User login
Today more than one‐third of emergency departments (EDs) in the United States have affiliated observation units, where patients can stay 24 to 48 hours without being admitted to the hospital.[1] Observation units experienced significant growth in the United States from 2005 to 2007, secondary to policy changes involving the Centers for Medicare and Medicaid Services (CMS), which expanded reimbursement for observation services to include any clinical condition. Furthermore, CMS implemented the Recovery Audit Contractor process, which was able to fine providers and facilities for inappropriate claims, with the principle method for charge recovery being inappropriate charges for short inpatient stays.
ED observation units (EDOUs) vary in the number of beds, but are often located adjacent to the emergency department.[2] It is estimated that EDOUs have the capacity for caring for 5% to 10% of any given ED volume.[2] Almost half of EDOUs are protocol driven, allowing these units to discharge up to 80% of all patients within 24 hours.[1, 2] Some studies have suggested that EDOUs are associated with a decrease in overall hospitalization rates, leading to cost savings.[1] However, these studies were limited by their single‐center design or simulated in nature. In addition, other studies show that EDOUs decrease inpatient admissions, length of stay, and costs related to specific clinical conditions such as chest pain, transient ischemic attack, and syncope.[3]
To further evaluate the association of observation units on ED hospital admission rates nationally, we analyzed the largest ED‐based survey, the 2010 National Hospital Ambulatory Medical Care Survey (NHAMCS), to assess the impact of observation units on hospital admissions from the ED. We hypothesized that observation units decrease overall hospital admissions from the ED.
METHODS
Study Design and Population
We performed a retrospective cross‐sectional analysis of ED visits from 2010. This study was exempt from institutional review board review by the University of Colorado and Yale University institutional review committee. The NHAMCS is an annual, national probability sample of ambulatory visits made to nonfederal, general, and short‐stay hospitals conducted by the Centers for Disease Control and Prevention (CDC), National Center for Health Statistics. The multistaged sample design was previously described elsewhere.[4] The 2010 NHAMCS dataset included 350 participating hospitals (unweighted sampling rate of 90%) and a total of 34,936 patient visits.[4]
Exclusions
We excluded patients who were less than 18 years old (n = 8015; 23%); left without being seen, left before examination completion, or left against medical advice (n = 813; 2%); transferred to another institution (n = 626; 1.7%); died on arrival or died in the ED (n = 60; 0.2%); and with missing data on discharge disposition (n = 100; 0.3%). Finally, we excluded hospitals with fewer than 30 visits per year (n = 307; 0.9%) to comply with reliable relative standard errors, as recommended by the CDC; after all of these exclusions there were 325 hospitals. Finally, we excluded hospitals with missing information on EDOUs (n = 783, 2.2%); our dataset at this point included 315 hospitals.
Outcomes
The primary outcome was hospital admission, either from the ED or admitted to an observation unit with subsequent hospital admission, defined as the ED risk‐standardized hospital admission rate (ED RSHAR).[5] This methodology allows for risk adjustment of case mix (ie, disease severity) for each hospital's ED admission rates and has been previously described in the evaluation of varying ED hospital admission rates using the same dataset.[5] To evaluate which hospitals had observation units, we used the following hospital survey question: Does your ED have an observation or clinical decision unit?
Identification of Variables
ED hospitalization rates were risk standardized for each hospital to account for each hospital's case mix and hospital factors such as socioeconomic status, clinical severity, and hospital characteristics. This methodology and dataset use have been previously described in detail.[5]
To account for common chief complaints leading to hospitalization and case‐mix distribution of these complaints among different hospitals, we analyzed all chief complaints and their relationship to hospital admission. We first identified those associated with an admission rate that exceeded 30% and was present in 1% or more of patient visits. The study team of researchers and clinicians determined the aforementioned cutoffs as clinically meaningful. Eight chief complaints met both criteria: chest pain and related symptoms, shortness of breath, other symptoms/probably related to psychological, general weakness, labored or difficulty breathing, fainting (syncope), unconscious arrival, and other symptoms referable to the nervous system. Chronic diseases, such as congestive heart failure, diabetes mellitus, renal disease on dialysis, and human immunodeficiency virus, were also included in the model.
Hospital factors included metropolitan status, geographic region of the country (limited to Northeast, Midwest, South, and West), teaching status, and urban or rural status.[6] We derived a new variable based on a previous study, teaching status, by combining nonprivate hospital status plus having at least 1 ED visit be evaluated by a resident.
Statistical Analyses
We used SAS version 9.2 (SAS Institute, Cary, NC) for all statistical analyses. Frequencies of all variables in the model were calculated to assess the distribution of data and quantify missing data. We did not want to have variables in the model with high collinearity. To investigate collinearity between independent variables, we calculated Spearman correlation coefficients; high collinearity was defined as r > 0.6. No variables included in the model had high collinearity.
To investigate the association of the candidate variables with hospitalization, we used survey logistic regression. Although some variables did not show an association with hospitalization, we felt they were clinically relevant and did not remove them from the model. Hierarchical logistic regression modeling (explained below) was used to calculate ED RSHAR based on the aforementioned selected variables associated with hospital admission.
Hierarchical logistic regression models (HLRM) were used to estimate RSHAR for each hospital. This approach reflects the assumption that a hospital‐specific component exists, and that it will affect the outcomes of patients at a particular institution. This method takes into consideration the hierarchical structure of the data to account for patient clustering within hospitals, and has been used by the CMS to publicly report hospital risk‐standardized rates of mortality and readmission for acute myocardial infarction, heart failure, and pneumonia.
We used a similar methodology as previously published.[5] In summary, the hospital RSHAR was calculated as a ratio of the number of predicted hospital admissions in the hospital to the number of expected hospital admissions in the hospital. This ratio is then multiplied by the national unadjusted rate of hospital admissions. We calculated the C statistic of the HLRM model to assess for overall adequacy of risk prediction. To analyze the association between ED RSHAR and EDOUs, we used analysis of variance, where the dependent variable was ED RSHAR and independent variable of interest was presence of EDOUs.
RESULTS
There were 24,232 ED visits from 315 hospitals in the United States in our study. Of these, 82 (20.6%) hospitals had an observation unit physically separate from the ED. Hospitals with and without observation units did not have different hospital patient level characteristics. There was no association between hospital ownership, teaching status, region location, urban or rural location, and hospitals with observation units when compared with hospitals without observation units (Table 1).
| Hospitals With Observation Units, W% (N = 82) | Hospitals Without Observation Units, W% (N = 233) | P Value | |
|---|---|---|---|
| |||
| Region of country | 0.54 | ||
| Northeast | 10.01 | 15.46 | |
| Midwest | 32.06 | 28.35 | |
| South | 41.84 | 36.33 | |
| West | 16.08 | 19.85 | |
| Ownership of hospitals | 0.4 | ||
| Voluntary, nonprofit | 77.28 | 72.35 | |
| Government, nonfederal | 18.78 | 16.11 | |
| Private | 3.94 | 11.55 | |
| Urban or rural location | 0.43 | ||
| Urban | 68.28 | 60.19 | |
| Rural | 31.72 | 39.81 | |
| Teaching hospital status | 0.56 | ||
| Teaching hospital | 63.22 | 68.28 | |
| Nonteaching hospital | 36.78 | 31.71 | |
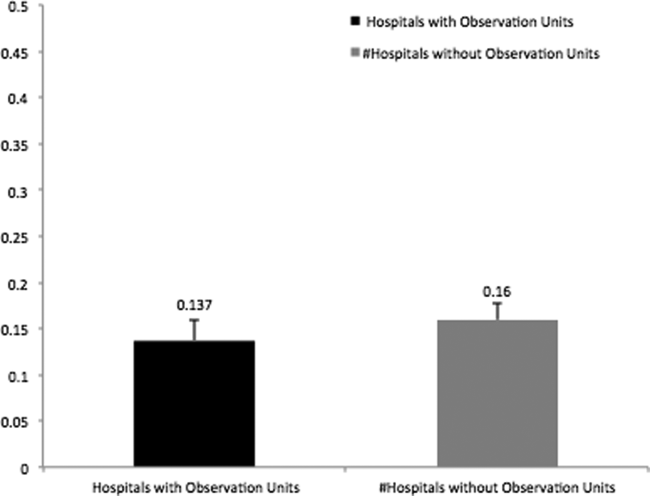
In addition, there was no association between patient characteristics at the ED visit level in hospitals with observation units when compared with patient characteristics at the ED visit level in hospitals without observation units (Table 2). The average ED risk‐standardized hospital admission rate for hospitals with observation units was 13.7% (95% confidence interval [CI]: 11.3 to 16.0) compared to 16.0% (95% CI: 14.1 to 17.7) for hospitals without observation units (Figure 1). This difference of 2.3% (95% CI: 0.1 to 4.7) was not statistically significant.

| Hospitals With Observation Units, W% (N = 6,067) | Hospitals Without Observation Units, W% (N = 18,165) | P Value | |
|---|---|---|---|
| |||
| Sex, female | 58.75 | 58.35 | 0.96 |
| Age, y | 45.17 | 46.08 | 0.32 |
| Race | 0.75 | ||
| Non‐Hispanic white | 63.54 | 66.41 | |
| Non‐Hispanic black | 23.67 | 18.77 | |
| Hispanic | 9.77 | 12.47 | |
| Other | 3.02 | 2.35 | |
| Source of payment | 0.87 | ||
| Private | 21.90 | 21.46 | |
| Medicare | 32.73 | 30.55 | |
| Medicaid | 22.15 | 23.23 | |
| Uninsured | 18.61 | 20.25 | |
| Unknown/missing | 4.61 | 4.51 | |
| Poverty level | 0.50 | ||
| <5% | 13.87 | 15.31 | |
| 5%9.9% | 32.57 | 23.38 | |
| 10%19.9% | 29.81 | 36.29 | |
| >20% | 20.32 | 20.18 | |
| Missing | 3.44 | 4.83 | |
| Arrival by ambulance | 0.06 | ||
| Yes | 20.01 | 18.61 | |
| No | 76.12 | 76.34 | |
| Unknown | 3.87 | 5.05 | |
| Severity of illness | 0.58 | ||
| Emergent | 16.58 | 16.62 | |
| Nonemergent | 44.09 | 43.85 | |
| Indeterminate | 1.18 | 1.17 | |
| Mental health, alcohol, unclassified | 38.15 | 38.37 | |
| Vital signs | |||
| Temperature | 0.91 | ||
| 9095F | 0.31 | 0.36 | |
| 95.1100.4F | 93.94 | 93.19 | |
| 100.4107F | 1.81 | 2.11 | |
| Missing | 3.94 | 4.35 | |
| Pulse | 0.60 | ||
| 1059 bpm | 3.39 | 3.93 | |
| 60100 bpm | 72.86 | 75.94 | |
| >101 bpm | 19.60 | 21.37 | |
| Missing | 4.16 | 7.67 | |
| Systolic blood pressure | 0.92 | ||
| 5090 mm Hg | 0.90 | 1.02 | |
| 91160 mm Hg | 85.49 | 84.03 | |
| 161260 mm Hg | 11.90 | 12.94 | |
| Missing | 1.71 | 2.01 | |
| Respiratory rate | 0.68 | ||
| 411 breaths/min | 0.24 | 0.19 | |
| 1220 breaths/min | 87.88 | 86.40 | |
| 2160 breaths/min | 8.90 | 10.09 | |
| Missing | 2.98 | 3.32 | |
| Chief complaint associated with hospitalization | |||
| Chest pain and related symptoms | 7.37 | 6.40 | 0.48 |
| Shortness of breath | 3.24 | 3.19 | 0.80 |
| Other symptoms/probably related to psychological | 1.28 | 0.97 | 0.19 |
| General weakness | 1.19 | 1.14 | 0.26 |
| Labored or difficult breathing | 0.56 | 0.88 | 0.93 |
| Fainting (syncope) | 0.44 | 0.42 | 0.09 |
| Unconscious on arrival | 0.35 | 0.38 | 0.17 |
| Other symptoms referable to the nervous system | 0.38 | 0.35 | 0.81 |
| Chronic diseases | |||
| Congestive heart failure | 4.13 | 4.05 | 0.05 |
| Cerebrovascular disease | 4.03 | 3.33 | 0.04 |
| Diabetes | 11.15 | 11.44 | 0.69 |
| HIV | 0.51 | 0.44 | 0.99 |
| On dialysis | 1.14 | 0.96 | 0.25 |
DISCUSSION
In this national study of hospital admissions from the ED, we did not find that hospitals with observation units had a statistically significant lower ED risk‐standardized admission rate when compared with hospitals that did not have observation units. However, the difference of ED risk‐standardized hospital admission rates between hospitals with observation units and those without observation units was very small, and we were likely underpowered to detect a statistically significant difference.
Recently, EDOUs have received much attention, in part because of increases in their numbers and frequency of use.[7] Prior studies, which did not report admission rates that were risk standardized, have also demonstrated no difference in the admission rates among hospitals with and without observation units.[6, 8] Although this result seems counterintuitive, several possible explanations exist.
One reason that there may not be a relation between the rate of inpatient admission and the presence of an observation unit is that the introduction of an EDOU appears to change physician behavior. When the option to admit to an observation unit is present, ED physicians are 2 times more likely to disposition patients to observation status without a statistically significant change in the rate of inpatient admission.[6] Studies have demonstrated that after the introduction of an observation unit, ED physicians tend to overutilize observation among patients who previously would have been discharged, while continuing to admit patients as inpatients who meet observation criteria, which could result in an increase in cost for payers and patients.[7, 9]
Observation units that are protocol driven have been associated with the best patient outcomes including shorter length of stay, lower likelihood of subsequent inpatient admission, and decreased cost.[10] Furthermore, studies evaluating EDOUs suggest increased patient satisfaction and improved patient safety, especially for protocol‐driven EDOUs.[2] However, currently, only half of dedicated observation units are protocol driven. It is also possible that the ED inpatient admission rate does not capture the full impact of an observation unit on care delivery and quality. Observation units are more likely to be present in EDs with a higher overall patient census, longer patient lengths of stay, and higher rates of ambulance diversion.[6, 8] Unfortunately, NHAMCS does not distinguish protocol‐driven versus nonprotocol‐driven observation units. From a policy standpoint, as EDOUs continue to emerge, there is an opportunity to standardize how EDOUs function by using best practices.
This study should be evaluated in the context of limitations such as heterogeneity in the management of EDOUs, limited hospital factor variables that may influence hospital admissions, and small sample size associated with each hospital. Because we were not able to determine which EDs used protocol‐driven observation units, we were not able to determine the impact of having a protocol‐driven observation unit on inpatient hospital admission rates. Additionally, the study may suffer from a selection bias, as EDs with observation units have been shown to have higher patient volume, longer patient lengths of stay, and greater rates of ED diversion. Despite the small sample size, our risk‐standardized model accounted for case mix and hospital factors associated with hospital admission rates and had a high C statistic value, which indicates that the predicted probability of being admitted from the ED highly correlates with the actual outcome of being admitted from the ED. We were unable to track hospitals longitudinally to determine if a hospital's high volume is associated with the creation of EDOUs as a means to offset its demand. However, in our analysis, we did control for overall patient volume when calculating the RHSAR. Finally, we were not able to limit the dataset to observation unit admission conditions because of the limited number of visits provided per hospital by NHAMCS. We conducted an analysis using 80% power and a P value of 0.05 to determine the sample size needed to have statistically significant results. We would require 920 hospitals to have statistically significant results, which suggests we were underpowered to detect a statistically significant difference.
In this preliminary study, we did not find an association between the presence of EDOUs and ED hospital admissions. Our study was limited by an inability to analyze administrative differences and to adjust for certain hospital factors that are likely to influence inpatient admissions via the ED. Nonetheless, our findings suggest that EDOUs merit further evaluation of their potential cost savings and the quality of the care they provide. An evaluation of ED observation departmental management is also needed to assess differences in care at observation units managed by emergency physicians versus nonemergency physicians.
Acknowledgments
Disclosures: R.C., B.S., and C.G. conceived the study. R.C. conducted the statistical analysis and was supervised by B.S. and C.G. All authors analyzed the results and interpreted findings. R.C. and D.B. drafted the manuscript, and all authors contributed substantially to its revision. All authors listed have contributed sufficiently to the project to be included as authors, and all those who are qualified to be authors are listed in the author byline. This work was previously presented at the 2013 Society for Academic Emergency Medicine Annual Meeting, Dallas, Texas. Dr. Capp is funded by a translational K award: KL2 TR001080. Dr. Gross reports grants from Johnson & Johnson, Medtronic Inc., and 21st Century Oncology during the conduct of this study. In addition, he received payment from Fair Health Inc. and ASTRO outside the submitted work. Dr. Sun receives National Institutes of Health funding. No conflicts of interest, financial or other, exist. This applies to all authors.
- , , . National study of emergency department observation services. Acad Emerg Med. 2011;18(9):959–965.
- , , . Emergency department observation units: a clinical and financial benefit for hospitals. Health Care Manage Rev 2011;36(1):28–37.
- , , , et al. Costs of an emergency department‐based accelerated diagnostic protocol vs hospitalization in patients with chest pain: a randomized controlled trial. JAMA. 1997;278(20):1670–1676.
- Centers for Disease Control and Prevention. National Hospital Ambulatory Medical Care Survey. Ambulatory health care data. Questionnaires, datasets, and related documentation. 2009. Available at: http://www.cdc.gov/nchs/ahcd/ahcd_questionnaires.htm. Accessed November 1, 2011.
- , , , et al. Hospital variation in risk‐standardized hospital admission rates from US EDs among adults. Am J Emerg Med. 2014;32(8):837–843.
- , , , , , . Use of observation care in US emergency departments, 2001 to 2008. PloS One. 2011;6(9):e24326.
- , , , , , . Making greater use of dedicated hospital observation units for many short‐stay patients could save $3.1 billion a year. Health Aff (Millwood). 2012;31(10):2314–2323.
- , , , . A national survey of observation units in the United States. Am J Emerg Med. 2003;21(7):529–533.
- , , , . An evaluation of emergency physician selection of observation unit patients. Am J Emerg Med. 2006;24(3):271–279.
- , , , , , . Protocol‐driven emergency department observation units offer savings, shorter stays, and reduced admissions. Health Aff (Millwood). 2013;32(12):2149–2156.
Today more than one‐third of emergency departments (EDs) in the United States have affiliated observation units, where patients can stay 24 to 48 hours without being admitted to the hospital.[1] Observation units experienced significant growth in the United States from 2005 to 2007, secondary to policy changes involving the Centers for Medicare and Medicaid Services (CMS), which expanded reimbursement for observation services to include any clinical condition. Furthermore, CMS implemented the Recovery Audit Contractor process, which was able to fine providers and facilities for inappropriate claims, with the principle method for charge recovery being inappropriate charges for short inpatient stays.
ED observation units (EDOUs) vary in the number of beds, but are often located adjacent to the emergency department.[2] It is estimated that EDOUs have the capacity for caring for 5% to 10% of any given ED volume.[2] Almost half of EDOUs are protocol driven, allowing these units to discharge up to 80% of all patients within 24 hours.[1, 2] Some studies have suggested that EDOUs are associated with a decrease in overall hospitalization rates, leading to cost savings.[1] However, these studies were limited by their single‐center design or simulated in nature. In addition, other studies show that EDOUs decrease inpatient admissions, length of stay, and costs related to specific clinical conditions such as chest pain, transient ischemic attack, and syncope.[3]
To further evaluate the association of observation units on ED hospital admission rates nationally, we analyzed the largest ED‐based survey, the 2010 National Hospital Ambulatory Medical Care Survey (NHAMCS), to assess the impact of observation units on hospital admissions from the ED. We hypothesized that observation units decrease overall hospital admissions from the ED.
METHODS
Study Design and Population
We performed a retrospective cross‐sectional analysis of ED visits from 2010. This study was exempt from institutional review board review by the University of Colorado and Yale University institutional review committee. The NHAMCS is an annual, national probability sample of ambulatory visits made to nonfederal, general, and short‐stay hospitals conducted by the Centers for Disease Control and Prevention (CDC), National Center for Health Statistics. The multistaged sample design was previously described elsewhere.[4] The 2010 NHAMCS dataset included 350 participating hospitals (unweighted sampling rate of 90%) and a total of 34,936 patient visits.[4]
Exclusions
We excluded patients who were less than 18 years old (n = 8015; 23%); left without being seen, left before examination completion, or left against medical advice (n = 813; 2%); transferred to another institution (n = 626; 1.7%); died on arrival or died in the ED (n = 60; 0.2%); and with missing data on discharge disposition (n = 100; 0.3%). Finally, we excluded hospitals with fewer than 30 visits per year (n = 307; 0.9%) to comply with reliable relative standard errors, as recommended by the CDC; after all of these exclusions there were 325 hospitals. Finally, we excluded hospitals with missing information on EDOUs (n = 783, 2.2%); our dataset at this point included 315 hospitals.
Outcomes
The primary outcome was hospital admission, either from the ED or admitted to an observation unit with subsequent hospital admission, defined as the ED risk‐standardized hospital admission rate (ED RSHAR).[5] This methodology allows for risk adjustment of case mix (ie, disease severity) for each hospital's ED admission rates and has been previously described in the evaluation of varying ED hospital admission rates using the same dataset.[5] To evaluate which hospitals had observation units, we used the following hospital survey question: Does your ED have an observation or clinical decision unit?
Identification of Variables
ED hospitalization rates were risk standardized for each hospital to account for each hospital's case mix and hospital factors such as socioeconomic status, clinical severity, and hospital characteristics. This methodology and dataset use have been previously described in detail.[5]
To account for common chief complaints leading to hospitalization and case‐mix distribution of these complaints among different hospitals, we analyzed all chief complaints and their relationship to hospital admission. We first identified those associated with an admission rate that exceeded 30% and was present in 1% or more of patient visits. The study team of researchers and clinicians determined the aforementioned cutoffs as clinically meaningful. Eight chief complaints met both criteria: chest pain and related symptoms, shortness of breath, other symptoms/probably related to psychological, general weakness, labored or difficulty breathing, fainting (syncope), unconscious arrival, and other symptoms referable to the nervous system. Chronic diseases, such as congestive heart failure, diabetes mellitus, renal disease on dialysis, and human immunodeficiency virus, were also included in the model.
Hospital factors included metropolitan status, geographic region of the country (limited to Northeast, Midwest, South, and West), teaching status, and urban or rural status.[6] We derived a new variable based on a previous study, teaching status, by combining nonprivate hospital status plus having at least 1 ED visit be evaluated by a resident.
Statistical Analyses
We used SAS version 9.2 (SAS Institute, Cary, NC) for all statistical analyses. Frequencies of all variables in the model were calculated to assess the distribution of data and quantify missing data. We did not want to have variables in the model with high collinearity. To investigate collinearity between independent variables, we calculated Spearman correlation coefficients; high collinearity was defined as r > 0.6. No variables included in the model had high collinearity.
To investigate the association of the candidate variables with hospitalization, we used survey logistic regression. Although some variables did not show an association with hospitalization, we felt they were clinically relevant and did not remove them from the model. Hierarchical logistic regression modeling (explained below) was used to calculate ED RSHAR based on the aforementioned selected variables associated with hospital admission.
Hierarchical logistic regression models (HLRM) were used to estimate RSHAR for each hospital. This approach reflects the assumption that a hospital‐specific component exists, and that it will affect the outcomes of patients at a particular institution. This method takes into consideration the hierarchical structure of the data to account for patient clustering within hospitals, and has been used by the CMS to publicly report hospital risk‐standardized rates of mortality and readmission for acute myocardial infarction, heart failure, and pneumonia.
We used a similar methodology as previously published.[5] In summary, the hospital RSHAR was calculated as a ratio of the number of predicted hospital admissions in the hospital to the number of expected hospital admissions in the hospital. This ratio is then multiplied by the national unadjusted rate of hospital admissions. We calculated the C statistic of the HLRM model to assess for overall adequacy of risk prediction. To analyze the association between ED RSHAR and EDOUs, we used analysis of variance, where the dependent variable was ED RSHAR and independent variable of interest was presence of EDOUs.
RESULTS
There were 24,232 ED visits from 315 hospitals in the United States in our study. Of these, 82 (20.6%) hospitals had an observation unit physically separate from the ED. Hospitals with and without observation units did not have different hospital patient level characteristics. There was no association between hospital ownership, teaching status, region location, urban or rural location, and hospitals with observation units when compared with hospitals without observation units (Table 1).
| Hospitals With Observation Units, W% (N = 82) | Hospitals Without Observation Units, W% (N = 233) | P Value | |
|---|---|---|---|
| |||
| Region of country | 0.54 | ||
| Northeast | 10.01 | 15.46 | |
| Midwest | 32.06 | 28.35 | |
| South | 41.84 | 36.33 | |
| West | 16.08 | 19.85 | |
| Ownership of hospitals | 0.4 | ||
| Voluntary, nonprofit | 77.28 | 72.35 | |
| Government, nonfederal | 18.78 | 16.11 | |
| Private | 3.94 | 11.55 | |
| Urban or rural location | 0.43 | ||
| Urban | 68.28 | 60.19 | |
| Rural | 31.72 | 39.81 | |
| Teaching hospital status | 0.56 | ||
| Teaching hospital | 63.22 | 68.28 | |
| Nonteaching hospital | 36.78 | 31.71 | |
In addition, there was no association between patient characteristics at the ED visit level in hospitals with observation units when compared with patient characteristics at the ED visit level in hospitals without observation units (Table 2). The average ED risk‐standardized hospital admission rate for hospitals with observation units was 13.7% (95% confidence interval [CI]: 11.3 to 16.0) compared to 16.0% (95% CI: 14.1 to 17.7) for hospitals without observation units (Figure 1). This difference of 2.3% (95% CI: 0.1 to 4.7) was not statistically significant.
| Hospitals With Observation Units, W% (N = 6,067) | Hospitals Without Observation Units, W% (N = 18,165) | P Value | |
|---|---|---|---|
| |||
| Sex, female | 58.75 | 58.35 | 0.96 |
| Age, y | 45.17 | 46.08 | 0.32 |
| Race | 0.75 | ||
| Non‐Hispanic white | 63.54 | 66.41 | |
| Non‐Hispanic black | 23.67 | 18.77 | |
| Hispanic | 9.77 | 12.47 | |
| Other | 3.02 | 2.35 | |
| Source of payment | 0.87 | ||
| Private | 21.90 | 21.46 | |
| Medicare | 32.73 | 30.55 | |
| Medicaid | 22.15 | 23.23 | |
| Uninsured | 18.61 | 20.25 | |
| Unknown/missing | 4.61 | 4.51 | |
| Poverty level | 0.50 | ||
| <5% | 13.87 | 15.31 | |
| 5%9.9% | 32.57 | 23.38 | |
| 10%19.9% | 29.81 | 36.29 | |
| >20% | 20.32 | 20.18 | |
| Missing | 3.44 | 4.83 | |
| Arrival by ambulance | 0.06 | ||
| Yes | 20.01 | 18.61 | |
| No | 76.12 | 76.34 | |
| Unknown | 3.87 | 5.05 | |
| Severity of illness | 0.58 | ||
| Emergent | 16.58 | 16.62 | |
| Nonemergent | 44.09 | 43.85 | |
| Indeterminate | 1.18 | 1.17 | |
| Mental health, alcohol, unclassified | 38.15 | 38.37 | |
| Vital signs | |||
| Temperature | 0.91 | ||
| 9095F | 0.31 | 0.36 | |
| 95.1100.4F | 93.94 | 93.19 | |
| 100.4107F | 1.81 | 2.11 | |
| Missing | 3.94 | 4.35 | |
| Pulse | 0.60 | ||
| 1059 bpm | 3.39 | 3.93 | |
| 60100 bpm | 72.86 | 75.94 | |
| >101 bpm | 19.60 | 21.37 | |
| Missing | 4.16 | 7.67 | |
| Systolic blood pressure | 0.92 | ||
| 5090 mm Hg | 0.90 | 1.02 | |
| 91160 mm Hg | 85.49 | 84.03 | |
| 161260 mm Hg | 11.90 | 12.94 | |
| Missing | 1.71 | 2.01 | |
| Respiratory rate | 0.68 | ||
| 411 breaths/min | 0.24 | 0.19 | |
| 1220 breaths/min | 87.88 | 86.40 | |
| 2160 breaths/min | 8.90 | 10.09 | |
| Missing | 2.98 | 3.32 | |
| Chief complaint associated with hospitalization | |||
| Chest pain and related symptoms | 7.37 | 6.40 | 0.48 |
| Shortness of breath | 3.24 | 3.19 | 0.80 |
| Other symptoms/probably related to psychological | 1.28 | 0.97 | 0.19 |
| General weakness | 1.19 | 1.14 | 0.26 |
| Labored or difficult breathing | 0.56 | 0.88 | 0.93 |
| Fainting (syncope) | 0.44 | 0.42 | 0.09 |
| Unconscious on arrival | 0.35 | 0.38 | 0.17 |
| Other symptoms referable to the nervous system | 0.38 | 0.35 | 0.81 |
| Chronic diseases | |||
| Congestive heart failure | 4.13 | 4.05 | 0.05 |
| Cerebrovascular disease | 4.03 | 3.33 | 0.04 |
| Diabetes | 11.15 | 11.44 | 0.69 |
| HIV | 0.51 | 0.44 | 0.99 |
| On dialysis | 1.14 | 0.96 | 0.25 |
DISCUSSION
In this national study of hospital admissions from the ED, we did not find that hospitals with observation units had a statistically significant lower ED risk‐standardized admission rate when compared with hospitals that did not have observation units. However, the difference of ED risk‐standardized hospital admission rates between hospitals with observation units and those without observation units was very small, and we were likely underpowered to detect a statistically significant difference.
Recently, EDOUs have received much attention, in part because of increases in their numbers and frequency of use.[7] Prior studies, which did not report admission rates that were risk standardized, have also demonstrated no difference in the admission rates among hospitals with and without observation units.[6, 8] Although this result seems counterintuitive, several possible explanations exist.
One reason that there may not be a relation between the rate of inpatient admission and the presence of an observation unit is that the introduction of an EDOU appears to change physician behavior. When the option to admit to an observation unit is present, ED physicians are 2 times more likely to disposition patients to observation status without a statistically significant change in the rate of inpatient admission.[6] Studies have demonstrated that after the introduction of an observation unit, ED physicians tend to overutilize observation among patients who previously would have been discharged, while continuing to admit patients as inpatients who meet observation criteria, which could result in an increase in cost for payers and patients.[7, 9]
Observation units that are protocol driven have been associated with the best patient outcomes including shorter length of stay, lower likelihood of subsequent inpatient admission, and decreased cost.[10] Furthermore, studies evaluating EDOUs suggest increased patient satisfaction and improved patient safety, especially for protocol‐driven EDOUs.[2] However, currently, only half of dedicated observation units are protocol driven. It is also possible that the ED inpatient admission rate does not capture the full impact of an observation unit on care delivery and quality. Observation units are more likely to be present in EDs with a higher overall patient census, longer patient lengths of stay, and higher rates of ambulance diversion.[6, 8] Unfortunately, NHAMCS does not distinguish protocol‐driven versus nonprotocol‐driven observation units. From a policy standpoint, as EDOUs continue to emerge, there is an opportunity to standardize how EDOUs function by using best practices.
This study should be evaluated in the context of limitations such as heterogeneity in the management of EDOUs, limited hospital factor variables that may influence hospital admissions, and small sample size associated with each hospital. Because we were not able to determine which EDs used protocol‐driven observation units, we were not able to determine the impact of having a protocol‐driven observation unit on inpatient hospital admission rates. Additionally, the study may suffer from a selection bias, as EDs with observation units have been shown to have higher patient volume, longer patient lengths of stay, and greater rates of ED diversion. Despite the small sample size, our risk‐standardized model accounted for case mix and hospital factors associated with hospital admission rates and had a high C statistic value, which indicates that the predicted probability of being admitted from the ED highly correlates with the actual outcome of being admitted from the ED. We were unable to track hospitals longitudinally to determine if a hospital's high volume is associated with the creation of EDOUs as a means to offset its demand. However, in our analysis, we did control for overall patient volume when calculating the RHSAR. Finally, we were not able to limit the dataset to observation unit admission conditions because of the limited number of visits provided per hospital by NHAMCS. We conducted an analysis using 80% power and a P value of 0.05 to determine the sample size needed to have statistically significant results. We would require 920 hospitals to have statistically significant results, which suggests we were underpowered to detect a statistically significant difference.
In this preliminary study, we did not find an association between the presence of EDOUs and ED hospital admissions. Our study was limited by an inability to analyze administrative differences and to adjust for certain hospital factors that are likely to influence inpatient admissions via the ED. Nonetheless, our findings suggest that EDOUs merit further evaluation of their potential cost savings and the quality of the care they provide. An evaluation of ED observation departmental management is also needed to assess differences in care at observation units managed by emergency physicians versus nonemergency physicians.
Acknowledgments
Disclosures: R.C., B.S., and C.G. conceived the study. R.C. conducted the statistical analysis and was supervised by B.S. and C.G. All authors analyzed the results and interpreted findings. R.C. and D.B. drafted the manuscript, and all authors contributed substantially to its revision. All authors listed have contributed sufficiently to the project to be included as authors, and all those who are qualified to be authors are listed in the author byline. This work was previously presented at the 2013 Society for Academic Emergency Medicine Annual Meeting, Dallas, Texas. Dr. Capp is funded by a translational K award: KL2 TR001080. Dr. Gross reports grants from Johnson & Johnson, Medtronic Inc., and 21st Century Oncology during the conduct of this study. In addition, he received payment from Fair Health Inc. and ASTRO outside the submitted work. Dr. Sun receives National Institutes of Health funding. No conflicts of interest, financial or other, exist. This applies to all authors.
- , , . National study of emergency department observation services. Acad Emerg Med. 2011;18(9):959–965.
- , , . Emergency department observation units: a clinical and financial benefit for hospitals. Health Care Manage Rev 2011;36(1):28–37.
- , , , et al. Costs of an emergency department‐based accelerated diagnostic protocol vs hospitalization in patients with chest pain: a randomized controlled trial. JAMA. 1997;278(20):1670–1676.
- Centers for Disease Control and Prevention. National Hospital Ambulatory Medical Care Survey. Ambulatory health care data. Questionnaires, datasets, and related documentation. 2009. Available at: http://www.cdc.gov/nchs/ahcd/ahcd_questionnaires.htm. Accessed November 1, 2011.
- , , , et al. Hospital variation in risk‐standardized hospital admission rates from US EDs among adults. Am J Emerg Med. 2014;32(8):837–843.
- , , , , , . Use of observation care in US emergency departments, 2001 to 2008. PloS One. 2011;6(9):e24326.
- , , , , , . Making greater use of dedicated hospital observation units for many short‐stay patients could save $3.1 billion a year. Health Aff (Millwood). 2012;31(10):2314–2323.
- , , , . A national survey of observation units in the United States. Am J Emerg Med. 2003;21(7):529–533.
- , , , . An evaluation of emergency physician selection of observation unit patients. Am J Emerg Med. 2006;24(3):271–279.
- , , , , , . Protocol‐driven emergency department observation units offer savings, shorter stays, and reduced admissions. Health Aff (Millwood). 2013;32(12):2149–2156.