User login
Type 1 diabetes cases poised to double worldwide by 2040
STOCKHOLM – The number of people living with type 1 diabetes worldwide is expected to double by 2040, with most new cases among adults living in low- and middle-income countries, new modeling data suggest.
The forecast, developed from available data collected in the newly established open-source Type 1 Diabetes Index, provides estimates for type 1 diabetes prevalence, incidence, associated mortality, and life expectancy for 201 countries for 2021.
The model also projects estimates for prevalent cases in 2040. It is the first type 1 diabetes dataset to account for the lack of prevalence because of premature mortality, particularly in low- and middle-income countries.
“The worldwide prevalence of type 1 diabetes is substantial and growing. Improved surveillance – particularly in adults who make up most of the population living with type 1 diabetes – is essential to enable improvements to care and outcomes. There is an opportunity to save millions of lives in the coming decades by raising the standard of care (including ensuring universal access to insulin and other essential supplies) and increasing awareness of the signs and symptoms of type 1 diabetes to enable a 100% rate of diagnosis in all countries,” the authors write.
“This work spells out the need for early diagnosis of type 1 diabetes and timely access to quality care,” said Chantal Mathieu, MD, at the European Association for the Study of Diabetes annual meeting.
One in five deaths from type 1 diabetes in under 25s
The new findings were published in Lancet Diabetes & Endocrinology by Gabriel A. Gregory, MD, of Life for a Child Program, New South Wales, Australia, and colleagues. The T1D Index Project database was published Sept. 21, 2022.
According to the model, about 8.4 million people were living with type 1 diabetes in 2021, with one-fifth from low- and middle-income countries. An additional 3.7 million died prematurely and would have been added to that count had they lived. One in five of all deaths caused by type 1 diabetes in 2021 is estimated to have occurred in people younger than age 25 years because of nondiagnosis.
“It is unacceptable that, in 2022, some 35,000 people worldwide are dying undiagnosed within a year of onset of symptoms. There also continues to be a huge disparity in life expectancy for people with type 1 diabetes, hitting those in the poorest countries hardest,” noted Dr. Mathieu, who is senior vice-president of EASD and an endocrinologist based at KU Leuven, Belgium.
By 2040, the model predicts that between 13.5 million and 17.4 million people will be living with the condition, with the largest relative increase from 2021 in low-income and lower-middle-income countries. The majority of incident and prevalent cases of type 1 diabetes are in adults, with an estimated 62% of 510,000 new diagnoses worldwide in 2021 occurring in people aged 20 years and older.
Type 1 diabetes is not predominantly a disease of childhood
Dr. Mathieu also noted that the data dispute the long-held view of type 1 diabetes as a predominantly pediatric condition. Indeed, worldwide, the median age for a person living with type 1 diabetes is 37 years.
“While type 1 diabetes is often referred to as ‘child-onset’ diabetes, this important study shows that only around one in five living with the condition are aged 20 years or younger, two-thirds are aged 20-64 years, and a further one in five are aged 65 years or older.”
“This condition does not stop at age 18 years – the children become adults, and the adults become elderly. All countries must examine and strengthen their diagnosis and care pathways for people of all ages living with type 1 diabetes,” Dr. Mathieu emphasized.
And in an accompanying editorial, Serena Jingchuan Guo, MD, PhD, and Hui Shao, MD, PhD, point out that most studies that estimate diabetes burden have focused on type 2 diabetes, noting, “type 1 diabetes faces the challenges of misdiagnosis, underdiagnosis, high risk of complications, and premature mortality.”
The insulin affordability issue is central, point out Dr. Guo and Dr. Shao of the Center for Drug Evaluation and Safety, department of pharmaceutical evaluation and policy, University of Florida College of Pharmacy, Gainesville.
“Countries need to strengthen the price regulation and reimbursement policy for insulin while building subsidy programs to ensure insulin access and to cope with the growing demand for insulin. Meanwhile, optimizing the insulin supply chain between manufacturers and patients while seeking alternative treatment options (for example, biosimilar products) will also improve the current situation,” they conclude.
The study was funded by JDRF, of which four coauthors are employees. The editorialists have reported no relevant financial relationships.
A version of this article first appeared on Medscape.com.
AT EASD 2022
Cre8 EVO stent loses sweet spot in diabetes at 2 years: SUGAR
BOSTON – Despite a promising start, extended follow-up from the SUGAR trial found that the Cre8 EVO drug-eluting stent could not maintain superiority over the Resolute Onyx DES at 2 years in patients with diabetes undergoing revascularization for coronary artery disease.
The Cre8 EVO stent (Alvimedica) is not available in the United States but, as previously reported, caused a stir last year after demonstrating a 35% relative risk reduction in the primary endpoint of target lesion failure (TLF) at 1 year in a prespecified superiority analysis.
At 2 years, however, the TLF rate was 10.4% with the polymer-free Cre8 EVO amphilimus-eluting stent and 12.1% with the durable polymer Resolute Onyx (Medtronic) zotarolimus-eluting stent, which did not achieve superiority (hazard ratio, 0.84; 95% confidence interval, 0.60-1.19).
Rates were numerically lower with the Cre8 EVO stent for the endpoint’s individual components of cardiac death (3.1% vs. 3.4%), target vessel MI (6.6% vs. 7.6%), and target lesion revascularization (4.3% vs. 4.6%).
Results were also similar between the Cre8 EVO and Resolute Onyx stents for all-cause mortality (7.1% vs. 6.8%), any MI (9.0% vs. 9.2%), target vessel revascularization (5.5% vs. 5.1%), all new revascularizations (7.6% vs. 9.4%), definite stent thrombosis (1.0% vs. 1.2%), and major adverse cardiac events (18.3% vs. 20.8%), Pablo Salinas, MD, PhD, of Hospital Clinico San Carlos, Madrid, reported at the Transcatheter Cardiovascular Therapeutics annual meeting.
He noted that all-cause mortality was 7% in just 2 years in the diabetic cohort, or twice the number of cardiac deaths. “In other words, these patients had the same chance of dying from cardiac causes and noncardiac causes, so we need a more comprehensive approach to the disease. Also, if you look at all new revascularizations, roughly 50% were off target, so there is disease progression at 2 years in this population.”
Among the 586 Cre8 EVO and 589 Resolute Onyx patients who underwent percutaneous coronary intervention (PCI), roughly half had multivessel coronary artery disease, 83% had hypertension, 81% had dyslipidemia, and 21% were current smokers. Nearly all patients had diabetes type 2 for an average of 10.6 years for Cre8 EVO and 11.4 years for Resolute Onyx, with hemoglobin A1c levels of 7.4% and 7.5%, respectively.
Although there is “insufficient evidence” the Cre8 EVO stent is superior to the Resolute Onyx stent with regard to TLF, Dr. Salinas concluded extended follow-up until 5 years is warranted.
During a discussion of the results, Dr. Salinas said he expects the 5-year results will “probably go parallel” but that it’s worth following this very valuable cohort. “There are not so many trials with 1,000 diabetic patients. We always speak about how complex they are, the results are bad, but we don’t use the diabetic population in trials,” he said at the meeting sponsored by the Cardiovascular Research Foundation.
Asked during a TCT press conference what could have caused the catch-up in TLF at 2 years, Dr. Salinas said there were only 25 primary events from years 1 to 2, driven primarily by periprocedural MI, but that the timing of restenosis was different. Events accrued “drop by drop” with the Cre8 EVO, whereas with the Resolute Onyx there was a “bump in restenosis” after 6 months “but then it is very nice to see it is flat, which means that durable polymers are also safe because we have not seen late events.”

Press conference discussant Carlo Di Mario, MD, from Careggi University Hospital, Florence, Italy, who was not involved in the study, said the reversal of superiority for the Cre8 EVO might be a “bitter note” for the investigators but “maybe it is not bitter for us because overall, the percentage of figures are so low that it’s very difficult to find a difference” between the two stents.
Roxana Mehran, MD, of Icahn School of Medicine at Mount Sinai, New York, who previously described the 1-year results as “almost too good to be true,” commented to this news organization, “We just saw in this trial, no benefit whatsoever at 2 years in terms of target lesion failure. So it’s very important for us to evaluate this going forward.”
She continued, “We’ve always been talking about these biodegradable polymers and then going back to the bare metal stent – oh that’s great because polymers aren’t so good – but now we’re seeing durable polymers may be okay, especially with the current technology.”
Asked whether Cre8 EVO, which is CE mark certified in Europe, remains an option in light of the new results, Dr. Mehran said, “I don’t think it kills it. It’s not worse; it’s another stent that’s available.”
Nevertheless, “what we’re looking for is some efficacious benefit for diabetic patients. We don’t have one yet,” observed Dr. Mehran, who is leading the ABILITY Diabetes Global trial, which just finished enrolling 3,000 patients with diabetes and is testing PCI with the Abluminus DES+ sirolimus-eluting stent system vs. the Xience everolimus-eluting stent. The study is estimated to be complete in August 2024.
The study was funded by the Spanish Society of Cardiology. Dr. Salinas reported consulting fees/honoraria from Boston Scientific, Abbott Vascular, Biomenco, and Medtronic.
A version of this article first appeared on Medscape.com.
BOSTON – Despite a promising start, extended follow-up from the SUGAR trial found that the Cre8 EVO drug-eluting stent could not maintain superiority over the Resolute Onyx DES at 2 years in patients with diabetes undergoing revascularization for coronary artery disease.
The Cre8 EVO stent (Alvimedica) is not available in the United States but, as previously reported, caused a stir last year after demonstrating a 35% relative risk reduction in the primary endpoint of target lesion failure (TLF) at 1 year in a prespecified superiority analysis.
At 2 years, however, the TLF rate was 10.4% with the polymer-free Cre8 EVO amphilimus-eluting stent and 12.1% with the durable polymer Resolute Onyx (Medtronic) zotarolimus-eluting stent, which did not achieve superiority (hazard ratio, 0.84; 95% confidence interval, 0.60-1.19).
Rates were numerically lower with the Cre8 EVO stent for the endpoint’s individual components of cardiac death (3.1% vs. 3.4%), target vessel MI (6.6% vs. 7.6%), and target lesion revascularization (4.3% vs. 4.6%).
Results were also similar between the Cre8 EVO and Resolute Onyx stents for all-cause mortality (7.1% vs. 6.8%), any MI (9.0% vs. 9.2%), target vessel revascularization (5.5% vs. 5.1%), all new revascularizations (7.6% vs. 9.4%), definite stent thrombosis (1.0% vs. 1.2%), and major adverse cardiac events (18.3% vs. 20.8%), Pablo Salinas, MD, PhD, of Hospital Clinico San Carlos, Madrid, reported at the Transcatheter Cardiovascular Therapeutics annual meeting.
He noted that all-cause mortality was 7% in just 2 years in the diabetic cohort, or twice the number of cardiac deaths. “In other words, these patients had the same chance of dying from cardiac causes and noncardiac causes, so we need a more comprehensive approach to the disease. Also, if you look at all new revascularizations, roughly 50% were off target, so there is disease progression at 2 years in this population.”
Among the 586 Cre8 EVO and 589 Resolute Onyx patients who underwent percutaneous coronary intervention (PCI), roughly half had multivessel coronary artery disease, 83% had hypertension, 81% had dyslipidemia, and 21% were current smokers. Nearly all patients had diabetes type 2 for an average of 10.6 years for Cre8 EVO and 11.4 years for Resolute Onyx, with hemoglobin A1c levels of 7.4% and 7.5%, respectively.
Although there is “insufficient evidence” the Cre8 EVO stent is superior to the Resolute Onyx stent with regard to TLF, Dr. Salinas concluded extended follow-up until 5 years is warranted.
During a discussion of the results, Dr. Salinas said he expects the 5-year results will “probably go parallel” but that it’s worth following this very valuable cohort. “There are not so many trials with 1,000 diabetic patients. We always speak about how complex they are, the results are bad, but we don’t use the diabetic population in trials,” he said at the meeting sponsored by the Cardiovascular Research Foundation.
Asked during a TCT press conference what could have caused the catch-up in TLF at 2 years, Dr. Salinas said there were only 25 primary events from years 1 to 2, driven primarily by periprocedural MI, but that the timing of restenosis was different. Events accrued “drop by drop” with the Cre8 EVO, whereas with the Resolute Onyx there was a “bump in restenosis” after 6 months “but then it is very nice to see it is flat, which means that durable polymers are also safe because we have not seen late events.”
Press conference discussant Carlo Di Mario, MD, from Careggi University Hospital, Florence, Italy, who was not involved in the study, said the reversal of superiority for the Cre8 EVO might be a “bitter note” for the investigators but “maybe it is not bitter for us because overall, the percentage of figures are so low that it’s very difficult to find a difference” between the two stents.
Roxana Mehran, MD, of Icahn School of Medicine at Mount Sinai, New York, who previously described the 1-year results as “almost too good to be true,” commented to this news organization, “We just saw in this trial, no benefit whatsoever at 2 years in terms of target lesion failure. So it’s very important for us to evaluate this going forward.”
She continued, “We’ve always been talking about these biodegradable polymers and then going back to the bare metal stent – oh that’s great because polymers aren’t so good – but now we’re seeing durable polymers may be okay, especially with the current technology.”
Asked whether Cre8 EVO, which is CE mark certified in Europe, remains an option in light of the new results, Dr. Mehran said, “I don’t think it kills it. It’s not worse; it’s another stent that’s available.”
Nevertheless, “what we’re looking for is some efficacious benefit for diabetic patients. We don’t have one yet,” observed Dr. Mehran, who is leading the ABILITY Diabetes Global trial, which just finished enrolling 3,000 patients with diabetes and is testing PCI with the Abluminus DES+ sirolimus-eluting stent system vs. the Xience everolimus-eluting stent. The study is estimated to be complete in August 2024.
The study was funded by the Spanish Society of Cardiology. Dr. Salinas reported consulting fees/honoraria from Boston Scientific, Abbott Vascular, Biomenco, and Medtronic.
A version of this article first appeared on Medscape.com.
AT TCT 2022

Emphasis on weight loss in new type 2 diabetes guidance
STOCKHOLM – Weight loss should be a co–primary management goal for type 2 diabetes in adults, according to a new comprehensive joint consensus report from the European Association for the Study of Diabetes and the American Diabetes Association.
And while metformin is still recommended as first-line therapy for patients with type 2 diabetes with no other comorbidities, the statement expands the indications for use of other agents or combinations of agents as initial therapy for subgroups of patients, as part of individualized and patient-centered decision-making.
Last updated in 2019, the new “Management of Hyperglycemia in Type 2 Diabetes” statement also places increased emphasis on social determinants of health, incorporates recent clinical trial data for cardiovascular and kidney outcomes for sodium-glucose cotransporter-2 (SGLT2) inhibitors and glucagonlike peptide–1 (GLP-1) agonists to broaden recommendations for cardiorenal protection, and discusses health behaviors such as sleep and sitting. It also targets a wider audience than in the past by addressing health system organization to optimize delivery of diabetes care.
The new statement was presented during a 90-minute session at the annual meeting of the EASD, with 12 of its 14 European and American authors as presenters. The document was simultaneously published in Diabetologia and Diabetes Care.
During the discussion, panel member Jennifer Brigitte Green, MD, commented: “Many of these recommendations are not new. They’re modest revisions of recommendations that have been in place for years, but we know that actual implementation rates of use of these drugs in patients with established comorbidities are very low.”
“I think it’s time for communities, health care systems, etc, to actually introduce these as expectations of care... to assess quality because unless it’s considered formally to be a requirement of care I just don’t think we’re going to move that needle very much,” added Dr. Green, who is professor of medicine at Duke University, Durham, N.C.
Vanita R. Aroda, MD, of the division of endocrinology, diabetes, and hypertension at Brigham and Women’s Hospital, Boston, commented: “In the past, sometimes these recommendations created fodder for debate, but I don’t think this one will. It’s just really solidly evidence based, with the rationales presented throughout, including the figures. I think just having very clear evidence-based directions should support their dissemination and use.”
Weight management plays a prominent role in treatment
In an interview, writing panel cochair John B. Buse, MD, PhD, said: “We are saying that the four major components of type 2 diabetes care are glycemic management, cardiovascular risk management, weight management, and prevention of end-organ damage, particularly with regard to cardiorenal risk.”
“The weight management piece is much more explicit now,” said Dr. Buse, director of the Diabetes Center at the University of North Carolina at Chapel Hill.
He noted that recent evidence from the intensive lifestyle trial DiRECT, conducted in the United Kingdom, the bariatric surgery literature, and the emergence of potent weight-loss drugs have meant that “achieving 10%-15% body weight loss is now possible.
“So, aiming for remission is something that might be attractive to patients and providers. This could be based on weight management, with the [chosen] method based on shared decision-making.”
According to the new report: “Weight loss of 5%-10% confers metabolic improvement; weight loss of 10%-15% or more can have a disease-modifying effect and lead to remission of diabetes, defined as normal blood glucose levels for 3 months or more in the absence of pharmacological therapy in a 2021 consensus report.”
“Weight loss may exert benefits that extend beyond glycemic management to improve risk factors for cardiometabolic disease and quality of life,” it adds.
Individualization featured throughout
The report’s sections cover principles of care, including the importance of diabetes self-management education and support and avoidance of therapeutic inertia. Detailed guidance addresses therapeutic options including lifestyle, weight management, and pharmacotherapy for treating type 2 diabetes.
Another entire section is devoted to personalizing treatment approaches based on individual characteristics, including new evidence from cardiorenal outcomes studies for SGLT2 inhibitors and GLP-1 agonists that have come out since the last consensus report.
The document advises: “Consider initial combination therapy with glucose-lowering agents, especially in those with high [hemoglobin] A1c at diagnosis (that is, > 70 mmol/mol [> 8.5%]), in younger people with type 2 diabetes (regardless of A1c), and in those in whom a stepwise approach would delay access to agents that provide cardiorenal protection beyond their glucose-lowering effects.”
Designed to be used and user-friendly
Under the “Putting it all together: strategies for implementation” section, several lists of “practical tips for clinicians” are provided for many of the topics covered.
A series of colorful infographics are included as well, addressing the “decision cycle for person-centered glycemic management in type 2 diabetes,” including a chart summarizing characteristics of available glucose-lowering medications, including cardiorenal protection.
Also mentioned is the importance of 24-hour physical behaviors (including sleep, sitting, and sweating) and the impact on cardiometabolic health, use of a “holistic person-centered approach” to type 2 diabetes management, and an algorithm on insulin use.
Dr. Buse has financial ties to numerous drug and device companies. Dr. Green is a consultant for AstraZeneca, Pfizer, Boehringer Ingelheim/Lilly, Bayer, Sanofi, Anji, Vertex/ICON, and Valo. Dr. Aroda has served as a consultant for Applied Therapeutics, Duke, Fractyl, Novo Nordisk, Pfizer, and Sanofi.
A version of this article first appeared on Medscape.com.
AT EASD 2022
Presence of community health workers linked with better results in patients with T2D
The researchers, led by Robert L. Ferrer, MD, MPH, with the department of family and community medicine at the University of Texas Health Science Center, San Antonio, enrolled 986 people in a Latino, inner-city cohort in primary care in San Antonio. Patients had uncontrolled type 2 diabetes and psychosocial risk factors. The study was published in Annals of Family Medicine.
The primary outcome measured was whether patients progressed through three stages of self-care: outreach (meeting face to face with a community health care worker), stabilization (collaborating with community health care workers to address life circumstances), and a third stage the researchers called “self-care generativity” (being able to manage blood sugar levels at home). The intervention lasted up to 12 weeks and had a 4-year follow-up.
Of participating patients, the researchers reported, 27% remained in outreach, 41% progressed to stabilization, 32% achieved self-care generativity status.
Coauthor Carlos Roberto Jaén, MD, PhD, also from the UT Health Science Center at San Antonio, said in an interview, “I don’t know any other intervention for diabetes that has 32% of participants having this kind of effect 4 years later.”
Dr. Jaén added that the study is unusual in that it had a 4-year follow-up and showed positive effects throughout that period, as most CHW studies have followed patients only up to one year.
The positive results over the 4 years after a short intervention “is a testimony of the power of intervention,” he said.
A1c drops with more progress in the intervention
The secondary outcome was change in hemoglobin A1c and need for urgent care or emergency department or hospital care.
Study participants who worked with a CHW – regardless of which group they were in at the end of the intervention – collectively saw a 2% drop in blood sugar.
Over a similar time period to when the study was conducted, the researchers analyzed 27,000 A1c measurements of patients with type 2 diabetes in a comparator group. For these patients, who did not receive the study intervention but were part of the same practice as those who received the intervention, the researchers observed a reduction in A1c levels of 0.05%.
Among the study participants, for those who remained in outreach, hospital visits were 6% higher than for those who advanced to the level of self-care generativity, but this difference was not statistically significant. Hospital visits were 90% higher for those who achieved stabilization versus those who remained in outreach (P = .014) The average count of emergency department visits was 74% higher for those who achieved stabilization versus those who achieved self-care generativity, and 31% higher in the group remaining at outreach versus those who reached the highest level of self-care.
Advantages of community workers
In San Antonio, the authors noted, type 2 diabetes prevalence is high: 15.5% of its 1.6 million residents have been diagnosed with the disease.
The CHWs built trust with patients and helped them set goals, navigate the health system and connect to community resources. They worked with behavioral health clinicians, nurse care managers, and medical assistants toward population management.
“Community health workers’ detailed understanding of patients’ circumstances help to tailor their care rather than apply fixed interventions,” the authors wrote.
Ricardo Correa, MD, director of the endocrinology, diabetes, and metabolism fellowship program in the University of Arizona, Phoenix, who was not involved with the study, said in an interview he was not surprised by the positive results.
He described the difference when CHWs get involved with type 2 diabetes care, particularly in the Latino community.
“They understand the culture, not just the language,” he said. “They have the trust of the community.”
It’s different when a provider not from the community tells a person with type 2 diabetes he or she needs to eat healthier or exercise more, he said.
The CHW can understand, for instance, that the nearest fresh market may be two towns away and open only on Saturdays and the parks are not safe for exercise outside at certain times of the day. Then they can help the patient find a sustainable solution.
“Community workers also won’t be looking at your immigration status,” something important to many in the Latino community, he explained.
Though this study looked at type 2 diabetes management, community health workers are also effective in other areas, he explained, such as increasing COVID-19 vaccinations, also do them being trustworthy and understanding.
Other study strengths
The group of people with type 2 diabetes they studied has the highest rates of poverty – “the poorest of the poor” – and the highest rates of diabetes-related amputations in San Antonio, Dr. Jaén said.
The intervention “is more focused on what people want to do, less so on the disease,” he explained. People are asked what goals they want to achieve and how the care team can help.
“It becomes an alliance between the community health worker and the patient,” he continued.
Others interested in implementing a program should know that building that relationship takes time and takes a broad multidisciplinary team working together, he said. “We would not necessarily see these effects in 6 months. You have to use a larger perspective.”
The researchers include with this study under the first-page tab “more online” access to tools, including resources for training, for others who want to implement such a program.
The study authors and Dr. Correa reported no relevant financial relationships.
FROM ANNALS OF FAMILY MEDICINE
Assessment of Glucagon-like Peptide-1 Receptor Agonists in Veterans TakingBasal/Bolus Insulin Regimens
In 2019, diabetes mellitus (DM) was the seventh leading cause of death in the United States, and currently, about 11% of the American population has a DM diagnosis.1 Most have a diagnosis of type 2 diabetes (T2DM), which has a strong genetic predisposition, and the risk of developing T2DM increases with age, obesity, and lack of physical activity.1,2 Nearly one-quarter of veterans have a diagnosis of DM, and DM is the leading cause of comorbidities, such as blindness, end-stage renal disease, and amputation for patients receiving care from the Veterans Health Administration (VHA).2 The elevated incidence of DM in the veteran population is attributed to a variety of factors, including exposure to herbicides, such as Agent Orange, advanced age, increased risk of obesity, and limited access to high-quality food.3
After diagnosis, both the American Diabetes Association (ADA) and the American Association of Clinical Endocrinologists and American College of Endocrinology (AACE/ACE) emphasize the appropriate use of lifestyle management and pharmacologic therapy for DM care. The use of pharmacologic agents (oral medications, insulin, or noninsulin injectables) is often determined by efficacy, cost, potential adverse effects (AEs), and patient factors and comorbidities.4,5
The initial recommendation for pharmacologic treatment for T2DM differs slightly between expert guidelines. The ADA and AACE/ACE recommend any of the following as initial monotherapy, listed in order to represent a hierarchy of usage: metformin, glucagon-like peptide-1 receptor agonists (GLP-1 RAs), sodium-glucose cotransporter 2 (SGLT-2) inhibitors, or dipeptidyl peptidase-4 (DPP-4) inhibitors, with the first 3 agents carrying the strongest recommendations.4,5 For patients with established atherosclerotic cardiovascular disease (CVD), chronic kidney disease, or heart failure, it is recommended to start a long-acting GLP-1 RA or SGLT-2 inhibitor. For patients with T2DM and hemoglobin A1c (HbA1c) between 7.5% and 9.0% at diagnosis, the AACE/ACE recommend initiation of dual therapy using metformin alongside another first-line agent and recommend the addition of another antidiabetic agent if glycemic goals are not met after regular follow-up. AACE/ACE recommend the consideration of insulin therapy in symptomatic patients with HbA1c > 9.0%.5 In contrast, the ADA recommends metformin as first-line therapy for all patients with T2DM and recommends dual therapy using metformin and another preferred agent (selection based on comorbidities) when HbA1c is 1.5% to 2% above target. The ADA recommends the consideration of insulin with HbA1c > 10% or with evidence of ongoing catabolism or symptoms of hyperglycemia.4 There are several reasons why insulin may be initiated prior to GLP-1 RAs, including profound hyperglycemia at time of diagnosis or implementation of insulin agents prior to commercial availability of GLP-1 RA.
GLP-1 RAs are analogs of the hormone incretin, which increases glucose-dependent insulin secretion, decreases postprandial glucagon secretion, increases satiety, and slows gastric emptying.6,7 When used in combination with noninsulin agents, GLP-1 RAs have demonstrated HbA1c reductions of 0.5% to 1.5%.8 The use of GLP-1 RAs with basal insulin also has been studied extensively.6,8-10 When the combination of GLP-1 RAs and basal insulin was compared with basal/bolus insulin regimens, the use of the GLP-1 RAs resulted in lower HbA1c levels and lower incidence of hypoglycemia.6,9 Data have demonstrated the complementary mechanisms of using basal insulin and GLP 1 RAs in decreasing HbA1c levels, insulin requirements, and weight compared with using basal insulin monotherapy and basal/bolus combinations.6,9-13 Moreover, 3 GLP-1 RA medications currently on the market (liraglutide, dulaglutide, and semaglutide) have displayed cardiovascular and renal benefits, further supporting the use of these medications.2,5
Despite these benefits, GLP-1 RAs may have bothersome AEs and are associated with a high cost.6 In addition, some studies have found that as the length of therapy increases, the positive effects of these agents may diminish.9,11 In one study, which looked at the impact of the addition of exenatide to patients taking basal or basal/bolus insulin regimens, mean changes in weight were −2.4 kg at 0 to 6 months, −4.3 kg at 6 to 12 months, −6.2 kg at 12 to 18 months, and −5.5 kg at 18 to 27 months. After 18 months, an increase in weight was observed, but the increase remained lower than baseline.11 Another study, conducted over 12 months, found no significant decrease in weight or total daily dose (TDD) of insulin when exenatide or liraglutide were added to various insulin regimens (basal or basal/bolus).13 To date, minimal published data exist regarding the addition of newer GLP-1 RAs and the long-term use of these agents beyond 12 months in patients taking basal/bolus insulin regimens. The primary goal of this study was to evaluate the effect of adding GLP-1 RAs to basal/bolus insulin regimens over a 24-month period.
Methods
This study was a retrospective, electronic health record review of all patients on basal and bolus insulin regimens who received additional therapy with a GLP-1 RA at Veteran Health Indiana in Indianapolis from September 1, 2015, to June 30, 2019. Patients meeting inclusion criteria served as their own control. The primary outcome was change in HbA1c at 3, 6, 12, 18, and 24 months after initiation of the GLP-1 RA. Secondary outcomes included change in weight and TDD of insulin at 3, 6, 12, 18, and 24 months after the initiation of the GLP-1 RAs and incidence of patient-reported or laboratory-confirmed hypoglycemia and other AEs.
Patients were included if they were aged ≥ 18 years with a diagnosis of T2DM, had concomitant prescriptions for both a basal insulin (glargine, detemir, or NPH) and a bolus insulin (aspart, lispro, or regular) before receiving add-on therapy with a GLP-1 RA (exenatide, liraglutide, albiglutide, lixisenatide, dulaglutide, or semaglutide) from September 1, 2015, to June 30, 2019, and had baseline and subsequent Hb A1c measurements available in the electronic health record. Patients were excluded if they had a diagnosis of T1DM, were followed by an outside clinician for DM care, or if the GLP-1 RA was discontinued before subsequent HbA1c measurement. The study protocol was approved by the Research and Development Office of Veteran Health Indiana, and the project was deemed exempt from review by the Indiana University Institutional Review Board due to the retrospective nature of the study.
Data analysis was performed using Excel. Change from baseline for each interval was computed, and 1 sample t tests (2-tailed) compared change from baseline to no change. Due to the disparity in the number of patients with data available at each of the time intervals, a mean plot was presented for each group of patients within each interval, allowing mean changes in individual groups to be observed over time.
Results
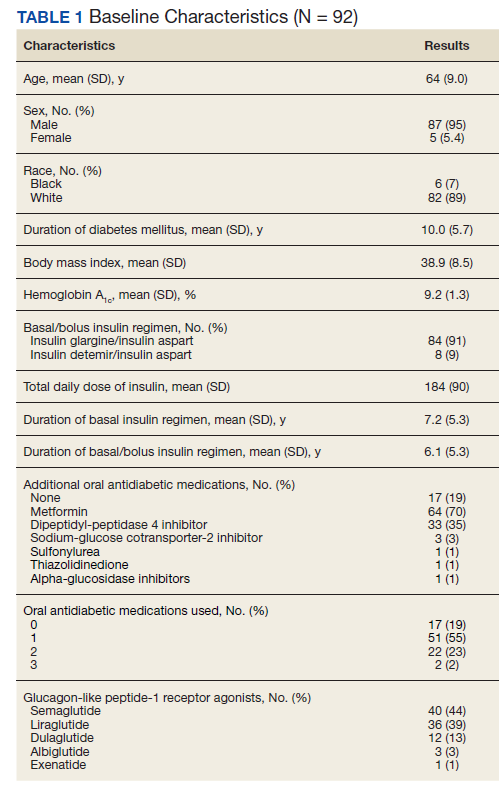
One hundred twenty-three subjects met inclusion criteria; 16 patients were excluded due to GLP-1 RA discontinuation before follow-up measurement of HbA1c; 14 were excluded due to patients being managed by a clinician outside of the facility; 1 patient was excluded for lack of documentation regarding baseline and subsequent insulin doses. Ninety-two patient charts were reviewed. Participants had a mean age of 64 years, 95% were male, and 89% were White. Mean baseline Hb A1c was 9.2%, mean body mass index was 38.9, and the mean TDD of insulin was 184 units. Mean duration of DM was 10 years, and mean use of basal/bolus insulin regimen was 6.1 years. Most participants (91%) used an insulin regimen containing insulin glargine and insulin aspart; the remaining participants used insulin detemir and insulin aspart. Semaglutide and liraglutide were the most commonly used GLP-1 RAs (44% and 39%, respectively) (Table 1).
![]()
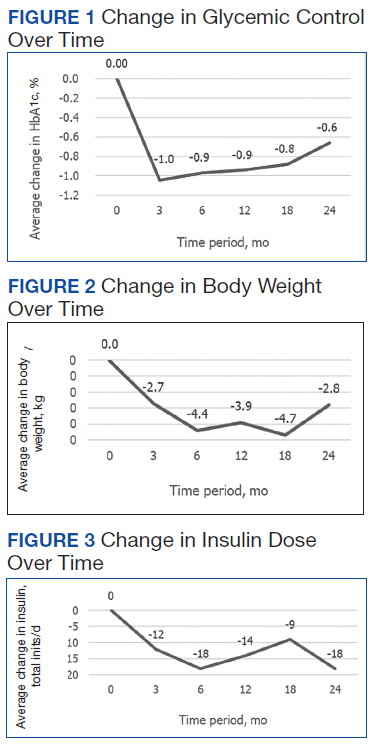
Since some patients switched between GLP-1 RAs throughout the study and there was variation in timing of laboratory and clinic follow-up, a different number of patient charts were available for review at each period (Table 2). Glycemic control was significantly improved at all time points when compared with baseline, but over time the benefit declined. The mean change in HbA1c was −1.1% (95% CI, −1.3 to −0.8; P < .001) at 3 months; −1.0% (95% CI, −1.3 to −0.7; P < .001) at 6 months; −0.9% (95% CI, −1.3 to −0.6; P < .001) at 12 months; −0.9% (95% CI −1.4 to −0.3; P = .002) at 18 months; and −0.7% (95% CI, −1.4 to 0.1; P = .07) at 24 months (Figure 1). Mean weight decreased from baseline −2.7 kg (95% CI, −3.7 to −1.6; P < .001); −4.4 kg (95% CI −5.7 to −3.2; P < .001) at 6 months; −3.9 kg (95% CI −6.0 to −1.9; P < .001) at 12 months; −4.7 kg (95% CI −6.7 to −2.6; P < .001) at 18 months; and −2.8 kg (95% CI, −5.9 to 0.3; P = .07) at 24 months (Figure 2). Mean TDD decreased at 3 months −12 units (95% CI, −19 to −5; P < .001); −18 units (95% CI, −27 to −9; P < .001) at 6 months; −14 units (95% CI, −24 to −5; P = .004) at 12 months; −9 units (95% CI, −21 to 3; P = .15) at 18 months; and −18 units (95% CI, −43 to 5 units; P = .12) at 24 months (Figure 3). The most common AEs were hypoglycemia (30%), diarrhea (11%), nausea (4%), and abdominal pain (3%).
Discussion
Adding a GLP-1 RA to basal/bolus insulin regimens was associated with a statistically significant decrease in HbA1c at each time point through 18 months. The greatest improvement in glycemic control from baseline was seen at 3 months, with improvements in HbA1c diminishing at each subsequent period. The study also demonstrated a significant decrease in weight at each time point through 18 months. The greatest decrease in weight was observed at both 6 and 12 months. Statistically significant decreases in TDD were observed at 3, 6, and 12 months. Insulin changes after 12 months were not found to be statistically significant.
Few studies have previously evaluated the use of GLP-1 RAs in patients with T2DM who are already taking basal/bolus insulin regimens. Gyorffy and colleagues reported significant improvements in glycemic control at 3 and 6 months in a sample of 54 patients taking basal/bolus insulin when liraglutide or exenatide was added, although statistical significance was not found at the final 12-month time point.13 That study also found a significant decrease in weight at 6 months; however there was not a significant reduction in weight at both 3 and 12 months of GLP-1 RA therapy. There was not a significant decrease in TDD at any of the collected time points. Nonetheless, Gyorffy and colleagues concluded that reduction in TDD leveled off after 12 months, which is consistent with this study’s findings. The small size of the study may have limited the ability to detect statistical significance; however, this study was conducted in a population that was racially diverse and included a higher proportion of women, though average age was similar.13
Yoon and colleagues reported weight loss through 18 months, then saw weight increase, though weights did remain lover than baseline. The study also showed no significant change in TDD of insulin after 12 months of concomitant exenatide and insulin therapy.11 Although these results mirror the outcomes observed in this study, Yoon and colleagues did not differentiate results between basal and basal/bolus insulin groups.11 Seino and colleagues observed no significant change in weight after 36 weeks of GLP-1 RA therapy in Japanese patients when used with basal and basal/bolus insulin regimens. Despite the consideration that the population in the study was not overweight (mean body mass index was 25.6), the results of these studies support the idea that effects of GLP-1 RAs on weight and TDD may diminish over time.14
Within the VHA, GLP-1 RAs are nonformulary medications. Patients must meet certain criteria in order to be approved for these agents, which may include diagnosis of CVD, renal disease, or failure to reach glycemic control with the use of oral agents or insulin. Therefore, participants of this study represent a particular subset of VHA patients, many of whom may have been selected for consideration due to long-standing or uncontrolled T2DM and failure of previous therapies. The baseline demographics support this idea, given poor glycemic control at baseline and high insulin requirements. Once approved for GLP-1 RA therapy, semaglutide is currently the preferred agent within the VHA, with other agents being available for select considerations. It should be noted that albiglutide, which was the primary agent selected for some of the patients included in this study, was removed from the market in 2017 for economic considerations.15 In the case for these patients, a conversion to a formulary-preferred GLP-1 RA was made.
Most of the patients included in this study (70%) were maintained on metformin from baseline throughout the study period. Fifty-seven percent of patients were taking TDD of insulin > 150 units. Considering the significant cost of concentrated insulins, the addition of GLP-1 RAs to standard insulin may prove to be beneficial from a cost standpoint. Additional research in this area may be warranted to establish more data regarding this potential benefit of GLP-1 RAs as add-on therapy.
Many adverse drug reactions were reported at different periods; however, most of these were associated with the gastrointestinal system, which is consistent with current literature, drug labeling, and the mechanism of action.16 Hypoglycemia occurred in about one-third of the participants; however, it should be noted that alone, GLP-1 RAs are not associated with a high risk of hypoglycemia. Previous studies have found that GLP-1 RA monotherapy is associated with hypoglycemia in 1.6% to 12.6% of patients.17,18 More likely, the combination of basal/bolus insulin and the GLP-1 RA’s effect on increasing insulin sensitivity through weight loss, improving glucose-dependent insulin secretion, or by decreasing appetite and therefore decreasing carbohydrate intake contributed to the hypoglycemia prevalence.
Limitations and Strengths
Limitations of this study include a small patient population and a gradual reduction in available data as time periods progressed, making even smaller sample sizes for subsequent time periods. A majority of participants were older males of White race. This could have limited the determination of statistical significance and applicability of the results to other patient populations. Another potential limitation was the retrospective nature of the study design, which may have limited reporting of hypoglycemia and other AEs based on the documentation of the clinician.
Strengths included the length of study duration and the diversity of GLP-1 RAs used by participants, as the impact of many of these agents has not yet been assessed in the literature. In addition, the retrospective nature of the study allows for a more realistic representation of patient adherence, education, and motivation, which are likely different from those of patients included in prospective clinical trials.
There are no clear guidelines dictating the optimal duration of concomitant GLP-1 RA and insulin therapy; however, our study suggests that there may be continued benefits past short-term use. Also our study suggests that patients with T2DM treated with basal/bolus insulin regimens may glean additional benefit from adding GLP-1 RAs; however, further randomized, controlled studies are warranted, particularly in poorly controlled patients requiring even more aggressive treatment regimens, such as concentrated insulins.
Conclusions
In our study, adding GLP-1 RA to basal/bolus insulin was associated with a significant decrease in HbA1c from baseline through 18 months. An overall decrease in weight and TDD of insulin was observed through 24 months, but the change in weight was not significant past 18 months, and the change in insulin requirement was not significant past 12 months. Hypoglycemia was observed in almost one-third of patients, and gastrointestinal symptoms were the most common AE observed as a result adding GLP-1 RAs. More studies are needed to better evaluate the durability and cost benefit of GLP-1 RAs, especially in patients with high insulin requirements.
Acknowledgments
This material is the result of work supported with resources and facilities at Veteran Health Indiana in Indianapolis. Study data were collected and managed using REDCap electronic data capture tools hosted at Veteran Health Indiana. The authors also acknowledge George Eckert for his assistance with data analysis.
1. American Diabetes Association. Statistics about diabetes. Accessed August 9, 2022. http://www.diabetes.org/diabetes-basics/statistics
2. US Department of Veterans Affairs, Veterans Health Administration, Office of Research and Development. VA research on: diabetes. Updated January 15, 2021. Accessed August 9, 2022. https://www.research.va.gov/topics/diabetes.cfm
3. Federal Practitioner. Federal Health Care Data Trends 2017, Diabetes mellitus. Accessed August 9, 2022. https://www.fedprac-digital.com/federalpractitioner/data_trends_2017?pg=20#pg20
4. American Diabetes Association Professional Practice Committee. 9. Pharmacologic approaches to glycemic treatment: Standards of Medical Care in Diabetes—2022. Diabetes Care. 2022;45(suppl 1):S125-S143. doi:10.2337/dc22-S009
5. Garber AJ, Abrahamson MJ, Barzilay JI, et al. Consensus statement by the American Association of Clinical Endocrinologists and American College of Endocrinology on the comprehensive type 2 diabetes management algorithm – 2019 executive summary. Endocr Pract. 2019;25(1):69-100. doi:10.4158/CS-2018-0535
6. St Onge E, Miller S, Clements E, Celauro L, Barnes K. The role of glucagon-like peptide-1 receptor agonists in the treatment of type 2 diabetes. J Transl Int Med. 2017;5(2):79-89. Published 2017 Jun 30. doi:10.1515/jtim-2017-0015
7. Almandoz JP, Lingvay I, Morales J, Campos C. Switching between glucagon-like peptide-1 receptor agonists: rationale and practical guidance. Clin Diabetes. 2020;38(4):390-402. doi:10.2337/cd19-0100
8. Davies ML, Pham DQ, Drab SR. GLP1-RA add-on therapy in patients with type 2 diabetes currently on a bolus containing insulin regimen. Pharmacotherapy. 2016;36(8):893-905. doi:10.1002/phar.1792
9. Rosenstock J, Guerci B, Hanefeld M, et al. Prandial options to advance basal insulin glargine therapy: testing lixisenatide plus basal insulin versus insulin glulisine either as basal-plus or basal-bolus in type 2 diabetes: the GetGoal Duo-2 Trial Investigators. Diabetes Care. 2016;39(8):1318-1328. doi:10.2337/dc16-0014
10. Levin PA, Mersey JH, Zhou S, Bromberger LA. Clinical outcomes using long-term combination therapy with insulin glargine and exenatide in patients with type 2 diabetes mellitus. Endocr Pract. 2012;18(1):17-25. doi:10.4158/EP11097.OR
11. Yoon NM, Cavaghan MK, Brunelle RL, Roach P. Exenatide added to insulin therapy: a retrospective review of clinical practice over two years in an academic endocrinology outpatient setting. Clin Ther. 2009;31(7):1511-1523. doi:10.1016/j.clinthera.2009.07.021
12. Weissman PN, Carr MC, Ye J, et al. HARMONY 4: randomised clinical trial comparing once-weekly albiglutide and insulin glargine in patients with type 2 diabetes inadequately controlled with metformin with or without sulfonylurea. Diabetologia. 2014;57(12):2475-2484. doi:10.1007/s00125-014-3360-3
13. Gyorffy JB, Keithler AN, Wardian JL, Zarzabal LA, Rittel A, True MW. The impact of GLP-1 receptor agonists on patients with diabetes on insulin therapy. Endocr Pract. 2019;25(9):935-942. doi:10.4158/EP-2019-0023
14. Seino Y, Kaneko S, Fukuda S, et al. Combination therapy with liraglutide and insulin in Japanese patients with type 2 diabetes: a 36-week, randomized, double-blind, parallel-group trial. J Diabetes Investig. 2016;7(4):565-573. doi:10.1111/jdi.12457
15. Optum. Tanzeum (albiglutide)–drug discontinuation. Published 2017. Accessed August 15, 2022. https://professionals.optumrx.com/content/dam/optum3/professional-optumrx/news/rxnews/drug-recalls-shortages/drugwithdrawal_tanzeum_2017-0801.pdf
16. Chun JH, Butts A. Long-acting GLP-1RAs: an overview of efficacy, safety, and their role in type 2 diabetes management. JAAPA. 2020;33(8):3-18. doi:10.1097/01.JAA.0000669456.13763.bd
17. Ozempic semaglutide injection. Prescribing information. Novo Nordisk; 2022. Accessed August 9, 2022. https://www.novo-pi.com/ozempic.pdf
18. Victoza liraglutide injection. Prescribing information. Novo Nordisk; 2021. Accessed August 9, 2022. https://www.novo-pi.com/victoza.pdf
In 2019, diabetes mellitus (DM) was the seventh leading cause of death in the United States, and currently, about 11% of the American population has a DM diagnosis.1 Most have a diagnosis of type 2 diabetes (T2DM), which has a strong genetic predisposition, and the risk of developing T2DM increases with age, obesity, and lack of physical activity.1,2 Nearly one-quarter of veterans have a diagnosis of DM, and DM is the leading cause of comorbidities, such as blindness, end-stage renal disease, and amputation for patients receiving care from the Veterans Health Administration (VHA).2 The elevated incidence of DM in the veteran population is attributed to a variety of factors, including exposure to herbicides, such as Agent Orange, advanced age, increased risk of obesity, and limited access to high-quality food.3
After diagnosis, both the American Diabetes Association (ADA) and the American Association of Clinical Endocrinologists and American College of Endocrinology (AACE/ACE) emphasize the appropriate use of lifestyle management and pharmacologic therapy for DM care. The use of pharmacologic agents (oral medications, insulin, or noninsulin injectables) is often determined by efficacy, cost, potential adverse effects (AEs), and patient factors and comorbidities.4,5
The initial recommendation for pharmacologic treatment for T2DM differs slightly between expert guidelines. The ADA and AACE/ACE recommend any of the following as initial monotherapy, listed in order to represent a hierarchy of usage: metformin, glucagon-like peptide-1 receptor agonists (GLP-1 RAs), sodium-glucose cotransporter 2 (SGLT-2) inhibitors, or dipeptidyl peptidase-4 (DPP-4) inhibitors, with the first 3 agents carrying the strongest recommendations.4,5 For patients with established atherosclerotic cardiovascular disease (CVD), chronic kidney disease, or heart failure, it is recommended to start a long-acting GLP-1 RA or SGLT-2 inhibitor. For patients with T2DM and hemoglobin A1c (HbA1c) between 7.5% and 9.0% at diagnosis, the AACE/ACE recommend initiation of dual therapy using metformin alongside another first-line agent and recommend the addition of another antidiabetic agent if glycemic goals are not met after regular follow-up. AACE/ACE recommend the consideration of insulin therapy in symptomatic patients with HbA1c > 9.0%.5 In contrast, the ADA recommends metformin as first-line therapy for all patients with T2DM and recommends dual therapy using metformin and another preferred agent (selection based on comorbidities) when HbA1c is 1.5% to 2% above target. The ADA recommends the consideration of insulin with HbA1c > 10% or with evidence of ongoing catabolism or symptoms of hyperglycemia.4 There are several reasons why insulin may be initiated prior to GLP-1 RAs, including profound hyperglycemia at time of diagnosis or implementation of insulin agents prior to commercial availability of GLP-1 RA.
GLP-1 RAs are analogs of the hormone incretin, which increases glucose-dependent insulin secretion, decreases postprandial glucagon secretion, increases satiety, and slows gastric emptying.6,7 When used in combination with noninsulin agents, GLP-1 RAs have demonstrated HbA1c reductions of 0.5% to 1.5%.8 The use of GLP-1 RAs with basal insulin also has been studied extensively.6,8-10 When the combination of GLP-1 RAs and basal insulin was compared with basal/bolus insulin regimens, the use of the GLP-1 RAs resulted in lower HbA1c levels and lower incidence of hypoglycemia.6,9 Data have demonstrated the complementary mechanisms of using basal insulin and GLP 1 RAs in decreasing HbA1c levels, insulin requirements, and weight compared with using basal insulin monotherapy and basal/bolus combinations.6,9-13 Moreover, 3 GLP-1 RA medications currently on the market (liraglutide, dulaglutide, and semaglutide) have displayed cardiovascular and renal benefits, further supporting the use of these medications.2,5
Despite these benefits, GLP-1 RAs may have bothersome AEs and are associated with a high cost.6 In addition, some studies have found that as the length of therapy increases, the positive effects of these agents may diminish.9,11 In one study, which looked at the impact of the addition of exenatide to patients taking basal or basal/bolus insulin regimens, mean changes in weight were −2.4 kg at 0 to 6 months, −4.3 kg at 6 to 12 months, −6.2 kg at 12 to 18 months, and −5.5 kg at 18 to 27 months. After 18 months, an increase in weight was observed, but the increase remained lower than baseline.11 Another study, conducted over 12 months, found no significant decrease in weight or total daily dose (TDD) of insulin when exenatide or liraglutide were added to various insulin regimens (basal or basal/bolus).13 To date, minimal published data exist regarding the addition of newer GLP-1 RAs and the long-term use of these agents beyond 12 months in patients taking basal/bolus insulin regimens. The primary goal of this study was to evaluate the effect of adding GLP-1 RAs to basal/bolus insulin regimens over a 24-month period.
Methods
This study was a retrospective, electronic health record review of all patients on basal and bolus insulin regimens who received additional therapy with a GLP-1 RA at Veteran Health Indiana in Indianapolis from September 1, 2015, to June 30, 2019. Patients meeting inclusion criteria served as their own control. The primary outcome was change in HbA1c at 3, 6, 12, 18, and 24 months after initiation of the GLP-1 RA. Secondary outcomes included change in weight and TDD of insulin at 3, 6, 12, 18, and 24 months after the initiation of the GLP-1 RAs and incidence of patient-reported or laboratory-confirmed hypoglycemia and other AEs.
Patients were included if they were aged ≥ 18 years with a diagnosis of T2DM, had concomitant prescriptions for both a basal insulin (glargine, detemir, or NPH) and a bolus insulin (aspart, lispro, or regular) before receiving add-on therapy with a GLP-1 RA (exenatide, liraglutide, albiglutide, lixisenatide, dulaglutide, or semaglutide) from September 1, 2015, to June 30, 2019, and had baseline and subsequent Hb A1c measurements available in the electronic health record. Patients were excluded if they had a diagnosis of T1DM, were followed by an outside clinician for DM care, or if the GLP-1 RA was discontinued before subsequent HbA1c measurement. The study protocol was approved by the Research and Development Office of Veteran Health Indiana, and the project was deemed exempt from review by the Indiana University Institutional Review Board due to the retrospective nature of the study.
Data analysis was performed using Excel. Change from baseline for each interval was computed, and 1 sample t tests (2-tailed) compared change from baseline to no change. Due to the disparity in the number of patients with data available at each of the time intervals, a mean plot was presented for each group of patients within each interval, allowing mean changes in individual groups to be observed over time.
Results
One hundred twenty-three subjects met inclusion criteria; 16 patients were excluded due to GLP-1 RA discontinuation before follow-up measurement of HbA1c; 14 were excluded due to patients being managed by a clinician outside of the facility; 1 patient was excluded for lack of documentation regarding baseline and subsequent insulin doses. Ninety-two patient charts were reviewed. Participants had a mean age of 64 years, 95% were male, and 89% were White. Mean baseline Hb A1c was 9.2%, mean body mass index was 38.9, and the mean TDD of insulin was 184 units. Mean duration of DM was 10 years, and mean use of basal/bolus insulin regimen was 6.1 years. Most participants (91%) used an insulin regimen containing insulin glargine and insulin aspart; the remaining participants used insulin detemir and insulin aspart. Semaglutide and liraglutide were the most commonly used GLP-1 RAs (44% and 39%, respectively) (Table 1).
![]()
Since some patients switched between GLP-1 RAs throughout the study and there was variation in timing of laboratory and clinic follow-up, a different number of patient charts were available for review at each period (Table 2). Glycemic control was significantly improved at all time points when compared with baseline, but over time the benefit declined. The mean change in HbA1c was −1.1% (95% CI, −1.3 to −0.8; P < .001) at 3 months; −1.0% (95% CI, −1.3 to −0.7; P < .001) at 6 months; −0.9% (95% CI, −1.3 to −0.6; P < .001) at 12 months; −0.9% (95% CI −1.4 to −0.3; P = .002) at 18 months; and −0.7% (95% CI, −1.4 to 0.1; P = .07) at 24 months (Figure 1). Mean weight decreased from baseline −2.7 kg (95% CI, −3.7 to −1.6; P < .001); −4.4 kg (95% CI −5.7 to −3.2; P < .001) at 6 months; −3.9 kg (95% CI −6.0 to −1.9; P < .001) at 12 months; −4.7 kg (95% CI −6.7 to −2.6; P < .001) at 18 months; and −2.8 kg (95% CI, −5.9 to 0.3; P = .07) at 24 months (Figure 2). Mean TDD decreased at 3 months −12 units (95% CI, −19 to −5; P < .001); −18 units (95% CI, −27 to −9; P < .001) at 6 months; −14 units (95% CI, −24 to −5; P = .004) at 12 months; −9 units (95% CI, −21 to 3; P = .15) at 18 months; and −18 units (95% CI, −43 to 5 units; P = .12) at 24 months (Figure 3). The most common AEs were hypoglycemia (30%), diarrhea (11%), nausea (4%), and abdominal pain (3%).
Discussion
Adding a GLP-1 RA to basal/bolus insulin regimens was associated with a statistically significant decrease in HbA1c at each time point through 18 months. The greatest improvement in glycemic control from baseline was seen at 3 months, with improvements in HbA1c diminishing at each subsequent period. The study also demonstrated a significant decrease in weight at each time point through 18 months. The greatest decrease in weight was observed at both 6 and 12 months. Statistically significant decreases in TDD were observed at 3, 6, and 12 months. Insulin changes after 12 months were not found to be statistically significant.
Few studies have previously evaluated the use of GLP-1 RAs in patients with T2DM who are already taking basal/bolus insulin regimens. Gyorffy and colleagues reported significant improvements in glycemic control at 3 and 6 months in a sample of 54 patients taking basal/bolus insulin when liraglutide or exenatide was added, although statistical significance was not found at the final 12-month time point.13 That study also found a significant decrease in weight at 6 months; however there was not a significant reduction in weight at both 3 and 12 months of GLP-1 RA therapy. There was not a significant decrease in TDD at any of the collected time points. Nonetheless, Gyorffy and colleagues concluded that reduction in TDD leveled off after 12 months, which is consistent with this study’s findings. The small size of the study may have limited the ability to detect statistical significance; however, this study was conducted in a population that was racially diverse and included a higher proportion of women, though average age was similar.13
Yoon and colleagues reported weight loss through 18 months, then saw weight increase, though weights did remain lover than baseline. The study also showed no significant change in TDD of insulin after 12 months of concomitant exenatide and insulin therapy.11 Although these results mirror the outcomes observed in this study, Yoon and colleagues did not differentiate results between basal and basal/bolus insulin groups.11 Seino and colleagues observed no significant change in weight after 36 weeks of GLP-1 RA therapy in Japanese patients when used with basal and basal/bolus insulin regimens. Despite the consideration that the population in the study was not overweight (mean body mass index was 25.6), the results of these studies support the idea that effects of GLP-1 RAs on weight and TDD may diminish over time.14
Within the VHA, GLP-1 RAs are nonformulary medications. Patients must meet certain criteria in order to be approved for these agents, which may include diagnosis of CVD, renal disease, or failure to reach glycemic control with the use of oral agents or insulin. Therefore, participants of this study represent a particular subset of VHA patients, many of whom may have been selected for consideration due to long-standing or uncontrolled T2DM and failure of previous therapies. The baseline demographics support this idea, given poor glycemic control at baseline and high insulin requirements. Once approved for GLP-1 RA therapy, semaglutide is currently the preferred agent within the VHA, with other agents being available for select considerations. It should be noted that albiglutide, which was the primary agent selected for some of the patients included in this study, was removed from the market in 2017 for economic considerations.15 In the case for these patients, a conversion to a formulary-preferred GLP-1 RA was made.
Most of the patients included in this study (70%) were maintained on metformin from baseline throughout the study period. Fifty-seven percent of patients were taking TDD of insulin > 150 units. Considering the significant cost of concentrated insulins, the addition of GLP-1 RAs to standard insulin may prove to be beneficial from a cost standpoint. Additional research in this area may be warranted to establish more data regarding this potential benefit of GLP-1 RAs as add-on therapy.
Many adverse drug reactions were reported at different periods; however, most of these were associated with the gastrointestinal system, which is consistent with current literature, drug labeling, and the mechanism of action.16 Hypoglycemia occurred in about one-third of the participants; however, it should be noted that alone, GLP-1 RAs are not associated with a high risk of hypoglycemia. Previous studies have found that GLP-1 RA monotherapy is associated with hypoglycemia in 1.6% to 12.6% of patients.17,18 More likely, the combination of basal/bolus insulin and the GLP-1 RA’s effect on increasing insulin sensitivity through weight loss, improving glucose-dependent insulin secretion, or by decreasing appetite and therefore decreasing carbohydrate intake contributed to the hypoglycemia prevalence.
Limitations and Strengths
Limitations of this study include a small patient population and a gradual reduction in available data as time periods progressed, making even smaller sample sizes for subsequent time periods. A majority of participants were older males of White race. This could have limited the determination of statistical significance and applicability of the results to other patient populations. Another potential limitation was the retrospective nature of the study design, which may have limited reporting of hypoglycemia and other AEs based on the documentation of the clinician.
Strengths included the length of study duration and the diversity of GLP-1 RAs used by participants, as the impact of many of these agents has not yet been assessed in the literature. In addition, the retrospective nature of the study allows for a more realistic representation of patient adherence, education, and motivation, which are likely different from those of patients included in prospective clinical trials.
There are no clear guidelines dictating the optimal duration of concomitant GLP-1 RA and insulin therapy; however, our study suggests that there may be continued benefits past short-term use. Also our study suggests that patients with T2DM treated with basal/bolus insulin regimens may glean additional benefit from adding GLP-1 RAs; however, further randomized, controlled studies are warranted, particularly in poorly controlled patients requiring even more aggressive treatment regimens, such as concentrated insulins.
Conclusions
In our study, adding GLP-1 RA to basal/bolus insulin was associated with a significant decrease in HbA1c from baseline through 18 months. An overall decrease in weight and TDD of insulin was observed through 24 months, but the change in weight was not significant past 18 months, and the change in insulin requirement was not significant past 12 months. Hypoglycemia was observed in almost one-third of patients, and gastrointestinal symptoms were the most common AE observed as a result adding GLP-1 RAs. More studies are needed to better evaluate the durability and cost benefit of GLP-1 RAs, especially in patients with high insulin requirements.
Acknowledgments
This material is the result of work supported with resources and facilities at Veteran Health Indiana in Indianapolis. Study data were collected and managed using REDCap electronic data capture tools hosted at Veteran Health Indiana. The authors also acknowledge George Eckert for his assistance with data analysis.
1. American Diabetes Association. Statistics about diabetes. Accessed August 9, 2022. http://www.diabetes.org/diabetes-basics/statistics
2. US Department of Veterans Affairs, Veterans Health Administration, Office of Research and Development. VA research on: diabetes. Updated January 15, 2021. Accessed August 9, 2022. https://www.research.va.gov/topics/diabetes.cfm
3. Federal Practitioner. Federal Health Care Data Trends 2017, Diabetes mellitus. Accessed August 9, 2022. https://www.fedprac-digital.com/federalpractitioner/data_trends_2017?pg=20#pg20
4. American Diabetes Association Professional Practice Committee. 9. Pharmacologic approaches to glycemic treatment: Standards of Medical Care in Diabetes—2022. Diabetes Care. 2022;45(suppl 1):S125-S143. doi:10.2337/dc22-S009
5. Garber AJ, Abrahamson MJ, Barzilay JI, et al. Consensus statement by the American Association of Clinical Endocrinologists and American College of Endocrinology on the comprehensive type 2 diabetes management algorithm – 2019 executive summary. Endocr Pract. 2019;25(1):69-100. doi:10.4158/CS-2018-0535
6. St Onge E, Miller S, Clements E, Celauro L, Barnes K. The role of glucagon-like peptide-1 receptor agonists in the treatment of type 2 diabetes. J Transl Int Med. 2017;5(2):79-89. Published 2017 Jun 30. doi:10.1515/jtim-2017-0015
7. Almandoz JP, Lingvay I, Morales J, Campos C. Switching between glucagon-like peptide-1 receptor agonists: rationale and practical guidance. Clin Diabetes. 2020;38(4):390-402. doi:10.2337/cd19-0100
8. Davies ML, Pham DQ, Drab SR. GLP1-RA add-on therapy in patients with type 2 diabetes currently on a bolus containing insulin regimen. Pharmacotherapy. 2016;36(8):893-905. doi:10.1002/phar.1792
9. Rosenstock J, Guerci B, Hanefeld M, et al. Prandial options to advance basal insulin glargine therapy: testing lixisenatide plus basal insulin versus insulin glulisine either as basal-plus or basal-bolus in type 2 diabetes: the GetGoal Duo-2 Trial Investigators. Diabetes Care. 2016;39(8):1318-1328. doi:10.2337/dc16-0014
10. Levin PA, Mersey JH, Zhou S, Bromberger LA. Clinical outcomes using long-term combination therapy with insulin glargine and exenatide in patients with type 2 diabetes mellitus. Endocr Pract. 2012;18(1):17-25. doi:10.4158/EP11097.OR
11. Yoon NM, Cavaghan MK, Brunelle RL, Roach P. Exenatide added to insulin therapy: a retrospective review of clinical practice over two years in an academic endocrinology outpatient setting. Clin Ther. 2009;31(7):1511-1523. doi:10.1016/j.clinthera.2009.07.021
12. Weissman PN, Carr MC, Ye J, et al. HARMONY 4: randomised clinical trial comparing once-weekly albiglutide and insulin glargine in patients with type 2 diabetes inadequately controlled with metformin with or without sulfonylurea. Diabetologia. 2014;57(12):2475-2484. doi:10.1007/s00125-014-3360-3
13. Gyorffy JB, Keithler AN, Wardian JL, Zarzabal LA, Rittel A, True MW. The impact of GLP-1 receptor agonists on patients with diabetes on insulin therapy. Endocr Pract. 2019;25(9):935-942. doi:10.4158/EP-2019-0023
14. Seino Y, Kaneko S, Fukuda S, et al. Combination therapy with liraglutide and insulin in Japanese patients with type 2 diabetes: a 36-week, randomized, double-blind, parallel-group trial. J Diabetes Investig. 2016;7(4):565-573. doi:10.1111/jdi.12457
15. Optum. Tanzeum (albiglutide)–drug discontinuation. Published 2017. Accessed August 15, 2022. https://professionals.optumrx.com/content/dam/optum3/professional-optumrx/news/rxnews/drug-recalls-shortages/drugwithdrawal_tanzeum_2017-0801.pdf
16. Chun JH, Butts A. Long-acting GLP-1RAs: an overview of efficacy, safety, and their role in type 2 diabetes management. JAAPA. 2020;33(8):3-18. doi:10.1097/01.JAA.0000669456.13763.bd
17. Ozempic semaglutide injection. Prescribing information. Novo Nordisk; 2022. Accessed August 9, 2022. https://www.novo-pi.com/ozempic.pdf
18. Victoza liraglutide injection. Prescribing information. Novo Nordisk; 2021. Accessed August 9, 2022. https://www.novo-pi.com/victoza.pdf
Commentary: Preventing and Predicting T2D Complications, October 2022

Diabetes guidelines recommend sodium-glucose transport protein 2 (SGLT2) inhibitors to reduce kidney disease progression in patients with type 2 diabetes (T2D) and moderate-to-severe albuminuric kidney disease on the basis of renal outcomes trials, such as CREDENCE and DAPA-CKD. However, these trials did not include patients who are at low risk for kidney disease progression.
Mozenson and colleagues published a post hoc analysis of the DECLARE-TIMI 58 trial and focused on patients with low kidney risk. They demonstated that dapagliflozin slowed the progression of kidney disease in patients with T2D at high cardiovascular risk, including those who are at low risk for kidney progression. The absolute benefit for slowing kidney progression was much lower in patients with low kidney risk compared with those who are at high or very high risk (number needed to treat 177 vs 13-23). Though dapagliflozin does provide kidney protection across a spectrum of patients with kidney risk, clinicians should consider the level of risk when starting an SGLT2 inhibitor for slowing kidney disease.
SGLT2 inhibitor outcome trials and meta-analyses have mainly shown neutral results for ischemic stroke, except for sotagliflozin vs placebo in the SCORED trial. In this trial, sotagliflozin was shown to reduce total stroke. Recently, in a retrospective longitudinal cohort study of patients with T2D in Taiwan, Lin and colleagues have shown a significant reduction in new onset stroke among those who use SGLT2 inhibitor compared with those who don't. A 15% relative risk reduction in stroke was shown in an analysis that adjusted for age, sex, and duration of T2D, with a similar reduction in a propensity score-matched analysis. Although limited by its observational design, this study suggests that further research should be continued regarding the impact of SGLT2 inhibitors on stroke outcomes.
Severe hypoglycemia is a serious complication of insulin and insulin secretagogue therapy. There have been few studies regarding the association between long-term glycemic variability of A1c and fasting plasma glucose (FPG) and the risk for severe hypoglycemia. Long and colleagues performed a post hoc analysis of the ACCORD study and found that both A1c and FPG variability were associated with a greater risk for severe hypoglycemia in T2D, with FPG being a more sensitive indicator than is A1c variability. Clinicians need to be aware that A1c and FPG variability in insulin- or insulin secretagogue–treated patients with T2D places them at greater risk for severe hypoglycemia and such variability should be considered a potential target of treatment.
Although a higher mean A1c has been linked to diabetes microvascular and macrovascular complications, there is a paucity of data comparing mean A1c and A1c variability and diabetes complications. In a prospective study from Taiwan, Wu and colleagues demonstrated that both mean A1c and A1c variability predicted most diabetes-related complications, with mean A1c being more effective at predicting retinopathy and A1c variability being more effective at predicting a decline in kidney function and cardiovascular and total mortality. Perhaps physicians need to pay more attention to A1c variability and not just the mean A1c over time when assessing an individual and their overall risk for diabetes complications.
Unsure on the best T2D drug choice? Let patients decide
STOCKHOLM – When a clinician is unsure which of several equally viable drug options is best for a specific patient with type 2 diabetes, a rational approach is to run a serial trial with each one and then let each patient decide which agent works best for them.
That concept underwent successful testing in a recent trial with 457 patients with type 2 diabetes and already on treatment with metformin or metformin plus a sulfonylurea but needed further glycemic control. After cycling through 4-month trials (when tolerated) of canagliflozin (Invokana), pioglitazone (Actos), and sitagliptin (Januvia), 24% identified pioglitazone as the one that made them feel best, 33% favored sitagliptin, 37% said canagliflozin was tops, and 6% had no preference, Beverley Shields, PhD, reported at the annual meeting of the European Association for the Study of Diabetes.
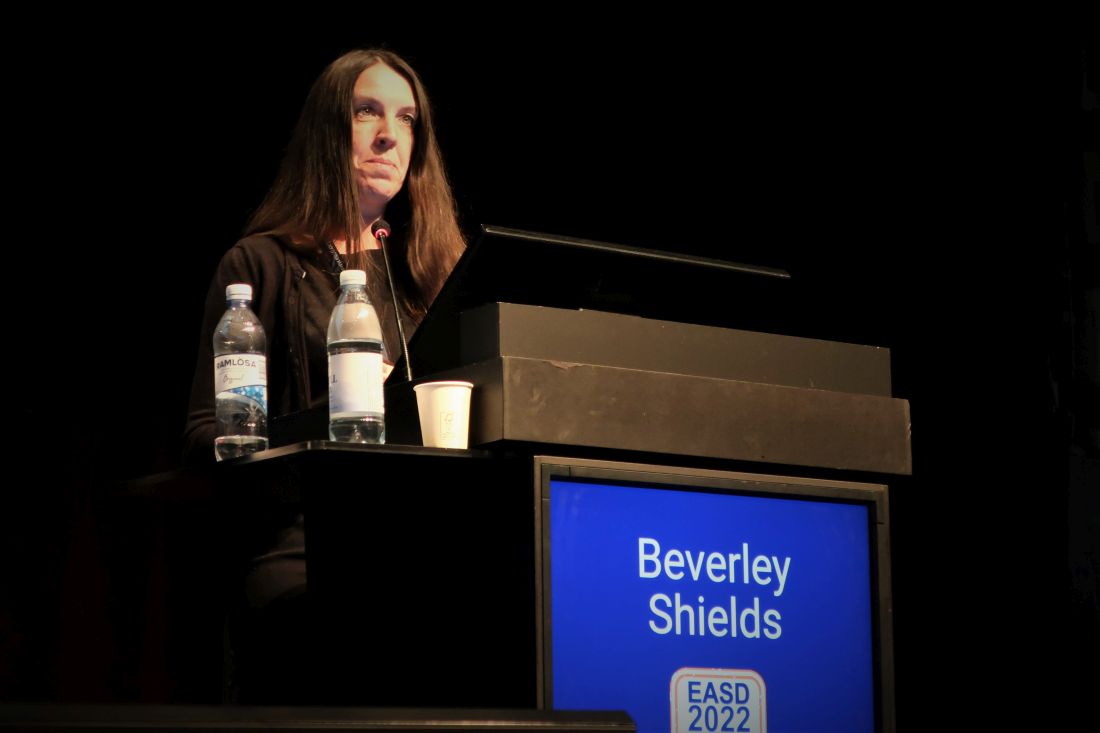
After making these selections based on just their qualitative self-appraisals, researchers told patients about their hemoglobin A1c status on each of the three agents. It barely budged their choices, which became 25% calling pioglitazone best, 35% naming sitagliptin their preference, 38% opting for canagliflozin, with 2% having no preference.
Further analysis showed that the drug patients preferred was also the one that produced their lowest A1c level when compared with their 8 months on each of the two other agents tested, showing a link between lower A1c levels and improved well-being. The same relationship existed for the drug that caused the fewest adverse events for each patient.
Patients prefer feeling better
“Patients tended to prefer the drug that they ‘felt better’ on, with the lowest A1c level and the lowest number of side effects,” explained Dr. Shields, a medical statistician at the University of Exeter (England). Changes in weight appeared less important to patients for establishing a preference.

“This is for when there is equipoise” among drug options, Andrew Hattersley, BMBCh, DM, the study’s principal investigator, said in an interview. “When you are unsure what to prescribe and there is no clear indication for one drug over another, try 4 months of one and 4 months of the other, then let the patient decide.
“Patients had overwhelming positivity about being able to choose their drug,” added Dr. Hattersley, who is also professor of molecular medicine at the University of Exeter.
“This has implications across medicine,” he added. “Whenever you’re not sure how to balance adverse effects and positive effects the best person to decide is the one who experiences the effects.”
“I’m a bit worried by this approach, but it is something new” and worth considering, commented Drazenka P. Barlovic, MD, an endocrinologist at the University Medical Center in Ljubljana, Slovenia, who chaired the session where Dr. Shields gave her report. “We should also have the courage to challenge metformin, as there is no longer an obligation to make it the first drug,” she said in an interview.
The study ran as a secondary analysis of the TriMaster study, which had the primary objective of identifying patient characteristics that could predict which of the three drug options tested worked best for certain patient subgroups. That analysis, presented at the 2021 EASD annual meeting, found that factors such as body mass index and kidney function significantly linked with the clinical responses patients had to each of the three tested agents.
The new analysis focused on 457 of the TriMaster participants who had provided preference information after they had tried all three agents. By design, none of the participants enrolled in the study had a contraindication for any of the tested drugs.
Patients quickly identify adverse effects
“We picked 4 months because it not too long, but long enough to see adverse effects, and to measure on-treatment A1c. Patients quickly identify their adverse events,” Dr. Shields said in an interview.
“This could come into practice now; there is no cost involved. Do it when you’re not certain which drug to prescribe,” Dr. Hattersley suggested. “We can’t know which drug a patient might prefer.” He also stressed telling patients to return quicker than 4 months if they can’t tolerate a new drug.
The findings have already changed Dr. Hattersley’s practice, and he believes it will catch on as he introduces it to local primary care physicians.
The study received no commercial funding. Dr. Shields, Dr. Hattersley, and Dr. Barlovic had no disclosures.
STOCKHOLM – When a clinician is unsure which of several equally viable drug options is best for a specific patient with type 2 diabetes, a rational approach is to run a serial trial with each one and then let each patient decide which agent works best for them.
That concept underwent successful testing in a recent trial with 457 patients with type 2 diabetes and already on treatment with metformin or metformin plus a sulfonylurea but needed further glycemic control. After cycling through 4-month trials (when tolerated) of canagliflozin (Invokana), pioglitazone (Actos), and sitagliptin (Januvia), 24% identified pioglitazone as the one that made them feel best, 33% favored sitagliptin, 37% said canagliflozin was tops, and 6% had no preference, Beverley Shields, PhD, reported at the annual meeting of the European Association for the Study of Diabetes.
After making these selections based on just their qualitative self-appraisals, researchers told patients about their hemoglobin A1c status on each of the three agents. It barely budged their choices, which became 25% calling pioglitazone best, 35% naming sitagliptin their preference, 38% opting for canagliflozin, with 2% having no preference.
Further analysis showed that the drug patients preferred was also the one that produced their lowest A1c level when compared with their 8 months on each of the two other agents tested, showing a link between lower A1c levels and improved well-being. The same relationship existed for the drug that caused the fewest adverse events for each patient.
Patients prefer feeling better
“Patients tended to prefer the drug that they ‘felt better’ on, with the lowest A1c level and the lowest number of side effects,” explained Dr. Shields, a medical statistician at the University of Exeter (England). Changes in weight appeared less important to patients for establishing a preference.
“This is for when there is equipoise” among drug options, Andrew Hattersley, BMBCh, DM, the study’s principal investigator, said in an interview. “When you are unsure what to prescribe and there is no clear indication for one drug over another, try 4 months of one and 4 months of the other, then let the patient decide.
“Patients had overwhelming positivity about being able to choose their drug,” added Dr. Hattersley, who is also professor of molecular medicine at the University of Exeter.
“This has implications across medicine,” he added. “Whenever you’re not sure how to balance adverse effects and positive effects the best person to decide is the one who experiences the effects.”
“I’m a bit worried by this approach, but it is something new” and worth considering, commented Drazenka P. Barlovic, MD, an endocrinologist at the University Medical Center in Ljubljana, Slovenia, who chaired the session where Dr. Shields gave her report. “We should also have the courage to challenge metformin, as there is no longer an obligation to make it the first drug,” she said in an interview.
The study ran as a secondary analysis of the TriMaster study, which had the primary objective of identifying patient characteristics that could predict which of the three drug options tested worked best for certain patient subgroups. That analysis, presented at the 2021 EASD annual meeting, found that factors such as body mass index and kidney function significantly linked with the clinical responses patients had to each of the three tested agents.
The new analysis focused on 457 of the TriMaster participants who had provided preference information after they had tried all three agents. By design, none of the participants enrolled in the study had a contraindication for any of the tested drugs.
Patients quickly identify adverse effects
“We picked 4 months because it not too long, but long enough to see adverse effects, and to measure on-treatment A1c. Patients quickly identify their adverse events,” Dr. Shields said in an interview.
“This could come into practice now; there is no cost involved. Do it when you’re not certain which drug to prescribe,” Dr. Hattersley suggested. “We can’t know which drug a patient might prefer.” He also stressed telling patients to return quicker than 4 months if they can’t tolerate a new drug.
The findings have already changed Dr. Hattersley’s practice, and he believes it will catch on as he introduces it to local primary care physicians.
The study received no commercial funding. Dr. Shields, Dr. Hattersley, and Dr. Barlovic had no disclosures.
AT EASD 2022
Early age at hysterectomy ups type 2 diabetes risk
Data from a large French cohort study suggest that women who have a hysterectomy before 40-45 years of age may be at particular risk of subsequently developing type 2 diabetes.
A 20% increase in the risk for incident diabetes was found comparing women of all ages who had and had not had a hysterectomy (P = .0003).
This risk jumped to a 52% increase when only women below the age of 45 were considered (P < .0001) and was still 38% higher if only women under 40 years were analyzed (P = .005).

“Our findings clearly show that hysterectomy is a risk marker for diabetes,” Fabrice Bonnet, MD, PhD, of Centre Hospitalier Universitaire (CHU) de Rennes (France), said at the annual meeting of the European Association for the Study of Diabetes.
Importantly, this risk appears to occur “independently of any hormonal therapy, any reproductive factors, physical activity, and diet,” Dr. Bonnet added.
Findings challenged
“I would like to challenge your findings,” said Peter Nilsson, MD, PhD, a professor at Lund (Sweden) University, during the postpresentation discussion period.
“Could there be a detection bias?” queried Dr. Nilsson. “If you undergo surgery like this, there will be several postoperative visits to a physician and there’s a higher likelihood of somebody taking blood samples and detecting diabetes.
“So, if this is true, it could mean that postoperative controls of goiter or thyroid surgery would bring the same findings,” Dr. Nilsson suggested.
“It is an epidemiological cohort of woman followed for a long time,” Dr. Bonnet responded. “So of course, there probably was more blood testing than in the usual population, but we did not observe the association for another type of surgery and type 2 diabetes.”
Clarifying further, Dr. Bonnet said that they had looked at thyroid surgery but not any other types of abdominal surgery.
Assessing the risk of incident diabetes
Hysterectomy is a common surgery among women – more than 400,000 are estimated to be performed every year in the United States, and 80,000 in France, with a rising rate in developing countries, Dr. Bonnet said in an interview.
“We don’t know exactly why that is, but it could have long-term consequences in terms of metabolic effects and the incidence of diabetes,” he said.
Prior research has linked having a hysterectomy with an increased rate of hypertension and cardiovascular risk, and there have also been a few studies linking it to diabetes.
“Our aim was to analyze the relationship between the past history of hysterectomies and the risk of incident diabetes; and specifically, we assessed the influence of age,” Dr. Bonnet said.
To do so, data on more than 83,000 women who had participated in The French E3N Prospective Cohort Study (E3N) were obtained. This large epidemiologic study is the French component of the long-running EPIC study.
For inclusion in the analysis, women had to have no diabetes at baseline, to have had their uterus, ovaries, or both removed for benign gynecologic reasons, and to have had their surgeries performed before any diagnosis of diabetes had been made. A diagnosis of diabetes was identified through the women’s responses to self-report questionnaires and prescriptions for antidiabetic medications.
In all, 2,672 women were found to have developed diabetes during the 16-year follow-up period.
The hazard ratio for the risk of diabetes in women who had and had not had a hysterectomy was 1.30 (95% confidence interval, 1.17-1.43; P < .0001), taking age into account and stratifying for birth generation.
The association held, when there was adjustment for other factors such as smoking status, physical activity, history of diabetes, weight, and adherence to a Mediterranean diet (HR 1.27; 95% CI 1.02-1.05; P = .02).
And, after adjustment for age at menarche, menopausal status, age at which menopause was reached, oral contraceptive and hormone therapy use, and the number of pregnancies, the risk for type 2 diabetes was still apparent in those who had undergoing a hysterectomy (HR, 1.20; 95% CI, 1.09-1.33; P = .0003).
Risk increased with oophorectomy
“Women who had both hysterectomy with bilateral oophorectomy had the highest rates of incident diabetes, as compared to women without hysterectomy and no oophorectomy,” said Dr. Bonnet (HR, 1.26; 95% CI, 1.11-1.42; P = .0003).
“This suggests preserving ovarian function is of importance,” he added. “Try to keep the ovaries in place, so just have hysterectomy alone,” he suggested might be the advice to fellow clinicians.
“So, identifying women at higher risk could be followed by a prevention program,” he suggested. “We do this for women who have gestational diabetes,” but for women who have had a hysterectomy, “we didn’t pay attention to this until now.”
No increased risk for endometriosis
While hysterectomy appears to up the risk for diabetes, having endometriosis does not. In a separate analysis of data from the E3N cohort, no effect was seen despite the association between endometriosis and other cardiometabolic risk factors.
The HR for incident type 2 diabetes comparing women with and without endometriosis was 10.06 in a fully adjusted statistical model (95% CI, 0.87-1.29). While there was an increase in the risk for diabetes if a woman had endometriosis and had also had a hysterectomy, this was not significant (HR, 1.22; 95% CI, 0.96-1.54).
The E3N study was sponsored by the French Institute for Health and Research. Dr. Bonnet and Dr. Nilsson had no relevant conflicts of interest to disclose.
Data from a large French cohort study suggest that women who have a hysterectomy before 40-45 years of age may be at particular risk of subsequently developing type 2 diabetes.
A 20% increase in the risk for incident diabetes was found comparing women of all ages who had and had not had a hysterectomy (P = .0003).
This risk jumped to a 52% increase when only women below the age of 45 were considered (P < .0001) and was still 38% higher if only women under 40 years were analyzed (P = .005).
“Our findings clearly show that hysterectomy is a risk marker for diabetes,” Fabrice Bonnet, MD, PhD, of Centre Hospitalier Universitaire (CHU) de Rennes (France), said at the annual meeting of the European Association for the Study of Diabetes.
Importantly, this risk appears to occur “independently of any hormonal therapy, any reproductive factors, physical activity, and diet,” Dr. Bonnet added.
Findings challenged
“I would like to challenge your findings,” said Peter Nilsson, MD, PhD, a professor at Lund (Sweden) University, during the postpresentation discussion period.
“Could there be a detection bias?” queried Dr. Nilsson. “If you undergo surgery like this, there will be several postoperative visits to a physician and there’s a higher likelihood of somebody taking blood samples and detecting diabetes.
“So, if this is true, it could mean that postoperative controls of goiter or thyroid surgery would bring the same findings,” Dr. Nilsson suggested.
“It is an epidemiological cohort of woman followed for a long time,” Dr. Bonnet responded. “So of course, there probably was more blood testing than in the usual population, but we did not observe the association for another type of surgery and type 2 diabetes.”
Clarifying further, Dr. Bonnet said that they had looked at thyroid surgery but not any other types of abdominal surgery.
Assessing the risk of incident diabetes
Hysterectomy is a common surgery among women – more than 400,000 are estimated to be performed every year in the United States, and 80,000 in France, with a rising rate in developing countries, Dr. Bonnet said in an interview.
“We don’t know exactly why that is, but it could have long-term consequences in terms of metabolic effects and the incidence of diabetes,” he said.
Prior research has linked having a hysterectomy with an increased rate of hypertension and cardiovascular risk, and there have also been a few studies linking it to diabetes.
“Our aim was to analyze the relationship between the past history of hysterectomies and the risk of incident diabetes; and specifically, we assessed the influence of age,” Dr. Bonnet said.
To do so, data on more than 83,000 women who had participated in The French E3N Prospective Cohort Study (E3N) were obtained. This large epidemiologic study is the French component of the long-running EPIC study.
For inclusion in the analysis, women had to have no diabetes at baseline, to have had their uterus, ovaries, or both removed for benign gynecologic reasons, and to have had their surgeries performed before any diagnosis of diabetes had been made. A diagnosis of diabetes was identified through the women’s responses to self-report questionnaires and prescriptions for antidiabetic medications.
In all, 2,672 women were found to have developed diabetes during the 16-year follow-up period.
The hazard ratio for the risk of diabetes in women who had and had not had a hysterectomy was 1.30 (95% confidence interval, 1.17-1.43; P < .0001), taking age into account and stratifying for birth generation.
The association held, when there was adjustment for other factors such as smoking status, physical activity, history of diabetes, weight, and adherence to a Mediterranean diet (HR 1.27; 95% CI 1.02-1.05; P = .02).
And, after adjustment for age at menarche, menopausal status, age at which menopause was reached, oral contraceptive and hormone therapy use, and the number of pregnancies, the risk for type 2 diabetes was still apparent in those who had undergoing a hysterectomy (HR, 1.20; 95% CI, 1.09-1.33; P = .0003).
Risk increased with oophorectomy
“Women who had both hysterectomy with bilateral oophorectomy had the highest rates of incident diabetes, as compared to women without hysterectomy and no oophorectomy,” said Dr. Bonnet (HR, 1.26; 95% CI, 1.11-1.42; P = .0003).
“This suggests preserving ovarian function is of importance,” he added. “Try to keep the ovaries in place, so just have hysterectomy alone,” he suggested might be the advice to fellow clinicians.
“So, identifying women at higher risk could be followed by a prevention program,” he suggested. “We do this for women who have gestational diabetes,” but for women who have had a hysterectomy, “we didn’t pay attention to this until now.”
No increased risk for endometriosis
While hysterectomy appears to up the risk for diabetes, having endometriosis does not. In a separate analysis of data from the E3N cohort, no effect was seen despite the association between endometriosis and other cardiometabolic risk factors.
The HR for incident type 2 diabetes comparing women with and without endometriosis was 10.06 in a fully adjusted statistical model (95% CI, 0.87-1.29). While there was an increase in the risk for diabetes if a woman had endometriosis and had also had a hysterectomy, this was not significant (HR, 1.22; 95% CI, 0.96-1.54).
The E3N study was sponsored by the French Institute for Health and Research. Dr. Bonnet and Dr. Nilsson had no relevant conflicts of interest to disclose.
FROM EASD 2022
Type 1 diabetes complication risk rises with A1c, duration
Long-term A1c from the time of type 1 diabetes diagnosis strongly predicts the development of severe retinopathy and nephropathy, new data suggest.
“[Weighted] HbA1c followed from diagnosis is a very strong biomarker for pan-retinal laser-treated diabetic retinopathy (PDR) and nephropathy, [and] the prevalence of both is still increasing 32 years after diagnosis,” say Hans J. Arnqvist, MD, and colleagues in their study published online Sept. 12 in Diabetes Care.
The results are from a 32-year follow-up of 447 patients from time of diagnosis of type 1 diabetes at age 0-34 in the Vascular Diabetic Complications in Southeast Sweden study.
“To avoid PDR and macroalbuminuria in patients with type 1 diabetes, A1c less than 7.0% (53 mmol/mol) and as normal as possible should be recommended when achievable without severe hypoglycemia and with good quality of life,” stress Dr. Arnqvist, department of endocrinology, Linköping University (Sweden), and coauthors.
At the time of the 20- to 24-year VISS follow-up, severe eye complications, defined as PDR, or nephropathy, defined as macroalbuminuria, were not present in participants with a long-term weighted mean A1c less than 7.6% (60 mmol/mol), they write.
Is explanation an increase in glycemic burden with diabetes duration?
By years 32-36, the prevalence of PDR had risen from 14% to 27%, and macroalbuminuria from 4% to 8%, with prevalence strongly correlated with A1c levels. At the same time, the threshold for the appearance of those severe complications dropped, with the lowest A1c values for appearance of PDR decreasing from 7.6% to 7.3% and for macroalbuminuria from 8.4% to 8.1%.
“A possible explanation for the lowered threshold for development of severe microangiopathy is the increase in ‘glycemic burden’ with diabetes duration,” the authors speculate.
In all A1c categories above 6.7% (> 50 mmol/mol), the cumulative proportion with PDR and/or macroproteinuria continued to increase up to at least 32 years of diabetes duration.
At the highest A1c quintile, greater than 9.5% (> 80mmol/mol), 75% had developed PDR and 44.2% had macroalbuminuria.
These findings align with guidelines from both the International Society for Pediatric and Adolescent Diabetes, which recommend A1c less than 7% (53 mmol/mol) as a treatment goal, and the UK National Institute for Health and Care Excellence, which advises a target A1c of 6.5% (48 mmol/mol) or lower in children and adults with type 1 diabetes.
The American Diabetes Association recommends individualized A1c targets ranging from 6.5% to 8.0%.
The study was supported by Barndiabetesfonden (Swedish Children’s Diabetes Foundation) and Region Ostergotlands Stiftelsefonder. The authors reported no further disclosures.
A version of this article first appeared on Medscape.com.
Could cold exposure, especially shivering, combat type 2 diabetes?
STOCKHOLM – Shivering upon repeated short exposures to cold improves glucose tolerance, decreases fasting blood glucose and lipid levels, and markedly reduces blood pressure, show new study results in adults with obesity and overweight.
Presenting the preliminary findings at the annual meeting of the European Association for the Study of Diabetes, Adam Sellers, a PhD student from Maastricht (the Netherlands) University, said: “The results are highly promising and may eventually suggest an alternative treatment or preventative measure for type 2 diabetes.”
Dr. Sellers found that 10 daily 1-hour sessions of shivering at 10° C led to 85% of participants showing a drop in fasting glucose, and a 32% drop in lipid levels, as well as a blood pressure drop of around 8% overall.
Although cold exposure is known to increase brown fat, Dr. Sellers doesn’t believe this explains his findings. “This research, in addition to two other prior studies, suggest that shivering and skeletal muscle may play a more important role than brown fat,” he said.
“Muscle can contract mechanically – [the concept of the] shivers – thereby generating heat, and there is considerably more muscle than brown fat in a human, so shivering can burn more calories and produce more heat,” he explained.
He added that, in the future, “in a similar way to saunas and steam rooms, there might be cold rooms where people go and sit in the cold room and shiver, or possibly patients attend hospital and shivering is induced.”
Audience member Anna Krook, PhD, professor of integrative physiology at the Karolinska Institute, Stockholm, commented on the work, saying the results are “potent” and demonstrate the metabolic effect of shivering. “One thing that struck me was, given the time the subject had to spend – 1 hour shivering over 10 days, I wonder if 1 hour of exercise would show similarly potent effects, and perhaps for those people who cannot perform exercise for whatever reason this might be a good alternative.”
She pointed out that, in terms of translation into practice, it “really depends on how tolerable this is. It also shows how important our muscle is in regulating metabolism. The study showed that you had to be shivering, and it wasn’t just enough to be cold, which has implications for the role of brown fat, especially when we consider the small amount of brown fat we have compared to muscle, which can be half of body weight.”
And Denis P. Blondin, PhD, said: “The reality is that we know it can be difficult and even painful for individuals with obesity to perform exercise, and therefore, cold exposure offers a passive way of improving our metabolic profile and cardiovascular health.”
“Some will argue that it is unrealistic to propose cold exposure as a therapy, but people overlook the fact that cold exposure [mostly through cold-water immersion] has increased in popularity over the past 5 years and has also been a cultural staple for many Nordic countries, albeit often performed with heat exposure as well [see the use of saunas and cold-water swimming in Finland and other Nordic countries],” added Dr. Blondin, of the faculty of medicine and health sciences, University of Sherbrooke (Que.)
“While it can certainly be uncomfortable at first (like starting an exercise program), we adapt very quickly,” he added.
1 hour in a cold-water suit to induce shivering
In the current study, Dr. Sellers exposed adults (aged 40-75 years; 11 men and 4 postmenopausal women) with overweight/obesity (body mass index, 27-35 kg/m2) to 10 consecutive cold exposures of at least 1 hour of shivering per cold exposure.
“The shivering in this new research was more intense [than in prior studies] and was induced with a different cold exposure method – a 10° C water-perfused suit [compared with a prior study of 14-15° C, 6 hours/day]. This facilitated a shorter cold exposure duration, deemed feasible for the participants,” explained Dr. Sellers.
“At baseline, participants had glucose and A1c levels at the upper end of the normal criteria [5.5 mmol/l and 5.4%, respectively],” he said, referring to measurements that were suggestive of possible progression to type 2 diabetes.
He explained how the cold exposure was applied. “We induced the cold with a water-perfused suit worn by the participant, through which water flows at 10° C, and this cools the participant. Eventually, the participant starts to shiver, and does so for at least 1 hour every morning for 10 days.”
Participants’ shivering-induced heat production was measured via surface electromyography and visual observation to confirm the presence of shivering. Both before and after the 10-day course of shivering, physiological measurements were taken in the morning while participants were at rest in an overnight fasted state, and under thermoneutral conditions. Blood pressure and fasting blood glucose were measured.
A 2-hour oral glucose tolerance test (OGTT) was conducted twice for each participant: on the morning before the 10-day course of shivering and again on the morning after the final 10th day of shivering.
The primary endpoint was change from before to after the 10-day shivering intervention, as represented by the total area under the curve of glucose levels over time during the OGTT.
“This provides a measure of the glucose concentrations in the blood before and after the 10 shivering sessions over the 10 days.”
Fasting glucose and blood lipids fall, glucose tolerance improves
After 10 shivering sessions, mean fasting plasma glucose decreased significantly in 13 out of the 15 participants, compared with before the first session (from 5.84 mmol/L to 5.67 mmol/L; P = .013).
Glucose tolerance during the OGTT improved by 6% (P = .041). “We can see that this was not due to a change in their insulin concentrations in the blood,” remarked Dr. Sellers, referring to the finding that plasma insulin concentrations at baseline and during the OGTT did not change.
Fasting plasma triglyceride and free-fatty acid concentrations also decreased significantly by 32% (P = .001) and 11% (P = .036), respectively.
“This is important because free-fatty acids are involved in the role of insulin resistance,” said Dr. Sellers. “In addition, the large reduction in serum triglycerides could have implications for atherosclerosis, which may also be beneficial.”
Dr. Sellers also found that systolic blood pressure decreased by 10 mm Hg or 7.4% (P < .001), while diastolic blood pressure decreased by 7 mm Hg or 8.1% (P < .001) on average. This lowering was seen in all participants.
“Again, quite strikingly, all participants showed” a reduction in blood pressure, said Dr. Sellers, which he noted relates to a decrease in resting heart rate (P = .062).
Brown fat or skeletal muscle contraction?
Dr. Sellers pointed out that, despite nonshivering thermogenesis being involved in mild cold acclimation, the data so far suggest that some level of mild muscle activity or shivering appears crucial in provoking the beneficial metabolic effects of cold acclimation.
“Brown fat is a metabolic heating system inside our bodies, burning calories”, explained Dr. Sellers. “This generates heat and prevents calories from being deposited as normal white fat. Brown fat is activated during cold and when we eat, but its activity is less in older adults and in individuals with obesity and diabetes.”
“Going forward, we might investigate the effects of shorter duration – so more intense shivering – to try and elucidate more precisely the optimum duration and intensity of shivering needed,” said Dr. Sellers.
“Our findings are promising and may have important health implications. In future studies, we plan to assess the effect of shivering in adults with type 2 diabetes,” he concluded.
Dr. Seller and Dr. Krook have reported no relevant financial relationships.
A version of this article first appeared on Medscape.com.
AT EASD 2022