User login
Things We Do for No Reason™: Fluid Restriction for the Management of Acute Decompensated Heart Failure in Patients With Reduced Ejection Fraction
Inspired by the ABIM Foundation’s Choosing Wisely® campaign, the “Things We Do for No Reason™” (TWDFNR) series reviews practices that have become common parts of hospital care but may provide little value to our patients. Practices reviewed in the TWDFNR series do not represent clear-cut conclusions or clinical practice standards but are meant as a starting place for research and active discussions among hospitalists and patients. We invite you to be part of that discussion.
CLINICAL SCENARIO
The hospitalist enters admission orders for an 80-year-old woman with hypertension, coronary artery disease, and heart failure with reduced ejection fraction who presented to the emergency department with weight gain, lower extremity edema, and dyspnea on exertion. She has an elevated jugular venous pressure, crackles on pulmonary exam, and bilateral pitting edema with warm extremities. Labs show a sodium of 140 mmol/L and creatinine of 1.4 mg/dL. After ordering intravenous furosemide for management of acute decompensated heart failure (ADHF), the hospitalist arrives at the nutrition section of the CHF Admission Order Set and reflexively picks an option for a fluid-restricted diet.
BACKGROUND
Patients with ADHF, the leading cause of hospitalization for patients older than 65 years,1 may present with signs and symptoms of volume overload: shortness of breath, lower-extremity swelling, and end-organ dysfunction. Before the 1980s, treatment of ADHF relied on loop diuretics, bedrest, and fluid restriction to minimize congestive symptoms.2 Clinicians based this practice on early theories framing heart failure as primarily an issue of salt and water retention that could be counterbalanced by sodium and fluid restriction.2
Today, hospitalists understand heart failure with reduced ejection fraction (HFrEF) as a heterogenous disease with a shared pathophysiology in which reduced cardiac output, elevated systemic venous pressures, and/or shunting of blood away from the kidneys may all lead to decreased renal perfusion. These phenomena trigger the activation of the renin-angiotensin-aldosterone system (RAAS), leading to sodium and water retention and fluid redistribution.2 As part of the modern day treatment regimen, providers continue to place patients on fluid-restricted diets. Guidelines support this practice.3,4
Since most of the existing literature on the topic of fluid restriction in ADHF relates to HFrEF (left ventricular ejection fraction [LVEF] <40%), as opposed to heart failure with a preserved ejection fraction (HFpEF, LVEF ≥50%), this review will focus on HFrEF patients. Limited existing data support extrapolating these arguments to HFpEF patients as well.5
WHY YOU MIGHT THINK FLUID RESTRICTION IS IMPORTANT IN THE MANAGEMENT OF ADHF IN HFREF PATIENTS
Longstanding conventional wisdom and data extrapolation from the chronic heart failure population has undergirded the practice of fluid restriction for ADHF. Current iterations of the American and European heart failure guidelines recommend fluid restriction of 1.5 to 2.0 L/day in severe ADHF as a management strategy.3,4 The American guidelines recommend considering restricting fluid intake to 2 L/day for most hospitalized ADHF patients without hyponatremia or diuretic resistance. The guidelines base the recommendation on clinical experience and data from a single randomized trial evaluating the effects of sodium restriction on heart failure outcomes in outpatients recently admitted for ADHF.4,6 This trial randomly assigned 232 patients with compensated HFrEF to either a normal or low-sodium diet plus oral furosemide. Researchers instructed both groups to adhere to a 1000 mL/day fluid restriction. The authors found a high incidence of readmissions for worsening congestive heart failure among a cohort of patients (n = 54) with a normal sodium diet who were excluded from randomization due to inability to adhere to the prescribed fluid restriction.6 Notably, this study did not evaluate patients receiving treatment for ADHF and was not designed to investigate the role of fluid restriction for the treatment of ADHF.
A subsequent study by the same investigators looked more deliberately, although not singularly, at outpatient fluid restriction. This study randomly assigned 410 patients with compensated HFrEF into eight groups by fluid intake (1 L vs 2 L), salt intake (80 mmol vs 120 mmol), and furosemide dose (125 mg twice daily vs 250 mg twice daily). At 180 days, the group receiving the fluid-restricted diet with higher sodium intake and higher diuretic dose had the lowest risk of hospital readmission.7Results from these studies of the chronic, compensated heart failure population, in conjunction with longstanding conventional wisdom, have influenced the management of patients hospitalized with ADHF.
WHY FLUID RESTRICTION IN THE MANAGEMENT OF ADHF IN HFREF PATIENTS MIGHT NOT BE HELPFUL
From a pathophysiologic perspective, fluid restriction in ADHF may counterproductively lead to RAAS activation.8 Congestion develops when arterial underfilling leads to RAAS activation, triggering sodium and water retention.2 Furthermore, RAAS activation, as measured by plasma levels of renin, angiotensin II, and aldosterone, correlates with prognosis and mortality in chronic HFrEF.9 Analyses from one of the largest databases of biomarkers from ADHF suggest that RAAS is further upregulated during decongestive therapy.10 While researchers have not studied the effects of fluid restriction on RAAS activation in ADHF patients, extrapolating from these data one may question whether fluid restriction in ADHF patients may further drive RAAS activation. Further activation may contribute to adverse incident outcomes such as worsening renal function.
The most relevant and compelling evidence against fluid restriction to date comes from Travers et al,11 who conducted the first randomized controlled trial examining fluid restriction in ADHF patients. Their small study compared restricted (1 L fluid restriction) vs liberal (free fluid) intake in hospitalized patients with ADHF and demonstrated no difference in duration or daily dose of intravenous diuretics, time to symptomatic improvement, total daily fluid output, or average hospitalization weight loss between the two arms. Furthermore, researchers withdrew more patients in the fluid-restricted arm due to a sustained rise in serum creatinine, suggesting potential harm of this intervention.11 The sample size (N = 67) and fluid-intake difference of only 400 mL between the two groups limited the study results.
In a subsequent randomized controlled trial, Aliti et al12 examined the clinical outcomes of even more aggressive fluid restriction (800 mL/day) and sodium restriction (800 mg/day) versus liberal intake (at least 2.5 L fluid/day and approximately 3-5 g sodium/day) in hospitalized patients with ADHF (N = 75). While this study evaluated both fluid and sodium restriction, it produced relevant results. The study demonstrated no significant difference in weight loss, use of diuretics, or rehospitalization between the study arms.12 At 30-day follow-up, researchers found that patients in the intervention group had more congestion and an increased likelihood of having a B-type natriuretic peptide (BNP) level greater than 700 pg/mL. In the subset of all patients with an elevated BNP level greater than 700 pg/mL at the end of the study, patients in the intervention group had a significantly higher rate of readmission (7 out of 22) compared with controls (1 of 20). Moreover, the fluid-restricted group had 50% higher perceived thirst values compared to the control group.12 The sensation of thirst not only reduces quality of life, but, given that angiotensin II stimulates thirst, it may reflect RAAS activation.13 For these reasons, clinicians should consider this side effect seriously, especially when the literature lacks evidence of the benefits from fluid restriction.
WHEN FLUID RESTRICTION IS HELPFUL IN THE MANAGEMENT OF DECOMPENSATED HEART FAILURE IN HFREF PATIENTS
Fluid-restrict patients who have chronic hyponatremia (Na <135 mmol/L) due to end-stage HFrEF in select circumstances. Hyponatremia develops in heart failure primarily because of the body’s inability to excrete free water due to non-osmotic arginine vasopressin secretion.4 Other processes contribute to hyponatremia, including increased free water intake due to angiotensin II stimulating thirst and decreased glomerular filtration rate limiting the kidney’s ability to excrete free water. Since hyponatremia in heart failure primarily occurs due to derangements of free water regulation, limiting free water intake may help; the American College of Cardiology/American Heart Association and European heart failure guidelines explicitly recommend this strategy for patients with stage D heart failure.3,4 However, no available randomized data support this practice, and observational data suggest that fluid restriction has limited impact on hyponatremia in ADHF.14 Guidelines also suggest employing fluid restriction in patients with diuretic resistance as an adjunctive therapy.
Twenty-nine percent of patients with ADHF have comorbid chronic kidney disease (CKD).15 Providers often prescribe patients with advanced CKD salt- and fluid-restrictive diets due to more limited abilities in sodium and free water excretion. However, no studies have examined the effects of fluid restriction alone without salt restriction in the CKD/ADHF population.
WHAT YOU SHOULD DO INSTEAD
In the present day of evidence-based pharmacologic therapies, research indicates that fluid-restriction does not help and potentially may harm. Instead, treat hospitalized HFrEF patients with ADHF with modern, evidence-based pharmacologic therapies and allow the patients to drink when thirsty.
RECOMMENDATIONS
- Treat patients with ADHF and reduced ejection fraction with evidence-based neurohormonal blockade and initiate loop diuretics to alleviate congestion.
- Allow patients with ADHF and reduced ejection fraction to drink when thirsty in the absence of hyponatremia.
- Consider initiating fluid restriction in patients with ADHF and concurrent hyponatremia and/or diuretic resistance. There is little evidence to guide setting specific limits on fluid intake.
CONCLUSION
The hospitalist starts the patient admitted for ADHF on an intravenous loop diuretic, continues her home beta blocker and angiotensin-converting enzyme inhibitor, and does not impose any fluid restriction. Her symptoms of congestion resolve, and she is discharged.
Hospitalists often treat patients with ADHF and reduced ejection fraction with fluid restriction. However, limited evidence supports this practice as part of the management of ADHF. Fluid restriction may have unintended adverse effects of increasing thirst and worsening renal function and quality of life.
What do you do? Do you think this is a low-value practice? Is this truly a “Thing We Do for No Reason”? Let us know what you do in your practice and propose ideas for other “Things We Do for No Reason” topics. Please join in the conversation online at Twitter (#TWDFNR)/Facebook and don’t forget to “Like It” on Facebook or retweet it on Twitter.
1. Mozaffarian D, Benjamin EJ, Go AS, et al; American Heart Association Statistics Committee and Stroke Statistics Subcommittee. Heart disease and stroke statistics—2015 update: a report from the American Heart Association. Circulation. 2015;131(4):e29-322. https://doi.org/10.1161/cir.0000000000000152
2. Arrigo M, Parissis JT, Akiyama E, Mebazaa A. Understanding acute heart failure: pathophysiology and diagnosis. Eur Heart J Suppl. 2016;18(Suppl G):G11-G18. https://doi.org/10.1093/eurheartj/suw044
3. Ponikowski P, Voors AA, Anker SD, et al. 2016 ESC Guidelines for the diagnosis and treatment of acute and chronic heart failure. Eur J Heart Fail. 2016;18(8):891-975. https://doi.org/10.1002/ejhf.592
4. Yancy CW, Jessup M, Bozkurt B, et al; American College of Cardiology Foundation; American Heart Association Task Force on Practice Guidelines. 2013 ACCF/AHA guideline for the management of heart failure. J Am Coll Cardiol. 2013;62(16):e147-e239. https://doi.org/10.1016/j.jacc.2013.05.019
5. Machado d’Almeida KS, Rabelo-Silva ER, Souza GC, et al. Aggressive fluid and sodium restriction in decompensated heart failure with preserved ejection fraction: results from a randomized clinical trial. Nutrition. 2018;54:111-117. https://doi.org/10.1016/j.nut.2018.02.007
6. Paterna S, Gaspare P, Fasullo S, Sarullo FM, Di Pasquale P. Normal-sodium diet compared with low-sodium diet in compensated congestive heart failure: is sodium an old enemy or a new friend? Clin Sci (Lond). 2008;114(3):221-230. https://doi.org/10.1042/cs20070193
7. Paterna S, Parrinello G, Cannizzaro S, et al. Medium term effects of different dosage of diuretic, sodium, and fluid administration on neurohormonal and clinical outcome in patients with recently compensated heart failure. Am J Cardiol. 2009;103(1):93-102. https://doi.org/10.1016/j.amjcard.2008.08.043
8. Shore AC, Markandu ND, Sagnella GA, et al. Endocrine and renal response to water loading and water restriction in normal man. Clin Sci (Lond). 1988;75(2):171-177. https://doi.org/10.1042/cs0750171
9. Oliveros E, Oni ET, Shahzad A, et al. Benefits and risks of continuing angiotensin-converting enzyme inhibitors, angiotensin II receptor antagonists, and mineralocorticoid receptor antagonists during hospitalizations for acute heart failure. Cardiorenal Med. 2020;10(2):69-84. https://doi.org/10.1159/000504167
10. Mentz RJ, Stevens SR, DeVore AD, et al. Decongestion strategies and renin-angiotensin-aldosterone system activation in acute heart failure. JACC Heart Fail. 2015;3(2):97-107. https://doi.org/10.1016/j.jchf.2014.09.003
11. Travers B, O’Loughlin C, Murphy NF, et al. Fluid restriction in the management of decompensated heart failure: no impact on time to clinical stability. J Card Fail. 2007;13(2):128-132. https://doi.org/10.1016/j.cardfail.2006.10.012
12. Aliti GB, Rabelo ER, Clausell N, Rohde LE, Biolo A, Beck-da-Silva L. Aggressive fluid and sodium restriction in acute decompensated heart failure: a randomized clinical trial. JAMA Intern Med. 2013;173(12):1058-1064. https://doi.org/10.1001/jamainternmed.2013.552
13. Jao GT, Chiong JR. Hyponatremia in acute decompensated heart failure: mechanisms, prognosis, and treatment options. Clin Cardiol. 2010;33(11):666-671. https://doi.org/10.1002/clc.20822
14. Nagler EV, Haller MC, Van Biesen W, Vanholder R, Craig JC, Webster AC. Interventions for chronic non-hypovolaemic hypotonic hyponatraemia. Cochrane Database Syst Rev. 2018;28(6):CD010965. https://doi.org/10.1002/14651858.cd010965.pub2
15. Fonarow GC; ADHERE Scientific Advisory Committee. The Acute Decompensated Heart Failure National Registry (ADHERE): opportunities to improve care of patients hospitalized with acute decompensated heart failure. Rev Cardiovasc Med. 2003;4(Suppl 7):S21-S30.
Inspired by the ABIM Foundation’s Choosing Wisely® campaign, the “Things We Do for No Reason™” (TWDFNR) series reviews practices that have become common parts of hospital care but may provide little value to our patients. Practices reviewed in the TWDFNR series do not represent clear-cut conclusions or clinical practice standards but are meant as a starting place for research and active discussions among hospitalists and patients. We invite you to be part of that discussion.
CLINICAL SCENARIO
The hospitalist enters admission orders for an 80-year-old woman with hypertension, coronary artery disease, and heart failure with reduced ejection fraction who presented to the emergency department with weight gain, lower extremity edema, and dyspnea on exertion. She has an elevated jugular venous pressure, crackles on pulmonary exam, and bilateral pitting edema with warm extremities. Labs show a sodium of 140 mmol/L and creatinine of 1.4 mg/dL. After ordering intravenous furosemide for management of acute decompensated heart failure (ADHF), the hospitalist arrives at the nutrition section of the CHF Admission Order Set and reflexively picks an option for a fluid-restricted diet.
BACKGROUND
Patients with ADHF, the leading cause of hospitalization for patients older than 65 years,1 may present with signs and symptoms of volume overload: shortness of breath, lower-extremity swelling, and end-organ dysfunction. Before the 1980s, treatment of ADHF relied on loop diuretics, bedrest, and fluid restriction to minimize congestive symptoms.2 Clinicians based this practice on early theories framing heart failure as primarily an issue of salt and water retention that could be counterbalanced by sodium and fluid restriction.2
Today, hospitalists understand heart failure with reduced ejection fraction (HFrEF) as a heterogenous disease with a shared pathophysiology in which reduced cardiac output, elevated systemic venous pressures, and/or shunting of blood away from the kidneys may all lead to decreased renal perfusion. These phenomena trigger the activation of the renin-angiotensin-aldosterone system (RAAS), leading to sodium and water retention and fluid redistribution.2 As part of the modern day treatment regimen, providers continue to place patients on fluid-restricted diets. Guidelines support this practice.3,4
Since most of the existing literature on the topic of fluid restriction in ADHF relates to HFrEF (left ventricular ejection fraction [LVEF] <40%), as opposed to heart failure with a preserved ejection fraction (HFpEF, LVEF ≥50%), this review will focus on HFrEF patients. Limited existing data support extrapolating these arguments to HFpEF patients as well.5
WHY YOU MIGHT THINK FLUID RESTRICTION IS IMPORTANT IN THE MANAGEMENT OF ADHF IN HFREF PATIENTS
Longstanding conventional wisdom and data extrapolation from the chronic heart failure population has undergirded the practice of fluid restriction for ADHF. Current iterations of the American and European heart failure guidelines recommend fluid restriction of 1.5 to 2.0 L/day in severe ADHF as a management strategy.3,4 The American guidelines recommend considering restricting fluid intake to 2 L/day for most hospitalized ADHF patients without hyponatremia or diuretic resistance. The guidelines base the recommendation on clinical experience and data from a single randomized trial evaluating the effects of sodium restriction on heart failure outcomes in outpatients recently admitted for ADHF.4,6 This trial randomly assigned 232 patients with compensated HFrEF to either a normal or low-sodium diet plus oral furosemide. Researchers instructed both groups to adhere to a 1000 mL/day fluid restriction. The authors found a high incidence of readmissions for worsening congestive heart failure among a cohort of patients (n = 54) with a normal sodium diet who were excluded from randomization due to inability to adhere to the prescribed fluid restriction.6 Notably, this study did not evaluate patients receiving treatment for ADHF and was not designed to investigate the role of fluid restriction for the treatment of ADHF.
A subsequent study by the same investigators looked more deliberately, although not singularly, at outpatient fluid restriction. This study randomly assigned 410 patients with compensated HFrEF into eight groups by fluid intake (1 L vs 2 L), salt intake (80 mmol vs 120 mmol), and furosemide dose (125 mg twice daily vs 250 mg twice daily). At 180 days, the group receiving the fluid-restricted diet with higher sodium intake and higher diuretic dose had the lowest risk of hospital readmission.7Results from these studies of the chronic, compensated heart failure population, in conjunction with longstanding conventional wisdom, have influenced the management of patients hospitalized with ADHF.
WHY FLUID RESTRICTION IN THE MANAGEMENT OF ADHF IN HFREF PATIENTS MIGHT NOT BE HELPFUL
From a pathophysiologic perspective, fluid restriction in ADHF may counterproductively lead to RAAS activation.8 Congestion develops when arterial underfilling leads to RAAS activation, triggering sodium and water retention.2 Furthermore, RAAS activation, as measured by plasma levels of renin, angiotensin II, and aldosterone, correlates with prognosis and mortality in chronic HFrEF.9 Analyses from one of the largest databases of biomarkers from ADHF suggest that RAAS is further upregulated during decongestive therapy.10 While researchers have not studied the effects of fluid restriction on RAAS activation in ADHF patients, extrapolating from these data one may question whether fluid restriction in ADHF patients may further drive RAAS activation. Further activation may contribute to adverse incident outcomes such as worsening renal function.
The most relevant and compelling evidence against fluid restriction to date comes from Travers et al,11 who conducted the first randomized controlled trial examining fluid restriction in ADHF patients. Their small study compared restricted (1 L fluid restriction) vs liberal (free fluid) intake in hospitalized patients with ADHF and demonstrated no difference in duration or daily dose of intravenous diuretics, time to symptomatic improvement, total daily fluid output, or average hospitalization weight loss between the two arms. Furthermore, researchers withdrew more patients in the fluid-restricted arm due to a sustained rise in serum creatinine, suggesting potential harm of this intervention.11 The sample size (N = 67) and fluid-intake difference of only 400 mL between the two groups limited the study results.
In a subsequent randomized controlled trial, Aliti et al12 examined the clinical outcomes of even more aggressive fluid restriction (800 mL/day) and sodium restriction (800 mg/day) versus liberal intake (at least 2.5 L fluid/day and approximately 3-5 g sodium/day) in hospitalized patients with ADHF (N = 75). While this study evaluated both fluid and sodium restriction, it produced relevant results. The study demonstrated no significant difference in weight loss, use of diuretics, or rehospitalization between the study arms.12 At 30-day follow-up, researchers found that patients in the intervention group had more congestion and an increased likelihood of having a B-type natriuretic peptide (BNP) level greater than 700 pg/mL. In the subset of all patients with an elevated BNP level greater than 700 pg/mL at the end of the study, patients in the intervention group had a significantly higher rate of readmission (7 out of 22) compared with controls (1 of 20). Moreover, the fluid-restricted group had 50% higher perceived thirst values compared to the control group.12 The sensation of thirst not only reduces quality of life, but, given that angiotensin II stimulates thirst, it may reflect RAAS activation.13 For these reasons, clinicians should consider this side effect seriously, especially when the literature lacks evidence of the benefits from fluid restriction.
WHEN FLUID RESTRICTION IS HELPFUL IN THE MANAGEMENT OF DECOMPENSATED HEART FAILURE IN HFREF PATIENTS
Fluid-restrict patients who have chronic hyponatremia (Na <135 mmol/L) due to end-stage HFrEF in select circumstances. Hyponatremia develops in heart failure primarily because of the body’s inability to excrete free water due to non-osmotic arginine vasopressin secretion.4 Other processes contribute to hyponatremia, including increased free water intake due to angiotensin II stimulating thirst and decreased glomerular filtration rate limiting the kidney’s ability to excrete free water. Since hyponatremia in heart failure primarily occurs due to derangements of free water regulation, limiting free water intake may help; the American College of Cardiology/American Heart Association and European heart failure guidelines explicitly recommend this strategy for patients with stage D heart failure.3,4 However, no available randomized data support this practice, and observational data suggest that fluid restriction has limited impact on hyponatremia in ADHF.14 Guidelines also suggest employing fluid restriction in patients with diuretic resistance as an adjunctive therapy.
Twenty-nine percent of patients with ADHF have comorbid chronic kidney disease (CKD).15 Providers often prescribe patients with advanced CKD salt- and fluid-restrictive diets due to more limited abilities in sodium and free water excretion. However, no studies have examined the effects of fluid restriction alone without salt restriction in the CKD/ADHF population.
WHAT YOU SHOULD DO INSTEAD
In the present day of evidence-based pharmacologic therapies, research indicates that fluid-restriction does not help and potentially may harm. Instead, treat hospitalized HFrEF patients with ADHF with modern, evidence-based pharmacologic therapies and allow the patients to drink when thirsty.
RECOMMENDATIONS
- Treat patients with ADHF and reduced ejection fraction with evidence-based neurohormonal blockade and initiate loop diuretics to alleviate congestion.
- Allow patients with ADHF and reduced ejection fraction to drink when thirsty in the absence of hyponatremia.
- Consider initiating fluid restriction in patients with ADHF and concurrent hyponatremia and/or diuretic resistance. There is little evidence to guide setting specific limits on fluid intake.
CONCLUSION
The hospitalist starts the patient admitted for ADHF on an intravenous loop diuretic, continues her home beta blocker and angiotensin-converting enzyme inhibitor, and does not impose any fluid restriction. Her symptoms of congestion resolve, and she is discharged.
Hospitalists often treat patients with ADHF and reduced ejection fraction with fluid restriction. However, limited evidence supports this practice as part of the management of ADHF. Fluid restriction may have unintended adverse effects of increasing thirst and worsening renal function and quality of life.
What do you do? Do you think this is a low-value practice? Is this truly a “Thing We Do for No Reason”? Let us know what you do in your practice and propose ideas for other “Things We Do for No Reason” topics. Please join in the conversation online at Twitter (#TWDFNR)/Facebook and don’t forget to “Like It” on Facebook or retweet it on Twitter.
1. Mozaffarian D, Benjamin EJ, Go AS, et al; American Heart Association Statistics Committee and Stroke Statistics Subcommittee. Heart disease and stroke statistics—2015 update: a report from the American Heart Association. Circulation. 2015;131(4):e29-322. https://doi.org/10.1161/cir.0000000000000152
2. Arrigo M, Parissis JT, Akiyama E, Mebazaa A. Understanding acute heart failure: pathophysiology and diagnosis. Eur Heart J Suppl. 2016;18(Suppl G):G11-G18. https://doi.org/10.1093/eurheartj/suw044
3. Ponikowski P, Voors AA, Anker SD, et al. 2016 ESC Guidelines for the diagnosis and treatment of acute and chronic heart failure. Eur J Heart Fail. 2016;18(8):891-975. https://doi.org/10.1002/ejhf.592
4. Yancy CW, Jessup M, Bozkurt B, et al; American College of Cardiology Foundation; American Heart Association Task Force on Practice Guidelines. 2013 ACCF/AHA guideline for the management of heart failure. J Am Coll Cardiol. 2013;62(16):e147-e239. https://doi.org/10.1016/j.jacc.2013.05.019
5. Machado d’Almeida KS, Rabelo-Silva ER, Souza GC, et al. Aggressive fluid and sodium restriction in decompensated heart failure with preserved ejection fraction: results from a randomized clinical trial. Nutrition. 2018;54:111-117. https://doi.org/10.1016/j.nut.2018.02.007
6. Paterna S, Gaspare P, Fasullo S, Sarullo FM, Di Pasquale P. Normal-sodium diet compared with low-sodium diet in compensated congestive heart failure: is sodium an old enemy or a new friend? Clin Sci (Lond). 2008;114(3):221-230. https://doi.org/10.1042/cs20070193
7. Paterna S, Parrinello G, Cannizzaro S, et al. Medium term effects of different dosage of diuretic, sodium, and fluid administration on neurohormonal and clinical outcome in patients with recently compensated heart failure. Am J Cardiol. 2009;103(1):93-102. https://doi.org/10.1016/j.amjcard.2008.08.043
8. Shore AC, Markandu ND, Sagnella GA, et al. Endocrine and renal response to water loading and water restriction in normal man. Clin Sci (Lond). 1988;75(2):171-177. https://doi.org/10.1042/cs0750171
9. Oliveros E, Oni ET, Shahzad A, et al. Benefits and risks of continuing angiotensin-converting enzyme inhibitors, angiotensin II receptor antagonists, and mineralocorticoid receptor antagonists during hospitalizations for acute heart failure. Cardiorenal Med. 2020;10(2):69-84. https://doi.org/10.1159/000504167
10. Mentz RJ, Stevens SR, DeVore AD, et al. Decongestion strategies and renin-angiotensin-aldosterone system activation in acute heart failure. JACC Heart Fail. 2015;3(2):97-107. https://doi.org/10.1016/j.jchf.2014.09.003
11. Travers B, O’Loughlin C, Murphy NF, et al. Fluid restriction in the management of decompensated heart failure: no impact on time to clinical stability. J Card Fail. 2007;13(2):128-132. https://doi.org/10.1016/j.cardfail.2006.10.012
12. Aliti GB, Rabelo ER, Clausell N, Rohde LE, Biolo A, Beck-da-Silva L. Aggressive fluid and sodium restriction in acute decompensated heart failure: a randomized clinical trial. JAMA Intern Med. 2013;173(12):1058-1064. https://doi.org/10.1001/jamainternmed.2013.552
13. Jao GT, Chiong JR. Hyponatremia in acute decompensated heart failure: mechanisms, prognosis, and treatment options. Clin Cardiol. 2010;33(11):666-671. https://doi.org/10.1002/clc.20822
14. Nagler EV, Haller MC, Van Biesen W, Vanholder R, Craig JC, Webster AC. Interventions for chronic non-hypovolaemic hypotonic hyponatraemia. Cochrane Database Syst Rev. 2018;28(6):CD010965. https://doi.org/10.1002/14651858.cd010965.pub2
15. Fonarow GC; ADHERE Scientific Advisory Committee. The Acute Decompensated Heart Failure National Registry (ADHERE): opportunities to improve care of patients hospitalized with acute decompensated heart failure. Rev Cardiovasc Med. 2003;4(Suppl 7):S21-S30.
© 2021 Society of Hospital Medicine
Improving Healthcare Value: Managing Length of Stay and Improving the Hospital Medicine Value Proposition
Healthcare payment model reform has increased pressure on healthcare systems and hospitalists to improve efficiency and reduce the cost of care. These pressures on the healthcare system have been exacerbated by a global pandemic and an aging patient population straining hospital capacity and resources. Hospital capacity constraints may contribute to hospital crowding and can compromise patient outcomes.1 Increasing hospital capacity also contributes to an increase in hospitalist census. This increase in census is accompanied by proportional increases in hospitalist burnout, cost of care, and prolonged length of stay (LOS).2 Managing LOS reduces “waste” (or non–value-added inpatient days) and can improve outcomes and efficiency within the hospital system.
The benefits for LOS reduction when patients are managed by hospitalists compared with primary care practitioners are well described and are associated with decreases in average LOS and cost.3-5 The shorter LOS with hospitalist care is most pronounced in older patients with more complex disease processes, which has temporal importance. The Department of Health and Human Services expects the number of American adults aged >65 years to approach 72 million (20% of the US population) by 2030. Hospitalists are positioned to drive evidence-based care pathways and improve the quality of patient care in this growing patient population. We examine the reasons for managing LOS, summarize factors that contribute to an increased LOS (“waste”), and propose a list of evidence-based value drivers for LOS reduction (Table).2,6-17 Our experience utilizing this approach within Cleveland Clinic Florida following implementation of many of these evidence-based strategies to reduce non–value-added hospital days is also described in the Appendix Figure.

WHY MANAGE LOS?
Barriers to sustainable LOS-reduction strategies have evolved, in part, since the introduction of the Medicare Prospective Payment System, which moved hospital Medicare payments to a predetermined fixed rate for each diagnosis-related group. This led to financial pressures on healthcare systems to identify methods to reduce cost and, in turn, contributed to an increase in postacute facility utilization, with alternative payment models developing in parallel.18,19 These changes along with disaggregated payments between hospitals and postacute facilities have created a formidable challenge to LOS and cost-reduction plans.19
The usual “why” for reducing LOS includes improving constraints on hospital capacity, strains on resources, and deleterious outcomes. In our experience, an evidence-based approach to LOS management should focus on: (1) reduction in patient hospital days through decreased care variation; (2) stabilizing hospitalist workloads; (3) minimizing the fragmentation inherent to the hospitalist care delivery model; and (4) developing service lines to manage patients hospitalized in an observation status and for those patients undergoing procedures deemed medically complex. The literature is mixed on the impact of LOS reductions on other clinical end points, such as readmissions or mortality, with the preponderance indicating no deleterious impact.20-22 Managing LOS using an evidence-based approach that addresses the variability of individual patients is essential to the LOS strategies employed. These strategies should focus on process improvements to drive LOS reduction and utilize metrics under the individual hospitalist control to support their contribution to the hospitalist groups’ overall LOS.23
IMPROVING HOSPITALIST VALUE AROUND LOS MANAGEMENT
Intrinsic factors such as hospitalist staffing fragmentation, high rounding census, failing to prioritize patients ready to be discharged, variability in practice, number of consultants per patient, and hospitalist behaviors contribute to increased LOS.2,6,8 A first precept to management of LOS at the group level is to recognize all hospitalist services are not created equal, and “lumping” hospitalists into a single efficiency metric would not yield actionable information.
The literature is rife with examples of the significant variation in practice styles among hospitalists. A large study including more than 1000 hospitalists identified practice variation as the strongest predictor of variations in mean LOS.7 While Goodwin et al7 identified significant variation among hospitalists’ LOS and the discharge destination of patients, much of the variation could be attributable to the hospitals where they practice. These findings ostensibly highlight the importance of LOS strategies being developed collaboratively among hospitalist groups and the healthcare systems they serve. Similar variation exists among hospitalists on teaching services versus nonteaching services. Our experience parallels that of other studies with regard to teaching services that have found that hospitalists on teaching services often have additional responsibilities and are less able to gain the efficiency of nonresident hospitalists services.3 The impact of teaching services on hospitalist efficiencies is an important component when setting expectations at the hospitalist group level for providers on academic services.
Workload and staffing models for hospitalists have a significant impact on hospitalist efficiency and LOS management. As workload increased, Elliot and colleagues2 identified a proportional increase in LOS. For occupancies of 75% to 85%, LOS increased exponentially above a daily relative value unit of approximately 25 and a census value of approximately 15. The magnitude of this difference in LOS and cost across the range of hospitalist workloads was $262, with an average increase in LOS of 2 days for every unit increase in census. Higher workloads contributed to inferior discussion of treatment options with patients; delays in discharges; delays in placing discharge orders; and unnecessary testing, procedures, and consults.14 To mitigate inefficiency and adverse impacts of higher workloads, hospitalist groups should develop mechanisms to absorb surges in census and unanticipated changes to staffing maintaining the workload within a range appropriate to the patient population.
Decreasing fragmentation, when multiple hospitalists care for the patient during hospitalization, is a necessary component of any LOS-reduction strategy. Studies of pneumonia and heart failure have demonstrated that a 10% increase in hosptialist fragmentation is associated with significant increases in LOS.24 Schedules with hospitalists on 7-day rotating rounding blocks have the intuitive advantage of improving care continuity for patients compared with schedules with a shorter number of consecutive rounding days, resulting in fewer hospitalists caring for each patient and decreased “fragmentation.” Additional value drivers for LOS reduction strategies for hospitalists are listed in the Table.
The 2018 State of Hospital Medicine Report highlighted that, among patients discharged by hospitalist groups, 80.8% were inpatient and 19.2% were outpatient. With nearly one in five patients discharged in observation status, it behooves hospitalist programs to work to effectively manage these patients. Indeed, hospitalist-run observation units have been shown to decrease LOS significantly without an increase in return rates to the emergency department or hospital compared with patients managed prior to the introduction of a dedicated observation unit.9
Although an in-depth discussion is beyond the scope of the present article, it is worth noting the value of hospitalist comanagement (HCoM) strategies. The impact of HCoM teams is demonstrated by reductions in LOS and cost of care resulting from decreases in medical complications, number of consultants per patient, and a decrease in 30-day readmsissions.12 The Society of Hospital Medicine Perioperative Care Work Group has outlined a collaborative framework for hospitalists and healthcare systems to draw from.15
THE CLEVELAND CLINIC INDIAN RIVER HOSPITAL EXPERIENCE
Within the Cleveland Clinic Indian River Hospital (CCIRH) medicine department, many of the aforementioned strategies and tactics were standardized among hospitalist providers. Hospitalists at CCIRH are scheduled on 7-day rotating blocks to reduce fragmentation. In 2019, we targeted a range of 15 to 18 patient contacts per rounding hospitalist per day and utilized a back-up call system to stabilize the hospitalist census. The hospitalist service lines are enhanced through HCoM services with patients cohorted on dedicated HCoM teams. The follow-up to discharge ratio is used to provide feedback at the provider level as both a management and assessment tool.23 The rounding and admitting teams are dedicated to their responsibility (with the occasional exception necessitating the rounding team assist with admissions when the volumes are high). Direct admissions and transfers from outside hospitals are managed by a dedicated hospital medicine “quarterback” to minimize disruption of the admitting and rounding teams. Barriers to discharge are identified at the time of admission by care management and aggressively managed. Prolonged LOS reports are generated daily and disseminated to care managers and physician leadership. In January 2019, the average LOS for inpatients at CCIRH was 4.4 days. In December 2019, the average LOS for the calendar year to-date at CCIRH was 3.9 days (Appendix Figure).
The value proposition for managing LOS should be viewed in the context of the total cost of care over an extended period of time and not viewed in isolation. Readmission rates serve as a counterbalance to LOS-reduction strategies and contribute to higher costs of care when increased. The 30-day readmission rate for this cohort over this same time period was down slightly compared with the previous year to 12.1%. In addition, observation patients at CCIRH are managed in a closed, geographically cohorted unit, staffed by dedicated advanced-practice providers and physicians dedicated to observation medicine. Over this same time period, more than 5500 patients were managed in the observation unit. These patients had an average LOS of 19.2 hours, with approximately four out of every five patients being discharged to home from an observation status.
The impact of COVID-19 and higher hospital volumes are best visualized in the Appendix Figure. Increases in LOS were observed during periods of COVID-19–related “surges” in hospital volume. These reversals in LOS trends during periods of high occupancy echo earlier findings by Elliot et al2 showing that external factors that are not directly under the control of the hospitalist drive LOS and must be considered when developing LOS reduction strategies.
CONCLUSION
The shift toward value-based payment models provides a strong tailwind for healthcare systems to manage LOS. Hospitalists are well positioned to drive LOS-reduction strategies for the healthcare systems they serve and provide value by driving both quality and efficiency. A complete realization of the value proposition of hospitalist programs in driving LOS-reduction initiatives requires the healthcare systems they serve to provide these teams with the appropriate resources and tools.
1. Eriksson CO, Stoner RC, Eden KB, Newgard CD, Guise J-M. The association between hospital capacity strain and inpatient outcomes in highly developed countries: a systematic review. J Gen Intern Med. 2017;32(6):686-696. https://doi.org/10.1007/s11606-016-3936-3
2. Elliott DJ, Young RS, Brice J, Aguiar R, Kolm P. Effect of hospitalist workload on the quality and efficiency of care. JAMA Intern Med. 2014;174(5):786-793. https://doi.org/10.1001/jamainternmed.2014.300
3. Rachoin JS, Skaf J, Cerceo E, et al. The impact of hospitalists on length of stay and costs: systematic review and meta-analysis. Am J Manag Care. 2012;18(1):e23-30.
4. Kuo YF, Goodwin JS. Effect of hospitalists on length of stay in the medicare population: variation according to hospital and patient characteristics. J Am Geriatr Soc. 2010;58(9):1649-1657. https://doi.org/10.1111/j.1532-5415.2010.03007.x
5. Lindenauer PK, Rothberg MB, Pekow PS, Kenwood C, Benjamin EM, Auerbach AD. Outcomes of care by hospitalists, general internists, and family physicians. N Engl J Med. 2007;357(25):2589-2600. https://doi.org/10.1056/NEJMsa067735
6. Epstein K, Juarez E, Epstein A, Loya K, Singer A. The impact of fragmentation of hospitalist care on length of stay. J Hosp Med. 2010;5(6):335-338. https://doi.org/10.1002/jhm.675
7. Goodwin JS, Lin Y-L, Singh S, Kuo Y-F. Variation in length of stay and outcomes among hospitalized patients attributable to hospitals and hospitalists. J Gen Intern Med. 2013;28(3):370-376. https://doi.org/10.1007/s11606-012-2255-6
8. Johnson T, McNutt R, Odwazny R, Patel D, Baker S. Discrepancy between admission and discharge diagnoses as a predictor of hospital length of stay. J Hosp Med. 2009;4(4):234-239. https://doi.org/10.1002/jhm.453
9. Aplin KS, Coutinho McAllister S, Kupersmith E, Rachoin JS. Caring for patients in a hospitalist-run clinical decision unit is associated with decreased length of stay without increasing revisit rates. J Hosp Med. 2014;9(6):391-395. https://doi.org/10.1002/jhm.2188
10. Selker HP, Beshansky JR, Pauker SG, Kassirer JP. The epidemiology of delays in a teaching hospital. The development and use of a tool that detects unnecessary hospital days. Med Care. 1989;27(2):112-129. https://doi.org/10.1097/00005650-198902000-00003
11. Carey MR, Sheth H, Braithwaite RS. A prospective study of reasons for prolonged hospitalizations on a general medicine teaching service. J Gen Intern Med. 2005;20(2):108-115. https://doi.org/10.1111/j.1525-1497.2005.40269.x
12. Rohatgi N, Loftus P, Grujic O, Cullen M, Hopkins J, Ahuja N. Surgical comanagement by hospitalists improves patient outcomes: a propensity score analysis. Ann Surg. 2016;264(2):275-282. https://doi.org/10.1097/SLA.0000000000001629
13. Chen LM, Freitag MH, Franco M, Sullivan CD, Dickson C, Brancati FL. Natural history of late discharges from a general medical ward. J Hosp Med. 2009;4(4):226-233. https://doi.org/10.1002/jhm.413
14. Zoucha J, Hull M, Keniston A, et al. Barriers to early hospital discharge: a cross-sectional study at five academic hospitals. J Hosp Med. 2018;13(12):816-822. https://doi.org/10.12788/jhm.3074
15. Thompson RE, Pfeifer K, Grant PJ, et al. Hospital medicine and perioperative care: a framework for high-quality, high-value collaborative care. J Hosp Med. 2017;12(4):277-282. https://doi.org/10.12788/jhm.2717
16. Fail RE, Meier DE. Improving quality of care for seriously ill patients: opportunities for hospitalists. J Hosp Med. 2018;13(3):194-197. https://doi.org/10.12788/jhm.2896
17. Hoyer EH, Friedman M, Lavezza A, et al. Promoting mobility and reducing length of stay in hospitalized general medicine patients: a quality-improvement project. J Hosp Med. 2016;11(5):341-347. https://doi.org/10.1002/jhm.2546
18. Davis C, Rhodes DJ. The impact of DRGs on the cost and quality of health care in the United States. Health Policy. 1988;9(2):117-131. https://doi.org/10.1016/0168-8510(88)90029-2
19. Rothberg M, Lee N. Reducing readmissions or length of stay-Which is more important? J Hosp Med. 2017;12(8):685-686. https://doi.org/10.12788/jhm.2790
20. Kaboli PJ, Go JT, Hockenberry J, et al. Associations between reduced hospital length of stay and 30-day readmission rate and mortality: 14-year experience in 129 Veterans Affairs hospitals. Ann Intern Med. 2012;157(12):837-845. https://doi.org/10.7326/0003-4819-157-12-201212180-00003
21. Rinne ST, Graves MC, Bastian LA, et al. Association between length of stay and readmission for COPD. Am J Manag Care. 2017;23(8):e253-e258.
22. Sud M, Yu B, Wijeysundera HC, et al. Associations between short or long length of stay and 30-day readmission and mortality in hospitalized patients with heart failure. JACC Heart Fail. 2017;5(8):578-588. https://doi.org/10.1016/j.jchf.2017.03.012
23. Rothman RD, Whinney CM, Pappas MA, Zoller DM, Rosencrance JG, Peter DJ. The relationship between the follow-up to discharge ratio and length of stay. Am J Manag Care. 2020;26(9):396-399. https://doi.org/10.37765/ajmc.2020.88490
24. Epstein K, Juarez E, Epstein A, Loya K, Singer A. The impact of fragmentation of hospitalist care on length of stay. J Hosp Med. 2010;5(6):335-338. https://doi.org/10.1002/jhm.675
Healthcare payment model reform has increased pressure on healthcare systems and hospitalists to improve efficiency and reduce the cost of care. These pressures on the healthcare system have been exacerbated by a global pandemic and an aging patient population straining hospital capacity and resources. Hospital capacity constraints may contribute to hospital crowding and can compromise patient outcomes.1 Increasing hospital capacity also contributes to an increase in hospitalist census. This increase in census is accompanied by proportional increases in hospitalist burnout, cost of care, and prolonged length of stay (LOS).2 Managing LOS reduces “waste” (or non–value-added inpatient days) and can improve outcomes and efficiency within the hospital system.
The benefits for LOS reduction when patients are managed by hospitalists compared with primary care practitioners are well described and are associated with decreases in average LOS and cost.3-5 The shorter LOS with hospitalist care is most pronounced in older patients with more complex disease processes, which has temporal importance. The Department of Health and Human Services expects the number of American adults aged >65 years to approach 72 million (20% of the US population) by 2030. Hospitalists are positioned to drive evidence-based care pathways and improve the quality of patient care in this growing patient population. We examine the reasons for managing LOS, summarize factors that contribute to an increased LOS (“waste”), and propose a list of evidence-based value drivers for LOS reduction (Table).2,6-17 Our experience utilizing this approach within Cleveland Clinic Florida following implementation of many of these evidence-based strategies to reduce non–value-added hospital days is also described in the Appendix Figure.
WHY MANAGE LOS?
Barriers to sustainable LOS-reduction strategies have evolved, in part, since the introduction of the Medicare Prospective Payment System, which moved hospital Medicare payments to a predetermined fixed rate for each diagnosis-related group. This led to financial pressures on healthcare systems to identify methods to reduce cost and, in turn, contributed to an increase in postacute facility utilization, with alternative payment models developing in parallel.18,19 These changes along with disaggregated payments between hospitals and postacute facilities have created a formidable challenge to LOS and cost-reduction plans.19
The usual “why” for reducing LOS includes improving constraints on hospital capacity, strains on resources, and deleterious outcomes. In our experience, an evidence-based approach to LOS management should focus on: (1) reduction in patient hospital days through decreased care variation; (2) stabilizing hospitalist workloads; (3) minimizing the fragmentation inherent to the hospitalist care delivery model; and (4) developing service lines to manage patients hospitalized in an observation status and for those patients undergoing procedures deemed medically complex. The literature is mixed on the impact of LOS reductions on other clinical end points, such as readmissions or mortality, with the preponderance indicating no deleterious impact.20-22 Managing LOS using an evidence-based approach that addresses the variability of individual patients is essential to the LOS strategies employed. These strategies should focus on process improvements to drive LOS reduction and utilize metrics under the individual hospitalist control to support their contribution to the hospitalist groups’ overall LOS.23
IMPROVING HOSPITALIST VALUE AROUND LOS MANAGEMENT
Intrinsic factors such as hospitalist staffing fragmentation, high rounding census, failing to prioritize patients ready to be discharged, variability in practice, number of consultants per patient, and hospitalist behaviors contribute to increased LOS.2,6,8 A first precept to management of LOS at the group level is to recognize all hospitalist services are not created equal, and “lumping” hospitalists into a single efficiency metric would not yield actionable information.
The literature is rife with examples of the significant variation in practice styles among hospitalists. A large study including more than 1000 hospitalists identified practice variation as the strongest predictor of variations in mean LOS.7 While Goodwin et al7 identified significant variation among hospitalists’ LOS and the discharge destination of patients, much of the variation could be attributable to the hospitals where they practice. These findings ostensibly highlight the importance of LOS strategies being developed collaboratively among hospitalist groups and the healthcare systems they serve. Similar variation exists among hospitalists on teaching services versus nonteaching services. Our experience parallels that of other studies with regard to teaching services that have found that hospitalists on teaching services often have additional responsibilities and are less able to gain the efficiency of nonresident hospitalists services.3 The impact of teaching services on hospitalist efficiencies is an important component when setting expectations at the hospitalist group level for providers on academic services.
Workload and staffing models for hospitalists have a significant impact on hospitalist efficiency and LOS management. As workload increased, Elliot and colleagues2 identified a proportional increase in LOS. For occupancies of 75% to 85%, LOS increased exponentially above a daily relative value unit of approximately 25 and a census value of approximately 15. The magnitude of this difference in LOS and cost across the range of hospitalist workloads was $262, with an average increase in LOS of 2 days for every unit increase in census. Higher workloads contributed to inferior discussion of treatment options with patients; delays in discharges; delays in placing discharge orders; and unnecessary testing, procedures, and consults.14 To mitigate inefficiency and adverse impacts of higher workloads, hospitalist groups should develop mechanisms to absorb surges in census and unanticipated changes to staffing maintaining the workload within a range appropriate to the patient population.
Decreasing fragmentation, when multiple hospitalists care for the patient during hospitalization, is a necessary component of any LOS-reduction strategy. Studies of pneumonia and heart failure have demonstrated that a 10% increase in hosptialist fragmentation is associated with significant increases in LOS.24 Schedules with hospitalists on 7-day rotating rounding blocks have the intuitive advantage of improving care continuity for patients compared with schedules with a shorter number of consecutive rounding days, resulting in fewer hospitalists caring for each patient and decreased “fragmentation.” Additional value drivers for LOS reduction strategies for hospitalists are listed in the Table.
The 2018 State of Hospital Medicine Report highlighted that, among patients discharged by hospitalist groups, 80.8% were inpatient and 19.2% were outpatient. With nearly one in five patients discharged in observation status, it behooves hospitalist programs to work to effectively manage these patients. Indeed, hospitalist-run observation units have been shown to decrease LOS significantly without an increase in return rates to the emergency department or hospital compared with patients managed prior to the introduction of a dedicated observation unit.9
Although an in-depth discussion is beyond the scope of the present article, it is worth noting the value of hospitalist comanagement (HCoM) strategies. The impact of HCoM teams is demonstrated by reductions in LOS and cost of care resulting from decreases in medical complications, number of consultants per patient, and a decrease in 30-day readmsissions.12 The Society of Hospital Medicine Perioperative Care Work Group has outlined a collaborative framework for hospitalists and healthcare systems to draw from.15
THE CLEVELAND CLINIC INDIAN RIVER HOSPITAL EXPERIENCE
Within the Cleveland Clinic Indian River Hospital (CCIRH) medicine department, many of the aforementioned strategies and tactics were standardized among hospitalist providers. Hospitalists at CCIRH are scheduled on 7-day rotating blocks to reduce fragmentation. In 2019, we targeted a range of 15 to 18 patient contacts per rounding hospitalist per day and utilized a back-up call system to stabilize the hospitalist census. The hospitalist service lines are enhanced through HCoM services with patients cohorted on dedicated HCoM teams. The follow-up to discharge ratio is used to provide feedback at the provider level as both a management and assessment tool.23 The rounding and admitting teams are dedicated to their responsibility (with the occasional exception necessitating the rounding team assist with admissions when the volumes are high). Direct admissions and transfers from outside hospitals are managed by a dedicated hospital medicine “quarterback” to minimize disruption of the admitting and rounding teams. Barriers to discharge are identified at the time of admission by care management and aggressively managed. Prolonged LOS reports are generated daily and disseminated to care managers and physician leadership. In January 2019, the average LOS for inpatients at CCIRH was 4.4 days. In December 2019, the average LOS for the calendar year to-date at CCIRH was 3.9 days (Appendix Figure).
The value proposition for managing LOS should be viewed in the context of the total cost of care over an extended period of time and not viewed in isolation. Readmission rates serve as a counterbalance to LOS-reduction strategies and contribute to higher costs of care when increased. The 30-day readmission rate for this cohort over this same time period was down slightly compared with the previous year to 12.1%. In addition, observation patients at CCIRH are managed in a closed, geographically cohorted unit, staffed by dedicated advanced-practice providers and physicians dedicated to observation medicine. Over this same time period, more than 5500 patients were managed in the observation unit. These patients had an average LOS of 19.2 hours, with approximately four out of every five patients being discharged to home from an observation status.
The impact of COVID-19 and higher hospital volumes are best visualized in the Appendix Figure. Increases in LOS were observed during periods of COVID-19–related “surges” in hospital volume. These reversals in LOS trends during periods of high occupancy echo earlier findings by Elliot et al2 showing that external factors that are not directly under the control of the hospitalist drive LOS and must be considered when developing LOS reduction strategies.
CONCLUSION
The shift toward value-based payment models provides a strong tailwind for healthcare systems to manage LOS. Hospitalists are well positioned to drive LOS-reduction strategies for the healthcare systems they serve and provide value by driving both quality and efficiency. A complete realization of the value proposition of hospitalist programs in driving LOS-reduction initiatives requires the healthcare systems they serve to provide these teams with the appropriate resources and tools.
1. Eriksson CO, Stoner RC, Eden KB, Newgard CD, Guise J-M. The association between hospital capacity strain and inpatient outcomes in highly developed countries: a systematic review. J Gen Intern Med. 2017;32(6):686-696. https://doi.org/10.1007/s11606-016-3936-3
2. Elliott DJ, Young RS, Brice J, Aguiar R, Kolm P. Effect of hospitalist workload on the quality and efficiency of care. JAMA Intern Med. 2014;174(5):786-793. https://doi.org/10.1001/jamainternmed.2014.300
3. Rachoin JS, Skaf J, Cerceo E, et al. The impact of hospitalists on length of stay and costs: systematic review and meta-analysis. Am J Manag Care. 2012;18(1):e23-30.
4. Kuo YF, Goodwin JS. Effect of hospitalists on length of stay in the medicare population: variation according to hospital and patient characteristics. J Am Geriatr Soc. 2010;58(9):1649-1657. https://doi.org/10.1111/j.1532-5415.2010.03007.x
5. Lindenauer PK, Rothberg MB, Pekow PS, Kenwood C, Benjamin EM, Auerbach AD. Outcomes of care by hospitalists, general internists, and family physicians. N Engl J Med. 2007;357(25):2589-2600. https://doi.org/10.1056/NEJMsa067735
6. Epstein K, Juarez E, Epstein A, Loya K, Singer A. The impact of fragmentation of hospitalist care on length of stay. J Hosp Med. 2010;5(6):335-338. https://doi.org/10.1002/jhm.675
7. Goodwin JS, Lin Y-L, Singh S, Kuo Y-F. Variation in length of stay and outcomes among hospitalized patients attributable to hospitals and hospitalists. J Gen Intern Med. 2013;28(3):370-376. https://doi.org/10.1007/s11606-012-2255-6
8. Johnson T, McNutt R, Odwazny R, Patel D, Baker S. Discrepancy between admission and discharge diagnoses as a predictor of hospital length of stay. J Hosp Med. 2009;4(4):234-239. https://doi.org/10.1002/jhm.453
9. Aplin KS, Coutinho McAllister S, Kupersmith E, Rachoin JS. Caring for patients in a hospitalist-run clinical decision unit is associated with decreased length of stay without increasing revisit rates. J Hosp Med. 2014;9(6):391-395. https://doi.org/10.1002/jhm.2188
10. Selker HP, Beshansky JR, Pauker SG, Kassirer JP. The epidemiology of delays in a teaching hospital. The development and use of a tool that detects unnecessary hospital days. Med Care. 1989;27(2):112-129. https://doi.org/10.1097/00005650-198902000-00003
11. Carey MR, Sheth H, Braithwaite RS. A prospective study of reasons for prolonged hospitalizations on a general medicine teaching service. J Gen Intern Med. 2005;20(2):108-115. https://doi.org/10.1111/j.1525-1497.2005.40269.x
12. Rohatgi N, Loftus P, Grujic O, Cullen M, Hopkins J, Ahuja N. Surgical comanagement by hospitalists improves patient outcomes: a propensity score analysis. Ann Surg. 2016;264(2):275-282. https://doi.org/10.1097/SLA.0000000000001629
13. Chen LM, Freitag MH, Franco M, Sullivan CD, Dickson C, Brancati FL. Natural history of late discharges from a general medical ward. J Hosp Med. 2009;4(4):226-233. https://doi.org/10.1002/jhm.413
14. Zoucha J, Hull M, Keniston A, et al. Barriers to early hospital discharge: a cross-sectional study at five academic hospitals. J Hosp Med. 2018;13(12):816-822. https://doi.org/10.12788/jhm.3074
15. Thompson RE, Pfeifer K, Grant PJ, et al. Hospital medicine and perioperative care: a framework for high-quality, high-value collaborative care. J Hosp Med. 2017;12(4):277-282. https://doi.org/10.12788/jhm.2717
16. Fail RE, Meier DE. Improving quality of care for seriously ill patients: opportunities for hospitalists. J Hosp Med. 2018;13(3):194-197. https://doi.org/10.12788/jhm.2896
17. Hoyer EH, Friedman M, Lavezza A, et al. Promoting mobility and reducing length of stay in hospitalized general medicine patients: a quality-improvement project. J Hosp Med. 2016;11(5):341-347. https://doi.org/10.1002/jhm.2546
18. Davis C, Rhodes DJ. The impact of DRGs on the cost and quality of health care in the United States. Health Policy. 1988;9(2):117-131. https://doi.org/10.1016/0168-8510(88)90029-2
19. Rothberg M, Lee N. Reducing readmissions or length of stay-Which is more important? J Hosp Med. 2017;12(8):685-686. https://doi.org/10.12788/jhm.2790
20. Kaboli PJ, Go JT, Hockenberry J, et al. Associations between reduced hospital length of stay and 30-day readmission rate and mortality: 14-year experience in 129 Veterans Affairs hospitals. Ann Intern Med. 2012;157(12):837-845. https://doi.org/10.7326/0003-4819-157-12-201212180-00003
21. Rinne ST, Graves MC, Bastian LA, et al. Association between length of stay and readmission for COPD. Am J Manag Care. 2017;23(8):e253-e258.
22. Sud M, Yu B, Wijeysundera HC, et al. Associations between short or long length of stay and 30-day readmission and mortality in hospitalized patients with heart failure. JACC Heart Fail. 2017;5(8):578-588. https://doi.org/10.1016/j.jchf.2017.03.012
23. Rothman RD, Whinney CM, Pappas MA, Zoller DM, Rosencrance JG, Peter DJ. The relationship between the follow-up to discharge ratio and length of stay. Am J Manag Care. 2020;26(9):396-399. https://doi.org/10.37765/ajmc.2020.88490
24. Epstein K, Juarez E, Epstein A, Loya K, Singer A. The impact of fragmentation of hospitalist care on length of stay. J Hosp Med. 2010;5(6):335-338. https://doi.org/10.1002/jhm.675
© 2021 Society of Hospital Medicine
Factors Associated With COVID-19 Disease Severity in US Children and Adolescents
The COVID-19 pandemic has led to more than 40 million infections and more than 650,000 deaths in the United States alone.1 Morbidity and mortality have disproportionately affected older adults.2-4 However, acute infection and delayed effects, such as multisystem inflammatory syndrome in children (MIS-C), occur and can lead to severe complications, hospitalization, and death in pediatric patients.5,6 Due to higher clinical disease prevalence and morbidity in the adult population, we have learned much about the clinical factors associated with severe adult COVID-19 disease.5,7-9 Such clinical factors include older age, concurrent comorbidities, smoke exposure, and Black race or Hispanic ethnicity, among others.5,7-10 However, there is a paucity of data on severe COVID-19 disease in pediatric patients.5,11,12 In addition, most immunization strategies and pharmacologic treatments for COVID-19 have not been evaluated or approved for use in children.13 To guide targeted prevention and treatment strategies, there is a critical need to identify children and adolescents—who are among the most vulnerable patient populations—at high risk for severe disease.
Identifying the clinical factors associated with severe COVID-19 disease will help with prioritizing and allocating vaccines when they are approved for use in patients younger than 12 years.
METHODS
Study Design
We conducted a multicenter retrospective cohort study of patients presenting for care at pediatric hospitals that report data to the Pediatric Health Information System (PHIS) database. The PHIS administrative database includes billing and utilization data from 45 US tertiary care hospitals affiliated with the Children’s Hospital Association (Lenexa, Kansas). Data quality and reliability are ensured through a joint validation effort between the Children’s Hospital Association and participating hospitals. Hospitals submit discharge data, including demographics, diagnoses, and procedures using International Classification of Diseases, 10th Revision (ICD-10) codes, along with daily detailed information on pharmacy, location of care, and other services.
Study Population
Patients 30 days to 18 years of age discharged from the emergency department (ED) or inpatient setting with a primary diagnosis of COVID-19 (ICD-10 codes U.071 and U.072) between April 1, 2020, and September 30, 2020, were eligible for inclusion.14 In a prior study, the positive predictive value of an ICD-10–coded diagnosis of COVID-19 among hospitalized pediatric patients was 95.5%, compared with reverse transcription polymerase reaction results or presence of MIS-C.15 The diagnostic code for COVID-19 (ICD-10-CM) also had a high sensitivity (98.0%) in the hospitalized population.16 Acknowledging the increasing practice of screening patients upon admission, and in an attempt to minimize potential misclassification, we did not include encounters with secondary diagnoses of COVID-19 in our primary analyses. Pediatric patients with surgical diagnoses and neonates who never left the hospital were also excluded.
Factors Associated With Severe COVID-19 Disease
Exposures of interest were determined a priori based on current evidence in the literature and included patient age (0-4 years, 5-11 years, and 12-18 years), sex, race and ethnicity (non-Hispanic White, non-Hispanic Black, Hispanic, Asian, other non-White race [defined as Pacific Islander, Native American, or other]), payor type, cardiovascular complex chronic conditions (CCC), neuromuscular CCC, obesity/type 2 diabetes mellitus (DM), pulmonary CCC, asthma (defined using ICD-10 codes17), and immunocompromised CCC
Pediatric Complications and Conditions Associated With COVID-19
Based on current evidence and expert opinion of study members, associated diagnoses and complications co-occurring with a COVID-19 diagnosis were defined a priori and identified through ICD-10 codes (Appendix Table 1). These included acute kidney injury, acute liver injury, aseptic meningitis, asthma exacerbation, bronchiolitis, cerebral infarction, croup, encephalitis, encephalopathy, infant fever, febrile seizure, gastroenteritis/dehydration, Kawasaki disease/MIS-C, myocarditis/pericarditis, pneumonia, lung effusion or empyema, respiratory failure, sepsis, nonfebrile seizure, pancreatitis, sickle cell complications, and thrombotic complications.
Outcomes
COVID-19 severity outcomes were assessed as follows: (1) mild = ED discharge; (2) moderate = inpatient admission; (3) severe = intensive care unit (ICU) admission without mechanical ventilation, shock, or death; and (4) very severe = ICU admission with mechanical ventilation, shock, or death.19 This ordinal ranking system did not violate the proportional odds assumption. Potential reasons for admission to the ICU without mechanical ventilation, shock, or death include, but are not limited to, need for noninvasive ventilation, vital sign instability, dysrhythmias, respiratory insufficiency, or complications arising from concurrent conditions (eg, thrombotic events, need for continuous albuterol therapy). We examined several secondary, hospital-based outcomes, including associated diagnoses and complications, all-cause 30-day healthcare reutilization (ED visit or rehospitalization), length of stay (LOS), and ICU LOS.
Statistical Analysis
Demographic characteristics were summarized using frequencies and percentages for categorical variables and geometric means with SD and medians with interquartile ranges (IQR) for continuous variables, as appropriate. Factors associated with hospitalization (encompassing severity levels 2-4) vs ED discharge (severity level 1) were assessed using logistic regression. Factors associated with increasing severity among hospitalized pediatric patients (severity levels 2, 3, and 4) were assessed using ordinal logistic regression. Covariates in these analyses included race and ethnicity, age, sex, payor, cardiovascular CCC, neurologic/neuromuscular CCC, obesity/type 2 DM, pulmonary CCC, asthma, and immunocompromised CCC. Adjusted odds ratios (aOR) and corresponding 95% CI for each risk factor were generated using generalized linear mixed effects models and random intercepts for each hospital. Given the potential for diagnostic misclassification of pediatric patients with COVID-19 based on primary vs secondary diagnoses, we performed sensitivity analyses defining the study population as those with a primary diagnosis of COVID-19 and those with a secondary diagnosis of COVID-19 plus a concurrent primary diagnosis of a condition associated with COVID-19 (Appendix Table 1).
All analyses were performed using SAS version 9.4 (SAS Institute, Inc), and P < .05 was considered statistically significant. The Institutional Review Board at Vanderbilt University Medical Center determined that this study of de-identified data did not meet the criteria for human subjects research.
RESULTS
Study Population
A total of 19,976 encounters were included in the study. Of those, 15,913 (79.7%) were discharged from the ED and 4063 (20.3%) were hospitalized (Table 1). The most common race/ethnicity was Hispanic (9741, 48.8%), followed by non-Hispanic White (4217, 21.1%). Reference race/ethnicity data for the overall 2019 PHIS population can be found in Appendix Table 2.

The severity distribution among the hospitalized population was moderate (3222, 79.3%), severe (431, 11.3%), and very severe (380, 9.4%). The frequency of COVID-19 diagnoses increased late in the study period (Figure). Among those hospitalized, the median LOS for the index admission was 2 days (IQR, 1-4), while among those admitted to the ICU, the median LOS was 3 days (IQR, 2-5).

Overall, 10.1% (n = 2020) of the study population had an all-cause repeat encounter (ie, subsequent ED encounter or hospitalization) within 30 days following the index discharge. Repeat encounters were more frequent among patients hospitalized than among those discharged from the ED (Appendix Table 3).
Prevalence of Conditions and Complications Associated With COVID-19
Overall, 3257 (16.3%) patients had one or more co-occurring diagnoses categorized as a COVID-19–associated condition or complication. The most frequent diagnoses included lower respiratory tract disease (pneumonia, lung effusion, or empyema; n = 1415, 7.1%), gastroenteritis/dehydration (n = 1068, 5.3%), respiratory failure (n = 731, 3.7%), febrile infant (n = 413, 2.1%), and nonfebrile seizure (n = 425, 2.1%). Aside from nonfebrile seizure, neurological complications were less frequent and included febrile seizure (n = 155, 0.8%), encephalopathy (n = 63, 0.3%), aseptic meningitis (n = 16, 0.1%), encephalitis (n = 11, 0.1%), and cerebral infarction (n = 6, <0.1%). Kawasaki disease and MIS-C comprised 1.7% (n = 346) of diagnoses. Thrombotic complications occurred in 0.1% (n = 13) of patients. Overall, these conditions and complications associated with COVID-19 were more frequent in hospitalized patients than in those discharged from the ED (P < .001) (Table 2).

Factors Associated With COVID-19 Disease Severity
Compared to pediatric patients with COVID-19 discharged from the ED, factors associated with increased odds of hospitalization included private payor insurance; obesity/type 2 DM; asthma; and cardiovascular, immunocompromised, neurologic/neuromuscular, and pulmonary CCCs (Table 3). Factors associated with decreased risk of hospitalization included Black race or Hispanic ethnicity compared with White race; female sex; and age 5 to 11 years and age 12 to 17 years (vs age 0-4 years). Among children and adolescents hospitalized with COVID-19, factors associated with greater disease severity included Black or other non-White race; age 5 to 11 years; age 12 to 17 years; obesity/type 2 DM; immunocompromised conditions; and cardiovascular, neurologic/neuromuscular, and pulmonary CCCs (Table 3).

Sensitivity Analysis
We performed a sensitivity analysis that expanded the study population to include those with a secondary diagnosis of COVID-19 plus a diagnosis of a COVID-19–associated condition or complication. Analyses using the expanded population (N = 21,247) were similar to the primary analyses (Appendix Table 4 and Appendix Table 5).
DISCUSSION
In this large multicenter study evaluating COVID-19 disease severity in more than 19,000 patients presenting for emergency care at US pediatric hospitals, approximately 20% were hospitalized, and among those hospitalized almost a quarter required ICU care. Clinical risk factors associated with increased risk of hospitalization include private payor status and selected comorbidities (obesity/type 2 DM; asthma; and cardiovascular, pulmonary, immunocompromised, neurologic/neuromuscular CCCs), while those associated with decreased risk of hospitalization include older age, female sex, and Black race or Hispanic ethnicity. Factors associated with severe disease among hospitalized pediatric patients include Black or other non-White race, school age (≥5 years), and certain chronic conditions (cardiovascular disease, obesity/type 2 DM, neurologic or neuromuscular disease). Sixteen percent of patients had a concurrent diagnosis for a condition or complication associated with COVID-19.
While the study population (ie, children and adolescents presenting to the ED) represents a small fraction of children and adolescents in the community with SARS-CoV-2 infection, the results provide important insight into factors of severe COVID-19 in the pediatric population. A report from France suggested ventilatory or hemodynamic support or death were independently associated with older age (≥10 years), elevated C-reactive protein, and hypoxemia.12 An Italian study found that younger age (0-4 years) was associated with less severe disease, while preexisting conditions were more likely in patients with severe disease.11 A single-center case series of 50 patients (aged ≤21 years) hospitalized at a children’s hospital in New York City found respiratory failure (n = 9) was more common in children older than 1 year, patients with elevated inflammatory markers, and patients with obesity.20
Our study confirms several factors for severe COVID-19 found in these studies, including older age,11,12,20 obesity,20 and preexisting conditions.11 Our findings also expand on these reports, including identification of factors associated with hospitalization. Given the rate of 30-day re-encounters among pediatric patients with COVID-19 (10.1%), identifying risk factors for hospitalization may aid ED providers in determining optimal disposition (eg, home, hospital admission, ICU). We also identified specific comorbidities associated with more severe disease in those hospitalized with COVID-19, such as cardiovascular disease, obesity/type 2 DM, and pulmonary, neurologic, or neuromuscular conditions. We also found that asthma increased the risk for hospitalization but not more severe disease among those hospitalized. This latter finding also aligns with recent single-center studies,21,22 whereas a Turkish study of pediatric patients aged 0 to 18 years found no association between asthma and COVID-19 hospitalizations.23We also examined payor type and racial/ethnic factors in our analysis. In 2019, patients who identified as Black or Hispanic comprised 52.3% of all encounters and 40.7% of hospitalizations recorded in the PHIS database. During the same year, encounters for influenza among Black or Hispanic pediatric patients comprised 58.7% of all influenza diagnoses and 47.0% of pediatric influenza hospitalizations (Appendix Table 2). In this study, patients who identified as Black or Hispanic race represented a disproportionately large share of patients presenting to children’s hospitals (68.5%) and of those hospitalized (60.8%). Hispanic ethnicity, in particular, represented a disproportionate share of patients seeking care for COVID-19 compared to the overall PHIS population (47.7% and 27.1%, respectively). After accounting for other factors, we found Black and other non-White race—but not of Hispanic ethnicity—were independently associated with more disease severity among those hospitalized. This contrasts with findings from a recent adult study by Yehia et al,24 who found (after adjusting for other clinical factors) no significant difference in mortality between Black patients and White patients among adults hospitalized due to COVID-19. It also contrasts with a recent large population-based UK study wherein pediatric patients identifying as Asian, but not Black or mixed race or ethnicity, had an increased risk of hospital admission and admission to the ICU compared to children identifying as White. Children identifying as Black or mixed race had longer hospital admissions.25 However, as the authors of the study note, residual confounders and ascertainment bias due to differences in COVID testing may have influenced these findings.
Our findings of differences in hospitalization and disease severity among those hospitalized by race and ethnicity should be interpreted carefully. These may reflect a constellation of factors that are difficult to measure, including differences in healthcare access, inequalities in care (including hospital admission inequalities), and implicit bias—all of which may reflect structural racism. For example, it is possible that children who identify as Black or Hispanic have different access to care compared to children who identify as White, and this may affect disease severity on presentation.2 Alternatively, it is possible that White pediatric patients are more likely to be hospitalized as compared to non-White pediatric patients with similar illness severity. Our finding that pediatric patients who identify as Hispanic or Black had a lower risk of hospitalization should be also interpreted carefully, as this may reflect higher utilization of the ED for SARS-CoV-2 testing, increased use of nonemergency services among those without access to primary care, or systematic differences in provider decision-making among this segment of the population.2 Further study is needed to determine specific drivers for racial and ethnic differences in healthcare utilization in children and adolescents with COVID-19.26
Complications and co-occurring diagnoses in adults with COVID-19 are well documented.27-30 However, there is little information to date on the co-occurring diagnoses and complications associated with COVID-19 in children and adolescents. We found that complications and co-occurring conditions occurred in 16.3% of the study population, with the most frequent conditions including known complications of viral infections such as pneumonia, respiratory failure, and seizures. Acute kidney and liver injury, as well as thrombotic complications, occurred less commonly than in adults.26-29 Interestingly, neurologic complications were also uncommon compared to adult reports8,31 and less frequent than in other viral illnesses in children and adolescents. For example, neurologic complications occur in approximately 7.5% of children and adolescents hospitalized with influenza.32
Limitations of the present study include the retrospective design, as well as incomplete patient-level clinical data in the PHIS database. The PHIS database only includes children’s hospitals, which may limit the generalizability of findings to community hospitals. We also excluded newborns, and our findings may not be generalizable to this population. We only included children and adolescents with a primary diagnosis of COVID-19, which has the potential for misclassification in cases where COVID-19 was a secondary diagnosis. However, results of our sensitivity analysis, which incorporated secondary diagnoses of COVID-19, were consistent with findings from our main analyses. Our study was designed to examine associations between certain prespecified factors and COVID-19 severity among pediatric patients who visited the ED or were admitted to the hospital during the COVID-19 pandemic. Thus, our findings must be interpreted in light of these considerations and may not be generalizable outside the ED or hospital setting. For example, it could be that some segments of the population utilized ED resources for testing, whereas others avoided the ED and other healthcare settings for fear of exposure to SARS-CoV-2. We also relied on diagnosis codes to identify concurrent diagnoses, as well as mechanical ventilation in our very severe outcome cohort, which resulted in this classification for some of these diagnoses. Despite these limitations, our findings represent an important step in understanding the risk factors associated with severe clinical COVID-19 disease in pediatric patients.
Our findings may inform future research and clinical interventions. Future studies on antiviral therapies and immune modulators targeting SARS-CoV-2 infection in children and adolescents should focus on high-risk populations, such as those identified in the study, as these patients are most likely to benefit from therapeutic interventions. Similarly, vaccine-development efforts may benefit from additional evaluation in high-risk populations, some of which may have altered immune responses. Furthermore, with increasing vaccination among adults and changes in recommendations, societal mitigation efforts (eg, masking, physical distancing) will diminish. Continued vigilance and COVID-19–mitigation efforts among high-risk children, for whom vaccines are not yet available, are critical during this transition.
CONCLUSION
Among children with COVID-19 who received care at children’s hospitals and EDs, 20% were hospitalized, and, of those, 21% were admitted to the ICU. Older children and adolescent patients had a lower risk of hospitalization; however, when hospitalized, they had greater illness severity. Those with selected comorbidities (eg, cardiovascular, obesity/type 2 DM, pulmonary and neurologic or neuromuscular disease) had both increased odds of hospitalization and in-hospital illness severity. While there were observed differences in COVID-19 severity by race and ethnicity, additional research is needed to clarify the drivers of such disparities. These factors should be considered when prioritizing mitigation strategies to prevent infection (eg, remote learning, avoidance of group activities, prioritization of COVID-19 vaccine when approved for children aged <12 years).
1. Centers for Disease Control and Prevention. COVID data tracker. Accessed September 9, 2021. https://covid.cdc.gov/covid-data-tracker/#datatracker-home
2. Levy C, Basmaci R, Bensaid P, et al. Changes in reverse transcription polymerase chain reaction-positive severe acute respiratory syndrome coronavirus 2 rates in adults and children according to the epidemic stages. Pediatr Infect Dis J. 2020;39(11):e369-e372. https://doi.org/10.1097/inf.0000000000002861
3. Gudbjartsson DF, Helgason A, Jonsson H, et al. Spread of SARS-CoV-2 in the Icelandic population. N Engl J Med. 2020;382(24):2302-2315. https://doi.org/10.1056/nejmoa2006100
4. Garg S, Kim L, Whitaker M, et al. Hospitalization rates and characteristics of patients hospitalized with laboratory-confirmed coronavirus disease 2019 - COVID-NET, 14 States, March 1-30, 2020. MMWR Morb Mortal Wkly Rep. 2020;69(15):458-464. https://doi.org/10.15585/mmwr.mm6915e3
5. Castagnoli R, Votto M, Licari A, et al. Severe acute respiratory syndrome coronavirus 2 (SARS-CoV-2) infection in children and adolescents: a systematic review. JAMA Pediatr. 2020;174(9):882-889. https://doi.org/10.1001/jamapediatrics.2020.1467
6. Feldstein LR, Rose EB, Horwitz SM, et al; Overcoming COVID-19 Investigators; CDC COVID-19 Response Team. Multisystem inflammatory syndrome in U.S. children and adolescents. N Engl J Med. 2020;383(4):334-346. https://doi.org/10.1056/nejmoa2021680
7. Magro B, Zuccaro V, Novelli L, et al. Predicting in-hospital mortality from coronavirus disease 2019: a simple validated app for clinical use. PLoS One. 2021;16(1):e0245281. https://doi.org/10.1371/journal.pone.0245281
8. Helms J, Kremer S, Merdji H, et al. Neurologic features in severe SARS-CoV-2 infection. N Engl J Med. 2020;382(23):2268-2270. https://doi.org/10.1056/nejmc2008597
9. Severe Covid GWAS Group; Ellinghaus D, Degenhardt F, Bujanda L, et al. Genomewide association study of severe Covid-19 with respiratory failure. N Engl J Med. 2020;383(16):1522-1534.
10. Kabarriti R, Brodin NP, Maron MI, et al. association of race and ethnicity with comorbidities and survival among patients with COVID-19 at an urban medical center in New York. JAMA Netw Open. 2020;3(9):e2019795. https://doi.org/10.1001/jamanetworkopen.2020.19795
11. Bellino S, Punzo O, Rota MC, et al; COVID-19 Working Group. COVID-19 disease severity risk factors for pediatric patients in Italy. Pediatrics. 2020;146(4):e2020009399. https://doi.org/10.1542/peds.2020-009399
12. Ouldali N, Yang DD, Madhi F, et al; investigator group of the PANDOR study. Factors associated with severe SARS-CoV-2 infection. Pediatrics. 2020;147(3):e2020023432. https://doi.org/10.1542/peds.2020-023432
13. Castells MC, Phillips EJ. Maintaining safety with SARS-CoV-2 vaccines. N Engl J Med. 2021;384(7):643-649. https://doi.org/10.1056/nejmra2035343
14. Antoon JW, Williams DJ, Thurm C, et al. The COVID-19 pandemic and changes in healthcare utilization for pediatric respiratory and nonrespiratory illnesses in the United States. J Hosp Med. 2021;16(5):294-297. https://doi.org/10.12788/jhm.3608
15. Blatz AM, David MZ, Otto WR, Luan X, Gerber JS. Validation of International Classification of Disease-10 code for identifying children hospitalized with coronavirus disease-2019. J Pediatric Infect Dis Soc. 2020;10(4):547-548. https://doi.org/10.1093/jpids/piaa140
16. Kadri SS, Gundrum J, Warner S, et al. Uptake and accuracy of the diagnosis code for COVID-19 among US hospitalizations. JAMA. 2020;324(24):2553-2554. https://doi.org/10.1001/jama.2020.20323
17. Kaiser SV, Rodean J, Bekmezian A, et al; Pediatric Research in Inpatient Settings (PRIS) Network. Effectiveness of pediatric asthma pathways for hospitalized children: a multicenter, national analysis. J Pediatr. 2018;197:165-171.e162. https://doi.org/10.1016/j.jpeds.2018.01.084
18. Feudtner C, Feinstein JA, Zhong W, Hall M, Dai D. Pediatric complex chronic conditions classification system version 2: updated for ICD-10 and complex medical technology dependence and transplantation. BMC Pediatr. 2014;14:199. https://doi.org/10.1186/1471-2431-14-199.
19. Williams DJ, Zhu Y, Grijalva CG, et al. Predicting severe pneumonia outcomes in children. Pediatrics. 2016;138(4):e20161019. https://doi.org/10.1542/peds.2016-1019
20. Zachariah P, Johnson CL, Halabi KC, et al. Epidemiology, clinical features, and disease severity in patients with coronavirus disease 2019 (COVID-19) in a children’s hospital in New York City, New York. JAMA Pediatr. 2020;174(10):e202430. https://doi.org/10.1001/jamapediatrics.2020.2430
21. DeBiasi RL, Song X, Delaney M, et al. Severe coronavirus disease-2019 in children and young adults in the Washington, DC, metropolitan region. J Pediatr. 2020;223:199-203.e191. https://doi.org/10.1016/j.jpeds.2020.05.007
22. Lovinsky-Desir S, Deshpande DR, De A, et al. Asthma among hospitalized patients with COVID-19 and related outcomes. J Allergy Clin Immunol. 2020;146(5):1027-1034.e1024. https://doi.org/10.1016/j.jaci.2020.07.026
23. Beken B, Ozturk GK, Aygun FD, Aydogmus C, Akar HH. Asthma and allergic diseases are not risk factors for hospitalization in children with coronavirus disease 2019. Ann Allergy Asthma Immunol. 2021;126(5):569-575. https://doi.org/10.1016/j.anai.2021.01.018
24. Yehia BR, Winegar A, Fogel R, et al. Association of race with mortality among patients hospitalized with coronavirus disease 2019 (COVID-19) at 92 US hospitals. JAMA Netw Open. 2020;3(8):e2018039. https://doi.org/10.1001/jamanetworkopen.2020.18039
25. Saatci D, Ranger TA, Garriga C, et al. Association between race and COVID-19 outcomes among 2.6 million children in England. JAMA Pediatr. 2021;e211685. https://doi.org/10.1001/jamapediatrics.2021.1685
26. Lopez L, 3rd, Hart LH, 3rd, Katz MH. Racial and ethnic health disparities related to COVID-19. JAMA. 2021;325(8):719-720. https://doi.org/10.1001/jama.2020.26443
27. Altunok ES, Alkan M, Kamat S, et al. Clinical characteristics of adult patients hospitalized with laboratory-confirmed COVID-19 pneumonia. J Infect Chemother. 2020. https://doi.org/10.1016/j.jiac.2020.10.020
28. Ali H, Daoud A, Mohamed MM, et al. Survival rate in acute kidney injury superimposed COVID-19 patients: a systematic review and meta-analysis. Ren Fail. 2020;42(1):393-397. https://doi.org/10.1080/0886022x.2020.1756323
29. Anirvan P, Bharali P, Gogoi M, Thuluvath PJ, Singh SP, Satapathy SK. Liver injury in COVID-19: the hepatic aspect of the respiratory syndrome - what we know so far. World J Hepatol. 2020;12(12):1182-1197. https://doi.org/10.4254/wjh.v12.i12.1182
30. Moschonas IC, Tselepis AD. SARS-CoV-2 infection and thrombotic complications: a narrative review. J Thromb Thrombolysis. 2021;52(1):111-123. https://doi.org/10.1007/s11239-020-02374-3
31. Lee MH, Perl DP, Nair G, et al. Microvascular injury in the brains of patients with Covid-19. N Engl J Med. 2020;384(5):481-483. https://doi.org/10.1056/nejmc2033369
32. Antoon JW, Hall M, Herndon A, et al. Prevalence, risk factors, and outcomes of influenza-associated neurological Complications in Children. J Pediatr. 2021;S0022-3476(21)00657-0. https://doi.org/10.1016/j.jpeds.2021.06.075
The COVID-19 pandemic has led to more than 40 million infections and more than 650,000 deaths in the United States alone.1 Morbidity and mortality have disproportionately affected older adults.2-4 However, acute infection and delayed effects, such as multisystem inflammatory syndrome in children (MIS-C), occur and can lead to severe complications, hospitalization, and death in pediatric patients.5,6 Due to higher clinical disease prevalence and morbidity in the adult population, we have learned much about the clinical factors associated with severe adult COVID-19 disease.5,7-9 Such clinical factors include older age, concurrent comorbidities, smoke exposure, and Black race or Hispanic ethnicity, among others.5,7-10 However, there is a paucity of data on severe COVID-19 disease in pediatric patients.5,11,12 In addition, most immunization strategies and pharmacologic treatments for COVID-19 have not been evaluated or approved for use in children.13 To guide targeted prevention and treatment strategies, there is a critical need to identify children and adolescents—who are among the most vulnerable patient populations—at high risk for severe disease.
Identifying the clinical factors associated with severe COVID-19 disease will help with prioritizing and allocating vaccines when they are approved for use in patients younger than 12 years.
METHODS
Study Design
We conducted a multicenter retrospective cohort study of patients presenting for care at pediatric hospitals that report data to the Pediatric Health Information System (PHIS) database. The PHIS administrative database includes billing and utilization data from 45 US tertiary care hospitals affiliated with the Children’s Hospital Association (Lenexa, Kansas). Data quality and reliability are ensured through a joint validation effort between the Children’s Hospital Association and participating hospitals. Hospitals submit discharge data, including demographics, diagnoses, and procedures using International Classification of Diseases, 10th Revision (ICD-10) codes, along with daily detailed information on pharmacy, location of care, and other services.
Study Population
Patients 30 days to 18 years of age discharged from the emergency department (ED) or inpatient setting with a primary diagnosis of COVID-19 (ICD-10 codes U.071 and U.072) between April 1, 2020, and September 30, 2020, were eligible for inclusion.14 In a prior study, the positive predictive value of an ICD-10–coded diagnosis of COVID-19 among hospitalized pediatric patients was 95.5%, compared with reverse transcription polymerase reaction results or presence of MIS-C.15 The diagnostic code for COVID-19 (ICD-10-CM) also had a high sensitivity (98.0%) in the hospitalized population.16 Acknowledging the increasing practice of screening patients upon admission, and in an attempt to minimize potential misclassification, we did not include encounters with secondary diagnoses of COVID-19 in our primary analyses. Pediatric patients with surgical diagnoses and neonates who never left the hospital were also excluded.
Factors Associated With Severe COVID-19 Disease
Exposures of interest were determined a priori based on current evidence in the literature and included patient age (0-4 years, 5-11 years, and 12-18 years), sex, race and ethnicity (non-Hispanic White, non-Hispanic Black, Hispanic, Asian, other non-White race [defined as Pacific Islander, Native American, or other]), payor type, cardiovascular complex chronic conditions (CCC), neuromuscular CCC, obesity/type 2 diabetes mellitus (DM), pulmonary CCC, asthma (defined using ICD-10 codes17), and immunocompromised CCC
Pediatric Complications and Conditions Associated With COVID-19
Based on current evidence and expert opinion of study members, associated diagnoses and complications co-occurring with a COVID-19 diagnosis were defined a priori and identified through ICD-10 codes (Appendix Table 1). These included acute kidney injury, acute liver injury, aseptic meningitis, asthma exacerbation, bronchiolitis, cerebral infarction, croup, encephalitis, encephalopathy, infant fever, febrile seizure, gastroenteritis/dehydration, Kawasaki disease/MIS-C, myocarditis/pericarditis, pneumonia, lung effusion or empyema, respiratory failure, sepsis, nonfebrile seizure, pancreatitis, sickle cell complications, and thrombotic complications.
Outcomes
COVID-19 severity outcomes were assessed as follows: (1) mild = ED discharge; (2) moderate = inpatient admission; (3) severe = intensive care unit (ICU) admission without mechanical ventilation, shock, or death; and (4) very severe = ICU admission with mechanical ventilation, shock, or death.19 This ordinal ranking system did not violate the proportional odds assumption. Potential reasons for admission to the ICU without mechanical ventilation, shock, or death include, but are not limited to, need for noninvasive ventilation, vital sign instability, dysrhythmias, respiratory insufficiency, or complications arising from concurrent conditions (eg, thrombotic events, need for continuous albuterol therapy). We examined several secondary, hospital-based outcomes, including associated diagnoses and complications, all-cause 30-day healthcare reutilization (ED visit or rehospitalization), length of stay (LOS), and ICU LOS.
Statistical Analysis
Demographic characteristics were summarized using frequencies and percentages for categorical variables and geometric means with SD and medians with interquartile ranges (IQR) for continuous variables, as appropriate. Factors associated with hospitalization (encompassing severity levels 2-4) vs ED discharge (severity level 1) were assessed using logistic regression. Factors associated with increasing severity among hospitalized pediatric patients (severity levels 2, 3, and 4) were assessed using ordinal logistic regression. Covariates in these analyses included race and ethnicity, age, sex, payor, cardiovascular CCC, neurologic/neuromuscular CCC, obesity/type 2 DM, pulmonary CCC, asthma, and immunocompromised CCC. Adjusted odds ratios (aOR) and corresponding 95% CI for each risk factor were generated using generalized linear mixed effects models and random intercepts for each hospital. Given the potential for diagnostic misclassification of pediatric patients with COVID-19 based on primary vs secondary diagnoses, we performed sensitivity analyses defining the study population as those with a primary diagnosis of COVID-19 and those with a secondary diagnosis of COVID-19 plus a concurrent primary diagnosis of a condition associated with COVID-19 (Appendix Table 1).
All analyses were performed using SAS version 9.4 (SAS Institute, Inc), and P < .05 was considered statistically significant. The Institutional Review Board at Vanderbilt University Medical Center determined that this study of de-identified data did not meet the criteria for human subjects research.
RESULTS
Study Population
A total of 19,976 encounters were included in the study. Of those, 15,913 (79.7%) were discharged from the ED and 4063 (20.3%) were hospitalized (Table 1). The most common race/ethnicity was Hispanic (9741, 48.8%), followed by non-Hispanic White (4217, 21.1%). Reference race/ethnicity data for the overall 2019 PHIS population can be found in Appendix Table 2.
The severity distribution among the hospitalized population was moderate (3222, 79.3%), severe (431, 11.3%), and very severe (380, 9.4%). The frequency of COVID-19 diagnoses increased late in the study period (Figure). Among those hospitalized, the median LOS for the index admission was 2 days (IQR, 1-4), while among those admitted to the ICU, the median LOS was 3 days (IQR, 2-5).
Overall, 10.1% (n = 2020) of the study population had an all-cause repeat encounter (ie, subsequent ED encounter or hospitalization) within 30 days following the index discharge. Repeat encounters were more frequent among patients hospitalized than among those discharged from the ED (Appendix Table 3).
Prevalence of Conditions and Complications Associated With COVID-19
Overall, 3257 (16.3%) patients had one or more co-occurring diagnoses categorized as a COVID-19–associated condition or complication. The most frequent diagnoses included lower respiratory tract disease (pneumonia, lung effusion, or empyema; n = 1415, 7.1%), gastroenteritis/dehydration (n = 1068, 5.3%), respiratory failure (n = 731, 3.7%), febrile infant (n = 413, 2.1%), and nonfebrile seizure (n = 425, 2.1%). Aside from nonfebrile seizure, neurological complications were less frequent and included febrile seizure (n = 155, 0.8%), encephalopathy (n = 63, 0.3%), aseptic meningitis (n = 16, 0.1%), encephalitis (n = 11, 0.1%), and cerebral infarction (n = 6, <0.1%). Kawasaki disease and MIS-C comprised 1.7% (n = 346) of diagnoses. Thrombotic complications occurred in 0.1% (n = 13) of patients. Overall, these conditions and complications associated with COVID-19 were more frequent in hospitalized patients than in those discharged from the ED (P < .001) (Table 2).
Factors Associated With COVID-19 Disease Severity
Compared to pediatric patients with COVID-19 discharged from the ED, factors associated with increased odds of hospitalization included private payor insurance; obesity/type 2 DM; asthma; and cardiovascular, immunocompromised, neurologic/neuromuscular, and pulmonary CCCs (Table 3). Factors associated with decreased risk of hospitalization included Black race or Hispanic ethnicity compared with White race; female sex; and age 5 to 11 years and age 12 to 17 years (vs age 0-4 years). Among children and adolescents hospitalized with COVID-19, factors associated with greater disease severity included Black or other non-White race; age 5 to 11 years; age 12 to 17 years; obesity/type 2 DM; immunocompromised conditions; and cardiovascular, neurologic/neuromuscular, and pulmonary CCCs (Table 3).
Sensitivity Analysis
We performed a sensitivity analysis that expanded the study population to include those with a secondary diagnosis of COVID-19 plus a diagnosis of a COVID-19–associated condition or complication. Analyses using the expanded population (N = 21,247) were similar to the primary analyses (Appendix Table 4 and Appendix Table 5).
DISCUSSION
In this large multicenter study evaluating COVID-19 disease severity in more than 19,000 patients presenting for emergency care at US pediatric hospitals, approximately 20% were hospitalized, and among those hospitalized almost a quarter required ICU care. Clinical risk factors associated with increased risk of hospitalization include private payor status and selected comorbidities (obesity/type 2 DM; asthma; and cardiovascular, pulmonary, immunocompromised, neurologic/neuromuscular CCCs), while those associated with decreased risk of hospitalization include older age, female sex, and Black race or Hispanic ethnicity. Factors associated with severe disease among hospitalized pediatric patients include Black or other non-White race, school age (≥5 years), and certain chronic conditions (cardiovascular disease, obesity/type 2 DM, neurologic or neuromuscular disease). Sixteen percent of patients had a concurrent diagnosis for a condition or complication associated with COVID-19.
While the study population (ie, children and adolescents presenting to the ED) represents a small fraction of children and adolescents in the community with SARS-CoV-2 infection, the results provide important insight into factors of severe COVID-19 in the pediatric population. A report from France suggested ventilatory or hemodynamic support or death were independently associated with older age (≥10 years), elevated C-reactive protein, and hypoxemia.12 An Italian study found that younger age (0-4 years) was associated with less severe disease, while preexisting conditions were more likely in patients with severe disease.11 A single-center case series of 50 patients (aged ≤21 years) hospitalized at a children’s hospital in New York City found respiratory failure (n = 9) was more common in children older than 1 year, patients with elevated inflammatory markers, and patients with obesity.20
Our study confirms several factors for severe COVID-19 found in these studies, including older age,11,12,20 obesity,20 and preexisting conditions.11 Our findings also expand on these reports, including identification of factors associated with hospitalization. Given the rate of 30-day re-encounters among pediatric patients with COVID-19 (10.1%), identifying risk factors for hospitalization may aid ED providers in determining optimal disposition (eg, home, hospital admission, ICU). We also identified specific comorbidities associated with more severe disease in those hospitalized with COVID-19, such as cardiovascular disease, obesity/type 2 DM, and pulmonary, neurologic, or neuromuscular conditions. We also found that asthma increased the risk for hospitalization but not more severe disease among those hospitalized. This latter finding also aligns with recent single-center studies,21,22 whereas a Turkish study of pediatric patients aged 0 to 18 years found no association between asthma and COVID-19 hospitalizations.23We also examined payor type and racial/ethnic factors in our analysis. In 2019, patients who identified as Black or Hispanic comprised 52.3% of all encounters and 40.7% of hospitalizations recorded in the PHIS database. During the same year, encounters for influenza among Black or Hispanic pediatric patients comprised 58.7% of all influenza diagnoses and 47.0% of pediatric influenza hospitalizations (Appendix Table 2). In this study, patients who identified as Black or Hispanic race represented a disproportionately large share of patients presenting to children’s hospitals (68.5%) and of those hospitalized (60.8%). Hispanic ethnicity, in particular, represented a disproportionate share of patients seeking care for COVID-19 compared to the overall PHIS population (47.7% and 27.1%, respectively). After accounting for other factors, we found Black and other non-White race—but not of Hispanic ethnicity—were independently associated with more disease severity among those hospitalized. This contrasts with findings from a recent adult study by Yehia et al,24 who found (after adjusting for other clinical factors) no significant difference in mortality between Black patients and White patients among adults hospitalized due to COVID-19. It also contrasts with a recent large population-based UK study wherein pediatric patients identifying as Asian, but not Black or mixed race or ethnicity, had an increased risk of hospital admission and admission to the ICU compared to children identifying as White. Children identifying as Black or mixed race had longer hospital admissions.25 However, as the authors of the study note, residual confounders and ascertainment bias due to differences in COVID testing may have influenced these findings.
Our findings of differences in hospitalization and disease severity among those hospitalized by race and ethnicity should be interpreted carefully. These may reflect a constellation of factors that are difficult to measure, including differences in healthcare access, inequalities in care (including hospital admission inequalities), and implicit bias—all of which may reflect structural racism. For example, it is possible that children who identify as Black or Hispanic have different access to care compared to children who identify as White, and this may affect disease severity on presentation.2 Alternatively, it is possible that White pediatric patients are more likely to be hospitalized as compared to non-White pediatric patients with similar illness severity. Our finding that pediatric patients who identify as Hispanic or Black had a lower risk of hospitalization should be also interpreted carefully, as this may reflect higher utilization of the ED for SARS-CoV-2 testing, increased use of nonemergency services among those without access to primary care, or systematic differences in provider decision-making among this segment of the population.2 Further study is needed to determine specific drivers for racial and ethnic differences in healthcare utilization in children and adolescents with COVID-19.26
Complications and co-occurring diagnoses in adults with COVID-19 are well documented.27-30 However, there is little information to date on the co-occurring diagnoses and complications associated with COVID-19 in children and adolescents. We found that complications and co-occurring conditions occurred in 16.3% of the study population, with the most frequent conditions including known complications of viral infections such as pneumonia, respiratory failure, and seizures. Acute kidney and liver injury, as well as thrombotic complications, occurred less commonly than in adults.26-29 Interestingly, neurologic complications were also uncommon compared to adult reports8,31 and less frequent than in other viral illnesses in children and adolescents. For example, neurologic complications occur in approximately 7.5% of children and adolescents hospitalized with influenza.32
Limitations of the present study include the retrospective design, as well as incomplete patient-level clinical data in the PHIS database. The PHIS database only includes children’s hospitals, which may limit the generalizability of findings to community hospitals. We also excluded newborns, and our findings may not be generalizable to this population. We only included children and adolescents with a primary diagnosis of COVID-19, which has the potential for misclassification in cases where COVID-19 was a secondary diagnosis. However, results of our sensitivity analysis, which incorporated secondary diagnoses of COVID-19, were consistent with findings from our main analyses. Our study was designed to examine associations between certain prespecified factors and COVID-19 severity among pediatric patients who visited the ED or were admitted to the hospital during the COVID-19 pandemic. Thus, our findings must be interpreted in light of these considerations and may not be generalizable outside the ED or hospital setting. For example, it could be that some segments of the population utilized ED resources for testing, whereas others avoided the ED and other healthcare settings for fear of exposure to SARS-CoV-2. We also relied on diagnosis codes to identify concurrent diagnoses, as well as mechanical ventilation in our very severe outcome cohort, which resulted in this classification for some of these diagnoses. Despite these limitations, our findings represent an important step in understanding the risk factors associated with severe clinical COVID-19 disease in pediatric patients.
Our findings may inform future research and clinical interventions. Future studies on antiviral therapies and immune modulators targeting SARS-CoV-2 infection in children and adolescents should focus on high-risk populations, such as those identified in the study, as these patients are most likely to benefit from therapeutic interventions. Similarly, vaccine-development efforts may benefit from additional evaluation in high-risk populations, some of which may have altered immune responses. Furthermore, with increasing vaccination among adults and changes in recommendations, societal mitigation efforts (eg, masking, physical distancing) will diminish. Continued vigilance and COVID-19–mitigation efforts among high-risk children, for whom vaccines are not yet available, are critical during this transition.
CONCLUSION
Among children with COVID-19 who received care at children’s hospitals and EDs, 20% were hospitalized, and, of those, 21% were admitted to the ICU. Older children and adolescent patients had a lower risk of hospitalization; however, when hospitalized, they had greater illness severity. Those with selected comorbidities (eg, cardiovascular, obesity/type 2 DM, pulmonary and neurologic or neuromuscular disease) had both increased odds of hospitalization and in-hospital illness severity. While there were observed differences in COVID-19 severity by race and ethnicity, additional research is needed to clarify the drivers of such disparities. These factors should be considered when prioritizing mitigation strategies to prevent infection (eg, remote learning, avoidance of group activities, prioritization of COVID-19 vaccine when approved for children aged <12 years).
1. Centers for Disease Control and Prevention. COVID data tracker. Accessed September 9, 2021. https://covid.cdc.gov/covid-data-tracker/#datatracker-home
2. Levy C, Basmaci R, Bensaid P, et al. Changes in reverse transcription polymerase chain reaction-positive severe acute respiratory syndrome coronavirus 2 rates in adults and children according to the epidemic stages. Pediatr Infect Dis J. 2020;39(11):e369-e372. https://doi.org/10.1097/inf.0000000000002861
3. Gudbjartsson DF, Helgason A, Jonsson H, et al. Spread of SARS-CoV-2 in the Icelandic population. N Engl J Med. 2020;382(24):2302-2315. https://doi.org/10.1056/nejmoa2006100
4. Garg S, Kim L, Whitaker M, et al. Hospitalization rates and characteristics of patients hospitalized with laboratory-confirmed coronavirus disease 2019 - COVID-NET, 14 States, March 1-30, 2020. MMWR Morb Mortal Wkly Rep. 2020;69(15):458-464. https://doi.org/10.15585/mmwr.mm6915e3
5. Castagnoli R, Votto M, Licari A, et al. Severe acute respiratory syndrome coronavirus 2 (SARS-CoV-2) infection in children and adolescents: a systematic review. JAMA Pediatr. 2020;174(9):882-889. https://doi.org/10.1001/jamapediatrics.2020.1467
6. Feldstein LR, Rose EB, Horwitz SM, et al; Overcoming COVID-19 Investigators; CDC COVID-19 Response Team. Multisystem inflammatory syndrome in U.S. children and adolescents. N Engl J Med. 2020;383(4):334-346. https://doi.org/10.1056/nejmoa2021680
7. Magro B, Zuccaro V, Novelli L, et al. Predicting in-hospital mortality from coronavirus disease 2019: a simple validated app for clinical use. PLoS One. 2021;16(1):e0245281. https://doi.org/10.1371/journal.pone.0245281
8. Helms J, Kremer S, Merdji H, et al. Neurologic features in severe SARS-CoV-2 infection. N Engl J Med. 2020;382(23):2268-2270. https://doi.org/10.1056/nejmc2008597
9. Severe Covid GWAS Group; Ellinghaus D, Degenhardt F, Bujanda L, et al. Genomewide association study of severe Covid-19 with respiratory failure. N Engl J Med. 2020;383(16):1522-1534.
10. Kabarriti R, Brodin NP, Maron MI, et al. association of race and ethnicity with comorbidities and survival among patients with COVID-19 at an urban medical center in New York. JAMA Netw Open. 2020;3(9):e2019795. https://doi.org/10.1001/jamanetworkopen.2020.19795
11. Bellino S, Punzo O, Rota MC, et al; COVID-19 Working Group. COVID-19 disease severity risk factors for pediatric patients in Italy. Pediatrics. 2020;146(4):e2020009399. https://doi.org/10.1542/peds.2020-009399
12. Ouldali N, Yang DD, Madhi F, et al; investigator group of the PANDOR study. Factors associated with severe SARS-CoV-2 infection. Pediatrics. 2020;147(3):e2020023432. https://doi.org/10.1542/peds.2020-023432
13. Castells MC, Phillips EJ. Maintaining safety with SARS-CoV-2 vaccines. N Engl J Med. 2021;384(7):643-649. https://doi.org/10.1056/nejmra2035343
14. Antoon JW, Williams DJ, Thurm C, et al. The COVID-19 pandemic and changes in healthcare utilization for pediatric respiratory and nonrespiratory illnesses in the United States. J Hosp Med. 2021;16(5):294-297. https://doi.org/10.12788/jhm.3608
15. Blatz AM, David MZ, Otto WR, Luan X, Gerber JS. Validation of International Classification of Disease-10 code for identifying children hospitalized with coronavirus disease-2019. J Pediatric Infect Dis Soc. 2020;10(4):547-548. https://doi.org/10.1093/jpids/piaa140
16. Kadri SS, Gundrum J, Warner S, et al. Uptake and accuracy of the diagnosis code for COVID-19 among US hospitalizations. JAMA. 2020;324(24):2553-2554. https://doi.org/10.1001/jama.2020.20323
17. Kaiser SV, Rodean J, Bekmezian A, et al; Pediatric Research in Inpatient Settings (PRIS) Network. Effectiveness of pediatric asthma pathways for hospitalized children: a multicenter, national analysis. J Pediatr. 2018;197:165-171.e162. https://doi.org/10.1016/j.jpeds.2018.01.084
18. Feudtner C, Feinstein JA, Zhong W, Hall M, Dai D. Pediatric complex chronic conditions classification system version 2: updated for ICD-10 and complex medical technology dependence and transplantation. BMC Pediatr. 2014;14:199. https://doi.org/10.1186/1471-2431-14-199.
19. Williams DJ, Zhu Y, Grijalva CG, et al. Predicting severe pneumonia outcomes in children. Pediatrics. 2016;138(4):e20161019. https://doi.org/10.1542/peds.2016-1019
20. Zachariah P, Johnson CL, Halabi KC, et al. Epidemiology, clinical features, and disease severity in patients with coronavirus disease 2019 (COVID-19) in a children’s hospital in New York City, New York. JAMA Pediatr. 2020;174(10):e202430. https://doi.org/10.1001/jamapediatrics.2020.2430
21. DeBiasi RL, Song X, Delaney M, et al. Severe coronavirus disease-2019 in children and young adults in the Washington, DC, metropolitan region. J Pediatr. 2020;223:199-203.e191. https://doi.org/10.1016/j.jpeds.2020.05.007
22. Lovinsky-Desir S, Deshpande DR, De A, et al. Asthma among hospitalized patients with COVID-19 and related outcomes. J Allergy Clin Immunol. 2020;146(5):1027-1034.e1024. https://doi.org/10.1016/j.jaci.2020.07.026
23. Beken B, Ozturk GK, Aygun FD, Aydogmus C, Akar HH. Asthma and allergic diseases are not risk factors for hospitalization in children with coronavirus disease 2019. Ann Allergy Asthma Immunol. 2021;126(5):569-575. https://doi.org/10.1016/j.anai.2021.01.018
24. Yehia BR, Winegar A, Fogel R, et al. Association of race with mortality among patients hospitalized with coronavirus disease 2019 (COVID-19) at 92 US hospitals. JAMA Netw Open. 2020;3(8):e2018039. https://doi.org/10.1001/jamanetworkopen.2020.18039
25. Saatci D, Ranger TA, Garriga C, et al. Association between race and COVID-19 outcomes among 2.6 million children in England. JAMA Pediatr. 2021;e211685. https://doi.org/10.1001/jamapediatrics.2021.1685
26. Lopez L, 3rd, Hart LH, 3rd, Katz MH. Racial and ethnic health disparities related to COVID-19. JAMA. 2021;325(8):719-720. https://doi.org/10.1001/jama.2020.26443
27. Altunok ES, Alkan M, Kamat S, et al. Clinical characteristics of adult patients hospitalized with laboratory-confirmed COVID-19 pneumonia. J Infect Chemother. 2020. https://doi.org/10.1016/j.jiac.2020.10.020
28. Ali H, Daoud A, Mohamed MM, et al. Survival rate in acute kidney injury superimposed COVID-19 patients: a systematic review and meta-analysis. Ren Fail. 2020;42(1):393-397. https://doi.org/10.1080/0886022x.2020.1756323
29. Anirvan P, Bharali P, Gogoi M, Thuluvath PJ, Singh SP, Satapathy SK. Liver injury in COVID-19: the hepatic aspect of the respiratory syndrome - what we know so far. World J Hepatol. 2020;12(12):1182-1197. https://doi.org/10.4254/wjh.v12.i12.1182
30. Moschonas IC, Tselepis AD. SARS-CoV-2 infection and thrombotic complications: a narrative review. J Thromb Thrombolysis. 2021;52(1):111-123. https://doi.org/10.1007/s11239-020-02374-3
31. Lee MH, Perl DP, Nair G, et al. Microvascular injury in the brains of patients with Covid-19. N Engl J Med. 2020;384(5):481-483. https://doi.org/10.1056/nejmc2033369
32. Antoon JW, Hall M, Herndon A, et al. Prevalence, risk factors, and outcomes of influenza-associated neurological Complications in Children. J Pediatr. 2021;S0022-3476(21)00657-0. https://doi.org/10.1016/j.jpeds.2021.06.075
© 2021 Society of Hospital Medicine
How Organizations Can Build a Successful and Sustainable Social Media Presence
Horwitz and Detsky1 provide readers with a personal, experientially based primer on how healthcare professionals can more effectively engage on Twitter. As experienced physicians, researchers, and active social media users, the authors outline pragmatic and specific recommendations on how to engage misinformation and add value to social media discourse. We applaud the authors for offering best-practice approaches that are valuable to newcomers as well as seasoned social media users. In highlighting that social media is merely a modern tool for engagement and discussion, the authors underscore the time-held idea that only when a tool is used effectively will it yield the desired outcome. As a medical journal that regularly uses social media as a tool for outreach and dissemination, we could not agree more with the authors’ assertion.
Since 2015, the Journal of Hospital Medicine (JHM) has used social media to engage its readership and extend the impact of the work published in its pages. Like Horwitz and Detsky, JHM has developed insights and experience in how medical journals, organizations, institutions, and other academic programs can use social media effectively. Because of our experience in this area, we are often asked how to build a successful and sustainable social media presence. Here, we share five primary lessons on how to use social media as a tool to disseminate, connect, and engage.
ESTABLISH YOUR GOALS
As the flagship journal for the field of hospital medicine, we seek to disseminate the ideas and research that will inform health policy, optimize healthcare delivery, and improve patient outcomes while also building and sustaining an online community for professional engagement and growth. Our social media goals provide direction on how to interact, allow us to focus attention on what is important, and motivate our growth in this area. Simply put, we believe that using social media without defined goals would be like sailing a ship without a rudder.
KNOW YOUR AUDIENCE
As your organization establishes its goals, it is important to consider with whom you want to connect. Knowing your audience will allow you to better tailor the content you deliver through social media. For instance, we understand that as a journal focused on hospital medicine, our audience consists of busy clinicians, researchers, and medical educators who are trying to efficiently gather the most up-to-date information in our field. Recognizing this, we produce (and make available for download) Visual Abstracts and publish them on Twitter to help our followers assimilate information from new studies quickly and easily.2 Moreover, we recognize that our followers are interested in how to use social media in their professional lives and have published several articles in this topic area.3-5
BUILD YOUR TEAM
We have found that having multiple individuals on our social media team has led to greater creativity and thoughtfulness on how we engage our readership. Our teams span generations, clinical experience, institutions, and cultural backgrounds. This intentional approach has allowed for diversity in thoughts and opinions and has helped shape the JHM social media message. Additionally, we have not only formalized editorial roles through the creation of Digital Media Editor positions, but we have also created the JHM Digital Media Fellowship, a training program and development pipeline for those interested in cultivating organization-based social media experiences and skill sets.6
ENGAGE CONSISTENTLY
Many organizations believe that successful social media outreach means creating an account and posting content when convenient. Experience has taught us that daily postings and regular engagement will build your brand as a regular and reliable source of information for your followers. Additionally, while many academic journals and organizations only occasionally post material and rarely interact with their followers, we have found that engaging and facilitating conversations through our monthly Twitter discussion (#JHMChat) has established a community, created opportunities for professional networking, and further disseminated the work published in JHM.7 As an academic journal or organization entering this field, recognize the product for which people follow you and deliver that product on a consistent basis.
OWN YOUR MISTAKES
It will only be a matter of time before your organization makes a misstep on social media. Instead of hiding, we recommend stepping into that tension and owning the mistake. For example, we recently published an article that contained a culturally offensive term. As a journal, we reflected on our error and took concrete steps to correct it. Further, we shared our thoughts with our followers to ensure transparency.8 Moving forward, we have inserted specific stopgaps in our editorial review process to avoid such missteps in the future.
Although every organization will have different goals and reasons for engaging on social media, we believe these central tenets will help optimize the use of this platform. Although we have established specific objectives for our engagement on social media, we believe Horwitz and Detsky1 put it best when they note that, at the end of the day, our ultimate goal is in “…promoting knowledge and science in a way that helps us all live healthier and happier lives."
1. Horwitz LI, Detsky AS. Tweeting into the void: effective use of social media for healthcare professionals. J Hosp Med. 2021;16(10):581-582. https://doi.org/10.12788/jhm.3684
2. 2021 Visual Abstracts. Accessed September 8, 2021. https://www.journalofhospitalmedicine.com/jhospmed/page/2021-visual-abstracts
3. Kumar A, Chen N, Singh A. #ConsentObtained - patient privacy in the age of social media. J Hosp Med. 2020;15(11):702-704. https://doi.org/10.12788/jhm.3416
4. Minter DJ, Patel A, Ganeshan S, Nematollahi S. Medical communities go virtual. J Hosp Med. 2021;16(6):378-380. https://doi.org/10.12788/jhm.3532
5. Marcelin JR, Cawcutt KA, Shapiro M, Varghese T, O’Glasser A. Moment vs movement: mission-based tweeting for physician advocacy. J Hosp Med. 2021;16(8):507-509. https://doi.org/10.12788/jhm.3636
6. Editorial Fellowships (Digital Media and Editorial). Accessed September 8, 2021. https://www.journalofhospitalmedicine.com/content/editorial-fellowships-digital-media-and-editorial
7. Wray CM, Auerbach AD, Arora VM. The adoption of an online journal club to improve research dissemination and social media engagement among hospitalists. J Hosp Med. 2018;13(11):764-769. https://doi.org/10.12788/jhm.2987
8. Shah SS, Manning KD, Wray CM, Castellanos A, Jerardi KE. Microaggressions, accountability, and our commitment to doing better [editorial]. J Hosp Med. 2021;16(6):325. https://doi.org/10.12788/jhm.3646
Horwitz and Detsky1 provide readers with a personal, experientially based primer on how healthcare professionals can more effectively engage on Twitter. As experienced physicians, researchers, and active social media users, the authors outline pragmatic and specific recommendations on how to engage misinformation and add value to social media discourse. We applaud the authors for offering best-practice approaches that are valuable to newcomers as well as seasoned social media users. In highlighting that social media is merely a modern tool for engagement and discussion, the authors underscore the time-held idea that only when a tool is used effectively will it yield the desired outcome. As a medical journal that regularly uses social media as a tool for outreach and dissemination, we could not agree more with the authors’ assertion.
Since 2015, the Journal of Hospital Medicine (JHM) has used social media to engage its readership and extend the impact of the work published in its pages. Like Horwitz and Detsky, JHM has developed insights and experience in how medical journals, organizations, institutions, and other academic programs can use social media effectively. Because of our experience in this area, we are often asked how to build a successful and sustainable social media presence. Here, we share five primary lessons on how to use social media as a tool to disseminate, connect, and engage.
ESTABLISH YOUR GOALS
As the flagship journal for the field of hospital medicine, we seek to disseminate the ideas and research that will inform health policy, optimize healthcare delivery, and improve patient outcomes while also building and sustaining an online community for professional engagement and growth. Our social media goals provide direction on how to interact, allow us to focus attention on what is important, and motivate our growth in this area. Simply put, we believe that using social media without defined goals would be like sailing a ship without a rudder.
KNOW YOUR AUDIENCE
As your organization establishes its goals, it is important to consider with whom you want to connect. Knowing your audience will allow you to better tailor the content you deliver through social media. For instance, we understand that as a journal focused on hospital medicine, our audience consists of busy clinicians, researchers, and medical educators who are trying to efficiently gather the most up-to-date information in our field. Recognizing this, we produce (and make available for download) Visual Abstracts and publish them on Twitter to help our followers assimilate information from new studies quickly and easily.2 Moreover, we recognize that our followers are interested in how to use social media in their professional lives and have published several articles in this topic area.3-5
BUILD YOUR TEAM
We have found that having multiple individuals on our social media team has led to greater creativity and thoughtfulness on how we engage our readership. Our teams span generations, clinical experience, institutions, and cultural backgrounds. This intentional approach has allowed for diversity in thoughts and opinions and has helped shape the JHM social media message. Additionally, we have not only formalized editorial roles through the creation of Digital Media Editor positions, but we have also created the JHM Digital Media Fellowship, a training program and development pipeline for those interested in cultivating organization-based social media experiences and skill sets.6
ENGAGE CONSISTENTLY
Many organizations believe that successful social media outreach means creating an account and posting content when convenient. Experience has taught us that daily postings and regular engagement will build your brand as a regular and reliable source of information for your followers. Additionally, while many academic journals and organizations only occasionally post material and rarely interact with their followers, we have found that engaging and facilitating conversations through our monthly Twitter discussion (#JHMChat) has established a community, created opportunities for professional networking, and further disseminated the work published in JHM.7 As an academic journal or organization entering this field, recognize the product for which people follow you and deliver that product on a consistent basis.
OWN YOUR MISTAKES
It will only be a matter of time before your organization makes a misstep on social media. Instead of hiding, we recommend stepping into that tension and owning the mistake. For example, we recently published an article that contained a culturally offensive term. As a journal, we reflected on our error and took concrete steps to correct it. Further, we shared our thoughts with our followers to ensure transparency.8 Moving forward, we have inserted specific stopgaps in our editorial review process to avoid such missteps in the future.
Although every organization will have different goals and reasons for engaging on social media, we believe these central tenets will help optimize the use of this platform. Although we have established specific objectives for our engagement on social media, we believe Horwitz and Detsky1 put it best when they note that, at the end of the day, our ultimate goal is in “…promoting knowledge and science in a way that helps us all live healthier and happier lives."
1. Horwitz LI, Detsky AS. Tweeting into the void: effective use of social media for healthcare professionals. J Hosp Med. 2021;16(10):581-582. https://doi.org/10.12788/jhm.3684
2. 2021 Visual Abstracts. Accessed September 8, 2021. https://www.journalofhospitalmedicine.com/jhospmed/page/2021-visual-abstracts
3. Kumar A, Chen N, Singh A. #ConsentObtained - patient privacy in the age of social media. J Hosp Med. 2020;15(11):702-704. https://doi.org/10.12788/jhm.3416
4. Minter DJ, Patel A, Ganeshan S, Nematollahi S. Medical communities go virtual. J Hosp Med. 2021;16(6):378-380. https://doi.org/10.12788/jhm.3532
5. Marcelin JR, Cawcutt KA, Shapiro M, Varghese T, O’Glasser A. Moment vs movement: mission-based tweeting for physician advocacy. J Hosp Med. 2021;16(8):507-509. https://doi.org/10.12788/jhm.3636
6. Editorial Fellowships (Digital Media and Editorial). Accessed September 8, 2021. https://www.journalofhospitalmedicine.com/content/editorial-fellowships-digital-media-and-editorial
7. Wray CM, Auerbach AD, Arora VM. The adoption of an online journal club to improve research dissemination and social media engagement among hospitalists. J Hosp Med. 2018;13(11):764-769. https://doi.org/10.12788/jhm.2987
8. Shah SS, Manning KD, Wray CM, Castellanos A, Jerardi KE. Microaggressions, accountability, and our commitment to doing better [editorial]. J Hosp Med. 2021;16(6):325. https://doi.org/10.12788/jhm.3646
© 2021 Society of Hospital Medicine
Implementation and Impact of a β -Lactam Allergy Assessment Protocol in a Veteran Population
Allergies to β-lactam antibiotics are among the most documented drug allergies, and approximately 10% of the US population reports an allergy specifically to penicillin.1,2 Many allergic reactions are mediated via the antibody immunoglobulin E (IgE), producing an immediate hypersensitivity response, such as hives or anaphylaxis, which can be life threatening. Reactions also may be mediated by T cells of the immune system, which target various cell lines and can cause a drug reaction with eosinophilia and systemic symptoms or Stevens-Johnson syndrome/toxic epidermal necrolysis (SJS/TEN).3Although β-lactam and penicillin allergies are frequently reported, < 5% manifest as either an IgE or T-cell–mediated response.4Furthermore, for the small proportion of patients who once had a true IgE-mediated reaction, including anaphylaxis, 80% experience a decrease in IgE antibodies over time, resulting in a loss of allergic response after about 10 years.2 Due to this decline in IgE response and the initial mislabeling of mild non-IgE penicillin reactions, 95% of patients who are labeled as penicillin-allergic can eventually tolerate a penicillin.2
When a patient’s β-lactam allergy is never reevaluated, negative consequences can ensue. This allergy in a patient’s medical record can lead to the inappropriate avoidance of the entire β-lactam antibiotic class, which includes all penicillins, cephalosporins, and carbapenems. Withholding these antibiotics in certain situations can lead to negative patient outcomes.5-7 For example, the drugs of choice for the infections syphilis and methicillin-susceptible Staphylococcus aureus (S aureus) are a penicillin or cephalosporin, and patients labeled as penicillin-allergic are more likely to experience treatment failure from using second-line therapies.8 Additionally, receiving non-β-lactam antibiotics puts patients at risk of multidrug-resistant pathogens like methicillin-resistant S aureus and vancomycin-resistant Enterococcus (VRE) as well as adverse effects, such as Clostridioides difficile infection.9 Using alternative, and likely broad-spectrum, antibiotics also can be financially detrimental: These medications often are more costly than their β-lactam alternatives, and the inappropriate use of therapies can result in longer hospital courses.9-11
Penicillin allergies can complicate the antibiotic treatment strategy. The Memphis Veterans Affairs Medical Center (MVAMC) in Tennessee recently examined the negative sequelae of β-lactam allergies and found that more than half the patients received inappropriate antibiotics based on guideline recommendations, allergy history, and culture and sensitivity data.12 To mitigate the problems for patients with β-lactam allergies, the 2016 guidelines from the Infectious Diseases Society of America (IDSA) on the Implementation of Antimicrobial Stewardship Programs (ASP) recommend that these patients undergo allergy assessment and penicillin skin testing.13In November 2017, MVAMC implemented such a process. The purpose of this study was to describe our pharmacist-run β-lactam allergy assessment (BLAA) protocol and penicillin allergy clinic (PAC) and evaluate their overall outcomes: the proportion of patients who have been cleared to receive an alternative β-lactam antibiotic or who have had their allergy removed altogether.
Methods
We conducted a retrospective, observational study with approval from the institutional review board at MVAMC. This institution is an academic teaching center with 240 acute care beds and a variety of outpatient clinics available at the main campus, serving veterans in Memphis and the Mid-South area, including west Tennessee, northern Mississippi, and northeastern Arkansas. Patients were consecutively evaluated from November 2017 through February 2020. All MVAMC patients with a documented β-lactam allergy were eligible for inclusion; there were no exclusion criteria. Electronic health record data were assessed and included basic patient demographics, allergy history, and the outcome of the BLAA and PAC. Descriptive statistics were used for data analysis.
The purpose of the BLAA process is to evaluate, clarify, and potentially clear patients of their β-lactam allergies. Started in November 2017, the process includes appropriate patient screening with documentation of the β-lactam allergy. When patients with a β-lactam allergy are admitted to the hospital, they are interviewed by an inpatient CPS. This pharmacist then enters an assessment into the patient’s chart, which includes details of the allergen, reaction, and timing of the event. Based on this information, the CPS provides recommendations: clearance for alternative β-lactams, avoidance of all β-lactams, or removal of the allergy.
In January 2019, the pharmacist-driven penicillin allergy clinic (PAC) was started. Eligible patients receive a skin test to confirm or rule out their allergy after hospital discharge. To facilitate patient identification and screening, the ASP/infectious diseases (ID) clinical pharmacist runs a daily report of hospitalized patients with documented β-lactam allergies. All inpatient CPSs had access to this report and could easily identify and interview patients. Following the interview, the pharmacist enters a note in the patient’s chart, using the BLAA template (eFigures 1 and 2). On completion, a note is viewable in the Notes section adjacent to the patient’s allergies. The pharmacist then can enter a PAC consult for eligible patients. Although most patients qualify for PAC, exclusion criteria include non–IgE-mediated allergies (ie, SJS/TEN), allergies to β-lactams other than penicillins, or recent reactions (ie, within the past 5 years). Each inpatient CPS is trained on this BLAA process, which includes patient screening, chart review, patient interviewing, and the BLAA template and note completion. Pharmacists must demonstrate competency in completing 5 BLAA notes with review from the ASP/ID pharmacist. Once training is completed, this process is integrated into the pharmacist’s everyday workflow.


On receipt of the PAC consult, the ASP/ID pharmacist reviews the patient chart to further assess for eligibility and to determine whether oral challenge alone or skin testing followed by the oral challenge is required based on patient risk stratification (Table 1).3Relative contraindications to PAC include severe or unstable lung disease that requires home oxygen, frequent or recurrent heart failure exacerbations, or patients with acute or unstable cardiopulmonary, neurologic, or mental health conditions. These scenarios are discussed case by case with the allergy/immunology (A/I) physician.

The ASP/ID pharmacist also reviews the patient’s chart for medications that may blunt the histamine response during drug testing. The need to hold these medications before PAC also are individually assessed in conjunction with the A/I physician. The ASP/ID pharmacist and 3 other CPS involved in the creation of the BLAA and PAC have received formal hands-on training on penicillin allergy testing. The PAC process consists of a penicillin skin test, followed by the amoxicillin oral challenge.3The ASP/ID clinical pharmacist who is trained in penicillin skin testing performs all duties in PAC, with oversight from the A/I attending physician as needed. Currently, the ASP/ID pharmacist runs the PAC once a week with the A/I physician available if needed. Along with documenting an A/I clinic note detailing the events of PAC, the ASP/ID pharmacist also will add an addendum to the original BLAA note. If the allergy is removed through direct testing, it also can be removed from the patient’s profile after discussion with the A/I physician. Therefore, the full details necessary to evaluate, clarify, and clear the patient of their β-lactam allergy are in one place.
Results
We evaluated 278 patients, using the BLAA protocol. In this veteran population, patients were generally older males and evenly split between African American and White patients (Table 2). Most patients reported an allergy to penicillin, with a rash being the most common reaction (Table 3).


Of the 278 assessed, 246 patients were evaluated via our BLAA alone and were not seen in PAC. We were able to remove 25% of these patients’ allergies by performing a thorough assessment. Of the 184 patients whose allergies could not be removed via the BLAA alone, 147 (80%) were still eligible for PAC but are awaiting scheduling. Patients ineligible for PAC included those with a cephalosporin allergy or a severe and non–IgE-mediated reaction. Other ineligible patients who were not eligible included those with diseases where risk of testing outweighed the benefits.
Of the 32 patients who were seen in PAC, 75% of allergies were removed through direct testing. No differences between race or gender were observed. Of the 8 patients (25%) whose allergies were not removed, 5 had confirmed penicillin allergies with a positive reaction; 4 of these patients have since tolerated an alternative β-lactam (either a cephalosporin or carbapenem). Three patients had inconclusive tests, most often because their positive control was nonreactive during the percutaneous portion of the skin test; these allergies could neither be confirmed nor removed. Two of these patients have since tolerated alternative β-lactams (both cephalosporins). Although these 8 patients should not be rechallenged with a penicillin antibiotic, they could still be considered for alternative β-lactams, based on the nature and histories of their allergies.
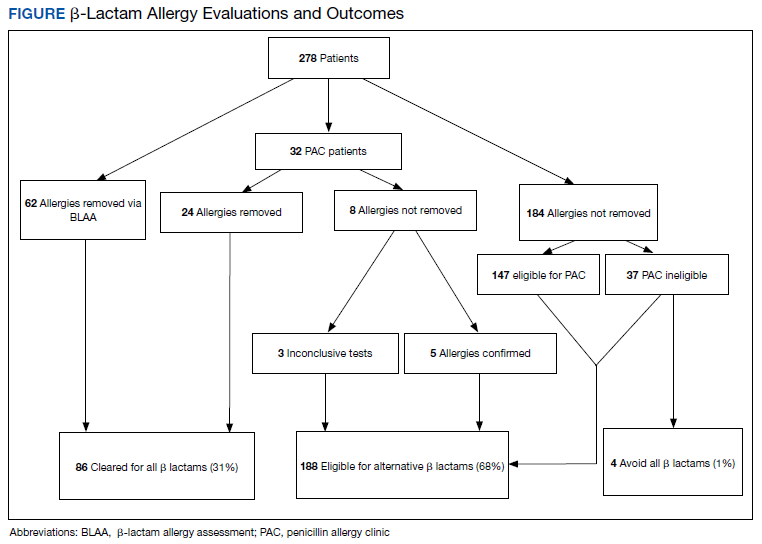
In total, we removed 86 allergies (31% of our patient population) using both BLAA and PAC (Figure). These patients were cleared for all β-lactams. One hundred eighty-eight patients (68%) were cleared to receive an alternative β-lactam based on the nature or history of the allergic reaction. β-lactam avoidance was recommended for only 4 patients (1%), as they had no exposure to any β-lactams, and they had a recent or severe reaction: 2 patients with anaphylaxis in the past 5 years, 1 with SJS/TEN, and 1 with recent convulsions after receiving cefepime. Combining patients whose penicillin allergies were removed with those who had been cleared for alternative β-lactam antibiotics, 99% of patients were cleared for a β-lactam antibiotic.
Discussion
We have implemented a unique and efficient way to evaluate, clarify, and clear β-lactam allergies. Our BLAA protocol allows for a smooth process by distributing the workload of evaluating and clarifying patients’ allergies over many inpatient CPS. Furthermore, the BLAA is readily accessible to health care providers (HCPs), allowing for optimal clinical decision making. HCPs can quickly gather further information on the β-lactam allergy, while seeing actionable recommendations, along with documentation of the PAC visit and subsequent events, if the patient has been seen.
This study demonstrated the promotion of alternative β-lactam use for nearly all patients: 99% of our patient population were deemed candidates for a β-lactam type antibiotic. This percentage included patients whose allergies have been fully cleared, both through BLAA alone and in PAC. Also included are patients who have been cleared for an alternative β-lactam and not necessarily a penicillin.
In our PAC, 8 patients were not cleared for penicillins: 5 had penicillin allergies confirmed, and 3 had inconclusive results. Based on the nature of their reactions and previous tolerance of alternative β-lactams, those 5 patients are still eligible for alternative β-lactams. Additionally, the 3 patients with inconclusive results are also eligible for alternative β-lactams for the same reasons. The patients for whom
Accounting for those patients who have not been seen in PAC, our results are in concordance with previous studies, which demonstrated that implementation of a similar BLAA process results in clearance of ≥ 90% of penicillin allergies.13-17Other studies have evaluated inpatient implementation of penicillin skin testing or oral challenges; in this study, however, BLAAs were completed while the patient was hospitalized, and patients were seen in PAC after discharge. Completing BLAA during hospitalization not only allows for faster assessment and facilitates decision making regarding most patients’ antibiotic regimens, but also provides a tool that can be used by many pharmacists and HCPs. The addition of our PAC to the BLAA protocol further strengthens the impact on clearance of patients’ penicillin allergies.
Limitations
Although our study demonstrates many benefits of implementation of a BLAA protocol and PAC, it has several limitations. This analysis was a retrospective review of the limited number of patients who had assessments completed. Additionally, many patients were waiting to be seen in PAC. This delay is largely due to the length of time to establish our pharmacist-run PAC, the limited number of pharmacists trained and available for skin testing, the time constraints of our staff, and COVID-19 pandemic. Additionally, only pharmacists administer the BLAA questionnaire, but this process could be expanded to other professionals such as nursing staff. Also, this study was not set up as a before-and-after analysis that examined outcomes associated with individual patients. Future directions include assessing the clinical impact of this protocol, such as evaluating provider utilization of β-lactam antibiotics for patients with penicillin allergies and determining associated cost savings.
Conclusions
This study demonstrated that implementation of a pharmacist-driven BLAA protocol and PAC can effectively remove inaccurate penicillin allergy labels and clear patients for alternative β-lactam antibiotic use. The BLAA process in conjunction with PAC will continue to be used to better evaluate, clarify, and clear patient allergies to optimize their care.
1. Lee CE, Zembower TR, Fotis MA, et al. The incidence of antimicrobial allergies in hospitalized patients: implications regarding prescribing patterns and emerging bacterial resistance. Arch Intern Med. 2000;160(18):2819-2822. doi:10.1001/archinte.160.18.2819
2. Shenoy ES, Macy E, Rowe T, Blumenthal KG. Evaluation and management of penicillin allergy: a review. JAMA. 2019;321(2):188-199. doi:10.1001/jama.2018.19283
3. Castells M, Khan DA, Phillips EJ. Penicillin allergy. N Engl J Med. 2019;381(24):2338-2351. doi:10.1056/NEJMra1807761
4. Park M, Markus P, Matesic D, Li JTC. Safety and effectiveness of a preoperative allergy clinic in decreasing vancomycin use in patients with a history of penicillin allergy. Ann Allergy Asthma Immunol. 2006;97(5):681-687. doi:10.1016/S1081-1206(10)61100-3
5. McDanel JS, Perencevich EN, Diekema DJ, et al. Comparative effectiveness of beta-lactams versus vancomycin for treatment of methicillin-susceptible Staphylococcus aureus bloodstream infections among 122 hospitals. Clin Infect Dis. 2015;61(3):361-367. doi:10.1093/cid/civ308
6. Blumenthal KG, Shenoy ES, Varughese CA, Hurwitz S, Hooper DC, Banerji A. Impact of a clinical guideline for prescribing antibiotics to inpatients reporting penicillin or cephalosporin allergy. Ann Allergy Asthma Immunol. 2015;115(4):294-300.e2. doi:10.1016/j.anai.2015.05.011
7. Blumenthal KG, Parker RA, Shenoy ES, Walensky RP. Improving clinical outcomes in patients with methicillin-sensitive Staphylococcus aureus bacteremia and reported penicillin allergy. Clin Infect Dis. 2015;61(5):741-749. doi:10.1093/cid/civ394
8. Jeffres MN, Narayanan PP, Shuster JE, Schramm GE. Consequences of avoiding β-lactams in patients with β-lactam allergies. J Allergy Clin Immunol. 2016;137(4):1148-1153. doi:10.1016/j.jaci.2015.10.026
9. Macy E, Contreras R. Health care use and serious infection prevalence associated with penicillin “allergy” in hospitalized patients: a cohort study. J Allergy Clin Immunol. 2014;133(3):790-796. doi:10.1016/j.jaci2013.09.021
10. Charneski L, Deshpande G, Smith SW. Impact of an antimicrobial allergy label in the medical record on clinical outcomes in hospitalized patients. Pharmacotherapy. 2011;31(8):742-747. doi:10.1592/phco.31.8.742
11. Sade K, Holtzer I, Levo Y, Kivity S. The economic burden of antibiotic treatment of penicillin-allergic patients in internal medicine wards of a general tertiary care hospital. Clin Exp Allergy. 2003;33(4):501-506. doi:10.1046/j.1365-2222.2003.01638.x
12. Ness RA, Bennett JG, Elliott WV, Gillion AR, Pattanaik DN. Impact of β-lactam allergies on antimicrobial selection in an outpatient setting. South Med J. 2019;112(11):591-597. doi:10.14423/SMJ.0000000000001037
13. Barlam TF, Cosgrove SE, Abbo LM, et al. Implementing an antibiotic stewardship program: guidelines by the Infectious Diseases Society of America and the Society for Healthcare Epidemiology of America. Clin Infect Dis. 2016;62(10):e51-e77. doi:10.1093/cid/ciw118
14. King EA, Challa S, Curtin P, Bielory L. Penicillin skin testing in hospitalized patients with beta-lactam allergies: effect on antibiotic selection and cost. Ann Allergy Asthma Immunol. 2016;117(1):67-71. doi:10.1016/j.anai.2016.04.021
15. Chen JR, Tarver SA, Alvarez KS, Tran T, Khan DA. A proactive approach to penicillin allergy testing in hospitalized patients. J Allergy Clin Immunol Pract. 2017;5(3):686-693. doi:10.1016/j.jaip.2016.09.045
16. Rimawi RH, Cook PP, Gooch M, et al. The impact of penicillin skin testing of clinical practice and antimicrobial stewardship. J Hosp Med. 2013;8(6):341-345. doi:10.1002/jhm.2036
17. Heil EL, Bork JT, Schmalzle SA, et al. Implementation of an infectious disease fellow-managed penicillin allergy skin testing service. Open Forum Infect Dis. 2016;3(3):155-161. doi:10.1093/ofid/ofw155
Allergies to β-lactam antibiotics are among the most documented drug allergies, and approximately 10% of the US population reports an allergy specifically to penicillin.1,2 Many allergic reactions are mediated via the antibody immunoglobulin E (IgE), producing an immediate hypersensitivity response, such as hives or anaphylaxis, which can be life threatening. Reactions also may be mediated by T cells of the immune system, which target various cell lines and can cause a drug reaction with eosinophilia and systemic symptoms or Stevens-Johnson syndrome/toxic epidermal necrolysis (SJS/TEN).3Although β-lactam and penicillin allergies are frequently reported, < 5% manifest as either an IgE or T-cell–mediated response.4Furthermore, for the small proportion of patients who once had a true IgE-mediated reaction, including anaphylaxis, 80% experience a decrease in IgE antibodies over time, resulting in a loss of allergic response after about 10 years.2 Due to this decline in IgE response and the initial mislabeling of mild non-IgE penicillin reactions, 95% of patients who are labeled as penicillin-allergic can eventually tolerate a penicillin.2
When a patient’s β-lactam allergy is never reevaluated, negative consequences can ensue. This allergy in a patient’s medical record can lead to the inappropriate avoidance of the entire β-lactam antibiotic class, which includes all penicillins, cephalosporins, and carbapenems. Withholding these antibiotics in certain situations can lead to negative patient outcomes.5-7 For example, the drugs of choice for the infections syphilis and methicillin-susceptible Staphylococcus aureus (S aureus) are a penicillin or cephalosporin, and patients labeled as penicillin-allergic are more likely to experience treatment failure from using second-line therapies.8 Additionally, receiving non-β-lactam antibiotics puts patients at risk of multidrug-resistant pathogens like methicillin-resistant S aureus and vancomycin-resistant Enterococcus (VRE) as well as adverse effects, such as Clostridioides difficile infection.9 Using alternative, and likely broad-spectrum, antibiotics also can be financially detrimental: These medications often are more costly than their β-lactam alternatives, and the inappropriate use of therapies can result in longer hospital courses.9-11
Penicillin allergies can complicate the antibiotic treatment strategy. The Memphis Veterans Affairs Medical Center (MVAMC) in Tennessee recently examined the negative sequelae of β-lactam allergies and found that more than half the patients received inappropriate antibiotics based on guideline recommendations, allergy history, and culture and sensitivity data.12 To mitigate the problems for patients with β-lactam allergies, the 2016 guidelines from the Infectious Diseases Society of America (IDSA) on the Implementation of Antimicrobial Stewardship Programs (ASP) recommend that these patients undergo allergy assessment and penicillin skin testing.13In November 2017, MVAMC implemented such a process. The purpose of this study was to describe our pharmacist-run β-lactam allergy assessment (BLAA) protocol and penicillin allergy clinic (PAC) and evaluate their overall outcomes: the proportion of patients who have been cleared to receive an alternative β-lactam antibiotic or who have had their allergy removed altogether.
Methods
We conducted a retrospective, observational study with approval from the institutional review board at MVAMC. This institution is an academic teaching center with 240 acute care beds and a variety of outpatient clinics available at the main campus, serving veterans in Memphis and the Mid-South area, including west Tennessee, northern Mississippi, and northeastern Arkansas. Patients were consecutively evaluated from November 2017 through February 2020. All MVAMC patients with a documented β-lactam allergy were eligible for inclusion; there were no exclusion criteria. Electronic health record data were assessed and included basic patient demographics, allergy history, and the outcome of the BLAA and PAC. Descriptive statistics were used for data analysis.
The purpose of the BLAA process is to evaluate, clarify, and potentially clear patients of their β-lactam allergies. Started in November 2017, the process includes appropriate patient screening with documentation of the β-lactam allergy. When patients with a β-lactam allergy are admitted to the hospital, they are interviewed by an inpatient CPS. This pharmacist then enters an assessment into the patient’s chart, which includes details of the allergen, reaction, and timing of the event. Based on this information, the CPS provides recommendations: clearance for alternative β-lactams, avoidance of all β-lactams, or removal of the allergy.
In January 2019, the pharmacist-driven penicillin allergy clinic (PAC) was started. Eligible patients receive a skin test to confirm or rule out their allergy after hospital discharge. To facilitate patient identification and screening, the ASP/infectious diseases (ID) clinical pharmacist runs a daily report of hospitalized patients with documented β-lactam allergies. All inpatient CPSs had access to this report and could easily identify and interview patients. Following the interview, the pharmacist enters a note in the patient’s chart, using the BLAA template (eFigures 1 and 2). On completion, a note is viewable in the Notes section adjacent to the patient’s allergies. The pharmacist then can enter a PAC consult for eligible patients. Although most patients qualify for PAC, exclusion criteria include non–IgE-mediated allergies (ie, SJS/TEN), allergies to β-lactams other than penicillins, or recent reactions (ie, within the past 5 years). Each inpatient CPS is trained on this BLAA process, which includes patient screening, chart review, patient interviewing, and the BLAA template and note completion. Pharmacists must demonstrate competency in completing 5 BLAA notes with review from the ASP/ID pharmacist. Once training is completed, this process is integrated into the pharmacist’s everyday workflow.
On receipt of the PAC consult, the ASP/ID pharmacist reviews the patient chart to further assess for eligibility and to determine whether oral challenge alone or skin testing followed by the oral challenge is required based on patient risk stratification (Table 1).3Relative contraindications to PAC include severe or unstable lung disease that requires home oxygen, frequent or recurrent heart failure exacerbations, or patients with acute or unstable cardiopulmonary, neurologic, or mental health conditions. These scenarios are discussed case by case with the allergy/immunology (A/I) physician.
The ASP/ID pharmacist also reviews the patient’s chart for medications that may blunt the histamine response during drug testing. The need to hold these medications before PAC also are individually assessed in conjunction with the A/I physician. The ASP/ID pharmacist and 3 other CPS involved in the creation of the BLAA and PAC have received formal hands-on training on penicillin allergy testing. The PAC process consists of a penicillin skin test, followed by the amoxicillin oral challenge.3The ASP/ID clinical pharmacist who is trained in penicillin skin testing performs all duties in PAC, with oversight from the A/I attending physician as needed. Currently, the ASP/ID pharmacist runs the PAC once a week with the A/I physician available if needed. Along with documenting an A/I clinic note detailing the events of PAC, the ASP/ID pharmacist also will add an addendum to the original BLAA note. If the allergy is removed through direct testing, it also can be removed from the patient’s profile after discussion with the A/I physician. Therefore, the full details necessary to evaluate, clarify, and clear the patient of their β-lactam allergy are in one place.
Results
We evaluated 278 patients, using the BLAA protocol. In this veteran population, patients were generally older males and evenly split between African American and White patients (Table 2). Most patients reported an allergy to penicillin, with a rash being the most common reaction (Table 3).
Of the 278 assessed, 246 patients were evaluated via our BLAA alone and were not seen in PAC. We were able to remove 25% of these patients’ allergies by performing a thorough assessment. Of the 184 patients whose allergies could not be removed via the BLAA alone, 147 (80%) were still eligible for PAC but are awaiting scheduling. Patients ineligible for PAC included those with a cephalosporin allergy or a severe and non–IgE-mediated reaction. Other ineligible patients who were not eligible included those with diseases where risk of testing outweighed the benefits.
Of the 32 patients who were seen in PAC, 75% of allergies were removed through direct testing. No differences between race or gender were observed. Of the 8 patients (25%) whose allergies were not removed, 5 had confirmed penicillin allergies with a positive reaction; 4 of these patients have since tolerated an alternative β-lactam (either a cephalosporin or carbapenem). Three patients had inconclusive tests, most often because their positive control was nonreactive during the percutaneous portion of the skin test; these allergies could neither be confirmed nor removed. Two of these patients have since tolerated alternative β-lactams (both cephalosporins). Although these 8 patients should not be rechallenged with a penicillin antibiotic, they could still be considered for alternative β-lactams, based on the nature and histories of their allergies.
In total, we removed 86 allergies (31% of our patient population) using both BLAA and PAC (Figure). These patients were cleared for all β-lactams. One hundred eighty-eight patients (68%) were cleared to receive an alternative β-lactam based on the nature or history of the allergic reaction. β-lactam avoidance was recommended for only 4 patients (1%), as they had no exposure to any β-lactams, and they had a recent or severe reaction: 2 patients with anaphylaxis in the past 5 years, 1 with SJS/TEN, and 1 with recent convulsions after receiving cefepime. Combining patients whose penicillin allergies were removed with those who had been cleared for alternative β-lactam antibiotics, 99% of patients were cleared for a β-lactam antibiotic.
Discussion
We have implemented a unique and efficient way to evaluate, clarify, and clear β-lactam allergies. Our BLAA protocol allows for a smooth process by distributing the workload of evaluating and clarifying patients’ allergies over many inpatient CPS. Furthermore, the BLAA is readily accessible to health care providers (HCPs), allowing for optimal clinical decision making. HCPs can quickly gather further information on the β-lactam allergy, while seeing actionable recommendations, along with documentation of the PAC visit and subsequent events, if the patient has been seen.
This study demonstrated the promotion of alternative β-lactam use for nearly all patients: 99% of our patient population were deemed candidates for a β-lactam type antibiotic. This percentage included patients whose allergies have been fully cleared, both through BLAA alone and in PAC. Also included are patients who have been cleared for an alternative β-lactam and not necessarily a penicillin.
In our PAC, 8 patients were not cleared for penicillins: 5 had penicillin allergies confirmed, and 3 had inconclusive results. Based on the nature of their reactions and previous tolerance of alternative β-lactams, those 5 patients are still eligible for alternative β-lactams. Additionally, the 3 patients with inconclusive results are also eligible for alternative β-lactams for the same reasons. The patients for whom
Accounting for those patients who have not been seen in PAC, our results are in concordance with previous studies, which demonstrated that implementation of a similar BLAA process results in clearance of ≥ 90% of penicillin allergies.13-17Other studies have evaluated inpatient implementation of penicillin skin testing or oral challenges; in this study, however, BLAAs were completed while the patient was hospitalized, and patients were seen in PAC after discharge. Completing BLAA during hospitalization not only allows for faster assessment and facilitates decision making regarding most patients’ antibiotic regimens, but also provides a tool that can be used by many pharmacists and HCPs. The addition of our PAC to the BLAA protocol further strengthens the impact on clearance of patients’ penicillin allergies.
Limitations
Although our study demonstrates many benefits of implementation of a BLAA protocol and PAC, it has several limitations. This analysis was a retrospective review of the limited number of patients who had assessments completed. Additionally, many patients were waiting to be seen in PAC. This delay is largely due to the length of time to establish our pharmacist-run PAC, the limited number of pharmacists trained and available for skin testing, the time constraints of our staff, and COVID-19 pandemic. Additionally, only pharmacists administer the BLAA questionnaire, but this process could be expanded to other professionals such as nursing staff. Also, this study was not set up as a before-and-after analysis that examined outcomes associated with individual patients. Future directions include assessing the clinical impact of this protocol, such as evaluating provider utilization of β-lactam antibiotics for patients with penicillin allergies and determining associated cost savings.
Conclusions
This study demonstrated that implementation of a pharmacist-driven BLAA protocol and PAC can effectively remove inaccurate penicillin allergy labels and clear patients for alternative β-lactam antibiotic use. The BLAA process in conjunction with PAC will continue to be used to better evaluate, clarify, and clear patient allergies to optimize their care.
1. Lee CE, Zembower TR, Fotis MA, et al. The incidence of antimicrobial allergies in hospitalized patients: implications regarding prescribing patterns and emerging bacterial resistance. Arch Intern Med. 2000;160(18):2819-2822. doi:10.1001/archinte.160.18.2819
2. Shenoy ES, Macy E, Rowe T, Blumenthal KG. Evaluation and management of penicillin allergy: a review. JAMA. 2019;321(2):188-199. doi:10.1001/jama.2018.19283
3. Castells M, Khan DA, Phillips EJ. Penicillin allergy. N Engl J Med. 2019;381(24):2338-2351. doi:10.1056/NEJMra1807761
4. Park M, Markus P, Matesic D, Li JTC. Safety and effectiveness of a preoperative allergy clinic in decreasing vancomycin use in patients with a history of penicillin allergy. Ann Allergy Asthma Immunol. 2006;97(5):681-687. doi:10.1016/S1081-1206(10)61100-3
5. McDanel JS, Perencevich EN, Diekema DJ, et al. Comparative effectiveness of beta-lactams versus vancomycin for treatment of methicillin-susceptible Staphylococcus aureus bloodstream infections among 122 hospitals. Clin Infect Dis. 2015;61(3):361-367. doi:10.1093/cid/civ308
6. Blumenthal KG, Shenoy ES, Varughese CA, Hurwitz S, Hooper DC, Banerji A. Impact of a clinical guideline for prescribing antibiotics to inpatients reporting penicillin or cephalosporin allergy. Ann Allergy Asthma Immunol. 2015;115(4):294-300.e2. doi:10.1016/j.anai.2015.05.011
7. Blumenthal KG, Parker RA, Shenoy ES, Walensky RP. Improving clinical outcomes in patients with methicillin-sensitive Staphylococcus aureus bacteremia and reported penicillin allergy. Clin Infect Dis. 2015;61(5):741-749. doi:10.1093/cid/civ394
8. Jeffres MN, Narayanan PP, Shuster JE, Schramm GE. Consequences of avoiding β-lactams in patients with β-lactam allergies. J Allergy Clin Immunol. 2016;137(4):1148-1153. doi:10.1016/j.jaci.2015.10.026
9. Macy E, Contreras R. Health care use and serious infection prevalence associated with penicillin “allergy” in hospitalized patients: a cohort study. J Allergy Clin Immunol. 2014;133(3):790-796. doi:10.1016/j.jaci2013.09.021
10. Charneski L, Deshpande G, Smith SW. Impact of an antimicrobial allergy label in the medical record on clinical outcomes in hospitalized patients. Pharmacotherapy. 2011;31(8):742-747. doi:10.1592/phco.31.8.742
11. Sade K, Holtzer I, Levo Y, Kivity S. The economic burden of antibiotic treatment of penicillin-allergic patients in internal medicine wards of a general tertiary care hospital. Clin Exp Allergy. 2003;33(4):501-506. doi:10.1046/j.1365-2222.2003.01638.x
12. Ness RA, Bennett JG, Elliott WV, Gillion AR, Pattanaik DN. Impact of β-lactam allergies on antimicrobial selection in an outpatient setting. South Med J. 2019;112(11):591-597. doi:10.14423/SMJ.0000000000001037
13. Barlam TF, Cosgrove SE, Abbo LM, et al. Implementing an antibiotic stewardship program: guidelines by the Infectious Diseases Society of America and the Society for Healthcare Epidemiology of America. Clin Infect Dis. 2016;62(10):e51-e77. doi:10.1093/cid/ciw118
14. King EA, Challa S, Curtin P, Bielory L. Penicillin skin testing in hospitalized patients with beta-lactam allergies: effect on antibiotic selection and cost. Ann Allergy Asthma Immunol. 2016;117(1):67-71. doi:10.1016/j.anai.2016.04.021
15. Chen JR, Tarver SA, Alvarez KS, Tran T, Khan DA. A proactive approach to penicillin allergy testing in hospitalized patients. J Allergy Clin Immunol Pract. 2017;5(3):686-693. doi:10.1016/j.jaip.2016.09.045
16. Rimawi RH, Cook PP, Gooch M, et al. The impact of penicillin skin testing of clinical practice and antimicrobial stewardship. J Hosp Med. 2013;8(6):341-345. doi:10.1002/jhm.2036
17. Heil EL, Bork JT, Schmalzle SA, et al. Implementation of an infectious disease fellow-managed penicillin allergy skin testing service. Open Forum Infect Dis. 2016;3(3):155-161. doi:10.1093/ofid/ofw155
Provider Perceptions of Opioid Safety Measures in VHA Emergency Departments and Urgent Care Centers
The United States is facing an opioid crisis in which approximately 10 million people have misused opioids in the past year, and an estimated 2 million people have an opioid use disorder (OUD).1 Compared with the general population, veterans treated in the Veterans Health Administration (VHA) facilities are at nearly twice the risk for accidental opioid overdose.2 The implementation of opioid safety measures in VHA facilities across all care settings is a priority in addressing this public health crisis. Hence, VHA leadership is working to minimize veteran risk of fatal opioid overdoses and to increase veteran access to medication-assisted treatments (MAT) for OUD.3
Since the administration of our survey, the VHA has shifted to using the term medication for opioid use disorder (MOUD) instead of MAT for OUD. However, for consistency with the survey we distributed, we use MAT in this analysis.
Acute care settings represent an opportunity to offer appropriate opioid care and treatment options to patients at risk for OUD or opioid-related overdose. VHA facilities offer 2 outpatient acute care settings for emergent ambulatory care: emergency departments (EDs) and urgent care centers (UCCs). Annually, these settings see an estimated 2.5 million patients each year, making EDs and UCCs critical access points of OUD care for veterans. Partnering with key national VHA stakeholders from Pharmacy Benefits Management (PBM), the Office of Emergency Medicine, and Academic Detailing Services (ADS), we developed the Emergency Department Opioid Safety Initiative (ED OSI) aimed at implementing and evaluating opioid safety measures in VHA outpatient acute care settings.
The US Department of Veterans Affairs (VA)/Department of Defense (DoD) Clinical Practice Guidelines for Opioid Therapy for Chronic Pain (CPG) makes recommendations for the initiation and continuation of opioids, risk mitigation, taper of opioids, and opioid therapy for acute pain in VHA facilities.4 Using these recommendations, we developed the broad aims of the ED OSI quality improvement (QI) program. The CPG is clear about the prioritization of safe opioid prescribing practices. New opioid prescriptions written in the ED have been associated with continued and chronic opioid use.5 At the time of prescription, patients not currently and chronically on opioids who receive more than a 3-day supply are at increased risk of becoming long-term opioid users.6 Given the annual volume of patients seen, VHA ED/UCCs are a crucial area for implementing better opioid prescribing practices.
The CPG also includes recommendations for the prescribing or coprescribing of naloxone rescue kits. The administration of naloxone following opioid overdose has been found to be an effective measure against fatal overdose. Increasing provider awareness of common risk factors for opioid-related overdose (eg, frequent ED visits or hospitalizations) helps facilitate a discussion on naloxone prescribing at discharge. Prior studies provide evidence that naloxone distribution and accompanying education also are effective in reducing opioid overdose mortalityand ED visits related to adverse opioid-related events.7,8
Similarly, the guidelines provide recommendations for the use of MAT for veterans with OUD. MAT for OUD is considered a first-line treatment option for patients with moderate-to-severe OUD. When used to treat patients with unsafe opioid use, this treatment helps alleviate symptoms of withdrawal, which can increase opioid taper adherence and has a protective effect against opioid overdose mortality.9 MAT initiated in the ED can increase patient engagement to addiction services.10
These 3 CPG recommendations serve as the basis for the broad goals of the ED OSI program. We aim to develop, implement, and evaluate programs and initiatives to (aim 1) reduce inappropriate opioid prescribing from VHA EDs; (aim 2) increase naloxone distribution from VHA EDs; and (aim 3) increase access to MAT initiation from VHA EDs through the implementation of ED-based MAT-initiation programs with EDs across the VHA. Aim 1 was a focused and strategic QI effort to implement an ED-based program to reduce inappropriate opioid prescribing. The ED OSI prescribing program offered a 4-step bundled approach: (1) sharing of opioid prescribing dashboard data with ED medical director and academic detailer; (2) education of ED providers and implementation of toolkit resources; (3) academic detailers conduct audit and feedback session(s) with highest prescribers; and (4) quarterly reports of opioid prescribing data to ED providers.
Results from the pilot suggested that our program was associated with accelerating the rate at which ED prescribing rates decreased.11 In addition, the pilot found that ED-based QI initiatives in VHA facilities are a feasible practice. As we work to develop and implement the next 2 phases of the QI program, a major consideration is to identify facilitators and address any existing barriers to the implementation of naloxone distribution (aim 2) and MAT-initiation (aim 3) programs for treatment-naïve patients from VHA EDs. To date, there have been no recent published studies examining the barriers and facilitators to use or implementation of MAT initiation or naloxone distribution in VHA facilities or, more specifically, from VHA EDs.12 As part of our QI program, we set out to better understand VHA ED provider perceptions of barriers and facilitators to implementation of programs aimed at increasing naloxone distribution and initiation of MAT for treatment-naïve patients in the ED.
Methods
This project received a QI designation from the Office of PBM Academic Detailing Service Institutional Review Board at the Edward Hines, Jr. Veterans Affairs Hospital VA Medical Center (VAMC). This designation was reviewed and approved by the Rocky Mountain Regional VAMC Research and Development service. In addition, we received national union approval to disseminate this survey nationally across all VA Integrated Service Networks (VISNs).
Survey
We worked with VHA subject matter experts, key stakeholders, and the VA Collaborative Evaluation Center (VACE) to develop the survey. Subject matter experts and stakeholders included VHA emergency medicine leadership, ADS leadership, and mental health and substance treatment providers. VACE is an interdisciplinary group of mixed-method researchers. The survey questions aimed to capture perceptions and experiences regarding naloxone distribution and new MAT initiation of VHA ED/UCC providers.
We used a variety of survey question formats. Close-ended questions with a predefined list of answer options were used to capture discrete domains, such as demographic information, comfort level, and experience level. To capture health care provider (HCP) perceptions on barriers and facilitators, we used multiple-answer multiple-choice questions. Built into this question format was a free-response option, which allowed respondents to offer additional barriers or facilitators. Respondents also had the option of not answering individual questions.
We identified physicians, nurse practitioners (NPs), and physician assistants (PAs) who saw at least 100 patients in the ED or UCC in at least one 3-month period in the prior year and obtained an email address for each. In total, 2228 ED or UCC providers across 132 facilities were emailed a survey; 1883 (84.5%) were ED providers and 345 (15.5%) were UCC providers.
We used Research Electronic Data Capture (REDCap) software to build and disseminate the survey via email. Surveys were initially disseminated in late January 2019. During the 3-month survey period, recipients received 3 automated email reminders from REDCap to complete the survey. Survey data were exported from REDCap. Results were analyzed using descriptive statistics analyses with Microsoft Excel.
Results
One respondent received the survey in error and was excluded from the analysis. The survey response rate was 16.7%: 372 responses from 103 unique facilities. Each VISN had a mean 20 respondents. The majority of respondents (n = 286, 76.9%) worked in highly complex level 1 facilities characterized by high patient volume and more high-risk patients and were teaching and research facilities. Respondents were asked to describe their most recent ED or UCC role. While 281 respondents (75.5%) were medical doctors, 61 respondents (16.4%) were NPs, 30 (8.1%) were PAs, and 26 (7.0%) were ED/UCC chiefs or medical directors (Table 1). Most respondents (80.4%) reported at least 10 years of health care experience.
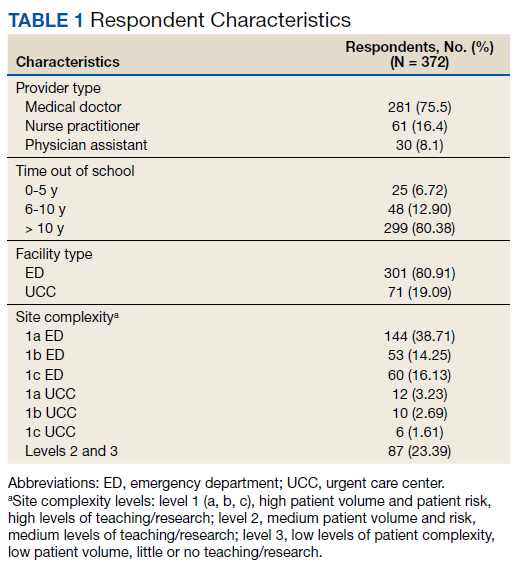
The majority of respondents (72.9%) believed that HCPs at their VHA facility should be prescribing naloxone. When asked to specify which HCPs should be prescribing naloxone, most HCP respondents selected pharmacists (76.4%) and substance abuse providers (71.6%). Less than half of respondents (45.0%) felt that VA ED/UCC providers also should be prescribing naloxone. However, 58.1% of most HCP respondents reported being comfortable or very comfortable with prescribing naloxone to a patient in the ED or UCC who already had an existing prescription of opioids. Similarly, 52.7% of respondents reported being comfortable or very comfortable with coprescribing naloxone when discharging a patient with an opioid prescription from the ED/UCC. Notably, while 36.7% of PAs reported being comfortable/very comfortable coprescribing naloxone, 46.7% reported being comfortable/very comfortable prescribing naloxone to a patient with an existing opioid prescription. Physicians and NPs expressed similar levels of comfort with coprescribing and prescribing naloxone.
Respondents across provider types indicated a number of barriers to prescribing naloxone to medically appropriate patients (Table 2). Many respondents indicated prescribing naloxone was beyond the ED/UCC provider scope of practice (35.2%), followed by the perceived stigma associated with naloxone (33.3%), time required to prescribe naloxone (23.9%), and concern with patient’s ability to use naloxone (22.8%).

Facilitators for prescribing naloxone to medically appropriate patients identified by HCP respondents included pharmacist help and education (44.6%), patient knowledge of medication options (31.7%), societal shift away from opioids for pain management (28.0%), facility leadership (26.9%), and patient interest in safe opioid usage (26.6%) (Table 3). In addition, NPs specifically endorsed

Less than 6.8% of HCP respondents indicated that they were comfortable using MAT. Meanwhile, 42.1% of respondents reported being aware of MAT but not familiar with it, and 23.5% reported that they were unaware of MAT. Correspondingly, 301 of the 372 (88.5%) HCP respondents indicated that they had not prescribed MAT in the past year. Across HCP types, only 24.1% indicated that it is the role of VA ED or UCC providers to prescribe MAT when medically appropriate and subsequently refer patients to substance abuse treatment for follow-up (just 7.1% of PAs endorsed this). Furthermore, 6.5% and 18.8% of HCP respondents indicated that their facility leadership was very supportive and supportive, respectively, of MAT for OUD prescribing.
Barriers to MAT initiation indicated by HCP respondents included limited scope of ED and UCC practice (53.2%), unclear follow-up/referral process (50.3%), time (29.8%), and discomfort (28.2%). Nearly one-third of NPs (27.9%) identified patient willingness/ability as a barrier to MAT initiation (Table 4).
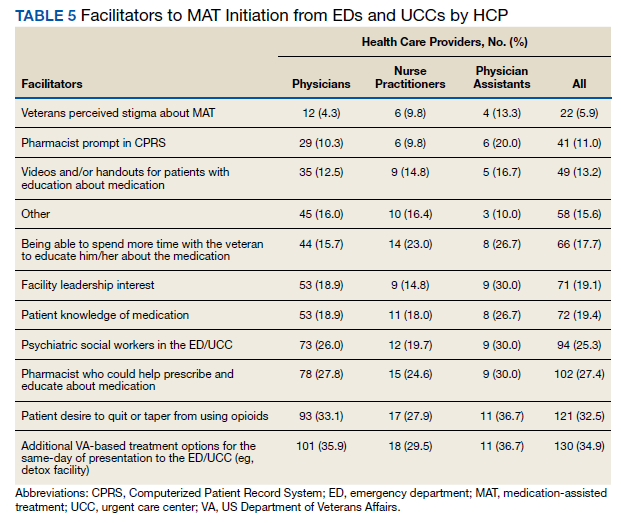

Facilitators of MAT initiation in the ED or UCC included VHA same-day treatment options (34.9%), patient desire (32.5%), pharmacist help/education (27.4%), and psychiatric social workers in the ED or UCC (25.3%). Some NPs (23.0%) and PAs (26.7%) also indicated that having time to educate veterans about the medication would be a facilitator (Table 5). Facility leadership support was considered a facilitator by 30% of PAs.
Discussion
To the best of our knowledge, there have not been any studies examining HCP perceptions of the barriers and facilitators to naloxone distribution or the initiation of MAT in VHA ED and UCCs. Veterans are at an increased risk of overdose when compared with the general population, and increasing access to opioid safety measures (eg, safer prescribing practices, naloxone distribution) and treatment with MAT for OUD across all clinical settings has been a VHA priority.3
National guidance from VHA leadership, the Centers for Disease Control and Prevention (CDC), the US Surgeon General, and the US Department of Health and Human Services (HHS) call for an all-hands-on-deck approach to combatting opioid overdose with naloxone distribution or MAT (such as buprenorphine) initiation.13 VHA ED and UCC settings provide acute outpatient care to patients with medical or psychiatric illnesses or injuries that the patient believes requires emergent or immediate medical attention or for which there is a critical need for treatment to prevent deterioration of the condition or the possible impairment of recovery.14 However, ED and UCC environments are often regarded as settings meant to stabilize a patient until they can be seen by a primary care or long-term care provider.
A major barrier identified by HCPs was that MAT for OUD was outside their ED/UCC scope of practice, which suggests a need for a top-down or peer-to-peer reexamination of the role of HCPs in ED/UCC settings. Any naloxone distribution and/or MAT-initiation program in VHA ED/UCCs should consider education about the role of ED/UCC HCPs in opioid safety and treatment.
Only 25.3% of HCPs reported that their facility leadership was supportive or very supportive of MAT prescribing. This suggests that facility leadership should be engaged in any efforts to implement a MAT-initiation program in the facility’s ED. Engaging leadership in efforts to implement ED-based MAT programs will allow for a better understanding of leadership goals as related to opioid safety and an opportunity to address concerns regarding prescribing MAT in the ED. We recommend engaging facility leadership early in MAT implementation efforts. Respectively, 12.4% and 28.2% of HCP respondents reported discomfort prescribing naloxone or using MAT, suggesting a need for more education. Similarly, only 6.8% of HCPs reported comfort with using MAT.
A consideration for implementing ED/UCC-based MAT should be the inclusion of a training component. An evidence-based clinical treatment pathway that is appropriate to the ED/UCC setting and facility on the administration of MAT also could be beneficial. A clinical treatment pathway that includes ED/UCC-initiated discharge recommendations would address HCP concerns of unclear follow-up plans and system for referral of care. To this end, a key implementation task is coordinating with other outpatient services (eg, pain management clinic, substance use disorder treatment clinic) equipped for long-term patient follow-up to develop a system for referral of care. For example, as part of the clinical treatment pathway, an ED can develop a system of referral for patients initiated on MAT in the ED in which patients are referred for follow-up at the facility’s substance use disorder treatment clinic to be seen within 72 hours to continue the administration of MAT (such as buprenorphine).
In addition to HCP education, results suggest that patient/veteran education regarding naloxone and/or MAT should be considered. HCPs indicated that having help from a pharmacist to educate the patient about the medications would be a facilitator to naloxone distribution and MAT initiation. Similarly, patient knowledge of the medications also was endorsed as a facilitator. As such, a consideration for any future ED/UCC-based naloxone distribution or MAT-initiation programs in the VHA should be patient education whether by a clinically trained professional or an educational campaign for veterans.
Expanded naloxone distribution and initiation of MAT for OUD for EDs/UCCs across the VHA could impact the lives of veterans on long-term opioid therapy, with OUD, or who are otherwise at risk for opioid overdose. Steps taken to address the barriers and leverage the facilitators identified by HCP respondents can greatly reduce current obstacles to widespread implementation of ED/UCC-based naloxone distribution and MAT initiation nationally within the VHA.
Limitations
This survey had a low response rate (16.7%). One potential explanation for the low response rate is that when the survey was deployed, many of the VHA ED/UCC physicians were per-diem employees. Per-diem physicians may be less engaged and aware of site facilitators or barriers to naloxone and MAT prescribing. This, too, may have potentially skewed the collected data. However, the survey did not ask HCPs to disclose their employment status; thus, exact rates of per diem respondents are unknown.
We aimed to capture only self-perceived barriers to prescribing naloxone and MAT in the ED, but we did not capture or measure HCP respondent’s actual prescribing rates of MAT or naloxone. Understanding HCP perceptions of naloxone distribution and MAT initiation in the ED may have been further informed by comparing HCP responses to their actual clinical practice as related to their prescribing of these medications. In future research, we will link HCPs with the actual numbers of naloxone and MAT medications prescribed. Additionally, we do not know how many of these barriers or proposed facilitators will impact clinical practice.
Conclusions
A key aim for VHA leadership is to increase veteran access to naloxone distribution and MAT for OUD across clinical areas. The present study aimed to identify HCP perceptions of barriers and facilitators to the naloxone distribution and MAT-initiation programs in VHA ED/UCCs to inform the development of a targeted QI program to implement these opioid safety measures. Although the survey yielded a low response rate, results allowed us to identify important action items for our QI program, such as the development of clear protocols, follow-up plans, and systems for referral of care and HCP educational materials related to MAT and naloxone. We hope this work will serve as the basis for ED/UCC-tailored programs that can provide customized educational programs for HCPs designed to overcome known barriers to naloxone and MAT initiation.
Acknowledgments
This work was supported by the VA Office of Specialty Care Services 10P11 and through funding provided by the Comprehensive Addiction and Recovery Act (CARA).
1. Substance Abuse and Mental Health Services Administration. Key substance use and mental health indicators in the united states: results from the 2018 National Survey on Drug Use and Health. Published August 2019. Accessed August 20, 2021. https://www.samhsa.gov/data/sites/default/files/cbhsq-reports/NSDUHNationalFindingsReport2018/NSDUHNationalFindingsReport2018.pdf
2. Bohnert AS, Ilgen MA, Galea S, McCarthy JF, Blow FC. Accidental poisoning mortality among patients in the Department of Veterans Affairs Health System. Med Care. 2011;49(4):393-396. doi:10.1097/MLR.0b013e318202aa27
3. US Department of Veterans Affairs, Pharmacy Benefits Management Service. Recommendations for issuing naloxone rescue for the VA opioid overdose education and naloxone distribution (OEND) program. Published August 2016. Accessed August 20, 2021. https://www.pbm.va.gov/PBM/clinicalguidance/clinicalrecommendations/Naloxone_HCl_Rescue_Kits_Recommendations_for_Use.pdf
4. US Department of Defense, US Department of Veterans Affairs, Opioid Therapy for Chronic Pain Work Group. VA/DoD clinical practice guideline for opioid therapy for chronic pain. Published February 2017. Accessed August 20, 2021. https://www.va.gov/HOMELESS/nchav/resources/docs/mental-health/substance-abuse/VA_DoD-CLINICAL-PRACTICE-GUIDELINE-FOR-OPIOID-THERAPY-FOR-CHRONIC-PAIN-508.pdf
5. Barnett ML, Olenski AR, Jena AB. Opioid-prescribing patterns of emergency physicians and risk of long-term use. N Engl J Med. 2017;376(7):663-673. doi:10.1056/NEJMsa1610524
6. Shah A, Hayes CJ, Martin BC. Characteristics of initial prescription episodes and likelihood of long-term opioid use - United States, 2006-2015. MMWR Morb Mortal Wkly Rep. 2017;66(10):265-269. Published 2017 Mar 17. doi:10.15585/mmwr.mm6610a1
7. Clark AK, Wilder CM, Winstanley EL. A systematic review of community opioid overdose prevention and naloxone distribution programs. J Addict Med. 2014;8(3):153-163. doi:10.1097/ADM.0000000000000034
8. Coffin PO, Behar E, Rowe C, et al. Nonrandomized intervention study of naloxone coprescription for primary care patients receiving long-term opioid therapy for Pain. Ann Intern Med. 2016;165(4):245-252. doi:10.7326/M15-2771
9. Ma J, Bao YP, Wang RJ, et al. Effects of medication-assisted treatment on mortality among opioids users: a systematic review and meta-analysis. Mol Psychiatry. 2019;24(12):1868-1883. doi:10.1038/s41380-018-0094-5
10. D’Onofrio G, O’Connor PG, Pantalon MV, et al. Emergency department-initiated buprenorphine/naloxone treatment for opioid dependence: a randomized clinical trial. JAMA. 2015;313(16):1636-1644. doi:10.1001/jama.2015.3474
11. Dieujuste N, Johnson-Koenke R, Christopher M, et al. Feasibility study of a quasi-experimental regional opioid safety prescribing program in Veterans Health Administration emergency departments. Acad Emerg Med. 2020;27(8):734-741. doi:10.1111/acem.13980
12. Mackey K, Veazie S, Anderson J, Bourne D, Peterson K. Evidence brief: barriers and facilitators to use of medications for opioid use disorder. Published July 2017. Accessed August 20, 2021. http://www.ncbi.nlm.nih.gov/books/NBK549203/
13. US Department of Health and Human Services, Office of the Surgeon General. Naloxone: the opioid reversal drug that saves lives. Published December 2018. Accessed August 20, 2021. https://www.hhs.gov/opioids/sites/default/files/2018-12/naloxone-coprescribing-guidance.pdf
14. US Department of Veterans Affairs, Veterans Health Administration. Chapter 256: Emergency department (ED) and urgent care clinic (UCC). Updated October 3, 2016. Accessed August 20, 2021. https://www.cfm.va.gov/til/space/spChapter256.pdf.
The United States is facing an opioid crisis in which approximately 10 million people have misused opioids in the past year, and an estimated 2 million people have an opioid use disorder (OUD).1 Compared with the general population, veterans treated in the Veterans Health Administration (VHA) facilities are at nearly twice the risk for accidental opioid overdose.2 The implementation of opioid safety measures in VHA facilities across all care settings is a priority in addressing this public health crisis. Hence, VHA leadership is working to minimize veteran risk of fatal opioid overdoses and to increase veteran access to medication-assisted treatments (MAT) for OUD.3
Since the administration of our survey, the VHA has shifted to using the term medication for opioid use disorder (MOUD) instead of MAT for OUD. However, for consistency with the survey we distributed, we use MAT in this analysis.
Acute care settings represent an opportunity to offer appropriate opioid care and treatment options to patients at risk for OUD or opioid-related overdose. VHA facilities offer 2 outpatient acute care settings for emergent ambulatory care: emergency departments (EDs) and urgent care centers (UCCs). Annually, these settings see an estimated 2.5 million patients each year, making EDs and UCCs critical access points of OUD care for veterans. Partnering with key national VHA stakeholders from Pharmacy Benefits Management (PBM), the Office of Emergency Medicine, and Academic Detailing Services (ADS), we developed the Emergency Department Opioid Safety Initiative (ED OSI) aimed at implementing and evaluating opioid safety measures in VHA outpatient acute care settings.
The US Department of Veterans Affairs (VA)/Department of Defense (DoD) Clinical Practice Guidelines for Opioid Therapy for Chronic Pain (CPG) makes recommendations for the initiation and continuation of opioids, risk mitigation, taper of opioids, and opioid therapy for acute pain in VHA facilities.4 Using these recommendations, we developed the broad aims of the ED OSI quality improvement (QI) program. The CPG is clear about the prioritization of safe opioid prescribing practices. New opioid prescriptions written in the ED have been associated with continued and chronic opioid use.5 At the time of prescription, patients not currently and chronically on opioids who receive more than a 3-day supply are at increased risk of becoming long-term opioid users.6 Given the annual volume of patients seen, VHA ED/UCCs are a crucial area for implementing better opioid prescribing practices.
The CPG also includes recommendations for the prescribing or coprescribing of naloxone rescue kits. The administration of naloxone following opioid overdose has been found to be an effective measure against fatal overdose. Increasing provider awareness of common risk factors for opioid-related overdose (eg, frequent ED visits or hospitalizations) helps facilitate a discussion on naloxone prescribing at discharge. Prior studies provide evidence that naloxone distribution and accompanying education also are effective in reducing opioid overdose mortalityand ED visits related to adverse opioid-related events.7,8
Similarly, the guidelines provide recommendations for the use of MAT for veterans with OUD. MAT for OUD is considered a first-line treatment option for patients with moderate-to-severe OUD. When used to treat patients with unsafe opioid use, this treatment helps alleviate symptoms of withdrawal, which can increase opioid taper adherence and has a protective effect against opioid overdose mortality.9 MAT initiated in the ED can increase patient engagement to addiction services.10
These 3 CPG recommendations serve as the basis for the broad goals of the ED OSI program. We aim to develop, implement, and evaluate programs and initiatives to (aim 1) reduce inappropriate opioid prescribing from VHA EDs; (aim 2) increase naloxone distribution from VHA EDs; and (aim 3) increase access to MAT initiation from VHA EDs through the implementation of ED-based MAT-initiation programs with EDs across the VHA. Aim 1 was a focused and strategic QI effort to implement an ED-based program to reduce inappropriate opioid prescribing. The ED OSI prescribing program offered a 4-step bundled approach: (1) sharing of opioid prescribing dashboard data with ED medical director and academic detailer; (2) education of ED providers and implementation of toolkit resources; (3) academic detailers conduct audit and feedback session(s) with highest prescribers; and (4) quarterly reports of opioid prescribing data to ED providers.
Results from the pilot suggested that our program was associated with accelerating the rate at which ED prescribing rates decreased.11 In addition, the pilot found that ED-based QI initiatives in VHA facilities are a feasible practice. As we work to develop and implement the next 2 phases of the QI program, a major consideration is to identify facilitators and address any existing barriers to the implementation of naloxone distribution (aim 2) and MAT-initiation (aim 3) programs for treatment-naïve patients from VHA EDs. To date, there have been no recent published studies examining the barriers and facilitators to use or implementation of MAT initiation or naloxone distribution in VHA facilities or, more specifically, from VHA EDs.12 As part of our QI program, we set out to better understand VHA ED provider perceptions of barriers and facilitators to implementation of programs aimed at increasing naloxone distribution and initiation of MAT for treatment-naïve patients in the ED.
Methods
This project received a QI designation from the Office of PBM Academic Detailing Service Institutional Review Board at the Edward Hines, Jr. Veterans Affairs Hospital VA Medical Center (VAMC). This designation was reviewed and approved by the Rocky Mountain Regional VAMC Research and Development service. In addition, we received national union approval to disseminate this survey nationally across all VA Integrated Service Networks (VISNs).
Survey
We worked with VHA subject matter experts, key stakeholders, and the VA Collaborative Evaluation Center (VACE) to develop the survey. Subject matter experts and stakeholders included VHA emergency medicine leadership, ADS leadership, and mental health and substance treatment providers. VACE is an interdisciplinary group of mixed-method researchers. The survey questions aimed to capture perceptions and experiences regarding naloxone distribution and new MAT initiation of VHA ED/UCC providers.
We used a variety of survey question formats. Close-ended questions with a predefined list of answer options were used to capture discrete domains, such as demographic information, comfort level, and experience level. To capture health care provider (HCP) perceptions on barriers and facilitators, we used multiple-answer multiple-choice questions. Built into this question format was a free-response option, which allowed respondents to offer additional barriers or facilitators. Respondents also had the option of not answering individual questions.
We identified physicians, nurse practitioners (NPs), and physician assistants (PAs) who saw at least 100 patients in the ED or UCC in at least one 3-month period in the prior year and obtained an email address for each. In total, 2228 ED or UCC providers across 132 facilities were emailed a survey; 1883 (84.5%) were ED providers and 345 (15.5%) were UCC providers.
We used Research Electronic Data Capture (REDCap) software to build and disseminate the survey via email. Surveys were initially disseminated in late January 2019. During the 3-month survey period, recipients received 3 automated email reminders from REDCap to complete the survey. Survey data were exported from REDCap. Results were analyzed using descriptive statistics analyses with Microsoft Excel.
Results
One respondent received the survey in error and was excluded from the analysis. The survey response rate was 16.7%: 372 responses from 103 unique facilities. Each VISN had a mean 20 respondents. The majority of respondents (n = 286, 76.9%) worked in highly complex level 1 facilities characterized by high patient volume and more high-risk patients and were teaching and research facilities. Respondents were asked to describe their most recent ED or UCC role. While 281 respondents (75.5%) were medical doctors, 61 respondents (16.4%) were NPs, 30 (8.1%) were PAs, and 26 (7.0%) were ED/UCC chiefs or medical directors (Table 1). Most respondents (80.4%) reported at least 10 years of health care experience.
The majority of respondents (72.9%) believed that HCPs at their VHA facility should be prescribing naloxone. When asked to specify which HCPs should be prescribing naloxone, most HCP respondents selected pharmacists (76.4%) and substance abuse providers (71.6%). Less than half of respondents (45.0%) felt that VA ED/UCC providers also should be prescribing naloxone. However, 58.1% of most HCP respondents reported being comfortable or very comfortable with prescribing naloxone to a patient in the ED or UCC who already had an existing prescription of opioids. Similarly, 52.7% of respondents reported being comfortable or very comfortable with coprescribing naloxone when discharging a patient with an opioid prescription from the ED/UCC. Notably, while 36.7% of PAs reported being comfortable/very comfortable coprescribing naloxone, 46.7% reported being comfortable/very comfortable prescribing naloxone to a patient with an existing opioid prescription. Physicians and NPs expressed similar levels of comfort with coprescribing and prescribing naloxone.
Respondents across provider types indicated a number of barriers to prescribing naloxone to medically appropriate patients (Table 2). Many respondents indicated prescribing naloxone was beyond the ED/UCC provider scope of practice (35.2%), followed by the perceived stigma associated with naloxone (33.3%), time required to prescribe naloxone (23.9%), and concern with patient’s ability to use naloxone (22.8%).
Facilitators for prescribing naloxone to medically appropriate patients identified by HCP respondents included pharmacist help and education (44.6%), patient knowledge of medication options (31.7%), societal shift away from opioids for pain management (28.0%), facility leadership (26.9%), and patient interest in safe opioid usage (26.6%) (Table 3). In addition, NPs specifically endorsed
Less than 6.8% of HCP respondents indicated that they were comfortable using MAT. Meanwhile, 42.1% of respondents reported being aware of MAT but not familiar with it, and 23.5% reported that they were unaware of MAT. Correspondingly, 301 of the 372 (88.5%) HCP respondents indicated that they had not prescribed MAT in the past year. Across HCP types, only 24.1% indicated that it is the role of VA ED or UCC providers to prescribe MAT when medically appropriate and subsequently refer patients to substance abuse treatment for follow-up (just 7.1% of PAs endorsed this). Furthermore, 6.5% and 18.8% of HCP respondents indicated that their facility leadership was very supportive and supportive, respectively, of MAT for OUD prescribing.
Barriers to MAT initiation indicated by HCP respondents included limited scope of ED and UCC practice (53.2%), unclear follow-up/referral process (50.3%), time (29.8%), and discomfort (28.2%). Nearly one-third of NPs (27.9%) identified patient willingness/ability as a barrier to MAT initiation (Table 4).
Facilitators of MAT initiation in the ED or UCC included VHA same-day treatment options (34.9%), patient desire (32.5%), pharmacist help/education (27.4%), and psychiatric social workers in the ED or UCC (25.3%). Some NPs (23.0%) and PAs (26.7%) also indicated that having time to educate veterans about the medication would be a facilitator (Table 5). Facility leadership support was considered a facilitator by 30% of PAs.
Discussion
To the best of our knowledge, there have not been any studies examining HCP perceptions of the barriers and facilitators to naloxone distribution or the initiation of MAT in VHA ED and UCCs. Veterans are at an increased risk of overdose when compared with the general population, and increasing access to opioid safety measures (eg, safer prescribing practices, naloxone distribution) and treatment with MAT for OUD across all clinical settings has been a VHA priority.3
National guidance from VHA leadership, the Centers for Disease Control and Prevention (CDC), the US Surgeon General, and the US Department of Health and Human Services (HHS) call for an all-hands-on-deck approach to combatting opioid overdose with naloxone distribution or MAT (such as buprenorphine) initiation.13 VHA ED and UCC settings provide acute outpatient care to patients with medical or psychiatric illnesses or injuries that the patient believes requires emergent or immediate medical attention or for which there is a critical need for treatment to prevent deterioration of the condition or the possible impairment of recovery.14 However, ED and UCC environments are often regarded as settings meant to stabilize a patient until they can be seen by a primary care or long-term care provider.
A major barrier identified by HCPs was that MAT for OUD was outside their ED/UCC scope of practice, which suggests a need for a top-down or peer-to-peer reexamination of the role of HCPs in ED/UCC settings. Any naloxone distribution and/or MAT-initiation program in VHA ED/UCCs should consider education about the role of ED/UCC HCPs in opioid safety and treatment.
Only 25.3% of HCPs reported that their facility leadership was supportive or very supportive of MAT prescribing. This suggests that facility leadership should be engaged in any efforts to implement a MAT-initiation program in the facility’s ED. Engaging leadership in efforts to implement ED-based MAT programs will allow for a better understanding of leadership goals as related to opioid safety and an opportunity to address concerns regarding prescribing MAT in the ED. We recommend engaging facility leadership early in MAT implementation efforts. Respectively, 12.4% and 28.2% of HCP respondents reported discomfort prescribing naloxone or using MAT, suggesting a need for more education. Similarly, only 6.8% of HCPs reported comfort with using MAT.
A consideration for implementing ED/UCC-based MAT should be the inclusion of a training component. An evidence-based clinical treatment pathway that is appropriate to the ED/UCC setting and facility on the administration of MAT also could be beneficial. A clinical treatment pathway that includes ED/UCC-initiated discharge recommendations would address HCP concerns of unclear follow-up plans and system for referral of care. To this end, a key implementation task is coordinating with other outpatient services (eg, pain management clinic, substance use disorder treatment clinic) equipped for long-term patient follow-up to develop a system for referral of care. For example, as part of the clinical treatment pathway, an ED can develop a system of referral for patients initiated on MAT in the ED in which patients are referred for follow-up at the facility’s substance use disorder treatment clinic to be seen within 72 hours to continue the administration of MAT (such as buprenorphine).
In addition to HCP education, results suggest that patient/veteran education regarding naloxone and/or MAT should be considered. HCPs indicated that having help from a pharmacist to educate the patient about the medications would be a facilitator to naloxone distribution and MAT initiation. Similarly, patient knowledge of the medications also was endorsed as a facilitator. As such, a consideration for any future ED/UCC-based naloxone distribution or MAT-initiation programs in the VHA should be patient education whether by a clinically trained professional or an educational campaign for veterans.
Expanded naloxone distribution and initiation of MAT for OUD for EDs/UCCs across the VHA could impact the lives of veterans on long-term opioid therapy, with OUD, or who are otherwise at risk for opioid overdose. Steps taken to address the barriers and leverage the facilitators identified by HCP respondents can greatly reduce current obstacles to widespread implementation of ED/UCC-based naloxone distribution and MAT initiation nationally within the VHA.
Limitations
This survey had a low response rate (16.7%). One potential explanation for the low response rate is that when the survey was deployed, many of the VHA ED/UCC physicians were per-diem employees. Per-diem physicians may be less engaged and aware of site facilitators or barriers to naloxone and MAT prescribing. This, too, may have potentially skewed the collected data. However, the survey did not ask HCPs to disclose their employment status; thus, exact rates of per diem respondents are unknown.
We aimed to capture only self-perceived barriers to prescribing naloxone and MAT in the ED, but we did not capture or measure HCP respondent’s actual prescribing rates of MAT or naloxone. Understanding HCP perceptions of naloxone distribution and MAT initiation in the ED may have been further informed by comparing HCP responses to their actual clinical practice as related to their prescribing of these medications. In future research, we will link HCPs with the actual numbers of naloxone and MAT medications prescribed. Additionally, we do not know how many of these barriers or proposed facilitators will impact clinical practice.
Conclusions
A key aim for VHA leadership is to increase veteran access to naloxone distribution and MAT for OUD across clinical areas. The present study aimed to identify HCP perceptions of barriers and facilitators to the naloxone distribution and MAT-initiation programs in VHA ED/UCCs to inform the development of a targeted QI program to implement these opioid safety measures. Although the survey yielded a low response rate, results allowed us to identify important action items for our QI program, such as the development of clear protocols, follow-up plans, and systems for referral of care and HCP educational materials related to MAT and naloxone. We hope this work will serve as the basis for ED/UCC-tailored programs that can provide customized educational programs for HCPs designed to overcome known barriers to naloxone and MAT initiation.
Acknowledgments
This work was supported by the VA Office of Specialty Care Services 10P11 and through funding provided by the Comprehensive Addiction and Recovery Act (CARA).
1. Substance Abuse and Mental Health Services Administration. Key substance use and mental health indicators in the united states: results from the 2018 National Survey on Drug Use and Health. Published August 2019. Accessed August 20, 2021. https://www.samhsa.gov/data/sites/default/files/cbhsq-reports/NSDUHNationalFindingsReport2018/NSDUHNationalFindingsReport2018.pdf
2. Bohnert AS, Ilgen MA, Galea S, McCarthy JF, Blow FC. Accidental poisoning mortality among patients in the Department of Veterans Affairs Health System. Med Care. 2011;49(4):393-396. doi:10.1097/MLR.0b013e318202aa27
3. US Department of Veterans Affairs, Pharmacy Benefits Management Service. Recommendations for issuing naloxone rescue for the VA opioid overdose education and naloxone distribution (OEND) program. Published August 2016. Accessed August 20, 2021. https://www.pbm.va.gov/PBM/clinicalguidance/clinicalrecommendations/Naloxone_HCl_Rescue_Kits_Recommendations_for_Use.pdf
4. US Department of Defense, US Department of Veterans Affairs, Opioid Therapy for Chronic Pain Work Group. VA/DoD clinical practice guideline for opioid therapy for chronic pain. Published February 2017. Accessed August 20, 2021. https://www.va.gov/HOMELESS/nchav/resources/docs/mental-health/substance-abuse/VA_DoD-CLINICAL-PRACTICE-GUIDELINE-FOR-OPIOID-THERAPY-FOR-CHRONIC-PAIN-508.pdf
5. Barnett ML, Olenski AR, Jena AB. Opioid-prescribing patterns of emergency physicians and risk of long-term use. N Engl J Med. 2017;376(7):663-673. doi:10.1056/NEJMsa1610524
6. Shah A, Hayes CJ, Martin BC. Characteristics of initial prescription episodes and likelihood of long-term opioid use - United States, 2006-2015. MMWR Morb Mortal Wkly Rep. 2017;66(10):265-269. Published 2017 Mar 17. doi:10.15585/mmwr.mm6610a1
7. Clark AK, Wilder CM, Winstanley EL. A systematic review of community opioid overdose prevention and naloxone distribution programs. J Addict Med. 2014;8(3):153-163. doi:10.1097/ADM.0000000000000034
8. Coffin PO, Behar E, Rowe C, et al. Nonrandomized intervention study of naloxone coprescription for primary care patients receiving long-term opioid therapy for Pain. Ann Intern Med. 2016;165(4):245-252. doi:10.7326/M15-2771
9. Ma J, Bao YP, Wang RJ, et al. Effects of medication-assisted treatment on mortality among opioids users: a systematic review and meta-analysis. Mol Psychiatry. 2019;24(12):1868-1883. doi:10.1038/s41380-018-0094-5
10. D’Onofrio G, O’Connor PG, Pantalon MV, et al. Emergency department-initiated buprenorphine/naloxone treatment for opioid dependence: a randomized clinical trial. JAMA. 2015;313(16):1636-1644. doi:10.1001/jama.2015.3474
11. Dieujuste N, Johnson-Koenke R, Christopher M, et al. Feasibility study of a quasi-experimental regional opioid safety prescribing program in Veterans Health Administration emergency departments. Acad Emerg Med. 2020;27(8):734-741. doi:10.1111/acem.13980
12. Mackey K, Veazie S, Anderson J, Bourne D, Peterson K. Evidence brief: barriers and facilitators to use of medications for opioid use disorder. Published July 2017. Accessed August 20, 2021. http://www.ncbi.nlm.nih.gov/books/NBK549203/
13. US Department of Health and Human Services, Office of the Surgeon General. Naloxone: the opioid reversal drug that saves lives. Published December 2018. Accessed August 20, 2021. https://www.hhs.gov/opioids/sites/default/files/2018-12/naloxone-coprescribing-guidance.pdf
14. US Department of Veterans Affairs, Veterans Health Administration. Chapter 256: Emergency department (ED) and urgent care clinic (UCC). Updated October 3, 2016. Accessed August 20, 2021. https://www.cfm.va.gov/til/space/spChapter256.pdf.
Implementation of a Pharmacist-Led Culture and Susceptibility Review System in Urgent Care and Outpatient Settings
Increasing antibiotic resistance is an urgent threat to public health and establishing a review service for antibiotics could alleviate this problem. As use of antibiotics escalates, the risk of resistance becomes increasingly important. Each year, approximately 269 million antibiotics are dispensed and at least 30% are prescribed inappropriately.1 In addition to inappropriate prescribing, increased antibiotic resistance can be caused by patients not completing an antibiotic course as recommended or inherent bacterial mutations. According to the Centers for Disease Control and Prevention, each year approximately 3 million individuals contract an antibiotic-resistant infection.2 By 2050, it is projected that drug-resistant conditions could cause 300 million deaths and might be as disastrous to the economy as the 2008 global financial crisis.3 Ensuring appropriate use of antibiotic therapy through antimicrobial stewardship can help combat this significant public health issue.
Antimicrobial stewardship promotes appropriate use of antimicrobials to improve patient outcomes, reduce health care costs, and decrease antimicrobial resistance. One study found that nearly 50% of patients discharged from the emergency department with antibiotics required therapy modification after culture and susceptibility results were returned.4 Both the Infectious Disease Society of America (IDSA) and the Society for Healthcare Epidemiology of America (SHEA) support incorporating a clinical pharmacist into culture reviews.3 Several institutions have implemented a pharmacist-led culture review service to improve antibiotic usage, which has shown positive results. A retrospective case-control study at University of Rochester Medical Center showed reduced time to positive culture review and to patient or health care provider (HCP) notification when emergency medicine pharmacists were involved in culture review.5 A retrospective study at Carolinas Medical Center-Northeast showed 12% decreased readmission rate using pharmacist-implemented culture review compared with HCP review.6 Results from previous studies showed an overall improvement in patient safety through decreased use of inappropriate agents and reduced time on inappropriate antibiotic therapy.
Establishing a pharmacist-led culture review service at the Carl Vinson Veterans Affairs Medical Center (CVVAMC) in Dublin, Georgia, could decrease the time to review of positive culture results, time to patient or HCP notification, and readmission rates. CVVAMC provides outpatient primary care services to about 30,000 veterans in the central and southern regions of Georgia. Our facility has executed an antimicrobial stewardship program based on guidelines published in 2016 by IDSA and SHEA to guide optimal use of antibiotics. Clinical pharmacists play an active role in antimicrobial stewardship throughout the facility. Clinical responsibilities of the antimicrobial stewardship pharmacist include assessing therapy for inappropriate dual anaerobic coverage, evaluating inpatient culture results within 48 hours, dosing and monitoring antibiotic therapy, including vancomycin and aminoglycosides, and implementing IV to by-mouth conversions for appropriate patients. HCPs involved with antimicrobial stewardship could order an array of tests to assess a veteran’s condition, including cultures, when an infection is suspected.
Culture results take about 3 to 5 days, then HCPs evaluate the result to ensure current antibiotic therapy is appropriate. Patients might not receive timely follow-up because HCPs often have many laboratory alerts to sift through every day, and a protocol is not in place for pharmacists to adjust outpatient antimicrobial regimens based on culture results. Before implementing this project, there was no outpatient service for pharmacists to impact culture and susceptibility review. This project was initiated because a lead physician identified difficulty reviewing culture and susceptibility results. HCPs often work on rotating schedules, and there was a concern about possible delay in follow-up of results if a HCP was not scheduled to work for a period of time.
The purpose of this project was to implement an outpatient, pharmacist-managed culture and susceptibility review service to improve patient outcomes, including decreasing and preventing inappropriate antibiotic use. The primary objective was to design and implement a pharmacist-led review service to intervene in cases of mismatched antibiotic bacteria combinations. Secondary objectives included identifying most common culture types and organisms encountered and intervened on at our facility.
Quality Improvement Project
This quality improvement project was approved by the CVVAMC Pharmacy and Therapeutics Committee. Members of the medical review board signed a care coordination agreement between pharmacy and outpatient HCPs to permit pharmacist interventions involving optimization of antibiotic therapy. This agreement allowed pharmacists to make changes to existing antimicrobial regimens within their scope of practice (SOP) without requiring discussion with HCPs. A protocol was also developed to guide pharmacist modification of antimicrobial therapy based on current antimicrobial guidelines.7 This protocol was based on commonly isolated organisms and local resistance patterns and provided guidance for antibiotic treatment based on culture type (ie, skin and soft tissue infection, urine, etc). Computerized Patient Record System (CPRS) note templates were also developed for interventions performed, and patient follow-up after antibiotic regimens were completed (eAppendix 1
Program Inclusion
Veterans were included in this project if they presented to primary care or urgent care clinics for therapy; had positive culture and sensitivity results; and were prescribed an empiric antibiotic. Veterans were not eligible for this project if they were not receiving antibiotic therapy, with or without pending or resulted culture results shown in CPRS.
Implementation
Data gathered through a CPRS dashboard from August 2019 to February 2020 identified patients with pending or completed culture results in urgent care and primary care settings (eAppendix 4). The dashboard was created specifically for this project to show patient details that included initial antibiotic(s) prescribed and preliminary and final culture results. After a mismatched combination was identified, pharmacists contacted patients and assessed symptoms. If a patient was still symptomatic, the pharmacist changed the antibiotic regimen and educated the patient about this change. The pharmacist documented an intervention note in CPRS and added the HCP as a signer so he or she would be aware of the change. The clinical pharmacist followed up after regimens were complete. At this time, the pharmacist assessed patients to ensure the medication was taken as directed (eg, number of days of therapy, how many tablets per day, etc), to discuss any reported adverse effects, and to assess resolution of symptoms. If a patient still had symptoms, the pharmacist contacted the patient’s primary care provider. If the veteran could not be contacted after 3 consecutive attempts via phone, a certified letter was mailed. If patients were asymptomatic at the time of the call, the pharmacist documented the lack of symptoms and added the HCP as a signer for awareness purposes. HCPs continued to practice as usual while this service was implemented.

Observations
Using the culture and susceptibility dashboard, the pharmacist identified 675 patients as having a pending culture (Table 1). Among these patients, 320 results were positive, and were taking antibiotics empirically. Out of the 320 patients who met inclusion criteria, 10 required pharmacist intervention. After contacting the veterans, 7 required regimen changes because their current antibiotic was not susceptible to the isolated organism. Three additional patients were contacted because of a mismatch between the empiric antibiotic and culture result. Antibiotic therapy was not modified because these patients were asymptomatic at the time the clinical pharmacist contacted them. These patient cases were discussed with the HCP before documenting the intervention to prevent initiation of unwarranted antibiotics.


Most of the modified antimicrobial regimens were found in urine cultures from symptomatic patients (Table 2). Of the 7 patients requiring therapy change because of a mismatch antibiotic–bacteria combination, 4 were empirically prescribed fluoroquinolones, 2 received levofloxacin, and 2 were prescribed ciprofloxacin. According to the most recent antibiogram at our facility, some organisms are resistant to fluoroquinolones, specifically Proteus mirabilis (P mirabilis) and Escherichia coli (E coli). These pathogens were the cause of urinary tract infections in 3 of 4 patients with fluoroquinolone prescriptions.
Through the CPRS dashboard, the pharmacist inadvertently identified 4 patients with positive culture results who were not on antibiotic therapy. These patients were contacted by telephone, and antibiotics were initiated for symptomatic patients after consultation with the HCP. The primary culture type intervened on was urine in 12 of 14 cases (86%). The other 2 culture types included oropharynx culture (7%) positive for an acute bacterial respiratory tract infection caused by group C Streptococcus and a stool culture (7%) positive for Pseudomonas aeruginosa (P aeruginosa). E coli (36%) was isolated in 5 cases and was the most commonly isolated organism. P
Discussion
This project was an innovative antimicrobial stewardship endeavor that helped initiate antibiotic interventions quickly and improve patient outcomes. The antimicrobial stewardship pharmacist independently performed interventions for patients without requiring HCP consultation, therefore decreasing HCP burden and possibly reducing time to assessment of culture results.
Limitations
The study results were limited due to its small sample size of antimicrobial interventions. The clinical pharmacist did not contact the patient when the antibiotic prescribed empirically by the HCP was appropriate for the isolated organism. Among the patients contacted, 3 were asymptomatic, did not require further antibiotic therapy, and no intervention was made. Provider education was deemed successful because HCPs did not request further information about the service. However, not all HCPs were provided education because of different shifts and inability to attend educational sessions. Closely working with lead physicians within the facility provided an alternate method for information dissemination.
The care coordination agreement allowed the pharmacist to make changes if patients had a current prescription for an antibiotic. In addition to the changes to antibiotics, this project improved HCP awareness of culture results even in cases of symptomatic patients who were not prescribed therapy. When this occurred, the pharmacist contacted the patient to assess symptoms and then notified the HCP if the patient was symptomatic.
Future Directions
Future endeavors regarding this project include modifying the scope of the service to allow pharmacists to prescribe antibiotics for patients with positive cultures and symptoms without empiric antibiotics in addition to continuing to modify empiric therapy. Additionally, improving dashboard efficiency through changes to include only isolated antibiotic mismatches rather than all antibiotics prescribed and all available cultures would reduce the pharmacists’ time commitment. Expanding to other parts of the medical center, including long-term care facilities and other outpatient clinics, would allow this service to reach more veterans. Integrating this service throughout the medical center will require continued HCP education and modifying care coordination agreements to include these facilities.
On a typical day, 60 to 90 minutes were spent navigating the dashboard and implementing this service. The CPRS dashboard should be modified to streamline patients identified to decrease the daily time commitment. Re-education of HCPs about resistance rates of fluoroquinolones and empirically prescribing these agents also will be completed based on empiric antibiotic interventions made with these agents throughout this project. Discussing HCP viewpoints on this service would be beneficial to ensure HCP satisfaction.
Conclusions
This pharmacy service and antimicrobial stewardship program reduced time patients were on inappropriate antibiotics. Pharmacists reviewed the dashboard daily under the scope of this project, which expedited needed changes and decreased provider burden because pharmacists were able to make changes without interrupting HCPs’ daily tasks, including patient care.
This program may also reduce readmissions. Patients who were still symptomatic were contacted could be given revised medication regimens without the patient returning to the facility for follow-up treatment. An interesting conclusion not included in the current scope of this service was possible reduced time to therapy initiation in cases of positive cultures and symptomatic patients without antibiotic therapy. If this occurred on the dashboard, patient’s symptoms could be assessed, and if symptoms were ongoing, the pharmacist contacted the HCP with a recommended antimicrobial therapy. In these cases, we were able to mail the antibiotic quickly, and many times, on the same day as this intervention through overnight mail. Implementation of a pharmacist-led antimicrobial review service has provided positive results overall for CVVAMC.
Acknowledgment
This material is the result of work supported with resources and the use of the facilities at the Carl Vinson VA Medical Center.
1. Centers for Disease Control and Prevention. Antibiotic use in outpatient settings, 2017: progress and opportunities. Accessed August 19, 2021. https://www.cdc.gov/antibiotic-use/stewardship-report/outpatient.html
2. Centers for Disease Control and Prevention. Antibiotic/antimicrobial resistance. Accessed August 19, 2021. https://www.cdc.gov/drugresistance/index.html
3. Jonas OB, Irwin A, Berthe FCJ, Le Gall FG, Marquez PV. Drug-resistant infections: a threat to our economic future. March 2017. Accessed August 19, 2021. https://documents.worldbank.org/en/publication/documents-reports/documentdetail/323311493396993758/final-report
4. Davis LC, Covey RB, Weston JS, Hu BBY, Laine GA. Pharmacist-driven antimicrobial optimization in the emergency department. Am J Health Syst Pharm. 2016;73(5)(suppl 1):S49-S56. doi:10.2146/sp150036
5. Baker SN, Acquisto NM, Ashley ED, Fairbanks RJ, Beamish SE, Haas CE. Pharmacist-managed antimicrobial stewardship program for patients discharged from the emergency department. J Pharm Pract. 2012;25(2):190-194. doi:10.1177/0897190011420160
6 Randolph TC, Parker A, Meyer L, Zeina R. Effect of a pharmacist-managed culture review process on antimicrobial therapy in an emergency department. Am J Health Syst Pharm. 2011;68(10):916-919. doi:10.2146/ajhp090552
7. Infectious Diseases Society of America. Infectious diseases society of America guidelines 2019. Accessed August 24, 2021. https://www.idsociety.org/practice-guideline/practice-guidelines/#/+/0/date_na_dt/desc
Increasing antibiotic resistance is an urgent threat to public health and establishing a review service for antibiotics could alleviate this problem. As use of antibiotics escalates, the risk of resistance becomes increasingly important. Each year, approximately 269 million antibiotics are dispensed and at least 30% are prescribed inappropriately.1 In addition to inappropriate prescribing, increased antibiotic resistance can be caused by patients not completing an antibiotic course as recommended or inherent bacterial mutations. According to the Centers for Disease Control and Prevention, each year approximately 3 million individuals contract an antibiotic-resistant infection.2 By 2050, it is projected that drug-resistant conditions could cause 300 million deaths and might be as disastrous to the economy as the 2008 global financial crisis.3 Ensuring appropriate use of antibiotic therapy through antimicrobial stewardship can help combat this significant public health issue.
Antimicrobial stewardship promotes appropriate use of antimicrobials to improve patient outcomes, reduce health care costs, and decrease antimicrobial resistance. One study found that nearly 50% of patients discharged from the emergency department with antibiotics required therapy modification after culture and susceptibility results were returned.4 Both the Infectious Disease Society of America (IDSA) and the Society for Healthcare Epidemiology of America (SHEA) support incorporating a clinical pharmacist into culture reviews.3 Several institutions have implemented a pharmacist-led culture review service to improve antibiotic usage, which has shown positive results. A retrospective case-control study at University of Rochester Medical Center showed reduced time to positive culture review and to patient or health care provider (HCP) notification when emergency medicine pharmacists were involved in culture review.5 A retrospective study at Carolinas Medical Center-Northeast showed 12% decreased readmission rate using pharmacist-implemented culture review compared with HCP review.6 Results from previous studies showed an overall improvement in patient safety through decreased use of inappropriate agents and reduced time on inappropriate antibiotic therapy.
Establishing a pharmacist-led culture review service at the Carl Vinson Veterans Affairs Medical Center (CVVAMC) in Dublin, Georgia, could decrease the time to review of positive culture results, time to patient or HCP notification, and readmission rates. CVVAMC provides outpatient primary care services to about 30,000 veterans in the central and southern regions of Georgia. Our facility has executed an antimicrobial stewardship program based on guidelines published in 2016 by IDSA and SHEA to guide optimal use of antibiotics. Clinical pharmacists play an active role in antimicrobial stewardship throughout the facility. Clinical responsibilities of the antimicrobial stewardship pharmacist include assessing therapy for inappropriate dual anaerobic coverage, evaluating inpatient culture results within 48 hours, dosing and monitoring antibiotic therapy, including vancomycin and aminoglycosides, and implementing IV to by-mouth conversions for appropriate patients. HCPs involved with antimicrobial stewardship could order an array of tests to assess a veteran’s condition, including cultures, when an infection is suspected.
Culture results take about 3 to 5 days, then HCPs evaluate the result to ensure current antibiotic therapy is appropriate. Patients might not receive timely follow-up because HCPs often have many laboratory alerts to sift through every day, and a protocol is not in place for pharmacists to adjust outpatient antimicrobial regimens based on culture results. Before implementing this project, there was no outpatient service for pharmacists to impact culture and susceptibility review. This project was initiated because a lead physician identified difficulty reviewing culture and susceptibility results. HCPs often work on rotating schedules, and there was a concern about possible delay in follow-up of results if a HCP was not scheduled to work for a period of time.
The purpose of this project was to implement an outpatient, pharmacist-managed culture and susceptibility review service to improve patient outcomes, including decreasing and preventing inappropriate antibiotic use. The primary objective was to design and implement a pharmacist-led review service to intervene in cases of mismatched antibiotic bacteria combinations. Secondary objectives included identifying most common culture types and organisms encountered and intervened on at our facility.
Quality Improvement Project
This quality improvement project was approved by the CVVAMC Pharmacy and Therapeutics Committee. Members of the medical review board signed a care coordination agreement between pharmacy and outpatient HCPs to permit pharmacist interventions involving optimization of antibiotic therapy. This agreement allowed pharmacists to make changes to existing antimicrobial regimens within their scope of practice (SOP) without requiring discussion with HCPs. A protocol was also developed to guide pharmacist modification of antimicrobial therapy based on current antimicrobial guidelines.7 This protocol was based on commonly isolated organisms and local resistance patterns and provided guidance for antibiotic treatment based on culture type (ie, skin and soft tissue infection, urine, etc). Computerized Patient Record System (CPRS) note templates were also developed for interventions performed, and patient follow-up after antibiotic regimens were completed (eAppendix 1
Program Inclusion
Veterans were included in this project if they presented to primary care or urgent care clinics for therapy; had positive culture and sensitivity results; and were prescribed an empiric antibiotic. Veterans were not eligible for this project if they were not receiving antibiotic therapy, with or without pending or resulted culture results shown in CPRS.
Implementation
Data gathered through a CPRS dashboard from August 2019 to February 2020 identified patients with pending or completed culture results in urgent care and primary care settings (eAppendix 4). The dashboard was created specifically for this project to show patient details that included initial antibiotic(s) prescribed and preliminary and final culture results. After a mismatched combination was identified, pharmacists contacted patients and assessed symptoms. If a patient was still symptomatic, the pharmacist changed the antibiotic regimen and educated the patient about this change. The pharmacist documented an intervention note in CPRS and added the HCP as a signer so he or she would be aware of the change. The clinical pharmacist followed up after regimens were complete. At this time, the pharmacist assessed patients to ensure the medication was taken as directed (eg, number of days of therapy, how many tablets per day, etc), to discuss any reported adverse effects, and to assess resolution of symptoms. If a patient still had symptoms, the pharmacist contacted the patient’s primary care provider. If the veteran could not be contacted after 3 consecutive attempts via phone, a certified letter was mailed. If patients were asymptomatic at the time of the call, the pharmacist documented the lack of symptoms and added the HCP as a signer for awareness purposes. HCPs continued to practice as usual while this service was implemented.
Observations
Using the culture and susceptibility dashboard, the pharmacist identified 675 patients as having a pending culture (Table 1). Among these patients, 320 results were positive, and were taking antibiotics empirically. Out of the 320 patients who met inclusion criteria, 10 required pharmacist intervention. After contacting the veterans, 7 required regimen changes because their current antibiotic was not susceptible to the isolated organism. Three additional patients were contacted because of a mismatch between the empiric antibiotic and culture result. Antibiotic therapy was not modified because these patients were asymptomatic at the time the clinical pharmacist contacted them. These patient cases were discussed with the HCP before documenting the intervention to prevent initiation of unwarranted antibiotics.
Most of the modified antimicrobial regimens were found in urine cultures from symptomatic patients (Table 2). Of the 7 patients requiring therapy change because of a mismatch antibiotic–bacteria combination, 4 were empirically prescribed fluoroquinolones, 2 received levofloxacin, and 2 were prescribed ciprofloxacin. According to the most recent antibiogram at our facility, some organisms are resistant to fluoroquinolones, specifically Proteus mirabilis (P mirabilis) and Escherichia coli (E coli). These pathogens were the cause of urinary tract infections in 3 of 4 patients with fluoroquinolone prescriptions.
Through the CPRS dashboard, the pharmacist inadvertently identified 4 patients with positive culture results who were not on antibiotic therapy. These patients were contacted by telephone, and antibiotics were initiated for symptomatic patients after consultation with the HCP. The primary culture type intervened on was urine in 12 of 14 cases (86%). The other 2 culture types included oropharynx culture (7%) positive for an acute bacterial respiratory tract infection caused by group C Streptococcus and a stool culture (7%) positive for Pseudomonas aeruginosa (P aeruginosa). E coli (36%) was isolated in 5 cases and was the most commonly isolated organism. P
Discussion
This project was an innovative antimicrobial stewardship endeavor that helped initiate antibiotic interventions quickly and improve patient outcomes. The antimicrobial stewardship pharmacist independently performed interventions for patients without requiring HCP consultation, therefore decreasing HCP burden and possibly reducing time to assessment of culture results.
Limitations
The study results were limited due to its small sample size of antimicrobial interventions. The clinical pharmacist did not contact the patient when the antibiotic prescribed empirically by the HCP was appropriate for the isolated organism. Among the patients contacted, 3 were asymptomatic, did not require further antibiotic therapy, and no intervention was made. Provider education was deemed successful because HCPs did not request further information about the service. However, not all HCPs were provided education because of different shifts and inability to attend educational sessions. Closely working with lead physicians within the facility provided an alternate method for information dissemination.
The care coordination agreement allowed the pharmacist to make changes if patients had a current prescription for an antibiotic. In addition to the changes to antibiotics, this project improved HCP awareness of culture results even in cases of symptomatic patients who were not prescribed therapy. When this occurred, the pharmacist contacted the patient to assess symptoms and then notified the HCP if the patient was symptomatic.
Future Directions
Future endeavors regarding this project include modifying the scope of the service to allow pharmacists to prescribe antibiotics for patients with positive cultures and symptoms without empiric antibiotics in addition to continuing to modify empiric therapy. Additionally, improving dashboard efficiency through changes to include only isolated antibiotic mismatches rather than all antibiotics prescribed and all available cultures would reduce the pharmacists’ time commitment. Expanding to other parts of the medical center, including long-term care facilities and other outpatient clinics, would allow this service to reach more veterans. Integrating this service throughout the medical center will require continued HCP education and modifying care coordination agreements to include these facilities.
On a typical day, 60 to 90 minutes were spent navigating the dashboard and implementing this service. The CPRS dashboard should be modified to streamline patients identified to decrease the daily time commitment. Re-education of HCPs about resistance rates of fluoroquinolones and empirically prescribing these agents also will be completed based on empiric antibiotic interventions made with these agents throughout this project. Discussing HCP viewpoints on this service would be beneficial to ensure HCP satisfaction.
Conclusions
This pharmacy service and antimicrobial stewardship program reduced time patients were on inappropriate antibiotics. Pharmacists reviewed the dashboard daily under the scope of this project, which expedited needed changes and decreased provider burden because pharmacists were able to make changes without interrupting HCPs’ daily tasks, including patient care.
This program may also reduce readmissions. Patients who were still symptomatic were contacted could be given revised medication regimens without the patient returning to the facility for follow-up treatment. An interesting conclusion not included in the current scope of this service was possible reduced time to therapy initiation in cases of positive cultures and symptomatic patients without antibiotic therapy. If this occurred on the dashboard, patient’s symptoms could be assessed, and if symptoms were ongoing, the pharmacist contacted the HCP with a recommended antimicrobial therapy. In these cases, we were able to mail the antibiotic quickly, and many times, on the same day as this intervention through overnight mail. Implementation of a pharmacist-led antimicrobial review service has provided positive results overall for CVVAMC.
Acknowledgment
This material is the result of work supported with resources and the use of the facilities at the Carl Vinson VA Medical Center.
1. Centers for Disease Control and Prevention. Antibiotic use in outpatient settings, 2017: progress and opportunities. Accessed August 19, 2021. https://www.cdc.gov/antibiotic-use/stewardship-report/outpatient.html
2. Centers for Disease Control and Prevention. Antibiotic/antimicrobial resistance. Accessed August 19, 2021. https://www.cdc.gov/drugresistance/index.html
3. Jonas OB, Irwin A, Berthe FCJ, Le Gall FG, Marquez PV. Drug-resistant infections: a threat to our economic future. March 2017. Accessed August 19, 2021. https://documents.worldbank.org/en/publication/documents-reports/documentdetail/323311493396993758/final-report
4. Davis LC, Covey RB, Weston JS, Hu BBY, Laine GA. Pharmacist-driven antimicrobial optimization in the emergency department. Am J Health Syst Pharm. 2016;73(5)(suppl 1):S49-S56. doi:10.2146/sp150036
5. Baker SN, Acquisto NM, Ashley ED, Fairbanks RJ, Beamish SE, Haas CE. Pharmacist-managed antimicrobial stewardship program for patients discharged from the emergency department. J Pharm Pract. 2012;25(2):190-194. doi:10.1177/0897190011420160
6 Randolph TC, Parker A, Meyer L, Zeina R. Effect of a pharmacist-managed culture review process on antimicrobial therapy in an emergency department. Am J Health Syst Pharm. 2011;68(10):916-919. doi:10.2146/ajhp090552
7. Infectious Diseases Society of America. Infectious diseases society of America guidelines 2019. Accessed August 24, 2021. https://www.idsociety.org/practice-guideline/practice-guidelines/#/+/0/date_na_dt/desc
Leadership & Professional Development: How to Teach When You Don’t Know
“By learning you will teach, by teaching you will learn.”
–Latin proverb
The COVID-19 pandemic thrust hospitalists into uncertain clinical situations where scientific evidence was rapidly changing and expert consensus was not always available. Amidst this, our learners were eager to better understand this new disease and how to properly care for patients. This forced hospitalists, as educators, to face the question: “How do you teach when you don’t have the answers?”
Teaching outside a hospitalist’s expertise existed before the COVID-19 pandemic and will continue to exist. It is a challenge encountered frequently by both junior and senior faculty across all disciplines, yet is rarely discussed.1 However, great learning can still occur when we teach at the edge of our comfort zones.
Acknowledge What You Don’t Know
You don’t need to be an expert to be a great teacher. Although most educators know this, we often fear that disclosing our knowledge limitations exposes our weaknesses. But a successful start to the learning journey begins with establishing trust and confidence with your learners. Remaining authentic in your knowledge base will inspire more credibility than false pretenses of content mastery. Phrases like, “This topic is new for me as well. Here’s what I do know and what I don’t know” or “What a great question. I wish I had a great answer. Let me get back to you” set a standard for honesty and reduce teaching pressures. In turn, learners will be more comfortable acknowledging their own uncertainties and will be more likely to voice their hesitations or ask questions on rounds.
Allow Yourself to Be the Student
The field of medicine is steeped in hierarchical structure, where the attending is assumed to have the most knowledge. But this may not always be true, as learners are often more up to date on a subject than the attending. By reexamining traditional hierarchies and instead considering ourselves as part of a learning team, we can promote a more positive educational climate.
When a learner asks a question that you don’t have an answer for, the response “Great question. I can tell you what I think, but I’m interested in first hearing your thoughts” reflects that you respect your learners and their skills and experiences. You can also ask them to do a literature review and report back to you and the team the next morning. By inverting the hierarchy, you are teaching humility, adaptability, and shared responsibility, as well as demonstrating the skills of being a lifelong learner.2
Teach the Skills You Do Have
As educators, we often hold ourselves to unrealistic expectations of being omniscient knowledge vessels. In times of crisis or uncertainty, teaching about how to learn and where to learn become just as important as what to learn. Invite learners to observe how you navigate ambiguity. For example, I recently interacted with a colleague on an unfamiliar case. She said, “Dr Wang, I don’t know much about malaria. Can you share with me what made you consider this diagnosis?” Additionally, admitting to learners when you have made an error not only clarifies their learning, but also role models continuous personal improvement.
By modeling humility by acknowledging our own limits, respecting our learners’ knowledge and experiences, and demonstrating how we manage uncertainty, we can enhance the learning environment and inspire our learners.
1. Huston T. Teaching What You Don’t Know. Harvard University Press; 2012.
2. Heifetz R, Grashow A, Linsky M. Leadership in a (permanent) crisis. Har Bus Rev. 2019;87(7-8):62-69, 153.
“By learning you will teach, by teaching you will learn.”
–Latin proverb
The COVID-19 pandemic thrust hospitalists into uncertain clinical situations where scientific evidence was rapidly changing and expert consensus was not always available. Amidst this, our learners were eager to better understand this new disease and how to properly care for patients. This forced hospitalists, as educators, to face the question: “How do you teach when you don’t have the answers?”
Teaching outside a hospitalist’s expertise existed before the COVID-19 pandemic and will continue to exist. It is a challenge encountered frequently by both junior and senior faculty across all disciplines, yet is rarely discussed.1 However, great learning can still occur when we teach at the edge of our comfort zones.
Acknowledge What You Don’t Know
You don’t need to be an expert to be a great teacher. Although most educators know this, we often fear that disclosing our knowledge limitations exposes our weaknesses. But a successful start to the learning journey begins with establishing trust and confidence with your learners. Remaining authentic in your knowledge base will inspire more credibility than false pretenses of content mastery. Phrases like, “This topic is new for me as well. Here’s what I do know and what I don’t know” or “What a great question. I wish I had a great answer. Let me get back to you” set a standard for honesty and reduce teaching pressures. In turn, learners will be more comfortable acknowledging their own uncertainties and will be more likely to voice their hesitations or ask questions on rounds.
Allow Yourself to Be the Student
The field of medicine is steeped in hierarchical structure, where the attending is assumed to have the most knowledge. But this may not always be true, as learners are often more up to date on a subject than the attending. By reexamining traditional hierarchies and instead considering ourselves as part of a learning team, we can promote a more positive educational climate.
When a learner asks a question that you don’t have an answer for, the response “Great question. I can tell you what I think, but I’m interested in first hearing your thoughts” reflects that you respect your learners and their skills and experiences. You can also ask them to do a literature review and report back to you and the team the next morning. By inverting the hierarchy, you are teaching humility, adaptability, and shared responsibility, as well as demonstrating the skills of being a lifelong learner.2
Teach the Skills You Do Have
As educators, we often hold ourselves to unrealistic expectations of being omniscient knowledge vessels. In times of crisis or uncertainty, teaching about how to learn and where to learn become just as important as what to learn. Invite learners to observe how you navigate ambiguity. For example, I recently interacted with a colleague on an unfamiliar case. She said, “Dr Wang, I don’t know much about malaria. Can you share with me what made you consider this diagnosis?” Additionally, admitting to learners when you have made an error not only clarifies their learning, but also role models continuous personal improvement.
By modeling humility by acknowledging our own limits, respecting our learners’ knowledge and experiences, and demonstrating how we manage uncertainty, we can enhance the learning environment and inspire our learners.
1. Huston T. Teaching What You Don’t Know. Harvard University Press; 2012.
2. Heifetz R, Grashow A, Linsky M. Leadership in a (permanent) crisis. Har Bus Rev. 2019;87(7-8):62-69, 153.
1. Huston T. Teaching What You Don’t Know. Harvard University Press; 2012.
2. Heifetz R, Grashow A, Linsky M. Leadership in a (permanent) crisis. Har Bus Rev. 2019;87(7-8):62-69, 153.
© 2021 Society of Hospital Medicine
The Limited Academic Footprint of Hospital Medicine: Where Do We Go From Here?
What has been the scholarly output of academic hospital medicine faculty (AHMF) and what academic rank have they achieved at US academic medical centers (AMCs)? Sumarsono et al1 address these questions and add to the growing body of literature exposing the limited academic footprint of hospitalists.
The authors performed a cross-sectional analysis of AHMF affiliated with the top 25 internal medicine training programs (as determined by the physician networking service doximity.com) and used Scopus to determine number of publications, citations, and H-index (a metric of productivity) for each faculty member. They also evaluated predictors for promotion. In contrast, most prior research on this topic relies on data obtained by survey methodology.2-5
Among 1554 AHMF from 22 AMCs, 42 (2.7%) were full professors and 140 (9.0%) were associate professors. The number of publications per AHMF was noticeably low, with a mean of 6.3 and median of 0 (interquartile range, 0-4). The authors found that H-index, completion of chief residency, and graduation from a top 25 medical school were independently associated with promotion.
The authors only evaluated AHMF among the most academically rigorous AMCs, an approach that likely overestimates scholarly output of hospitalists across all US AMCs. Conversely, if we presume that promotion is more difficult at these major AMCs, the results may underestimate academic rank of AHMF nationally. Additionally, the authors did not distinguish faculty by tracks (eg, clinician-investigators, clinician-educators), which often have different criteria for academic promotion.
These findings are worrisomely consistent with prior reports, despite the tremendous expansion of the field.2-4 A 2008 survey of academic hospitalists found that 4% of respondents were full professors and 9% were associate professors, values nearly identical to the results in this current analysis,4 suggesting enduring barriers to academic advancement.
We are left with the following questions provoked by this body of literature: How can hospitalists increase their scholarly output and climb the promotional ladder? And how can we increase the academic footprint of hospital medicine? We recently proposed the following strategies based on a survey of academic groups participating in the Hospital Medicine Reengineering Network (HOMERuN) survey5: (1) expand hospital medicine research fellowships, which will provide graduates with research skills to justify dedicated time for research and aid their ability to obtain independent funding; (2) formalize mentorship between research faculty in hospital medicine and other internal medicine disciplines with robust track records for research; (3) invest in research infrastructure and data access within and between institutions; and (4) encourage hospital medicine group leaders to foster academic growth by incentivizing faculty to perform research, present their work at national conferences, and publish manuscripts with their findings.
Although an increase in scholarly output should contribute to higher academic rank, hospitalists routinely make other invaluable contributions beyond clinical care to AMCs, including medical education, hospital leadership, quality improvement, clinical innovation, and social justice advocacy. Also, hospitalists are increasingly disseminating their contributions via newer mediums (eg, social media, podcasts) that arguably have greater reach than traditional scholarship outlets. We believe that promotion committees should update their criteria to reflect the evolution of academic contribution and integrate these within traditional promotion pathways.
Finally, we must address federal funding mechanisms, which currently favor specialty-specific funding over funding that would be more applicable to hospital medicine researchers. Funding agencies are largely specialty- or disease-specific, with limited options for broader-based research.6 Additionally, grant-review committees are largely comprised of specialists, with few generalists and fewer hospitalists. These limitations make it difficult to “argue” the necessity of hospital medicine research. One concrete step would be for the National Institutes of Health (NIH) to create an Office for Hospital Medicine Research, analogous to the Office of Emergency Care Research, which works across NIH institutes and centers to foster research and research training for the emergency setting.
With these strategies, we are hopeful that hospital medicine will continue to expand its academic footprint and be recognized for its ever-growing contributions to the practice of medicine.
1. Sumarsono A, Keshvani N, Saleh SN, et al. Scholarly productivity and rank in academic hospital medicine. J Hosp Med. 2021;16(9):545-548. https://doi.org/10.12788/jhm.3631
2. Chopra V, Burden M, Jones CD, et al. State of research in adult hospital medicine: results of a national survey. J Hosp Med. 2019;14(4):207-211. https://doi.org/10.12788/jhm.3136
3. Miller CS, Fogerty RL, Gann J, et al, the Society of General Internal Medicine Membership Committee. The growth of hospitalists and the future of the society of general internal medicine: results from the 2014 membership survey. J Gen Intern Med. 2017;32(11):1179-1185. https://doi.org/10.1007/s11606-017-4126-7
4. Reid MB, Misky GJ, Harrison RA, Sharpe B, Auerbach A, Glasheen JJ. Mentorship, productivity, and promotion among academic hospitalists. J Gen Intern Med. 2012;27(1):23-27. https://doi.org/10.1007/s11606-011-1892-5
5. Shannon EM, Chopra V, Greysen SR, et al. Dearth of hospitalist investigators in academic medicine: a call to action. J Hosp Med. 2021;16(3):189-191. https://doi.org/10.12788/jhm.3536
6. Levinson W, Linzer M. What is an academic general internist? Career options and training pathways. JAMA. 2002;288(16):2045-2048. https://doi.org/10.1001/jama.288.16.2045
What has been the scholarly output of academic hospital medicine faculty (AHMF) and what academic rank have they achieved at US academic medical centers (AMCs)? Sumarsono et al1 address these questions and add to the growing body of literature exposing the limited academic footprint of hospitalists.
The authors performed a cross-sectional analysis of AHMF affiliated with the top 25 internal medicine training programs (as determined by the physician networking service doximity.com) and used Scopus to determine number of publications, citations, and H-index (a metric of productivity) for each faculty member. They also evaluated predictors for promotion. In contrast, most prior research on this topic relies on data obtained by survey methodology.2-5
Among 1554 AHMF from 22 AMCs, 42 (2.7%) were full professors and 140 (9.0%) were associate professors. The number of publications per AHMF was noticeably low, with a mean of 6.3 and median of 0 (interquartile range, 0-4). The authors found that H-index, completion of chief residency, and graduation from a top 25 medical school were independently associated with promotion.
The authors only evaluated AHMF among the most academically rigorous AMCs, an approach that likely overestimates scholarly output of hospitalists across all US AMCs. Conversely, if we presume that promotion is more difficult at these major AMCs, the results may underestimate academic rank of AHMF nationally. Additionally, the authors did not distinguish faculty by tracks (eg, clinician-investigators, clinician-educators), which often have different criteria for academic promotion.
These findings are worrisomely consistent with prior reports, despite the tremendous expansion of the field.2-4 A 2008 survey of academic hospitalists found that 4% of respondents were full professors and 9% were associate professors, values nearly identical to the results in this current analysis,4 suggesting enduring barriers to academic advancement.
We are left with the following questions provoked by this body of literature: How can hospitalists increase their scholarly output and climb the promotional ladder? And how can we increase the academic footprint of hospital medicine? We recently proposed the following strategies based on a survey of academic groups participating in the Hospital Medicine Reengineering Network (HOMERuN) survey5: (1) expand hospital medicine research fellowships, which will provide graduates with research skills to justify dedicated time for research and aid their ability to obtain independent funding; (2) formalize mentorship between research faculty in hospital medicine and other internal medicine disciplines with robust track records for research; (3) invest in research infrastructure and data access within and between institutions; and (4) encourage hospital medicine group leaders to foster academic growth by incentivizing faculty to perform research, present their work at national conferences, and publish manuscripts with their findings.
Although an increase in scholarly output should contribute to higher academic rank, hospitalists routinely make other invaluable contributions beyond clinical care to AMCs, including medical education, hospital leadership, quality improvement, clinical innovation, and social justice advocacy. Also, hospitalists are increasingly disseminating their contributions via newer mediums (eg, social media, podcasts) that arguably have greater reach than traditional scholarship outlets. We believe that promotion committees should update their criteria to reflect the evolution of academic contribution and integrate these within traditional promotion pathways.
Finally, we must address federal funding mechanisms, which currently favor specialty-specific funding over funding that would be more applicable to hospital medicine researchers. Funding agencies are largely specialty- or disease-specific, with limited options for broader-based research.6 Additionally, grant-review committees are largely comprised of specialists, with few generalists and fewer hospitalists. These limitations make it difficult to “argue” the necessity of hospital medicine research. One concrete step would be for the National Institutes of Health (NIH) to create an Office for Hospital Medicine Research, analogous to the Office of Emergency Care Research, which works across NIH institutes and centers to foster research and research training for the emergency setting.
With these strategies, we are hopeful that hospital medicine will continue to expand its academic footprint and be recognized for its ever-growing contributions to the practice of medicine.
1. Sumarsono A, Keshvani N, Saleh SN, et al. Scholarly productivity and rank in academic hospital medicine. J Hosp Med. 2021;16(9):545-548. https://doi.org/10.12788/jhm.3631
2. Chopra V, Burden M, Jones CD, et al. State of research in adult hospital medicine: results of a national survey. J Hosp Med. 2019;14(4):207-211. https://doi.org/10.12788/jhm.3136
3. Miller CS, Fogerty RL, Gann J, et al, the Society of General Internal Medicine Membership Committee. The growth of hospitalists and the future of the society of general internal medicine: results from the 2014 membership survey. J Gen Intern Med. 2017;32(11):1179-1185. https://doi.org/10.1007/s11606-017-4126-7
4. Reid MB, Misky GJ, Harrison RA, Sharpe B, Auerbach A, Glasheen JJ. Mentorship, productivity, and promotion among academic hospitalists. J Gen Intern Med. 2012;27(1):23-27. https://doi.org/10.1007/s11606-011-1892-5
5. Shannon EM, Chopra V, Greysen SR, et al. Dearth of hospitalist investigators in academic medicine: a call to action. J Hosp Med. 2021;16(3):189-191. https://doi.org/10.12788/jhm.3536
6. Levinson W, Linzer M. What is an academic general internist? Career options and training pathways. JAMA. 2002;288(16):2045-2048. https://doi.org/10.1001/jama.288.16.2045
© 2021 Society of Hospital Medicine
The Chronic Effects of COVID-19 Hospitalizations: Learning How Patients Can Get “Back to Normal”
As our understanding of SARS-CoV-2 has progressed, researchers, clinicians, and patients have learned that recovery from COVID-19 can last well beyond the acute phase of the illness. As we see fewer fatal cases and more survivors, studies that characterize the postacute sequelae of COVID-19 (PASC) are increasingly important for understanding how to help patients return to their normal lives, especially after hospitalization. Critical to investigating this is knowing patients’ burden of symptoms and disabilities prior to infection. In this issue, a study by Iwashyna et al1 helps us understand patients’ lives after COVID compared to their lives before COVID.
The study analyzed patients with SARS-CoV-2 infection admitted during the third wave of the pandemic to assess for new cardiopulmonary symptoms, new disability, and financial toxicity of hospitalization 1 month after discharge.1 Many patients had new cardiopulmonary symptoms and oxygen use, and a much larger number had new limitations in activities of daily living (ADLs) or instrumental activities of daily living (iADLs). The majority were discharged home without home care services, and new limitations in ADLs or iADLs were common in these cases. Most patients reported not having returned to their cardiopulmonary or functional baseline; however, new cough, shortness of breath, or oxygen use usually did not explain their new disabilities. Financial toxicity was also common, reflecting the effects of COVID-19 on both employment and family finances.
These results complement those of Chopra et al,2 who examined 60-day outcomes for patients hospitalized during the first wave of the pandemic. At 2 months from discharge, many patients had ongoing cough, shortness of breath, oxygen use, and disability, but at lower rates. This likely reflects continuing recovery during the extra 30 days, but other potential explanations deserve consideration. One possibility is improving survival over the course of the pandemic. Many patients who may have passed away earlier in the pandemic now survive to return home, albeit with a heavy burden of symptomatology. This raises the possibility that symptoms among survivors may continue to increase as survival of COVID-19 improves. However, it should be noted that neither study is representative of the national patterns of hospitalization by race or ethnicity.3 Iwashyna et al1 underrepresented Black patients, while Chopra et al2 underrepresented Hispanic patients. Given what we know about outcomes for these populations and their underrepresentation in PASC literature, the impact of COVID-19 for them is likely underestimated. As data from 3, 6, or 12 months become available, we may also see the effect sizes described in this early literature become even larger.
Consistent with the findings of Chopra et al,2 financial toxicity after COVID-19 hospitalization was high. The longer-term financial burden of COVID-19 will likely exceed what is described here, particularly for Black and Hispanic patients, who experienced a disproportionate drain on their savings. These populations are also more likely to be negatively impacted by the COVID economy4 and thus may suffer a “double hit” financially if hospitalized.
Iwashyna et al1 underscore the urgent need for progress in understanding COVID “long-haulers”5 and helping patients with physical and financial recovery. Whether the spectacular innovations identified by the medical community in COVID-19 prevention and treatment of acute illness can be found for long COVID remains to be seen. The fact that so many patients studied by Iwashyna et al did not receive home care services and experienced financial toxicity shows the importance of broader implementation of systems and services to support survivors of COVID-19 hospitalization. Developers of this support must emphasize the importance of physical and cardiopulmonary rehabilitation as well as financial relief, particularly for minorities. For our patients and their families, this may be the best strategy to get “back to normal.”
Acknowledgment
The authors thank Dr Vineet Arora for reviewing and advising on this manuscript.
1. Iwashyna TJ, Kamphuis LA, Gundel SJ, et al. Continuing cardiopulmonary symptoms, disability, and financial toxicity 1 month after hospitalization for third-wave COVID-19: early results from a US nationwide cohort. J Hosp Med. 2021;16(9):531-537. https://doi.org/10.12788/jhm.3660
2. Chopra V, Flanders SA, O’Malley M, Malani AN, Prescott HC. Sixty-day outcomes among patients hospitalized with COVID-19. Ann Intern Med. 2021;174(4):576-578. https://doi.org/10.7326/M20-5661
3. Centers for Disease Control and Prevention. Risk for COVID-19 infection, hospitalization, and death by race/ethnicity. Updated July 16, 2021. Accessed August 19, 2021. https://www.cdc.gov/coronavirus/2019-ncov/covid-data/investigations-discovery/hospitalization-death-by-race-ethnicity.html
4. Robert Wood Johnson Foundation, NPR, Harvard T.H. Chan School of Public Health. The impact of coronavirus on households by race/ethnicity. September 2020. Accessed July 28, 2021. https://www.rwjf.org/en/library/research/2020/09/the-impact-of-coronavirus-on-households-across-america.html
5. Barber C. The problem of ‘long haul’ COVID. December 29, 2020. Accessed July 28, 2021. https://www.scientificamerican.com/article/the-problem-of-long-haul-covid/
As our understanding of SARS-CoV-2 has progressed, researchers, clinicians, and patients have learned that recovery from COVID-19 can last well beyond the acute phase of the illness. As we see fewer fatal cases and more survivors, studies that characterize the postacute sequelae of COVID-19 (PASC) are increasingly important for understanding how to help patients return to their normal lives, especially after hospitalization. Critical to investigating this is knowing patients’ burden of symptoms and disabilities prior to infection. In this issue, a study by Iwashyna et al1 helps us understand patients’ lives after COVID compared to their lives before COVID.
The study analyzed patients with SARS-CoV-2 infection admitted during the third wave of the pandemic to assess for new cardiopulmonary symptoms, new disability, and financial toxicity of hospitalization 1 month after discharge.1 Many patients had new cardiopulmonary symptoms and oxygen use, and a much larger number had new limitations in activities of daily living (ADLs) or instrumental activities of daily living (iADLs). The majority were discharged home without home care services, and new limitations in ADLs or iADLs were common in these cases. Most patients reported not having returned to their cardiopulmonary or functional baseline; however, new cough, shortness of breath, or oxygen use usually did not explain their new disabilities. Financial toxicity was also common, reflecting the effects of COVID-19 on both employment and family finances.
These results complement those of Chopra et al,2 who examined 60-day outcomes for patients hospitalized during the first wave of the pandemic. At 2 months from discharge, many patients had ongoing cough, shortness of breath, oxygen use, and disability, but at lower rates. This likely reflects continuing recovery during the extra 30 days, but other potential explanations deserve consideration. One possibility is improving survival over the course of the pandemic. Many patients who may have passed away earlier in the pandemic now survive to return home, albeit with a heavy burden of symptomatology. This raises the possibility that symptoms among survivors may continue to increase as survival of COVID-19 improves. However, it should be noted that neither study is representative of the national patterns of hospitalization by race or ethnicity.3 Iwashyna et al1 underrepresented Black patients, while Chopra et al2 underrepresented Hispanic patients. Given what we know about outcomes for these populations and their underrepresentation in PASC literature, the impact of COVID-19 for them is likely underestimated. As data from 3, 6, or 12 months become available, we may also see the effect sizes described in this early literature become even larger.
Consistent with the findings of Chopra et al,2 financial toxicity after COVID-19 hospitalization was high. The longer-term financial burden of COVID-19 will likely exceed what is described here, particularly for Black and Hispanic patients, who experienced a disproportionate drain on their savings. These populations are also more likely to be negatively impacted by the COVID economy4 and thus may suffer a “double hit” financially if hospitalized.
Iwashyna et al1 underscore the urgent need for progress in understanding COVID “long-haulers”5 and helping patients with physical and financial recovery. Whether the spectacular innovations identified by the medical community in COVID-19 prevention and treatment of acute illness can be found for long COVID remains to be seen. The fact that so many patients studied by Iwashyna et al did not receive home care services and experienced financial toxicity shows the importance of broader implementation of systems and services to support survivors of COVID-19 hospitalization. Developers of this support must emphasize the importance of physical and cardiopulmonary rehabilitation as well as financial relief, particularly for minorities. For our patients and their families, this may be the best strategy to get “back to normal.”
Acknowledgment
The authors thank Dr Vineet Arora for reviewing and advising on this manuscript.
1. Iwashyna TJ, Kamphuis LA, Gundel SJ, et al. Continuing cardiopulmonary symptoms, disability, and financial toxicity 1 month after hospitalization for third-wave COVID-19: early results from a US nationwide cohort. J Hosp Med. 2021;16(9):531-537. https://doi.org/10.12788/jhm.3660
2. Chopra V, Flanders SA, O’Malley M, Malani AN, Prescott HC. Sixty-day outcomes among patients hospitalized with COVID-19. Ann Intern Med. 2021;174(4):576-578. https://doi.org/10.7326/M20-5661
3. Centers for Disease Control and Prevention. Risk for COVID-19 infection, hospitalization, and death by race/ethnicity. Updated July 16, 2021. Accessed August 19, 2021. https://www.cdc.gov/coronavirus/2019-ncov/covid-data/investigations-discovery/hospitalization-death-by-race-ethnicity.html
4. Robert Wood Johnson Foundation, NPR, Harvard T.H. Chan School of Public Health. The impact of coronavirus on households by race/ethnicity. September 2020. Accessed July 28, 2021. https://www.rwjf.org/en/library/research/2020/09/the-impact-of-coronavirus-on-households-across-america.html
5. Barber C. The problem of ‘long haul’ COVID. December 29, 2020. Accessed July 28, 2021. https://www.scientificamerican.com/article/the-problem-of-long-haul-covid/
© 2021 Society of Hospital Medicine