User login
The Hospitalist Imperative: Standardizing Best Practice across Expanding Healthcare Networks
Rapid dissemination and adoption of evidence-based guidelines remains a challenge despite studies showing that key evidence-based care processes improve outcomes in sepsis and heart failure.1 Hospital medicine was virtually founded on the premise that hospitalists would be champions of delivering high-quality care. Hospitalists are now dealing with a new challenge—unprecedented growth of healthcare systems because of mergers and acquisitions. The year 2018 was a banner time for healthcare mergers and acquisitions, with a total of 1,182, up 14% from 2017.2 These are in response to the belief that healthcare systems may better navigate the mixed reimbursement models of fee-for-service and fee-for-value by achieving a larger patient base and economies of scale. Hospitalists must now achieve consistent, evidence-based standards of care across larger networks by educating their colleagues (often separated by large geographic areas) to manifest durable changes in their group practice with demonstrable improvement in patient outcomes and cost savings.
The study by Yurso et al. focused on implementing an education program, which included standardized learning through Clinical Performance and Value (CPV) vignettes with process measurement and feedback for sepsis and heart failure.3 Sepsis and heart failure have been a focus for treatment standardization because of the associated morbidity, mortality, and high cost of care. The study by Yurso et al. is a prospective quasi-controlled cohort of hospitalists in eight hospitals who were matched with comparator hospitalists in six nonparticipating hospitals across the AdventHealth system. Measurement and feedback were provided using CPV vignettes. Over two years, hospitalists who participated improved CPV scores by 8%, compliance with the utilization of the three-hour sepsis bundle from 46.0% to 57.5%, and orders of essential medical treatment elements for heart failure from 58.2% to 72.1%. In year one, the average length of stay (LOS) observed/expected (O/E) rates dropped by 8% for participating hospitalists compared with 2.5% in the comparator group. By year two, cost O/E rates improved slightly resulting in cost savings. The authors concluded that CPV case simulation-based measurement and feedback helped drive improvements in evidence-based care, which was associated with lower costs and shorter LOS.
While studies using traditional didactic CME struggle to demonstrate changes in practice leading to improved patient outcomes,4 the study by Yurso et al. gives a glimpse into how simulation can be used to help improve clinical performance and measure adherence to best practice. A remarkably similar study used CPV for simulated patients with serial performance measurement and feedback for heart failure and pneumonia. The study showed reduced practice variation between hospitalists at 11 hospitals across four states and decreased LOS and readmissions. However, the sole clinical outcome was no change in in-house mortality.5 Another study using CPV training in breast cancer treatment demonstrated increased adherence to evidence-based practice standards and decreased variation in care between providers across four states.6 Of note, this study did not include clinical outcomes. These studies collectively imply that simulation training with interactive learning, educational feedback, repetitive practice, and curriculum integration has shown modest success in creating practice change and improving adherence to best practice standards. However, they have minimal measures of patient outcomes and fairly simple analyses for cost savings. Because the education is computer-based and feedback can be performed remotely, it can be deployed across large and diverse growing healthcare systems. To really move the needle, future research in the field of simulation should identify optimal simulation methods and be designed with more rigor to include patient and cost outcomes.
At Intermountain Healthcare, hospitalist expansion occurred through a strategic realignment from the different geographic regions into the One Intermountain model. This model is built on the commitment that our patients will receive the same high-quality, high-value care wherever they walk through our doors. We have found four substantive changes have been particularly powerful in spurring a group practice mentality toward standardizing best practice. One, hospitalists are now aligned across the system under a single operational leadership structure that encourages combined efforts to share best practices and develop and deploy strategic initiatives around them. Two, hospitalists continue to build on a culture of quality and measure what matters to patients. While Intermountain Healthcare has a long history of using quality improvement to achieve better patient outcomes and lower costs,7 the new structure is allowing our group to test novel methods including redesigned education to see what actually improves adherence to best practice. Three, the group knows where the system’s reimbursement is coming from; Intermountain Healthcare has transitioned to a larger percentage of capitation,8 currently about 40%, with a strong commitment to partner with services geared to transition patients home quickly and keep them at home. Four, the organization has created a structure of accountability and reporting; an executive-sponsored systemwide operating model has been designed to cut through system barriers being identified by the frontline, allowing them to be rapidly surfaced and then solved at the executive level through daily huddles.9
Innovative educational programs such as the one described in the study by Yurso et al. that help the busy hospitalist achieve improved adherence to best practice are likely to be an important component leading to improved outcomes, but only after a group has been structured for success. As hospitalist groups continue to act as a single effector arm for high-value care, this will help meet the expectations of our patients and deliver on the promise of our field.
Disclosures: Dr. Srivastava is a physician founder of the I- PASS Patient Safety Institute. His employer, Intermountain Healthcare owns his equity in the I-PASS Patient Safety Institute. Dr. Srivastava is supported in part by the Children’s Hospital Association for his work as an executive council member of the Pediatric Research in Inpatient Settings (PRIS) network. Dr. Srivastava has received monetary awards, honorariums, and travel reimbursement from multiple academic and professional organizations for talks about pediatric hospitalist research networks and quality of care. All other authors have nothing to disclose. No funding was provided for this editorial.
Disclosures
The authors have no disclosures of financial conflicts of interest.
Funding
Dr. Walke was supported an award from the Health Resources and Services Administration Geriatric Workforce Enhancement Program to the University of Pennsylvania (U1QHP28720).
1. Seymour, CW, Geston F, Prescott HC, et al. Time to treatment and mortality during mandated emergency care for sepsis. N Engl J Med. 2017;376(23):2235-2244. https://doi.org/10.1056/NEJMoa1703058.
2. Healthcare Finance. Lagasse J. Healthcare mergers and acquisitions had record year in 2018, up 14.4 percent.https://webcache.googleusercontent.com/search?q=cache:zoMrl9yoLokJ:https://www.healthcarefinancenews.com/news/healthcare-mergers-and-acquisitions-had-record-year-2018-144-percent+&cd=2&hl=en&ct=clnk&gl=us. Published January, 2019. Accessed April 26, 2019.
3. Yurso M, Box B, Burgon T, et al. Reducing unneeded clinical variation in sepsis and heart failure care to improve outcomes and reduce cost: a collaborative engagement with hospitalists in a multi-state system. J Hosp Med. 2019;14(9):542-546. https://doi.org/10.12788/jhm.3220.
4. Cervero RM, Gaines JK. The impact of CME on physician performance and patient health outcomes: an updated synthesis of systematic reviews. J Contin Educ Health Prof. 2015;35(2):131-138. https://doi.org/10.1002/chp.21290.
5. Weems L, Strong J, Plummer D, et al. A quality collaboration in heart failure and pneumonia inpatient care at Novant Health: standardizing hospitalist practices to improve patient care and system performance. Jt Comm J Qual Patient Saf. 2019;45(3):199-206. https://doi.org/10.1016/j.jcjq.2018.09.005.
6. Peabody JW, Paculdo DR, Tamondong-Lachica D, et al. Improving clinical practice using a novel engagement approach; measurement, benchmarking and feedback; a longitudinal study. J Clin Med Res. 2016;8(9):633-640. https://doi.org/10.14740/jocmr2620w.
7. James BC, Savitz LA. How Intermountain trimmed health care costs through robust quality improvement efforts. Health Aff (Millwood). 2011;30(6):1185-1191. https://doi.org/10.1377/hlthaff.2011.0358.
8. James BC, Poulsen GP. The case for capitation. Harv Bus Rev. 2016;94(7-8):102-111,134. PubMed
9. Harvard Business Review. Harrison M. How a U.S. Health Care System Uses 15-Minute Huddles to Keep 23 Hospitals Aligned. https://hbr.org/2018/11/how-a-u-s-health-care-system-uses-15-minute-huddles-to-keep-23-hospitals-aligned. Published November, 2019. Accessed May 16, 2019.
Rapid dissemination and adoption of evidence-based guidelines remains a challenge despite studies showing that key evidence-based care processes improve outcomes in sepsis and heart failure.1 Hospital medicine was virtually founded on the premise that hospitalists would be champions of delivering high-quality care. Hospitalists are now dealing with a new challenge—unprecedented growth of healthcare systems because of mergers and acquisitions. The year 2018 was a banner time for healthcare mergers and acquisitions, with a total of 1,182, up 14% from 2017.2 These are in response to the belief that healthcare systems may better navigate the mixed reimbursement models of fee-for-service and fee-for-value by achieving a larger patient base and economies of scale. Hospitalists must now achieve consistent, evidence-based standards of care across larger networks by educating their colleagues (often separated by large geographic areas) to manifest durable changes in their group practice with demonstrable improvement in patient outcomes and cost savings.
The study by Yurso et al. focused on implementing an education program, which included standardized learning through Clinical Performance and Value (CPV) vignettes with process measurement and feedback for sepsis and heart failure.3 Sepsis and heart failure have been a focus for treatment standardization because of the associated morbidity, mortality, and high cost of care. The study by Yurso et al. is a prospective quasi-controlled cohort of hospitalists in eight hospitals who were matched with comparator hospitalists in six nonparticipating hospitals across the AdventHealth system. Measurement and feedback were provided using CPV vignettes. Over two years, hospitalists who participated improved CPV scores by 8%, compliance with the utilization of the three-hour sepsis bundle from 46.0% to 57.5%, and orders of essential medical treatment elements for heart failure from 58.2% to 72.1%. In year one, the average length of stay (LOS) observed/expected (O/E) rates dropped by 8% for participating hospitalists compared with 2.5% in the comparator group. By year two, cost O/E rates improved slightly resulting in cost savings. The authors concluded that CPV case simulation-based measurement and feedback helped drive improvements in evidence-based care, which was associated with lower costs and shorter LOS.
While studies using traditional didactic CME struggle to demonstrate changes in practice leading to improved patient outcomes,4 the study by Yurso et al. gives a glimpse into how simulation can be used to help improve clinical performance and measure adherence to best practice. A remarkably similar study used CPV for simulated patients with serial performance measurement and feedback for heart failure and pneumonia. The study showed reduced practice variation between hospitalists at 11 hospitals across four states and decreased LOS and readmissions. However, the sole clinical outcome was no change in in-house mortality.5 Another study using CPV training in breast cancer treatment demonstrated increased adherence to evidence-based practice standards and decreased variation in care between providers across four states.6 Of note, this study did not include clinical outcomes. These studies collectively imply that simulation training with interactive learning, educational feedback, repetitive practice, and curriculum integration has shown modest success in creating practice change and improving adherence to best practice standards. However, they have minimal measures of patient outcomes and fairly simple analyses for cost savings. Because the education is computer-based and feedback can be performed remotely, it can be deployed across large and diverse growing healthcare systems. To really move the needle, future research in the field of simulation should identify optimal simulation methods and be designed with more rigor to include patient and cost outcomes.
At Intermountain Healthcare, hospitalist expansion occurred through a strategic realignment from the different geographic regions into the One Intermountain model. This model is built on the commitment that our patients will receive the same high-quality, high-value care wherever they walk through our doors. We have found four substantive changes have been particularly powerful in spurring a group practice mentality toward standardizing best practice. One, hospitalists are now aligned across the system under a single operational leadership structure that encourages combined efforts to share best practices and develop and deploy strategic initiatives around them. Two, hospitalists continue to build on a culture of quality and measure what matters to patients. While Intermountain Healthcare has a long history of using quality improvement to achieve better patient outcomes and lower costs,7 the new structure is allowing our group to test novel methods including redesigned education to see what actually improves adherence to best practice. Three, the group knows where the system’s reimbursement is coming from; Intermountain Healthcare has transitioned to a larger percentage of capitation,8 currently about 40%, with a strong commitment to partner with services geared to transition patients home quickly and keep them at home. Four, the organization has created a structure of accountability and reporting; an executive-sponsored systemwide operating model has been designed to cut through system barriers being identified by the frontline, allowing them to be rapidly surfaced and then solved at the executive level through daily huddles.9
Innovative educational programs such as the one described in the study by Yurso et al. that help the busy hospitalist achieve improved adherence to best practice are likely to be an important component leading to improved outcomes, but only after a group has been structured for success. As hospitalist groups continue to act as a single effector arm for high-value care, this will help meet the expectations of our patients and deliver on the promise of our field.
Disclosures: Dr. Srivastava is a physician founder of the I- PASS Patient Safety Institute. His employer, Intermountain Healthcare owns his equity in the I-PASS Patient Safety Institute. Dr. Srivastava is supported in part by the Children’s Hospital Association for his work as an executive council member of the Pediatric Research in Inpatient Settings (PRIS) network. Dr. Srivastava has received monetary awards, honorariums, and travel reimbursement from multiple academic and professional organizations for talks about pediatric hospitalist research networks and quality of care. All other authors have nothing to disclose. No funding was provided for this editorial.
Disclosures
The authors have no disclosures of financial conflicts of interest.
Funding
Dr. Walke was supported an award from the Health Resources and Services Administration Geriatric Workforce Enhancement Program to the University of Pennsylvania (U1QHP28720).
1. Seymour, CW, Geston F, Prescott HC, et al. Time to treatment and mortality during mandated emergency care for sepsis. N Engl J Med. 2017;376(23):2235-2244. https://doi.org/10.1056/NEJMoa1703058.
2. Healthcare Finance. Lagasse J. Healthcare mergers and acquisitions had record year in 2018, up 14.4 percent.https://webcache.googleusercontent.com/search?q=cache:zoMrl9yoLokJ:https://www.healthcarefinancenews.com/news/healthcare-mergers-and-acquisitions-had-record-year-2018-144-percent+&cd=2&hl=en&ct=clnk&gl=us. Published January, 2019. Accessed April 26, 2019.
3. Yurso M, Box B, Burgon T, et al. Reducing unneeded clinical variation in sepsis and heart failure care to improve outcomes and reduce cost: a collaborative engagement with hospitalists in a multi-state system. J Hosp Med. 2019;14(9):542-546. https://doi.org/10.12788/jhm.3220.
4. Cervero RM, Gaines JK. The impact of CME on physician performance and patient health outcomes: an updated synthesis of systematic reviews. J Contin Educ Health Prof. 2015;35(2):131-138. https://doi.org/10.1002/chp.21290.
5. Weems L, Strong J, Plummer D, et al. A quality collaboration in heart failure and pneumonia inpatient care at Novant Health: standardizing hospitalist practices to improve patient care and system performance. Jt Comm J Qual Patient Saf. 2019;45(3):199-206. https://doi.org/10.1016/j.jcjq.2018.09.005.
6. Peabody JW, Paculdo DR, Tamondong-Lachica D, et al. Improving clinical practice using a novel engagement approach; measurement, benchmarking and feedback; a longitudinal study. J Clin Med Res. 2016;8(9):633-640. https://doi.org/10.14740/jocmr2620w.
7. James BC, Savitz LA. How Intermountain trimmed health care costs through robust quality improvement efforts. Health Aff (Millwood). 2011;30(6):1185-1191. https://doi.org/10.1377/hlthaff.2011.0358.
8. James BC, Poulsen GP. The case for capitation. Harv Bus Rev. 2016;94(7-8):102-111,134. PubMed
9. Harvard Business Review. Harrison M. How a U.S. Health Care System Uses 15-Minute Huddles to Keep 23 Hospitals Aligned. https://hbr.org/2018/11/how-a-u-s-health-care-system-uses-15-minute-huddles-to-keep-23-hospitals-aligned. Published November, 2019. Accessed May 16, 2019.
© 2019 Society of Hospital Medicine
Why Every Hospital Should (Must) Have an ACE Unit by 2040
Like the rest of the world, the United States is experiencing an aging boom. The number of adults aged 65 years or older is expected to grow from 49 million in 2016 to 82 million in 2040, indicating an increase of 67%. Even more impressively, the population of individuals aged 85 years or older is expected to increase by 129% to 14.6 million within this same time period.1 Considering that one in five Medicare Fee for Service beneficiaries are hospitalized at least once a year,2 hospitals can expect the number of adults over the age of 65 requiring acute care will substantially increase over the next 20 years. These demographic changes have important implications for the overall healthcare costs in the US. Of persons with the highest annual healthcare expenditures, 40% are 65 years of age or older. 3 Thus, optimizing the care of hospitalized older adults will remain a critical component in the management of healthcare costs in the next 20 years.
As such, the Acute Care for the Elderly (ACE) unit, an interprofessional model of care that has been shown to provide high-quality care to hospitalized older adults without increasing costs,4 will become an increasingly important component of acute care as the older adult population grows. In this edition of the Journal of Hospital Medicine, Brennan et al.5 describe a quality improvement initiative in which an interprofessional team that included a geriatric clinician, nurses, pharmacist, and chaplain developed a daily plan of care for ACE unit patients aged 70 years or older. The daily care plan, which focused on symptom management and advance care planning, was the nidus for collaboration between the hospital medicine attending and geriatrics team. Their results demonstrate that ACE unit patients had lower hospital costs and shorter lengths of stay (LOS) as compared with age-matched, usual-care patients despite having higher comorbidity scores. In addition, the greatest benefits were seen among persons in the highest quartile of the comorbidity score.
These results add to the small but consistent body of literature that demonstrates quality and cost benefits to the ACE unit care. Importantly, however, in contrast with the prior ACE unit studies in which persons with moderate risk were the ones to demonstrate the greatest benefits, Brennan et al.5 were able to demonstrate the greatest effect for the highest-need, highest-cost population. Reasons for this impressive effect may be attributed to this intervention’s specific emphasis on symptom management and estimated life expectancy. In an era when Medicare and other payers are looking to increase the value proposition in population health-based approaches by reducing high costs while preserving high quality, these findings represent an important example that merits a broader dissemination.
Of course, ACE units are not the only hospital-based programs that have shown to improve outcomes for older adults. The Hospital Elder Life Program (HELP) is an evidence-based delirium prevention intervention that has been shown to not only prevent delirium but also prevent cognitive and functional decline while decreasing hospital LOS, hospital falls, and sitter use.6 Moreover, similar to ACE units, HELP has been shown to reduce inhospital patient costs. Geriatrics surgery comanagement programs are another hospital-based intervention that has shown to improve outcomes for older surgical patients. Reductions in LOS, improved mobility, and higher discharge to home have been demonstrated in patients who have undergone spinal surgery.7 Decreased LOS and lower hospital costs have also been demonstrated among patients with hip fracture undergoing repair.8 Programs such as ACE units, HELP, and geriatric surgery comanagement are well aligned with the growing emphasis on value-based healthcare and will be especially needed by hospitals that strive to be high-reliability organizations as the number of adults aged 65 and older continues to grow. To date, few studies have explored the potential synergistic effects (or redundancies) of these programs and how to maximize the impact of these evidence-based interventions across healthcare systems with multiple hospitals that care for older adults from various socioeconomic and cultural backgrounds.
Looking toward the future, the implementation of ACE units and other innovative geriatric programs will equip hospitals to develop into Age-Friendly Health Systems (AFHS). AFHS is an initiative being led by the Institute for Healthcare Improvement, The John A. Hartford Foundation, the American Hospital Association, and the Catholic Health Association of the United States in partnership with several other leading healthcare organizations to provide high-value care to every older adult.9 AFHS provide care focused on the 4M framework—What Matters, Medications, Mobility, and Mentation. The goal is for 20% of hospitals and medical practices to join the AFHS initiative by 2020; to date, over 70 organizations nationwide have done so. Clearly, to reach this goal, and beyond, a greater collaboration between aging-focused interprofessional teams including geriatricians and hospitalists will be essential.
Given the aging demographic and rising healthcare costs, Brennan et al.’s work5 suggests that each hospital should have an ACE unit by 2040. Consistently, hospital care delivery has appropriately developed in response to the needs of the patient population served. Intensive care units (ICUs), dialysis units, and emergency rooms are just a few innovations that were adopted by hospitals to provide specialty care to individuals with complex acute illnesses. While technology within the ICU certainly plays a role in the care delivered in that setting, it could be argued that what makes the ICUs most effective is the cohorting of interprofessional expertise. Since the implementation of ICUs, the survival rate for critically ill patients has substantially improved and additional specialty units with an interprofessional team model, eg, cardiac care units, dialysis units, emergency rooms, etc., have followed suit. Specialty units have become a part of the fabric of acute care, so much so that it would be hard to imagine a modern hospital without an ICU, dialysis unit, or emergency room. The same should be true for ACE units. Even hospitals without geriatricians on site can use teleconferencing to successfully implement an ACE unit.10 We owe it to our older patients to transform our institutions into AFHS; implementing models of care proven to improve outcomes, such as the ACE unit, is one of the critical first steps.
Disclosures
The authors have no disclosures or financial conflicts of interest.
Funding
Dr. Walke was supported by an award from the Health Resources and Services Administration Geriatric Workforce Enhancement Program to the University of Pennsylvania (U1QHP28720
1. Administration for Community Living. Profile of older adults: 2017. https://acl.gov/sites/default/files/Aging%20and%20Disability%20in%20America/2017OlderAmericansProfile.pdf Accessed April 22, 2019.
2. Gorina Y, Pratt LA, Kramarow EA, Elgaddal N. Hospitalization, readmission, and death experience of noninstitutionalized Medicare fee-for-service beneficiaries aged 65 and over. Hyattsville, MD: National Center for Health Statistics. 2015. PubMed
3. Agency for Healthcare Research and Quality, Medical Expenditure Panel Survey, Household Component 2015. https://meps.ahrq.gov/data_files/publications/st506/stat506.shtml Accessed April 1, 2019.
4. Landefeld CS, Palmer RM, Kresevic DM, Fortinsky RH, Kowal J. A randomized trial of care in a hospital medical unit especially designed to improve the functional outcomes of acutely ill older adults. N Engl J Med. 1995;332(20):1338-1344. https://doi.org/10.1056/NEJM199505183322006.
5. Brennan M, Knee A, Leahy E, et al. An acute care for elders QI program for complex, high cost patients yields savings for the system. J Hosp Med. 2019;14(9):527-533. https://doi.org/10.12788/jhm.3198.
6. Hospital Elder Life Program. https://www.hospitalelderlifeprogram.org/about/results/ Accessed May 6, 2019.
7. Adogwa O, Elsamadicy AA, Vuong VD, et al. Geriatric comanagement reduces perioperative complications and shortens duration of hospital stay after lumbar spine surgery: a prospective single-institution experience. J Neurosurg Spine. 2017;27(6):670-675. https://doi.org/10.3171/2017.5.SPINE17199.
8. Della Rocca GJ, Moylan KC, Crist BD, Volgas DA, Stannard JP, Mehr DR. Comanagement of geriatric patients with hip fracutues: a retrospective, controlled, cohort study. Geriatr Orthop Surg & Rehab.2013;4(1):10-15. https://doi.org/10.1177/2151458513495238.
9. Institute for Healthcare Improvement. http://www.ihi.org/Engage/Initiatives/Age-Friendly-Health-Systems/Pages/default.aspx. Accessed May 6, 2019.
10. Malone ML, Vollbrecht M, Stephenson J, Burke L, Pagel P, Goodwin JS. Acute Care for Elders (ACE) tracker and e-geriatrician: methods to disseminate ACE concepts to hospitals with no geriatricians on staff. J Am Geriatr Soc. 2010;58(1):161-167. https://doi.org/10.1111/j.1532-5415.2009.02624.x.
Like the rest of the world, the United States is experiencing an aging boom. The number of adults aged 65 years or older is expected to grow from 49 million in 2016 to 82 million in 2040, indicating an increase of 67%. Even more impressively, the population of individuals aged 85 years or older is expected to increase by 129% to 14.6 million within this same time period.1 Considering that one in five Medicare Fee for Service beneficiaries are hospitalized at least once a year,2 hospitals can expect the number of adults over the age of 65 requiring acute care will substantially increase over the next 20 years. These demographic changes have important implications for the overall healthcare costs in the US. Of persons with the highest annual healthcare expenditures, 40% are 65 years of age or older. 3 Thus, optimizing the care of hospitalized older adults will remain a critical component in the management of healthcare costs in the next 20 years.
As such, the Acute Care for the Elderly (ACE) unit, an interprofessional model of care that has been shown to provide high-quality care to hospitalized older adults without increasing costs,4 will become an increasingly important component of acute care as the older adult population grows. In this edition of the Journal of Hospital Medicine, Brennan et al.5 describe a quality improvement initiative in which an interprofessional team that included a geriatric clinician, nurses, pharmacist, and chaplain developed a daily plan of care for ACE unit patients aged 70 years or older. The daily care plan, which focused on symptom management and advance care planning, was the nidus for collaboration between the hospital medicine attending and geriatrics team. Their results demonstrate that ACE unit patients had lower hospital costs and shorter lengths of stay (LOS) as compared with age-matched, usual-care patients despite having higher comorbidity scores. In addition, the greatest benefits were seen among persons in the highest quartile of the comorbidity score.
These results add to the small but consistent body of literature that demonstrates quality and cost benefits to the ACE unit care. Importantly, however, in contrast with the prior ACE unit studies in which persons with moderate risk were the ones to demonstrate the greatest benefits, Brennan et al.5 were able to demonstrate the greatest effect for the highest-need, highest-cost population. Reasons for this impressive effect may be attributed to this intervention’s specific emphasis on symptom management and estimated life expectancy. In an era when Medicare and other payers are looking to increase the value proposition in population health-based approaches by reducing high costs while preserving high quality, these findings represent an important example that merits a broader dissemination.
Of course, ACE units are not the only hospital-based programs that have shown to improve outcomes for older adults. The Hospital Elder Life Program (HELP) is an evidence-based delirium prevention intervention that has been shown to not only prevent delirium but also prevent cognitive and functional decline while decreasing hospital LOS, hospital falls, and sitter use.6 Moreover, similar to ACE units, HELP has been shown to reduce inhospital patient costs. Geriatrics surgery comanagement programs are another hospital-based intervention that has shown to improve outcomes for older surgical patients. Reductions in LOS, improved mobility, and higher discharge to home have been demonstrated in patients who have undergone spinal surgery.7 Decreased LOS and lower hospital costs have also been demonstrated among patients with hip fracture undergoing repair.8 Programs such as ACE units, HELP, and geriatric surgery comanagement are well aligned with the growing emphasis on value-based healthcare and will be especially needed by hospitals that strive to be high-reliability organizations as the number of adults aged 65 and older continues to grow. To date, few studies have explored the potential synergistic effects (or redundancies) of these programs and how to maximize the impact of these evidence-based interventions across healthcare systems with multiple hospitals that care for older adults from various socioeconomic and cultural backgrounds.
Looking toward the future, the implementation of ACE units and other innovative geriatric programs will equip hospitals to develop into Age-Friendly Health Systems (AFHS). AFHS is an initiative being led by the Institute for Healthcare Improvement, The John A. Hartford Foundation, the American Hospital Association, and the Catholic Health Association of the United States in partnership with several other leading healthcare organizations to provide high-value care to every older adult.9 AFHS provide care focused on the 4M framework—What Matters, Medications, Mobility, and Mentation. The goal is for 20% of hospitals and medical practices to join the AFHS initiative by 2020; to date, over 70 organizations nationwide have done so. Clearly, to reach this goal, and beyond, a greater collaboration between aging-focused interprofessional teams including geriatricians and hospitalists will be essential.
Given the aging demographic and rising healthcare costs, Brennan et al.’s work5 suggests that each hospital should have an ACE unit by 2040. Consistently, hospital care delivery has appropriately developed in response to the needs of the patient population served. Intensive care units (ICUs), dialysis units, and emergency rooms are just a few innovations that were adopted by hospitals to provide specialty care to individuals with complex acute illnesses. While technology within the ICU certainly plays a role in the care delivered in that setting, it could be argued that what makes the ICUs most effective is the cohorting of interprofessional expertise. Since the implementation of ICUs, the survival rate for critically ill patients has substantially improved and additional specialty units with an interprofessional team model, eg, cardiac care units, dialysis units, emergency rooms, etc., have followed suit. Specialty units have become a part of the fabric of acute care, so much so that it would be hard to imagine a modern hospital without an ICU, dialysis unit, or emergency room. The same should be true for ACE units. Even hospitals without geriatricians on site can use teleconferencing to successfully implement an ACE unit.10 We owe it to our older patients to transform our institutions into AFHS; implementing models of care proven to improve outcomes, such as the ACE unit, is one of the critical first steps.
Disclosures
The authors have no disclosures or financial conflicts of interest.
Funding
Dr. Walke was supported by an award from the Health Resources and Services Administration Geriatric Workforce Enhancement Program to the University of Pennsylvania (U1QHP28720
1. Administration for Community Living. Profile of older adults: 2017. https://acl.gov/sites/default/files/Aging%20and%20Disability%20in%20America/2017OlderAmericansProfile.pdf Accessed April 22, 2019.
2. Gorina Y, Pratt LA, Kramarow EA, Elgaddal N. Hospitalization, readmission, and death experience of noninstitutionalized Medicare fee-for-service beneficiaries aged 65 and over. Hyattsville, MD: National Center for Health Statistics. 2015. PubMed
3. Agency for Healthcare Research and Quality, Medical Expenditure Panel Survey, Household Component 2015. https://meps.ahrq.gov/data_files/publications/st506/stat506.shtml Accessed April 1, 2019.
4. Landefeld CS, Palmer RM, Kresevic DM, Fortinsky RH, Kowal J. A randomized trial of care in a hospital medical unit especially designed to improve the functional outcomes of acutely ill older adults. N Engl J Med. 1995;332(20):1338-1344. https://doi.org/10.1056/NEJM199505183322006.
5. Brennan M, Knee A, Leahy E, et al. An acute care for elders QI program for complex, high cost patients yields savings for the system. J Hosp Med. 2019;14(9):527-533. https://doi.org/10.12788/jhm.3198.
6. Hospital Elder Life Program. https://www.hospitalelderlifeprogram.org/about/results/ Accessed May 6, 2019.
7. Adogwa O, Elsamadicy AA, Vuong VD, et al. Geriatric comanagement reduces perioperative complications and shortens duration of hospital stay after lumbar spine surgery: a prospective single-institution experience. J Neurosurg Spine. 2017;27(6):670-675. https://doi.org/10.3171/2017.5.SPINE17199.
8. Della Rocca GJ, Moylan KC, Crist BD, Volgas DA, Stannard JP, Mehr DR. Comanagement of geriatric patients with hip fracutues: a retrospective, controlled, cohort study. Geriatr Orthop Surg & Rehab.2013;4(1):10-15. https://doi.org/10.1177/2151458513495238.
9. Institute for Healthcare Improvement. http://www.ihi.org/Engage/Initiatives/Age-Friendly-Health-Systems/Pages/default.aspx. Accessed May 6, 2019.
10. Malone ML, Vollbrecht M, Stephenson J, Burke L, Pagel P, Goodwin JS. Acute Care for Elders (ACE) tracker and e-geriatrician: methods to disseminate ACE concepts to hospitals with no geriatricians on staff. J Am Geriatr Soc. 2010;58(1):161-167. https://doi.org/10.1111/j.1532-5415.2009.02624.x.
© 2019 Society of Hospital Medicine
Patient Perspective is Critical in Developing Interventions for Frequently Admitted Patients
In the context of rapidly rising healthcare costs and increasing disparities in health outcomes in the United States, there has been increasing interest in identifying and addressing the needs of our country’s most frequently admitted patients. These patients account for a disproportionate percentage of healthcare expenditures1-3; they also represent a vulnerable and high-risk population. Finding solutions to address the needs of these patients is important for the patients themselves and for the systems in which they receive care. The last 10-15 years have seen a proliferation of programs working to address the needs and contain the costs of frequently admitted patients,2,4-6 as well as increased interest in understanding the risk factors and drivers that lead to high utilization.
In this edition of the Journal of Hospital Medicine, O’Leary et al. report on their study of patients enrolled in the CHAMP program at Northwestern University, in which the authors elicit patients’ perceptions of factors contributing to the onset and continuation of high hospital use.7 The authors identify several themes, including the important role of psychological, social, and economic factors in course fluctuation, the perception of acute illness as uncontrollable and unpredictable, and a strong desire to avoid hospitalization. As a group, the themes suggest multiple strategies that may be of use in developing individualized plans for patients.
Several of the most commonly cited risk factors for high utilization—including mental health issues, housing insecurity or homelessness, and substance use2,3,8,9—did not emerge as themes identified by patients in this study as contributing to high hospital utilization. Although identified themes such as social support and psychological stress could certainly be related to these underlying risk factors, the risk factors themselves did not emerge. This is particularly notable in a population whose utilization is in line with other studies (participants had at least two unplanned 30-day inpatient readmissions within 12 months, and one readmission in the last six months, a referral, or at least three observation visits). In contrast to prior qualitative work with complex, high-needs patients,10 patients in this study did not identify difficult (or positive) relationships with care provider teams, or a history of early life trauma, as factors related to current utilization.
These findings raise several important questions. To what extent are frequently hospitalized patient populations comparable with each other? This is both a question about how populations are defined and a question about the inherent variability between populations (including geographic, social, socioeconomic, and other factors). It is not evident from the demographic information provided whether this population is fundamentally different from others that have been studied, or whether risk factors such as mental health issues, housing insecurity, substance abuse, and trauma history are present, but are just not identified by patients here as proximal contributors to their utilization. In either case, the findings raise important questions about the development of effective interventions for these patients. The discrepancies also highlight the utility of ascertaining and reporting the prevalence of these risk factors among study populations, ideally both among patients who opt in and those who opt out. Although obtaining this information adds an additional layer of complexity to data collection, this history, along with extended demographic data, would significantly improve our ability to assess the comparability of populations across studies. It would also help us understand whether perspectives of any specific groups of patients are not represented, due to frequent opting out of the study.
The fact that commonly identified risk factors for high utilization are not identified by patients in this study as contributing to their high hospital use highlights the importance of (1) including the patient perspective as an integral part of care plan and intervention development and (2) continuing local work aimed at understanding the risk factors and drivers of high utilization in specific populations. Many programs, including CHAMP at Northwestern and our own hospitalist-run program at Penn Medicine, work closely with patients to develop individualized care plans that aim to address the underlying drivers of high utilization. In our experience, a multidisciplinary committee reviewing patient cases has identified mental health conditions as likely drivers of frequent admissions in over 95% of program patients. In line with the findings here, however, patients themselves often do not see mental health as a significant contributor. If patients do not see factors such as mental health as important, this has significant implications for the development of interventions around these factors as part of a solution to high hospital use.
Patients are unlikely to respond to interventions targeting problems that they themselves do not identify as important. This is not to say that drivers such as mental health, housing instability, substance abuse, and behaviors rooted in childhood trauma cannot be addressed if they are not identified by a patient as problems. Rather, interventions must be sensitive to and developed within the context of the patient’s own perceptions and priorities. For any program aimed at addressing the underlying drivers of high utilization, therefore, it is critical to elicit individual patient perspectives and to incorporate them in the development of interventions tailored to a specific patient’s needs. This process not only informs the creation of an individualized care plan but also promotes engagement and builds trust.
In prior work,6 O’Leary et al. have joined others throughout the field in calling for standardized definitions of “high utilizers”; this is critical for our ability to compare study results across programs. However, standardizing definitions is just the first step. Individual site studies such as this are needed to help us understand which themes are universal, versus those that are population- and site-specific. They are also important for individual institutions in targeting, developing, and refining local interventions. As a whole, the results will help guide the development of best practices within the field and allow providers to better understand the needs of specific populations. This work is essential to our ability as providers, hospitals, and systems to develop effective interventions for individual patients in this heterogeneous, vulnerable, and high-risk population.
Disclosures
Dr. Knox and Dr. Greysen have nothing to disclose.
1. Stanton MW, Rutherford MK. The high concentration of U.S. health care expenditures. Research in Action Issue 19. 2005. Rockville, MD: Agency for Healthcare Research and Quality.
2. Center for Health Care Strategies (CHCS). “Super-utilizer summit: common themes from innovative complex care management programs.” CHCS. 2013.
3. Jiang H, Weiss A, Barrett M, Sheng M. Characteristics of hospital stays for super-utilizers by payer, 2012: Statistical Brief #190. PubMed
4. Bodenheimer T. Strategies to reduce costs and improve care for high-utilizing medicaid patients: reflections on pioneering programs. CHCS. 2013.
5. Hong C , Siegel A, Ferris T. Caring for high-need, high-cost patients: what makes for a successful care management program? New York (NY): Commonwealth Fund. 2014;19(1):1-19. PubMed
6. Goodwin A, Henschen BL, O’Dwyer LC, Nichols N, O’Leary KJ. Interventions for frequently hospitalized patients and their effect on outcomes: a systematic review. J Hosp Med. 2018;13(12):853-859. https://doi.org/10.12788/jhm.3090.
7. O’Leary K, Chapman M, Shandu F et al. Frequently hospitalized patients’ perceptions of factors contributing to high hospital use. J Hosp Med. 2019;14(9):521-526. https://doi.org/10.12788/jhm.3175.
8. Johnson TL, Rinehart DJ, Durfee J, et al. For many patients who use large amounts of health care services, the need is intense yet temporary. Health Aff. 2015;34(8):1312-1319. https://doi.org/10.1377/hlthaff.2014.1186.
9. Rinehart DJ, Oronce C, Durfee MJ, et al. Identifying subgroups of adult superutilizers in an urban safety-net system using latent class analysis: implications for clinical practice. Med Care. 2018;56(1):e1-e9. https://doi.org/10.1097/MLR.0000000000000628.
10. Mautner DB, Pang H, Brenner JC, et al. Generating hypotheses about care needs of high utilizers: lessons from patient interviews. Popul Health Manag. 2013;16(1):S26-S33. https://doi.org/10.1089/pop.2013.0033.
In the context of rapidly rising healthcare costs and increasing disparities in health outcomes in the United States, there has been increasing interest in identifying and addressing the needs of our country’s most frequently admitted patients. These patients account for a disproportionate percentage of healthcare expenditures1-3; they also represent a vulnerable and high-risk population. Finding solutions to address the needs of these patients is important for the patients themselves and for the systems in which they receive care. The last 10-15 years have seen a proliferation of programs working to address the needs and contain the costs of frequently admitted patients,2,4-6 as well as increased interest in understanding the risk factors and drivers that lead to high utilization.
In this edition of the Journal of Hospital Medicine, O’Leary et al. report on their study of patients enrolled in the CHAMP program at Northwestern University, in which the authors elicit patients’ perceptions of factors contributing to the onset and continuation of high hospital use.7 The authors identify several themes, including the important role of psychological, social, and economic factors in course fluctuation, the perception of acute illness as uncontrollable and unpredictable, and a strong desire to avoid hospitalization. As a group, the themes suggest multiple strategies that may be of use in developing individualized plans for patients.
Several of the most commonly cited risk factors for high utilization—including mental health issues, housing insecurity or homelessness, and substance use2,3,8,9—did not emerge as themes identified by patients in this study as contributing to high hospital utilization. Although identified themes such as social support and psychological stress could certainly be related to these underlying risk factors, the risk factors themselves did not emerge. This is particularly notable in a population whose utilization is in line with other studies (participants had at least two unplanned 30-day inpatient readmissions within 12 months, and one readmission in the last six months, a referral, or at least three observation visits). In contrast to prior qualitative work with complex, high-needs patients,10 patients in this study did not identify difficult (or positive) relationships with care provider teams, or a history of early life trauma, as factors related to current utilization.
These findings raise several important questions. To what extent are frequently hospitalized patient populations comparable with each other? This is both a question about how populations are defined and a question about the inherent variability between populations (including geographic, social, socioeconomic, and other factors). It is not evident from the demographic information provided whether this population is fundamentally different from others that have been studied, or whether risk factors such as mental health issues, housing insecurity, substance abuse, and trauma history are present, but are just not identified by patients here as proximal contributors to their utilization. In either case, the findings raise important questions about the development of effective interventions for these patients. The discrepancies also highlight the utility of ascertaining and reporting the prevalence of these risk factors among study populations, ideally both among patients who opt in and those who opt out. Although obtaining this information adds an additional layer of complexity to data collection, this history, along with extended demographic data, would significantly improve our ability to assess the comparability of populations across studies. It would also help us understand whether perspectives of any specific groups of patients are not represented, due to frequent opting out of the study.
The fact that commonly identified risk factors for high utilization are not identified by patients in this study as contributing to their high hospital use highlights the importance of (1) including the patient perspective as an integral part of care plan and intervention development and (2) continuing local work aimed at understanding the risk factors and drivers of high utilization in specific populations. Many programs, including CHAMP at Northwestern and our own hospitalist-run program at Penn Medicine, work closely with patients to develop individualized care plans that aim to address the underlying drivers of high utilization. In our experience, a multidisciplinary committee reviewing patient cases has identified mental health conditions as likely drivers of frequent admissions in over 95% of program patients. In line with the findings here, however, patients themselves often do not see mental health as a significant contributor. If patients do not see factors such as mental health as important, this has significant implications for the development of interventions around these factors as part of a solution to high hospital use.
Patients are unlikely to respond to interventions targeting problems that they themselves do not identify as important. This is not to say that drivers such as mental health, housing instability, substance abuse, and behaviors rooted in childhood trauma cannot be addressed if they are not identified by a patient as problems. Rather, interventions must be sensitive to and developed within the context of the patient’s own perceptions and priorities. For any program aimed at addressing the underlying drivers of high utilization, therefore, it is critical to elicit individual patient perspectives and to incorporate them in the development of interventions tailored to a specific patient’s needs. This process not only informs the creation of an individualized care plan but also promotes engagement and builds trust.
In prior work,6 O’Leary et al. have joined others throughout the field in calling for standardized definitions of “high utilizers”; this is critical for our ability to compare study results across programs. However, standardizing definitions is just the first step. Individual site studies such as this are needed to help us understand which themes are universal, versus those that are population- and site-specific. They are also important for individual institutions in targeting, developing, and refining local interventions. As a whole, the results will help guide the development of best practices within the field and allow providers to better understand the needs of specific populations. This work is essential to our ability as providers, hospitals, and systems to develop effective interventions for individual patients in this heterogeneous, vulnerable, and high-risk population.
Disclosures
Dr. Knox and Dr. Greysen have nothing to disclose.
1. Stanton MW, Rutherford MK. The high concentration of U.S. health care expenditures. Research in Action Issue 19. 2005. Rockville, MD: Agency for Healthcare Research and Quality.
2. Center for Health Care Strategies (CHCS). “Super-utilizer summit: common themes from innovative complex care management programs.” CHCS. 2013.
3. Jiang H, Weiss A, Barrett M, Sheng M. Characteristics of hospital stays for super-utilizers by payer, 2012: Statistical Brief #190. PubMed
4. Bodenheimer T. Strategies to reduce costs and improve care for high-utilizing medicaid patients: reflections on pioneering programs. CHCS. 2013.
5. Hong C , Siegel A, Ferris T. Caring for high-need, high-cost patients: what makes for a successful care management program? New York (NY): Commonwealth Fund. 2014;19(1):1-19. PubMed
6. Goodwin A, Henschen BL, O’Dwyer LC, Nichols N, O’Leary KJ. Interventions for frequently hospitalized patients and their effect on outcomes: a systematic review. J Hosp Med. 2018;13(12):853-859. https://doi.org/10.12788/jhm.3090.
7. O’Leary K, Chapman M, Shandu F et al. Frequently hospitalized patients’ perceptions of factors contributing to high hospital use. J Hosp Med. 2019;14(9):521-526. https://doi.org/10.12788/jhm.3175.
8. Johnson TL, Rinehart DJ, Durfee J, et al. For many patients who use large amounts of health care services, the need is intense yet temporary. Health Aff. 2015;34(8):1312-1319. https://doi.org/10.1377/hlthaff.2014.1186.
9. Rinehart DJ, Oronce C, Durfee MJ, et al. Identifying subgroups of adult superutilizers in an urban safety-net system using latent class analysis: implications for clinical practice. Med Care. 2018;56(1):e1-e9. https://doi.org/10.1097/MLR.0000000000000628.
10. Mautner DB, Pang H, Brenner JC, et al. Generating hypotheses about care needs of high utilizers: lessons from patient interviews. Popul Health Manag. 2013;16(1):S26-S33. https://doi.org/10.1089/pop.2013.0033.
© 2019 Society of Hospital Medicine
Leadership & Professional Development: Searching for Ideas Close to Home
As hospitalists, many of us see things in our daily practice that help inform our efforts to improve quality of care, organizational efficiency, and medical education, and to reduce physician burnout. But many of those efforts, while well intended, lack rigorous empirical evaluation.
Indeed, it is the complexity of hospital care that leads scholars across many disciplines—including economics, epidemiology, and sociology—to look to hospital medicine as a place where “natural experimentation” can inform us about what works and doesn’t work in medical care. As a hospitalist and economist, I find that the very best of my ideas come from what I see in the hospital. And for many hospital-based clinicians and physician leaders, translating everyday insights into rigorous scientific explorations is not only feasible but is a natural extension of the curiosity that drives good clinical work. It is also a way to drive quality improvement.
Consider, for example, a question that hospitalists face every day: when to discharge a patient from the hospital. Hospital leaders and frontline clinicians are increasingly under pressure to discharge patients earlier and earlier, with some concerned that earlier discharge poses safety risks. Short of randomizing patients to earlier discharge and studying the effects on outcomes, how can a data-driven hospital leader identify which patients can be safely discharged earlier and how much earlier?
A simple observation of a practicing hospitalist could be a clue to elegantly and rigorously answering this question. It turns out that some patients happen to be hospitalized days before their birthday and it wouldn’t be absurd to think that a physician treating such a patient might be more likely to discharge that patient home on or before their birthday so they can celebrate it at home. The same might be true for patients who are in the hospital before an impending storm. Patient-level data could be used to assess whether length of stay is shorter for patients who are admitted to the hospital a few days before their birthday (or just before a storm), compared with otherwise similar patients admitted to the hospital several weeks earlier, and whether outcomes are any different, on average, or in specific subpopulations. For hospital leaders, this could not only be convincing “quasi-experimental” evidence that length of stay can be safely reduced, but it could also contribute to the scholarly literature.
How can hospitalists generate ideas like these, rigorously evaluate them, and translate them into practice? It turns out that examples such as these abound for the practicing hospitalist, yet few draw the link between these everyday phenomena and the larger question of how length of stay affects patient outcomes. To start, a systematic approach to generating ideas is important: “idea rounds”—a dedicated group discussion in which physicians and other providers brainstorm ideas for quality improvement—can leverage the wisdom of frontline clinicians. But, clever insights aren’t enough. Data and statistical expertise are needed, but with the growing use of electronic health record data and administrative data from large insurers, lack of data is less of a challenge. The larger challenge is data expertise. Data-driven hospital leaders should invest in personnel with statistical expertise to not only complement the scholarly endeavors of hospital medicine faculty, but also to conduct larger, more rigorous quality improvement studies. Particularly as hospitals are increasingly being measured and reimbursed on the basis of data-oriented quality-of-care metrics, it makes sense for hospital leaders to analogously invest in data infrastructure and the analytic capability to analyze that data. The innovation of this approach lies in the simple insight that the everyday activities of hospitalists can be used to answer interesting questions about what works, what doesn’t, and potentially why in healthcare.
Disclosures
Dr. Jena reports receiving consulting fees unrelated to this work from Pfizer, Hill Rom Services, Bristol Myers Squibb, Novartis, Amgen, Eli Lilly, Vertex Pharmaceuticals, AstraZeneca, Celgene, Tesaro, Sanofi Aventis, Biogen, Precision Health Economics, and Analysis Group.
Funding
Support was provided by the Office of the Director, National Institutes of Health (1DP5OD017897, Dr. Jena).
© 2019 Society of Hospital Medicine
Cognitive Biases Influence Decision-Making Regarding Postacute Care in a Skilled Nursing Facility
The combination of decreasing hospital lengths of stay and increasing age and comorbidity of the United States population is a principal driver of the increased use of postacute care in the US.1-3 Postacute care refers to care in long-term acute care hospitals, inpatient rehabilitation facilities, skilled nursing facilities (SNFs), and care provided by home health agencies after an acute hospitalization. In 2016, 43% of Medicare beneficiaries received postacute care after hospital discharge at the cost of $60 billion annually; nearly half of these received care in an SNF.4 Increasing recognition of the significant cost and poor outcomes of postacute care led to payment reforms, such as bundled payments, that incentivized less expensive forms of postacute care and improvements in outcomes.5-9 Early evaluations suggested that hospitals are sensitive to these reforms and responded by significantly decreasing SNF utilization.10,11 It remains unclear whether this was safe and effective.
In this context, increased attention to how hospital clinicians and hospitalized patients decide whether to use postacute care (and what form to use) is appropriate since the effect of payment reforms could negatively impact vulnerable populations of older adults without adequate protection.12 Suboptimal decision-making can drive both overuse and inappropriate underuse of this expensive medical resource. Initial evidence suggests that patients and clinicians are poorly equipped to make high-quality decisions about postacute care, with significant deficits in both the decision-making process and content.13-16 While these gaps are important to address, they may only be part of the problem. The fields of cognitive psychology and behavioral economics have revealed new insights into decision-making, demonstrating that people deviate from rational decision-making in predictable ways, termed decision heuristics, or cognitive biases.17 This growing field of research suggests heuristics or biases play important roles in decision-making and determining behavior, particularly in situations where there may be little information provided and the patient is stressed, tired, and ill—precisely like deciding on postacute care.18 However, it is currently unknown whether cognitive biases are at play when making hospital discharge decisions.
We sought to identify the most salient heuristics or cognitive biases patients may utilize when making decisions about postacute care at the end of their hospitalization and ways clinicians may contribute to these biases. The overall goal was to derive insights for improving postacute care decision-making.
METHODS
Study Design
We conducted a secondary analysis on interviews with hospital and SNF clinicians as well as patients and their caregivers who were either leaving the hospital for an SNF or newly arrived in an SNF from the hospital to understand if cognitive biases were present and how they manifested themselves in a real-world clinical context.19 These interviews were part of a larger qualitative study that sought to understand how clinicians, patients, and their caregivers made decisions about postacute care, particularly related to SNFs.13,14 This study represents the analysis of all our interviews, specifically examining decision-making bias. Participating sites, clinical roles, and both patient and caregiver characteristics (Table 1) in our cohort have been previously described.13,14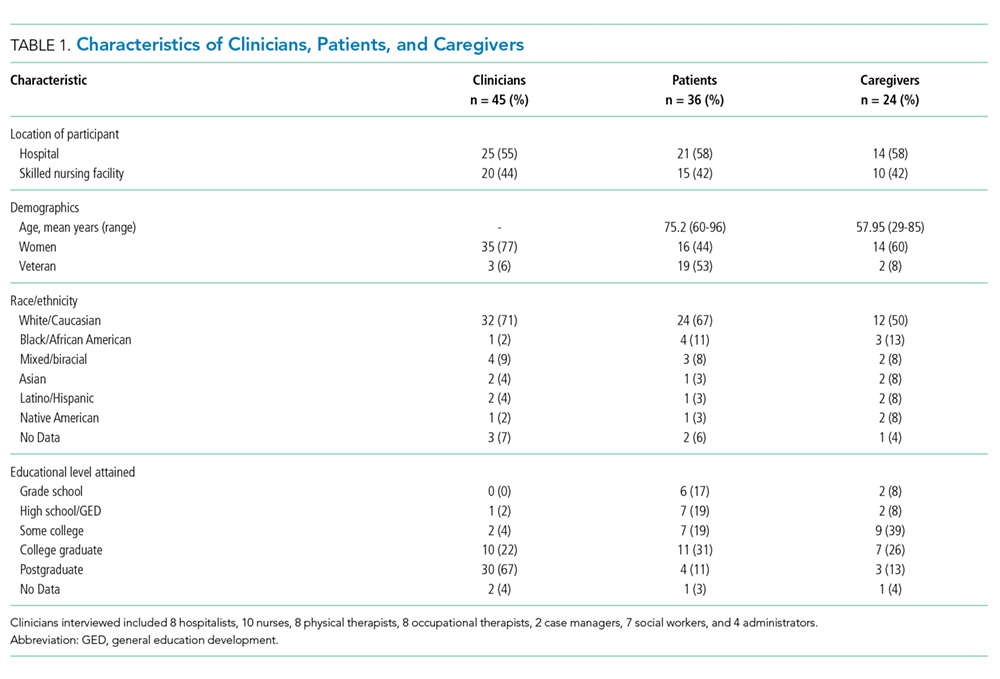
Analysis
We used a team-based approach to framework analysis, which has been used in other decision-making studies14, including those measuring cognitive bias.20 A limitation in cognitive bias research is the lack of a standardized list or categorization of cognitive biases. We reviewed prior systematic17,21 and narrative reviews18,22, as well as prior studies describing examples of cognitive biases playing a role in decision-making about therapy20 to construct a list of possible cognitive biases to evaluate and narrow these a priori to potential biases relevant to the decision about postacute care based on our prior work (Table 2).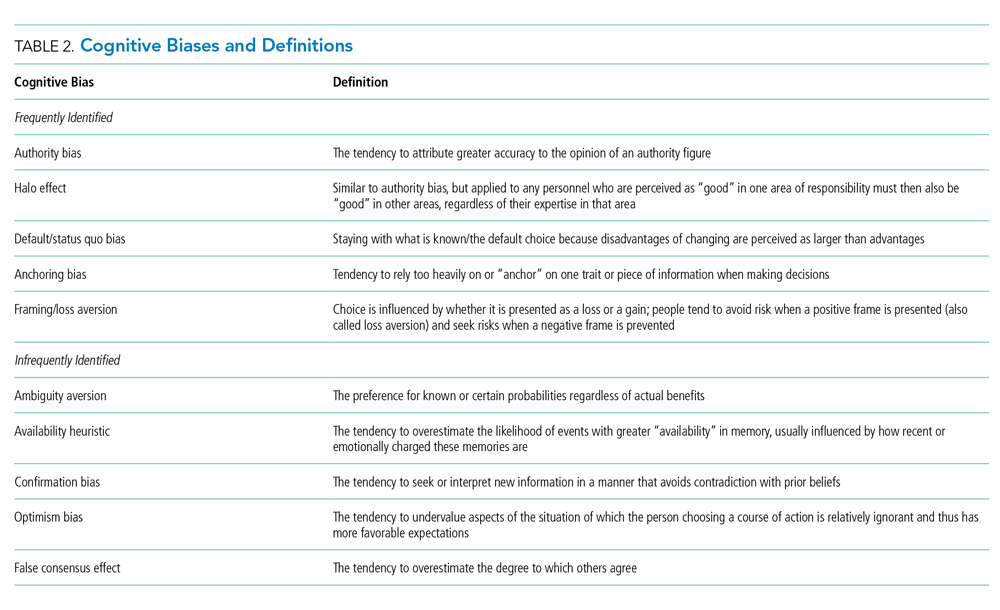
We applied this framework to analyze transcripts through an iterative process of deductive coding and reviewing across four reviewers (ML, RA, AL, CL) and a hospitalist physician with expertise leading qualitative studies (REB).
Intercoder consensus was built through team discussion by resolving points of disagreement.23 Consistency of coding was regularly checked by having more than one investigator code individual manuscripts and comparing coding, and discrepancies were resolved through team discussion. We triangulated the data (shared our preliminary results) using a larger study team, including an expert in behavioral economics (SRG), physicians at study sites (EC, RA), and an anthropologist with expertise in qualitative methods (CL). We did this to ensure credibility (to what extent the findings are credible or believable) and confirmability of findings (ensuring the findings are based on participant narratives rather than researcher biases).
RESULTS
We reviewed a total of 105 interviews with 25 hospital clinicians, 20 SNF clinicians, 21 patients and 14 caregivers in the hospital, and 15 patients and 10 caregivers in the SNF setting (Table 1). We found authority bias/halo effect; default/status quo bias, anchoring bias, and framing was commonly present in decision-making about postacute care in a SNF, whereas there were few if any examples of ambiguity aversion, availability heuristic, confirmation bias, optimism bias, or false consensus effect (Table 2).
Authority Bias/Halo Effect
While most patients deferred to their inpatient teams when it came to decision-making, this effect seemed to differ across VA and non-VA settings. Veterans expressed a higher degree of potential authority bias regarding the VA as an institution, whereas older adults in non-VA settings saw physicians as the authority figure making decisions in their best interests.
Veterans expressed confidence in the VA regarding both whether to go to a SNF and where to go:
“The VA wouldn’t license [an SNF] if they didn’t have a good reputation for care, cleanliness, things of that nature” (Veteran, VA CLC)
“I just knew the VA would have my best interests at heart” (Veteran, VA CLC)
Their caregivers expressed similar confidence:
“I’m not gonna decide [on whether the patient they care for goes to postacute care], like I told you, that’s totally up to the VA. I have trust and faith in them…so wherever they send him, that’s where he’s going” (Caregiver, VA hospital)
In some cases, this perspective was closer to the halo effect: a positive experience with the care provider or the care team led the decision-makers to believe that their recommendations about postacute care would be similarly positive.
“I think we were very trusting in the sense that whatever happened the last time around, he survived it…they took care of him…he got back home, and he started his life again, you know, so why would we question what they’re telling us to do? (Caregiver, VA hospital)
In contrast to Veterans, non-Veteran patients seemed to experience authority bias when it came to the inpatient team.
“Well, I’d like to know more about the PTs [Physical Therapists] there, but I assume since they were recommended, they will be good.” (Patient, University hospital)
This perspective was especially apparent when it came to physicians:
“The level of trust that they [patients] put in their doctor is gonna outweigh what anyone else would say.” (Clinical liaison, SNF)
“[In response to a question about influences on the decision to go to rehab] I don’t…that’s not my decision to make, that’s the doctor’s decision.” (Patient, University hospital)
“They said so…[the doctor] said I needed to go to rehab, so I guess I do because it’s the doctor’s decision.” (Patient, University hospital)
Default/Status quo Bias
In a related way, patients and caregivers with exposure to a SNF seemed to default to the same SNF with which they had previous experience. This bias seems to be primarily related to knowing what to expect.
“He thinks it’s [a particular SNF] the right place for him now…he was there before and he knew, again, it was the right place for him to be” (Caregiver, VA hospital)
“It’s the only one I’ve ever been in…but they have a lot of activities; you have a lot of freedom, staff was good” (Patient, VA hospital)
“I’ve been [to this SNF] before and I kind of know what the program involves…so it was kind of like going home, not, going home is the wrong way to put it…I mean coming here is like something I know, you know, I didn’t need anybody to explain it to me.” (Patient, VA hospital)
“Anybody that’s been to [SNF], that would be their choice to go back to, and I guess I must’ve liked it that first time because I asked to go back again.” (Patient, University hospital)
Anchoring Bias
While anchoring bias was less frequent, it came up in two domains: first, related to costs of care, and second, related to facility characteristics. Costs came up most frequently for Veterans who preferred to move their care to the VA for cost reasons, which appeared in these cases to overshadow other considerations:
“I kept emphasizing that the VA could do all the same things at a lot more reasonable price. The whole purpose of having the VA is for the Veteran, so that…we can get the healthcare that we need at a more reasonable [sic] or a reasonable price.” (Veteran, CLC)
“I think the CLC [VA SNF] is going to take care of her probably the same way any other facility of its type would, unless she were in a private facility, but you know, that costs a lot more money.” (Caregiver, VA hospital)
Patients occasionally had striking responses to particular characteristics of SNFs, regardless of whether this was a central feature or related to their rehabilitation:
“The social worker comes and talks to me about the nursing home where cats are running around, you know, to infect my leg or spin their little cat hairs into my lungs and make my asthma worse…I’m going to have to beg the nurses or the aides or the family or somebody to clean the cat…” (Veteran, VA hospital)
Framing
Framing was the strongest theme among clinician interviews in our sample. Clinicians most frequently described the SNF as a place where patients could recover function (a positive frame), explaining risks (eg, rehospitalization) associated with alternative postacute care options besides the SNF in great detail.
“Aside from explaining the benefits of going and…having that 24-hour care, having the therapies provided to them [the patients], talking about them getting stronger, phrasing it in such a way that patients sometimes are more agreeable, like not calling it a skilled nursing facility, calling it a rehab you know, for them to get physically stronger so they can be the most independent that they can once they do go home, and also explaining … we think that this would be the best plan to prevent them from coming back to the hospital, so those are some of the things that we’ll mention to patients to try and educate them and get them to be agreeable for placement.” (Social worker, University hospital)
Clinicians avoided negative associations with “nursing home” (even though all SNFs are nursing homes) and tended to use more positive frames such as “rehabilitation facility.”
“Use the word rehab….we definitely use the word rehab, to get more therapy, to go home; it’s not a, we really emphasize it’s not a nursing home, it’s not to go to stay forever.” (Physical therapist, safety-net hospital)
Clinicians used a frame of “safety” when discussing the SNF and used a frame of “risk” when discussing alternative postacute care options such as returning home. We did not find examples of clinicians discussing similar risks in going to a SNF even for risks, such as falling, which exist in both settings.
“I’ve talked to them primarily on an avenue of safety because I think people want and they value independence, they value making sure they can get home, but you know, a lot of the times they understand safety is, it can be a concern and outlining that our goal is to make sure that they’re safe and they stay home, and I tend to broach the subject saying that our therapists believe that they might not be safe at home in the moment, but they have potential goals to be safe later on if we continue therapy. I really highlight safety being the major driver of our discussion.” (Physician, VA hospital)
In some cases, framing was so overt that other risk-mitigating options (eg, home healthcare) are not discussed.
“I definitely tend to explain the ideal first. I’m not going to bring up home care when we really think somebody should go to rehab, however, once people say I don’t want to do that, I’m not going, then that’s when I’m like OK, well, let’s talk to the doctors, but we can see about other supports in the home.” (Social worker, VA hospital)
DISCUSSION
In a large sample of patients and their caregivers, as well as multidisciplinary clinicians at three different hospitals and three SNFs, we found authority bias/halo effect and framing biases were most common and seemed most impactful. Default/status quo bias and anchoring bias were also present in decision-making about a SNF. The combination of authority bias/halo effect and framing biases could synergistically interact to augment the likelihood of patients accepting a SNF for postacute care. Patients who had been to a SNF before seemed more likely to choose the SNF they had experienced previously even if they had no other postacute care experiences, and could be highly influenced by isolated characteristics of that facility (such as the physical environment or cost of care).
It is important to mention that cognitive biases do not necessarily have a negative impact: indeed, as Kahneman and Tversky point out, these are useful heuristics from “fast” thinking that are often effective.24 For example, clinicians may be trying to act in the best interests of the patient when framing the decision in terms of regaining function and averting loss of safety and independence. However, the evidence base regarding the outcomes of an SNF versus other postacute options is not robust, and this decision-making is complex. While this decision was most commonly framed in terms of rehabilitation and returning home, the fact that only about half of patients have returned to the community by 100 days4 was not discussed in any interview. In fact, initial evidence suggests replacing the SNF with home healthcare in patients with hip and knee arthroplasty may reduce costs without worsening clinical outcomes.6 However, across a broader population, SNFs significantly reduce 30-day readmissions when directly compared with home healthcare, but other clinical outcomes are similar.25 This evidence suggests that the “right” postacute care option for an individual patient is not clear, highlighting a key role biases may play in decision-making. Further, the nebulous concept of “safety” could introduce potential disparities related to social determinants of health.12 The observed inclination to accept an SNF with which the individual had prior experience may be influenced by the acceptability of this choice because of personal factors or prior research, even if it also represents a bias by limiting the consideration of current alternatives.
Our findings complement those of others in the literature which have also identified profound gaps in discharge decision-making among patients and clinicians,13-16,26-31 though to our knowledge the role of cognitive biases in these decisions has not been explored. This study also addresses gaps in the cognitive bias literature, including the need for real-world data rather than hypothetical vignettes,17 and evaluation of treatment and management decisions rather than diagnoses, which have been more commonly studied.21
These findings have implications for both individual clinicians and healthcare institutions. In the immediate term, these findings may serve as a call to discharging clinicians to modulate language and “debias” their conversations with patients about care after discharge.18,22 Shared decision-making requires an informed choice by patients based on their goals and values; framing a decision in a way that puts the clinician’s goals or values (eg, safety) ahead of patient values (eg, independence and autonomy) or limits disclosure (eg, a “rehab” is a nursing home) in the hope of influencing choice may be more consistent with framing bias and less with shared decision-making.14 Although controversy exists about the best way to “debias” oneself,32 self-awareness of bias is increasingly recognized across healthcare venues as critical to improving care for vulnerable populations.33 The use of data rather than vignettes may be a useful debiasing strategy, although the limitations of currently available data (eg, capturing nursing home quality) are increasingly recognized.34 From a policy and health system perspective, cognitive biases should be integrated into the development of decision aids to facilitate informed, shared, and high-quality decision-making that incorporates patient values, and perhaps “nudges” from behavioral economics to assist patients in choosing the right postdischarge care for them. Such nudges use principles of framing to influence care without restricting choice.35 As the science informing best practice regarding postacute care improves, identifying the “right” postdischarge care may become easier and recommendations more evidence-based.36
Strengths of the study include a large, diverse sample of patients, caregivers, and clinicians in both the hospital and SNF setting. Also, we used a team-based analysis with an experienced team and a deep knowledge of the data, including triangulation with clinicians to verify results. However, all hospitals and SNFs were located in a single metropolitan area, and responses may vary by region or population density. All three hospitals have housestaff teaching programs, and at the time of the interviews all three community SNFs were “five-star” facilities on the Nursing Home Compare website; results may be different at community hospitals or other SNFs. Hospitalists were the only physician group sampled in the hospital as they provide the majority of inpatient care to older adults; geriatricians, in particular, may have had different perspectives. Since we intended to explore whether cognitive biases were present overall, we did not evaluate whether cognitive biases differed by role or subgroup (by clinician type, patient, or caregiver), but this may be a promising area to explore in future work. Many cognitive biases have been described, and there are likely additional biases we did not identify. To confirm the generalizability of these findings, they should be studied in a larger, more generalizable sample of respondents in future work.
Cognitive biases play an important role in patient decision-making about postacute care, particularly regarding SNF care. As postacute care undergoes a transformation spurred by payment reforms, it is more important than ever to ensure that patients understand their choices at hospital discharge and can make a high-quality decision consistent with their goals.
1. Burke RE, Juarez-Colunga E, Levy C, Prochazka AV, Coleman EA, Ginde AA. Rise of post-acute care facilities as a discharge destination of US hospitalizations. JAMA Intern Med. 2015;175(2):295-296. https://doi.org/10.1001/jamainternmed.2014.6383.
2. Burke RE, Juarez-Colunga E, Levy C, Prochazka AV, Coleman EA, Ginde AA. Patient and hospitalization characteristics associated with increased postacute care facility discharges from US hospitals. Med Care. 2015;53(6):492-500. https://doi.org/10.1097/MLR.0000000000000359.
3. Werner RM, Konetzka RT. Trends in post-acute care use among medicare beneficiaries: 2000 to 2015. JAMA. 2018;319(15):1616-1617. https://doi.org/10.1001/jama.2018.2408.
4. Medicare Payment Advisory Commission June 2018 Report to Congress. http://www.medpac.gov/docs/default-source/reports/jun18_ch5_medpacreport_sec.pdf?sfvrsn=0. Accessed November 9, 2018.
5. Burke RE, Cumbler E, Coleman EA, Levy C. Post-acute care reform: implications and opportunities for hospitalists. J Hosp Med. 2017;12(1):46-51. https://doi.org/10.1002/jhm.2673.
6. Dummit LA, Kahvecioglu D, Marrufo G, et al. Association between hospital participation in a medicare bundled payment initiative and payments and quality outcomes for lower extremity joint replacement episodes. JAMA. 2016;316(12):1267-1278. https://doi.org/10.1001/jama.2016.12717.
7. Navathe AS, Troxel AB, Liao JM, et al. Cost of joint replacement using bundled payment models. JAMA Intern Med. 2017;177(2):214-222. https://doi.org/10.1001/jamainternmed.2016.8263.
8. Kennedy G, Lewis VA, Kundu S, Mousqués J, Colla CH. Accountable care organizations and post-acute care: a focus on preferred SNF networks. Med Care Res Rev MCRR. 2018;1077558718781117. https://doi.org/10.1177/1077558718781117.
9. Chandra A, Dalton MA, Holmes J. Large increases in spending on postacute care in Medicare point to the potential for cost savings in these settings. Health Aff Proj Hope. 2013;32(5):864-872. https://doi.org/10.1377/hlthaff.2012.1262.
10. McWilliams JM, Gilstrap LG, Stevenson DG, Chernew ME, Huskamp HA, Grabowski DC. Changes in postacute care in the Medicare shared savings program. JAMA Intern Med. 2017;177(4):518-526. https://doi.org/10.1001/jamainternmed.2016.9115.
11. Zhu JM, Patel V, Shea JA, Neuman MD, Werner RM. Hospitals using bundled payment report reducing skilled nursing facility use and improving care integration. Health Aff Proj Hope. 2018;37(8):1282-1289. https://doi.org/10.1377/hlthaff.2018.0257.
12. Burke RE, Ibrahim SA. Discharge destination and disparities in postoperative care. JAMA. 2018;319(16):1653-1654. https://doi.org/10.1001/jama.2017.21884.
13. Burke RE, Lawrence E, Ladebue A, et al. How hospital clinicians select patients for skilled nursing facilities. J Am Geriatr Soc. 2017;65(11):2466-2472. https://doi.org/10.1111/jgs.14954.
14. Burke RE, Jones J, Lawrence E, et al. Evaluating the quality of patient decision-making regarding post-acute care. J Gen Intern Med. 2018;33(5):678-684. https://doi.org/10.1007/s11606-017-4298-1.
15. Gadbois EA, Tyler DA, Mor V. Selecting a skilled nursing facility for postacute care: individual and family perspectives. J Am Geriatr Soc. 2017;65(11):2459-2465. https://doi.org/10.1111/jgs.14988.
16. Tyler DA, Gadbois EA, McHugh JP, Shield RR, Winblad U, Mor V. Patients are not given quality-of-care data about skilled nursing facilities when discharged from hospitals. Health Aff. 2017;36(8):1385-1391. https://doi.org/10.1377/hlthaff.2017.0155.
17. Blumenthal-Barby JS, Krieger H. Cognitive biases and heuristics in medical decision making: a critical review using a systematic search strategy. Med Decis Mak Int J Soc Med Decis Mak. 2015;35(4):539-557. https://doi.org/10.1177/0272989X14547740.
18. Croskerry P, Singhal G, Mamede S. Cognitive debiasing 1: origins of bias and theory of debiasing. BMJ Qual Saf. 2013;22 Suppl 2:ii58-ii64. https://doi.org/10.1136/bmjqs-2012-001712.
19. Hinds PS, Vogel RJ, Clarke-Steffen L. The possibilities and pitfalls of doing a secondary analysis of a qualitative data set. Qual Health Res. 1997;7(3):408-424. https://doi.org/10.1177/104973239700700306.
20. Magid M, Mcllvennan CK, Jones J, et al. Exploring cognitive bias in destination therapy left ventricular assist device decision making: a retrospective qualitative framework analysis. Am Heart J. 2016;180:64-73. https://doi.org/10.1016/j.ahj.2016.06.024.
21. Saposnik G, Redelmeier D, Ruff CC, Tobler PN. Cognitive biases associated with medical decisions: a systematic review. BMC Med Inform Decis Mak. 2016;16(1):138. https://doi.org/10.1186/s12911-016-0377-1.
22. Croskerry P, Singhal G, Mamede S. Cognitive debiasing 2: impediments to and strategies for change. BMJ Qual Saf. 2013;22 Suppl 2:ii65-ii72. https://doi.org/10.1136/bmjqs-2012-001713.
23. Bradley EH, Curry LA, Devers KJ. Qualitative data analysis for health services research: developing taxonomy, themes, and theory. Health Serv Res. 2007;42(4):1758-1772. https://doi.org/10.1111/j.1475-6773.2006.00684.x.
24. Thinking, Fast and Slow. Daniel Kahneman. Macmillan. US Macmillan. https://us.macmillan.com/thinkingfastandslow/danielkahneman/9780374533557. Accessed February 5, 2019.
25. Werner RM, Konetzka RT, Coe NB. Does type of post-acute care matter? The effect of hospital discharge to home with home health care versus to skilled nursing facility. JAMA Intern Med. In press.
26. Jones J, Lawrence E, Ladebue A, Leonard C, Ayele R, Burke RE. Nurses’ role in managing “The Fit” of older adults in skilled nursing facilities. J Gerontol Nurs. 2017;43(12):11-20. https://doi.org/10.3928/00989134-20171110-06.
27. Lawrence E, Casler J-J, Jones J, et al. Variability in skilled nursing facility screening and admission processes: implications for value-based purchasing. Health Care Manage Rev. 2018. https://doi.org/10.1097/HMR.0000000000000225.
28. Ayele R, Jones J, Ladebue A, et al. Perceived costs of care influence post-acute care choices by clinicians, patients, and caregivers. J Am Geriatr Soc. 2019. https://doi.org/10.1111/jgs.15768.
29. Sefcik JS, Nock RH, Flores EJ, et al. Patient preferences for information on post-acute care services. Res Gerontol Nurs. 2016;9(4):175-182. https://doi.org/10.3928/19404921-20160120-01.
30. Konetzka RT, Perraillon MC. Use of nursing home compare website appears limited by lack of awareness and initial mistrust of the data. Health Aff Proj Hope. 2016;35(4):706-713. https://doi.org/10.1377/hlthaff.2015.1377.
31. Schapira MM, Shea JA, Duey KA, Kleiman C, Werner RM. The nursing home compare report card: perceptions of residents and caregivers regarding quality ratings and nursing home choice. Health Serv Res. 2016;51 Suppl 2:1212-1228. https://doi.org/10.1111/1475-6773.12458.
32. Dhaliwal G. Premature closure? Not so fast. BMJ Qual Saf. 2017;26(2):87-89. https://doi.org/10.1136/bmjqs-2016-005267.
33. Masters C, Robinson D, Faulkner S, Patterson E, McIlraith T, Ansari A. Addressing biases in patient care with the 5Rs of cultural humility, a clinician coaching tool. J Gen Intern Med. 2019;34(4):627-630. https://doi.org/10.1007/s11606-018-4814-y.
34. Burke RE, Werner RM. Quality measurement and nursing homes: measuring what matters. BMJ Qual Saf. 2019;28(7);520-523. https://doi.org/10.1136/bmjqs-2019-009447.
35. Patel MS, Volpp KG, Asch DA. Nudge units to improve the delivery of health care. N Engl J Med. 2018;378(3):214-216. https://doi.org/10.1056/NEJMp1712984.
36. Jenq GY, Tinetti ME. Post–acute care: who belongs where? JAMA Intern Med. 2015;175(2):296-297. https://doi.org/10.1001/jamainternmed.2014.4298.
The combination of decreasing hospital lengths of stay and increasing age and comorbidity of the United States population is a principal driver of the increased use of postacute care in the US.1-3 Postacute care refers to care in long-term acute care hospitals, inpatient rehabilitation facilities, skilled nursing facilities (SNFs), and care provided by home health agencies after an acute hospitalization. In 2016, 43% of Medicare beneficiaries received postacute care after hospital discharge at the cost of $60 billion annually; nearly half of these received care in an SNF.4 Increasing recognition of the significant cost and poor outcomes of postacute care led to payment reforms, such as bundled payments, that incentivized less expensive forms of postacute care and improvements in outcomes.5-9 Early evaluations suggested that hospitals are sensitive to these reforms and responded by significantly decreasing SNF utilization.10,11 It remains unclear whether this was safe and effective.
In this context, increased attention to how hospital clinicians and hospitalized patients decide whether to use postacute care (and what form to use) is appropriate since the effect of payment reforms could negatively impact vulnerable populations of older adults without adequate protection.12 Suboptimal decision-making can drive both overuse and inappropriate underuse of this expensive medical resource. Initial evidence suggests that patients and clinicians are poorly equipped to make high-quality decisions about postacute care, with significant deficits in both the decision-making process and content.13-16 While these gaps are important to address, they may only be part of the problem. The fields of cognitive psychology and behavioral economics have revealed new insights into decision-making, demonstrating that people deviate from rational decision-making in predictable ways, termed decision heuristics, or cognitive biases.17 This growing field of research suggests heuristics or biases play important roles in decision-making and determining behavior, particularly in situations where there may be little information provided and the patient is stressed, tired, and ill—precisely like deciding on postacute care.18 However, it is currently unknown whether cognitive biases are at play when making hospital discharge decisions.
We sought to identify the most salient heuristics or cognitive biases patients may utilize when making decisions about postacute care at the end of their hospitalization and ways clinicians may contribute to these biases. The overall goal was to derive insights for improving postacute care decision-making.
METHODS
Study Design
We conducted a secondary analysis on interviews with hospital and SNF clinicians as well as patients and their caregivers who were either leaving the hospital for an SNF or newly arrived in an SNF from the hospital to understand if cognitive biases were present and how they manifested themselves in a real-world clinical context.19 These interviews were part of a larger qualitative study that sought to understand how clinicians, patients, and their caregivers made decisions about postacute care, particularly related to SNFs.13,14 This study represents the analysis of all our interviews, specifically examining decision-making bias. Participating sites, clinical roles, and both patient and caregiver characteristics (Table 1) in our cohort have been previously described.13,14
Analysis
We used a team-based approach to framework analysis, which has been used in other decision-making studies14, including those measuring cognitive bias.20 A limitation in cognitive bias research is the lack of a standardized list or categorization of cognitive biases. We reviewed prior systematic17,21 and narrative reviews18,22, as well as prior studies describing examples of cognitive biases playing a role in decision-making about therapy20 to construct a list of possible cognitive biases to evaluate and narrow these a priori to potential biases relevant to the decision about postacute care based on our prior work (Table 2).
We applied this framework to analyze transcripts through an iterative process of deductive coding and reviewing across four reviewers (ML, RA, AL, CL) and a hospitalist physician with expertise leading qualitative studies (REB).
Intercoder consensus was built through team discussion by resolving points of disagreement.23 Consistency of coding was regularly checked by having more than one investigator code individual manuscripts and comparing coding, and discrepancies were resolved through team discussion. We triangulated the data (shared our preliminary results) using a larger study team, including an expert in behavioral economics (SRG), physicians at study sites (EC, RA), and an anthropologist with expertise in qualitative methods (CL). We did this to ensure credibility (to what extent the findings are credible or believable) and confirmability of findings (ensuring the findings are based on participant narratives rather than researcher biases).
RESULTS
We reviewed a total of 105 interviews with 25 hospital clinicians, 20 SNF clinicians, 21 patients and 14 caregivers in the hospital, and 15 patients and 10 caregivers in the SNF setting (Table 1). We found authority bias/halo effect; default/status quo bias, anchoring bias, and framing was commonly present in decision-making about postacute care in a SNF, whereas there were few if any examples of ambiguity aversion, availability heuristic, confirmation bias, optimism bias, or false consensus effect (Table 2).
Authority Bias/Halo Effect
While most patients deferred to their inpatient teams when it came to decision-making, this effect seemed to differ across VA and non-VA settings. Veterans expressed a higher degree of potential authority bias regarding the VA as an institution, whereas older adults in non-VA settings saw physicians as the authority figure making decisions in their best interests.
Veterans expressed confidence in the VA regarding both whether to go to a SNF and where to go:
“The VA wouldn’t license [an SNF] if they didn’t have a good reputation for care, cleanliness, things of that nature” (Veteran, VA CLC)
“I just knew the VA would have my best interests at heart” (Veteran, VA CLC)
Their caregivers expressed similar confidence:
“I’m not gonna decide [on whether the patient they care for goes to postacute care], like I told you, that’s totally up to the VA. I have trust and faith in them…so wherever they send him, that’s where he’s going” (Caregiver, VA hospital)
In some cases, this perspective was closer to the halo effect: a positive experience with the care provider or the care team led the decision-makers to believe that their recommendations about postacute care would be similarly positive.
“I think we were very trusting in the sense that whatever happened the last time around, he survived it…they took care of him…he got back home, and he started his life again, you know, so why would we question what they’re telling us to do? (Caregiver, VA hospital)
In contrast to Veterans, non-Veteran patients seemed to experience authority bias when it came to the inpatient team.
“Well, I’d like to know more about the PTs [Physical Therapists] there, but I assume since they were recommended, they will be good.” (Patient, University hospital)
This perspective was especially apparent when it came to physicians:
“The level of trust that they [patients] put in their doctor is gonna outweigh what anyone else would say.” (Clinical liaison, SNF)
“[In response to a question about influences on the decision to go to rehab] I don’t…that’s not my decision to make, that’s the doctor’s decision.” (Patient, University hospital)
“They said so…[the doctor] said I needed to go to rehab, so I guess I do because it’s the doctor’s decision.” (Patient, University hospital)
Default/Status quo Bias
In a related way, patients and caregivers with exposure to a SNF seemed to default to the same SNF with which they had previous experience. This bias seems to be primarily related to knowing what to expect.
“He thinks it’s [a particular SNF] the right place for him now…he was there before and he knew, again, it was the right place for him to be” (Caregiver, VA hospital)
“It’s the only one I’ve ever been in…but they have a lot of activities; you have a lot of freedom, staff was good” (Patient, VA hospital)
“I’ve been [to this SNF] before and I kind of know what the program involves…so it was kind of like going home, not, going home is the wrong way to put it…I mean coming here is like something I know, you know, I didn’t need anybody to explain it to me.” (Patient, VA hospital)
“Anybody that’s been to [SNF], that would be their choice to go back to, and I guess I must’ve liked it that first time because I asked to go back again.” (Patient, University hospital)
Anchoring Bias
While anchoring bias was less frequent, it came up in two domains: first, related to costs of care, and second, related to facility characteristics. Costs came up most frequently for Veterans who preferred to move their care to the VA for cost reasons, which appeared in these cases to overshadow other considerations:
“I kept emphasizing that the VA could do all the same things at a lot more reasonable price. The whole purpose of having the VA is for the Veteran, so that…we can get the healthcare that we need at a more reasonable [sic] or a reasonable price.” (Veteran, CLC)
“I think the CLC [VA SNF] is going to take care of her probably the same way any other facility of its type would, unless she were in a private facility, but you know, that costs a lot more money.” (Caregiver, VA hospital)
Patients occasionally had striking responses to particular characteristics of SNFs, regardless of whether this was a central feature or related to their rehabilitation:
“The social worker comes and talks to me about the nursing home where cats are running around, you know, to infect my leg or spin their little cat hairs into my lungs and make my asthma worse…I’m going to have to beg the nurses or the aides or the family or somebody to clean the cat…” (Veteran, VA hospital)
Framing
Framing was the strongest theme among clinician interviews in our sample. Clinicians most frequently described the SNF as a place where patients could recover function (a positive frame), explaining risks (eg, rehospitalization) associated with alternative postacute care options besides the SNF in great detail.
“Aside from explaining the benefits of going and…having that 24-hour care, having the therapies provided to them [the patients], talking about them getting stronger, phrasing it in such a way that patients sometimes are more agreeable, like not calling it a skilled nursing facility, calling it a rehab you know, for them to get physically stronger so they can be the most independent that they can once they do go home, and also explaining … we think that this would be the best plan to prevent them from coming back to the hospital, so those are some of the things that we’ll mention to patients to try and educate them and get them to be agreeable for placement.” (Social worker, University hospital)
Clinicians avoided negative associations with “nursing home” (even though all SNFs are nursing homes) and tended to use more positive frames such as “rehabilitation facility.”
“Use the word rehab….we definitely use the word rehab, to get more therapy, to go home; it’s not a, we really emphasize it’s not a nursing home, it’s not to go to stay forever.” (Physical therapist, safety-net hospital)
Clinicians used a frame of “safety” when discussing the SNF and used a frame of “risk” when discussing alternative postacute care options such as returning home. We did not find examples of clinicians discussing similar risks in going to a SNF even for risks, such as falling, which exist in both settings.
“I’ve talked to them primarily on an avenue of safety because I think people want and they value independence, they value making sure they can get home, but you know, a lot of the times they understand safety is, it can be a concern and outlining that our goal is to make sure that they’re safe and they stay home, and I tend to broach the subject saying that our therapists believe that they might not be safe at home in the moment, but they have potential goals to be safe later on if we continue therapy. I really highlight safety being the major driver of our discussion.” (Physician, VA hospital)
In some cases, framing was so overt that other risk-mitigating options (eg, home healthcare) are not discussed.
“I definitely tend to explain the ideal first. I’m not going to bring up home care when we really think somebody should go to rehab, however, once people say I don’t want to do that, I’m not going, then that’s when I’m like OK, well, let’s talk to the doctors, but we can see about other supports in the home.” (Social worker, VA hospital)
DISCUSSION
In a large sample of patients and their caregivers, as well as multidisciplinary clinicians at three different hospitals and three SNFs, we found authority bias/halo effect and framing biases were most common and seemed most impactful. Default/status quo bias and anchoring bias were also present in decision-making about a SNF. The combination of authority bias/halo effect and framing biases could synergistically interact to augment the likelihood of patients accepting a SNF for postacute care. Patients who had been to a SNF before seemed more likely to choose the SNF they had experienced previously even if they had no other postacute care experiences, and could be highly influenced by isolated characteristics of that facility (such as the physical environment or cost of care).
It is important to mention that cognitive biases do not necessarily have a negative impact: indeed, as Kahneman and Tversky point out, these are useful heuristics from “fast” thinking that are often effective.24 For example, clinicians may be trying to act in the best interests of the patient when framing the decision in terms of regaining function and averting loss of safety and independence. However, the evidence base regarding the outcomes of an SNF versus other postacute options is not robust, and this decision-making is complex. While this decision was most commonly framed in terms of rehabilitation and returning home, the fact that only about half of patients have returned to the community by 100 days4 was not discussed in any interview. In fact, initial evidence suggests replacing the SNF with home healthcare in patients with hip and knee arthroplasty may reduce costs without worsening clinical outcomes.6 However, across a broader population, SNFs significantly reduce 30-day readmissions when directly compared with home healthcare, but other clinical outcomes are similar.25 This evidence suggests that the “right” postacute care option for an individual patient is not clear, highlighting a key role biases may play in decision-making. Further, the nebulous concept of “safety” could introduce potential disparities related to social determinants of health.12 The observed inclination to accept an SNF with which the individual had prior experience may be influenced by the acceptability of this choice because of personal factors or prior research, even if it also represents a bias by limiting the consideration of current alternatives.
Our findings complement those of others in the literature which have also identified profound gaps in discharge decision-making among patients and clinicians,13-16,26-31 though to our knowledge the role of cognitive biases in these decisions has not been explored. This study also addresses gaps in the cognitive bias literature, including the need for real-world data rather than hypothetical vignettes,17 and evaluation of treatment and management decisions rather than diagnoses, which have been more commonly studied.21
These findings have implications for both individual clinicians and healthcare institutions. In the immediate term, these findings may serve as a call to discharging clinicians to modulate language and “debias” their conversations with patients about care after discharge.18,22 Shared decision-making requires an informed choice by patients based on their goals and values; framing a decision in a way that puts the clinician’s goals or values (eg, safety) ahead of patient values (eg, independence and autonomy) or limits disclosure (eg, a “rehab” is a nursing home) in the hope of influencing choice may be more consistent with framing bias and less with shared decision-making.14 Although controversy exists about the best way to “debias” oneself,32 self-awareness of bias is increasingly recognized across healthcare venues as critical to improving care for vulnerable populations.33 The use of data rather than vignettes may be a useful debiasing strategy, although the limitations of currently available data (eg, capturing nursing home quality) are increasingly recognized.34 From a policy and health system perspective, cognitive biases should be integrated into the development of decision aids to facilitate informed, shared, and high-quality decision-making that incorporates patient values, and perhaps “nudges” from behavioral economics to assist patients in choosing the right postdischarge care for them. Such nudges use principles of framing to influence care without restricting choice.35 As the science informing best practice regarding postacute care improves, identifying the “right” postdischarge care may become easier and recommendations more evidence-based.36
Strengths of the study include a large, diverse sample of patients, caregivers, and clinicians in both the hospital and SNF setting. Also, we used a team-based analysis with an experienced team and a deep knowledge of the data, including triangulation with clinicians to verify results. However, all hospitals and SNFs were located in a single metropolitan area, and responses may vary by region or population density. All three hospitals have housestaff teaching programs, and at the time of the interviews all three community SNFs were “five-star” facilities on the Nursing Home Compare website; results may be different at community hospitals or other SNFs. Hospitalists were the only physician group sampled in the hospital as they provide the majority of inpatient care to older adults; geriatricians, in particular, may have had different perspectives. Since we intended to explore whether cognitive biases were present overall, we did not evaluate whether cognitive biases differed by role or subgroup (by clinician type, patient, or caregiver), but this may be a promising area to explore in future work. Many cognitive biases have been described, and there are likely additional biases we did not identify. To confirm the generalizability of these findings, they should be studied in a larger, more generalizable sample of respondents in future work.
Cognitive biases play an important role in patient decision-making about postacute care, particularly regarding SNF care. As postacute care undergoes a transformation spurred by payment reforms, it is more important than ever to ensure that patients understand their choices at hospital discharge and can make a high-quality decision consistent with their goals.
1. Burke RE, Juarez-Colunga E, Levy C, Prochazka AV, Coleman EA, Ginde AA. Rise of post-acute care facilities as a discharge destination of US hospitalizations. JAMA Intern Med. 2015;175(2):295-296. https://doi.org/10.1001/jamainternmed.2014.6383.
2. Burke RE, Juarez-Colunga E, Levy C, Prochazka AV, Coleman EA, Ginde AA. Patient and hospitalization characteristics associated with increased postacute care facility discharges from US hospitals. Med Care. 2015;53(6):492-500. https://doi.org/10.1097/MLR.0000000000000359.
3. Werner RM, Konetzka RT. Trends in post-acute care use among medicare beneficiaries: 2000 to 2015. JAMA. 2018;319(15):1616-1617. https://doi.org/10.1001/jama.2018.2408.
4. Medicare Payment Advisory Commission June 2018 Report to Congress. http://www.medpac.gov/docs/default-source/reports/jun18_ch5_medpacreport_sec.pdf?sfvrsn=0. Accessed November 9, 2018.
5. Burke RE, Cumbler E, Coleman EA, Levy C. Post-acute care reform: implications and opportunities for hospitalists. J Hosp Med. 2017;12(1):46-51. https://doi.org/10.1002/jhm.2673.
6. Dummit LA, Kahvecioglu D, Marrufo G, et al. Association between hospital participation in a medicare bundled payment initiative and payments and quality outcomes for lower extremity joint replacement episodes. JAMA. 2016;316(12):1267-1278. https://doi.org/10.1001/jama.2016.12717.
7. Navathe AS, Troxel AB, Liao JM, et al. Cost of joint replacement using bundled payment models. JAMA Intern Med. 2017;177(2):214-222. https://doi.org/10.1001/jamainternmed.2016.8263.
8. Kennedy G, Lewis VA, Kundu S, Mousqués J, Colla CH. Accountable care organizations and post-acute care: a focus on preferred SNF networks. Med Care Res Rev MCRR. 2018;1077558718781117. https://doi.org/10.1177/1077558718781117.
9. Chandra A, Dalton MA, Holmes J. Large increases in spending on postacute care in Medicare point to the potential for cost savings in these settings. Health Aff Proj Hope. 2013;32(5):864-872. https://doi.org/10.1377/hlthaff.2012.1262.
10. McWilliams JM, Gilstrap LG, Stevenson DG, Chernew ME, Huskamp HA, Grabowski DC. Changes in postacute care in the Medicare shared savings program. JAMA Intern Med. 2017;177(4):518-526. https://doi.org/10.1001/jamainternmed.2016.9115.
11. Zhu JM, Patel V, Shea JA, Neuman MD, Werner RM. Hospitals using bundled payment report reducing skilled nursing facility use and improving care integration. Health Aff Proj Hope. 2018;37(8):1282-1289. https://doi.org/10.1377/hlthaff.2018.0257.
12. Burke RE, Ibrahim SA. Discharge destination and disparities in postoperative care. JAMA. 2018;319(16):1653-1654. https://doi.org/10.1001/jama.2017.21884.
13. Burke RE, Lawrence E, Ladebue A, et al. How hospital clinicians select patients for skilled nursing facilities. J Am Geriatr Soc. 2017;65(11):2466-2472. https://doi.org/10.1111/jgs.14954.
14. Burke RE, Jones J, Lawrence E, et al. Evaluating the quality of patient decision-making regarding post-acute care. J Gen Intern Med. 2018;33(5):678-684. https://doi.org/10.1007/s11606-017-4298-1.
15. Gadbois EA, Tyler DA, Mor V. Selecting a skilled nursing facility for postacute care: individual and family perspectives. J Am Geriatr Soc. 2017;65(11):2459-2465. https://doi.org/10.1111/jgs.14988.
16. Tyler DA, Gadbois EA, McHugh JP, Shield RR, Winblad U, Mor V. Patients are not given quality-of-care data about skilled nursing facilities when discharged from hospitals. Health Aff. 2017;36(8):1385-1391. https://doi.org/10.1377/hlthaff.2017.0155.
17. Blumenthal-Barby JS, Krieger H. Cognitive biases and heuristics in medical decision making: a critical review using a systematic search strategy. Med Decis Mak Int J Soc Med Decis Mak. 2015;35(4):539-557. https://doi.org/10.1177/0272989X14547740.
18. Croskerry P, Singhal G, Mamede S. Cognitive debiasing 1: origins of bias and theory of debiasing. BMJ Qual Saf. 2013;22 Suppl 2:ii58-ii64. https://doi.org/10.1136/bmjqs-2012-001712.
19. Hinds PS, Vogel RJ, Clarke-Steffen L. The possibilities and pitfalls of doing a secondary analysis of a qualitative data set. Qual Health Res. 1997;7(3):408-424. https://doi.org/10.1177/104973239700700306.
20. Magid M, Mcllvennan CK, Jones J, et al. Exploring cognitive bias in destination therapy left ventricular assist device decision making: a retrospective qualitative framework analysis. Am Heart J. 2016;180:64-73. https://doi.org/10.1016/j.ahj.2016.06.024.
21. Saposnik G, Redelmeier D, Ruff CC, Tobler PN. Cognitive biases associated with medical decisions: a systematic review. BMC Med Inform Decis Mak. 2016;16(1):138. https://doi.org/10.1186/s12911-016-0377-1.
22. Croskerry P, Singhal G, Mamede S. Cognitive debiasing 2: impediments to and strategies for change. BMJ Qual Saf. 2013;22 Suppl 2:ii65-ii72. https://doi.org/10.1136/bmjqs-2012-001713.
23. Bradley EH, Curry LA, Devers KJ. Qualitative data analysis for health services research: developing taxonomy, themes, and theory. Health Serv Res. 2007;42(4):1758-1772. https://doi.org/10.1111/j.1475-6773.2006.00684.x.
24. Thinking, Fast and Slow. Daniel Kahneman. Macmillan. US Macmillan. https://us.macmillan.com/thinkingfastandslow/danielkahneman/9780374533557. Accessed February 5, 2019.
25. Werner RM, Konetzka RT, Coe NB. Does type of post-acute care matter? The effect of hospital discharge to home with home health care versus to skilled nursing facility. JAMA Intern Med. In press.
26. Jones J, Lawrence E, Ladebue A, Leonard C, Ayele R, Burke RE. Nurses’ role in managing “The Fit” of older adults in skilled nursing facilities. J Gerontol Nurs. 2017;43(12):11-20. https://doi.org/10.3928/00989134-20171110-06.
27. Lawrence E, Casler J-J, Jones J, et al. Variability in skilled nursing facility screening and admission processes: implications for value-based purchasing. Health Care Manage Rev. 2018. https://doi.org/10.1097/HMR.0000000000000225.
28. Ayele R, Jones J, Ladebue A, et al. Perceived costs of care influence post-acute care choices by clinicians, patients, and caregivers. J Am Geriatr Soc. 2019. https://doi.org/10.1111/jgs.15768.
29. Sefcik JS, Nock RH, Flores EJ, et al. Patient preferences for information on post-acute care services. Res Gerontol Nurs. 2016;9(4):175-182. https://doi.org/10.3928/19404921-20160120-01.
30. Konetzka RT, Perraillon MC. Use of nursing home compare website appears limited by lack of awareness and initial mistrust of the data. Health Aff Proj Hope. 2016;35(4):706-713. https://doi.org/10.1377/hlthaff.2015.1377.
31. Schapira MM, Shea JA, Duey KA, Kleiman C, Werner RM. The nursing home compare report card: perceptions of residents and caregivers regarding quality ratings and nursing home choice. Health Serv Res. 2016;51 Suppl 2:1212-1228. https://doi.org/10.1111/1475-6773.12458.
32. Dhaliwal G. Premature closure? Not so fast. BMJ Qual Saf. 2017;26(2):87-89. https://doi.org/10.1136/bmjqs-2016-005267.
33. Masters C, Robinson D, Faulkner S, Patterson E, McIlraith T, Ansari A. Addressing biases in patient care with the 5Rs of cultural humility, a clinician coaching tool. J Gen Intern Med. 2019;34(4):627-630. https://doi.org/10.1007/s11606-018-4814-y.
34. Burke RE, Werner RM. Quality measurement and nursing homes: measuring what matters. BMJ Qual Saf. 2019;28(7);520-523. https://doi.org/10.1136/bmjqs-2019-009447.
35. Patel MS, Volpp KG, Asch DA. Nudge units to improve the delivery of health care. N Engl J Med. 2018;378(3):214-216. https://doi.org/10.1056/NEJMp1712984.
36. Jenq GY, Tinetti ME. Post–acute care: who belongs where? JAMA Intern Med. 2015;175(2):296-297. https://doi.org/10.1001/jamainternmed.2014.4298.
© 2020 Society of Hospital Medicine
Clinical Guideline Highlights for the Hospitalist: Management of Acute Pancreatitis in the Pediatric Population
Pediatric acute pancreatitis is being diagnosed more commonly, affecting approximately one per 10,000 children annually with an estimated inpatient cost burden of $200 million per year.1,2 Common causes of pediatric acute pancreatitis include systemic illness, biliary disease, trauma, and medications; 13%-34% of cases are idiopathic.1 Currently, substantial variation exists in the clinical management of this condition.3,4 Hospitalists should familiarize themselves with the current literature, including the recent practice guideline by the North American Society for Pediatric Gastroenterology, Hepatology and Nutrition (NASPGHAN).2
KEY RECOMMENDATIONS FOR THE HOSPITALIST
(Evidence quality: not graded, recommendation by expert consensus)
Recommendation 1. Diagnosis of acute pancreatitis in pediatric patients requires at least two of the following symptoms: abdominal pain compatible with acute pancreatitis, serum amylase and/or lipase values >3 times the upper limits of normal, and imaging findings consistent with acute pancreatitis.The most common symptoms of acute pancreatitis in children are epigastric or diffuse abdominal pain, vomiting, and irritability. Presentation varies by age, and diagnosis requires a high index of suspicion. Significant elevations in amylase and lipase levels are typically detected early in the disease course. The guideline does not specify a preferred serum biomarker in the diagnosis of pancreatitis but notes that lipase is more sensitive and specific than amylase, rises within 6 hours of symptoms, and stays elevated longer. Amylase levels rise faster but often normalize by 24 hours of symptom onset. Amylase and lipase can originate from extrapancreatic sources and may be elevated during acute illness in the absence of pancreatitis.
Laboratory testing to investigate the etiology of acute pancreatitis should include hepatic enzymes, bilirubin, triglyceride, and calcium levels. Although not typically necessary for diagnosis, imaging may demonstrate pancreatic edema or peripancreatic fluid, confirm disease complications, and identify obstructive causes. Transabdominal ultrasonography is indicated if biliary pancreatitis is suspected. Contrast-enhanced computed tomography should be considered for patients with severe presentation or deteriorating condition. Magnetic resonance cholangiopancreatography is useful in detecting pancreaticobiliary abnormalities.
Recommendation 2. Children with acute pancreatitis should be initially resuscitated with crystalloids, either with lactated Ringer’s or normal saline in the acute setting. These children should be provided 1.5-2 times maintenance intravenous fluids with monitoring of urine output over the next 24-48 hours.
Fluid resuscitation and maintenance are the current mainstays of therapy for pancreatitis. Prompt fluid administration corrects hypovolemia and may prevent potential complications. Early, aggressive fluid replacement in adults reduces the incidence of systemic inflammatory response syndrome and organ failure. Limited pediatric studies support correction of hypovolemia and/or circulatory compromise using 10-20 ml/kg boluses of isotonic crystalloid fluid. Although the literature is sparse regarding the rate of continued fluid replacement, the committee recommends patients receive 1.5-2 times maintenance intravenous fluid (IVF) with normal saline plus 5% dextrose for the first 24-48 hours. The rate of IVF administration should be adjusted based on volume status and urine output. IVF should be discontinued once the patient is able to maintain adequate hydration enterally. Cardiac, renal, and pulmonary complications of pancreatitis often present within the first 48 hours of illness and should prompt close monitoring with assessment of vital signs every four hours. The committee recommends monitoring serum electrolytes and renal function in the first 48 hours but does not offer guidance regarding the frequency of laboratory testing or the value of trending serum biomarkers.
Recommendation 3. Except in the presence of direct contraindications to use the gut, children with mild acute pancreatitis may benefit from early (within 48-72 hours of presentation) oral and enteral nutrition to decrease the length of stay (LOS) and the risk of organ dysfunction.
Adult studies suggest early enteral nutrition decreases complications and reduces LOS. Initiating enteral nutrition within 48 hours in children may have similar benefits. Several small pediatric studies have demonstrated a reduced LOS with early enteral feeds without an increase in complications. In a retrospective single-center study, children who were fed within the first 48 hours and received 1.5-2 times maintenance IVF had shorter LOS, less frequent intensive care admissions, and reduced severity of illness compared with those who were kept nil per os
Recommendation 4. Intravenous morphine or other opioids should be used for acute pancreatitis pain not responding to acetaminophen or nonsteroidal antiinflammatory drugs (NSAIDs).
Abdominal pain is the most common presenting symptom of pancreatitis, and pain control is an essential component of supportive care. There are no randomized trials identifying an optimal pain management regimen. The committee recommends the use of opioids for pain not controlled with acetaminophen and NSAIDs. Refractory pain may necessitate consultation with an acute pain specialist.
Recommendation 5. Routine use of prophylactic antibiotics, protease inhibitors, antioxidants, and probiotics is not recommended in acute pancreatitis.
Adult literature does not support routine use of antibiotics in acute pancreatitis, but their use may be beneficial in severe or recalcitrant cases. Pediatric literature neither confirms nor refutes this finding. The guideline does not recommend the use of antibiotics without signs of infection. Limited adult studies have shown protease inhibitors, antioxidants, and probiotics to be beneficial; however, no pediatric data support their use.
This guideline also discusses interventional and surgical procedures. Of note, biliary tract disease may necessitate endoscopic retrograde cholangiopancreatography or cholecystectomy. Such procedures should be considered in conjunction with subspecialty input.2
CRITIQUE
Methods in Preparing Guideline
The guideline development committee, funded by the NASPGHAN and the National Institutes of Diabetes and Digestive and Kidney Diseases, was composed of members of the NASPGHAN Pancreas Committee and included gastroenterologists from multiple sites.2 Topics were selected via group discussion, and Medline searches included both adult and pediatric literature. Preliminary recommendations were presented at the 2016 World Congress of Pediatric Gastroenterology, Hepatology and Nutrition. Following revision, the 24 authors voted on each recommendation using a five-point Likert scale. A recommendation passed if 75% of the participants either agreed or strongly agreed with it. The authors reported no conflicts of interest.
Although the literature review was comprehensive, it lacked prospective pediatric studies and many of the recommendations were derived from adult research. The committee originally intended to grade the quality of evidence; however, the pediatric specific literature was underpowered and retrospective. Therefore, the committee opted to use consensus voting. The authors note that had the group used the Grading of Recommendations, Assessment, Development and Evaluation (GRADE) system, it would have returned grades of “low” or “very low” quality evidence.2 The Hungarian Pancreatic Study Group and the European Pancreatic Club published a consensus guideline on the management of pediatric acute pancreatitis shortly after the NASPGHAN guideline, which offers similar conclusions.2,6 The strength and generalizability of the NASPGHAN guideline are limited by its overreliance on adult literature, expert consensus, and small, retrospective pediatric studies to guide care.
AREAS OF FURTHER STUDY
This guideline highlights the need for pediatric research to guide the management of acute pancreatitis. The etiologies of pancreatitis in children are distinct from adults, where alcohol abuse and biliary disease are significant contributors.1 Furthermore, age and environmental factors influence the presentation and clinical course.1 Robust, prospective studies are needed to better understand the treatment outcomes of pediatric pancreatitis. Areas of further research include pediatric pancreatic severity scoring, ideal fluid composition and administration rate, enteral feed timing, optimal pain control, laboratory monitoring frequency, and adjuvant therapies.
Disclosures
Dr. Wall has nothing to disclose.
1. Bai HX, Lowe ME, Husain SZ. What have we learned about acute pancreatitis in children? J Pediatr Gastroenterol Nutr. 2011;52(3):262–270. https://doi.org/10.1097/MPG.0b013e3182061d75.
2. Abu-El-Haija M, Kumar S, et al. The management of acute pancreatitis in the pediatric population: a clinical report from the North American Society for Pediatric Gastroenterology, Hepatology, and Nutrition pancreas committee. J Pediatr Gastroenterol Nutr. 2018;66(1):159-176. https://doi.org/ 10.1097/MPG.0000000000001715.
3. Szabo, FK, Palermo, J, et al. Comparison of length of hospital stay of children admitted with acute pancreatitis among hospital services at a single pediatric tertiary care center [AGA Abstract Tu1144]. Gastroenterology. 2014;146(5):S–765. https://doi.org/10.1016/S0016-5085(14)62765-7.
4. Abu-El-Haija M, Lin TK, Palermo J. Update to the management of pediatric acute pancreatitis: highlighting areas in need of research. J Pediatr Gastroenterol Nutr. 2014;58:689–693. https://doi.org/ 10.1097/MPG.0000000000000360.
5. Szabo FK, Fei L, Cruz LA, et al. Early enteral nutrition and aggressive fluid resuscitation are associated with improved clinical outcomes in acute pancreatitis. J Pediatr. 2015;167(2):397–402e1. https://doi.org/10.1016/j.jpeds.2015.05.030.
6. Párniczky A, Abu-El-Haija M, et al. EPC/HPSG evidence-based guidelines for the management of pediatric pancreatitis. Pancreatology. 2018;18(2):146-160. https://doi.org/10.1016/j.pan.2018.01.001.
Pediatric acute pancreatitis is being diagnosed more commonly, affecting approximately one per 10,000 children annually with an estimated inpatient cost burden of $200 million per year.1,2 Common causes of pediatric acute pancreatitis include systemic illness, biliary disease, trauma, and medications; 13%-34% of cases are idiopathic.1 Currently, substantial variation exists in the clinical management of this condition.3,4 Hospitalists should familiarize themselves with the current literature, including the recent practice guideline by the North American Society for Pediatric Gastroenterology, Hepatology and Nutrition (NASPGHAN).2
KEY RECOMMENDATIONS FOR THE HOSPITALIST
(Evidence quality: not graded, recommendation by expert consensus)
Recommendation 1. Diagnosis of acute pancreatitis in pediatric patients requires at least two of the following symptoms: abdominal pain compatible with acute pancreatitis, serum amylase and/or lipase values >3 times the upper limits of normal, and imaging findings consistent with acute pancreatitis.The most common symptoms of acute pancreatitis in children are epigastric or diffuse abdominal pain, vomiting, and irritability. Presentation varies by age, and diagnosis requires a high index of suspicion. Significant elevations in amylase and lipase levels are typically detected early in the disease course. The guideline does not specify a preferred serum biomarker in the diagnosis of pancreatitis but notes that lipase is more sensitive and specific than amylase, rises within 6 hours of symptoms, and stays elevated longer. Amylase levels rise faster but often normalize by 24 hours of symptom onset. Amylase and lipase can originate from extrapancreatic sources and may be elevated during acute illness in the absence of pancreatitis.
Laboratory testing to investigate the etiology of acute pancreatitis should include hepatic enzymes, bilirubin, triglyceride, and calcium levels. Although not typically necessary for diagnosis, imaging may demonstrate pancreatic edema or peripancreatic fluid, confirm disease complications, and identify obstructive causes. Transabdominal ultrasonography is indicated if biliary pancreatitis is suspected. Contrast-enhanced computed tomography should be considered for patients with severe presentation or deteriorating condition. Magnetic resonance cholangiopancreatography is useful in detecting pancreaticobiliary abnormalities.
Recommendation 2. Children with acute pancreatitis should be initially resuscitated with crystalloids, either with lactated Ringer’s or normal saline in the acute setting. These children should be provided 1.5-2 times maintenance intravenous fluids with monitoring of urine output over the next 24-48 hours.
Fluid resuscitation and maintenance are the current mainstays of therapy for pancreatitis. Prompt fluid administration corrects hypovolemia and may prevent potential complications. Early, aggressive fluid replacement in adults reduces the incidence of systemic inflammatory response syndrome and organ failure. Limited pediatric studies support correction of hypovolemia and/or circulatory compromise using 10-20 ml/kg boluses of isotonic crystalloid fluid. Although the literature is sparse regarding the rate of continued fluid replacement, the committee recommends patients receive 1.5-2 times maintenance intravenous fluid (IVF) with normal saline plus 5% dextrose for the first 24-48 hours. The rate of IVF administration should be adjusted based on volume status and urine output. IVF should be discontinued once the patient is able to maintain adequate hydration enterally. Cardiac, renal, and pulmonary complications of pancreatitis often present within the first 48 hours of illness and should prompt close monitoring with assessment of vital signs every four hours. The committee recommends monitoring serum electrolytes and renal function in the first 48 hours but does not offer guidance regarding the frequency of laboratory testing or the value of trending serum biomarkers.
Recommendation 3. Except in the presence of direct contraindications to use the gut, children with mild acute pancreatitis may benefit from early (within 48-72 hours of presentation) oral and enteral nutrition to decrease the length of stay (LOS) and the risk of organ dysfunction.
Adult studies suggest early enteral nutrition decreases complications and reduces LOS. Initiating enteral nutrition within 48 hours in children may have similar benefits. Several small pediatric studies have demonstrated a reduced LOS with early enteral feeds without an increase in complications. In a retrospective single-center study, children who were fed within the first 48 hours and received 1.5-2 times maintenance IVF had shorter LOS, less frequent intensive care admissions, and reduced severity of illness compared with those who were kept nil per os
Recommendation 4. Intravenous morphine or other opioids should be used for acute pancreatitis pain not responding to acetaminophen or nonsteroidal antiinflammatory drugs (NSAIDs).
Abdominal pain is the most common presenting symptom of pancreatitis, and pain control is an essential component of supportive care. There are no randomized trials identifying an optimal pain management regimen. The committee recommends the use of opioids for pain not controlled with acetaminophen and NSAIDs. Refractory pain may necessitate consultation with an acute pain specialist.
Recommendation 5. Routine use of prophylactic antibiotics, protease inhibitors, antioxidants, and probiotics is not recommended in acute pancreatitis.
Adult literature does not support routine use of antibiotics in acute pancreatitis, but their use may be beneficial in severe or recalcitrant cases. Pediatric literature neither confirms nor refutes this finding. The guideline does not recommend the use of antibiotics without signs of infection. Limited adult studies have shown protease inhibitors, antioxidants, and probiotics to be beneficial; however, no pediatric data support their use.
This guideline also discusses interventional and surgical procedures. Of note, biliary tract disease may necessitate endoscopic retrograde cholangiopancreatography or cholecystectomy. Such procedures should be considered in conjunction with subspecialty input.2
CRITIQUE
Methods in Preparing Guideline
The guideline development committee, funded by the NASPGHAN and the National Institutes of Diabetes and Digestive and Kidney Diseases, was composed of members of the NASPGHAN Pancreas Committee and included gastroenterologists from multiple sites.2 Topics were selected via group discussion, and Medline searches included both adult and pediatric literature. Preliminary recommendations were presented at the 2016 World Congress of Pediatric Gastroenterology, Hepatology and Nutrition. Following revision, the 24 authors voted on each recommendation using a five-point Likert scale. A recommendation passed if 75% of the participants either agreed or strongly agreed with it. The authors reported no conflicts of interest.
Although the literature review was comprehensive, it lacked prospective pediatric studies and many of the recommendations were derived from adult research. The committee originally intended to grade the quality of evidence; however, the pediatric specific literature was underpowered and retrospective. Therefore, the committee opted to use consensus voting. The authors note that had the group used the Grading of Recommendations, Assessment, Development and Evaluation (GRADE) system, it would have returned grades of “low” or “very low” quality evidence.2 The Hungarian Pancreatic Study Group and the European Pancreatic Club published a consensus guideline on the management of pediatric acute pancreatitis shortly after the NASPGHAN guideline, which offers similar conclusions.2,6 The strength and generalizability of the NASPGHAN guideline are limited by its overreliance on adult literature, expert consensus, and small, retrospective pediatric studies to guide care.
AREAS OF FURTHER STUDY
This guideline highlights the need for pediatric research to guide the management of acute pancreatitis. The etiologies of pancreatitis in children are distinct from adults, where alcohol abuse and biliary disease are significant contributors.1 Furthermore, age and environmental factors influence the presentation and clinical course.1 Robust, prospective studies are needed to better understand the treatment outcomes of pediatric pancreatitis. Areas of further research include pediatric pancreatic severity scoring, ideal fluid composition and administration rate, enteral feed timing, optimal pain control, laboratory monitoring frequency, and adjuvant therapies.
Disclosures
Dr. Wall has nothing to disclose.
1. Bai HX, Lowe ME, Husain SZ. What have we learned about acute pancreatitis in children? J Pediatr Gastroenterol Nutr. 2011;52(3):262–270. https://doi.org/10.1097/MPG.0b013e3182061d75.
2. Abu-El-Haija M, Kumar S, et al. The management of acute pancreatitis in the pediatric population: a clinical report from the North American Society for Pediatric Gastroenterology, Hepatology, and Nutrition pancreas committee. J Pediatr Gastroenterol Nutr. 2018;66(1):159-176. https://doi.org/ 10.1097/MPG.0000000000001715.
3. Szabo, FK, Palermo, J, et al. Comparison of length of hospital stay of children admitted with acute pancreatitis among hospital services at a single pediatric tertiary care center [AGA Abstract Tu1144]. Gastroenterology. 2014;146(5):S–765. https://doi.org/10.1016/S0016-5085(14)62765-7.
4. Abu-El-Haija M, Lin TK, Palermo J. Update to the management of pediatric acute pancreatitis: highlighting areas in need of research. J Pediatr Gastroenterol Nutr. 2014;58:689–693. https://doi.org/ 10.1097/MPG.0000000000000360.
5. Szabo FK, Fei L, Cruz LA, et al. Early enteral nutrition and aggressive fluid resuscitation are associated with improved clinical outcomes in acute pancreatitis. J Pediatr. 2015;167(2):397–402e1. https://doi.org/10.1016/j.jpeds.2015.05.030.
6. Párniczky A, Abu-El-Haija M, et al. EPC/HPSG evidence-based guidelines for the management of pediatric pancreatitis. Pancreatology. 2018;18(2):146-160. https://doi.org/10.1016/j.pan.2018.01.001.
© 2019 Society of Hospital Medicine
Things We Do for No Reason™: Discontinuing Buprenorphine When Treating Acute Pain

Inspired by the ABIM Foundation’s Choosing Wisely® campaign, the “Things We Do for No Reason™” (TWDFNR™) series reviews practices that have become common parts of hospital care but may provide little value to our patients. Practices reviewed in the TWDFNR™ series do not represent “black and white” conclusions or clinical practice standards but are meant as a starting place for research and active discussions among hospitalists and patients. We invite you to be part of that discussion.
CLINICAL SCENARIO
A 40-year-old woman with a history of opioid use disorder (OUD) on buprenorphine-naloxone treatment is admitted to medicine following incision and drainage of a large forearm abscess with surrounding cellulitis. The patient reports severe pain following the procedure, which is not relieved by ibuprofen. The admitting hospitalist orders a pain regimen for the patient, which includes oral and intravenous hydromorphone and discontinues the patient’s buprenorphine-naloxone so that the short-acting opioids can take effect.
BACKGROUND
Medications to treat OUD include methadone, buprenorphine, and extended-release naltrexone. Buprenorphine is a Schedule III medication under the United States Food and Drug Administration that reduces opioid cravings, subsequently decreasing drug use1 and opioid-related overdose deaths.2 It has a favorable safety profile and can be prescribed for OUD in an office-based, outpatient setting since the Drug Addiction Treatment Act of 2000 (DATA 2000). Due to extensive first-pass metabolism, buprenorphine for OUD is typically administered sublingually, either alone or in a fixed combination with naloxone.
WHY YOU MIGHT THINK YOU SHOULD HOLD BUPRENORPHINE WHEN TREATING ACUTE PAIN
Buprenorphine is a partial opioid agonist with a long half-life and high affinity for the mu opioid receptor. Given these properties, prior recommendations assumed that buprenorphine blocked the effectiveness of additional opioid agonists.3,4 In 2004, guidelines by the Department of Health and Human Service Center for Substance Abuse Treatment recommended discontinuing buprenorphine in patients taking opioid pain medications.5 These suggestions were based on limited case reports describing difficulty controlling pain in patients with OUD with a high opioid tolerance who were receiving buprenorphine.6
Providers may hold buprenorphine when treating acute pain out of concern it could precipitate withdrawal by displacing full opioid agonists from the mu receptor. Providers may also believe that the naloxone component in the most commonly prescribed formulation, buprenorphine-naloxone, blocks the effects of opioid analgesics. Evolving understanding of buprenorphine pharmacology and the absence of high-quality evidence has resulted in providers holding buprenorphine in the setting of acute pain.
Finally, providers without dedicated training may feel they lack the necessary qualifications to prescribe buprenorphine in the inpatient setting. DATA 2000 requires mandatory X waiver training for physicians, nurse practitioners, and physician assistants to prescribe outpatient buprenorphine for OUD treatment outside of specialized opioid treatment programs.
WHY DISCONTINUING BUPRENORPHINE WHEN TREATING ACUTE PAIN IS NOT NECESSARY
Despite buprenorphine’s high affinity at the mu receptor, additional receptors remain available for full opioid agonists to bind and activate,6 providing effective pain relief even in patients using buprenorphine. In contrast to the 2004 Department of Health and Human Service guidelines, subsequent clinical studies have demonstrated that concurrent use of opioid analgesics is effective for patients maintained on buprenorphine, similar to patients on other forms of OUD treatment such as methadone.7,8
Precipitated withdrawal only occurs when buprenorphine is newly introduced to patients with already circulating opioids. Patients receiving buprenorphine-naloxone can also be exposed to opioids without precipitated withdrawal from the naloxone component, as naloxone is not absorbed via sublingual or buccal administration, but only present in the formulation to dissuade intravenous administration of the medication.
Even in the perioperative period, there is insufficient evidence to support the discontinuation of buprenorphine.9 Studies in this patient population have found that patients receiving buprenorphine may require higher doses of short-acting opioids to achieve adequate analgesia, but they experience similar pain control, lengths of stay, and functional outcomes to controls.10 Despite variable perioperative management of buprenorphine,11 protocols at major medical centers now recommend continuing or dose adjusting buprenorphine in the perioperative period rather than discontinuing.12-14
Patients physically dependent on opioid agonists, including buprenorphine, must be maintained on a daily equivalent opioid dose to avoid experiencing withdrawal. This maintenance requirement must be met before any analgesic effect for acute pain is obtained with additional opioids. Temporarily discontinuing buprenorphine introduces unnecessary complexity to a hospitalization, places the patient at risk of exacerbation of pain, opioid withdrawal, and predisposes the patient to return to use and overdose if not resumed before hospital discharge.5
Finally, clinicians do not require additional training or an X waiver to administer buprenorphine to hospitalized patients. These requirements are limited to providers managing buprenorphine in the outpatient setting or those prescribing buprenorphine to patients to take postdischarge. Hospitalists frequently prescribe opioid medications in the inpatient setting with similar or greater safety risk profiles to buprenorphine.
WHEN YOU SHOULD CONSIDER HOLDING BUPRENORPHINE
Providers may consider holding buprenorphine if a patient with OUD has not been taking buprenorphine before hospitalization and has severe acute pain needs. This history can be confirmed with the patient and the state’s online prescription drug monitoring program. If further clarification is needed, this can be accomplished with a pharmacist and urine testing or by verifying with the patient’s opioid treatment program, as some programs provide directly administered buprenorphine.
In cases where a patient may have stopped buprenorphine before admission but wants to restart it in the hospital, it is essential to ascertain when the patient last used an opioid. The buprenorphine reinduction should be timed to a sufficient number of hours since last opioid use and/or to when the patient shows signs of active withdrawal. The re-induction can take place before, during, or after an acute pain episode, depending on the individual circumstances.
Patient preference is extremely important in the management of both pain and OUD. After shared decision-making, some patients may ultimately opt to hold buprenorphine in certain situations or switch to an alternative treatment, such as methadone, during their hospitalization. Such adjustments should be made in conjunction with the patient, primary care provider, and pain or addiction medicine specialty consultation.
WHAT YOU SHOULD DO INSTEAD
For patients on buprenorphine admitted to the hospital with anticipated or unanticipated acute pain needs, hospitalists should continue buprenorphine. Continuation of buprenorphine meets a patient’s baseline opioid requirement while still allowing the use of additional short-acting opioid agonists as needed for pain.15
As with all pain, multimodal pain management should be provided with adjunctive medications such as acetaminophen, nonsteroidal anti-inflammatory drugs, neuropathic agents, topical analgesics, and regional anesthesia.8
Acute pain can be addressed by taking advantage of buprenorphine’s analgesic effects and adding additional short-acting opioids if needed.15 Several options are available, including:
1. Continuing daily buprenorphine and prescribing short-acting opioid agonists, preferably those with high intrinsic activity at the mu receptor (such as morphine, fentanyl, or hydromorphone). Full opioid agonist doses to achieve analgesia for patients on buprenorphine will be higher than in opioid naïve patients due to tolerance.16
2 .Dividing the total daily buprenorphine dose into three or four times per day dosing, since buprenorphine provides an analgesic effect lasting six to eight hours. Short-acting opioid agonists can still be prescribed on an as-needed basis for additional pain needs.
3. Temporarily increasing the total daily buprenorphine dose and dividing into three or four times per day dosing, as above. Short-acting opioid agonists can still be prescribed on an as-needed basis for additional pain needs.
It is essential to make a clear plan with the patient for initiation and discontinuation of short-acting opioid agonists or buprenorphine changes. Patients on buprenorphine should be managed collaboratively with the primary care provider or addiction specialist to coordinate prescribing and follow-up after discharge.
RECOMMENDATIONS
- Continue outpatient buprenorphine treatment for patients admitted with acute pain.
- Use adjunctive nonopioid pain medications and nonpharmacologic modalities to address acute pain.
- Adjust buprenorphine to address acute pain by dividing the total daily amount into three or four times a day dosing, and/or up-titrate the buprenorphine dose (federal prescribing regulations recommend a maximum of 24 mg daily, but state regulations may vary).
- Add short-acting opioid agonists on an as-needed basis in conjunction with a defined plan to discontinue short-acting opioid agonists to avoid a return to use.
- Make plans collaboratively with the patient and outpatient provider, and communicate medication changes and plan at discharge.
CONCLUSION
Concerning our case, the hospitalist can continue the patient’s buprenorphine-naloxone, even with her acute pain needs. The patient has a baseline opioid requirement, fulfilled by continuing buprenorphine. Additional short-acting opioid agonists, such as hydromorphone, will provide analgesia for the patient, though the clinician should be aware that higher doses might be required. The practice of holding buprenorphine during episodes of acute pain is not supported by current evidence and may predispose to inadequate analgesia, opioid withdrawal, and risk of return to use and death.2
Do you think this is a low-value practice? Is this truly a “Thing We Do for No Reason™?” Share what you do in your practice and join in the conversation online by retweeting it on Twitter (#TWDFNR) and liking it on Facebook. We invite you to propose ideas for other “Things We Do for No Reason™” topics by emailing TWDFNR@hospitalmedicine.org.
Disclosures
The authors report no conflicts of interest.
1. Mattick RP, Breen C, Kimber J, Davoli M. Buprenorphine maintenance versus placebo or methadone maintenance for opioid dependence. Cochrane Database Syst Rev. 2014;(3):CD002207. https://doi.org/10.1002/14651858.CD002207.
2. Sordo L, Barrio G, Bravo M, et al. Morality risk during and after opioid substitution treatment: systemic review and meta-analysis of cohort studies. BMJ. 2017;357:1550. https://doi.org/10.1136/bmj.j1550.
3. Johnson RE, Fudula PJ, Payne R. Buprenorphine: considerations for pain management. J Pain Symptom Manage. 2005;29(3):297-326. https://doi.org/10.1016/j.jpainsymman.2004.07.005.
4. Marcelina JS, Rubinstein A. Continuous perioperative sublingual buprenorphine. J Pain Palliat Care Pharmacother. 2016;30(4):289-293. https://doi.org/10.1080/15360288.2016.1231734.
5. Greenwald MK, Johanson CE, Moody DE, et al. Effects of buprenorphine maintenance dose on mu-opioid receptor binding potential, plasma concentration and antagonist blockade in heroin-dependent volunteers. Neuropsychopharmacology. 2003;28(11):2000-2009. https://doi.org/10.1038/sj.npp.1300251.
6. Lembke A, Ottestad E, Schmiesing C. Patients maintained on buprenorphine for opioid use disorder should continue buprenorphine through the perioperative period. Pain Med. 2019;20(3):425-428. https://doi.org/10.1093/pm/pny019.
7. Kornfeld H, Manfredi L. Effectiveness of full agonist opioids in patients stabilized on buprenorphine undergoing major surgery: A case series. Am J Ther. 2010;17(5):523-528. https://doi.org/10.1097/MJT.0b013e3181be0804.
8. Harrison TK, Kornfeld H, Aggarwal AK, Lembke A. Perioperative considerations for the patient with opioid use disorder on buprenorphine, methadone, or naltrexone maintenance therapy. Anesthesiol Clin. 2018;36(3):345-359. https://doi.org/10.1016/j.anclin.2018.04.002.
9. Goel A, Azargive S, Lamba W, et al. The perioperative patient on buprenorphine: a systematic review of perioperative management strategies and patient outcomes. Can J Anesth. 2019; 66(2):201-217. https://doi.org/10.1007/s12630-018-1255-3.
10. Hansen LE, Stone GL, Matson CA, Tybor DJ, Pevear ME, Smith EL. Total joint arthroplasty in patients taking methadone or buprenorphine/naloxone preoperatively for prior heroin addiction: a prospective matched cohort study. J Arthroplasty. 2016;31(8):1698-1701. https://doi.org/10.1016/j.arth.2016.01.032.
11. Jonan AB, Kaye AD, Urman RD. Buprenorphine formulations: clinical best practice strategies recommendations for perioperative management of patients undergoing surgical or interventional pain procedures. Pain Physician. 2018;21(1):E1-12. PubMed
12. Quaye AN, Zhang Y. Perioperative management of buprenorphine: solving the conundrum. Pain Med. 2018. https://doi.org/10.1093/pm/pny217.
13. Silva MJ, Rubinstein A. Continuous perioperative sublingual buprenorphine. J Pain Palliative Care Pharmacother. 2016;30(4):289-293. https://doi.org/10.1080/15360288.2016.1231734.
14. Kampman K, Jarvis M. ASAM National practice guidelines for the use of medications in the treatment of addiction involving opioid use. J Addict Med. 2015;9(5):358-367. https://doi.org/10.1097/ADM.0000000000000166.
15. Childers JW, Arnold RM. Treatment of pain in patients taking buprenorphine for opioid addiction. J Palliat Med. 2012;15(5):613-614. https://doi.org/10.1089/jpm.2012.9591.
16. Alford DP, Compton P, Samet JH. Acute pain management for patients receiving maintenance methadone or buprenorphine therapy. Ann Intern Med. 2006;144(2):127-134. https://doi.org/10.7326/0003-4819-144-2-200601170-00010
Inspired by the ABIM Foundation’s Choosing Wisely® campaign, the “Things We Do for No Reason™” (TWDFNR™) series reviews practices that have become common parts of hospital care but may provide little value to our patients. Practices reviewed in the TWDFNR™ series do not represent “black and white” conclusions or clinical practice standards but are meant as a starting place for research and active discussions among hospitalists and patients. We invite you to be part of that discussion.
CLINICAL SCENARIO
A 40-year-old woman with a history of opioid use disorder (OUD) on buprenorphine-naloxone treatment is admitted to medicine following incision and drainage of a large forearm abscess with surrounding cellulitis. The patient reports severe pain following the procedure, which is not relieved by ibuprofen. The admitting hospitalist orders a pain regimen for the patient, which includes oral and intravenous hydromorphone and discontinues the patient’s buprenorphine-naloxone so that the short-acting opioids can take effect.
BACKGROUND
Medications to treat OUD include methadone, buprenorphine, and extended-release naltrexone. Buprenorphine is a Schedule III medication under the United States Food and Drug Administration that reduces opioid cravings, subsequently decreasing drug use1 and opioid-related overdose deaths.2 It has a favorable safety profile and can be prescribed for OUD in an office-based, outpatient setting since the Drug Addiction Treatment Act of 2000 (DATA 2000). Due to extensive first-pass metabolism, buprenorphine for OUD is typically administered sublingually, either alone or in a fixed combination with naloxone.
WHY YOU MIGHT THINK YOU SHOULD HOLD BUPRENORPHINE WHEN TREATING ACUTE PAIN
Buprenorphine is a partial opioid agonist with a long half-life and high affinity for the mu opioid receptor. Given these properties, prior recommendations assumed that buprenorphine blocked the effectiveness of additional opioid agonists.3,4 In 2004, guidelines by the Department of Health and Human Service Center for Substance Abuse Treatment recommended discontinuing buprenorphine in patients taking opioid pain medications.5 These suggestions were based on limited case reports describing difficulty controlling pain in patients with OUD with a high opioid tolerance who were receiving buprenorphine.6
Providers may hold buprenorphine when treating acute pain out of concern it could precipitate withdrawal by displacing full opioid agonists from the mu receptor. Providers may also believe that the naloxone component in the most commonly prescribed formulation, buprenorphine-naloxone, blocks the effects of opioid analgesics. Evolving understanding of buprenorphine pharmacology and the absence of high-quality evidence has resulted in providers holding buprenorphine in the setting of acute pain.
Finally, providers without dedicated training may feel they lack the necessary qualifications to prescribe buprenorphine in the inpatient setting. DATA 2000 requires mandatory X waiver training for physicians, nurse practitioners, and physician assistants to prescribe outpatient buprenorphine for OUD treatment outside of specialized opioid treatment programs.
WHY DISCONTINUING BUPRENORPHINE WHEN TREATING ACUTE PAIN IS NOT NECESSARY
Despite buprenorphine’s high affinity at the mu receptor, additional receptors remain available for full opioid agonists to bind and activate,6 providing effective pain relief even in patients using buprenorphine. In contrast to the 2004 Department of Health and Human Service guidelines, subsequent clinical studies have demonstrated that concurrent use of opioid analgesics is effective for patients maintained on buprenorphine, similar to patients on other forms of OUD treatment such as methadone.7,8
Precipitated withdrawal only occurs when buprenorphine is newly introduced to patients with already circulating opioids. Patients receiving buprenorphine-naloxone can also be exposed to opioids without precipitated withdrawal from the naloxone component, as naloxone is not absorbed via sublingual or buccal administration, but only present in the formulation to dissuade intravenous administration of the medication.
Even in the perioperative period, there is insufficient evidence to support the discontinuation of buprenorphine.9 Studies in this patient population have found that patients receiving buprenorphine may require higher doses of short-acting opioids to achieve adequate analgesia, but they experience similar pain control, lengths of stay, and functional outcomes to controls.10 Despite variable perioperative management of buprenorphine,11 protocols at major medical centers now recommend continuing or dose adjusting buprenorphine in the perioperative period rather than discontinuing.12-14
Patients physically dependent on opioid agonists, including buprenorphine, must be maintained on a daily equivalent opioid dose to avoid experiencing withdrawal. This maintenance requirement must be met before any analgesic effect for acute pain is obtained with additional opioids. Temporarily discontinuing buprenorphine introduces unnecessary complexity to a hospitalization, places the patient at risk of exacerbation of pain, opioid withdrawal, and predisposes the patient to return to use and overdose if not resumed before hospital discharge.5
Finally, clinicians do not require additional training or an X waiver to administer buprenorphine to hospitalized patients. These requirements are limited to providers managing buprenorphine in the outpatient setting or those prescribing buprenorphine to patients to take postdischarge. Hospitalists frequently prescribe opioid medications in the inpatient setting with similar or greater safety risk profiles to buprenorphine.
WHEN YOU SHOULD CONSIDER HOLDING BUPRENORPHINE
Providers may consider holding buprenorphine if a patient with OUD has not been taking buprenorphine before hospitalization and has severe acute pain needs. This history can be confirmed with the patient and the state’s online prescription drug monitoring program. If further clarification is needed, this can be accomplished with a pharmacist and urine testing or by verifying with the patient’s opioid treatment program, as some programs provide directly administered buprenorphine.
In cases where a patient may have stopped buprenorphine before admission but wants to restart it in the hospital, it is essential to ascertain when the patient last used an opioid. The buprenorphine reinduction should be timed to a sufficient number of hours since last opioid use and/or to when the patient shows signs of active withdrawal. The re-induction can take place before, during, or after an acute pain episode, depending on the individual circumstances.
Patient preference is extremely important in the management of both pain and OUD. After shared decision-making, some patients may ultimately opt to hold buprenorphine in certain situations or switch to an alternative treatment, such as methadone, during their hospitalization. Such adjustments should be made in conjunction with the patient, primary care provider, and pain or addiction medicine specialty consultation.
WHAT YOU SHOULD DO INSTEAD
For patients on buprenorphine admitted to the hospital with anticipated or unanticipated acute pain needs, hospitalists should continue buprenorphine. Continuation of buprenorphine meets a patient’s baseline opioid requirement while still allowing the use of additional short-acting opioid agonists as needed for pain.15
As with all pain, multimodal pain management should be provided with adjunctive medications such as acetaminophen, nonsteroidal anti-inflammatory drugs, neuropathic agents, topical analgesics, and regional anesthesia.8
Acute pain can be addressed by taking advantage of buprenorphine’s analgesic effects and adding additional short-acting opioids if needed.15 Several options are available, including:
1. Continuing daily buprenorphine and prescribing short-acting opioid agonists, preferably those with high intrinsic activity at the mu receptor (such as morphine, fentanyl, or hydromorphone). Full opioid agonist doses to achieve analgesia for patients on buprenorphine will be higher than in opioid naïve patients due to tolerance.16
2 .Dividing the total daily buprenorphine dose into three or four times per day dosing, since buprenorphine provides an analgesic effect lasting six to eight hours. Short-acting opioid agonists can still be prescribed on an as-needed basis for additional pain needs.
3. Temporarily increasing the total daily buprenorphine dose and dividing into three or four times per day dosing, as above. Short-acting opioid agonists can still be prescribed on an as-needed basis for additional pain needs.
It is essential to make a clear plan with the patient for initiation and discontinuation of short-acting opioid agonists or buprenorphine changes. Patients on buprenorphine should be managed collaboratively with the primary care provider or addiction specialist to coordinate prescribing and follow-up after discharge.
RECOMMENDATIONS
- Continue outpatient buprenorphine treatment for patients admitted with acute pain.
- Use adjunctive nonopioid pain medications and nonpharmacologic modalities to address acute pain.
- Adjust buprenorphine to address acute pain by dividing the total daily amount into three or four times a day dosing, and/or up-titrate the buprenorphine dose (federal prescribing regulations recommend a maximum of 24 mg daily, but state regulations may vary).
- Add short-acting opioid agonists on an as-needed basis in conjunction with a defined plan to discontinue short-acting opioid agonists to avoid a return to use.
- Make plans collaboratively with the patient and outpatient provider, and communicate medication changes and plan at discharge.
CONCLUSION
Concerning our case, the hospitalist can continue the patient’s buprenorphine-naloxone, even with her acute pain needs. The patient has a baseline opioid requirement, fulfilled by continuing buprenorphine. Additional short-acting opioid agonists, such as hydromorphone, will provide analgesia for the patient, though the clinician should be aware that higher doses might be required. The practice of holding buprenorphine during episodes of acute pain is not supported by current evidence and may predispose to inadequate analgesia, opioid withdrawal, and risk of return to use and death.2
Do you think this is a low-value practice? Is this truly a “Thing We Do for No Reason™?” Share what you do in your practice and join in the conversation online by retweeting it on Twitter (#TWDFNR) and liking it on Facebook. We invite you to propose ideas for other “Things We Do for No Reason™” topics by emailing TWDFNR@hospitalmedicine.org.
Disclosures
The authors report no conflicts of interest.
1. Mattick RP, Breen C, Kimber J, Davoli M. Buprenorphine maintenance versus placebo or methadone maintenance for opioid dependence. Cochrane Database Syst Rev. 2014;(3):CD002207. https://doi.org/10.1002/14651858.CD002207.
2. Sordo L, Barrio G, Bravo M, et al. Morality risk during and after opioid substitution treatment: systemic review and meta-analysis of cohort studies. BMJ. 2017;357:1550. https://doi.org/10.1136/bmj.j1550.
3. Johnson RE, Fudula PJ, Payne R. Buprenorphine: considerations for pain management. J Pain Symptom Manage. 2005;29(3):297-326. https://doi.org/10.1016/j.jpainsymman.2004.07.005.
4. Marcelina JS, Rubinstein A. Continuous perioperative sublingual buprenorphine. J Pain Palliat Care Pharmacother. 2016;30(4):289-293. https://doi.org/10.1080/15360288.2016.1231734.
5. Greenwald MK, Johanson CE, Moody DE, et al. Effects of buprenorphine maintenance dose on mu-opioid receptor binding potential, plasma concentration and antagonist blockade in heroin-dependent volunteers. Neuropsychopharmacology. 2003;28(11):2000-2009. https://doi.org/10.1038/sj.npp.1300251.
6. Lembke A, Ottestad E, Schmiesing C. Patients maintained on buprenorphine for opioid use disorder should continue buprenorphine through the perioperative period. Pain Med. 2019;20(3):425-428. https://doi.org/10.1093/pm/pny019.
7. Kornfeld H, Manfredi L. Effectiveness of full agonist opioids in patients stabilized on buprenorphine undergoing major surgery: A case series. Am J Ther. 2010;17(5):523-528. https://doi.org/10.1097/MJT.0b013e3181be0804.
8. Harrison TK, Kornfeld H, Aggarwal AK, Lembke A. Perioperative considerations for the patient with opioid use disorder on buprenorphine, methadone, or naltrexone maintenance therapy. Anesthesiol Clin. 2018;36(3):345-359. https://doi.org/10.1016/j.anclin.2018.04.002.
9. Goel A, Azargive S, Lamba W, et al. The perioperative patient on buprenorphine: a systematic review of perioperative management strategies and patient outcomes. Can J Anesth. 2019; 66(2):201-217. https://doi.org/10.1007/s12630-018-1255-3.
10. Hansen LE, Stone GL, Matson CA, Tybor DJ, Pevear ME, Smith EL. Total joint arthroplasty in patients taking methadone or buprenorphine/naloxone preoperatively for prior heroin addiction: a prospective matched cohort study. J Arthroplasty. 2016;31(8):1698-1701. https://doi.org/10.1016/j.arth.2016.01.032.
11. Jonan AB, Kaye AD, Urman RD. Buprenorphine formulations: clinical best practice strategies recommendations for perioperative management of patients undergoing surgical or interventional pain procedures. Pain Physician. 2018;21(1):E1-12. PubMed
12. Quaye AN, Zhang Y. Perioperative management of buprenorphine: solving the conundrum. Pain Med. 2018. https://doi.org/10.1093/pm/pny217.
13. Silva MJ, Rubinstein A. Continuous perioperative sublingual buprenorphine. J Pain Palliative Care Pharmacother. 2016;30(4):289-293. https://doi.org/10.1080/15360288.2016.1231734.
14. Kampman K, Jarvis M. ASAM National practice guidelines for the use of medications in the treatment of addiction involving opioid use. J Addict Med. 2015;9(5):358-367. https://doi.org/10.1097/ADM.0000000000000166.
15. Childers JW, Arnold RM. Treatment of pain in patients taking buprenorphine for opioid addiction. J Palliat Med. 2012;15(5):613-614. https://doi.org/10.1089/jpm.2012.9591.
16. Alford DP, Compton P, Samet JH. Acute pain management for patients receiving maintenance methadone or buprenorphine therapy. Ann Intern Med. 2006;144(2):127-134. https://doi.org/10.7326/0003-4819-144-2-200601170-00010
© 2019 Society of Hospital Medicine
Clinical Progress Notes: Updates from the 4th Universal Definition of Myocardial Infarction
Elevated serum troponin clearly does not equal myocardial infarction (MI). This was the strong message in the 2018 publication of the Fourth Universal Definition of Myocardial Infarction1 (4UDMI), the first update to the international consensus document since 2012.
Most clinicians have learned how to accurately diagnose the classic Type 1 MI (T1MI) due to atherosclerotic plaque rupture; however, elevated troponin in the absence of T1MI is increasingly common due to more frequent and less discriminate troponin testing.2 Patients with elevated troponin in the absence of T1MI have traditionally created confusion and variability in diagnosis, management, and documentation. Interpretation and management of elevated troponin in the absence of T1MI has become difficult.
In this clinical practice update, we aim to review the updated definition of Type 2 MI (T2MI) and nonischemic myocardial injury (NIMI), since these are the two predominant diagnoses among patients with elevated troponin in the absence of T1MI. We also provide a clinical framework for clinicians to think through elevated serum cardiac troponin levels and identify opportunities for quality improvement around this critical issue.
DEFINITIONS OF MYOCARDIAL INJURY
The presence of an elevated serum troponin level is a critical component in determining the presence of cardiac myocyte injury and possible infarction. Myocardial injury is defined as the presence of serum troponin above the 99th percentile of the upper reference limit (URL), the absolute value of which varies by assay and which applies to traditional and highly sensitive subtypes. Myocardial injury can be confusing to assess, as it can be acute or chronic.
When troponin levels are elevated but stable, this is indicative of chronic (usually nonischemic) myocardial injury, as seen, for example, in patients who have end-stage renal disease. The presence of acute injury requires a change in the troponin value—specifically a rise and/or fall in troponin levels with serial measurements. What constitutes a significant “rise and/or fall” is a matter of some debate and is not precisely defined in the 4UDMI. The percent change in the troponin value over time (relative delta) is listed as part of the criteria for acute injury when the change is greater than or equal to 20%;1 however, clinicians should be aware that absolute delta in troponin (the change in ng/dL) has better performance characteristics3 in diagnosing acute myocardial injury. Regardless of whether clinicians use relative or absolute changes in the serum troponin level, clinical evaluation of patients with acute injury is critical to establishing whether the injury is ischemic (MI) or nonischemic (NIMI). The presence of at least one of the following is necessary to meet the current criteria for myocardial ischemia according to the fourth universal definition: new ischemic symptoms (eg, chest pain, dyspnea, etc.), new ischemic changes in the patient’s electrocardiogram (eg, new ST segment depression in leads II, III, and aVF), or cardiac imaging changes consistent with ischemic injury (eg, new wall motion abnormality in the inferior wall on echocardiography).
Following diagnosis of MI based on elevated troponin and new symptoms or signs, the cause of MI should then be determined. Type 1 MI remains defined as MI caused by atherosclerotic plaque disruption in a patient with coronary artery disease (CAD). Type 2 MI is not caused by plaque disruption but is due to a mismatch between oxygen supply and demand unrelated to acute atherothrombosis. T2MI is an ischemic myocardial injury traceable to some other illness that leads to inadequate myocyte oxygenation. Causes of T2MI are numerous, can overlap with nonischemic injury, and can include severe anemia, septic shock, rapid atrial fibrillation, and coronary dissection. While CAD may be present in patients with T2MI, it is not a requirement, and an increased demand for, or reduced supply of, myocyte oxygen alone can be sufficient to cause MI.
In the absence of clinical signs or symptoms of cardiac ischemia, clinicians should categorize patients as having a nonischemic myocardial injury. There is significant overlap between causes of T2MI and NIMI, for example, sepsis could cause either T2MI or NIMI. What distinguishes these two entities is whether the signs and symptoms for myocardial ischemia as outlined above are present. If these signs or symptoms are present, the diagnosis is T2MI. If no clinical signs or symptoms of ischemia are present, the diagnosis is NIMI. The assessment of the clinician, using all available clinical information, is pivotal. The characteristics of the three major types of myocardial injury are depicted in the Figure.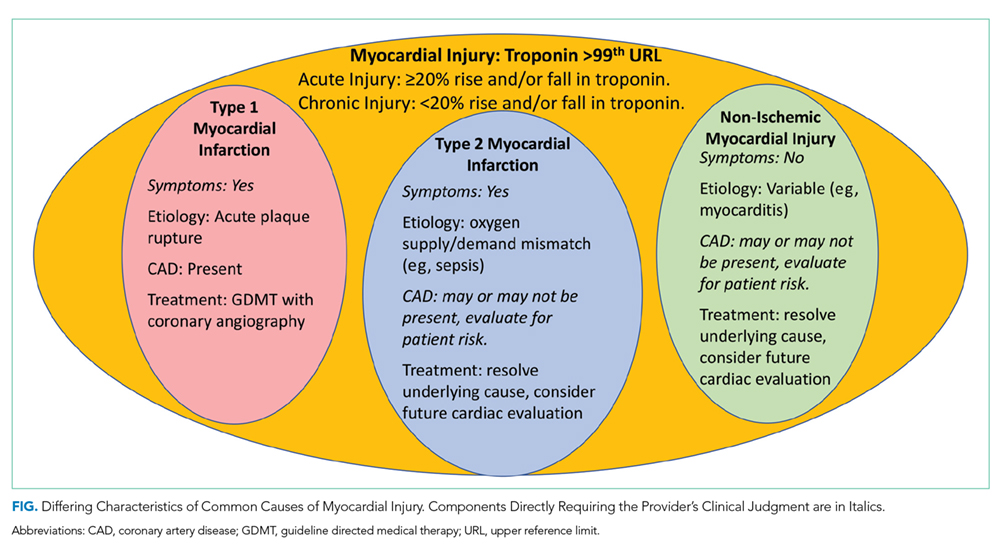
CLINICAL PRACTICE UPDATE
Proper distinction between infarction or injury without infarction is central to proper evaluation, treatment, and eventual documentation in patients with elevated troponin levels. In the case of T2MI and NIMI, identifying what underlying illness is causing the troponin elevation is essential for acute management.
Evaluation
Troponin elevation is associated with an elevated risk for major adverse cardiovascular events, regardless of etiology.4 While patients with suspected T1MI are most often evaluated by coronary angiography, this may not be necessary for patients with T2MI or NIMI. Developing an evaluation strategy for patients with T2MI or NIMI requires understanding the underlying etiology of myocardial injury. In patients with septic shock for example, there are many potential mechanisms for cardiac myocyte injury, many of which are nonischemic (eg, cytokine-mediated).5 Prompt evaluation and treatment of septic shock, therefore, often leads to resolution of cardiac dysfunction, and ischemic evaluation may not be necessary.6 In many cases of T2MI or NIMI, waiting for an acute underlying illness to resolve is necessary before deciding whether ischemic evaluation is appropriate. It is important that this decision is deferred but not forgotten though as patients with T2MI or NIMI may benefit from further cardiac evaluation. There are no society recommendations and minimal evidence to guide this evaluation, but clinical trials testing different evaluation strategies are underway.7 Until an optimal evidence-based evaluation strategy becomes clear, clinicians should focus on two key principles: first, determine and treat the underlying etiology; second, identify patients with traditional risk factors for CAD and consider further evaluation with either coronary angiography or cardiac imaging. Referral to a cardiologist for assistance with the latter issue, especially for challenging or equivocal cases, is encouraged.
Treatment
While T1MI therapies have a strong evidence base with high rates of appropriate treatment, there are relatively few evidence-based therapies for T2MI and NIMI. The benefits of traditional T1MI therapies should be considered in terms of each therapy’s risk-benefit profile. Among patients with T2MI or NIMI in whom atherosclerotic plaque rupture is unlikely, or in whom bleeding risk is high, antithrombotic agents such as unfractionated heparin and dual antiplatelet therapy represent low value and potentially harmful therapies.8 Conversely, patients with multiple risk factors for CAD may benefit from low-risk guideline directed medical therapies such as HMGCoA reductase inhibitors (ie, “statins”). Recent data suggest that lipid-lowering therapies may even be beneficial for preventing T2MI.9
Given the lack of evidence for therapies to treat patients with T2MI or NIMI, clinical judgment remains central to creating an optimal management plan. Clinicians should consider consultation with a cardiologist any time there is ambiguity in whether the diagnosis is T1MI or T2MI. For example, postoperative patients represent a particularly challenging clinical scenario due to the difficulty of assessing ischemic signs and symptoms in the operating room. In this setting, early evaluation by a cardiologist has been shown to improve outcomes.10
Documentation
Documentation of non-ST elevation MI (NSTEMI) for every case of elevated troponin, rather than using the more specific T1MI, T2MI, or NIMI terminology, can have adverse consequences for health systems. From a coding perspective, the terms STEMI and NSTEMI mean T1MI, and the ICD-10 codes used to identify T1MI patients for value-focused programs frequently include patients with T2MI and NIMI due to imprecise documentation.11 When T2MI and NIMI are imprecisely documented as NSTEMI, health systems and clinicians are held to the T1MI care standards. This can negatively skew the performance of a health system or individual clinician because T2MI and NIMI patients have worse outcomes than T1MI patients.4 Inaccurate categorization of patients can lead to inaccurate quality and registry reporting, which may hinder the ability of health systems to monitor and implement quality improvement programs for MI patients. The distinction between T1MI and T2MI in documentation is all the more important now that a new ICD-10 code exists for T2MI (I21.A1), which allows clinicians to more precisely identify these patients, both clinically and administratively, as distinct from T1MI patients.12 While there is no similarly specific ICD-10 code for NIMI, using the appropriate terminology in documentation should prompt coding personnel to use a code for “other abnormal findings of blood chemistry,” reflecting cardiac biomarker elevation (R79.89), rather than using one of the T1MI codes. Clinicians may not be able to determine the etiology of troponin elevation in the initial phase of a hospitalization, but a definitive diagnosis should be documented in the discharge summary.
From the patient perspective, documentation using STEMI and NSTEMI can mislead clinicians, given that this terminology does not specify the underlying cause (ie, plaque rupture or oxygen supply-demand mismatch), potentially leading to delayed initiation of appropriate therapy. Incorrect documentation, using STEMI/NSTEMI language or incorrectly labeling T2MI and NIMI, may lead patients to believe they have had a heart attack when they had myocardial injury instead. This may lead to unnecessary anxiety and change their interactions with the health system. These patients may be started on unnecessary therapies, have inaccurate preoperative evaluations, and be labeled with a preexisting condition for the rest of their lives.
Opportunities for Quality Improvement
Systems-based quality improvement can help to ensure that patients with NIMI and T2MI are labeled appropriately and receive the proper treatment.
CONCLUSIONS
Understanding the definitions of T1MI, T2MI, and NIMI will help clinicians to better identify the appropriate clinical care and consultation strategy for patients with elevated cardiac troponin. There are relatively few published quality improvement initiatives to help guide clinicians through these nuanced distinctions, but there is great potential in such approaches to help clinicians provide the highest value care possible.
Disclosures
No authors have any conflict of interest, financial or otherwise, to declare regarding this study.
Funding
Dr. Levy receives funding from National Institutes of Health (NIH) T32 Training Grant 5T32-HL007822.
1. Thygesen K, Alpert JS, Jaffe AS, et al. Fourth universal definition of myocardial infarction (2018). J Am Coll Cardiol. 2018;72(18):2231-2264. https://doi.org/10.1016/j.jacc.2018.08.1038.
2. Shah ASV, Sandoval Y, Noaman A, et al. Patient selection for high sensitivity cardiac troponin testing and diagnosis of myocardial infarction: prospective cohort study. BMJ. 2017;359:j4788. https://doi.org/10.1136/bmj.j4788.
3. Storrow AB, Nowak RM, Diercks DB, et al. Absolute and relative changes (delta) in troponin I for early diagnosis of myocardial infarction: results of a prospective multicenter trial. Clin Biochem. 2015;48(4-5):260-267. https://doi.org/10.1016/j.clinbiochem.2014.09.012.
4. Sandoval Y, Jaffe AS. Type 2 myocardial infarction. J Am Coll Cardiol. 2019;73(14):1846-1860. https://doi.org/10.1016/j.jacc.2019.02.018.
5. Martin L, Derwall M, Al Zoubi S, et al. The septic heart: current understanding of molecular mechanisms and clinical implications. Chest. 2019;155(2):427-437. https://doi.org/10.1016/j.chest.2018.08.1037.
6. Vallabhajosyula S, Jentzer JC, Geske JB, et al. New-onset heart failure and mortality in hospital survivors of sepsis-related left ventricular dysfunction. Shock. 2018;49(2):144-149. https://doi.org/10.1097/SHK.0000000000000952.
7. Lambrakis K, French JK, Scott IA, et al. The appropriateness of coronary investigation in myocardial injury and type 2 myocardial infarction (ACT-2): a randomized trial design. Am Heart J. 2019;208:11-20. https://doi.org/10.1016/j.ahj.2018.09.016.
8. Morrow A, Ahmad F, Steele C, McEntegart M, Murdoch D. Treating the troponin: adverse consequences of over-treatment of elevated troponin in non-coronary presentations. Scot Med J. 2019;64(1):10-15. https://doi.org/10.1177/0036933018809754.
9. White HD, Steg P, Szarek M, et al. Reduction of type 1 and type 2 myocardial infarctions in patients treated with alirocumab: insights from the ODYSSEY Trial. J Am Coll Cardiol. 2019;73(9):4. https://doi.org/10.1016/S0735-1097(19)30613-8.
10. Hua A, Pattenden H, Leung M, et al. Early cardiology assessment and intervention reduces mortality following myocardial injury after non-cardiac surgery (MINS). J Thorac Dis. 2016;8(5):920-924. https://doi.org/10.21037/jtd.2016.03.55.
11. Díaz-Garzón J, Sandoval Y, Smith S, et al. Discordance between ICD-coded myocardial infarction and diagnosis according to the universal definition of myocardial infarction. Clin Chem. 2017;63(1):415-419. https://doi.org/10.1373/clinchem.2016.263764.
12. Goyal A, Gluckman TJ, Tcheng JE. What’s in a name? The new ICD-10 (10th revision of the International Statistical Classification of Diseases and Related Health Problems) codes and type 2 myocardial infarction. Circulation. 2017;136(13):1180-1182. https://doi.org/10.1161/CIRCULATIONAHA.117.030347.
13. Goyal A GT, Levy AE, Mariani D, et al. Translating the fourth universal definition of myocardial infarction into clinical documentation. Cardiology. 2018:34-36.
Elevated serum troponin clearly does not equal myocardial infarction (MI). This was the strong message in the 2018 publication of the Fourth Universal Definition of Myocardial Infarction1 (4UDMI), the first update to the international consensus document since 2012.
Most clinicians have learned how to accurately diagnose the classic Type 1 MI (T1MI) due to atherosclerotic plaque rupture; however, elevated troponin in the absence of T1MI is increasingly common due to more frequent and less discriminate troponin testing.2 Patients with elevated troponin in the absence of T1MI have traditionally created confusion and variability in diagnosis, management, and documentation. Interpretation and management of elevated troponin in the absence of T1MI has become difficult.
In this clinical practice update, we aim to review the updated definition of Type 2 MI (T2MI) and nonischemic myocardial injury (NIMI), since these are the two predominant diagnoses among patients with elevated troponin in the absence of T1MI. We also provide a clinical framework for clinicians to think through elevated serum cardiac troponin levels and identify opportunities for quality improvement around this critical issue.
DEFINITIONS OF MYOCARDIAL INJURY
The presence of an elevated serum troponin level is a critical component in determining the presence of cardiac myocyte injury and possible infarction. Myocardial injury is defined as the presence of serum troponin above the 99th percentile of the upper reference limit (URL), the absolute value of which varies by assay and which applies to traditional and highly sensitive subtypes. Myocardial injury can be confusing to assess, as it can be acute or chronic.
When troponin levels are elevated but stable, this is indicative of chronic (usually nonischemic) myocardial injury, as seen, for example, in patients who have end-stage renal disease. The presence of acute injury requires a change in the troponin value—specifically a rise and/or fall in troponin levels with serial measurements. What constitutes a significant “rise and/or fall” is a matter of some debate and is not precisely defined in the 4UDMI. The percent change in the troponin value over time (relative delta) is listed as part of the criteria for acute injury when the change is greater than or equal to 20%;1 however, clinicians should be aware that absolute delta in troponin (the change in ng/dL) has better performance characteristics3 in diagnosing acute myocardial injury. Regardless of whether clinicians use relative or absolute changes in the serum troponin level, clinical evaluation of patients with acute injury is critical to establishing whether the injury is ischemic (MI) or nonischemic (NIMI). The presence of at least one of the following is necessary to meet the current criteria for myocardial ischemia according to the fourth universal definition: new ischemic symptoms (eg, chest pain, dyspnea, etc.), new ischemic changes in the patient’s electrocardiogram (eg, new ST segment depression in leads II, III, and aVF), or cardiac imaging changes consistent with ischemic injury (eg, new wall motion abnormality in the inferior wall on echocardiography).
Following diagnosis of MI based on elevated troponin and new symptoms or signs, the cause of MI should then be determined. Type 1 MI remains defined as MI caused by atherosclerotic plaque disruption in a patient with coronary artery disease (CAD). Type 2 MI is not caused by plaque disruption but is due to a mismatch between oxygen supply and demand unrelated to acute atherothrombosis. T2MI is an ischemic myocardial injury traceable to some other illness that leads to inadequate myocyte oxygenation. Causes of T2MI are numerous, can overlap with nonischemic injury, and can include severe anemia, septic shock, rapid atrial fibrillation, and coronary dissection. While CAD may be present in patients with T2MI, it is not a requirement, and an increased demand for, or reduced supply of, myocyte oxygen alone can be sufficient to cause MI.
In the absence of clinical signs or symptoms of cardiac ischemia, clinicians should categorize patients as having a nonischemic myocardial injury. There is significant overlap between causes of T2MI and NIMI, for example, sepsis could cause either T2MI or NIMI. What distinguishes these two entities is whether the signs and symptoms for myocardial ischemia as outlined above are present. If these signs or symptoms are present, the diagnosis is T2MI. If no clinical signs or symptoms of ischemia are present, the diagnosis is NIMI. The assessment of the clinician, using all available clinical information, is pivotal. The characteristics of the three major types of myocardial injury are depicted in the Figure.
CLINICAL PRACTICE UPDATE
Proper distinction between infarction or injury without infarction is central to proper evaluation, treatment, and eventual documentation in patients with elevated troponin levels. In the case of T2MI and NIMI, identifying what underlying illness is causing the troponin elevation is essential for acute management.
Evaluation
Troponin elevation is associated with an elevated risk for major adverse cardiovascular events, regardless of etiology.4 While patients with suspected T1MI are most often evaluated by coronary angiography, this may not be necessary for patients with T2MI or NIMI. Developing an evaluation strategy for patients with T2MI or NIMI requires understanding the underlying etiology of myocardial injury. In patients with septic shock for example, there are many potential mechanisms for cardiac myocyte injury, many of which are nonischemic (eg, cytokine-mediated).5 Prompt evaluation and treatment of septic shock, therefore, often leads to resolution of cardiac dysfunction, and ischemic evaluation may not be necessary.6 In many cases of T2MI or NIMI, waiting for an acute underlying illness to resolve is necessary before deciding whether ischemic evaluation is appropriate. It is important that this decision is deferred but not forgotten though as patients with T2MI or NIMI may benefit from further cardiac evaluation. There are no society recommendations and minimal evidence to guide this evaluation, but clinical trials testing different evaluation strategies are underway.7 Until an optimal evidence-based evaluation strategy becomes clear, clinicians should focus on two key principles: first, determine and treat the underlying etiology; second, identify patients with traditional risk factors for CAD and consider further evaluation with either coronary angiography or cardiac imaging. Referral to a cardiologist for assistance with the latter issue, especially for challenging or equivocal cases, is encouraged.
Treatment
While T1MI therapies have a strong evidence base with high rates of appropriate treatment, there are relatively few evidence-based therapies for T2MI and NIMI. The benefits of traditional T1MI therapies should be considered in terms of each therapy’s risk-benefit profile. Among patients with T2MI or NIMI in whom atherosclerotic plaque rupture is unlikely, or in whom bleeding risk is high, antithrombotic agents such as unfractionated heparin and dual antiplatelet therapy represent low value and potentially harmful therapies.8 Conversely, patients with multiple risk factors for CAD may benefit from low-risk guideline directed medical therapies such as HMGCoA reductase inhibitors (ie, “statins”). Recent data suggest that lipid-lowering therapies may even be beneficial for preventing T2MI.9
Given the lack of evidence for therapies to treat patients with T2MI or NIMI, clinical judgment remains central to creating an optimal management plan. Clinicians should consider consultation with a cardiologist any time there is ambiguity in whether the diagnosis is T1MI or T2MI. For example, postoperative patients represent a particularly challenging clinical scenario due to the difficulty of assessing ischemic signs and symptoms in the operating room. In this setting, early evaluation by a cardiologist has been shown to improve outcomes.10
Documentation
Documentation of non-ST elevation MI (NSTEMI) for every case of elevated troponin, rather than using the more specific T1MI, T2MI, or NIMI terminology, can have adverse consequences for health systems. From a coding perspective, the terms STEMI and NSTEMI mean T1MI, and the ICD-10 codes used to identify T1MI patients for value-focused programs frequently include patients with T2MI and NIMI due to imprecise documentation.11 When T2MI and NIMI are imprecisely documented as NSTEMI, health systems and clinicians are held to the T1MI care standards. This can negatively skew the performance of a health system or individual clinician because T2MI and NIMI patients have worse outcomes than T1MI patients.4 Inaccurate categorization of patients can lead to inaccurate quality and registry reporting, which may hinder the ability of health systems to monitor and implement quality improvement programs for MI patients. The distinction between T1MI and T2MI in documentation is all the more important now that a new ICD-10 code exists for T2MI (I21.A1), which allows clinicians to more precisely identify these patients, both clinically and administratively, as distinct from T1MI patients.12 While there is no similarly specific ICD-10 code for NIMI, using the appropriate terminology in documentation should prompt coding personnel to use a code for “other abnormal findings of blood chemistry,” reflecting cardiac biomarker elevation (R79.89), rather than using one of the T1MI codes. Clinicians may not be able to determine the etiology of troponin elevation in the initial phase of a hospitalization, but a definitive diagnosis should be documented in the discharge summary.
From the patient perspective, documentation using STEMI and NSTEMI can mislead clinicians, given that this terminology does not specify the underlying cause (ie, plaque rupture or oxygen supply-demand mismatch), potentially leading to delayed initiation of appropriate therapy. Incorrect documentation, using STEMI/NSTEMI language or incorrectly labeling T2MI and NIMI, may lead patients to believe they have had a heart attack when they had myocardial injury instead. This may lead to unnecessary anxiety and change their interactions with the health system. These patients may be started on unnecessary therapies, have inaccurate preoperative evaluations, and be labeled with a preexisting condition for the rest of their lives.
Opportunities for Quality Improvement
Systems-based quality improvement can help to ensure that patients with NIMI and T2MI are labeled appropriately and receive the proper treatment.
CONCLUSIONS
Understanding the definitions of T1MI, T2MI, and NIMI will help clinicians to better identify the appropriate clinical care and consultation strategy for patients with elevated cardiac troponin. There are relatively few published quality improvement initiatives to help guide clinicians through these nuanced distinctions, but there is great potential in such approaches to help clinicians provide the highest value care possible.
Disclosures
No authors have any conflict of interest, financial or otherwise, to declare regarding this study.
Funding
Dr. Levy receives funding from National Institutes of Health (NIH) T32 Training Grant 5T32-HL007822.
1. Thygesen K, Alpert JS, Jaffe AS, et al. Fourth universal definition of myocardial infarction (2018). J Am Coll Cardiol. 2018;72(18):2231-2264. https://doi.org/10.1016/j.jacc.2018.08.1038.
2. Shah ASV, Sandoval Y, Noaman A, et al. Patient selection for high sensitivity cardiac troponin testing and diagnosis of myocardial infarction: prospective cohort study. BMJ. 2017;359:j4788. https://doi.org/10.1136/bmj.j4788.
3. Storrow AB, Nowak RM, Diercks DB, et al. Absolute and relative changes (delta) in troponin I for early diagnosis of myocardial infarction: results of a prospective multicenter trial. Clin Biochem. 2015;48(4-5):260-267. https://doi.org/10.1016/j.clinbiochem.2014.09.012.
4. Sandoval Y, Jaffe AS. Type 2 myocardial infarction. J Am Coll Cardiol. 2019;73(14):1846-1860. https://doi.org/10.1016/j.jacc.2019.02.018.
5. Martin L, Derwall M, Al Zoubi S, et al. The septic heart: current understanding of molecular mechanisms and clinical implications. Chest. 2019;155(2):427-437. https://doi.org/10.1016/j.chest.2018.08.1037.
6. Vallabhajosyula S, Jentzer JC, Geske JB, et al. New-onset heart failure and mortality in hospital survivors of sepsis-related left ventricular dysfunction. Shock. 2018;49(2):144-149. https://doi.org/10.1097/SHK.0000000000000952.
7. Lambrakis K, French JK, Scott IA, et al. The appropriateness of coronary investigation in myocardial injury and type 2 myocardial infarction (ACT-2): a randomized trial design. Am Heart J. 2019;208:11-20. https://doi.org/10.1016/j.ahj.2018.09.016.
8. Morrow A, Ahmad F, Steele C, McEntegart M, Murdoch D. Treating the troponin: adverse consequences of over-treatment of elevated troponin in non-coronary presentations. Scot Med J. 2019;64(1):10-15. https://doi.org/10.1177/0036933018809754.
9. White HD, Steg P, Szarek M, et al. Reduction of type 1 and type 2 myocardial infarctions in patients treated with alirocumab: insights from the ODYSSEY Trial. J Am Coll Cardiol. 2019;73(9):4. https://doi.org/10.1016/S0735-1097(19)30613-8.
10. Hua A, Pattenden H, Leung M, et al. Early cardiology assessment and intervention reduces mortality following myocardial injury after non-cardiac surgery (MINS). J Thorac Dis. 2016;8(5):920-924. https://doi.org/10.21037/jtd.2016.03.55.
11. Díaz-Garzón J, Sandoval Y, Smith S, et al. Discordance between ICD-coded myocardial infarction and diagnosis according to the universal definition of myocardial infarction. Clin Chem. 2017;63(1):415-419. https://doi.org/10.1373/clinchem.2016.263764.
12. Goyal A, Gluckman TJ, Tcheng JE. What’s in a name? The new ICD-10 (10th revision of the International Statistical Classification of Diseases and Related Health Problems) codes and type 2 myocardial infarction. Circulation. 2017;136(13):1180-1182. https://doi.org/10.1161/CIRCULATIONAHA.117.030347.
13. Goyal A GT, Levy AE, Mariani D, et al. Translating the fourth universal definition of myocardial infarction into clinical documentation. Cardiology. 2018:34-36.
© 2019 Society of Hospital
Clinical Progress Note: Procalcitonin in the Diagnosis and Management of Community-Acquired Pneumonia in Hospitalized Adults
Community-acquired pneumonia (CAP) accounts for more than 1.5 million adult hospitalizations and 100,000 deaths each year in the United States.1 Antibiotic overuse in the hospital setting is an important contributor to the rise of antibiotic resistance, prompting increased efforts to limit inappropriate antibiotic use in hospitals.2 Procalcitonin, a precursor of the hormone calcitonin, is upregulated in bacterial infections and downregulated in viral infections. The US Food and Drug Administration has approved it as a serum biomarker to assist clinicians with decisions about using antibiotics.3
There is no consensus on how to best use procalcitonin in the management of CAP. We provide a practical update that includes a review of recent literature, added secondary analysis, and expert opinion surrounding the use of procalcitonin in the diagnosis and management of CAP in hospitalized adults.
INITIATION OF ANTIBIOTICS
Initial procalcitonin levels do not sufficiently exclude bacterial etiologies of CAP to withhold antibiotic prescription safely. The largest diagnostic accuracy study of procalcitonin in the diagnosis of CAP was a subanalysis of the Etiology of Pneumonia in the Community Study.4 A total of 1,735 adults hospitalized with CAP received procalcitonin testing along with systematic pathogen testing. The area under the receiver operating characteristic curve for procalcitonin in discriminating bacterial pathogens from viral pathogens was 0.73 (95% CI, 0.69-0.77). A procalcitonin cut-off of 0.1 ng/mL resulted in 80.9% (95% CI, 75.3%-85.7%) sensitivity and 51.6% (95% CI, 46.6%-56.5%) specificity for identification of any bacterial pathogen.
In a secondary analysis of this study, we calculated multilevel likelihood ratios (LRs) for ranges of procalcitonin values to determine the diagnostic accuracy of procalcitonin in distinguishing bacterial from viral etiologies of CAP (Table). Multilevel LRs offer more useful diagnostic information than dichotomizing at specified cut-points.5 A procalcitonin result less than 0.1 ng/mL has a negative LR of 0.4 (95% CI, 0.3-0.5), which is not low enough to rule out bacterial CAP effectively when starting with intermediate or high pretest probability. For a low result (<0.1 ng/mL) to be useful in ruling out bacterial CAP, for example having less than a 10% posttest probability of bacterial CAP, the pretest probability would have to be no greater than 22%. Even then, a 10% posttest probability of bacterial CAP may still be too high for clinicians to withhold initial antibiotics. For procalcitonin values between 0.1 ng/mL and 1.0 ng/mL, the probability of bacterial CAP does not change significantly, with an LR of 1.0 (95% CI, 0.8-1.3). Procalcitonin values up to 5 ng/mL reach a modest positive LR of 2.3 (95% CI, 0.8-4.3). Very high values, such as those >10 ng/mL, yield a positive LR of 5.5 (95% CI, 3.2-9.7), are potentially useful in decisions to initiate antibiotics in situations of very low pretest probability of bacterial CAP. For example, a 9% pretest probability of bacterial CAP is likely below many physicians’ threshold for starting antibiotics. A procalcitonin of 12 ng/mL in this patient would increase the posttest probability to 35%, a value that would prompt many physicians to initiate antibiotics.
Overall, there is insufficient evidence to support the use of procalcitonin as a stand-alone test for ruling out bacterial CAP, limiting its use in withholding antibiotics in patients with suspected bacterial CAP.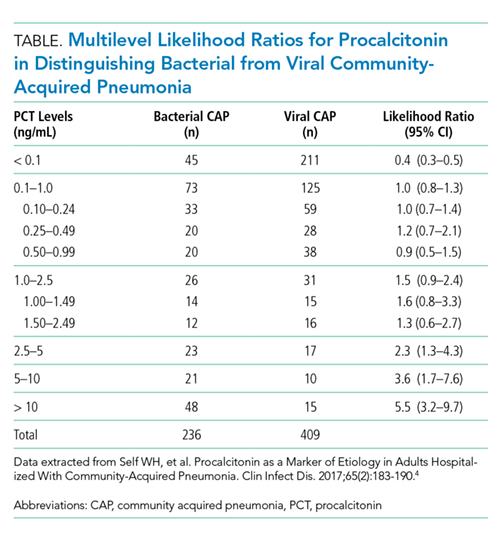
DISCONTINUATION OF ANTIBIOTICS
While initial procalcitonin measurements may not affect the initial antibiotic treatment decision, procalcitonin levels thereafter can guide the duration of therapy. A meta-analysis of procalcitonin-guided treatment in patients with upper or lower respiratory tract infection (LRTI) showed that procalcitonin guidance reduces antibiotic exposure and antibiotic-related adverse effects and improves survival, albeit a small absolute mortality difference of 1.4 percentage points, primarily observed in the intensive care unit setting.6 Most patients included in this meta-analysis were diagnosed with LRTI (91%), and CAP was the predominant subtype of LRTI (43%). The main effect of procalcitonin guidance for patients with CAP was earlier discontinuation of antibiotic treatment. Procalcitonin-guided algorithms in these trials discouraged, or strongly discouraged, antibiotics if procalcitonin was <0.25 ng/mL or <0.1 ng/mL, respectively. In addition, serial procalcitonin measurements were used to guide discontinuation of antibiotics if procalcitonin dropped below 0.25 ng/mL, or by 80% to 90% from the peak value. This approach safely shortened the duration of therapy in patients with CAP.
There are several limitations in the interpretation and generalizability of this meta-analysis. There is large heterogeneity across the included clinical trials in design, procalcitonin protocols, clinical setting, and respiratory infection type, including bronchitis, acute exacerbation of chronic obstructive pulmonary disease (AECOPD), and CAP. Results were consistent only in one moderate- to high-quality randomized trial specifically studying CAP in the inpatient setting.7 Additionally, most of these trials were conducted in Europe. Antibiotic prescribing practices may be different in the US, and prescribing practices on both continents may have changed over the years with greater awareness and appreciation of antibiotic stewardship.
PROCALCITONIN-GUIDED ALGORITHMS
The ProACT trial, the largest randomized, US multicenter trial to evaluate a procalcitonin-based algorithm to assist with antibiotic decision making, included over 1,600 emergency department patients at 14 academic medical centers.8 Procalcitonin guidance in this trial did not reduce antibiotic exposure compared with usual care for patients with suspected LRTI. However, its applicability to the practice of hospitalists and the inpatient setting is limited. First, only 48% of the study participants required hospitalization. Second, this study included all LRTIs, with CAP comprising just 20% of all final diagnoses. Third, the average number of antibiotic days during hospitalization for CAP was short in both groups (3.9 days in the procalcitonin group and 4.1 days in the usual care group). This relatively short antibiotic duration makes it difficult for any intervention to decrease antibiotic days meaningfully.
In a prepost controlled intervention study for inpatients at a single US tertiary care hospital, procalcitonin guidance in hospitalized patients safely reduced antibiotic use in LRTI, specifically for the discontinuation of antibiotics.9 The greatest benefit of procalcitonin guidance in antibiotic discontinuation was found in patients with AECOPD and patients with an admitting diagnosis of CAP, but with mild illness and a low procalcitonin. Although this prepost study suggested a safe reduction of antibiotic use due to implementation of procalcitonin guidance, the lack of randomization and the absence of a contemporaneous control group are important limitations. Given the mixed findings on the effectiveness of procalcitonin guidance for hospitalized CAP patients in the US, further investigation will be needed with large clinical trials in the inpatient setting for CAP.
CONCLUSIONS
There is insufficient evidence to support the use of serum procalcitonin to withhold initial antibiotics in patients with a clinical syndrome consistent with bacterial CAP. However, the literature supports the use of procalcitonin for the early discontinuation of antibiotics for cases in which the probability of bacterial CAP is low, and procalcitonin remains below 0.1 ng/mL (Figure).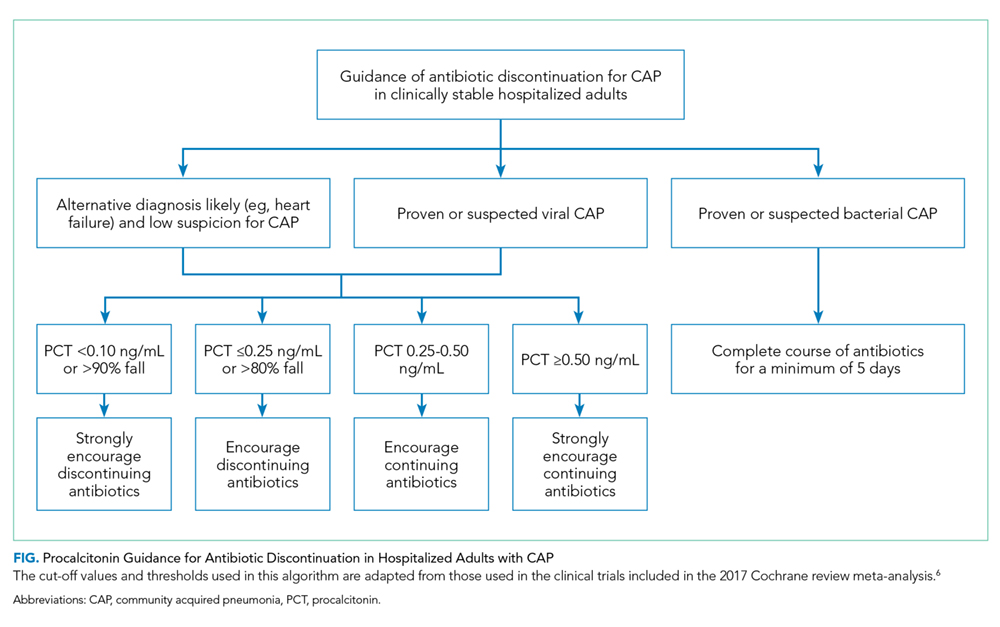
Serial measurements of procalcitonin every one to two days may also be used when clinical uncertainty remains regarding the need for antibiotics. Very low or significantly decreasing procalcitonin levels in patients with CAP and no identified bacterial pathogen likely indicate the infection was not bacterial or was bacterial, but has now been adequately treated with antibiotics. For cases of proven bacterial etiology or high clinical suspicion of bacterial CAP, there is insufficient evidence to recommend the early discontinuation of antibiotics based on procalcitonin levels short of the recommended five-day course according to current guidelines.10 Future clinical trials are needed to determine if procalcitonin guidance can safely decrease the duration of antibiotic therapy for confirmed bacterial CAP to less than five days.
There are discrepancies between the apparent test characteristics of procalcitonin and the recommended antibiotic decisions in many procalcitonin algorithms. For example, algorithms discourage antibiotics when procalcitonin values are 0.1-0.24 ng/mL, and encourage (or even strongly encourage) antibiotic use for higher procalcitonin values of 0.25-1.0 ng/mL. However, the LRs for these ranges are identical and are approximately 1.0 (Table), suggesting that decision-making should be similar across the entire procalcitonin range of 0.1 to 1.0. Future clinical trials should study revised algorithms with different cut-points, including the thresholds found in our secondary analysis of multilevel LRs. Until then, we believe there is insufficient evidence to deviate from current antibiotic decision recommendations at the traditional cut-points.
While procalcitonin is an imperfect biomarker for discriminating bacterial and nonbacterial etiologies of CAP, it may still provide helpful information for the hospitalist in antibiotic decision-making in the same way we apply other commonly used clinical variables such as fever, white blood cell count, band count, and the pattern of infiltrate in chest imaging.
Procalcitonin should be interpreted cautiously in certain populations in which it has not been extensively studied (eg, immunocompromised) or in noninfectious conditions that may elevate procalcitonin, such as major physiologic stress (eg, surgery, trauma, burns) and end-stage renal disease.12-14 Further investigation is needed to determine the efficacy and safety of procalcitonin-guided antibiotic therapy in these populations.
RECOMMENDATIONS
- Based on currently available data, a low procalcitonin value should not be used as a stand-alone test to withhold antibiotics in a patient with CAP.
- Serum procalcitonin measurements may help guide the early discontinuation of antibiotics for patients who the treating clinician judges the risks of bacterial etiology and clinical deterioration to be low.
- Interpret procalcitonin cautiously in immunocompromised patients, undergoing severe physiologic stress, or have underlying end-stage renal disease.
- Serum procalcitonin serves as an adjunct to, rather than a substitute for, clinical judgment.
Disclosures
Dr Choi, Dr Evans, and Dr Glesby have nothing to disclose. Dr Self reports receiving prior research funding from BRAHMS/Thermo-Fisher and BioMerieux for studies on procalcitonin. Dr Self reports personal fees from Inflammatix, grants from Axis Shield, Rapid Pathogen Screening, and BioMerieux, all outside the submitted work. Dr McCarthy reports receiving research funding from Allergan outside the submitted work. Dr Simon reports receiving consulting fees from Roche Diagnostics.
1. Ramirez JA, Wiemken TL, Peyrani P, et al. adults hospitalized with pneumonia in the united states: incidence, epidemiology, and mortality. Clin Infect Dis. 2017;65(11):1806-1812. https://doi.org/10.1093/cid/cix647.
2. Hecker MT, Aron DC, Patel NP, Lehmann MK, Donskey CJ. Unnecessary use of antimicrobials in hospitalized patients: current patterns of misuse with an emphasis on the antianaerobic spectrum of activity. Arch Intern Med. 2003;163(8):972-978. https://doi.org/10.1001/archinte.163.8.972.
3. Rhee C. Using procalcitonin to guide antibiotic therapy. Open Forum Infect Dis. 2017;4(1):ofw249. https://doi.org/10.1093/ofid/ofw249.
4. Self WH, Balk RA, Grijalva CG, et al. Procalcitonin as a marker of etiology in adults hospitalized with community-acquired pneumonia. Clin Infect Dis. 2017;65(2):183-190. https://doi.org/10.1093/cid/cix317.
5. Straus SE, Richardson WS, Glasziou P, Haynes RB. Evidence-Based Medicine: How to Practice and Teach It (4th Edition). Fourth Edition ed. London, England: Elsevier Churchill Livingstone; 2010.
6. Schuetz P, Wirz Y, Sager R, et al. Procalcitonin to initiate or discontinue antibiotics in acute respiratory tract infections. Cochrane Database Syst Rev. 2017;10:CD007498. https://doi.org/10.1164/rccm.200512-1922OC.
7. Christ-Crain M, Stolz D, Bingisser R, et al. Procalcitonin guidance of antibiotic therapy in community-acquired pneumonia: a randomized trial. Am J Respir Crit Care Med. 2006;174(1):84-93. https://doi.org/10.1056/NEJMoa1802670.
8. Huang DT, Yealy DM, Filbin MR, et al. Procalcitonin-guided use of antibiotics for lower respiratory tract infection. N Engl J Med. 2018;379(3):236-249. https://doi.org/10.1056/NEJMoa1802670
10. Townsend J, Adams V, Galiatsatos P, et al. Procalcitonin-guided antibiotic therapy reduces antibiotic use for lower respiratory tract infections in a United States medical center: results of a clinical trial. Open Forum Infect Dis. 2018;5(12):ofy327. https://doi.org/10.1093/ofid/ofy327.
11. Mandell LA, Wunderink RG, Anzueto A, et al. Infectious Diseases Society of America/American Thoracic Society consensus guidelines on the management of community-acquired pneumonia in adults. Clin Infect Dis. 2007;44 Suppl 2:S27-S72. https://doi.org/10.1086/511159.
12. Seoane L, Pértega S, Galeiras R, Astola I, Bouza T. Procalcitonin in the burn unit and the diagnosis of infection. Burns. 2014;40(2):223-229. https://doi.org/10.1016/j.burns.2013.11.018.
13. Dahaba AA, Rehak PH, List WF. Procalcitonin and C-reactive protein plasma concentrations in nonseptic uremic patients undergoing hemodialysis. Intensive Care Med. 2003;29(4):579-583. https://doi.org/10.1007/s00134-003-1664-8.
14. Ghabra H, White W, Townsend M, Boysen P, Nossaman B. Use of biomarkers in the prediction of culture-proven infection in the surgical intensive care unit. J Crit Care. 2019;49:149-154. https://doi.org/10.1016/j.jcrc.2018.10.023.
15. Hoshino K, Irie Y, Mizunuma M, Kawano K, Kitamura T, Ishikura H. Incidence of elevated procalcitonin and presepsin levels after severe trauma: a pilot cohort study. Anaesth Intensive Care. 2017;45(5):600-604. https://doi.org/10.1177/0310057X1704500510.
Community-acquired pneumonia (CAP) accounts for more than 1.5 million adult hospitalizations and 100,000 deaths each year in the United States.1 Antibiotic overuse in the hospital setting is an important contributor to the rise of antibiotic resistance, prompting increased efforts to limit inappropriate antibiotic use in hospitals.2 Procalcitonin, a precursor of the hormone calcitonin, is upregulated in bacterial infections and downregulated in viral infections. The US Food and Drug Administration has approved it as a serum biomarker to assist clinicians with decisions about using antibiotics.3
There is no consensus on how to best use procalcitonin in the management of CAP. We provide a practical update that includes a review of recent literature, added secondary analysis, and expert opinion surrounding the use of procalcitonin in the diagnosis and management of CAP in hospitalized adults.
INITIATION OF ANTIBIOTICS
Initial procalcitonin levels do not sufficiently exclude bacterial etiologies of CAP to withhold antibiotic prescription safely. The largest diagnostic accuracy study of procalcitonin in the diagnosis of CAP was a subanalysis of the Etiology of Pneumonia in the Community Study.4 A total of 1,735 adults hospitalized with CAP received procalcitonin testing along with systematic pathogen testing. The area under the receiver operating characteristic curve for procalcitonin in discriminating bacterial pathogens from viral pathogens was 0.73 (95% CI, 0.69-0.77). A procalcitonin cut-off of 0.1 ng/mL resulted in 80.9% (95% CI, 75.3%-85.7%) sensitivity and 51.6% (95% CI, 46.6%-56.5%) specificity for identification of any bacterial pathogen.
In a secondary analysis of this study, we calculated multilevel likelihood ratios (LRs) for ranges of procalcitonin values to determine the diagnostic accuracy of procalcitonin in distinguishing bacterial from viral etiologies of CAP (Table). Multilevel LRs offer more useful diagnostic information than dichotomizing at specified cut-points.5 A procalcitonin result less than 0.1 ng/mL has a negative LR of 0.4 (95% CI, 0.3-0.5), which is not low enough to rule out bacterial CAP effectively when starting with intermediate or high pretest probability. For a low result (<0.1 ng/mL) to be useful in ruling out bacterial CAP, for example having less than a 10% posttest probability of bacterial CAP, the pretest probability would have to be no greater than 22%. Even then, a 10% posttest probability of bacterial CAP may still be too high for clinicians to withhold initial antibiotics. For procalcitonin values between 0.1 ng/mL and 1.0 ng/mL, the probability of bacterial CAP does not change significantly, with an LR of 1.0 (95% CI, 0.8-1.3). Procalcitonin values up to 5 ng/mL reach a modest positive LR of 2.3 (95% CI, 0.8-4.3). Very high values, such as those >10 ng/mL, yield a positive LR of 5.5 (95% CI, 3.2-9.7), are potentially useful in decisions to initiate antibiotics in situations of very low pretest probability of bacterial CAP. For example, a 9% pretest probability of bacterial CAP is likely below many physicians’ threshold for starting antibiotics. A procalcitonin of 12 ng/mL in this patient would increase the posttest probability to 35%, a value that would prompt many physicians to initiate antibiotics.
Overall, there is insufficient evidence to support the use of procalcitonin as a stand-alone test for ruling out bacterial CAP, limiting its use in withholding antibiotics in patients with suspected bacterial CAP.
DISCONTINUATION OF ANTIBIOTICS
While initial procalcitonin measurements may not affect the initial antibiotic treatment decision, procalcitonin levels thereafter can guide the duration of therapy. A meta-analysis of procalcitonin-guided treatment in patients with upper or lower respiratory tract infection (LRTI) showed that procalcitonin guidance reduces antibiotic exposure and antibiotic-related adverse effects and improves survival, albeit a small absolute mortality difference of 1.4 percentage points, primarily observed in the intensive care unit setting.6 Most patients included in this meta-analysis were diagnosed with LRTI (91%), and CAP was the predominant subtype of LRTI (43%). The main effect of procalcitonin guidance for patients with CAP was earlier discontinuation of antibiotic treatment. Procalcitonin-guided algorithms in these trials discouraged, or strongly discouraged, antibiotics if procalcitonin was <0.25 ng/mL or <0.1 ng/mL, respectively. In addition, serial procalcitonin measurements were used to guide discontinuation of antibiotics if procalcitonin dropped below 0.25 ng/mL, or by 80% to 90% from the peak value. This approach safely shortened the duration of therapy in patients with CAP.
There are several limitations in the interpretation and generalizability of this meta-analysis. There is large heterogeneity across the included clinical trials in design, procalcitonin protocols, clinical setting, and respiratory infection type, including bronchitis, acute exacerbation of chronic obstructive pulmonary disease (AECOPD), and CAP. Results were consistent only in one moderate- to high-quality randomized trial specifically studying CAP in the inpatient setting.7 Additionally, most of these trials were conducted in Europe. Antibiotic prescribing practices may be different in the US, and prescribing practices on both continents may have changed over the years with greater awareness and appreciation of antibiotic stewardship.
PROCALCITONIN-GUIDED ALGORITHMS
The ProACT trial, the largest randomized, US multicenter trial to evaluate a procalcitonin-based algorithm to assist with antibiotic decision making, included over 1,600 emergency department patients at 14 academic medical centers.8 Procalcitonin guidance in this trial did not reduce antibiotic exposure compared with usual care for patients with suspected LRTI. However, its applicability to the practice of hospitalists and the inpatient setting is limited. First, only 48% of the study participants required hospitalization. Second, this study included all LRTIs, with CAP comprising just 20% of all final diagnoses. Third, the average number of antibiotic days during hospitalization for CAP was short in both groups (3.9 days in the procalcitonin group and 4.1 days in the usual care group). This relatively short antibiotic duration makes it difficult for any intervention to decrease antibiotic days meaningfully.
In a prepost controlled intervention study for inpatients at a single US tertiary care hospital, procalcitonin guidance in hospitalized patients safely reduced antibiotic use in LRTI, specifically for the discontinuation of antibiotics.9 The greatest benefit of procalcitonin guidance in antibiotic discontinuation was found in patients with AECOPD and patients with an admitting diagnosis of CAP, but with mild illness and a low procalcitonin. Although this prepost study suggested a safe reduction of antibiotic use due to implementation of procalcitonin guidance, the lack of randomization and the absence of a contemporaneous control group are important limitations. Given the mixed findings on the effectiveness of procalcitonin guidance for hospitalized CAP patients in the US, further investigation will be needed with large clinical trials in the inpatient setting for CAP.
CONCLUSIONS
There is insufficient evidence to support the use of serum procalcitonin to withhold initial antibiotics in patients with a clinical syndrome consistent with bacterial CAP. However, the literature supports the use of procalcitonin for the early discontinuation of antibiotics for cases in which the probability of bacterial CAP is low, and procalcitonin remains below 0.1 ng/mL (Figure).
Serial measurements of procalcitonin every one to two days may also be used when clinical uncertainty remains regarding the need for antibiotics. Very low or significantly decreasing procalcitonin levels in patients with CAP and no identified bacterial pathogen likely indicate the infection was not bacterial or was bacterial, but has now been adequately treated with antibiotics. For cases of proven bacterial etiology or high clinical suspicion of bacterial CAP, there is insufficient evidence to recommend the early discontinuation of antibiotics based on procalcitonin levels short of the recommended five-day course according to current guidelines.10 Future clinical trials are needed to determine if procalcitonin guidance can safely decrease the duration of antibiotic therapy for confirmed bacterial CAP to less than five days.
There are discrepancies between the apparent test characteristics of procalcitonin and the recommended antibiotic decisions in many procalcitonin algorithms. For example, algorithms discourage antibiotics when procalcitonin values are 0.1-0.24 ng/mL, and encourage (or even strongly encourage) antibiotic use for higher procalcitonin values of 0.25-1.0 ng/mL. However, the LRs for these ranges are identical and are approximately 1.0 (Table), suggesting that decision-making should be similar across the entire procalcitonin range of 0.1 to 1.0. Future clinical trials should study revised algorithms with different cut-points, including the thresholds found in our secondary analysis of multilevel LRs. Until then, we believe there is insufficient evidence to deviate from current antibiotic decision recommendations at the traditional cut-points.
While procalcitonin is an imperfect biomarker for discriminating bacterial and nonbacterial etiologies of CAP, it may still provide helpful information for the hospitalist in antibiotic decision-making in the same way we apply other commonly used clinical variables such as fever, white blood cell count, band count, and the pattern of infiltrate in chest imaging.
Procalcitonin should be interpreted cautiously in certain populations in which it has not been extensively studied (eg, immunocompromised) or in noninfectious conditions that may elevate procalcitonin, such as major physiologic stress (eg, surgery, trauma, burns) and end-stage renal disease.12-14 Further investigation is needed to determine the efficacy and safety of procalcitonin-guided antibiotic therapy in these populations.
RECOMMENDATIONS
- Based on currently available data, a low procalcitonin value should not be used as a stand-alone test to withhold antibiotics in a patient with CAP.
- Serum procalcitonin measurements may help guide the early discontinuation of antibiotics for patients who the treating clinician judges the risks of bacterial etiology and clinical deterioration to be low.
- Interpret procalcitonin cautiously in immunocompromised patients, undergoing severe physiologic stress, or have underlying end-stage renal disease.
- Serum procalcitonin serves as an adjunct to, rather than a substitute for, clinical judgment.
Disclosures
Dr Choi, Dr Evans, and Dr Glesby have nothing to disclose. Dr Self reports receiving prior research funding from BRAHMS/Thermo-Fisher and BioMerieux for studies on procalcitonin. Dr Self reports personal fees from Inflammatix, grants from Axis Shield, Rapid Pathogen Screening, and BioMerieux, all outside the submitted work. Dr McCarthy reports receiving research funding from Allergan outside the submitted work. Dr Simon reports receiving consulting fees from Roche Diagnostics.
1. Ramirez JA, Wiemken TL, Peyrani P, et al. adults hospitalized with pneumonia in the united states: incidence, epidemiology, and mortality. Clin Infect Dis. 2017;65(11):1806-1812. https://doi.org/10.1093/cid/cix647.
2. Hecker MT, Aron DC, Patel NP, Lehmann MK, Donskey CJ. Unnecessary use of antimicrobials in hospitalized patients: current patterns of misuse with an emphasis on the antianaerobic spectrum of activity. Arch Intern Med. 2003;163(8):972-978. https://doi.org/10.1001/archinte.163.8.972.
3. Rhee C. Using procalcitonin to guide antibiotic therapy. Open Forum Infect Dis. 2017;4(1):ofw249. https://doi.org/10.1093/ofid/ofw249.
4. Self WH, Balk RA, Grijalva CG, et al. Procalcitonin as a marker of etiology in adults hospitalized with community-acquired pneumonia. Clin Infect Dis. 2017;65(2):183-190. https://doi.org/10.1093/cid/cix317.
5. Straus SE, Richardson WS, Glasziou P, Haynes RB. Evidence-Based Medicine: How to Practice and Teach It (4th Edition). Fourth Edition ed. London, England: Elsevier Churchill Livingstone; 2010.
6. Schuetz P, Wirz Y, Sager R, et al. Procalcitonin to initiate or discontinue antibiotics in acute respiratory tract infections. Cochrane Database Syst Rev. 2017;10:CD007498. https://doi.org/10.1164/rccm.200512-1922OC.
7. Christ-Crain M, Stolz D, Bingisser R, et al. Procalcitonin guidance of antibiotic therapy in community-acquired pneumonia: a randomized trial. Am J Respir Crit Care Med. 2006;174(1):84-93. https://doi.org/10.1056/NEJMoa1802670.
8. Huang DT, Yealy DM, Filbin MR, et al. Procalcitonin-guided use of antibiotics for lower respiratory tract infection. N Engl J Med. 2018;379(3):236-249. https://doi.org/10.1056/NEJMoa1802670
10. Townsend J, Adams V, Galiatsatos P, et al. Procalcitonin-guided antibiotic therapy reduces antibiotic use for lower respiratory tract infections in a United States medical center: results of a clinical trial. Open Forum Infect Dis. 2018;5(12):ofy327. https://doi.org/10.1093/ofid/ofy327.
11. Mandell LA, Wunderink RG, Anzueto A, et al. Infectious Diseases Society of America/American Thoracic Society consensus guidelines on the management of community-acquired pneumonia in adults. Clin Infect Dis. 2007;44 Suppl 2:S27-S72. https://doi.org/10.1086/511159.
12. Seoane L, Pértega S, Galeiras R, Astola I, Bouza T. Procalcitonin in the burn unit and the diagnosis of infection. Burns. 2014;40(2):223-229. https://doi.org/10.1016/j.burns.2013.11.018.
13. Dahaba AA, Rehak PH, List WF. Procalcitonin and C-reactive protein plasma concentrations in nonseptic uremic patients undergoing hemodialysis. Intensive Care Med. 2003;29(4):579-583. https://doi.org/10.1007/s00134-003-1664-8.
14. Ghabra H, White W, Townsend M, Boysen P, Nossaman B. Use of biomarkers in the prediction of culture-proven infection in the surgical intensive care unit. J Crit Care. 2019;49:149-154. https://doi.org/10.1016/j.jcrc.2018.10.023.
15. Hoshino K, Irie Y, Mizunuma M, Kawano K, Kitamura T, Ishikura H. Incidence of elevated procalcitonin and presepsin levels after severe trauma: a pilot cohort study. Anaesth Intensive Care. 2017;45(5):600-604. https://doi.org/10.1177/0310057X1704500510.
© 2019 Society of Hospital Medicine
Barriers to Providing VTE Chemoprophylaxis to Hospitalized Patients: A Nursing-Focused Qualitative Evaluation
Venous thromboembolism (VTE), comprising deep venous thrombosis and pulmonary embolism (PE),1 is a serious medical condition that results in preventable morbidity and mortality.1-5 VTE affects all age groups, all races/ethnicities, and both genders, but there are known factors that increase the risk of developing VTE (eg, advanced age, undergoing surgery, hospitalization, and immobility).1-3,5-7 Prevention of VTE among hospitalized patients is of paramount importance to avoid preventable death, chronic illness/long-term complications,8 longer hospital stays, and increased hospital costs.9 Fortunately, there is clear evidence that provision of appropriate prophylaxis can decrease the risk of a VTE event occurring, and broadly accepted best-practice guidelines reflect this evidence.3,5
Given the inadequacy of current VTE-related quality measures to identify actionable failures in the provision of VTE prophylaxis, our group created a VTE process-of-care measure to assess adherence to the components of VTE prophylaxis: (1) early ambulation, (2) mechanical prophylaxis (sequential compression devices [SCDs]), and (3) chemoprophylaxis administered at the correct dose and frequency for the duration of the patient’s hospital stay.3,10,11 This quality measure was conceived, created, and iteratively revised to measure whether optimal care is provided to patients throughout their hospitalization and identify actionable areas in which failures of care occur, in order to decrease the risk of a VTE event. Data from our institution provided evidence that while ambulation and SCD component measure adherence is high, chemoprophylaxis adherence required significant improvement.10 When chemoprophylaxis process measure adherence data were analyzed further, a major failure mode was patient refusal of one or more doses. However, the drivers of patient refusal are not well defined in the literature, and previous studies have called for a greater focus on developing interventions to improve VTE chemoprophylaxis administration.12
Previous research has shown that nurses can influence patient compliance with VTE prophylaxis.13-15 A mixed-methods study by Elder et al. found that nurses in units with high rates of failure to provide optimal chemoprophylaxis offered the medication as optional, leading researchers to conclude that nurses perceived chemoprophylaxis as discretionary.13 Another study by Lee et al., conducted a survey of bedside registered nurses and identified nurses’ lack of education on VTE prevention as a significant barrier to providing care.14 These studies show that multiple levels of influence impact how nurses provide VTE chemoprophylaxis, particularly when they encounter patients who refuse chemoprophylaxis.
To explore the nuance and interplay of multiple influences, we used the Theoretical Domains Framework (TDF), an integrative framework that applies theoretical approaches to interventions aimed at behavior change.15-18 The framework contains 14 interrelated domains that characterize the behavior being studied, in this case, administration of VTE chemoprophylaxis. Consequently, we designed a nurse-focused, qualitative evaluation with the objective to identify nursing-related barriers to administration of VTE chemoprophylaxis.
METHODS
Inpatient Unit Selection
The study team accessed data from the hospital’s Enterprise Data Warehouse to review patient refusal rates of VTE chemoprophylaxis for each inpatient unit in the hospital. Patient refusal was utilized as a proxy measure for the behavior of nurses attempting to administer VTE chemoprophylaxis. Of the 14 medical and surgical units in the hospital, two medical and two surgical units were selected to participate in the qualitative evaluation based on having the highest patient refusal rates. One unit (surgical) was also selected to serve as a benchmark because it had the lowest patient refusal rate. Table 1 includes the refusal rates for the five units. Given the low refusal rate for the best performing unit, we suspected that it would be possible to decrease the patient refusal rate for other units with similar patient populations and interprofessional teams at the institution.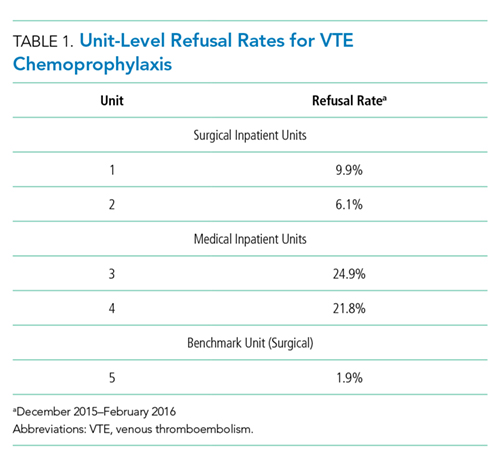
Observations
We observed chemoprophylaxis administration on the five units to understand the process for ordering and administering chemoprophylaxis. An observation protocol was utilized to document the date, time, and location of the observation as well as descriptive notes including accounts of particular events.19,20 Observations occurred in May 2016 and informed the creation of a process map outlining the procedure for ordering and administering VTE chemoprophylaxis. The process map was utilized to create the focus group interview guide and ensure the interview guide included pertinent questions for each step of the process (Appendix A).
Focus Group Interviews
We conducted focus group interviews with day and night shift nurses on the five units to assess nurses’ understanding of VTE chemoprophylaxis and nurses’ perceptions of barriers to administration of VTE chemoprophylaxis. The study team chose to conduct focus group interviews in an effort to maximize participation and to speak with multiple nurses within a shorter period of time. The focus group structure allowed the study team to speak with nurses during their shifts, as one could briefly step out, if required, for patient care and return to rejoin the discussion.
We developed a semistructured interview guide21 with questions focused on identifying nurses’ perceptions of guideline-recommended care for VTE chemoprophylaxis, where they learned these guidelines, how nurses discuss chemoprophylaxis with patients, how they handle the conversation with patients who refuse, and if there are times when chemoprophylaxis is not necessary. The interview guide was vetted by a multidisciplinary team consisting of clinical nursing coordinators and nurse managers from medical and surgical units, hospital quality leaders, surgeons and general internists, and qualitative research experts. The interview guide is included as Appendix B.
The unit clinical coordinators and nurse managers identified dates and times for the focus groups that would be minimally disruptive to the unit. For each of the four units with a high patient refusal rate, two focus groups were conducted during the lunch hour and one was conducted at the end of the night shift to ensure that both day and night shift nurses were included in the study. Two focus groups were conducted with the best-practice unit during the lunch hour. For each focus group, the clinical coordinator identified two to eight nurses who could step away from patient care to participate or who had completed their shifts. In total, approximately 67 nurses participated in the focus groups.
The focus groups (n = 14) lasted approximately 40 minutes during May and June 2016. Two members of the study team cofacilitated interviews, which were recorded and transcribed verbatim.
Coding and Data Analysis
To develop the code book, the study team, consisting of three qualitative researchers, independently read one focus group transcript and applied the TDF domains to the nurses’ perceptions of barriers to administration of VTE chemoprophylaxis.21-24 In addition to coding by domain, the study team also coded nursing perceptions as barriers or facilitators. The study team reviewed the coded transcript and reconciled any differences in coding. This process was repeated for a second transcript, and then all remaining transcripts were assigned to two out of three study team members for coding, with the entire study team meeting to reconcile any differences. If necessary, the team member who did not code a transcript acted as the tie-breaker if there were discrepancies in codes that could not be reconciled.
Once coding was completed, we identified the TDF domains that were most relevant to the administration of VTE chemoprophylaxis.16 Member checking (testing the analysis, interpretations, and conclusions with members of those groups from whom the data were originally obtained) was performed with the four clinical nursing coordinators and four nurse managers from the participating units to establish face validity of the themes identified from the focus group interviews.25
The study team used MaxQDA, V12 (Berlin, Germany) to support data coding and analysis.26 The Northwestern University institutional review board office deemed this project research on nonhuman-subjects because it focused on the process of providing VTE chemoprophylaxis and not about the patients themselves. The purpose of the study was explained at the beginning of each focus group, and nurses gave verbal consent to have the focus group recorded.
RESULTS
We conducted 14 focus groups with day and night shift nurses from five units (two medical and three surgical) at a single institution. All nurses invited to participate in a focus group agreed to participate. The data were coded and grouped by domain and identified as barriers or facilitators. The findings included below are for the domains most relevant to the provision of VTE prophylaxis. Table 2 provides illustrative verbatim quotes for each domain that was represented in the focus groups.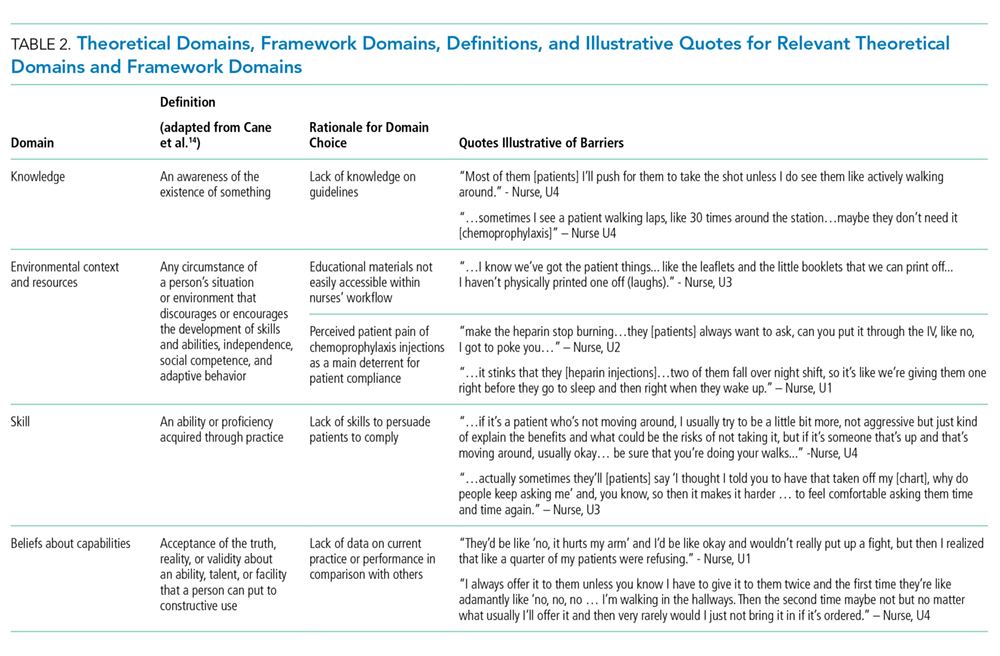
THEORETICAL DOMAINS FRAMEWORK DOMAINS
Knowledge
All interviewees recognized that providing some form of prophylaxis to mitigate the risk of a VTE event is essential. Some nurses stated that seeing a patient ambulating meant they would consider not administering prescribed chemoprophylaxis, while others would try to negotiate with patients by asking the patient to allow one dose of chemoprophylaxis prescribed two to three times daily because it was better than receiving no doses.
Environmental Context and Resources
Multiple barriers to providing optimal care were associated with the environmental context and a lack of resources. There was a lack of accessible, comprehensive, patient-centered education materials on VTE chemoprophylaxis to supplement a nurse’s explanation about the importance of chemoprophylaxis. Furthermore, many nurses cited the perceived patient pain of chemoprophylaxis injections as the main deterrent to patient compliance, especially subcutaneous heparin injections, which occur up to three times in 24 hours and often cause more pain at the site of injection than low-molecular-weight heparin. Nurses felt that transitioning patients from receiving subcutaneous heparin injections to receiving low-molecular-weight heparin could be a main driver to reduce patient refusals.
Skills
Nurses felt inadequately equipped to handle patient refusals. Many said that patient refusal of treatments was never discussed in nursing school. As a result, when patients refused treatments, the nurses did not know how to handle the situation. They felt that they lacked the tools and techniques to persuade the patient to comply.
Beliefs about Capabilities
Nurses did not know their own patient refusal rate or benchmarks of an acceptable refusal rate in contrast to one that is too high. Without this feedback, they were unable to assess their own behavior or performance related to providing VTE chemoprophylaxis.
DISCUSSION
Nurses play a critical role in providing VTE chemoprophylaxis to patients throughout their hospitalization. This study provided a unique opportunity to perform an in-depth, qualitative analysis of the barriers nurses face in providing patients with VTE chemoprophylaxis as part of their daily work caring for patients. We discovered several nursing-related barriers to the provision of VTE chemoprophylaxis, including lack of knowledge, resources, skill, and misconceptions of their capability to provide VTE chemoprophylaxis. We used a bottom-up approach by incorporating the voices of unit nurses, clinical coordinators, and nurse managers to understand potential barriers. Our findings brought to light the challenge of delivering standardized care in an area of care that is generally agreed upon, yet not fully followed. Some nurses display greater proficiency than others at communicating with patients who do not understand their risk for VTE and need for chemoprophylaxis. Furthermore, there is a pronounced misconception around the delivery of VTE chemoprophylaxis. Nurses have the inaccurate belief that even if ordered, chemoprophylaxis is not required. This misconception was widespread among nurses taking care of both medical and surgical patients. These factors appear to be modifiable targets for quality improvement and highlight the need for a skills-based education during the new hire onboarding process, as well as ongoing reeducation to ensure nursing staff have the skills to appropriately provide best-practice care for VTE chemoprophylaxis. Nurses felt ownership of the results of the qualitative evaluation because they were included in every aspect from the beginning.27 This sense of ownership will support future quality improvement efforts to develop a skills-based intervention to improve the provision of VTE chemoprophylaxis.18,27
This study has certain limitations. First, it was a qualitative study assessing nursing-related barriers to providing VTE chemoprophylaxis at a single institution, and the results cannot be generalized broadly. However, the techniques and results are transferable to other hospital settings and other clinical care situations. Thus, we believe that other institutions can utilize our methods and that similar lessons can be learned and applied. Furthermore, the validity of our study is bolstered by concordance between the results of this study and those of other studies conducted on the topic of provision of VTE prophylaxis by nurses.13-15,21 Other studies utilized observations and surveys to determine potential nurse-related barriers to the provision of VTE prophylaxis, such as lack of knowledge and the belief that the need for prophylaxis can be determined based on whether or not the patient is ambulating;13,14 however, by utilizing focus group interviews, we allowed nurses to speak in their own voices about their experiences with VTE prophylaxis, and we were able to delve deeper and identify additional barriers that emerged from discussions with nurses, such as the lack of skill and misconceptions of capability.28,29 Second, the study focused solely on nurses. Additional initiatives are underway to assess the roles of resident physicians, attending physicians, and patients in the provision of VTE prophylaxis.
Nursing-related barriers to the provision of VTE chemoprophylaxis include a lack of knowledge, resources, skills, and misconceptions of the consequences of missed elements of VTE prophylaxis. Future initiatives will focus on equipping nurses to have meaningful conversations with patients and engaging patients in their care through development of a multifaceted bundle of interventions. Furthermore, similar methods of qualitative inquiry will be used to identify the role of resident and attending physicians and patients in the provision of VTE chemoprophylaxis.
Acknowledgments
The authors thank Sonali Oberoi, Joanne Prinz, Nancy Tomaska, and Kate Paredes, as well as all the nurses who participated in focus group interviews for this study and the nurse managers and clinical coordinators who helped to schedule the focus group interviews.
Disclosures
The authors declare that they have no competing interests.
Funding
This study was funded by the Surgical Outcomes and Quality Improvement Center at Northwestern University.
1. Beckman MG, Hooper WC, Critchley SE, Ortel TL. Venous thromboembolism: a public health concern. Am J Prev Med. 2010;38(4):S495-S501. https://doi.org/10.1016/j.amepre.2009.12.017.
2. Falck-Ytter Y, Francis CW, Johanson NA, et al. Prevention of VTE in orthopedic surgery patients: Antithrombotic Therapy and Prevention of Thrombosis, 9th ed: American College of Chest Physicians evidence-based clinical practice guidelines. Chest. 2012;141(2):e278S-e325S. https://doi.org/10.1378/chest.11-2404.
3. Gould MK, Garcia DA, Wren SM, et al. Prevention of VTE in nonorthopedic surgical patients: antithrombotic therapy and prevention of thrombosis: American College of Chest Physicians evidence-based clinical practice guidelines. Chest. 2012;141(2):e227S-e277S. https://doi.org/10.1378/chest.11-2297.
4. Guyatt GH, Akl EA, Crowther M, et al. Executive summary: antithrombotic therapy and prevention of thrombosis: American College of Chest Physicians evidence-based clinical practice guidelines. Chest. 2012;141(2):7S-47S. https://doi.org/10.1378/chest.1412S3.
5. Office of the Surgeon General. National Heart L, and Blood Institute. The Surgeon General’s Call to Action to Prevent Deep Vein Thrombosis and Pulmonary Embolism. Rockville, MD; 2008.
6. Geerts WH, Pineo GF, Heit JA, et al. Prevention of venous thromboembolism: the Seventh ACCP Conference on Antithrombotic and Thrombolytic Therapy. Chest. 2004;126(3):338S-400S. https://doi.org/10.1378/chest.126.3_suppl.338S.
7. Haut ER, Lau BD, Kraus PS, et al. Preventability of hospital-acquired venous thromboembolism. JAMA Surg. 2015;150(9):912-915. https://doi.org/10.1001/jamasurg.2015.1340.
8. Kahn SR, Solymoss S, Lamping DL, Abenhaim L. Long-term outcomes after deep vein thrombosis: postphlebitic syndrome and quality of life. J Gen Intern Med. 2000;15(6):425-429. https://doi.org/10.1046/j.1525-1497.2000.06419.x.
9. Mahan CE, Holdsworth MT, Welch SM, Borrego M, Spyropoulos AC. Deep-vein thrombosis: a United States cost model for a preventable and costly adverse event. Thromb Haemost. 2011;106(3):405-415. https://doi.org/10.1160/TH11-02-0132.
10. Kinnier CV, Ju MH, Kmiecik T, et al. Development of a novel composite process measure for venous thromboembolism prophylaxis. Med Care. 2016;54(2):210-217. https://doi.org/10.1097/MLR.0000000000000474.
11. Schünemann HJ, Cushman M, Burnett AE, et al. American Society of Hematology 2018 guidelines for management of venous thromboembolism: prophylaxis for hospitalized and nonhospitalized medical patients. Blood Adv. 2018;2(22):3198-3225. https://doi.org/10.1182/bloodadvances.2018022954.
12. Lau BD, Streiff MB, Kraus PS, et al. Missed doses of venous thromboembolism (VTE) prophylaxis at community hospitals: cause for alarm. J Gen Intern Med. 2018;33(1):19-20. https://doi.org/10.1007/s11606-017-4203-y.
13. Elder S, Hobson DB, Rand CS, et al. Hidden barriers to delivery of pharmacological venous thromboembolism prophylaxis: the role of nursing beliefs and practices. J Patient Saf. 2016;12(2):63-68. https://doi.org/10.1097/PTS.0000000000000086.
14. Lee JA, Grochow D, Drake D, et al. Evaluation of hospital nurses’ perceived knowledge and practices of venous thromboembolism assessment and prevention. J Vasc Nurs. 2014;32(1):18-24. https://doi.org/10.1016/j.jvn.2013.06.001.
15. Shermock KM, Lau BD, Haut ER, et al. Patterns of non-administration of ordered doses of venous thromboembolism prophylaxis: implications for novel intervention strategies. PLOS ONE. 2013;8(6):e66311. https://doi.org/10.1371/journal.pone.0066311.
16. Lipworth W, Taylor N, Braithwaite J. Can the theoretical domains framework account for the implementation of clinical quality interventions? BMC Health Serv Res. 2013;13(1):530. https://doi.org/10.1186/1472-6963-13-530.
17. Taylor N, Lawton R, Moore S, et al. Collaborating with front-line healthcare professionals: the clinical and cost effectiveness of a theory based approach to the implementation of a national guideline. BMC Health Serv Res. 2014;14(1):648. https://doi.org/10.1186/s12913-014-0648-4.
18. Cane J, O’Connor D, Michie S. Validation of the theoretical domains framework for use in behaviour change and implementation research. Implement Sci. 2012;7(1):37. https://doi.org/10.1186/1748-5908-7-37.
19. Bogdan R, Biklen S. Qualitative Research for Education: an Introduction to Theory and Methods. Boston: Allyn & Bacon; 1992.
20. Creswell J. Research Design: Qualitative and Quantitative Approaches. Thousand Oaks, CA: Sage Publications; 1994.
21. Patton M. Qualitative Research & Evaluation Methods: Integrating Theory and Practice. 4th ed. Thousand Oaks, CA: SAGE Publications, Inc.; 2014.
22. Alexander KE, Brijnath B, Mazza D. Barriers and enablers to delivery of the Healthy Kids Check: an analysis informed by the theoretical domains framework and COM-B model. Implement Sci. 2014;9(1):60. https://doi.org/10.1186/1748-5908-9-60.
23. Birken SA, Presseau J, Ellis SD, Gerstel AA, Mayer DK. Potential determinants of health-care professionals’ use of survivorship care plans: a qualitative study using the theoretical domains framework. Implement Sci. 2014;9(1):167. https://doi.org/10.1186/s13012-014-0167-z.
24. Atkins L, Francis J, Islam R, et al. A guide to using the theoretical domains framework of behaviour change to investigate implementation problems. Implement Sci. 2017;12(1):77. https://doi.org/10.1186/s13012-017-0605-9.
25. Lincoln YS, Guba EG. Naturalistic Inquiry. Newbury Park, CA: Sage Publications; 1985.
26. Berlin G. MAXQDA, Software for Qualitative Data Analysis. VERBI Software – Consult. Sozialforschung GmbH [computer program]; 1989-2016.
27. Lipmanowicz H. Buy-in v. ownership. Liberating Structures. http://www.liberatingstructures.com/hl-articles/. Accessed July 5, 2019.
28. Morgan D. Why Should You Use Focus Groups? and what focus groups are (and are not). In: The Focus Group Guidebook. Thousand Oaks, CA: Sage Publications; 1998:9-15, 29-35.
29. Sofaer S. Qualitative methods: what are they and why use them? Health Serv Res. 1999;34(5):1101-1118.
Venous thromboembolism (VTE), comprising deep venous thrombosis and pulmonary embolism (PE),1 is a serious medical condition that results in preventable morbidity and mortality.1-5 VTE affects all age groups, all races/ethnicities, and both genders, but there are known factors that increase the risk of developing VTE (eg, advanced age, undergoing surgery, hospitalization, and immobility).1-3,5-7 Prevention of VTE among hospitalized patients is of paramount importance to avoid preventable death, chronic illness/long-term complications,8 longer hospital stays, and increased hospital costs.9 Fortunately, there is clear evidence that provision of appropriate prophylaxis can decrease the risk of a VTE event occurring, and broadly accepted best-practice guidelines reflect this evidence.3,5
Given the inadequacy of current VTE-related quality measures to identify actionable failures in the provision of VTE prophylaxis, our group created a VTE process-of-care measure to assess adherence to the components of VTE prophylaxis: (1) early ambulation, (2) mechanical prophylaxis (sequential compression devices [SCDs]), and (3) chemoprophylaxis administered at the correct dose and frequency for the duration of the patient’s hospital stay.3,10,11 This quality measure was conceived, created, and iteratively revised to measure whether optimal care is provided to patients throughout their hospitalization and identify actionable areas in which failures of care occur, in order to decrease the risk of a VTE event. Data from our institution provided evidence that while ambulation and SCD component measure adherence is high, chemoprophylaxis adherence required significant improvement.10 When chemoprophylaxis process measure adherence data were analyzed further, a major failure mode was patient refusal of one or more doses. However, the drivers of patient refusal are not well defined in the literature, and previous studies have called for a greater focus on developing interventions to improve VTE chemoprophylaxis administration.12
Previous research has shown that nurses can influence patient compliance with VTE prophylaxis.13-15 A mixed-methods study by Elder et al. found that nurses in units with high rates of failure to provide optimal chemoprophylaxis offered the medication as optional, leading researchers to conclude that nurses perceived chemoprophylaxis as discretionary.13 Another study by Lee et al., conducted a survey of bedside registered nurses and identified nurses’ lack of education on VTE prevention as a significant barrier to providing care.14 These studies show that multiple levels of influence impact how nurses provide VTE chemoprophylaxis, particularly when they encounter patients who refuse chemoprophylaxis.
To explore the nuance and interplay of multiple influences, we used the Theoretical Domains Framework (TDF), an integrative framework that applies theoretical approaches to interventions aimed at behavior change.15-18 The framework contains 14 interrelated domains that characterize the behavior being studied, in this case, administration of VTE chemoprophylaxis. Consequently, we designed a nurse-focused, qualitative evaluation with the objective to identify nursing-related barriers to administration of VTE chemoprophylaxis.
METHODS
Inpatient Unit Selection
The study team accessed data from the hospital’s Enterprise Data Warehouse to review patient refusal rates of VTE chemoprophylaxis for each inpatient unit in the hospital. Patient refusal was utilized as a proxy measure for the behavior of nurses attempting to administer VTE chemoprophylaxis. Of the 14 medical and surgical units in the hospital, two medical and two surgical units were selected to participate in the qualitative evaluation based on having the highest patient refusal rates. One unit (surgical) was also selected to serve as a benchmark because it had the lowest patient refusal rate. Table 1 includes the refusal rates for the five units. Given the low refusal rate for the best performing unit, we suspected that it would be possible to decrease the patient refusal rate for other units with similar patient populations and interprofessional teams at the institution.
Observations
We observed chemoprophylaxis administration on the five units to understand the process for ordering and administering chemoprophylaxis. An observation protocol was utilized to document the date, time, and location of the observation as well as descriptive notes including accounts of particular events.19,20 Observations occurred in May 2016 and informed the creation of a process map outlining the procedure for ordering and administering VTE chemoprophylaxis. The process map was utilized to create the focus group interview guide and ensure the interview guide included pertinent questions for each step of the process (Appendix A).
Focus Group Interviews
We conducted focus group interviews with day and night shift nurses on the five units to assess nurses’ understanding of VTE chemoprophylaxis and nurses’ perceptions of barriers to administration of VTE chemoprophylaxis. The study team chose to conduct focus group interviews in an effort to maximize participation and to speak with multiple nurses within a shorter period of time. The focus group structure allowed the study team to speak with nurses during their shifts, as one could briefly step out, if required, for patient care and return to rejoin the discussion.
We developed a semistructured interview guide21 with questions focused on identifying nurses’ perceptions of guideline-recommended care for VTE chemoprophylaxis, where they learned these guidelines, how nurses discuss chemoprophylaxis with patients, how they handle the conversation with patients who refuse, and if there are times when chemoprophylaxis is not necessary. The interview guide was vetted by a multidisciplinary team consisting of clinical nursing coordinators and nurse managers from medical and surgical units, hospital quality leaders, surgeons and general internists, and qualitative research experts. The interview guide is included as Appendix B.
The unit clinical coordinators and nurse managers identified dates and times for the focus groups that would be minimally disruptive to the unit. For each of the four units with a high patient refusal rate, two focus groups were conducted during the lunch hour and one was conducted at the end of the night shift to ensure that both day and night shift nurses were included in the study. Two focus groups were conducted with the best-practice unit during the lunch hour. For each focus group, the clinical coordinator identified two to eight nurses who could step away from patient care to participate or who had completed their shifts. In total, approximately 67 nurses participated in the focus groups.
The focus groups (n = 14) lasted approximately 40 minutes during May and June 2016. Two members of the study team cofacilitated interviews, which were recorded and transcribed verbatim.
Coding and Data Analysis
To develop the code book, the study team, consisting of three qualitative researchers, independently read one focus group transcript and applied the TDF domains to the nurses’ perceptions of barriers to administration of VTE chemoprophylaxis.21-24 In addition to coding by domain, the study team also coded nursing perceptions as barriers or facilitators. The study team reviewed the coded transcript and reconciled any differences in coding. This process was repeated for a second transcript, and then all remaining transcripts were assigned to two out of three study team members for coding, with the entire study team meeting to reconcile any differences. If necessary, the team member who did not code a transcript acted as the tie-breaker if there were discrepancies in codes that could not be reconciled.
Once coding was completed, we identified the TDF domains that were most relevant to the administration of VTE chemoprophylaxis.16 Member checking (testing the analysis, interpretations, and conclusions with members of those groups from whom the data were originally obtained) was performed with the four clinical nursing coordinators and four nurse managers from the participating units to establish face validity of the themes identified from the focus group interviews.25
The study team used MaxQDA, V12 (Berlin, Germany) to support data coding and analysis.26 The Northwestern University institutional review board office deemed this project research on nonhuman-subjects because it focused on the process of providing VTE chemoprophylaxis and not about the patients themselves. The purpose of the study was explained at the beginning of each focus group, and nurses gave verbal consent to have the focus group recorded.
RESULTS
We conducted 14 focus groups with day and night shift nurses from five units (two medical and three surgical) at a single institution. All nurses invited to participate in a focus group agreed to participate. The data were coded and grouped by domain and identified as barriers or facilitators. The findings included below are for the domains most relevant to the provision of VTE prophylaxis. Table 2 provides illustrative verbatim quotes for each domain that was represented in the focus groups.
THEORETICAL DOMAINS FRAMEWORK DOMAINS
Knowledge
All interviewees recognized that providing some form of prophylaxis to mitigate the risk of a VTE event is essential. Some nurses stated that seeing a patient ambulating meant they would consider not administering prescribed chemoprophylaxis, while others would try to negotiate with patients by asking the patient to allow one dose of chemoprophylaxis prescribed two to three times daily because it was better than receiving no doses.
Environmental Context and Resources
Multiple barriers to providing optimal care were associated with the environmental context and a lack of resources. There was a lack of accessible, comprehensive, patient-centered education materials on VTE chemoprophylaxis to supplement a nurse’s explanation about the importance of chemoprophylaxis. Furthermore, many nurses cited the perceived patient pain of chemoprophylaxis injections as the main deterrent to patient compliance, especially subcutaneous heparin injections, which occur up to three times in 24 hours and often cause more pain at the site of injection than low-molecular-weight heparin. Nurses felt that transitioning patients from receiving subcutaneous heparin injections to receiving low-molecular-weight heparin could be a main driver to reduce patient refusals.
Skills
Nurses felt inadequately equipped to handle patient refusals. Many said that patient refusal of treatments was never discussed in nursing school. As a result, when patients refused treatments, the nurses did not know how to handle the situation. They felt that they lacked the tools and techniques to persuade the patient to comply.
Beliefs about Capabilities
Nurses did not know their own patient refusal rate or benchmarks of an acceptable refusal rate in contrast to one that is too high. Without this feedback, they were unable to assess their own behavior or performance related to providing VTE chemoprophylaxis.
DISCUSSION
Nurses play a critical role in providing VTE chemoprophylaxis to patients throughout their hospitalization. This study provided a unique opportunity to perform an in-depth, qualitative analysis of the barriers nurses face in providing patients with VTE chemoprophylaxis as part of their daily work caring for patients. We discovered several nursing-related barriers to the provision of VTE chemoprophylaxis, including lack of knowledge, resources, skill, and misconceptions of their capability to provide VTE chemoprophylaxis. We used a bottom-up approach by incorporating the voices of unit nurses, clinical coordinators, and nurse managers to understand potential barriers. Our findings brought to light the challenge of delivering standardized care in an area of care that is generally agreed upon, yet not fully followed. Some nurses display greater proficiency than others at communicating with patients who do not understand their risk for VTE and need for chemoprophylaxis. Furthermore, there is a pronounced misconception around the delivery of VTE chemoprophylaxis. Nurses have the inaccurate belief that even if ordered, chemoprophylaxis is not required. This misconception was widespread among nurses taking care of both medical and surgical patients. These factors appear to be modifiable targets for quality improvement and highlight the need for a skills-based education during the new hire onboarding process, as well as ongoing reeducation to ensure nursing staff have the skills to appropriately provide best-practice care for VTE chemoprophylaxis. Nurses felt ownership of the results of the qualitative evaluation because they were included in every aspect from the beginning.27 This sense of ownership will support future quality improvement efforts to develop a skills-based intervention to improve the provision of VTE chemoprophylaxis.18,27
This study has certain limitations. First, it was a qualitative study assessing nursing-related barriers to providing VTE chemoprophylaxis at a single institution, and the results cannot be generalized broadly. However, the techniques and results are transferable to other hospital settings and other clinical care situations. Thus, we believe that other institutions can utilize our methods and that similar lessons can be learned and applied. Furthermore, the validity of our study is bolstered by concordance between the results of this study and those of other studies conducted on the topic of provision of VTE prophylaxis by nurses.13-15,21 Other studies utilized observations and surveys to determine potential nurse-related barriers to the provision of VTE prophylaxis, such as lack of knowledge and the belief that the need for prophylaxis can be determined based on whether or not the patient is ambulating;13,14 however, by utilizing focus group interviews, we allowed nurses to speak in their own voices about their experiences with VTE prophylaxis, and we were able to delve deeper and identify additional barriers that emerged from discussions with nurses, such as the lack of skill and misconceptions of capability.28,29 Second, the study focused solely on nurses. Additional initiatives are underway to assess the roles of resident physicians, attending physicians, and patients in the provision of VTE prophylaxis.
Nursing-related barriers to the provision of VTE chemoprophylaxis include a lack of knowledge, resources, skills, and misconceptions of the consequences of missed elements of VTE prophylaxis. Future initiatives will focus on equipping nurses to have meaningful conversations with patients and engaging patients in their care through development of a multifaceted bundle of interventions. Furthermore, similar methods of qualitative inquiry will be used to identify the role of resident and attending physicians and patients in the provision of VTE chemoprophylaxis.
Acknowledgments
The authors thank Sonali Oberoi, Joanne Prinz, Nancy Tomaska, and Kate Paredes, as well as all the nurses who participated in focus group interviews for this study and the nurse managers and clinical coordinators who helped to schedule the focus group interviews.
Disclosures
The authors declare that they have no competing interests.
Funding
This study was funded by the Surgical Outcomes and Quality Improvement Center at Northwestern University.
1. Beckman MG, Hooper WC, Critchley SE, Ortel TL. Venous thromboembolism: a public health concern. Am J Prev Med. 2010;38(4):S495-S501. https://doi.org/10.1016/j.amepre.2009.12.017.
2. Falck-Ytter Y, Francis CW, Johanson NA, et al. Prevention of VTE in orthopedic surgery patients: Antithrombotic Therapy and Prevention of Thrombosis, 9th ed: American College of Chest Physicians evidence-based clinical practice guidelines. Chest. 2012;141(2):e278S-e325S. https://doi.org/10.1378/chest.11-2404.
3. Gould MK, Garcia DA, Wren SM, et al. Prevention of VTE in nonorthopedic surgical patients: antithrombotic therapy and prevention of thrombosis: American College of Chest Physicians evidence-based clinical practice guidelines. Chest. 2012;141(2):e227S-e277S. https://doi.org/10.1378/chest.11-2297.
4. Guyatt GH, Akl EA, Crowther M, et al. Executive summary: antithrombotic therapy and prevention of thrombosis: American College of Chest Physicians evidence-based clinical practice guidelines. Chest. 2012;141(2):7S-47S. https://doi.org/10.1378/chest.1412S3.
5. Office of the Surgeon General. National Heart L, and Blood Institute. The Surgeon General’s Call to Action to Prevent Deep Vein Thrombosis and Pulmonary Embolism. Rockville, MD; 2008.
6. Geerts WH, Pineo GF, Heit JA, et al. Prevention of venous thromboembolism: the Seventh ACCP Conference on Antithrombotic and Thrombolytic Therapy. Chest. 2004;126(3):338S-400S. https://doi.org/10.1378/chest.126.3_suppl.338S.
7. Haut ER, Lau BD, Kraus PS, et al. Preventability of hospital-acquired venous thromboembolism. JAMA Surg. 2015;150(9):912-915. https://doi.org/10.1001/jamasurg.2015.1340.
8. Kahn SR, Solymoss S, Lamping DL, Abenhaim L. Long-term outcomes after deep vein thrombosis: postphlebitic syndrome and quality of life. J Gen Intern Med. 2000;15(6):425-429. https://doi.org/10.1046/j.1525-1497.2000.06419.x.
9. Mahan CE, Holdsworth MT, Welch SM, Borrego M, Spyropoulos AC. Deep-vein thrombosis: a United States cost model for a preventable and costly adverse event. Thromb Haemost. 2011;106(3):405-415. https://doi.org/10.1160/TH11-02-0132.
10. Kinnier CV, Ju MH, Kmiecik T, et al. Development of a novel composite process measure for venous thromboembolism prophylaxis. Med Care. 2016;54(2):210-217. https://doi.org/10.1097/MLR.0000000000000474.
11. Schünemann HJ, Cushman M, Burnett AE, et al. American Society of Hematology 2018 guidelines for management of venous thromboembolism: prophylaxis for hospitalized and nonhospitalized medical patients. Blood Adv. 2018;2(22):3198-3225. https://doi.org/10.1182/bloodadvances.2018022954.
12. Lau BD, Streiff MB, Kraus PS, et al. Missed doses of venous thromboembolism (VTE) prophylaxis at community hospitals: cause for alarm. J Gen Intern Med. 2018;33(1):19-20. https://doi.org/10.1007/s11606-017-4203-y.
13. Elder S, Hobson DB, Rand CS, et al. Hidden barriers to delivery of pharmacological venous thromboembolism prophylaxis: the role of nursing beliefs and practices. J Patient Saf. 2016;12(2):63-68. https://doi.org/10.1097/PTS.0000000000000086.
14. Lee JA, Grochow D, Drake D, et al. Evaluation of hospital nurses’ perceived knowledge and practices of venous thromboembolism assessment and prevention. J Vasc Nurs. 2014;32(1):18-24. https://doi.org/10.1016/j.jvn.2013.06.001.
15. Shermock KM, Lau BD, Haut ER, et al. Patterns of non-administration of ordered doses of venous thromboembolism prophylaxis: implications for novel intervention strategies. PLOS ONE. 2013;8(6):e66311. https://doi.org/10.1371/journal.pone.0066311.
16. Lipworth W, Taylor N, Braithwaite J. Can the theoretical domains framework account for the implementation of clinical quality interventions? BMC Health Serv Res. 2013;13(1):530. https://doi.org/10.1186/1472-6963-13-530.
17. Taylor N, Lawton R, Moore S, et al. Collaborating with front-line healthcare professionals: the clinical and cost effectiveness of a theory based approach to the implementation of a national guideline. BMC Health Serv Res. 2014;14(1):648. https://doi.org/10.1186/s12913-014-0648-4.
18. Cane J, O’Connor D, Michie S. Validation of the theoretical domains framework for use in behaviour change and implementation research. Implement Sci. 2012;7(1):37. https://doi.org/10.1186/1748-5908-7-37.
19. Bogdan R, Biklen S. Qualitative Research for Education: an Introduction to Theory and Methods. Boston: Allyn & Bacon; 1992.
20. Creswell J. Research Design: Qualitative and Quantitative Approaches. Thousand Oaks, CA: Sage Publications; 1994.
21. Patton M. Qualitative Research & Evaluation Methods: Integrating Theory and Practice. 4th ed. Thousand Oaks, CA: SAGE Publications, Inc.; 2014.
22. Alexander KE, Brijnath B, Mazza D. Barriers and enablers to delivery of the Healthy Kids Check: an analysis informed by the theoretical domains framework and COM-B model. Implement Sci. 2014;9(1):60. https://doi.org/10.1186/1748-5908-9-60.
23. Birken SA, Presseau J, Ellis SD, Gerstel AA, Mayer DK. Potential determinants of health-care professionals’ use of survivorship care plans: a qualitative study using the theoretical domains framework. Implement Sci. 2014;9(1):167. https://doi.org/10.1186/s13012-014-0167-z.
24. Atkins L, Francis J, Islam R, et al. A guide to using the theoretical domains framework of behaviour change to investigate implementation problems. Implement Sci. 2017;12(1):77. https://doi.org/10.1186/s13012-017-0605-9.
25. Lincoln YS, Guba EG. Naturalistic Inquiry. Newbury Park, CA: Sage Publications; 1985.
26. Berlin G. MAXQDA, Software for Qualitative Data Analysis. VERBI Software – Consult. Sozialforschung GmbH [computer program]; 1989-2016.
27. Lipmanowicz H. Buy-in v. ownership. Liberating Structures. http://www.liberatingstructures.com/hl-articles/. Accessed July 5, 2019.
28. Morgan D. Why Should You Use Focus Groups? and what focus groups are (and are not). In: The Focus Group Guidebook. Thousand Oaks, CA: Sage Publications; 1998:9-15, 29-35.
29. Sofaer S. Qualitative methods: what are they and why use them? Health Serv Res. 1999;34(5):1101-1118.
© 2019 Society of Hospital Medicine