User login
RN‐Pharmacist Medication Reconciliation
Adverse drug events (ADE), of which medication errors are one form, refer to harm caused by use of a drug. ADEs occur frequently and are associated with an increased length of stay, economic burden, and risk of death.1, 2 Classen et al and Bates et al estimate, respectively, that there are 1.2 to 1.8 preventable ADEs per 100 inpatient admissions.1, 3 Adjusting these data to current levels of yearly admissions, 380,000 to 400,000 preventable ADEs occur each year, and are projected to cost upwards of $3.5 billion annually in 2006 dollars.4
Medication reconciliation is an active process that occurs at transitions in care (admissions, transfers in level of care, and discharge) and is designed to prevent medication errors as the patient moves across the continuum of care. Medications used by the patient prior to hospitalization are considered when developing the inpatient therapeutic regimen.
Medications are ordered on admission based in part on what providers believe is the patient's home medication list (HML). A systematic review revealed that errors in medication history taking, including errors of omission and commission, are extremely common and clinically important.5 Such inaccuracies lead to unintended discrepancies between the hospital medication orders and the patient's true home medication regimen, and can result in patient harm.
Numerous studies have documented that inpatient discrepancies are common.610 From September 2004 to July 2005, data from the United States Pharmacopeia MEDMARX voluntary medication error reporting program revealed over 2000 medication errors associated with reconciliation failures: 22% occurred during admission and 12% occurred at time of discharge.11 A Canadian study demonstrated that 81 of 151 enrolled patients, who were prescribed 4 or more medications and were admitted to a medicine service, had at least 1 unintended discrepancy.6 Of those discrepancies, 38.6% were thought to have the potential to cause moderate or severe discomfort or clinical deterioration. Bates et al found that 0.9% of all inpatient medication errors lead to harm.12
The Joint Commission highlighted the importance of this problem by creating National Patient Safety Goal (NPSG) 8 in 2005, Accurately and completely reconcile medications across the continuum of care.13 This goal was modified and became effective on July 1, 2011.14 As a response, organizations have been developing physician‐led, nurse‐led, or pharmacist‐led medication reconciliation processes.8, 1522 Typically, these teams have time dedicated to producing the most accurate home list possible, a gold standard list. Examples of successful pharmacist‐led interventions to address this goal are described by investigators at Northwestern Memorial Hospital16 and Duke University Medical Center.23 Other interventions implemented to improve the reconciliation process include computerized provider order entry (CPOE) systems24 and combining information technology (IT) with process redesign involving physicians, pharmacists, and nurses.20 While the literature shows that there are multiple interventions that can reduce medication reconciliation errors, there is a dearth of evidence for interventions that are low‐cost and easily replicable.
Given that unintended medication discrepancies are common and harmful, we sought to develop a generalizable intervention. Our prospective pilot study explored whether an easily replicable nurse‐pharmacist led medication reconciliation process could efficiently and inexpensively identify unintended medication discrepancies, thereby preventing potential adverse drug events (PADEs).
METHODS
Patient Selection
The study was conducted at a 1000 bed urban, tertiary care hospital that serves a diverse patient population. We enrolled eligible patients over a 15‐month period, from January 2008 to March 2009, admitted to 2 resident‐covered general medicine teams. Each team is composed of an attending physician, 2 senior residents, 4 interns, a case manager, a pharmacist, and a social worker. Patients were excluded only if they did not consent or were discharged from the hospital in less than 24 hours. Patients were interviewed Monday through Friday, and those admitted over the weekend were interviewed the following Monday. The study was approved by The Johns Hopkins institutional review board (IRB).
Intervention Team
Baccalaureate‐prepared registered nurses (RNs) provided the primary intervention in this model. Both nurses had practiced as bedside clinicians at the hospital and had knowledge of hospital systems and structures. No additional training was provided.
The study pharmacist, who is board certified in pharmacotherapy, has a doctor of pharmacy degree and completed 1 year of Pharmacy Practice residency, as well as a 1‐year specialty residency in Internal Medicine. She spends the majority of her clinical time rounding with the inpatient medicine teams where she provides medication management recommendations.
Home Medication List Compilation
Informed consent was obtained by the study nurse 24‐48 hours after admission. The nurse completed an initial patient interview to determine the HML or preadmission medication list. The patient‐reported HML was compared to the history obtained by the physician. If both lists matched, the HML was considered complete. If a patient was not able to provide a written HML or recall medications, the nurses reviewed the electronic patient record (EPR), which documents previous discharge medication lists and Hopkins outpatient medication lists. If not convinced that the HML was accurate or complete, the nurses could use other sources of information, including patients' families, primary care physicians, and community pharmacies. Patients were then asked to verify the HML. At the start of the study, the nurses created a handwritten HML that they placed in the chart. As functionality of the CPOE improved during the study, the nurses entered the lists into the CPOE instead.
Reconciling the HML with the Admission Orders and Discharge Medication List
The nurses created the HML during the first 24‐48 hours of a patient's admission, so admission orders were entered before the resident physicians were aware of the nurse‐complied HML. By comparing the active medication orders to the HML, the nurses created a list of admission discrepancies. The nurse evaluated the discrepancies in the context of the treatment plan to determine if they appeared to be intended or unintended. The nurses consulted the study pharmacist if they were unsure if a discrepancy was intended. Questions about specific drug substitutions were clarified with the study pharmacist. For example, the nurses consulted the pharmacist about a patient who was taking carvedilol at home but was changed to metoprolol during the hospitalization.
After consultation with the pharmacist, the nurse reviewed all remaining potential unintended admission discrepancies with the physician team. A similar process was repeated on the day of discharge. For all patients transitioning out of the hospital, the nurses compared the active medication list and the HML to the discharge worksheet medication list and patient instructions. The nurses contacted the physician team when potential unintended discrepancies were identified. If unintended discrepancies were confirmed for a patient who had already been discharged earlier that day, a resolution plan was determined and the patient was contacted.
Intended Versus Unintended Discrepancies
After completing the nurse‐pharmacist review, the nurse presented the admission discrepancies that were thought to be unintended to the prescriber. If the medication order was not changed, the discrepancy was considered intended. If the prescriber changed the order, the discrepancy was considered unintended. Unintended discrepancies were identified within 48 hours of admission and also upon discharge. If an unintended discrepancy was identified during admission, it only counted as an admission discrepancy. However, if the same mistake occurred again during discharge, the unintended discrepancy was also counted as a discharge discrepancy. The nurses classified the discrepancy by type: medication omission, frequency error, route error, wrong dose, and/or wrong drug.
Rating Potential Harm From the Unintended Discrepancies
Adjudicators assessed the potential harm of unintended admission discrepancies that could occur during an average 4‐day hospitalization. Similarly, raters assessed the potential harm of unintended discharge medication discrepancies. Each of the 4 adjudicators, 2 physicians and 2 pharmacists, were blinded and independently adjudicated all unintended admission and discharge discrepancies, rating the potential harm from the discrepancy on a scale6 from 1 to 3:
Rank 1: unlikely to cause any harm or discomfort.
Rank 2: potential to cause moderate discomfort or clinical deterioration.
Rank 3: potential for severe discomfort or clinical deterioration.
To rate the potential harm of the discrepancies, the raters were provided with the patients' diagnoses, the medications in question, the types of discrepancies, and whether the discrepancy occurred at admission or discharge. The final potential harm level was determined by the majority rating unless a rating spread of Rank 1 to Rank 3 existed. In that case, consensus was reached by discussion. If the 4 raters were evenly split, the mean value was used.
Cost Analysis: Resources, Valuation, and Cost Savings
The time involved in implementing the protocol was recorded in minutes on an Excel spreadsheet. The time records included: participant interview, contact with secondary sources for medication history (a primary care physician or pharmacy), consultation with the study pharmacist, patient education, discharge activities, and consultation with the prescribers. The study pharmacist submitted additional time for follow‐up of issues after the initial consultation with the nurse.
The cost of an ADE in our study was estimated based on the Bates et al study, which reported an average cost of $5857.00 per inpatient ADE in 1996 dollars.2 Using an inflation adjustment ratio from 1996 to 2008 of 1.595, we calculated the cost of an ADE in 2008 dollars to be an average of $9344.12.
We compared the cost of the program with potential cost savings. We performed a threshold analysis to determine the minimum proportion of Rank 2‐3 potential ADEs that would actually need to result in harm in order for the intervention to yield a cost savings. We also estimated the costs of harm based on the Bates et al study which found that 0.9% of all inpatient medication errors results in harm.12
Statistical Analysis
We used logistic regression to test for associations between discrepancies and patient characteristics including age, race, length of stay, education, marital status, primary payor, severity of illness, and number of medications. The outcome measure was at least 1 unintended discrepancy on admission or discharge. A paired‐samples t test was calculated to compare the mean number of discrepancies on admission to the mean discrepancies at discharge.
RESULTS
We enrolled 563 patients who were admitted a total of 698 times. Only the first admission for each patient was analyzed. Patient demographics are presented in Table 1. Almost 70% of our enrolled patients were less than 65 years old, 65% of the patients were black, 58% lived within 5 miles of the Johns Hopkins Hospital, and a plurality of the patients were single and received Medicare. The mean number of medications was 7.8 (SD 4.9).
| Demographic Variable | Percentage |
|---|---|
| Demographic Variable | Mean SD |
| |
| Sex | |
| Male | 49.2 |
| Female | 50.8 |
| Age | |
| <65 | 69.5 |
| 65 to <85 | 27.5 |
| 85 | 3.0 |
| Marital status | |
| Single | 47.0 |
| Married | 30.0 |
| Divorced | 10.5 |
| Widowed | 10.7 |
| Payor | |
| Medicare | 42.3 |
| Medicaid | 25.0 |
| HMO | 8.0 |
| Self‐pay | 9.2 |
| Race | |
| White | 33.0 |
| Black | 65.1 |
| Other | 1.9 |
| APDRG complexity 1‐4 | |
| 1 | 5.2 |
| 2 | 28.5 |
| 3 | 47.4 |
| 4 | 18.9 |
| Education | |
| Less than eighth grade | 9.2 |
| Some high school | 21.7 |
| High school or GED | 28.9 |
| Some college | 15.1 |
| College degree or greater | 19.5 |
| Chose not to answer | 5.5 |
| ICD‐9 codes | |
| Diseases of the circulatory system | 25.5 |
| Diseases of the respiratory system | 11.1 |
| Diseases of the digestive system | 10.9 |
| Symptoms, signs, and ill‐defined conditions | 10.7 |
| Admission from the Emergency Room | 87 |
| Patient lives within 5 miles of the hospital | 58 |
| Age (years) | 55.4 16.6 |
| Number of medications per patient | 7.76 4.9 |
| Length of stay | 5.72 7.28 |
The most frequent source of the home medication list was from patient verbal recall (52%). Few patients had lists of their current medications when admitted. The second most commonly used source was the electronic patient record, 36.6%, which was used to verify and complete the home list. The patient's community pharmacist, 12.5%, was contacted when other sources did not result in a complete home list. The primary care site was contacted in 6.0% of the cases. Patients were then asked to verify the HML.
Of the 563 patients, 225 (40%; 95% confidence interval [CI], 36%‐44%) had at least 1 unintended discrepancy on admission or discharge. On admission and discharge, 28% (95% CI, 25%‐30%) and 25% (95% CI, 21%‐29%) of the patients, respectively, had an unintended discrepancy. Of those 225 patients who had an unintended discrepancy, 162 (72%) had a discrepancy ranked 2 or 3 on the potential harm scale.
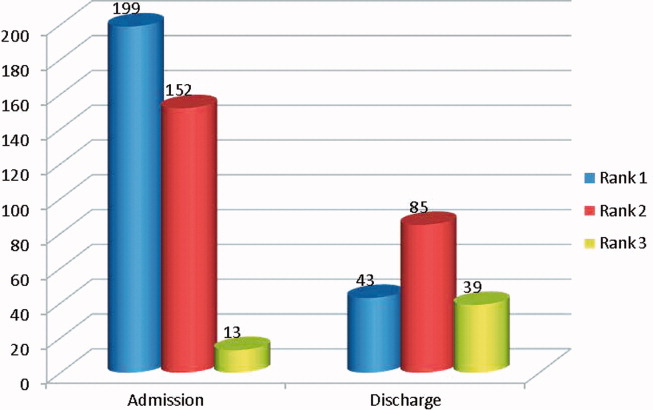
Overall, there were more unintended discrepancies on admission (364) than at discharge (167) (Figure 1). The paired t test showed a significant decrease (t[562] = 2.066, P = 0.039) between the number of discrepancies on admission to discharge. However, the majority of these discrepancies on admission (55%) were Rank 1 on the potential harm scale, while the majority of the discharge discrepancies (85%) were likely to cause harm (Rank 2‐3). There were many more Rank 3 discrepancies upon discharge, 39, than on admission, 13. The percentage of Rank 2‐3 discrepancies on admission and discharge were 45% versus 85%, respectively. Interclass correlation of ratings before consensus was 0.58.
The most common unintended discrepancies were omissions of medications at admission, 74%, and discharge, 62%, followed by discrepancies in dosing (Table 2). The majority of omission discrepancies were categorized as Rank 1. Discrepancies in frequency and dosing were most likely to be adjudicated as Rank 2 or 3. Table 3 gives examples of how discrepancies were ranked.
| a. Type of Discrepancy on Admission | Total | Rank 1 | Rank 2 | Rank 3 |
|---|---|---|---|---|
| 364 (%) | 199 (%) | 152 (%) | 13 (%) | |
| ||||
| Omission | 270 (74) | 157 (79) | 102 (67) | 11 (85) |
| Frequency | 19 (5) | 7 (4) | 12 (8) | 0 |
| Route | 3 (1) | 1 (1) | 2 (1) | 0 |
| Dose | 54 (15) | 23 (12) | 29 (19) | 2 (15) |
| Drug | 18 (5) | 11 (5) | 7 (5) | 0 |
| b. Type of Discrepancy on Discharge | Total | Rank 1 | Rank 2 | Rank 3 |
| 167 (%) | 43 (%) | 85 (%) | 39 (%) | |
| Omission | 104 (62) | 37 (86) | 46 (54) | 21 (54) |
| Frequency | 15 (9) | 3 (7) | 10 (12) | 2 (5) |
| Route | 12 (7) | 2 (5) | 6 (7) | 4 (10) |
| Dose | 22 (13) | 0 | 14 (16) | 8 (21) |
| Drug | 14 (8) | 1 (2) | 9 (11) | 4 (10) |
| Rank | Time of Discrepancy | Clinical Information |
|---|---|---|
| ||
| 1 | Discharge | Elderly patient with sepsis from acute cystitis. Centrum Silver, part of the HML, was not on the discharge orders. |
| 2 | Discharge | Patient admitted with UTI. Metoprolol XL 100 mg was on the patient's HML but not on the discharge orders. |
| 3 | Admission | Patient admitted with hypertensive urgency. Clonidine 0.2 mg by mouth 3 times daily, which was on the patient's HML, was omitted. |
The only statistically significantly variable associated with the presence of discrepancies was the number of medications (odds ratio, 1.087; 95% CI, 1.044‐1.132). Each additional medication increased the odds of a discrepancy by 8.7%. Other variables, including age, race, length of stay, level of education, marital status, primary payor, and severity of illness, were not associated with prevalent discrepancies.
Cost Analysis: Resources, Utilization, and Cost Savings
On average, the nurses spent 11.2 minutes (SD 8.0 minutes) of their time conducting the admitting patient interview. The average total time for the protocol excluding the initial interview was 29.3 minutes (SD 30.2 minutes). The clinical pharmacist was consulted in 30% of the cases. The average consultation time was 7.5 minutes (SD 4.4). We determined the hospital's cost of the intervention by adding hourly wages plus benefits for the nurse, pharmacist, and physician multiplied by the time required of each team member. The intervention cost $31.82 per patient. Given (1) the total of 40.5 minutes per patient‐admission spent by the nurse for each of 563 patients admitted a total of 698 times over 15 months, (2) the assumption of 2000 hours of work in a 12‐month period, and (3) the assumption that these patients and all their admissions were representative of the 15‐month period, the estimated full‐time equivalents was 0.19.
Since Rank 1 discrepancies do not cause harm, we considered only Rank 2‐3 discrepancies. One hundred sixty‐two of the 563 (29%) patients had a discrepancy categorized as Rank 2‐3. Since the cost of the intervention per patient was $31.82, it cost $113.64 to find 1 discrepancy that could cause harm. If each ADE cost a hospital approximately $9344 in 2008, then preventing 1 discrepancy in every 290 patient encounters would offset the intervention costs. For every 290 patients, our data suggest that we would prevent 81 discrepancies. Every potential ADE does not result in an actual harm. Only 1.2% of the potential ADEs would have to result in harm for the cost of the intervention to be offset. Bates el al found that 0.9% of all inpatient medication errors lead to harm.12 Applying this rate to the total of 531 discrepancies found in the current study, 4.8 of them would have caused harm. Applying the inflation‐adjusted cost to these 4.8 harmful discrepancies, the total estimated cost averted would be $44,607; this compares favorably with the $17,915 cost of the nurse‐pharmacist intervention.
DISCUSSION
Inpatient medication reconciliation, an essential patient safety process, prevents potential ADEs and is mandated by The Joint Commission. Previous studies have shown that discrepancies are common occurrences for patients treated in tertiary centers,68 and those discrepancies can lead to patient discomfort or clinical deterioration.6, 8 Our current study supports this body of literature, as 40% of patients had at least 1 discrepancy on admission or discharge, and 29% of those discrepancies had the potential to result in moderate or severe discomfort or clinical deterioration. Although consistent with some findings,8 these numbers are generally lower than other studies,6, 25 where anywhere from 39% to 64% of the discrepancies were classified as Rank 2‐3.
Consistent with other studies, we found that omission was the most common type of discrepancy at admission as well as discharge.6, 8, 9, 21 In recent studies, omissions accounted for 46.5%10, 21 to 60%9 of the discrepancies. Further analysis in our study showed that the more medications a patient took, the higher the likelihood of discrepancya correlation also seen in other studies.9, 10 As the number of medications that a patient takes increases, the more difficult it becomes for all parties involved, including patients, families, and physicians, to keep an accurate recordleading to more opportunities for discrepancies.
Unintended medication discrepancies do not just occur on admission. While we identified many fewer discharge discrepancies, they were more likely to be categorized as Rank 2‐3. This is in contrast with other research that has found more discrepancies at discharge than admission.9, 11 In the current study, active medication reconciliation on admission likely led to a decrease in the number of discharge discrepancies. Even though there were fewer discharge discrepancies, the potential for harm was great and should not be underestimated.
Although many different types of interventions have been tried, this pilot study demonstrated a remarkably easy, generalizable, and inexpensive method. Other interventions have depended on wholesale reengineering of complicated processes,20, 26 pharmacists,10, 15, 16, 18, 19, 21, 22 or particular IT systems.20 Our intervention employed a nursing‐pharmacist model, which may either reduce the cost of healthcare, or at the very least, pay for itself. Each ADE is projected to cost $9300. The nurse‐pharmacist collaboration costs approximately $32 per patient. Thus, preventing only 1 ADE in 290 patient admissions would constitute a breakeven point for the interventiona goal that is likely achievable according to our study results. Even more cost‐effective would be to target only those patients at highest risk for a discrepancynamely those taking multiple home medications.10
There are several limitations to our study. First, we did not have a control group that would allow for comparison of clinical outcomes between the intervention and standard practice. Second, only potential ADEs were avoided. We were not able to determine that an ADE would definitely have occurred if the reconciliation had not taken place. Third, this study was conducted in a single department at 1 institution. As such, the results may not be generalizable to services other than general medicine or to other hospitals. Fourth, we relied on cost data from 1 inpatient study that is more than a decade old to estimate the potential savings to the healthcare system.2 This demonstrates the need for new studies of the cost of ADEs in hospital and outpatient settings. Outpatient medication discrepancies may be more or less costly than their inpatient counterparts, which would impact the cost analysis of this study. Fifth, we did not rely on the brown bag method, asking the patient's family to bring in the medication bottles, for determining the HML. That would certainly have given us another method to confirm the HML. Moreover, the nurse did not confirm the HML with a second source if she felt that the list provided by the patient was accurate. Finally, while we can intervene on discharge discrepancies, we do not control what a patient chooses to do after discharge.27 Health literacy, financial issues, deficits in communication between patients' discharge providers and their primary care providers, and many other factors affect whether patients adhere to their discharge medication list.28
Since this is not a randomized controlled trial, this pilot study requires additional testing to determine if ADEs are actually avoided and costs saved. The HML protocol could be updated to include the brown bag method or other additional steps to verify the HML. Although not inexpensive, a home visit intervention could be tested as well.29, 30
In conclusion, potentially harmful unintended medication discrepancies occurred frequently at both hospital admission and discharge. A nurse‐pharmacist collaboration to monitor and intervene on these discrepancies allowed many to be reconciled before potentially causing harm to patients. The collaboration was relatively efficient and cost‐effective, and the process potentially improves patient safety.
- ,,,,.Adverse drug events in hospitalized patients. Excess length of stay, extra costs, and attributable mortality.JAMA.1997;277(4):301–306.
- ,,, et al.The costs of adverse drug events in hospitalized patients. Adverse Drug Events Prevention Study Group.JAMA.1997;277(4):307–311.
- ,,, et al.Incidence of adverse drug events and potential adverse drug events. Implications for prevention. ADE Prevention Study Group.JAMA.1995;274(1):29–34.
- ,Institute of Medicine (U.S.).Committee on Identifying and Preventing Medication Errors.Preventing Medication Errors.Washington, DC:National Academies Press;2007.
- ,,,,,.Frequency, type and clinical importance of medication history errors at admission to hospital: a systematic review.Can Med Assoc J.2005;173(5):510–515.
- ,,, et al.Unintended medication discrepancies at the time of hospital admission.Arch Intern Med.2005;165(4):424–429.
- ,,.Frequency and type of medication discrepancies in one tertiary care hospital.Healthc Q.2006;9(Spec No):119–123.
- ,,, et al.Medication reconciliation at hospital discharge: evaluating discrepancies.Ann Pharmacother.2008;42(10):1373–1379.
- ,,, et al.Classifying and predicting errors of inpatient medication reconciliation.J Gen Intern Med.2008;23(9):1414–1422.
- ,,, et al.Results of the Medications At Transitions and Clinical Handoffs (MATCH) study: an analysis of medication reconciliation errors and risk factors at hospital admission.J Gen Intern Med.25(5):441–447.
- .Reconciliation failures lead to medication errors.Jt Comm J Qual Patient Saf.2006;32(4):225–229.
- ,,,,.Relationship between medication errors and adverse drug events.J Gen Intern Med.1995;10(4):199–205.
- The Joint Commission.National Patient Safety Goals. 2006 Critical Access Hospital and Hospital National Patient Safety Goals.Oakbrook Terrace, IL:The Joint Commission;2006.
- The Joint Commission.Approved: modifications to National Patient Safety Goal on reconciling medication information.Jt Comm Perspect.2011;31(1):1,3–7.
- ,.Pharmacists' medication reconciliation‐related clinical interventions in a children's hospital.Jt Comm J Qual Patient Saf.2009;35(5):278–282.
- ,,,,,.Reconciliation of discrepancies in medication histories and admission orders of newly hospitalized patients.Am J Health Syst Pharm.2004;61(16):1689–1695.
- ,,, et al.Medication reconciliation: a practical tool to reduce the risk of medication errors.J Crit Care.2003;18(4):201–205.
- ,,,,,.Multidisciplinary approach to inpatient medication reconciliation in an academic setting.Am J Health Syst Pharm.2007;64(8):850–854.
- ,,.Reconcilable differences: correcting medication errors at hospital admission and discharge.Qual Saf Health Care.2006;15(2):122–126.
- ,,, et al.Effect of an electronic medication reconciliation application and process redesign on potential adverse drug events: a cluster‐randomized trial.Arch Intern Med.2009;169(8):771–780.
- ,,, et al.Pharmacist medication assessments in a surgical preadmission clinic.Arch Intern Med.2007;167(10):1034–1040.
- ,.Effectiveness of a pharmacist‐acquired medication history in promoting patient safety.Am J Health Syst Pharm.2002;59(22):2221–2225.
- ,,,,,.Inpatient medication reconciliation at admission and discharge: a retrospective cohort study of age and other risk factors for medication discrepancies.Am J Geriatr Pharmacother.2010;8(2):115–126.
- ,,, et al.Design and implementation of an application and associated services to support interdisciplinary medication reconciliation efforts at an integrated healthcare delivery network.J Am Med Inform Assoc.2006;13(6):581–592.
- ,,, et al.The impact of computerized physician order entry on medication error prevention.J Am Med Inform Assoc.1999;6(4):313–321.
- ,,, et al.Medication safety program reduces adverse drug events in a community hospital.Qual Saf Health Care.2005;14(3):169–174.
- ,,,.Posthospital medication discrepancies: prevalence and contributing factors.Arch Intern Med.2005;165(16):1842–1847.
- ,,,,,.Deficits in communication and information transfer between hospital‐based and primary care physicians: implications for patient safety and continuity of care.JAMA.2007;297(8):831–841.
- ,,, et al.Adverse events among medical patients after discharge from hospital.Can Med Assoc J.2004;170(3):345–349.
- ,,,,.The incidence and severity of adverse events affecting patients after discharge from the hospital.Ann Intern Med.2003;138(3):161–167.
Adverse drug events (ADE), of which medication errors are one form, refer to harm caused by use of a drug. ADEs occur frequently and are associated with an increased length of stay, economic burden, and risk of death.1, 2 Classen et al and Bates et al estimate, respectively, that there are 1.2 to 1.8 preventable ADEs per 100 inpatient admissions.1, 3 Adjusting these data to current levels of yearly admissions, 380,000 to 400,000 preventable ADEs occur each year, and are projected to cost upwards of $3.5 billion annually in 2006 dollars.4
Medication reconciliation is an active process that occurs at transitions in care (admissions, transfers in level of care, and discharge) and is designed to prevent medication errors as the patient moves across the continuum of care. Medications used by the patient prior to hospitalization are considered when developing the inpatient therapeutic regimen.
Medications are ordered on admission based in part on what providers believe is the patient's home medication list (HML). A systematic review revealed that errors in medication history taking, including errors of omission and commission, are extremely common and clinically important.5 Such inaccuracies lead to unintended discrepancies between the hospital medication orders and the patient's true home medication regimen, and can result in patient harm.
Numerous studies have documented that inpatient discrepancies are common.610 From September 2004 to July 2005, data from the United States Pharmacopeia MEDMARX voluntary medication error reporting program revealed over 2000 medication errors associated with reconciliation failures: 22% occurred during admission and 12% occurred at time of discharge.11 A Canadian study demonstrated that 81 of 151 enrolled patients, who were prescribed 4 or more medications and were admitted to a medicine service, had at least 1 unintended discrepancy.6 Of those discrepancies, 38.6% were thought to have the potential to cause moderate or severe discomfort or clinical deterioration. Bates et al found that 0.9% of all inpatient medication errors lead to harm.12
The Joint Commission highlighted the importance of this problem by creating National Patient Safety Goal (NPSG) 8 in 2005, Accurately and completely reconcile medications across the continuum of care.13 This goal was modified and became effective on July 1, 2011.14 As a response, organizations have been developing physician‐led, nurse‐led, or pharmacist‐led medication reconciliation processes.8, 1522 Typically, these teams have time dedicated to producing the most accurate home list possible, a gold standard list. Examples of successful pharmacist‐led interventions to address this goal are described by investigators at Northwestern Memorial Hospital16 and Duke University Medical Center.23 Other interventions implemented to improve the reconciliation process include computerized provider order entry (CPOE) systems24 and combining information technology (IT) with process redesign involving physicians, pharmacists, and nurses.20 While the literature shows that there are multiple interventions that can reduce medication reconciliation errors, there is a dearth of evidence for interventions that are low‐cost and easily replicable.
Given that unintended medication discrepancies are common and harmful, we sought to develop a generalizable intervention. Our prospective pilot study explored whether an easily replicable nurse‐pharmacist led medication reconciliation process could efficiently and inexpensively identify unintended medication discrepancies, thereby preventing potential adverse drug events (PADEs).
METHODS
Patient Selection
The study was conducted at a 1000 bed urban, tertiary care hospital that serves a diverse patient population. We enrolled eligible patients over a 15‐month period, from January 2008 to March 2009, admitted to 2 resident‐covered general medicine teams. Each team is composed of an attending physician, 2 senior residents, 4 interns, a case manager, a pharmacist, and a social worker. Patients were excluded only if they did not consent or were discharged from the hospital in less than 24 hours. Patients were interviewed Monday through Friday, and those admitted over the weekend were interviewed the following Monday. The study was approved by The Johns Hopkins institutional review board (IRB).
Intervention Team
Baccalaureate‐prepared registered nurses (RNs) provided the primary intervention in this model. Both nurses had practiced as bedside clinicians at the hospital and had knowledge of hospital systems and structures. No additional training was provided.
The study pharmacist, who is board certified in pharmacotherapy, has a doctor of pharmacy degree and completed 1 year of Pharmacy Practice residency, as well as a 1‐year specialty residency in Internal Medicine. She spends the majority of her clinical time rounding with the inpatient medicine teams where she provides medication management recommendations.
Home Medication List Compilation
Informed consent was obtained by the study nurse 24‐48 hours after admission. The nurse completed an initial patient interview to determine the HML or preadmission medication list. The patient‐reported HML was compared to the history obtained by the physician. If both lists matched, the HML was considered complete. If a patient was not able to provide a written HML or recall medications, the nurses reviewed the electronic patient record (EPR), which documents previous discharge medication lists and Hopkins outpatient medication lists. If not convinced that the HML was accurate or complete, the nurses could use other sources of information, including patients' families, primary care physicians, and community pharmacies. Patients were then asked to verify the HML. At the start of the study, the nurses created a handwritten HML that they placed in the chart. As functionality of the CPOE improved during the study, the nurses entered the lists into the CPOE instead.
Reconciling the HML with the Admission Orders and Discharge Medication List
The nurses created the HML during the first 24‐48 hours of a patient's admission, so admission orders were entered before the resident physicians were aware of the nurse‐complied HML. By comparing the active medication orders to the HML, the nurses created a list of admission discrepancies. The nurse evaluated the discrepancies in the context of the treatment plan to determine if they appeared to be intended or unintended. The nurses consulted the study pharmacist if they were unsure if a discrepancy was intended. Questions about specific drug substitutions were clarified with the study pharmacist. For example, the nurses consulted the pharmacist about a patient who was taking carvedilol at home but was changed to metoprolol during the hospitalization.
After consultation with the pharmacist, the nurse reviewed all remaining potential unintended admission discrepancies with the physician team. A similar process was repeated on the day of discharge. For all patients transitioning out of the hospital, the nurses compared the active medication list and the HML to the discharge worksheet medication list and patient instructions. The nurses contacted the physician team when potential unintended discrepancies were identified. If unintended discrepancies were confirmed for a patient who had already been discharged earlier that day, a resolution plan was determined and the patient was contacted.
Intended Versus Unintended Discrepancies
After completing the nurse‐pharmacist review, the nurse presented the admission discrepancies that were thought to be unintended to the prescriber. If the medication order was not changed, the discrepancy was considered intended. If the prescriber changed the order, the discrepancy was considered unintended. Unintended discrepancies were identified within 48 hours of admission and also upon discharge. If an unintended discrepancy was identified during admission, it only counted as an admission discrepancy. However, if the same mistake occurred again during discharge, the unintended discrepancy was also counted as a discharge discrepancy. The nurses classified the discrepancy by type: medication omission, frequency error, route error, wrong dose, and/or wrong drug.
Rating Potential Harm From the Unintended Discrepancies
Adjudicators assessed the potential harm of unintended admission discrepancies that could occur during an average 4‐day hospitalization. Similarly, raters assessed the potential harm of unintended discharge medication discrepancies. Each of the 4 adjudicators, 2 physicians and 2 pharmacists, were blinded and independently adjudicated all unintended admission and discharge discrepancies, rating the potential harm from the discrepancy on a scale6 from 1 to 3:
Rank 1: unlikely to cause any harm or discomfort.
Rank 2: potential to cause moderate discomfort or clinical deterioration.
Rank 3: potential for severe discomfort or clinical deterioration.
To rate the potential harm of the discrepancies, the raters were provided with the patients' diagnoses, the medications in question, the types of discrepancies, and whether the discrepancy occurred at admission or discharge. The final potential harm level was determined by the majority rating unless a rating spread of Rank 1 to Rank 3 existed. In that case, consensus was reached by discussion. If the 4 raters were evenly split, the mean value was used.
Cost Analysis: Resources, Valuation, and Cost Savings
The time involved in implementing the protocol was recorded in minutes on an Excel spreadsheet. The time records included: participant interview, contact with secondary sources for medication history (a primary care physician or pharmacy), consultation with the study pharmacist, patient education, discharge activities, and consultation with the prescribers. The study pharmacist submitted additional time for follow‐up of issues after the initial consultation with the nurse.
The cost of an ADE in our study was estimated based on the Bates et al study, which reported an average cost of $5857.00 per inpatient ADE in 1996 dollars.2 Using an inflation adjustment ratio from 1996 to 2008 of 1.595, we calculated the cost of an ADE in 2008 dollars to be an average of $9344.12.
We compared the cost of the program with potential cost savings. We performed a threshold analysis to determine the minimum proportion of Rank 2‐3 potential ADEs that would actually need to result in harm in order for the intervention to yield a cost savings. We also estimated the costs of harm based on the Bates et al study which found that 0.9% of all inpatient medication errors results in harm.12
Statistical Analysis
We used logistic regression to test for associations between discrepancies and patient characteristics including age, race, length of stay, education, marital status, primary payor, severity of illness, and number of medications. The outcome measure was at least 1 unintended discrepancy on admission or discharge. A paired‐samples t test was calculated to compare the mean number of discrepancies on admission to the mean discrepancies at discharge.
RESULTS
We enrolled 563 patients who were admitted a total of 698 times. Only the first admission for each patient was analyzed. Patient demographics are presented in Table 1. Almost 70% of our enrolled patients were less than 65 years old, 65% of the patients were black, 58% lived within 5 miles of the Johns Hopkins Hospital, and a plurality of the patients were single and received Medicare. The mean number of medications was 7.8 (SD 4.9).
| Demographic Variable | Percentage |
|---|---|
| Demographic Variable | Mean SD |
| |
| Sex | |
| Male | 49.2 |
| Female | 50.8 |
| Age | |
| <65 | 69.5 |
| 65 to <85 | 27.5 |
| 85 | 3.0 |
| Marital status | |
| Single | 47.0 |
| Married | 30.0 |
| Divorced | 10.5 |
| Widowed | 10.7 |
| Payor | |
| Medicare | 42.3 |
| Medicaid | 25.0 |
| HMO | 8.0 |
| Self‐pay | 9.2 |
| Race | |
| White | 33.0 |
| Black | 65.1 |
| Other | 1.9 |
| APDRG complexity 1‐4 | |
| 1 | 5.2 |
| 2 | 28.5 |
| 3 | 47.4 |
| 4 | 18.9 |
| Education | |
| Less than eighth grade | 9.2 |
| Some high school | 21.7 |
| High school or GED | 28.9 |
| Some college | 15.1 |
| College degree or greater | 19.5 |
| Chose not to answer | 5.5 |
| ICD‐9 codes | |
| Diseases of the circulatory system | 25.5 |
| Diseases of the respiratory system | 11.1 |
| Diseases of the digestive system | 10.9 |
| Symptoms, signs, and ill‐defined conditions | 10.7 |
| Admission from the Emergency Room | 87 |
| Patient lives within 5 miles of the hospital | 58 |
| Age (years) | 55.4 16.6 |
| Number of medications per patient | 7.76 4.9 |
| Length of stay | 5.72 7.28 |
The most frequent source of the home medication list was from patient verbal recall (52%). Few patients had lists of their current medications when admitted. The second most commonly used source was the electronic patient record, 36.6%, which was used to verify and complete the home list. The patient's community pharmacist, 12.5%, was contacted when other sources did not result in a complete home list. The primary care site was contacted in 6.0% of the cases. Patients were then asked to verify the HML.
Of the 563 patients, 225 (40%; 95% confidence interval [CI], 36%‐44%) had at least 1 unintended discrepancy on admission or discharge. On admission and discharge, 28% (95% CI, 25%‐30%) and 25% (95% CI, 21%‐29%) of the patients, respectively, had an unintended discrepancy. Of those 225 patients who had an unintended discrepancy, 162 (72%) had a discrepancy ranked 2 or 3 on the potential harm scale.
Overall, there were more unintended discrepancies on admission (364) than at discharge (167) (Figure 1). The paired t test showed a significant decrease (t[562] = 2.066, P = 0.039) between the number of discrepancies on admission to discharge. However, the majority of these discrepancies on admission (55%) were Rank 1 on the potential harm scale, while the majority of the discharge discrepancies (85%) were likely to cause harm (Rank 2‐3). There were many more Rank 3 discrepancies upon discharge, 39, than on admission, 13. The percentage of Rank 2‐3 discrepancies on admission and discharge were 45% versus 85%, respectively. Interclass correlation of ratings before consensus was 0.58.
The most common unintended discrepancies were omissions of medications at admission, 74%, and discharge, 62%, followed by discrepancies in dosing (Table 2). The majority of omission discrepancies were categorized as Rank 1. Discrepancies in frequency and dosing were most likely to be adjudicated as Rank 2 or 3. Table 3 gives examples of how discrepancies were ranked.
| a. Type of Discrepancy on Admission | Total | Rank 1 | Rank 2 | Rank 3 |
|---|---|---|---|---|
| 364 (%) | 199 (%) | 152 (%) | 13 (%) | |
| ||||
| Omission | 270 (74) | 157 (79) | 102 (67) | 11 (85) |
| Frequency | 19 (5) | 7 (4) | 12 (8) | 0 |
| Route | 3 (1) | 1 (1) | 2 (1) | 0 |
| Dose | 54 (15) | 23 (12) | 29 (19) | 2 (15) |
| Drug | 18 (5) | 11 (5) | 7 (5) | 0 |
| b. Type of Discrepancy on Discharge | Total | Rank 1 | Rank 2 | Rank 3 |
| 167 (%) | 43 (%) | 85 (%) | 39 (%) | |
| Omission | 104 (62) | 37 (86) | 46 (54) | 21 (54) |
| Frequency | 15 (9) | 3 (7) | 10 (12) | 2 (5) |
| Route | 12 (7) | 2 (5) | 6 (7) | 4 (10) |
| Dose | 22 (13) | 0 | 14 (16) | 8 (21) |
| Drug | 14 (8) | 1 (2) | 9 (11) | 4 (10) |
| Rank | Time of Discrepancy | Clinical Information |
|---|---|---|
| ||
| 1 | Discharge | Elderly patient with sepsis from acute cystitis. Centrum Silver, part of the HML, was not on the discharge orders. |
| 2 | Discharge | Patient admitted with UTI. Metoprolol XL 100 mg was on the patient's HML but not on the discharge orders. |
| 3 | Admission | Patient admitted with hypertensive urgency. Clonidine 0.2 mg by mouth 3 times daily, which was on the patient's HML, was omitted. |
The only statistically significantly variable associated with the presence of discrepancies was the number of medications (odds ratio, 1.087; 95% CI, 1.044‐1.132). Each additional medication increased the odds of a discrepancy by 8.7%. Other variables, including age, race, length of stay, level of education, marital status, primary payor, and severity of illness, were not associated with prevalent discrepancies.
Cost Analysis: Resources, Utilization, and Cost Savings
On average, the nurses spent 11.2 minutes (SD 8.0 minutes) of their time conducting the admitting patient interview. The average total time for the protocol excluding the initial interview was 29.3 minutes (SD 30.2 minutes). The clinical pharmacist was consulted in 30% of the cases. The average consultation time was 7.5 minutes (SD 4.4). We determined the hospital's cost of the intervention by adding hourly wages plus benefits for the nurse, pharmacist, and physician multiplied by the time required of each team member. The intervention cost $31.82 per patient. Given (1) the total of 40.5 minutes per patient‐admission spent by the nurse for each of 563 patients admitted a total of 698 times over 15 months, (2) the assumption of 2000 hours of work in a 12‐month period, and (3) the assumption that these patients and all their admissions were representative of the 15‐month period, the estimated full‐time equivalents was 0.19.
Since Rank 1 discrepancies do not cause harm, we considered only Rank 2‐3 discrepancies. One hundred sixty‐two of the 563 (29%) patients had a discrepancy categorized as Rank 2‐3. Since the cost of the intervention per patient was $31.82, it cost $113.64 to find 1 discrepancy that could cause harm. If each ADE cost a hospital approximately $9344 in 2008, then preventing 1 discrepancy in every 290 patient encounters would offset the intervention costs. For every 290 patients, our data suggest that we would prevent 81 discrepancies. Every potential ADE does not result in an actual harm. Only 1.2% of the potential ADEs would have to result in harm for the cost of the intervention to be offset. Bates el al found that 0.9% of all inpatient medication errors lead to harm.12 Applying this rate to the total of 531 discrepancies found in the current study, 4.8 of them would have caused harm. Applying the inflation‐adjusted cost to these 4.8 harmful discrepancies, the total estimated cost averted would be $44,607; this compares favorably with the $17,915 cost of the nurse‐pharmacist intervention.
DISCUSSION
Inpatient medication reconciliation, an essential patient safety process, prevents potential ADEs and is mandated by The Joint Commission. Previous studies have shown that discrepancies are common occurrences for patients treated in tertiary centers,68 and those discrepancies can lead to patient discomfort or clinical deterioration.6, 8 Our current study supports this body of literature, as 40% of patients had at least 1 discrepancy on admission or discharge, and 29% of those discrepancies had the potential to result in moderate or severe discomfort or clinical deterioration. Although consistent with some findings,8 these numbers are generally lower than other studies,6, 25 where anywhere from 39% to 64% of the discrepancies were classified as Rank 2‐3.
Consistent with other studies, we found that omission was the most common type of discrepancy at admission as well as discharge.6, 8, 9, 21 In recent studies, omissions accounted for 46.5%10, 21 to 60%9 of the discrepancies. Further analysis in our study showed that the more medications a patient took, the higher the likelihood of discrepancya correlation also seen in other studies.9, 10 As the number of medications that a patient takes increases, the more difficult it becomes for all parties involved, including patients, families, and physicians, to keep an accurate recordleading to more opportunities for discrepancies.
Unintended medication discrepancies do not just occur on admission. While we identified many fewer discharge discrepancies, they were more likely to be categorized as Rank 2‐3. This is in contrast with other research that has found more discrepancies at discharge than admission.9, 11 In the current study, active medication reconciliation on admission likely led to a decrease in the number of discharge discrepancies. Even though there were fewer discharge discrepancies, the potential for harm was great and should not be underestimated.
Although many different types of interventions have been tried, this pilot study demonstrated a remarkably easy, generalizable, and inexpensive method. Other interventions have depended on wholesale reengineering of complicated processes,20, 26 pharmacists,10, 15, 16, 18, 19, 21, 22 or particular IT systems.20 Our intervention employed a nursing‐pharmacist model, which may either reduce the cost of healthcare, or at the very least, pay for itself. Each ADE is projected to cost $9300. The nurse‐pharmacist collaboration costs approximately $32 per patient. Thus, preventing only 1 ADE in 290 patient admissions would constitute a breakeven point for the interventiona goal that is likely achievable according to our study results. Even more cost‐effective would be to target only those patients at highest risk for a discrepancynamely those taking multiple home medications.10
There are several limitations to our study. First, we did not have a control group that would allow for comparison of clinical outcomes between the intervention and standard practice. Second, only potential ADEs were avoided. We were not able to determine that an ADE would definitely have occurred if the reconciliation had not taken place. Third, this study was conducted in a single department at 1 institution. As such, the results may not be generalizable to services other than general medicine or to other hospitals. Fourth, we relied on cost data from 1 inpatient study that is more than a decade old to estimate the potential savings to the healthcare system.2 This demonstrates the need for new studies of the cost of ADEs in hospital and outpatient settings. Outpatient medication discrepancies may be more or less costly than their inpatient counterparts, which would impact the cost analysis of this study. Fifth, we did not rely on the brown bag method, asking the patient's family to bring in the medication bottles, for determining the HML. That would certainly have given us another method to confirm the HML. Moreover, the nurse did not confirm the HML with a second source if she felt that the list provided by the patient was accurate. Finally, while we can intervene on discharge discrepancies, we do not control what a patient chooses to do after discharge.27 Health literacy, financial issues, deficits in communication between patients' discharge providers and their primary care providers, and many other factors affect whether patients adhere to their discharge medication list.28
Since this is not a randomized controlled trial, this pilot study requires additional testing to determine if ADEs are actually avoided and costs saved. The HML protocol could be updated to include the brown bag method or other additional steps to verify the HML. Although not inexpensive, a home visit intervention could be tested as well.29, 30
In conclusion, potentially harmful unintended medication discrepancies occurred frequently at both hospital admission and discharge. A nurse‐pharmacist collaboration to monitor and intervene on these discrepancies allowed many to be reconciled before potentially causing harm to patients. The collaboration was relatively efficient and cost‐effective, and the process potentially improves patient safety.
- ,,,,.Adverse drug events in hospitalized patients. Excess length of stay, extra costs, and attributable mortality.JAMA.1997;277(4):301–306.
- ,,, et al.The costs of adverse drug events in hospitalized patients. Adverse Drug Events Prevention Study Group.JAMA.1997;277(4):307–311.
- ,,, et al.Incidence of adverse drug events and potential adverse drug events. Implications for prevention. ADE Prevention Study Group.JAMA.1995;274(1):29–34.
- ,Institute of Medicine (U.S.).Committee on Identifying and Preventing Medication Errors.Preventing Medication Errors.Washington, DC:National Academies Press;2007.
- ,,,,,.Frequency, type and clinical importance of medication history errors at admission to hospital: a systematic review.Can Med Assoc J.2005;173(5):510–515.
- ,,, et al.Unintended medication discrepancies at the time of hospital admission.Arch Intern Med.2005;165(4):424–429.
- ,,.Frequency and type of medication discrepancies in one tertiary care hospital.Healthc Q.2006;9(Spec No):119–123.
- ,,, et al.Medication reconciliation at hospital discharge: evaluating discrepancies.Ann Pharmacother.2008;42(10):1373–1379.
- ,,, et al.Classifying and predicting errors of inpatient medication reconciliation.J Gen Intern Med.2008;23(9):1414–1422.
- ,,, et al.Results of the Medications At Transitions and Clinical Handoffs (MATCH) study: an analysis of medication reconciliation errors and risk factors at hospital admission.J Gen Intern Med.25(5):441–447.
- .Reconciliation failures lead to medication errors.Jt Comm J Qual Patient Saf.2006;32(4):225–229.
- ,,,,.Relationship between medication errors and adverse drug events.J Gen Intern Med.1995;10(4):199–205.
- The Joint Commission.National Patient Safety Goals. 2006 Critical Access Hospital and Hospital National Patient Safety Goals.Oakbrook Terrace, IL:The Joint Commission;2006.
- The Joint Commission.Approved: modifications to National Patient Safety Goal on reconciling medication information.Jt Comm Perspect.2011;31(1):1,3–7.
- ,.Pharmacists' medication reconciliation‐related clinical interventions in a children's hospital.Jt Comm J Qual Patient Saf.2009;35(5):278–282.
- ,,,,,.Reconciliation of discrepancies in medication histories and admission orders of newly hospitalized patients.Am J Health Syst Pharm.2004;61(16):1689–1695.
- ,,, et al.Medication reconciliation: a practical tool to reduce the risk of medication errors.J Crit Care.2003;18(4):201–205.
- ,,,,,.Multidisciplinary approach to inpatient medication reconciliation in an academic setting.Am J Health Syst Pharm.2007;64(8):850–854.
- ,,.Reconcilable differences: correcting medication errors at hospital admission and discharge.Qual Saf Health Care.2006;15(2):122–126.
- ,,, et al.Effect of an electronic medication reconciliation application and process redesign on potential adverse drug events: a cluster‐randomized trial.Arch Intern Med.2009;169(8):771–780.
- ,,, et al.Pharmacist medication assessments in a surgical preadmission clinic.Arch Intern Med.2007;167(10):1034–1040.
- ,.Effectiveness of a pharmacist‐acquired medication history in promoting patient safety.Am J Health Syst Pharm.2002;59(22):2221–2225.
- ,,,,,.Inpatient medication reconciliation at admission and discharge: a retrospective cohort study of age and other risk factors for medication discrepancies.Am J Geriatr Pharmacother.2010;8(2):115–126.
- ,,, et al.Design and implementation of an application and associated services to support interdisciplinary medication reconciliation efforts at an integrated healthcare delivery network.J Am Med Inform Assoc.2006;13(6):581–592.
- ,,, et al.The impact of computerized physician order entry on medication error prevention.J Am Med Inform Assoc.1999;6(4):313–321.
- ,,, et al.Medication safety program reduces adverse drug events in a community hospital.Qual Saf Health Care.2005;14(3):169–174.
- ,,,.Posthospital medication discrepancies: prevalence and contributing factors.Arch Intern Med.2005;165(16):1842–1847.
- ,,,,,.Deficits in communication and information transfer between hospital‐based and primary care physicians: implications for patient safety and continuity of care.JAMA.2007;297(8):831–841.
- ,,, et al.Adverse events among medical patients after discharge from hospital.Can Med Assoc J.2004;170(3):345–349.
- ,,,,.The incidence and severity of adverse events affecting patients after discharge from the hospital.Ann Intern Med.2003;138(3):161–167.
Copyright © 2012 Society of Hospital Medicine
