User login
Confronting Uncertainty and Addressing Urgency for Action Through the Establishment of a VA Long COVID Practice-Based Research Network
Confronting Uncertainty and Addressing Urgency for Action Through the Establishment of a VA Long COVID Practice-Based Research Network
Learning health systems (LHS) promote a continuous process that can assist in making sense of uncertainty when confronting emerging complex conditions such as Long COVID. Long COVID is an infection-associated chronic condition that detrimentally impacts veterans, their families, and the communities in which they live. This complex condition is defined by ongoing, new, or returning symptoms following COVID-19 infection that negatively affect return to meaningful participation in social, recreational, and vocational activities.1,2 The clinical uncertainty surrounding Long COVID is amplified by unclear etiology, prognosis, and expected course of symptoms.3,4 Uncertainty surrounding best clinical practices, processes, and policies for Long COVID care has resulted in practice variation despite the emerging evidence base for Long COVID care.4 Failure to address gaps in clinical evidence and care implementation threatens to perpetuate fragmented and unnecessary care.
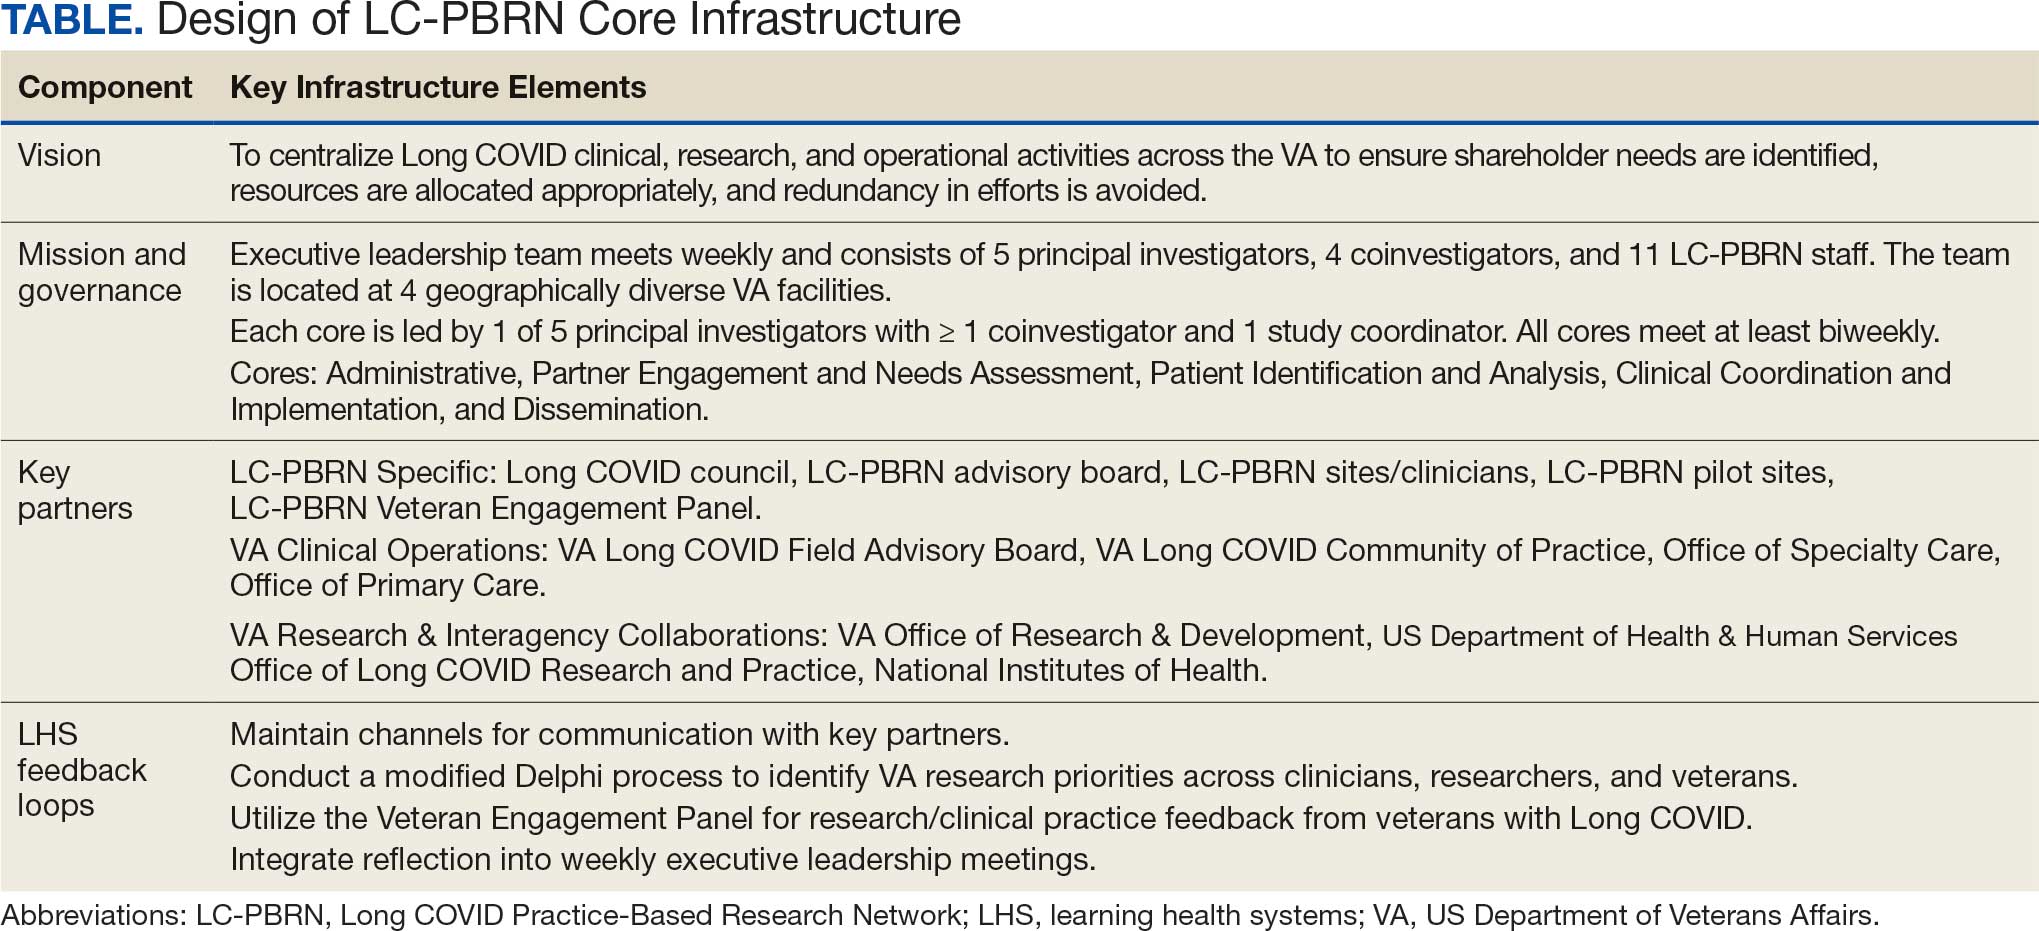
The context surrounding Long COVID created an urgency to rapidly address clinically relevant questions and make sense of any uncertainty. Thus, the Veterans Health Administration (VHA) funded a Long COVID Practice-Based Research Network (LC-PBRN) to build an infrastructure that supports Long COVID research nationally and promotes interdisciplinary collaboration. The LC-PBRN vision is to centralize Long COVID clinical, research, and operational activities. The research infrastructure of the LC-PBRN is designed with an LHS lens to facilitate feedback loops and integrate knowledge learned while making progress towards this vision.5 This article describes the phases of infrastructure development and network building, as well as associated lessons learned.
Designing the LC-PBRN Infrastructure
Vision
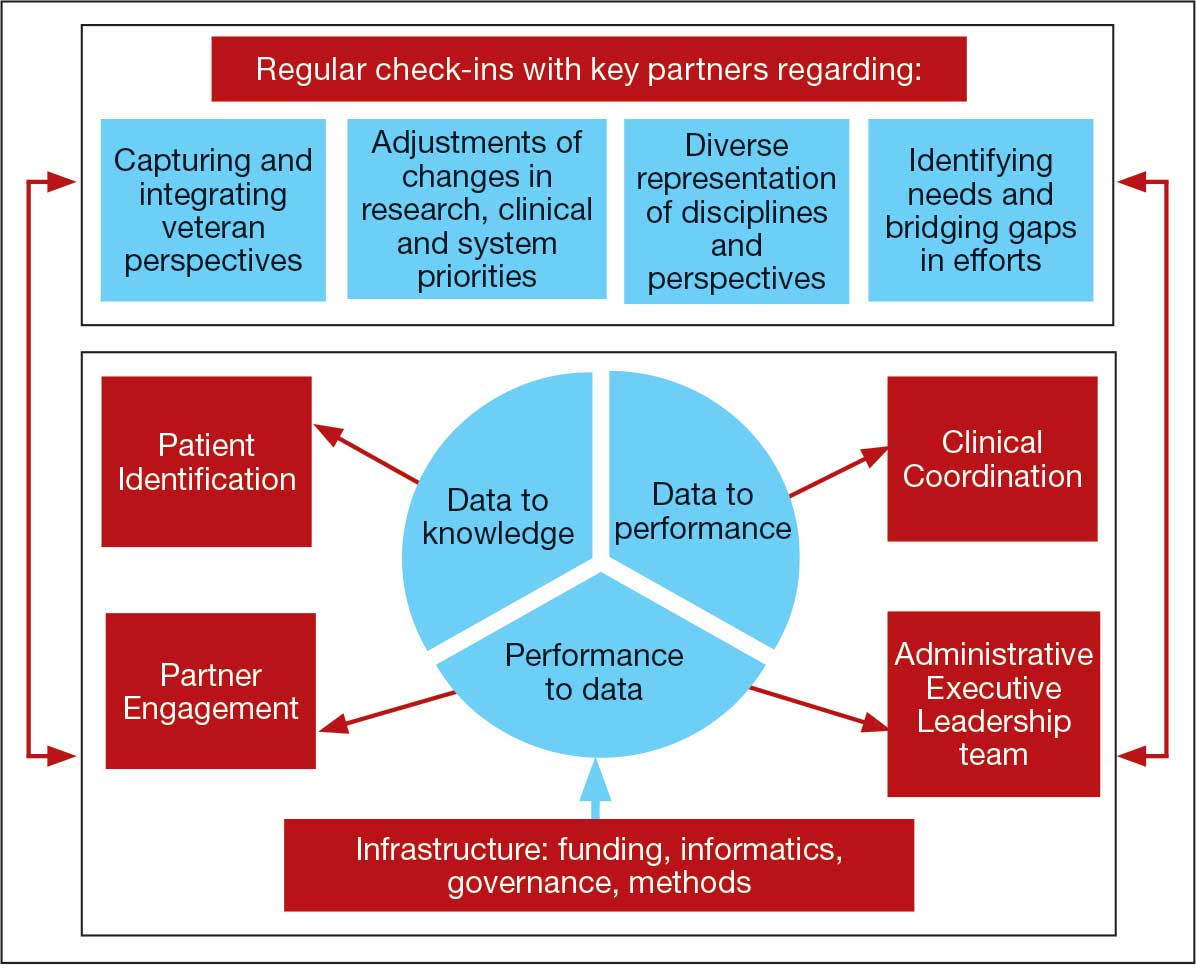
The LC-PBRN’s vision is to create an infrastructure that integrates an LHS framework by unifying the VA research approach to Long COVID to ensure veteran, clinician, operational, and researcher involvement (Figure 1).
Mission and Governance
The LC-PBRN operates with an executive leadership team and 5 cores. The executive leadership team is responsible for overall LC-PBRN operations, management, and direction setting of the LC-PBRN. The executive leadership team meets weekly to provide oversight of each core, which specializes in different aspects. The cores include: Administrative, Partner Engagement and Needs Assessment, Patient Identification and Analysis, Clinical Coordination and Implementation, and Dissemination (Figure 2).
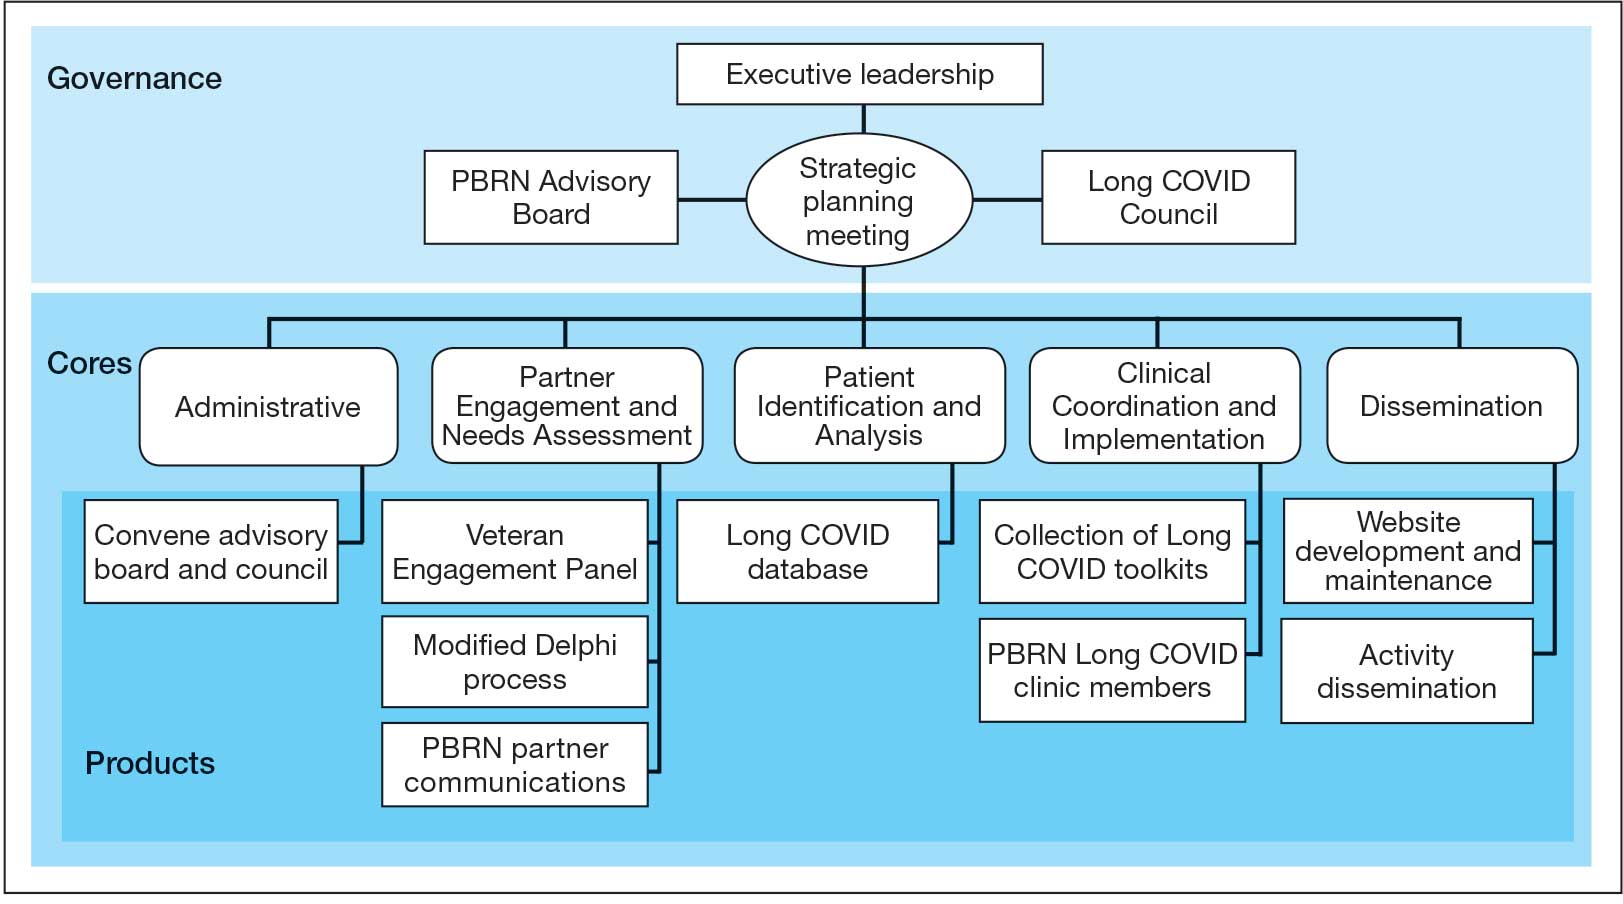
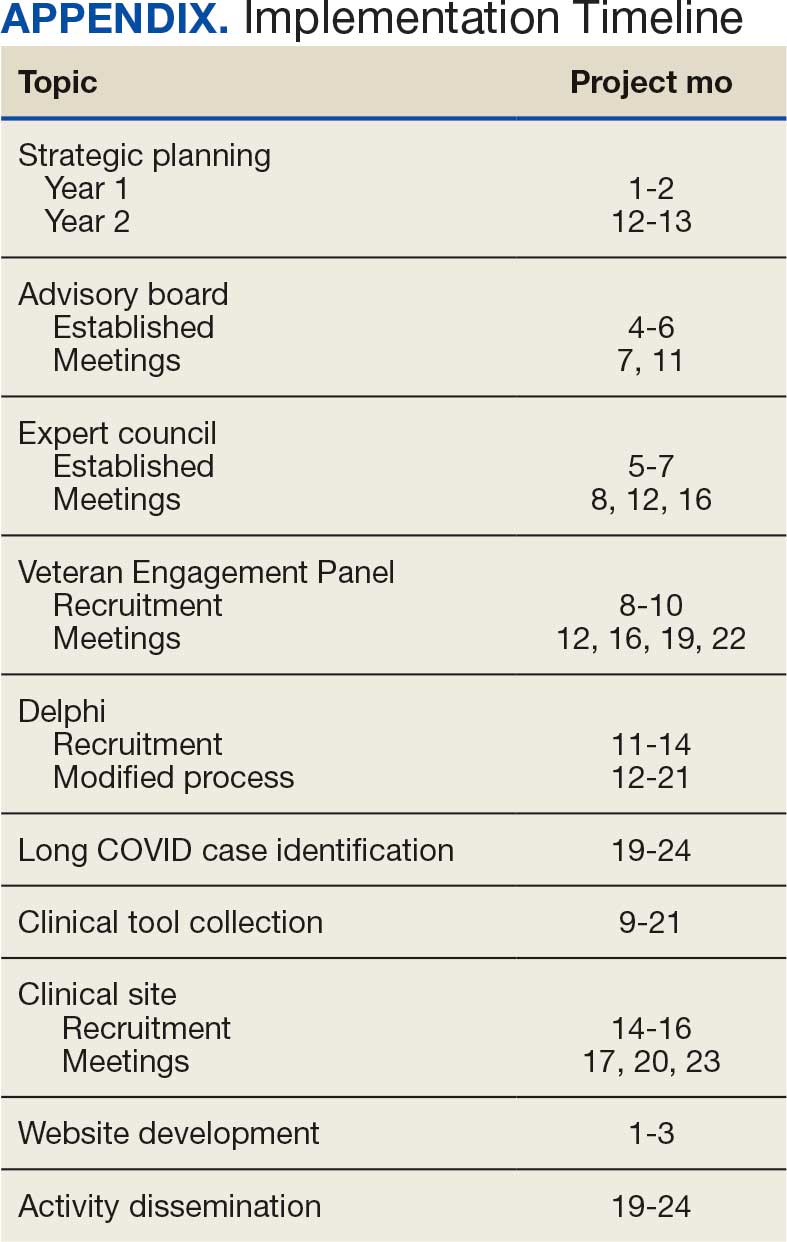
The Administrative core focuses on interagency collaboration to identify and network with key operational and agency leaders to allow for ongoing exploration of funding strategies for Long COVID research. The Administrative core manages 3 teams: an advisory board, Long COVID council, and the strategic planning team. The advisory board meets biannually to oversee achievement of LC-PBRN goals, deliverables, and tactics for meeting these goals. The advisory board includes the LC-PBRN executive leadership team and 13 interagency members from various shareholders (eg, Centers for Disease Control and Prevention, National Institutes of Health, and specialty departments within the VA).
The Long COVID council convenes quarterly to provide scientific input on important overarching issues in Long COVID research, practice, and policy. The council consists of 22 scientific representatives in VA and non-VA contexts, university affiliates, and veteran representatives. The strategic planning team convenes annually to identify how the LC-PBRN and its partners can meet the needs of the broader Long COVID ecosystem and conduct a strengths, opportunities, weaknesses, and threats analysis to identify strategic objectives and expected outcomes. The strategic planning team includes the executive leadership team and key Long COVID shareholders within VHA and affiliated partners. The Partner Engagement and Needs Assessment core aims to solicit feedback from veterans, clinicians, researchers, and operational leadership. Input is gathered through a Veteran Engagement Panel and a modified Delphi consensus process. The panel was formed using a Community Engagement Studio model to engage veterans as consultants on research.7 Currently, 10 members represent a range of ages, genders, racial and ethnic backgrounds, and military experience. All veterans have a history of Long COVID and are paid as consultants. Video conference panel meetings occur quarterly for 1 to 2 hours; the meeting length is shorter than typical engagement studios to accommodate for fatigue-related symptoms that may limit attention and ability to participate in longer meetings. Before each panel, the Partner Engagement and Needs Assessment core helps identify key questions and creates a structured agenda. Each panel begins with a presentation of a research study followed by a group discussion led by a trained facilitator. The modified Delphi consensus process focuses on identifying research priority areas for Long COVID within the VA. Veterans living with Long COVID, as well as clinicians and researchers who work closely with patients who have Long COVID, complete a series of progressive surveys to provide input on research priorities.
The Partner Engagement and Needs Assessment core also actively provides outreach to important partners in research, clinical care, and operational leadership to facilitate introductory meetings to (1) ask partners to describe their 5 largest pain points, (2) find pain points within the scope of LC-PBRN resources, and (3) discuss the strengths and capacity of the PBRN. During introductory meetings, communications preferences and a cadence for subsequent meetings are established. Subsequent engagement meetings aim to provide updates and codevelop solutions to emerging issues. This core maintains a living document to track engagement efforts, points of contact for identified and emerging partners, and ensure all communication is timely.
The Patient Identification and Analysis core develops a database of veterans with confirmed or suspected Long COVID. The goal is for researchers to use the database to identify potential participants for clinical trials and monitor clinical care outcomes. When possible, this core works with existing VA data to facilitate research that aligns with the LC-PBRN mission. The core can also use natural language processing and machine learning to work with researchers conducting clinical trials to help identify patients who may meet eligibility criteria.
The Clinical Coordination and Implementation core gathers information on the best practices for identifying and recruiting veterans for Long COVID research as well as compiles strategies for standardized clinical assessments that can both facilitate ongoing research and the successful implementation of evidence-based care. The Clinical Coordination and Implementation core provides support to pilot and multisite trials in 3 ways. First, it develops toolkits such as best practice strategies for recruiting participants for research, template examples of recruitment materials, and a library of patient-reported outcome measures, standardized clinical note titles and templates in use for Long COVID in the national electronic health record. Second, it partners with the Patient Identification and Analysis core to facilitate access to and use of algorithms that identify Long COVID cases based on electronic health records for recruitment. Finally, it compiles a detailed list of potential collaborating sites. The steps to facilitate patient identification and recruitment inform feasibility assessments and improve efficiency of launching pilot studies and multisite trials. The library of outcome measures, standardized clinical notes, and templates can aid and expedite data collection.
The Dissemination core focuses on developing a website, creating a dissemination plan, and actively disseminating products of the LC-PBRN and its partners. This core’s foundational framework is based on the Agency for Healthcare Research and Quality Quick-Start Guide to Dissemination for PBRNs.8,9 The core built an internal- and external-facing website to connect users with LC-PBRN products, potential outreach contacts, and promote timely updates on LC-PBRN activities. A manual of operating procedures will be drafted to include the development of training for practitioners involved in research projects to learn the processes involved in presenting clinical results for education and training initiatives, presentations, and manuscript preparation. A toolkit will also be developed to support dissemination activities designed to reach a variety of end-users, such as education materials, policy briefings, educational briefs, newsletters, and presentations at local, regional, and national levels.
Key Partners
Key partners exist specific to the LC-PBRN and within the broader VA ecosystem, including VA clinical operations, VA research, and intra-agency collaborations.
LC-PBRN Specific. In addition to the LC-PBRN council, advisory board, and Veteran Engagement Panel discussed earlier,
VA Clinical Operations. To support clinical operations, a Long COVID Field Advisory Board was formed through the VA Office of Specialty Care as an operational effort to develop clinical best practice. The LC-PBRN consults with this group on veteran engagement strategies for input on clinical guides and dissemination of practice guide materials. The LC-PBRN also partners with an existing Long COVID Community of Practice and the Office of Primary Care. The Community of Practice provides a learning space for VA staff interested in advancing Long COVID care and assists with disseminating LC-PBRN to the broader Long COVID clinical community. A member of the Office of Primary Care sits on the PBRN advisory board to provide input on engaging primary care practitioners and ensure their unique needs are considered in LC-PBRN initiatives.
VA Research & Interagency Collaborations. The LC-PBRN engages monthly with an interagency workgroup led by the US Department of Health and Human Services Office of Long COVID Research and Practice. These engagements support identification of research gaps that the VA may help address, monitor emerging funding opportunities, and foster collaborations. LC-PBRN representatives also meet with staff at the National Institutes of Health Researching COVID to Enhance Recovery initiative to identify pathways for veteran recruitment.
LHS Feedback Loops
The LC-PBRN was designed with an LHS approach in mind.10 Throughout development of the LC-PBRN, consideration was given to (1) capture data on new efforts within the Long COVID ecosystem (performance to data), (2) examine performance gaps and identify approaches for best practice (data to knowledge), and (3) implement best practices, develop toolkits, disseminate findings, and measure impacts (knowledge to performance). With this approach, the LC-PBRN is constantly evolving based on new information coming from the internal and external Long COVID ecosystem. Each element was deliberatively considered in relation to how data can be transformed into knowledge, knowledge into performance, and performance into data.
First, an important mechanism for feedback involves establishing clear channels of communication. Regular check-ins with key partners occur through virtual meetings to provide updates, assess needs and challenges, and codevelop action plans. For example, during a check-in with the Long COVID Field Advisory Board, members expressed a desire to incorporate veteran feedback into VA clinical practice recommendations. We provided expertise on different engagement modalities (eg, focus groups vs individual interviews), and collaboration occurred to identify key interview questions for veterans. This process resulted in a published clinician-facing Long COVID Nervous System Clinical Guide (available at longcovid@hhs.gov) that integrated critical feedback from veterans related to neurological symptoms.
Second, weekly executive leadership meetings include dedicated time for reflection on partner feedback, the current state of Long COVID, and contextual changes that impact deliverable priorities and timelines. Outcomes from these discussions are communicated with VHA Health Services Research and, when appropriate, to key partners to ensure alignment. For example, the Patient Identification and Analysis core was originally tasked with identifying a definition of Long COVID. However, as the broader community moved away from a singular definition, efforts were redirected toward higher-priority issues within the VA Long COVID ecosystem, including veteran enrollment in clinical trials.
Third, the Veteran Engagement Panel captures feedback from those with lived experience to inform Long COVID research and clinical efforts. The panel meetings are strategically designed to ask veterans living with Long COVID specific questions related to a given research or clinical topic of interest. For example, panel sessions with the Field Advisory Board focused on concerns articulated by veterans related to the mental health and gastroenterological symptoms associated with Long COVID. Insights from these discussions will inform development of Long COVID mental health and gastroenterological clinical care guides, with several PBRN investigators serving as subject matter experts. This collaborative approach ensures that veteran perspectives are represented in developing Long COVID clinical care processes.
Fourth, research priorities identified through the Delphi consensus process will inform development of VA Request for Funding Proposals related to Long COVID. The initial survey was developed in collaboration with veterans, clinicians, and researchers across the Veteran Engagement Panel, the Field Advisory Board, and the National Research Action Plan on Long COVID.11 The process was launched in October 2024 and concluded in June 2025. The team conducted 3 consensus rounds with veterans and VA clinicians and researchers. Top priority areas included the testing assessments for diagnosing Long COVID, studying subtypes of Long COVID and treatments for each, and finding biomarkers for Long COVID. A formal publication of the results and analysis is the focus of a future publication.
Fifth, ongoing engagement with the Field Advisory Board has supported adoption of a preliminary set of clinical outcome measures. If universally adopted, these instruments may contribute to the development of a standardized data collection process and serve as common data elements collected for epidemiologic, health services, or clinical trial research.
Lessons Learned and Practice Implications
Throughout the development of the LC-PBRN, several decisions were identified that have impacted infrastructure development and implementation.
Include veterans’ voices to ensure network efforts align with patient needs. Given the novelty of Long COVID, practitioners and researchers are learning as they go. It is important to listen to individuals who live with Long COVID. Throughout the development of the LC-PBRN, veteran perspective has proven how vital it is for them to be heard when it comes to their health care. Clinicians similarly highlighted the value of incorporating patient perspectives into the development of tools and treatment strategies. Develop an interdisciplinary leadership team to foster the diverse viewpoints needed to tackle multifaceted problems. It is important to consider as many clinical and research perspectives as possible because Long COVID is a complex condition with symptoms impacting major organ systems.12-15 Therefore, the team spans across a multitude of specialties and locations.
Set clear expectations and goals with partners to uphold timely deliverables and stay within the PBRN’s capacity. When including a multitude of partners, teams should consider each of those partners’ experiences and opinions in decision-making conversations. Expectation setting is important to ensure all partners are on the same page and understand the capacity of the LC-PBRN. This allows the team to focus its efforts, avoid being overwhelmed with requests, and provide quality deliverables.
Build engaging relationships to bridge gaps between internal and external partners. A substantial number of resources focus on building relationships with partners so they can trust the LC-PBRN has their best interests in mind. These relationships are important to ensure the VA avoids duplicate efforts. This includes prioritizing connecting partners who are working on similar efforts to promote collaboration across facilities.
Conclusions
PBRNs provide an important mechanism to use LHS approaches to successfully convene research around complex issues. PBRNs can support integration across the LHS cycle, allowing for multiple feedback loops, and coordinate activities that work to achieve a larger vision. PBRNs offer centralized mechanisms to collaboratively understand and address complex problems, such as Long COVID, where the uncertainty regarding how to treat occurs in tandem with the urgency to treat. The LC-PBRN model described in this article has the potential to transcend Long COVID by building infrastructure necessary to proactively address current or future clinical conditions or populations with a LHS lens. The infrastructure can require cross-system and sector collaborations, expediency, inclusivity, and patient- and family-centeredness. Future efforts will focus on building out a larger network of VHA sites, facilitating recruitment at site and veteran levels into Long COVID trials through case identification, and systematically support the standardization of clinical data for clinical utility and evaluation of quality and/or outcomes across the VHA.
- Ottiger M, Poppele I, Sperling N, et al. Work ability and return-to-work of patients with post-COVID-19: a systematic review and meta-analysis. BMC Public Health. 2024;24:1811. doi:10.1186/s12889-024-19328-6
- Ziauddeen N, Gurdasani D, O’Hara ME, et al. Characteristics and impact of Long Covid: findings from an online survey. PLOS ONE. 2022;17:e0264331. doi:10.1371/journal.pone.0264331
- Graham F. Daily briefing: Answers emerge about long COVID recovery. Nature. Published online June 28, 2023. doi:10.1038/d41586-023-02190-8
- Al-Aly Z, Davis H, McCorkell L, et al. Long COVID science, research and policy. Nat Med. 2024;30:2148-2164. doi:10.1038/s41591-024-03173-6
- Atkins D, Kilbourne AM, Shulkin D. Moving from discovery to system-wide change: the role of research in a learning health care system: experience from three decades of health systems research in the Veterans Health Administration. Annu Rev Public Health. 2017;38:467-487. doi:10.1146/annurev-publhealth-031816-044255
- Ely EW, Brown LM, Fineberg HV. Long covid defined. N Engl J Med. 2024;391:1746-1753.doi:10.1056/NEJMsb2408466
- Joosten YA, Israel TL, Williams NA, et al. Community engagement studios: a structured approach to obtaining meaningful input from stakeholders to inform research. Acad Med. 2015;90:1646-1650. doi:10.1097/ACM.0000000000000794
- AHRQ. Quick-start guide to dissemination for practice-based research networks. Revised June 2014. Accessed December 2, 2025. https://www.ahrq.gov/sites/default/files/wysiwyg/ncepcr/resources/dissemination-quick-start-guide.pdf
- Gustavson AM, Morrow CD, Brown RJ, et al. Reimagining how we synthesize information to impact clinical care, policy, and research priorities in real time: examples and lessons learned from COVID-19. J Gen Intern Med. 2024;39:2554-2559. doi:10.1007/s11606-024-08855-y
- University of Minnesota. About the Center for Learning Health System Sciences. Updated December 11, 2025. Accessed December 12, 2025. https://med.umn.edu/clhss/about-us
- AHRQ. National Research Action Plan. Published online 2022. Accessed February 14, 2024. https://www.covid.gov/sites/default/files/documents/National-Research-Action-Plan-on-Long-COVID-08012022.pdf
- Gustavson AM, Eaton TL, Schapira RM, et al. Approaches to long COVID care: the Veterans Health Administration experience in 2021. BMJ Mil Health. 2024;170:179-180. doi:10.1136/military-2022-002185
- Gustavson AM. A learning health system approach to long COVID care. Fed Pract. 2022;39:7. doi:10.12788/fp.0288
- Palacio A, Bast E, Klimas N, et al. Lessons learned in implementing a multidisciplinary long COVID clinic. Am J Med. 2025;138:843-849.doi:10.1016/j.amjmed.2024.05.020
- Prusinski C, Yan D, Klasova J, et al. Multidisciplinary management strategies for long COVID: a narrative review. Cureus. 2024;16:e59478. doi:10.7759/cureus.59478
Learning health systems (LHS) promote a continuous process that can assist in making sense of uncertainty when confronting emerging complex conditions such as Long COVID. Long COVID is an infection-associated chronic condition that detrimentally impacts veterans, their families, and the communities in which they live. This complex condition is defined by ongoing, new, or returning symptoms following COVID-19 infection that negatively affect return to meaningful participation in social, recreational, and vocational activities.1,2 The clinical uncertainty surrounding Long COVID is amplified by unclear etiology, prognosis, and expected course of symptoms.3,4 Uncertainty surrounding best clinical practices, processes, and policies for Long COVID care has resulted in practice variation despite the emerging evidence base for Long COVID care.4 Failure to address gaps in clinical evidence and care implementation threatens to perpetuate fragmented and unnecessary care.
The context surrounding Long COVID created an urgency to rapidly address clinically relevant questions and make sense of any uncertainty. Thus, the Veterans Health Administration (VHA) funded a Long COVID Practice-Based Research Network (LC-PBRN) to build an infrastructure that supports Long COVID research nationally and promotes interdisciplinary collaboration. The LC-PBRN vision is to centralize Long COVID clinical, research, and operational activities. The research infrastructure of the LC-PBRN is designed with an LHS lens to facilitate feedback loops and integrate knowledge learned while making progress towards this vision.5 This article describes the phases of infrastructure development and network building, as well as associated lessons learned.
Designing the LC-PBRN Infrastructure
Vision
The LC-PBRN’s vision is to create an infrastructure that integrates an LHS framework by unifying the VA research approach to Long COVID to ensure veteran, clinician, operational, and researcher involvement (Figure 1).
Mission and Governance
The LC-PBRN operates with an executive leadership team and 5 cores. The executive leadership team is responsible for overall LC-PBRN operations, management, and direction setting of the LC-PBRN. The executive leadership team meets weekly to provide oversight of each core, which specializes in different aspects. The cores include: Administrative, Partner Engagement and Needs Assessment, Patient Identification and Analysis, Clinical Coordination and Implementation, and Dissemination (Figure 2).
The Administrative core focuses on interagency collaboration to identify and network with key operational and agency leaders to allow for ongoing exploration of funding strategies for Long COVID research. The Administrative core manages 3 teams: an advisory board, Long COVID council, and the strategic planning team. The advisory board meets biannually to oversee achievement of LC-PBRN goals, deliverables, and tactics for meeting these goals. The advisory board includes the LC-PBRN executive leadership team and 13 interagency members from various shareholders (eg, Centers for Disease Control and Prevention, National Institutes of Health, and specialty departments within the VA).
The Long COVID council convenes quarterly to provide scientific input on important overarching issues in Long COVID research, practice, and policy. The council consists of 22 scientific representatives in VA and non-VA contexts, university affiliates, and veteran representatives. The strategic planning team convenes annually to identify how the LC-PBRN and its partners can meet the needs of the broader Long COVID ecosystem and conduct a strengths, opportunities, weaknesses, and threats analysis to identify strategic objectives and expected outcomes. The strategic planning team includes the executive leadership team and key Long COVID shareholders within VHA and affiliated partners. The Partner Engagement and Needs Assessment core aims to solicit feedback from veterans, clinicians, researchers, and operational leadership. Input is gathered through a Veteran Engagement Panel and a modified Delphi consensus process. The panel was formed using a Community Engagement Studio model to engage veterans as consultants on research.7 Currently, 10 members represent a range of ages, genders, racial and ethnic backgrounds, and military experience. All veterans have a history of Long COVID and are paid as consultants. Video conference panel meetings occur quarterly for 1 to 2 hours; the meeting length is shorter than typical engagement studios to accommodate for fatigue-related symptoms that may limit attention and ability to participate in longer meetings. Before each panel, the Partner Engagement and Needs Assessment core helps identify key questions and creates a structured agenda. Each panel begins with a presentation of a research study followed by a group discussion led by a trained facilitator. The modified Delphi consensus process focuses on identifying research priority areas for Long COVID within the VA. Veterans living with Long COVID, as well as clinicians and researchers who work closely with patients who have Long COVID, complete a series of progressive surveys to provide input on research priorities.
The Partner Engagement and Needs Assessment core also actively provides outreach to important partners in research, clinical care, and operational leadership to facilitate introductory meetings to (1) ask partners to describe their 5 largest pain points, (2) find pain points within the scope of LC-PBRN resources, and (3) discuss the strengths and capacity of the PBRN. During introductory meetings, communications preferences and a cadence for subsequent meetings are established. Subsequent engagement meetings aim to provide updates and codevelop solutions to emerging issues. This core maintains a living document to track engagement efforts, points of contact for identified and emerging partners, and ensure all communication is timely.
The Patient Identification and Analysis core develops a database of veterans with confirmed or suspected Long COVID. The goal is for researchers to use the database to identify potential participants for clinical trials and monitor clinical care outcomes. When possible, this core works with existing VA data to facilitate research that aligns with the LC-PBRN mission. The core can also use natural language processing and machine learning to work with researchers conducting clinical trials to help identify patients who may meet eligibility criteria.
The Clinical Coordination and Implementation core gathers information on the best practices for identifying and recruiting veterans for Long COVID research as well as compiles strategies for standardized clinical assessments that can both facilitate ongoing research and the successful implementation of evidence-based care. The Clinical Coordination and Implementation core provides support to pilot and multisite trials in 3 ways. First, it develops toolkits such as best practice strategies for recruiting participants for research, template examples of recruitment materials, and a library of patient-reported outcome measures, standardized clinical note titles and templates in use for Long COVID in the national electronic health record. Second, it partners with the Patient Identification and Analysis core to facilitate access to and use of algorithms that identify Long COVID cases based on electronic health records for recruitment. Finally, it compiles a detailed list of potential collaborating sites. The steps to facilitate patient identification and recruitment inform feasibility assessments and improve efficiency of launching pilot studies and multisite trials. The library of outcome measures, standardized clinical notes, and templates can aid and expedite data collection.
The Dissemination core focuses on developing a website, creating a dissemination plan, and actively disseminating products of the LC-PBRN and its partners. This core’s foundational framework is based on the Agency for Healthcare Research and Quality Quick-Start Guide to Dissemination for PBRNs.8,9 The core built an internal- and external-facing website to connect users with LC-PBRN products, potential outreach contacts, and promote timely updates on LC-PBRN activities. A manual of operating procedures will be drafted to include the development of training for practitioners involved in research projects to learn the processes involved in presenting clinical results for education and training initiatives, presentations, and manuscript preparation. A toolkit will also be developed to support dissemination activities designed to reach a variety of end-users, such as education materials, policy briefings, educational briefs, newsletters, and presentations at local, regional, and national levels.
Key Partners
Key partners exist specific to the LC-PBRN and within the broader VA ecosystem, including VA clinical operations, VA research, and intra-agency collaborations.
LC-PBRN Specific. In addition to the LC-PBRN council, advisory board, and Veteran Engagement Panel discussed earlier,
VA Clinical Operations. To support clinical operations, a Long COVID Field Advisory Board was formed through the VA Office of Specialty Care as an operational effort to develop clinical best practice. The LC-PBRN consults with this group on veteran engagement strategies for input on clinical guides and dissemination of practice guide materials. The LC-PBRN also partners with an existing Long COVID Community of Practice and the Office of Primary Care. The Community of Practice provides a learning space for VA staff interested in advancing Long COVID care and assists with disseminating LC-PBRN to the broader Long COVID clinical community. A member of the Office of Primary Care sits on the PBRN advisory board to provide input on engaging primary care practitioners and ensure their unique needs are considered in LC-PBRN initiatives.
VA Research & Interagency Collaborations. The LC-PBRN engages monthly with an interagency workgroup led by the US Department of Health and Human Services Office of Long COVID Research and Practice. These engagements support identification of research gaps that the VA may help address, monitor emerging funding opportunities, and foster collaborations. LC-PBRN representatives also meet with staff at the National Institutes of Health Researching COVID to Enhance Recovery initiative to identify pathways for veteran recruitment.
LHS Feedback Loops
The LC-PBRN was designed with an LHS approach in mind.10 Throughout development of the LC-PBRN, consideration was given to (1) capture data on new efforts within the Long COVID ecosystem (performance to data), (2) examine performance gaps and identify approaches for best practice (data to knowledge), and (3) implement best practices, develop toolkits, disseminate findings, and measure impacts (knowledge to performance). With this approach, the LC-PBRN is constantly evolving based on new information coming from the internal and external Long COVID ecosystem. Each element was deliberatively considered in relation to how data can be transformed into knowledge, knowledge into performance, and performance into data.
First, an important mechanism for feedback involves establishing clear channels of communication. Regular check-ins with key partners occur through virtual meetings to provide updates, assess needs and challenges, and codevelop action plans. For example, during a check-in with the Long COVID Field Advisory Board, members expressed a desire to incorporate veteran feedback into VA clinical practice recommendations. We provided expertise on different engagement modalities (eg, focus groups vs individual interviews), and collaboration occurred to identify key interview questions for veterans. This process resulted in a published clinician-facing Long COVID Nervous System Clinical Guide (available at longcovid@hhs.gov) that integrated critical feedback from veterans related to neurological symptoms.
Second, weekly executive leadership meetings include dedicated time for reflection on partner feedback, the current state of Long COVID, and contextual changes that impact deliverable priorities and timelines. Outcomes from these discussions are communicated with VHA Health Services Research and, when appropriate, to key partners to ensure alignment. For example, the Patient Identification and Analysis core was originally tasked with identifying a definition of Long COVID. However, as the broader community moved away from a singular definition, efforts were redirected toward higher-priority issues within the VA Long COVID ecosystem, including veteran enrollment in clinical trials.
Third, the Veteran Engagement Panel captures feedback from those with lived experience to inform Long COVID research and clinical efforts. The panel meetings are strategically designed to ask veterans living with Long COVID specific questions related to a given research or clinical topic of interest. For example, panel sessions with the Field Advisory Board focused on concerns articulated by veterans related to the mental health and gastroenterological symptoms associated with Long COVID. Insights from these discussions will inform development of Long COVID mental health and gastroenterological clinical care guides, with several PBRN investigators serving as subject matter experts. This collaborative approach ensures that veteran perspectives are represented in developing Long COVID clinical care processes.
Fourth, research priorities identified through the Delphi consensus process will inform development of VA Request for Funding Proposals related to Long COVID. The initial survey was developed in collaboration with veterans, clinicians, and researchers across the Veteran Engagement Panel, the Field Advisory Board, and the National Research Action Plan on Long COVID.11 The process was launched in October 2024 and concluded in June 2025. The team conducted 3 consensus rounds with veterans and VA clinicians and researchers. Top priority areas included the testing assessments for diagnosing Long COVID, studying subtypes of Long COVID and treatments for each, and finding biomarkers for Long COVID. A formal publication of the results and analysis is the focus of a future publication.
Fifth, ongoing engagement with the Field Advisory Board has supported adoption of a preliminary set of clinical outcome measures. If universally adopted, these instruments may contribute to the development of a standardized data collection process and serve as common data elements collected for epidemiologic, health services, or clinical trial research.
Lessons Learned and Practice Implications
Throughout the development of the LC-PBRN, several decisions were identified that have impacted infrastructure development and implementation.
Include veterans’ voices to ensure network efforts align with patient needs. Given the novelty of Long COVID, practitioners and researchers are learning as they go. It is important to listen to individuals who live with Long COVID. Throughout the development of the LC-PBRN, veteran perspective has proven how vital it is for them to be heard when it comes to their health care. Clinicians similarly highlighted the value of incorporating patient perspectives into the development of tools and treatment strategies. Develop an interdisciplinary leadership team to foster the diverse viewpoints needed to tackle multifaceted problems. It is important to consider as many clinical and research perspectives as possible because Long COVID is a complex condition with symptoms impacting major organ systems.12-15 Therefore, the team spans across a multitude of specialties and locations.
Set clear expectations and goals with partners to uphold timely deliverables and stay within the PBRN’s capacity. When including a multitude of partners, teams should consider each of those partners’ experiences and opinions in decision-making conversations. Expectation setting is important to ensure all partners are on the same page and understand the capacity of the LC-PBRN. This allows the team to focus its efforts, avoid being overwhelmed with requests, and provide quality deliverables.
Build engaging relationships to bridge gaps between internal and external partners. A substantial number of resources focus on building relationships with partners so they can trust the LC-PBRN has their best interests in mind. These relationships are important to ensure the VA avoids duplicate efforts. This includes prioritizing connecting partners who are working on similar efforts to promote collaboration across facilities.
Conclusions
PBRNs provide an important mechanism to use LHS approaches to successfully convene research around complex issues. PBRNs can support integration across the LHS cycle, allowing for multiple feedback loops, and coordinate activities that work to achieve a larger vision. PBRNs offer centralized mechanisms to collaboratively understand and address complex problems, such as Long COVID, where the uncertainty regarding how to treat occurs in tandem with the urgency to treat. The LC-PBRN model described in this article has the potential to transcend Long COVID by building infrastructure necessary to proactively address current or future clinical conditions or populations with a LHS lens. The infrastructure can require cross-system and sector collaborations, expediency, inclusivity, and patient- and family-centeredness. Future efforts will focus on building out a larger network of VHA sites, facilitating recruitment at site and veteran levels into Long COVID trials through case identification, and systematically support the standardization of clinical data for clinical utility and evaluation of quality and/or outcomes across the VHA.
- Ottiger M, Poppele I, Sperling N, et al. Work ability and return-to-work of patients with post-COVID-19: a systematic review and meta-analysis. BMC Public Health. 2024;24:1811. doi:10.1186/s12889-024-19328-6
- Ziauddeen N, Gurdasani D, O’Hara ME, et al. Characteristics and impact of Long Covid: findings from an online survey. PLOS ONE. 2022;17:e0264331. doi:10.1371/journal.pone.0264331
- Graham F. Daily briefing: Answers emerge about long COVID recovery. Nature. Published online June 28, 2023. doi:10.1038/d41586-023-02190-8
- Al-Aly Z, Davis H, McCorkell L, et al. Long COVID science, research and policy. Nat Med. 2024;30:2148-2164. doi:10.1038/s41591-024-03173-6
- Atkins D, Kilbourne AM, Shulkin D. Moving from discovery to system-wide change: the role of research in a learning health care system: experience from three decades of health systems research in the Veterans Health Administration. Annu Rev Public Health. 2017;38:467-487. doi:10.1146/annurev-publhealth-031816-044255
- Ely EW, Brown LM, Fineberg HV. Long covid defined. N Engl J Med. 2024;391:1746-1753.doi:10.1056/NEJMsb2408466
- Joosten YA, Israel TL, Williams NA, et al. Community engagement studios: a structured approach to obtaining meaningful input from stakeholders to inform research. Acad Med. 2015;90:1646-1650. doi:10.1097/ACM.0000000000000794
- AHRQ. Quick-start guide to dissemination for practice-based research networks. Revised June 2014. Accessed December 2, 2025. https://www.ahrq.gov/sites/default/files/wysiwyg/ncepcr/resources/dissemination-quick-start-guide.pdf
- Gustavson AM, Morrow CD, Brown RJ, et al. Reimagining how we synthesize information to impact clinical care, policy, and research priorities in real time: examples and lessons learned from COVID-19. J Gen Intern Med. 2024;39:2554-2559. doi:10.1007/s11606-024-08855-y
- University of Minnesota. About the Center for Learning Health System Sciences. Updated December 11, 2025. Accessed December 12, 2025. https://med.umn.edu/clhss/about-us
- AHRQ. National Research Action Plan. Published online 2022. Accessed February 14, 2024. https://www.covid.gov/sites/default/files/documents/National-Research-Action-Plan-on-Long-COVID-08012022.pdf
- Gustavson AM, Eaton TL, Schapira RM, et al. Approaches to long COVID care: the Veterans Health Administration experience in 2021. BMJ Mil Health. 2024;170:179-180. doi:10.1136/military-2022-002185
- Gustavson AM. A learning health system approach to long COVID care. Fed Pract. 2022;39:7. doi:10.12788/fp.0288
- Palacio A, Bast E, Klimas N, et al. Lessons learned in implementing a multidisciplinary long COVID clinic. Am J Med. 2025;138:843-849.doi:10.1016/j.amjmed.2024.05.020
- Prusinski C, Yan D, Klasova J, et al. Multidisciplinary management strategies for long COVID: a narrative review. Cureus. 2024;16:e59478. doi:10.7759/cureus.59478
Confronting Uncertainty and Addressing Urgency for Action Through the Establishment of a VA Long COVID Practice-Based Research Network
Confronting Uncertainty and Addressing Urgency for Action Through the Establishment of a VA Long COVID Practice-Based Research Network

Hospitalists and Quality of Care
Quality of care in US hospitals is inconsistent and often below accepted standards.1 This observation has catalyzed a number of performance measurement initiatives intended to publicize gaps and spur quality improvement.2 As the field has evolved, organizational factors such as teaching status, ownership model, nurse staffing levels, and hospital volume have been found to be associated with performance on quality measures.1, 3‐7 Hospitalists represent a more recent change in the organization of inpatient care8 that may impact hospital‐level performance. In fact, most hospitals provide financial support to hospitalists, not only for hopes of improving efficiency, but also for improving quality and safety.9
Only a few single‐site studies have examined the impact of hospitalists on quality of care for common medical conditions (ie, pneumonia, congestive heart failure, and acute myocardial infarction), and each has focused on patient‐level effects. Rifkin et al.10, 11 did not find differences between hospitalists' and nonhospitalists' patients in terms of pneumonia process measures. Roytman et al.12 found hospitalists more frequently prescribed afterload‐reducing agents for congestive heart failure (CHF), but other studies have shown no differences in care quality for heart failure.13, 14 Importantly, no studies have examined the role of hospitalists in the care of patients with acute myocardial infarction (AMI). In addition, studies have not addressed the effect of hospitalists at the hospital level to understand whether hospitalists have broader system‐level effects reflected by overall hospital performance.
We hypothesized that the presence of hospitalists within a hospital would be associated with improvements in hospital‐level adherence to publicly reported quality process measures, and having a greater percentage of patients admitted by hospitalists would be associated with improved performance. To test these hypotheses, we linked data from a statewide census of hospitalists with data collected as part of a hospital quality‐reporting initiative.
Materials and Methods
Study Sites
We examined the performance of 209 hospitals (63% of all 334 non‐federal facilities in California) participating in the California Hospital Assessment and Reporting Taskforce (CHART) at the time of the survey. CHART is a voluntary quality reporting initiative that began publicly reporting hospital quality data in January 2006.
Hospital‐level Organizational, Case‐mix, and Quality Data
Hospital organizational characteristics (eg, bed size) were obtained from publicly available discharge and utilization data sets from the California Office of Statewide Health Planning and Development (OSHPD). We also linked hospital‐level patient‐mix data (eg, race) from these OSHPD files.
We obtained quality of care data from CHART for January 2006 through June 2007, the time period corresponding to the survey. Quality metrics included 16 measures collected by the Center for Medicare and Medicaid Services (www.cms.hhs.gov) and extensively used in quality research.1, 4, 13, 15‐17 Rather than define a single measure, we examined multiple process measures, anticipating differential impacts of hospitalists on various processes of care for AMI, CHF, and pneumonia. Measures were further divided among those that are usually measured upon initial presentation to the hospital and those that are measured throughout the entire hospitalization and discharge. This division reflects the division of care in the hospital, where emergency room physicians are likely to have a more critical role for admission processes.
Survey Process
We surveyed all nonfederal, acute care hospitals in California that participated in CHART.2 We first identified contacts at each site via professional society mailing lists. We then sent web‐based surveys to all with available email addresses and a fax/paper survey to the remainder. We surveyed individuals between October 2006 and April 2007 and repeated the process at intervals of 1 to 3 weeks. For remaining nonrespondents, we placed a direct call unless consent to survey had been specifically refused. We contacted the following persons in sequence: (1) hospital executives or administrative leaders; (2) hospital medicine department leaders; (3) admitting emergency room personnel or medical staff officers; and (4) hospital website information. In the case of multiple responses with disagreement, the hospital/hospitalist leader's response was treated as the primary source. At each step, respondents were asked to answer questions only if they had a direct working knowledge of their hospitalist services.
Survey Data
Our key survey question to all respondents included whether the respondents could confirm their hospitals had at least one hospitalist medicine group. Hospital leaders were also asked to participate in a more comprehensive survey of their organizational and clinical characteristics. Within the comprehensive survey, leaders also provided estimates of the percent of general medical patients admitted by hospitalists. This measure, used in prior surveys of hospital leaders,9 was intended to be an easily understood approximation of the intensity of hospitalist utilization in any given hospital. A more rigorous, direct measure was not feasible due to the complexity of obtaining admission data over such a large, diverse set of hospitals.
Process Performance Measures
AMI measures assessed at admission included aspirin and ‐blocker administration within 24 hours of arrival. AMI measures assessed at discharge included aspirin administration, ‐blocker administration, angiotensin converting enzyme inhibitor (ACE‐I) (or angiotensin receptor blocker [ARB]) administration for left ventricular (LV) dysfunction, and smoking cessation counseling. There were no CHF admission measures. CHF discharge measures included assessment of LV function, the use of an ACE‐I or ARB for LV dysfunction, and smoking cessation counseling. Pneumonia admission measures included the drawing of blood cultures prior to the receipt of antibiotics, timely administration of initial antibiotics (<8 hours), and antibiotics consistent with recommendations. Pneumonia discharge measures included pneumococcal vaccination, flu vaccination, and smoking cessation counseling.
For each performance measure, we quantified the percentage of missed quality opportunities, defined as the number of patients who did not receive a care process divided by the number of eligible patients, multiplied by 100. In addition, we calculated composite scores for admission and discharge measures across each condition. We summed the numerators and denominators of individual performance measures to generate a disease‐specific composite numerator and denominator. Both individual and composite scores were produced using methodology outlined by the Center for Medicare & Medicaid Services.18 In order to retain as representative a sample of hospitals as possible, we calculated composite scores for hospitals that had a minimum of 25 observations in at least 2 of the quality indicators that made up each composite score.
Statistical Analysis
We used chi‐square tests, Student t tests, and Mann‐Whitney tests, where appropriate, to compare hospital‐level characteristics of hospitals that utilized hospitalists vs. those that did not. Similar analyses were performed among the subset of hospitals that utilized hospitalists. Among this subgroup of hospitals, we compared hospital‐level characteristics between hospitals that provided information regarding the percent of patients admitted by hospitalists vs. those who did not provide this information.
We used multivariable, generalized linear regression models to assess the relationship between having at least 1 hospitalist group and the percentage of missed quality of care measures. Because percentages were not normally distributed (ie, a majority of hospitals had few missed opportunities, while a minority had many), multivariable models employed log‐link functions with a gamma distribution.19, 20 Coefficients for our key predictor (presence of hospitalists) were transformed back to the original units (percentage of missed quality opportunities) so that a positive coefficient represented a higher number of quality measures missed relative to hospitals without hospitalists. Models were adjusted for factors previously reported to be associated with care quality. Hospital organizational characteristics included the number of beds, teaching status, registered nursing (RN) hours per adjusted patient day, and hospital ownership (for‐profit vs. not‐for‐profit). Hospital patient mix factors included annual percentage of admissions by insurance status (Medicare, Medicaid, other), annual percentage of admissions by race (white vs. nonwhite), annual percentage of do‐not‐resuscitate status at admission, and mean diagnosis‐related group‐based case‐mix index.21 We additionally adjusted for the number of cardiac catheterizations, a measure that moderately correlates with the number of cardiologists and technology utilization.22‐24 In our subset analysis among those hospitals with hospitalists, our key predictor for regression analyses was the percentage of patients admitted by hospitalists. For ease of interpretation, the percentage of patients admitted by hospitalists was centered on the mean across all respondent hospitals, and we report the effect of increasing by 10% the percentage of patients admitted by hospitalists. Models were adjusted for the same hospital organizational characteristics listed above. For those models, a positive coefficient also meant a higher number of measures missed.
For both sets of predictors, we additionally tested for the presence of interactions between the predictors and hospital bed size (both continuous as well as dichotomized at 150 beds) in composite measure performance, given the possibility that any hospitalist effect may be greater among smaller, resource‐limited hospitals. Tests for interaction were performed with the likelihood ratio test. In addition, to minimize any potential bias or loss of power that might result from limiting the analysis to hospitals with complete data, we used the multivariate imputation by chained equations method, as implemented in STATA 9.2 (StataCorp, College Station, TX), to create 10 imputed datasets.25 Imputation of missing values was restricted to confounding variables. Standard methods were then used to combine results over the 10 imputed datasets. We also applied Bonferroni corrections to composite measure tests based on the number of composites generated (n = 5). Thus, for the 5 inpatient composites created, standard definitions of significance (P 0.05) were corrected by dividing composite P values by 5, requiring P 0.01 for significance. The institutional review board of the University of California, San Francisco, approved the study. All analyses were performed using STATA 9.2.
Results
Characteristics of Participating Sites
There were 209 eligible hospitals. All 209 (100%) hospitals provided data about the presence or absence of hospitalists via at least 1 of our survey strategies. The majority of identification of hospitalist utilization was via contact with either hospital or hospitalist leaders, n = 147 (70.3%). Web‐sites informed hospitalist prevalence in only 3 (1.4%) hospitals. There were 8 (3.8%) occurrences of disagreement between sources, all of which had available hospital/hospitalist leader responses. Only 1 (0.5%) hospital did not have the minimum 25 patients eligible for any disease‐specific quality measures during the data reporting period. Collectively, the remaining 208 hospitals accounted for 81% of California's acute care hospital population.
Comparisons of Sites With Hospitalists and Those Without
A total of 170 hospitals (82%) participating in CHART used hospitalists. Hospitals with and without hospitalists differed by a variety of characteristics (Table 1). Sites with hospitalists were larger, less likely to be for‐profit, had more registered nursing hours per day, and performed more cardiac catheterizations.
| Characteristic | Hospitals Without Hospitalists (n = 38) | Hospitals With Hospitalists (n = 170) | P Value* |
|---|---|---|---|
| |||
| Number of beds, n (% of hospitals) | <0.001 | ||
| 0‐99 | 16 (42.1) | 14 (8.2) | |
| 100‐199 | 8 (21.1) | 44 (25.9) | |
| 200‐299 | 7 (18.4) | 42 (24.7) | |
| 300+ | 7 (18.4) | 70 (41.2) | |
| For profit, n (% of hospitals) | 9 (23.7) | 18 (10.6) | 0.03 |
| Teaching hospital, n (% of hospitals) | 7 (18.4) | 55 (32.4) | 0.09 |
| RN hours per adjusted patient day, number of hours (IQR) | 7.4 (5.7‐8.6) | 8.5 (7.4‐9.9) | <0.001 |
| Annual cardiac catheterizations, n (IQR) | 0 (0‐356) | 210 (0‐813) | 0.007 |
| Hospital total census days, n (IQR) | 37161 (14910‐59750) | 60626 (34402‐87950) | <0.001 |
| ICU total census, n (IQR) | 2193 (1132‐4289) | 3855 (2489‐6379) | <0.001 |
| Medicare insurance, % patients (IQR) | 36.9 (28.5‐48.0) | 35.3(28.2‐44.3) | 0.95 |
| Medicaid insurance, % patients (IQR) | 21.0 (12.7‐48.3) | 16.6 (5.6‐27.6) | 0.02 |
| Race, white, % patients (IQR) | 53.7 (26.0‐82.7) | 59.1 (45.6‐74.3) | 0.73 |
| DNR at admission, % patients (IQR) | 3.6 (2.0‐6.4) | 4.4 (2.7‐7.1) | 0.12 |
| Case‐mix index, index (IQR) | 1.05 (0.90‐1.21) | 1.13 (1.01‐1.26) | 0.11 |
Relationship Between Hospitalist Group Utilization and the Percentage of Missed Quality Opportunities
Table 2 shows the frequency of missed quality opportunities in sites with hospitalists compared to those without. In general, for both individual and composite measures of quality, multivariable adjustment modestly attenuated the observed differences between the 2 groups of hospitals. We present only the more conservative adjusted estimates.
| Quality Measure | Number of Hospitals | Adjusted Mean % Missed Quality Opportunities (95% CI) | Difference With Hospitalists | Relative % Change | P Value | |
|---|---|---|---|---|---|---|
| Hospitals Without Hospitalists | Hospitals With Hospitalists | |||||
| ||||||
| Acute myocardial infarction | ||||||
| Admission measures | ||||||
| Aspirin at admission | 193 | 3.7 (2.4‐5.1) | 3.4 (2.3‐4.4) | 0.3 | 10.0 | 0.44 |
| Beta‐blocker at admission | 186 | 7.8 (4.7‐10.9) | 6.4 (4.4‐8.3) | 1.4 | 18.3 | 0.19 |
| AMI admission composite | 186 | 5.5 (3.6‐7.5) | 4.8 (3.4‐6.1) | 0.7 | 14.3 | 0.26 |
| Hospital/discharge measures | ||||||
| Aspirin at discharge | 173 | 7.5 (4.5‐10.4) | 5.2 (3.4‐6.9) | 2.3 | 31.0 | 0.02 |
| Beta‐blocker at discharge | 179 | 6.6 (3.8‐9.4) | 5.9 (3.6‐8.2) | 0.7 | 9.6 | 0.54 |
| ACE‐I/ARB at discharge | 119 | 20.7 (9.5‐31.8) | 11.8 (6.6‐17.0) | 8.9 | 43.0 | 0.006 |
| Smoking cessation counseling | 193 | 3.8 (2.4‐5.1) | 3.4 (2.4‐4.4) | 0.4 | 10.0 | 0.44 |
| AMI hospital/discharge composite | 179 | 6.4 (4.1‐8.6) | 5.3 (3.7‐6.8) | 1.1 | 17.6 | 0.16 |
| Congestive heart failure | ||||||
| Hospital/discharge measures | ||||||
| Ejection fraction assessment | 208 | 12.6 (7.7‐17.6) | 6.5 (4.6‐8.4) | 6.1 | 48.2 | <0.001 |
| ACE‐I/ARB at discharge | 201 | 14.7 (10.0‐19.4) | 12.9 (9.8‐16.1) | 1.8 | 12.1 | 0.31 |
| Smoking cessation counseling | 168 | 9.1 (2.9‐15.4) | 9.0 (4.2‐13.8) | 0.1 | 1.8 | 0.98 |
| CHF hospital/discharge composite | 201 | 12.2 (7.9‐16.5) | 8.2 (6.2‐10.2) | 4.0 | 33.1 | 0.006* |
| Pneumonia | ||||||
| Admission measures | ||||||
| Blood culture before antibiotics | 206 | 12.0 (9.1‐14.9) | 10.9 (8.8‐13.0) | 1.1 | 9.1 | 0.29 |
| Timing of antibiotics <8 hours | 208 | 5.8 (4.1‐7.5) | 6.2 (4.7‐7.7) | 0.4 | 6.9 | 0.56 |
| Initial antibiotic consistent with recommendations | 207 | 15.0 (11.6‐18.6) | 13.8 (10.9‐16.8) | 1.2 | 8.1 | 0.27 |
| Pneumonia admission composite | 207 | 10.5 (8.5‐12.5) | 9.9 (8.3‐11.5) | 0.6 | 5.9 | 0.37 |
| Hospital/discharge measures | ||||||
| Pneumonia vaccine | 208 | 29.4 (19.5‐39.2) | 27.1 (19.9‐34.3) | 2.3 | 7.7 | 0.54 |
| Influenza vaccine | 207 | 36.9 (25.4‐48.4) | 35.0 (27.0‐43.1) | 1.9 | 5.2 | 0.67 |
| Smoking cessation counseling | 196 | 15.4 (7.8‐23.1) | 13.9 (8.9‐18.9) | 1.5 | 10.2 | 0.59 |
| Pneumonia hospital/discharge composite | 207 | 29.6 (20.5‐38.7) | 27.3 (20.9‐33.6) | 2.3 | 7.8 | 0.51 |
Compared to hospitals without hospitalists, those with hospitalists did not have any statistically significant differences in the individual and composite admission measures for each of the disease processes. In contrast, there were statistically significant differences between hospitalist and nonhospitalist sites for many individual cardiac processes of care that typically occur after admission from the emergency room (ie, LV function assessment for CHF) or those that occurred at discharge (ie, aspirin and ACE‐I/ARB at discharge for AMI). Similarly, the composite discharge scores for AMI and CHF revealed better overall process measure performance at sites with hospitalists, although the AMI composite did not meet statistical significance. There were no statistically significant differences between groups for the pneumonia process measures assessed at discharge. In addition, for composite measures there were no statistically significant interactions between hospitalist prevalence and bed size, although there was a trend (P = 0.06) for the CHF discharge composite, with a larger effect of hospitalists among smaller hospitals.
Percent of Patients Admitted by Hospitalists
Of the 171 hospitals with hospitalists, 71 (42%) estimated the percent of patients admitted by their hospitalist physicians. Among the respondents, the mean and median percentages of medical patients admitted by hospitalists were 51% (SD = 25%) and 49% (IQR = 30‐70%), respectively. Thirty hospitals were above the sample mean. Compared to nonrespondent sites, respondent hospitals took care of more white patients; otherwise, respondent and nonrespondent hospitals were similar in terms of bed size, location, performance across each measure, and other observable characteristics (Supporting Information, Appendix 1).
Relationship Between the Estimated Percentages of Medical Patients Admitted by Hospitalists and Missed Quality Opportunities
Table 3 displays the change in missed quality measures associated with each additional 10% of patients estimated to be admitted by hospitalists. A higher estimated percentage of patients admitted by hospitalists was associated with statistically significant improvements in quality of care across a majority of individual measures and for all composite discharge measures regardless of condition. For example, every 10% increase in the mean estimated number of patients admitted by hospitalists was associated with a mean of 0.6% (P < 0.001), 0.5% (P = 0.004), and 1.5% (P = 0.006) fewer missed quality opportunities for AMI, CHF, and pneumonia discharge process measures composites, respectively. In addition, for these composite measures, there were no statistically significant interactions between the estimated percentage of patients admitted by hospitalists and bed size (dichotomized at 150 beds), although there was a trend (P = 0.09) for the AMI discharge composite, with a larger effect of hospitalists among smaller hospitals.
| Quality Measure | Number of Hospitals | Adjusted % Missed Quality Opportunities (95% CI) | Difference With Hospitalists | Relative Percent Change | P Value | |
|---|---|---|---|---|---|---|
| Among Hospitals With Mean % of Patients Admitted by Hospitalists | Among Hospitals With Mean + 10% of Patients Admitted by Hospitalists | |||||
| ||||||
| Acute myocardial infarction | ||||||
| Admission measures | ||||||
| Aspirin at admission | 70 | 3.4 (2.3‐4.6) | 3.1 (2.0‐3.1) | 0.3 | 10.2 | 0.001 |
| Beta‐blocker at admission | 65 | 5.8 (3.4‐8.2) | 5.1 (3.0‐7.3) | 0.7 | 11.9 | <0.001 |
| AMI admission composite | 65 | 4.5 (2.9‐6.1) | 4.0 (2.6‐5.5) | 0.5 | 11.1 | <0.001* |
| Hospital/discharge measures | ||||||
| Aspirin at discharge | 62 | 5.1 (3.3‐6.9) | 4.6 (3.1‐6.2) | 0.5 | 9.0 | 0.03 |
| Beta‐blocker at discharge | 63 | 5.1 (2.9‐7.2) | 4.3 (2.5‐6.0) | 0.8 | 15.4 | <0.001 |
| ACE‐I/ARB at discharge | 44 | 11.4 (6.2‐16.6) | 10.3 (5.4‐15.1) | 1.1 | 10.0 | 0.02 |
| Smoking cessation counseling | 70 | 3.4 (2.3‐4.6) | 3.1 (2.0‐4.1) | 0.3 | 10.2 | 0.001 |
| AMI hospital/discharge composite | 63 | 5.0 (3.3‐6.7) | 4.4 (3.0‐5.8) | 0.6 | 11.3 | 0.001* |
| Congestive heart failure | ||||||
| Hospital/discharge measures | ||||||
| Ejection fraction assessment | 71 | 5.9 (4.1‐7.6) | 5.6 (3.9‐7.2) | 0.3 | 2.9 | 0.07 |
| ACE‐I/ARB at discharge | 70 | 12.3 (8.6‐16.0) | 11.4 (7.9‐15.0) | 0.9 | 7.1 | 0.008* |
| Smoking cessation counseling | 56 | 8.4 (4.1‐12.6) | 8.2 (4.2‐12.3) | 0.2 | 1.7 | 0.67 |
| CHF hospital/discharge composite | 70 | 7.7 (5.8‐9.6) | 7.2 (5.4‐9.0) | 0.5 | 6.0 | 0.004* |
| Pneumonia | ||||||
| Admission measures | ||||||
| Timing of antibiotics <8 hours | 71 | 5.9 (4.2‐7.6) | 5.9 (4.1‐7.7) | 0.0 | 0.0 | 0.98 |
| Blood culture before antibiotics | 71 | 10.0 (8.0‐12.0) | 9.8 (7.7‐11.8) | 0.2 | 2.6 | 0.18 |
| Initial antibiotic consistent with recommendations | 71 | 13.3 (10.4‐16.2) | 12.9 (9.9‐15.9) | 0.4 | 2.8 | 0.20 |
| Pneumonia admission composite | 71 | 9.4 (7.7‐11.1) | 9.2 (7.6‐10.9) | 0.2 | 1.8 | 0.23 |
| Hospital/discharge measures | ||||||
| Pneumonia vaccine | 71 | 27.0 (19.2‐34.8) | 24.7 (17.2‐32.2) | 2.3 | 8.4 | 0.006 |
| Influenza vaccine | 71 | 34.1 (25.9‐42.2) | 32.6 (24.7‐40.5) | 1.5 | 4.3 | 0.03 |
| Smoking cessation counseling | 67 | 15.2 (9.8‐20.7) | 15.0 (9.6‐20.4) | 0.2 | 2.0 | 0.56 |
| Pneumonia hospital/discharge composite | 71 | 26.7 (20.3‐33.1) | 25.2 (19.0‐31.3) | 1.5 | 5.8 | 0.006* |
In order to test the robustness of our results, we carried out 2 secondary analyses. First, we used multivariable models to generate a propensity score representing the predicted probability of being assigned to a hospital with hospitalists. We then used the propensity score as an additional covariate in subsequent multivariable models. In addition, we performed a complete‐case analysis (including only hospitals with complete data, n = 204) as a check on the sensitivity of our results to missing data. Neither analysis produced results substantially different from those presented.
Discussion
In this cross‐sectional analysis of hospitals participating in a voluntary quality reporting initiative, hospitals with at least 1 hospitalist group had fewer missed discharge care process measures for CHF, even after adjusting for hospital‐level characteristics. In addition, as the estimated percentage of patients admitted by hospitalists increased, the percentage of missed quality opportunities decreased across all measures. The observed relationships were most apparent for measures that could be completed at any time during the hospitalization and at discharge. While it is likely that hospitalists are a marker of a hospital's ability to invest in systems (and as a result, care improvement initiatives), the presence of a potential dose‐response relationship suggests that hospitalists themselves may have a role in improving processes of care.
Our study suggests a generally positive, but mixed, picture of hospitalists' effects on quality process measure performance. Lack of uniformity across measures may depend on the timing of the process measure (eg, whether or not the process is measured at admission or discharge). For example, in contrast to admission process measures, we more commonly observed a positive association between hospitalists and care quality on process measures targeting processes that generally took place later in hospitalization or at discharge. Many admission process measures (eg, door to antibiotic time, blood cultures, and appropriate initial antibiotics) likely occurred prior to hospitalist involvement in most cases and were instead under the direction of emergency medicine physicians. Performance on these measures would not be expected to relate to use of hospitalists, and that is what we observed.
In addition to the timing of when a process was measured or took place, associations between hospitalists and care quality vary by disease. The apparent variation in impact of hospitalists by disease (more impact for cardiac conditions, less for pneumonia) may relate primarily to the characteristics of the processes of care that were measured for each condition. For example, one‐half of the pneumonia process measures related to care occurring within a few hours of admission, while the other one‐half (smoking cessation advice and streptococcal and influenza vaccines) were often administered per protocol or by nonphysician providers.26‐29 However, more of the cardiac measures required physician action (eg, prescription of an ACE‐I at discharge). Alternatively, unmeasured confounders important in the delivery of cardiac care might play an important role in the relationship between hospitalists and cardiac process measure performance.
Our approach to defining hospitalists bears mention as well. While a dichotomous measure of having hospitalists available was only statistically significant for the single CHF discharge composite measure, our measure of hospitalist availabilitythe percentage of patients admitted by hospitalistswas more strongly associated with a larger number of quality measures. Contrast between the dichotomous and continuous measures may have statistical explanations (the power to see differences between 2 groups is more limited with use of a binary predictor, which itself can be subject to bias),30 but may also indicate a dose‐response relationship. A larger number of admissions to hospitalists may help standardize practices, as care is concentrated in a smaller number of physicians' hands. Moreover, larger hospitalist programs may be more likely to have implemented care standardization or quality improvement processes or to have been incorporated into (or lead) hospitals' quality infrastructures. Finally, presence of larger hospitalist groups may be a marker for a hospital's capacity to make hospital‐wide investments in improvement. However, the association between the percentage of patients admitted by hospitalists and care quality persisted even after adjustment for many measures plausibly associated with ability to invest in care quality.
Our study has several limitations. First, although we used a widely accepted definition of hospitalists endorsed by the Society of Hospital Medicine, there are no gold standard definitions for a hospitalist's job description or skill set. As a result, it is possible that a model utilizing rotating internists (from a multispecialty group) might have been misidentified as a hospitalist model. Second, our findings represent a convenience sample of hospitals in a voluntary reporting initiative (CHART) and may not be applicable to hospitals that are less able to participate in such an endeavor. CHART hospitals are recognized to be better performers than the overall California population of hospitals, potentially decreasing variability in our quality of care measures.2 Third, there were significant differences between our comparison groups within the CHART hospitals, including sample size. Although we attempted to adjust our analyses for many important potential confounders and applied conservative measures to assess statistical significance, given the baseline differences, we cannot rule out the possibility of residual confounding by unmeasured factors. Fourth, as described above, this observational study cannot provide robust evidence to support conclusions regarding causality. Fifth, the estimation of the percent of patients admitted by hospitalists is unvalidated and based upon self‐reported and incomplete (41% of respondents) data. We are somewhat reassured by the fact that respondents and nonresponders were similar across all hospital characteristics, as well as outcomes. Sixth, misclassification of the estimated percentage of patients admitted by hospitalists may have influenced our results. Although possible, misclassification often biases results toward the null, potentially weakening any observed association. Given that our respondents were not aware of our hypotheses, there is no reason to expect recall issues to bias the results one way or the other. Finally, for many performance measures, overall performance was excellent among all hospitals (eg, aspirin at admission) with limited variability, thus limiting the ability to assess for differences.
In summary, in a large, cross‐sectional study of California hospitals participating in a voluntary quality reporting initiative, the presence of hospitalists was associated with modest improvements in hospital‐level performance of quality process measures. In addition, we found a relationship between the percentage of patients admitted by hospitalists and improved process measure adherence. Although we cannot determine causality, our data support the hypothesis that dedicated hospital physicians can positively affect the quality of care. Future research should examine this relationship in other settings and should address causality using broader measures of quality including both processes and outcomes.
Acknowledgements
The authors acknowledge Teresa Chipps, BS, Center for Health Services Research, Division of General Internal Medicine and Public Health, Department of Medicine, Vanderbilt University, Nashville, TN, for her administrative and editorial assistance in the preparation of this manuscript.
- ,,,.Care in U.S. hospitals—the Hospital Quality Alliance Program.N Engl J Med.2005;353:265–274.
- CalHospitalCompare.org: online report card simplifies the search for quality hospital care. Available at: http://www.chcf.org/topics/hospitals/index.cfm?itemID=131387. Accessed September 2009.
- ,,, et al.Hospital characteristics and quality of care.JAMA.1992;268:1709–1714.
- ,,,,.Patient and hospital characteristics associated with recommended processes of care for elderly patients hospitalized with pneumonia: results from the Medicare quality indicator system pneumonia module.Arch Intern Med.2002;162:827–833.
- ,,, et al.A systematic review and meta‐analysis of studies comparing mortality rates of private for‐profit and private not‐for‐profit hospitals.CMAJ.2002;166:1399–1406.
- ,.Teaching hospitals and quality of care: a review of the literature.Milbank Q.2002;80:569–593.
- ,,,,.Nurse‐staffing levels and the quality of care in hospitals.N Engl J Med.2002;346:1715–1722.
- ,,,.Growth in the care of older patients by hospitalists in the United States.N Engl J Med.2009;360:1102–1112.
- ,,,.Health care market trends and the evolution of hospitalist use and roles.J Gen Intern Med.2005;20:101–107.
- ,,,.Comparison of processes and outcomes of pneumonia care between hospitalists and community‐based primary care physicians.Mayo Clin Proc.2002;77:1053–1058.
- ,,,.Comparison of hospitalists and nonhospitalists regarding core measures of pneumonia care.Am J Manag Care.2007;13:129–132.
- ,,.Comparison of practice patterns of hospitalists and community physicians in the care of patients with congestive heart failure.J Hosp Med.2008;3:35–41.
- ,,, et al.Quality of care for decompensated heart failure: comparable performance between academic hospitalists and non‐hospitalists.J Gen Intern Med.2008;23:1399–1406.
- ,,,,.Quality of care for patients hospitalized with heart failure: assessing the impact of hospitalists.Arch Intern Med.2002;162:1251–1256.
- ,,,.The inverse relationship between mortality rates and performance in the Hospital Quality Alliance measures.Health Aff.2007;26:1104–1110.
- ,,,,.Does the Leapfrog program help identify high‐quality hospitals?Jt Comm J Qual Patient Saf.2008;34:318–325.
- ,,,,,.Outcomes of care by hospitalists, general internists, and family physicians.N Engl J Med.2007;357:2589–2600.
- CMS HQI demonstration project—composite quality score methodology overview. Available at: http://www.cms.hhs.gov/HospitalQualityInits/downloads/HospitalCompositeQualityScoreMethodologyOverview.pdf. Accessed September 2009.
- ,,.Modeling risk using generalized linear models.J Health Econ.1999;18:153–171.
- ,,.Generalized modeling approaches to risk adjustment of skewed outcomes data.J Health Econ.2005;24:465–488.
- ,,, et al.Quality of care for the treatment of acute medical conditions in US hospitals.Arch Intern Med.2006;166:2511–2517.
- ,,, et al.The Dartmouth Atlas of Cardiovascular Health Care.Chicago:AHA Press;1999. Current data from the Dartmouth Institute for Health Policy and Clinical Practice, Lebanon, NH. Available at: http://www.dartmouthatlas.org/atlases/atlas_ series.shtm. Accessed September 2009.
- ,,.Differences in per capita rates of revascularization and in choice of revascularization procedure for eleven states.BMC Health Serv Res.2006;6:35.
- ,,.The relationship between physician supply, cardiovascular health service use and cardiac disease burden in Ontario: supply‐need mismatch.Can J Card.2008;24:187.
- .Multiple imputation: a primer.Stat Methods Med Res.1999;8:3–15.
- .Nursing intervention and smoking cessation: Meta‐analysis update.Heart Lung.2006;35:147–163.
- .Ten‐year durability and success of an organized program to increase influenza and pneumococcal vaccination rates among high‐risk adults.Am J Med.1998;105:385–392.
- ,,, et al.Role of student pharmacist interns in hospital‐based standing orders pneumococcal vaccination program.J Am Pharm Assoc.2007;47:404–409.
- ,,,.Effect of a pharmacist‐managed program of pneumococcal and influenza immunization on vaccination rates among adult inpatients.Am J Health Syst Pharm.2003;60:1767–1771.
- ,,.Dichotomizing continuous predictors in multiple regression: a bad idea.Stat Med.2006;25:127–141.
Quality of care in US hospitals is inconsistent and often below accepted standards.1 This observation has catalyzed a number of performance measurement initiatives intended to publicize gaps and spur quality improvement.2 As the field has evolved, organizational factors such as teaching status, ownership model, nurse staffing levels, and hospital volume have been found to be associated with performance on quality measures.1, 3‐7 Hospitalists represent a more recent change in the organization of inpatient care8 that may impact hospital‐level performance. In fact, most hospitals provide financial support to hospitalists, not only for hopes of improving efficiency, but also for improving quality and safety.9
Only a few single‐site studies have examined the impact of hospitalists on quality of care for common medical conditions (ie, pneumonia, congestive heart failure, and acute myocardial infarction), and each has focused on patient‐level effects. Rifkin et al.10, 11 did not find differences between hospitalists' and nonhospitalists' patients in terms of pneumonia process measures. Roytman et al.12 found hospitalists more frequently prescribed afterload‐reducing agents for congestive heart failure (CHF), but other studies have shown no differences in care quality for heart failure.13, 14 Importantly, no studies have examined the role of hospitalists in the care of patients with acute myocardial infarction (AMI). In addition, studies have not addressed the effect of hospitalists at the hospital level to understand whether hospitalists have broader system‐level effects reflected by overall hospital performance.
We hypothesized that the presence of hospitalists within a hospital would be associated with improvements in hospital‐level adherence to publicly reported quality process measures, and having a greater percentage of patients admitted by hospitalists would be associated with improved performance. To test these hypotheses, we linked data from a statewide census of hospitalists with data collected as part of a hospital quality‐reporting initiative.
Materials and Methods
Study Sites
We examined the performance of 209 hospitals (63% of all 334 non‐federal facilities in California) participating in the California Hospital Assessment and Reporting Taskforce (CHART) at the time of the survey. CHART is a voluntary quality reporting initiative that began publicly reporting hospital quality data in January 2006.
Hospital‐level Organizational, Case‐mix, and Quality Data
Hospital organizational characteristics (eg, bed size) were obtained from publicly available discharge and utilization data sets from the California Office of Statewide Health Planning and Development (OSHPD). We also linked hospital‐level patient‐mix data (eg, race) from these OSHPD files.
We obtained quality of care data from CHART for January 2006 through June 2007, the time period corresponding to the survey. Quality metrics included 16 measures collected by the Center for Medicare and Medicaid Services (www.cms.hhs.gov) and extensively used in quality research.1, 4, 13, 15‐17 Rather than define a single measure, we examined multiple process measures, anticipating differential impacts of hospitalists on various processes of care for AMI, CHF, and pneumonia. Measures were further divided among those that are usually measured upon initial presentation to the hospital and those that are measured throughout the entire hospitalization and discharge. This division reflects the division of care in the hospital, where emergency room physicians are likely to have a more critical role for admission processes.
Survey Process
We surveyed all nonfederal, acute care hospitals in California that participated in CHART.2 We first identified contacts at each site via professional society mailing lists. We then sent web‐based surveys to all with available email addresses and a fax/paper survey to the remainder. We surveyed individuals between October 2006 and April 2007 and repeated the process at intervals of 1 to 3 weeks. For remaining nonrespondents, we placed a direct call unless consent to survey had been specifically refused. We contacted the following persons in sequence: (1) hospital executives or administrative leaders; (2) hospital medicine department leaders; (3) admitting emergency room personnel or medical staff officers; and (4) hospital website information. In the case of multiple responses with disagreement, the hospital/hospitalist leader's response was treated as the primary source. At each step, respondents were asked to answer questions only if they had a direct working knowledge of their hospitalist services.
Survey Data
Our key survey question to all respondents included whether the respondents could confirm their hospitals had at least one hospitalist medicine group. Hospital leaders were also asked to participate in a more comprehensive survey of their organizational and clinical characteristics. Within the comprehensive survey, leaders also provided estimates of the percent of general medical patients admitted by hospitalists. This measure, used in prior surveys of hospital leaders,9 was intended to be an easily understood approximation of the intensity of hospitalist utilization in any given hospital. A more rigorous, direct measure was not feasible due to the complexity of obtaining admission data over such a large, diverse set of hospitals.
Process Performance Measures
AMI measures assessed at admission included aspirin and ‐blocker administration within 24 hours of arrival. AMI measures assessed at discharge included aspirin administration, ‐blocker administration, angiotensin converting enzyme inhibitor (ACE‐I) (or angiotensin receptor blocker [ARB]) administration for left ventricular (LV) dysfunction, and smoking cessation counseling. There were no CHF admission measures. CHF discharge measures included assessment of LV function, the use of an ACE‐I or ARB for LV dysfunction, and smoking cessation counseling. Pneumonia admission measures included the drawing of blood cultures prior to the receipt of antibiotics, timely administration of initial antibiotics (<8 hours), and antibiotics consistent with recommendations. Pneumonia discharge measures included pneumococcal vaccination, flu vaccination, and smoking cessation counseling.
For each performance measure, we quantified the percentage of missed quality opportunities, defined as the number of patients who did not receive a care process divided by the number of eligible patients, multiplied by 100. In addition, we calculated composite scores for admission and discharge measures across each condition. We summed the numerators and denominators of individual performance measures to generate a disease‐specific composite numerator and denominator. Both individual and composite scores were produced using methodology outlined by the Center for Medicare & Medicaid Services.18 In order to retain as representative a sample of hospitals as possible, we calculated composite scores for hospitals that had a minimum of 25 observations in at least 2 of the quality indicators that made up each composite score.
Statistical Analysis
We used chi‐square tests, Student t tests, and Mann‐Whitney tests, where appropriate, to compare hospital‐level characteristics of hospitals that utilized hospitalists vs. those that did not. Similar analyses were performed among the subset of hospitals that utilized hospitalists. Among this subgroup of hospitals, we compared hospital‐level characteristics between hospitals that provided information regarding the percent of patients admitted by hospitalists vs. those who did not provide this information.
We used multivariable, generalized linear regression models to assess the relationship between having at least 1 hospitalist group and the percentage of missed quality of care measures. Because percentages were not normally distributed (ie, a majority of hospitals had few missed opportunities, while a minority had many), multivariable models employed log‐link functions with a gamma distribution.19, 20 Coefficients for our key predictor (presence of hospitalists) were transformed back to the original units (percentage of missed quality opportunities) so that a positive coefficient represented a higher number of quality measures missed relative to hospitals without hospitalists. Models were adjusted for factors previously reported to be associated with care quality. Hospital organizational characteristics included the number of beds, teaching status, registered nursing (RN) hours per adjusted patient day, and hospital ownership (for‐profit vs. not‐for‐profit). Hospital patient mix factors included annual percentage of admissions by insurance status (Medicare, Medicaid, other), annual percentage of admissions by race (white vs. nonwhite), annual percentage of do‐not‐resuscitate status at admission, and mean diagnosis‐related group‐based case‐mix index.21 We additionally adjusted for the number of cardiac catheterizations, a measure that moderately correlates with the number of cardiologists and technology utilization.22‐24 In our subset analysis among those hospitals with hospitalists, our key predictor for regression analyses was the percentage of patients admitted by hospitalists. For ease of interpretation, the percentage of patients admitted by hospitalists was centered on the mean across all respondent hospitals, and we report the effect of increasing by 10% the percentage of patients admitted by hospitalists. Models were adjusted for the same hospital organizational characteristics listed above. For those models, a positive coefficient also meant a higher number of measures missed.
For both sets of predictors, we additionally tested for the presence of interactions between the predictors and hospital bed size (both continuous as well as dichotomized at 150 beds) in composite measure performance, given the possibility that any hospitalist effect may be greater among smaller, resource‐limited hospitals. Tests for interaction were performed with the likelihood ratio test. In addition, to minimize any potential bias or loss of power that might result from limiting the analysis to hospitals with complete data, we used the multivariate imputation by chained equations method, as implemented in STATA 9.2 (StataCorp, College Station, TX), to create 10 imputed datasets.25 Imputation of missing values was restricted to confounding variables. Standard methods were then used to combine results over the 10 imputed datasets. We also applied Bonferroni corrections to composite measure tests based on the number of composites generated (n = 5). Thus, for the 5 inpatient composites created, standard definitions of significance (P 0.05) were corrected by dividing composite P values by 5, requiring P 0.01 for significance. The institutional review board of the University of California, San Francisco, approved the study. All analyses were performed using STATA 9.2.
Results
Characteristics of Participating Sites
There were 209 eligible hospitals. All 209 (100%) hospitals provided data about the presence or absence of hospitalists via at least 1 of our survey strategies. The majority of identification of hospitalist utilization was via contact with either hospital or hospitalist leaders, n = 147 (70.3%). Web‐sites informed hospitalist prevalence in only 3 (1.4%) hospitals. There were 8 (3.8%) occurrences of disagreement between sources, all of which had available hospital/hospitalist leader responses. Only 1 (0.5%) hospital did not have the minimum 25 patients eligible for any disease‐specific quality measures during the data reporting period. Collectively, the remaining 208 hospitals accounted for 81% of California's acute care hospital population.
Comparisons of Sites With Hospitalists and Those Without
A total of 170 hospitals (82%) participating in CHART used hospitalists. Hospitals with and without hospitalists differed by a variety of characteristics (Table 1). Sites with hospitalists were larger, less likely to be for‐profit, had more registered nursing hours per day, and performed more cardiac catheterizations.
| Characteristic | Hospitals Without Hospitalists (n = 38) | Hospitals With Hospitalists (n = 170) | P Value* |
|---|---|---|---|
| |||
| Number of beds, n (% of hospitals) | <0.001 | ||
| 0‐99 | 16 (42.1) | 14 (8.2) | |
| 100‐199 | 8 (21.1) | 44 (25.9) | |
| 200‐299 | 7 (18.4) | 42 (24.7) | |
| 300+ | 7 (18.4) | 70 (41.2) | |
| For profit, n (% of hospitals) | 9 (23.7) | 18 (10.6) | 0.03 |
| Teaching hospital, n (% of hospitals) | 7 (18.4) | 55 (32.4) | 0.09 |
| RN hours per adjusted patient day, number of hours (IQR) | 7.4 (5.7‐8.6) | 8.5 (7.4‐9.9) | <0.001 |
| Annual cardiac catheterizations, n (IQR) | 0 (0‐356) | 210 (0‐813) | 0.007 |
| Hospital total census days, n (IQR) | 37161 (14910‐59750) | 60626 (34402‐87950) | <0.001 |
| ICU total census, n (IQR) | 2193 (1132‐4289) | 3855 (2489‐6379) | <0.001 |
| Medicare insurance, % patients (IQR) | 36.9 (28.5‐48.0) | 35.3(28.2‐44.3) | 0.95 |
| Medicaid insurance, % patients (IQR) | 21.0 (12.7‐48.3) | 16.6 (5.6‐27.6) | 0.02 |
| Race, white, % patients (IQR) | 53.7 (26.0‐82.7) | 59.1 (45.6‐74.3) | 0.73 |
| DNR at admission, % patients (IQR) | 3.6 (2.0‐6.4) | 4.4 (2.7‐7.1) | 0.12 |
| Case‐mix index, index (IQR) | 1.05 (0.90‐1.21) | 1.13 (1.01‐1.26) | 0.11 |
Relationship Between Hospitalist Group Utilization and the Percentage of Missed Quality Opportunities
Table 2 shows the frequency of missed quality opportunities in sites with hospitalists compared to those without. In general, for both individual and composite measures of quality, multivariable adjustment modestly attenuated the observed differences between the 2 groups of hospitals. We present only the more conservative adjusted estimates.
| Quality Measure | Number of Hospitals | Adjusted Mean % Missed Quality Opportunities (95% CI) | Difference With Hospitalists | Relative % Change | P Value | |
|---|---|---|---|---|---|---|
| Hospitals Without Hospitalists | Hospitals With Hospitalists | |||||
| ||||||
| Acute myocardial infarction | ||||||
| Admission measures | ||||||
| Aspirin at admission | 193 | 3.7 (2.4‐5.1) | 3.4 (2.3‐4.4) | 0.3 | 10.0 | 0.44 |
| Beta‐blocker at admission | 186 | 7.8 (4.7‐10.9) | 6.4 (4.4‐8.3) | 1.4 | 18.3 | 0.19 |
| AMI admission composite | 186 | 5.5 (3.6‐7.5) | 4.8 (3.4‐6.1) | 0.7 | 14.3 | 0.26 |
| Hospital/discharge measures | ||||||
| Aspirin at discharge | 173 | 7.5 (4.5‐10.4) | 5.2 (3.4‐6.9) | 2.3 | 31.0 | 0.02 |
| Beta‐blocker at discharge | 179 | 6.6 (3.8‐9.4) | 5.9 (3.6‐8.2) | 0.7 | 9.6 | 0.54 |
| ACE‐I/ARB at discharge | 119 | 20.7 (9.5‐31.8) | 11.8 (6.6‐17.0) | 8.9 | 43.0 | 0.006 |
| Smoking cessation counseling | 193 | 3.8 (2.4‐5.1) | 3.4 (2.4‐4.4) | 0.4 | 10.0 | 0.44 |
| AMI hospital/discharge composite | 179 | 6.4 (4.1‐8.6) | 5.3 (3.7‐6.8) | 1.1 | 17.6 | 0.16 |
| Congestive heart failure | ||||||
| Hospital/discharge measures | ||||||
| Ejection fraction assessment | 208 | 12.6 (7.7‐17.6) | 6.5 (4.6‐8.4) | 6.1 | 48.2 | <0.001 |
| ACE‐I/ARB at discharge | 201 | 14.7 (10.0‐19.4) | 12.9 (9.8‐16.1) | 1.8 | 12.1 | 0.31 |
| Smoking cessation counseling | 168 | 9.1 (2.9‐15.4) | 9.0 (4.2‐13.8) | 0.1 | 1.8 | 0.98 |
| CHF hospital/discharge composite | 201 | 12.2 (7.9‐16.5) | 8.2 (6.2‐10.2) | 4.0 | 33.1 | 0.006* |
| Pneumonia | ||||||
| Admission measures | ||||||
| Blood culture before antibiotics | 206 | 12.0 (9.1‐14.9) | 10.9 (8.8‐13.0) | 1.1 | 9.1 | 0.29 |
| Timing of antibiotics <8 hours | 208 | 5.8 (4.1‐7.5) | 6.2 (4.7‐7.7) | 0.4 | 6.9 | 0.56 |
| Initial antibiotic consistent with recommendations | 207 | 15.0 (11.6‐18.6) | 13.8 (10.9‐16.8) | 1.2 | 8.1 | 0.27 |
| Pneumonia admission composite | 207 | 10.5 (8.5‐12.5) | 9.9 (8.3‐11.5) | 0.6 | 5.9 | 0.37 |
| Hospital/discharge measures | ||||||
| Pneumonia vaccine | 208 | 29.4 (19.5‐39.2) | 27.1 (19.9‐34.3) | 2.3 | 7.7 | 0.54 |
| Influenza vaccine | 207 | 36.9 (25.4‐48.4) | 35.0 (27.0‐43.1) | 1.9 | 5.2 | 0.67 |
| Smoking cessation counseling | 196 | 15.4 (7.8‐23.1) | 13.9 (8.9‐18.9) | 1.5 | 10.2 | 0.59 |
| Pneumonia hospital/discharge composite | 207 | 29.6 (20.5‐38.7) | 27.3 (20.9‐33.6) | 2.3 | 7.8 | 0.51 |
Compared to hospitals without hospitalists, those with hospitalists did not have any statistically significant differences in the individual and composite admission measures for each of the disease processes. In contrast, there were statistically significant differences between hospitalist and nonhospitalist sites for many individual cardiac processes of care that typically occur after admission from the emergency room (ie, LV function assessment for CHF) or those that occurred at discharge (ie, aspirin and ACE‐I/ARB at discharge for AMI). Similarly, the composite discharge scores for AMI and CHF revealed better overall process measure performance at sites with hospitalists, although the AMI composite did not meet statistical significance. There were no statistically significant differences between groups for the pneumonia process measures assessed at discharge. In addition, for composite measures there were no statistically significant interactions between hospitalist prevalence and bed size, although there was a trend (P = 0.06) for the CHF discharge composite, with a larger effect of hospitalists among smaller hospitals.
Percent of Patients Admitted by Hospitalists
Of the 171 hospitals with hospitalists, 71 (42%) estimated the percent of patients admitted by their hospitalist physicians. Among the respondents, the mean and median percentages of medical patients admitted by hospitalists were 51% (SD = 25%) and 49% (IQR = 30‐70%), respectively. Thirty hospitals were above the sample mean. Compared to nonrespondent sites, respondent hospitals took care of more white patients; otherwise, respondent and nonrespondent hospitals were similar in terms of bed size, location, performance across each measure, and other observable characteristics (Supporting Information, Appendix 1).
Relationship Between the Estimated Percentages of Medical Patients Admitted by Hospitalists and Missed Quality Opportunities
Table 3 displays the change in missed quality measures associated with each additional 10% of patients estimated to be admitted by hospitalists. A higher estimated percentage of patients admitted by hospitalists was associated with statistically significant improvements in quality of care across a majority of individual measures and for all composite discharge measures regardless of condition. For example, every 10% increase in the mean estimated number of patients admitted by hospitalists was associated with a mean of 0.6% (P < 0.001), 0.5% (P = 0.004), and 1.5% (P = 0.006) fewer missed quality opportunities for AMI, CHF, and pneumonia discharge process measures composites, respectively. In addition, for these composite measures, there were no statistically significant interactions between the estimated percentage of patients admitted by hospitalists and bed size (dichotomized at 150 beds), although there was a trend (P = 0.09) for the AMI discharge composite, with a larger effect of hospitalists among smaller hospitals.
| Quality Measure | Number of Hospitals | Adjusted % Missed Quality Opportunities (95% CI) | Difference With Hospitalists | Relative Percent Change | P Value | |
|---|---|---|---|---|---|---|
| Among Hospitals With Mean % of Patients Admitted by Hospitalists | Among Hospitals With Mean + 10% of Patients Admitted by Hospitalists | |||||
| ||||||
| Acute myocardial infarction | ||||||
| Admission measures | ||||||
| Aspirin at admission | 70 | 3.4 (2.3‐4.6) | 3.1 (2.0‐3.1) | 0.3 | 10.2 | 0.001 |
| Beta‐blocker at admission | 65 | 5.8 (3.4‐8.2) | 5.1 (3.0‐7.3) | 0.7 | 11.9 | <0.001 |
| AMI admission composite | 65 | 4.5 (2.9‐6.1) | 4.0 (2.6‐5.5) | 0.5 | 11.1 | <0.001* |
| Hospital/discharge measures | ||||||
| Aspirin at discharge | 62 | 5.1 (3.3‐6.9) | 4.6 (3.1‐6.2) | 0.5 | 9.0 | 0.03 |
| Beta‐blocker at discharge | 63 | 5.1 (2.9‐7.2) | 4.3 (2.5‐6.0) | 0.8 | 15.4 | <0.001 |
| ACE‐I/ARB at discharge | 44 | 11.4 (6.2‐16.6) | 10.3 (5.4‐15.1) | 1.1 | 10.0 | 0.02 |
| Smoking cessation counseling | 70 | 3.4 (2.3‐4.6) | 3.1 (2.0‐4.1) | 0.3 | 10.2 | 0.001 |
| AMI hospital/discharge composite | 63 | 5.0 (3.3‐6.7) | 4.4 (3.0‐5.8) | 0.6 | 11.3 | 0.001* |
| Congestive heart failure | ||||||
| Hospital/discharge measures | ||||||
| Ejection fraction assessment | 71 | 5.9 (4.1‐7.6) | 5.6 (3.9‐7.2) | 0.3 | 2.9 | 0.07 |
| ACE‐I/ARB at discharge | 70 | 12.3 (8.6‐16.0) | 11.4 (7.9‐15.0) | 0.9 | 7.1 | 0.008* |
| Smoking cessation counseling | 56 | 8.4 (4.1‐12.6) | 8.2 (4.2‐12.3) | 0.2 | 1.7 | 0.67 |
| CHF hospital/discharge composite | 70 | 7.7 (5.8‐9.6) | 7.2 (5.4‐9.0) | 0.5 | 6.0 | 0.004* |
| Pneumonia | ||||||
| Admission measures | ||||||
| Timing of antibiotics <8 hours | 71 | 5.9 (4.2‐7.6) | 5.9 (4.1‐7.7) | 0.0 | 0.0 | 0.98 |
| Blood culture before antibiotics | 71 | 10.0 (8.0‐12.0) | 9.8 (7.7‐11.8) | 0.2 | 2.6 | 0.18 |
| Initial antibiotic consistent with recommendations | 71 | 13.3 (10.4‐16.2) | 12.9 (9.9‐15.9) | 0.4 | 2.8 | 0.20 |
| Pneumonia admission composite | 71 | 9.4 (7.7‐11.1) | 9.2 (7.6‐10.9) | 0.2 | 1.8 | 0.23 |
| Hospital/discharge measures | ||||||
| Pneumonia vaccine | 71 | 27.0 (19.2‐34.8) | 24.7 (17.2‐32.2) | 2.3 | 8.4 | 0.006 |
| Influenza vaccine | 71 | 34.1 (25.9‐42.2) | 32.6 (24.7‐40.5) | 1.5 | 4.3 | 0.03 |
| Smoking cessation counseling | 67 | 15.2 (9.8‐20.7) | 15.0 (9.6‐20.4) | 0.2 | 2.0 | 0.56 |
| Pneumonia hospital/discharge composite | 71 | 26.7 (20.3‐33.1) | 25.2 (19.0‐31.3) | 1.5 | 5.8 | 0.006* |
In order to test the robustness of our results, we carried out 2 secondary analyses. First, we used multivariable models to generate a propensity score representing the predicted probability of being assigned to a hospital with hospitalists. We then used the propensity score as an additional covariate in subsequent multivariable models. In addition, we performed a complete‐case analysis (including only hospitals with complete data, n = 204) as a check on the sensitivity of our results to missing data. Neither analysis produced results substantially different from those presented.
Discussion
In this cross‐sectional analysis of hospitals participating in a voluntary quality reporting initiative, hospitals with at least 1 hospitalist group had fewer missed discharge care process measures for CHF, even after adjusting for hospital‐level characteristics. In addition, as the estimated percentage of patients admitted by hospitalists increased, the percentage of missed quality opportunities decreased across all measures. The observed relationships were most apparent for measures that could be completed at any time during the hospitalization and at discharge. While it is likely that hospitalists are a marker of a hospital's ability to invest in systems (and as a result, care improvement initiatives), the presence of a potential dose‐response relationship suggests that hospitalists themselves may have a role in improving processes of care.
Our study suggests a generally positive, but mixed, picture of hospitalists' effects on quality process measure performance. Lack of uniformity across measures may depend on the timing of the process measure (eg, whether or not the process is measured at admission or discharge). For example, in contrast to admission process measures, we more commonly observed a positive association between hospitalists and care quality on process measures targeting processes that generally took place later in hospitalization or at discharge. Many admission process measures (eg, door to antibiotic time, blood cultures, and appropriate initial antibiotics) likely occurred prior to hospitalist involvement in most cases and were instead under the direction of emergency medicine physicians. Performance on these measures would not be expected to relate to use of hospitalists, and that is what we observed.
In addition to the timing of when a process was measured or took place, associations between hospitalists and care quality vary by disease. The apparent variation in impact of hospitalists by disease (more impact for cardiac conditions, less for pneumonia) may relate primarily to the characteristics of the processes of care that were measured for each condition. For example, one‐half of the pneumonia process measures related to care occurring within a few hours of admission, while the other one‐half (smoking cessation advice and streptococcal and influenza vaccines) were often administered per protocol or by nonphysician providers.26‐29 However, more of the cardiac measures required physician action (eg, prescription of an ACE‐I at discharge). Alternatively, unmeasured confounders important in the delivery of cardiac care might play an important role in the relationship between hospitalists and cardiac process measure performance.
Our approach to defining hospitalists bears mention as well. While a dichotomous measure of having hospitalists available was only statistically significant for the single CHF discharge composite measure, our measure of hospitalist availabilitythe percentage of patients admitted by hospitalistswas more strongly associated with a larger number of quality measures. Contrast between the dichotomous and continuous measures may have statistical explanations (the power to see differences between 2 groups is more limited with use of a binary predictor, which itself can be subject to bias),30 but may also indicate a dose‐response relationship. A larger number of admissions to hospitalists may help standardize practices, as care is concentrated in a smaller number of physicians' hands. Moreover, larger hospitalist programs may be more likely to have implemented care standardization or quality improvement processes or to have been incorporated into (or lead) hospitals' quality infrastructures. Finally, presence of larger hospitalist groups may be a marker for a hospital's capacity to make hospital‐wide investments in improvement. However, the association between the percentage of patients admitted by hospitalists and care quality persisted even after adjustment for many measures plausibly associated with ability to invest in care quality.
Our study has several limitations. First, although we used a widely accepted definition of hospitalists endorsed by the Society of Hospital Medicine, there are no gold standard definitions for a hospitalist's job description or skill set. As a result, it is possible that a model utilizing rotating internists (from a multispecialty group) might have been misidentified as a hospitalist model. Second, our findings represent a convenience sample of hospitals in a voluntary reporting initiative (CHART) and may not be applicable to hospitals that are less able to participate in such an endeavor. CHART hospitals are recognized to be better performers than the overall California population of hospitals, potentially decreasing variability in our quality of care measures.2 Third, there were significant differences between our comparison groups within the CHART hospitals, including sample size. Although we attempted to adjust our analyses for many important potential confounders and applied conservative measures to assess statistical significance, given the baseline differences, we cannot rule out the possibility of residual confounding by unmeasured factors. Fourth, as described above, this observational study cannot provide robust evidence to support conclusions regarding causality. Fifth, the estimation of the percent of patients admitted by hospitalists is unvalidated and based upon self‐reported and incomplete (41% of respondents) data. We are somewhat reassured by the fact that respondents and nonresponders were similar across all hospital characteristics, as well as outcomes. Sixth, misclassification of the estimated percentage of patients admitted by hospitalists may have influenced our results. Although possible, misclassification often biases results toward the null, potentially weakening any observed association. Given that our respondents were not aware of our hypotheses, there is no reason to expect recall issues to bias the results one way or the other. Finally, for many performance measures, overall performance was excellent among all hospitals (eg, aspirin at admission) with limited variability, thus limiting the ability to assess for differences.
In summary, in a large, cross‐sectional study of California hospitals participating in a voluntary quality reporting initiative, the presence of hospitalists was associated with modest improvements in hospital‐level performance of quality process measures. In addition, we found a relationship between the percentage of patients admitted by hospitalists and improved process measure adherence. Although we cannot determine causality, our data support the hypothesis that dedicated hospital physicians can positively affect the quality of care. Future research should examine this relationship in other settings and should address causality using broader measures of quality including both processes and outcomes.
Acknowledgements
The authors acknowledge Teresa Chipps, BS, Center for Health Services Research, Division of General Internal Medicine and Public Health, Department of Medicine, Vanderbilt University, Nashville, TN, for her administrative and editorial assistance in the preparation of this manuscript.
- ,,,.Care in U.S. hospitals—the Hospital Quality Alliance Program.N Engl J Med.2005;353:265–274.
- CalHospitalCompare.org: online report card simplifies the search for quality hospital care. Available at: http://www.chcf.org/topics/hospitals/index.cfm?itemID=131387. Accessed September 2009.
- ,,, et al.Hospital characteristics and quality of care.JAMA.1992;268:1709–1714.
- ,,,,.Patient and hospital characteristics associated with recommended processes of care for elderly patients hospitalized with pneumonia: results from the Medicare quality indicator system pneumonia module.Arch Intern Med.2002;162:827–833.
- ,,, et al.A systematic review and meta‐analysis of studies comparing mortality rates of private for‐profit and private not‐for‐profit hospitals.CMAJ.2002;166:1399–1406.
- ,.Teaching hospitals and quality of care: a review of the literature.Milbank Q.2002;80:569–593.
- ,,,,.Nurse‐staffing levels and the quality of care in hospitals.N Engl J Med.2002;346:1715–1722.
- ,,,.Growth in the care of older patients by hospitalists in the United States.N Engl J Med.2009;360:1102–1112.
- ,,,.Health care market trends and the evolution of hospitalist use and roles.J Gen Intern Med.2005;20:101–107.
- ,,,.Comparison of processes and outcomes of pneumonia care between hospitalists and community‐based primary care physicians.Mayo Clin Proc.2002;77:1053–1058.
- ,,,.Comparison of hospitalists and nonhospitalists regarding core measures of pneumonia care.Am J Manag Care.2007;13:129–132.
- ,,.Comparison of practice patterns of hospitalists and community physicians in the care of patients with congestive heart failure.J Hosp Med.2008;3:35–41.
- ,,, et al.Quality of care for decompensated heart failure: comparable performance between academic hospitalists and non‐hospitalists.J Gen Intern Med.2008;23:1399–1406.
- ,,,,.Quality of care for patients hospitalized with heart failure: assessing the impact of hospitalists.Arch Intern Med.2002;162:1251–1256.
- ,,,.The inverse relationship between mortality rates and performance in the Hospital Quality Alliance measures.Health Aff.2007;26:1104–1110.
- ,,,,.Does the Leapfrog program help identify high‐quality hospitals?Jt Comm J Qual Patient Saf.2008;34:318–325.
- ,,,,,.Outcomes of care by hospitalists, general internists, and family physicians.N Engl J Med.2007;357:2589–2600.
- CMS HQI demonstration project—composite quality score methodology overview. Available at: http://www.cms.hhs.gov/HospitalQualityInits/downloads/HospitalCompositeQualityScoreMethodologyOverview.pdf. Accessed September 2009.
- ,,.Modeling risk using generalized linear models.J Health Econ.1999;18:153–171.
- ,,.Generalized modeling approaches to risk adjustment of skewed outcomes data.J Health Econ.2005;24:465–488.
- ,,, et al.Quality of care for the treatment of acute medical conditions in US hospitals.Arch Intern Med.2006;166:2511–2517.
- ,,, et al.The Dartmouth Atlas of Cardiovascular Health Care.Chicago:AHA Press;1999. Current data from the Dartmouth Institute for Health Policy and Clinical Practice, Lebanon, NH. Available at: http://www.dartmouthatlas.org/atlases/atlas_ series.shtm. Accessed September 2009.
- ,,.Differences in per capita rates of revascularization and in choice of revascularization procedure for eleven states.BMC Health Serv Res.2006;6:35.
- ,,.The relationship between physician supply, cardiovascular health service use and cardiac disease burden in Ontario: supply‐need mismatch.Can J Card.2008;24:187.
- .Multiple imputation: a primer.Stat Methods Med Res.1999;8:3–15.
- .Nursing intervention and smoking cessation: Meta‐analysis update.Heart Lung.2006;35:147–163.
- .Ten‐year durability and success of an organized program to increase influenza and pneumococcal vaccination rates among high‐risk adults.Am J Med.1998;105:385–392.
- ,,, et al.Role of student pharmacist interns in hospital‐based standing orders pneumococcal vaccination program.J Am Pharm Assoc.2007;47:404–409.
- ,,,.Effect of a pharmacist‐managed program of pneumococcal and influenza immunization on vaccination rates among adult inpatients.Am J Health Syst Pharm.2003;60:1767–1771.
- ,,.Dichotomizing continuous predictors in multiple regression: a bad idea.Stat Med.2006;25:127–141.
Copyright © 2010 Society of Hospital Medicine