User login
What makes a great doctor? Heck if I know. Maybe it’s like pornography. A great physician, well, “You know one when you see one.” That approach worked from the time of Hippocrates until the recent past, when the Centers for Medicare & Medicaid Services (CMS), the Joint Commission, and others embarked on programs to measure and report physician quality. Of course, bodies like the American Board of Internal Medicine have been certifying physicians for a long time.
Ongoing Professional Practice Evaluation (OPPE) is one such measurement program, now over four years old, with standards put forth by the Joint Commission in an effort to monitor individual physician—and non-physician provider—performance across a number of domains. The program requires accredited hospitals to monitor and report performance to the physician/provider at least every 11 months, and to use such information in the credentialing process.
This year, I received two OPPE reports, causing me to reflect on how helpful these reports are in judging and improving the quality of my practice. Before I discuss some of the “grades” I received, let me start with my conclusion: Physician quality measurement is in its infancy, and the measures are at best “directional” for most physicians, including hospitalists. Some measurement is better than none at all, however, and selected measures, such as surgical site infection and other measures of harm, may be grounds for closer monitoring, or even corrective action, of a physician’s practice. Unfortunately, my stance that OPPE quality measures are “directional” might not help a physician whose privileges are on the line.
Attribution
For hospitalists, the first concern in measuring and reporting quality is, “How can I attribute quality to an individual hospitalist, when several different hospitalists see the patient?” My perspective is that unless a quality measure can be attributed to an individual hospitalist (e.g. discharge medication reconciliation), it should be attributed at the group level.
However, the OPPE program is specifically intended to address the individual physician/provider for purposes of credentialing, and group attribution is a non-starter. In my performance examples below, I believe that attributing outcomes like mortality, readmissions, or resource utilization to individual hospitalists does not make sense—and is probably unfair.
Resource Utilization
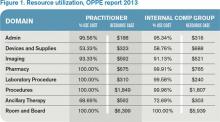
The report lists my performance (Practitioner) compared to an Internal Comparison Group for a specified time period (see Figure 1). The comparison group is described as “practitioners in your specialty...from within your health system.” My data were generated based on only 45 cases (I see patients only part time), while the comparison group was based on 4,530 cases. What I take home from this is that, for cost/resource, I look favorable in “supplies” and “pharmacy”; for most of the others, I’m expensive in comparison.
Will this change my practice? Maybe I will think twice about incurring laboratory or pharmacy costs, but I can’t say I am going to fundamentally rethink how or what I order. And I take all these data with a grain of salt, because I share responsibility for patients with several other hospitalists.
Readmissions
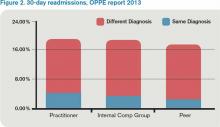
My 30-day readmissions performance (see Figure 2) is weak compared to the Internal Comp Group, which I defined above, and the Peer group, which in my report is defined as derived from practitioners at facilities with 501 beds or more (my facility has 700-plus beds). I accept the “directional” nature of the data, meaning that it provides a general idea but not a precise measurement, and vow to reflect on the processes underlying my approach to hospital discharge (teach back, medication reconciliation, PCP communication, and so on).
Mortality
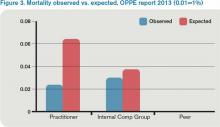
For this category (see Figure 3), I’m looking better. The blue bar is “observed,” while the red bar is “expected.” Although my patients are sicker (higher “expected” mortality), my “observed” mortality is lower than the comparison group. I’m not sure why my observed mortality is lower, but I’m convinced that part of the reason for a higher expected mortality is that my documentation is better than the comparison group.
Will OPPE Change My Practice?
There are other data in my report, including process (core) measures, length of stay, hospital-acquired conditions, and patient flow measures. The OPPE report is but one of a growing number of physician report cards: The Massachusetts Board of Medicine, Physician Compare (CMS), and Health Grades are just a few of the organizations that have public websites reporting my performance. Perhaps at this stage, the primary impact of these reports is through the oft-invoked “Hawthorne Effect,” where subjects modify behavior simply because they are being observed, as opposed to any particular piece of feedback.
My sense is that hospitalists are particularly open to the type of feedback offered in OPPE and similar reports, as long as the data are credible, even if reflecting group level performance. The 2012 SHM State of Hospital Medicine survey shows that the percent of hospitalist compensation based on performance (other than production/billings) increased to 7% from 4% in 2011. It seems that performance measurement with consequences, be it for credentialing or compensation, is here to stay.
Dr. Whitcombis Chief Medical Officer of Remedy Partners. He is co-founder and past president of SHM. Email him at wfwhit@comcast.net.


