User login
Does regular walking improve lipid levels in adults?
Evidence summary
Walking’s impact on cholesterol levels is modest, inconsistent
A 2022 systematic review and meta-analysis of 21 studies (n = 1129) evaluated the effects of walking on lipids and lipoproteins in women older than 18 years who were overweight or obese and were not taking any lipid-lowering medications. Median TC was 206 mg/dL and median LDL was 126 mg/dL.1
The primary outcome found that walking decreased TC and LDL levels independent of diet and weight loss. Twenty studies reported on TC and showed that walking significantly decreased TC levels compared to the control groups (raw mean difference [RMD] = 6.7 mg/dL; 95% CI, 0.4-12.9; P = .04). Fifteen studies examined LDL and showed a significant decrease in LDL levels with walking compared to control groups (RMD = 7.4 mg/dL; 95% CI, 0.3-14.5; P = .04). However, the small magnitude of the changes may have little clinical impact.1
There were no significant changes in the walking groups compared to the control groups for triglycerides (17 studies; RMD = 2.2 mg/dL; 95% CI, –8.4 to 12.8; P = .68) or high-density lipoprotein (HDL) (18 studies; RMD = 1.5 mg/dL; 95% CI, –0.4 to 3.3; P = .12). Included studies were required to be controlled but were otherwise not described. The overall risk for bias was determined to be low.1
A 2020 RCT (n = 22) assessed the effects of a walking intervention on cholesterol and cardiovascular disease (CVD) risk in individuals ages 40 to 65 years with moderate CVD risk but without diabetes or CVD.2 Moderate CVD risk was defined as a 2% to 5% 10-year risk for a CVD event using the European HeartScore, which incorporates age, sex, blood pressure, lipid levels, and smoking status3; however, study participants were not required to have hyperlipidemia. Participants were enrolled in a 12-week, nurse-led intervention of moderate-paced walking for 30 to 45 minutes 5 times weekly.
Individuals in the intervention group had significant decreases in average TC levels from baseline to follow-up (244.6 mg/dL vs 213.7 mg/dL; P = .001). As a result, participants’ average 10-year CVD risk was significantly reduced from moderate risk to low risk (2.6% vs 1.8%; P = 038) and was significantly lower in the intervention group than in the control group at follow-up (1.8% vs 3.1%; P = .019). No blinding was used, and the use of lipid-lowering medications was not reported, which could have impacted the results.2
A 2008 RCT (n = 67) examined the effect of a home-based walking program (12 weeks of brisk walking, at least 30 min/d and at least 5 d/wk, with at least 300 kcal burned per walk) vs a sedentary control group in men ages 45 to 65 years with hyperlipidemia (TC > 240 mg/dL and/or TC/HDL-C ratio ≥ 6) who were not receiving lipid-lowering medication. There were no significant changes from baseline to follow-up in the walking group compared to the control group in TC (adjusted mean difference [AMD] = –9.3 mg/dL; 95% CI, –22.8 to 4.64; P = .19), HDL-C (AMD = 2.7 mg/dL; 95% CI, –0.4 to 5.4; P = .07) or triglycerides (AMD = –26.6 mg/dL; 95% CI, –56.7 to 2.7; P = .07).4
A 2002 RCT (n = 111) of sedentary men and women (BMI, 25-35; ages, 40-65 years) with dyslipidemia (LDL of 130-190 mg/dL, or HDL < 40 mg/dL for men or < 45 mg/dL for women) examined the impact of various physical activity levels for 8 months when compared to a control group observed for 6 months. The group assigned to low-amount, moderate-intensity physical activity walked an equivalent of 12 miles per week.5
Continue to: In this group...
In this group, there was a significant decrease in average triglyceride concentrations from baseline to follow-up (mean ± standard error = 196.8 ± 30.5 mg/dL vs 145.2 ± 16.0 mg/dL; P < .001). Significance of the change compared with changes in the control group was not reported, although triglycerides in the control group increased from baseline to follow-up (132.1 ± 11.0 vs 155.8 ± 14.9 mg/dL). There were no significant changes from baseline to follow-up in TC (194 ± 4.8 vs 197.9 ± 5.4 mg/dL), LDL (122.7 ± 4.0 vs 127.8 ± 4.1 mg/dL), or HDL (42.0 ± 1.9 vs 43.1 ± 2.5 mg/dL); P values of pre-post changes and comparison to control group were not reported.5
Recommendations from others
The Physical Activity Guidelines for Americans, published by the Department of Health and Human Services and updated in 2018, cite adherence to the published guidelines as a protective factor against high LDL and total lipids in both adults and children.6 The guidelines for adults recommend 150 to 300 minutes of moderate-intensity or 75 to 150 minutes of vigorous-intensity aerobic exercise per week, as well as muscle-strengthening activities of moderate or greater intensity 2 or more days per week. Brisk walking is included as an example of a moderate-intensity activity. These same guidelines are cited and endorsed by the American College of Sports Medicine and the American Heart Association.7,8
Editor’s takeaway
The lipid reductions achieved from walking—if any—are minimal. By themselves, these small reductions will not accomplish our lipid-lowering goals. However, cholesterol goals are primarily disease oriented. This evidence does not directly inform us of important patient-oriented outcomes, such as morbidity, mortality, and vitality.
1. Ballard AM, Davis A, Wong B, et al. The effects of exclusive walking on lipids and lipoproteins in women with overweight and obesity: a systematic review and meta-analysis. Am J Health Promot. 2022;36:328-339. doi: 10.1177/08901171211048135
2. Akgöz AD, Gözüm S. Effectiveness of a nurse-led physical activity intervention to decrease cardiovascular disease risk in middle-aged adults: a pilot randomized controlled study. J Vasc Nurs. 2020;38:140-148. doi: 10.1016/j.jvn.2020.05.002
3. European Association of Preventive Cardiology. HeartScore. Accessed December 23, 2022. www.heartscore.org/en_GB
4. Coghill N, Cooper AR. The effect of a home-based walking program on risk factors for coronary heart disease in hypercholesterolaemic men: a randomized controlled trial. Prev Med. 2008; 46:545-551. doi: 10.1016/j.ypmed.2008.01.002
5. Kraus WE, Houmard JA, Duscha BD, et al. Effects of the amount and intensity of exercise on plasma lipoproteins. N Engl J Med. 2002;347:1483-1492. doi: 10.1056/NEJMoa020194
6. US Department of Health and Human Services. Physical Activity Guidelines for Americans, 2nd edition. Washington, DC: US Department of Health and Human Services; 2018. Accessed December 23, 2022. https://health.gov/sites/default/files/2019-09/Physical_Activity_Guidelines_2nd_edition.pdf
7. American Heart Association. Recommendations for physical activity in adults and kids. Accessed December 23, 2022. www.heart.org/en/healthy-living/fitness/fitness-basics/aha-recs-for-physical-activity-in-adults
8. American College of Sports Medicine. Trending topic: physical activity guidelines. Accessed December 23, 2022. www.acsm.org/education-resources/trending-topics-resources/physical-activity-guidelines
Evidence summary
Walking’s impact on cholesterol levels is modest, inconsistent
A 2022 systematic review and meta-analysis of 21 studies (n = 1129) evaluated the effects of walking on lipids and lipoproteins in women older than 18 years who were overweight or obese and were not taking any lipid-lowering medications. Median TC was 206 mg/dL and median LDL was 126 mg/dL.1
The primary outcome found that walking decreased TC and LDL levels independent of diet and weight loss. Twenty studies reported on TC and showed that walking significantly decreased TC levels compared to the control groups (raw mean difference [RMD] = 6.7 mg/dL; 95% CI, 0.4-12.9; P = .04). Fifteen studies examined LDL and showed a significant decrease in LDL levels with walking compared to control groups (RMD = 7.4 mg/dL; 95% CI, 0.3-14.5; P = .04). However, the small magnitude of the changes may have little clinical impact.1
There were no significant changes in the walking groups compared to the control groups for triglycerides (17 studies; RMD = 2.2 mg/dL; 95% CI, –8.4 to 12.8; P = .68) or high-density lipoprotein (HDL) (18 studies; RMD = 1.5 mg/dL; 95% CI, –0.4 to 3.3; P = .12). Included studies were required to be controlled but were otherwise not described. The overall risk for bias was determined to be low.1
A 2020 RCT (n = 22) assessed the effects of a walking intervention on cholesterol and cardiovascular disease (CVD) risk in individuals ages 40 to 65 years with moderate CVD risk but without diabetes or CVD.2 Moderate CVD risk was defined as a 2% to 5% 10-year risk for a CVD event using the European HeartScore, which incorporates age, sex, blood pressure, lipid levels, and smoking status3; however, study participants were not required to have hyperlipidemia. Participants were enrolled in a 12-week, nurse-led intervention of moderate-paced walking for 30 to 45 minutes 5 times weekly.
Individuals in the intervention group had significant decreases in average TC levels from baseline to follow-up (244.6 mg/dL vs 213.7 mg/dL; P = .001). As a result, participants’ average 10-year CVD risk was significantly reduced from moderate risk to low risk (2.6% vs 1.8%; P = 038) and was significantly lower in the intervention group than in the control group at follow-up (1.8% vs 3.1%; P = .019). No blinding was used, and the use of lipid-lowering medications was not reported, which could have impacted the results.2
A 2008 RCT (n = 67) examined the effect of a home-based walking program (12 weeks of brisk walking, at least 30 min/d and at least 5 d/wk, with at least 300 kcal burned per walk) vs a sedentary control group in men ages 45 to 65 years with hyperlipidemia (TC > 240 mg/dL and/or TC/HDL-C ratio ≥ 6) who were not receiving lipid-lowering medication. There were no significant changes from baseline to follow-up in the walking group compared to the control group in TC (adjusted mean difference [AMD] = –9.3 mg/dL; 95% CI, –22.8 to 4.64; P = .19), HDL-C (AMD = 2.7 mg/dL; 95% CI, –0.4 to 5.4; P = .07) or triglycerides (AMD = –26.6 mg/dL; 95% CI, –56.7 to 2.7; P = .07).4
A 2002 RCT (n = 111) of sedentary men and women (BMI, 25-35; ages, 40-65 years) with dyslipidemia (LDL of 130-190 mg/dL, or HDL < 40 mg/dL for men or < 45 mg/dL for women) examined the impact of various physical activity levels for 8 months when compared to a control group observed for 6 months. The group assigned to low-amount, moderate-intensity physical activity walked an equivalent of 12 miles per week.5
Continue to: In this group...
In this group, there was a significant decrease in average triglyceride concentrations from baseline to follow-up (mean ± standard error = 196.8 ± 30.5 mg/dL vs 145.2 ± 16.0 mg/dL; P < .001). Significance of the change compared with changes in the control group was not reported, although triglycerides in the control group increased from baseline to follow-up (132.1 ± 11.0 vs 155.8 ± 14.9 mg/dL). There were no significant changes from baseline to follow-up in TC (194 ± 4.8 vs 197.9 ± 5.4 mg/dL), LDL (122.7 ± 4.0 vs 127.8 ± 4.1 mg/dL), or HDL (42.0 ± 1.9 vs 43.1 ± 2.5 mg/dL); P values of pre-post changes and comparison to control group were not reported.5
Recommendations from others
The Physical Activity Guidelines for Americans, published by the Department of Health and Human Services and updated in 2018, cite adherence to the published guidelines as a protective factor against high LDL and total lipids in both adults and children.6 The guidelines for adults recommend 150 to 300 minutes of moderate-intensity or 75 to 150 minutes of vigorous-intensity aerobic exercise per week, as well as muscle-strengthening activities of moderate or greater intensity 2 or more days per week. Brisk walking is included as an example of a moderate-intensity activity. These same guidelines are cited and endorsed by the American College of Sports Medicine and the American Heart Association.7,8
Editor’s takeaway
The lipid reductions achieved from walking—if any—are minimal. By themselves, these small reductions will not accomplish our lipid-lowering goals. However, cholesterol goals are primarily disease oriented. This evidence does not directly inform us of important patient-oriented outcomes, such as morbidity, mortality, and vitality.
1. Ballard AM, Davis A, Wong B, et al. The effects of exclusive walking on lipids and lipoproteins in women with overweight and obesity: a systematic review and meta-analysis. Am J Health Promot. 2022;36:328-339. doi: 10.1177/08901171211048135
2. Akgöz AD, Gözüm S. Effectiveness of a nurse-led physical activity intervention to decrease cardiovascular disease risk in middle-aged adults: a pilot randomized controlled study. J Vasc Nurs. 2020;38:140-148. doi: 10.1016/j.jvn.2020.05.002
3. European Association of Preventive Cardiology. HeartScore. Accessed December 23, 2022. www.heartscore.org/en_GB
4. Coghill N, Cooper AR. The effect of a home-based walking program on risk factors for coronary heart disease in hypercholesterolaemic men: a randomized controlled trial. Prev Med. 2008; 46:545-551. doi: 10.1016/j.ypmed.2008.01.002
5. Kraus WE, Houmard JA, Duscha BD, et al. Effects of the amount and intensity of exercise on plasma lipoproteins. N Engl J Med. 2002;347:1483-1492. doi: 10.1056/NEJMoa020194
6. US Department of Health and Human Services. Physical Activity Guidelines for Americans, 2nd edition. Washington, DC: US Department of Health and Human Services; 2018. Accessed December 23, 2022. https://health.gov/sites/default/files/2019-09/Physical_Activity_Guidelines_2nd_edition.pdf
7. American Heart Association. Recommendations for physical activity in adults and kids. Accessed December 23, 2022. www.heart.org/en/healthy-living/fitness/fitness-basics/aha-recs-for-physical-activity-in-adults
8. American College of Sports Medicine. Trending topic: physical activity guidelines. Accessed December 23, 2022. www.acsm.org/education-resources/trending-topics-resources/physical-activity-guidelines
EVIDENCE-BASED ANSWER:
Minimally. Regular moderate- intensity walking for a period of 4 or more weeks minimally decreased total cholesterol (TC) and low-density lipoprotein (LDL) levels by about 7 mg/dL in women with overweight or obesity (strength of recommendation [SOR]: C, systematic review and meta-analysis on disease-oriented evidence). For adults ages 40 to 65 years, regular walking for 3 or more months inconsistently affected cholesterol and triglyceride levels (SOR: C, based on 3 randomized controlled trials [RCTs] with disease-oriented evidence).

Novel resuscitation for patients with nonshockable rhythms in cardiac arrest
This transcript has been edited for clarity.
Robert D. Glatter, MD: Welcome. I’m Dr Robert Glatter, medical adviser for Medscape Emergency Medicine. with a remarkable increase in neurologically intact survival. Welcome, gentlemen.
Dr. Pepe, I’d like to start off by thanking you for taking time to join us to discuss this novel concept of head-up or what you now refer to as a neuroprotective cardiopulmonary resuscitation (CPR) bundle. Can you define what this entails and why it is referred to as a neuroprotective CPR bundle?
Paul E. Pepe, MD, MPH: CPR has been life saving for 60 years the way we’ve performed it, but probably only in a very small percentage of cases. That’s one of the problems. We have almost a thousand people a day who have sudden cardiac arrest out in the community alone and more in the hospital.
We know that early defibrillation and early CPR can contribute, but it’s still a small percentage of those. About 75%-85% of the cases that we go out to see will have nonshockable rhythms and flatlines. Some cases are what we call “pulseless electrical activity,” meaning that it looks like there is some kind of organized complex, but there is no pulse associated with it.
That’s why it’s a problem, because they don’t come back. Part of the reason why we see poor outcomes is not only that these cases tend to be people who, say, were in ventricular fibrillation and then just went on over time and were not witnessed or resuscitated or had a long response time. They basically either go into flatline or autoconvert into these bizarre rhythms.
The other issue is the way we perform CPR. CPR has been lifesaving, but it only generates about 20% and maybe 15% in some cases of normal blood flow, and particularly, cerebral perfusion pressure. We’ve looked at this nicely in the laboratory.
For example, during chest compressions, we’re hoping during the recoil phase to pull blood down and back into the right heart. The problem is that you’re not only setting a pressure rate up here to the arterial side but also, you’re setting back pressure wave on the venous side. Obviously, the arterial side always wins out, but it’s just not as efficient as it could be, at 20% or 30%.
What does this entail? It entails several independent mechanisms in terms of how they work, but they all do the same thing, which is they help to pull blood out of the brain and back into the right heart by basically manipulating intrathoracic pressure and creating more of a vacuum to get blood back there.
It’s so important that people do quality CPR. You have to have a good release and that helps us suck a little bit of blood and sucks the air in. As soon as the air rushes in, it neutralizes the pressure and there’s no more vacuum and nothing else is happening until the next squeeze.
What we have found is that we can cap the airway just for a second with a little pop-up valve. It acts like when you’re sucking a milkshake through a straw and it creates more of a vacuum in the chest. Just a little pop-up valve that pulls a little bit more blood out of the brain and the rest of the body and into the right heart.
We’ve shown in a human study that, for example, the systolic blood pressure almost doubles. It really goes from 40 mm Hg during standard CPR up to 80 mm Hg, and that would be sustained for 14-15 minutes. That was a nice little study that was done in Milwaukee a few years ago.
The other thing that happens is, if you add on something else, it’s like a toilet plunger. I think many people have seen it; it’s called “active compression-decompression.” It not only compresses, but it decompresses. Where it becomes even more effective is that if you had broken bones or stiff bones as you get older or whatever it may be, as you do the CPR, you’re still getting the push down and then you’re getting the pull out. It helps on several levels. More importantly, when you put the two together, they’re very synergistic.
We, have already done the clinical trial that is the proof of concept, and that was published in The Lancet about 10 years ago. In that study, we found that the combination of those two dramatically improved survival rates by 50%, with 1-year survival neurologically intact. That got us on the right track.
The interesting thing is that someone said, “Can we lift the head up a little bit?” We did a large amount of work in the laboratory over 10 years, fine tuning it. When do you first lift the head? How soon is too soon? It’s probably bad if you just go right to it.
We had to get the pump primed a little bit with these other things to get the flow going better, not only pulling blood out of the brain but now, you have a better flow this way. You have to prime at first for a couple of minutes, and we worked out the timing: Is it 3 or 4 minutes? It seems the timing is right at about 2 minutes, then you gradually elevate the head over about 2 minutes. We’re finding that seems to be the optimal way to do it. About 2 minutes of priming with those other two devices, the adjuncts, and then gradually elevate the head over 2 minutes.
When we do that in the laboratory, we’re getting normalized cerebral perfusion pressures. You’re normalizing the flow back again with that. We’re seeing profound differences in outcome as a result, even in these cases of the nonshockables.
Dr. Glatter: What you’re doing basically is resulting in an increase in cardiac output, essentially. That really is important, especially in these nonshockable rhythms, correct?
Dr. Pepe: Absolutely. As you’re doing this compression and you’re getting these intracranial pulse waves that are going up because they’re colliding up there. It could be even damaging in itself, but we’re seeing these intracranial raises. The intracranial pressure starts going up more and more over time. Also, peripherally in most people, you’re not getting good flow out there; then, your vasculature starts to relax. The arterials are starting to not get oxygen, so they don’t go out.
With this technique where we’re returning the pressure, we’re getting to 40% of normal now with the active compression-decompression CPR plus an impedance threshold device (ACD+ITD CPR) approach. Now, you add this, and you’re almost normalizing. In humans, even in these asystole patients, we’re seeing end-title CO2s which are generally in the 15-20 range with standard CPR are now up with ACD+ITD CPR in the 30%-40% range, where we’re getting through 30 or 40 end-tidal CO2s. Now, we’re seeing even the end-tidal CO2s moving up into the 40s and 50s. We know there’s a surrogate marker telling us that we are generating much better flows not only to the rest of the body, but most importantly, to the brain.
Dr. Glatter: Ryan, could you tell us about the approach in terms of on scene, what you’re doing and how you use the device itself? Maybe you could talk about the backpack that you developed with your fire department?
Ryan P. Quinn, BS, EMS: Our approach has always been to get to the patient quickly, like everybody’s approach on a cardiac arrest when you’re responding. We are an advanced life-support paramedic ambulance service through the fire department – we’re all cross-trained firefighter paramedics. Our first vehicle from the fire department is typically the ambulance. It’s smaller and a little quicker than the fire engine. Two paramedics are going to jump out with two backpacks. One has the automated compressive device (we use the Lucas), and the other one is the sequential patient lifting device, the EleGARD.
Our two paramedics are quick to the patient’s side, and once they make contact with the patient to verify pulseless cardiac arrest, they will unpack. One person will go right to compressions if there’s nobody on compressions already. Sometimes we have a first responder police officer with an automated external defibrillator (AED). We go right to the patient’s side, concentrate on compressions, and within 90 seconds to 2 minutes, we have our bags unpacked, we’ve got the devices turned on, patient lifted up, slid under the device, and we have a supraglottic airway that is placed within 15 seconds already premade with the ITD on top. We have a sealed airway that we can continue to compress with Dr. Pepe’s original discussion of building on what’s previously been shown to work.
Dr. Pepe: Let me make a comment about this. This is so important, what Ryan is saying, because it’s something we found during the study. It’s really a true pit-crew approach. You’re not only getting these materials, which you think you need a medical Sherpa for, but you don’t. They set it up and then when they open it up, it’s all laid out just exactly as you need it. It’s not just how fast you get there; it’s how fast you get this done.
When we look at all cases combined against high-performance systems that had some of the highest survival rates around, when we compare it to those, we found that overall, even if you looked at the ones that had over 20-minute responses, the odds ratios were still three to four times higher. It was impressive.
If you looked at it under 15 minutes, which is really reasonable for most systems that get there by the way, the average time that people start CPR in any system in these studies has been about 8 minutes if you actually start this thing, which takes about 2 minutes more for this new bundle of care with this triad, it’s almost 12-14 times higher in terms of the odds ratio. I’ve never seen anything like that where the higher end is over 100 in terms of your confidence intervals.
Ryan’s system did really well and is one of those with even higher levels of outcomes, mostly because they got it on quickly. It’s like the AED for nonshockables but better because you have a wider range of efficacy where it will work.
Dr. Glatter: When the elapsed time was less than 11 minutes, that seemed to be an inflection point in the study, is that correct? You saw that 11-fold higher incidence in terms of neurologically intact survival, is that correct?
Dr. Pepe: We picked that number because that was the median time to get it on board. Half the people were getting it within that time period. The fact that you have a larger window, we’re talking about 13- almost 14-fold improvements in outcome if it was under 15 minutes. It doesn’t matter about the 11 or the 12. It’s the faster you get it on board, the better off you are.
Dr. Glatter: What’s the next step in the process of doing trials and having implementation on a larger scale based on your Annals of Emergency Medicine study? Where do you go from here?
Dr. Pepe: I’ve come to find out there are many confounding variables. What was the quality of CPR? How did people ventilate? Did they give the breath and hold it? Did they give a large enough breath so that blood can go across the transpulmonary system? There are many confounding variables. That’s why I think, in the future, it’s going to be more of looking at things like propensity score matching because we know all the variables that change outcomes. I think that’s going to be a way for me.
The other thing is that we were looking at only 380 cases here. When this doubles up in numbers, as we accrue more cases around the country of people who are implementing this, these numbers I just quoted are going to go up much higher. Unwitnessed asystole is considered futile, and you just don’t get them back. To be able to get these folks back now, even if it’s a small percentage, and the fact that we know that we’re producing this better flow, is pretty striking.
I’m really impressed, and the main thing is to make sure people are educated about it. Number two is that they understand that it has to be done right. It cannot be done wrong or you’re not going to see the differences. Getting it done right is not only following the procedures, the sequence, and how you do it, but it also has to do with getting there quickly, including assigning the right people to put it on and having well-trained people who know what they’re doing.
Dr. Glatter: In general, the lay public obviously should not attempt this in the field lifting someone’s head up in the sense of trying to do chest compressions. I think that message is important that you just said. It’s not ready for prime time yet in any way. It has to be done right.
Dr. Pepe: Bystanders have to learn CPR – they will buy us time and we’ll have better outcomes when they do that. That’s number one. Number two is that as more and more systems adopt this, you’re going to see more people coming back. If you think about what we’re doing now, if we only get back 5% of these nonshockable vs. less than 1%, it’s 5% of 800 people a day because a thousand people a day die. Several dozens of lives can be saved on a daily basis, coming back neurologically intact. That’s the key thing.
Dr. Glatter: Ryan, can you comment about your experience in the field? Is there anything in terms of your current approach that you think would be ideal to change at this point?
Mr. Quinn: We’ve established that this is the approach that we want to take and we’re just fine tuning it to be more efficient. Using the choreography of which person is going to do which role, we have clearly defined roles and clearly defined command of the scene so we’re not missing anything. Training is extremely important.
Dr. Glatter: Paul, I want to ask you about your anecdotal experience of people waking up quickly and talking after elevating their heads and going through this process. Having people talk about it and waking up is really fascinating. Maybe you can comment further on this.
Dr. Pepe: That’s a great point that you bring up because a 40- to 50-year-old guy who got saved with this approach, when he came around, he said he was hearing what people were saying. When he came out of it, he found out he had been getting CPR for about 25 minutes because he had persistent recurring ventricular fibrillation. He said, “How could I have survived that that long?”
When we told him about the new approach, he added, “Well, that’s like neuroprotective.” He’s right, because in the laboratory, we showed it was neuroprotective and we’re also getting better flows back there. It goes along with everything else, and so we’ve adopted the name because it is.
These are really high-powered systems we are comparing against, and we have the same level of return of spontaneous circulation. The major difference was when you started talking about the neurointact survival. We don’t have enough numbers yet, but next go around, we’re going to look at cerebral performance category (CPC) – CPC1 vs. the CPC2 – which were both considered intact, but CPC1 is actually better. We’re seeing many more of those, anecdotally.
I also wanted to mention that people do bring this up and say, “Well, let’s do a trial.” As far as we’re concerned, the trial’s been done in terms of The Lancet study 10 years ago that showed that the active compression-decompression had tremendously better outcomes. We show in the laboratories that you augment that a little bit. These are all [Food and Drug Administration] approved. You can go out and buy it tomorrow and get it done. I have no conflicts of interest, by the way, with any of this.
To have this device that’s going to have the potential of saving so many more lives is really an exciting breakthrough. More importantly, we’re understanding more now about the physiology of CPR and why it works. It could work much better with the approaches that we’ve been developing over the last 20 years or so.
Dr. Glatter: Absolutely. I want to thank both of you gentlemen. It’s been really an incredible experience to learn more about an advance in resuscitation that could truly be lifesaving. Thank you again for taking time to join us.
Dr. Glatter is an attending physician in the department of emergency medicine, Lenox Hill Hospital, New York. Dr. Pepe is professor, department of management, policy, and community health, University of Texas Health Sciences Center, Houston. Mr. Quinn is EMS Chief, Edina (Minn.) Fire Department. No conflicts of interest were reported.
A version of this article first appeared Jan. 26 on Medscape.com.
More type 2 diabetes deaths from cancer than heart disease
Cancer appears to have overtaken cardiovascular disease (CVD) as a leading cause of death in adults with type 2 diabetes, a 20-year population study in England suggests.
The researchers found that, from 1998 to 2018, in more than 130,000 adults aged 35 and older with type 2 diabetes, all-cause mortality declined for all ages, but cancer mortality increased for those aged 75 and older; people with type 2 diabetes who were smokers had higher and steadily increasing cancer mortality rates; and people with type 2 diabetes had more than twice the rate of colorectal, pancreatic, liver, and endometrial cancer mortality than age- and sex-matched individuals in the general population.
The findings suggest that “cancer prevention strategies therefore deserve at least a similar level of attention as cardiovascular disease prevention, particularly in older people and for some cancers such as liver, colorectal, and pancreatic cancer,” the researchers wrote.
Tailored cancer prevention and early-detection strategies are needed to address persistent inequalities in the older population, the most deprived, and smokers, they added.
Breast cancer rates in younger women with type 2 diabetes rising
According to the researchers, “early cancer detection through changes to existing screening [programs], or more in-depth investigations for suspected/nonspecific symptoms, may reduce the number of avoidable cancer deaths in people with type 2 diabetes.”
Moreover, breast cancer rates in younger women with type 2 diabetes are rising by 4.1% per year, they wrote, which suggests such women are high risk and should be screened at a younger age, but screening age would need to be determined in cost-effectiveness analyses.
The study by Suping Ling, PhD, and colleagues was published online in Diabetologia.
Results challenge belief that preventing CVD is priority in type 2 diabetes
“The prevention of cardiovascular disease has been, and is still considered, a priority in people with diabetes,” the researchers wrote.
“Our results challenge this view by showing that cancer may have overtaken cardiovascular disease as a leading cause of death in people with type 2 diabetes.”
“The proportion of cancer deaths out of all-cause deaths remains high (> 30%) in young ages, and it was steadily increasing in older ages,” Dr. Ling, from the department of noncommunicable disease epidemiology, London School of Hygiene & Tropical Medicine, said in a comment.
“Combined with previous studies reporting decreasing CVD mortality rates,” she said, “we concluded that cancer might have overtaken CVD as the leading cause of death in people with type 2 diabetes.”
Many evidence-based cancer-prevention strategies related to lifestyle (such as being physically active, being a healthy weight, eating a better diet, stopping smoking, as summarized by the World Cancer Research Fund), are helpful for preventing both cancer and CVD, Ling observed.
However, in the medical community, many additional efforts were made for monitoring, early detection, and innovating medications for CVD, she noted. “Therefore, we would like to propose a similar level of attention and effort for cancer in people with type 2 diabetes.”
Deaths from cancer vs. all causes in patients with diabetes
The researchers identified 137,804 patients aged 35 and older who were newly diagnosed with type 2 diabetes from 1998 to 2018 in general practices in the UK that were part of the Clinical Practice Research Datalink.
Patients were a median age of 64 years and 45% were women. Most (83%) were White, followed by South Asian (3.5%), Black (2.0%), and other (3%); 8.4% had missing information for race. Patients had a median body mass index (BMI) of 30.6 kg/m2.
Researchers divided patients into socioeconomic quintiles of most to least deprived based on income, employment, education, and other factors. During a median follow-up of 8.4 years, there were 39,212 deaths (28.5%).
Cancer mortality in subgroups of patients with type 2 diabetes
Researchers analyzed annual deaths from cancer and from all causes over 20 years in subgroups of patients with type 2 diabetes.
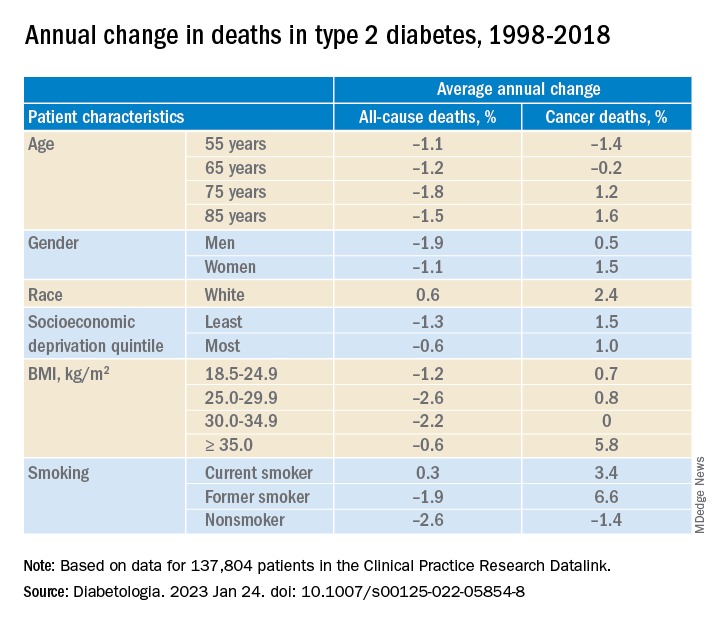
In adults with type 2 diabetes, the average percentage change in cancer mortality per year, from 1998 to 2018 decreased in people aged 55 and 65 (–1.4% and –0.2%, respectively), but increased in people aged 75 and 85 (1.2% and 1.6%, respectively); increased more in women than in men (1.5% vs 1.0%), although women had lower cancer mortality than men; and increased more in the least deprived (wealthiest) individuals than in the most deprived (1.5% vs 1.0%). Cancer mortality rates were consistently higher in the most deprived individuals, Dr. Ling noted.
Cancer mortality also increased more in people with class III obesity (BMI ≥ 35) versus normal weight (5.8% vs 0.7%) and versus other weights. In addition, there was an upward trend in cancer mortality in people who were White or former/current smokers.
Deaths from specific cancers in diabetes vs. general population
Next, researchers determined cancer mortality ratios – the cancer mortality of the patients with diabetes divided by the cancer mortality of the general population.
They determined this for all cancers, the four most common cancers in the United Kingdom (lung, colorectal, breast, and prostate), and cancers caused by type 2 diabetes (pancreatic, liver, gallbladder, and endometrial cancer), standardized by sex and age.
Mortality from all cancer was 18% higher in patients with type 2 diabetes, compared with the general population.
Overall, mortality from colorectal cancer, pancreatic cancer, and liver cancer was 2.4 times, 2.12 times, and 2.13 times higher, respectively, in patients with type 2 diabetes than in the general population.
Mortality from breast cancer was 9% higher and mortality from endometrial cancer was 2.08 times higher in women with type 2 diabetes than in women in the general population.
There was a constant upward trend for mortality rates for pancreatic, liver, and lung cancer at all ages, colorectal cancer at most ages, breast cancer at younger ages, and prostate and endometrial cancer at older ages.
The study was funded by Hope Against Cancer. Dr. Ling reported no relevant financial relationships.
A version of this article first appeared on Medscape.com.
Cancer appears to have overtaken cardiovascular disease (CVD) as a leading cause of death in adults with type 2 diabetes, a 20-year population study in England suggests.
The researchers found that, from 1998 to 2018, in more than 130,000 adults aged 35 and older with type 2 diabetes, all-cause mortality declined for all ages, but cancer mortality increased for those aged 75 and older; people with type 2 diabetes who were smokers had higher and steadily increasing cancer mortality rates; and people with type 2 diabetes had more than twice the rate of colorectal, pancreatic, liver, and endometrial cancer mortality than age- and sex-matched individuals in the general population.
The findings suggest that “cancer prevention strategies therefore deserve at least a similar level of attention as cardiovascular disease prevention, particularly in older people and for some cancers such as liver, colorectal, and pancreatic cancer,” the researchers wrote.
Tailored cancer prevention and early-detection strategies are needed to address persistent inequalities in the older population, the most deprived, and smokers, they added.
Breast cancer rates in younger women with type 2 diabetes rising
According to the researchers, “early cancer detection through changes to existing screening [programs], or more in-depth investigations for suspected/nonspecific symptoms, may reduce the number of avoidable cancer deaths in people with type 2 diabetes.”
Moreover, breast cancer rates in younger women with type 2 diabetes are rising by 4.1% per year, they wrote, which suggests such women are high risk and should be screened at a younger age, but screening age would need to be determined in cost-effectiveness analyses.
The study by Suping Ling, PhD, and colleagues was published online in Diabetologia.
Results challenge belief that preventing CVD is priority in type 2 diabetes
“The prevention of cardiovascular disease has been, and is still considered, a priority in people with diabetes,” the researchers wrote.
“Our results challenge this view by showing that cancer may have overtaken cardiovascular disease as a leading cause of death in people with type 2 diabetes.”
“The proportion of cancer deaths out of all-cause deaths remains high (> 30%) in young ages, and it was steadily increasing in older ages,” Dr. Ling, from the department of noncommunicable disease epidemiology, London School of Hygiene & Tropical Medicine, said in a comment.
“Combined with previous studies reporting decreasing CVD mortality rates,” she said, “we concluded that cancer might have overtaken CVD as the leading cause of death in people with type 2 diabetes.”
Many evidence-based cancer-prevention strategies related to lifestyle (such as being physically active, being a healthy weight, eating a better diet, stopping smoking, as summarized by the World Cancer Research Fund), are helpful for preventing both cancer and CVD, Ling observed.
However, in the medical community, many additional efforts were made for monitoring, early detection, and innovating medications for CVD, she noted. “Therefore, we would like to propose a similar level of attention and effort for cancer in people with type 2 diabetes.”
Deaths from cancer vs. all causes in patients with diabetes
The researchers identified 137,804 patients aged 35 and older who were newly diagnosed with type 2 diabetes from 1998 to 2018 in general practices in the UK that were part of the Clinical Practice Research Datalink.
Patients were a median age of 64 years and 45% were women. Most (83%) were White, followed by South Asian (3.5%), Black (2.0%), and other (3%); 8.4% had missing information for race. Patients had a median body mass index (BMI) of 30.6 kg/m2.
Researchers divided patients into socioeconomic quintiles of most to least deprived based on income, employment, education, and other factors. During a median follow-up of 8.4 years, there were 39,212 deaths (28.5%).
Cancer mortality in subgroups of patients with type 2 diabetes
Researchers analyzed annual deaths from cancer and from all causes over 20 years in subgroups of patients with type 2 diabetes.
In adults with type 2 diabetes, the average percentage change in cancer mortality per year, from 1998 to 2018 decreased in people aged 55 and 65 (–1.4% and –0.2%, respectively), but increased in people aged 75 and 85 (1.2% and 1.6%, respectively); increased more in women than in men (1.5% vs 1.0%), although women had lower cancer mortality than men; and increased more in the least deprived (wealthiest) individuals than in the most deprived (1.5% vs 1.0%). Cancer mortality rates were consistently higher in the most deprived individuals, Dr. Ling noted.
Cancer mortality also increased more in people with class III obesity (BMI ≥ 35) versus normal weight (5.8% vs 0.7%) and versus other weights. In addition, there was an upward trend in cancer mortality in people who were White or former/current smokers.
Deaths from specific cancers in diabetes vs. general population
Next, researchers determined cancer mortality ratios – the cancer mortality of the patients with diabetes divided by the cancer mortality of the general population.
They determined this for all cancers, the four most common cancers in the United Kingdom (lung, colorectal, breast, and prostate), and cancers caused by type 2 diabetes (pancreatic, liver, gallbladder, and endometrial cancer), standardized by sex and age.
Mortality from all cancer was 18% higher in patients with type 2 diabetes, compared with the general population.
Overall, mortality from colorectal cancer, pancreatic cancer, and liver cancer was 2.4 times, 2.12 times, and 2.13 times higher, respectively, in patients with type 2 diabetes than in the general population.
Mortality from breast cancer was 9% higher and mortality from endometrial cancer was 2.08 times higher in women with type 2 diabetes than in women in the general population.
There was a constant upward trend for mortality rates for pancreatic, liver, and lung cancer at all ages, colorectal cancer at most ages, breast cancer at younger ages, and prostate and endometrial cancer at older ages.
The study was funded by Hope Against Cancer. Dr. Ling reported no relevant financial relationships.
A version of this article first appeared on Medscape.com.
FROM DIABETOLOGIA
Is preeclampsia a cardiovascular time bomb for mothers?
Women who experience preeclampsia during pregnancy are almost twice as likely to have a heart attack or stroke within 20 years of giving birth as pregnant women who did not, according to a new study published in the European Journal of Preventive Cardiology. The risks are especially high in the first decade after giving birth, the researchers found.
Preeclampsia is the onset of high blood pressure after the 20th week of pregnancy combined with signs of organ damage, such as excess protein in the urine. It can occur in up to 8% of pregnancies, and the association between preeclampsia and long-term cardiac risks is well-known. But new research suggests these risks appear much earlier in life than expected – as early as age 30 – at a time when women are often not screened for signs of heart trouble
“Targeted interventions cannot wait until women with preeclampsia become eligible for conventional screening programs in middle age,” Sara Hallum, PhD, a coauthor of the study, told this news organization.
Dr. Hallum, who was an epidemiologist at the University of Copenhagen at the time of the study, and colleagues evaluated the medical histories of more than 1.1 million women in Denmark who became pregnant once or twice between 1978 and 2017. Of this group, 3% had experienced preeclampsia. They compared rates of heart attack and stroke between the two groups over time.
While 1.2% of the entire study population had experienced a heart attack or stroke within 20 years of giving birth, 2% of the women with a history of preeclampsia had such an event. Within the first decade after delivery, women with a history of preeclampsia were four times as likely to have a heart attack and three times as likely to have a stroke as other women.
Women aged 30-39 with a history of preeclampsia were nearly five times as likely to have a heart attack and three times as likely to have a stroke as similar-aged women. And if a woman gave birth twice and had preeclampsia only during the second pregnancy, she was at especially high risk for a heart attack, the researchers found.
“Women with a history of preeclampsia should be monitored routinely for modifiable risk factors, particularly for increased blood pressure,” Dr. Hallum said.
The Danish study population is racially homogeneous, so the researchers were not able to distinguish the effects of preeclampsia by racial group. In the United States, strong evidence shows that Black women experience the effects of preeclampsia more than others.
A useful clue to cardiac risk
Ellen Seely, MD, an endocrinologist at Brigham and Women’s Hospital in Boston, who specializes in preeclampsia, said physicians are less likely to ask women who have been pregnant if they had experienced preeclampsia than to ask if they smoke or have a family history of heart attacks. As a result, they may miss a looming cardiovascular event, especially in younger women who appear healthy.
“Emerging high blood pressure shouldn’t be ignored” in a seemingly healthy young woman, Dr. Seely said, particularly if that woman has divulged a history of preeclampsia. The doctor’s first step should be to verify hypertension, Dr. Seely said. If high blood pressure is evident, immediate treatment – such as encouraging more physical activity and a healthier diet – should follow. Watchful waiting in such cases is inappropriate, she added.
Although the experience of having preeclampsia is unpleasant and scary, Dr. Seely noted that in at least one way it can prove advantageous. Some women who did not experience preeclampsia will end up having a heart attack, sometimes with no prior warning that anything was amiss. At least a history of preeclampsia provides a clue that women should take care of their hearts.
“The patient carries their history with them wherever they go,” Dr. Seely said. For now, this reality often requires women to mention their pregnancy history even if a provider doesn’t ask. Someday, Dr. Seely said, asking about that history will become just as routine for providers as asking about family history.
The study was funded by the Danish Heart Foundation. Dr. Hallum and Dr. Seely have reported no relevant financial relationships.
A version of this article first appeared on Medscape.com.
FROM THE EUROPEAN JOURNAL OF PREVENTIVE CARDIOLOGY
High HDL-C levels linked to increased fracture risk
High levels of high-density lipoprotein cholesterol (HDL-C) in older adults are associated with a higher risk of sustaining a fracture than lower HDL-C levels, a new study suggests.
“Two animal studies showing that HDL-C reduces bone mineral density by reducing osteoblast number and function provide a plausible explanation for why high HDL-C may increase the risk of fractures,” Monira Hussain, MBBS, MPH, PhD, of Monash University in Melbourne, told this news organization. “So, it was not surprising when our analyses provided evidence that amongst those in the highest quintile of HDL-C (> 74 mg/dL), there was a [33%] increased risk of fractures.”
After adjustment, one standard deviation increment in HDL-C level was associated with a 14% higher risk of fracture during a 4-year follow-up.
Based on this and other studies, Dr. Hussain said, “I believe that the finding of a very high HDL-C [should] alert clinicians to a higher risk of mortality, fractures, and possibly other threats to their patient’s health.”
The study was published online in JAMA Cardiology.
Independent risk factor
For this report, the researchers conducted a post hoc analysis of data from the Aspirin in Reducing Events in the Elderly (ASPREE) clinical trial and the ASPREE-Fracture substudy.
ASPREE was a double-blind, randomized, placebo-controlled primary prevention trial of aspirin. Participants were 16,703 community-dwelling Australians and 2,411 individuals from the United States with a mean age of 75 and without evident cardiovascular disease, dementia, physical disability, or life-limiting chronic illness.
The ASPREE-Fracture substudy collected data on fractures reported post randomization from the Australian participants. Fractures were confirmed by imaging and adjudicated by an expert panel and included both traumatic and minimal trauma fractures.
Of the 16,262 participants who had a plasma HDL-C measurement at baseline (55% women), 1,659 (10.2%) experienced at least one fracture over a median of 4 years. This included 711 minimal trauma fractures (for example, falls from standing height) and 948 other trauma fractures, mainly falls on stairs, ladders, or stools.
Higher rates of fractures occurred in the highest quintile of HDL-C level where the mean level was 89 mg/dL. At baseline, participants in that quintile had a lower BMI, a high prevalence of current/former smoking and current alcohol use, 12 years or longer of school, more physical activity, and higher use of antiosteoporosis medication. They also had less chronic kidney disease, diabetes, prefrailty/frailty, or treatment with lipid-lowering drugs.
In a fully adjusted model, each standard deviation increment in HDL-C level was associated with a 14% higher risk of fractures (hazard ratio, 1.14). When analyzed in quintiles, compared with participants in Q1, those in Q5 had a 33% higher risk for fracture (HR, 1.33).
Prevalence rates were similar between the sexes. The increase in fracture risk appeared to be independent of traditional risk factors for fractures, including age, sex, physical activity, alcohol use, frailty, BMI, smoking status, diabetes, chronic kidney disease, use of lipid-lowering or antiosteoporosis drugs, and education, the authors note.
The results persisted in sensitivity analyses in restricted subgroups of interest and in stratified analyses – including, for example, only minimal fractures; participants not taking antiosteoporosis drugs or statins; never smokers; nondrinkers; and those engaging in minimal physical activity (walking less than 30 minutes per day).
No association was observed between non–HDL-C levels and fractures.
The authors conclude that the study “provides robust evidence that higher levels of HDL-C are associated with incident fractures in both male and female individuals, independent of conventional risk factors.”
Clinically useful?
Commenting on the study for this news organization, Marilyn Tan, MD, clinic chief of the Endocrine Clinic and clinical associate professor of medicine at Stanford (Calif.) University, said, “I certainly would not recommend anyone do anything to actively lower their HDL levels. HDL levels are largely determined by genetics, diet, and lifestyle, with some effects from certain medications/supplements. Studies have demonstrated that moderately higher HDL levels may be protective for atherosclerosis.”
In the current study, she said, “Causation has not been proven, and importantly there is no evidence that reducing HDL levels reduces fracture risk. Also, this association between raised HDL levels and fracture risk has not been demonstrated consistently in other studies.”
Furthermore, she noted, the preclinical trials on which the authors based their hypothesis – that is, an association between HDL and a reduction in the number and function of osteoblasts – “has not been demonstrated widely in human subjects.”
“We have a large armamentarium of FDA-approved treatments for osteoporosis that have been clinically proven to reduce fracture risk very significantly, and these are the tools [in addition to lifestyle changes] we should use to reduce fracture risk,” Dr. Tan concluded.
John Wilkins, MD, of Northwestern University, Chicago, and Anand Rohatgi, MD, MSCS, of UT Southwestern Medical Center, Dallas, also point out some limitations of the study in a related editorial.
They note the inclusion of predominantly healthy adults with a mean age of 75, a population that could yield different findings from middle-aged cohorts with chronic illnesses, as well as a lack of clarity regarding the possible role of alcohol intake among the study participants.
Furthermore, the editorialists write, although significant associations were shown in this study, “models were not adjusted for detailed measures of exercise/activity, triglycerides, or any other lipids, including other HDL compositional measures such as HDL-P or ApoA-I levels. There was no assessment of whether HDL-C improved discrimination, reclassification, or any other validated measures of risk prediction performance.
“Taken together,” they conclude, “this study alone leaves several unanswered questions as to whether high HDL-C could be a useful biomarker to detect fracture risk.”
No commercial funding was disclosed. The authors report no relevant financial relationships.
A version of this article originally appeared on Medscape.com.
Medicare policy tweak on LVADs may reduce access to transplant
A recent change in Medicare policy designed to increase access to left ventricular assist devices (LVADs) may have had the unintended consequence of increasing inequalities in access to heart transplant for patients with advanced heart failure.
In December 2020, the Centers for Medicare & Medicaid Services relaxed restrictions on centers that implant LVADs but don’t perform heart transplants. Specifically, they dropped the requirement that LVAD-only centers obtain permission from a Medicare-approved heart transplant center authorizing LVAD implantation with “bridge-to-transplant” (BTT) intent, meaning the patient is a transplant candidate.
While the relaxed requirement has the potential to increase access to LVADs for appropriate patients, a look back at 22,221 LVAD recipients found that patients who received LVADs at transplant-capable centers had a 79% higher likelihood of receiving a BTT LVAD designation.
The 2-year heart transplant rate following LVAD implant was 25.6% for patients who received an LVAD at a heart transplant center, compared with 11.9% at LVAD-only centers.
Thomas Cascino, MD, with University of Michigan Health Frankel Cardiovascular Center, Ann Arbor, and colleagues reported their findings in JAMA Network Open.
Differential assessment?
Nontransplant LVAD centers are increasing in number in the United States now that the CMS has made establishing an LVAD-only center easier.
“Although there should be enthusiasm for the potential of LVAD-only centers to increase access to LVAD, it appears that receiving an LVAD at a center that does not perform transplants results in differential assessment of transplant eligibility at the time of LVAD implant and inequities in receipt of transplant,” Dr. Cascino and colleagues said.
“Being cared for at a center that does not perform heart transplant should not result in a lesser chance to receive a heart transplant,” Dr. Cascino added in a university news release. “Our study shows that this disparity existed before the policy change, and we think it will likely grow larger now that there is less collaboration.”
The CMS policy will likely “further challenge equity in access to transplant for patients seeking care at nontransplant centers and may have the unintended consequence of contributing to increasing inequities in access to transplants, as has been feared,” the researchers wrote.
They also note that recent changes in the adult heart allocation system under the United Network for Organ Sharing have significantly reduced the likelihood of transplant after durable LVAD implant unless candidates are listed as being at higher urgency status owing to an LVAD complication or clinical deterioration.
“The reality is that durable LVADs are much less likely to be a bridge to the best therapy (that is, transplant) in the current allocation system. As a result, there is a critical need to select appropriate durable LVAD and transplant candidates at the initial evaluation,” the authors said.
“This puts the onus on the transplant community to select appropriate LVAD and transplant candidates during the initial evaluation. We need a system in which any patient can walk into the same hospital and get the right therapy for them,” Dr. Cascino added in the news release.
The research was supported in part through funding from the University of Michigan Health department of cardiac surgery and the National Institutes of Health, National Heart, Lung, and Blood Institute. Dr. Cascino has received grants from Johnson & Johnson.
A version of this article first appeared on Medscape.com.
FROM JAMA NETWORK OPEN
Clarity on torsemide vs. furosemide in HF: TRANSFORM-HF published
Survival and readmission risk were similar whether patients hospitalized with heart failure (HF) were discharged on furosemide or torsemide in a randomized trial.
The study, TRANSFORM-HF, helps fill a major gap in the sparse evidence base guiding diuretic therapy in patients with a history of HF hospitalization. In that setting, for example, results suggest that discharge on any appropriate loop diuretic is more important than which loop diuretic is chosen.
TRANSFORM-HF is no ordinary randomized trial. Designed as a pragmatic comparative effectiveness study, it featured a streamlined protocol and other adaptations that made it easier and cheaper to conduct but that have also complicated its interpretation, the trialists and some observers acknowledge.
Perceived torsemide advantages
Furosemide may be the most-prescribed loop diuretic in HF, but in practice – based on some limited evidence – clinicians often prefer torsemide for its perceived advantages that include greater bioavailability, potassium sparing, and potentially helpful pleiotropic effects.
TRANSFORM-HF, however, provides no evidence to support such a preference. The primary endpoint of all-cause mortality was about 26% over a median 17 months whether patients were assigned to an initial furosemide or torsemide-first strategy, regardless of ejection fraction. Composite rates of death or hospitalization at 12 months also weren’t significantly different, at about 49% and 47%, respectively.
The findings suggest that clinicians may safely continue to prescribe either loop diuretic at their discretion, now with the support of data from a randomized trial.
TRANSFORM-HF was published in the Journal of the American Medical Association, with lead author Robert J. Mentz, MD, Duke University School of Medicine, Durham, N.C.

Dr. Mentz had also presented the trial’s preliminary results at the November American Heart Association Scientific Sessions in Chicago. The findings unveiled at the meeting and those published in the journal are essentially the same.
Reflections of standard practice
With its pragmatic design, TRANSFORM-HF entered a diverse HF population broadly representative of actual clinical practice. Patients were managed with few restrictions in a protocol that allowed, for example, loop-diuretic crossovers and other discretionary diuretic changes.
Diuretic dosing also varied significantly between the groups, and there was an unexpectedly high prevalence of diuretic withdrawal, the published report notes. Those factors, it states, may have “diminished” the trial’s ability “to distinguish the hypothesized between-group differences.”
Still, the trial “should be celebrated for dispelling a long-standing myth, based on surrogate markers and small trials, of the superiority of torsemide over furosemide,” writes Michelle M. Kittleson, MD, PhD, Smidt Heart Institute, Cedars-Sinai Medical Center, Los Angeles, in an accompanying editorial .
Now, she continues, “when faced with a patient with heart failure and congestive symptoms, clinicians can focus their energy on what really matters: Not the relative merits of different loop diuretics, but rather the initiation and optimization of evidence and guideline-based therapies to help their patients feel better and live longer.”
Trial design caveats
But that pragmatic design raises cautions, the editorial notes. “Pragmatic trials are more flexible and nimbler in design and execution, but this agility comes at a cost. An overly heterogeneous patient population can impact the trial’s ability to assess efficacy of therapies while minimally intensive follow-up precludes comprehensive outcome assessment.”
The study’s 2,859 patients hospitalized with HF were assigned to open-label treatment with furosemide or torsemide at more than 60 U.S. centers. Of the 1,428 and 1,431 patients, respectively, about 37% were women and 34% were African American.
The hazard ratio for all cause mortality across the 17.4-month follow-up, torsemide versus furosemide, was 1.02 (95% confidence interval, 0.89-1.18). The HR for death or hospitalization for any cause at 12 months was 0.92 (95% CI, 0.83-1.02). And the rate ratio for 12-month all-cause hospitalization was 0.94 (95% CI, 0.84-1.07).
“TRANSFORM-HF joins a catalog of cautionary tales in cardiology, whereby carefully executed negative trials have refuted the misleading promise of plausible surrogate end points and preliminary data,” Dr. Kittleson writes.
“The lesson: Clinicians should have a healthy suspicion for plausible pathophysiology, surrogate end points, and nonrandomized data as the sole basis of defining superiority of an intervention.”
TRANSFORM-HF was funded by the National Institutes of Health. Dr. Mentz reports receiving grants from American Regent and Novartis; personal fees from AstraZeneca, Boehringer Ingelheim/Eli Lilly, Cytokinetics, Bayer, Merck, and Pharmacosmos; and research support from Abbott, Amgen, Bayer, Boston Scientific, Fast BioMedical, Gilead, Innolife, Medtronic, Relypsa, Respicardia, Roche, Sanofi, Vifor, Windtree Therapeutics, and Zoll. Disclosures for the other authors can be found with the original article. Dr. Kittleson reports no relevant financial relationships.
A version of this article first appeared on Medscape.com.
Survival and readmission risk were similar whether patients hospitalized with heart failure (HF) were discharged on furosemide or torsemide in a randomized trial.
The study, TRANSFORM-HF, helps fill a major gap in the sparse evidence base guiding diuretic therapy in patients with a history of HF hospitalization. In that setting, for example, results suggest that discharge on any appropriate loop diuretic is more important than which loop diuretic is chosen.
TRANSFORM-HF is no ordinary randomized trial. Designed as a pragmatic comparative effectiveness study, it featured a streamlined protocol and other adaptations that made it easier and cheaper to conduct but that have also complicated its interpretation, the trialists and some observers acknowledge.
Perceived torsemide advantages
Furosemide may be the most-prescribed loop diuretic in HF, but in practice – based on some limited evidence – clinicians often prefer torsemide for its perceived advantages that include greater bioavailability, potassium sparing, and potentially helpful pleiotropic effects.
TRANSFORM-HF, however, provides no evidence to support such a preference. The primary endpoint of all-cause mortality was about 26% over a median 17 months whether patients were assigned to an initial furosemide or torsemide-first strategy, regardless of ejection fraction. Composite rates of death or hospitalization at 12 months also weren’t significantly different, at about 49% and 47%, respectively.
The findings suggest that clinicians may safely continue to prescribe either loop diuretic at their discretion, now with the support of data from a randomized trial.
TRANSFORM-HF was published in the Journal of the American Medical Association, with lead author Robert J. Mentz, MD, Duke University School of Medicine, Durham, N.C.
Dr. Mentz had also presented the trial’s preliminary results at the November American Heart Association Scientific Sessions in Chicago. The findings unveiled at the meeting and those published in the journal are essentially the same.
Reflections of standard practice
With its pragmatic design, TRANSFORM-HF entered a diverse HF population broadly representative of actual clinical practice. Patients were managed with few restrictions in a protocol that allowed, for example, loop-diuretic crossovers and other discretionary diuretic changes.
Diuretic dosing also varied significantly between the groups, and there was an unexpectedly high prevalence of diuretic withdrawal, the published report notes. Those factors, it states, may have “diminished” the trial’s ability “to distinguish the hypothesized between-group differences.”
Still, the trial “should be celebrated for dispelling a long-standing myth, based on surrogate markers and small trials, of the superiority of torsemide over furosemide,” writes Michelle M. Kittleson, MD, PhD, Smidt Heart Institute, Cedars-Sinai Medical Center, Los Angeles, in an accompanying editorial .
Now, she continues, “when faced with a patient with heart failure and congestive symptoms, clinicians can focus their energy on what really matters: Not the relative merits of different loop diuretics, but rather the initiation and optimization of evidence and guideline-based therapies to help their patients feel better and live longer.”
Trial design caveats
But that pragmatic design raises cautions, the editorial notes. “Pragmatic trials are more flexible and nimbler in design and execution, but this agility comes at a cost. An overly heterogeneous patient population can impact the trial’s ability to assess efficacy of therapies while minimally intensive follow-up precludes comprehensive outcome assessment.”
The study’s 2,859 patients hospitalized with HF were assigned to open-label treatment with furosemide or torsemide at more than 60 U.S. centers. Of the 1,428 and 1,431 patients, respectively, about 37% were women and 34% were African American.
The hazard ratio for all cause mortality across the 17.4-month follow-up, torsemide versus furosemide, was 1.02 (95% confidence interval, 0.89-1.18). The HR for death or hospitalization for any cause at 12 months was 0.92 (95% CI, 0.83-1.02). And the rate ratio for 12-month all-cause hospitalization was 0.94 (95% CI, 0.84-1.07).
“TRANSFORM-HF joins a catalog of cautionary tales in cardiology, whereby carefully executed negative trials have refuted the misleading promise of plausible surrogate end points and preliminary data,” Dr. Kittleson writes.
“The lesson: Clinicians should have a healthy suspicion for plausible pathophysiology, surrogate end points, and nonrandomized data as the sole basis of defining superiority of an intervention.”
TRANSFORM-HF was funded by the National Institutes of Health. Dr. Mentz reports receiving grants from American Regent and Novartis; personal fees from AstraZeneca, Boehringer Ingelheim/Eli Lilly, Cytokinetics, Bayer, Merck, and Pharmacosmos; and research support from Abbott, Amgen, Bayer, Boston Scientific, Fast BioMedical, Gilead, Innolife, Medtronic, Relypsa, Respicardia, Roche, Sanofi, Vifor, Windtree Therapeutics, and Zoll. Disclosures for the other authors can be found with the original article. Dr. Kittleson reports no relevant financial relationships.
A version of this article first appeared on Medscape.com.
FROM JAMA

The longevity gene: Healthy mutant reverses heart aging
Everybody wants a younger heart
As more people live well past 90, scientists have been taking a closer look at how they’ve been doing it. Mostly it boiled down to genetics. You either had it or you didn’t. Well, a recent study suggests that doesn’t have to be true anymore, at least for the heart.
Scientists from the United Kingdom and Italy found an antiaging gene in some centenarians that has shown possible antiaging effects in mice and in human heart cells. A single administration of the mutant antiaging gene, they found, stopped heart function decay in middle-aged mice and even reversed the biological clock by the human equivalent of 10 years in elderly mice.
When the researchers applied the antiaging gene to samples of human heart cells from elderly people with heart problems, the cells “resumed functioning properly, proving to be more efficient in building new blood vessels,” they said in a written statement. It all kind of sounds like something out of Dr. Frankenstein’s lab.
I want to believe … in better sleep
The “X-Files” theme song plays. Mulder and Scully are sitting in a diner, breakfast laid out around them. The diner is quiet, with only a few people inside.
Mulder: I’m telling you, Scully, there’s something spooky going on here.
Scully: You mean other than the fact that this town in Georgia looks suspiciously like Vancouver?
Mulder: Not one person we spoke to yesterday has gotten a full night’s sleep since the UFO sighting last month. I’m telling you, they’re here, they’re experimenting.
Scully: Do you really want me to do this to you again?
Mulder: Do what again?
Scully: There’s nothing going on here that can’t be explained by the current research. Why, in January 2023 a study was published revealing a link between poor sleep and belief in paranormal phenomena like UFOS, demons, or ghosts. Which probably explains why you’re on your third cup of coffee for the morning.
Mulder: Scully, you’ve literally been abducted by aliens. Do we have to play this game every time?
Scully: Look, it’s simple. In a sample of nearly 9,000 people, nearly two-thirds of those who reported experiencing sleep paralysis or exploding head syndrome reported believing in UFOs and aliens walking amongst humanity, despite making up just 3% of the overall sample.

Furthermore, about 60% of those reporting sleep paralysis also reported believing near-death experiences prove the soul lingers on after death, and those with stronger insomnia symptoms were more likely to believe in the devil.
Mulder: Aha!
Scully: Aha what?
Mulder: You’re a devout Christian. You believe in the devil and the soul.
Scully: Yes, but I don’t let it interfere with a good night’s sleep, Mulder. These people saw something strange, convinced themselves it was a UFO, and now they can’t sleep. It’s a vicious cycle. The study authors even said that people experiencing strange nighttime phenomena could interpret this as evidence of aliens or other paranormal beings, thus making them even more susceptible to further sleep disruption and deepening beliefs. Look who I’m talking to.
Mulder: Always with the facts, eh?
Scully: I am a doctor, after all. And if you want more research into how paranormal belief and poor sleep quality are linked, I’d be happy to dig out the literature, because the truth is out there, Mulder.
Mulder: I hate you sometimes.
It’s ChatGPT’s world. We’re just living in it
Have you heard about ChatGPT? The artificial intelligence chatbot was just launched in November and it’s already more important to the Internet than either Vladimir Putin or “Rick and Morty.”
What’s that? You’re wondering why you should care? Well, excuuuuuse us, but we thought you might want to know that ChatGPT is in the process of taking over the world. Let’s take a quick look at what it’s been up to.
“ChatGPT bot passes law school exam”
“ChatGPT passes MBA exam given by a Wharton professor”
“A freelance writer says ChatGPT wrote a $600 article in just 30 seconds”
And here’s one that might be of interest to those of the health care persuasion: “ChatGPT can pass part of the U.S. Medical Licensing Exam.” See? It’s coming for you, too.
The artificial intelligence known as ChatGPT “performed at >50% accuracy across [the three USMLE] examinations, exceeding 60% in most analyses,” a group of researchers wrote on the preprint server medRxiv, noting that 60% is usually the pass threshold for humans taking the exam in any given year.

ChatGPT was not given any special medical training before the exam, but the investigators pointed out that another AI, PubMedGPT, which is trained exclusively on biomedical domain literature, was only 50.8% accurate on the USMLE. Its reliance on “ongoing academic discourse that tends to be inconclusive, contradictory, or highly conservative or noncommittal in its language” was its undoing, the team suggested.
To top it off, ChatGPT is listed as one of the authors at the top of the medRxiv report, with an acknowledgment at the end saying that “ChatGPT contributed to the writing of several sections of this manuscript.”
We’ve said it before, and no doubt we’ll say it again: We’re doomed.
Everybody wants a younger heart
As more people live well past 90, scientists have been taking a closer look at how they’ve been doing it. Mostly it boiled down to genetics. You either had it or you didn’t. Well, a recent study suggests that doesn’t have to be true anymore, at least for the heart.
Scientists from the United Kingdom and Italy found an antiaging gene in some centenarians that has shown possible antiaging effects in mice and in human heart cells. A single administration of the mutant antiaging gene, they found, stopped heart function decay in middle-aged mice and even reversed the biological clock by the human equivalent of 10 years in elderly mice.
When the researchers applied the antiaging gene to samples of human heart cells from elderly people with heart problems, the cells “resumed functioning properly, proving to be more efficient in building new blood vessels,” they said in a written statement. It all kind of sounds like something out of Dr. Frankenstein’s lab.
I want to believe … in better sleep
The “X-Files” theme song plays. Mulder and Scully are sitting in a diner, breakfast laid out around them. The diner is quiet, with only a few people inside.
Mulder: I’m telling you, Scully, there’s something spooky going on here.
Scully: You mean other than the fact that this town in Georgia looks suspiciously like Vancouver?
Mulder: Not one person we spoke to yesterday has gotten a full night’s sleep since the UFO sighting last month. I’m telling you, they’re here, they’re experimenting.
Scully: Do you really want me to do this to you again?
Mulder: Do what again?
Scully: There’s nothing going on here that can’t be explained by the current research. Why, in January 2023 a study was published revealing a link between poor sleep and belief in paranormal phenomena like UFOS, demons, or ghosts. Which probably explains why you’re on your third cup of coffee for the morning.
Mulder: Scully, you’ve literally been abducted by aliens. Do we have to play this game every time?
Scully: Look, it’s simple. In a sample of nearly 9,000 people, nearly two-thirds of those who reported experiencing sleep paralysis or exploding head syndrome reported believing in UFOs and aliens walking amongst humanity, despite making up just 3% of the overall sample.
Furthermore, about 60% of those reporting sleep paralysis also reported believing near-death experiences prove the soul lingers on after death, and those with stronger insomnia symptoms were more likely to believe in the devil.
Mulder: Aha!
Scully: Aha what?
Mulder: You’re a devout Christian. You believe in the devil and the soul.
Scully: Yes, but I don’t let it interfere with a good night’s sleep, Mulder. These people saw something strange, convinced themselves it was a UFO, and now they can’t sleep. It’s a vicious cycle. The study authors even said that people experiencing strange nighttime phenomena could interpret this as evidence of aliens or other paranormal beings, thus making them even more susceptible to further sleep disruption and deepening beliefs. Look who I’m talking to.
Mulder: Always with the facts, eh?
Scully: I am a doctor, after all. And if you want more research into how paranormal belief and poor sleep quality are linked, I’d be happy to dig out the literature, because the truth is out there, Mulder.
Mulder: I hate you sometimes.
It’s ChatGPT’s world. We’re just living in it
Have you heard about ChatGPT? The artificial intelligence chatbot was just launched in November and it’s already more important to the Internet than either Vladimir Putin or “Rick and Morty.”
What’s that? You’re wondering why you should care? Well, excuuuuuse us, but we thought you might want to know that ChatGPT is in the process of taking over the world. Let’s take a quick look at what it’s been up to.
“ChatGPT bot passes law school exam”
“ChatGPT passes MBA exam given by a Wharton professor”
“A freelance writer says ChatGPT wrote a $600 article in just 30 seconds”
And here’s one that might be of interest to those of the health care persuasion: “ChatGPT can pass part of the U.S. Medical Licensing Exam.” See? It’s coming for you, too.
The artificial intelligence known as ChatGPT “performed at >50% accuracy across [the three USMLE] examinations, exceeding 60% in most analyses,” a group of researchers wrote on the preprint server medRxiv, noting that 60% is usually the pass threshold for humans taking the exam in any given year.
ChatGPT was not given any special medical training before the exam, but the investigators pointed out that another AI, PubMedGPT, which is trained exclusively on biomedical domain literature, was only 50.8% accurate on the USMLE. Its reliance on “ongoing academic discourse that tends to be inconclusive, contradictory, or highly conservative or noncommittal in its language” was its undoing, the team suggested.
To top it off, ChatGPT is listed as one of the authors at the top of the medRxiv report, with an acknowledgment at the end saying that “ChatGPT contributed to the writing of several sections of this manuscript.”
We’ve said it before, and no doubt we’ll say it again: We’re doomed.
Canadian guidance recommends reducing alcohol consumption
“Drinking less is better,” says the guidance, which replaces Canada’s 2011 Low-Risk Drinking Guidelines (LRDGs).
Developed in consultation with an executive committee from federal, provincial, and territorial governments; national organizations; three scientific expert panels; and an internal evidence review working group, the guidance presents the following findings:
- Consuming no drinks per week has benefits, such as better health and better sleep, and it’s the only safe option during pregnancy.
- Consuming one or two standard drinks weekly will likely not have alcohol-related consequences.
- Three to six drinks raise the risk of developing breast, colon, and other cancers.
- Seven or more increase the risk of heart disease or stroke.
- Each additional drink “radically increases” the risk of these health consequences.
“Alcohol is more harmful than was previously thought and is a key component of the health of your patients,” Adam Sherk, PhD, a scientist at the Canadian Institute for Substance Use Research at the University of Victoria (B.C.), and a member of the scientific expert panel that contributed to the guidance, said in an interview. “Display and discuss the new guidance with your patients with the main message that drinking less is better.”
Peter Butt, MD, a clinical associate professor at the University of Saskatchewan, Saskatoon, and cochair of the guidance project, said in an interview: “The World Health Organization has identified over 200 ICD-coded conditions associated with alcohol use. This creates many opportunities to inquire into quantity and frequency of alcohol use, relate it to the patient’s health and well-being, and provide advice on reduction.”
“Canada’s Guidance on Alcohol and Health: Final Report” and a related infographic were published online Jan. 17.
Continuum of risk
The impetus for the new guidance came from the fact that “our 2011 LRDGs were no longer current, and there was emerging evidence that people drinking within those levels were coming to harm,” said Dr. Butt.
That evidence indicates that alcohol causes at least seven types of cancer, mostly of the breast or colon; is a risk factor for most types of heart disease; and is a main cause of liver disease. Evidence also indicates that avoiding drinking to the point of intoxication will reduce people’s risk of perpetrating alcohol-related violence.
Responding to the need to accurately quantify the risk, the guidance defines a “standard” drink as 12 oz of beer, cooler, or cider (5% alcohol); 5 oz of wine (12% alcohol); and 1.5 oz of spirits such as whiskey, vodka, or gin (40% alcohol).
Using different mortality risk thresholds, the project’s experts developed the following continuum of risk:
- Low for individuals who consume two standard drinks or fewer per week
- Moderate for those who consume from three to six standard drinks per week
- Increasingly high for those who consume seven standard drinks or more per week
The guidance makes the following observations:
- Consuming more than two standard drinks per drinking occasion is associated with an increased risk of harms to self and others, including injuries and violence.
- When pregnant or trying to get pregnant, no amount of alcohol is safe.
- When breastfeeding, not drinking is safest.
- Above the upper limit of the moderate risk zone, health risks increase more steeply for females than males.
- Far more injuries, violence, and deaths result from men’s alcohol use, especially for per occasion drinking, than from women’s alcohol use.
- Young people should delay alcohol use for as long as possible.
- Individuals should not start to use alcohol or increase their alcohol use for health benefits.
- Any reduction in alcohol use is beneficial.
Other national guidelines
“Countries that haven’t updated their alcohol use guidelines recently should do so, as the evidence regarding alcohol and health has advanced considerably in the past 10 years,” said Dr. Sherk. He acknowledged that “any time health guidance changes substantially, it’s reasonable to expect a period of readjustment.”
“Some will be resistant,” Dr. Butt agreed. “Some professionals will need more education than others on the health effects of alcohol. Some patients will also be more invested in drinking than others. The harm-reduction, risk-zone approach should assist in the process of engaging patients and helping them reduce over time.
“Just as we benefited from the updates done in the United Kingdom, France, and especially Australia, so also researchers elsewhere will critique our work and our approach and make their own decisions on how best to communicate with their public,” Dr. Butt said. He noted that Canada’s contributions regarding the association between alcohol and violence, as well as their sex/gender approach to the evidence, “may influence the next country’s review.”
Commenting on whether the United States should consider changing its guidance, Timothy Brennan, MD, MPH, chief of clinical services for the Addiction Institute of Mount Sinai Health System in New York, said in an interview, “A lot of people will be surprised at the recommended limits on alcohol. Most think that they can have one or two glasses of alcohol per day and not have any increased risk to their health. I think the Canadians deserve credit for putting themselves out there.”
Dr. Brennan said there will “certainly be pushback by the drinking lobby, which is very strong both in the U.S. and in Canada.” In fact, the national trade group Beer Canada was recently quoted as stating that it still supports the 2011 guidelines and that the updating process lacked full transparency and expert technical peer review.
Nevertheless, Dr. Brennan said, “it’s overwhelmingly clear that alcohol affects a ton of different parts of our body, so limiting the amount of alcohol we take in is always going to be a good thing. The Canadian graphic is great because it color-codes the risk. I recommend that clinicians put it up in their offices and begin quantifying the units of alcohol that are going into a patient’s body each day.”
A version of this article originally appeared on Medscape.com.
AHA scientific statement on rapid evaluation for suspected TIA
TIAs are “warning shots” of a future stroke and require emergency evaluation, Hardik Amin, MD, chair of the writing committee and medical stroke director, Yale New Haven (Conn.) Hospital, said in an AHA podcast.
A key aim of the scientific statement is to help clinicians properly risk-stratify patients with suspected TIA and determine which patients need to be admitted to the hospital and which patients might be safely discharged as long as proper and prompt follow-up has been arranged, Dr. Amin explained.
The statement, published online in the journal Stroke, addresses “how we can identify and be confident in diagnosing a TIA patient and what might suggest an alternative diagnosis,” he added.
Diagnostic challenge
It’s estimated that nearly one in five people who suffer a TIA will have a full-blown stroke within 3 months; close to half of these strokes will happen within 2 days.
The challenge with TIAs is that they can be tough to diagnose because many patients no longer have symptoms when they arrive at the emergency department. There is also no confirmatory test. Limited resources and access to stroke specialists in rural centers may exacerbate these challenges, the authors noted.
The statement pointed out that the F.A.S.T. acronym for stroke symptoms (Face drooping, Arm weakness, Speech difficulty, Time to call 911) can also be used to identify a TIA – even if the symptoms resolve.
The statement also provided guidance on how to tell the difference between a TIA and a TIA mimic.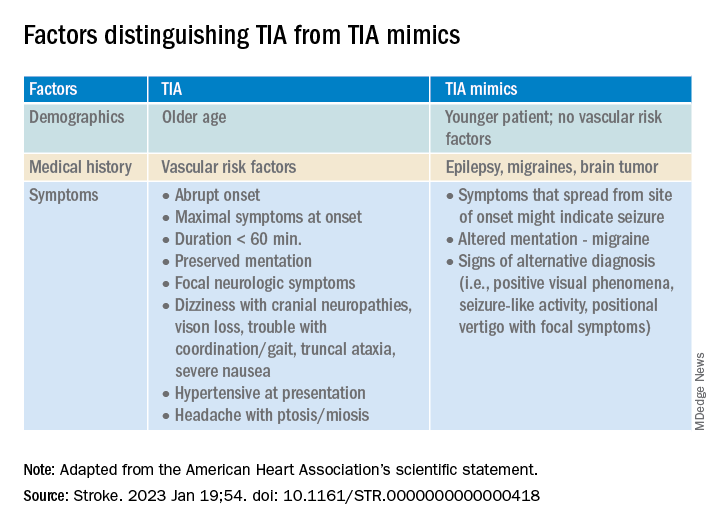
If available, a noncontrast head CT (NCCT) scan should be done initially in the emergency department to evaluate for subacute ischemia, hemorrhage, or mass lesion. Although the sensitivity of NCCT to detect an acute infarct is low, NCCT is useful for ruling out TIA mimics, the writing group said.
Multimodal brain MRI is the “preferred” method to evaluate for acute ischemic infarct and ideally should be obtained within 24 hours of symptom onset, and in most centers will follow an NCCT.
“When MRI cannot be obtained acutely to definitively distinguish TIA from stroke, it remains reasonable to make a clinical diagnosis of TIA in the ED on the basis of a negative NCCT and symptom resolution within 24 hours,” the authors said.
“A potential next step would be hospital admission for MRI, comprehensive workup, and neurology consultation. Other options might include transferring patients to a facility with advanced imaging and vascular neurology expertise or arranging a timely (ideally < 24 hours) outpatient MRI,” they advised.
The statement also provides guidance on the advantages, limitations, and considerations of Doppler ultrasonography, CT angiography, and magnetic resonance angiography for TIA assessment.
Once TIA is diagnosed, a cardiac work-up is advised because of the potential for heart-related factors to cause a TIA.
An individual’s risk of future stroke after TIA can be rapidly assessed using the ABCD2 score, which stratifies patients into low, medium, and high risk based on age, blood pressure, clinical features, duration of symptoms, and diabetes.
“It is up to each center to use the resources available and create a pathway to ensure successful management and disposition of patients with TIA, with the ultimate goal of reducing the risk of future stroke,” the authors concluded.
This scientific statement was prepared by the volunteer writing group on behalf of the American Heart Association’s Emergency Neurovascular Care Committee of the Stroke Council and the Council on Peripheral Vascular Disease. The American Academy of Neurology affirms the value of this statement as an educational tool for neurologists, and it is endorsed by the American Association of Neurological Surgeons/Congress of Neurological Surgeons.
A version of this article first appeared on Medscape.com.
FROM STROKE