User login
More type 2 diabetes deaths from cancer than heart disease
Cancer appears to have overtaken cardiovascular disease (CVD) as a leading cause of death in adults with type 2 diabetes, a 20-year population study in England suggests.
The researchers found that, from 1998 to 2018, in more than 130,000 adults aged 35 and older with type 2 diabetes, all-cause mortality declined for all ages, but cancer mortality increased for those aged 75 and older; people with type 2 diabetes who were smokers had higher and steadily increasing cancer mortality rates; and people with type 2 diabetes had more than twice the rate of colorectal, pancreatic, liver, and endometrial cancer mortality than age- and sex-matched individuals in the general population.
The findings suggest that “cancer prevention strategies therefore deserve at least a similar level of attention as cardiovascular disease prevention, particularly in older people and for some cancers such as liver, colorectal, and pancreatic cancer,” the researchers wrote.
Tailored cancer prevention and early-detection strategies are needed to address persistent inequalities in the older population, the most deprived, and smokers, they added.
Breast cancer rates in younger women with type 2 diabetes rising
According to the researchers, “early cancer detection through changes to existing screening [programs], or more in-depth investigations for suspected/nonspecific symptoms, may reduce the number of avoidable cancer deaths in people with type 2 diabetes.”
Moreover, breast cancer rates in younger women with type 2 diabetes are rising by 4.1% per year, they wrote, which suggests such women are high risk and should be screened at a younger age, but screening age would need to be determined in cost-effectiveness analyses.
The study by Suping Ling, PhD, and colleagues was published online in Diabetologia.
Results challenge belief that preventing CVD is priority in type 2 diabetes
“The prevention of cardiovascular disease has been, and is still considered, a priority in people with diabetes,” the researchers wrote.
“Our results challenge this view by showing that cancer may have overtaken cardiovascular disease as a leading cause of death in people with type 2 diabetes.”
“The proportion of cancer deaths out of all-cause deaths remains high (> 30%) in young ages, and it was steadily increasing in older ages,” Dr. Ling, from the department of noncommunicable disease epidemiology, London School of Hygiene & Tropical Medicine, said in a comment.
“Combined with previous studies reporting decreasing CVD mortality rates,” she said, “we concluded that cancer might have overtaken CVD as the leading cause of death in people with type 2 diabetes.”
Many evidence-based cancer-prevention strategies related to lifestyle (such as being physically active, being a healthy weight, eating a better diet, stopping smoking, as summarized by the World Cancer Research Fund), are helpful for preventing both cancer and CVD, Ling observed.
However, in the medical community, many additional efforts were made for monitoring, early detection, and innovating medications for CVD, she noted. “Therefore, we would like to propose a similar level of attention and effort for cancer in people with type 2 diabetes.”
Deaths from cancer vs. all causes in patients with diabetes
The researchers identified 137,804 patients aged 35 and older who were newly diagnosed with type 2 diabetes from 1998 to 2018 in general practices in the UK that were part of the Clinical Practice Research Datalink.
Patients were a median age of 64 years and 45% were women. Most (83%) were White, followed by South Asian (3.5%), Black (2.0%), and other (3%); 8.4% had missing information for race. Patients had a median body mass index (BMI) of 30.6 kg/m2.
Researchers divided patients into socioeconomic quintiles of most to least deprived based on income, employment, education, and other factors. During a median follow-up of 8.4 years, there were 39,212 deaths (28.5%).
Cancer mortality in subgroups of patients with type 2 diabetes
Researchers analyzed annual deaths from cancer and from all causes over 20 years in subgroups of patients with type 2 diabetes.
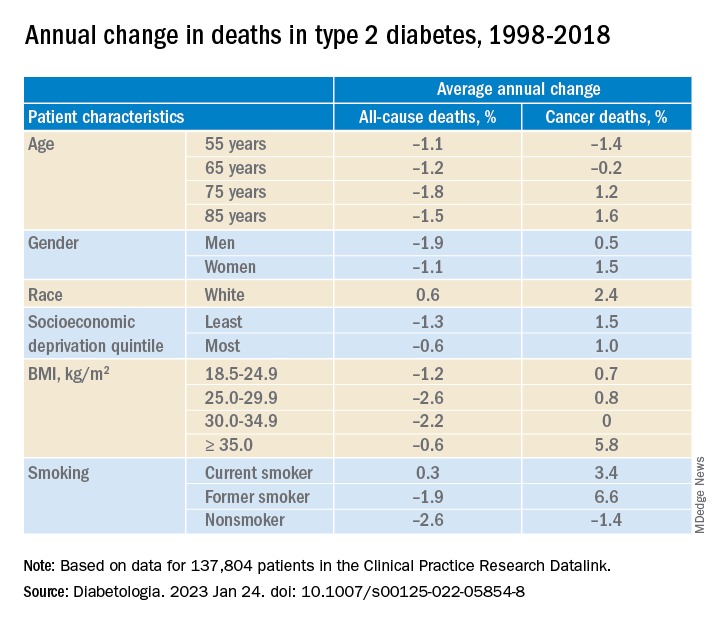
In adults with type 2 diabetes, the average percentage change in cancer mortality per year, from 1998 to 2018 decreased in people aged 55 and 65 (–1.4% and –0.2%, respectively), but increased in people aged 75 and 85 (1.2% and 1.6%, respectively); increased more in women than in men (1.5% vs 1.0%), although women had lower cancer mortality than men; and increased more in the least deprived (wealthiest) individuals than in the most deprived (1.5% vs 1.0%). Cancer mortality rates were consistently higher in the most deprived individuals, Dr. Ling noted.
Cancer mortality also increased more in people with class III obesity (BMI ≥ 35) versus normal weight (5.8% vs 0.7%) and versus other weights. In addition, there was an upward trend in cancer mortality in people who were White or former/current smokers.
Deaths from specific cancers in diabetes vs. general population
Next, researchers determined cancer mortality ratios – the cancer mortality of the patients with diabetes divided by the cancer mortality of the general population.
They determined this for all cancers, the four most common cancers in the United Kingdom (lung, colorectal, breast, and prostate), and cancers caused by type 2 diabetes (pancreatic, liver, gallbladder, and endometrial cancer), standardized by sex and age.
Mortality from all cancer was 18% higher in patients with type 2 diabetes, compared with the general population.
Overall, mortality from colorectal cancer, pancreatic cancer, and liver cancer was 2.4 times, 2.12 times, and 2.13 times higher, respectively, in patients with type 2 diabetes than in the general population.
Mortality from breast cancer was 9% higher and mortality from endometrial cancer was 2.08 times higher in women with type 2 diabetes than in women in the general population.
There was a constant upward trend for mortality rates for pancreatic, liver, and lung cancer at all ages, colorectal cancer at most ages, breast cancer at younger ages, and prostate and endometrial cancer at older ages.
The study was funded by Hope Against Cancer. Dr. Ling reported no relevant financial relationships.
A version of this article first appeared on Medscape.com.
Cancer appears to have overtaken cardiovascular disease (CVD) as a leading cause of death in adults with type 2 diabetes, a 20-year population study in England suggests.
The researchers found that, from 1998 to 2018, in more than 130,000 adults aged 35 and older with type 2 diabetes, all-cause mortality declined for all ages, but cancer mortality increased for those aged 75 and older; people with type 2 diabetes who were smokers had higher and steadily increasing cancer mortality rates; and people with type 2 diabetes had more than twice the rate of colorectal, pancreatic, liver, and endometrial cancer mortality than age- and sex-matched individuals in the general population.
The findings suggest that “cancer prevention strategies therefore deserve at least a similar level of attention as cardiovascular disease prevention, particularly in older people and for some cancers such as liver, colorectal, and pancreatic cancer,” the researchers wrote.
Tailored cancer prevention and early-detection strategies are needed to address persistent inequalities in the older population, the most deprived, and smokers, they added.
Breast cancer rates in younger women with type 2 diabetes rising
According to the researchers, “early cancer detection through changes to existing screening [programs], or more in-depth investigations for suspected/nonspecific symptoms, may reduce the number of avoidable cancer deaths in people with type 2 diabetes.”
Moreover, breast cancer rates in younger women with type 2 diabetes are rising by 4.1% per year, they wrote, which suggests such women are high risk and should be screened at a younger age, but screening age would need to be determined in cost-effectiveness analyses.
The study by Suping Ling, PhD, and colleagues was published online in Diabetologia.
Results challenge belief that preventing CVD is priority in type 2 diabetes
“The prevention of cardiovascular disease has been, and is still considered, a priority in people with diabetes,” the researchers wrote.
“Our results challenge this view by showing that cancer may have overtaken cardiovascular disease as a leading cause of death in people with type 2 diabetes.”
“The proportion of cancer deaths out of all-cause deaths remains high (> 30%) in young ages, and it was steadily increasing in older ages,” Dr. Ling, from the department of noncommunicable disease epidemiology, London School of Hygiene & Tropical Medicine, said in a comment.
“Combined with previous studies reporting decreasing CVD mortality rates,” she said, “we concluded that cancer might have overtaken CVD as the leading cause of death in people with type 2 diabetes.”
Many evidence-based cancer-prevention strategies related to lifestyle (such as being physically active, being a healthy weight, eating a better diet, stopping smoking, as summarized by the World Cancer Research Fund), are helpful for preventing both cancer and CVD, Ling observed.
However, in the medical community, many additional efforts were made for monitoring, early detection, and innovating medications for CVD, she noted. “Therefore, we would like to propose a similar level of attention and effort for cancer in people with type 2 diabetes.”
Deaths from cancer vs. all causes in patients with diabetes
The researchers identified 137,804 patients aged 35 and older who were newly diagnosed with type 2 diabetes from 1998 to 2018 in general practices in the UK that were part of the Clinical Practice Research Datalink.
Patients were a median age of 64 years and 45% were women. Most (83%) were White, followed by South Asian (3.5%), Black (2.0%), and other (3%); 8.4% had missing information for race. Patients had a median body mass index (BMI) of 30.6 kg/m2.
Researchers divided patients into socioeconomic quintiles of most to least deprived based on income, employment, education, and other factors. During a median follow-up of 8.4 years, there were 39,212 deaths (28.5%).
Cancer mortality in subgroups of patients with type 2 diabetes
Researchers analyzed annual deaths from cancer and from all causes over 20 years in subgroups of patients with type 2 diabetes.
In adults with type 2 diabetes, the average percentage change in cancer mortality per year, from 1998 to 2018 decreased in people aged 55 and 65 (–1.4% and –0.2%, respectively), but increased in people aged 75 and 85 (1.2% and 1.6%, respectively); increased more in women than in men (1.5% vs 1.0%), although women had lower cancer mortality than men; and increased more in the least deprived (wealthiest) individuals than in the most deprived (1.5% vs 1.0%). Cancer mortality rates were consistently higher in the most deprived individuals, Dr. Ling noted.
Cancer mortality also increased more in people with class III obesity (BMI ≥ 35) versus normal weight (5.8% vs 0.7%) and versus other weights. In addition, there was an upward trend in cancer mortality in people who were White or former/current smokers.
Deaths from specific cancers in diabetes vs. general population
Next, researchers determined cancer mortality ratios – the cancer mortality of the patients with diabetes divided by the cancer mortality of the general population.
They determined this for all cancers, the four most common cancers in the United Kingdom (lung, colorectal, breast, and prostate), and cancers caused by type 2 diabetes (pancreatic, liver, gallbladder, and endometrial cancer), standardized by sex and age.
Mortality from all cancer was 18% higher in patients with type 2 diabetes, compared with the general population.
Overall, mortality from colorectal cancer, pancreatic cancer, and liver cancer was 2.4 times, 2.12 times, and 2.13 times higher, respectively, in patients with type 2 diabetes than in the general population.
Mortality from breast cancer was 9% higher and mortality from endometrial cancer was 2.08 times higher in women with type 2 diabetes than in women in the general population.
There was a constant upward trend for mortality rates for pancreatic, liver, and lung cancer at all ages, colorectal cancer at most ages, breast cancer at younger ages, and prostate and endometrial cancer at older ages.
The study was funded by Hope Against Cancer. Dr. Ling reported no relevant financial relationships.
A version of this article first appeared on Medscape.com.
FROM DIABETOLOGIA
Meet the JCOM Author with Dr. Barkoudah: Teaching Quality Improvement to Internal Medicine Residents

Eye check important before starting semaglutide for diabetes
A small potential increased risk of retinopathy worsening at 1 year with injected semaglutide (Ozempic, Novo Nordisk), a glucagon-like peptide 1 (GLP-1) agonist approved for type 2 diabetes, doesn’t outweigh the drug’s cardiovascular benefits but does highlight the need for baseline ophthalmologic evaluation before initiating treatment and ongoing retinal monitoring, researchers say.
That conclusion was based on data from a meta-analysis of the seven major cardiovascular outcomes trials of GLP-1 agonists currently on the market.
The findings were recently published in Diabetes & Metabolic Syndrome: Clinical Research & Reviews, by Stewart G. Albert, MD, and colleagues.
Concerns about retinopathy worsening with the GLP-1 agonist drug class first arose from the SUSTAIN-6 cardiovascular outcomes trial for injectable semaglutide, although a subsequent analysis of data from that trial appeared to suggest the problem is likely due to rapid glucose-lowering in already vulnerable patients rather than a drug-specific effect. This effect had been previously reported, most notably in the landmark Diabetes Control and Complications Trial.
In this new meta-analysis, “we showed that with improvements in A1c there were correlations with decreases in the rate of cardiovascular events but increases in the rate of retinopathy,” Dr. Albert, of St. Louis University, told this news organization.
“As a class of drugs, we did not find an increased rate of retinopathy. The effect of GLP-1 agonists on retinopathy did not appear to be due to an immediate direct toxic effect of the drug. The worsening of the rate of retinopathy was seen with semaglutide after 1 year of therapy and when there was a decrease in A1c of 1%,” he explained.
He noted that because the increased risk was seen primarily among those who already had retinopathy at baseline, “it would seem prudent to know the level of retinopathy either before or plan for close ophthalmologic monitoring around the time of drug initiation ... We routinely evaluate patients with known type 2 diabetes mellitus at yearly intervals for retinopathy. From our data, we saw worsening at 1 year of drug exposure, but we do not know the exact time when the changes occurred during that year.”
The Ozempic label advises that “patients with a history of diabetic retinopathy should be monitored for progression of diabetic retinopathy” but doesn’t specifically mention baseline assessment at the time of drug initiation.
No increase in retinopathy risk for GLP-1 agonist class overall
The seven trials in the meta-analysis comprised 56,004 participants, with baseline retinopathy prevalence ranging from 9% to 31%.
For the GLP-1 agonist class overall, there was no significant increase in the relative rate (RR) of retinopathy (RR, 1.09; P = .36), while there were significant reductions in relative rates of major adverse cardiac events, overall deaths, and cardiovascular deaths (all P < .001 or P = .001).
The increased retinopathy risk was seen only in the subcutaneous semaglutide group (RR, 1.73; P = .02).
The overall number needed to harm was 1,000 and the number to treat was 77. For semaglutide, those values were 77 and 43, respectively.
There was a significant correlation between a decrease in major adverse cardiac events and a decrease in A1c (P = .014), while for retinopathy, the risk increased with improved A1c (P = .076).
Semaglutide subanalysis finds increased retinopathy worsening
Dr. Albert and colleagues conducted a separate subanalysis of 11 studies of semaglutide that enrolled 11,894 patients, of which 6 studies (n = 5,610) were of oral semaglutide (Rybelsus) and 5 studies were of subcutaneous semaglutide (Ozempic; n = 6,284).
In the subanalysis, there was an overall increase in relative rates of new or worsening retinopathy (RR, 1.218; P = .049).
The change in relative rate of retinopathy was predominantly found for subcutaneous semaglutide given for longer than 1 year (RR, 1.559; P = .022) and decreases in A1c of more than 1.0% (RR, 1.590; P = .016). No such differences were seen with oral semaglutide.
A further evaluation of the data without the SUSTAIN 6 trial showed no effect on retinopathy but the analysis lacked power.
Dr. Albert told this news organization: “We did not find an immediate toxic effect of any drug. However, we cannot rule out that there was a cumulative effect of the dose over longer times.”
No disclosures were given.
A version of this article first appeared on Medscape.com.
FROM DIABETES & METABOLIC SYNDROME: CLINICAL RESEARCH & REVIEWS
FDA okays Tidepool Loop app to help guide insulin delivery
The Food and Drug Administration has cleared the Tidepool Loop, a mobile application for use with compatible continuous glucose monitors (CGMs) and insulin pumps to enable automated insulin delivery.
Indicated for people with type 1 diabetes ages 6 years and up, the app algorithm was developed by the diabetes startup Tidepool, which already hosts a cloud-based platform for users to download and review data from different glucose meters, insulin pumps, and CGM systems. The Tidepool Loop project arose from patient-led, open-source initiatives to enable interoperability between the devices.
“The [FDA] authorization of the Tidepool Loop is a huge win for the type 1 diabetes (T1D) community and is a vital step towards a world where people with T1D can choose the pump, CGM, and algorithm that are best for them – and have all three work together seamlessly,” Aaron Kowalski, PhD, CEO of the advocacy organization JDRF, said in a statement.
JDRF helped support preclinical and clinical research in the development of the Loop algorithm, along with The Leona M. and Harry B. Helmsley Charitable Trust, the Tullman Foundation, and partnerships with device makers and donations from the T1D community.
Available by prescription only, the Tidepool app is for single patient use. It works with designated “integrated CGMs” and “alternate controller enabled pumps” to automatically increase, decrease, or suspend insulin delivery, based on the glucose readings and predicted values. The app can also recommend correction doses, which the user can confirm.
According to an FDA statement:“Tidepool Loop’s algorithm technology is designed to be compatible with other individual interoperable devices that meet prespecified acceptance criteria set forth in a validation and integration plan provided by the sponsor and cleared by the FDA as part of the premarket submission.”
Tidepool is finalizing agreements with the various device manufacturers “to create a seamless experience for both physicians prescribing Tidepool Loop and the patients using it,” according to a company statement.
Tidepool’s initial launch device partners have not yet been announced, but the company “has a development partnership with Dexcom and other yet-to-be-named medical device companies for future inclusion of their components with the Tidepool Loop platform,” the statement says.
A version of this article first appeared on Medscape.com.
EMR screening in emergency department tags undiagnosed diabetes
A diabetes screening program built into an electronic medical records system identified diabetes or prediabetes in 52% of individuals flagged for abnormal hemoglobin A1c, based on data from more than 2,000 adults.
“Despite the best efforts of clinicians, researchers, and educators, the number of patients living with undiagnosed diabetes is still rising and is currently at approximately 8.5 million, and the number of people unaware of their prediabetes is approximately 77 million,” lead investigator Kristie K. Danielson, PhD, said in an interview. Screening for diabetes is critical to start treatment early, to potentially reverse prediabetes, and to prevent the long-term complications of diabetes and reduced life expectancy.
In a pilot study published in JAMA Network Open, Dr. Danielson and colleagues reviewed data from 8,441 adults who visited a single emergency department in Chicago during February–April 2021.
The EMR at the hospital contained a built-in best practice alert (BPA) that flagged patients as being at risk for type 2 diabetes based the American Diabetes Association recommendations; the identification algorithm included age 45 years and older, or those aged 18-44 years with a body mass index of 25 kg/m2 or higher, no previous history of diabetes, and no A1c measure in the last 3 years, according to the EMR.
A total of 8,441 adult patients visited the ED during the study period; 2,576 triggered BPA tests, and 2,074 had A1c results for review. Among the patients with A1c results, 52% had elevated values of 5.7% or higher. Of these, a total of 758 individuals were identified with prediabetes (A1c, 5.7%-6.4%), 265 with diabetes (A1c, 6.5%-9.9%), and 62 with severe diabetes (A1c, 10% or higher).
After testing, 352 patients with elevated A1c were contacted by the researchers. The mean age of this group was 52.2 years, 54.5% were women, and nearly two-thirds (64.8%) were non-Hispanic Black. The median income of those contacted was in the 44th percentile, and 50% had public insurance.
Most of those contacted (264 patients) were not aware of a previous diagnosis of prediabetes or diabetes; the remaining 88 had a previous diagnosis, but only 51 self-reported receiving treatment, the researchers noted.
Although the screening program successfully identified a significant number of previously undiagnosed individuals with diabetes, prediabetes, or poorly controlled diabetes, its feasibility in routine practice requires further study, the researchers wrote.
The findings were limited by several factors including the identification of patients previously diagnosed with diabetes but who were not being treated, and the potential bias toward individuals of higher socioeconomic status, the researchers noted. However, the results support further exploration of the program as a way to identify undiagnosed diabetes, especially in underserved populations.
Diabetes in underserved groups goes undetected
“We were surprised by the sheer number of people newly diagnosed with diabetes or prediabetes,” which was far greater than expected, commented Dr. Danielson of the University of Illinois at Chicago. “Clearly, we tapped into a new population that has not often been seen by primary care providers or endocrinologists, as is often the case for underserved and vulnerable individuals who visit the emergency department as a first line for health care.”
The screening alert system is straightforward to build into an existing EMR, with technical support, Dr. Danielson said. “In theory, it should be able to be incorporated into other clinical centers and emergency departments. One of the current limitations that we are seeing is that the EMR is still flagging some people already diagnosed with diabetes to be screened for diabetes.” However, “because of this, we also see this as an opportunity to identify and reach out to those with diabetes who are still underserved and not receiving the appropriate diabetes care they need.”
The study results have broader public health implications, Dr. Danielson added. “We have identified a new, large population of people with diabetes who need medical care and diabetes education. This will further add to the burden of health care and costs, and it raises the ethical question of screening and not having full resources readily available to help.
“In my opinion, the study sheds light on a significant issue that will hopefully help drive change at both a health systems and public health level locally and nationally,” she added.
“One of the significant research gaps that has emerged now is how to link these new patients to health care and diabetes education at our institution after they leave the emergency department,” said Dr. Danielson. Diabetes screening in the ED setting is “a very novel area for health system scientists, social workers, and others to now come to the table and collaborate on next steps to help our patients.”
The study was initiated by the investigators, but was supported by a grant from Novo Nordisk to two coauthors. Dr. Danielson also disclosed grant funding from Novo Nordisk during the conduct of the study.
FROM JAMA NETWORK OPEN
High-deductible health plans detrimental for those with diabetes
Individuals with diabetes who are forced to switch to high-deductible health plans have more episodes of severe hypo- and hyperglycemia compared with those on conventional insurance plans, according to a new study.
Previous studies have shown that people with diabetes who are enrolled in high-deductible health plans (HDHPs) have an increased financial burden, lower medication adherence, and more low-severity emergency department visits, and they delay care for cardiovascular conditions.

But no study has looked at the plans’ impact on acute diabetes complications and glycemic control, wrote the authors in JAMA Network Open.
They found evidence that the high-dollar plans were associated with increased odds of severe hypoglycemic and hyperglycemic events, and that the risk increased with each successive year of enrollment. Low-income individuals, Blacks, and Hispanics were disproportionately more impacted, noted senior author Rozalina G. McCoy, MD, Mayo Clinic, Rochester, Minn., and colleagues.
Overall, “enrollees may be rationing or forgoing necessary care, which is detrimental to their health and ultimately increases the morbidity, mortality, and costs associated with diabetes,” they concluded.
A systematic review of eight studies published in Endocrine Practice in 2021 backs up this latest finding. That analysis reported enrollees in HDHPs often forgo routine care and monitoring, and that they have lower medication adherence, leading to an increase in total health care expenditures for emergency department visits, hospitalizations, and preventable complications.
Increased frequency of hypoglycemia is detrimental
The new study published in JAMA Network Open was based on data for adults enrolled in private insurance programs from 2010 to 2018. Researchers analyzed medical and pharmacy claims data contained in a large health insurance claims database, comparing adults with diabetes who had been in an HDHP for at least 1 year (and after a year of being in a conventional plan), with those who were in a conventional plan.
They identified 42,326 individuals who had been switched from a conventional plan to an HDHP. Of those, 7,375 (17.4%) were Black, 5,740 (13.6%) were Hispanic, 26,572 (62.8%) were non-Hispanic White, and 6,880 (16.3%) had a household income below $40,000 a year.
Baseline characteristics of the 202,729 people in conventional plans were similar to those in the HDHP group.
The median deductible for individuals in the HDHP group was $1,500 and for families it was $3,000, compared with $350 and $800, respectively, for those in conventional plans.
The odds of having any severe hypoglycemic event were significantly higher in the HDHP group (odds ratio [OR], 1.11; P < .001). Each year of HDHP enrollment increased the odds of a hypoglycemia-related ED or hospital visit by 2% (OR, 1.02; P = .04).
Aware that only a small number of severe hypoglycemic events, as well as an unknown number of such events, result in an emergency department visit or hospitalization, and that “the decision to seek ED or hospital care may be influenced by health plan assignment,” the authors also looked at office visits where severe, or any, hypoglycemia or hyperglycemia was coded or documented.
The proportion of HDHP enrollees where hypoglycemia was coded was 14% higher than for conventional plan enrollees (OR, 1.14; P < .001), with each year of the high-dollar plan enrollment increasing these odds by 6% (OR, 1.06; P < .001).
The tally of hypoglycemic events is an underestimate because HDHP enrollees might forgo ambulatory care for cost-related reasons, wrote the authors. Hypoglycemia might also be treated at home. But that is not necessarily a positive, they noted.
“The increased frequency of severe hypoglycemia – no matter where managed and discussed – is a sign of detrimental effects of HDHP enrollment for people living with diabetes.”
They found that individuals of racial and ethnic minorities were less likely than were White patients to have an increase in hypoglycemia-related office visits, which suggests that those patients were deferring care, wrote Dr. McCoy and colleagues.
Switching to an HDHP was associated with a significant increase in the odds of having at least one hyperglycemia-related ED or hospital visit per year (OR, 1.25; P < .001). Each successive year in the plan increased these odds by 5% (OR, 1.05; P = .02). However, the authors found no increase in hyperglycemia-related office visits.
“Because severe dysglycemic events may be prevented with optimal glycemic management, the increase in the frequency of their occurrence suggests important gaps in access to and implementation of diabetes therapy,” wrote the authors.
They noted that people with diabetes already face high out-of-pocket expenses. A high-deductible plan might make care even less affordable, they wrote.
“Individuals may be forced to ration medications, glucose-monitoring supplies, diabetes self-management education, food, and other essential cares to the detriment of their health,” they noted.
The authors added that because the study was observational, they could not delve into the root causes of the glycemic events or whether, for instance, any HDHP enrollees also had health savings accounts (HSAs) that might help defray costs.
They suggested that employers offer a wide variety of health plans, or if they are offering only a high-deductible plan that they be more transparent about potential costs. “Previous studies have shown that enrollees are not fully aware of the details within their health plans and may be focusing on reducing the cost of monthly premiums – not overall care – when choosing health plans.”
The authors said employers should find ways to fund HSAs for people with low incomes – those who appear to be most vulnerable to the effects of HDHPs.
A study published in JAMA Internal Medicine in 2017 found that low-income and HSA-eligible individuals with diabetes switched to an HDHP had major increases in emergency department visits for preventable acute diabetes complications.
The study was funded by a grant from the National Institute of Diabetes and Digestive and Kidney Diseases (NIDDK), the Mayo Clinic K2R Research Award, and the Mayo Clinic Robert D. and Patricia E. Kern Center for the Science of Health Care Delivery. Dr. McCoy has reported receiving grants from the NIDDK, AARP, and the Patient-Centered Outcomes Research Institute, and personal fees from Emmi for the development of patient education materials about diabetes outside the submitted work.
A version of this article first appeared on Medscape.com.
Individuals with diabetes who are forced to switch to high-deductible health plans have more episodes of severe hypo- and hyperglycemia compared with those on conventional insurance plans, according to a new study.
Previous studies have shown that people with diabetes who are enrolled in high-deductible health plans (HDHPs) have an increased financial burden, lower medication adherence, and more low-severity emergency department visits, and they delay care for cardiovascular conditions.
But no study has looked at the plans’ impact on acute diabetes complications and glycemic control, wrote the authors in JAMA Network Open.
They found evidence that the high-dollar plans were associated with increased odds of severe hypoglycemic and hyperglycemic events, and that the risk increased with each successive year of enrollment. Low-income individuals, Blacks, and Hispanics were disproportionately more impacted, noted senior author Rozalina G. McCoy, MD, Mayo Clinic, Rochester, Minn., and colleagues.
Overall, “enrollees may be rationing or forgoing necessary care, which is detrimental to their health and ultimately increases the morbidity, mortality, and costs associated with diabetes,” they concluded.
A systematic review of eight studies published in Endocrine Practice in 2021 backs up this latest finding. That analysis reported enrollees in HDHPs often forgo routine care and monitoring, and that they have lower medication adherence, leading to an increase in total health care expenditures for emergency department visits, hospitalizations, and preventable complications.
Increased frequency of hypoglycemia is detrimental
The new study published in JAMA Network Open was based on data for adults enrolled in private insurance programs from 2010 to 2018. Researchers analyzed medical and pharmacy claims data contained in a large health insurance claims database, comparing adults with diabetes who had been in an HDHP for at least 1 year (and after a year of being in a conventional plan), with those who were in a conventional plan.
They identified 42,326 individuals who had been switched from a conventional plan to an HDHP. Of those, 7,375 (17.4%) were Black, 5,740 (13.6%) were Hispanic, 26,572 (62.8%) were non-Hispanic White, and 6,880 (16.3%) had a household income below $40,000 a year.
Baseline characteristics of the 202,729 people in conventional plans were similar to those in the HDHP group.
The median deductible for individuals in the HDHP group was $1,500 and for families it was $3,000, compared with $350 and $800, respectively, for those in conventional plans.
The odds of having any severe hypoglycemic event were significantly higher in the HDHP group (odds ratio [OR], 1.11; P < .001). Each year of HDHP enrollment increased the odds of a hypoglycemia-related ED or hospital visit by 2% (OR, 1.02; P = .04).
Aware that only a small number of severe hypoglycemic events, as well as an unknown number of such events, result in an emergency department visit or hospitalization, and that “the decision to seek ED or hospital care may be influenced by health plan assignment,” the authors also looked at office visits where severe, or any, hypoglycemia or hyperglycemia was coded or documented.
The proportion of HDHP enrollees where hypoglycemia was coded was 14% higher than for conventional plan enrollees (OR, 1.14; P < .001), with each year of the high-dollar plan enrollment increasing these odds by 6% (OR, 1.06; P < .001).
The tally of hypoglycemic events is an underestimate because HDHP enrollees might forgo ambulatory care for cost-related reasons, wrote the authors. Hypoglycemia might also be treated at home. But that is not necessarily a positive, they noted.
“The increased frequency of severe hypoglycemia – no matter where managed and discussed – is a sign of detrimental effects of HDHP enrollment for people living with diabetes.”
They found that individuals of racial and ethnic minorities were less likely than were White patients to have an increase in hypoglycemia-related office visits, which suggests that those patients were deferring care, wrote Dr. McCoy and colleagues.
Switching to an HDHP was associated with a significant increase in the odds of having at least one hyperglycemia-related ED or hospital visit per year (OR, 1.25; P < .001). Each successive year in the plan increased these odds by 5% (OR, 1.05; P = .02). However, the authors found no increase in hyperglycemia-related office visits.
“Because severe dysglycemic events may be prevented with optimal glycemic management, the increase in the frequency of their occurrence suggests important gaps in access to and implementation of diabetes therapy,” wrote the authors.
They noted that people with diabetes already face high out-of-pocket expenses. A high-deductible plan might make care even less affordable, they wrote.
“Individuals may be forced to ration medications, glucose-monitoring supplies, diabetes self-management education, food, and other essential cares to the detriment of their health,” they noted.
The authors added that because the study was observational, they could not delve into the root causes of the glycemic events or whether, for instance, any HDHP enrollees also had health savings accounts (HSAs) that might help defray costs.
They suggested that employers offer a wide variety of health plans, or if they are offering only a high-deductible plan that they be more transparent about potential costs. “Previous studies have shown that enrollees are not fully aware of the details within their health plans and may be focusing on reducing the cost of monthly premiums – not overall care – when choosing health plans.”
The authors said employers should find ways to fund HSAs for people with low incomes – those who appear to be most vulnerable to the effects of HDHPs.
A study published in JAMA Internal Medicine in 2017 found that low-income and HSA-eligible individuals with diabetes switched to an HDHP had major increases in emergency department visits for preventable acute diabetes complications.
The study was funded by a grant from the National Institute of Diabetes and Digestive and Kidney Diseases (NIDDK), the Mayo Clinic K2R Research Award, and the Mayo Clinic Robert D. and Patricia E. Kern Center for the Science of Health Care Delivery. Dr. McCoy has reported receiving grants from the NIDDK, AARP, and the Patient-Centered Outcomes Research Institute, and personal fees from Emmi for the development of patient education materials about diabetes outside the submitted work.
A version of this article first appeared on Medscape.com.
FDA approves new type 2 diabetes drug bexagliflozin
The U.S. Food and Drug Administration has approved bexagliflozin (Brenzavvy, TheracosBio) for the treatment of adults with type 2 diabetes.
The once-daily 20-mg oral sodium-glucose cotransporter 2 (SGLT2) inhibitor is indicated as an adjunct to diet and exercise to improve glycemic control for those with type 2 diabetes, but not type 1 diabetes. It can be used in adults with an estimated glomerular filtration rate (eGFR) > 30 mL/min per 1.73 m2.
Approval was based on results from 23 clinical trials with more than 5,000 participants, including more than 300 patients with stage 3 kidney disease (eGFR < 60 and > 30 mL/min per 1.73 m2).
In the phase 3 studies, bexagliflozin significantly reduced hemoglobin A1c and fasting blood glucose at 24 weeks as monotherapy or as add-on to metformin and other glucose-lowering drugs and combinations. It also produced modest reductions in body weight and systolic blood pressure.
In the phase 3 Bexagliflozin Efficacy and Safety Trial (BEST) cardiovascular outcomes trial, the drug met its efficacy and safety objectives in patients at high cardiovascular risk. Noninferiority was demonstrated for the composite outcome of cardiovascular death, myocardial infarction, stroke, or unstable angina.
“As a class of drugs, SGLT2 inhibitors have shown tremendous benefit in treating adults with type 2 diabetes,” said Mason Freeman, MD, director of the Translational Research Center at Massachusetts General Hospital, Boston, in a press release from TheracosBio.
“Being involved in all of the clinical trials for Brenzavvy, I am greatly impressed with the efficacy of the drug in reducing blood glucose levels and I believe it is an important addition to the SGLT2 inhibitor class of drugs.”
As with other SGLT2 inhibitors, adverse events seen in the trials include ketoacidosis, lower limb amputation, volume depletion, urosepsis, pyelonephritis, Fournier’s gangrene, genital mycotic infections, and hypoglycemia when used with insulin or insulin secretagogues.
Bexagliflozin joins an already crowded field of SGLT2 inhibitors, some of which have been approved for additional cardiovascular and kidney indications.
Of interest, bexagliflozin was approved by the FDA for diabetes in cats in December 2022, as the first oral new animal drug to improve glycemic control in otherwise healthy cats with diabetes not previously treated with insulin.
A version of this article first appeared on Medscape.com.
Teaching Quality Improvement to Internal Medicine Residents to Address Patient Care Gaps in Ambulatory Quality Metrics
ABSTRACT
Objective: To teach internal medicine residents quality improvement (QI) principles in an effort to improve resident knowledge and comfort with QI, as well as address quality care gaps in resident clinic primary care patient panels.
Design: A QI curriculum was implemented for all residents rotating through a primary care block over a 6-month period. Residents completed Institute for Healthcare Improvement (IHI) modules, participated in a QI workshop, and received panel data reports, ultimately completing a plan-do-study-act (PDSA) cycle to improve colorectal cancer screening and hypertension control.
Setting and participants: This project was undertaken at Tufts Medical Center Primary Care, Boston, Massachusetts, the primary care teaching practice for all 75 internal medicine residents at Tufts Medical Center. All internal medicine residents were included, with 55 (73%) of the 75 residents completing the presurvey, and 39 (52%) completing the postsurvey.
Measurements: We administered a 10-question pre- and postsurvey looking at resident attitudes toward and comfort with QI and familiarity with their panel data as well as measured rates of colorectal cancer screening and hypertension control in resident panels.
Results: There was an increase in the numbers of residents who performed a PDSA cycle (P = .002), completed outreach based on their panel data (P = .02), and felt comfortable in both creating aim statements and designing and implementing PDSA cycles (P < .0001). The residents’ knowledge of their panel data significantly increased. There was no significant improvement in hypertension control, but there was an increase in colorectal cancer screening rates (P < .0001).
Conclusion: Providing panel data and performing targeted QI interventions can improve resident comfort with QI, translating to improvement in patient outcomes.
Keywords: quality improvement, resident education, medical education, care gaps, quality metrics.
As quality improvement (QI) has become an integral part of clinical practice, residency training programs have continued to evolve in how best to teach QI. The Accreditation Council for Graduate Medical Education (ACGME) Common Program requirements mandate that core competencies in residency programs include practice-based learning and improvement and systems-based practice.1 Residents should receive education in QI, receive data on quality metrics and benchmarks related to their patient population, and participate in QI activities. The Clinical Learning Environment Review (CLER) program was established to provide feedback to institutions on 6 focused areas, including patient safety and health care quality. In visits to institutions across the United States, the CLER committees found that many residents had limited knowledge of QI concepts and limited access to data on quality metrics and benchmarks.2
There are many barriers to implementing a QI curriculum in residency programs, and creating and maintaining successful strategies has proven challenging.3 Many QI curricula for internal medicine residents have been described in the literature, but the results of many of these studies focus on resident self-assessment of QI knowledge and numbers of projects rather than on patient outcomes.4-13 As there is some evidence suggesting that patients treated by residents have worse outcomes on ambulatory quality measures when compared with patients treated by staff physicians,14,15 it is important to also look at patient outcomes when evaluating a QI curriculum. Experts in education recommend the following to optimize learning: exposure to both didactic and experiential opportunities, connection to health system improvement efforts, and assessment of patient outcomes in addition to learner feedback.16,17 A study also found that providing panel data to residents could improve quality metrics.18
In this study, we sought to investigate the effects of a resident QI intervention during an ambulatory block on both residents’ self-assessments of QI knowledge and attitudes as well as on patient quality metrics.
Methods
Curriculum
We implemented this educational initiative at Tufts Medical Center Primary Care, Boston, Massachusetts, the primary care teaching practice for all 75 internal medicine residents at Tufts Medical Center. Co-located with the 415-bed academic medical center in downtown Boston, the practice serves more than 40,000 patients, approximately 7000 of whom are cared for by resident primary care physicians (PCPs). The internal medicine residents rotate through the primary care clinic as part of continuity clinic during ambulatory or elective blocks. In addition to continuity clinic, the residents have 2 dedicated 3-week primary care rotations during the course of an academic year. Primary care rotations consist of 5 clinic sessions a week as well as structured teaching sessions. Each resident inherits a panel of patients from an outgoing senior resident, with an average panel size of 96 patients per resident.
Prior to this study intervention, we did not do any formal QI teaching to our residents as part of their primary care curriculum, and previous panel management had focused more on chart reviews of patients whom residents perceived to be higher risk. Residents from all 3 years were included in the intervention. We taught a QI curriculum to our residents from January 2018 to June 2018 during the 3-week primary care rotation, which consisted of the following components:
- Institute for Healthcare Improvement (IHI) module QI 102 completed independently online.
- A 2-hour QI workshop led by 1 of 2 primary care faculty with backgrounds in QI, during which residents were taught basic principles of QI, including how to craft aim statements and design plan-do-study-act (PDSA) cycles, and participated in a hands-on QI activity designed to model rapid cycle improvement (the Paper Airplane Factory19).
- Distribution of individualized reports of residents’ patient panel data by email at the start of the primary care block that detailed patients’ overall rates of colorectal cancer screening and hypertension (HTN) control, along with the average resident panel rates and the average attending panel rates. The reports also included a list of all residents’ patients who were overdue for colorectal cancer screening or whose last blood pressure (BP) was uncontrolled (systolic BP ≥ 140 mm Hg or diastolic BP ≥ 90 mm Hg). These reports were originally designed by our practice’s QI team and run and exported in Microsoft Excel format monthly by our information technology (IT) administrator.
- Instruction on aim statements as a group, followed by the expectation that each resident create an individualized aim statement tailored to each resident’s patient panel rates, with the PDSA cycle to be implemented during the remainder of the primary care rotation, focusing on improvement of colorectal cancer screening and HTN control (see supplementary eFigure 1 online for the worksheet used for the workshop).
- Residents were held accountable for their interventions by various check-ins. At the end of the primary care block, residents were required to submit their completed worksheets showing the intervention they had undertaken and when it was performed. The 2 primary care attendings primarily responsible for QI education would review the resident’s work approximately 1 to 2 months after they submitted their worksheets describing their intervention. These attendings sent the residents personalized feedback based on whether the intervention had been completed or successful as evidenced by documentation in the chart, including direct patient outreach by phone, letter, or portal; outreach to the resident coordinator; scheduled follow-up appointment; or booking or completion of colorectal cancer screening. Along with this feedback, residents were also sent suggestions for next steps. Resident preceptors were copied on the email to facilitate reinforcement of the goals and plans. Finally, the resident preceptors also helped with accountability by going through the residents’ worksheets and patient panel metrics with the residents during biannual evaluations.

Evaluation
Residents were surveyed with a 10-item questionnaire pre and post intervention regarding their attitudes toward QI, understanding of QI principles, and familiarity with their patient panel data. Surveys were anonymous and distributed via the SurveyMonkey platform (see supplementary eFigure 2 online). Residents were asked if they had ever performed a PDSA cycle, performed patient outreach, or performed an intervention and whether they knew the rates of diabetes, HTN, and colorectal cancer screening in their patient panels. Questions rated on a 5-point Likert scale were used to assess comfort with panel management, developing an aim statement, designing and implementing a PDSA cycle, as well as interest in pursuing QI as a career. For the purposes of analysis, these questions were dichotomized into “somewhat comfortable” and “very comfortable” vs “neutral,” “somewhat uncomfortable,” and “very uncomfortable.” Similarly, we dichotomized the question about interest in QI as a career into “somewhat interested” and “very interested” vs “neutral,” “somewhat disinterested,” and “very disinterested.” As the surveys were anonymous, we were unable to pair the pre- and postintervention surveys and used a chi-square test to evaluate whether there was an association between survey assessments pre intervention vs post intervention and a positive or negative response to the question.

We also examined rates of HTN control and colorectal cancer screening in all 75 resident panels pre and post intervention. The paired t-test was used to determine whether the mean change from pre to post intervention was significant. SAS 9.4 (SAS Institute Inc.) was used for all analyses. Institutional Review Board exemption was obtained from the Tufts Medical Center IRB. There was no funding received for this study.
Results
Respondents
Of the 75 residents, 55 (73%) completed the survey prior to the intervention, and 39 (52%) completed the survey after the intervention.
Panel Knowledge and Intervention
Prior to the intervention, 45% of residents had performed a PDSA cycle, compared with 77% post intervention, which was a significant increase (P = .002) (Table 1). Sixty-two percent of residents had performed outreach or an intervention based on their patient panel reports prior to the intervention, compared with 85% of residents post intervention, which was also a significant increase (P = .02). The increase post intervention was not 100%, as there were residents who either missed the initial workshop or who did not follow through with their planned intervention. Common interventions included the residents giving their coordinators a list of patients to call to schedule appointments, utilizing fellow team members (eg, pharmacists, social workers) for targeted patient outreach, or calling patients themselves to reestablish a connection.

In terms of knowledge of their patient panels, prior to the intervention, 55%, 62%, and 62% of residents knew the rates of patients in their panel with diabetes, HTN, and colorectal cancer screening, respectively. After the intervention, the residents’ knowledge of these rates increased significantly, to 85% for diabetes (P = .002), 97% for HTN (P < .0001), and 97% for colorectal cancer screening (P < .0001).
Comfort With QI Approaches
Prior to the intervention, 82% of residents were comfortable managing their primary care panel, which did not change significantly post intervention (Table 2). The residents’ comfort with designing an aim statement did significantly increase, from 55% to 95% (P < .0001). The residents also had a significant increase in comfort with both designing and implementing a PDSA cycle. Prior to the intervention, 22% felt comfortable designing a PDSA cycle, which increased to 79% (P < .0001) post intervention, and 24% felt comfortable implementing a PDSA cycle, which increased to 77% (P < .0001) post intervention.

Patient Outcome Measures
The rate of HTN control in the residents' patient panels did not change significantly pre and post intervention (Table 3). The rate of resident patients who were up to date with colorectal cancer screening increased by 6.5% post intervention (P < .0001).

Interest in QI as a Career
As part of the survey, residents were asked how interested they were in making QI a part of their career. Fifty percent of residents indicated an interest in QI pre intervention, and 54% indicated an interest post intervention, which was not a significant difference (P = .72).
Discussion
In this study, we found that integration of a QI curriculum into a primary care rotation improved both residents’ knowledge of their patient panels and comfort with QI approaches, which translated to improvement in patient outcomes. Several previous studies have found improvements in resident self-assessment or knowledge after implementation of a QI curriculum.4-13 Liao et al implemented a longitudinal curriculum including both didactic and experiential components and found an improvement in both QI confidence and knowledge.3 Similarly, Duello et al8 found that a curriculum including both didactic lectures and QI projects improved subjective QI knowledge and comfort. Interestingly, Fok and Wong9 found that resident knowledge could be sustained post curriculum after completion of a QI project, suggesting that experiential learning may be helpful in maintaining knowledge.
Studies also have looked at providing performance data to residents. Hwang et al18 found that providing audit and feedback in the form of individual panel performance data to residents compared with practice targets led to statistically significant improvement in cancer screening rates and composite quality score, indicating that there is tremendous potential in providing residents with their data. While the ACGME mandates that residents should receive data on their quality metrics, on CLER visits, many residents interviewed noted limited access to data on their metrics and benchmarks.1,2
Though previous studies have individually looked at teaching QI concepts, providing panel data, or targeting select metrics, our study was unique in that it reviewed both self-reported resident outcomes data as well as actual patient outcomes. In addition to finding increased knowledge of patient panels and comfort with QI approaches, we found a significant increase in colorectal cancer screening rates post intervention. We thought this finding was particularly important given some data that residents' patients have been found to have worse outcomes on quality metrics compared with patients cared for by staff physicians.14,15 Given that having a resident physician as a PCP has been associated with failing to meet quality measures, it is especially important to focus targeted quality improvement initiatives in this patient population to reduce disparities in care.
We found that residents had improved knowledge on their patient panels as a result of this initiative. The residents were noted to have a higher knowledge of their HTN and colorectal cancer screening rates in comparison to their diabetes metrics. We suspect this is because residents are provided with multiple metrics related to diabetes, including process measures such as A1c testing, as well as outcome measures such as A1c control, so it may be harder for them to elucidate exactly how they are doing with their diabetes patients, whereas in HTN control and colorectal cancer screening, there is only 1 associated metric. Interestingly, even though HTN and colorectal cancer screening were the 2 measures focused on in the study, the residents had a significant improvement in knowledge of the rates of diabetes in their panel as well. This suggests that even just receiving data alone is valuable, hopefully translating to better outcomes with better baseline understanding of panels. We believe that our intervention was successful because it included both a didactic and an experiential component, as well as the use of individual panel performance data.
There were several limitations to our study. It was performed at a single institution, translating to a small sample size. Our data analysis was limited because we were unable to pair our pre- and postintervention survey responses because we used an anonymous survey. We also did not have full participation in postintervention surveys from all residents, which may have biased the study in favor of high performers. Another limitation was that our survey relied on self-reported outcomes for the questions about the residents knowing their patient panels.
This study required a 2-hour workshop every 3 weeks led by a faculty member trained in QI. Given the amount of time needed for the curriculum, this study may be difficult to replicate at other institutions, especially if faculty with an interest or training in QI are not available. Given our finding that residents had increased knowledge of their patient panels after receiving panel metrics, simply providing data with the goal of smaller, focused interventions may be easier to implement. At our institution, we discontinued the longer 2-hour QI workshops designed to teach QI approaches more broadly. We continue to provide individualized panel data to all residents during their primary care rotations and conduct half-hour, small group workshops with the interns that focus on drafting aim statements and planning interventions. All residents are required to submit worksheets to us at the end of their primary care blocks listing their current rates of each predetermined metric and laying out their aim statements and planned interventions. Residents also continue to receive feedback from our faculty with expertise in QI afterward on their plans and evidence of follow-through in the chart, with their preceptors included on the feedback emails. Even without the larger QI workshop, this approach has continued to be successful and appreciated. In fact, it does appear as though improvement in colorectal cancer screening has been sustained over several years. At the end of our study period, the resident patient colorectal cancer screening rate rose from 34% to 43%, and for the 2021-2022 academic year, the rate rose further, from 46% to 50%.
Given that the resident clinic patient population is at higher risk overall, targeted outreach and approaches to improve quality must be continued. Future areas of research include looking at which interventions, whether QI curriculum, provision of panel data, or required panel management interventions, translate to the greatest improvements in patient outcomes in this vulnerable population.
Conclusion
Our study showed that a dedicated QI curriculum for the residents and access to quality metric data improved both resident knowledge and comfort with QI approaches. Beyond resident-centered outcomes, there was also translation to improved patient outcomes, with a significant increase in colon cancer screening rates post intervention.
Corresponding author: Kinjalika Sathi, MD, 800 Washington St., Boston, MA 02111; ksathi@tuftsmedicalcenter.org
Disclosures: None reported.
1. Accreditation Council for Graduate Medical Education. ACGME Common Program Requirements (Residency). Approved June 13, 2021. Updated July 1, 2022. Accessed December 29, 2022. https://www.acgme.org/globalassets/pfassets/programrequirements/cprresidency_2022v3.pdf
2. Koh NJ, Wagner R, Newton RC, et al; on behalf of the CLER Evaluation Committee and the CLER Program. CLER National Report of Findings 2021. Accreditation Council for Graduate Medical Education; 2021. Accessed December 29, 2022. https://www.acgme.org/globalassets/pdfs/cler/2021clernationalreportoffindings.pdf
3. Liao JM, Co JP, Kachalia A. Providing educational content and context for training the next generation of physicians in quality improvement. Acad Med. 2015;90(9):1241-1245. doi:10.1097/ACM.0000000000000799
4. Johnson KM, Fiordellisi W, Kuperman E, et al. X + Y = time for QI: meaningful engagement of residents in quality improvement during the ambulatory block. J Grad Med Educ. 2018;10(3):316-324. doi:10.4300/JGME-D-17-00761.1
5. Kesari K, Ali S, Smith S. Integrating residents with institutional quality improvement teams. Med Educ. 2017;51(11):1173. doi:10.1111/medu.13431
6. Ogrinc G, Cohen ES, van Aalst R, et al. Clinical and educational outcomes of an integrated inpatient quality improvement curriculum for internal medicine residents. J Grad Med Educ. 2016;8(4):563-568. doi:10.4300/JGME-D-15-00412.1
7. Malayala SV, Qazi KJ, Samdani AJ, et al. A multidisciplinary performance improvement rotation in an internal medicine training program. Int J Med Educ. 2016;7:212-213. doi:10.5116/ijme.5765.0bda
8. Duello K, Louh I, Greig H, et al. Residents’ knowledge of quality improvement: the impact of using a group project curriculum. Postgrad Med J. 2015;91(1078):431-435. doi:10.1136/postgradmedj-2014-132886
9. Fok MC, Wong RY. Impact of a competency based curriculum on quality improvement among internal medicine residents. BMC Med Educ. 2014;14:252. doi:10.1186/s12909-014-0252-7
10. Wilper AP, Smith CS, Weppner W. Instituting systems-based practice and practice-based learning and improvement: a curriculum of inquiry. Med Educ Online. 2013;18:21612. doi:10.3402/meo.v18i0.21612
11. Weigel C, Suen W, Gupte G. Using lean methodology to teach quality improvement to internal medicine residents at a safety net hospital. Am J Med Qual. 2013;28(5):392-399. doi:10.1177/1062860612474062
12. Tomolo AM, Lawrence RH, Watts B, et al. Pilot study evaluating a practice-based learning and improvement curriculum focusing on the development of system-level quality improvement skills. J Grad Med Educ. 2011;3(1):49-58. doi:10.4300/JGME-D-10-00104.1
13. Djuricich AM, Ciccarelli M, Swigonski NL. A continuous quality improvement curriculum for residents: addressing core competency, improving systems. Acad Med. 2004;79(10 Suppl):S65-S67. doi:10.1097/00001888-200410001-00020
14. Essien UR, He W, Ray A, et al. Disparities in quality of primary care by resident and staff physicians: is there a conflict between training and equity? J Gen Intern Med. 2019;34(7):1184-1191. doi:10.1007/s11606-019-04960-5
15. Amat M, Norian E, Graham KL. Unmasking a vulnerable patient care process: a qualitative study describing the current state of resident continuity clinic in a nationwide cohort of internal medicine residency programs. Am J Med. 2022;135(6):783-786. doi:10.1016/j.amjmed.2022.02.007
16. Wong BM, Etchells EE, Kuper A, et al. Teaching quality improvement and patient safety to trainees: a systematic review. Acad Med. 2010;85(9):1425-1439. doi:10.1097/ACM.0b013e3181e2d0c6
17. Armstrong G, Headrick L, Madigosky W, et al. Designing education to improve care. Jt Comm J Qual Patient Saf. 2012;38:5-14. doi:10.1016/s1553-7250(12)38002-1
18. Hwang AS, Harding AS, Chang Y, et al. An audit and feedback intervention to improve internal medicine residents’ performance on ambulatory quality measures: a randomized controlled trial. Popul Health Manag. 2019;22(6):529-535. doi:10.1089/pop.2018.0217
19. Institute for Healthcare Improvement. Open school. The paper airplane factory. Accessed December 29, 2022. https://www.ihi.org/education/IHIOpenSchool/resources/Pages/Activities/PaperAirplaneFactory.aspx
ABSTRACT
Objective: To teach internal medicine residents quality improvement (QI) principles in an effort to improve resident knowledge and comfort with QI, as well as address quality care gaps in resident clinic primary care patient panels.
Design: A QI curriculum was implemented for all residents rotating through a primary care block over a 6-month period. Residents completed Institute for Healthcare Improvement (IHI) modules, participated in a QI workshop, and received panel data reports, ultimately completing a plan-do-study-act (PDSA) cycle to improve colorectal cancer screening and hypertension control.
Setting and participants: This project was undertaken at Tufts Medical Center Primary Care, Boston, Massachusetts, the primary care teaching practice for all 75 internal medicine residents at Tufts Medical Center. All internal medicine residents were included, with 55 (73%) of the 75 residents completing the presurvey, and 39 (52%) completing the postsurvey.
Measurements: We administered a 10-question pre- and postsurvey looking at resident attitudes toward and comfort with QI and familiarity with their panel data as well as measured rates of colorectal cancer screening and hypertension control in resident panels.
Results: There was an increase in the numbers of residents who performed a PDSA cycle (P = .002), completed outreach based on their panel data (P = .02), and felt comfortable in both creating aim statements and designing and implementing PDSA cycles (P < .0001). The residents’ knowledge of their panel data significantly increased. There was no significant improvement in hypertension control, but there was an increase in colorectal cancer screening rates (P < .0001).
Conclusion: Providing panel data and performing targeted QI interventions can improve resident comfort with QI, translating to improvement in patient outcomes.
Keywords: quality improvement, resident education, medical education, care gaps, quality metrics.
As quality improvement (QI) has become an integral part of clinical practice, residency training programs have continued to evolve in how best to teach QI. The Accreditation Council for Graduate Medical Education (ACGME) Common Program requirements mandate that core competencies in residency programs include practice-based learning and improvement and systems-based practice.1 Residents should receive education in QI, receive data on quality metrics and benchmarks related to their patient population, and participate in QI activities. The Clinical Learning Environment Review (CLER) program was established to provide feedback to institutions on 6 focused areas, including patient safety and health care quality. In visits to institutions across the United States, the CLER committees found that many residents had limited knowledge of QI concepts and limited access to data on quality metrics and benchmarks.2
There are many barriers to implementing a QI curriculum in residency programs, and creating and maintaining successful strategies has proven challenging.3 Many QI curricula for internal medicine residents have been described in the literature, but the results of many of these studies focus on resident self-assessment of QI knowledge and numbers of projects rather than on patient outcomes.4-13 As there is some evidence suggesting that patients treated by residents have worse outcomes on ambulatory quality measures when compared with patients treated by staff physicians,14,15 it is important to also look at patient outcomes when evaluating a QI curriculum. Experts in education recommend the following to optimize learning: exposure to both didactic and experiential opportunities, connection to health system improvement efforts, and assessment of patient outcomes in addition to learner feedback.16,17 A study also found that providing panel data to residents could improve quality metrics.18
In this study, we sought to investigate the effects of a resident QI intervention during an ambulatory block on both residents’ self-assessments of QI knowledge and attitudes as well as on patient quality metrics.
Methods
Curriculum
We implemented this educational initiative at Tufts Medical Center Primary Care, Boston, Massachusetts, the primary care teaching practice for all 75 internal medicine residents at Tufts Medical Center. Co-located with the 415-bed academic medical center in downtown Boston, the practice serves more than 40,000 patients, approximately 7000 of whom are cared for by resident primary care physicians (PCPs). The internal medicine residents rotate through the primary care clinic as part of continuity clinic during ambulatory or elective blocks. In addition to continuity clinic, the residents have 2 dedicated 3-week primary care rotations during the course of an academic year. Primary care rotations consist of 5 clinic sessions a week as well as structured teaching sessions. Each resident inherits a panel of patients from an outgoing senior resident, with an average panel size of 96 patients per resident.
Prior to this study intervention, we did not do any formal QI teaching to our residents as part of their primary care curriculum, and previous panel management had focused more on chart reviews of patients whom residents perceived to be higher risk. Residents from all 3 years were included in the intervention. We taught a QI curriculum to our residents from January 2018 to June 2018 during the 3-week primary care rotation, which consisted of the following components:
- Institute for Healthcare Improvement (IHI) module QI 102 completed independently online.
- A 2-hour QI workshop led by 1 of 2 primary care faculty with backgrounds in QI, during which residents were taught basic principles of QI, including how to craft aim statements and design plan-do-study-act (PDSA) cycles, and participated in a hands-on QI activity designed to model rapid cycle improvement (the Paper Airplane Factory19).
- Distribution of individualized reports of residents’ patient panel data by email at the start of the primary care block that detailed patients’ overall rates of colorectal cancer screening and hypertension (HTN) control, along with the average resident panel rates and the average attending panel rates. The reports also included a list of all residents’ patients who were overdue for colorectal cancer screening or whose last blood pressure (BP) was uncontrolled (systolic BP ≥ 140 mm Hg or diastolic BP ≥ 90 mm Hg). These reports were originally designed by our practice’s QI team and run and exported in Microsoft Excel format monthly by our information technology (IT) administrator.
- Instruction on aim statements as a group, followed by the expectation that each resident create an individualized aim statement tailored to each resident’s patient panel rates, with the PDSA cycle to be implemented during the remainder of the primary care rotation, focusing on improvement of colorectal cancer screening and HTN control (see supplementary eFigure 1 online for the worksheet used for the workshop).
- Residents were held accountable for their interventions by various check-ins. At the end of the primary care block, residents were required to submit their completed worksheets showing the intervention they had undertaken and when it was performed. The 2 primary care attendings primarily responsible for QI education would review the resident’s work approximately 1 to 2 months after they submitted their worksheets describing their intervention. These attendings sent the residents personalized feedback based on whether the intervention had been completed or successful as evidenced by documentation in the chart, including direct patient outreach by phone, letter, or portal; outreach to the resident coordinator; scheduled follow-up appointment; or booking or completion of colorectal cancer screening. Along with this feedback, residents were also sent suggestions for next steps. Resident preceptors were copied on the email to facilitate reinforcement of the goals and plans. Finally, the resident preceptors also helped with accountability by going through the residents’ worksheets and patient panel metrics with the residents during biannual evaluations.
Evaluation
Residents were surveyed with a 10-item questionnaire pre and post intervention regarding their attitudes toward QI, understanding of QI principles, and familiarity with their patient panel data. Surveys were anonymous and distributed via the SurveyMonkey platform (see supplementary eFigure 2 online). Residents were asked if they had ever performed a PDSA cycle, performed patient outreach, or performed an intervention and whether they knew the rates of diabetes, HTN, and colorectal cancer screening in their patient panels. Questions rated on a 5-point Likert scale were used to assess comfort with panel management, developing an aim statement, designing and implementing a PDSA cycle, as well as interest in pursuing QI as a career. For the purposes of analysis, these questions were dichotomized into “somewhat comfortable” and “very comfortable” vs “neutral,” “somewhat uncomfortable,” and “very uncomfortable.” Similarly, we dichotomized the question about interest in QI as a career into “somewhat interested” and “very interested” vs “neutral,” “somewhat disinterested,” and “very disinterested.” As the surveys were anonymous, we were unable to pair the pre- and postintervention surveys and used a chi-square test to evaluate whether there was an association between survey assessments pre intervention vs post intervention and a positive or negative response to the question.
We also examined rates of HTN control and colorectal cancer screening in all 75 resident panels pre and post intervention. The paired t-test was used to determine whether the mean change from pre to post intervention was significant. SAS 9.4 (SAS Institute Inc.) was used for all analyses. Institutional Review Board exemption was obtained from the Tufts Medical Center IRB. There was no funding received for this study.
Results
Respondents
Of the 75 residents, 55 (73%) completed the survey prior to the intervention, and 39 (52%) completed the survey after the intervention.
Panel Knowledge and Intervention
Prior to the intervention, 45% of residents had performed a PDSA cycle, compared with 77% post intervention, which was a significant increase (P = .002) (Table 1). Sixty-two percent of residents had performed outreach or an intervention based on their patient panel reports prior to the intervention, compared with 85% of residents post intervention, which was also a significant increase (P = .02). The increase post intervention was not 100%, as there were residents who either missed the initial workshop or who did not follow through with their planned intervention. Common interventions included the residents giving their coordinators a list of patients to call to schedule appointments, utilizing fellow team members (eg, pharmacists, social workers) for targeted patient outreach, or calling patients themselves to reestablish a connection.
In terms of knowledge of their patient panels, prior to the intervention, 55%, 62%, and 62% of residents knew the rates of patients in their panel with diabetes, HTN, and colorectal cancer screening, respectively. After the intervention, the residents’ knowledge of these rates increased significantly, to 85% for diabetes (P = .002), 97% for HTN (P < .0001), and 97% for colorectal cancer screening (P < .0001).
Comfort With QI Approaches
Prior to the intervention, 82% of residents were comfortable managing their primary care panel, which did not change significantly post intervention (Table 2). The residents’ comfort with designing an aim statement did significantly increase, from 55% to 95% (P < .0001). The residents also had a significant increase in comfort with both designing and implementing a PDSA cycle. Prior to the intervention, 22% felt comfortable designing a PDSA cycle, which increased to 79% (P < .0001) post intervention, and 24% felt comfortable implementing a PDSA cycle, which increased to 77% (P < .0001) post intervention.
Patient Outcome Measures
The rate of HTN control in the residents' patient panels did not change significantly pre and post intervention (Table 3). The rate of resident patients who were up to date with colorectal cancer screening increased by 6.5% post intervention (P < .0001).
Interest in QI as a Career
As part of the survey, residents were asked how interested they were in making QI a part of their career. Fifty percent of residents indicated an interest in QI pre intervention, and 54% indicated an interest post intervention, which was not a significant difference (P = .72).
Discussion
In this study, we found that integration of a QI curriculum into a primary care rotation improved both residents’ knowledge of their patient panels and comfort with QI approaches, which translated to improvement in patient outcomes. Several previous studies have found improvements in resident self-assessment or knowledge after implementation of a QI curriculum.4-13 Liao et al implemented a longitudinal curriculum including both didactic and experiential components and found an improvement in both QI confidence and knowledge.3 Similarly, Duello et al8 found that a curriculum including both didactic lectures and QI projects improved subjective QI knowledge and comfort. Interestingly, Fok and Wong9 found that resident knowledge could be sustained post curriculum after completion of a QI project, suggesting that experiential learning may be helpful in maintaining knowledge.
Studies also have looked at providing performance data to residents. Hwang et al18 found that providing audit and feedback in the form of individual panel performance data to residents compared with practice targets led to statistically significant improvement in cancer screening rates and composite quality score, indicating that there is tremendous potential in providing residents with their data. While the ACGME mandates that residents should receive data on their quality metrics, on CLER visits, many residents interviewed noted limited access to data on their metrics and benchmarks.1,2
Though previous studies have individually looked at teaching QI concepts, providing panel data, or targeting select metrics, our study was unique in that it reviewed both self-reported resident outcomes data as well as actual patient outcomes. In addition to finding increased knowledge of patient panels and comfort with QI approaches, we found a significant increase in colorectal cancer screening rates post intervention. We thought this finding was particularly important given some data that residents' patients have been found to have worse outcomes on quality metrics compared with patients cared for by staff physicians.14,15 Given that having a resident physician as a PCP has been associated with failing to meet quality measures, it is especially important to focus targeted quality improvement initiatives in this patient population to reduce disparities in care.
We found that residents had improved knowledge on their patient panels as a result of this initiative. The residents were noted to have a higher knowledge of their HTN and colorectal cancer screening rates in comparison to their diabetes metrics. We suspect this is because residents are provided with multiple metrics related to diabetes, including process measures such as A1c testing, as well as outcome measures such as A1c control, so it may be harder for them to elucidate exactly how they are doing with their diabetes patients, whereas in HTN control and colorectal cancer screening, there is only 1 associated metric. Interestingly, even though HTN and colorectal cancer screening were the 2 measures focused on in the study, the residents had a significant improvement in knowledge of the rates of diabetes in their panel as well. This suggests that even just receiving data alone is valuable, hopefully translating to better outcomes with better baseline understanding of panels. We believe that our intervention was successful because it included both a didactic and an experiential component, as well as the use of individual panel performance data.
There were several limitations to our study. It was performed at a single institution, translating to a small sample size. Our data analysis was limited because we were unable to pair our pre- and postintervention survey responses because we used an anonymous survey. We also did not have full participation in postintervention surveys from all residents, which may have biased the study in favor of high performers. Another limitation was that our survey relied on self-reported outcomes for the questions about the residents knowing their patient panels.
This study required a 2-hour workshop every 3 weeks led by a faculty member trained in QI. Given the amount of time needed for the curriculum, this study may be difficult to replicate at other institutions, especially if faculty with an interest or training in QI are not available. Given our finding that residents had increased knowledge of their patient panels after receiving panel metrics, simply providing data with the goal of smaller, focused interventions may be easier to implement. At our institution, we discontinued the longer 2-hour QI workshops designed to teach QI approaches more broadly. We continue to provide individualized panel data to all residents during their primary care rotations and conduct half-hour, small group workshops with the interns that focus on drafting aim statements and planning interventions. All residents are required to submit worksheets to us at the end of their primary care blocks listing their current rates of each predetermined metric and laying out their aim statements and planned interventions. Residents also continue to receive feedback from our faculty with expertise in QI afterward on their plans and evidence of follow-through in the chart, with their preceptors included on the feedback emails. Even without the larger QI workshop, this approach has continued to be successful and appreciated. In fact, it does appear as though improvement in colorectal cancer screening has been sustained over several years. At the end of our study period, the resident patient colorectal cancer screening rate rose from 34% to 43%, and for the 2021-2022 academic year, the rate rose further, from 46% to 50%.
Given that the resident clinic patient population is at higher risk overall, targeted outreach and approaches to improve quality must be continued. Future areas of research include looking at which interventions, whether QI curriculum, provision of panel data, or required panel management interventions, translate to the greatest improvements in patient outcomes in this vulnerable population.
Conclusion
Our study showed that a dedicated QI curriculum for the residents and access to quality metric data improved both resident knowledge and comfort with QI approaches. Beyond resident-centered outcomes, there was also translation to improved patient outcomes, with a significant increase in colon cancer screening rates post intervention.
Corresponding author: Kinjalika Sathi, MD, 800 Washington St., Boston, MA 02111; ksathi@tuftsmedicalcenter.org
Disclosures: None reported.
1. Accreditation Council for Graduate Medical Education. ACGME Common Program Requirements (Residency). Approved June 13, 2021. Updated July 1, 2022. Accessed December 29, 2022. https://www.acgme.org/globalassets/pfassets/programrequirements/cprresidency_2022v3.pdf
2. Koh NJ, Wagner R, Newton RC, et al; on behalf of the CLER Evaluation Committee and the CLER Program. CLER National Report of Findings 2021. Accreditation Council for Graduate Medical Education; 2021. Accessed December 29, 2022. https://www.acgme.org/globalassets/pdfs/cler/2021clernationalreportoffindings.pdf
3. Liao JM, Co JP, Kachalia A. Providing educational content and context for training the next generation of physicians in quality improvement. Acad Med. 2015;90(9):1241-1245. doi:10.1097/ACM.0000000000000799
4. Johnson KM, Fiordellisi W, Kuperman E, et al. X + Y = time for QI: meaningful engagement of residents in quality improvement during the ambulatory block. J Grad Med Educ. 2018;10(3):316-324. doi:10.4300/JGME-D-17-00761.1
5. Kesari K, Ali S, Smith S. Integrating residents with institutional quality improvement teams. Med Educ. 2017;51(11):1173. doi:10.1111/medu.13431
6. Ogrinc G, Cohen ES, van Aalst R, et al. Clinical and educational outcomes of an integrated inpatient quality improvement curriculum for internal medicine residents. J Grad Med Educ. 2016;8(4):563-568. doi:10.4300/JGME-D-15-00412.1
7. Malayala SV, Qazi KJ, Samdani AJ, et al. A multidisciplinary performance improvement rotation in an internal medicine training program. Int J Med Educ. 2016;7:212-213. doi:10.5116/ijme.5765.0bda
8. Duello K, Louh I, Greig H, et al. Residents’ knowledge of quality improvement: the impact of using a group project curriculum. Postgrad Med J. 2015;91(1078):431-435. doi:10.1136/postgradmedj-2014-132886
9. Fok MC, Wong RY. Impact of a competency based curriculum on quality improvement among internal medicine residents. BMC Med Educ. 2014;14:252. doi:10.1186/s12909-014-0252-7
10. Wilper AP, Smith CS, Weppner W. Instituting systems-based practice and practice-based learning and improvement: a curriculum of inquiry. Med Educ Online. 2013;18:21612. doi:10.3402/meo.v18i0.21612
11. Weigel C, Suen W, Gupte G. Using lean methodology to teach quality improvement to internal medicine residents at a safety net hospital. Am J Med Qual. 2013;28(5):392-399. doi:10.1177/1062860612474062
12. Tomolo AM, Lawrence RH, Watts B, et al. Pilot study evaluating a practice-based learning and improvement curriculum focusing on the development of system-level quality improvement skills. J Grad Med Educ. 2011;3(1):49-58. doi:10.4300/JGME-D-10-00104.1
13. Djuricich AM, Ciccarelli M, Swigonski NL. A continuous quality improvement curriculum for residents: addressing core competency, improving systems. Acad Med. 2004;79(10 Suppl):S65-S67. doi:10.1097/00001888-200410001-00020
14. Essien UR, He W, Ray A, et al. Disparities in quality of primary care by resident and staff physicians: is there a conflict between training and equity? J Gen Intern Med. 2019;34(7):1184-1191. doi:10.1007/s11606-019-04960-5
15. Amat M, Norian E, Graham KL. Unmasking a vulnerable patient care process: a qualitative study describing the current state of resident continuity clinic in a nationwide cohort of internal medicine residency programs. Am J Med. 2022;135(6):783-786. doi:10.1016/j.amjmed.2022.02.007
16. Wong BM, Etchells EE, Kuper A, et al. Teaching quality improvement and patient safety to trainees: a systematic review. Acad Med. 2010;85(9):1425-1439. doi:10.1097/ACM.0b013e3181e2d0c6
17. Armstrong G, Headrick L, Madigosky W, et al. Designing education to improve care. Jt Comm J Qual Patient Saf. 2012;38:5-14. doi:10.1016/s1553-7250(12)38002-1
18. Hwang AS, Harding AS, Chang Y, et al. An audit and feedback intervention to improve internal medicine residents’ performance on ambulatory quality measures: a randomized controlled trial. Popul Health Manag. 2019;22(6):529-535. doi:10.1089/pop.2018.0217
19. Institute for Healthcare Improvement. Open school. The paper airplane factory. Accessed December 29, 2022. https://www.ihi.org/education/IHIOpenSchool/resources/Pages/Activities/PaperAirplaneFactory.aspx
Nitrite food additives may increase risk of type 2 diabetes
Consuming a large amount of nitrites from food additives versus none was associated with a greater risk of developing type 2 diabetes in the NutriNet-Santé study in France, researchers report.

However, a few experts who were not involved with this research question the strength of the findings because of study limitations.
The study involved more than 100,000 adults with a mean age of 43, and 79% were women.
Individuals with the highest intakes of nitrites from food additives (top third) had a 53% higher risk of developing type 2 diabetes during a median follow-up of 7 years compared with those with the lowest intake of this food additive after controlling for intake of sugars, red and processed meats, heme iron, salt, and saturated fatty acids. Consumption of nitrates from food additives was not associated with risk of type 2 diabetes.
“Our findings suggest a direct association between additives-originated nitrites and [type 2 diabetes] risk and corroborate previously suggested associations between total dietary nitrites and [type 2 diabetes],” the researchers report in an article published online in PLoS Medicine.
However, “as this is the first large-scale study finding these associations, these results need to be replicated in other large-scale cohorts,” senior author Mathilde Touvier, PhD, head of the Nutritional Epidemiology Research Team (EREN-CRESS), INSERM, INRAE, Sorbonne Paris Nord University, and lead author Bernard Srour, PhD, PharmD, a scientist at the same institution, said in a joint email to this news organization.
Short-term intervention studies to determine insulin resistance could also be tested, they add.
In the meantime, “this study adds further evidence to the existing strong link between nitrites and colorectal cancer risk, and supports the importance of further regulation of nitrites as food additives and nitrogen fertilizers,” they say.
According to Dr. Touvier and Dr. Srour, the takeaway message for clinicians is the finding that nitrites from food additives are associated with type 2 diabetes, “support existing guidelines recommending [limiting] the consumption of processed meats to prevent chronic diseases. However, the consumption of vegetables should be encouraged as they contain several beneficial compounds and contribute to chronic disease prevention.”
Some experts are skeptical
But three experts who were not involved with the research were skeptical about the conclusions, in comments made to the U.K. Science Media Centre.
“The fundamental weakness of this study is how the food additive intake was assessed,” said Tom Sanders, DSc, PhD, professor emeritus of nutrition and dietetics, King’s College London. “Estimates of intake were based on recalls of dietary intake on two separate occasions at the beginning of the study with no further estimates in the follow-up period of over 7 years,” he noted.
Other limitations include the relatively young age of the cohort and relatively low incidence of new cases of type 2 diabetes (about 1% of the study population over 7 years).
Moreover, the level of nitrite food additive ingestion is much lower than the acceptable daily intake. The findings would need to be replicated with appropriate adjustment for differences in body weight.
Gunter Kuhnle, PhD, professor of nutrition and food science, University of Reading, England, said that “the study does not support the claim in the press release and paper that food additives are responsible for the increased risk.”
He pointed out that “nitrite from additives contributes only about 4%-6% of total nitrite intake in the population, and it is not clear why this should have a stronger impact on risk than nitrite from other sources,” such as nitrate found in food and water.
Duane Mellor, PhD, registered dietitian and senior lecturer, Aston University, Birmingham, England, said: “It could be questioned how accurate estimating intakes of individual additives like sodium nitrite, which was less than 1 mg per day from a record of just 2 days food intake per year, as it assumes people ate the same the other 363 days of the year.”
Moreover, “it is perhaps worth noting that the use of nitrites as an additive is often as sodium nitrite, which is used to cure meats like bacon, which if someone is seeking to reduce their risk of type 2 diabetes would be something people would be encouraged to eat less of [anyway].”
“The best way to reduce your risk of developing type 2 diabetes,” he said, “is to be physically active, maintain a healthy weight for you, and eat a varied diet based on vegetables, pulses, nuts, seeds, and fruit along with wholegrain and moderate intakes of dairy foods and meat (especially processed meats).”
Study details
Nitrites and nitrates are used as food additives to prevent bacterial growth, mainly in processed meats, and they are also found in foods (mainly green leafy vegetables) and water (nitrates from the use of nitrogen fertilizer can enter the water supply).
The researchers analyzed data from 104,168 participants in NutriNet-Santé who had no diabetes at baseline and who completed 24-hour dietary intake records. They investigated the association between exposure to nitrites and nitrates (in food and water or in additives) and incident type 2 diabetes.
Most nitrites came from food (95.3%), and less often from food additives (4.7%) and water (< 0.01%). The nitrites in foods were mainly from vegetables (60%) and seasonings (23%).
Most nitrates also came from food (93%), followed by water (6.9%) and food additives (0.1%). The nitrates in foods were mainly from vegetables (41%), processed meat (19%), and meat (17%).
During a median follow-up of 7.3 years, there were 969 incident cases of type 2 diabetes.
Compared with individuals in the lowest third of nitrites from food and water, those in the highest tertile had a 27% higher risk of incident type 2 diabetes, after adjusting for multiple variables (hazard ratio, 1.27; P = .009).
The risk of type 2 diabetes associated with the highest intake of nitrites from additives was as previously described, 53% higher, than that for those with the lowest intake.
There was no evidence of an association between nitrates and risk of type 2 diabetes.
The researchers acknowledge that study limitations include potential errors in assessment of nitrate and nitrate exposure, potential selection bias (participants in the web-based study may have had healthier behaviors than the general population), and potential unaccounted confounders (because it was an observational study).
A version of this article first appeared on Medscape.com.
Consuming a large amount of nitrites from food additives versus none was associated with a greater risk of developing type 2 diabetes in the NutriNet-Santé study in France, researchers report.
However, a few experts who were not involved with this research question the strength of the findings because of study limitations.
The study involved more than 100,000 adults with a mean age of 43, and 79% were women.
Individuals with the highest intakes of nitrites from food additives (top third) had a 53% higher risk of developing type 2 diabetes during a median follow-up of 7 years compared with those with the lowest intake of this food additive after controlling for intake of sugars, red and processed meats, heme iron, salt, and saturated fatty acids. Consumption of nitrates from food additives was not associated with risk of type 2 diabetes.
“Our findings suggest a direct association between additives-originated nitrites and [type 2 diabetes] risk and corroborate previously suggested associations between total dietary nitrites and [type 2 diabetes],” the researchers report in an article published online in PLoS Medicine.
However, “as this is the first large-scale study finding these associations, these results need to be replicated in other large-scale cohorts,” senior author Mathilde Touvier, PhD, head of the Nutritional Epidemiology Research Team (EREN-CRESS), INSERM, INRAE, Sorbonne Paris Nord University, and lead author Bernard Srour, PhD, PharmD, a scientist at the same institution, said in a joint email to this news organization.
Short-term intervention studies to determine insulin resistance could also be tested, they add.
In the meantime, “this study adds further evidence to the existing strong link between nitrites and colorectal cancer risk, and supports the importance of further regulation of nitrites as food additives and nitrogen fertilizers,” they say.
According to Dr. Touvier and Dr. Srour, the takeaway message for clinicians is the finding that nitrites from food additives are associated with type 2 diabetes, “support existing guidelines recommending [limiting] the consumption of processed meats to prevent chronic diseases. However, the consumption of vegetables should be encouraged as they contain several beneficial compounds and contribute to chronic disease prevention.”
Some experts are skeptical
But three experts who were not involved with the research were skeptical about the conclusions, in comments made to the U.K. Science Media Centre.
“The fundamental weakness of this study is how the food additive intake was assessed,” said Tom Sanders, DSc, PhD, professor emeritus of nutrition and dietetics, King’s College London. “Estimates of intake were based on recalls of dietary intake on two separate occasions at the beginning of the study with no further estimates in the follow-up period of over 7 years,” he noted.
Other limitations include the relatively young age of the cohort and relatively low incidence of new cases of type 2 diabetes (about 1% of the study population over 7 years).
Moreover, the level of nitrite food additive ingestion is much lower than the acceptable daily intake. The findings would need to be replicated with appropriate adjustment for differences in body weight.
Gunter Kuhnle, PhD, professor of nutrition and food science, University of Reading, England, said that “the study does not support the claim in the press release and paper that food additives are responsible for the increased risk.”
He pointed out that “nitrite from additives contributes only about 4%-6% of total nitrite intake in the population, and it is not clear why this should have a stronger impact on risk than nitrite from other sources,” such as nitrate found in food and water.
Duane Mellor, PhD, registered dietitian and senior lecturer, Aston University, Birmingham, England, said: “It could be questioned how accurate estimating intakes of individual additives like sodium nitrite, which was less than 1 mg per day from a record of just 2 days food intake per year, as it assumes people ate the same the other 363 days of the year.”
Moreover, “it is perhaps worth noting that the use of nitrites as an additive is often as sodium nitrite, which is used to cure meats like bacon, which if someone is seeking to reduce their risk of type 2 diabetes would be something people would be encouraged to eat less of [anyway].”
“The best way to reduce your risk of developing type 2 diabetes,” he said, “is to be physically active, maintain a healthy weight for you, and eat a varied diet based on vegetables, pulses, nuts, seeds, and fruit along with wholegrain and moderate intakes of dairy foods and meat (especially processed meats).”
Study details
Nitrites and nitrates are used as food additives to prevent bacterial growth, mainly in processed meats, and they are also found in foods (mainly green leafy vegetables) and water (nitrates from the use of nitrogen fertilizer can enter the water supply).
The researchers analyzed data from 104,168 participants in NutriNet-Santé who had no diabetes at baseline and who completed 24-hour dietary intake records. They investigated the association between exposure to nitrites and nitrates (in food and water or in additives) and incident type 2 diabetes.
Most nitrites came from food (95.3%), and less often from food additives (4.7%) and water (< 0.01%). The nitrites in foods were mainly from vegetables (60%) and seasonings (23%).
Most nitrates also came from food (93%), followed by water (6.9%) and food additives (0.1%). The nitrates in foods were mainly from vegetables (41%), processed meat (19%), and meat (17%).
During a median follow-up of 7.3 years, there were 969 incident cases of type 2 diabetes.
Compared with individuals in the lowest third of nitrites from food and water, those in the highest tertile had a 27% higher risk of incident type 2 diabetes, after adjusting for multiple variables (hazard ratio, 1.27; P = .009).
The risk of type 2 diabetes associated with the highest intake of nitrites from additives was as previously described, 53% higher, than that for those with the lowest intake.
There was no evidence of an association between nitrates and risk of type 2 diabetes.
The researchers acknowledge that study limitations include potential errors in assessment of nitrate and nitrate exposure, potential selection bias (participants in the web-based study may have had healthier behaviors than the general population), and potential unaccounted confounders (because it was an observational study).
A version of this article first appeared on Medscape.com.
FROM PLOS MEDICINE
Diet packed with fast food found hard on the liver
The study finds that getting one-fifth or more of total daily calories from fast food can increase the risk of nonalcoholic fatty liver disease, which can lead to cirrhosis and its complications, including liver failure and liver cancer.
Although the magnitude of association was modest among the general population, “striking” elevations in steatosis were evident among persons with obesity and diabetes who consumed fast food, in comparison with their counterparts who did not have obesity and diabetes, the researchers reported.
“My hope is that this study encourages people to seek out more nutritious, healthy food options and provides information that clinicians can use to counsel their patients, particularly those with underlying metabolic risk factors, of the importance of avoiding foods that are high in fat, carbohydrates, and processed sugars,” lead investigator Ani Kardashian, MD, hepatologist with the University of Southern California, Los Angeles, said in an interview.
“At a policy level, public health efforts are needed to improve access to affordable, healthy, and nutritious food options across the U.S. This is especially important as more people have turned to fast foods during the pandemic and as the price of food as risen dramatically over the past year due to food inflation,” Dr. Kardashian added.
The study was published online in Clinical Gastroenterology and Hepatology.
More fast food, greater steatosis
The findings are based on data from 3,954 adults who participated in the National Health and Nutrition Examination Survey (NHANES) of 2017-2018 and who underwent vibration-controlled transient elastography. Of these participants, data regarding 1- or 2-day dietary recall were available.
Steatosis, the primary outcome, was measured via controlled attenuation parameter (CAP). Two validated cutoffs were utilized (CAP ≥ 263 dB/m and CAP ≥ 285 dB/m).
Of those surveyed, 52% consumed any fast food, and 29% derived 20% or more of their daily calories from fast food.
Fast-food intake of 20% or more of daily calories was significantly associated with greater steatosis after multivariable adjustment, both as a continuous measure (4.6 dB/m higher CAP score) and with respect to the CAP ≥ 263 dB/m cutoff (odds ratio [OR], 1.45).
“The negative effects are particularly severe in people who already have diabetes and obesity,” Dr. Kardashian told this news organization.
For example, with diabetes and fast-food intake of 20% or more of daily calories, the ORs of meeting the CAP ≥ 263 dB/m cutoff and the CAP ≥ 285 dB/m cutoff were 2.3 and 2.48, respectively.
The researchers said their findings are particularly “alarming,” given the overall increase in fast-food consumption over the past 50 years in the United States, regardless of socioeconomic status.
Diet coaching
The finding that fast food has more deleterious impact on those with obesity and diabetes “emphasizes that it is not just one insult but multiple factors that contribute to overall health,” said Nancy Reau, MD, section chief of hepatology at Rush University Medical Center in Chicago.
“This is actually great news, because diet is modifiable, vs. your genetics, which you currently can’t change. This doesn’t mean if you’re lean you can eat whatever you want, but if you are overweight, being careful with your diet does have impact, even if it doesn’t lead to substantial weight changes,” said Dr. Reau, who is not affiliated with the study.
For people who have limited options and need to eat fast food, “there are healthy choices at most restaurants; you just need to be smart about reading labels, watching calories, and ordering the healthier options,” Dr. Reau said in an interview.
Fast food and fatty liver go “hand in hand,” Lisa Ganjhu, DO, gastroenterologist and hepatologist at NYU Langone Health in New York, told this news organization.
“I counsel and coach my patients on healthy diet and exercise, and I’ve been pretty successful,” said Dr. Ganjhu, who was not involved with the study.
“If my patient is eating at McDonald’s a lot, I basically walk through the menu with them and help them find something healthy. When patients see the benefits of cutting out fat and reducing carbohydrates, they are more apt to continue,” Dr. Ganjhu said.
The study was funded by the University of Southern California. Dr. Kardashian, Dr. Reau, and Dr. Ganjhu have disclosed no relevant financial relationships.
A version of this article first appeared on Medscape.com.
FROM CLINICAL GASTROENTEROLOGY AND HEPATOLOGY