User login
Knee Extensor Mechanism Reconstruction With Complete Extensor Allograft After Failure of Patellar Tendon Repair
The extensor mechanism of the knee comprises the quadriceps tendon, the patella, and the patellar tendon. The extensor mechanism may be damaged by injury to these structures, with consequences such as the inability to actively extend the knee and hemarthrosis.1,2 Disruption of this mechanism is rare, and the most common injury pattern is an eccentric contraction of the quadriceps tendon on a flexed knee causing a tendon (quadriceps or patellar) rupture or a patella fracture.1,2
Patellar tendon ruptures are more common in persons younger than 40 years.1 Treatment is surgical, regardless of age and physical activity. In the acute setting, repair can be end-to-end suture or transosseous tunnel insertion. End-to-end suturing is difficult in chronic patellar tendon ruptures because of patella alta secondary to quadriceps contraction.3 Treatment options for chronic ruptures may involve transpatellar traction4 or tendon reinforcement with fascia lata, a semitendinosus band, or synthetic materials.3-5 Alternatively, tendon autograft and allografts have also been recommended, especially in extreme situations.1,6 Furthermore, animal experiments have shown that a compact platelet-rich fibrin scaffold (CPFS) has the potential to accelerate healing of patellar tendon defects and to act as a bioscaffold for graft augmentation.7
We describe the case of a 30-year-old man who underwent extensor mechanism reconstruction with cadaveric tendon–patellar tendon–bone allograft for failure of an infected primary end-to-end repair. The patient provided written informed consent for print and electronic publication of this case report.
Case Report
A 30-year-old healthy man landed on an empty glass fish tank, resulting in a traumatic right-knee arthrotomy. On initial evaluation, the patient had a negative straight-leg-raise test and impaired knee extension. The patient was taken urgently to the operating room for irrigation and débridement and concurrent repair of the patellar tendon laceration. Antibiotic prophylaxis with 2 g of intravenous (IV) cefazolin was given in the emergency room.
Intraoperatively, after visualizing the patellar tendon laceration and excluding any associated chondral lesions, we proceeded with extensive débridement and irrigation using 9 L of normal saline pulse lavage. After we achieved a clean site, we proceeded to repair the patellar tendon using No. 2 FiberWire sutures (Arthrex, Naples, Florida) with a classic Krackow repair8 consisting of 2 sutures run in a 4-row fashion through the patella and the patellar tendon. The suture was securely tightened and then tested for stability to at least 90° of knee flexion. The retinaculum was repaired using No. 0 Vicryl sutures (Ethicon, Somerville, New Jersey). After wound closure and dressing, the patient was placed in a hinged knee brace locked in extension at all times after surgery. Antibiotic treatment with IV cefazolin was administered for 48 hours.
Postoperative management consisted of weight-bearing as tolerated on the operative limb and appropriate deep venous thrombosis prophylaxis. The patient followed up in clinic 2 weeks and 4 weeks after surgery. At 4 weeks, the patient was noted to have a secondary wound infection with superficial dehiscence and serosanguineous drainage. No wound opening was noticed, and local wound care was performed with a 1-week course of oral cephalexin. The patient was scheduled to follow up a few weeks later but did not follow up for a year.
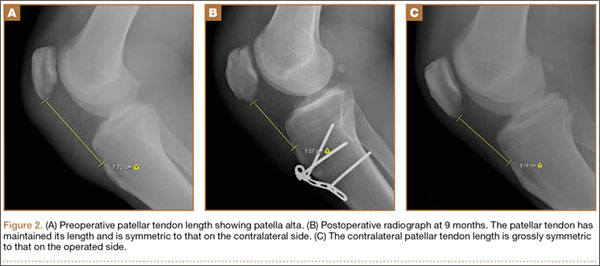
At 1-year follow-up, the patient reported that he had had a steady progression of his knee range of motion (ROM) with decreased pain. However, over time, the patient noted subjective instability of the knee, with frequent falls occurring close to his 1-year follow-up. Examination of his knee showed that his active ROM ranged from 20° in extension to 120° in flexion, with a weak extensor mechanism. Passively, his knee could be brought to full extension. His incision was well healed, but it had an area of bogginess in the middle. Radiographs showed patella alta on the affected knee, with a lengthening of the patellar tendon of 7.70 cm on the right compared with 5.18 cm on the left. Magnetic resonance imaging (MRI) showed moderate-to-severe patellar tendinosis with small fluid pockets around the surgical material and evidence of acute patellar enthesopathy. The laboratory values showed a white blood cell count of 7580/μL (normal, 4500-11,000/μL), an erythrocyte sedimentation rate of 2 mm/h (normal, 1-15 mm/h), and a C-reactive protein level of 1.93 mg/dL (normal, 0.00-0.29 mg/dL). Based on the clinical examination and imaging findings, there was a concern for a possible chronic deep-tissue infection, in addition to failure of the primary patellar tendon repair. Operative versus nonoperative management options were discussed with the patient, and he elected to undergo surgery.
During surgery, the patellar laxity was confirmed, and the patellar tendon was noticed to be chronically thickened and surrounded by unhealthy tissue. Initially, an extensive soft-tissue débridement was performed, and all patellar tendon loculations visualized on the preoperative MRI were drained; a solid purulent-like fluid was expressed. Unfortunately, the extensive and required débridement did not allow the preservation of the patellar tendon. Appropriate cultures were taken and sent for immediate Gram-stain analysis, which returned negative. Tissue samples from the patellar tendon were also sent to the pathology department for analysis. Intraoperatively, the infrapatellar defect was filled temporarily with a tobramycin cement spacer mixed with 2 g of vancomycin in a manner similar to that of the Masquelet technique used for infected long-bone nonunions with bone loss.9,10 This technique is a 2-stage procedure that promotes the formation of a biologic membrane that allows bone healing in the reconstruction of long-bone defects. The first stage consists of a radical débridement with soft-tissue repair by flaps when needed, with the insertion of a polymethylmethacrylate cement spacer into the bone defect. The second stage is usually performed 6 to 8 weeks later, with removal of the spacer and preservation of the induced membrane, which is filled with iliac crest bone autograft augmented (if necessary) with demineralized allograft.
The incision was closed primarily, and after surgery, the patient was allowed to bear weight as tolerated in a hinged knee brace locked in extension. Final laboratory analysis from cultures and tissue samples revealed acute and chronic inflammation with more than 20 neutrophils per high-powered field. No organisms grew from aerobic, anaerobic, fungal, or mycobacterial cultures. The infectious disease service was consulted and recommended oral cephalexin.
Because all cultures were negative, all laboratory examinations did not indicate any residual infections, and no bony involvement was noticed intraoperatively or in the preoperative knee MRI, we decided to proceed with the second stage of the Masquelet technique after 2 weeks. The patient returned to the operating room for final reconstruction of his patellar tendon using a custom-ordered cadaveric tendon–patellar tendon–bone allograft, the length of which was determined by measuring the contralateral patellar tendon, ie, 5.18 cm (Figure 1A). The previous anterior knee incision was reopened and extended distally past the tibial tuberosity and proximally toward the quadriceps tendon. The antibiotic spacer was removed. We proceeded with a repeat irrigation and débridement and the allograft transfer. The selected allograft was customized by reducing the tibial bone component to an approximately 1×2-cm bone block and by reducing the allograft patellar thickness with an oscillating saw, leaving an approximately 2-mm thick patellar bone graft attached to the patellar tendon. In a similar technique using an oscillating saw, we shaved off the anterior cortex of the patient’s patella to accommodate, in a sandwich fashion, the patellar allograft. Proximally, the quadriceps tendon insertion was split longitudinally and partially separated from the superior pole of the patellar tendon to allow seating and fixation of the modified quadriceps allograft tendon component.
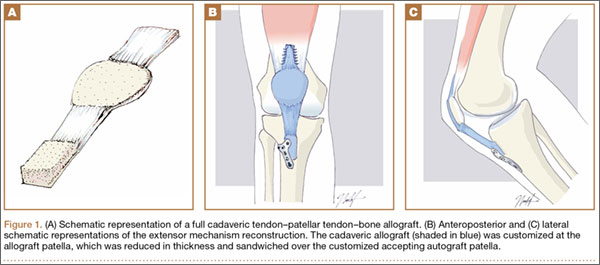
We proceeded with the fixation of the allograft first distally on the patella. The anterior cortex of the tibial tuberosity was resected to allow the perfect seating of the bone block allograft. The graft was secured with a 4.0-mm fully threaded cancellous lag screw and reinforced with a 2.4-mm, 3-hole T-volar buttress plate (Synthes, Paoli, Pennsylvania). The plate was contoured to better fit the patient’s tibia. We sutured the patellar allograft tendon to the patella using two No. 2-0 FiberWire sutures in Krackow suture technique8 (Figures 1B, 1C). We obtained good fixation of the patellar tendon, and the distance between the patellar insertion and the inferior patellar pole was the same as before surgery: 5.57 cm and comparable to the contralateral side (Figures 2A-2C). The patellar allograft and autograft sandwich were secured with additional No. 2-0 FiberWire sutures, and the quadriceps allograft and autograft were secured with the cross-stitch technique with the same material. Fine suturing of the quadriceps tendon was done with No. 0 Vicryl sutures. After the fixation was completed, we tested the stability of the reconstruction and found good flexion up to 120°.
The postoperative protocol consisted of weight-bearing as tolerated in full extension and passive knee ROM, using a continuous passive ROM machine from 0° to 45° for the first 4 weeks, followed by active ROM, increased as tolerated, during the next 8 weeks.
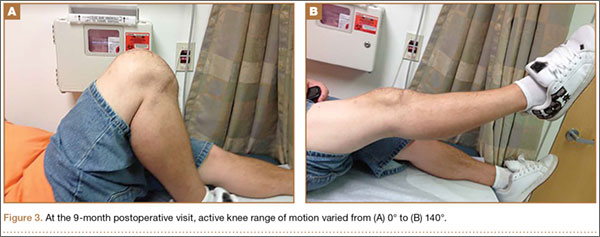
The patient was seen in clinic 3 and 9 months after surgery. At the 3-month follow-up appointment, the patient’s examination showed knee ROM from 0° extension to 130° of flexion, no secondary infection signs, and radiographic evidence of a well-healing patellar allograft with symmetric patellar tendon length to the contralateral side. At 9-month follow-up, the patient’s active ROM was from 0° extension to 140° flexion (Figures 3A, 3B), and he had returned to his preinjury level of functioning.
Discussion
This case report describes the successful reconstruction of a patellar tendon defect with cadaveric tendon–patellar tendon–bone allograft. Extensor mechanism injuries are uncommon in general, and the incidence of patellar tendon injury is higher in men than in women.2 Patellar tendon tears occur frequently in active patients younger than 40 years, usually as a result of sudden quadriceps contraction with the knee slightly flexed.1 Treatment of patellar tendon injury is surgical, and functional outcomes for patients with this injury are equivalent to those of patients with quadriceps tendon injuries or patellar fractures.2 Acute patellar tendon tears can be repaired by end-to-end suturing or transosseous tunnel insertion in the tibia or patella.1 Reinforcement is often added between the patella and tibial tuberosity, using a semitendinosus band or wire.1 End-to-end suture is performed using a thick resorbable suture. It is important to avoid patella alta during suturing, comparing the position of the patella with the contralateral patella with the knee in 45° of flexion. In proximal avulsion, the tendon is anchored to the bone by 2 thick nonresorbable sutures through 2 parallel bone tunnels to the proximal pole of the patella. Distal avulsion is rare in adults, but it can be managed by using staples or suture anchors.1
End-to-end suturing of chronic patellar tendon defects is difficult more than 45 days after injury primarily because of difficulties in correcting patella alta secondary to the upward force exerted by the quadriceps tendon.1,3 Extreme situations similar to the case we present warrant Achilles or patellar tendon allograft for reconstruction of the extensor mechanism.1,3,6,9
Extensor mechanism allograft also provides an effective remedy for severe quadriceps deficiency caused by loss of the patella, patellar tendon, and quadriceps tendon in total knee arthroplasty.10 However, in such cases, late failure is common, and major quadriceps deficiency occurs after removal of the allograft material.10 To improve outcome, a novel technique using the medial gastrocnemius muscle transferred to the muscular portion of the vastus medialis and lateralis flaps provides a secure and strong closure of the anterior knee, thereby restoring the extensor mechanism of the knee.10
Patellar tendon reconstruction with allograft tissue has been successfully used, especially in cases related to chronic patellar tendon ruptures11 and total knee arthroplasty.6,12-14 Crossett and colleagues12 showed that, at 2-year follow-up, the average knee score for pain, ROM, and stability had improved from 26 points (range, 6-39 points) before surgery to 81 points (range, 40-92 points). The average knee score for function had also improved: 14 points (range, 0-35 points) before surgery to 53 points (range, 30-90 points).12 Primary repair may succeed in early intervention, but in an established rupture, allograft reconstruction is often necessary. Achilles tendon is the preferred allograft, with the calcaneus fragment embedded into the proximal tibia as a new tubercle and the tendon sutured into the remaining extensor mechanism.1,11 The repair is further protected using a cable loop from the superior pole of the patella to a drill hole in the upper tibia.9 Techniques have also been described involving passage of the proximal aspect of the allograft tendon through patellar bone tunnels and suture fixation to the native quadriceps tendon.11,15 However, in our technique, we shaved off the anterior cortex of the patient’s patella to allow a sandwich-type over-position of the allograft to secure fixation to the patella.
Another alternative to allograft reconstruction involves biocompatible scaffolds. Such scaffolds incorporate the use of platelets in a fibrin framework. A CPFS, produced from blood and calcium gluconate to improve healing of patellar tendon defects, has been described in animal studies.7 In the rabbit model, CPFS acts as a provisional bioscaffold that can accelerate healing of an injured patellar tendon repair, potentially secondary to several growth factors derived from platelets.7 Platelets are biocompatible sources of growth factors, and CPFS can act as a scaffold to restore the mechanical integrity of injured soft tissue.7,16 In addition, CPFS can act to lower donor-site morbidity associated with harvesting tissue autograft.7 However, to our knowledge, such scaffolds have not been used in human trials. The LARS biocompatible ligament (Corin Group PLC, Cirencester, United Kingdom), currently not approved by the US Food and Drug Administration, is used for reconstructions of isolated or multiple knee ligament injuries.17 This graft requires the presence of healthy tissue with good blood supply from which new tendon or ligament can grow in. Sometimes it is also used for extensor mechanism reconstruction after radical tumor resection around the knee; however, good results are achieved in only 59% of cases,18 and to our knowledge, only 1 case of primary repair of a patellar tendon rupture has been published.19
Techniques involving the use of tendon–patellar tendon–bone graft with fixation via the sandwich-type over-position of the allograft for chronic patellar tendon rupture have not been described in the literature. In our patient, given the extensive patellar tendon lesion and inflammation with chronic tissue degeneration, there was no option but to use allograft. To improve the patient’s outcome, we chose the strongest possible allograft, tendon–patellar tendon–bone graft.
Conclusion
Revision patellar tendon reconstruction is a challenging, but necessary, procedure to restore the extensor mechanism of the knee, especially in young, active individuals. Various options to reconstruct the tissue defects are available. Our patient was successfully treated with a tendon–patellar tendon–bone allograft reconstruction.
1. Saragaglia D, Pison A, Rubens-Duval B. Acute and old ruptures of the extensor apparatus of the knee in adults (excluding knee replacement). Orthop Traumatol Surg Res. 2013;99(1 suppl):S67-S76.
2. Tejwani NC, Lekic N, Bechtel C, Montero N, Egol KA. Outcomes after knee joint extensor mechanism disruptions: is it better to fracture the patella or rupture the tendon? J Orthop Trauma. 2012;26(11):648-651.
3. Ecker ML, Lotke PA, Glazer RM. Late reconstruction of the patellar tendon. J Bone Joint Surg Am. 1979;61(6):884-886.
4. Siwek CW, Rao JP. Ruptures of the extensor mechanism of the knee joint. J Bone Joint Surg Am. 1981;63(6):932-937.
5. Levy M, Goldstein J, Rosner M. A method of repair for quadriceps tendon or patellar ligament (tendon) ruptures without cast immobilization. Preliminary report. Clin Orthop Relat Res. 1987;218:297-301.
6. Burks RT, Edelson RH. Allograft reconstruction of the patellar ligament. A case report. J Bone Joint Surg Am. 1994;76(7):1077-1079.
7. Matsunaga D, Akizuki S, Takizawa T, Omae S, Kato H. Compact platelet-rich fibrin scaffold to improve healing of patellar tendon defects and for medial collateral ligament reconstruction. Knee. 2013;20(6):545-550.
8. Krackow KA, Thomas SC, Jones LC. Ligament-tendon fixation: analysis of a new stitch and comparison with standard techniques. Orthopedics. 1988;11(6):909-917.
9. Brooks P. Extensor mechanism ruptures. Orthopedics. 2009;32(9):683-684.
10. Whiteside LA. Surgical technique: muscle transfer restores extensor function after failed patella-patellar tendon allograft. Clin Orthop Relat Res. 2014;472(1):218-226.
11. Farmer K, Cosgarea AJ. Procedure 25. Acute and chronic patellar tendon ruptures. In: Miller MD, Cole BJ, Cosgarea AJ, Sekiya JK, eds. Operative Techniques: Sports Knee Surgery. Philadelphia, PA: Saunders (Elsevier); 2008:397-417.
12. Crossett LS, Sinha RK, Sechriest VF, Rubash HE. Reconstruction of a ruptured patellar tendon with achilles tendon allograft following total knee arthroplasty. J Bone Joint Surg Am. 2002;84(8):1354-1361.
13. Lahav A, Burks RT, Scholl MD. Allograft reconstruction of the patellar tendon: 12-year follow-up. Am J Orthop. 2004;33(12):623-624.
14. Yoo JH, Chang JD, Seo YJ, Baek SW. Reconstruction of a patellar tendon with Achilles tendon allograft for severe patellar infera--a case report. Knee. 2011;18(5):350-353.
15. Saldua NS, Mazurek MT. Procedure 37. Quadriceps and patellar tendon repair. In: Reider B, Terry MA, Provencher MT, eds. Operative Techniques: Sports Medicine Surgery. Philadelphia, PA: Saunders (Elsevier); 2010:623-640.
16. Anitua E, Andia I, Ardanza B, Nurden P, Nurden AT. Autologous platelets as a source of proteins for healing and tissue regeneration. Thromb Haemost. 2004;91(1):4-15.
17. Ibrahim SAR, Ahmad FHF, Salah M, Al Misfer ARK, Ghaffer SA, Khirat S. Surgical management of traumatic knee dislocation. Arthroscopy. 2008;24(2):178-187.
18. Dominkus M, Sabeti M, Toma C, Abdolvahab F, Trieb K, Kotz RI. Reconstructing the extensor apparatus with a new polyester ligament. Clin Orthop Relat Res. 2006;453:328-334.
19. Naim S, Gougoulias N, Griffiths D. Patellar tendon reconstruction using LARS ligament: surgical technique and case report. Strategies Trauma Limb Reconstr. 2011;6(1):39-41.
The extensor mechanism of the knee comprises the quadriceps tendon, the patella, and the patellar tendon. The extensor mechanism may be damaged by injury to these structures, with consequences such as the inability to actively extend the knee and hemarthrosis.1,2 Disruption of this mechanism is rare, and the most common injury pattern is an eccentric contraction of the quadriceps tendon on a flexed knee causing a tendon (quadriceps or patellar) rupture or a patella fracture.1,2
Patellar tendon ruptures are more common in persons younger than 40 years.1 Treatment is surgical, regardless of age and physical activity. In the acute setting, repair can be end-to-end suture or transosseous tunnel insertion. End-to-end suturing is difficult in chronic patellar tendon ruptures because of patella alta secondary to quadriceps contraction.3 Treatment options for chronic ruptures may involve transpatellar traction4 or tendon reinforcement with fascia lata, a semitendinosus band, or synthetic materials.3-5 Alternatively, tendon autograft and allografts have also been recommended, especially in extreme situations.1,6 Furthermore, animal experiments have shown that a compact platelet-rich fibrin scaffold (CPFS) has the potential to accelerate healing of patellar tendon defects and to act as a bioscaffold for graft augmentation.7
We describe the case of a 30-year-old man who underwent extensor mechanism reconstruction with cadaveric tendon–patellar tendon–bone allograft for failure of an infected primary end-to-end repair. The patient provided written informed consent for print and electronic publication of this case report.
Case Report
A 30-year-old healthy man landed on an empty glass fish tank, resulting in a traumatic right-knee arthrotomy. On initial evaluation, the patient had a negative straight-leg-raise test and impaired knee extension. The patient was taken urgently to the operating room for irrigation and débridement and concurrent repair of the patellar tendon laceration. Antibiotic prophylaxis with 2 g of intravenous (IV) cefazolin was given in the emergency room.
Intraoperatively, after visualizing the patellar tendon laceration and excluding any associated chondral lesions, we proceeded with extensive débridement and irrigation using 9 L of normal saline pulse lavage. After we achieved a clean site, we proceeded to repair the patellar tendon using No. 2 FiberWire sutures (Arthrex, Naples, Florida) with a classic Krackow repair8 consisting of 2 sutures run in a 4-row fashion through the patella and the patellar tendon. The suture was securely tightened and then tested for stability to at least 90° of knee flexion. The retinaculum was repaired using No. 0 Vicryl sutures (Ethicon, Somerville, New Jersey). After wound closure and dressing, the patient was placed in a hinged knee brace locked in extension at all times after surgery. Antibiotic treatment with IV cefazolin was administered for 48 hours.
Postoperative management consisted of weight-bearing as tolerated on the operative limb and appropriate deep venous thrombosis prophylaxis. The patient followed up in clinic 2 weeks and 4 weeks after surgery. At 4 weeks, the patient was noted to have a secondary wound infection with superficial dehiscence and serosanguineous drainage. No wound opening was noticed, and local wound care was performed with a 1-week course of oral cephalexin. The patient was scheduled to follow up a few weeks later but did not follow up for a year.
At 1-year follow-up, the patient reported that he had had a steady progression of his knee range of motion (ROM) with decreased pain. However, over time, the patient noted subjective instability of the knee, with frequent falls occurring close to his 1-year follow-up. Examination of his knee showed that his active ROM ranged from 20° in extension to 120° in flexion, with a weak extensor mechanism. Passively, his knee could be brought to full extension. His incision was well healed, but it had an area of bogginess in the middle. Radiographs showed patella alta on the affected knee, with a lengthening of the patellar tendon of 7.70 cm on the right compared with 5.18 cm on the left. Magnetic resonance imaging (MRI) showed moderate-to-severe patellar tendinosis with small fluid pockets around the surgical material and evidence of acute patellar enthesopathy. The laboratory values showed a white blood cell count of 7580/μL (normal, 4500-11,000/μL), an erythrocyte sedimentation rate of 2 mm/h (normal, 1-15 mm/h), and a C-reactive protein level of 1.93 mg/dL (normal, 0.00-0.29 mg/dL). Based on the clinical examination and imaging findings, there was a concern for a possible chronic deep-tissue infection, in addition to failure of the primary patellar tendon repair. Operative versus nonoperative management options were discussed with the patient, and he elected to undergo surgery.
During surgery, the patellar laxity was confirmed, and the patellar tendon was noticed to be chronically thickened and surrounded by unhealthy tissue. Initially, an extensive soft-tissue débridement was performed, and all patellar tendon loculations visualized on the preoperative MRI were drained; a solid purulent-like fluid was expressed. Unfortunately, the extensive and required débridement did not allow the preservation of the patellar tendon. Appropriate cultures were taken and sent for immediate Gram-stain analysis, which returned negative. Tissue samples from the patellar tendon were also sent to the pathology department for analysis. Intraoperatively, the infrapatellar defect was filled temporarily with a tobramycin cement spacer mixed with 2 g of vancomycin in a manner similar to that of the Masquelet technique used for infected long-bone nonunions with bone loss.9,10 This technique is a 2-stage procedure that promotes the formation of a biologic membrane that allows bone healing in the reconstruction of long-bone defects. The first stage consists of a radical débridement with soft-tissue repair by flaps when needed, with the insertion of a polymethylmethacrylate cement spacer into the bone defect. The second stage is usually performed 6 to 8 weeks later, with removal of the spacer and preservation of the induced membrane, which is filled with iliac crest bone autograft augmented (if necessary) with demineralized allograft.
The incision was closed primarily, and after surgery, the patient was allowed to bear weight as tolerated in a hinged knee brace locked in extension. Final laboratory analysis from cultures and tissue samples revealed acute and chronic inflammation with more than 20 neutrophils per high-powered field. No organisms grew from aerobic, anaerobic, fungal, or mycobacterial cultures. The infectious disease service was consulted and recommended oral cephalexin.
Because all cultures were negative, all laboratory examinations did not indicate any residual infections, and no bony involvement was noticed intraoperatively or in the preoperative knee MRI, we decided to proceed with the second stage of the Masquelet technique after 2 weeks. The patient returned to the operating room for final reconstruction of his patellar tendon using a custom-ordered cadaveric tendon–patellar tendon–bone allograft, the length of which was determined by measuring the contralateral patellar tendon, ie, 5.18 cm (Figure 1A). The previous anterior knee incision was reopened and extended distally past the tibial tuberosity and proximally toward the quadriceps tendon. The antibiotic spacer was removed. We proceeded with a repeat irrigation and débridement and the allograft transfer. The selected allograft was customized by reducing the tibial bone component to an approximately 1×2-cm bone block and by reducing the allograft patellar thickness with an oscillating saw, leaving an approximately 2-mm thick patellar bone graft attached to the patellar tendon. In a similar technique using an oscillating saw, we shaved off the anterior cortex of the patient’s patella to accommodate, in a sandwich fashion, the patellar allograft. Proximally, the quadriceps tendon insertion was split longitudinally and partially separated from the superior pole of the patellar tendon to allow seating and fixation of the modified quadriceps allograft tendon component.
We proceeded with the fixation of the allograft first distally on the patella. The anterior cortex of the tibial tuberosity was resected to allow the perfect seating of the bone block allograft. The graft was secured with a 4.0-mm fully threaded cancellous lag screw and reinforced with a 2.4-mm, 3-hole T-volar buttress plate (Synthes, Paoli, Pennsylvania). The plate was contoured to better fit the patient’s tibia. We sutured the patellar allograft tendon to the patella using two No. 2-0 FiberWire sutures in Krackow suture technique8 (Figures 1B, 1C). We obtained good fixation of the patellar tendon, and the distance between the patellar insertion and the inferior patellar pole was the same as before surgery: 5.57 cm and comparable to the contralateral side (Figures 2A-2C). The patellar allograft and autograft sandwich were secured with additional No. 2-0 FiberWire sutures, and the quadriceps allograft and autograft were secured with the cross-stitch technique with the same material. Fine suturing of the quadriceps tendon was done with No. 0 Vicryl sutures. After the fixation was completed, we tested the stability of the reconstruction and found good flexion up to 120°.
The postoperative protocol consisted of weight-bearing as tolerated in full extension and passive knee ROM, using a continuous passive ROM machine from 0° to 45° for the first 4 weeks, followed by active ROM, increased as tolerated, during the next 8 weeks.
The patient was seen in clinic 3 and 9 months after surgery. At the 3-month follow-up appointment, the patient’s examination showed knee ROM from 0° extension to 130° of flexion, no secondary infection signs, and radiographic evidence of a well-healing patellar allograft with symmetric patellar tendon length to the contralateral side. At 9-month follow-up, the patient’s active ROM was from 0° extension to 140° flexion (Figures 3A, 3B), and he had returned to his preinjury level of functioning.
Discussion
This case report describes the successful reconstruction of a patellar tendon defect with cadaveric tendon–patellar tendon–bone allograft. Extensor mechanism injuries are uncommon in general, and the incidence of patellar tendon injury is higher in men than in women.2 Patellar tendon tears occur frequently in active patients younger than 40 years, usually as a result of sudden quadriceps contraction with the knee slightly flexed.1 Treatment of patellar tendon injury is surgical, and functional outcomes for patients with this injury are equivalent to those of patients with quadriceps tendon injuries or patellar fractures.2 Acute patellar tendon tears can be repaired by end-to-end suturing or transosseous tunnel insertion in the tibia or patella.1 Reinforcement is often added between the patella and tibial tuberosity, using a semitendinosus band or wire.1 End-to-end suture is performed using a thick resorbable suture. It is important to avoid patella alta during suturing, comparing the position of the patella with the contralateral patella with the knee in 45° of flexion. In proximal avulsion, the tendon is anchored to the bone by 2 thick nonresorbable sutures through 2 parallel bone tunnels to the proximal pole of the patella. Distal avulsion is rare in adults, but it can be managed by using staples or suture anchors.1
End-to-end suturing of chronic patellar tendon defects is difficult more than 45 days after injury primarily because of difficulties in correcting patella alta secondary to the upward force exerted by the quadriceps tendon.1,3 Extreme situations similar to the case we present warrant Achilles or patellar tendon allograft for reconstruction of the extensor mechanism.1,3,6,9
Extensor mechanism allograft also provides an effective remedy for severe quadriceps deficiency caused by loss of the patella, patellar tendon, and quadriceps tendon in total knee arthroplasty.10 However, in such cases, late failure is common, and major quadriceps deficiency occurs after removal of the allograft material.10 To improve outcome, a novel technique using the medial gastrocnemius muscle transferred to the muscular portion of the vastus medialis and lateralis flaps provides a secure and strong closure of the anterior knee, thereby restoring the extensor mechanism of the knee.10
Patellar tendon reconstruction with allograft tissue has been successfully used, especially in cases related to chronic patellar tendon ruptures11 and total knee arthroplasty.6,12-14 Crossett and colleagues12 showed that, at 2-year follow-up, the average knee score for pain, ROM, and stability had improved from 26 points (range, 6-39 points) before surgery to 81 points (range, 40-92 points). The average knee score for function had also improved: 14 points (range, 0-35 points) before surgery to 53 points (range, 30-90 points).12 Primary repair may succeed in early intervention, but in an established rupture, allograft reconstruction is often necessary. Achilles tendon is the preferred allograft, with the calcaneus fragment embedded into the proximal tibia as a new tubercle and the tendon sutured into the remaining extensor mechanism.1,11 The repair is further protected using a cable loop from the superior pole of the patella to a drill hole in the upper tibia.9 Techniques have also been described involving passage of the proximal aspect of the allograft tendon through patellar bone tunnels and suture fixation to the native quadriceps tendon.11,15 However, in our technique, we shaved off the anterior cortex of the patient’s patella to allow a sandwich-type over-position of the allograft to secure fixation to the patella.
Another alternative to allograft reconstruction involves biocompatible scaffolds. Such scaffolds incorporate the use of platelets in a fibrin framework. A CPFS, produced from blood and calcium gluconate to improve healing of patellar tendon defects, has been described in animal studies.7 In the rabbit model, CPFS acts as a provisional bioscaffold that can accelerate healing of an injured patellar tendon repair, potentially secondary to several growth factors derived from platelets.7 Platelets are biocompatible sources of growth factors, and CPFS can act as a scaffold to restore the mechanical integrity of injured soft tissue.7,16 In addition, CPFS can act to lower donor-site morbidity associated with harvesting tissue autograft.7 However, to our knowledge, such scaffolds have not been used in human trials. The LARS biocompatible ligament (Corin Group PLC, Cirencester, United Kingdom), currently not approved by the US Food and Drug Administration, is used for reconstructions of isolated or multiple knee ligament injuries.17 This graft requires the presence of healthy tissue with good blood supply from which new tendon or ligament can grow in. Sometimes it is also used for extensor mechanism reconstruction after radical tumor resection around the knee; however, good results are achieved in only 59% of cases,18 and to our knowledge, only 1 case of primary repair of a patellar tendon rupture has been published.19
Techniques involving the use of tendon–patellar tendon–bone graft with fixation via the sandwich-type over-position of the allograft for chronic patellar tendon rupture have not been described in the literature. In our patient, given the extensive patellar tendon lesion and inflammation with chronic tissue degeneration, there was no option but to use allograft. To improve the patient’s outcome, we chose the strongest possible allograft, tendon–patellar tendon–bone graft.
Conclusion
Revision patellar tendon reconstruction is a challenging, but necessary, procedure to restore the extensor mechanism of the knee, especially in young, active individuals. Various options to reconstruct the tissue defects are available. Our patient was successfully treated with a tendon–patellar tendon–bone allograft reconstruction.
1. Saragaglia D, Pison A, Rubens-Duval B. Acute and old ruptures of the extensor apparatus of the knee in adults (excluding knee replacement). Orthop Traumatol Surg Res. 2013;99(1 suppl):S67-S76.
2. Tejwani NC, Lekic N, Bechtel C, Montero N, Egol KA. Outcomes after knee joint extensor mechanism disruptions: is it better to fracture the patella or rupture the tendon? J Orthop Trauma. 2012;26(11):648-651.
3. Ecker ML, Lotke PA, Glazer RM. Late reconstruction of the patellar tendon. J Bone Joint Surg Am. 1979;61(6):884-886.
4. Siwek CW, Rao JP. Ruptures of the extensor mechanism of the knee joint. J Bone Joint Surg Am. 1981;63(6):932-937.
5. Levy M, Goldstein J, Rosner M. A method of repair for quadriceps tendon or patellar ligament (tendon) ruptures without cast immobilization. Preliminary report. Clin Orthop Relat Res. 1987;218:297-301.
6. Burks RT, Edelson RH. Allograft reconstruction of the patellar ligament. A case report. J Bone Joint Surg Am. 1994;76(7):1077-1079.
7. Matsunaga D, Akizuki S, Takizawa T, Omae S, Kato H. Compact platelet-rich fibrin scaffold to improve healing of patellar tendon defects and for medial collateral ligament reconstruction. Knee. 2013;20(6):545-550.
8. Krackow KA, Thomas SC, Jones LC. Ligament-tendon fixation: analysis of a new stitch and comparison with standard techniques. Orthopedics. 1988;11(6):909-917.
9. Brooks P. Extensor mechanism ruptures. Orthopedics. 2009;32(9):683-684.
10. Whiteside LA. Surgical technique: muscle transfer restores extensor function after failed patella-patellar tendon allograft. Clin Orthop Relat Res. 2014;472(1):218-226.
11. Farmer K, Cosgarea AJ. Procedure 25. Acute and chronic patellar tendon ruptures. In: Miller MD, Cole BJ, Cosgarea AJ, Sekiya JK, eds. Operative Techniques: Sports Knee Surgery. Philadelphia, PA: Saunders (Elsevier); 2008:397-417.
12. Crossett LS, Sinha RK, Sechriest VF, Rubash HE. Reconstruction of a ruptured patellar tendon with achilles tendon allograft following total knee arthroplasty. J Bone Joint Surg Am. 2002;84(8):1354-1361.
13. Lahav A, Burks RT, Scholl MD. Allograft reconstruction of the patellar tendon: 12-year follow-up. Am J Orthop. 2004;33(12):623-624.
14. Yoo JH, Chang JD, Seo YJ, Baek SW. Reconstruction of a patellar tendon with Achilles tendon allograft for severe patellar infera--a case report. Knee. 2011;18(5):350-353.
15. Saldua NS, Mazurek MT. Procedure 37. Quadriceps and patellar tendon repair. In: Reider B, Terry MA, Provencher MT, eds. Operative Techniques: Sports Medicine Surgery. Philadelphia, PA: Saunders (Elsevier); 2010:623-640.
16. Anitua E, Andia I, Ardanza B, Nurden P, Nurden AT. Autologous platelets as a source of proteins for healing and tissue regeneration. Thromb Haemost. 2004;91(1):4-15.
17. Ibrahim SAR, Ahmad FHF, Salah M, Al Misfer ARK, Ghaffer SA, Khirat S. Surgical management of traumatic knee dislocation. Arthroscopy. 2008;24(2):178-187.
18. Dominkus M, Sabeti M, Toma C, Abdolvahab F, Trieb K, Kotz RI. Reconstructing the extensor apparatus with a new polyester ligament. Clin Orthop Relat Res. 2006;453:328-334.
19. Naim S, Gougoulias N, Griffiths D. Patellar tendon reconstruction using LARS ligament: surgical technique and case report. Strategies Trauma Limb Reconstr. 2011;6(1):39-41.
Spontaneous Osteonecrosis of Knee After Arthroscopy Is Not Necessarily Related to the Procedure
The term spontaneous osteonecrosis of the knee was first used by Ahlbäck1 in 1968. This term, and the acronym SONK (sometimes SPONK2), has subsequently been used by other authors to refer to an apparent osteonecrosis of the knee, most commonly occurring within the medial femoral condyle. SONK typically occurs in older women who usually do not have the typical osteonecrosis risk factors, such as steroid use, sickle-cell anemia, and excessive alcohol intake. Furthermore, the radiologic appearance of SONK differs from the typical avascular necrosis findings seen with radiography and magnetic resonance imaging (MRI). In particular, on MRI, the abnormality of SONK does not have the typical serpiginous margin of bone infarction, or the double-line sign indicating both sclerosis and granulation tissue.3 SONK is normally seen as a line of signal intensity on T1- and T2-weighted sequences; this line is adjacent to or parallels the subchondral bone with an adjacent area of extensive edema.
There is dispute over the cause of SONK. Yamamoto and Bullough4 proposed the lesion is in part a subchondral insufficiency fracture and staged it into 4 parts. Histologic findings suggest at least some SONK lesions are subchondral insufficiency fractures.5 Brahme and colleagues6 were the first to describe SONK occurring after arthroscopy, and others have documented this finding. The condition has also been referred to as osteonecrosis in the postoperative knee.7-13 An association of postoperative SONK with cartilage loss and meniscal tear has been proposed.7-13
We reviewed the clinical, radiologic, and MRI findings in 11 patients with evidence of postarthroscopy SONK to try to identify any risk factors that might predispose them to poor outcomes. Our study population consisted of 11 patients (12 knees) with SONK; 6 of the knees had the lesion before knee arthroscopy, and the other 6 developed the lesion after arthroscopy. We also considered MRI findings in a group of 11 age- and sex-matched patients who underwent knee arthroscopy and did not have or develop SONK. We reviewed the preoperative MRI findings of both groups for meniscal tear, meniscal extrusion, and cartilage loss. We had 2 hypotheses. First, patients with preoperative MRI findings of SONK would have articular cartilage changes, posterior root degeneration, and meniscal extrusion similar to those of patients who developed SONK after arthroscopy. Second, an age- and sex-matched group of patients who underwent arthroscopy and did not develop SONK would be similar in articular cartilage changes, posterior root degeneration or tear, and meniscal extrusion.
Materials and Methods
With institutional review board approval and waived informed consent, we reviewed all imaging studies, particularly the radiographs and MRI studies, of 11 patients (12 knees) who either had SONK before arthroscopy or developed it after arthroscopy. In all these cases, arthroscopy was performed to alleviate mechanical symptoms associated with meniscal tear.
On subsequent review by a musculoskeletal radiologist, 6 patients with SONK had an identifiable lesion before surgery. All patients’ symptoms had not improved with an earlier trial of conservative management. All preoperative and postoperative radiologic and MRI findings were reviewed. The patient group was assembled by writing to all the orthopedic surgeons who performed arthroscopy at our institution and asking for SONK cases seen in their practices. All but 2 cases were performed by a surgeon who treated a predominantly older, less active population. Clinical notes were reviewed for outcomes, and the musculoskeletal radiologist reviewed all radiologic studies. The 4 men and 7 women in the SONK group (1 woman had bilateral knee lesions) ranged in age from 43 to 74 years (mean, 63.8 years), and the 4 men and 7 women in the control group were age-matched to 43 to 75 years (mean, 63.6 years). The controls were chosen from a pool of patients who underwent knee arthroscopy at our institution.
MRI was performed using General Electric 1-T, 1.5-T, or 3-T magnets (GE Healthcare, Milwaukee, Wisconsin) or using Philips 1.5-T or open 0.7-T magnets (Philips Healthcare, Andover, Massachusetts). Imaging included sagittal and coronal proton density–weighted sequences and coronal and axial fat-suppressed T2-weighted sequences. SONK was diagnosed when a low signal line adjacent to the subchondral bone plate on the femoral or tibial condyles was present with an adjacent area of bone marrow edema in the respective condyle or when there was depression of the subchondral bone plate with adjacent edema. The MRI studies were reviewed for lesion location, and medial meniscus and lateral meniscus were reviewed for tear. Type of meniscal tear (horizontal cleavage, radial, complex degenerative) was documented, as was meniscal extrusion. The meniscus was regarded as extruded if the body extended more than 3 mm from the joint margin. Cartilage in the medial and lateral compartment was reviewed according to a modified Noyes scale listing 0 as normal, 1 as internal changes only, 2A as 1% to 49% cartilage loss, 2B as 50% to 90% loss of articular cartilage, 3A as 100% articular cartilage loss with subchondral bone plate intact, and 3B as 100% articular cartilage loss with ulcerated subchondral bone plate.14 Osteoarthritic severity was similarly classified using the Kellgren-Lawrence scale,15 where grade 0 is normal; grade 1 is unlikely to have narrowing of the joint space but potentially has osteophytic lipping; grade 2 has both definite narrowing of the joint space and osteophytes; grade 3 has narrowing of the joint space and multiple osteophytes, some sclerosis, and possible deformity of bone contour; and grade 4 has marked narrowing of the joint space, large osteophytes, severe sclerosis, and definite deformity of bone contour. Follow-up clinical notes and radiologic studies were reviewed in the assessment of patient outcomes.
All statistical analyses were performed with SAS 9.2 software (SAS Institute, Cary, North Carolina). Age data were evaluated with the Shapiro-Wilk test and graphical displays and were found to violate normality assumptions, so they are presented as medians and ranges; other variables are presented as count and column percentages. The Wilcoxon rank sum test was used to compare the 2 groups’ age distributions. Fisher exact tests were used to compare proportions between the 2 groups for the other variables. Statistical significance was set at P < .05.
Results
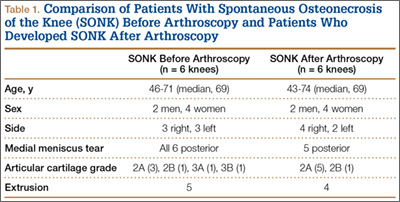
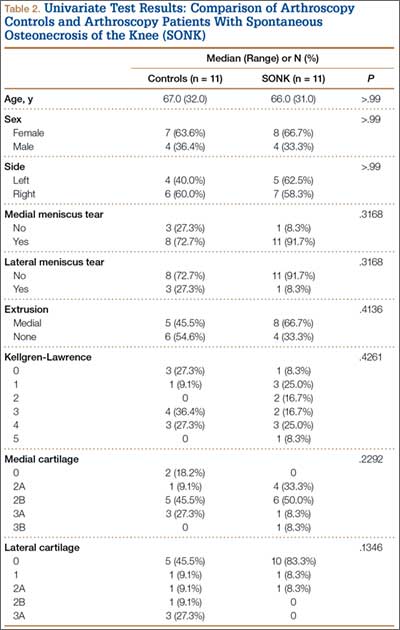
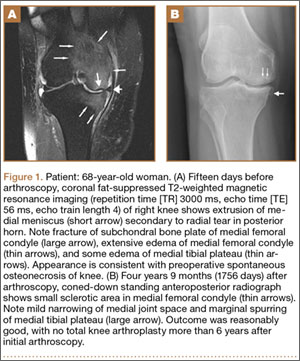
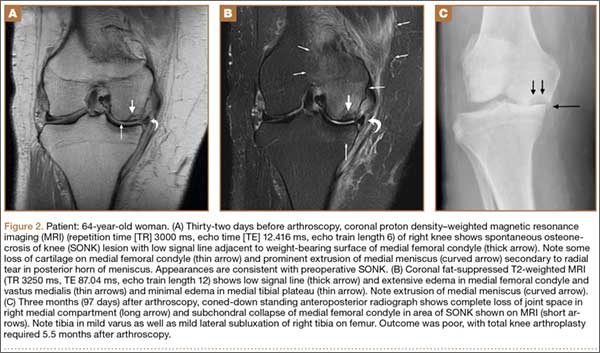
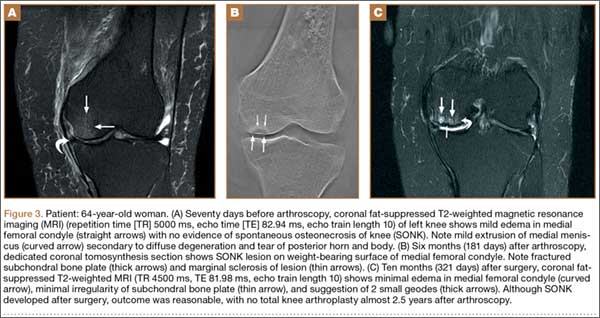
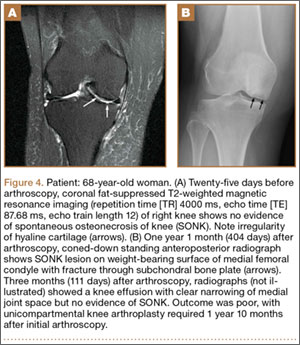
Table 1 lists the demographics and imaging characteristics of the 11 patients—6 had SONK before arthroscopy and 6 developed it after arthroscopy. Comparison of the 11 patients with SONK and the 11 controls is summarized with P values in Table 2. Representative cases that either presented before surgery or developed after surgery are shown in Figures 1 to 4. There were 6 prearthroscopy lesions and 6 postarthroscopy lesions—all 12 in the medial femoral condyle. Eleven of the 12 knees had a medial meniscal tear, and 1 knee had both medial and lateral meniscal tears. In 8 of the 12 knees, the lateral meniscus was normal; in 2 knees, it had mild degeneration; and, in 1 knee, it had a complex tear. Assessment of hyaline cartilage revealed medial cartilage loss ranging from 2A to 3B (median, 2B) in the patients with SONK, and lateral cartilage loss ranging from 0 to 2A (median, 0). At surgery, all knees had a partial medial meniscectomy, and 6 had a partial lateral meniscectomy. Ten of the 12 knees had chondroplasty, 9 patellar and 5 of the medial femoral condyle. Only 4 of the 11 patients with follow-up of more than 1 year went on to joint replacement. Six of the 12 had follow-up of more than 2 years. Of the 6 patients without an identifiable SONK lesion on MRI before arthroscopy, 4 had mild to moderate knee pain 0.5, 2.4, 3.5, and 4 years after surgery. For the other 2 patients, knee replacement was performed 1.5 and 1.8 years after surgery. Of the 6 patients with prearthroscopy SONK, 4 had mild to moderate knee pain 1.5, 3.7, 6.5, and 6.8 years after surgery; the other 2 had knee replacement 0.5 and 1.8 years after surgery. Articular cartilage degeneration and meniscal extrusion were similar (Table 1). In the control group, there was only 1 knee replacement, at 3 years, and the other 11 were functioning 2.6 to 5 years later. The longer follow-up resulted from selection of appropriate controls from the same year. Of the 6 SONK lesions found on preoperative MRI, 3 were read by the interpreting radiologist before surgery as possible SONK lesions, 2 were read as insufficiency fractures, and 1 was read as a possible insufficiency fracture.
Discussion
SONK is well described as a complication of arthroscopic knee surgery. However, this condition more commonly appears spontaneously in a population that has not had surgery. It has become clear that the term SONK may be misleading.16 In a recent series of postoperative subchondral fractures reported by MacDessi and colleagues,5 the average age of patients included in their study was 64 years. Pathologic analysis revealed subchondral fracture with callus formation in all cases. Only 2 knees had evidence of osteonecrosis, which appeared to be secondary to the fracture. Based on these findings, the authors concluded that “further investigation into the etiology of this condition is warranted.” A prominent association with medial meniscal tear has been noted, with the medial femoral condyle predominantly affected. As already mentioned, SONK differs from classical avascular necrosis on several points, including lack of the typical avascular osteonecrosis risk factors and absence of the serpiginous margin and double-line sign seen with typical bone infarction. In addition, the SONK lesions seen on radiographs and MRIs of the knee typically are in the medial femoral condyle and are very different from the typical area of infarction seen in patients with known risk factors for secondary osteonecrosis.
The cause of SONK is not known. Of more importance from a medicolegal standpoint is that these lesions are not necessarily related to arthroscopy.17 Interestingly, Pape and colleagues17 noted that some of the lesions they studied may have been present before surgery, which is what we found in 6 (50%) of the SONK knees in our study. Our data thus support the proposition that some SONK lesions are present before arthroscopy, and some cases of so-called postarthroscopy SONK may in fact have been progressing before surgery.
Our data also reinforce the importance of radiologist–orthopedic surgeon communication regarding the presence of SONK. We emphasize the importance of communicating the MRI findings clearly, whether the lesion is called SONK, SPONK, or insufficiency fracture. The orthopedic surgeons in our series may have been unaware of the presence of these lesions before arthroscopic meniscectomy, given the wide variety of terms being used in radiologic reports.
The natural history of spontaneous osteonecrosis of the medial tibial plateau has also been studied.18 There were 3 outcome patterns—acute extensive collapse of the medial tibial plateau, rapid progression to varying degrees of osteoarthritis, and complete resolution. It has been shown that resolution of SONK can occur in the early stages of the disease, within several months, but often the changes progress to bone destruction and articular cartilage collapse.19
In our series of patients, there was a female predominance, and mean age was 64 years. We investigated cartilage loss, meniscal tear, and meniscal extrusion to see if we could predict outcomes in patients who had the lesion before arthroscopy and if we could predict who might be at risk for developing the lesion after arthroscopy. Type of surgical procedure was also reviewed. For the sake of simplicity, we divided the follow-up patients into 2 groups: those managed with conservative treatment, which we deemed a reasonable outcome, and those who subsequently required knee joint replacement, which we deemed a poor outcome. As seen from our representative cases, both groups had patients with cartilage loss, meniscal tear, and meniscal extrusion to varying degrees. There were no risk factors pointing to a reasonable or poor outcome. In the group of patients with prearthroscopy lesions, we found the same problem. We were unable to identify a risk factor that might suggest a poor rather than a reasonable outcome. We must also emphasize that, in our review of patient charts, we could find no other causes for osteonecrosis. In particular, arthroscopic causes of acute chondral loss (eg, thermal wash, laser, bupivacaine pain pumps, epinephrine in irrigant) were not identified.
This study consisted of a series of cases managed at our institution over the past 8 years. Our data and this study had several limitations:
We may have been unable to identify other SONK cases that belonged in the group from our institution. In addition, we had only 11 patients for comparison with patients without SONK. Likewise, there were only 6 knees each in the prearthroscopy and postarthroscopy SONK groups. We also used images obtained from 1-T, 1.5-T, and 3-T closed MRI devices and one 0.7-T open device. These were, however, at the same institution.
Timing of our imaging was not uniform. In particular, in 3 of the patients who developed SONK after arthroscopy, preoperative MRI studies were performed quite some time before surgery. However, in these patients, more recent preoperative radiographs did not show any evidence of lesions. It can also be seen that postarthroscopy follow-up of patients varied. It is possible that, on longer follow-up, some of the cases we classified as having a reasonable outcome may have gone on to require total knee arthroplasty. One could argue that, in the patient who developed SONK within 1 year after surgery (Figure 4), the lesion was not related to the surgery. However, this patient’s radiographs 3 months after surgery did not show the SONK lesion but clearly showed prominent medial joint space narrowing—a new finding.
Only 1 musculoskeletal radiologist evaluated the radiographs, MRIs, and tomosynthesis (similar to computed tomography) studies for this investigation.
This lesion is not common, thus giving us a small group to analyze.
Despite our data limitations and the retrospective nature of this study, we compiled a reasonably representative sample of surgical SONK patients that matches other samples reported in the literature. Unfortunately, we could not identify any risk factors pointing to the likelihood of developing SONK or any risk factors pointing to either a reasonable or a poor prognosis in these patients. The etiology of the lesion remains an enigma. Our finding 6 cases of prearthroscopy lesions that did not necessarily result in a poor outcome, combined with our inability to identify any risk factors for SONK, points to the lack of a causal relationship with arthroscopy.
1. Ahlbäck S. Osteoarthritis of the knee. A radiographic investigation. Acta Radiol Diagn. 1968;(suppl 277):7-72.
2. Juréus J, Lindstrand A, Geijer M, Robertsson O, Tägil M. The natural course of spontaneous osteonecrosis of the knee (SPONK): a 1- to 27-year follow-up of 40 patients. Acta Orthop. 2013;84(4):410-414.
3. Zurlo JV. The double-line sign. Radiology. 1999;212(2):541-542.
4. Yamamoto T, Bullough PG. Spontaneous osteonecrosis of the knee: the result of subchondral insufficiency fracture. J Bone Joint Surg Am. 2000;82(6):858-866.
5. MacDessi SJ, Brophy RH, Bullough PG, Windsor RE, Sculco TP. Subchondral fracture following arthroscopic knee surgery. A series of eight cases. J Bone Joint Surg Am. 2008;90(5):1007-1012.
6. Brahme SK, Fox JM, Ferkel RD, Friedman MJ, Flannigan BD, Resnick DL. Osteonecrosis of the knee after arthroscopic surgery: diagnosis with MR imaging. Radiology. 1991;178(3):851-853.
7. Faletti C, Robba T, de Petro P. Postmeniscectomy osteonecrosis. Arthroscopy. 2002;18(1):91-94.
8. Johnson TC, Evans JA, Gilley JA, DeLee JC. Osteonecrosis of the knee after arthroscopic surgery for meniscal tears and chondral lesions. Arthroscopy. 2000;16(3):254-261.
9. al-Kaar M, Garcia J, Fritschy D, Bonvin JC. Aseptic osteonecrosis of the femoral condyle after meniscectomy by the arthroscopic approach. J Radiol. 1997;78(4):283-288.
10. DeFalco RA, Ricci AR, Balduini FC. Osteonecrosis of the knee after arthroscopic meniscectomy and chondroplasty: a case report and literature review. Am J Sports Med. 2003;31(6):1013-1016.
11. Kusayama T. Idiopathic osteonecrosis of the femoral condyle after meniscectomy. Tokai J Exp Clin Med. 2003;28(4):145-150.
12. Prues-Latour V, Bonvin JC, Fritschy D. Nine cases of osteonecrosis in elderly patients following arthroscopic meniscectomy. Knee Surg Sports Traumatol Arthrosc. 1998;6(3):142-147.
13. Santori N, Condello V, Adriani E, Mariani PP. Osteonecrosis after arthroscopic medial meniscectomy. Arthroscopy. 1995;11(2):220-224.
14. Noyes FR, Stabler CL. A system for grading articular cartilage lesions at arthroscopy. Am J Sports Med. 1989;17(4):505-513.
15. Kellgren JH, Lawrence JS. Radiological assessment of osteo-arthrosis. Ann Rheum Dis. 1957;16(4):494-502.
16. Kidwai AS, Hemphill SD, Griffiths HJ. Radiologic case study. Spontaneous osteonecrosis of the knee reclassified as insufficiency fracture. Orthopedics. 2005;28(3):236, 333-236.
17. Pape D, Lorbach O, Anagnostakos K, Kohn D. Osteonecrosis in the postarthroscopic knee. Orthopade. 2008;37(11):1099-1107.
18. Satku K, Kumar VP, Chacha PB. Stress fractures around the knee in elderly patients. A cause of acute pain in the knee. J Bone Joint Surg Am. 1990;72(6):918-922.
19. Soucacos PN, Xenakis TH, Beris AE, Soucacos PK, Georgoulis A. Idiopathic osteonecrosis of the medial femoral condyle. Classification and treatment. Clin Orthop. 1997;(341):82-89.
The term spontaneous osteonecrosis of the knee was first used by Ahlbäck1 in 1968. This term, and the acronym SONK (sometimes SPONK2), has subsequently been used by other authors to refer to an apparent osteonecrosis of the knee, most commonly occurring within the medial femoral condyle. SONK typically occurs in older women who usually do not have the typical osteonecrosis risk factors, such as steroid use, sickle-cell anemia, and excessive alcohol intake. Furthermore, the radiologic appearance of SONK differs from the typical avascular necrosis findings seen with radiography and magnetic resonance imaging (MRI). In particular, on MRI, the abnormality of SONK does not have the typical serpiginous margin of bone infarction, or the double-line sign indicating both sclerosis and granulation tissue.3 SONK is normally seen as a line of signal intensity on T1- and T2-weighted sequences; this line is adjacent to or parallels the subchondral bone with an adjacent area of extensive edema.
There is dispute over the cause of SONK. Yamamoto and Bullough4 proposed the lesion is in part a subchondral insufficiency fracture and staged it into 4 parts. Histologic findings suggest at least some SONK lesions are subchondral insufficiency fractures.5 Brahme and colleagues6 were the first to describe SONK occurring after arthroscopy, and others have documented this finding. The condition has also been referred to as osteonecrosis in the postoperative knee.7-13 An association of postoperative SONK with cartilage loss and meniscal tear has been proposed.7-13
We reviewed the clinical, radiologic, and MRI findings in 11 patients with evidence of postarthroscopy SONK to try to identify any risk factors that might predispose them to poor outcomes. Our study population consisted of 11 patients (12 knees) with SONK; 6 of the knees had the lesion before knee arthroscopy, and the other 6 developed the lesion after arthroscopy. We also considered MRI findings in a group of 11 age- and sex-matched patients who underwent knee arthroscopy and did not have or develop SONK. We reviewed the preoperative MRI findings of both groups for meniscal tear, meniscal extrusion, and cartilage loss. We had 2 hypotheses. First, patients with preoperative MRI findings of SONK would have articular cartilage changes, posterior root degeneration, and meniscal extrusion similar to those of patients who developed SONK after arthroscopy. Second, an age- and sex-matched group of patients who underwent arthroscopy and did not develop SONK would be similar in articular cartilage changes, posterior root degeneration or tear, and meniscal extrusion.
Materials and Methods
With institutional review board approval and waived informed consent, we reviewed all imaging studies, particularly the radiographs and MRI studies, of 11 patients (12 knees) who either had SONK before arthroscopy or developed it after arthroscopy. In all these cases, arthroscopy was performed to alleviate mechanical symptoms associated with meniscal tear.
On subsequent review by a musculoskeletal radiologist, 6 patients with SONK had an identifiable lesion before surgery. All patients’ symptoms had not improved with an earlier trial of conservative management. All preoperative and postoperative radiologic and MRI findings were reviewed. The patient group was assembled by writing to all the orthopedic surgeons who performed arthroscopy at our institution and asking for SONK cases seen in their practices. All but 2 cases were performed by a surgeon who treated a predominantly older, less active population. Clinical notes were reviewed for outcomes, and the musculoskeletal radiologist reviewed all radiologic studies. The 4 men and 7 women in the SONK group (1 woman had bilateral knee lesions) ranged in age from 43 to 74 years (mean, 63.8 years), and the 4 men and 7 women in the control group were age-matched to 43 to 75 years (mean, 63.6 years). The controls were chosen from a pool of patients who underwent knee arthroscopy at our institution.
MRI was performed using General Electric 1-T, 1.5-T, or 3-T magnets (GE Healthcare, Milwaukee, Wisconsin) or using Philips 1.5-T or open 0.7-T magnets (Philips Healthcare, Andover, Massachusetts). Imaging included sagittal and coronal proton density–weighted sequences and coronal and axial fat-suppressed T2-weighted sequences. SONK was diagnosed when a low signal line adjacent to the subchondral bone plate on the femoral or tibial condyles was present with an adjacent area of bone marrow edema in the respective condyle or when there was depression of the subchondral bone plate with adjacent edema. The MRI studies were reviewed for lesion location, and medial meniscus and lateral meniscus were reviewed for tear. Type of meniscal tear (horizontal cleavage, radial, complex degenerative) was documented, as was meniscal extrusion. The meniscus was regarded as extruded if the body extended more than 3 mm from the joint margin. Cartilage in the medial and lateral compartment was reviewed according to a modified Noyes scale listing 0 as normal, 1 as internal changes only, 2A as 1% to 49% cartilage loss, 2B as 50% to 90% loss of articular cartilage, 3A as 100% articular cartilage loss with subchondral bone plate intact, and 3B as 100% articular cartilage loss with ulcerated subchondral bone plate.14 Osteoarthritic severity was similarly classified using the Kellgren-Lawrence scale,15 where grade 0 is normal; grade 1 is unlikely to have narrowing of the joint space but potentially has osteophytic lipping; grade 2 has both definite narrowing of the joint space and osteophytes; grade 3 has narrowing of the joint space and multiple osteophytes, some sclerosis, and possible deformity of bone contour; and grade 4 has marked narrowing of the joint space, large osteophytes, severe sclerosis, and definite deformity of bone contour. Follow-up clinical notes and radiologic studies were reviewed in the assessment of patient outcomes.
All statistical analyses were performed with SAS 9.2 software (SAS Institute, Cary, North Carolina). Age data were evaluated with the Shapiro-Wilk test and graphical displays and were found to violate normality assumptions, so they are presented as medians and ranges; other variables are presented as count and column percentages. The Wilcoxon rank sum test was used to compare the 2 groups’ age distributions. Fisher exact tests were used to compare proportions between the 2 groups for the other variables. Statistical significance was set at P < .05.
Results
Table 1 lists the demographics and imaging characteristics of the 11 patients—6 had SONK before arthroscopy and 6 developed it after arthroscopy. Comparison of the 11 patients with SONK and the 11 controls is summarized with P values in Table 2. Representative cases that either presented before surgery or developed after surgery are shown in Figures 1 to 4. There were 6 prearthroscopy lesions and 6 postarthroscopy lesions—all 12 in the medial femoral condyle. Eleven of the 12 knees had a medial meniscal tear, and 1 knee had both medial and lateral meniscal tears. In 8 of the 12 knees, the lateral meniscus was normal; in 2 knees, it had mild degeneration; and, in 1 knee, it had a complex tear. Assessment of hyaline cartilage revealed medial cartilage loss ranging from 2A to 3B (median, 2B) in the patients with SONK, and lateral cartilage loss ranging from 0 to 2A (median, 0). At surgery, all knees had a partial medial meniscectomy, and 6 had a partial lateral meniscectomy. Ten of the 12 knees had chondroplasty, 9 patellar and 5 of the medial femoral condyle. Only 4 of the 11 patients with follow-up of more than 1 year went on to joint replacement. Six of the 12 had follow-up of more than 2 years. Of the 6 patients without an identifiable SONK lesion on MRI before arthroscopy, 4 had mild to moderate knee pain 0.5, 2.4, 3.5, and 4 years after surgery. For the other 2 patients, knee replacement was performed 1.5 and 1.8 years after surgery. Of the 6 patients with prearthroscopy SONK, 4 had mild to moderate knee pain 1.5, 3.7, 6.5, and 6.8 years after surgery; the other 2 had knee replacement 0.5 and 1.8 years after surgery. Articular cartilage degeneration and meniscal extrusion were similar (Table 1). In the control group, there was only 1 knee replacement, at 3 years, and the other 11 were functioning 2.6 to 5 years later. The longer follow-up resulted from selection of appropriate controls from the same year. Of the 6 SONK lesions found on preoperative MRI, 3 were read by the interpreting radiologist before surgery as possible SONK lesions, 2 were read as insufficiency fractures, and 1 was read as a possible insufficiency fracture.
Discussion
SONK is well described as a complication of arthroscopic knee surgery. However, this condition more commonly appears spontaneously in a population that has not had surgery. It has become clear that the term SONK may be misleading.16 In a recent series of postoperative subchondral fractures reported by MacDessi and colleagues,5 the average age of patients included in their study was 64 years. Pathologic analysis revealed subchondral fracture with callus formation in all cases. Only 2 knees had evidence of osteonecrosis, which appeared to be secondary to the fracture. Based on these findings, the authors concluded that “further investigation into the etiology of this condition is warranted.” A prominent association with medial meniscal tear has been noted, with the medial femoral condyle predominantly affected. As already mentioned, SONK differs from classical avascular necrosis on several points, including lack of the typical avascular osteonecrosis risk factors and absence of the serpiginous margin and double-line sign seen with typical bone infarction. In addition, the SONK lesions seen on radiographs and MRIs of the knee typically are in the medial femoral condyle and are very different from the typical area of infarction seen in patients with known risk factors for secondary osteonecrosis.
The cause of SONK is not known. Of more importance from a medicolegal standpoint is that these lesions are not necessarily related to arthroscopy.17 Interestingly, Pape and colleagues17 noted that some of the lesions they studied may have been present before surgery, which is what we found in 6 (50%) of the SONK knees in our study. Our data thus support the proposition that some SONK lesions are present before arthroscopy, and some cases of so-called postarthroscopy SONK may in fact have been progressing before surgery.
Our data also reinforce the importance of radiologist–orthopedic surgeon communication regarding the presence of SONK. We emphasize the importance of communicating the MRI findings clearly, whether the lesion is called SONK, SPONK, or insufficiency fracture. The orthopedic surgeons in our series may have been unaware of the presence of these lesions before arthroscopic meniscectomy, given the wide variety of terms being used in radiologic reports.
The natural history of spontaneous osteonecrosis of the medial tibial plateau has also been studied.18 There were 3 outcome patterns—acute extensive collapse of the medial tibial plateau, rapid progression to varying degrees of osteoarthritis, and complete resolution. It has been shown that resolution of SONK can occur in the early stages of the disease, within several months, but often the changes progress to bone destruction and articular cartilage collapse.19
In our series of patients, there was a female predominance, and mean age was 64 years. We investigated cartilage loss, meniscal tear, and meniscal extrusion to see if we could predict outcomes in patients who had the lesion before arthroscopy and if we could predict who might be at risk for developing the lesion after arthroscopy. Type of surgical procedure was also reviewed. For the sake of simplicity, we divided the follow-up patients into 2 groups: those managed with conservative treatment, which we deemed a reasonable outcome, and those who subsequently required knee joint replacement, which we deemed a poor outcome. As seen from our representative cases, both groups had patients with cartilage loss, meniscal tear, and meniscal extrusion to varying degrees. There were no risk factors pointing to a reasonable or poor outcome. In the group of patients with prearthroscopy lesions, we found the same problem. We were unable to identify a risk factor that might suggest a poor rather than a reasonable outcome. We must also emphasize that, in our review of patient charts, we could find no other causes for osteonecrosis. In particular, arthroscopic causes of acute chondral loss (eg, thermal wash, laser, bupivacaine pain pumps, epinephrine in irrigant) were not identified.
This study consisted of a series of cases managed at our institution over the past 8 years. Our data and this study had several limitations:
We may have been unable to identify other SONK cases that belonged in the group from our institution. In addition, we had only 11 patients for comparison with patients without SONK. Likewise, there were only 6 knees each in the prearthroscopy and postarthroscopy SONK groups. We also used images obtained from 1-T, 1.5-T, and 3-T closed MRI devices and one 0.7-T open device. These were, however, at the same institution.
Timing of our imaging was not uniform. In particular, in 3 of the patients who developed SONK after arthroscopy, preoperative MRI studies were performed quite some time before surgery. However, in these patients, more recent preoperative radiographs did not show any evidence of lesions. It can also be seen that postarthroscopy follow-up of patients varied. It is possible that, on longer follow-up, some of the cases we classified as having a reasonable outcome may have gone on to require total knee arthroplasty. One could argue that, in the patient who developed SONK within 1 year after surgery (Figure 4), the lesion was not related to the surgery. However, this patient’s radiographs 3 months after surgery did not show the SONK lesion but clearly showed prominent medial joint space narrowing—a new finding.
Only 1 musculoskeletal radiologist evaluated the radiographs, MRIs, and tomosynthesis (similar to computed tomography) studies for this investigation.
This lesion is not common, thus giving us a small group to analyze.
Despite our data limitations and the retrospective nature of this study, we compiled a reasonably representative sample of surgical SONK patients that matches other samples reported in the literature. Unfortunately, we could not identify any risk factors pointing to the likelihood of developing SONK or any risk factors pointing to either a reasonable or a poor prognosis in these patients. The etiology of the lesion remains an enigma. Our finding 6 cases of prearthroscopy lesions that did not necessarily result in a poor outcome, combined with our inability to identify any risk factors for SONK, points to the lack of a causal relationship with arthroscopy.
1. Ahlbäck S. Osteoarthritis of the knee. A radiographic investigation. Acta Radiol Diagn. 1968;(suppl 277):7-72.
2. Juréus J, Lindstrand A, Geijer M, Robertsson O, Tägil M. The natural course of spontaneous osteonecrosis of the knee (SPONK): a 1- to 27-year follow-up of 40 patients. Acta Orthop. 2013;84(4):410-414.
3. Zurlo JV. The double-line sign. Radiology. 1999;212(2):541-542.
4. Yamamoto T, Bullough PG. Spontaneous osteonecrosis of the knee: the result of subchondral insufficiency fracture. J Bone Joint Surg Am. 2000;82(6):858-866.
5. MacDessi SJ, Brophy RH, Bullough PG, Windsor RE, Sculco TP. Subchondral fracture following arthroscopic knee surgery. A series of eight cases. J Bone Joint Surg Am. 2008;90(5):1007-1012.
6. Brahme SK, Fox JM, Ferkel RD, Friedman MJ, Flannigan BD, Resnick DL. Osteonecrosis of the knee after arthroscopic surgery: diagnosis with MR imaging. Radiology. 1991;178(3):851-853.
7. Faletti C, Robba T, de Petro P. Postmeniscectomy osteonecrosis. Arthroscopy. 2002;18(1):91-94.
8. Johnson TC, Evans JA, Gilley JA, DeLee JC. Osteonecrosis of the knee after arthroscopic surgery for meniscal tears and chondral lesions. Arthroscopy. 2000;16(3):254-261.
9. al-Kaar M, Garcia J, Fritschy D, Bonvin JC. Aseptic osteonecrosis of the femoral condyle after meniscectomy by the arthroscopic approach. J Radiol. 1997;78(4):283-288.
10. DeFalco RA, Ricci AR, Balduini FC. Osteonecrosis of the knee after arthroscopic meniscectomy and chondroplasty: a case report and literature review. Am J Sports Med. 2003;31(6):1013-1016.
11. Kusayama T. Idiopathic osteonecrosis of the femoral condyle after meniscectomy. Tokai J Exp Clin Med. 2003;28(4):145-150.
12. Prues-Latour V, Bonvin JC, Fritschy D. Nine cases of osteonecrosis in elderly patients following arthroscopic meniscectomy. Knee Surg Sports Traumatol Arthrosc. 1998;6(3):142-147.
13. Santori N, Condello V, Adriani E, Mariani PP. Osteonecrosis after arthroscopic medial meniscectomy. Arthroscopy. 1995;11(2):220-224.
14. Noyes FR, Stabler CL. A system for grading articular cartilage lesions at arthroscopy. Am J Sports Med. 1989;17(4):505-513.
15. Kellgren JH, Lawrence JS. Radiological assessment of osteo-arthrosis. Ann Rheum Dis. 1957;16(4):494-502.
16. Kidwai AS, Hemphill SD, Griffiths HJ. Radiologic case study. Spontaneous osteonecrosis of the knee reclassified as insufficiency fracture. Orthopedics. 2005;28(3):236, 333-236.
17. Pape D, Lorbach O, Anagnostakos K, Kohn D. Osteonecrosis in the postarthroscopic knee. Orthopade. 2008;37(11):1099-1107.
18. Satku K, Kumar VP, Chacha PB. Stress fractures around the knee in elderly patients. A cause of acute pain in the knee. J Bone Joint Surg Am. 1990;72(6):918-922.
19. Soucacos PN, Xenakis TH, Beris AE, Soucacos PK, Georgoulis A. Idiopathic osteonecrosis of the medial femoral condyle. Classification and treatment. Clin Orthop. 1997;(341):82-89.
EuroPCR: CT-derived FFR promising in evaluating chest pain
PARIS – Noninvasive measurement of computed tomography–derived fractional flow reserve is a potential game changer in the management of patients with stable chest pain.
In a 200-patient proof-of-concept study known as FFR-CT RIPCORD, in which three experienced interventional cardiologists initially devised management plans based on coronary anatomy as defined by the results of CT angiography alone, subsequent knowledge of CT-derived fractional flow reserve (FFR-CT) caused them to change their management strategies in fully 36% of cases, Dr. Nick Curzen reported at the annual congress of the European Association of Percutaneous Cardiovascular Interventions.

“If this novel proof-of-concept result can be confirmed in large-scale trials, this suggests that noninvasive FFR-CT can be used as a clinically relevant tool that mimics the well-described ability of invasive FFR to refine management decisions for patients with chest pain that are made by invasive coronary angiography alone. This would indeed have important implications for routine clinical practice. FFR-CT may have potential as a noninvasive default method for simultaneous assessment of coronary anatomy and physiology in angina patients in order to define their management, which would completely change the way we look after them,” observed Dr. Curzen, professor of interventional cardiology at the University of Southampton (England).
EuroPCR codirector Dr. Williams Wijns was favorably impressed by the FFR-CT RIPCORD findings.
“This, I find just stunning. It’s really far reaching. This is a complete change in paradigm. Many patients that today undergo invasive angiography won’t even be sent to the cath lab. The invasive center becomes only for treatment,” commented Dr. Wijns, codirector of the cardiovascular center in Aalst, Belgium.
In FFR-CT RIPCORD, the cardiologists received information about a patient’s history and nonvasive CT angiography findings and were asked to reach consensus in selecting one of four management options: optimal medical therapy (OMT) alone, PCI plus OMT, CABG surgery and OMT, or ‘more information needed’ in the form of FFR findings, which identify those coronary lesions that are actually causing ischemia. Instead of receiving the results of conventional invasive FFR obtained using a pressure wire, however, the cardiologists were provided with the noninvasive FFR-CT findings in all 200 cases.
The resultant changes in management were substantial. Thirty percent of the patients initially slated for PCI were reallocated to OMT alone because no ischemic lesions were present. Twelve percent of patients assigned to OMT-only got reassigned to coronary revascularization. Moreover, in 18% of the PCI group, FFR-CT data led to a change in the vessel or vessels targeted for intervention.
“What particularly impressed me were two of those figures: that one-third of PCI patients are redirected to medical therapy, and – even more impressive to me – is the 18% of PCI patients who had a change in their target vessel. That’s a problem we often have in patients with multivessel disease and intermediate lesions: Sometimes we think, for example, the target is the LAD when in fact it’s another vessel,” commented Dr. Jean Fajadet, codirector of the interventional cardiovascular group at the Clinique Pasteur in Toulouse, France.
Dr. Curzen said the exciting thing about FFR-CT is that it could provide in one fell swoop a standardized way of obtaining both the anatomic and physiologic data necessary for informed clinical decision making, and without exposing patients needlessly to the risks of contrast and radiation exposure entailed in invasive coronary angiography.
“When we assess people with stable angina, if you have a room full of invasive cardiologists, we all do it differently at the moment. It’s crazy. A lot of us will do noninvasive tests like stress echo or MRI or some kind of exercise test, and then refer them for an invasive angiogram where we’ll also do an FFR. Some people will go straight for an angiogram. It’s a real mess. The thing I love about FFR-CT is it would be so slick for patients and their families: You see them in a chest pain clinic or your office and you put them in for this test. They don’t have to waste their time coming back several times for different tests. It’s a really beautiful concept,” Dr. Curzen continued.
Right now the turnaround time on FFR-CT is about 12 hours. The dataset has to be sent off to a supercomputer for a complex modeling analysis before the results come back.
“Of course, if this ever becomes clinically proven, I’m sure the turnaround time would become very quick,” according to the cardiologist.
A cost-effectiveness analysis of FFR-CT versus current standard care is ongoing and the results aren’t yet available. However, Dr. Curzen observed, “The cost to the patient is a very important issue: Who would want to have this done invasively if you have a test that proves you don’t need to have an invasive procedure?”
The FFR-CT RIPCORD study was sponsored by Heartflow. Dr. Curzen reported receiving research support from Heartflow, Boston Scientific, Haemonetics, and Medtronic.
PARIS – Noninvasive measurement of computed tomography–derived fractional flow reserve is a potential game changer in the management of patients with stable chest pain.
In a 200-patient proof-of-concept study known as FFR-CT RIPCORD, in which three experienced interventional cardiologists initially devised management plans based on coronary anatomy as defined by the results of CT angiography alone, subsequent knowledge of CT-derived fractional flow reserve (FFR-CT) caused them to change their management strategies in fully 36% of cases, Dr. Nick Curzen reported at the annual congress of the European Association of Percutaneous Cardiovascular Interventions.
“If this novel proof-of-concept result can be confirmed in large-scale trials, this suggests that noninvasive FFR-CT can be used as a clinically relevant tool that mimics the well-described ability of invasive FFR to refine management decisions for patients with chest pain that are made by invasive coronary angiography alone. This would indeed have important implications for routine clinical practice. FFR-CT may have potential as a noninvasive default method for simultaneous assessment of coronary anatomy and physiology in angina patients in order to define their management, which would completely change the way we look after them,” observed Dr. Curzen, professor of interventional cardiology at the University of Southampton (England).
EuroPCR codirector Dr. Williams Wijns was favorably impressed by the FFR-CT RIPCORD findings.
“This, I find just stunning. It’s really far reaching. This is a complete change in paradigm. Many patients that today undergo invasive angiography won’t even be sent to the cath lab. The invasive center becomes only for treatment,” commented Dr. Wijns, codirector of the cardiovascular center in Aalst, Belgium.
In FFR-CT RIPCORD, the cardiologists received information about a patient’s history and nonvasive CT angiography findings and were asked to reach consensus in selecting one of four management options: optimal medical therapy (OMT) alone, PCI plus OMT, CABG surgery and OMT, or ‘more information needed’ in the form of FFR findings, which identify those coronary lesions that are actually causing ischemia. Instead of receiving the results of conventional invasive FFR obtained using a pressure wire, however, the cardiologists were provided with the noninvasive FFR-CT findings in all 200 cases.
The resultant changes in management were substantial. Thirty percent of the patients initially slated for PCI were reallocated to OMT alone because no ischemic lesions were present. Twelve percent of patients assigned to OMT-only got reassigned to coronary revascularization. Moreover, in 18% of the PCI group, FFR-CT data led to a change in the vessel or vessels targeted for intervention.
“What particularly impressed me were two of those figures: that one-third of PCI patients are redirected to medical therapy, and – even more impressive to me – is the 18% of PCI patients who had a change in their target vessel. That’s a problem we often have in patients with multivessel disease and intermediate lesions: Sometimes we think, for example, the target is the LAD when in fact it’s another vessel,” commented Dr. Jean Fajadet, codirector of the interventional cardiovascular group at the Clinique Pasteur in Toulouse, France.
Dr. Curzen said the exciting thing about FFR-CT is that it could provide in one fell swoop a standardized way of obtaining both the anatomic and physiologic data necessary for informed clinical decision making, and without exposing patients needlessly to the risks of contrast and radiation exposure entailed in invasive coronary angiography.
“When we assess people with stable angina, if you have a room full of invasive cardiologists, we all do it differently at the moment. It’s crazy. A lot of us will do noninvasive tests like stress echo or MRI or some kind of exercise test, and then refer them for an invasive angiogram where we’ll also do an FFR. Some people will go straight for an angiogram. It’s a real mess. The thing I love about FFR-CT is it would be so slick for patients and their families: You see them in a chest pain clinic or your office and you put them in for this test. They don’t have to waste their time coming back several times for different tests. It’s a really beautiful concept,” Dr. Curzen continued.
Right now the turnaround time on FFR-CT is about 12 hours. The dataset has to be sent off to a supercomputer for a complex modeling analysis before the results come back.
“Of course, if this ever becomes clinically proven, I’m sure the turnaround time would become very quick,” according to the cardiologist.
A cost-effectiveness analysis of FFR-CT versus current standard care is ongoing and the results aren’t yet available. However, Dr. Curzen observed, “The cost to the patient is a very important issue: Who would want to have this done invasively if you have a test that proves you don’t need to have an invasive procedure?”
The FFR-CT RIPCORD study was sponsored by Heartflow. Dr. Curzen reported receiving research support from Heartflow, Boston Scientific, Haemonetics, and Medtronic.
AT EUROPCR
Key clinical point: Clinically decisive anatomic and physiologic data regarding the coronary arteries of patients with stable angina can be obtained noninvasively with a single test: CT-derived fractional flow reserve.
Major finding: Noninvasive FFR-CT findings resulted in a change in management strategy for 36% of patients with stable angina whose initial treatment plan was based on CT angiography alone.
Data source: A proof-of-concept study involving 200 patients with stable angina and a panel of three experienced interventional cardiologists making consensus decisions regarding their appropriate management.
Disclosures: The FFR-CT RIPCORD study was sponsored by Heartflow. The presenter reported having received research support from the company.
Hibernoma
Hibernomas are rare benign soft-tissue tumors originally described as pseudolipomas by Merkel1 in 1906. Gery coined the term hibernoma in 1914, after noting the multivacuolated cytoplasm of the tumor cells and its resemblance to normal brown fat found in hibernating animals.2
Hibernomas represent 2% of all benign fat-containing tumors and are composed of brown adipocytes, which are histologically different from the white fat of lipomas. Hibernomas usually develop between ages 20 and 40 years, and their incidence is slightly higher in males.
Diffusely present in human newborns, brown fat usually regresses by 8 weeks of age.3 Residual brown fat deposits may remain in the neck, axilla, shoulder, thorax, thigh, retroperitoneum, and periscapular/interscapular regions.4 All these vestigial areas are therefore common locations of hibernomas, with the thigh accounting for up to 30% of cases.5 These tumors are seldom identified in the abdomen, popliteal fossa, or even intracranially. Injury to brown fat cells in these locations, either by infection, inflammation, or trauma, is considered a predisposing risk factor for development of hibernomas.6
Clinical Presentation
Clinically, hibernomas present as slow-growing, painless soft-tissue masses. Physical examination usually reveals a palpable, solitary, soft, and rubbery mass within the subcutaneous fat, which is freely mobile and not attached to deep layers. These tumors may rarely produce steroid hormones and result in a paraneoplastic syndrome. Even though these tumors are usually large at presentation, compression of adjacent structures seldom occurs.
Histology and Differential Diagnosis
The characteristic hibernoma cell is a multivacuolated adipocyte with centrally located nucleus, indistinct nucleolus, and coarsely granular eosinophilic (or pale) cytoplasm (Figure 1). Cytoplasmic vacuoles are uniform, round, regular, and small and stain for neutral fat. Nuclei are usually small with no or rare atypia. These multivacuolated brown fat–like tumor cells usually stain positive for S100 and CD31, usually stain negative for CD34 and p53, and can show 11q13-21 rearrangements, also seen in lipomas and liposarcomas. Hibernomas have 4 histologic variants: typical (classic), myxoid, lipoma-like, and spindle-cell.5 The typical hibernoma, the most common, contains a varying mixture of brown and white fat cells. The myxoid type, second most common, is composed of hibernoma cells floating in a loose acellular myxoid stroma. The lipoma-like variant consists of a few scattered hibernoma cells in a predominance of white fat cells. The spindle-cell variant, the rarest, has features of typical hibernoma and spindle-cell lipoma.7
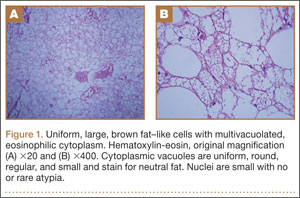
Grossly, hibernomas are well encapsulated, soft, and lobular with prominent feeding vessels.8 They typically are tan or brown because of their hypervascularity and abundant mitochondria. Tumor size ranges from 1 to 24 cm (mean, 9.4 cm).9 These tumors are well-defined intermuscular/intramuscular, subcutaneous, or retroperitoneal lesions that tend to grow along fascial planes and displace surrounding structures rather than invade them. Delicate branching capillaries are usually seen within the tumor.
Although rare, hibernoma should be included in the differential diagnosis of lipomatous soft-tissue tumors.10 Imaging findings of hibernoma are not specific; other differential diagnostic considerations for a mass with a signal similar to that of fat or containing large intratumoral vessels include angiolipoma, intramuscular hemangioma with fat, spindle-cell lipoma, pleomorphic lipoma, lipoblastoma, hemangiopericytoma, and hemangioblastoma,11-15 as well as malignant processes, including lipoma-like well-differentiated liposarcoma and myxoid liposarcoma.16 Other entities that should be considered include residual brown fat and rhabdomyoma.
Hibernomas are histologically distinguished from well-differentiated liposarcomas by location (liposarcomas tend to be deep), atypia, presence of a prominent “plexiform” capillary pattern, and specific molecular translocations, including t (12;16). Lipomas have lipocytes that are not multivacuolated, and residual brown fat does not present as a distinct mass. Rhabdomyomas are distinguished by an absence of cytoplasmic lipid vacuoles.
Imaging
Conventional radiography may show a radiolucent mass without internal mineralization or associated osseous abnormalities4 (Figure 2). Calcifications are notably absent.17 Sonographically, hibernomas are well-circumscribed, solid, hyperechoic masses with increased internal vascular flow on both grayscale and color Doppler sampling; however their appearance is not pathognomonic (Figure 3). Angiography reveals a hypervascular tumor that may have internal arteriovenous shunting.18 Hibernomas have a heterogeneous appearance on computed tomography (CT) and magnetic resonance imaging (MRI) because of the variable distribution of brown fat cells, white fat cells, myxoid material, and spindle cells within the individual tumor subtypes.5 CT of these tumors shows internal septations and low attenuation values, between those of fat and muscle19 (Figure 4). Intravenous contrast enhances internal septa, but enhancement varies from none to intense, and from generalized to focal, depending on internal tumor composition.3,17,20-22
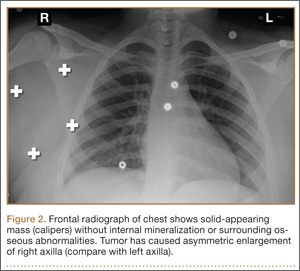
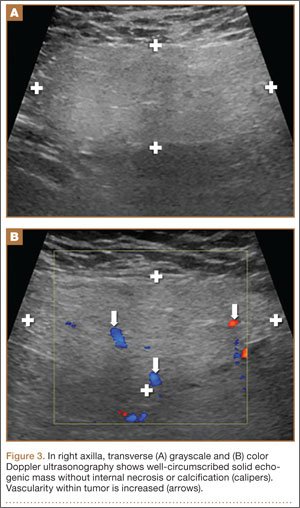
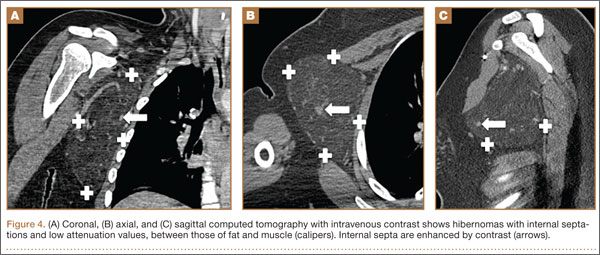
Hibernomas are usually hyperintense to skeletal muscle on T1-weighted MRI but slightly hypointense to subcutaneous fat because of the different gyromagnetic ratios and precessional frequencies of protons in white fat versus those in brown fat17 (Figure 5). Rarely, lesions are isointense to skeletal muscle on T1-weighted images.23 On T2-weighted images, high signal intensity similar to that of subcutaneous fat is typical.24 Flow voids can be readily identified.25 Short tau inversion recovery (STIR) MRI shows some areas with signal intensity higher than that of subcutaneous fat, and other areas of fat suppression.9 Ritchie and colleagues21 reported that hibernomas histologically composed of more than 70% multivacuolated adipocytes tended to have MRI signal characteristics different from those of subcutaneous fat, and those with less than 70% multivacuolated adipocytes tended to have signal characteristics paralleling those of subcutaneous fat. Myxoid hibernomas have higher signal intensity on T2-weighted and STIR MRI because of high water content.17,21,26,27
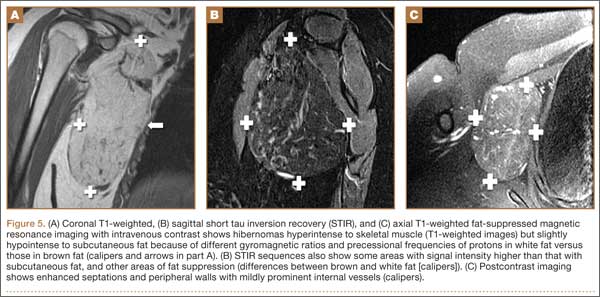
Hibernomas demonstrate moderate uptake on bone scintigraphy blood pool images and mild uptake on delayed images.4 Positron emission tomography (PET) is useful in differentiating hibernomas from other fat-containing lesions.9 Hibernomas demonstrate intense fluorine-18 fluorodeoxyglucose uptake because, unlike other adipogenic tumors, hibernomas contain abundant mitochondria and are highly metabolically active.28
Treatment and Prognosis
Complete surgical excision is the treatment of choice; given the behavior of the benign tumor, marginal complete excision is considered curative.5 Intralesional excision may be the only option for large tumors that are near nerves or vessels. However, intralesional excision may result in continued growth and local recurrence.
At surgery, these tumors usually are encapsulated and/or adherent to skeletal muscle or bone, without invasion, and easily separated from surrounding soft tissues.29 No specific surgical considerations are required beyond standard oncological principles, including careful dissection of adjacent nerves and vessels, and hemostasis. Hibernomas have the potential for significant bleeding during surgical excision. In this setting, embolization becomes a consideration, given the identification of large intratumoral vessels and the benign course of these lesions.
1. Merkel H. On a pseudolipoma of the breast. Beitr Pathol Anat. 1906;39:152-157.
2. Enzinger FM, Weiss SW. Benign lipomatous tumors. In: Enzinger FM, Weiss SW, eds. Soft Tissue Tumors. 3rd ed. St. Louis, MO: Mosby-Yearbook; 1994:420-423.
3. Alvine G, Rosenthal H, Murphey M, Huntrakoon M. Hibernoma. Skeletal Radiol. 1996;25(5):493-496.
4. Kumazoe H, Nagamatsu Y, Nishi T, Kimura YN, Nakazono T, Kudo S. Dumbbell-shaped thoracic hibernoma: computed tomography and magnetic resonance imaging findings. Jpn J Radiol. 2009;27(1):37-40.
5. Furlong MA, Fanburg-Smith JC, Miettinen M. The morphologic spectrum of hibernoma: a clinicopathologic study of 170 cases. Am J Surg Pathol. 2001;25(6):809-814.
6. Ucak A, Inan K, Onan B, Yilmaz AT. Resection of intrapericardial hibernoma associated with constrictive pericarditis. Interact Cardiovasc Thorac Surg. 2009;9(4):717-719.
7. Tomihama RT, Lindskog DM, Ahrens W, Haims AH. Hibernoma: a case report demonstrating usefulness of MR angiography in characterizing the tumor. Skeletal Radiol. 2007;36(6):541-545.
8. Choi J, Heiner J, Agni R, Hafez GR. Case of the season. Hibernoma. Semin Roentgenol. 2002;37(2):99-101.
9. Craig WD, Fanburg-Smith JC, Henry LR, Guerrero R, Barton JH. Fat-containing lesions of the retroperitoneum: radiologic-pathologic correlation. Radiographics. 2009;29(1):261-290.
10. Vassos N, Lell M, Hohenberger W, Croner RS, Agaimy A. Deep-seated huge hibernoma of soft tissue: a rare differential diagnosis of atypical lipomatous tumor/well differentiated liposarcoma. Int J Clin Exp Pathol. 2013;6(10):2178-2184.
11. Mugel T, Ghossain MA, Guinet C, et al. MR and CT findings in a case of hibernoma of the thigh extending into the pelvis. Eur Radiol. 1998;8(3):476-478.
12. Kallas KM, Vaughan L, Haghighi P, Resnick D. Hibernoma of the left axilla; a case report and review of MR imaging. Skeletal Radiol. 2003;32(5):290-294.
13. Suh JS, Cho J, Lee SH, et al. Alveolar soft part sarcoma: MR and angiographic findings. Skeletal Radiol. 2000;29(12):680-689.
14. De Beuckeleer LH, De Schepper AM, Vandevenne JE, et al. MR imaging of clear cell sarcoma (malignant melanoma of the soft parts): a multicenter correlative MRI-pathology study of 21 cases and literature review. Skeletal Radiol. 2000;29(4):187-195.
15. Chu BC, Terae S, Hida K, Furukawa M, Abe S, Miyasaka K. MR findings in spinal hemangioblastoma: correlation with symptoms and with angiographic and surgical findings. AJNR Am J Neuroradiol. 2001;22(1):206-217.
16. Cypess AM, Lehman S, Williams G, et al. Identification and importance of brown adipose tissue in adult humans. N Engl J Med. 2009;360(15):1509-1517.
17. Anderson SE, Schwab C, Stauffer E, Banic A, Steinbach LS. Hibernoma: imaging characteristics of a rare benign soft tissue tumor. Skeletal Radiol. 2001;30(10):590-595.
18. Angervall L, Nilsson L, Stener B. Microangiographic and histological studies in 2 cases of hibernoma. Cancer. 1964;17:685-692.
19. Sansom HE, Blunt DM, Moskovic EC. Large retroperitoneal hibernoma—CT findings with pathological correlation. Clin Radiol. 1999;54(9):625-627.
20. Dursun M, Agayev A, Bakir B, et al. CT and MR characteristics of hibernoma: six cases. Clin Imaging. 2008;32(1):42-47.
21. Ritchie DA, Aniq H, Davies AM, Mangham DC, Helliwell TR. Hibernoma—correlation of histopathology and magnetic-resonance-imaging features in 10 cases. Skeletal Radiol. 2006;35(8):579-589.
22. Lee JC, Gupta A, Saifuddin A, et al. Hibernoma: MRI features in eight consecutive cases. Clin Radiol. 2006;61(12):1029-1034.
23. Chitoku S, Kawai S, Watabe Y, et al. Intradural spinal hibernoma: case report. Surg Neurol. 1998;49(5):509-513.
24. Baskurt E, Padgett DM, Matsumoto JA. Multiple hibernomas in a 1-month-old female infant. AJNR Am J Neuroradiol. 2004;25(8):1443-1445.
25. da Motta AC, Tunkel DE, Westra WH, Yousem DM. Imaging findings of a hibernoma of the neck. AJNR Am J Neuroradiol. 2006;27(8):1658-1659.
26. Cook MA, Stern M, de Siva RD. MRI of a hibernoma. J Comput Assist Tomogr. 1996;20(2):333-335.
27. Murphey MD, Carroll JF, Flemming DJ, Pope TL, Gannon FH, Kransdorf MJ. From the archives of the AFIP: benign musculoskeletal lipomatous lesions. Radiographics. 2004;24(5):1433-1466.
28. Robison S, Rapmund A, Hemmings C, Fulham M, Barry P. False-positive diagnosis of metastasis on positron emission tomography–computed tomography imaging due to hibernoma. J Clin Oncol. 2009;27(6):994-995.
29. Kallas KM, Vaughan L, Haghighi P, Resnick D. Hibernoma of the left axilla; a case report and review of MR imaging. Skeletal Radiol. 2003;32(5):290-294.
Hibernomas are rare benign soft-tissue tumors originally described as pseudolipomas by Merkel1 in 1906. Gery coined the term hibernoma in 1914, after noting the multivacuolated cytoplasm of the tumor cells and its resemblance to normal brown fat found in hibernating animals.2
Hibernomas represent 2% of all benign fat-containing tumors and are composed of brown adipocytes, which are histologically different from the white fat of lipomas. Hibernomas usually develop between ages 20 and 40 years, and their incidence is slightly higher in males.
Diffusely present in human newborns, brown fat usually regresses by 8 weeks of age.3 Residual brown fat deposits may remain in the neck, axilla, shoulder, thorax, thigh, retroperitoneum, and periscapular/interscapular regions.4 All these vestigial areas are therefore common locations of hibernomas, with the thigh accounting for up to 30% of cases.5 These tumors are seldom identified in the abdomen, popliteal fossa, or even intracranially. Injury to brown fat cells in these locations, either by infection, inflammation, or trauma, is considered a predisposing risk factor for development of hibernomas.6
Clinical Presentation
Clinically, hibernomas present as slow-growing, painless soft-tissue masses. Physical examination usually reveals a palpable, solitary, soft, and rubbery mass within the subcutaneous fat, which is freely mobile and not attached to deep layers. These tumors may rarely produce steroid hormones and result in a paraneoplastic syndrome. Even though these tumors are usually large at presentation, compression of adjacent structures seldom occurs.
Histology and Differential Diagnosis
The characteristic hibernoma cell is a multivacuolated adipocyte with centrally located nucleus, indistinct nucleolus, and coarsely granular eosinophilic (or pale) cytoplasm (Figure 1). Cytoplasmic vacuoles are uniform, round, regular, and small and stain for neutral fat. Nuclei are usually small with no or rare atypia. These multivacuolated brown fat–like tumor cells usually stain positive for S100 and CD31, usually stain negative for CD34 and p53, and can show 11q13-21 rearrangements, also seen in lipomas and liposarcomas. Hibernomas have 4 histologic variants: typical (classic), myxoid, lipoma-like, and spindle-cell.5 The typical hibernoma, the most common, contains a varying mixture of brown and white fat cells. The myxoid type, second most common, is composed of hibernoma cells floating in a loose acellular myxoid stroma. The lipoma-like variant consists of a few scattered hibernoma cells in a predominance of white fat cells. The spindle-cell variant, the rarest, has features of typical hibernoma and spindle-cell lipoma.7
Grossly, hibernomas are well encapsulated, soft, and lobular with prominent feeding vessels.8 They typically are tan or brown because of their hypervascularity and abundant mitochondria. Tumor size ranges from 1 to 24 cm (mean, 9.4 cm).9 These tumors are well-defined intermuscular/intramuscular, subcutaneous, or retroperitoneal lesions that tend to grow along fascial planes and displace surrounding structures rather than invade them. Delicate branching capillaries are usually seen within the tumor.
Although rare, hibernoma should be included in the differential diagnosis of lipomatous soft-tissue tumors.10 Imaging findings of hibernoma are not specific; other differential diagnostic considerations for a mass with a signal similar to that of fat or containing large intratumoral vessels include angiolipoma, intramuscular hemangioma with fat, spindle-cell lipoma, pleomorphic lipoma, lipoblastoma, hemangiopericytoma, and hemangioblastoma,11-15 as well as malignant processes, including lipoma-like well-differentiated liposarcoma and myxoid liposarcoma.16 Other entities that should be considered include residual brown fat and rhabdomyoma.
Hibernomas are histologically distinguished from well-differentiated liposarcomas by location (liposarcomas tend to be deep), atypia, presence of a prominent “plexiform” capillary pattern, and specific molecular translocations, including t (12;16). Lipomas have lipocytes that are not multivacuolated, and residual brown fat does not present as a distinct mass. Rhabdomyomas are distinguished by an absence of cytoplasmic lipid vacuoles.
Imaging
Conventional radiography may show a radiolucent mass without internal mineralization or associated osseous abnormalities4 (Figure 2). Calcifications are notably absent.17 Sonographically, hibernomas are well-circumscribed, solid, hyperechoic masses with increased internal vascular flow on both grayscale and color Doppler sampling; however their appearance is not pathognomonic (Figure 3). Angiography reveals a hypervascular tumor that may have internal arteriovenous shunting.18 Hibernomas have a heterogeneous appearance on computed tomography (CT) and magnetic resonance imaging (MRI) because of the variable distribution of brown fat cells, white fat cells, myxoid material, and spindle cells within the individual tumor subtypes.5 CT of these tumors shows internal septations and low attenuation values, between those of fat and muscle19 (Figure 4). Intravenous contrast enhances internal septa, but enhancement varies from none to intense, and from generalized to focal, depending on internal tumor composition.3,17,20-22
Hibernomas are usually hyperintense to skeletal muscle on T1-weighted MRI but slightly hypointense to subcutaneous fat because of the different gyromagnetic ratios and precessional frequencies of protons in white fat versus those in brown fat17 (Figure 5). Rarely, lesions are isointense to skeletal muscle on T1-weighted images.23 On T2-weighted images, high signal intensity similar to that of subcutaneous fat is typical.24 Flow voids can be readily identified.25 Short tau inversion recovery (STIR) MRI shows some areas with signal intensity higher than that of subcutaneous fat, and other areas of fat suppression.9 Ritchie and colleagues21 reported that hibernomas histologically composed of more than 70% multivacuolated adipocytes tended to have MRI signal characteristics different from those of subcutaneous fat, and those with less than 70% multivacuolated adipocytes tended to have signal characteristics paralleling those of subcutaneous fat. Myxoid hibernomas have higher signal intensity on T2-weighted and STIR MRI because of high water content.17,21,26,27
Hibernomas demonstrate moderate uptake on bone scintigraphy blood pool images and mild uptake on delayed images.4 Positron emission tomography (PET) is useful in differentiating hibernomas from other fat-containing lesions.9 Hibernomas demonstrate intense fluorine-18 fluorodeoxyglucose uptake because, unlike other adipogenic tumors, hibernomas contain abundant mitochondria and are highly metabolically active.28
Treatment and Prognosis
Complete surgical excision is the treatment of choice; given the behavior of the benign tumor, marginal complete excision is considered curative.5 Intralesional excision may be the only option for large tumors that are near nerves or vessels. However, intralesional excision may result in continued growth and local recurrence.
At surgery, these tumors usually are encapsulated and/or adherent to skeletal muscle or bone, without invasion, and easily separated from surrounding soft tissues.29 No specific surgical considerations are required beyond standard oncological principles, including careful dissection of adjacent nerves and vessels, and hemostasis. Hibernomas have the potential for significant bleeding during surgical excision. In this setting, embolization becomes a consideration, given the identification of large intratumoral vessels and the benign course of these lesions.
1. Merkel H. On a pseudolipoma of the breast. Beitr Pathol Anat. 1906;39:152-157.
2. Enzinger FM, Weiss SW. Benign lipomatous tumors. In: Enzinger FM, Weiss SW, eds. Soft Tissue Tumors. 3rd ed. St. Louis, MO: Mosby-Yearbook; 1994:420-423.
3. Alvine G, Rosenthal H, Murphey M, Huntrakoon M. Hibernoma. Skeletal Radiol. 1996;25(5):493-496.
4. Kumazoe H, Nagamatsu Y, Nishi T, Kimura YN, Nakazono T, Kudo S. Dumbbell-shaped thoracic hibernoma: computed tomography and magnetic resonance imaging findings. Jpn J Radiol. 2009;27(1):37-40.
5. Furlong MA, Fanburg-Smith JC, Miettinen M. The morphologic spectrum of hibernoma: a clinicopathologic study of 170 cases. Am J Surg Pathol. 2001;25(6):809-814.
6. Ucak A, Inan K, Onan B, Yilmaz AT. Resection of intrapericardial hibernoma associated with constrictive pericarditis. Interact Cardiovasc Thorac Surg. 2009;9(4):717-719.
7. Tomihama RT, Lindskog DM, Ahrens W, Haims AH. Hibernoma: a case report demonstrating usefulness of MR angiography in characterizing the tumor. Skeletal Radiol. 2007;36(6):541-545.
8. Choi J, Heiner J, Agni R, Hafez GR. Case of the season. Hibernoma. Semin Roentgenol. 2002;37(2):99-101.
9. Craig WD, Fanburg-Smith JC, Henry LR, Guerrero R, Barton JH. Fat-containing lesions of the retroperitoneum: radiologic-pathologic correlation. Radiographics. 2009;29(1):261-290.
10. Vassos N, Lell M, Hohenberger W, Croner RS, Agaimy A. Deep-seated huge hibernoma of soft tissue: a rare differential diagnosis of atypical lipomatous tumor/well differentiated liposarcoma. Int J Clin Exp Pathol. 2013;6(10):2178-2184.
11. Mugel T, Ghossain MA, Guinet C, et al. MR and CT findings in a case of hibernoma of the thigh extending into the pelvis. Eur Radiol. 1998;8(3):476-478.
12. Kallas KM, Vaughan L, Haghighi P, Resnick D. Hibernoma of the left axilla; a case report and review of MR imaging. Skeletal Radiol. 2003;32(5):290-294.
13. Suh JS, Cho J, Lee SH, et al. Alveolar soft part sarcoma: MR and angiographic findings. Skeletal Radiol. 2000;29(12):680-689.
14. De Beuckeleer LH, De Schepper AM, Vandevenne JE, et al. MR imaging of clear cell sarcoma (malignant melanoma of the soft parts): a multicenter correlative MRI-pathology study of 21 cases and literature review. Skeletal Radiol. 2000;29(4):187-195.
15. Chu BC, Terae S, Hida K, Furukawa M, Abe S, Miyasaka K. MR findings in spinal hemangioblastoma: correlation with symptoms and with angiographic and surgical findings. AJNR Am J Neuroradiol. 2001;22(1):206-217.
16. Cypess AM, Lehman S, Williams G, et al. Identification and importance of brown adipose tissue in adult humans. N Engl J Med. 2009;360(15):1509-1517.
17. Anderson SE, Schwab C, Stauffer E, Banic A, Steinbach LS. Hibernoma: imaging characteristics of a rare benign soft tissue tumor. Skeletal Radiol. 2001;30(10):590-595.
18. Angervall L, Nilsson L, Stener B. Microangiographic and histological studies in 2 cases of hibernoma. Cancer. 1964;17:685-692.
19. Sansom HE, Blunt DM, Moskovic EC. Large retroperitoneal hibernoma—CT findings with pathological correlation. Clin Radiol. 1999;54(9):625-627.
20. Dursun M, Agayev A, Bakir B, et al. CT and MR characteristics of hibernoma: six cases. Clin Imaging. 2008;32(1):42-47.
21. Ritchie DA, Aniq H, Davies AM, Mangham DC, Helliwell TR. Hibernoma—correlation of histopathology and magnetic-resonance-imaging features in 10 cases. Skeletal Radiol. 2006;35(8):579-589.
22. Lee JC, Gupta A, Saifuddin A, et al. Hibernoma: MRI features in eight consecutive cases. Clin Radiol. 2006;61(12):1029-1034.
23. Chitoku S, Kawai S, Watabe Y, et al. Intradural spinal hibernoma: case report. Surg Neurol. 1998;49(5):509-513.
24. Baskurt E, Padgett DM, Matsumoto JA. Multiple hibernomas in a 1-month-old female infant. AJNR Am J Neuroradiol. 2004;25(8):1443-1445.
25. da Motta AC, Tunkel DE, Westra WH, Yousem DM. Imaging findings of a hibernoma of the neck. AJNR Am J Neuroradiol. 2006;27(8):1658-1659.
26. Cook MA, Stern M, de Siva RD. MRI of a hibernoma. J Comput Assist Tomogr. 1996;20(2):333-335.
27. Murphey MD, Carroll JF, Flemming DJ, Pope TL, Gannon FH, Kransdorf MJ. From the archives of the AFIP: benign musculoskeletal lipomatous lesions. Radiographics. 2004;24(5):1433-1466.
28. Robison S, Rapmund A, Hemmings C, Fulham M, Barry P. False-positive diagnosis of metastasis on positron emission tomography–computed tomography imaging due to hibernoma. J Clin Oncol. 2009;27(6):994-995.
29. Kallas KM, Vaughan L, Haghighi P, Resnick D. Hibernoma of the left axilla; a case report and review of MR imaging. Skeletal Radiol. 2003;32(5):290-294.
Technique for Lumbar Pedicle Subtraction Osteotomy for Sagittal Plane Deformity in Revision
Pedicle subtraction osteotomies (PSOs) have been used in the treatment of multiple spinal conditions involving a fixed sagittal imbalance, such as degenerative scoliosis, idiopathic scoliosis, posttraumatic deformities, iatrogenic flatback syndrome, and ankylosing spondylitis. The procedure was first described by Thomasen1 for the treatment of ankylosing spondylitis. More recently, multiple centers have reported the expanded use and good success of PSO in the treatment of fixed sagittal imbalance of other etiologies.2,3 According to Bridwell and colleagues,2 lumbar lordosis can be increased 34.1°, and sagittal plumb line can be improved 13.5 cm.
PSO is a complex, extensive surgery most often performed in the revision setting. Multiple authors have described the technique for PSO.4,5 There are significant technical challenges and many complications, including neurologic deficits, pseudarthrosis of adjacent levels, and wound infections.6 Short-term challenges include a large loss of blood, 2.4 L on average, according to Bridwell and colleagues.6 Time of closure of the osteotomy gap is a crucial point in the surgery. Blood loss, often large, slows only after the gap is closed and stabilized.
In this article, we describe a technique in which an additional rod or pedicle screw construct is used at the periosteotomy levels to close the osteotomy gap during PSO and simplify subsequent instrumentation. In addition, we report our experience with the procedure.
Materials and Methods
Seventeen consecutive patients (mean age, 58 years; range, 12-81 years) with fixed sagittal imbalance were treated with lumbar PSO. The indication in all cases was flatback syndrome after previous spinal surgery. Mean follow-up was 13 months. Mean number of prior surgeries was 3. Thirteen PSOs were performed at L3, and 4 were performed at L2.
Radiographic data were collected from before surgery, in the immediate postoperative period, and at final follow-up. All the radiographs were standing films. Established radiographic parameters were measured: thoracic kyphosis from T5 to T12, lumbar lordosis from L1 to S1, PSO angle (1 level above to 1 level below osteotomy level), sagittal plumb line (from center of C7 body to posterosuperior aspect of S1 body), and coronal plumb line (from center of C7 body to center of S1 body).2
Good clinical outcomes in the treatment of spinal disorders require careful attention to the alignment of the spine in the sagittal plane.7,8 When evaluating the preoperative radiographs, we measured and documented pelvic parameters. Figure 1A shows how pelvic incidence was determined. We measured this as the angle between a line drawn from the center of the S1 endplate to the center of the femoral head and the perpendicular off the S1 endplate. Figure 1B shows pelvic tilt as determined by the angle between a line drawn from the center of S1 to the femoral head and a vertical line originating from the center of the femoral head. Figure 1C shows the sacral slope, which we measured as the angle between a line drawn parallel to the endplate of S1 and its intersection with a horizontal line.
Surgical Technique
The overall surgical technique for PSO has been well described.4,5 Here we describe the “outrigger” modification to osteotomy closure (Figures 2, 3).
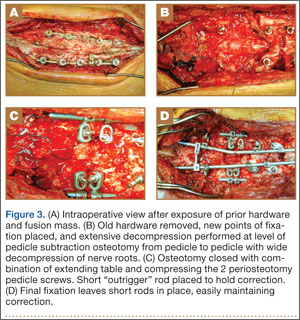
Most of our 17 cases were revisions. In these cases, new fixation points are first established. All fixation points that will be needed for the final fusion are placed. If a pedicle above or below the osteotomy level is not suitable for a screw, it can be skipped.
Wide decompression of the involved level is performed from pedicle to pedicle, ensuring that the nerve roots are completely decompressed. The dissection is then continued around the lateral wall of the vertebral body. While the neural elements are protected with gentle retraction, the pedicle and a portion of the posterior aspect of the vertebral body are removed with a combination of a rongeur and reverse-angle curettes. Resection of the vertebral body can be facilitated by attaching a short rod to the pedicle screws on either side of the osteotomy level and using it to provide gentle distraction.
Once sufficient bone has been removed to close the osteotomy, short rods are placed in the pedicle screws in the level above and the level below the osteotomy site. These rods are attached with offset connectors that allow the rods to be placed lateral to the screws. Before the surgical procedure is started, the patient is positioned on 2 sets of posts separated by the break in the table. The break in the table allows flexion to accommodate the preoperative kyphosis and allows hyperextension to help close the osteotomy site. Now, with the osteotomy site ready for closure, the table is gradually positioned in extension along with a combination of posterior pressure and compression between the pedicle screws above and below the osteotomy. Once the osteotomy is adequately compressed, the short rods are tightened, holding the osteotomy in good position. With the osteotomy held by the short rods and table positioning, decompression of the neural elements is confirmed and hemostasis obtained.
Final instrumentation is then performed with long rods that can bypass the osteotomized levels, allowing for simpler contouring. If desired, a cross connector can be placed between the long rod of the fusion construct and the short rod holding the osteotomy. The rest of the fusion procedure is completed in standard fashion with at least 1 subfascial drain.
Results
Our 17 patients’ results are summarized in the Table. Mean sagittal plumb line improved from 17.7 cm (range, 5.9 to 29 cm) before surgery to 4.5 cm (range, –0.2 to 12.9 cm) after surgery, for a mean improvement of 13.2 cm. At final follow-up, mean sagittal plumb line was 5.1 cm (range, –1.4 to 10.2 cm).
Mean lumbar lordosis improved from 10° (range, –14° to 34°) before surgery to 49° (range, 36° to 63°) after surgery, for a mean improvement of 39°. Mean PSO angle improved from 3° (range, –36° to 23°) before surgery to 41° (range, 25° to 65°) after surgery, for a mean improvement of 38°. At final follow-up, mean lumbar lordosis remained at 47° (range, 26° to 64°), and mean PSO angle was 39° (range, 24° to 59°).
Mean thoracic kyphosis improved from 18° (range, –8° to 52°) before surgery to 30° (range, 3° to 58°) after surgery, for a mean improvement of 12°. At final follow-up, mean thoracic kyphosis was 31° (range, 2° to 57°).
Fourteen patients did not have complications during the study period. Of the 3 patients with complications, 1 had an early infection, treated effectively with irrigation and débridement and intravenous antibiotics; 1 had a late deep infection, treated with multiple débridements, hardware removal, and, eventually, suppressive antibiotics; and 1 had cauda equina syndrome (caused by extensive scar tissue on the dura, which buckled with restoration of lordosis leading to cord compression), treated with duraplasty, which resulted in full neurologic recovery.
Discussion
In the present series of patients, the described technique for facilitating PSO for correction of sagittal imbalance was effective, and complications were similar to those previously reported.
The benefit of the outrigger construct is that it allows controlled compression of the osteotomy site and can be left in place at time of final instrumentation, locking in compression and correction. Other techniques involve removing the temporary rod and replacing it with final instrumentation4,5—an extra step that complicates instrumentation of the additional levels of the fusion construct and possibly adds pedicle screw stress and contributes to loosening when the new rod is reduced to the pedicle screw. The final long rod construct can bypass the osteotomy levels and allow for simpler instrumentation.
Mean age was 58 years in this series versus 52.4 years in the series reported by Bridwell and colleagues.2 Given the higher mean age of our patients, though no objective measures of bone quality were available, this technique is likely applicable to patients with poor bone quality.
The complications we have reported are in line with those reported in previous series, and maintenance of radiographic parameters at final follow-up indicates that this osteotomy technique allows for solid fusion constructs.
The outrigger technique for controlling PSO closure is an effective method that simplifies instrumentation during a complex revision case.
1. Thomasen E. Vertebral osteotomy for correction of kyphosis in ankylosing spondylitis. Clin Orthop. 1985;(194):142-152.
2. Bridwell KH, Lewis SJ, Lenke LG, Baldus C, Blanke K. Pedicle subtraction osteotomy for the treatment of fixed sagittal imbalance. J Bone Joint Surg Am. 2003;85(3):454-463.
3. Berven SH, Deviren V, Smith JA, Emami A, Hu SS, Bradford DS. Management of fixed sagittal plane deformity: results of the transpedicular wedge resection osteotomy. Spine. 2001;26(18):2036-2043.
4. Bridwell KH, Lewis SJ, Rinella A, Lenke LG, Baldus C, Blanke K. Pedicle subtraction osteotomy for the treatment of fixed sagittal imbalance. Surgical technique. J Bone Joint Surg Am. 2004;86(suppl 1):44-50.
5. Wang MY, Berven SH. Lumbar pedicle subtraction osteotomy. Neurosurgery. 2007;60(2 suppl 1):ONS140-ONS146.
6. Bridwell KH, Lewis SJ, Edwards C, et al. Complications and outcomes of pedicle subtraction osteotomies for fixed sagittal imbalance. Spine. 2003;28(18):2093-2101.
7. Vialle R, Levassor N, Rillardon L, Templier A, Skalli W, Guigui P. Radiographic analysis of the sagittal alignment and balance of the spine in asymptomatic subjects. J Bone Joint Surg Am. 2005;87(2):260-267.
8. Schwab F, Lafage V, Patel A, Farcy JP. Sagittal plane considerations and the pelvis in the adult patient. Spine. 2009;34(17):1828-1833.
Pedicle subtraction osteotomies (PSOs) have been used in the treatment of multiple spinal conditions involving a fixed sagittal imbalance, such as degenerative scoliosis, idiopathic scoliosis, posttraumatic deformities, iatrogenic flatback syndrome, and ankylosing spondylitis. The procedure was first described by Thomasen1 for the treatment of ankylosing spondylitis. More recently, multiple centers have reported the expanded use and good success of PSO in the treatment of fixed sagittal imbalance of other etiologies.2,3 According to Bridwell and colleagues,2 lumbar lordosis can be increased 34.1°, and sagittal plumb line can be improved 13.5 cm.
PSO is a complex, extensive surgery most often performed in the revision setting. Multiple authors have described the technique for PSO.4,5 There are significant technical challenges and many complications, including neurologic deficits, pseudarthrosis of adjacent levels, and wound infections.6 Short-term challenges include a large loss of blood, 2.4 L on average, according to Bridwell and colleagues.6 Time of closure of the osteotomy gap is a crucial point in the surgery. Blood loss, often large, slows only after the gap is closed and stabilized.
In this article, we describe a technique in which an additional rod or pedicle screw construct is used at the periosteotomy levels to close the osteotomy gap during PSO and simplify subsequent instrumentation. In addition, we report our experience with the procedure.
Materials and Methods
Seventeen consecutive patients (mean age, 58 years; range, 12-81 years) with fixed sagittal imbalance were treated with lumbar PSO. The indication in all cases was flatback syndrome after previous spinal surgery. Mean follow-up was 13 months. Mean number of prior surgeries was 3. Thirteen PSOs were performed at L3, and 4 were performed at L2.
Radiographic data were collected from before surgery, in the immediate postoperative period, and at final follow-up. All the radiographs were standing films. Established radiographic parameters were measured: thoracic kyphosis from T5 to T12, lumbar lordosis from L1 to S1, PSO angle (1 level above to 1 level below osteotomy level), sagittal plumb line (from center of C7 body to posterosuperior aspect of S1 body), and coronal plumb line (from center of C7 body to center of S1 body).2
Good clinical outcomes in the treatment of spinal disorders require careful attention to the alignment of the spine in the sagittal plane.7,8 When evaluating the preoperative radiographs, we measured and documented pelvic parameters. Figure 1A shows how pelvic incidence was determined. We measured this as the angle between a line drawn from the center of the S1 endplate to the center of the femoral head and the perpendicular off the S1 endplate. Figure 1B shows pelvic tilt as determined by the angle between a line drawn from the center of S1 to the femoral head and a vertical line originating from the center of the femoral head. Figure 1C shows the sacral slope, which we measured as the angle between a line drawn parallel to the endplate of S1 and its intersection with a horizontal line.
Surgical Technique
The overall surgical technique for PSO has been well described.4,5 Here we describe the “outrigger” modification to osteotomy closure (Figures 2, 3).
Most of our 17 cases were revisions. In these cases, new fixation points are first established. All fixation points that will be needed for the final fusion are placed. If a pedicle above or below the osteotomy level is not suitable for a screw, it can be skipped.
Wide decompression of the involved level is performed from pedicle to pedicle, ensuring that the nerve roots are completely decompressed. The dissection is then continued around the lateral wall of the vertebral body. While the neural elements are protected with gentle retraction, the pedicle and a portion of the posterior aspect of the vertebral body are removed with a combination of a rongeur and reverse-angle curettes. Resection of the vertebral body can be facilitated by attaching a short rod to the pedicle screws on either side of the osteotomy level and using it to provide gentle distraction.
Once sufficient bone has been removed to close the osteotomy, short rods are placed in the pedicle screws in the level above and the level below the osteotomy site. These rods are attached with offset connectors that allow the rods to be placed lateral to the screws. Before the surgical procedure is started, the patient is positioned on 2 sets of posts separated by the break in the table. The break in the table allows flexion to accommodate the preoperative kyphosis and allows hyperextension to help close the osteotomy site. Now, with the osteotomy site ready for closure, the table is gradually positioned in extension along with a combination of posterior pressure and compression between the pedicle screws above and below the osteotomy. Once the osteotomy is adequately compressed, the short rods are tightened, holding the osteotomy in good position. With the osteotomy held by the short rods and table positioning, decompression of the neural elements is confirmed and hemostasis obtained.
Final instrumentation is then performed with long rods that can bypass the osteotomized levels, allowing for simpler contouring. If desired, a cross connector can be placed between the long rod of the fusion construct and the short rod holding the osteotomy. The rest of the fusion procedure is completed in standard fashion with at least 1 subfascial drain.
Results
Our 17 patients’ results are summarized in the Table. Mean sagittal plumb line improved from 17.7 cm (range, 5.9 to 29 cm) before surgery to 4.5 cm (range, –0.2 to 12.9 cm) after surgery, for a mean improvement of 13.2 cm. At final follow-up, mean sagittal plumb line was 5.1 cm (range, –1.4 to 10.2 cm).
Mean lumbar lordosis improved from 10° (range, –14° to 34°) before surgery to 49° (range, 36° to 63°) after surgery, for a mean improvement of 39°. Mean PSO angle improved from 3° (range, –36° to 23°) before surgery to 41° (range, 25° to 65°) after surgery, for a mean improvement of 38°. At final follow-up, mean lumbar lordosis remained at 47° (range, 26° to 64°), and mean PSO angle was 39° (range, 24° to 59°).
Mean thoracic kyphosis improved from 18° (range, –8° to 52°) before surgery to 30° (range, 3° to 58°) after surgery, for a mean improvement of 12°. At final follow-up, mean thoracic kyphosis was 31° (range, 2° to 57°).
Fourteen patients did not have complications during the study period. Of the 3 patients with complications, 1 had an early infection, treated effectively with irrigation and débridement and intravenous antibiotics; 1 had a late deep infection, treated with multiple débridements, hardware removal, and, eventually, suppressive antibiotics; and 1 had cauda equina syndrome (caused by extensive scar tissue on the dura, which buckled with restoration of lordosis leading to cord compression), treated with duraplasty, which resulted in full neurologic recovery.
Discussion
In the present series of patients, the described technique for facilitating PSO for correction of sagittal imbalance was effective, and complications were similar to those previously reported.
The benefit of the outrigger construct is that it allows controlled compression of the osteotomy site and can be left in place at time of final instrumentation, locking in compression and correction. Other techniques involve removing the temporary rod and replacing it with final instrumentation4,5—an extra step that complicates instrumentation of the additional levels of the fusion construct and possibly adds pedicle screw stress and contributes to loosening when the new rod is reduced to the pedicle screw. The final long rod construct can bypass the osteotomy levels and allow for simpler instrumentation.
Mean age was 58 years in this series versus 52.4 years in the series reported by Bridwell and colleagues.2 Given the higher mean age of our patients, though no objective measures of bone quality were available, this technique is likely applicable to patients with poor bone quality.
The complications we have reported are in line with those reported in previous series, and maintenance of radiographic parameters at final follow-up indicates that this osteotomy technique allows for solid fusion constructs.
The outrigger technique for controlling PSO closure is an effective method that simplifies instrumentation during a complex revision case.
1. Thomasen E. Vertebral osteotomy for correction of kyphosis in ankylosing spondylitis. Clin Orthop. 1985;(194):142-152.
2. Bridwell KH, Lewis SJ, Lenke LG, Baldus C, Blanke K. Pedicle subtraction osteotomy for the treatment of fixed sagittal imbalance. J Bone Joint Surg Am. 2003;85(3):454-463.
3. Berven SH, Deviren V, Smith JA, Emami A, Hu SS, Bradford DS. Management of fixed sagittal plane deformity: results of the transpedicular wedge resection osteotomy. Spine. 2001;26(18):2036-2043.
4. Bridwell KH, Lewis SJ, Rinella A, Lenke LG, Baldus C, Blanke K. Pedicle subtraction osteotomy for the treatment of fixed sagittal imbalance. Surgical technique. J Bone Joint Surg Am. 2004;86(suppl 1):44-50.
5. Wang MY, Berven SH. Lumbar pedicle subtraction osteotomy. Neurosurgery. 2007;60(2 suppl 1):ONS140-ONS146.
6. Bridwell KH, Lewis SJ, Edwards C, et al. Complications and outcomes of pedicle subtraction osteotomies for fixed sagittal imbalance. Spine. 2003;28(18):2093-2101.
7. Vialle R, Levassor N, Rillardon L, Templier A, Skalli W, Guigui P. Radiographic analysis of the sagittal alignment and balance of the spine in asymptomatic subjects. J Bone Joint Surg Am. 2005;87(2):260-267.
8. Schwab F, Lafage V, Patel A, Farcy JP. Sagittal plane considerations and the pelvis in the adult patient. Spine. 2009;34(17):1828-1833.
Leg-Length Discrepancy After Total Hip Arthroplasty: Comparison of Robot-Assisted Posterior, Fluoroscopy-Guided Anterior, and Conventional Posterior Approaches
Total hip arthroplasty (THA) effectively provides adequate pain relief and favorable outcomes in patients with hip osteoarthritis (OA). However, leg-length discrepancy (LLD) is still a significant cause of morbidity,1 including nerve damage,2,3 low back pain,2,4,5 and abnormal gait.2,6,7 Although most of the LLD values reported in the literature fall under the acceptable threshold of 10 mm,8 some patients report dissatisfaction,9 leading to litigation against orthopedic surgeons.2 However, lower extremity lengthening is sometimes needed to achieve adequate hip joint stability and prevent dislocations.2,10
Several methods have been developed to help surgeons estimate the change in leg length during surgery in an attempt to improve clinical outcomes. Use of guide pins as a reference on the pelvis decreased LLD and improved outcomes in some published studies.11,12 Preoperative templating of implant size, cup position, and level of femoral neck cut is very important in helping minimize clinically significant LLD after THA.2,13,14 Computer-assisted THA has also been introduced to try to improve component positioning, restoration of hip center of rotation, and minimizing of LLD.15-17 However, cost and increased operative time have prevented widespread adoption of computer-assisted surgery in THA.
Proponents of different surgical approaches have argued about the superiority of one approach over another. The posterior approach is the gold standard in THA because it is safe, easy to perform, and, if needed, extensile.11 However, exact determination of the intraoperative 3-dimensional (3-D) orientation of the pelvis, and subsequently of LLD, is challenging when the patient lies in the lateral position. The anterior approach has gained in popularity because of its advantages in accelerating postoperative rehabilitation and decreasing hospital length of stay.18 Placing the patient supine is advantageous because it allows leveling of the pelvis and estimation of LLD (by comparing the positions of the lower extremities).19 The anterior approach also allows for radiographic measurements on the operating table.19,20 However, this approach has a high learning curve21 and is not extensile.21 To date, no study has shown superiority of the anterior approach over either the conventional posterior approach or the robot-assisted posterior approach in minimizing LLD after THA.
We conducted a study to compare LLD in patients who underwent THA performed with a robot-assisted posterior approach (RTHA), a fluoroscopy-guided anterior approach (ATHA), or a conventional posterior approach (PTHA). We hypothesized that, compared with PTHA, both RTHA and ATHA would result in reduced LLD.
Materials and Methods
We reviewed all RTHAs, ATHAs, and PTHAs performed by Dr. Domb between September 2008 and December 2012. Study inclusion criteria were a diagnosis of hip OA and the availability of postoperative supine anteroposterior pelvis radiographs. Exclusion criteria were a diagnosis other than hip OA, missing or improper postoperative radiographs (radiographs with rotated or tilted pelvis),22 and radiographs on which at least one of the lesser trochanters was difficult to define. Of the 155 cases included in the study, 67 were RTHAs, 29 were ATHAs, and 59 were PTHAs.
All patients scheduled for THA underwent preoperative planning; plain radiographs were used to determine component size and position, level of neck cut, and amount of leg lengthening or shortening needed. In all RTHA cases, computed tomography of the involved hip was performed before surgery. The MAKO system (MAKO Surgical Corporation, Davie, Florida) was used to develop a patient-specific 3-D model of the pelvis and proximal femur, and this model was used to guide THA execution. The system was then used to detect patient-specific landmarks during surgery, to register the femur and the acetabulum, and to help determine the position of the pelvis and proximal femur during surgery. This system, which uses a haptic robotic arm that guides acetabular reaming and cup placement, provides feedback regarding cup placement, stem version, leg length, and global offset. Pelvic tilt and rotation were accounted for by the MAKO software, and all provided measurements were made on the coronal (functional) plane of the body, as described by Murray.23 ATHA was performed with the patient in the supine position on a Hana table (Mizuho OSI, Union City, California) with fluoroscopic guidance. PTHA was performed in the conventional way, with the patient in the lateral position.
Radiographic measurements of LLD were made with TraumaCad software (Build 2.2.535.0; Voyant Health, Petah-Tikva, Israel). The accuracy of this software has been studied and reported in the literature.24-26 Radiographs were calibrated using the known size of each femoral head as a marker. The reference on the pelvis was the interobturator line (line tangent to inferior border of obturator foramina), and the reference on the femurs was the most superior and medial aspect of each lesser trochanter. Two lines were drawn, each perpendicular to the interobturator line, starting from the previously defined reference point on each lesser trochanter. The difference in length between these 2 lines was recorded as the LLD. Values were recorded relative to the operative extremity. For example, if the operative extremity was longer than the nonoperative extremity, the LLD was given a positive value.
To eliminate bias and increase measurement accuracy, the study had each of 2 observers collect the LLD data twice, 2 months apart. These observers were blinded to each other’s results and to the type of surgery performed. (Neither observer was Dr. Domb, the senior surgeon.) IBM SPSS Statistics software (Version 20; IBM, Armonk, New York) was used for statistical analysis. Each patient’s 4 measurements were averaged into a single number for LLD, and the absolute LLD values were used in all statistical analyses. Means, standard deviations (SDs), and 95% confidence intervals (CIs) were calculated for LLD in each of the 3 groups. Pearson correlation coefficient was used to determine interobserver and intraobserver reliability. One-way analysis of variance (ANOVA) was used to compare group means for age, body mass index (BMI), and LLD. In each group, number of outliers was determined with outliers set at LLDs of more than 3 mm and more than 5 mm. Fischer exact test was used to compare number of outliers in each group. P < .05 was considered statistically significant.
Results
Table 1 lists the demographic data, including age, sex, and BMI, and compares the means. There were strong interobserver and intraobserver correlations for all LLD measurements (r > 0.9; P < .001). Mean (SD) LLD was 2.7 (1.8) mm (95% CI, 2.3-3.2) in the RTHA group, 1.8 (1.6) mm (95% CI, 1.2-2.4) in the ATHA group, and 1.9 (1.6) mm (95% CI, 1.5-2.4) in the PTHA group (P = .01). When LLD of more than 3 mm was set as an outlier, percentage of outliers was 37.3% (RTHA), 17.2% (ATHA), and 22% (PTHA) (P = .06-.78). When LLD of more than 5 mm was set as an outlier, percentage of outliers was 10.4% (RTHA), 6.9% (ATHA), and 8.5% (PTHA) (P = .72 to >.99). No patient in any group had LLD of 10 mm or more (Figure). Table 2 lists percentages of patients’ operated extremities that were longer, shorter, or the same size as their contralateral extremities. Six (9.0%) of the 67 RTHA patients, 4 (13.8%) of the 29 ATHA patients, and 3 (5.1%) of the 59 PTHA patients had a contralateral THA.
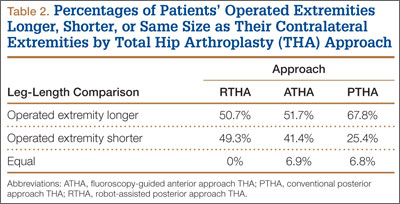
Discussion
Our study results showed that RTHA, ATHA, and PTHA were equally effective in minimizing LLD. There was a statistically significant difference in mean LLD among the 3 groups studied. The RTHA group had the largest mean (SD) LLD: 2.7 (1.8) mm. However, statistically significant differences do not always indicate clinical significance.27 Therefore, comparison of the 3 groups’ means is not enough for drawing significant conclusions. The more important point to consider is the number of cases of LLD of 10 mm or more—a discrepancy that would be perceptible to patients and thus become a source of dissatisfaction with painless THA.28 Patients perceive LLD when shortening exceeds 10 mm and lengthening exceeds 6 mm,29 or when LLD is more than 10 mm.16,19,20 Despite significant differences in means, all our cases came in under the 10-mm threshold. When the threshold was decreased to 5 mm (and to 3 mm), there was no statistically significant difference among the groups in the number of cases above the threshold.
LLD remains a source of significant post-THA comorbidity and patient dissatisfaction.1-7,19 Despite surgeons’ efforts to minimize LLD, some patients can detect even a subtle LLD after surgery.1,8,29 Most LLD values reported in the literature fall under the 10-mm threshold.16,19,20 In some cases, however, postoperative LLD is more than 1 cm, enough to prompt litigation against orthopedic surgeons.2 Surgeons have tried to improve LLD with use of multiple techniques, including use of intraoperative measuring devices,30 patient positioning during surgery,20 use of computer-assisted surgery,19 and use of intraoperative fluoroscopy.20
Proponents of computer-assisted THA have argued that this technique improves accuracy in placing the acetabular cup in the safe zone,31 minimizes LLD, and restores femoral offset.32,33 Manzotti and colleagues16 reported on 48 cases of computer-assisted THA matched to 48 cases of conventional THA using the posterior approach. Mean (SD) LLD was 5.06 (2.99) mm in the computer-assisted group and 7.64 (4.36) mm in the conventional group; there was a statistically significant difference in favor of the computer-assisted group (P = .04). However, 5 patients in the computer-assisted group and 13 in the conventional group had LLD of more than 10 mm, and the difference was statistically significant.16 Moreover, the study population was heterogeneous, with 12 patients in both groups having developmental dysplasia as a primary diagnosis.16 All the cases in our study had a diagnosis of OA, and no case had LLD of 10 mm or more.
Several advantages have been proposed for the anterior approach. The supine position (with direct comparison of leg lengths) and the use of fluoroscopy have been described as advantageous in minimizing LLD.20,21 In their study of 494 primary THAs performed with the anterior approach, Matta and colleagues20 reported mean (SD) postoperative LLD of 3 (2) mm (range, 0-26 mm) and concluded that the anterior approach was effective in restoring leg lengths and ensuring proper cup placement while not increasing the dislocation rate. However, they did not compare this approach with others or with computer-assisted THA with respect to LLD.
In another study, Nam and colleagues19 compared LLD after THA performed with 3 different approaches (anterior, conventional posterior, posterior-navigated) and found no statistically significant difference in LLD among the groups. However, LLD was more than 10 mm in 2.2% of anterior cases, 4.4% of conventional posterior cases, and 4.4% of posterior-navigated cases. When 5 mm was used as a cutoff, percentage of patients who were outliers was 31.1% (anterior), 20% (conventional posterior), and 23.3% (navigated-posterior). Our data showed superior results in using 5 mm as a cutoff, with percentage of outliers of 6.9% with ATHA, 8.5% with PTHA, and 10.4% with RTHA. However, Nam and colleagues19 used a larger patient cohort and different techniques for measuring LLD on anteroposterior pelvis radiographs.
The most likely reason that the groups in our study were comparable in terms of LLD accuracy and lack of outliers over the 10-mm cutoff was Dr. Domb’s high accuracy in minimizing LLD using each of the 3 techniques. For ATHA, mean (SD) LLD was 1.8 (1.6) mm (no LLD of ≥10 mm), better than the 3 (2) mm (0.9% with LLD of >10 mm) reported by Matta and colleagues20 and the 3.8 (3.9) mm (2.2% with LLD of >10 mm) reported by Nam and colleagues.19 For PTHA, mean (SD) LLD was 1.9 (1.6) mm (no LLD of ≥10 mm), comparable to some of the best results reported in the literature—for example, the 1 mm (3% with LLD of >10 mm) reported by Woolson and colleagues.34 For RTHA, mean (SD) LLD was 2.7 (1.8) mm (no LLD of ≥10 mm), superior to the 3.9 (2.7) mm (4.4% with LLD of >10 mm) reported by Nam and colleagues19 for posterior-navigated THA and the 5.06 (2.99) mm (10.4% with LLD of >10 mm) reported by Manzotti and colleagues16 for computer-assisted THA.
This study had several notable strengths. All patients had a diagnosis of hip OA and were operated on by a single surgeon. Radiographs were calibrated using the size of the implanted femoral head. Radiographic data were measured using the same technique in all cases and were collected twice by 2 observers (not the senior surgeon) to decrease bias and determine interobserver and intraobserver reliability. In addition, surgeon experience might have played an important role in minimizing LLD regardless of technique and approach used for THA.
Study limitations were different number of cases in each group, lack of matching, lack of clinical follow-up, and lack of long-term assessment of clinical outcomes and complications.
Conclusion
As performed by an experienced surgeon, RTHA, ATHA, and PTHA did not differ in obtaining minimal LLD. All 3 groups had a low frequency of outliers, using thresholds of 3 mm and 5 mm, and no patient in any group had LLD of 10 mm or more. All 3 techniques are effective in achieving accuracy in LLD.
1. Maloney WJ, Keeney JA. Leg length discrepancy after total hip arthroplasty. J Arthroplasty. 2004;19(4 suppl 1):108-110.
2. Clark CR, Huddleston HD, Schoch EP 3rd, Thomas BJ. Leg-length discrepancy after total hip arthroplasty. J Am Acad Orthop Surg. 2006;14(1):38-45.
3. Edwards BN, Tullos HS, Noble PC. Contributory factors and etiology of sciatic nerve palsy in total hip arthroplasty. Clin Orthop. 1987;(218):136-141.
4. Giles LG, Taylor JR. Low-back pain associated with leg length inequality. Spine. 1981;6(5):510-521.
5. Parvizi J, Sharkey PF, Bissett GA, Rothman RH, Hozack WJ. Surgical treatment of limb-length discrepancy following total hip arthroplasty. J Bone Joint Surg Am. 2003;85(12):2310-2317.
6. Edeen J, Sharkey PF, Alexander AH. Clinical significance of leg-length inequality after total hip arthroplasty. Am J Orthop. 1995;24(4):347-351.
7. Gurney B, Mermier C, Robergs R, Gibson A, Rivero D. Effects of limb-length discrepancy on gait economy and lower-extremity muscle activity in older adults. J Bone Joint Surg Am. 2001;83(6):907-915.
8. O’Brien S, Kernohan G, Fitzpatrick C, Hill J, Beverland D. Perception of imposed leg length inequality in normal subjects. Hip Int. 2010;20(4):505-511.
9. Hofmann AA, Skrzynski MC. Leg-length inequality and nerve palsy in total hip arthroplasty: a lawyer awaits! Orthopedics. 2000;23(9):943-944.
10. Miyamoto RG, Kaplan KM, Levine BR, Egol KA, Zuckerman JD. Surgical management of hip fractures: an evidence-based review of the literature. I: femoral neck fractures. J Am Acad Orthop Surg. 2008;16(10):596-607.
11. Ranawat CS, Rao RR, Rodriguez JA, Bhende HS. Correction of limb-length inequality during total hip arthroplasty. J Arthroplasty. 2001;16(6):715-720.
12. McGee HM, Scott JH. A simple method of obtaining equal leg length in total hip arthroplasty. Clin Orthop. 1985;(194):269-270.
13. Della Valle AG, Padgett DE, Salvati EA. Preoperative planning for primary total hip arthroplasty. J Am Acad Orthop Surg. 2005;13(7):455-462.
14. Gonzalez Della Valle A, Slullitel G, Piccaluga F, Salvati EA. The precision and usefulness of preoperative planning for cemented and hybrid primary total hip arthroplasty. J Arthroplasty. 2005;20(1):51-58.
15. Confalonieri N, Manzotti A, Montironi F, Pullen C. Leg length discrepancy, dislocation rate, and offset in total hip replacement using a short modular stem: navigation vs conventional freehand. Orthopedics. 2008;31(10 suppl 1).
16. Manzotti A, Cerveri P, De Momi E, Pullen C, Confalonieri N. Does computer-assisted surgery benefit leg length restoration in total hip replacement? Navigation versus conventional freehand. Int Orthop. 2011;35(1):19-24.
17. Nishio S, Fukunishi S, Fukui T, Fujihara Y, Yoshiya S. Adjustment of leg length using imageless navigation THA software without a femoral tracker. J Orthop Sci. 2011;16(2):171-176.
18. Martin CT, Pugely AJ, Gao Y, Clark CR. A comparison of hospital length of stay and short-term morbidity between the anterior and the posterior approaches to total hip arthroplasty. J Arthroplasty. 2013;28(5):849-854.
19. Nam D, Sculco PK, Abdel MP, Alexiades MM, Figgie MP, Mayman DJ. Leg-length inequalities following THA based on surgical technique. Orthopedics. 2013;36(4):e395-e400.
20. Matta JM, Shahrdar C, Ferguson T. Single-incision anterior approach for total hip arthroplasty on an orthopaedic table. Clin Orthop. 2005;(441):115-124.
21. Yi C, Agudelo JF, Dayton MR, Morgan SJ. Early complications of anterior supine intermuscular total hip arthroplasty. Orthopedics. 2013;36(3):e276-e281.
22. Siebenrock KA, Kalbermatten DF, Ganz R. Effect of pelvic tilt on acetabular retroversion: a study of pelves from cadavers. Clin Orthop. 2003;(407):241-248.
23. Murray DW. The definition and measurement of acetabular orientation. J Bone Joint Surg Br. 1993;75(2):228-232.
24. Kumar PG, Kirmani SJ, Humberg H, Kavarthapu V, Li P. Reproducibility and accuracy of templating uncemented THA with digital radiographic and digital TraumaCad templating software. Orthopedics. 2009;32(11):815.
25. Steinberg EL, Shasha N, Menahem A, Dekel S. Preoperative planning of total hip replacement using the TraumaCad system. Arch Orthop Trauma Surg. 2010;130(12):1429-1432.
26. Westacott DJ, McArthur J, King RJ, Foguet P. Assessment of cup orientation in hip resurfacing: a comparison of TraumaCad and computed tomography. J Orthop Surg Res. 2013;8:8.
27. Copay AG, Subach BR, Glassman SD, Polly DW Jr, Schuler TC. Understanding the minimum clinically important difference: a review of concepts and methods. Spine J. 2007;7(5):541-546.
28. Abraham WD, Dimon JH 3rd. Leg length discrepancy in total hip arthroplasty. Orthop Clin North Am. 1992;23(2):201-209.
29. Konyves A, Bannister GC. The importance of leg length discrepancy after total hip arthroplasty. J Bone Joint Surg Br. 2005;87(2):155-157.
30. Matsuda K, Nakamura S, Matsushita T. A simple method to minimize limb-length discrepancy after hip arthroplasty. Acta Orthop. 2006;77(3):375-379.
31. Haaker RG, Tiedjen K, Ottersbach A, Rubenthaler F, Stockheim M, Stiehl JB. Comparison of conventional versus computer-navigated acetabular component insertion. J Arthroplasty. 2007;22(2):151-159.
32. Renkawitz T, Schuster T, Herold T, et al. Measuring leg length and offset with an imageless navigation system during total hip arthroplasty: is it really accurate? Int J Med Robot. 2009;5(2):192-197.
33. Nakamura N, Sugano N, Nishii T, Kakimoto A, Miki H. A comparison between robotic-assisted and manual implantation of cementless total hip arthroplasty. Clin Orthop. 2010;468(4):1072-1081.
34. Woolson ST, Hartford JM, Sawyer A. Results of a method of leg-length equalization for patients undergoing primary total hip replacement. J Arthroplasty. 1999;14(2):159-164.
Total hip arthroplasty (THA) effectively provides adequate pain relief and favorable outcomes in patients with hip osteoarthritis (OA). However, leg-length discrepancy (LLD) is still a significant cause of morbidity,1 including nerve damage,2,3 low back pain,2,4,5 and abnormal gait.2,6,7 Although most of the LLD values reported in the literature fall under the acceptable threshold of 10 mm,8 some patients report dissatisfaction,9 leading to litigation against orthopedic surgeons.2 However, lower extremity lengthening is sometimes needed to achieve adequate hip joint stability and prevent dislocations.2,10
Several methods have been developed to help surgeons estimate the change in leg length during surgery in an attempt to improve clinical outcomes. Use of guide pins as a reference on the pelvis decreased LLD and improved outcomes in some published studies.11,12 Preoperative templating of implant size, cup position, and level of femoral neck cut is very important in helping minimize clinically significant LLD after THA.2,13,14 Computer-assisted THA has also been introduced to try to improve component positioning, restoration of hip center of rotation, and minimizing of LLD.15-17 However, cost and increased operative time have prevented widespread adoption of computer-assisted surgery in THA.
Proponents of different surgical approaches have argued about the superiority of one approach over another. The posterior approach is the gold standard in THA because it is safe, easy to perform, and, if needed, extensile.11 However, exact determination of the intraoperative 3-dimensional (3-D) orientation of the pelvis, and subsequently of LLD, is challenging when the patient lies in the lateral position. The anterior approach has gained in popularity because of its advantages in accelerating postoperative rehabilitation and decreasing hospital length of stay.18 Placing the patient supine is advantageous because it allows leveling of the pelvis and estimation of LLD (by comparing the positions of the lower extremities).19 The anterior approach also allows for radiographic measurements on the operating table.19,20 However, this approach has a high learning curve21 and is not extensile.21 To date, no study has shown superiority of the anterior approach over either the conventional posterior approach or the robot-assisted posterior approach in minimizing LLD after THA.
We conducted a study to compare LLD in patients who underwent THA performed with a robot-assisted posterior approach (RTHA), a fluoroscopy-guided anterior approach (ATHA), or a conventional posterior approach (PTHA). We hypothesized that, compared with PTHA, both RTHA and ATHA would result in reduced LLD.
Materials and Methods
We reviewed all RTHAs, ATHAs, and PTHAs performed by Dr. Domb between September 2008 and December 2012. Study inclusion criteria were a diagnosis of hip OA and the availability of postoperative supine anteroposterior pelvis radiographs. Exclusion criteria were a diagnosis other than hip OA, missing or improper postoperative radiographs (radiographs with rotated or tilted pelvis),22 and radiographs on which at least one of the lesser trochanters was difficult to define. Of the 155 cases included in the study, 67 were RTHAs, 29 were ATHAs, and 59 were PTHAs.
All patients scheduled for THA underwent preoperative planning; plain radiographs were used to determine component size and position, level of neck cut, and amount of leg lengthening or shortening needed. In all RTHA cases, computed tomography of the involved hip was performed before surgery. The MAKO system (MAKO Surgical Corporation, Davie, Florida) was used to develop a patient-specific 3-D model of the pelvis and proximal femur, and this model was used to guide THA execution. The system was then used to detect patient-specific landmarks during surgery, to register the femur and the acetabulum, and to help determine the position of the pelvis and proximal femur during surgery. This system, which uses a haptic robotic arm that guides acetabular reaming and cup placement, provides feedback regarding cup placement, stem version, leg length, and global offset. Pelvic tilt and rotation were accounted for by the MAKO software, and all provided measurements were made on the coronal (functional) plane of the body, as described by Murray.23 ATHA was performed with the patient in the supine position on a Hana table (Mizuho OSI, Union City, California) with fluoroscopic guidance. PTHA was performed in the conventional way, with the patient in the lateral position.
Radiographic measurements of LLD were made with TraumaCad software (Build 2.2.535.0; Voyant Health, Petah-Tikva, Israel). The accuracy of this software has been studied and reported in the literature.24-26 Radiographs were calibrated using the known size of each femoral head as a marker. The reference on the pelvis was the interobturator line (line tangent to inferior border of obturator foramina), and the reference on the femurs was the most superior and medial aspect of each lesser trochanter. Two lines were drawn, each perpendicular to the interobturator line, starting from the previously defined reference point on each lesser trochanter. The difference in length between these 2 lines was recorded as the LLD. Values were recorded relative to the operative extremity. For example, if the operative extremity was longer than the nonoperative extremity, the LLD was given a positive value.
To eliminate bias and increase measurement accuracy, the study had each of 2 observers collect the LLD data twice, 2 months apart. These observers were blinded to each other’s results and to the type of surgery performed. (Neither observer was Dr. Domb, the senior surgeon.) IBM SPSS Statistics software (Version 20; IBM, Armonk, New York) was used for statistical analysis. Each patient’s 4 measurements were averaged into a single number for LLD, and the absolute LLD values were used in all statistical analyses. Means, standard deviations (SDs), and 95% confidence intervals (CIs) were calculated for LLD in each of the 3 groups. Pearson correlation coefficient was used to determine interobserver and intraobserver reliability. One-way analysis of variance (ANOVA) was used to compare group means for age, body mass index (BMI), and LLD. In each group, number of outliers was determined with outliers set at LLDs of more than 3 mm and more than 5 mm. Fischer exact test was used to compare number of outliers in each group. P < .05 was considered statistically significant.
Results
Table 1 lists the demographic data, including age, sex, and BMI, and compares the means. There were strong interobserver and intraobserver correlations for all LLD measurements (r > 0.9; P < .001). Mean (SD) LLD was 2.7 (1.8) mm (95% CI, 2.3-3.2) in the RTHA group, 1.8 (1.6) mm (95% CI, 1.2-2.4) in the ATHA group, and 1.9 (1.6) mm (95% CI, 1.5-2.4) in the PTHA group (P = .01). When LLD of more than 3 mm was set as an outlier, percentage of outliers was 37.3% (RTHA), 17.2% (ATHA), and 22% (PTHA) (P = .06-.78). When LLD of more than 5 mm was set as an outlier, percentage of outliers was 10.4% (RTHA), 6.9% (ATHA), and 8.5% (PTHA) (P = .72 to >.99). No patient in any group had LLD of 10 mm or more (Figure). Table 2 lists percentages of patients’ operated extremities that were longer, shorter, or the same size as their contralateral extremities. Six (9.0%) of the 67 RTHA patients, 4 (13.8%) of the 29 ATHA patients, and 3 (5.1%) of the 59 PTHA patients had a contralateral THA.
Discussion
Our study results showed that RTHA, ATHA, and PTHA were equally effective in minimizing LLD. There was a statistically significant difference in mean LLD among the 3 groups studied. The RTHA group had the largest mean (SD) LLD: 2.7 (1.8) mm. However, statistically significant differences do not always indicate clinical significance.27 Therefore, comparison of the 3 groups’ means is not enough for drawing significant conclusions. The more important point to consider is the number of cases of LLD of 10 mm or more—a discrepancy that would be perceptible to patients and thus become a source of dissatisfaction with painless THA.28 Patients perceive LLD when shortening exceeds 10 mm and lengthening exceeds 6 mm,29 or when LLD is more than 10 mm.16,19,20 Despite significant differences in means, all our cases came in under the 10-mm threshold. When the threshold was decreased to 5 mm (and to 3 mm), there was no statistically significant difference among the groups in the number of cases above the threshold.
LLD remains a source of significant post-THA comorbidity and patient dissatisfaction.1-7,19 Despite surgeons’ efforts to minimize LLD, some patients can detect even a subtle LLD after surgery.1,8,29 Most LLD values reported in the literature fall under the 10-mm threshold.16,19,20 In some cases, however, postoperative LLD is more than 1 cm, enough to prompt litigation against orthopedic surgeons.2 Surgeons have tried to improve LLD with use of multiple techniques, including use of intraoperative measuring devices,30 patient positioning during surgery,20 use of computer-assisted surgery,19 and use of intraoperative fluoroscopy.20
Proponents of computer-assisted THA have argued that this technique improves accuracy in placing the acetabular cup in the safe zone,31 minimizes LLD, and restores femoral offset.32,33 Manzotti and colleagues16 reported on 48 cases of computer-assisted THA matched to 48 cases of conventional THA using the posterior approach. Mean (SD) LLD was 5.06 (2.99) mm in the computer-assisted group and 7.64 (4.36) mm in the conventional group; there was a statistically significant difference in favor of the computer-assisted group (P = .04). However, 5 patients in the computer-assisted group and 13 in the conventional group had LLD of more than 10 mm, and the difference was statistically significant.16 Moreover, the study population was heterogeneous, with 12 patients in both groups having developmental dysplasia as a primary diagnosis.16 All the cases in our study had a diagnosis of OA, and no case had LLD of 10 mm or more.
Several advantages have been proposed for the anterior approach. The supine position (with direct comparison of leg lengths) and the use of fluoroscopy have been described as advantageous in minimizing LLD.20,21 In their study of 494 primary THAs performed with the anterior approach, Matta and colleagues20 reported mean (SD) postoperative LLD of 3 (2) mm (range, 0-26 mm) and concluded that the anterior approach was effective in restoring leg lengths and ensuring proper cup placement while not increasing the dislocation rate. However, they did not compare this approach with others or with computer-assisted THA with respect to LLD.
In another study, Nam and colleagues19 compared LLD after THA performed with 3 different approaches (anterior, conventional posterior, posterior-navigated) and found no statistically significant difference in LLD among the groups. However, LLD was more than 10 mm in 2.2% of anterior cases, 4.4% of conventional posterior cases, and 4.4% of posterior-navigated cases. When 5 mm was used as a cutoff, percentage of patients who were outliers was 31.1% (anterior), 20% (conventional posterior), and 23.3% (navigated-posterior). Our data showed superior results in using 5 mm as a cutoff, with percentage of outliers of 6.9% with ATHA, 8.5% with PTHA, and 10.4% with RTHA. However, Nam and colleagues19 used a larger patient cohort and different techniques for measuring LLD on anteroposterior pelvis radiographs.
The most likely reason that the groups in our study were comparable in terms of LLD accuracy and lack of outliers over the 10-mm cutoff was Dr. Domb’s high accuracy in minimizing LLD using each of the 3 techniques. For ATHA, mean (SD) LLD was 1.8 (1.6) mm (no LLD of ≥10 mm), better than the 3 (2) mm (0.9% with LLD of >10 mm) reported by Matta and colleagues20 and the 3.8 (3.9) mm (2.2% with LLD of >10 mm) reported by Nam and colleagues.19 For PTHA, mean (SD) LLD was 1.9 (1.6) mm (no LLD of ≥10 mm), comparable to some of the best results reported in the literature—for example, the 1 mm (3% with LLD of >10 mm) reported by Woolson and colleagues.34 For RTHA, mean (SD) LLD was 2.7 (1.8) mm (no LLD of ≥10 mm), superior to the 3.9 (2.7) mm (4.4% with LLD of >10 mm) reported by Nam and colleagues19 for posterior-navigated THA and the 5.06 (2.99) mm (10.4% with LLD of >10 mm) reported by Manzotti and colleagues16 for computer-assisted THA.
This study had several notable strengths. All patients had a diagnosis of hip OA and were operated on by a single surgeon. Radiographs were calibrated using the size of the implanted femoral head. Radiographic data were measured using the same technique in all cases and were collected twice by 2 observers (not the senior surgeon) to decrease bias and determine interobserver and intraobserver reliability. In addition, surgeon experience might have played an important role in minimizing LLD regardless of technique and approach used for THA.
Study limitations were different number of cases in each group, lack of matching, lack of clinical follow-up, and lack of long-term assessment of clinical outcomes and complications.
Conclusion
As performed by an experienced surgeon, RTHA, ATHA, and PTHA did not differ in obtaining minimal LLD. All 3 groups had a low frequency of outliers, using thresholds of 3 mm and 5 mm, and no patient in any group had LLD of 10 mm or more. All 3 techniques are effective in achieving accuracy in LLD.
1. Maloney WJ, Keeney JA. Leg length discrepancy after total hip arthroplasty. J Arthroplasty. 2004;19(4 suppl 1):108-110.
2. Clark CR, Huddleston HD, Schoch EP 3rd, Thomas BJ. Leg-length discrepancy after total hip arthroplasty. J Am Acad Orthop Surg. 2006;14(1):38-45.
3. Edwards BN, Tullos HS, Noble PC. Contributory factors and etiology of sciatic nerve palsy in total hip arthroplasty. Clin Orthop. 1987;(218):136-141.
4. Giles LG, Taylor JR. Low-back pain associated with leg length inequality. Spine. 1981;6(5):510-521.
5. Parvizi J, Sharkey PF, Bissett GA, Rothman RH, Hozack WJ. Surgical treatment of limb-length discrepancy following total hip arthroplasty. J Bone Joint Surg Am. 2003;85(12):2310-2317.
6. Edeen J, Sharkey PF, Alexander AH. Clinical significance of leg-length inequality after total hip arthroplasty. Am J Orthop. 1995;24(4):347-351.
7. Gurney B, Mermier C, Robergs R, Gibson A, Rivero D. Effects of limb-length discrepancy on gait economy and lower-extremity muscle activity in older adults. J Bone Joint Surg Am. 2001;83(6):907-915.
8. O’Brien S, Kernohan G, Fitzpatrick C, Hill J, Beverland D. Perception of imposed leg length inequality in normal subjects. Hip Int. 2010;20(4):505-511.
9. Hofmann AA, Skrzynski MC. Leg-length inequality and nerve palsy in total hip arthroplasty: a lawyer awaits! Orthopedics. 2000;23(9):943-944.
10. Miyamoto RG, Kaplan KM, Levine BR, Egol KA, Zuckerman JD. Surgical management of hip fractures: an evidence-based review of the literature. I: femoral neck fractures. J Am Acad Orthop Surg. 2008;16(10):596-607.
11. Ranawat CS, Rao RR, Rodriguez JA, Bhende HS. Correction of limb-length inequality during total hip arthroplasty. J Arthroplasty. 2001;16(6):715-720.
12. McGee HM, Scott JH. A simple method of obtaining equal leg length in total hip arthroplasty. Clin Orthop. 1985;(194):269-270.
13. Della Valle AG, Padgett DE, Salvati EA. Preoperative planning for primary total hip arthroplasty. J Am Acad Orthop Surg. 2005;13(7):455-462.
14. Gonzalez Della Valle A, Slullitel G, Piccaluga F, Salvati EA. The precision and usefulness of preoperative planning for cemented and hybrid primary total hip arthroplasty. J Arthroplasty. 2005;20(1):51-58.
15. Confalonieri N, Manzotti A, Montironi F, Pullen C. Leg length discrepancy, dislocation rate, and offset in total hip replacement using a short modular stem: navigation vs conventional freehand. Orthopedics. 2008;31(10 suppl 1).
16. Manzotti A, Cerveri P, De Momi E, Pullen C, Confalonieri N. Does computer-assisted surgery benefit leg length restoration in total hip replacement? Navigation versus conventional freehand. Int Orthop. 2011;35(1):19-24.
17. Nishio S, Fukunishi S, Fukui T, Fujihara Y, Yoshiya S. Adjustment of leg length using imageless navigation THA software without a femoral tracker. J Orthop Sci. 2011;16(2):171-176.
18. Martin CT, Pugely AJ, Gao Y, Clark CR. A comparison of hospital length of stay and short-term morbidity between the anterior and the posterior approaches to total hip arthroplasty. J Arthroplasty. 2013;28(5):849-854.
19. Nam D, Sculco PK, Abdel MP, Alexiades MM, Figgie MP, Mayman DJ. Leg-length inequalities following THA based on surgical technique. Orthopedics. 2013;36(4):e395-e400.
20. Matta JM, Shahrdar C, Ferguson T. Single-incision anterior approach for total hip arthroplasty on an orthopaedic table. Clin Orthop. 2005;(441):115-124.
21. Yi C, Agudelo JF, Dayton MR, Morgan SJ. Early complications of anterior supine intermuscular total hip arthroplasty. Orthopedics. 2013;36(3):e276-e281.
22. Siebenrock KA, Kalbermatten DF, Ganz R. Effect of pelvic tilt on acetabular retroversion: a study of pelves from cadavers. Clin Orthop. 2003;(407):241-248.
23. Murray DW. The definition and measurement of acetabular orientation. J Bone Joint Surg Br. 1993;75(2):228-232.
24. Kumar PG, Kirmani SJ, Humberg H, Kavarthapu V, Li P. Reproducibility and accuracy of templating uncemented THA with digital radiographic and digital TraumaCad templating software. Orthopedics. 2009;32(11):815.
25. Steinberg EL, Shasha N, Menahem A, Dekel S. Preoperative planning of total hip replacement using the TraumaCad system. Arch Orthop Trauma Surg. 2010;130(12):1429-1432.
26. Westacott DJ, McArthur J, King RJ, Foguet P. Assessment of cup orientation in hip resurfacing: a comparison of TraumaCad and computed tomography. J Orthop Surg Res. 2013;8:8.
27. Copay AG, Subach BR, Glassman SD, Polly DW Jr, Schuler TC. Understanding the minimum clinically important difference: a review of concepts and methods. Spine J. 2007;7(5):541-546.
28. Abraham WD, Dimon JH 3rd. Leg length discrepancy in total hip arthroplasty. Orthop Clin North Am. 1992;23(2):201-209.
29. Konyves A, Bannister GC. The importance of leg length discrepancy after total hip arthroplasty. J Bone Joint Surg Br. 2005;87(2):155-157.
30. Matsuda K, Nakamura S, Matsushita T. A simple method to minimize limb-length discrepancy after hip arthroplasty. Acta Orthop. 2006;77(3):375-379.
31. Haaker RG, Tiedjen K, Ottersbach A, Rubenthaler F, Stockheim M, Stiehl JB. Comparison of conventional versus computer-navigated acetabular component insertion. J Arthroplasty. 2007;22(2):151-159.
32. Renkawitz T, Schuster T, Herold T, et al. Measuring leg length and offset with an imageless navigation system during total hip arthroplasty: is it really accurate? Int J Med Robot. 2009;5(2):192-197.
33. Nakamura N, Sugano N, Nishii T, Kakimoto A, Miki H. A comparison between robotic-assisted and manual implantation of cementless total hip arthroplasty. Clin Orthop. 2010;468(4):1072-1081.
34. Woolson ST, Hartford JM, Sawyer A. Results of a method of leg-length equalization for patients undergoing primary total hip replacement. J Arthroplasty. 1999;14(2):159-164.
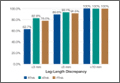
Computer Navigation and Robotics for Total Knee Arthroplasty
Total knee arthroplasty (TKA) is a good surgical option to relieve pain and improve function in patients with osteoarthritis. The goal of surgery is to achieve a well-aligned prosthesis with well-balanced ligaments in order to minimize wear and improve implant survival. Overall, 82% to 89% of patients are satisfied with their outcomes after TKA, with good 10- to 15-year implant survivorship; however, there is still a subset of patients that are unsatisfied. In many cases, patient dissatisfaction is attributed to improper component alignment.1-3 Over the past decade, computer navigation and robotics have been introduced to control surgical variables so as to gain greater consistency in implant placement and postoperative component alignment.
Computer-assisted navigation tools were introduced not only to improve implant alignment but, more importantly, to optimize clinical outcomes. Most studies have demonstrated that the use of navigation is associated with fewer radiographic outliers after TKA.4 Various studies have compared radiographic results of navigated TKA with results of TKA using standard instrumentation.4-7 While long-term studies are necessary, short-term follow-up has shown that computer-assisted TKA can improve alignment, especially in patients with severe deformity.8-10 Currently, there is no definitive consensus that computer-assisted TKA leads to significantly better component alignment or postoperative outcomes due to the fact that many studies are limited by study design or small cohorts. However, the currently published articles support better component alignment and clinical outcomes with computer-assisted TKA. While some argue that the use of computer-assisted surgery is dependent on the user’s experience, computer-assisted surgery can assist less-experienced surgeons to reliably achieve good midterm outcomes with a low complication rate.8,11 Various studies have looked at computer-assisted TKA at midterm follow-up, with no significant differences in clinical outcome between navigated and traditional techniques. However, long-term studies showing the benefits of computer navigation are beginning to emerge. For example, de Steiger and colleagues12 recently found that computer-assisted TKA reduced the overall revision rate for loosening after TKA in patients less than 65 years of age.
While surgical navigation helps improve implant planning, robotic tools have emerged as a tool to help refine surgical execution. Coupled with surgical navigation tools, robotic control of surgical gestures may further enhance precision in implant placement and/or enable novel implant design features. At present, robotic techniques are increasingly used in unicompartmental knee arthroplasty (UKA) and TKA.13 Studies have demonstrated that the robotic tool is 3 times more accurate with 3 times less variability than conventional techniques in UKA.14 The utility of robotic tools for TKA remains unclear. Robotic-driven automatic cutting guides have been shown to reduce time and improve accuracy compared with navigation guides in femoral TKA cutting procedures in a cadaveric model.15 However, robotic-enabled TKA procedures are poorly described at present, and the clinical implications of their proposed improved precision remain unclear.
Computer navigation and robotic tools in TKA hold the promise of enhanced control of surgical variables that influence clinical outcome. The variables that may be impacted by these advanced tools include implant positioning, lower limb alignment, soft-tissue balance, and, potentially, implant design and fixation. At present, these tools have primarily been shown to improve lower limb alignment in TKA. The clinical impact of the enhanced control of this single surgical variable (lower limb alignment) has been muted in short-term and midterm studies. Future studies should be directed at understanding which surgical variable, or combination of variables, it is most essential to precisely control so as to positively impact clinical outcomes. ◾
1. Bourne RB, Chesworth BM, Davis AM, Mahomed NN, Charron KD. Patient satisfaction after total knee arthroplasty: who is satisfied and who is not? Clin Orthop Relat Res. 2010;468(1):57-63.
2. Sharkey PF, Hozack WJ, Rothman RH, Shastri S, Jacoby SM. Insall Award paper. Why are total knee arthroplasties failing today? Clin Orthop Relat Res. 2002;(404):7-13.
3. Emmerson KP, Morgan CG, Pinder IM. Survivorship analysis of the Kinematic Stabilizer total knee replacement: a 10- to 14-year follow-up. J Bone Joint Surg Br. 1996;78(3):441-445.
4. Liow MH, Xia Z, Wong MK, Tay KJ, Yeo SJ, Chin PL. Robot-assisted total knee arthroplasty accurately restores the joint line and mechanical axis. A prospective randomized study. J Arthroplasty. 2014;29(12):2373-2377.
5. Sparmann M, Wolke B, Czupalla H, Banzer D, Zink A. Positioning of total knee arthroplasty with and without navigation support. A prospective, randomized study. J Bone Joint Surg Br. 2003;85(6):830-835.
6. Hoffart HE, Langenstein E, Vasak N. A prospective study comparing the functional outcome of computer-assisted and conventional total knee replacement. J Bone Joint Surg Br. 2012;94(2):194-199.
7. Cip J, Widemschek M, Luegmair M, Sheinkop MB, Benesch T, Martin A. Conventional versus computer-assisted technique for total knee arthroplasty: a minimum of 5-year follow-up of 200 patients in a prospective randomized comparative trial. J Arthroplasty. 2014;29(9):1795-1802.
8. Huang TW, Peng KT, Huang KC, Lee MS, Hsu RW. Differences in component and limb alignment between computer-assisted and conventional surgery total knee arthroplasty. Knee Surg Sports Traumatol Arthrosc. 2014;22(12):2954-2961.
9. Lee CY, Lin SJ, Kuo LT, et al. The benefits of computer-assisted total knee arthroplasty on coronal alignment with marked femoral bowing in Asian patients. J Orthop Surg Res. 2014;9:122.
10. Hernandez-Vaquero D, Noriega-Fernandez A, Fernandez-Carreira JM, Fernandez-Simon JM, Llorens de los Rios J. Computer-assisted surgery improves rotational positioning of the femoral component but not the tibial component in total knee arthroplasty. Knee Surg Sports Traumatol Arthrosc. 2014;22(12):3127-3134.
11. Khakha RS, Chowdhry M, Sivaprakasam M, Kheiran A, Chauhan SK. Radiological and functional outcomes in computer assisted total knee arthroplasty between consultants and trainees - a prospective randomized controlled trial [published online ahead of print March 14, 2015]. J Arthroplasty.
12. de Steiger RN, Liu YL, Graves SE. Computer navigation for total knee arthroplasty reduces revision rate for patients less than sixty-five years of age. J Bone Joint Surg Am. 2015;97(8):635-642.
13. Pearle AD, O’Loughlin PF, Kendoff DO. Robot-assisted unicompartmental knee arthroplasty. J Arthroplasty. 2010;25(2):230-237.
14. Citak M, Suero EM, Citak M, et al. Unicompartmental knee arthroplasty: is robotic technology more accurate than conventional technique? Knee. 2013;20(4):268-271.
15. Koulalis D, O’Loughlin PF, Plaskos C, Kendoff D, Cross MB, Pearle AD. Sequential versus automated cutting guides in computer-assisted total knee arthroplasty. Knee. 2011;18(6):436-442.
Total knee arthroplasty (TKA) is a good surgical option to relieve pain and improve function in patients with osteoarthritis. The goal of surgery is to achieve a well-aligned prosthesis with well-balanced ligaments in order to minimize wear and improve implant survival. Overall, 82% to 89% of patients are satisfied with their outcomes after TKA, with good 10- to 15-year implant survivorship; however, there is still a subset of patients that are unsatisfied. In many cases, patient dissatisfaction is attributed to improper component alignment.1-3 Over the past decade, computer navigation and robotics have been introduced to control surgical variables so as to gain greater consistency in implant placement and postoperative component alignment.
Computer-assisted navigation tools were introduced not only to improve implant alignment but, more importantly, to optimize clinical outcomes. Most studies have demonstrated that the use of navigation is associated with fewer radiographic outliers after TKA.4 Various studies have compared radiographic results of navigated TKA with results of TKA using standard instrumentation.4-7 While long-term studies are necessary, short-term follow-up has shown that computer-assisted TKA can improve alignment, especially in patients with severe deformity.8-10 Currently, there is no definitive consensus that computer-assisted TKA leads to significantly better component alignment or postoperative outcomes due to the fact that many studies are limited by study design or small cohorts. However, the currently published articles support better component alignment and clinical outcomes with computer-assisted TKA. While some argue that the use of computer-assisted surgery is dependent on the user’s experience, computer-assisted surgery can assist less-experienced surgeons to reliably achieve good midterm outcomes with a low complication rate.8,11 Various studies have looked at computer-assisted TKA at midterm follow-up, with no significant differences in clinical outcome between navigated and traditional techniques. However, long-term studies showing the benefits of computer navigation are beginning to emerge. For example, de Steiger and colleagues12 recently found that computer-assisted TKA reduced the overall revision rate for loosening after TKA in patients less than 65 years of age.
While surgical navigation helps improve implant planning, robotic tools have emerged as a tool to help refine surgical execution. Coupled with surgical navigation tools, robotic control of surgical gestures may further enhance precision in implant placement and/or enable novel implant design features. At present, robotic techniques are increasingly used in unicompartmental knee arthroplasty (UKA) and TKA.13 Studies have demonstrated that the robotic tool is 3 times more accurate with 3 times less variability than conventional techniques in UKA.14 The utility of robotic tools for TKA remains unclear. Robotic-driven automatic cutting guides have been shown to reduce time and improve accuracy compared with navigation guides in femoral TKA cutting procedures in a cadaveric model.15 However, robotic-enabled TKA procedures are poorly described at present, and the clinical implications of their proposed improved precision remain unclear.
Computer navigation and robotic tools in TKA hold the promise of enhanced control of surgical variables that influence clinical outcome. The variables that may be impacted by these advanced tools include implant positioning, lower limb alignment, soft-tissue balance, and, potentially, implant design and fixation. At present, these tools have primarily been shown to improve lower limb alignment in TKA. The clinical impact of the enhanced control of this single surgical variable (lower limb alignment) has been muted in short-term and midterm studies. Future studies should be directed at understanding which surgical variable, or combination of variables, it is most essential to precisely control so as to positively impact clinical outcomes. ◾
1. Bourne RB, Chesworth BM, Davis AM, Mahomed NN, Charron KD. Patient satisfaction after total knee arthroplasty: who is satisfied and who is not? Clin Orthop Relat Res. 2010;468(1):57-63.
2. Sharkey PF, Hozack WJ, Rothman RH, Shastri S, Jacoby SM. Insall Award paper. Why are total knee arthroplasties failing today? Clin Orthop Relat Res. 2002;(404):7-13.
3. Emmerson KP, Morgan CG, Pinder IM. Survivorship analysis of the Kinematic Stabilizer total knee replacement: a 10- to 14-year follow-up. J Bone Joint Surg Br. 1996;78(3):441-445.
4. Liow MH, Xia Z, Wong MK, Tay KJ, Yeo SJ, Chin PL. Robot-assisted total knee arthroplasty accurately restores the joint line and mechanical axis. A prospective randomized study. J Arthroplasty. 2014;29(12):2373-2377.
5. Sparmann M, Wolke B, Czupalla H, Banzer D, Zink A. Positioning of total knee arthroplasty with and without navigation support. A prospective, randomized study. J Bone Joint Surg Br. 2003;85(6):830-835.
6. Hoffart HE, Langenstein E, Vasak N. A prospective study comparing the functional outcome of computer-assisted and conventional total knee replacement. J Bone Joint Surg Br. 2012;94(2):194-199.
7. Cip J, Widemschek M, Luegmair M, Sheinkop MB, Benesch T, Martin A. Conventional versus computer-assisted technique for total knee arthroplasty: a minimum of 5-year follow-up of 200 patients in a prospective randomized comparative trial. J Arthroplasty. 2014;29(9):1795-1802.
8. Huang TW, Peng KT, Huang KC, Lee MS, Hsu RW. Differences in component and limb alignment between computer-assisted and conventional surgery total knee arthroplasty. Knee Surg Sports Traumatol Arthrosc. 2014;22(12):2954-2961.
9. Lee CY, Lin SJ, Kuo LT, et al. The benefits of computer-assisted total knee arthroplasty on coronal alignment with marked femoral bowing in Asian patients. J Orthop Surg Res. 2014;9:122.
10. Hernandez-Vaquero D, Noriega-Fernandez A, Fernandez-Carreira JM, Fernandez-Simon JM, Llorens de los Rios J. Computer-assisted surgery improves rotational positioning of the femoral component but not the tibial component in total knee arthroplasty. Knee Surg Sports Traumatol Arthrosc. 2014;22(12):3127-3134.
11. Khakha RS, Chowdhry M, Sivaprakasam M, Kheiran A, Chauhan SK. Radiological and functional outcomes in computer assisted total knee arthroplasty between consultants and trainees - a prospective randomized controlled trial [published online ahead of print March 14, 2015]. J Arthroplasty.
12. de Steiger RN, Liu YL, Graves SE. Computer navigation for total knee arthroplasty reduces revision rate for patients less than sixty-five years of age. J Bone Joint Surg Am. 2015;97(8):635-642.
13. Pearle AD, O’Loughlin PF, Kendoff DO. Robot-assisted unicompartmental knee arthroplasty. J Arthroplasty. 2010;25(2):230-237.
14. Citak M, Suero EM, Citak M, et al. Unicompartmental knee arthroplasty: is robotic technology more accurate than conventional technique? Knee. 2013;20(4):268-271.
15. Koulalis D, O’Loughlin PF, Plaskos C, Kendoff D, Cross MB, Pearle AD. Sequential versus automated cutting guides in computer-assisted total knee arthroplasty. Knee. 2011;18(6):436-442.
Obesity implicated in spinal degeneration
SEATTLE – Heavier individuals are more likely to have degenerative changes of the lumbar spine seen on MRI, according to findings from an analysis of 1,684 patients in the European Genodisc Study.
“BMI [body mass index] is associated with disc herniation and spinal stenosis. It is also associated with disc degeneration, but the coefficient is so small it’s unlikely to be clinically relevant,” lead investigator Dr. Anand Segar reported at the World Congress on Osteoarthritis.
“Age appears to be the most import factor in determining spinal degeneration,” he added. “Interestingly, smoking and work intensity were not associated with any outcomes.”

Although degenerative changes were worse and more prevalent at the lower lumbar levels, the associations of BMI with these changes were actually stronger at the upper three levels, according to Dr. Segar, who is a resident in the Nuffield Department of Orthopaedics, Rheumatology, and Musculoskeletal Sciences at the University of Oxford (England). Thus, “we further add to the thought of an upper spine phenotype, which has been described by other authors, and this needs further investigation,” he maintained.
Session comoderator Dr. Jeffrey N. Katz, professor of orthopedic surgery at Harvard Medical School and codirector of the Brigham Spine Center at Brigham and Women’s Hospital, Boston, asked, “Looking at the upper spine, were you able to exclude the possibility of scoliosis as a reason for transferring load to the upper rather than the lower spine? And in evaluating spinal stenosis and thinking about BMI as your primary predictor, did you make any accommodation for how you dealt with epidural fat in relation to spinal stenosis?”
The investigators did not specifically look at scoliosis, but it was uncommon in the study sample and therefore unlikely to have affected the findings, Dr. Segar replied. Similarly, they did not specifically evaluate epidural fat, “but my understanding from the literature is that epidural fat is not really associated with obesity, ... so I don’t think again it would have changed our results.”
The patients in Genodisc were recruited from tertiary spinal clinics in the United Kingdom, Hungary, Italy, and Slovenia.
They underwent MRI of the lumbar spine, and the scans were evaluated by a musculoskeletal radiologist. Disc degeneration was assessed with the 5-point Pfirrmann grading system, while disc herniation and spinal stenosis were simply scored as present or absent.
On average, the patients studied were 51 years old and had a BMI of 27.2 kg/m2, according to data reported at the meeting, which was sponsored by the Osteoarthritis Research Society International.
Results of multivariate analysis showed that each 5-kg/m2 increase in BMI was associated with a 0.04-unit increase in disc degeneration score, a 19% increase in the odds of disc herniation, and a 24% increase in the odds of spinal stenosis.
For comparison, each 10-year increment in age was associated with a 0.31-unit increase in disc degeneration score, a 30% decrease in the odds of disc herniation, and a more than a doubling of the odds of spinal stenosis.
The impact of BMI on the lumbar spine was greater at the upper three levels, reported Dr. Segar, who disclosed no relevant conflicts of interest. In analyses restricted to those levels, each 5-kg/m2 increase in BMI was associated with a 39% increase in the odds of disc herniation and a 65% increase in the odds of spinal stenosis.
SEATTLE – Heavier individuals are more likely to have degenerative changes of the lumbar spine seen on MRI, according to findings from an analysis of 1,684 patients in the European Genodisc Study.
“BMI [body mass index] is associated with disc herniation and spinal stenosis. It is also associated with disc degeneration, but the coefficient is so small it’s unlikely to be clinically relevant,” lead investigator Dr. Anand Segar reported at the World Congress on Osteoarthritis.
“Age appears to be the most import factor in determining spinal degeneration,” he added. “Interestingly, smoking and work intensity were not associated with any outcomes.”
Although degenerative changes were worse and more prevalent at the lower lumbar levels, the associations of BMI with these changes were actually stronger at the upper three levels, according to Dr. Segar, who is a resident in the Nuffield Department of Orthopaedics, Rheumatology, and Musculoskeletal Sciences at the University of Oxford (England). Thus, “we further add to the thought of an upper spine phenotype, which has been described by other authors, and this needs further investigation,” he maintained.
Session comoderator Dr. Jeffrey N. Katz, professor of orthopedic surgery at Harvard Medical School and codirector of the Brigham Spine Center at Brigham and Women’s Hospital, Boston, asked, “Looking at the upper spine, were you able to exclude the possibility of scoliosis as a reason for transferring load to the upper rather than the lower spine? And in evaluating spinal stenosis and thinking about BMI as your primary predictor, did you make any accommodation for how you dealt with epidural fat in relation to spinal stenosis?”
The investigators did not specifically look at scoliosis, but it was uncommon in the study sample and therefore unlikely to have affected the findings, Dr. Segar replied. Similarly, they did not specifically evaluate epidural fat, “but my understanding from the literature is that epidural fat is not really associated with obesity, ... so I don’t think again it would have changed our results.”
The patients in Genodisc were recruited from tertiary spinal clinics in the United Kingdom, Hungary, Italy, and Slovenia.
They underwent MRI of the lumbar spine, and the scans were evaluated by a musculoskeletal radiologist. Disc degeneration was assessed with the 5-point Pfirrmann grading system, while disc herniation and spinal stenosis were simply scored as present or absent.
On average, the patients studied were 51 years old and had a BMI of 27.2 kg/m2, according to data reported at the meeting, which was sponsored by the Osteoarthritis Research Society International.
Results of multivariate analysis showed that each 5-kg/m2 increase in BMI was associated with a 0.04-unit increase in disc degeneration score, a 19% increase in the odds of disc herniation, and a 24% increase in the odds of spinal stenosis.
For comparison, each 10-year increment in age was associated with a 0.31-unit increase in disc degeneration score, a 30% decrease in the odds of disc herniation, and a more than a doubling of the odds of spinal stenosis.
The impact of BMI on the lumbar spine was greater at the upper three levels, reported Dr. Segar, who disclosed no relevant conflicts of interest. In analyses restricted to those levels, each 5-kg/m2 increase in BMI was associated with a 39% increase in the odds of disc herniation and a 65% increase in the odds of spinal stenosis.
AT OARSI 2015
Key clinical point: Heavier individuals are at increased risk for degenerative changes in the lumbar spine.
Major finding: Each 5-kg/m2 increase in BMI was associated with a 0.04-unit increase in disc degeneration score and with 19% and 24% increases in the odds of disc herniation and spinal stenosis, respectively.
Data source: A cohort study of 1,684 patients recruited from European spine clinics.
Disclosures: Dr. Segar disclosed having no relevant conflicts of interest.
Ultrasound sign could help diagnose giant cell arteritis
MANCHESTER, U.K. – An early halo sign on ultrasound is both diagnostic and prognostic according to the findings of a substudy of the ongoing TABUL trial.
In newly diagnosed giant cell arteritis (GCA), halo on ultrasound was seen in 46% of cases, and its presence correlated significantly with both ischemic symptoms and abnormal physical examination of the temporal arteries.
The finding “supports the early use of the halo as a diagnostic and potentially prognostic marker,” Dr. Raashid Luqmani, professor of rheumatology at the University of Oxford, England, said at the British Society for Rheumatology annual conference.

The halo sign is an abnormal shadow seen around the temporal arteries on ultrasound, Dr. Luqmani explained.
“The value of halo size change over time in individual patients is being investigated as a marker of response to treatment,” he added, noting that the size of the halo decreased rapidly with longer duration of early, high-dose steroid treatment.
The main TABUL (Temporal Artery Biopsy Versus Ultrasound for the Diagnosis of Giant Cell Arteritis) trial is looking at the overall diagnostic performance, accuracy, and cost-effectiveness of ultrasound versus biopsy in patients with newly suspected GCA. A total of 430 patients have been recruited and have undergone a single ultrasound scan of the temporal and axillary arteries followed by temporal artery biopsy within 7 days of commencing steroids.
Clinicians are blinded to the results of the ultrasound scan until 2 weeks after a treatment decision has been made and they intend to start rapid steroid withdrawal. Following this, patients are seen at a 6-month follow-up visit.

The aim of the substudy reported by Dr. Luqmani was to describe the features of the early halo sign in response to steroid therapy and whether it correlated to ischemic symptoms.
A cross-sectional analysis was performed on data from 312 patients to look at the extent of arterial involvement, the maximum thickness of the halo, the duration of steroid treatment when the ultrasound was performed, and what ischemic symptoms were present.
The mean age of the 220 women studied was 72.5 years, and that of the 92 men was 71.2 years.
Most patients had one (30.6%), two (22.2%), or three (13.9%) temporal arterial segments involved, with the remaining third having four or more. Bilateral halos were seen in 30% of patients, temporal or axillary artery halos in 13.5%, and isolated axillary halos in 2.6%.
The fact that 13.5% had both temporal and axillary artery involvement and 2.6% had only isolated axillary halos suggests a role for scanning both the axillary and temporal arteries, Dr. Luqmani suggested.
The likelihood of finding a halo diminished with the duration of steroid therapy, he reported. “Patients who received no steroid therapy had a much bigger halo and it got progressively smaller and significantly less by day 4,” he observed.
“Although there are still some patients who still have a halo at days 5 and 6 of steroid treatment, the likelihood of finding that halo is much, much less,” he added.
Looking at the presence of halo in relation to ischemic symptoms, there did appear to be an association but it was only significant (P < .004) for jaw claudication.
“If you have a patient with newly suspected GCA, you are likely to see a significant halo, but you need to be quick, you need to be seeing that halo within 4 days of starting steroids or evaluating patients who have not had any steroid treatment,” Dr. Luqmani said.
The TABUL study is funded by the U.K. Health Technology Assessment, a program of the National Institute for Health Research,and sponsored by the University of Oxford. Dr. Luqmani had received consulting fees from GlaxoSmithKline, Novartis, Roche, and Pfizer.
MANCHESTER, U.K. – An early halo sign on ultrasound is both diagnostic and prognostic according to the findings of a substudy of the ongoing TABUL trial.
In newly diagnosed giant cell arteritis (GCA), halo on ultrasound was seen in 46% of cases, and its presence correlated significantly with both ischemic symptoms and abnormal physical examination of the temporal arteries.
The finding “supports the early use of the halo as a diagnostic and potentially prognostic marker,” Dr. Raashid Luqmani, professor of rheumatology at the University of Oxford, England, said at the British Society for Rheumatology annual conference.
The halo sign is an abnormal shadow seen around the temporal arteries on ultrasound, Dr. Luqmani explained.
“The value of halo size change over time in individual patients is being investigated as a marker of response to treatment,” he added, noting that the size of the halo decreased rapidly with longer duration of early, high-dose steroid treatment.
The main TABUL (Temporal Artery Biopsy Versus Ultrasound for the Diagnosis of Giant Cell Arteritis) trial is looking at the overall diagnostic performance, accuracy, and cost-effectiveness of ultrasound versus biopsy in patients with newly suspected GCA. A total of 430 patients have been recruited and have undergone a single ultrasound scan of the temporal and axillary arteries followed by temporal artery biopsy within 7 days of commencing steroids.
Clinicians are blinded to the results of the ultrasound scan until 2 weeks after a treatment decision has been made and they intend to start rapid steroid withdrawal. Following this, patients are seen at a 6-month follow-up visit.
The aim of the substudy reported by Dr. Luqmani was to describe the features of the early halo sign in response to steroid therapy and whether it correlated to ischemic symptoms.
A cross-sectional analysis was performed on data from 312 patients to look at the extent of arterial involvement, the maximum thickness of the halo, the duration of steroid treatment when the ultrasound was performed, and what ischemic symptoms were present.
The mean age of the 220 women studied was 72.5 years, and that of the 92 men was 71.2 years.
Most patients had one (30.6%), two (22.2%), or three (13.9%) temporal arterial segments involved, with the remaining third having four or more. Bilateral halos were seen in 30% of patients, temporal or axillary artery halos in 13.5%, and isolated axillary halos in 2.6%.
The fact that 13.5% had both temporal and axillary artery involvement and 2.6% had only isolated axillary halos suggests a role for scanning both the axillary and temporal arteries, Dr. Luqmani suggested.
The likelihood of finding a halo diminished with the duration of steroid therapy, he reported. “Patients who received no steroid therapy had a much bigger halo and it got progressively smaller and significantly less by day 4,” he observed.
“Although there are still some patients who still have a halo at days 5 and 6 of steroid treatment, the likelihood of finding that halo is much, much less,” he added.
Looking at the presence of halo in relation to ischemic symptoms, there did appear to be an association but it was only significant (P < .004) for jaw claudication.
“If you have a patient with newly suspected GCA, you are likely to see a significant halo, but you need to be quick, you need to be seeing that halo within 4 days of starting steroids or evaluating patients who have not had any steroid treatment,” Dr. Luqmani said.
The TABUL study is funded by the U.K. Health Technology Assessment, a program of the National Institute for Health Research,and sponsored by the University of Oxford. Dr. Luqmani had received consulting fees from GlaxoSmithKline, Novartis, Roche, and Pfizer.
AT RHEUMATOLOGY 2015
Key clinical point: The halo sign on ultrasound is a diagnostic and potentially prognostic marker, but its use is limited by the effect of early high-dose steroids from about day 4 onward.
Major finding: Halo on ultrasound was seen in 46% of cases; its presence correlated with both ischemic symptoms and abnormal physical examination of the temporal arteries.
Data source: The TABUL trial, involving 312 patients suspected of giant cell arteritis.
Disclosures: TABUL is funded by the U.K. Health Technology Assessment, a program of the National Institute for Health Research, and sponsored by the University of Oxford. Dr. Luqmani had received consulting fees from GlaxoSmithKline, Novartis, Roche, and Pfizer.
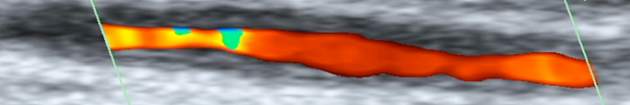
PAS: Swallow test may raise respiratory infection risk in infants
SAN DIEGO– There is no clear clinical benefit to diagnosing and treating infants with abnormal swallowing, according to the results of a video fluoroscopic swallow study (VFSS), and in certain cases, the study could be associated with an increased risk of developing acute respiratory infections (ARI) in these populations.
In a retrospective cohort study, Dr. Eric R. Coon of the University of Utah, Salt Lake City, and his colleagues examined data on all infants aged 12 months or younger who underwent VFSS from 2010 to 2012 at Primary Children’s Hospital in Salt Lake City.
“Providers implicitly believe that infant swallowing abnormalities lead to future respiratory illness,” Dr. Coon said at the annual meeting of the Pediatric Academic Societies. “However, data for that link is limited to descriptive case series, and studies relying on subjective definitions of aspiration that don’t include radiographic confirmation [and] interventions for swallowing abnormalities have not been shown to improve important clinical outcomes.”
The investigators looked at all inpatient, outpatient, and emergency department ARI cases in the Intermountain Healthcare system, a network of 22 hospital centers servicing five states, over the same time period in patients who experienced ARI between their first VFSS and age 3 years. ARI was defined as either bronchiolitis, asthma, pneumonia, or aspiration pneumonia, and was identified via IDC-9 codes.
Out of 576 infants, 199 (34%) exhibited oropharyngeal aspiration, 79 (14%) showed penetration, and 298 (52%)were classified as “normal.” Of the 199 with aspiration, 38 (19%) had thin aspiration and cough, 11 (6%) had thick aspiration and cough, 93 (47%) had thin aspiration and were silent, and 57 (28%) had thick aspiration and were silent.
Those deemed “thick aspiration, silent,” however, averaged 581 days to ARI, the shortest of any cohort, and a mean of 2.39 ARIs per subject. “Thin aspiration, cough” subjects had 638 mean days to ARI and a mean of 1.63 ARIs; “thick aspiration, cough” subjects had a mean of 750 days to ARI and 0.55 mean number of ARIs; and “thin aspiration, silent” had an average of 669 days to ARI and a mean of 1.69 ARIs (P < .05).
Those in the normal, or control, cohort averaged 715 days to ARI and 1.36 ARIs, while those with just penetration averaged 681 days to ARIs and 1.53 ARIs per subject (P < .05).
Cox regression models were used to calculate data time to first ARI, and Poisson regression was used for data on total number of ARIs experienced. Taking into account subject’s age at initial test, presence of complex chronic conditions in each subject, result of VFSS and type of aspiration intervention, silent aspiration with thickened feed yielded a Cox hazard ratio of 1.30 and a Poisson hazard ratio of 1.47, higher than all the others.
“The clinical importance of [VFSS]-detected abnormalities remains unclear, making them high-risk for overdiagnosis,” concluded Dr. Coon, adding that “patients may not experience net benefit, but may in fact be harmed.”
Dr. Coon did not report any relevant financial disclosures.
AT THE PAS ANNUAL MEETING
Key clinical point: Infants with swallowing abnormalities who are tested with video fluoroscopic swallow study are not at any less of a risk to develop an acute respiratory infection, and at least one type of swallowing abnormality poses an increased risk for an ARI.
Major finding: Thirty-four percent of infants demonstrated oropharyngeal aspiration; silent aspiration of thick feeds had the lowest mean days to ARI (581) and highest mean number of ARIs (2.39).
Data source: Retrospective cohort study of 576 infants (age <12 months) during 2010-2012.
Disclosures: Dr. Coon did not report any relevant disclosures.