User login
Increasing Inpatient Consultation: Hospitalist Perceptions and Objective Findings. In Reference to: “Hospitalist Perspective of Interactions with Medicine Subspecialty Consult Services”
We read with interest the article, “Hospitalist Perspective of Interactions with Medicine Subspecialty Consult Services.”1 We applaud the authors for their work, but were surprised by the authors’ findings of hospitalist perceptions of consultation utilization. The authors reported that more hospitalists felt that their personal use of consultation was increasing (38.5%) versus those who reported that use was decreasing (30.3%).1 The lack of true consensus on this issue may hint at significant variability in hospitalist use of inpatient consultation. We examined consultation use in 4,023 general medicine admissions to the University of Chicago from 2011 to 2015. Consultation use varied widely, with a 3.5-fold difference between the lowest and the highest quartiles of use (P < .01).2 Contrary to the survey findings, we found that the number of consultations per admission actually decreased with each year in our sample.2 In addition, a particularly interesting effect was observed in hospitalists; in multivariate regression, hospitalists on nonteaching services ordered more consultations than those on teaching services.2 These findings suggest a gap between hospitalist self-reported perceptions of consultation use and actual use, which is important to understand, and highlight the need for further characterization of factors driving the use of this valuable resource.
Disclosures
The authors have no conflicts of interest to disclose.
1. Adams TN, Bonsall J, Hunt D, et al. Hospitalist perspective of interactions with medicine subspecialty consult services. J Hosp Med. 2018:13(5):318-323. doi: 10.12788/jhm.2882. PubMed
2. Kachman M, Carter K, Martin S, et al. Describing variability of inpatient consultation practices on general medicine services: patient, admission and physician-level factors. Abstract from: Hospital Medicine 2018; April 8-11, 2018; Orlando, Florida.
We read with interest the article, “Hospitalist Perspective of Interactions with Medicine Subspecialty Consult Services.”1 We applaud the authors for their work, but were surprised by the authors’ findings of hospitalist perceptions of consultation utilization. The authors reported that more hospitalists felt that their personal use of consultation was increasing (38.5%) versus those who reported that use was decreasing (30.3%).1 The lack of true consensus on this issue may hint at significant variability in hospitalist use of inpatient consultation. We examined consultation use in 4,023 general medicine admissions to the University of Chicago from 2011 to 2015. Consultation use varied widely, with a 3.5-fold difference between the lowest and the highest quartiles of use (P < .01).2 Contrary to the survey findings, we found that the number of consultations per admission actually decreased with each year in our sample.2 In addition, a particularly interesting effect was observed in hospitalists; in multivariate regression, hospitalists on nonteaching services ordered more consultations than those on teaching services.2 These findings suggest a gap between hospitalist self-reported perceptions of consultation use and actual use, which is important to understand, and highlight the need for further characterization of factors driving the use of this valuable resource.
Disclosures
The authors have no conflicts of interest to disclose.
1. Adams TN, Bonsall J, Hunt D, et al. Hospitalist perspective of interactions with medicine subspecialty consult services. J Hosp Med. 2018:13(5):318-323. doi: 10.12788/jhm.2882. PubMed
2. Kachman M, Carter K, Martin S, et al. Describing variability of inpatient consultation practices on general medicine services: patient, admission and physician-level factors. Abstract from: Hospital Medicine 2018; April 8-11, 2018; Orlando, Florida.
© 2018 Society of Hospital Medicine
Healthcare Quality for Children and Adolescents with Suicidality Admitted to Acute Care Hospitals in the United States
Suicide is the second most common cause of death among children, adolescents, and young adults in the United States. In 2016, over 6,000 children and youth 5 to 24 years of age succumbed to suicide, thus reflecting a mortality rate nearly three times higher than deaths from malignancies and 28 times higher than deaths from sepsis in this age group.1 Suicidal ideation and suicide attempts are even more common, with 17% of high school students reporting seriously considering suicide and 8% reporting suicide attempts in the previous 12 months.2 These tragic statistics are reflected in our health system use, emergency department (ED) utilization for suicide attempts and suicidal ideation is growing at a tremendous rate, and over 50% of the children seen in EDs are subsequently admitted to the hospital for ongoing care.3,4
In this issue of Journal of Hospital Medicine, Doupnik and colleagues present an analysis of pediatric hospitalizations for suicide attempts and suicidal ideation at acute care hospitals contained within the 2013 and 2014 National Readmissions Dataset.5 This dataset reflects a nationally representative sample of pediatric hospitalizations, weighted to allow for national estimates. Although their focus was on hospital readmission, their analysis yielded additional valuable data about suicide attempts and suicidal ideation in American youth. The investigators identified 181,575 pediatric acute care hospitalizations for suicide attempts and suicidal ideation over the two-year study period, accounting for 9.5% of all acute care hospitalizations among children and adolescents 6 to 17 years of age nationally. This number exceeds the biennial number of pediatric hospitalizations for cellulitis, dehydration, and urinary tract infections, all of which are generally considered the “bread and butter” of pediatric hospital medicine.6
Doupnik and colleagues rightly pointed out that hospital readmission is not a nationally endorsed measure to evaluate the quality of pediatric mental health hospitalizations. At the same time, their work highlights that acute care hospitals need strategies to measure the quality of pediatric hospitalizations for suicide attempts and suicidal ideation. Beyond readmissions, how should the quality of these hospital stays be evaluated? A recent review of 15 national quality measure sets identified 257 unique measures to evaluate pediatric quality of care.7 Of these, only one focused on mental health hospitalization. This measure, which was endorsed by the National Quality Forum, determines the percentage of discharges for patients six years of age and older who were hospitalized for mental health diagnoses and who had a follow-up visit with a mental health practitioner within 7 and 30 days of hospital discharge.8 Given Doupnik et al.’s finding that one-third of all 30-day hospital readmissions occurred within seven days of hospital discharge, early follow-up visits with mental health practitioners is arguably essential.
Although evidence-based quality measures to evaluate hospital-based mental healthcare are limited, quality measure development is ongoing, facilitated by recent federal health policy and associated research efforts. Four newly developed measures focus on the quality of inpatient care for suicidality, including two evaluated using data from health records and two derived from caregiver surveys. The first medical records-based measure identifies whether caregivers of patients admitted to hospital for dangerous self-harm or suicidality have documentation that they were counseled on how to restrict their child’s or adolescent’s access to potentially lethal means of suicide before discharge. The second record-based measure evaluates documentation in the medical record of discussion between the hospital provider and the patient’s outpatient provider regarding the plan for follow-up.9 The two survey-based measures ask caregivers whether they were counseled on how to restrict access to potentially lethal means of suicide, and, for children and adolescents started on a new antidepressant medication or dose, whether they were counseled regarding the potential benefits and risks of the medication.10 All measures were field-tested at children’s hospitals to ensure feasibility in data collection. However, as shown by Doupnik et al., only 7.4% of acute care hospitalizations for suicide attempts and suicidal ideation occurred at freestanding children’s hospitals; most occurred at urban nonteaching centers. Evaluation of these new quality measures across structurally diverse hospitals is an important next step.
Beyond the healthcare constructs evaluated by these quality measures, many foundational questions about what constitutes high quality inpatient healthcare for suicide attempts and suicidal ideation remain. An American Academy of Child and Adolescent Psychiatry (AACAP) practice parameter, which was published in 2001, established minimal standards for the assessment and treatment of children and adolescents with suicidal behavior.11 This guideline recommends inpatient treatment until the mental state or level of suicidality has stabilized, with discharge considered only when the clinician is satisfied that adequate supervision and support will be available and when a responsible adult has agreed to secure or dispose of potentially lethal medications and firearms. It further recommends that the clinician treating the child or adolescent during the days following a suicide attempt be available to the patient and family – for example, to receive and make telephone calls outside of regular clinic hours. Recognizing the growing prevalence of suicidality in American children and youth, coupled with critical shortages in pediatric psychiatrists and fragmentation of inpatient and outpatient care, these minimal standards may be difficult to implement across the many settings where children receive their mental healthcare.4,12,13
The large number of children and adolescents being hospitalized for suicide attempts and suicidal ideation at acute care hospitals demands that we take stock of how we manage this vulnerable population. Although Doupnik and colleagues suggest that exclusion of specialty psychiatric hospitals from their dataset is a limitation, their presentation of suicide attempts and suicidal ideation epidemiology at acute care hospitals provides valuable data for pediatric hospitalists. Given the presence of pediatric hospitalists at many acute care hospitals, comanagement by hospital medicine and psychiatry services may prove both efficient and effective while breaking down the silos that traditionally separate these specialties. Alternatively, extending the role of collaborative care teams, which are increasingly embedded in pediatric primary care, into inpatient settings may enable continuity of care and improve healthcare quality.14 Finally, nearly 20 years have passed since the AACAP published its practice parameter for the assessment and treatment of children and adolescents with suicidal behavior. An update to reflect contemporary suicide attempts and suicidal ideation statistics and evidence-based practices is needed, and collaboration between professional pediatric and psychiatric organizations in the creation of this update would recognize the growing role of pediatricians, including hospitalists, in the provision of mental healthcare for children.
Updated guidelines must take into account the transitions of care experienced by children and adolescents throughout their hospital stay: at admission, at discharge, and during their hospitalization if they move from medical to psychiatric care. Research is needed to determine what proportion of children and adolescents receive evidence-based mental health therapies while in hospital and how many are connected with wraparound mental health services before hospital discharge.15 Doupnik et al. excluded children and adolescents who were transferred to other hospitals, which included over 18,000 youth. How long did these patients spend “boarding,” and did they receive any mental health assessment or treatment during this period? Although the Joint Commission recommends that holding times for patients awaiting bed placement should not exceed four4 hours, hospitals have described average pediatric inpatient boarding times of 2-3 days while awaiting inpatient psychiatric care.16,17 In one study of children and adolescents awaiting transfer for inpatient psychiatric care, mental health counseling was received by only 6%, which reflects lost time that could have been spent treating this highly vulnerable population.16 Multidisciplinary collaboration is needed to address these issues and inform best practices.
Although mortality is a rare outcome for most conditions we treat in pediatric hospital medicine, mortality following suicide attempts is all too common. The data presented by Doupnik and colleagues provide a powerful call to improve healthcare quality across the diverse settings where children with suicidality receive their care.
Disclosures
The authors have no financial relationships relevant to this article to disclose.
Funding
Dr. Leyenaar was supported by grant number K08HS024133 from the Agency for Healthcare Research and Quality. The content is solely the responsibility of the authors and does not necessarily represent the official views of AHRQ.
1. Centers for Disease Control and Prevention, National Center for Health Statistics. Underlying Cause of Death 1999-2016 on CDC WONDER Online Database, released December, 2017.
2. Kann L, Kinchen S, Shanklin S, et al. Youth risk behavior surveillance-United States, 2013. MMWR. 2014;63(4):1-168. PubMed
3. Olfson M, Gameroff MJ, Marcus SC, Greenberg T, Shaffer D. Emergency treatment of young people following deliberate self-harm. Arch Gen Psychiatry. 2005;62(10):1122-1128. doi: 10.1001/archpsyc.62.10.1122 PubMed
4. Mercado MC, Holland K, Leemis RW, Stone DM, Wang J. Trends in emergency department visits for nonfatal self-inflicted injuries among youth aged 10 to 24 years in the United States, 2001-2015. JAMA. 2017;318(19):1931-1932. doi: 10.1001/jama.2017.13317 PubMed
5. Doupnik S, Rodean J, Zima B, et al. Readmissions after pediatric hospitalization for suicide ideation and suicide attempt [published online ahead of print October 31, 2018]. J Hosp Med. doi: 10.12788/jhm.3070
6. Leyenaar JK, Ralston SL, Shieh M, Pekow PS, Mangione-Smith R, Lindenauer PK. Epidemiology of pediatric hospitalizations at general hospitals and freestanding children’s hospitals in the United States. J Hosp Med. 2016;11(11):743-749. doi: 10.1002/jhm.2624 PubMed
7. House SA, Coon ER, Schroeder AR, Ralston SL. Categorization of national pediatric quality measures. Pediatrics. 2017;139(4):e20163269. PubMed
8. National Quality Forum. Follow-up after hospitalization for mental illness. Available at www.qualityforum.org. Accessed July 21, 2018.
9. Bardach N, Burkhart Q, Richardson L, et al. Hospital-based quality measures for pediatric mental health care. Pediatrics. 2018;141(6):e20173554. PubMed
10. Parast L, Bardach N, Burkhart Q, et al. Development of new quality measures for hospital-based care of suicidal youth. Acad Pediatr. 2018;18(3):248-255. doi: 10.1016/j.acap.2017.09.017 PubMed
11. Shaffer D, Pfeffer C. Practice parameters for the assessment and treatment of children and adolescents with suicidal behavior. J Am Acad Child Adolesc Psychiatry. 2001;40(7 Suppl):24-51. doi: 10.1097/00004583-200107001-00003
12. Thomas C, Holtzer C. The continuing shortage of child and adolescent psychiatrists. J Am Acad Child Adolesc Psychiatry. 2006;45(9):1023-1031. doi: 10.1097/01.chi.0000225353.16831.5d PubMed
13. Plemmons G, Hall M, Doupnik S, et al. Hospitalization for suicide ideation or attempt: 2008–2015. Pediatrics. 2018;141(6):e20172426. PubMed
14. Beach SR, Walker J, Celano CM, Mastromauro CA, Sharpe M, Huffman JC. Implementing collaborative care programs for psychiatric disorders in medical settings: a practical guide. Gen Hosp Psychiatry. 2015;37(6):522-527. doi: 10.1016/j.genhosppsych.2015.06.015 PubMed
15. Winters N, Pumariega A. Practice parameter on child and adolescent mental health care in community systems of care. J Am Acad Child Adolsc Psychiatry. 2007;46(2):284-299. DOI: 10.1097/01.chi.0000246061.70330.b8 PubMed
16. Claudius I, Donofrio J, Lam CN, Santillanes G. Impact of boarding pediatric psychiatric patients on a medical ward. Hosp Pediatr. 2014;4(3):125-131. doi: 10.1542/hpeds.2013-0079 PubMed
17. Gallagher KAS, Bujoreanu IS, Cheung P, Choi C, Golden S, Brodziak K. Psychiatric boarding in the pediatric inpatient medical setting: a retrospective analysis. Hosp Pediatr. 2013;7(8):444-450. doi: 10.1542/hpeds.2017-0005 PubMed
Suicide is the second most common cause of death among children, adolescents, and young adults in the United States. In 2016, over 6,000 children and youth 5 to 24 years of age succumbed to suicide, thus reflecting a mortality rate nearly three times higher than deaths from malignancies and 28 times higher than deaths from sepsis in this age group.1 Suicidal ideation and suicide attempts are even more common, with 17% of high school students reporting seriously considering suicide and 8% reporting suicide attempts in the previous 12 months.2 These tragic statistics are reflected in our health system use, emergency department (ED) utilization for suicide attempts and suicidal ideation is growing at a tremendous rate, and over 50% of the children seen in EDs are subsequently admitted to the hospital for ongoing care.3,4
In this issue of Journal of Hospital Medicine, Doupnik and colleagues present an analysis of pediatric hospitalizations for suicide attempts and suicidal ideation at acute care hospitals contained within the 2013 and 2014 National Readmissions Dataset.5 This dataset reflects a nationally representative sample of pediatric hospitalizations, weighted to allow for national estimates. Although their focus was on hospital readmission, their analysis yielded additional valuable data about suicide attempts and suicidal ideation in American youth. The investigators identified 181,575 pediatric acute care hospitalizations for suicide attempts and suicidal ideation over the two-year study period, accounting for 9.5% of all acute care hospitalizations among children and adolescents 6 to 17 years of age nationally. This number exceeds the biennial number of pediatric hospitalizations for cellulitis, dehydration, and urinary tract infections, all of which are generally considered the “bread and butter” of pediatric hospital medicine.6
Doupnik and colleagues rightly pointed out that hospital readmission is not a nationally endorsed measure to evaluate the quality of pediatric mental health hospitalizations. At the same time, their work highlights that acute care hospitals need strategies to measure the quality of pediatric hospitalizations for suicide attempts and suicidal ideation. Beyond readmissions, how should the quality of these hospital stays be evaluated? A recent review of 15 national quality measure sets identified 257 unique measures to evaluate pediatric quality of care.7 Of these, only one focused on mental health hospitalization. This measure, which was endorsed by the National Quality Forum, determines the percentage of discharges for patients six years of age and older who were hospitalized for mental health diagnoses and who had a follow-up visit with a mental health practitioner within 7 and 30 days of hospital discharge.8 Given Doupnik et al.’s finding that one-third of all 30-day hospital readmissions occurred within seven days of hospital discharge, early follow-up visits with mental health practitioners is arguably essential.
Although evidence-based quality measures to evaluate hospital-based mental healthcare are limited, quality measure development is ongoing, facilitated by recent federal health policy and associated research efforts. Four newly developed measures focus on the quality of inpatient care for suicidality, including two evaluated using data from health records and two derived from caregiver surveys. The first medical records-based measure identifies whether caregivers of patients admitted to hospital for dangerous self-harm or suicidality have documentation that they were counseled on how to restrict their child’s or adolescent’s access to potentially lethal means of suicide before discharge. The second record-based measure evaluates documentation in the medical record of discussion between the hospital provider and the patient’s outpatient provider regarding the plan for follow-up.9 The two survey-based measures ask caregivers whether they were counseled on how to restrict access to potentially lethal means of suicide, and, for children and adolescents started on a new antidepressant medication or dose, whether they were counseled regarding the potential benefits and risks of the medication.10 All measures were field-tested at children’s hospitals to ensure feasibility in data collection. However, as shown by Doupnik et al., only 7.4% of acute care hospitalizations for suicide attempts and suicidal ideation occurred at freestanding children’s hospitals; most occurred at urban nonteaching centers. Evaluation of these new quality measures across structurally diverse hospitals is an important next step.
Beyond the healthcare constructs evaluated by these quality measures, many foundational questions about what constitutes high quality inpatient healthcare for suicide attempts and suicidal ideation remain. An American Academy of Child and Adolescent Psychiatry (AACAP) practice parameter, which was published in 2001, established minimal standards for the assessment and treatment of children and adolescents with suicidal behavior.11 This guideline recommends inpatient treatment until the mental state or level of suicidality has stabilized, with discharge considered only when the clinician is satisfied that adequate supervision and support will be available and when a responsible adult has agreed to secure or dispose of potentially lethal medications and firearms. It further recommends that the clinician treating the child or adolescent during the days following a suicide attempt be available to the patient and family – for example, to receive and make telephone calls outside of regular clinic hours. Recognizing the growing prevalence of suicidality in American children and youth, coupled with critical shortages in pediatric psychiatrists and fragmentation of inpatient and outpatient care, these minimal standards may be difficult to implement across the many settings where children receive their mental healthcare.4,12,13
The large number of children and adolescents being hospitalized for suicide attempts and suicidal ideation at acute care hospitals demands that we take stock of how we manage this vulnerable population. Although Doupnik and colleagues suggest that exclusion of specialty psychiatric hospitals from their dataset is a limitation, their presentation of suicide attempts and suicidal ideation epidemiology at acute care hospitals provides valuable data for pediatric hospitalists. Given the presence of pediatric hospitalists at many acute care hospitals, comanagement by hospital medicine and psychiatry services may prove both efficient and effective while breaking down the silos that traditionally separate these specialties. Alternatively, extending the role of collaborative care teams, which are increasingly embedded in pediatric primary care, into inpatient settings may enable continuity of care and improve healthcare quality.14 Finally, nearly 20 years have passed since the AACAP published its practice parameter for the assessment and treatment of children and adolescents with suicidal behavior. An update to reflect contemporary suicide attempts and suicidal ideation statistics and evidence-based practices is needed, and collaboration between professional pediatric and psychiatric organizations in the creation of this update would recognize the growing role of pediatricians, including hospitalists, in the provision of mental healthcare for children.
Updated guidelines must take into account the transitions of care experienced by children and adolescents throughout their hospital stay: at admission, at discharge, and during their hospitalization if they move from medical to psychiatric care. Research is needed to determine what proportion of children and adolescents receive evidence-based mental health therapies while in hospital and how many are connected with wraparound mental health services before hospital discharge.15 Doupnik et al. excluded children and adolescents who were transferred to other hospitals, which included over 18,000 youth. How long did these patients spend “boarding,” and did they receive any mental health assessment or treatment during this period? Although the Joint Commission recommends that holding times for patients awaiting bed placement should not exceed four4 hours, hospitals have described average pediatric inpatient boarding times of 2-3 days while awaiting inpatient psychiatric care.16,17 In one study of children and adolescents awaiting transfer for inpatient psychiatric care, mental health counseling was received by only 6%, which reflects lost time that could have been spent treating this highly vulnerable population.16 Multidisciplinary collaboration is needed to address these issues and inform best practices.
Although mortality is a rare outcome for most conditions we treat in pediatric hospital medicine, mortality following suicide attempts is all too common. The data presented by Doupnik and colleagues provide a powerful call to improve healthcare quality across the diverse settings where children with suicidality receive their care.
Disclosures
The authors have no financial relationships relevant to this article to disclose.
Funding
Dr. Leyenaar was supported by grant number K08HS024133 from the Agency for Healthcare Research and Quality. The content is solely the responsibility of the authors and does not necessarily represent the official views of AHRQ.
1. Centers for Disease Control and Prevention, National Center for Health Statistics. Underlying Cause of Death 1999-2016 on CDC WONDER Online Database, released December, 2017.
2. Kann L, Kinchen S, Shanklin S, et al. Youth risk behavior surveillance-United States, 2013. MMWR. 2014;63(4):1-168. PubMed
3. Olfson M, Gameroff MJ, Marcus SC, Greenberg T, Shaffer D. Emergency treatment of young people following deliberate self-harm. Arch Gen Psychiatry. 2005;62(10):1122-1128. doi: 10.1001/archpsyc.62.10.1122 PubMed
4. Mercado MC, Holland K, Leemis RW, Stone DM, Wang J. Trends in emergency department visits for nonfatal self-inflicted injuries among youth aged 10 to 24 years in the United States, 2001-2015. JAMA. 2017;318(19):1931-1932. doi: 10.1001/jama.2017.13317 PubMed
5. Doupnik S, Rodean J, Zima B, et al. Readmissions after pediatric hospitalization for suicide ideation and suicide attempt [published online ahead of print October 31, 2018]. J Hosp Med. doi: 10.12788/jhm.3070
6. Leyenaar JK, Ralston SL, Shieh M, Pekow PS, Mangione-Smith R, Lindenauer PK. Epidemiology of pediatric hospitalizations at general hospitals and freestanding children’s hospitals in the United States. J Hosp Med. 2016;11(11):743-749. doi: 10.1002/jhm.2624 PubMed
7. House SA, Coon ER, Schroeder AR, Ralston SL. Categorization of national pediatric quality measures. Pediatrics. 2017;139(4):e20163269. PubMed
8. National Quality Forum. Follow-up after hospitalization for mental illness. Available at www.qualityforum.org. Accessed July 21, 2018.
9. Bardach N, Burkhart Q, Richardson L, et al. Hospital-based quality measures for pediatric mental health care. Pediatrics. 2018;141(6):e20173554. PubMed
10. Parast L, Bardach N, Burkhart Q, et al. Development of new quality measures for hospital-based care of suicidal youth. Acad Pediatr. 2018;18(3):248-255. doi: 10.1016/j.acap.2017.09.017 PubMed
11. Shaffer D, Pfeffer C. Practice parameters for the assessment and treatment of children and adolescents with suicidal behavior. J Am Acad Child Adolesc Psychiatry. 2001;40(7 Suppl):24-51. doi: 10.1097/00004583-200107001-00003
12. Thomas C, Holtzer C. The continuing shortage of child and adolescent psychiatrists. J Am Acad Child Adolesc Psychiatry. 2006;45(9):1023-1031. doi: 10.1097/01.chi.0000225353.16831.5d PubMed
13. Plemmons G, Hall M, Doupnik S, et al. Hospitalization for suicide ideation or attempt: 2008–2015. Pediatrics. 2018;141(6):e20172426. PubMed
14. Beach SR, Walker J, Celano CM, Mastromauro CA, Sharpe M, Huffman JC. Implementing collaborative care programs for psychiatric disorders in medical settings: a practical guide. Gen Hosp Psychiatry. 2015;37(6):522-527. doi: 10.1016/j.genhosppsych.2015.06.015 PubMed
15. Winters N, Pumariega A. Practice parameter on child and adolescent mental health care in community systems of care. J Am Acad Child Adolsc Psychiatry. 2007;46(2):284-299. DOI: 10.1097/01.chi.0000246061.70330.b8 PubMed
16. Claudius I, Donofrio J, Lam CN, Santillanes G. Impact of boarding pediatric psychiatric patients on a medical ward. Hosp Pediatr. 2014;4(3):125-131. doi: 10.1542/hpeds.2013-0079 PubMed
17. Gallagher KAS, Bujoreanu IS, Cheung P, Choi C, Golden S, Brodziak K. Psychiatric boarding in the pediatric inpatient medical setting: a retrospective analysis. Hosp Pediatr. 2013;7(8):444-450. doi: 10.1542/hpeds.2017-0005 PubMed
© 2018 Society of Hospital Medicine
Readmissions after Pediatric Hospitalization for Suicide Ideation and Suicide Attempt
Suicide is a leading cause of death among 10- to 34-year-olds in the United States.1,2 During the past two decades, the youth suicide death rate has risen by 24%, and more than 5,000 young people die from suicide each year.3 Suicide ideation (SI) and suicide attempts (SAs) are well-established risk factors for suicide death and a source of morbidity for patients and families. One-third of youth with SI attempt suicide at some point in their lifetime.4 Approximately 11% of youth SAs result in suicide death, and 2% of youth who attempt suicide subsequently go on to die from suicide after recovering from a prior SA.5 More than 60,000 youth are hospitalized for SI or SA each year,6 and young people hospitalized for SA are at high short-term risk of repeat SA and suicide death.7 Hospitals need strategies for measuring the quality of SI and SA hospitalizations, monitoring postdischarge outcomes, and identifying the patients at the highest risk of poor outcomes. Readmissions are a useful hospital quality measure that can indicate re-emergence of SI, repeat SA, or inadequate community-based mental health treatment, and interventions designed for patients with readmissions can potentially avert morbidity or mortality.
The National Committee on Quality Assurance recommends measurement of quality metrics for 30-day mental health follow-up after psychiatric hospitalizations, 30-day readmissions after adult (but not pediatric) psychiatric hospitalizations, and 30-day readmissions in pediatric medical and surgical hospitalizations. Readmission measures are not consistently used to evaluate pediatric psychiatric hospitalizations, and psychiatric quality measures are not used to evaluate medical or surgical hospitalizations for SA. Recent research has investigated transfers to postacute care,8 readmission prevalence, variation in hospital readmission performance, and risk factors for readmissions after pediatric psychiatric hospitalizations.9–11 However, no national study has investigated 30-day readmissions in youth hospitalized specifically for SI or SA.
To inform hospital quality measurement and improve hospital and postdischarge care for youth at risk of suicide, more information is needed about the characteristics of and the risk factors for readmissions after index SI/SA hospitalization. To address this knowledge gap, among SI/SA hospitalizations in 6- to 17-year-olds, we examined (1) unplanned 30-day readmissions and characteristics of hospitalizations by 30-day readmission status; (2) patient, hospital, and regional characteristics associated with 30-day readmissions; and (3) characteristics of 30-day readmissions.
METHODS
Study Design and Data Source
We conducted a national, retrospective cohort study of hospitalizations for patients aged 6-17 years using the Agency for Healthcare Research and Quality (AHRQ) 2013 and 2014 Nationwide Readmissions Database (NRD). The combined 2013-2014 NRD includes administrative data from a nationally representative sample of 29 million hospitalizations in 22 states, accounting for 49.3% of all US hospitalizations, and is weighted for national projections. The NRD includes hospital information, patient demographic information, and International Classification of Diseases, Ninth Revision, Clinical Modification (ICD-9-CM) diagnosis, procedure, and external cause of injury codes (E-codes). The database includes one primary diagnosis, up to 24 additional diagnoses, and up to 4 E-codes for each hospitalization. The NRD includes information about hospitalizations in acute-care general hospitals (including their psychiatric units) but not from specialty psychiatric hospitals. The database also includes de-identified, verified patient linkage numbers so that patients can be tracked across multiple hospitalizations at the same institution or different institutions within the same state. This study was considered to be exempt from review by the Children’s Hospital of Philadelphia Institutional Review Board.
Sample
We identified a sample of 181,575 hospitalizations for SI (n = 119,037) or SA (n = 62,538) among 6- to 17-year-olds between January 1, 2013, and December 31, 2014 (Figure). We included children as young as 6 years because validated methods exist to identify SI and SA in this age group,12 and because suicide deaths have recently increased among younger children.3 We excluded patients aged 18 years and older from this study since delivery of mental health services differs for adults.13 To create the sample, we first identified all hospitalizations of patients aged 6-17 years. We then used a validated algorithm relying on ICD-9-CM diagnosis codes for poisonings and E-codes for self-injury (E950-959) to identify hospitalizations related to SA.12 Because E-code completeness varies among states,14 we also used the combination of having both a diagnosis code for injury (800-999) and an ICD-9-CM code for SI (V62.84) as a proxy for SA. Among hospitalizations without SA, we identified hospitalizations with SI using the ICD-9-CM code for SI (V62.84) in any position.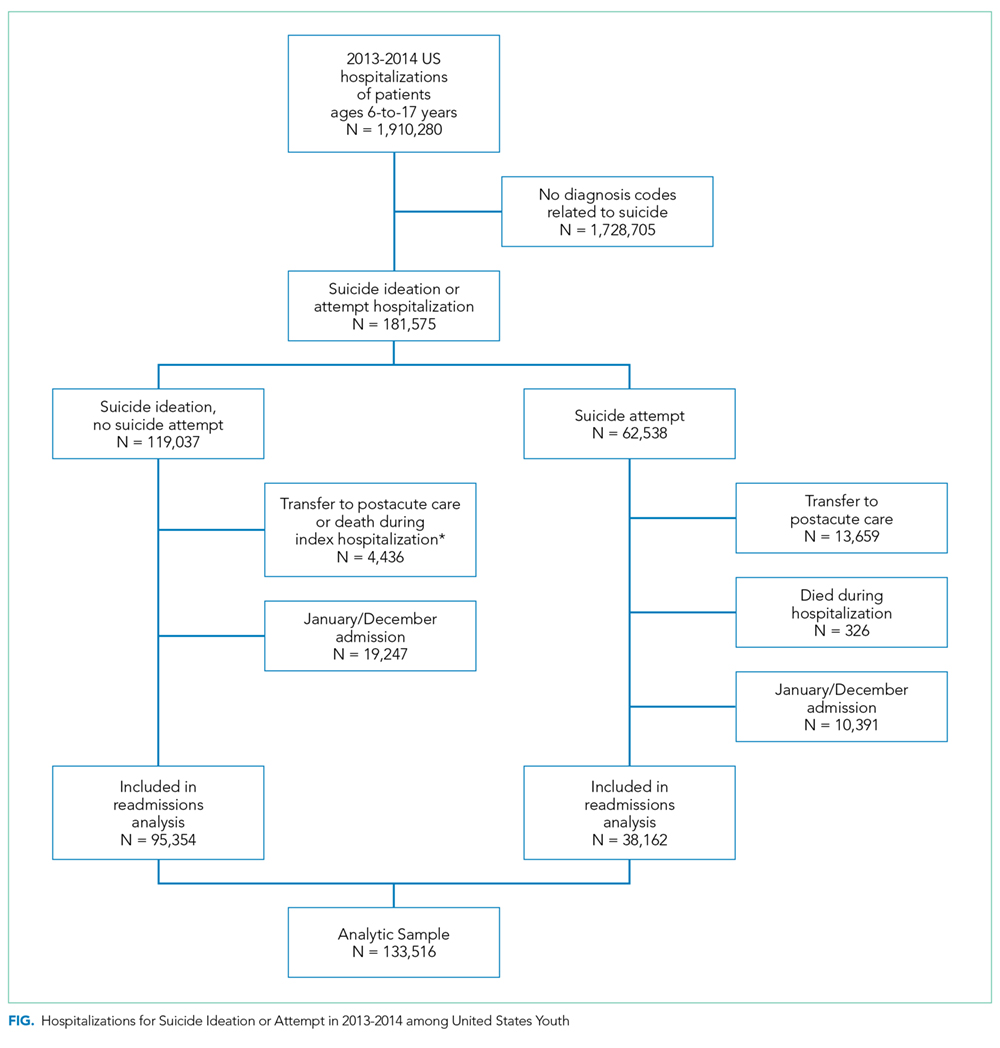
We identified 133,516 index hospitalizations with complete data at risk for an unplanned readmission. Because NRD data cannot be linked between calendar years, we limited the study time period for each calendar year to 10 months. We excluded hospitalizations in January because the full 30-day time frame to determine whether a hospitalization had occurred in the preceding 30 days, a known risk factor for readmissions in other samples,15 was not available. We excluded index hospitalizations occurring in December, because the full 30-day time frame to ascertain readmissions was not available. We excluded hospitalizations resulting in death, since these are not at risk for readmission, and hospitalizations resulting in transfer, since the timing of discharge to the community was not known. Readmission hospitalizations were eligible to be included as index hospitalizations if they met sample inclusion criteria. The final sample for readmission analyses included 95,354 SI hospitalizations and 38,162 SA hospitalizations (Figure).
Primary Outcome
The primary outcome was any unplanned, all-cause readmission within 30 days of index hospitalization for SI or SA. Among 30-day readmissions, we examined readmission timing, whether the readmission was to the same hospital or a different hospital, length of stay, and indication for readmission (medical/surgical or psychiatric, and presence of SI or SA diagnoses). Planned readmissions were identified using measure specifications endorsed by the AHRQ and the National Quality Forum16 and excluded from measurement.
Among index hospitalizations for SI, we specifically examined 30-day readmissions for subsequent SA, since one objective of hospitalization for SI is to prevent progression to SA or death. We could not identify hospitalizations for repeat SA after index hospitalization for SA, because diagnosis codes did not differentiate between readmission for complications of index SA and readmission for repeat SA.
Independent Variables
We analyzed demographic, clinical, and hospital factors associated with readmissions in other samples.17–20 Demographic characteristics included patient gender and age, urban or rural residence, payer, and median national income quartile for a patient’s ZIP code. Race and ethnicity data are not available in the NRD.
Clinical characteristics included hospitalization in the 30-days preceding the index hospitalization, index hospitalization length of stay, and admission via the emergency department (ED) versus direct admission. A patient’s chronic condition profile was determined using index hospitalization diagnosis codes. Complex chronic conditions (eg, cancer, cystic fibrosis) were identified using a classification system used in several prior studies of hospital administrative datasets,21 and other noncomplex chronic medical conditions (eg, asthma, obesity) were identified using the Healthcare Cost and Utilization Project (HCUP) chronic condition indicator system.22 Psychiatric conditions (eg, anxiety disorders, substance abuse, autism) were identified and categorized using a classification system used in studies of hospital administrative datasets.23 The number of psychiatric conditions was determined by counting the number of psychiatric condition categories in which a patient had a diagnosis. SA was categorized as having lower risk of death (eg, medication overdose, injury from cutting or piercing) or higher risk of death (eg, hanging, suffocation, or firearm injury).24
Because of known temporal trends in SI and SA,25,26 the month and year of admission were included as covariates. Hospital characteristics included teaching hospital and children’s hospital designations.
Statistical Analysis
We compared descriptive, summary statistics for characteristics of index hospitalizations with and without a 30-day readmission using Rao-Scott chi-square tests. In multivariable analyses, we derived logistic regression models to measure the associations of patient, hospital, and temporal factors with 30-day hospital readmissions. Analyses were conducted in SAS PROC SURVEYLOGISTIC and were weighted to achieve national estimates, clustered by sample stratum and hospital to account for the complex survey design,27 clustered by patients to account for multiple index visits per patient, and adjusted for clinical, demographic, and hospital characteristics. SAS version 9.4 (SAS Institute, Cary, North Carolina) was used for all analyses. All tests were two-sided, and a P value <.05 was considered as statistically significant.
RESULTS
Sample Characteristics
In the weighted analyses, we identified 133,516 hospitalizations in acute-care hospitals for SI or SA, and 8.5% (n = 11,375) of hospitalizations had at least one unplanned 30-day readmission to an acute-care hospital. Unweighted, the sample included 37,683 patients and 42,198 hospitalizations. Among all patients represented in the sample, 90.5% had only a single SI or SA hospitalization, 7.7% had two hospitalizations, and 1.8% had >2 hospitalizations in one year.
Table 1 summarizes the sample characteristics and displays the demographic, clinical, and hospital characteristics of index hospitalizations by the 30-day readmission status. Patients represented in the index hospitalizations were 64.9% female, 3.6% were aged 6-9 years, 40.1% were aged 10-14 years, and 56.3% were aged 15-17 years. Nearly half of the patients (49.1%) used public insurance. Nearly half (44.9%) lived in metropolitan areas with >1 million residents, 36.1% lived in metropolitan areas with 50,000 to 1 million residents, and 14.7% lived in rural areas.
Median length of stay for the index hospitalization was 5 days (interquartile range [IQR] 3-7). Nearly one-third (32.3%) of patients had a noncomplex chronic medical condition, 7.8% had a complex chronic medical condition, and 98.1% had a psychiatric condition. The most common psychiatric conditions were depressive disorders (60.0%) and anxiety disorders (42.2%). More than half (55.0%) of the patients had >2 psychiatric conditions. Most hospitalizations in the sample had SI only (71.4%). Among patients with SA, 81.0% had a lower lethality mechanism of injury and 19.0% had a higher lethality mechanism.
Patients experiencing a readmission were more likely to be 10-14 years old and use public insurance than patients without a readmission (P < .001 for both). For clinical characteristics, patients with a readmission were more likely to have longer index hospital stays (6 vs. 5 days), >2 psychiatric conditions (SI vs. SA), a prior admission in the 30 days preceding the index hospitalization, and admission via the ED (vs. direct admission) (P < .001 for all).
Association of Patient and Hospital Characteristics with Readmissions
Table 2 displays the patient and hospital characteristics associated with readmissions. Among demographic characteristics, 10- to 14-year-old patients had higher odds of readmission (odds ratio [OR]: 1.18, 95% confidence interval [CI]: 1.07-1.29) than 15- to 17-year-old patients. Having public insurance was associated with higher odds of readmission (OR: 1.14, 95% CI: 1.04-1.25). We found no differences in readmission rates based on sex, urban or rural location, or patient’s ZIP code income quartile.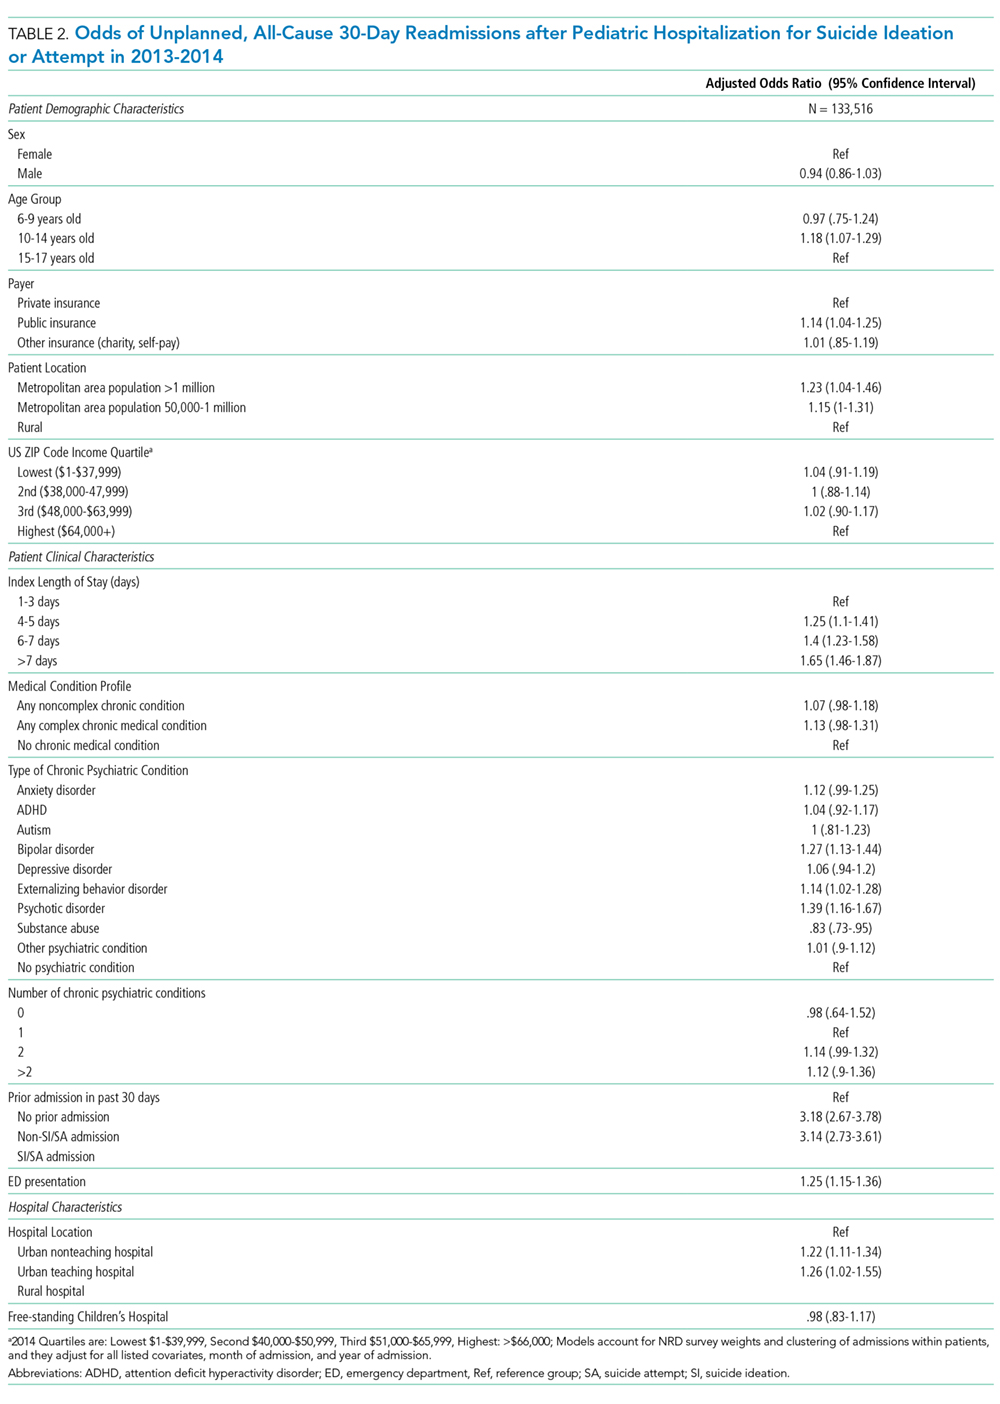
Among clinical characteristics, hospitalizations with an admission for SI or SA in the preceding 30 days, meaning that the index hospitalization itself was a readmission, had the strongest association with readmissions (OR: 3.14, 95% CI: 2.73-3.61). In addition, patients admitted via the ED for the index hospitalization had higher odds of readmission (OR: 1.25, 95% CI: 1.15-1.36). Chronic psychiatric conditions associated with higher odds of readmission included psychotic disorders (OR: 1.39, 95% CI: 1.16-1.67) and bipolar disorder (OR: 1.27, 95% CI: 1.13-1.44).
Characteristics of 30-day Readmissions
Table 3 displays the characteristics of readmissions after SI compared to that after SA. Among the combined sample of 11,375 30-day readmissions, 34.1% occurred within 7 days, and 65.9% in 8-30 days. Eleven percent of patients with any readmission had more than one readmission within 30 days. Among readmissions, 94.5% were for a psychiatric problem and 5.5% were for a medical or surgical problem. A total of 43.9% had a diagnosis of SI and 19.5% a diagnosis of SA. Readmissions were more likely to occur at a different hospital after SI than after SA (48.1% vs. 31.3%, P < .001). Medical and surgical indications for readmission were less common after SI than after SA (4.4% vs. 8.7%, P < .001). Only 1.2% of SI hospitalizations had a readmission for SA within 30 days. Of these cases, 55.6% were aged 15-17 years, 43.3% were aged 10-14 years, and 1.1% were aged 6-9 years; 73.1% of the patients were female, and 49.1% used public insurance.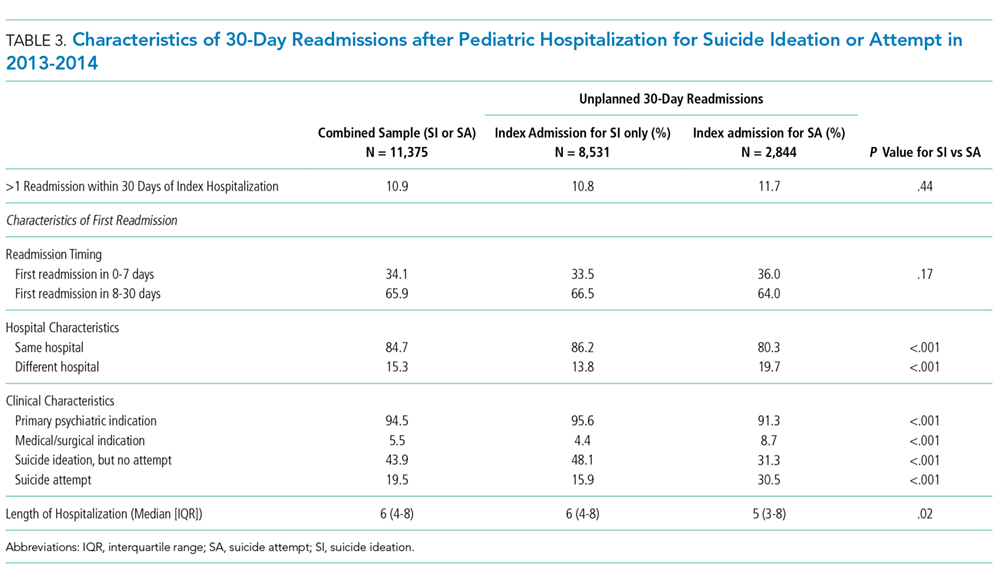
DISCUSSION
SI and SA in children and adolescents are substantial public health problems associated with significant hospital resource utilization. In 2013 and 2014, there were 181,575 pediatric acute-care hospitalizations for SI or SA, accounting for 9.5% of all hospitalizations in 6- to 17-year-old patients nationally. Among acute-care SI and SA hospitalizations, 8.5% had a readmission to an acute-care hospital within 30 days. The study data source did not include psychiatric specialty hospitals, and the number of index hospitalizations is likely substantially higher when psychiatric specialty hospitalizations are included. Readmissions may also be higher if patients were readmitted to psychiatric specialty hospitals after discharge from acute-care hospitals. The strongest risk factor for unplanned 30-day readmissions was a previous hospitalization in the 30 days before the index admission, likely a marker for severity or complexity of psychiatric illness. Other characteristics associated with higher odds of readmission were bipolar disorder, psychotic disorders, and age 10-14 years. More than one-third of readmissions occurred within the first 7 days after hospital discharge. The prevalence of SI and SA hospitalizations and readmissions was similar to findings in previous analyses of mental health hospitalizations.10,28
A patient’s psychiatric illness type and severity, as evidenced by the need for frequent repeat hospitalizations, was highly associated with the risk of 30-day readmission. Any hospitalization in the 30 days preceding the index hospitalization, whether for SI/SA or for another problem, was a strong risk factor for readmissions. We suspect that prior SI/SA hospitalizations reflect a patient’s chronic elevated risk for suicide. Prior hospitalizations not for SI or SA could be hospitalizations for mental illness exacerbations that increase the risk of SI or SA, eg, bipolar disorder with acute mania, or they could represent physical health problems. Chronic physical health problems are a known risk factor for SI and SA.29
A knowledge of those characteristics that increase the readmission risk can inform future resource allocation, research, and policy in several ways. First, longer hospital stays could mitigate readmission risk in some patients with severe psychiatric illness. European studies in older adolescents and adults show that for severe psychiatric illness, a longer hospital stay is associated with a lower risk of hospital readmission.15,30 Second, better access to intensive community-based mental health (MH) services, including evidence-based psychotherapy and medication management, improves symptoms in young people.31 Access to these services likely affects the risk of hospital readmission. We found that readmission risk was highest in 10- to 14-year-olds. Taken in the context of existing evidence that suicide rates are rising in younger patients,1,3 our findings suggest that particular attention to community services for younger patients is needed. Third, care coordination could help patients access beneficial services to reduce readmissions and improve other outcomes. Enhanced discharge care coordination reduced suicide deaths in high-risk populations in Europe32 and Japan33 and improved attendance at mental health follow-up after pediatric ED discharge in a small United States sample.34 Given that one-third of readmissions occurred within seven days, care coordination designed to ensure access to ambulatory services in the immediate postdischarge period may be particularly beneficial.
We found that ZIP code income quartile was not associated with readmissions. We suspect that poverty is not as closely correlated with MH hospitalization outcomes as it is with physical health hospitalization outcomes for several reasons. Medicaid insurance historically has more robust coverage of mental health services than some private insurance plans, which might offset some of the risk of poor mental health outcomes associated with poverty. Low-income families are eligible to use social services, and families accessing social services might have more opportunities to become familiar with community mental health programs. Further, the expectation of high achievement found in some higher income families is associated with MH problems in children and adolescents.35 Therefore, being in a higher income quartile might not be as protective against poor mental health outcomes as it is against poor physical health outcomes.
Although the NRD provides a rich source of readmission data across hospitals nationally, several limitations are inherent to this administrative dataset. First, data from specialty psychiatric hospitals were not included in the NRD. The study underestimates the total number of index hospitalizations and readmissions, since index SI/SA hospitalizations at psychiatric hospitals are not included, and readmissions are not included if they occurred at specialty psychiatric hospitals. Second, because data cannot be linked between calendar years, we excluded January and December hospitalizations, and findings might not generalize to hospitalizations in January and December. Seasonal trends in SI/SA hospitalizations are known to occur.36 Third, race, ethnicity, primary language, gender identity, and sexual orientation are not available in the NRD, and we could not examine the association of these characteristics with the likelihood of readmissions. Fourth, we did not have information about pre- or posthospitalization insurance enrollment or outpatient services that could affect the risk of readmission. Nevertheless, this study offers information on the characteristics of readmissions after hospitalizations for SI and SA in a large nationally representative sample of youth, and the findings can inform resource planning to prevent suicides.
CONCLUSION
Hospital readmissions are common in patients with SI and SA, and patients with a recent previous hospitalization have the highest risk of readmission. More than one-third of readmissions after SI or SA occurred within the first seven days. Due to the dearth of mental health services in the community, hospitals offer an important safety net for youth experiencing acute suicidal crises. Strategies to improve the continuum of care for patients at risk of suicide that solely focus on reducing readmissions are not likely to benefit patients. However, readmissions can identify opportunities for improving hospital discharge processes and outpatient services. Future research and clinical innovation to investigate and improve hospital discharge planning and access to community mental health services is likely to benefit patients and could reduce 30-day hospital readmissions.
Acknowledgments
The authors thank John Lawlor for his assistance with the analysis.
Disclosures
The authors have no potential conflicts of interest to disclose.
Funding
Dr. Zima received funding from the Behavioral Health Centers of Excellence for California (SB852).
1. Sheftall AH, Asti L, Horowitz LM, et al. Suicide in elementary school-aged children and early adolescents. Pediatrics. 2016;138(4):e20160436. doi: 10.1542/peds.2016-0436. PubMed
2. Prevention CNC for I. Suicide facts at a Glance 2015 nonfatal suicidal thoughts and behavior. In: 2015:3-4. https://stacks.cdc.gov/view/cdc/34181/cdc_34181_DS1.pdf. Accessed September 30, 2016.
3. Curtin S, Warner M, Hedegaard H. Increase in Suicide in the United States, 1999-2014. Hyattsville, MD; 2016. http://www.cdc.gov/nchs/data/databriefs/db241.pdf. Accessed November 7, 2016. PubMed
4. Nock MK, Green JG, Hwang I, et al. Prevalence, correlates, and treatment of lifetime suicidal behavior among adolescents: results from the national comorbidity survey replication adolescent supplement. JAMA Psychiatry. 2013;70(3):300. doi: 10.1001/2013.jamapsychiatry.55. PubMed
5. Bostwick JM, Pabbati C, Geske JR, Mckean AJ. Suicide attempt as a risk factor for completed suicide: even more lethal than we knew. Am J Psychiatry. 2016;173(11):1094-1100. doi: 10.1176/appi.ajp.2016.15070854. PubMed
6. Torio CM, Encinosa W, Berdahl T, McCormick MC, Simpson LA. Annual report on health care for children and youth in the united states: national estimates of cost, utilization and expenditures for children with mental health conditions. Acad Pediatr. 2015;15(1):19-35. doi: 10.1016/j.acap.2014.07.007. PubMed
7. Olfson M, Wall M, Wang S, et al. Suicide after deliberate self-harm in adolescents and young adults. Pediatrics. 2018;141(4):e20173517. doi: 10.1542/peds.2017-3517. PubMed
8. Gay JC, Zima BT, Coker TR, et al. Postacute care after pediatric hospitalizations for a primary mental health condition. J Pediatr. 2018;193:222-228.e1. doi: 10.1016/j.jpeds.2017.09.058. PubMed
9. Heslin KC, Weiss AJ. Hospital Readmissions Involving Psychiatric Disorders, 2012. 2015. https://www.ncbi.nlm.nih.gov/books/NBK305353/pdf/Bookshelf_NBK305353.pdf. Accessed September 8, 2017. PubMed
10. Feng JY, Toomey SL, Zaslavsky AM, Nakamura MM, Schuster MA. Readmission after pediatric mental health admissions. Pediatrics. 2017;140(6):e20171571. doi: 10.1542/peds.2017-1571. PubMed
11. Bardach NS, Vittinghoff E, Asteria-Peñaloza R, et al. Measuring hospital quality using pediatric readmission and revisit rates. Pediatrics. 2013;132(3):429-436. doi: 10.1542/peds.2012-3527. PubMed
12. Callahan ST, Fuchs DC, Shelton RC, et al. Identifying suicidal behavior among adolescents using administrative claims data. Pharmacoepidemiol Drug Saf. 2013;22(7):769-775. doi: 10.1002/pds.3421. PubMed
13. SAMHSA, HHS, Synectics for Management Decisions, Mathematica Policy Research. National Mental Health Services Survey: 2010: Data on Mental Health Treatment Facilities. http://media.samhsa.gov/data/DASIS/NMHSS2010D/NMHSS2010_Web.pdf. Accessed November 13, 2015.
14. Patrick AR, Miller M, Barber CW, Wang PS, Canning CF, Schneeweiss S. Identification of hospitalizations for intentional self-harm when E-codes are incompletely recorded. Pharmacoepidemiol Drug Saf. 2010;19(12):1263-1275. doi: 10.1002/pds.2037. PubMed
15. Mellesdal L, Mehlum L, Wentzel-Larsen T, Kroken R, Jørgensen HA. Suicide risk and acute psychiatric readmissions: a prospective cohort study. Psychiatr Serv. 2010;61(1):25-31. doi: 10.1176/appi.ps.61.1.25. PubMed
16. Agency for Healthcare Research and Quality, Centers for Medicare and Medicaid. Measure: Pediatric All-Condition Readmission Measure Measure Developer: Center of Excellence for Pediatric Quality Measurement (CEPQM). https://www.ahrq.gov/sites/default/files/wysiwyg/policymakers/chipra/factsheets/chipra_14-p008-1-ef.pdf. Accessed November 15, 2017.
17. Cancino RS, Culpepper L, Sadikova E, Martin J, Jack BW, Mitchell SE. Dose-response relationship between depressive symptoms and hospital readmission. J Hosp Med. 2014;9(6):358-364. doi: 10.1002/jhm.2180. PubMed
18. Carlisle CE, Mamdani M, Schachar R, To T. Aftercare, emergency department visits, and readmission in adolescents. J Am Acad Child Adolesc Psychiatry. 2012;51(3):283-293. http://www.sciencedirect.com/science/article/pii/S0890856711011002. Accessed November 2, 2015. PubMed
19. Fadum EA, Stanley B, Qin P, Diep LM, Mehlum L. Self-poisoning with medications in adolescents: a national register study of hospital admissions and readmissions. Gen Hosp Psychiatry. 2014;36(6):709-715. doi: 10.1016/j.genhosppsych.2014.09.004. PubMed
20. Bernet AC. Predictors of psychiatric readmission among veterans at high risk of suicide: the impact of post-discharge aftercare. Arch Psychiatr Nurs. 2013;27(5):260-261. doi: 10.1016/j.apnu.2013.07.001. PubMed
21. Feudtner C, Feinstein JA, Zhong W, Hall M, Dai D. Pediatric complex chronic conditions classification system version 2: updated for ICD-10 and complex medical technology dependence and transplantation. BMC Pediatr. 2014;14(1):199. doi: 10.1186/1471-2431-14-199. PubMed
22. HCUP. HCUP-US Tools & Software Page. http://www.hcup-us.ahrq.gov/toolssoftware/chronic/chronic.jsp. Published 2015. Accessed October 30, 2015.
23. Zima BT, Rodean J, Hall M, Bardach NS, Coker TR, Berry JG. Psychiatric disorders and trends in resource use in pediatric hospitals. Pediatrics. 2016;138(5):e20160909-e20160909. doi: 10.1542/peds.2016-0909. PubMed
24. Spicer RS, Miller TR. Suicide acts in 8 states: incidence and case fatality rates by demographics and method. Am J Public Health. 2000;90(12):1885-1891. doi: 10.2105/AJPH.90.12.1885. PubMed
25. Hansen B, Lang M. Back to school blues: Seasonality of youth suicide and the academic calendar. Econ Educ Rev. 2011;30(5):850-861. doi: 10.1016/j.econedurev.2011.04.012.
26. Lueck C, Kearl L, Lam CN, Claudius I. Do emergency pediatric psychiatric visits for danger to self or others correspond to times of school attendance? Am J Emerg Med. 2015;33(5):682-684. doi: 10.1016/J.AJEM.2015.02.055. PubMed
27. Healthcare Cost And Utilization Project. Introduction to the HCUP Nationwide Readmissions Database. Rockville, MD; 2017. https://www.hcup-us.ahrq.gov/db/nation/nrd/Introduction_NRD_2010-2014.pdf. Accessed November 14, 2017.
28. Bardach NS, Coker TR, Zima BT, et al. Common and costly hospitalizations for pediatric mental health disorders. Pediatrics. 2014;133(4):602-609. doi: 10.1542/peds.2013-3165. PubMed
29. Ahmedani BK, Peterson EL, Hu Y, et al. Major physical health conditions and risk of suicide. Am J Prev Med. 2017;53(3):308-315. doi: 10.1016/J.AMEPRE.2017.04.001. PubMed
30. Gunnell D, Hawton K, Ho D, et al. Hospital admissions for self harm after discharge from psychiatric inpatient care: cohort study. BMJ. 2008;337:a2278. doi: 10.1136/bmj.a2278. PubMed
31. The TADS Team. The treatment for adolescents with depression study (TADS). Arch Gen Psychiatry. 2007;64(10):1132. doi: 10.1001/archpsyc.64.10.1132. PubMed
32. While D, Bickley H, Roscoe A, et al. Implementation of mental health service recommendations in England and Wales and suicide rates, 1997-2006: A cross-sectional and before-and-after observational study. Lancet. 2012;379(9820):1005-1012. doi: 10.1016/S0140-6736(11)61712-1. PubMed
33. Kawanishi C, Aruga T, Ishizuka N, et al. Assertive case management versus enhanced usual care for people with mental health problems who had attempted suicide and were admitted to hospital emergency departments in Japan (ACTION-J): a multicentre, randomised controlled trial. Lancet Psychiatry. 2014;1(3):193-201. doi: 10.1016/S2215-0366(14)70259-7. PubMed
34. Grupp-Phelan J, McGuire L, Husky MM, Olfson M. A randomized controlled trial to engage in care of adolescent emergency department patients with mental health problems that increase suicide risk. Pediatr Emerg Care. 2012;28(12):1263-1268. doi: 10.1097/PEC.0b013e3182767ac8. PubMed
35. Ciciolla L, Curlee AS, Karageorge J, Luthar SS. When mothers and fathers are seen as disproportionately valuing achievements: implications for adjustment among upper middle class youth. J Youth Adolesc. 2017;46(5):1057-1075. doi: 10.1007/s10964-016-0596-x. PubMed
36. Plemmons G, Hall M, Doupnik S, et al. Hospitalization for suicide ideation or attempt: 2008–2015. Pediatrics. May 2018:e20172426. doi: 10.1542/peds.2017-2426. PubMed
Suicide is a leading cause of death among 10- to 34-year-olds in the United States.1,2 During the past two decades, the youth suicide death rate has risen by 24%, and more than 5,000 young people die from suicide each year.3 Suicide ideation (SI) and suicide attempts (SAs) are well-established risk factors for suicide death and a source of morbidity for patients and families. One-third of youth with SI attempt suicide at some point in their lifetime.4 Approximately 11% of youth SAs result in suicide death, and 2% of youth who attempt suicide subsequently go on to die from suicide after recovering from a prior SA.5 More than 60,000 youth are hospitalized for SI or SA each year,6 and young people hospitalized for SA are at high short-term risk of repeat SA and suicide death.7 Hospitals need strategies for measuring the quality of SI and SA hospitalizations, monitoring postdischarge outcomes, and identifying the patients at the highest risk of poor outcomes. Readmissions are a useful hospital quality measure that can indicate re-emergence of SI, repeat SA, or inadequate community-based mental health treatment, and interventions designed for patients with readmissions can potentially avert morbidity or mortality.
The National Committee on Quality Assurance recommends measurement of quality metrics for 30-day mental health follow-up after psychiatric hospitalizations, 30-day readmissions after adult (but not pediatric) psychiatric hospitalizations, and 30-day readmissions in pediatric medical and surgical hospitalizations. Readmission measures are not consistently used to evaluate pediatric psychiatric hospitalizations, and psychiatric quality measures are not used to evaluate medical or surgical hospitalizations for SA. Recent research has investigated transfers to postacute care,8 readmission prevalence, variation in hospital readmission performance, and risk factors for readmissions after pediatric psychiatric hospitalizations.9–11 However, no national study has investigated 30-day readmissions in youth hospitalized specifically for SI or SA.
To inform hospital quality measurement and improve hospital and postdischarge care for youth at risk of suicide, more information is needed about the characteristics of and the risk factors for readmissions after index SI/SA hospitalization. To address this knowledge gap, among SI/SA hospitalizations in 6- to 17-year-olds, we examined (1) unplanned 30-day readmissions and characteristics of hospitalizations by 30-day readmission status; (2) patient, hospital, and regional characteristics associated with 30-day readmissions; and (3) characteristics of 30-day readmissions.
METHODS
Study Design and Data Source
We conducted a national, retrospective cohort study of hospitalizations for patients aged 6-17 years using the Agency for Healthcare Research and Quality (AHRQ) 2013 and 2014 Nationwide Readmissions Database (NRD). The combined 2013-2014 NRD includes administrative data from a nationally representative sample of 29 million hospitalizations in 22 states, accounting for 49.3% of all US hospitalizations, and is weighted for national projections. The NRD includes hospital information, patient demographic information, and International Classification of Diseases, Ninth Revision, Clinical Modification (ICD-9-CM) diagnosis, procedure, and external cause of injury codes (E-codes). The database includes one primary diagnosis, up to 24 additional diagnoses, and up to 4 E-codes for each hospitalization. The NRD includes information about hospitalizations in acute-care general hospitals (including their psychiatric units) but not from specialty psychiatric hospitals. The database also includes de-identified, verified patient linkage numbers so that patients can be tracked across multiple hospitalizations at the same institution or different institutions within the same state. This study was considered to be exempt from review by the Children’s Hospital of Philadelphia Institutional Review Board.
Sample
We identified a sample of 181,575 hospitalizations for SI (n = 119,037) or SA (n = 62,538) among 6- to 17-year-olds between January 1, 2013, and December 31, 2014 (Figure). We included children as young as 6 years because validated methods exist to identify SI and SA in this age group,12 and because suicide deaths have recently increased among younger children.3 We excluded patients aged 18 years and older from this study since delivery of mental health services differs for adults.13 To create the sample, we first identified all hospitalizations of patients aged 6-17 years. We then used a validated algorithm relying on ICD-9-CM diagnosis codes for poisonings and E-codes for self-injury (E950-959) to identify hospitalizations related to SA.12 Because E-code completeness varies among states,14 we also used the combination of having both a diagnosis code for injury (800-999) and an ICD-9-CM code for SI (V62.84) as a proxy for SA. Among hospitalizations without SA, we identified hospitalizations with SI using the ICD-9-CM code for SI (V62.84) in any position.
We identified 133,516 index hospitalizations with complete data at risk for an unplanned readmission. Because NRD data cannot be linked between calendar years, we limited the study time period for each calendar year to 10 months. We excluded hospitalizations in January because the full 30-day time frame to determine whether a hospitalization had occurred in the preceding 30 days, a known risk factor for readmissions in other samples,15 was not available. We excluded index hospitalizations occurring in December, because the full 30-day time frame to ascertain readmissions was not available. We excluded hospitalizations resulting in death, since these are not at risk for readmission, and hospitalizations resulting in transfer, since the timing of discharge to the community was not known. Readmission hospitalizations were eligible to be included as index hospitalizations if they met sample inclusion criteria. The final sample for readmission analyses included 95,354 SI hospitalizations and 38,162 SA hospitalizations (Figure).
Primary Outcome
The primary outcome was any unplanned, all-cause readmission within 30 days of index hospitalization for SI or SA. Among 30-day readmissions, we examined readmission timing, whether the readmission was to the same hospital or a different hospital, length of stay, and indication for readmission (medical/surgical or psychiatric, and presence of SI or SA diagnoses). Planned readmissions were identified using measure specifications endorsed by the AHRQ and the National Quality Forum16 and excluded from measurement.
Among index hospitalizations for SI, we specifically examined 30-day readmissions for subsequent SA, since one objective of hospitalization for SI is to prevent progression to SA or death. We could not identify hospitalizations for repeat SA after index hospitalization for SA, because diagnosis codes did not differentiate between readmission for complications of index SA and readmission for repeat SA.
Independent Variables
We analyzed demographic, clinical, and hospital factors associated with readmissions in other samples.17–20 Demographic characteristics included patient gender and age, urban or rural residence, payer, and median national income quartile for a patient’s ZIP code. Race and ethnicity data are not available in the NRD.
Clinical characteristics included hospitalization in the 30-days preceding the index hospitalization, index hospitalization length of stay, and admission via the emergency department (ED) versus direct admission. A patient’s chronic condition profile was determined using index hospitalization diagnosis codes. Complex chronic conditions (eg, cancer, cystic fibrosis) were identified using a classification system used in several prior studies of hospital administrative datasets,21 and other noncomplex chronic medical conditions (eg, asthma, obesity) were identified using the Healthcare Cost and Utilization Project (HCUP) chronic condition indicator system.22 Psychiatric conditions (eg, anxiety disorders, substance abuse, autism) were identified and categorized using a classification system used in studies of hospital administrative datasets.23 The number of psychiatric conditions was determined by counting the number of psychiatric condition categories in which a patient had a diagnosis. SA was categorized as having lower risk of death (eg, medication overdose, injury from cutting or piercing) or higher risk of death (eg, hanging, suffocation, or firearm injury).24
Because of known temporal trends in SI and SA,25,26 the month and year of admission were included as covariates. Hospital characteristics included teaching hospital and children’s hospital designations.
Statistical Analysis
We compared descriptive, summary statistics for characteristics of index hospitalizations with and without a 30-day readmission using Rao-Scott chi-square tests. In multivariable analyses, we derived logistic regression models to measure the associations of patient, hospital, and temporal factors with 30-day hospital readmissions. Analyses were conducted in SAS PROC SURVEYLOGISTIC and were weighted to achieve national estimates, clustered by sample stratum and hospital to account for the complex survey design,27 clustered by patients to account for multiple index visits per patient, and adjusted for clinical, demographic, and hospital characteristics. SAS version 9.4 (SAS Institute, Cary, North Carolina) was used for all analyses. All tests were two-sided, and a P value <.05 was considered as statistically significant.
RESULTS
Sample Characteristics
In the weighted analyses, we identified 133,516 hospitalizations in acute-care hospitals for SI or SA, and 8.5% (n = 11,375) of hospitalizations had at least one unplanned 30-day readmission to an acute-care hospital. Unweighted, the sample included 37,683 patients and 42,198 hospitalizations. Among all patients represented in the sample, 90.5% had only a single SI or SA hospitalization, 7.7% had two hospitalizations, and 1.8% had >2 hospitalizations in one year.
Table 1 summarizes the sample characteristics and displays the demographic, clinical, and hospital characteristics of index hospitalizations by the 30-day readmission status. Patients represented in the index hospitalizations were 64.9% female, 3.6% were aged 6-9 years, 40.1% were aged 10-14 years, and 56.3% were aged 15-17 years. Nearly half of the patients (49.1%) used public insurance. Nearly half (44.9%) lived in metropolitan areas with >1 million residents, 36.1% lived in metropolitan areas with 50,000 to 1 million residents, and 14.7% lived in rural areas.
Median length of stay for the index hospitalization was 5 days (interquartile range [IQR] 3-7). Nearly one-third (32.3%) of patients had a noncomplex chronic medical condition, 7.8% had a complex chronic medical condition, and 98.1% had a psychiatric condition. The most common psychiatric conditions were depressive disorders (60.0%) and anxiety disorders (42.2%). More than half (55.0%) of the patients had >2 psychiatric conditions. Most hospitalizations in the sample had SI only (71.4%). Among patients with SA, 81.0% had a lower lethality mechanism of injury and 19.0% had a higher lethality mechanism.
Patients experiencing a readmission were more likely to be 10-14 years old and use public insurance than patients without a readmission (P < .001 for both). For clinical characteristics, patients with a readmission were more likely to have longer index hospital stays (6 vs. 5 days), >2 psychiatric conditions (SI vs. SA), a prior admission in the 30 days preceding the index hospitalization, and admission via the ED (vs. direct admission) (P < .001 for all).
Association of Patient and Hospital Characteristics with Readmissions
Table 2 displays the patient and hospital characteristics associated with readmissions. Among demographic characteristics, 10- to 14-year-old patients had higher odds of readmission (odds ratio [OR]: 1.18, 95% confidence interval [CI]: 1.07-1.29) than 15- to 17-year-old patients. Having public insurance was associated with higher odds of readmission (OR: 1.14, 95% CI: 1.04-1.25). We found no differences in readmission rates based on sex, urban or rural location, or patient’s ZIP code income quartile.
Among clinical characteristics, hospitalizations with an admission for SI or SA in the preceding 30 days, meaning that the index hospitalization itself was a readmission, had the strongest association with readmissions (OR: 3.14, 95% CI: 2.73-3.61). In addition, patients admitted via the ED for the index hospitalization had higher odds of readmission (OR: 1.25, 95% CI: 1.15-1.36). Chronic psychiatric conditions associated with higher odds of readmission included psychotic disorders (OR: 1.39, 95% CI: 1.16-1.67) and bipolar disorder (OR: 1.27, 95% CI: 1.13-1.44).
Characteristics of 30-day Readmissions
Table 3 displays the characteristics of readmissions after SI compared to that after SA. Among the combined sample of 11,375 30-day readmissions, 34.1% occurred within 7 days, and 65.9% in 8-30 days. Eleven percent of patients with any readmission had more than one readmission within 30 days. Among readmissions, 94.5% were for a psychiatric problem and 5.5% were for a medical or surgical problem. A total of 43.9% had a diagnosis of SI and 19.5% a diagnosis of SA. Readmissions were more likely to occur at a different hospital after SI than after SA (48.1% vs. 31.3%, P < .001). Medical and surgical indications for readmission were less common after SI than after SA (4.4% vs. 8.7%, P < .001). Only 1.2% of SI hospitalizations had a readmission for SA within 30 days. Of these cases, 55.6% were aged 15-17 years, 43.3% were aged 10-14 years, and 1.1% were aged 6-9 years; 73.1% of the patients were female, and 49.1% used public insurance.
DISCUSSION
SI and SA in children and adolescents are substantial public health problems associated with significant hospital resource utilization. In 2013 and 2014, there were 181,575 pediatric acute-care hospitalizations for SI or SA, accounting for 9.5% of all hospitalizations in 6- to 17-year-old patients nationally. Among acute-care SI and SA hospitalizations, 8.5% had a readmission to an acute-care hospital within 30 days. The study data source did not include psychiatric specialty hospitals, and the number of index hospitalizations is likely substantially higher when psychiatric specialty hospitalizations are included. Readmissions may also be higher if patients were readmitted to psychiatric specialty hospitals after discharge from acute-care hospitals. The strongest risk factor for unplanned 30-day readmissions was a previous hospitalization in the 30 days before the index admission, likely a marker for severity or complexity of psychiatric illness. Other characteristics associated with higher odds of readmission were bipolar disorder, psychotic disorders, and age 10-14 years. More than one-third of readmissions occurred within the first 7 days after hospital discharge. The prevalence of SI and SA hospitalizations and readmissions was similar to findings in previous analyses of mental health hospitalizations.10,28
A patient’s psychiatric illness type and severity, as evidenced by the need for frequent repeat hospitalizations, was highly associated with the risk of 30-day readmission. Any hospitalization in the 30 days preceding the index hospitalization, whether for SI/SA or for another problem, was a strong risk factor for readmissions. We suspect that prior SI/SA hospitalizations reflect a patient’s chronic elevated risk for suicide. Prior hospitalizations not for SI or SA could be hospitalizations for mental illness exacerbations that increase the risk of SI or SA, eg, bipolar disorder with acute mania, or they could represent physical health problems. Chronic physical health problems are a known risk factor for SI and SA.29
A knowledge of those characteristics that increase the readmission risk can inform future resource allocation, research, and policy in several ways. First, longer hospital stays could mitigate readmission risk in some patients with severe psychiatric illness. European studies in older adolescents and adults show that for severe psychiatric illness, a longer hospital stay is associated with a lower risk of hospital readmission.15,30 Second, better access to intensive community-based mental health (MH) services, including evidence-based psychotherapy and medication management, improves symptoms in young people.31 Access to these services likely affects the risk of hospital readmission. We found that readmission risk was highest in 10- to 14-year-olds. Taken in the context of existing evidence that suicide rates are rising in younger patients,1,3 our findings suggest that particular attention to community services for younger patients is needed. Third, care coordination could help patients access beneficial services to reduce readmissions and improve other outcomes. Enhanced discharge care coordination reduced suicide deaths in high-risk populations in Europe32 and Japan33 and improved attendance at mental health follow-up after pediatric ED discharge in a small United States sample.34 Given that one-third of readmissions occurred within seven days, care coordination designed to ensure access to ambulatory services in the immediate postdischarge period may be particularly beneficial.
We found that ZIP code income quartile was not associated with readmissions. We suspect that poverty is not as closely correlated with MH hospitalization outcomes as it is with physical health hospitalization outcomes for several reasons. Medicaid insurance historically has more robust coverage of mental health services than some private insurance plans, which might offset some of the risk of poor mental health outcomes associated with poverty. Low-income families are eligible to use social services, and families accessing social services might have more opportunities to become familiar with community mental health programs. Further, the expectation of high achievement found in some higher income families is associated with MH problems in children and adolescents.35 Therefore, being in a higher income quartile might not be as protective against poor mental health outcomes as it is against poor physical health outcomes.
Although the NRD provides a rich source of readmission data across hospitals nationally, several limitations are inherent to this administrative dataset. First, data from specialty psychiatric hospitals were not included in the NRD. The study underestimates the total number of index hospitalizations and readmissions, since index SI/SA hospitalizations at psychiatric hospitals are not included, and readmissions are not included if they occurred at specialty psychiatric hospitals. Second, because data cannot be linked between calendar years, we excluded January and December hospitalizations, and findings might not generalize to hospitalizations in January and December. Seasonal trends in SI/SA hospitalizations are known to occur.36 Third, race, ethnicity, primary language, gender identity, and sexual orientation are not available in the NRD, and we could not examine the association of these characteristics with the likelihood of readmissions. Fourth, we did not have information about pre- or posthospitalization insurance enrollment or outpatient services that could affect the risk of readmission. Nevertheless, this study offers information on the characteristics of readmissions after hospitalizations for SI and SA in a large nationally representative sample of youth, and the findings can inform resource planning to prevent suicides.
CONCLUSION
Hospital readmissions are common in patients with SI and SA, and patients with a recent previous hospitalization have the highest risk of readmission. More than one-third of readmissions after SI or SA occurred within the first seven days. Due to the dearth of mental health services in the community, hospitals offer an important safety net for youth experiencing acute suicidal crises. Strategies to improve the continuum of care for patients at risk of suicide that solely focus on reducing readmissions are not likely to benefit patients. However, readmissions can identify opportunities for improving hospital discharge processes and outpatient services. Future research and clinical innovation to investigate and improve hospital discharge planning and access to community mental health services is likely to benefit patients and could reduce 30-day hospital readmissions.
Acknowledgments
The authors thank John Lawlor for his assistance with the analysis.
Disclosures
The authors have no potential conflicts of interest to disclose.
Funding
Dr. Zima received funding from the Behavioral Health Centers of Excellence for California (SB852).
1. Sheftall AH, Asti L, Horowitz LM, et al. Suicide in elementary school-aged children and early adolescents. Pediatrics. 2016;138(4):e20160436. doi: 10.1542/peds.2016-0436. PubMed
2. Prevention CNC for I. Suicide facts at a Glance 2015 nonfatal suicidal thoughts and behavior. In: 2015:3-4. https://stacks.cdc.gov/view/cdc/34181/cdc_34181_DS1.pdf. Accessed September 30, 2016.
3. Curtin S, Warner M, Hedegaard H. Increase in Suicide in the United States, 1999-2014. Hyattsville, MD; 2016. http://www.cdc.gov/nchs/data/databriefs/db241.pdf. Accessed November 7, 2016. PubMed
4. Nock MK, Green JG, Hwang I, et al. Prevalence, correlates, and treatment of lifetime suicidal behavior among adolescents: results from the national comorbidity survey replication adolescent supplement. JAMA Psychiatry. 2013;70(3):300. doi: 10.1001/2013.jamapsychiatry.55. PubMed
5. Bostwick JM, Pabbati C, Geske JR, Mckean AJ. Suicide attempt as a risk factor for completed suicide: even more lethal than we knew. Am J Psychiatry. 2016;173(11):1094-1100. doi: 10.1176/appi.ajp.2016.15070854. PubMed
6. Torio CM, Encinosa W, Berdahl T, McCormick MC, Simpson LA. Annual report on health care for children and youth in the united states: national estimates of cost, utilization and expenditures for children with mental health conditions. Acad Pediatr. 2015;15(1):19-35. doi: 10.1016/j.acap.2014.07.007. PubMed
7. Olfson M, Wall M, Wang S, et al. Suicide after deliberate self-harm in adolescents and young adults. Pediatrics. 2018;141(4):e20173517. doi: 10.1542/peds.2017-3517. PubMed
8. Gay JC, Zima BT, Coker TR, et al. Postacute care after pediatric hospitalizations for a primary mental health condition. J Pediatr. 2018;193:222-228.e1. doi: 10.1016/j.jpeds.2017.09.058. PubMed
9. Heslin KC, Weiss AJ. Hospital Readmissions Involving Psychiatric Disorders, 2012. 2015. https://www.ncbi.nlm.nih.gov/books/NBK305353/pdf/Bookshelf_NBK305353.pdf. Accessed September 8, 2017. PubMed
10. Feng JY, Toomey SL, Zaslavsky AM, Nakamura MM, Schuster MA. Readmission after pediatric mental health admissions. Pediatrics. 2017;140(6):e20171571. doi: 10.1542/peds.2017-1571. PubMed
11. Bardach NS, Vittinghoff E, Asteria-Peñaloza R, et al. Measuring hospital quality using pediatric readmission and revisit rates. Pediatrics. 2013;132(3):429-436. doi: 10.1542/peds.2012-3527. PubMed
12. Callahan ST, Fuchs DC, Shelton RC, et al. Identifying suicidal behavior among adolescents using administrative claims data. Pharmacoepidemiol Drug Saf. 2013;22(7):769-775. doi: 10.1002/pds.3421. PubMed
13. SAMHSA, HHS, Synectics for Management Decisions, Mathematica Policy Research. National Mental Health Services Survey: 2010: Data on Mental Health Treatment Facilities. http://media.samhsa.gov/data/DASIS/NMHSS2010D/NMHSS2010_Web.pdf. Accessed November 13, 2015.
14. Patrick AR, Miller M, Barber CW, Wang PS, Canning CF, Schneeweiss S. Identification of hospitalizations for intentional self-harm when E-codes are incompletely recorded. Pharmacoepidemiol Drug Saf. 2010;19(12):1263-1275. doi: 10.1002/pds.2037. PubMed
15. Mellesdal L, Mehlum L, Wentzel-Larsen T, Kroken R, Jørgensen HA. Suicide risk and acute psychiatric readmissions: a prospective cohort study. Psychiatr Serv. 2010;61(1):25-31. doi: 10.1176/appi.ps.61.1.25. PubMed
16. Agency for Healthcare Research and Quality, Centers for Medicare and Medicaid. Measure: Pediatric All-Condition Readmission Measure Measure Developer: Center of Excellence for Pediatric Quality Measurement (CEPQM). https://www.ahrq.gov/sites/default/files/wysiwyg/policymakers/chipra/factsheets/chipra_14-p008-1-ef.pdf. Accessed November 15, 2017.
17. Cancino RS, Culpepper L, Sadikova E, Martin J, Jack BW, Mitchell SE. Dose-response relationship between depressive symptoms and hospital readmission. J Hosp Med. 2014;9(6):358-364. doi: 10.1002/jhm.2180. PubMed
18. Carlisle CE, Mamdani M, Schachar R, To T. Aftercare, emergency department visits, and readmission in adolescents. J Am Acad Child Adolesc Psychiatry. 2012;51(3):283-293. http://www.sciencedirect.com/science/article/pii/S0890856711011002. Accessed November 2, 2015. PubMed
19. Fadum EA, Stanley B, Qin P, Diep LM, Mehlum L. Self-poisoning with medications in adolescents: a national register study of hospital admissions and readmissions. Gen Hosp Psychiatry. 2014;36(6):709-715. doi: 10.1016/j.genhosppsych.2014.09.004. PubMed
20. Bernet AC. Predictors of psychiatric readmission among veterans at high risk of suicide: the impact of post-discharge aftercare. Arch Psychiatr Nurs. 2013;27(5):260-261. doi: 10.1016/j.apnu.2013.07.001. PubMed
21. Feudtner C, Feinstein JA, Zhong W, Hall M, Dai D. Pediatric complex chronic conditions classification system version 2: updated for ICD-10 and complex medical technology dependence and transplantation. BMC Pediatr. 2014;14(1):199. doi: 10.1186/1471-2431-14-199. PubMed
22. HCUP. HCUP-US Tools & Software Page. http://www.hcup-us.ahrq.gov/toolssoftware/chronic/chronic.jsp. Published 2015. Accessed October 30, 2015.
23. Zima BT, Rodean J, Hall M, Bardach NS, Coker TR, Berry JG. Psychiatric disorders and trends in resource use in pediatric hospitals. Pediatrics. 2016;138(5):e20160909-e20160909. doi: 10.1542/peds.2016-0909. PubMed
24. Spicer RS, Miller TR. Suicide acts in 8 states: incidence and case fatality rates by demographics and method. Am J Public Health. 2000;90(12):1885-1891. doi: 10.2105/AJPH.90.12.1885. PubMed
25. Hansen B, Lang M. Back to school blues: Seasonality of youth suicide and the academic calendar. Econ Educ Rev. 2011;30(5):850-861. doi: 10.1016/j.econedurev.2011.04.012.
26. Lueck C, Kearl L, Lam CN, Claudius I. Do emergency pediatric psychiatric visits for danger to self or others correspond to times of school attendance? Am J Emerg Med. 2015;33(5):682-684. doi: 10.1016/J.AJEM.2015.02.055. PubMed
27. Healthcare Cost And Utilization Project. Introduction to the HCUP Nationwide Readmissions Database. Rockville, MD; 2017. https://www.hcup-us.ahrq.gov/db/nation/nrd/Introduction_NRD_2010-2014.pdf. Accessed November 14, 2017.
28. Bardach NS, Coker TR, Zima BT, et al. Common and costly hospitalizations for pediatric mental health disorders. Pediatrics. 2014;133(4):602-609. doi: 10.1542/peds.2013-3165. PubMed
29. Ahmedani BK, Peterson EL, Hu Y, et al. Major physical health conditions and risk of suicide. Am J Prev Med. 2017;53(3):308-315. doi: 10.1016/J.AMEPRE.2017.04.001. PubMed
30. Gunnell D, Hawton K, Ho D, et al. Hospital admissions for self harm after discharge from psychiatric inpatient care: cohort study. BMJ. 2008;337:a2278. doi: 10.1136/bmj.a2278. PubMed
31. The TADS Team. The treatment for adolescents with depression study (TADS). Arch Gen Psychiatry. 2007;64(10):1132. doi: 10.1001/archpsyc.64.10.1132. PubMed
32. While D, Bickley H, Roscoe A, et al. Implementation of mental health service recommendations in England and Wales and suicide rates, 1997-2006: A cross-sectional and before-and-after observational study. Lancet. 2012;379(9820):1005-1012. doi: 10.1016/S0140-6736(11)61712-1. PubMed
33. Kawanishi C, Aruga T, Ishizuka N, et al. Assertive case management versus enhanced usual care for people with mental health problems who had attempted suicide and were admitted to hospital emergency departments in Japan (ACTION-J): a multicentre, randomised controlled trial. Lancet Psychiatry. 2014;1(3):193-201. doi: 10.1016/S2215-0366(14)70259-7. PubMed
34. Grupp-Phelan J, McGuire L, Husky MM, Olfson M. A randomized controlled trial to engage in care of adolescent emergency department patients with mental health problems that increase suicide risk. Pediatr Emerg Care. 2012;28(12):1263-1268. doi: 10.1097/PEC.0b013e3182767ac8. PubMed
35. Ciciolla L, Curlee AS, Karageorge J, Luthar SS. When mothers and fathers are seen as disproportionately valuing achievements: implications for adjustment among upper middle class youth. J Youth Adolesc. 2017;46(5):1057-1075. doi: 10.1007/s10964-016-0596-x. PubMed
36. Plemmons G, Hall M, Doupnik S, et al. Hospitalization for suicide ideation or attempt: 2008–2015. Pediatrics. May 2018:e20172426. doi: 10.1542/peds.2017-2426. PubMed
© 2018 Society of Hospital Medicine
The Virtual Hospitalist: The Future is Now
Compared with other industries, medicine has been slow to embrace the digital age. Electronic health records have only recently become ubiquitous, and that was only realized after governmental prodding through Meaningful Use legislation. Other digital tools, such as video or remote sensor technologies, have been available for decades but had not been introduced into routine medical care until recently for various reasons, ranging from costs to security to reimbursement rules. However, we are currently in the midst of a paradigm shift in medicine toward virtual care, as exemplified by the Kaiser Permanente CEO’s proclamation in 2017 that this capitated care system had moved over half of its 100 million annual patient encounters to the virtual environment.1
Regulation – both at the state and federal levels – has been the largest barrier to the adoption of virtual care. State licensure regulations for practicing medicine hamper virtual visits, which can otherwise be easily achieved without regard to geography. Although the Centers for Medicare & Medicaid Services (CMS) has had provisions for telehealth billing, these have been largely limited to rural areas. However, regulations are constantly evolving as the Interstate Medical Licensure Compact list is not CMS. The Interstate Medical Licensure Compact (www.imlcc.org) is an agreement involving 24 states that permits licensed physicians to practice medicine across state lines. CMS has recently proposed to add payments for virtual check-in visits, which will not be subject to the prior limitations on Medicare telehealth services.2 These and future changes in regulation will likely spur the rapid adoption and evolution of virtual services.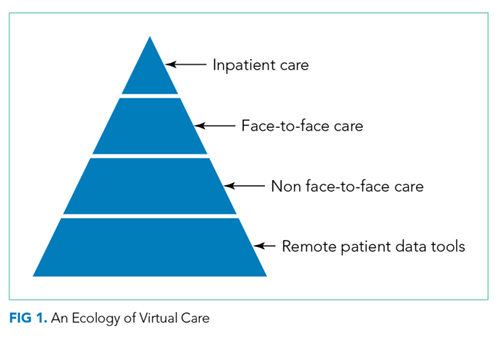
In this context, the article by Kuperman et al.3 provides a welcoming view of the future of hospital medicine. The authors demonstrated the feasibility of using a “virtual hospitalist” to manage patients admitted to a small rural hospital that lacked the patient volumes and resources to justify on-site hospitalist staffing. The patients benefited from the clinical expertise of an experienced inpatient provider while staying near their homes. This article adds to the growing literature on the use of these technologies in the hospital settings, which range from the management of patients in the intensive care unit4 to stroke patients in the ED5 and to inpatient psychiatric consultation.6
What are the implications for hospitalists? We need to prepare the current and future generations of hospitalists for practice in an evolving digital environment. “Choosing Wisely®: Things We Do For No Reason” is one of the most popular segments of JHM for a good reason: there are many things in the field of medicine because “that’s the way we always did it.” The capabilities unleashed by digital technologies will require hospitalists to rethink how we manage patients in acute and subacute settings and after discharge. Although these tools show a substantial promise to help us achieve the Triple Aim, we will need considerably more research to understand the costs and effectiveness of these new digital technologies and approaches.7,8 We also need new payment models that recognize their value. Finally, we also need to be aware that doctoring elements, such as human touch, physical presence, and emotional connection, can be encumbered and not enhanced by digital technologies.9
Disclosures
Dr. Ong and Dr. Brotman have nothing to disclose.
1. Why Digital Transformations Are Hard. Wall Street Journal. March 7, 2017, 2017.
2. Medicare Program: Revisions to Payment Policies under the Physician Fee Schedule and Other Revisions to Part B for CY 2019; Medicare Shared Savings Program Requirements; etc. In: Centers for Medicare & Medicaid Services, ed: Federal Register; 2018:1472.
3. Kuperman EF, Linson EL, Klefstad K, Perry E, Glenn K. The virtual hospitalist: a single-site implementation bringing hospitalist coverage to critical access hospitals. J Hosp Med. 2018. In Press. PubMed
4. Lilly CM, Cody S, Zhao H, et al. Hospital mortality, length of stay, and preventable complications among critically ill patients before and after tele-ICU reengineering of critical care processes. JAMA. 2011;305(21):2175-2183. doi: 10.1001/jama.2011.697. PubMed
5. Meyer BC, Raman R, Hemmen T, et al. Efficacy of site-independent telemedicine in the STRokE DOC trial: a randomised, blinded, prospective study. Lancet Neurol. 2008;7(9):787-795. doi: 10.1016/S1474-4422(08)70171-6. PubMed
6. Arevian AC, Jeffrey J, Young AS, Ong MK. Opportunities for flexible, on-demand care delivery through telemedicine. Psychiatr Serv. 2018;69(1):5-8. doi: 10.1176/appi.ps.201600589. PubMed
7. Ashwood JS, Mehrotra A, Cowling D, Uscher-Pines L. Direct-to-consumer telehealth may increase access to care but does not decrease spending. Health Aff (Millwood). 2017;36(3):485-491. doi: 10.1377/hlthaff.2016.1130. PubMed
8. Ong MK, Romano PS, Edgington S, et al. Effectiveness of remote patient monitoring after discharge of hospitalized patients with heart failure: the better effectiveness after transition -- Heart Failure (BEAT-HF) Randomized Clinical Trial. JAMA Intern Med. 2016;176(3):310-318. doi: 10.1001/jamainternmed.2015.7712. PubMed
9. Verghese A. Culture shock--patient as icon, icon as patient. N Engl J Med. 2008;359(26):2748-2751. doi: 10.1056/NEJMp0807461. PubMed
Compared with other industries, medicine has been slow to embrace the digital age. Electronic health records have only recently become ubiquitous, and that was only realized after governmental prodding through Meaningful Use legislation. Other digital tools, such as video or remote sensor technologies, have been available for decades but had not been introduced into routine medical care until recently for various reasons, ranging from costs to security to reimbursement rules. However, we are currently in the midst of a paradigm shift in medicine toward virtual care, as exemplified by the Kaiser Permanente CEO’s proclamation in 2017 that this capitated care system had moved over half of its 100 million annual patient encounters to the virtual environment.1
Regulation – both at the state and federal levels – has been the largest barrier to the adoption of virtual care. State licensure regulations for practicing medicine hamper virtual visits, which can otherwise be easily achieved without regard to geography. Although the Centers for Medicare & Medicaid Services (CMS) has had provisions for telehealth billing, these have been largely limited to rural areas. However, regulations are constantly evolving as the Interstate Medical Licensure Compact list is not CMS. The Interstate Medical Licensure Compact (www.imlcc.org) is an agreement involving 24 states that permits licensed physicians to practice medicine across state lines. CMS has recently proposed to add payments for virtual check-in visits, which will not be subject to the prior limitations on Medicare telehealth services.2 These and future changes in regulation will likely spur the rapid adoption and evolution of virtual services.
In this context, the article by Kuperman et al.3 provides a welcoming view of the future of hospital medicine. The authors demonstrated the feasibility of using a “virtual hospitalist” to manage patients admitted to a small rural hospital that lacked the patient volumes and resources to justify on-site hospitalist staffing. The patients benefited from the clinical expertise of an experienced inpatient provider while staying near their homes. This article adds to the growing literature on the use of these technologies in the hospital settings, which range from the management of patients in the intensive care unit4 to stroke patients in the ED5 and to inpatient psychiatric consultation.6
What are the implications for hospitalists? We need to prepare the current and future generations of hospitalists for practice in an evolving digital environment. “Choosing Wisely®: Things We Do For No Reason” is one of the most popular segments of JHM for a good reason: there are many things in the field of medicine because “that’s the way we always did it.” The capabilities unleashed by digital technologies will require hospitalists to rethink how we manage patients in acute and subacute settings and after discharge. Although these tools show a substantial promise to help us achieve the Triple Aim, we will need considerably more research to understand the costs and effectiveness of these new digital technologies and approaches.7,8 We also need new payment models that recognize their value. Finally, we also need to be aware that doctoring elements, such as human touch, physical presence, and emotional connection, can be encumbered and not enhanced by digital technologies.9
Disclosures
Dr. Ong and Dr. Brotman have nothing to disclose.
1. Why Digital Transformations Are Hard. Wall Street Journal. March 7, 2017, 2017.
2. Medicare Program: Revisions to Payment Policies under the Physician Fee Schedule and Other Revisions to Part B for CY 2019; Medicare Shared Savings Program Requirements; etc. In: Centers for Medicare & Medicaid Services, ed: Federal Register; 2018:1472.
3. Kuperman EF, Linson EL, Klefstad K, Perry E, Glenn K. The virtual hospitalist: a single-site implementation bringing hospitalist coverage to critical access hospitals. J Hosp Med. 2018. In Press. PubMed
4. Lilly CM, Cody S, Zhao H, et al. Hospital mortality, length of stay, and preventable complications among critically ill patients before and after tele-ICU reengineering of critical care processes. JAMA. 2011;305(21):2175-2183. doi: 10.1001/jama.2011.697. PubMed
5. Meyer BC, Raman R, Hemmen T, et al. Efficacy of site-independent telemedicine in the STRokE DOC trial: a randomised, blinded, prospective study. Lancet Neurol. 2008;7(9):787-795. doi: 10.1016/S1474-4422(08)70171-6. PubMed
6. Arevian AC, Jeffrey J, Young AS, Ong MK. Opportunities for flexible, on-demand care delivery through telemedicine. Psychiatr Serv. 2018;69(1):5-8. doi: 10.1176/appi.ps.201600589. PubMed
7. Ashwood JS, Mehrotra A, Cowling D, Uscher-Pines L. Direct-to-consumer telehealth may increase access to care but does not decrease spending. Health Aff (Millwood). 2017;36(3):485-491. doi: 10.1377/hlthaff.2016.1130. PubMed
8. Ong MK, Romano PS, Edgington S, et al. Effectiveness of remote patient monitoring after discharge of hospitalized patients with heart failure: the better effectiveness after transition -- Heart Failure (BEAT-HF) Randomized Clinical Trial. JAMA Intern Med. 2016;176(3):310-318. doi: 10.1001/jamainternmed.2015.7712. PubMed
9. Verghese A. Culture shock--patient as icon, icon as patient. N Engl J Med. 2008;359(26):2748-2751. doi: 10.1056/NEJMp0807461. PubMed
© 2018 Society of Hospital Medicine
The Virtual Hospitalist: A Single-Site Implementation Bringing Hospitalist Coverage to Critical Access Hospitals
Through increased involvement with families and caregivers, community hospitals can deliver better healthcare to patients.1,2 Furthermore, when patients bypass local hospitals and directly present to tertiary care, mortality for time-sensitive illnesses, such as sepsis, increases.3 Unfortunately, although critical access hospitals (CAHs) had an equivalent risk-adjusted mortality in 2002, they have failed to improve their performance at the same rate as that of larger hospitals and lag in quality metrics.4,5
One potential contributor to the lagging performance may be the low uptake of the hospitalist model at these facilities.6 Although dedicated hospitalists have improved patient outcomes and decreased spending in large hospitals,7-9 implementing the hospitalist medicine model on a smaller scale remains difficult. Approximately 1,300 CAHs provide necessary emergency room and inpatient services in the rural United States.10 Assuming 12-hour shifts and every-other-week assignments, providing continuous, on-location hospitalist coverage would require more than 10% of the total hospitalist workforce to cover less than 3% of all hospital admissions.11-13
Telemedicine allows content experts, including hospitalists, to supervise patient care remotely. This provides a potential solution to the logistical challenges of supplying continuous hospitalist coverage to a remote facility with a low daily census. We hypothesized that providing continuous “virtual hospitalist” coverage through telemedicine could increase the ability of a CAH to care for patients locally, decreasing the number of transfers to tertiary care centers and improving patient and provider satisfaction. We aimed to create a 25% relative reduction in CAH Emergency Department (ED) patient encounters resulting in transfer to outside hospitals within 6 months.
This quality improvement project was exempt from Institutional Review Board review.
METHODS
Setting
The University of Iowa Hospitals and Clinics (UIHC) is a 750-bed teaching hospital based in a suburban community in Eastern Iowa and the only tertiary care hospital in the state of Iowa. The UIHC Hospitalist group contains 44 staff physicians and covers more than 12 service lines (both faculty-only and resident-covered) at this facility.
Van Buren County Hospital (VBCH) is a 24-bed CAH offering emergency, internal medicine, and obstetrical services and located 80 miles southwest of UIHC. X-ray and CT scan services are available continuously, but ultrasound and magnetic resonance imaging services are available only 2-3 times per week. While tertiary care patients were transferred to UIHC, patients requiring specialty care but with less complex illnesses (eg, stable myocardial infarction) were referred to closer facilities.
Prior to implementation, coverage of the acute inpatient ward and the emergency room at VBCH was simultaneously provided by a single physician or advanced practice providers (APPs). When APPs provided coverage, a physician was required to be notified of any new admissions and was immediately available for medical emergencies. The VBCH providers worked alone in 48- to 72-hour continuous shifts as the sole coverage for both ED and inpatient units. It was frequently necessary to bring in outside providers through locum tenens agencies to fill gaps in the provider schedule. Both VBCH and UIHC used a shared electronic medical record (EMR), which was a key consideration in choosing VBCH as our pilot site. Providers at both institutions had access to identical patient information through the EMR, including radiology images, laboratory results, and provider notes.
Intervention Development and Implementation
A site visit by clinical and administrative project leads to VBCH identified three deficits that we could address through telemedicine: (1) The extended duration of VBCH shifts was detrimental to provider experience and retention; (2) Lack of local expertise in hospital medicine led to limited comfort in caring for patients with stable but medically complex conditions (eg, drug-resistant urinary tract infection); and (3) Patient transitions between VBCH and UIHC during acute care transfer were frustrating and led to negative experiences with providers and patients.
We developed a model to address these deficits using the minimum number of specialties and employees to facilitate rapid implementation. Although local care ED and inpatient care was provided by 3 APPS and a single physician provider, we mandated the coverage of all acute inpatients by the virtual hospitalists. This coverage included daily videoconference patient rounds, continuous pager coverage for new acute issues, and listing the virtual hospitalists as the attending of record for patient admissions. We scheduled contact times in the morning and afternoon to accelerate familiarity and comfort with the technology. We used a secure, Health Insurance Portability and Accountability Act of 1996 (HIPAA)-compliant platform for videoconferencing, accessible through personal computers or portable smart devices (Vidyo, VidyoInc, Hackensack, New Jersey). At VBCH, two tablet computers were provided to serve as portable platforms to use either in provider conference rooms or to be taken into patient rooms. Twice a day, at 8:45
Outcome Measures
Outcome measures were divided into three categories: (1) clinical and utilization outcomes; (2) virtual hospitalist outcomes; and (3) satisfaction outcomes. The primary clinical outcome was the percentage of ED encounters resulting in transfer to a different acute care hospital. We also monitored alternative ED dispositions, including local inpatient admission. Additional clinical and utilization outcomes after ED admission included the mean daily inpatient census at VBCH and the case mix index (CMI). We selected the mean length of stay, the percentage of inpatients transferred to other hospitals, and the inpatient mortality as balance measures due to concerns of increasing the acuity of the inpatient wards beyond the comfort and expertise of local staff. Virtual hospitalist outcomes included the mean daily time commitment and the mean time commitment per patient. Virtual hospitalists self-reported their time commitments as part of their daily documentation. We chose these measures in anticipation of expanding this program to other institutions in the future. Satisfaction outcomes included a weekly survey to all VBCH physicians and nursing staff (Appendix 1), weekly group discussions with virtual hospitalists and CAH staff, and 3 interviews with patients and family members after discharge (Appendix 2).
Statistical Analysis
Baseline data collected over a period of 24 weeks were used to measure pre-implementation performance and trends at VBCH. The virtual hospitalist service was started on November 15, 2016, and the two weeks before and two weeks after this date were excluded from analysis as a transition period. To account for weekend variation, we reported data in consecutive 28-day blocks. We used Chi-square tests to compare proportional outcomes and Student’s t-tests for continuous variables. Statistical Process Control charts were used to evaluate for temporal trends in quantitative data.
Funding
Development of this project was funded through the University of Iowa Hospitalist group and the Signal Center for Health Innovations at UI Health Ventures. Virtual hospitalist clinical time was paid for by the CAH on a fractional basis of a traditional hospitalist based on projected patient volumes through analysis of baseline data. Patients were not directly billed for virtual hospitalist service but were charged for the services provided by CAH providers.
RESULTS
Clinical and Utilization Outcomes
During the 24-week baseline period, VBCH had 947 ED encounters and 176 combined acute inpatient and observation admissions. For the 24 weeks following the transition, there were 930 ED visits and 186 admissions. We observed a 36% (157/947 to 98/930, P < .001) decrease in ED encounters ending in patient transfer to another hospital (Figure). In parallel, VBCH ED visits leading to local admission increased by 62% of baseline (39/947 to 62/930, P = .014). There was no significant change in the fraction of ED encounters resulting in an observation stay (104/947 to 99/930, P = .814). Daily ED visits did not change after virtual hospitalist coverage began (5.64 to 5.54 visits/day, P = .734), but the percentage of ED visits ending in discharge to a nonmedical setting increased from 79.0% to 82.7% (748/947 to 769/930, P = .042).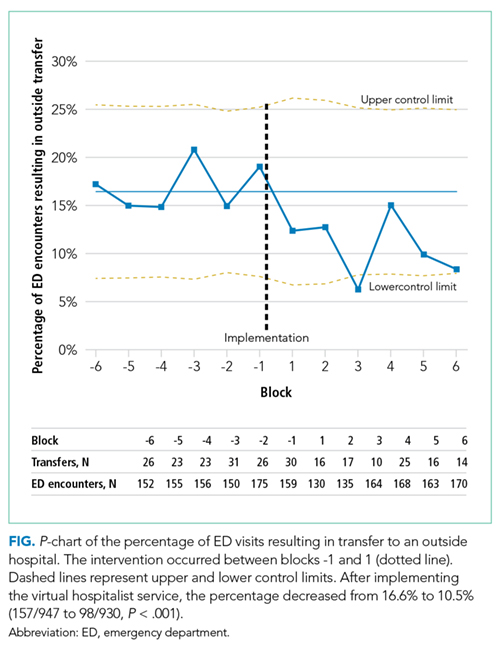
The implementation did not have a significant impact on ward census or patient complexity (Table 1). Both CMI and mean length of stay did not change after starting the service. The study was underpowered to detect differences in rare events, including inpatient mortality and transfer after admission. Despite the decrease in transfers, inpatient census was unchanged. This coincides with a 17% decrease (196/947 to 160/930, P = .054) in the proportion of ED patients referred for admission either locally or at an outside hospital.
Virtual Hospitalist Outcomes
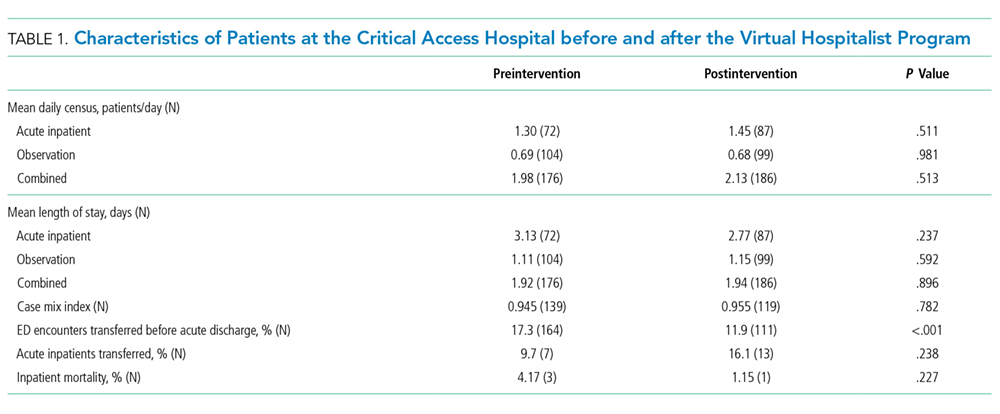
Satisfaction Outcomes
The staff at VBCH identified several benefits to the virtual hospitalist service. Survey responses (N = 18) were positive, with staff expressing specific gratitude for the additional education and training provided by the virtual hospitalists. On a Likert scale ranging from 1 (very poor) to 5 (excellent), the respondents gave high mean scores to the overall service experience (4.8) and the effectiveness of care delivered (4.9) but were more critical of the ability to keep patients locally (4.5) and the experience with transferring patients (3.9). We also collected free-text feedback from both patients and staff at VBCH (Table 2).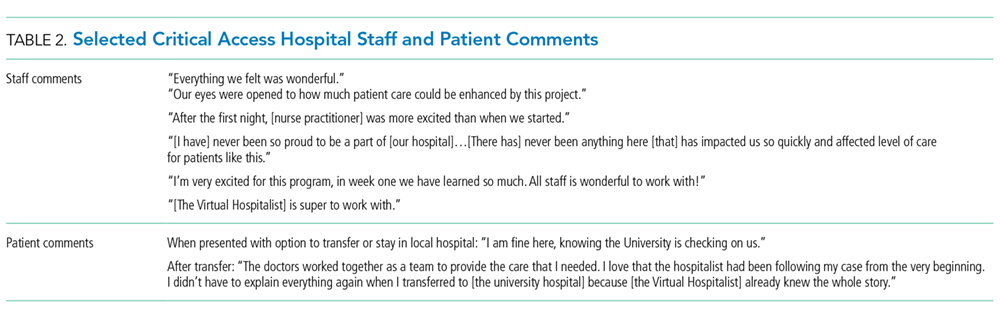
DISCUSSION
The virtual hospitalist service allowed a higher percentage of acute inpatients to receive care in their local hospital and was positively perceived by providers and patients. The per-patient time commitment by virtual hospitalists was similar to traditional hospitalist coverage14 and could scale to multiple simultaneous institutions.
Despite the increase in the proportion of patients admitted locally, neither the mean inpatient census nor the complexity of patients (as measured by CMI) increased. The increase in patients admitted locally was offset by a parallel increase in the number of ED patients discharged home. Although virtual hospitalists were available to consult on ED patients, this consultation was not mandatory unless the CAH provider felt that admission was indicated. It remains unclear whether the changes in ED disposition were due to direct intervention by virtual hospitalists, increasing local expertise with inpatient medicine, or unrelated local factors.
Although outside transfers directly from the ED dropped, there was a potential increase in acute inpatients transferred after admission that failed to reach statistical significance. We anticipated increased transfers after admission as a potential consequence of accepting more complex patients for CAH admission. Reasons for transfer included emergent transfers for medically unstable patients and scheduled transfer for subspecialist evaluation or testing. Despite the possible increase in delayed transfers, there was no significant change in CAH inpatient mortality, and the total fraction of combined ED and inpatients transferred decreased after the intervention.
Despite the benefits of keeping patients within their communities, 20%-60% of rural patients bypass their local facilities when seeking emergent care.15 Despite publicity on local media,16 we did not observe an increase in daily ED visits after implementation. Although some investigators have found that increasing the services offered decreases in rural bypass,17 others have found no or mixed effects.18,19 Further investigations into the local factors contributing to rural bypass may yield important insights, and future implementations should not rely on rapid increases in patient volume to establish economic viability.
Although telemedicine has been applied to a variety of previous settings, to our knowledge, this marks the first collaboration between an academic medical center and a CAH to provide continuous hospitalist coverage. A previous model for pediatric inpatients showed a similar decrease in patients transferred to tertiary centers.20 Virtual hospitalists differ from other adult telemedicine projects, which focused on subspecialty care or overnight coverage.21 The advantages of our model include the ability to proactively address deficits, even when local providers are unaware of changes to the standards of care. We believe that mandatory scheduled interactions decreased the barriers to communication and increased provider reassurance in telemedicine management of their patients. The scheduled interactions also provided additional training and development for CAH personnel, were well received by local staff, and may contribute to local provider job satisfaction, retention, and recruitment.
Past efforts to integrate academic hospitalists into CAHs improved quality metrics and provider satisfaction but were economically infeasible due to low patient volumes.22 In contrast, virtual providers can distribute their efforts across multiple areas, including covering additional CAHs, providing local patient care at their home facility, or completing academic projects. By combining two or more CAHs into a single provider, sufficient patient volume can be generated to dedicated personnel.
There were several limitations to this initial investigation:
- As a pilot between two specific institutions, modifications will be required to replicate in other CAHs or academic centers.
- Generating sufficient revenue to cover a full hospitalist salary will require adding additional responsibilities, either covering multiple CAHs simultaneously or combining virtual coverage with in-person responsibilities.
- The accuracy of the self-report remains unmeasured, and the impact of combining two or more CAHs may not be strictly additive. Attempts to supplement the self-reported time spent with additional information from the EMR and cell phone logs were complicated by the use of multiple platforms in parallel, interruptions in provider workflow, and provider multitasking.
- Due to the need for reliable local physical examinations and regulations on telehealth reimbursement, local APPs were necessary for this implementation. Although most of the CAHs have an on-site provider to provide ED coverage, CAHs with sufficient volume to necessitate separating ED and inpatient ward coverage may have difficulty supporting both APP and virtual hospitalist coverage, even on a fractional basis.
- This study was underpowered to detect rare events with significant consequences, including inpatient mortality and inpatient transfer. Although CMI suggests similar complexity in CAH patients, we have insufficient data to draw further comparisons on patient characteristics before and after the intervention.
- The analysis may be vulnerable to secular trends in the CAH patient population, as only 24 weeks of data were used as a baseline for comparison (although no significant seasonal variation was detected during that time). Extending the baseline data to include an additional 30 weeks ED encounters did not significantly alter our conclusions.
- Virtual hospitalists were dependent on physical examinations performed independently by local APPs.
- Although virtual providers were obligated to be available for videoconferencing within 60 minutes, more urgent medical decisions were sometimes made based on phone conferences between VBCH and the virtual hospitalist without video or direct patient assessment.
- We selected a CAH utilizing an identical instance of our EMR. Although this increased the ability of virtual hospitalists to split their time between virtual and local patient encounters, this limits our ability to spread this intervention beyond institutions already partnering with the UIHC.
CONCLUSIONS
We succeeded in reducing outside transfers at a CAH by implementing a sustainable virtual hospitalist service. This model allows patients to receive more of their care within their local communities and provides an improved inpatient experience. Next steps include expanding this service to other CAHs within our region, both to understand if this model is applicable beyond our initial site and to monitor for complications induced by scaling. If successful, virtual hospitalist coverage can provide a sustainable solution to providing the latest innovations in hospital medicine even to the most rural communities.
ACKNOWLEDGMENTS
The authors thank Ray Brownsworth, CEO of Van Buren County Hospital, as well as all the providers and staff who worked with them to implement and improve their services. The authors also thank Pat Brophy, founder of The Signal Center for Health Innovation, for providing leadership, support, and resources for innovation.
Disclosures
None of the authors have identified a conflict of interest in relation to this manuscript.
Funding
This project was funded through the University of Iowa Health Care and the Signal Center for Health Innovations at UI Health Ventures.
Compliance With Ethical Standards
This quality improvement project was exempt from Institutional Review Board review
1. Kripalani S, Jackson AT, Schnipper JL, Coleman EA. Promoting effective transitions of care at hospital discharge: a review of key issues for hospitalists. J Hosp Med. 2007;2(5):314-323. doi: 10.1002/jhm.228.
2. Potter AJ, Ward MM, Natafgi N, et al. Perceptions of the benefits of telemedicine in rural communities. Perspect Health Inform Manag. 2016;Summer:1-13.
3. Mohr NM, Harland KK, Shane DM, et al. Rural patients with severe sepsis or septic shock who bypass rural hospitals have increased mortality: an instrumental variables approach. Crit Care Med. 2017;45(1):85-93. doi: 10.1097/CCM.0000000000002026.
4. Joynt KE, Orav EJ, Jha AK. Mortality rates for medicare beneficiaries admitted to critical access and non-critical access hospitals, 2002-2010. JAMA. 2013;309(13):1379-1387. doi: 10.1001/jama.2013.2366.
5. Joynt KE, Harris Y, Orav EJ, Jha AK. Quality of care and patient outcomes in critical access rural hospitals. JAMA. 2011;306(1):45-52. doi: 10.1001/jama.2011.902.
6. Association AH. AHA Annual Survey Database. Washington, DC: American Hospital Association; 2005.
7. Wachter RM, Katz P, Showstack J, Bindman AB, Goldman L. Reorganizing an academic medical service: impact on cost, quality, patient satisfaction, and education. JAMA. 1998;279(19):1560-1565. doi: 10.1001/jama.279.19.1560.
8. Peterson MC. A systematic review of outcomes and quality measures in adult patients cared for by hospitalists vs nonhospitalists. Mayo Clin Proc. 2009;84(3):248-254. doi: 10.1016/S0025-6196(11)61142-7.
9. Auerbach AD, Wachter RM, Katz P, et al. Implementation of a voluntary hospitalist service at a community teaching hospital: improved clinical efficiency and patient outcomes. Ann Intern Med. 2002;137(11):859-865. doi: 10.7326/0003-4819-137-11-200212030-00006.
10. Moscovice I, Coburn A, Holmes M, et al. Flex Monitoring Team. http://www.flexmonitoring.org/. Accessed December 19, 2016.
11. In Critical Condition the Fragile State of Critical Access Hospitals; 2013. http://www.aha.org/research/policy/infographics/pdf/info-cah.pdf. Accessed March 23, 2017.
12. Wachter RM, Goldman L. Zero to 50,000—the 20th anniversary of the hospitalist. N Engl J Med. 2016;375(11):1009-1011. doi: 10.1056/NEJMp1607958.
13. Aj W, AE. Overview of Hospital Stays in the United States; 2012. http://www.hcup-us.ahrq.gov/reports/statbriefs/sb180-Hospitalizations-United-States-2012.pdf. Accessed February 7, 2017.
14. Tipping MD, Forth VE, O’Leary KJ, et al. Where did the day go?—A time‐motion study of hospitalists. J Hosp Med. 2010;5(6):323-328. doi: 10.1002/jhm.790.
15. Liu JJ, Bellamy GR, McCormick M. Patient bypass behavior and critical access hospitals: implications for patient retention. J Rural Health. 2007;23(1):17-24 doi: http://dx.doi.org/10.1111/j.1748-0361.2006.00063.x.
16. Keenan C. Iowa’s rural hospitals balance tight budgets with patient needs. The Gazette. July 10, 2017.
17. Escarce JJ, Kapur K. Do patients bypass rural hospitals? Determinants of inpatient hospital choice in rural California. J Health Care Poor Underserved. 2009;20(3):625-644. doi: 10.1353/hpu.0.0178.
18. Liu JJ, Bellamy G, Barnet B, Weng S. Bypass of local primary care in rural counties: effect of patient and community characteristics. Ann Fam Med. 2008;6(2):124-130. doi: 10.1370/afm.794.
19. Weigel PAM, Ullrich F, Ward MM. Rural bypass of critical access hospitals in Iowa: do visiting surgical specialists make a difference? J Rural Health. 2018;34 Supplement 1:s21-s29. doi: 10.1111/jrh.12220.
20. LaBarbera JM, Ellenby MS, Bouressa P, et al. The impact of telemedicine intensivist support and a pediatric hospitalist program on a community hospital. Telemed J E Health. 2013;19(10):760-766. doi: 10.1089/tmj.2012.0303.
21. AlDossary S, Martin-Khan MG, Bradford NK, Smith AC. A systematic review of the methodologies used to evaluate telemedicine service initiatives in hospital facilities. Int J Med Inform. 2017;97:171-194. doi: 10.1016/j.ijmedinf.2016.10.012.
22. Dougan BM, Montori VM, Carlson KW. Implementing a Hospitalist Program in a Critical Access Hospital. J Rural Health. 2018;34(1):109-115. doi: 10.1111/jrh.12190.
Through increased involvement with families and caregivers, community hospitals can deliver better healthcare to patients.1,2 Furthermore, when patients bypass local hospitals and directly present to tertiary care, mortality for time-sensitive illnesses, such as sepsis, increases.3 Unfortunately, although critical access hospitals (CAHs) had an equivalent risk-adjusted mortality in 2002, they have failed to improve their performance at the same rate as that of larger hospitals and lag in quality metrics.4,5
One potential contributor to the lagging performance may be the low uptake of the hospitalist model at these facilities.6 Although dedicated hospitalists have improved patient outcomes and decreased spending in large hospitals,7-9 implementing the hospitalist medicine model on a smaller scale remains difficult. Approximately 1,300 CAHs provide necessary emergency room and inpatient services in the rural United States.10 Assuming 12-hour shifts and every-other-week assignments, providing continuous, on-location hospitalist coverage would require more than 10% of the total hospitalist workforce to cover less than 3% of all hospital admissions.11-13
Telemedicine allows content experts, including hospitalists, to supervise patient care remotely. This provides a potential solution to the logistical challenges of supplying continuous hospitalist coverage to a remote facility with a low daily census. We hypothesized that providing continuous “virtual hospitalist” coverage through telemedicine could increase the ability of a CAH to care for patients locally, decreasing the number of transfers to tertiary care centers and improving patient and provider satisfaction. We aimed to create a 25% relative reduction in CAH Emergency Department (ED) patient encounters resulting in transfer to outside hospitals within 6 months.
This quality improvement project was exempt from Institutional Review Board review.
METHODS
Setting
The University of Iowa Hospitals and Clinics (UIHC) is a 750-bed teaching hospital based in a suburban community in Eastern Iowa and the only tertiary care hospital in the state of Iowa. The UIHC Hospitalist group contains 44 staff physicians and covers more than 12 service lines (both faculty-only and resident-covered) at this facility.
Van Buren County Hospital (VBCH) is a 24-bed CAH offering emergency, internal medicine, and obstetrical services and located 80 miles southwest of UIHC. X-ray and CT scan services are available continuously, but ultrasound and magnetic resonance imaging services are available only 2-3 times per week. While tertiary care patients were transferred to UIHC, patients requiring specialty care but with less complex illnesses (eg, stable myocardial infarction) were referred to closer facilities.
Prior to implementation, coverage of the acute inpatient ward and the emergency room at VBCH was simultaneously provided by a single physician or advanced practice providers (APPs). When APPs provided coverage, a physician was required to be notified of any new admissions and was immediately available for medical emergencies. The VBCH providers worked alone in 48- to 72-hour continuous shifts as the sole coverage for both ED and inpatient units. It was frequently necessary to bring in outside providers through locum tenens agencies to fill gaps in the provider schedule. Both VBCH and UIHC used a shared electronic medical record (EMR), which was a key consideration in choosing VBCH as our pilot site. Providers at both institutions had access to identical patient information through the EMR, including radiology images, laboratory results, and provider notes.
Intervention Development and Implementation
A site visit by clinical and administrative project leads to VBCH identified three deficits that we could address through telemedicine: (1) The extended duration of VBCH shifts was detrimental to provider experience and retention; (2) Lack of local expertise in hospital medicine led to limited comfort in caring for patients with stable but medically complex conditions (eg, drug-resistant urinary tract infection); and (3) Patient transitions between VBCH and UIHC during acute care transfer were frustrating and led to negative experiences with providers and patients.
We developed a model to address these deficits using the minimum number of specialties and employees to facilitate rapid implementation. Although local care ED and inpatient care was provided by 3 APPS and a single physician provider, we mandated the coverage of all acute inpatients by the virtual hospitalists. This coverage included daily videoconference patient rounds, continuous pager coverage for new acute issues, and listing the virtual hospitalists as the attending of record for patient admissions. We scheduled contact times in the morning and afternoon to accelerate familiarity and comfort with the technology. We used a secure, Health Insurance Portability and Accountability Act of 1996 (HIPAA)-compliant platform for videoconferencing, accessible through personal computers or portable smart devices (Vidyo, VidyoInc, Hackensack, New Jersey). At VBCH, two tablet computers were provided to serve as portable platforms to use either in provider conference rooms or to be taken into patient rooms. Twice a day, at 8:45
Outcome Measures
Outcome measures were divided into three categories: (1) clinical and utilization outcomes; (2) virtual hospitalist outcomes; and (3) satisfaction outcomes. The primary clinical outcome was the percentage of ED encounters resulting in transfer to a different acute care hospital. We also monitored alternative ED dispositions, including local inpatient admission. Additional clinical and utilization outcomes after ED admission included the mean daily inpatient census at VBCH and the case mix index (CMI). We selected the mean length of stay, the percentage of inpatients transferred to other hospitals, and the inpatient mortality as balance measures due to concerns of increasing the acuity of the inpatient wards beyond the comfort and expertise of local staff. Virtual hospitalist outcomes included the mean daily time commitment and the mean time commitment per patient. Virtual hospitalists self-reported their time commitments as part of their daily documentation. We chose these measures in anticipation of expanding this program to other institutions in the future. Satisfaction outcomes included a weekly survey to all VBCH physicians and nursing staff (Appendix 1), weekly group discussions with virtual hospitalists and CAH staff, and 3 interviews with patients and family members after discharge (Appendix 2).
Statistical Analysis
Baseline data collected over a period of 24 weeks were used to measure pre-implementation performance and trends at VBCH. The virtual hospitalist service was started on November 15, 2016, and the two weeks before and two weeks after this date were excluded from analysis as a transition period. To account for weekend variation, we reported data in consecutive 28-day blocks. We used Chi-square tests to compare proportional outcomes and Student’s t-tests for continuous variables. Statistical Process Control charts were used to evaluate for temporal trends in quantitative data.
Funding
Development of this project was funded through the University of Iowa Hospitalist group and the Signal Center for Health Innovations at UI Health Ventures. Virtual hospitalist clinical time was paid for by the CAH on a fractional basis of a traditional hospitalist based on projected patient volumes through analysis of baseline data. Patients were not directly billed for virtual hospitalist service but were charged for the services provided by CAH providers.
RESULTS
Clinical and Utilization Outcomes
During the 24-week baseline period, VBCH had 947 ED encounters and 176 combined acute inpatient and observation admissions. For the 24 weeks following the transition, there were 930 ED visits and 186 admissions. We observed a 36% (157/947 to 98/930, P < .001) decrease in ED encounters ending in patient transfer to another hospital (Figure). In parallel, VBCH ED visits leading to local admission increased by 62% of baseline (39/947 to 62/930, P = .014). There was no significant change in the fraction of ED encounters resulting in an observation stay (104/947 to 99/930, P = .814). Daily ED visits did not change after virtual hospitalist coverage began (5.64 to 5.54 visits/day, P = .734), but the percentage of ED visits ending in discharge to a nonmedical setting increased from 79.0% to 82.7% (748/947 to 769/930, P = .042).
The implementation did not have a significant impact on ward census or patient complexity (Table 1). Both CMI and mean length of stay did not change after starting the service. The study was underpowered to detect differences in rare events, including inpatient mortality and transfer after admission. Despite the decrease in transfers, inpatient census was unchanged. This coincides with a 17% decrease (196/947 to 160/930, P = .054) in the proportion of ED patients referred for admission either locally or at an outside hospital.
Virtual Hospitalist Outcomes
Satisfaction Outcomes
The staff at VBCH identified several benefits to the virtual hospitalist service. Survey responses (N = 18) were positive, with staff expressing specific gratitude for the additional education and training provided by the virtual hospitalists. On a Likert scale ranging from 1 (very poor) to 5 (excellent), the respondents gave high mean scores to the overall service experience (4.8) and the effectiveness of care delivered (4.9) but were more critical of the ability to keep patients locally (4.5) and the experience with transferring patients (3.9). We also collected free-text feedback from both patients and staff at VBCH (Table 2).
DISCUSSION
The virtual hospitalist service allowed a higher percentage of acute inpatients to receive care in their local hospital and was positively perceived by providers and patients. The per-patient time commitment by virtual hospitalists was similar to traditional hospitalist coverage14 and could scale to multiple simultaneous institutions.
Despite the increase in the proportion of patients admitted locally, neither the mean inpatient census nor the complexity of patients (as measured by CMI) increased. The increase in patients admitted locally was offset by a parallel increase in the number of ED patients discharged home. Although virtual hospitalists were available to consult on ED patients, this consultation was not mandatory unless the CAH provider felt that admission was indicated. It remains unclear whether the changes in ED disposition were due to direct intervention by virtual hospitalists, increasing local expertise with inpatient medicine, or unrelated local factors.
Although outside transfers directly from the ED dropped, there was a potential increase in acute inpatients transferred after admission that failed to reach statistical significance. We anticipated increased transfers after admission as a potential consequence of accepting more complex patients for CAH admission. Reasons for transfer included emergent transfers for medically unstable patients and scheduled transfer for subspecialist evaluation or testing. Despite the possible increase in delayed transfers, there was no significant change in CAH inpatient mortality, and the total fraction of combined ED and inpatients transferred decreased after the intervention.
Despite the benefits of keeping patients within their communities, 20%-60% of rural patients bypass their local facilities when seeking emergent care.15 Despite publicity on local media,16 we did not observe an increase in daily ED visits after implementation. Although some investigators have found that increasing the services offered decreases in rural bypass,17 others have found no or mixed effects.18,19 Further investigations into the local factors contributing to rural bypass may yield important insights, and future implementations should not rely on rapid increases in patient volume to establish economic viability.
Although telemedicine has been applied to a variety of previous settings, to our knowledge, this marks the first collaboration between an academic medical center and a CAH to provide continuous hospitalist coverage. A previous model for pediatric inpatients showed a similar decrease in patients transferred to tertiary centers.20 Virtual hospitalists differ from other adult telemedicine projects, which focused on subspecialty care or overnight coverage.21 The advantages of our model include the ability to proactively address deficits, even when local providers are unaware of changes to the standards of care. We believe that mandatory scheduled interactions decreased the barriers to communication and increased provider reassurance in telemedicine management of their patients. The scheduled interactions also provided additional training and development for CAH personnel, were well received by local staff, and may contribute to local provider job satisfaction, retention, and recruitment.
Past efforts to integrate academic hospitalists into CAHs improved quality metrics and provider satisfaction but were economically infeasible due to low patient volumes.22 In contrast, virtual providers can distribute their efforts across multiple areas, including covering additional CAHs, providing local patient care at their home facility, or completing academic projects. By combining two or more CAHs into a single provider, sufficient patient volume can be generated to dedicated personnel.
There were several limitations to this initial investigation:
- As a pilot between two specific institutions, modifications will be required to replicate in other CAHs or academic centers.
- Generating sufficient revenue to cover a full hospitalist salary will require adding additional responsibilities, either covering multiple CAHs simultaneously or combining virtual coverage with in-person responsibilities.
- The accuracy of the self-report remains unmeasured, and the impact of combining two or more CAHs may not be strictly additive. Attempts to supplement the self-reported time spent with additional information from the EMR and cell phone logs were complicated by the use of multiple platforms in parallel, interruptions in provider workflow, and provider multitasking.
- Due to the need for reliable local physical examinations and regulations on telehealth reimbursement, local APPs were necessary for this implementation. Although most of the CAHs have an on-site provider to provide ED coverage, CAHs with sufficient volume to necessitate separating ED and inpatient ward coverage may have difficulty supporting both APP and virtual hospitalist coverage, even on a fractional basis.
- This study was underpowered to detect rare events with significant consequences, including inpatient mortality and inpatient transfer. Although CMI suggests similar complexity in CAH patients, we have insufficient data to draw further comparisons on patient characteristics before and after the intervention.
- The analysis may be vulnerable to secular trends in the CAH patient population, as only 24 weeks of data were used as a baseline for comparison (although no significant seasonal variation was detected during that time). Extending the baseline data to include an additional 30 weeks ED encounters did not significantly alter our conclusions.
- Virtual hospitalists were dependent on physical examinations performed independently by local APPs.
- Although virtual providers were obligated to be available for videoconferencing within 60 minutes, more urgent medical decisions were sometimes made based on phone conferences between VBCH and the virtual hospitalist without video or direct patient assessment.
- We selected a CAH utilizing an identical instance of our EMR. Although this increased the ability of virtual hospitalists to split their time between virtual and local patient encounters, this limits our ability to spread this intervention beyond institutions already partnering with the UIHC.
CONCLUSIONS
We succeeded in reducing outside transfers at a CAH by implementing a sustainable virtual hospitalist service. This model allows patients to receive more of their care within their local communities and provides an improved inpatient experience. Next steps include expanding this service to other CAHs within our region, both to understand if this model is applicable beyond our initial site and to monitor for complications induced by scaling. If successful, virtual hospitalist coverage can provide a sustainable solution to providing the latest innovations in hospital medicine even to the most rural communities.
ACKNOWLEDGMENTS
The authors thank Ray Brownsworth, CEO of Van Buren County Hospital, as well as all the providers and staff who worked with them to implement and improve their services. The authors also thank Pat Brophy, founder of The Signal Center for Health Innovation, for providing leadership, support, and resources for innovation.
Disclosures
None of the authors have identified a conflict of interest in relation to this manuscript.
Funding
This project was funded through the University of Iowa Health Care and the Signal Center for Health Innovations at UI Health Ventures.
Compliance With Ethical Standards
This quality improvement project was exempt from Institutional Review Board review
1. Kripalani S, Jackson AT, Schnipper JL, Coleman EA. Promoting effective transitions of care at hospital discharge: a review of key issues for hospitalists. J Hosp Med. 2007;2(5):314-323. doi: 10.1002/jhm.228.
2. Potter AJ, Ward MM, Natafgi N, et al. Perceptions of the benefits of telemedicine in rural communities. Perspect Health Inform Manag. 2016;Summer:1-13.
3. Mohr NM, Harland KK, Shane DM, et al. Rural patients with severe sepsis or septic shock who bypass rural hospitals have increased mortality: an instrumental variables approach. Crit Care Med. 2017;45(1):85-93. doi: 10.1097/CCM.0000000000002026.
4. Joynt KE, Orav EJ, Jha AK. Mortality rates for medicare beneficiaries admitted to critical access and non-critical access hospitals, 2002-2010. JAMA. 2013;309(13):1379-1387. doi: 10.1001/jama.2013.2366.
5. Joynt KE, Harris Y, Orav EJ, Jha AK. Quality of care and patient outcomes in critical access rural hospitals. JAMA. 2011;306(1):45-52. doi: 10.1001/jama.2011.902.
6. Association AH. AHA Annual Survey Database. Washington, DC: American Hospital Association; 2005.
7. Wachter RM, Katz P, Showstack J, Bindman AB, Goldman L. Reorganizing an academic medical service: impact on cost, quality, patient satisfaction, and education. JAMA. 1998;279(19):1560-1565. doi: 10.1001/jama.279.19.1560.
8. Peterson MC. A systematic review of outcomes and quality measures in adult patients cared for by hospitalists vs nonhospitalists. Mayo Clin Proc. 2009;84(3):248-254. doi: 10.1016/S0025-6196(11)61142-7.
9. Auerbach AD, Wachter RM, Katz P, et al. Implementation of a voluntary hospitalist service at a community teaching hospital: improved clinical efficiency and patient outcomes. Ann Intern Med. 2002;137(11):859-865. doi: 10.7326/0003-4819-137-11-200212030-00006.
10. Moscovice I, Coburn A, Holmes M, et al. Flex Monitoring Team. http://www.flexmonitoring.org/. Accessed December 19, 2016.
11. In Critical Condition the Fragile State of Critical Access Hospitals; 2013. http://www.aha.org/research/policy/infographics/pdf/info-cah.pdf. Accessed March 23, 2017.
12. Wachter RM, Goldman L. Zero to 50,000—the 20th anniversary of the hospitalist. N Engl J Med. 2016;375(11):1009-1011. doi: 10.1056/NEJMp1607958.
13. Aj W, AE. Overview of Hospital Stays in the United States; 2012. http://www.hcup-us.ahrq.gov/reports/statbriefs/sb180-Hospitalizations-United-States-2012.pdf. Accessed February 7, 2017.
14. Tipping MD, Forth VE, O’Leary KJ, et al. Where did the day go?—A time‐motion study of hospitalists. J Hosp Med. 2010;5(6):323-328. doi: 10.1002/jhm.790.
15. Liu JJ, Bellamy GR, McCormick M. Patient bypass behavior and critical access hospitals: implications for patient retention. J Rural Health. 2007;23(1):17-24 doi: http://dx.doi.org/10.1111/j.1748-0361.2006.00063.x.
16. Keenan C. Iowa’s rural hospitals balance tight budgets with patient needs. The Gazette. July 10, 2017.
17. Escarce JJ, Kapur K. Do patients bypass rural hospitals? Determinants of inpatient hospital choice in rural California. J Health Care Poor Underserved. 2009;20(3):625-644. doi: 10.1353/hpu.0.0178.
18. Liu JJ, Bellamy G, Barnet B, Weng S. Bypass of local primary care in rural counties: effect of patient and community characteristics. Ann Fam Med. 2008;6(2):124-130. doi: 10.1370/afm.794.
19. Weigel PAM, Ullrich F, Ward MM. Rural bypass of critical access hospitals in Iowa: do visiting surgical specialists make a difference? J Rural Health. 2018;34 Supplement 1:s21-s29. doi: 10.1111/jrh.12220.
20. LaBarbera JM, Ellenby MS, Bouressa P, et al. The impact of telemedicine intensivist support and a pediatric hospitalist program on a community hospital. Telemed J E Health. 2013;19(10):760-766. doi: 10.1089/tmj.2012.0303.
21. AlDossary S, Martin-Khan MG, Bradford NK, Smith AC. A systematic review of the methodologies used to evaluate telemedicine service initiatives in hospital facilities. Int J Med Inform. 2017;97:171-194. doi: 10.1016/j.ijmedinf.2016.10.012.
22. Dougan BM, Montori VM, Carlson KW. Implementing a Hospitalist Program in a Critical Access Hospital. J Rural Health. 2018;34(1):109-115. doi: 10.1111/jrh.12190.
© 2018 Society of Hospital Medicine
Estimating the Accuracy of Dobutamine Stress Echocardiography and Single-Photon Emission Computed Tomography among Patients Undergoing Noncardiac Surgery
Cardiac complications account for at least one-third of perioperative deaths, and lead to substantial morbidity and cost.1-4 Current guidelines recommend that patients undergo assessment of cardiac risk and functional status prior to noncardiac surgery.5 Preoperative cardiac stress testing is recommended for patients whose predicted cardiac risk exceeds 1%, whose functional status is limited, and for whom testing may change management.5
However, patients are not specifically selected according to risk of coronary artery disease (CAD) in current guidelines. The pretest probability of CAD may vary widely in this patient population, and the resultant accuracy of cardiac stress testing in making the diagnosis of CAD may vary as well.5 Meanwhile, CAD is a clear risk factor for perioperative cardiac events.6-8
Because the pretest probability of CAD is heterogeneous, the optimal modality of cardiac stress testing in this population is unclear. False-positive results would likely lead to inflated estimates of operative risk, expensive and high-risk downstream testing, and potentially cancellation of otherwise beneficial surgeries. Meanwhile, false-negative results would lead to overly optimistic estimates of surgical risk and potentially to surgical intervention at higher levels of risk than would be desirable. Current guidelines leave the selection of either dobutamine stress echocardiography (DSE) or pharmacological stress myocardial perfusion imaging to the clinician.5 To inform decisions regarding the selection of cardiac stress testing modality prior to noncardiac surgery, we conducted this study to estimate the diagnostic accuracy of DSE and single-photon emission computed tomography (SPECT) among this patient population.
METHODS
Surgical Cohort
The American College of Surgeons’ National Surgical Quality Improvement Program (NSQIP) samples patients undergoing surgery at participating hospitals and collects standardized clinical data on preoperative risk factors and postoperative complications.9 We acquired public use data from the 2009 NSQIP cohort, which included more than 336,000 surgical cases from 237 hospitals (principally in the United States). We excluded from our analysis patients undergoing cardiac surgery, patients with a prior diagnosis of CAD, and patients undergoing experimental surgeries. This left a sample of 300,462 for analysis.
Prediction of Dyslipidemia
The model we used to predict the presence of obstructive CAD required the presence or absence of dyslipidemia. A number of variables are common to both NSQIP and the National Health and Nutrition Examination Survey (NHANES), including age, weight, sex, tobacco use, diabetes, and prior stroke.10 Using those common variables, we developed a logistic regression to predict a diagnosis of dyslipidemia, applied that regression to the NSQIP cohort, and dichotomized. To assess the potential impact of misclassification, we performed separate sensitivity analyses in which either no patients or all patients had dyslipidemia.
Prediction of Obstructive CAD
To estimate the probability of obstructive CAD, we applied the risk prediction tool currently recommended by the European Society of Cardiology.11 The clinical version of this tool relies on age; sex; diagnoses of diabetes, hypertension, and dyslipidemia; active tobacco use; and chest pain characteristics to predict the probability of obstructive CAD on coronary angiography. We assumed that all patients in our cohort had nonspecific chest pain, the referent in the calculator.
Prediction of Perioperative Event Risk
To predict the probability of a perioperative cardiac event, we used the Myocardial Infarction or Cardiac Arrest (MICA) calculator, which was derived from an earlier cohort of NSQIP.12 All variables required for this prediction tool were included in the 2009 NSQIP cohort; our categorization of surgeries is included as an online appendix. MICA is one of three prediction tools included in the current American College of Cardiology/American Heart Association (ACC/AHA) guidelines.5
Prediction of Test Accuracy
We searched the MEDLINE database for estimates of the test characteristics of DSE and SPECT that adjusted for workup bias.13 (Also known as sequential-ordering bias, here we refer to the phenomenon whereby further workup is based on the results of diagnostic testing, resulting in underdiagnosis among patients with negative tests and falsely high estimates of sensitivity.14) Although other modalities of myocardial perfusion imaging exist, SPECT appears to be the most widely available, utilized, and studied modality of MPI.15 Our search strategy paired (“Sensitivity and Specificity” [MeSH Terms] AND “Coronary Disease/diagnostic imaging” [MAJR] AND “bias” [TIAB]) with (“Tomography, Emission-Computed, Single-Photon” [MAJR] OR “Echocardiography, Stress” [MAJR]). We reviewed the results for sensitivity and specificity estimates that corrected for workup bias. For each of SPECT and DSE, we drew the sensitivity and specificity from normal distributions based on literature estimates (see Table). We then calculated the expected accuracy of each modality for each patient in our dataset. All analyses were performed in Stata (version 14, College Station, Texas).
RESULTS
The median predicted probability of obstructive CAD was
Both accuracy and PPV were higher for DSE than for SPECT. The predicted accuracy of DSE was greater than that of SPECT in 73.5% of cases overall and in 60.5% of cases with a predicted operative cardiac risk greater than 1%. The mean PPV of DSE was 32.9% (median: 26.7%), while the equivalent PPVs for SPECT were 14.1% and 8.2%, respectively. Among cases with a predicted operative cardiac risk greater than 1%, the mean PPV of DSE was 57.5% (median: 60.2%), while the equivalent PPVs for SPECT were 29.8% and 26.7%, respectively.
DSE had a mean predicted accuracy of 93.0% (median: 96.2%), while SPECT had a mean accuracy of 92.6% (median: 95.6%). The predicted accuracies of DSE and SPECT are shown in the Figure, stratified by predicted perioperative risk across the 1% risk threshold currently used by ACC/AHA guidelines.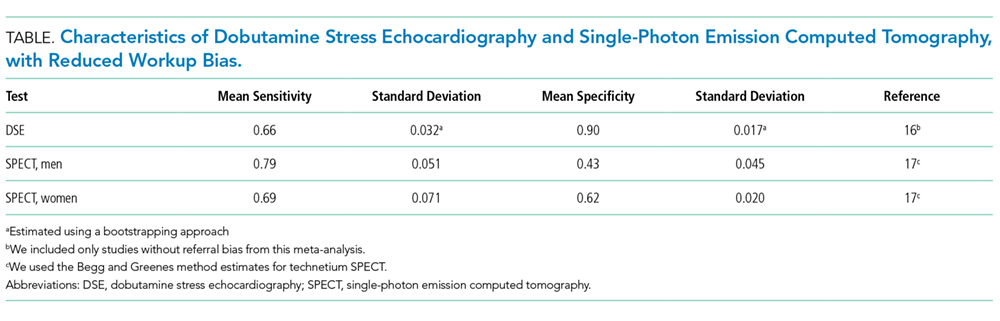
In our sensitivity analyses, dyslipidemia had little effect on the comparative accuracy. If no patients had dyslipidemia, DSE would have a higher accuracy than SPECT in 75.7% of cases. If all patients had dyslipidemia, DSE would have a higher predicted accuracy than SPECT in 72.8% of cases. For patients with an operative cardiac risk greater than 1%, the predicted accuracies were 65.0% and 59.4%, respectively.
DISCUSSION
In this study, we demonstrated that the expected accuracy of DSE in the diagnosis of obstructive CAD among patients undergoing noncardiac surgery is higher than that of SPECT. This finding was true in both unselected patients and those selected by a perioperative risk of greater than 1%. The use of SPECT, compared with DSE, would likely result in greater numbers of false-positive tests in this patient population and less accurate results overall.
Cardiac stress testing, as with any diagnostic test, is most useful at intermediate probabilities. Insofar as stress testing offers diagnostic value, our analysis suggests that, in the range of the predicted risk of CAD found in patients undergoing noncardiac surgery, DSE is a more efficient testing strategy. To the extent that making a diagnosis of CAD informs the decision to proceed to surgery, a more accurate test would be preferable. The lower cost of DSE, the lack of ionizing radiation, and the information provided by echocardiography regarding diagnoses other than CAD, if considered, would further amplify that preference.
However, it is important to note that both modalities have limited positive predictive value. In the median patient who meets the currently recommended 1% perioperative event risk threshold, SPECT would lead to 2.74 false positive results for every true positive result. DSE would produce approximately two false positive results for every three true positive results. If lower rates of false-positive testing are desired, different patient selection criteria are required.
A few key limitations of this work warrant discussion. First, our results likely overestimate the probability of obstructive CAD in this population. We assumed that all patients have nonspecific chest pain at the time of the preoperative evaluation, though many patients do not, in fact, have chest pain. Tools to estimate the pretest probability of CAD (such as the ESC tool that we used or the older Diamond-Forrester prediction) are intended to stratify higher-risk patients than are seen in a preoperative setting. If asymptomatic patients seen in preoperative risk assessment clinics have lower risk of CAD than what we have predicted, we will have understated the case for DSE. Moreover, cases sampled from hospitals participating in NSQIP are not representative of the national surgical population. This likely further inflates our estimates of CAD risk compared with the “true” surgical population. Finally, we cannot comment on current practice from these data. Current guidelines recommend preoperative cardiac stress testing for patients whose risk of a perioperative cardiac event exceeds 1%, whose functional status is poor or unknown, and only if said testing will change management.5 Using these data, we cannot determine the pretest probability of patients referred for stress testing before noncardiac surgery.
Still, this analysis suggests that, among patients undergoing noncardiac surgery, selecting patients according to the risk of perioperative events would result in a population at an overall comparatively low risk of CAD, and that in this population, DSE would be more accurate than SPECT for making the diagnosis of CAD. If a diagnosis of CAD would change the decision to proceed to surgery, DSE is likely to be a more efficient test than SPECT.
Acknowledgements
The authors would like to thank Wael Jaber, MD, for his thoughtful comments on a draft of this manuscript.
Disclosures
The authors have nothing to disclose.
Funding
The authors received no specific funding for this work.
1. Devereaux PJ, Xavier D, Pogue J, et al. Characteristics and short-term prognosis of perioperative myocardial infarction in patients undergoing noncardiac surgery: a cohort study. Ann Intern Med. 2011;154(8):523-528. doi: 10.7326/0003-4819-154-8-201104190-00003. PubMed
2. Udeh BL, Dalton JE, Hata JS, Udeh CI, Sessler DI. Economic trends from 2003 to 2010 for perioperative myocardial infarction: a retrospective, cohort study. Anesthesiology. 2014;121(1):36-45. doi: 10.1097/ALN.0000000000000233. PubMed
3. van Waes JAR, Nathoe HM, de Graaff JC, et al. Myocardial injury after noncardiac surgery and its association with short-term mortality. Circulation. 2013;127(23):2264-2271. doi: 10.1161/CIRCULATIONAHA.113.002128. PubMed
4. Wijeysundera DN, Beattie WS, Austin PC, Hux JE, Laupacis A. Non-invasive cardiac stress testing before elective major non-cardiac surgery: population based cohort study. BMJ. 2010;340(jan28 3):b5526-b5526. doi: 10.1136/bmj.b5526. PubMed
5. Fleisher LA, Fleischmann KE, Auerbach AD, et al. 2014 ACC/AHA Guideline on Perioperative Cardiovascular Evaluation and Management of Patients Undergoing Noncardiac Surgery. J Am Coll Cardiol. 2014;64(22):e77-e137. doi: 10.1016/j.jacc.2014.07.944. PubMed
6. Goldman L, Caldera DL, Nussbaum SR, et al. Multifactorial index of cardiac risk in noncardiac surgical procedures. N Engl J Med. 1977;297(16):845-850. doi:10.1056/NEJM197710202971601. PubMed
7. Devereaux PJ, Sessler DI. Cardiac Complications in patients undergoing major noncardiac surgery. N Engl J Med. 2015;373(23):2258-2269. doi:10.1056/NEJMra1502824. PubMed
8. Lee TH, Marcantonio ER, Mangione CM, et al. Derivation and prospective validation of a simple index for prediction of cardiac risk of major noncardiac surgery. Circulation. 1999;100(10):1043-1049. doi: 10.1161/01.CIR.100.10.1043. PubMed
9. Cohen ME, Ko CY, Bilimoria KY, et al. Optimizing ACS NSQIP modeling for evaluation of surgical quality and risk: patient risk adjustment, procedure mix adjustment, shrinkage adjustment, and surgical focus. J Am Coll Surg. 2013;217(2):336-46.e1. doi: 10.1016/j.jamcollsurg.2013.02.027. PubMed
10. National Health and Nutrition Examination Survey Data. https://wwwn.cdc.gov/nchs/nhanes/continuousnhanes/default.aspx?BeginYear=2011. Accessed April 20, 2018.
11. Genders TSS, Steyerberg EW, Hunink MGM, et al. Prediction model to estimate presence of coronary artery disease: retrospective pooled analysis of existing cohorts. BMJ. 2012;344:e3485. doi: 10.1136/bmj.e3485. PubMed
12. Gupta PK, Gupta H, Sundaram A, et al. Development and validation of a risk calculator for prediction of cardiac risk after surgery. Circulation. 2011;124(4):381-387. doi: 10.1161/CIRCULATIONAHA.110.015701. PubMed
13. Blackstone EH, Lauer MS. Caveat emptor: the treachery of work-up bias. J Thorac Cardiovasc Surg. 2004;128(3):341-344. doi: 10.1016/j.jtcvs.2004.03.039. PubMed
14. Ransohoff DF, Feinstein AR. Problems of spectrum and bias in evaluating the efficacy of diagnostic tests. N Engl J Med. 1978;299(17):926-930. doi: 10.1056/NEJM197810262991705. PubMed
15. Jaarsma C, Leiner T, Bekkers SC, et al. Diagnostic performance of noninvasive myocardial perfusion imaging using single-photon emission computed tomography, cardiac magnetic resonance, and positron emission tomography imaging for the detection of obstructive coronary artery disease: a meta-analysis. J Am Coll Cardiol. 2012;59(19):1719-1728. doi: 10.1016/j.jacc.2011.12.040. PubMed
16. Geleijnse ML, Krenning BJ, Soliman OII, Nemes A, Galema TW, Cate ten FJ. Dobutamine stress echocardiography for the detection of coronary artery disease in women. Am J Cardiol. 2007;99(5):714-717. doi: 10.1016/j.amjcard.2006.09.124. PubMed
17. Miller TD, Hodge DO, Christian TF, Milavetz JJ, Bailey KR, Gibbons RJ. Effects of adjustment for referral bias on the sensitivity and specificity of single photon emission computed tomography for the diagnosis of coronary artery disease. Am J Med. 2002;112(4):290-297. doi: 10.1016/S0002-9343(01)01111-1. PubMed
Cardiac complications account for at least one-third of perioperative deaths, and lead to substantial morbidity and cost.1-4 Current guidelines recommend that patients undergo assessment of cardiac risk and functional status prior to noncardiac surgery.5 Preoperative cardiac stress testing is recommended for patients whose predicted cardiac risk exceeds 1%, whose functional status is limited, and for whom testing may change management.5
However, patients are not specifically selected according to risk of coronary artery disease (CAD) in current guidelines. The pretest probability of CAD may vary widely in this patient population, and the resultant accuracy of cardiac stress testing in making the diagnosis of CAD may vary as well.5 Meanwhile, CAD is a clear risk factor for perioperative cardiac events.6-8
Because the pretest probability of CAD is heterogeneous, the optimal modality of cardiac stress testing in this population is unclear. False-positive results would likely lead to inflated estimates of operative risk, expensive and high-risk downstream testing, and potentially cancellation of otherwise beneficial surgeries. Meanwhile, false-negative results would lead to overly optimistic estimates of surgical risk and potentially to surgical intervention at higher levels of risk than would be desirable. Current guidelines leave the selection of either dobutamine stress echocardiography (DSE) or pharmacological stress myocardial perfusion imaging to the clinician.5 To inform decisions regarding the selection of cardiac stress testing modality prior to noncardiac surgery, we conducted this study to estimate the diagnostic accuracy of DSE and single-photon emission computed tomography (SPECT) among this patient population.
METHODS
Surgical Cohort
The American College of Surgeons’ National Surgical Quality Improvement Program (NSQIP) samples patients undergoing surgery at participating hospitals and collects standardized clinical data on preoperative risk factors and postoperative complications.9 We acquired public use data from the 2009 NSQIP cohort, which included more than 336,000 surgical cases from 237 hospitals (principally in the United States). We excluded from our analysis patients undergoing cardiac surgery, patients with a prior diagnosis of CAD, and patients undergoing experimental surgeries. This left a sample of 300,462 for analysis.
Prediction of Dyslipidemia
The model we used to predict the presence of obstructive CAD required the presence or absence of dyslipidemia. A number of variables are common to both NSQIP and the National Health and Nutrition Examination Survey (NHANES), including age, weight, sex, tobacco use, diabetes, and prior stroke.10 Using those common variables, we developed a logistic regression to predict a diagnosis of dyslipidemia, applied that regression to the NSQIP cohort, and dichotomized. To assess the potential impact of misclassification, we performed separate sensitivity analyses in which either no patients or all patients had dyslipidemia.
Prediction of Obstructive CAD
To estimate the probability of obstructive CAD, we applied the risk prediction tool currently recommended by the European Society of Cardiology.11 The clinical version of this tool relies on age; sex; diagnoses of diabetes, hypertension, and dyslipidemia; active tobacco use; and chest pain characteristics to predict the probability of obstructive CAD on coronary angiography. We assumed that all patients in our cohort had nonspecific chest pain, the referent in the calculator.
Prediction of Perioperative Event Risk
To predict the probability of a perioperative cardiac event, we used the Myocardial Infarction or Cardiac Arrest (MICA) calculator, which was derived from an earlier cohort of NSQIP.12 All variables required for this prediction tool were included in the 2009 NSQIP cohort; our categorization of surgeries is included as an online appendix. MICA is one of three prediction tools included in the current American College of Cardiology/American Heart Association (ACC/AHA) guidelines.5
Prediction of Test Accuracy
We searched the MEDLINE database for estimates of the test characteristics of DSE and SPECT that adjusted for workup bias.13 (Also known as sequential-ordering bias, here we refer to the phenomenon whereby further workup is based on the results of diagnostic testing, resulting in underdiagnosis among patients with negative tests and falsely high estimates of sensitivity.14) Although other modalities of myocardial perfusion imaging exist, SPECT appears to be the most widely available, utilized, and studied modality of MPI.15 Our search strategy paired (“Sensitivity and Specificity” [MeSH Terms] AND “Coronary Disease/diagnostic imaging” [MAJR] AND “bias” [TIAB]) with (“Tomography, Emission-Computed, Single-Photon” [MAJR] OR “Echocardiography, Stress” [MAJR]). We reviewed the results for sensitivity and specificity estimates that corrected for workup bias. For each of SPECT and DSE, we drew the sensitivity and specificity from normal distributions based on literature estimates (see Table). We then calculated the expected accuracy of each modality for each patient in our dataset. All analyses were performed in Stata (version 14, College Station, Texas).
RESULTS
The median predicted probability of obstructive CAD was
Both accuracy and PPV were higher for DSE than for SPECT. The predicted accuracy of DSE was greater than that of SPECT in 73.5% of cases overall and in 60.5% of cases with a predicted operative cardiac risk greater than 1%. The mean PPV of DSE was 32.9% (median: 26.7%), while the equivalent PPVs for SPECT were 14.1% and 8.2%, respectively. Among cases with a predicted operative cardiac risk greater than 1%, the mean PPV of DSE was 57.5% (median: 60.2%), while the equivalent PPVs for SPECT were 29.8% and 26.7%, respectively.
DSE had a mean predicted accuracy of 93.0% (median: 96.2%), while SPECT had a mean accuracy of 92.6% (median: 95.6%). The predicted accuracies of DSE and SPECT are shown in the Figure, stratified by predicted perioperative risk across the 1% risk threshold currently used by ACC/AHA guidelines.
In our sensitivity analyses, dyslipidemia had little effect on the comparative accuracy. If no patients had dyslipidemia, DSE would have a higher accuracy than SPECT in 75.7% of cases. If all patients had dyslipidemia, DSE would have a higher predicted accuracy than SPECT in 72.8% of cases. For patients with an operative cardiac risk greater than 1%, the predicted accuracies were 65.0% and 59.4%, respectively.
DISCUSSION
In this study, we demonstrated that the expected accuracy of DSE in the diagnosis of obstructive CAD among patients undergoing noncardiac surgery is higher than that of SPECT. This finding was true in both unselected patients and those selected by a perioperative risk of greater than 1%. The use of SPECT, compared with DSE, would likely result in greater numbers of false-positive tests in this patient population and less accurate results overall.
Cardiac stress testing, as with any diagnostic test, is most useful at intermediate probabilities. Insofar as stress testing offers diagnostic value, our analysis suggests that, in the range of the predicted risk of CAD found in patients undergoing noncardiac surgery, DSE is a more efficient testing strategy. To the extent that making a diagnosis of CAD informs the decision to proceed to surgery, a more accurate test would be preferable. The lower cost of DSE, the lack of ionizing radiation, and the information provided by echocardiography regarding diagnoses other than CAD, if considered, would further amplify that preference.
However, it is important to note that both modalities have limited positive predictive value. In the median patient who meets the currently recommended 1% perioperative event risk threshold, SPECT would lead to 2.74 false positive results for every true positive result. DSE would produce approximately two false positive results for every three true positive results. If lower rates of false-positive testing are desired, different patient selection criteria are required.
A few key limitations of this work warrant discussion. First, our results likely overestimate the probability of obstructive CAD in this population. We assumed that all patients have nonspecific chest pain at the time of the preoperative evaluation, though many patients do not, in fact, have chest pain. Tools to estimate the pretest probability of CAD (such as the ESC tool that we used or the older Diamond-Forrester prediction) are intended to stratify higher-risk patients than are seen in a preoperative setting. If asymptomatic patients seen in preoperative risk assessment clinics have lower risk of CAD than what we have predicted, we will have understated the case for DSE. Moreover, cases sampled from hospitals participating in NSQIP are not representative of the national surgical population. This likely further inflates our estimates of CAD risk compared with the “true” surgical population. Finally, we cannot comment on current practice from these data. Current guidelines recommend preoperative cardiac stress testing for patients whose risk of a perioperative cardiac event exceeds 1%, whose functional status is poor or unknown, and only if said testing will change management.5 Using these data, we cannot determine the pretest probability of patients referred for stress testing before noncardiac surgery.
Still, this analysis suggests that, among patients undergoing noncardiac surgery, selecting patients according to the risk of perioperative events would result in a population at an overall comparatively low risk of CAD, and that in this population, DSE would be more accurate than SPECT for making the diagnosis of CAD. If a diagnosis of CAD would change the decision to proceed to surgery, DSE is likely to be a more efficient test than SPECT.
Acknowledgements
The authors would like to thank Wael Jaber, MD, for his thoughtful comments on a draft of this manuscript.
Disclosures
The authors have nothing to disclose.
Funding
The authors received no specific funding for this work.
1. Devereaux PJ, Xavier D, Pogue J, et al. Characteristics and short-term prognosis of perioperative myocardial infarction in patients undergoing noncardiac surgery: a cohort study. Ann Intern Med. 2011;154(8):523-528. doi: 10.7326/0003-4819-154-8-201104190-00003. PubMed
2. Udeh BL, Dalton JE, Hata JS, Udeh CI, Sessler DI. Economic trends from 2003 to 2010 for perioperative myocardial infarction: a retrospective, cohort study. Anesthesiology. 2014;121(1):36-45. doi: 10.1097/ALN.0000000000000233. PubMed
3. van Waes JAR, Nathoe HM, de Graaff JC, et al. Myocardial injury after noncardiac surgery and its association with short-term mortality. Circulation. 2013;127(23):2264-2271. doi: 10.1161/CIRCULATIONAHA.113.002128. PubMed
4. Wijeysundera DN, Beattie WS, Austin PC, Hux JE, Laupacis A. Non-invasive cardiac stress testing before elective major non-cardiac surgery: population based cohort study. BMJ. 2010;340(jan28 3):b5526-b5526. doi: 10.1136/bmj.b5526. PubMed
5. Fleisher LA, Fleischmann KE, Auerbach AD, et al. 2014 ACC/AHA Guideline on Perioperative Cardiovascular Evaluation and Management of Patients Undergoing Noncardiac Surgery. J Am Coll Cardiol. 2014;64(22):e77-e137. doi: 10.1016/j.jacc.2014.07.944. PubMed
6. Goldman L, Caldera DL, Nussbaum SR, et al. Multifactorial index of cardiac risk in noncardiac surgical procedures. N Engl J Med. 1977;297(16):845-850. doi:10.1056/NEJM197710202971601. PubMed
7. Devereaux PJ, Sessler DI. Cardiac Complications in patients undergoing major noncardiac surgery. N Engl J Med. 2015;373(23):2258-2269. doi:10.1056/NEJMra1502824. PubMed
8. Lee TH, Marcantonio ER, Mangione CM, et al. Derivation and prospective validation of a simple index for prediction of cardiac risk of major noncardiac surgery. Circulation. 1999;100(10):1043-1049. doi: 10.1161/01.CIR.100.10.1043. PubMed
9. Cohen ME, Ko CY, Bilimoria KY, et al. Optimizing ACS NSQIP modeling for evaluation of surgical quality and risk: patient risk adjustment, procedure mix adjustment, shrinkage adjustment, and surgical focus. J Am Coll Surg. 2013;217(2):336-46.e1. doi: 10.1016/j.jamcollsurg.2013.02.027. PubMed
10. National Health and Nutrition Examination Survey Data. https://wwwn.cdc.gov/nchs/nhanes/continuousnhanes/default.aspx?BeginYear=2011. Accessed April 20, 2018.
11. Genders TSS, Steyerberg EW, Hunink MGM, et al. Prediction model to estimate presence of coronary artery disease: retrospective pooled analysis of existing cohorts. BMJ. 2012;344:e3485. doi: 10.1136/bmj.e3485. PubMed
12. Gupta PK, Gupta H, Sundaram A, et al. Development and validation of a risk calculator for prediction of cardiac risk after surgery. Circulation. 2011;124(4):381-387. doi: 10.1161/CIRCULATIONAHA.110.015701. PubMed
13. Blackstone EH, Lauer MS. Caveat emptor: the treachery of work-up bias. J Thorac Cardiovasc Surg. 2004;128(3):341-344. doi: 10.1016/j.jtcvs.2004.03.039. PubMed
14. Ransohoff DF, Feinstein AR. Problems of spectrum and bias in evaluating the efficacy of diagnostic tests. N Engl J Med. 1978;299(17):926-930. doi: 10.1056/NEJM197810262991705. PubMed
15. Jaarsma C, Leiner T, Bekkers SC, et al. Diagnostic performance of noninvasive myocardial perfusion imaging using single-photon emission computed tomography, cardiac magnetic resonance, and positron emission tomography imaging for the detection of obstructive coronary artery disease: a meta-analysis. J Am Coll Cardiol. 2012;59(19):1719-1728. doi: 10.1016/j.jacc.2011.12.040. PubMed
16. Geleijnse ML, Krenning BJ, Soliman OII, Nemes A, Galema TW, Cate ten FJ. Dobutamine stress echocardiography for the detection of coronary artery disease in women. Am J Cardiol. 2007;99(5):714-717. doi: 10.1016/j.amjcard.2006.09.124. PubMed
17. Miller TD, Hodge DO, Christian TF, Milavetz JJ, Bailey KR, Gibbons RJ. Effects of adjustment for referral bias on the sensitivity and specificity of single photon emission computed tomography for the diagnosis of coronary artery disease. Am J Med. 2002;112(4):290-297. doi: 10.1016/S0002-9343(01)01111-1. PubMed
© 2018 Society of Hospital Medicine
The Continued Quest for Pediatric Readmission Risk Prediction
While the use of pediatric readmission rates as a quality metric remains controversial, pediatric hospital-to-home transitions need improvement.1 As many as a third of pediatric readmissions are preventable,2 but the multifactorial and complex nature of factors that contribute to pediatric readmissions presents a challenge in tackling readmission. Several factors are associated with increased risk of readmission; these factors include both clinical and sociodemographic characteristics;3 however, we still have much to learn. Further, the only large trial of an intervention to prevent pediatric readmissions across all comers (nontargeted) was unsuccessful in decreasing reutilization.4 By contrast, various studies have succeeded in reducing readmission and/or emergency department revisit rates associated with inpatient interventions in select populations.5 Currently, however, no standardized or validated pediatric risk prediction tool can reliably identify the high-risk patients who may benefit from interventions. In the Journal of Hospital Medicine, Brittan and colleagues add to the literature base exploring the factors associated with an increased 30-day readmission risk by trialing an electronic health record (EHR)-based tool composed of three components: presence of home health, polypharmacy in the form of ≥6 medications, and presence of a caregiver who prefers a language other than English.6
This brief report contributes significantly to the literature. First, the presence of a tool embedded within the pediatric EHR and readily accessible at the point of clinical care is novel. Study authors purposefully chose components easily extractable from the EHR which update automatically. This infrastructure generates an automated score that is easily accessible to clinicians in real-time. Second, the transparency of the tool is notable given its display via the EHR’s “Discharge Readiness Report,” where a clinician can view not only the total composite score (1 point for each component) but also the specific components for which a point was allocated. Although a composite score in and of itself is potentially helpful, understanding specific factors that contribute to a patient’s increased risk of readmission allows for better targeting of interventions. For example, in Brittan’s simple, three-component model, the presence of polypharmacy might trigger a pharmacist to meet with the family prior to discharge to discuss indications for and how to properly administer medications. Finally, a multidisciplinary team composed of clinicians, nurse-family educators, case managers, social workers, and informatics experts developed and implemented this tool. Although the roll-out and longitudinal use of this tool is not described, the engagement of these multiple provider-types is likely to increase successful roll-out and utilization of the tool.
Unfortunately, the utility of this tool in predicting readmission is limited as evidenced by its low c-statistic. This limitation may be due to several reasons. The tool was not originally built as a tool to predict readmissions but rather an instrument to identify complex discharge care as part of a quality improvement initiative to improve discharge processes. Given the questions about readmission risk prediction, the authors explored the potential for the tool to predict readmission risk. The authors acknowledge that the tool excluded many known readmission risk factors based upon inconsistent documentation within the EHR and the desire to emphasize only modifiable factors. Thus, variables, including prior hospitalization which is a well-documented risk factor for readmissions (but not modifiable) and social determinants of health (which are not consistently documented), were excluded. Additionally, the included variable of “language preference” may have been a considerably broad characteristic. Limited English proficiency has been increasingly recognized as a construct placing patients at higher risk for adverse outcomes. However, caregivers with high English proficiency also exhibit varying degrees of health literacy. The inclusion of health literacy may be additive to a readmission risk prediction tool. Finally, the outcome is not well-described with regard to identification of “unplanned” events. Thus, their outcome measure may have included planned admissions for which the readmission risk prediction tool would be irrelevant.
In summary, Brittan and colleagues engaged a multidisciplinary group of providers to address discharge planning processes and leveraged the EHR to support their efforts in the form of a brief screening tool. Although this tool was not predictive of hospital readmissions, it highlights the opportunity to better utilize the EHR to gather meaningful, real-time data and subsequently use this information to positively impact our clinical care and allocation of resources. The tool should serve as a stepping stone to building a more extensive tool with inclusion of other known and potential readmission risk factors, thus resulting in a clinically relevant readmission risk prediction tool.
The authors have nothing to disclose.
1. Solan LG, Beck AF, Brunswick SA, et al. The family perspective on hospital to home transitions: a qualitative study. Pediatrics 2015;136(6):e1539-1549. doi: 10.1542/peds.2015-2098. PubMed
2. Toomey SL, Peltz A, Loren S, et al. Potentially preventable 30-Day hospital readmissions at a children’s hospital. Pediatrics. 2016;138(2). doi: 10.1542/peds.2015-4182. PubMed
3. Berry JG, Hall DE, Kuo DZ, et al. Hospital utilization and characteristics of patients experiencing recurrent readmissions within children’s hospitals. JAMA. 2011;305(7):682-690. doi: 10.1001/jama.2011.122. PubMed
4. Auger KA, Simmons JM, Tubbs-Cooley H, et al. Hospital to home outcomes (H2O) randomized trial of a post-discharge nurse home visit. Pediatrics. In press. PubMed
5. Auger KA, Kenyon CC, Feudtner C, Davis MM. Pediatric hospital discharge interventions to reduce subsequent utilization: a systematic review. J Hosp Med. 2014;9(4):251-260. doi: 10.1002/jhm.2134. PubMed
6. Brittan MS, Martin SL, Anderson, Moss A,Torok MR. An electronic health record tool designed to improve pediatric hospital discharge has low predictive utility for readmissions [published online ahead of print August 29, 2018]. J Hosp Med. doi: 10.12788/jhm.3043. PubMed
While the use of pediatric readmission rates as a quality metric remains controversial, pediatric hospital-to-home transitions need improvement.1 As many as a third of pediatric readmissions are preventable,2 but the multifactorial and complex nature of factors that contribute to pediatric readmissions presents a challenge in tackling readmission. Several factors are associated with increased risk of readmission; these factors include both clinical and sociodemographic characteristics;3 however, we still have much to learn. Further, the only large trial of an intervention to prevent pediatric readmissions across all comers (nontargeted) was unsuccessful in decreasing reutilization.4 By contrast, various studies have succeeded in reducing readmission and/or emergency department revisit rates associated with inpatient interventions in select populations.5 Currently, however, no standardized or validated pediatric risk prediction tool can reliably identify the high-risk patients who may benefit from interventions. In the Journal of Hospital Medicine, Brittan and colleagues add to the literature base exploring the factors associated with an increased 30-day readmission risk by trialing an electronic health record (EHR)-based tool composed of three components: presence of home health, polypharmacy in the form of ≥6 medications, and presence of a caregiver who prefers a language other than English.6
This brief report contributes significantly to the literature. First, the presence of a tool embedded within the pediatric EHR and readily accessible at the point of clinical care is novel. Study authors purposefully chose components easily extractable from the EHR which update automatically. This infrastructure generates an automated score that is easily accessible to clinicians in real-time. Second, the transparency of the tool is notable given its display via the EHR’s “Discharge Readiness Report,” where a clinician can view not only the total composite score (1 point for each component) but also the specific components for which a point was allocated. Although a composite score in and of itself is potentially helpful, understanding specific factors that contribute to a patient’s increased risk of readmission allows for better targeting of interventions. For example, in Brittan’s simple, three-component model, the presence of polypharmacy might trigger a pharmacist to meet with the family prior to discharge to discuss indications for and how to properly administer medications. Finally, a multidisciplinary team composed of clinicians, nurse-family educators, case managers, social workers, and informatics experts developed and implemented this tool. Although the roll-out and longitudinal use of this tool is not described, the engagement of these multiple provider-types is likely to increase successful roll-out and utilization of the tool.
Unfortunately, the utility of this tool in predicting readmission is limited as evidenced by its low c-statistic. This limitation may be due to several reasons. The tool was not originally built as a tool to predict readmissions but rather an instrument to identify complex discharge care as part of a quality improvement initiative to improve discharge processes. Given the questions about readmission risk prediction, the authors explored the potential for the tool to predict readmission risk. The authors acknowledge that the tool excluded many known readmission risk factors based upon inconsistent documentation within the EHR and the desire to emphasize only modifiable factors. Thus, variables, including prior hospitalization which is a well-documented risk factor for readmissions (but not modifiable) and social determinants of health (which are not consistently documented), were excluded. Additionally, the included variable of “language preference” may have been a considerably broad characteristic. Limited English proficiency has been increasingly recognized as a construct placing patients at higher risk for adverse outcomes. However, caregivers with high English proficiency also exhibit varying degrees of health literacy. The inclusion of health literacy may be additive to a readmission risk prediction tool. Finally, the outcome is not well-described with regard to identification of “unplanned” events. Thus, their outcome measure may have included planned admissions for which the readmission risk prediction tool would be irrelevant.
In summary, Brittan and colleagues engaged a multidisciplinary group of providers to address discharge planning processes and leveraged the EHR to support their efforts in the form of a brief screening tool. Although this tool was not predictive of hospital readmissions, it highlights the opportunity to better utilize the EHR to gather meaningful, real-time data and subsequently use this information to positively impact our clinical care and allocation of resources. The tool should serve as a stepping stone to building a more extensive tool with inclusion of other known and potential readmission risk factors, thus resulting in a clinically relevant readmission risk prediction tool.
The authors have nothing to disclose.
1. Solan LG, Beck AF, Brunswick SA, et al. The family perspective on hospital to home transitions: a qualitative study. Pediatrics 2015;136(6):e1539-1549. doi: 10.1542/peds.2015-2098. PubMed
2. Toomey SL, Peltz A, Loren S, et al. Potentially preventable 30-Day hospital readmissions at a children’s hospital. Pediatrics. 2016;138(2). doi: 10.1542/peds.2015-4182. PubMed
3. Berry JG, Hall DE, Kuo DZ, et al. Hospital utilization and characteristics of patients experiencing recurrent readmissions within children’s hospitals. JAMA. 2011;305(7):682-690. doi: 10.1001/jama.2011.122. PubMed
4. Auger KA, Simmons JM, Tubbs-Cooley H, et al. Hospital to home outcomes (H2O) randomized trial of a post-discharge nurse home visit. Pediatrics. In press. PubMed
5. Auger KA, Kenyon CC, Feudtner C, Davis MM. Pediatric hospital discharge interventions to reduce subsequent utilization: a systematic review. J Hosp Med. 2014;9(4):251-260. doi: 10.1002/jhm.2134. PubMed
6. Brittan MS, Martin SL, Anderson, Moss A,Torok MR. An electronic health record tool designed to improve pediatric hospital discharge has low predictive utility for readmissions [published online ahead of print August 29, 2018]. J Hosp Med. doi: 10.12788/jhm.3043. PubMed
© 2018 Society of Hospital Medicine
An Electronic Health Record Tool Designed to Improve Pediatric Hospital Discharge has Low Predictive Utility for Readmissions
As hospitalized children become more medically complex, hospital-to-home care transitions will become increasingly challenging. During a quality improvement (QI) initiative, we developed an electronic tool to improve the quality of our hospital discharge process.
METHODS
Setting
This work was conducted at the Children’s Hospital Colorado as part of a national QI collaborative. The hospital’s EHR is Epic (Verona, Wisconsin). The project was approved as QI by the Children’s Hospital Organizational Research Risk and Quality Improvement Review Panel, precluding review from the Colorado Multiple Institutional Review Board.
Tool Design, Implementation, and Use
A team of clinicians, nurse–family educators, case managers, social workers, and informatics experts helped design the instrument between 2014 and 2015. In addition to the selected features (number of discharge medications, presence of home health, and language preference), we considered adding the number of consulting specialists but had previously improved our process for scheduling follow-up appointments. Diagnoses were not systematically or discretely documented to be reliably extracted in real time. We excluded known readmission predictor variables (such as length of stay [LOS] and prior hospitalizations) from the initial model to maintain emphasis on the modifiable discharge processes. Additional considerations, such as health literacy and social determinants, were not systematically measured to be operationally usable.
To generate the score, the clinical documentation of home-health orders categorizes children with home care. Each home-care equipment or service category is documented in separate flowsheet rows, allowing for identification of distinct categories (Table). Total parenteral nutrition, intravenous medications, and durable medical equipment and supplies are counted as home care. The number of discharge medications is approximated by inpatient medication orders and finalized as the number of discharge medication orders. The medications include new, historic, and as-needed medications (if included among discharge medication orders). 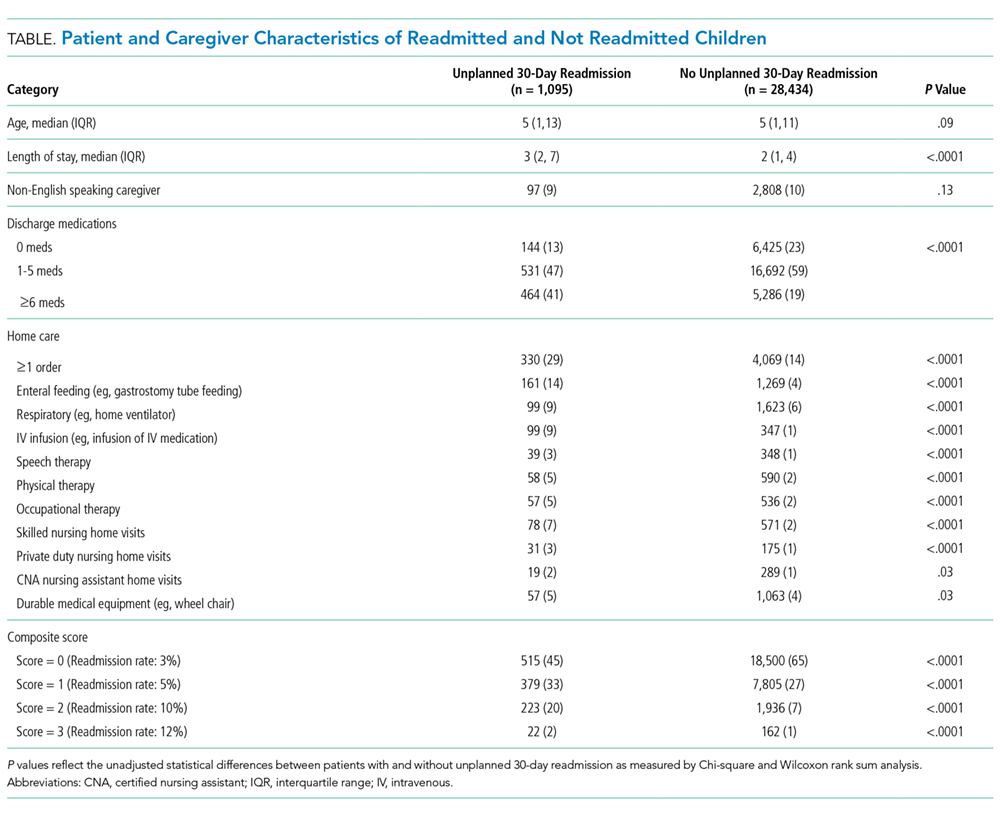
The electronic score is displayed within the EHR’s Discharge Readiness Report8 and updates automatically as relevant data are entered. The tool displays the individual components and as a composite of 0-3 points. To register a point in each category, a patient needs to exceed (1) the dichotomous discharge medications criterion (ie, ≥6 medications), (2) the dichotomous home-health order criterion (ie, ≥1 home-care order), and (3) to possess documentation of a non-English speaking caregiver. The tool serves as a visual reminder of discharge planning needs during daily coordination rounds attended by clinicians, nursing managers, case managers, and social workers. Case managers use the home-care alert to verify the accuracy of home-care orders.
Evaluation of Predictive Utility for Readmission
We performed a retrospective cohort study on patients aged 0-21 years who were discharged between January 1, 2014 and December 30, 2015. This study was performed to determine the optimal cut points for the continuous variables (discharge medications and home-care orders) and to evaluate the predictive value of the composite score.
Unplanned readmission within 30 days was used as the primary outcome. The index hospitalization was randomly selected for patients with >1 admissions to avoid biasing the results with multiple hospitalizations from individual patients.
Patient characteristics were summarized using percentages for categorical variables and the median and interquartile range (IQR) for continuous variables. We examined bivariate associations for each of the tool’s predictor elements with readmission using Chi-square and Wilcoxon tests
The area under the ROC curve (AUC) was estimated to evaluate the performance of the composite score
RESULTS
Cohort Characteristics
Analysis was restricted to 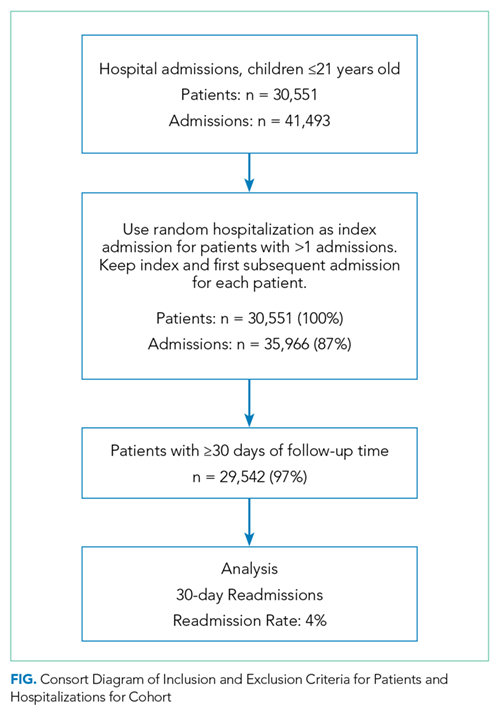
ROC analysis indicated that dichotomizing number of medications at ≥6 vs. <6 and home health at 0 vs. ≥1 categories maximized the sensitivity and specificity for predicting 30-day unplanned readmissions. In predictive logistic regression analysis, the odds of readmission was significantly higher in children with a composite score of 1 vs. 0 (odds ratio [OR], 1.7; 95% CI 1.5-2) and a score of ≥2 vs. 0 (OR, 4.2; 95% CI, 3.6-4.9). The c statistic for this model was 0.62, and the Brier score was 0.037. Internal validation of the predictive logistic regression model yielded identical results.
DISCUSSION
The instrument’s framework is relatively simple and should reduce barriers to implementation elsewhere. However, this tool was developed for one setting, and the design may require adjustment for other environments. Regional or institutional variation in home-health eligibility or clinical documentation may impact home-care and medication scores. The score may change at discharge if home-health or medication orders are modified late. The tool performs none of the following: measurement of regimen complexity, identification of high-risk medications, distinguishing of new versus preexisting medications/home care, nor measurement of health literacy, parent education, or psychosocial risk. Adding these features might enhance the model. Finally, readmission rates did not rise linearly with each added point. A more sophisticated scoring system (eg, differentially weighting each risk factor) may also improve the performance of the tool.
Despite these limitations, we have implemented a real-time electronic tool with practical potential to improve the discharge process but with low utility for distinguishing readmissions. Additional validation and research is needed to evaluate its impact on hospital discharge quality metrics and family reported outcome measures.
Disclosures
The authors have no relevant financial relationships to disclose.
Funding
This study was supported by an institutional Clinical and Operational Effectiveness and Patient Safety Small Grants Program
1. Holland DE, Conlon PM, Rohlik GM, Gillard KL, Messner PK, Mundy LM. Identifying hospitalized pediatric patients for early discharge planning: a feasibility study. J Pediatr Nurs. 2015;30(3):454-462. doi: 10.1016/j.pedn.2014.12.011. PubMed
2. Brittan M, Albright K, Cifuentes M, Jimenez-Zambrano A, Kempe A. Parent and provider perspectives on pediatric readmissions: what can we learn about readiness for discharge? Hosp Pediatr. 2015;5(11):559-565. doi: 10.1542/hpeds.2015-0034. PubMed
3. Brittan M FV, Martin S, Moss A, Keller D. Provider feedback: a potential method to reduce readmissions. Hosp Pediatr. 2016;6(11):684-688. PubMed
4. Berry JG, Hall DE, Kuo DZ, et al. Hospital utilization and characteristics of patients experiencing recurrent readmissions within children’s hospitals. JAMA 2011;305(7):682-690. doi: 10.1001/jama.2011.122. PubMed
5. Feudtner C, Levin JE, Srivastava R, et al. How well can hospital readmission be predicted in a cohort of hospitalized children? A retrospective, multicenter study. Pediatrics 2009;123(1):286-293. doi: 10.1542/peds.2007-3395. PubMed
6. Jurgens V, Spaeder MC, Pavuluri P, Waldman Z. Hospital readmission in children with complex chronic conditions discharged from subacute care. Hosp Pediatr. 2014;4(3):153-158. doi: 10.1542/hpeds.2013-0094. PubMed
7. Karliner LS, Kim SE, Meltzer DO, Auerbach AD. Influence of language barriers on outcomes of hospital care for general medicine inpatients. J Hosp Med. 2010;5(5):276-282. doi: 10.1002/jhm.658. PubMed
8. Tyler A, Boyer A, Martin S, Neiman J, Bakel LA, Brittan M. Development of a discharge readiness report within the electronic health record-A discharge planning tool. J Hosp Med. 2014;9(8):533-539. doi: 10.1002/jhm.2212. PubMed
9. Youden WJ. Index for rating diagnostic tests. Cancer 1950;3(1):32-35. doi: 10.1002/1097-0142(1950)3:1<32::AID-CNCR2820030106>3.0.CO;2-3. PubMed
10. Steyerberg EW, Harrell FE, Jr., Borsboom GJ, Eijkemans MJ, Vergouwe Y, Habbema JD. Internal validation of predictive models: efficiency of some procedures for logistic regression analysis. J Clin Epidemiol. 2001;54(8):774-781. doi: 10.1016/S0895-4356(01)00341-9. PubMed
11. Kansagara D, Englander H, Salanitro A, et al. Risk prediction models for hospital readmission: a systematic review. JAMA 2011;306(15):1688-1698. doi: 10.1001/jama.2011.1515. PubMed
12. Pepe MS, Janes H, Longton G, Leisenring W, Newcomb P. Limitations of the odds ratio in gauging the performance of a diagnostic, prognostic, or screening marker. Am J Epidemiol. 2004;159(9):882-890. doi: 10.1093/aje/kwh101. PubMed
13. Coller RJ, Klitzner TS, Lerner CF, Chung PJ. Predictors of 30-day readmission and association with primary care follow-up plans. J Pediatr. 2013;163(4):1027-1033. doi: 10.1016/j.jpeds.2013.04.013. PubMed
14. Jovanovic M, Radovanovic S, Vukicevic M, Van Poucke S, Delibasic B. Building interpretable predictive models for pediatric hospital readmission using Tree-Lasso logistic regression. Artif Intell Med. 2016;72:12-21. doi: 10.1016/j.artmed.2016.07.003. PubMed
15. Naessens JM, Knoebel E, Johnson M, Branda M. ISQUA16-1722 predicting pediatric readmissions. Int J Qual Health Care. 2016;28(suppl_1):24-25. doi: 10.1093/intqhc/mzw104.34.
As hospitalized children become more medically complex, hospital-to-home care transitions will become increasingly challenging. During a quality improvement (QI) initiative, we developed an electronic tool to improve the quality of our hospital discharge process.
METHODS
Setting
This work was conducted at the Children’s Hospital Colorado as part of a national QI collaborative. The hospital’s EHR is Epic (Verona, Wisconsin). The project was approved as QI by the Children’s Hospital Organizational Research Risk and Quality Improvement Review Panel, precluding review from the Colorado Multiple Institutional Review Board.
Tool Design, Implementation, and Use
A team of clinicians, nurse–family educators, case managers, social workers, and informatics experts helped design the instrument between 2014 and 2015. In addition to the selected features (number of discharge medications, presence of home health, and language preference), we considered adding the number of consulting specialists but had previously improved our process for scheduling follow-up appointments. Diagnoses were not systematically or discretely documented to be reliably extracted in real time. We excluded known readmission predictor variables (such as length of stay [LOS] and prior hospitalizations) from the initial model to maintain emphasis on the modifiable discharge processes. Additional considerations, such as health literacy and social determinants, were not systematically measured to be operationally usable.
To generate the score, the clinical documentation of home-health orders categorizes children with home care. Each home-care equipment or service category is documented in separate flowsheet rows, allowing for identification of distinct categories (Table). Total parenteral nutrition, intravenous medications, and durable medical equipment and supplies are counted as home care. The number of discharge medications is approximated by inpatient medication orders and finalized as the number of discharge medication orders. The medications include new, historic, and as-needed medications (if included among discharge medication orders).
The electronic score is displayed within the EHR’s Discharge Readiness Report8 and updates automatically as relevant data are entered. The tool displays the individual components and as a composite of 0-3 points. To register a point in each category, a patient needs to exceed (1) the dichotomous discharge medications criterion (ie, ≥6 medications), (2) the dichotomous home-health order criterion (ie, ≥1 home-care order), and (3) to possess documentation of a non-English speaking caregiver. The tool serves as a visual reminder of discharge planning needs during daily coordination rounds attended by clinicians, nursing managers, case managers, and social workers. Case managers use the home-care alert to verify the accuracy of home-care orders.
Evaluation of Predictive Utility for Readmission
We performed a retrospective cohort study on patients aged 0-21 years who were discharged between January 1, 2014 and December 30, 2015. This study was performed to determine the optimal cut points for the continuous variables (discharge medications and home-care orders) and to evaluate the predictive value of the composite score.
Unplanned readmission within 30 days was used as the primary outcome. The index hospitalization was randomly selected for patients with >1 admissions to avoid biasing the results with multiple hospitalizations from individual patients.
Patient characteristics were summarized using percentages for categorical variables and the median and interquartile range (IQR) for continuous variables. We examined bivariate associations for each of the tool’s predictor elements with readmission using Chi-square and Wilcoxon tests
The area under the ROC curve (AUC) was estimated to evaluate the performance of the composite score
RESULTS
Cohort Characteristics
Analysis was restricted to
ROC analysis indicated that dichotomizing number of medications at ≥6 vs. <6 and home health at 0 vs. ≥1 categories maximized the sensitivity and specificity for predicting 30-day unplanned readmissions. In predictive logistic regression analysis, the odds of readmission was significantly higher in children with a composite score of 1 vs. 0 (odds ratio [OR], 1.7; 95% CI 1.5-2) and a score of ≥2 vs. 0 (OR, 4.2; 95% CI, 3.6-4.9). The c statistic for this model was 0.62, and the Brier score was 0.037. Internal validation of the predictive logistic regression model yielded identical results.
DISCUSSION
The instrument’s framework is relatively simple and should reduce barriers to implementation elsewhere. However, this tool was developed for one setting, and the design may require adjustment for other environments. Regional or institutional variation in home-health eligibility or clinical documentation may impact home-care and medication scores. The score may change at discharge if home-health or medication orders are modified late. The tool performs none of the following: measurement of regimen complexity, identification of high-risk medications, distinguishing of new versus preexisting medications/home care, nor measurement of health literacy, parent education, or psychosocial risk. Adding these features might enhance the model. Finally, readmission rates did not rise linearly with each added point. A more sophisticated scoring system (eg, differentially weighting each risk factor) may also improve the performance of the tool.
Despite these limitations, we have implemented a real-time electronic tool with practical potential to improve the discharge process but with low utility for distinguishing readmissions. Additional validation and research is needed to evaluate its impact on hospital discharge quality metrics and family reported outcome measures.
Disclosures
The authors have no relevant financial relationships to disclose.
Funding
This study was supported by an institutional Clinical and Operational Effectiveness and Patient Safety Small Grants Program
1. Holland DE, Conlon PM, Rohlik GM, Gillard KL, Messner PK, Mundy LM. Identifying hospitalized pediatric patients for early discharge planning: a feasibility study. J Pediatr Nurs. 2015;30(3):454-462. doi: 10.1016/j.pedn.2014.12.011. PubMed
2. Brittan M, Albright K, Cifuentes M, Jimenez-Zambrano A, Kempe A. Parent and provider perspectives on pediatric readmissions: what can we learn about readiness for discharge? Hosp Pediatr. 2015;5(11):559-565. doi: 10.1542/hpeds.2015-0034. PubMed
3. Brittan M FV, Martin S, Moss A, Keller D. Provider feedback: a potential method to reduce readmissions. Hosp Pediatr. 2016;6(11):684-688. PubMed
4. Berry JG, Hall DE, Kuo DZ, et al. Hospital utilization and characteristics of patients experiencing recurrent readmissions within children’s hospitals. JAMA 2011;305(7):682-690. doi: 10.1001/jama.2011.122. PubMed
5. Feudtner C, Levin JE, Srivastava R, et al. How well can hospital readmission be predicted in a cohort of hospitalized children? A retrospective, multicenter study. Pediatrics 2009;123(1):286-293. doi: 10.1542/peds.2007-3395. PubMed
6. Jurgens V, Spaeder MC, Pavuluri P, Waldman Z. Hospital readmission in children with complex chronic conditions discharged from subacute care. Hosp Pediatr. 2014;4(3):153-158. doi: 10.1542/hpeds.2013-0094. PubMed
7. Karliner LS, Kim SE, Meltzer DO, Auerbach AD. Influence of language barriers on outcomes of hospital care for general medicine inpatients. J Hosp Med. 2010;5(5):276-282. doi: 10.1002/jhm.658. PubMed
8. Tyler A, Boyer A, Martin S, Neiman J, Bakel LA, Brittan M. Development of a discharge readiness report within the electronic health record-A discharge planning tool. J Hosp Med. 2014;9(8):533-539. doi: 10.1002/jhm.2212. PubMed
9. Youden WJ. Index for rating diagnostic tests. Cancer 1950;3(1):32-35. doi: 10.1002/1097-0142(1950)3:1<32::AID-CNCR2820030106>3.0.CO;2-3. PubMed
10. Steyerberg EW, Harrell FE, Jr., Borsboom GJ, Eijkemans MJ, Vergouwe Y, Habbema JD. Internal validation of predictive models: efficiency of some procedures for logistic regression analysis. J Clin Epidemiol. 2001;54(8):774-781. doi: 10.1016/S0895-4356(01)00341-9. PubMed
11. Kansagara D, Englander H, Salanitro A, et al. Risk prediction models for hospital readmission: a systematic review. JAMA 2011;306(15):1688-1698. doi: 10.1001/jama.2011.1515. PubMed
12. Pepe MS, Janes H, Longton G, Leisenring W, Newcomb P. Limitations of the odds ratio in gauging the performance of a diagnostic, prognostic, or screening marker. Am J Epidemiol. 2004;159(9):882-890. doi: 10.1093/aje/kwh101. PubMed
13. Coller RJ, Klitzner TS, Lerner CF, Chung PJ. Predictors of 30-day readmission and association with primary care follow-up plans. J Pediatr. 2013;163(4):1027-1033. doi: 10.1016/j.jpeds.2013.04.013. PubMed
14. Jovanovic M, Radovanovic S, Vukicevic M, Van Poucke S, Delibasic B. Building interpretable predictive models for pediatric hospital readmission using Tree-Lasso logistic regression. Artif Intell Med. 2016;72:12-21. doi: 10.1016/j.artmed.2016.07.003. PubMed
15. Naessens JM, Knoebel E, Johnson M, Branda M. ISQUA16-1722 predicting pediatric readmissions. Int J Qual Health Care. 2016;28(suppl_1):24-25. doi: 10.1093/intqhc/mzw104.34.
© 2018 Society of Hospital Medicine
A Dark Horse Diagnosis
A 73-year-old man presented to the emergency department in late winter with fevers, myalgias, fatigue, low back pain, and poor oral intake. Four days earlier, he had fallen and hit his head. His partner also noticed a few episodes of confusion in the days leading up to presentation.
The patient’s symptoms are nonspecific. Fevers prompt the consideration of systemic infection, though fevers can also be seen in a broad range of noninfectious processes, including malignancy, vasculitis, autoimmune conditions, endocrinopathies, and drug reaction. The clinical picture warrants prompt and comprehensive evaluation, beginning with further detailed history (current illnesses, exposures, travel, vaccinations, medications, cancer screenings, weight change) and a careful physical examination, which will help guide laboratory testing and imaging.
His past medical history was notable for coronary artery disease for which he underwent coronary artery bypass grafting five years prior, hypertension, hyperlipidemia, diet-controlled type 2 diabetes mellitus, gastroesophageal reflux disease, osteoarthritis leading to chronic knee and hand pain, and a history of mildly low testosterone levels. His medications included hydrocodone and acetaminophen, metoprolol tartrate, omeprazole, topical testosterone gel (prescribed for daily use, used intermittently), and aspirin. He was retired and lived in rural Michigan with his female partner. He previously worked as a truck driver and used to train racehorses. He had quit smoking five years earlier. He denied alcohol or injection drug use.
The patient has significant underlying medical conditions. Considering infectious causes of his symptoms, it is notable that he has no reported immunodeficiency. It would be relevant to know if he has been tested for HIV. His rural residence and work with horses raise the possibility of zoonotic infections, including plague (Yersinia pestis), brucellosis (Brucella species), Q fever (Coxiella burnetti), Rhodococcus equi, or group C or G Streptococci. Information about tuberculosis risk factors, other geographic exposures, recent dental work, and ill contacts might be helpful to elucidate the causes of this nonspecific febrile illness with a possible CNS component. With regard to malignancy, it would be helpful to ask about recent weight loss, lymphadenopathy, and prior cancer screenings. Considering other etiologies, he does not report a history of autoimmune or endocrine conditions. However, it is important to consider a vasculitis, such as giant cell arteritis or polyarteritis nodosa, autoimmune conditions, and endocrinopathies such as thyrotoxicosis. The differential diagnosis for his clinical syndrome remains broad.
Vital signs were temperature 37.3°C, heart rate 88 beats per minute, respiratory rate 18 breaths per minute, blood pressure 105/64 mmHg, and oxygen saturation 93% on room air. Oral examination revealed poor dentition. The heart had a normal rate and regular rhythm with no murmurs, rubs, or gallops, and lungs were clear to auscultation bilaterally. The abdomen was unremarkable. Examination of the back was notable for mild tenderness to palpation over the sacrum. He was oriented to person, place, and time, with intact cranial nerves and a nonfocal neurologic examination. The remainder of his examination was normal. The white blood cell (WBC) count was 11.1 × 10³/μL, with 84% neutrophils and 9% bands, hemoglobin 13.6 g/dL, platelet count 54 × 103/μL, sodium 122 mmol/L, potassium 3.3 mmol/L, chloride 89 mmol/L, bicarbonate 21 mmol/L, creatinine 1.64 mg/dL, albumin 2.7 g/dL, alkaline phosphatase 136 U/L, AST 60 U/L, ALT 37 U/L, and total bilirubin 2.1 mg/dL.
He had presented to the emergency department five days earlier with fever, flank pain, nausea, vomiting, and weakness. At that time, he had a temperature of 38.2°C, but vital signs otherwise had been normal. Laboratory studies had revealed WBC count 14.0 × 10³/μL, hemoglobin 13.7 g/dL, platelet count 175 × 103/μL, sodium 129 mmol/L, chloride 97 mmol/dL, bicarbonate 23 mmol/L, creatinine 1.1 mg/dL, and total bilirubin 1.6 mg/dL. Urinalysis had been negative. He had received one liter of intravenous normal saline and ketorolac for pain and had been discharged with the diagnosis of a viral illness.
A picture of a progressive, subacute illness with multisystem involvement appears to be emerging, and there are several abnormalities consistent with infection, including fever, leukocytosis with bandemia, thrombocytopenia, renal dysfunction, and elevated bilirubin. His borderline hypotension may be due to uninterrupted use of his antihypertensive medication in the setting of poor oral intake or may indicate incipient sepsis. Focal sacral tenderness raises the possibility of vertebral osteomyelitis or epidural abscess, either from a contiguous focus of infection from the surrounding structures, or as a site of seeding from bacteremia. His prior confusion episodes might have been secondary to a systemic process; however, CNS imaging should be done, given the history of confusion and recent fall. Further diagnostic studies are warranted, including: blood cultures; peripheral blood smear; imaging of the spine, chest, abdomen, and pelvis; electrocardiogram; and possibly echocardiogram. Although noninfectious etiologies should not be discounted, the constellation of findings is more compatible with infection.
Two sets of blood cultures and a viral respiratory swab were obtained. Computed tomography (CT) of the head without contrast was negative for acute bleeding or other intracranial pathology. Lumbosacral radiography revealed degenerative changes with intact alignment of the sacrum. The patient was admitted with plans to pursue lumbar puncture if altered mental status recurred. The viral swab was negative. Within 24 hours, one set of blood cultures (both bottles) grew lactose-negative, oxidase-negative, gram-negative rods.
Gram-negative rods (GNRs) rarely are contaminants in blood cultures and should be considered significant until proven otherwise. Prompt empiric therapy and investigation to identify the primary source of bacteremia must be initiated. Although the most common GNRs isolated from blood cultures are enteric coliform organisms such as E. coli, Klebsiella, and Enterobacter, these typically are lactose-positive. Additional possibilities should be considered, including Salmonella species or other organisms comprising the “HACEK” group. This latter group is commonly associated with endocarditis, but the majority are oxidase-positive and have more fastidious growth requirements. Although there are other gram-negative organisms to consider, they have other distinguishing characteristics that have not been indicated in the microbiology results. Broad-spectrum antibiotic therapy is appropriate while awaiting the final identification of the GNR. A thorough search for a primary source and secondary sites of hematogenous seeding should be conducted. His only localizing symptom was tenderness over the sacrum, and this should be further assessed by sensitive imaging such as magnetic resonance imaging (MRI). The identity of the GNR would guide further diagnostic evaluation. For example, a respiratory organism such as Haemophilus influenzae would prompt a CT scan of the chest. Isolation of an enteric or a coliform GNR such as E. coli would prompt abdominal and pelvic imaging to assess for occult abscess. An “HACEK” group organism would prompt echocardiography to evaluate for endocarditis.
He was started on piperacillin–tazobactam. GNR bacteremia without a clear source prompted a CT of the chest, abdomen, and pelvis with and without contrast. The images were unremarkable, with the exception of a signal abnormality in the left psoas muscle concerning for abscess (Figure 1). MRI of the same region revealed L2-4 osteomyelitis and discitis with bilateral psoas abscesses but without epidural abscess (Figure 2).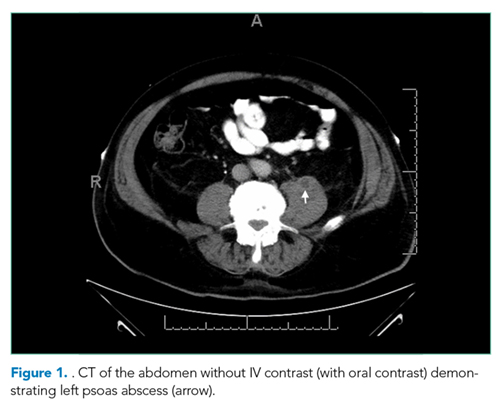
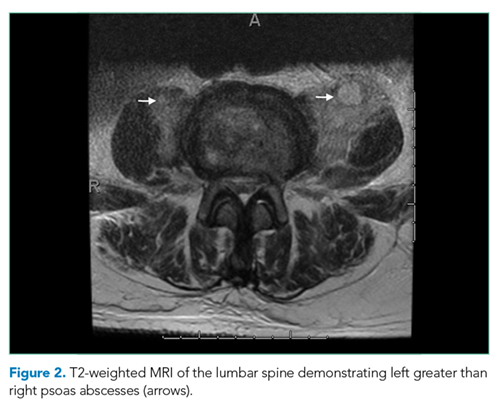
Because of increasing reports of antibiotic resistance in GNRs, even in community-acquired infections, it is appropriate to initially treat with a broad-spectrum antibiotic such as a fourth-generation cephalosporin or carbapenem while awaiting identification and susceptibility results to guide definitive therapy. In addition to antimicrobial therapy, treatment of psoas abscess usually requires drainage. Vertebral osteomyelitis from a hematogenous source can often be treated with antibiotics alone, as long as there are no associated complications such as epidural abscess and spine instability. Imaging should be reviewed for pathology of the surrounding structures, and surgical consultation should be obtained.
Neurosurgery, Interventional Radiology, and Infectious Disease services were consulted. Antibiotic coverage was expanded to vancomycin, cefepime, and metronidazole due to the possibility of polymicrobial infection. No surgical intervention was recommended since the abscesses were too small to drain.
The next day, the GNR was identified as Serratia marcescens.
S. marcescens is a widely distributed organism in the environment, but not a common component of endogenous human flora. Serratia is generally considered as an opportunistic nosocomial pathogen. Community-acquired infection with this organism is unusual and implies exogenous acquisition. A careful re-evaluation of exposures, including injection drug use or other parenteral exposures is important to identify the likely source of infection, as these have been previously linked to outbreaks of environmental organisms. Based on the presumed pathogenesis of infection and the initial microbiology suggesting monomicrobial Serratia infection, antibiotics should be narrowed based on the susceptibility results. There is concern that antibiotics might not adequately penetrate the abscesses and result in a lack of clinical improvement and/or lead to the emergence of antibiotic resistance during therapy. This is an important concern with Serratia, which typically harbors an AmpC beta-lactamase that can mediate resistance to broad-spectrum cephalosporins. If medical therapy alone without drainage is planned, short-interval re-imaging is warranted.
Blood cultures from days two and three of hospitalization also grew S. marcescens. No other organisms grew. Based on culture sensitivity data, antibiotics were narrowed to ceftriaxone.
This surprising culture result prompted the medical team to obtain screening laboratory tests for immunocompromising conditions and to revisit the patient’s history. His type 2 diabetes mellitus was well controlled with a hemoglobin A1c of 6.5%. HIV testing was negative. Further questioning of the patient revealed that he had fallen from a truck onto rocks four months prior, injuring his back and hip, but without puncture of the skin or loss of consciousness; he denied recent falls or other injuries but reported significant chronic knee pain. He had not been hospitalized recently. He had never taken corticosteroids or immunomodulatory medications. He continued to deny injection drug use. He did, however, clarify that his work with racehorses, which was originally understood to be a prior hobby, was ongoing, including recent work of cleaning the stables.
The following morning, he experienced confusion, rigors, and hypoxia, which prompted transfer to the intensive care unit (ICU).
Acute worsening during treatment is worrisome, and could be a potential complication of his infection or treatment – or even a separate process altogether. Knee pain in the setting of bacteremia raises the possibility of septic or crystal-induced arthritis and warrants imaging. Confusion and hypoxia might represent secondary sites of seeding from bacteremia (CNS infection and pneumonia, respectively) or manifestations of endocarditis, the latter being unusual for Serratia. An echocardiogram should be obtained. Other neurologic causes, including seizure, should also be considered. Further evaluation by chest imaging and repeat neurologic examination and imaging should be performed. Emergence of resistance during therapy is a theoretical concern with Serratia as an AmpC beta-lactamase-containing organism. While awaiting additional microbiology data, an empiric change to an AmpC beta-lactamase stable antibiotic such as a carbapenem should be made, especially since he has clinically deteriorated on therapy with a β-lactamase susceptible antibiotic, raising concerns of the emergence of resistance on initial therapy.
Antibiotics were changed to meropenem, vancomycin, and metronidazole given the clinical worsening and concerns that this represented infection unresponsive to prior antibiotics. The acute episode resolved spontaneously after one hour. His neurologic examination remained nonfocal. Chest radiography, urinalysis, urine culture, and right upper quadrant ultrasound were unremarkable. Transesophageal echocardiogram revealed no heart valve vegetations. MRI and bone scan of the lower extremities did not show any evidence of septic arthritis or other infection. He remained stable and was transferred out of the ICU the following day. Antibiotic coverage was switched to cefepime. On discussion with his significant other, this event was found to be similar to the intermittent confusion that occurred in the days prior to admission.
The acute onset and other features of these intermittent periods of deterioration are compatible with infection; intermittent seeding of the blood with microbes or their products (eg, lipopolysaccharides) from an abscess or vascular infection could explain these episodes. Some of the previous hypotheses to explain the episodes, such as a secondary infectious process, have not been supported by diagnostic testing or the clinical course. He needs close clinical monitoring and interval assessment of the known sites of infection.
Ten days after osteomyelitis and discitis were diagnosed, the patient developed worsening low back pain, prompting repeat spine MRI. This was significant for bilateral psoas abscess enlargement and extension of osteomyelitis and discitis (Figure 3). He was re-evaluated by Neurosurgery and Interventional Radiology and underwent psoas abscess drainage; abscess cultures grew S. marcescens.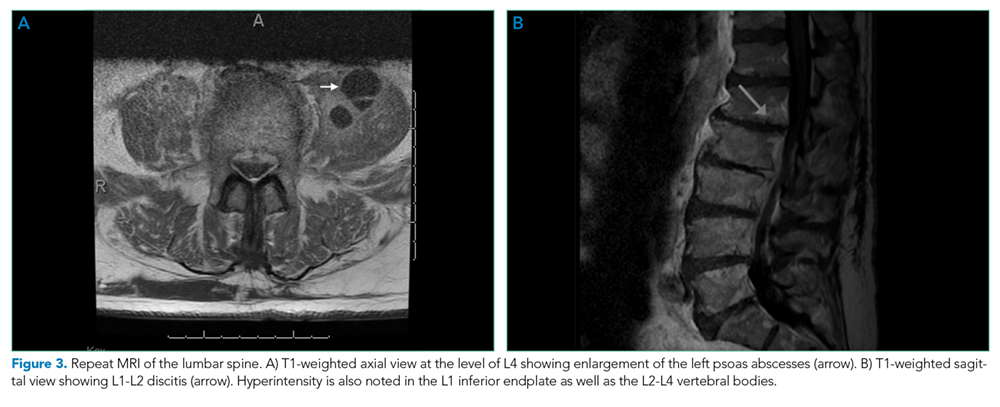
He slowly improved over several weeks and was discharged to a subacute rehabilitation facility. He completed a 3.5-week course of intravenous antibiotics before leaving against medical advice. He completed eight weeks of oral trimethoprim-sulfamethoxazole and remains without long-term sequelae from the infection.
DISCUSSION
S. marcescens is a gram-negative rod in the Enterobacteriaceae family known for its red pigment. Primarily, S. marcescens causes nosocomial infections, most commonly of the respiratory and urinary tracts. However, a wide range of manifestations has been documented, including meningitis, ocular infections (conjunctivitis, keratitis, endophthalmitis), endocarditis, skin infections (cellulitis, necrotizing fasciitis), and osteomyelitis.1, 2 S. marcescens is often reported as the cause of outbreaks in ICUs;3-6 infection is thought to occur via contamination of water pipes, hospital equipment, and disinfectants.3, 7 Its natural environment includes soil, water, and GI tracts of animals,4 and there are published reports of S. marcescens infection in horses.8, 9 This patient was most likely exposed to S. marcescens through his work with horses and their environment.
S. marcescens has wide-ranging target organs, and successful treatment can be difficult. S. marcescens can infect the renal, respiratory, gastrointestinal, ocular, cardiovascular, and musculoskeletal systems. S. marcescens, like other “SPACE” organisms (Serratia, Pseudomonas, Acinetobacter, Citrobacter, Enterobacter), expresses inducible AmpC beta-lactamase.10 At baseline, AmpC beta-lactamase expression is repressed.11 Mutants with stably de-repressed (constitutively expressed) AmpC can be selected during therapy and lead to clinical failure, as has been best described during therapy for Enterobacter infections.12 Infectious Disease consultation may be helpful when caring for patients with S. marcescens bacteremia given these complexities.
This was an unusual case of S. marcescens infection. It most commonly infects immunocompromised hosts. Reported risk factors include solid organ or hematopoietic stem cell transplant, malignancy, HIV/AIDS, and receipt of immunosuppressive agents. The patient did not have these risk factors, but did have well-controlled type 2 diabetes mellitus. Although diabetes is associated with an increased risk of infection and more severe infections,13, 14 there is no evidence in the literature that well-controlled type 2 diabetes mellitus compromises the immune system. A few case reports document cutaneous S. marcescens infection in immunocompetent adults.15,16 A case report of S. marcescens septic arthritis and adjacent osteomyelitis has also been published, but the patient had poorly controlled diabetes.17 This case provides a report of systemic S. marcescens infection in an individual without clear risk factors.
S. marcescens osteomyelitis is rare, and there have been only a few prior case reports.2,18 The presentation of osteomyelitis, regardless of the causative organism, is subtle, often insidious, and can easily be missed. Hospitalists should have a high index of suspicion for the diagnosis as it requires prompt evaluation and treatment for complications, including epidural abscess. Risk factors include diabetes mellitus, rheumatoid arthritis, injection drug use, and other immunocompromising illnesses.19 Degenerative changes in the spine such as osteoarthritis may be risk factors as well,20 though not well studied or quantified. A hypothesized mechanism involves local inflammation and joint damage, leaving the area susceptible to bacterial seeding. Osteoarthritis and degenerative disc disease, along with exposure to racehorses, likely put this patient at risk for bacterial seeding in the vertebrae, ultimately leading to a “dark horse” diagnosis.
TEACHING POINTS
- Serratia marcescens is a gram-negative rod bacterium that most commonly infects immunocompromised individuals in hospital settings. This report demonstrates that S. marcescens can cause serious infection in immunocompetent, nonhospitalized adults.
- S. marcescens bacteremia or infection of organs outside of the urinary or respiratory systems is uncommon, and therapy can be complicated by emergence of resistance.
- The clinical presentation of vertebral osteomyelitis and discitis and psoas abscess can be subtle and may present without typical signs and symptoms of infection.
ACKNOWLEDGEMENTS
The authors thank the patient and his partner for their willingness to have his story published, Laura Petersen, MHSA, for providing assistance with references and manuscript editing, and Shadi Azar, MBBS, for assistance in selecting the cross-sectional images.
Disclosures
The authors have no conflicts of interest to disclose.
1. Hejazi A, Falkiner FR. Serratia marcescens. J Med Microbiol. 1997;46(11):903-912. doi: 10.1099/00222615-46-11-903. PubMed
2. Lau JX, Li JY, Yong TY. Non-contiguous multifocal vertebral osteomyelitis caused by erratia marcescens. Mod Rheumatol. 2015;25(2):303-306. doi: 10.3109/14397595.2013.874754. PubMed
3. Dessi A, Puddu M, Testa M, Marcialis MA, Pintus MC, Fanos V. Serratia marcescens infections and outbreaks in neonatal intensive care units. J Chemother. 2009;21(5):493-499. doi: 10.1179/joc.2009.21.5.493. PubMed
4. Mahlen SD. Serratia infections: from military experiments to current practice. Clin Microbiol Rev. 2011;24(4):755-791. doi: 10.1128/CMR.00017-11. PubMed
5. Montagnani C, Cocchi P, Lega L, et al. Serratia marcescens outbreak in a neonatal intensive care unit: crucial role of implementing hand hygiene among external consultants. BMC Infect Dis. 2015;15:11. doi: 10.1186/s12879-014-0734-6. PubMed
6. van Ogtrop ML, van Zoeren-Grobben D, Verbakel-Salomons EM, van Boven CP. Serratia marcescens infections in neonatal departments: description of an outbreak and review of the literature. J Hosp Infect. 1997;36(2):95-103. doi: 10.1016/S0195-6701(97)90115-8. PubMed
7. Weber DJ, Rutala WA, Sickbert-Bennett EE. Outbreaks associated with contaminated antiseptics and disinfectants. Antimicrob Agents Chemother. 2007;51(12):4217-4224. doi: 10.1128/AAC.00138-07. PubMed
8. Ewart S, Brown C, Derksen F, Kufuor-Mensa E. Serratia marcescens endocarditis in a horse. J Am Vet Med Assoc. 1992;200(7):961-963. PubMed
9. Jores J, Beutner G, Hirth-Schmidt I, Borchers K, Pitt TL, Lubke-Becker A. Isolation of Serratia marcescens from an equine abortion in Germany. Vet Rec. 2004;154(8):242-244. doi: 10.1136/vr.154.8.242. PubMed
10. Herra C, Falkiner FR. Serratia marcescens. http://www.antimicrobe.org/b26.asp. Accessed August 22, 2017.
11. Jacoby GA. AmpC beta-lactamases. Clin Microbiol Rev. 2009;22(1):161-182, Table of Contents. doi: 10.1128/CMR.00036-08. PubMed
12. Chow JW, Fine MJ, Shlaes DM, et al. Enterobacter bacteremia: clinical features and emergence of antibiotic resistance during therapy. Ann Intern Med. 1991;115(8):585-590. doi: 10.7326/0003-4819-115-8-585. PubMed
13. Goeijenbier M, van Sloten TT, Slobbe L, et al. Benefits of flu vaccination for persons with diabetes mellitus: A review. Vaccine. 2017;35(38):5095-5101. doi: 10.1016/j.vaccine.2017.07.095. PubMed
14. Gupta S, Koirala J, Khardori R, Khardori N. Infections in diabetes mellitus and hyperglycemia. Infect Dis Clin North Am. 2007;21(3):617-638, vii. doi: 10.1016/j.idc.2007.07.003. PubMed
15. Carlesimo M, Pennica A, Muscianese M, et al. Multiple skin ulcers due to Serratia marcescens in a immunocompetent patient. G Ital Dermatol Venereol. 2014;149(3):367-370. PubMed
16. Rallis E, Karanikola E, Papadakis P. Severe facial infection caused by Serratia marcescens in an immunocompetent soldier. J Am Acad Dermatol. 2008;58(5 Suppl 1):S109-S110. doi: 10.1016/j.jaad.2007.04.010. PubMed
17. Hadid H, Usman M, Thapa S. Severe osteomyelitis and septic arthritis due to Serratia marcescens in an immunocompetent patient. Case Rep Infect Dis. 2015;2015:347652. doi: 10.1155/2015/347652. PubMed
18. Berbari EF, Kanj SS, Kowalski TJ, et al. 2015 Infectious Diseases Society of America (IDSA) Clinical Practice Guidelines for the Diagnosis and Treatment of Native Vertebral Osteomyelitis in Adults. Clin Infect Dis. 2015;61(6):e26-e46. doi: 10.1093/cid/civ482. PubMed
19. Vertebral Osteomyelitis Guideline Team (Team Leader: Chenoweth CE; Team Members: Bassin BS HS, Mack MR, Kunapuli A, Park P, Quint DJ, Seagull FJ, Wesorick DH; Consultants: Patel RD, Riddell IV J, Lanava KM). Vertebral Osteomyelitis, Discitis, and Spinal Epidural Abscess in Adults. University of Michigan Guidelines for Clinical Care 2013; http://www.med.umich.edu/1info/FHP/practiceguides/vertebral/VO.pdf. Accessed October 26, 2017.
20. McDonald M. Vertebral osteomyelitis and discitis in adults. 2017; Available at: https://www.uptodate.com/contents/vertebral-osteomyelitis-and-discitis-in-adults. Accessed October 26, 2017.
A 73-year-old man presented to the emergency department in late winter with fevers, myalgias, fatigue, low back pain, and poor oral intake. Four days earlier, he had fallen and hit his head. His partner also noticed a few episodes of confusion in the days leading up to presentation.
The patient’s symptoms are nonspecific. Fevers prompt the consideration of systemic infection, though fevers can also be seen in a broad range of noninfectious processes, including malignancy, vasculitis, autoimmune conditions, endocrinopathies, and drug reaction. The clinical picture warrants prompt and comprehensive evaluation, beginning with further detailed history (current illnesses, exposures, travel, vaccinations, medications, cancer screenings, weight change) and a careful physical examination, which will help guide laboratory testing and imaging.
His past medical history was notable for coronary artery disease for which he underwent coronary artery bypass grafting five years prior, hypertension, hyperlipidemia, diet-controlled type 2 diabetes mellitus, gastroesophageal reflux disease, osteoarthritis leading to chronic knee and hand pain, and a history of mildly low testosterone levels. His medications included hydrocodone and acetaminophen, metoprolol tartrate, omeprazole, topical testosterone gel (prescribed for daily use, used intermittently), and aspirin. He was retired and lived in rural Michigan with his female partner. He previously worked as a truck driver and used to train racehorses. He had quit smoking five years earlier. He denied alcohol or injection drug use.
The patient has significant underlying medical conditions. Considering infectious causes of his symptoms, it is notable that he has no reported immunodeficiency. It would be relevant to know if he has been tested for HIV. His rural residence and work with horses raise the possibility of zoonotic infections, including plague (Yersinia pestis), brucellosis (Brucella species), Q fever (Coxiella burnetti), Rhodococcus equi, or group C or G Streptococci. Information about tuberculosis risk factors, other geographic exposures, recent dental work, and ill contacts might be helpful to elucidate the causes of this nonspecific febrile illness with a possible CNS component. With regard to malignancy, it would be helpful to ask about recent weight loss, lymphadenopathy, and prior cancer screenings. Considering other etiologies, he does not report a history of autoimmune or endocrine conditions. However, it is important to consider a vasculitis, such as giant cell arteritis or polyarteritis nodosa, autoimmune conditions, and endocrinopathies such as thyrotoxicosis. The differential diagnosis for his clinical syndrome remains broad.
Vital signs were temperature 37.3°C, heart rate 88 beats per minute, respiratory rate 18 breaths per minute, blood pressure 105/64 mmHg, and oxygen saturation 93% on room air. Oral examination revealed poor dentition. The heart had a normal rate and regular rhythm with no murmurs, rubs, or gallops, and lungs were clear to auscultation bilaterally. The abdomen was unremarkable. Examination of the back was notable for mild tenderness to palpation over the sacrum. He was oriented to person, place, and time, with intact cranial nerves and a nonfocal neurologic examination. The remainder of his examination was normal. The white blood cell (WBC) count was 11.1 × 10³/μL, with 84% neutrophils and 9% bands, hemoglobin 13.6 g/dL, platelet count 54 × 103/μL, sodium 122 mmol/L, potassium 3.3 mmol/L, chloride 89 mmol/L, bicarbonate 21 mmol/L, creatinine 1.64 mg/dL, albumin 2.7 g/dL, alkaline phosphatase 136 U/L, AST 60 U/L, ALT 37 U/L, and total bilirubin 2.1 mg/dL.
He had presented to the emergency department five days earlier with fever, flank pain, nausea, vomiting, and weakness. At that time, he had a temperature of 38.2°C, but vital signs otherwise had been normal. Laboratory studies had revealed WBC count 14.0 × 10³/μL, hemoglobin 13.7 g/dL, platelet count 175 × 103/μL, sodium 129 mmol/L, chloride 97 mmol/dL, bicarbonate 23 mmol/L, creatinine 1.1 mg/dL, and total bilirubin 1.6 mg/dL. Urinalysis had been negative. He had received one liter of intravenous normal saline and ketorolac for pain and had been discharged with the diagnosis of a viral illness.
A picture of a progressive, subacute illness with multisystem involvement appears to be emerging, and there are several abnormalities consistent with infection, including fever, leukocytosis with bandemia, thrombocytopenia, renal dysfunction, and elevated bilirubin. His borderline hypotension may be due to uninterrupted use of his antihypertensive medication in the setting of poor oral intake or may indicate incipient sepsis. Focal sacral tenderness raises the possibility of vertebral osteomyelitis or epidural abscess, either from a contiguous focus of infection from the surrounding structures, or as a site of seeding from bacteremia. His prior confusion episodes might have been secondary to a systemic process; however, CNS imaging should be done, given the history of confusion and recent fall. Further diagnostic studies are warranted, including: blood cultures; peripheral blood smear; imaging of the spine, chest, abdomen, and pelvis; electrocardiogram; and possibly echocardiogram. Although noninfectious etiologies should not be discounted, the constellation of findings is more compatible with infection.
Two sets of blood cultures and a viral respiratory swab were obtained. Computed tomography (CT) of the head without contrast was negative for acute bleeding or other intracranial pathology. Lumbosacral radiography revealed degenerative changes with intact alignment of the sacrum. The patient was admitted with plans to pursue lumbar puncture if altered mental status recurred. The viral swab was negative. Within 24 hours, one set of blood cultures (both bottles) grew lactose-negative, oxidase-negative, gram-negative rods.
Gram-negative rods (GNRs) rarely are contaminants in blood cultures and should be considered significant until proven otherwise. Prompt empiric therapy and investigation to identify the primary source of bacteremia must be initiated. Although the most common GNRs isolated from blood cultures are enteric coliform organisms such as E. coli, Klebsiella, and Enterobacter, these typically are lactose-positive. Additional possibilities should be considered, including Salmonella species or other organisms comprising the “HACEK” group. This latter group is commonly associated with endocarditis, but the majority are oxidase-positive and have more fastidious growth requirements. Although there are other gram-negative organisms to consider, they have other distinguishing characteristics that have not been indicated in the microbiology results. Broad-spectrum antibiotic therapy is appropriate while awaiting the final identification of the GNR. A thorough search for a primary source and secondary sites of hematogenous seeding should be conducted. His only localizing symptom was tenderness over the sacrum, and this should be further assessed by sensitive imaging such as magnetic resonance imaging (MRI). The identity of the GNR would guide further diagnostic evaluation. For example, a respiratory organism such as Haemophilus influenzae would prompt a CT scan of the chest. Isolation of an enteric or a coliform GNR such as E. coli would prompt abdominal and pelvic imaging to assess for occult abscess. An “HACEK” group organism would prompt echocardiography to evaluate for endocarditis.
He was started on piperacillin–tazobactam. GNR bacteremia without a clear source prompted a CT of the chest, abdomen, and pelvis with and without contrast. The images were unremarkable, with the exception of a signal abnormality in the left psoas muscle concerning for abscess (Figure 1). MRI of the same region revealed L2-4 osteomyelitis and discitis with bilateral psoas abscesses but without epidural abscess (Figure 2).
Because of increasing reports of antibiotic resistance in GNRs, even in community-acquired infections, it is appropriate to initially treat with a broad-spectrum antibiotic such as a fourth-generation cephalosporin or carbapenem while awaiting identification and susceptibility results to guide definitive therapy. In addition to antimicrobial therapy, treatment of psoas abscess usually requires drainage. Vertebral osteomyelitis from a hematogenous source can often be treated with antibiotics alone, as long as there are no associated complications such as epidural abscess and spine instability. Imaging should be reviewed for pathology of the surrounding structures, and surgical consultation should be obtained.
Neurosurgery, Interventional Radiology, and Infectious Disease services were consulted. Antibiotic coverage was expanded to vancomycin, cefepime, and metronidazole due to the possibility of polymicrobial infection. No surgical intervention was recommended since the abscesses were too small to drain.
The next day, the GNR was identified as Serratia marcescens.
S. marcescens is a widely distributed organism in the environment, but not a common component of endogenous human flora. Serratia is generally considered as an opportunistic nosocomial pathogen. Community-acquired infection with this organism is unusual and implies exogenous acquisition. A careful re-evaluation of exposures, including injection drug use or other parenteral exposures is important to identify the likely source of infection, as these have been previously linked to outbreaks of environmental organisms. Based on the presumed pathogenesis of infection and the initial microbiology suggesting monomicrobial Serratia infection, antibiotics should be narrowed based on the susceptibility results. There is concern that antibiotics might not adequately penetrate the abscesses and result in a lack of clinical improvement and/or lead to the emergence of antibiotic resistance during therapy. This is an important concern with Serratia, which typically harbors an AmpC beta-lactamase that can mediate resistance to broad-spectrum cephalosporins. If medical therapy alone without drainage is planned, short-interval re-imaging is warranted.
Blood cultures from days two and three of hospitalization also grew S. marcescens. No other organisms grew. Based on culture sensitivity data, antibiotics were narrowed to ceftriaxone.
This surprising culture result prompted the medical team to obtain screening laboratory tests for immunocompromising conditions and to revisit the patient’s history. His type 2 diabetes mellitus was well controlled with a hemoglobin A1c of 6.5%. HIV testing was negative. Further questioning of the patient revealed that he had fallen from a truck onto rocks four months prior, injuring his back and hip, but without puncture of the skin or loss of consciousness; he denied recent falls or other injuries but reported significant chronic knee pain. He had not been hospitalized recently. He had never taken corticosteroids or immunomodulatory medications. He continued to deny injection drug use. He did, however, clarify that his work with racehorses, which was originally understood to be a prior hobby, was ongoing, including recent work of cleaning the stables.
The following morning, he experienced confusion, rigors, and hypoxia, which prompted transfer to the intensive care unit (ICU).
Acute worsening during treatment is worrisome, and could be a potential complication of his infection or treatment – or even a separate process altogether. Knee pain in the setting of bacteremia raises the possibility of septic or crystal-induced arthritis and warrants imaging. Confusion and hypoxia might represent secondary sites of seeding from bacteremia (CNS infection and pneumonia, respectively) or manifestations of endocarditis, the latter being unusual for Serratia. An echocardiogram should be obtained. Other neurologic causes, including seizure, should also be considered. Further evaluation by chest imaging and repeat neurologic examination and imaging should be performed. Emergence of resistance during therapy is a theoretical concern with Serratia as an AmpC beta-lactamase-containing organism. While awaiting additional microbiology data, an empiric change to an AmpC beta-lactamase stable antibiotic such as a carbapenem should be made, especially since he has clinically deteriorated on therapy with a β-lactamase susceptible antibiotic, raising concerns of the emergence of resistance on initial therapy.
Antibiotics were changed to meropenem, vancomycin, and metronidazole given the clinical worsening and concerns that this represented infection unresponsive to prior antibiotics. The acute episode resolved spontaneously after one hour. His neurologic examination remained nonfocal. Chest radiography, urinalysis, urine culture, and right upper quadrant ultrasound were unremarkable. Transesophageal echocardiogram revealed no heart valve vegetations. MRI and bone scan of the lower extremities did not show any evidence of septic arthritis or other infection. He remained stable and was transferred out of the ICU the following day. Antibiotic coverage was switched to cefepime. On discussion with his significant other, this event was found to be similar to the intermittent confusion that occurred in the days prior to admission.
The acute onset and other features of these intermittent periods of deterioration are compatible with infection; intermittent seeding of the blood with microbes or their products (eg, lipopolysaccharides) from an abscess or vascular infection could explain these episodes. Some of the previous hypotheses to explain the episodes, such as a secondary infectious process, have not been supported by diagnostic testing or the clinical course. He needs close clinical monitoring and interval assessment of the known sites of infection.
Ten days after osteomyelitis and discitis were diagnosed, the patient developed worsening low back pain, prompting repeat spine MRI. This was significant for bilateral psoas abscess enlargement and extension of osteomyelitis and discitis (Figure 3). He was re-evaluated by Neurosurgery and Interventional Radiology and underwent psoas abscess drainage; abscess cultures grew S. marcescens.
He slowly improved over several weeks and was discharged to a subacute rehabilitation facility. He completed a 3.5-week course of intravenous antibiotics before leaving against medical advice. He completed eight weeks of oral trimethoprim-sulfamethoxazole and remains without long-term sequelae from the infection.
DISCUSSION
S. marcescens is a gram-negative rod in the Enterobacteriaceae family known for its red pigment. Primarily, S. marcescens causes nosocomial infections, most commonly of the respiratory and urinary tracts. However, a wide range of manifestations has been documented, including meningitis, ocular infections (conjunctivitis, keratitis, endophthalmitis), endocarditis, skin infections (cellulitis, necrotizing fasciitis), and osteomyelitis.1, 2 S. marcescens is often reported as the cause of outbreaks in ICUs;3-6 infection is thought to occur via contamination of water pipes, hospital equipment, and disinfectants.3, 7 Its natural environment includes soil, water, and GI tracts of animals,4 and there are published reports of S. marcescens infection in horses.8, 9 This patient was most likely exposed to S. marcescens through his work with horses and their environment.
S. marcescens has wide-ranging target organs, and successful treatment can be difficult. S. marcescens can infect the renal, respiratory, gastrointestinal, ocular, cardiovascular, and musculoskeletal systems. S. marcescens, like other “SPACE” organisms (Serratia, Pseudomonas, Acinetobacter, Citrobacter, Enterobacter), expresses inducible AmpC beta-lactamase.10 At baseline, AmpC beta-lactamase expression is repressed.11 Mutants with stably de-repressed (constitutively expressed) AmpC can be selected during therapy and lead to clinical failure, as has been best described during therapy for Enterobacter infections.12 Infectious Disease consultation may be helpful when caring for patients with S. marcescens bacteremia given these complexities.
This was an unusual case of S. marcescens infection. It most commonly infects immunocompromised hosts. Reported risk factors include solid organ or hematopoietic stem cell transplant, malignancy, HIV/AIDS, and receipt of immunosuppressive agents. The patient did not have these risk factors, but did have well-controlled type 2 diabetes mellitus. Although diabetes is associated with an increased risk of infection and more severe infections,13, 14 there is no evidence in the literature that well-controlled type 2 diabetes mellitus compromises the immune system. A few case reports document cutaneous S. marcescens infection in immunocompetent adults.15,16 A case report of S. marcescens septic arthritis and adjacent osteomyelitis has also been published, but the patient had poorly controlled diabetes.17 This case provides a report of systemic S. marcescens infection in an individual without clear risk factors.
S. marcescens osteomyelitis is rare, and there have been only a few prior case reports.2,18 The presentation of osteomyelitis, regardless of the causative organism, is subtle, often insidious, and can easily be missed. Hospitalists should have a high index of suspicion for the diagnosis as it requires prompt evaluation and treatment for complications, including epidural abscess. Risk factors include diabetes mellitus, rheumatoid arthritis, injection drug use, and other immunocompromising illnesses.19 Degenerative changes in the spine such as osteoarthritis may be risk factors as well,20 though not well studied or quantified. A hypothesized mechanism involves local inflammation and joint damage, leaving the area susceptible to bacterial seeding. Osteoarthritis and degenerative disc disease, along with exposure to racehorses, likely put this patient at risk for bacterial seeding in the vertebrae, ultimately leading to a “dark horse” diagnosis.
TEACHING POINTS
- Serratia marcescens is a gram-negative rod bacterium that most commonly infects immunocompromised individuals in hospital settings. This report demonstrates that S. marcescens can cause serious infection in immunocompetent, nonhospitalized adults.
- S. marcescens bacteremia or infection of organs outside of the urinary or respiratory systems is uncommon, and therapy can be complicated by emergence of resistance.
- The clinical presentation of vertebral osteomyelitis and discitis and psoas abscess can be subtle and may present without typical signs and symptoms of infection.
ACKNOWLEDGEMENTS
The authors thank the patient and his partner for their willingness to have his story published, Laura Petersen, MHSA, for providing assistance with references and manuscript editing, and Shadi Azar, MBBS, for assistance in selecting the cross-sectional images.
Disclosures
The authors have no conflicts of interest to disclose.
1. Hejazi A, Falkiner FR. Serratia marcescens. J Med Microbiol. 1997;46(11):903-912. doi: 10.1099/00222615-46-11-903. PubMed
2. Lau JX, Li JY, Yong TY. Non-contiguous multifocal vertebral osteomyelitis caused by erratia marcescens. Mod Rheumatol. 2015;25(2):303-306. doi: 10.3109/14397595.2013.874754. PubMed
3. Dessi A, Puddu M, Testa M, Marcialis MA, Pintus MC, Fanos V. Serratia marcescens infections and outbreaks in neonatal intensive care units. J Chemother. 2009;21(5):493-499. doi: 10.1179/joc.2009.21.5.493. PubMed
4. Mahlen SD. Serratia infections: from military experiments to current practice. Clin Microbiol Rev. 2011;24(4):755-791. doi: 10.1128/CMR.00017-11. PubMed
5. Montagnani C, Cocchi P, Lega L, et al. Serratia marcescens outbreak in a neonatal intensive care unit: crucial role of implementing hand hygiene among external consultants. BMC Infect Dis. 2015;15:11. doi: 10.1186/s12879-014-0734-6. PubMed
6. van Ogtrop ML, van Zoeren-Grobben D, Verbakel-Salomons EM, van Boven CP. Serratia marcescens infections in neonatal departments: description of an outbreak and review of the literature. J Hosp Infect. 1997;36(2):95-103. doi: 10.1016/S0195-6701(97)90115-8. PubMed
7. Weber DJ, Rutala WA, Sickbert-Bennett EE. Outbreaks associated with contaminated antiseptics and disinfectants. Antimicrob Agents Chemother. 2007;51(12):4217-4224. doi: 10.1128/AAC.00138-07. PubMed
8. Ewart S, Brown C, Derksen F, Kufuor-Mensa E. Serratia marcescens endocarditis in a horse. J Am Vet Med Assoc. 1992;200(7):961-963. PubMed
9. Jores J, Beutner G, Hirth-Schmidt I, Borchers K, Pitt TL, Lubke-Becker A. Isolation of Serratia marcescens from an equine abortion in Germany. Vet Rec. 2004;154(8):242-244. doi: 10.1136/vr.154.8.242. PubMed
10. Herra C, Falkiner FR. Serratia marcescens. http://www.antimicrobe.org/b26.asp. Accessed August 22, 2017.
11. Jacoby GA. AmpC beta-lactamases. Clin Microbiol Rev. 2009;22(1):161-182, Table of Contents. doi: 10.1128/CMR.00036-08. PubMed
12. Chow JW, Fine MJ, Shlaes DM, et al. Enterobacter bacteremia: clinical features and emergence of antibiotic resistance during therapy. Ann Intern Med. 1991;115(8):585-590. doi: 10.7326/0003-4819-115-8-585. PubMed
13. Goeijenbier M, van Sloten TT, Slobbe L, et al. Benefits of flu vaccination for persons with diabetes mellitus: A review. Vaccine. 2017;35(38):5095-5101. doi: 10.1016/j.vaccine.2017.07.095. PubMed
14. Gupta S, Koirala J, Khardori R, Khardori N. Infections in diabetes mellitus and hyperglycemia. Infect Dis Clin North Am. 2007;21(3):617-638, vii. doi: 10.1016/j.idc.2007.07.003. PubMed
15. Carlesimo M, Pennica A, Muscianese M, et al. Multiple skin ulcers due to Serratia marcescens in a immunocompetent patient. G Ital Dermatol Venereol. 2014;149(3):367-370. PubMed
16. Rallis E, Karanikola E, Papadakis P. Severe facial infection caused by Serratia marcescens in an immunocompetent soldier. J Am Acad Dermatol. 2008;58(5 Suppl 1):S109-S110. doi: 10.1016/j.jaad.2007.04.010. PubMed
17. Hadid H, Usman M, Thapa S. Severe osteomyelitis and septic arthritis due to Serratia marcescens in an immunocompetent patient. Case Rep Infect Dis. 2015;2015:347652. doi: 10.1155/2015/347652. PubMed
18. Berbari EF, Kanj SS, Kowalski TJ, et al. 2015 Infectious Diseases Society of America (IDSA) Clinical Practice Guidelines for the Diagnosis and Treatment of Native Vertebral Osteomyelitis in Adults. Clin Infect Dis. 2015;61(6):e26-e46. doi: 10.1093/cid/civ482. PubMed
19. Vertebral Osteomyelitis Guideline Team (Team Leader: Chenoweth CE; Team Members: Bassin BS HS, Mack MR, Kunapuli A, Park P, Quint DJ, Seagull FJ, Wesorick DH; Consultants: Patel RD, Riddell IV J, Lanava KM). Vertebral Osteomyelitis, Discitis, and Spinal Epidural Abscess in Adults. University of Michigan Guidelines for Clinical Care 2013; http://www.med.umich.edu/1info/FHP/practiceguides/vertebral/VO.pdf. Accessed October 26, 2017.
20. McDonald M. Vertebral osteomyelitis and discitis in adults. 2017; Available at: https://www.uptodate.com/contents/vertebral-osteomyelitis-and-discitis-in-adults. Accessed October 26, 2017.
© 2018 Society of Hospital Medicine
Routine Chest Radiographs after Uncomplicated Thoracentesis
The “Things We Do for No Reason” series reviews practices which have become common parts of hospital care, but which may provide little value to our patients. Practices reviewed in the TWDFNR series do not represent “black and white” conclusions or clinical practice standards, but are meant as a starting place for research and active discussions among hospitalists and patients. We invite you to be part of that discussion. https://www.choosingwisely.org/

Bedside thoracentesis can cause serious complications, such as pneumothorax, re-expansion pulmonary edema, or hemorrhage. These rare complications have led many hospitalists to routinely order chest radiographs (CXRs) following thoracentesis. However, post-thoracentesis CXRs are usually not indicated and can lead to unnecessary radiation exposure and expense. Rather than obtaining routine CXRs, hospitalists should use postprocedural signs and symptoms to identify the occasional patients who require imaging. A risk-stratified approach is a safe and cost-effective way to avoid unnecessary radiographs.
CASE REPORT
A 52-year-old man with decompensated liver disease and hepatic hydrothorax is hospitalized for increasing dyspnea caused by a recurrent pleural effusion. Diuretics do not improve his dyspnea, and his hospitalist recommends a therapeutic thoracentesis for symptom relief. The patient does not have any significant procedural risk factors: He does not have preexisting pulmonary or pleural disease, his platelet count is 105,000 × 103/µl, and his international normalized ratio is 1.3. Bedside sonography demonstrates a large, free-flowing, right-sided pleural effusion. The hospitalist performs an uncomplicated ultrasound-guided removal of 1.5 L of straw-colored fluid with a catheter-over-needle kit. The patient does not have any pain or increased shortness of breath during or after the procedure. The hospitalist reflexively orders a routine chest radiograph to assess for pneumothorax.
Why You Might Think a Chest Radiograph is Helpful after Thoracentesis
Pleural effusions are newly diagnosed in more than 1.5 million Americans annually,1 and hospitalists frequently care for patients requiring thoracentesis. Internal medicine residents traditionally learn to perform this procedure during residency, and thoracentesis remains a common task for both residents and hospitalists.2 Patients typically tolerate thoracentesis well, but they can develop serious complications such as pneumothorax, re-expansion pulmonary edema, or hemothorax. Before the advent of bedside ultrasound, these complications occurred relatively commonly; a 2010 systematic review, for example, found that the rate of pneumothorax from thoracentesis performed without ultrasound was 9.3%.3 Other studies have identified even higher rates of complications, including two case series in which investigators found a 14% rate of major complications4 and a pneumothorax rate of nearly 30%.5 Postprocedure radiographs became common practice because of the high rate of complications, and this practice has persisted for many practitioners despite the substantial safety improvements introduced by bedside ultrasonography.6
Hospitalists might think routine CXRs are helpful after ultrasound-guided thoracentesis for additional reasons. First, modern guidelines reflecting the low risk of complications after ultrasound-guided procedures have not been released by United States pulmonary medicine societies, and some clinicians may continue to follow practices acquired during the era of unguided thoracentesis. Second, performing postprocedure imaging has become ingrained as a standard part of some institutional procedure checklists6 and some prominent textbooks continue to recommend the practice.7 For some hospitalists, this testing reflex may be reinforced by other common procedures, such as placing a nasogastric tube or a central venous catheter, for which a postprocedure CXR is standard practice. Thus, ordering postprocedure imaging can become internalized as the safe, checklist-based final step of a procedure. Third, hospitalists may order a postprocedure CXR for reasons other than detecting procedural complications. The pleural effusion might be thought to obscure a parenchymal or endobronchial lesion for which a postprocedure CXR may reveal an important finding. Finally, a CXR also may also satisfy the clinician’s curiosity regarding the completeness of drainage.
Why a Routine Postprocedure Chest Radiograph is Not Helpful after Thoracentesis
A routine post-thoracentesis CXR is not necessary for three reasons. First, the use of ultrasound marking or guidance has substantially improved site selection and reduced the rate of complications for experienced operators. For example, a 2010 systematic review found an overall rate of pneumothorax of 4% for ultrasound-guided procedures performed between 1986 and 2006,3 whereas more recently published data suggest the current rate of pneumothorax is closer to 1% when ultrasound marking or guidance is used.8,9 One study of 462 consecutive patients with malignant pleural effusions, for example, showed that the rate of pneumothorax with ultrasound-guided needle-over-catheter thoracentesis was 0.97% (3/310 patients), compared with a rate of 8.89% (12/135 patients) when the procedure was performed without ultrasound.9 Another prospective, randomized study of 160 patients with various causes of pleural effusion showed that the rate of pneumothorax with ultrasound-marked thoracentesis was 1.25% (1/80 patients), compared with 12.5% (10/80 patients) for procedures performed without ultrasound.8 Hospitalists who competently use ultrasound guidance should act on modern estimates of complications and may also choose to incorporate postprocedure ultrasound into their practice. Indeed, the Society of Hospital Medicine recommends against routine chest radiography in asymptomatic patients when sliding lung is visualized on postprocedure ultrasound.10
Second, procedural factors and postprocedural symptoms (new chest pain, dyspnea, or persistent cough) reliably identify patients with high risk of clinically meaningful complications. On one hand, only 1% to 2% of asymptomatic patients have a postprocedure pneumothorax, and clinical monitoring does not lead to chest tube placement in almost all of these cases.11 On the other hand, 67% to 72% of symptomatic patients are found to have complications.12 Doyle et al13 showed that the use of symptoms and procedure-specific factors (such as the aspiration of air, difficult procedure, multiple needle passes, or high operator suspicion of pneumothorax) could obviate the need for routine CXRs in approximately 60% of their procedures without any serious consequences.
Third, postprocedural CXRs very rarely reveal new or unexpected findings. For example, in one series,12 only 3.8% of postdrainage radiographs uncovered new findings, none of which clarified the underlying diagnosis or changed management. To assess the utility of an initial thoracentesis and decide about repeat procedures, begin by asking the patient about symptoms and perform a physical exam.
Why PostProcedural CHEST RADIOGRAPHS Might be Helpful in Certain Circumstances
CXRs might be helpful in certain scenarios, even when a complication is not suspected. For example, a postprocedure CXR to detect nonexpandable lung or evaluate the rate of recurrence may guide definitive management of patients with recurrent or malignant pleural effusion. Determining completeness of drainage may also assist with planning for palliative measures such as pleurodesis or indwelling pleural catheter placement. A postprocedure CXR is also helpful in patients with a technically difficult procedure or in those with symptoms during or immediately after the procedure. This recommendation is consistent with the 2010 British Thoracic Society guidelines, which recommend CXRs for procedures where air was withdrawn, the procedure was difficult, multiple needle passes were required, or the patient became symptomatic.14 The Society of Hospital Medicine’s recent Position Statement concurs with these guidelines and recommends against routine chest radiography in asymptomatic patients when sliding lung is visualized by postprocedure ultrasound.10
What You Should Do Instead
Hospitalists should not rountinely obtain post-thoracentesis CXRs in asymptomatic patients. Clinical monitoring with subsequent symptom-guided evaluation lowers costs, avoids unnecessary radiation exposure, and has been shown to be successful in a large case series of more than 9,300 patients.15 Some coughing should be expected with all large-volume thoracenteses as a normal response to re-expansion of atelectatic lung. The coughing should not persist past the immediate postprocedure period. If symptoms arise or if a complication is expected, the test of choice is either CXR or, if the hospitalist is a competent sonographer, bedside sonography. Bedside sonography is a low-cost, noninvasive method and has been well studied in the diagnosis of post-thoracentesis pneumothorax.16 CXRs may still be needed to confirm findings by sonography, to investigate postprocedural symptoms in those with pleural adhesions or other lung/pleural diseases (because ultrasonography is less reliable in these patients), or if reexpansion pulmonary edema or other complications are suspected. A robust quality improvement strategy to reduce unnecessary post-thoracentesis CXRs could result in cost savings and spare patients from radiation exposure, because a recent study of almost 1,000 thoracenteses performed at an academic medical center demonstrated that internal medicine residents, pulmonologists, and interventional radiologists order a CXR following 95% of thoracenteses.17 For a hypothetical hospital that orders 100 unnecessary post-thoracentesis CXRs annually, hospitalists could avoid approximately $7,000 in wasted expense per year.18
RECOMMENDATIONS:
- Do not routinely order post-thoracentesis CXRs.
- Order a post-thoracentesis CXR if (1) the patient had new chest pain, dyspnea, or persistent cough during or after the procedure; (2) procedural features suggest increased risk of a complication (multiple needle passes, aspiration of air, difficulty obtaining fluid); or (3) a definitive palliative procedure will be arranged based on lung expansion.
- If qualified, use bedside sonography as a first step in the diagnosis of pneumothorax, reserving CXRs for those patients in whom accurate sonography is not possible, an alternative diagnosis is suspected, or when sonography findings are equivocal.
CONCLUSION
Following the uncomplicated thoracentesis, the hospitalist reconsidered the initial decision to order a CXR and rapidly assessed the patient’s risk of complications. Because the procedure required only one needle pass, air was not aspirated, and the patient did not experience prolonged coughing or pain, the CXR order was canceled. The patient recovered uneventfully and was spared the cost and radiation associated with the proposed CXR.
Do you think this is a low-value practice? Is this truly a “Thing We Do for No Reason?” Share what you do in your practice and join in the conversation online by retweeting it on Twitter (#TWDFNR) and liking it on Facebook. We invite you to propose ideas for other “Things We Do for No Reason” topics by emailing TWDFNR@hospitalmedicine.org.cknowledgments
Acknowledgements
The authors would like to thank Patricia Kritek and Somnath Mookherjee for their comments on an early version of this manuscript.
Disclosures
The au
1. Light RW. Pleural effusions. Med Clin North Am. 2011;95:1055-1070. doi: 10.1016/j.mcna.2011.08.005. PubMed
2. ABIM Policies and Procedures for Certification. http://www.abim.org/~/media/ABIM Public/Files/pdf/publications/certification-guides/policies-and-procedures.pdf. Accessed 10th February 2018.
3. Gordon CE, Feller-Kopman D, Balk EM, Smetana GW. Pneumothorax following thoracentesis: a systematic review and meta-analysis. Arch Intern Med. 2010;170:332-339. doi: 10.1001/archinternmed.2009.548. PubMed
4. Seneff MG, Corwin RW, Gold LH, Irwin RS. Complications associated with thoracocentesis. Chest. 1986;90:97-100. doi: 10.1378/chest.90.1.97 PubMed
5. Grogan DR, Irwin RS, Channick R, Raptopoulos V, Curley FJ, Bartter T. Complications associated with thoracentesis a prospective, randomized study comparing three different methods. Arch Intern Med. 1990;150:873-877. doi: 10.1001/archinte.150.4.873 PubMed
6. Berg D, Berg K, Riesenberg LA, et al. The development of a validated checklist for thoracentesis preliminary results. Am J Med Qual. 2013;28:220-226. doi: 10.1177/1062860612459881. PubMed
7. Morris CA, Wolf A. Video 482e-1 clinical procedure tutorial: thoracentesis. Harrison’s Principles of Internal Medicine, 19th edition. http://accessmedicine.mhmedical.com/MultimediaPlayer.aspx?MultimediaID=12986897. Accessed 28th September 2017.
8. Perazzo A, Gatto P, Barlascini C, Ferrari-Bravo M, Nicolini A. Can ultrasound guidance reduce the risk of pneumothorax following thoracentesis?* , ** A ultrassonografia pode reduzir o risco de pneumotórax após toracocentese? J Bras Pneumol. 2013;40:6-12. doi: 10.1590/S1806-37132014000100002 PubMed
9. Cavanna L, Mordenti P, Bertè R, et al. Ultrasound guidance reduces pneumothorax rate and improves safety of thoracentesis in malignant pleural effusion: report on 445 consecutive patients with advanced cancer. World J Surg Oncol. 2014;12:139. doi: 10.1186/1477-7819-12-139. PubMed
10. Dancel R, Schnobrich D, Puri N, et al. Recommendations on the use of ultrasound guidance for adult thoracentesis: a position statement of the Society of Hospital Medicine. J Hosp Med. 2018;13:126-135. doi: 10.12788/jhm.2940. PubMed
11. Alemán C, Alegre J, Armadans L, et al. The value of chest roentgenography in the diagnosis of pneumothorax after thoracentesis. Am J Med. 1999;107:340-343. doi: 10.1016/S0002-9343(99)00238-7 PubMed
12. Petersen WG, Zimmerman R. Limited utility of chest radiograph after thoracentesis. Chest. 2000;117:1038-1042. doi: 10.1378/chest.117.4.1038 PubMed
13. Doyle JJ, Hnatiuk OW, Torrington KG, Slade AR, Howard RS. Necessity of routine chest roentgenography after thoracentesis. Ann Intern Med. 1996;124: 816-820. doi: 10.7326/0003-4819-124-9-199605010-00005 PubMed
14. BTS- British Thoracic Society. BTS Pleural Disease Guideline 2010. Thorax 2010;65:1-76. doi: 10.1136/thx.2010.137026.
15. Ault MJ, Rosen BT, Scher J, Feinglass J, Barsuk JH. Thoracentesis outcomes: a 12-year experience. Thorax 2015;70:127-132. 10.1136/thoraxjnl-2014-206114. PubMed
16. Shostak E, Brylka D, Krepp J, Pua B, Sanders A. Bedside ultrasonography in detection of post procedure pneumothorax. J Ultrasound Med. 2013;32:1003-1009. doi: 10.7863/ultra.32.6.1003 PubMed
17. Barsuk JH, Cohen ER, Williams MV, et al. Simulation-based mastery learning for thoracentesis skills improves patient outcomes. Acad Med. 2017; doi: 10.1097/ACM.0000000000001965 PubMed
18. Healthcare Bluebook. https://www.healthcarebluebook.com/page_ProcedureDetails.aspx?cftId=137&g=Chest+X-Ray. Accessed 10th February 2018.
The “Things We Do for No Reason” series reviews practices which have become common parts of hospital care, but which may provide little value to our patients. Practices reviewed in the TWDFNR series do not represent “black and white” conclusions or clinical practice standards, but are meant as a starting place for research and active discussions among hospitalists and patients. We invite you to be part of that discussion. https://www.choosingwisely.org/
Bedside thoracentesis can cause serious complications, such as pneumothorax, re-expansion pulmonary edema, or hemorrhage. These rare complications have led many hospitalists to routinely order chest radiographs (CXRs) following thoracentesis. However, post-thoracentesis CXRs are usually not indicated and can lead to unnecessary radiation exposure and expense. Rather than obtaining routine CXRs, hospitalists should use postprocedural signs and symptoms to identify the occasional patients who require imaging. A risk-stratified approach is a safe and cost-effective way to avoid unnecessary radiographs.
CASE REPORT
A 52-year-old man with decompensated liver disease and hepatic hydrothorax is hospitalized for increasing dyspnea caused by a recurrent pleural effusion. Diuretics do not improve his dyspnea, and his hospitalist recommends a therapeutic thoracentesis for symptom relief. The patient does not have any significant procedural risk factors: He does not have preexisting pulmonary or pleural disease, his platelet count is 105,000 × 103/µl, and his international normalized ratio is 1.3. Bedside sonography demonstrates a large, free-flowing, right-sided pleural effusion. The hospitalist performs an uncomplicated ultrasound-guided removal of 1.5 L of straw-colored fluid with a catheter-over-needle kit. The patient does not have any pain or increased shortness of breath during or after the procedure. The hospitalist reflexively orders a routine chest radiograph to assess for pneumothorax.
Why You Might Think a Chest Radiograph is Helpful after Thoracentesis
Pleural effusions are newly diagnosed in more than 1.5 million Americans annually,1 and hospitalists frequently care for patients requiring thoracentesis. Internal medicine residents traditionally learn to perform this procedure during residency, and thoracentesis remains a common task for both residents and hospitalists.2 Patients typically tolerate thoracentesis well, but they can develop serious complications such as pneumothorax, re-expansion pulmonary edema, or hemothorax. Before the advent of bedside ultrasound, these complications occurred relatively commonly; a 2010 systematic review, for example, found that the rate of pneumothorax from thoracentesis performed without ultrasound was 9.3%.3 Other studies have identified even higher rates of complications, including two case series in which investigators found a 14% rate of major complications4 and a pneumothorax rate of nearly 30%.5 Postprocedure radiographs became common practice because of the high rate of complications, and this practice has persisted for many practitioners despite the substantial safety improvements introduced by bedside ultrasonography.6
Hospitalists might think routine CXRs are helpful after ultrasound-guided thoracentesis for additional reasons. First, modern guidelines reflecting the low risk of complications after ultrasound-guided procedures have not been released by United States pulmonary medicine societies, and some clinicians may continue to follow practices acquired during the era of unguided thoracentesis. Second, performing postprocedure imaging has become ingrained as a standard part of some institutional procedure checklists6 and some prominent textbooks continue to recommend the practice.7 For some hospitalists, this testing reflex may be reinforced by other common procedures, such as placing a nasogastric tube or a central venous catheter, for which a postprocedure CXR is standard practice. Thus, ordering postprocedure imaging can become internalized as the safe, checklist-based final step of a procedure. Third, hospitalists may order a postprocedure CXR for reasons other than detecting procedural complications. The pleural effusion might be thought to obscure a parenchymal or endobronchial lesion for which a postprocedure CXR may reveal an important finding. Finally, a CXR also may also satisfy the clinician’s curiosity regarding the completeness of drainage.
Why a Routine Postprocedure Chest Radiograph is Not Helpful after Thoracentesis
A routine post-thoracentesis CXR is not necessary for three reasons. First, the use of ultrasound marking or guidance has substantially improved site selection and reduced the rate of complications for experienced operators. For example, a 2010 systematic review found an overall rate of pneumothorax of 4% for ultrasound-guided procedures performed between 1986 and 2006,3 whereas more recently published data suggest the current rate of pneumothorax is closer to 1% when ultrasound marking or guidance is used.8,9 One study of 462 consecutive patients with malignant pleural effusions, for example, showed that the rate of pneumothorax with ultrasound-guided needle-over-catheter thoracentesis was 0.97% (3/310 patients), compared with a rate of 8.89% (12/135 patients) when the procedure was performed without ultrasound.9 Another prospective, randomized study of 160 patients with various causes of pleural effusion showed that the rate of pneumothorax with ultrasound-marked thoracentesis was 1.25% (1/80 patients), compared with 12.5% (10/80 patients) for procedures performed without ultrasound.8 Hospitalists who competently use ultrasound guidance should act on modern estimates of complications and may also choose to incorporate postprocedure ultrasound into their practice. Indeed, the Society of Hospital Medicine recommends against routine chest radiography in asymptomatic patients when sliding lung is visualized on postprocedure ultrasound.10
Second, procedural factors and postprocedural symptoms (new chest pain, dyspnea, or persistent cough) reliably identify patients with high risk of clinically meaningful complications. On one hand, only 1% to 2% of asymptomatic patients have a postprocedure pneumothorax, and clinical monitoring does not lead to chest tube placement in almost all of these cases.11 On the other hand, 67% to 72% of symptomatic patients are found to have complications.12 Doyle et al13 showed that the use of symptoms and procedure-specific factors (such as the aspiration of air, difficult procedure, multiple needle passes, or high operator suspicion of pneumothorax) could obviate the need for routine CXRs in approximately 60% of their procedures without any serious consequences.
Third, postprocedural CXRs very rarely reveal new or unexpected findings. For example, in one series,12 only 3.8% of postdrainage radiographs uncovered new findings, none of which clarified the underlying diagnosis or changed management. To assess the utility of an initial thoracentesis and decide about repeat procedures, begin by asking the patient about symptoms and perform a physical exam.
Why PostProcedural CHEST RADIOGRAPHS Might be Helpful in Certain Circumstances
CXRs might be helpful in certain scenarios, even when a complication is not suspected. For example, a postprocedure CXR to detect nonexpandable lung or evaluate the rate of recurrence may guide definitive management of patients with recurrent or malignant pleural effusion. Determining completeness of drainage may also assist with planning for palliative measures such as pleurodesis or indwelling pleural catheter placement. A postprocedure CXR is also helpful in patients with a technically difficult procedure or in those with symptoms during or immediately after the procedure. This recommendation is consistent with the 2010 British Thoracic Society guidelines, which recommend CXRs for procedures where air was withdrawn, the procedure was difficult, multiple needle passes were required, or the patient became symptomatic.14 The Society of Hospital Medicine’s recent Position Statement concurs with these guidelines and recommends against routine chest radiography in asymptomatic patients when sliding lung is visualized by postprocedure ultrasound.10
What You Should Do Instead
Hospitalists should not rountinely obtain post-thoracentesis CXRs in asymptomatic patients. Clinical monitoring with subsequent symptom-guided evaluation lowers costs, avoids unnecessary radiation exposure, and has been shown to be successful in a large case series of more than 9,300 patients.15 Some coughing should be expected with all large-volume thoracenteses as a normal response to re-expansion of atelectatic lung. The coughing should not persist past the immediate postprocedure period. If symptoms arise or if a complication is expected, the test of choice is either CXR or, if the hospitalist is a competent sonographer, bedside sonography. Bedside sonography is a low-cost, noninvasive method and has been well studied in the diagnosis of post-thoracentesis pneumothorax.16 CXRs may still be needed to confirm findings by sonography, to investigate postprocedural symptoms in those with pleural adhesions or other lung/pleural diseases (because ultrasonography is less reliable in these patients), or if reexpansion pulmonary edema or other complications are suspected. A robust quality improvement strategy to reduce unnecessary post-thoracentesis CXRs could result in cost savings and spare patients from radiation exposure, because a recent study of almost 1,000 thoracenteses performed at an academic medical center demonstrated that internal medicine residents, pulmonologists, and interventional radiologists order a CXR following 95% of thoracenteses.17 For a hypothetical hospital that orders 100 unnecessary post-thoracentesis CXRs annually, hospitalists could avoid approximately $7,000 in wasted expense per year.18
RECOMMENDATIONS:
- Do not routinely order post-thoracentesis CXRs.
- Order a post-thoracentesis CXR if (1) the patient had new chest pain, dyspnea, or persistent cough during or after the procedure; (2) procedural features suggest increased risk of a complication (multiple needle passes, aspiration of air, difficulty obtaining fluid); or (3) a definitive palliative procedure will be arranged based on lung expansion.
- If qualified, use bedside sonography as a first step in the diagnosis of pneumothorax, reserving CXRs for those patients in whom accurate sonography is not possible, an alternative diagnosis is suspected, or when sonography findings are equivocal.
CONCLUSION
Following the uncomplicated thoracentesis, the hospitalist reconsidered the initial decision to order a CXR and rapidly assessed the patient’s risk of complications. Because the procedure required only one needle pass, air was not aspirated, and the patient did not experience prolonged coughing or pain, the CXR order was canceled. The patient recovered uneventfully and was spared the cost and radiation associated with the proposed CXR.
Do you think this is a low-value practice? Is this truly a “Thing We Do for No Reason?” Share what you do in your practice and join in the conversation online by retweeting it on Twitter (#TWDFNR) and liking it on Facebook. We invite you to propose ideas for other “Things We Do for No Reason” topics by emailing TWDFNR@hospitalmedicine.org.cknowledgments
Acknowledgements
The authors would like to thank Patricia Kritek and Somnath Mookherjee for their comments on an early version of this manuscript.
Disclosures
The au
1. Light RW. Pleural effusions. Med Clin North Am. 2011;95:1055-1070. doi: 10.1016/j.mcna.2011.08.005. PubMed
2. ABIM Policies and Procedures for Certification. http://www.abim.org/~/media/ABIM Public/Files/pdf/publications/certification-guides/policies-and-procedures.pdf. Accessed 10th February 2018.
3. Gordon CE, Feller-Kopman D, Balk EM, Smetana GW. Pneumothorax following thoracentesis: a systematic review and meta-analysis. Arch Intern Med. 2010;170:332-339. doi: 10.1001/archinternmed.2009.548. PubMed
4. Seneff MG, Corwin RW, Gold LH, Irwin RS. Complications associated with thoracocentesis. Chest. 1986;90:97-100. doi: 10.1378/chest.90.1.97 PubMed
5. Grogan DR, Irwin RS, Channick R, Raptopoulos V, Curley FJ, Bartter T. Complications associated with thoracentesis a prospective, randomized study comparing three different methods. Arch Intern Med. 1990;150:873-877. doi: 10.1001/archinte.150.4.873 PubMed
6. Berg D, Berg K, Riesenberg LA, et al. The development of a validated checklist for thoracentesis preliminary results. Am J Med Qual. 2013;28:220-226. doi: 10.1177/1062860612459881. PubMed
7. Morris CA, Wolf A. Video 482e-1 clinical procedure tutorial: thoracentesis. Harrison’s Principles of Internal Medicine, 19th edition. http://accessmedicine.mhmedical.com/MultimediaPlayer.aspx?MultimediaID=12986897. Accessed 28th September 2017.
8. Perazzo A, Gatto P, Barlascini C, Ferrari-Bravo M, Nicolini A. Can ultrasound guidance reduce the risk of pneumothorax following thoracentesis?* , ** A ultrassonografia pode reduzir o risco de pneumotórax após toracocentese? J Bras Pneumol. 2013;40:6-12. doi: 10.1590/S1806-37132014000100002 PubMed
9. Cavanna L, Mordenti P, Bertè R, et al. Ultrasound guidance reduces pneumothorax rate and improves safety of thoracentesis in malignant pleural effusion: report on 445 consecutive patients with advanced cancer. World J Surg Oncol. 2014;12:139. doi: 10.1186/1477-7819-12-139. PubMed
10. Dancel R, Schnobrich D, Puri N, et al. Recommendations on the use of ultrasound guidance for adult thoracentesis: a position statement of the Society of Hospital Medicine. J Hosp Med. 2018;13:126-135. doi: 10.12788/jhm.2940. PubMed
11. Alemán C, Alegre J, Armadans L, et al. The value of chest roentgenography in the diagnosis of pneumothorax after thoracentesis. Am J Med. 1999;107:340-343. doi: 10.1016/S0002-9343(99)00238-7 PubMed
12. Petersen WG, Zimmerman R. Limited utility of chest radiograph after thoracentesis. Chest. 2000;117:1038-1042. doi: 10.1378/chest.117.4.1038 PubMed
13. Doyle JJ, Hnatiuk OW, Torrington KG, Slade AR, Howard RS. Necessity of routine chest roentgenography after thoracentesis. Ann Intern Med. 1996;124: 816-820. doi: 10.7326/0003-4819-124-9-199605010-00005 PubMed
14. BTS- British Thoracic Society. BTS Pleural Disease Guideline 2010. Thorax 2010;65:1-76. doi: 10.1136/thx.2010.137026.
15. Ault MJ, Rosen BT, Scher J, Feinglass J, Barsuk JH. Thoracentesis outcomes: a 12-year experience. Thorax 2015;70:127-132. 10.1136/thoraxjnl-2014-206114. PubMed
16. Shostak E, Brylka D, Krepp J, Pua B, Sanders A. Bedside ultrasonography in detection of post procedure pneumothorax. J Ultrasound Med. 2013;32:1003-1009. doi: 10.7863/ultra.32.6.1003 PubMed
17. Barsuk JH, Cohen ER, Williams MV, et al. Simulation-based mastery learning for thoracentesis skills improves patient outcomes. Acad Med. 2017; doi: 10.1097/ACM.0000000000001965 PubMed
18. Healthcare Bluebook. https://www.healthcarebluebook.com/page_ProcedureDetails.aspx?cftId=137&g=Chest+X-Ray. Accessed 10th February 2018.
© 2018 Society of Hospital Medicine