User login
5 Tips to Finding a Good Locum Tenens Company
Over the past five years, I have worked as a locum tenens hospitalist with more than 12 different locum tenens companies. I have learned a lot through this process. At one point, I even considered starting my own locum tenens company because of the frustrations I was feeling about the inefficiencies of many of these companies. I would like to help those of you either already practicing as a locum tenens physician or considering practicing through this process to make it as painless as possible.
Here are my tips to be aware of when choosing a locum tenens company to work with.
- Bigger isn’t necessarily better. There are a few companies that advertise a lot. I’m sure you are all very well aware of them. They send out many emails, call numerous times, and somehow have a banner on every website you visit. These companies tend to have large overhead costs. These costs mean that your hourly rate may be lower. Smaller companies are sometimes less efficient, but as long as you make sure your expectations are heard, they will often give you a rate that the bigger companies cannot afford.
- State your terms. As physicians, we are often not the most business savvy. Remember that locum tenens companies exist because there is a shortage of hospitalists in some areas. We need to be able to state certain terms; if you don’t like something, then make sure you add that into your contract. For example, patient safety should always come first; make sure you establish a cap for the number of patients you are willing to see per day.
- Be protective of your CV. Remember that locum tenens companies profit when you work, so they will want to hand out your CV to as many hospitals as possible. While they make it sound like it is in your best interest, it may not be. If a company presents you to a hospital, most of the time the contract you sign with them states that they “own” your presentation for two years. This means that if you do not like the locum tenens company or if another company is offering you more for the same hospital, you have to work with the company that presented you first. Make sure you have a written agreement between you and your locum tenens company with regard to presentations stating which hospitals the locum tenens company can present you to, with a follow-up response from the locum tenens company stating when they presented you.
- Your recruiter is your best advocate. Make sure you get along. Make sure you have very good communication with your recruiter, who is the one who will be doing all of your scheduling and negotiating. If you do not have a good relationship, move on to a new recruiter or to a new company.
- Have fun! Working as a locum tenens physician, in my opinion, is the best of everything combined. There are very few jobs where you can decide when you want to work, dictate your terms, and get paid well doing something you love. Locum tenens takes a little bit of getting used to; when you have it figured out, it is empowering and enjoyable. TH
Geeta Arora, MD, is board certified in internal medicine and integrative holistic medicine.
Medicare Patient Outcomes of Inpatient Laparoscopic Cholecystectomy Varies Among Hospitals
NEW YORK (Reuters Health) - Outcomes of inpatient laparoscopic cholecystectomy in Medicare patients vary widely among hospitals, and most adverse outcomes occur well after patients have been discharged, new findings show.
While the overall adverse outcome rate was 20.7%, risk-adjusted adverse outcomes ranged from 10% in the best-performing decile of hospitals to 32.1% for the worst-performing decile, Dr. Donald E. Fry of MPA Healthcare Solutions in Chicago and colleagues found.
"These differences indicate that a significant number of readmissions and overall adverse outcomes of care after laparoscopic cholecystectomy are potentially preventable," Dr. Fry and his team state in their report, online February 1 in the Annals of Surgery.
Risk-adjusted measurement of care has typically been limited to inpatient events and 30-day mortality rates, they note, but declines in mortality rates, shorter patient stays and a shift toward ambulatory procedures have made this measurement more difficult.
"Surgery for gallbladder disease has experienced one of the most dramatic transitions from extended inpatient care to outpatient or limited inpatient care," they write.
To compare outcomes among hospitals, Dr. Fry and his team looked at Medicare data for 2010-2012 including both inpatient and 90-day post-discharge adverse outcomes for inpatient laparoscopic cholecystectomy.
They created a developmental database including more than 73,000 patients to construct predictive models for adverse outcomes, and a database of more than 83,000 patients treated at 1,570 hospitals, each with 20 or more qualifying cases and 4.5 or more predicted total adverse outcomes, to compare performance.
A total of 509 patients (0.6%) died in the hospital, 5,761 (6.9%) had prolonged length of stay, 1,154 (1.4%) died within 90 days of discharge without being readmitted, and 12,038 (14.5%) were readmitted at least once in the 90 days after discharge.
Gastrointestinal, infectious and cardiovascular events were the most common readmission causes.
"Strategies for improvement begin with hospitals and surgeons knowing what the results of their care happen to be," Dr. Fry told Reuters Health by email. "Since many readmissions and Emergency Department visits of post-discharge surgical cases occur at hospitals other than the facility of the index
hospitalization, the actual results of care may not be appreciated by the providers."
He added: "Improvement strategies need to focus on the reasons patients were readmitted. Better pain management will reduce readmissions for constipation, abdominal distention, nausea and vomiting. Increased contact by clinicians with their patients after discharge can identify early evidence of
pulmonary problems or potential urinary tract infection. Earlier recognition of evolving issues can provide interventions that avoid readmissions. Better overall strategies to avoid cardiac events and hypovolemia that may play in central nervous system events and renal failure should be of benefit."
Dr. Fry and his colleagues are now investigating whether similar differences in outcomes occur with other types of surgical procedures, as well as the frequency of and reasons for post-discharge emergency room visits.
"A final message for surgeons in this research is that Medicare has begun an initiative into bundled payments," Dr. Fry said. "Surgeons and hospitals need to establish better trackingmethods for post-discharge patients so that they know the results of care and so that they can develop focused strategies for better outcomes. There will be a substantial financial penalty for those who cannot adapt to the new payment model that CMS is implementing."
Histone levels may predict thrombocytopenia

Image by Eric Smith
Measuring circulating histones may help physicians predict the onset of thrombocytopenia or allow them to monitor the condition in patients who are critically ill, according to researchers.
They noted that histones induce profound thrombocytopenia in mice and are associated with organ injury when released after extensive cell damage in patients who are critically ill.
So the team decided to examine the association between circulating histones and thrombocytopenia in patients in the intensive care unit (ICU).
Cheng-Hock Toh, MD, of the University of Liverpool in the UK, and his colleagues conducted this research and reported the results in a letter to JAMA.
The researchers analyzed 56 patients with thrombocytopenia and 56 controls with normal platelet counts who were admitted to the ICU at Royal Liverpool University Hospital between June 2013 and January 2014.
Thrombocytopenia was defined as a platelet count less than 150 × 103/µL, a 25% or greater decrease in platelet count, or both within the first 96 hours of ICU admission.
The researchers noted that, at approximately 30 µg/mL, histones bind platelets and cause platelet aggregation, which results in profound thrombocytopenia in mice.
So the team used this as a cutoff to stratify thrombocytopenic patients. A “high” level of histones was 30 µg/mL or greater, and a “low” level was below 30 µg/mL.
The researchers detected circulating histones in 51 of the thrombocytopenic patients and 31 controls—91% and 55%, respectively (P<0.001). Histone levels were 2.5- to 5.5-fold higher in thrombocytopenic patients than in controls.
Thrombocytopenic patients with high histone levels at ICU admission had significantly lower platelet counts and a significantly higher percentage of decrease in platelet counts at 24 hours (P=0.02 and P=0.04, respectively) and 48 hours (P=0.003 and P=0.005, respectively) after admission.
High admission histone levels were associated with moderate to severe thrombocytopenia and the development of clinically important thrombocytopenia (P<0.001).
A 30 µg/mL histone concentration was able to predict thrombocytopenia with 76% sensitivity and 91% specificity. The positive predictive value was 79.4%, and the negative predictive value was 89.2%. ![]()
Adjunct T-cell therapy granted orphan designation
The US Food and Drug Administration (FDA) has granted orphan drug designation for BPX-501, an adjunct T-cell therapy.
The designation is for the combination of BPX-501 genetically modified T cells and the activator agent rimiducid as replacement T-cell therapy for the treatment of immunodeficiency and graft-versus-host disease (GVHD) after allogeneic hematopoietic stem cell transplant (HSCT).
BPX-501 consists of genetically modified donor T cells incorporating the CaspaCIDe safety switch, which is designed to eliminate cells in the event of toxicity.
The CaspaCIDe switch consists of the CID-binding domain coupled to the signaling domain of caspase-9, an enzyme that is part of the apoptotic pathway. Infusion of rimiducid is designed to trigger activation of this domain of caspase-9 (iCasp9), which leads to selective apoptosis of the CaspaCIDe-containing cells.
This technology is intended to provide a safety net to eliminate BPX-501 alloreactive T cells if severe GVHD occurs, ostensibly enabling physicians to more safely perform haploidentical HSCTs by adding back the BPX-501 genetically engineered T cells to speed immune reconstitution and provide control over viral infections.
Following an allogeneic HSCT, a lack of sufficient mature T cells constitutes immune deficiency that can contribute to infections, viral reactivation, and relapse.
The ability to correct this immune deficiency by adding back mature donor T cells, without raising the risk of uncontrollable GVHD, has the potential to change the risk profile of allogeneic transplant, according to Bellicum Pharmaceuticals, the company developing BPX-501.
BPX-501 is being evaluated in multiple phase 1/2 trials in adults and pediatric patients with leukemias, lymphomas, and genetic blood diseases in the US and Europe.
About orphan designation
The FDA’s Office of Orphan Products Development grants orphan designation to drugs and biologics intended to treat, diagnose, or prevent rare diseases and disorders that affect fewer than 200,000 people in the US.
Orphan designation qualifies a company for various development incentives, including tax credits for qualified clinical testing and marketing exclusivity for a period of 7 years. ![]()
MSC product may treat refractory aGVHD

HONOLULU—A mesenchymal stem cell (MSC) product has shown promise for treating children with steroid-refractory acute graft-versus-host disease (aGVHD), according to researchers.
The product, remestemcel-L (MSC-100-IV, formerly Prochymal), produced an overall response rate of 65% by 28 days after treatment.
And patients who responded to remestemcel-L had significantly better survival at day 100 than patients who did not respond.
Joanne Kurtzberg, MD, of Duke University Medical Center in Durham, North Carolina, presented these data at the 2016 BMT Tandem Meetings (abstract 54). The study was sponsored by Mesoblast, the company developing remestemcel-L.
“There is a critical and urgent need for an effective and well-tolerated treatment for the very ill children who develop [GVHD] after a bone marrow transplant,” Dr Kurtzberg said. “While, historically, there is a high mortality rate associated with this complication, we are now seeing the majority of children who receive Mesoblast’s cell therapy respond and survive.”
For this study, Dr Kurtzberg and her colleagues assessed 241 children treated in Mesoblast’s Expanded Access Program, which was conducted at 50 sites in North American and Europe from 2007 to 2014.
Forty-five percent of the children received a bone marrow transplant, 31% received cord blood, and 45% had a mismatched transplant. Their median age was 9.6 (range, 2 months-18 years), 61% were male, and 60% were Caucasian.
All of the patients had steroid-refractory aGVHD. Thirty percent had grade C GVHD, 50% had grade D, 50% had multi-organ disease, and 79% were classified as “high-risk” disease.
Treatment
All 241 children received remestemcel-L, which consists of bone-marrow derived and culture-expanded human MSCs. The initial treatment was 2 million MSCs/kg twice a week for 4 weeks, at least 3 days apart.
Continued treatment consisted of 2 million MSCs/kg once a week for 4 weeks if patients achieved a partial or mixed response (improvement in one organ with deterioration in another organ) at the day-28 assessment.
The patients received a total of 2434 infusions. The median number of infusions was 11 (range, 1-24), and the median duration of treatment was 46 days (range, 1-186). Eighty-one percent (123/152) of eligible patients with a partial or mixed response at day 28 received continued therapy of 1 infusion a week for 4 weeks.
Results
Fifty-seven percent of patients (n=138) had at least 1 serious adverse event. About 5% (n=11) were considered treatment-related, and 1.7% (n=4) led to study discontinuation. There was 1 infusion reaction.
Thirty-four percent of patients (n=81) died through day 100, and 2.5% (n=6) experienced a relapse of their underlying disease.
At day 28 after treatment, the overall response rate was 65%, with a complete response rate of 14% and partial response rate of 51%. Responses were observed for all aGVHD grades and did not differ by baseline organ involvement.
When remestemcel-L was used as front-line therapy following steroid failure, the response rate was 81%. In patients with gastrointestinal and liver disease, the overall response rates were 65% and 62%, respectively.
Children who achieved a response at day 28 had significantly improved survival, compared to those who did not—82% and 39%, respectively (P<0.0001).
Extending therapy beyond day 28 in children who had a mixed response at day 28 resulted in significantly improved survival as well. Survival was 72% for these patients, compared to 18% for patients with a mixed response who did not receive additional therapy (P=0.003).
Mesoblast is now conducting a 60-patient, open label, phase 3 trial using remestemcel-L as front-line therapy in children with steroid-refractory aGVHD. ![]()
Poverty tied to early relapse in kids with ALL

Photo by Logan Tuttle
A new study suggests children with acute lymphoblastic leukemia (ALL) are more likely to suffer early relapse if they live in high-poverty areas.
All of the children studied received the same treatment, and the rates of relapse were similar regardless of poverty level.
But early relapse was more common among children from poorer areas. These children also had a lower rate of 5-year overall survival, but the difference was not significant.
Kira Bona, MD, of Dana-Farber Cancer Institute in Boston, Massachusetts, and her colleagues reported these results in Pediatric Blood & Cancer.
The team examined outcomes for 575 children, ages 1 to 18, with newly diagnosed ALL who were treated on Dana-Farber Cancer Institute ALL Consortium Protocols at 7 major academic medical centers in the US between 2000 and 2010.
Using US Census Bureau criteria, the investigators defined high-poverty areas as zip codes where 20% or more of residents have incomes below the federal poverty level. For a family of 4, this translates to an annual income of $24,250 or less.
Dr Bona and her colleagues found the overall rates of relapse were similar between children from low-poverty areas and those from high-poverty areas.
However, the timing of relapse differed significantly. Ninety-two percent of children from high-poverty areas who relapsed suffered early relapse (less than 36 months after first achieving complete remission), while 48% of the other children who relapsed did so early (P=0.008).
The 5-year overall survival was 85% for children from high-poverty areas and 92% for children from low-poverty areas. This difference is statistically significant when considered on its own (P=0.02) but not when the analysis is adjusted for other factors (P=0.07).
Still, the investigators said this suggests a possible disparity in survival.
“These children are getting the same best possible care at well-resourced institutions from highly trained clinicians, and we’re still seeing disparities,” Dr Bona said. “In trying to improve cure rates, we, as a field, have focused almost exclusively on biology. If we want to move forward, we also have to look at social determinants.”
Next steps
Dr Bona and her colleagues are undertaking further research designed to delve deeper into the relationship between socioeconomic status and outcomes and to allow for the development of poverty-targeted interventions.
As part of a prospective trial for children with ALL, the researchers will investigate associations between disease outcomes and the socioeconomic status of patients’ families, using a targetable measure of socioeconomic status called material hardship (food, housing, and/or energy insecurity).
The researchers will also investigate possible mechanisms underlying the relationship between socioeconomic status and early relapse, including adherence to oral chemotherapy and delays or dose reductions in chemotherapy due to a child’s underlying health.
In another study, investigators will conduct in-depth interviews with patients’ families, probing their knowledge and experience to pinpoint factors that might explain the disparity in outcomes and identify factors that can be targeted with interventions.
“Doing these next 2 studies is incredibly important,” Dr Bona said. “This study told us that simply providing the current best treatment regimen is not good enough if our goal is to cure every child with cancer.”
“At the same time that we develop new drugs and new treatment protocols, we need to address social determinants of health. Findings from these next studies will help us develop specific interventions to address disparities in outcomes. That’s an amazing opportunity.” ![]()
Regionalized Care and Adverse Events
Failures in communication among healthcare professionals are known threats to patient safety. These failures account for over 60% of root causes of sentinel events, the most serious events reported to The Joint Commission.[1] As such, identifying both patterns of effective communication as well as barriers to successful communication has been a focus of efforts aimed at improving patient safety. However, to date, the majority of this work has centered on improving communication in settings such as the operating room and intensive care unit,[2, 3, 4] or at times of care transitions.[5, 6, 7, 8]
Unique barriers exist for effective interdisciplinary communication in the hospital setting, particularly physiciannurse communication regarding shared hospitalized patients.[9] Traditionally, care of hospitalized patients is provided by physicians, nurses, and other team members working in varied workflow patterns, leading to dispersed team membership, where each team member cares for different groups of patients in different locations across the hospital. This dispersion is further heightened on teaching services, where residents' rotation schedules lead to frequent changes of care team membership, leaving inpatient care teams particularly vulnerable to ineffective communication. Evidence suggests that communication between nurses and physicians is currently suboptimal, leading to frequent disagreement regarding the patient's plan of care.[9, 10] This divergence between physician and nursing perceptions of patients' care plans may leave patients at greater risk of adverse events (AEs).
Several studies have examined the effects of regionalized inpatient care teams, where multidisciplinary team members care for the same patients on the same hospital unit, on communication and patient outcomes.[4, 11, 12, 13, 14] Results of these studies have been inconsistent, perhaps due to the particular characteristics of the care teams or to the study methodology. Thus, further rigorously done studies are required to better understand the impact of team regionalization on patient care. The goal of this study was to examine whether the implementation of regionalized inpatient care teams was associated with improvements in care team communication and preventable AEs.
METHODS
Setting, Patients, and Study Design
We performed a cohort analysis of patients at a 700‐bed tertiary care center, pre‐ and postregionalization of inpatient general medicine care teams. Our study protocol was approved by the Partners Healthcare Human Subjects Review Committee. Patients were eligible for inclusion if they were 18 years of age or older and discharged from the general medicine service (GMS) from any of the 3 participating nursing units between April 1, 2012 and June 19, 2012 (preregionalization) or April 1, 2013 and June 19, 2013 (postregionalization).
Intervention
On June 20, 2012, regionalized care was implemented on the GMS such that each of 3 GMS teams was localized to 1 of 3, 15‐bed nursing units. Prior to regionalization, the GMS physician care teams, each consisting of 1 hospitalist attending, 1 medical resident, and 2 medical interns, would care for patients on an average of 7 and up to 13 different nursing units on a given day.
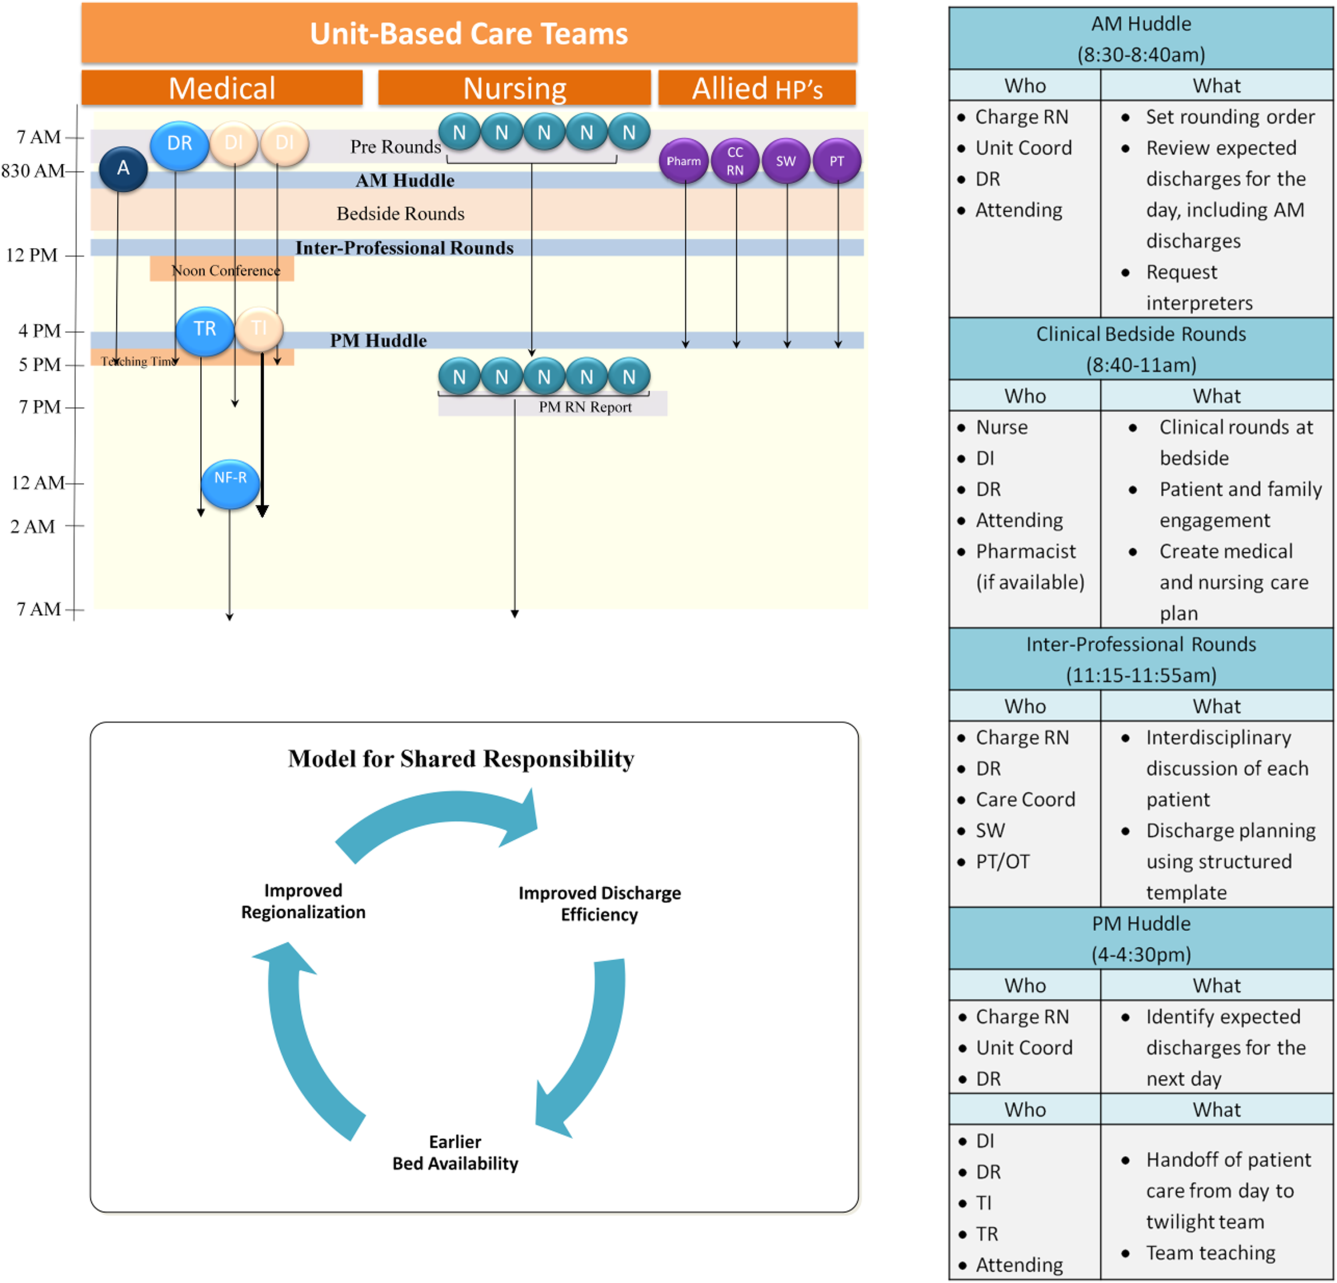
Regionalized care consisted of a multifaceted intervention codeveloped by hospitalist, residency, nursing, emergency department, and hospital leadership and included: (1) regionalizing GMS teams as much as possible; (2) change in resident call structure from a traditional 4‐day call cycle to daily admitting; (3) collaborative efforts to enhance GMS patient discharges before noon to promote regionalized placement of patients without prolonging time in the emergency department (ED); (4) daily morning and postround multidisciplinary huddles to prioritize sicker patients and discharges; (5) encouragement of daily rounds at patients' bedsides with presence of physician team, nurse, and team pharmacist if available; (6) creation of unit‐ and team‐level performance reports; and (7) creation of unit‐based physician and nursing co‐leadership (Figure 1).[15]
Concordance of Plan
Concordance of plan was measured via a 7‐question survey previously developed, pilot tested, and used to measure the impact of regionalized care on care team communication between inpatient nursephysician team members.[9] The survey was administered in‐person by 1 of 8 trained research assistants (RAs) (4/emntervention period) to nurse and intern pairs caring for patients on the study units pre‐ and postregionalization. GMS patients were eligible for inclusion if surveys could be administered to their nurse and intern within the first 24 hours of admission to the unit and within 48 hours of admission to the hospital, based on RA availability (thus excluding patients admitted on Fridays as surveys were not conducted over the weekend). Most often, all eligible patients admitted to the study units during time periods of data collection were included in the study. On limited occasions, the daily supply of patients surpassed RA capacity for inclusion, at which time computer‐generated randomization was utilized to randomly select patients for inclusion. Nurse and intern pairs were surveyed once during a patient's hospitalization, although they could be surveyed more than once about different patients, and patients could be included more than once if rehospitalized on the study unit and cared for by a different nurseintern pair. Of the 472 selected eligible patients, the nurses and interns of 418 patients were available and consented to survey administration, representing 361 unique nurse and intern pairs and 399 unique patients.
Each member of the pair was asked about 7 specific aspects of the patient's care plan for that day in isolation from the other team member, including: (1) the patient's primary diagnosis, (2) the patient's expressed chief concern, (3) the day's scheduled tests, (4) the day's scheduled procedures, (5) consulting services involved, (6) medication changes made that day, and (7) the patient's expected discharge date. In addition, each pair was asked the name of the other team member (ie, the nurse was asked the name of the intern and vice versa), and whether or not the patient care plan for the day had been discussed with the other team member, where concordance was defined as both members agreeing the plan had been discussed. All responses were recorded verbatim. Pairs were surveyed independently between 12 pm and 2 pm, limiting confounding by evolving plans of care over time.
Each set of surveys were then reviewed by 2 of 4 trained adjudicators, and responses to each question were scored as complete, partial, or no agreement. Rules for degree of agreement were based upon previously utilized parameters[9] as well as biweekly meetings during which common themes and disagreements in ratings were discussed, and rules generated to create consensus (see Supporting Information, Appendix, in the online version of this article).
Adverse Event Detection
Of the patients meeting eligibility criteria, 200 patients were randomly selected using computer‐generated randomization from each time period for AE outcome assessment, for a total of 400 patients.
Each patient's electronic medical record was retrospectively reviewed by a trained clinician using a previously validated screening tool to detect any possible AEs.[11] Any positive screen prompted documentation of a narrative summary including a short description of the possible AE and pertinent associated data. We defined AE as any injury due to medical management rather than the natural history of the illness, and further limited this definition to only include AEs that occurred on the study unit or as a result of care on that unit.
Two of 4 trained adjudicators, blinded to time period, then separately reviewed each narrative summary using previously validated 6‐point confidence scales to determine the presence and preventability of AE, with confidence ratings of 4 or greater used as cutoffs.[11] All AEs were also scored on a 4‐point severity scale (trivial, clinically significant, serious, or life threatening), with severe AE defined as serious or life threatening. Lastly, adjudicators grouped AEs into 1 of 10 prespecified categories.[11] Any disagreements in ratings or groupings were discussed by all 4 adjudicators to reach consensus.
Data Analysis
Patient characteristics are presented using descriptive statistics and were compared in the pre‐ and postregionalization time periods using 2 or t tests as appropriate.
To analyze whether regionalized care was associated with concordance of plan, adjudicated survey questions were assigned points of 1, 0.5, and 0 for complete, partial, and no agreement, respectively. Total mean concordance scores for any patient ranged from 0 to 7 points, and were divided by total number of answered questions (up to 7) for a range of 0 to 1. Total mean concordance scores as well as mean concordance score per survey question were compared pre‐ versus postregionalization using t tests. In sensitivity analyses, adjudicated survey responses were dichotomized with complete and partial agreement deemed concordant responses. Percent concordance for each question was then compared pre‐ versus postregionalization using 2 analysis. Questions about the name of the other team member and discussion of daily care plan with the other team member were excluded from total concordance score calculations and were compared individually pre‐ versus postregionalization, because they are not directly about the plan of care.
To analyze the association of regionalization with odds of preventable AE, we performed multivariable logistic regression adjusted for patient age, sex, race, language, and Elixhauser comorbidity score,[16] and utilized generalized estimating equations to account for clustering by hospital unit. Secondary outcomes included severe preventable AEs, nonpreventable AEs, and category of preventable AEs using similar methodology. Two‐sided P values <0.05 were considered significant, and SAS version 9.2 (SAS Institute Inc., Cary, NC) was used for all analyses.
RESULTS
The fidelity of the intervention in achieving its goal of regionalized care is discussed separately.[15] Briefly, the intervention was successful at achieving 85% regionalization by team (ie, average daily percentage of team's patients assigned to team's unit) and 87% regionalization by unit (ie, average daily percentage of unit's patients with assigned team) following implementation, compared to 20% regionalization by team and unit in the preintervention period. Importantly, the average daily census of physician care teams rose by 32%, from a mean of 10.8 patients/physician care team preregionalization to a mean of 14.3 patients/physician care team postregionalization.
Concordance of Plan
Of the 418 nurse and intern paired surveys, 4 surveys were excluded due to repeat surveys of the same patient during the same hospitalization, for a total of 197 distinct paired surveys preregionalization and 217 paired surveys postregionalization. There were no statistically significant differences in patients' age, sex, race, language, admission source, length of stay, Elixhauser comorbidity score and diagnosis‐related group weight pre‐ versus postregionalization (Table 1).
| Characteristic | Concordance of Care Plan | Adverse Events | ||||
|---|---|---|---|---|---|---|
| Pre, n = 197 | Post, n = 217 | P Value | Pre, n = 198 | Post, n = 194 | P Value | |
| ||||||
| Age, mean (SD) | 60.5 (19.4) | 57.6 (20.8) | 0.15 | 60.4 (18.9) | 58.0 (21.2) | 0.24 |
| Male, n (%) | 77 (39.1) | 92 (42.4) | 0.49 | 94 (47.5) | 85 (43.8) | 0.55 |
| Race/ethnicity, n (%) | 0.34 | 0.12 | ||||
| White | 134 (68.0) | 141 (65.0) | 132 (66.5) | 121 (62.4) | ||
| Black | 42 (21.3) | 45 (20.7) | 41 (20.8) | 54 (27.8) | ||
| Hispanic | 18 (9.1) | 21 (9.7) | 22 (11.3) | 13 (6.8) | ||
| Other/unknown | 3 (1.5) | 10 (4.6) | 3 (1.4) | 6 (2.9) | ||
| Language, n (%) | 0.30 | 0.73 | ||||
| English | 183 (92.9) | 203 (93.5) | 176 (88.7) | 175 (90.2) | ||
| Spanish | 6 (3.0) | 10 (4.6) | 10 (5.2) | 10 (5.3) | ||
| Other | 8 (4.1) | 4 (1.8) | 12 (6.1) | 9 (4.5) | ||
| Admitting source, n (%) | 1.00 | 0.10 | ||||
| Physician office | 13 (6.6) | 13 (6.0) | 13 (6.6) | 6 (3.1) | ||
| Emergency department | 136 (69.0) | 150 (69.1) | 126 (63.6) | 127 (65.5) | ||
| Transfer from different hospital | 40 (20.3) | 45 (20.7) | 54 (27.3) | 50 (25.8) | ||
| Transfer from skilled nursing facility | 8 (4.1) | 9 (4.2) | 5 (2.5) | 11 (5.6) | ||
| Length of stay, d, median (IQR) | 3.0 (4.0) | 3.0 (4.0) | 0.57 | 4.0 (5.0) | 3.0 (4.0) | 0.16 |
| Elixhauser Comorbidity Score, mean (SD) | 8.0 (8.8) | 8.3 (9.3) | 0.74 | 8.0 (8.6) | 7.8 (8.4) | 0.86 |
| DRG weight, mean (SD) | 1.6 (1.0) | 1.5 (1.0) | 0.37 | 1.5 (0.93) | 1.5 (1.1) | 0.96 |
Kappa scores for adjudications of concordance surveys (defined as both adjudicators scoring the same level of agreement (ie, both complete or partial agreement versus no agreement) ranged from 0.69 to 0.95, by question. There were no significant differences in total mean concordance scores in the care plan pre‐ versus postregionalization (0.65 vs 0.67, P = 0.26) (Table 2). Similarly, there were no significant differences in mean concordance score for each survey question, except agreement on expected date of discharge (0.56 vs 0.68, P = 0.003), knowledge of the other provider's name, and agreement that discussion of the daily plan had taken place with the other pair member. Similar results were seen when results were dichotomized (ie, partial or complete agreement vs no agreement) (Table 2).
| Concordance Outcome | Pre, n = 197 | Post, n = 217 | P Value |
|---|---|---|---|
| |||
| Concordance score* | |||
| Total concordance score, mean (SD) | 0.65 (0.17) | 0.67 (0.16) | 0.26 |
| Subgroups | |||
| Diagnosis | 0.77 (0.32) | 0.72 (0.35) | 0.11 |
| Patient's chief concern | 0.48 (0.44) | 0.48 (0.43) | 0.94 |
| Tests today | 0.67 (0.40) | 0.71 (0.42) | 0.36 |
| Procedures today | 0.93 (0.25) | 0.92 (0.25) | 0.71 |
| Medication changes today | 0.56 (0.44) | 0.59 (0.43) | 0.54 |
| Consulting services | 0.59 (0.44) | 0.60 (0.44) | 0.82 |
| Expected discharge date | 0.56 (0.44) | 0.68 (0.38) | 0.003 |
| Responding clinician knowledge of nurse's name | 0.56 (0.50) | 0.86 (0.35) | <0.001 |
| Nurse's knowledge of responding clinician's name | 0.56 (0.50) | 0.88 (0.33) | <0.001 |
| Plan discussed | 0.73 (0.45) | 0.88 (0.32) | <0.001 |
| Percent concordance, mean (SD) | |||
| Diagnosis | 92.0 (27.3) | 88.6 (31.9) | 0.25 |
| Patient's chief concern | 59.6 (49.1) | 60.6 (49.0) | 0.84 |
| Tests today | 78.9 (40.9) | 77.2 (42.1) | 0.67 |
| Procedures today | 93.5 (24.8) | 94.1 (23.7) | 0.80 |
| Medication changes today | 66.3 (33.6) | 69.9 (46.0) | 0.44 |
| Consulting services | 69.3 (46.2) | 68.9 (46.4) | 0.93 |
| Expected discharge date | 67.5 (47.0) | 82.6 (38.0) | <0.001 |
| Responding clinician knowledge of nurse's name | 55.7 (49.8) | 85.6 (35.2) | <0.001 |
| Nurse's knowledge of responding clinician's name | 55.9 (49.8) | 87.9 (32.8) | <0.001 |
| Plan discussed | 72.9 (44.6) | 88.2 (32.3) | <0.001 |
Adverse Events
Of the 400 patients screened for AEs, 8 were excluded due to missing medical record number (5) and discharge outside of study period (3). Of the final 392 patient screens (198 pre, 194 post), there were no significant differences in patients' age, sex, race, language, length of stay, or Elixhauser score pre‐ versus postregionalization (Table 1).
Kappa scores for adjudicator agreement were 0.35 for presence of AE and 0.34 for preventability of AE. Of the 392 reviewed patient records, there were 133 total AEs detected (66 pre, 67 post), 27 preventable AEs (13 pre, 14 post), and 9 severe preventable AEs (4 pre, 5 post) (Table 3). There was no significant difference in the adjusted odds of preventable AEs post‐ versus preregionalization (adjusted odds ratio: 1.37, 95% confidence interval: 0.69, 2.69). Although the low number of AEs rated as severe or life threatening precluded adjusted analysis, unadjusted results similarly demonstrated no difference in odds of severe preventable AEs pre‐ versus postregionalization. As expected, there was no significant difference in adjusted odds of nonpreventable AE after implementation of regionalized care (Table 3).
| Adverse Events | No. of Adverse Events | Adjusted Odds Ratio Post vs Pre (95% CI) | |
|---|---|---|---|
| Pre, n = 198 | Post, n = 194 | ||
| |||
| Preventable | 13 | 14 | 1.37 (0.69, 2.69) |
| Serious and preventable | 4 | 5 | |
| Nonpreventable | 47 | 50 | 1.20 (0.85, 1.75) |
Similarly, there were no significant differences in category of preventable AE pre‐ versus postregionalization. The most frequent preventable AEs in both time periods were those related to adverse drug events and to manifestations of poor glycemic control, examples of which are illustrated (Table 4).
| |
| Adverse drug event | 29‐year‐old male with history of alcohol abuse, complicated by prior withdrawal seizures/emntensive care unit admissions, presented with alcohol withdrawal. Started on standing and PRN lorazepam, kept on home medications including standing clonidine, gabapentin, citalopram, quetiapine. Became somnolent due to polypharmacy, ultimately discontinued quetiapine as discovered took only as needed at home for insomnia |
| Manifestations of poor glycemic control | 78‐year‐old male with recently diagnosed lymphoma, distant history of bladder and prostate cancer status post ileal loop diversion, presented status post syncopal event; during event, spilled boiling water on himself leading to second‐degree burns on 3% of his body. Initially admitted to trauma/burn service, ultimately transferred to medical service for ongoing multiple medical issues including obstructive uropathy, acute on chronic renal failure. Adverse event was hyperglycemia (>350 mg/dL on >2 consecutive readings) in the setting of holding his home insulin detemir and insulin aspart (had been placed on insulin aspart sliding scale alone). After hyperglycemic episodes, was placed back on weight‐based basal/nutritional insulin |
DISCUSSION
In this study of general medicine patients at a large academic medical center, we found that regionalization of care teams on general medicine services was associated with improved recognition of care team members and agreement on estimated date of patient discharge, but was not associated with improvement in overall nurse and physician concordance of the patient care plan, or the odds of preventable AEs.
This intervention importantly addresses the barrier of dispersion of team membership, a well‐recognized barrier to interdisciplinary collaboration,[17, 18] particularly with resident physician teams due to frequently changing team membership. Localization of all team members, in addition to encouragement of daily collaborative bedside rounds as part of the regionalization initiative, likely contributed to our observed improvement in team member identification and discussion of daily care plans. Similarly, regionalization resulted in improved agreement in estimations of date of patient discharge. Focus on early patient discharges was an integral part of the implementation efforts; we therefore hypothesize that mutual focus on discharge planning by both nurses and responding clinicians may have explained this observed result.
On the other hand, regionalization did not appreciably improve the overall concordance of care plan between nurses and interns, despite a significant increase in team members agreeing that the plan had been discussed. Our findings support similar prior research demonstrating that regionalizing hospitalist attendings to single nursing units had limited impact on agreement of care plan between physicians and nurses.[13] Similarly, in settings where physicians and nurses are inherently regionalized, such as the intensive care unit[4] or the operating room,[3] communication between physicians and nurses remains difficult. Collectively, our findings suggest that colocalization of physicians and nurses alone is likely insufficient to improve measured communication between care team members. Existing literature suggests that more standardized approaches to improve communication, such as structured communication tools used during daily inpatient care[19, 20] or formalized team training,[21, 22, 23] lead to improvements in communication and collaboration. Despite these findings, it is important to highlight that this study did not assess other measures of workplace culture, such as teamwork and care team cohesiveness, which may have been positively affected by this intervention, even without measurable effect on concordance of care plan. Additionally, as noted, the average daily census on each team increased by almost a third postintervention, which may have impeded improvements in care team communication.
In addition, we found that our intervention had no significant impact on preventable AEs or severe preventable AEs. Although we cannot exclude the possibility that more subtle AEs were missed with our methodology, our results indicate that regionalized care alone may be inadequate to improve major patient safety outcomes. As discussed, the volume of patients did increase postintervention; thus, another way to state our results is that we were able to increase the daily volume of patients without any significant decreases in patient safety. Nevertheless, the results on patient safety were less than desired. A recent review of interdisciplinary team care interventions on general medical wards similarly demonstrated underwhelming improvements in patient safety outcomes, although the reviewed interventions did not specifically address preventable AEs, a gap in the literature commented on by the authors.[24] Other albeit limited literature has demonstrated improvement in patient safety outcomes via multifaceted efforts aimed at improving care team member communication. Notably, these efforts include colocalization of care team members to single units but also involve additional measures to improve communication and collaboration between care team members, such as structured communication during interdisciplinary rounds, and certification of key interdisciplinary teamwork skills.[11, 14] Although our regionalized care intervention included many similar features to these accountable care units (ACUs) including unit‐based care teams, unit‐level performance reporting, and unit‐based physician and nursing coleadership, significant differences existed. Notably, in addition to the above features, the ACU model also incorporated highly structured communication models for interdisciplinary rounding, and certification processes to ensure an appropriate communication skill base among care team members.[14] Thus, although creation of regionalized care teams is likely a necessary precursor to implementation of these additional measures, alone it may be insufficient to improve patient safety outcomes.
Importantly, in our study we identified that adverse drug events and manifestations of poor glycemic control occurred in high frequency both before and following implementation of regionalized care, supporting other literature that describes the prevalence of these AEs.[11, 25, 26, 27] These results suggest that targeted interventions to address these specific AEs are likely necessary. Notably, the intervention units in our study did not consistently employ clinical pharmacists assigned specifically to that unit's care team to allow for integration within the care team. As prior research has suggested that greater collaboration with clinical pharmacists results in reduction of adverse drug events,[28] next steps may include improved integration of team‐based pharmacists into the activities of the regionalized care teams. Inpatient management of diabetes also requires specific interventions,[29, 30, 31] only some of which may be addressable by having regionalized care and better interdisciplinary communication.
Our findings are subject to several limitations. First, this was a single‐site study and thus our findings may not be generalizable to other institutions. However, regionalized care is increasingly encouraged to optimize communication between care team members.[17, 18] Therefore, our null findings may be pertinent to other institutions looking to improve patient safety outcomes, demonstrating that additional initiatives will likely be required. Second, our modes of outcome measurement possess limitations. In measuring concordance of care plan, although previously used survey techniques were employed,[9] the concordance survey has not been formally validated, and we believe some of the questions may have led to ambiguity on the part of the responders that may have resulted in less accurate responses, thus biasing toward the null. Similarly, in measuring AEs, the screening tool relied on retrospective chart review looking for specific AE types[11] and thus may not have captured more subtle AEs. Additionally, our study may have been underpowered to demonstrate significant reduction in preventable AEs, although other studies of similar methodology demonstrated significant results with similar sample size.[11] This was due in part to our lower‐than‐expected baseline AE rate (6.6% compared with approximately 10.3% in previous studies).[11] Lastly, our study solely examined the association of regionalization with concordance of care plan and preventable AEs, but importantly excluded other clinically important outcomes that may have been positively (or negatively) impacted by these regionalization efforts, such as ED wait times, provider efficiency (eg, fewer pages, less time in transit, more time at the bedside), interdisciplinary teamwork, or patient or provider satisfaction.
CONCLUSION
In summary, our findings suggest that regionalized care teams alone may be insufficient to effectively promote communication between care team members regarding the care plan or to lead to improvements in patient safety, although we recognize that there may have been benefits (or unintended harms) not measured in this study but are nonetheless important for clinical care and workplace culture. This is an important lesson, as many hospitals move toward regionalized care in an effort to improve patient safety outcomes. However, strengthening the infrastructure by colocalizing care team members to maximize opportunity for communication is likely a necessary first step toward facilitating implementation of additional initiatives that may lead to more robust patient safety improvements, such as structured interdisciplinary bedside rounds (eg, facilitating and training all team members to fulfill specific roles), teamwork training, and certification of key interdisciplinary teamwork skills. Additionally, close examination of identified prevalent and preventable AEs can help to determine which additional initiatives are most likely to have greatest impact in improving patient safety.
Disclosures: This research was supported by funds provided by Brigham and Women's Hospital (BWH) and by funds provided by the Department of Medicine at BWH. All authors had full access to all of the data in the study and were integrally involved in the design, implementation, data collection, and analyses. The first author, Dr. Stephanie Mueller, takes responsibility for the integrity for the data and the accuracy of the data analysis. Dr. Schnipper reports grants from Sanofi Aventis, outside the submitted work.
- Joint Commission on Accreditation of Healthcare Organizations. Understanding and Preventing Sentinel Events in Your Health Care Organization. Oak Brook, IL: Joint Commission; 2008.
- , , , et al. Communication failures in the operating room: an observational classification of recurrent types and effects. Qual Saf Health Care. 2004;13(5):330–334.
- , , , et al. Operating room teamwork among physicians and nurses: teamwork in the eye of the beholder. J Am Coll Surg. 2006;202(5):746–752.
- , , . Discrepant attitudes about teamwork among critical care nurses and physicians. Crit Care Med. 2003;31(3):956–959.
- , , , , . Communication failures in patient sign‐out and suggestions for improvement: a critical incident analysis. Qual Saf Health Care. 2005;14(6):401–407.
- , , , et al. Changes in medical errors after implementation of a handoff program. N Engl J Med. 2014;371(19):1803–1812.
- , , , et al. Communication and information deficits in patients discharged to rehabilitation facilities: an evaluation of five acute care hospitals. J Hosp Med. 2009;4(8):E28–E33.
- , , , , , . Deficits in communication and information transfer between hospital‐based and primary care physicians: implications for patient safety and continuity of care. JAMA. 2007;297(8):831–841.
- , , , et al. Patterns of nurse‐physician communication and agreement on the plan of care. Qual Saf Health Care. 2010;19(3):195–199.
- , , , , , . Can we talk? Priorities for patient care differed among health care providers. In: Henriksen K, Battles JB, Marks ES, Lewin DI, eds. Advances in Patient Safety: From Research to Implementation. Vol 1. Rockville, MD: Agency for Healthcare Research and Quality; 2005.
- , , , et al. Structured interdisciplinary rounds in a medical teaching unit: improving patient safety. Arch Intern Med. 2011;171(7):678–684.
- , , , , , . Improving teamwork: impact of structured interdisciplinary rounds on a hospitalist unit. J Hosp Med. 2011;6(2):88–93.
- , , , et al. Impact of localizing physicians to hospital units on nurse‐physician communication and agreement on the plan of care. J Gen Intern Med. 2009;24(11):1223–1227.
- , , , et al. Reorganizing a hospital ward as an accountable care unit. J Hosp Med. 2015;10(1):36–40.
- , , , et al. 5th time's a charm: creation of unit‐based care teams in a high occupancy hospital [abstract]. J Hosp Med. 2015;10 (suppl. 2). Available at: http://www.shmabstracts.com/abstract/5th‐times‐a‐charm‐creation‐of‐unit‐based‐care‐teams‐in‐a‐high‐occupancy‐hospital. Accessed July 28, 2015.
- , , , . Comorbidity measures for use with administrative data. Med Care. 1998;36(1):8–27.
- , , , , , . Teamwork on inpatient medical units: assessing attitudes and barriers. Qual Saf Health Care. 2010;19(2):117–121.
- , , , et al. A model for quality improvement programs in academic departments of medicine. Am J Med. 2008;121(10):922–929.
- , , , , . Improving nurse‐physician communication and satisfaction in the intensive care unit with a daily goals worksheet. Am J Crit Care. 2006;15(2):217–222.
- , , , , , . Improving communication in the ICU using daily goals. J Crit Care. 2003;18(2):71–75.
- , , , et al. Effect of crew resource management training in a multidisciplinary obstetrical setting. Int J Qual Health Care. 2008;20(4):254–263.
- , , , et al. Error reduction and performance improvement in the emergency department through formal teamwork training: evaluation results of the MedTeams project. Health Serv Res. 2002;37(6):1553–1581.
- , , , et al. Effects of teamwork training on adverse outcomes and process of care in labor and delivery: a randomized controlled trial. Obstet Gynecol. 2007;109(1):48–55.
- , , , et al. Effects of interdisciplinary team care interventions on general medical wards: a systematic review. JAMA Intern Med. 2015;175(8):1288–1298.
- , , , et al. Patient risk factors for adverse drug events in hospitalized patients. ADE Prevention Study Group. Arch Intern Med. 1999;159(21):2553–2560.
- , , , et al. Effect of a pharmacist intervention on clinically important medication errors after hospital discharge: a randomized trial. Ann Intern Med. 2012;157(1):1–10.
- , , , . Use of a standardized protocol to decrease medication errors and adverse events related to sliding scale insulin. Qual Saf Health Care. 2006;15(2):89–91.
- , , , . Clinical pharmacists and inpatient medical care: a systematic review. Arch Intern Med. 2006;166(9):955–964.
- , , , , . Improved inpatient use of basal insulin, reduced hypoglycemia, and improved glycemic control: effect of structured subcutaneous insulin orders and an insulin management algorithm. J Hosp Med. 2009;4(1):3–15.
- , , , . Effects of a computerized order set on the inpatient management of hyperglycemia: a cluster‐randomized controlled trial. Endocr Pract. 2010;16(2):209–218.
- , , , . Effects of a subcutaneous insulin protocol, clinical education, and computerized order set on the quality of inpatient management of hyperglycemia: results of a clinical trial. J Hosp Med. 2009;4(1):16–27.
Failures in communication among healthcare professionals are known threats to patient safety. These failures account for over 60% of root causes of sentinel events, the most serious events reported to The Joint Commission.[1] As such, identifying both patterns of effective communication as well as barriers to successful communication has been a focus of efforts aimed at improving patient safety. However, to date, the majority of this work has centered on improving communication in settings such as the operating room and intensive care unit,[2, 3, 4] or at times of care transitions.[5, 6, 7, 8]
Unique barriers exist for effective interdisciplinary communication in the hospital setting, particularly physiciannurse communication regarding shared hospitalized patients.[9] Traditionally, care of hospitalized patients is provided by physicians, nurses, and other team members working in varied workflow patterns, leading to dispersed team membership, where each team member cares for different groups of patients in different locations across the hospital. This dispersion is further heightened on teaching services, where residents' rotation schedules lead to frequent changes of care team membership, leaving inpatient care teams particularly vulnerable to ineffective communication. Evidence suggests that communication between nurses and physicians is currently suboptimal, leading to frequent disagreement regarding the patient's plan of care.[9, 10] This divergence between physician and nursing perceptions of patients' care plans may leave patients at greater risk of adverse events (AEs).
Several studies have examined the effects of regionalized inpatient care teams, where multidisciplinary team members care for the same patients on the same hospital unit, on communication and patient outcomes.[4, 11, 12, 13, 14] Results of these studies have been inconsistent, perhaps due to the particular characteristics of the care teams or to the study methodology. Thus, further rigorously done studies are required to better understand the impact of team regionalization on patient care. The goal of this study was to examine whether the implementation of regionalized inpatient care teams was associated with improvements in care team communication and preventable AEs.
METHODS
Setting, Patients, and Study Design
We performed a cohort analysis of patients at a 700‐bed tertiary care center, pre‐ and postregionalization of inpatient general medicine care teams. Our study protocol was approved by the Partners Healthcare Human Subjects Review Committee. Patients were eligible for inclusion if they were 18 years of age or older and discharged from the general medicine service (GMS) from any of the 3 participating nursing units between April 1, 2012 and June 19, 2012 (preregionalization) or April 1, 2013 and June 19, 2013 (postregionalization).
Intervention
On June 20, 2012, regionalized care was implemented on the GMS such that each of 3 GMS teams was localized to 1 of 3, 15‐bed nursing units. Prior to regionalization, the GMS physician care teams, each consisting of 1 hospitalist attending, 1 medical resident, and 2 medical interns, would care for patients on an average of 7 and up to 13 different nursing units on a given day.
Regionalized care consisted of a multifaceted intervention codeveloped by hospitalist, residency, nursing, emergency department, and hospital leadership and included: (1) regionalizing GMS teams as much as possible; (2) change in resident call structure from a traditional 4‐day call cycle to daily admitting; (3) collaborative efforts to enhance GMS patient discharges before noon to promote regionalized placement of patients without prolonging time in the emergency department (ED); (4) daily morning and postround multidisciplinary huddles to prioritize sicker patients and discharges; (5) encouragement of daily rounds at patients' bedsides with presence of physician team, nurse, and team pharmacist if available; (6) creation of unit‐ and team‐level performance reports; and (7) creation of unit‐based physician and nursing co‐leadership (Figure 1).[15]
Concordance of Plan
Concordance of plan was measured via a 7‐question survey previously developed, pilot tested, and used to measure the impact of regionalized care on care team communication between inpatient nursephysician team members.[9] The survey was administered in‐person by 1 of 8 trained research assistants (RAs) (4/emntervention period) to nurse and intern pairs caring for patients on the study units pre‐ and postregionalization. GMS patients were eligible for inclusion if surveys could be administered to their nurse and intern within the first 24 hours of admission to the unit and within 48 hours of admission to the hospital, based on RA availability (thus excluding patients admitted on Fridays as surveys were not conducted over the weekend). Most often, all eligible patients admitted to the study units during time periods of data collection were included in the study. On limited occasions, the daily supply of patients surpassed RA capacity for inclusion, at which time computer‐generated randomization was utilized to randomly select patients for inclusion. Nurse and intern pairs were surveyed once during a patient's hospitalization, although they could be surveyed more than once about different patients, and patients could be included more than once if rehospitalized on the study unit and cared for by a different nurseintern pair. Of the 472 selected eligible patients, the nurses and interns of 418 patients were available and consented to survey administration, representing 361 unique nurse and intern pairs and 399 unique patients.
Each member of the pair was asked about 7 specific aspects of the patient's care plan for that day in isolation from the other team member, including: (1) the patient's primary diagnosis, (2) the patient's expressed chief concern, (3) the day's scheduled tests, (4) the day's scheduled procedures, (5) consulting services involved, (6) medication changes made that day, and (7) the patient's expected discharge date. In addition, each pair was asked the name of the other team member (ie, the nurse was asked the name of the intern and vice versa), and whether or not the patient care plan for the day had been discussed with the other team member, where concordance was defined as both members agreeing the plan had been discussed. All responses were recorded verbatim. Pairs were surveyed independently between 12 pm and 2 pm, limiting confounding by evolving plans of care over time.
Each set of surveys were then reviewed by 2 of 4 trained adjudicators, and responses to each question were scored as complete, partial, or no agreement. Rules for degree of agreement were based upon previously utilized parameters[9] as well as biweekly meetings during which common themes and disagreements in ratings were discussed, and rules generated to create consensus (see Supporting Information, Appendix, in the online version of this article).
Adverse Event Detection
Of the patients meeting eligibility criteria, 200 patients were randomly selected using computer‐generated randomization from each time period for AE outcome assessment, for a total of 400 patients.
Each patient's electronic medical record was retrospectively reviewed by a trained clinician using a previously validated screening tool to detect any possible AEs.[11] Any positive screen prompted documentation of a narrative summary including a short description of the possible AE and pertinent associated data. We defined AE as any injury due to medical management rather than the natural history of the illness, and further limited this definition to only include AEs that occurred on the study unit or as a result of care on that unit.
Two of 4 trained adjudicators, blinded to time period, then separately reviewed each narrative summary using previously validated 6‐point confidence scales to determine the presence and preventability of AE, with confidence ratings of 4 or greater used as cutoffs.[11] All AEs were also scored on a 4‐point severity scale (trivial, clinically significant, serious, or life threatening), with severe AE defined as serious or life threatening. Lastly, adjudicators grouped AEs into 1 of 10 prespecified categories.[11] Any disagreements in ratings or groupings were discussed by all 4 adjudicators to reach consensus.
Data Analysis
Patient characteristics are presented using descriptive statistics and were compared in the pre‐ and postregionalization time periods using 2 or t tests as appropriate.
To analyze whether regionalized care was associated with concordance of plan, adjudicated survey questions were assigned points of 1, 0.5, and 0 for complete, partial, and no agreement, respectively. Total mean concordance scores for any patient ranged from 0 to 7 points, and were divided by total number of answered questions (up to 7) for a range of 0 to 1. Total mean concordance scores as well as mean concordance score per survey question were compared pre‐ versus postregionalization using t tests. In sensitivity analyses, adjudicated survey responses were dichotomized with complete and partial agreement deemed concordant responses. Percent concordance for each question was then compared pre‐ versus postregionalization using 2 analysis. Questions about the name of the other team member and discussion of daily care plan with the other team member were excluded from total concordance score calculations and were compared individually pre‐ versus postregionalization, because they are not directly about the plan of care.
To analyze the association of regionalization with odds of preventable AE, we performed multivariable logistic regression adjusted for patient age, sex, race, language, and Elixhauser comorbidity score,[16] and utilized generalized estimating equations to account for clustering by hospital unit. Secondary outcomes included severe preventable AEs, nonpreventable AEs, and category of preventable AEs using similar methodology. Two‐sided P values <0.05 were considered significant, and SAS version 9.2 (SAS Institute Inc., Cary, NC) was used for all analyses.
RESULTS
The fidelity of the intervention in achieving its goal of regionalized care is discussed separately.[15] Briefly, the intervention was successful at achieving 85% regionalization by team (ie, average daily percentage of team's patients assigned to team's unit) and 87% regionalization by unit (ie, average daily percentage of unit's patients with assigned team) following implementation, compared to 20% regionalization by team and unit in the preintervention period. Importantly, the average daily census of physician care teams rose by 32%, from a mean of 10.8 patients/physician care team preregionalization to a mean of 14.3 patients/physician care team postregionalization.
Concordance of Plan
Of the 418 nurse and intern paired surveys, 4 surveys were excluded due to repeat surveys of the same patient during the same hospitalization, for a total of 197 distinct paired surveys preregionalization and 217 paired surveys postregionalization. There were no statistically significant differences in patients' age, sex, race, language, admission source, length of stay, Elixhauser comorbidity score and diagnosis‐related group weight pre‐ versus postregionalization (Table 1).
| Characteristic | Concordance of Care Plan | Adverse Events | ||||
|---|---|---|---|---|---|---|
| Pre, n = 197 | Post, n = 217 | P Value | Pre, n = 198 | Post, n = 194 | P Value | |
| ||||||
| Age, mean (SD) | 60.5 (19.4) | 57.6 (20.8) | 0.15 | 60.4 (18.9) | 58.0 (21.2) | 0.24 |
| Male, n (%) | 77 (39.1) | 92 (42.4) | 0.49 | 94 (47.5) | 85 (43.8) | 0.55 |
| Race/ethnicity, n (%) | 0.34 | 0.12 | ||||
| White | 134 (68.0) | 141 (65.0) | 132 (66.5) | 121 (62.4) | ||
| Black | 42 (21.3) | 45 (20.7) | 41 (20.8) | 54 (27.8) | ||
| Hispanic | 18 (9.1) | 21 (9.7) | 22 (11.3) | 13 (6.8) | ||
| Other/unknown | 3 (1.5) | 10 (4.6) | 3 (1.4) | 6 (2.9) | ||
| Language, n (%) | 0.30 | 0.73 | ||||
| English | 183 (92.9) | 203 (93.5) | 176 (88.7) | 175 (90.2) | ||
| Spanish | 6 (3.0) | 10 (4.6) | 10 (5.2) | 10 (5.3) | ||
| Other | 8 (4.1) | 4 (1.8) | 12 (6.1) | 9 (4.5) | ||
| Admitting source, n (%) | 1.00 | 0.10 | ||||
| Physician office | 13 (6.6) | 13 (6.0) | 13 (6.6) | 6 (3.1) | ||
| Emergency department | 136 (69.0) | 150 (69.1) | 126 (63.6) | 127 (65.5) | ||
| Transfer from different hospital | 40 (20.3) | 45 (20.7) | 54 (27.3) | 50 (25.8) | ||
| Transfer from skilled nursing facility | 8 (4.1) | 9 (4.2) | 5 (2.5) | 11 (5.6) | ||
| Length of stay, d, median (IQR) | 3.0 (4.0) | 3.0 (4.0) | 0.57 | 4.0 (5.0) | 3.0 (4.0) | 0.16 |
| Elixhauser Comorbidity Score, mean (SD) | 8.0 (8.8) | 8.3 (9.3) | 0.74 | 8.0 (8.6) | 7.8 (8.4) | 0.86 |
| DRG weight, mean (SD) | 1.6 (1.0) | 1.5 (1.0) | 0.37 | 1.5 (0.93) | 1.5 (1.1) | 0.96 |
Kappa scores for adjudications of concordance surveys (defined as both adjudicators scoring the same level of agreement (ie, both complete or partial agreement versus no agreement) ranged from 0.69 to 0.95, by question. There were no significant differences in total mean concordance scores in the care plan pre‐ versus postregionalization (0.65 vs 0.67, P = 0.26) (Table 2). Similarly, there were no significant differences in mean concordance score for each survey question, except agreement on expected date of discharge (0.56 vs 0.68, P = 0.003), knowledge of the other provider's name, and agreement that discussion of the daily plan had taken place with the other pair member. Similar results were seen when results were dichotomized (ie, partial or complete agreement vs no agreement) (Table 2).
| Concordance Outcome | Pre, n = 197 | Post, n = 217 | P Value |
|---|---|---|---|
| |||
| Concordance score* | |||
| Total concordance score, mean (SD) | 0.65 (0.17) | 0.67 (0.16) | 0.26 |
| Subgroups | |||
| Diagnosis | 0.77 (0.32) | 0.72 (0.35) | 0.11 |
| Patient's chief concern | 0.48 (0.44) | 0.48 (0.43) | 0.94 |
| Tests today | 0.67 (0.40) | 0.71 (0.42) | 0.36 |
| Procedures today | 0.93 (0.25) | 0.92 (0.25) | 0.71 |
| Medication changes today | 0.56 (0.44) | 0.59 (0.43) | 0.54 |
| Consulting services | 0.59 (0.44) | 0.60 (0.44) | 0.82 |
| Expected discharge date | 0.56 (0.44) | 0.68 (0.38) | 0.003 |
| Responding clinician knowledge of nurse's name | 0.56 (0.50) | 0.86 (0.35) | <0.001 |
| Nurse's knowledge of responding clinician's name | 0.56 (0.50) | 0.88 (0.33) | <0.001 |
| Plan discussed | 0.73 (0.45) | 0.88 (0.32) | <0.001 |
| Percent concordance, mean (SD) | |||
| Diagnosis | 92.0 (27.3) | 88.6 (31.9) | 0.25 |
| Patient's chief concern | 59.6 (49.1) | 60.6 (49.0) | 0.84 |
| Tests today | 78.9 (40.9) | 77.2 (42.1) | 0.67 |
| Procedures today | 93.5 (24.8) | 94.1 (23.7) | 0.80 |
| Medication changes today | 66.3 (33.6) | 69.9 (46.0) | 0.44 |
| Consulting services | 69.3 (46.2) | 68.9 (46.4) | 0.93 |
| Expected discharge date | 67.5 (47.0) | 82.6 (38.0) | <0.001 |
| Responding clinician knowledge of nurse's name | 55.7 (49.8) | 85.6 (35.2) | <0.001 |
| Nurse's knowledge of responding clinician's name | 55.9 (49.8) | 87.9 (32.8) | <0.001 |
| Plan discussed | 72.9 (44.6) | 88.2 (32.3) | <0.001 |
Adverse Events
Of the 400 patients screened for AEs, 8 were excluded due to missing medical record number (5) and discharge outside of study period (3). Of the final 392 patient screens (198 pre, 194 post), there were no significant differences in patients' age, sex, race, language, length of stay, or Elixhauser score pre‐ versus postregionalization (Table 1).
Kappa scores for adjudicator agreement were 0.35 for presence of AE and 0.34 for preventability of AE. Of the 392 reviewed patient records, there were 133 total AEs detected (66 pre, 67 post), 27 preventable AEs (13 pre, 14 post), and 9 severe preventable AEs (4 pre, 5 post) (Table 3). There was no significant difference in the adjusted odds of preventable AEs post‐ versus preregionalization (adjusted odds ratio: 1.37, 95% confidence interval: 0.69, 2.69). Although the low number of AEs rated as severe or life threatening precluded adjusted analysis, unadjusted results similarly demonstrated no difference in odds of severe preventable AEs pre‐ versus postregionalization. As expected, there was no significant difference in adjusted odds of nonpreventable AE after implementation of regionalized care (Table 3).
| Adverse Events | No. of Adverse Events | Adjusted Odds Ratio Post vs Pre (95% CI) | |
|---|---|---|---|
| Pre, n = 198 | Post, n = 194 | ||
| |||
| Preventable | 13 | 14 | 1.37 (0.69, 2.69) |
| Serious and preventable | 4 | 5 | |
| Nonpreventable | 47 | 50 | 1.20 (0.85, 1.75) |
Similarly, there were no significant differences in category of preventable AE pre‐ versus postregionalization. The most frequent preventable AEs in both time periods were those related to adverse drug events and to manifestations of poor glycemic control, examples of which are illustrated (Table 4).
| |
| Adverse drug event | 29‐year‐old male with history of alcohol abuse, complicated by prior withdrawal seizures/emntensive care unit admissions, presented with alcohol withdrawal. Started on standing and PRN lorazepam, kept on home medications including standing clonidine, gabapentin, citalopram, quetiapine. Became somnolent due to polypharmacy, ultimately discontinued quetiapine as discovered took only as needed at home for insomnia |
| Manifestations of poor glycemic control | 78‐year‐old male with recently diagnosed lymphoma, distant history of bladder and prostate cancer status post ileal loop diversion, presented status post syncopal event; during event, spilled boiling water on himself leading to second‐degree burns on 3% of his body. Initially admitted to trauma/burn service, ultimately transferred to medical service for ongoing multiple medical issues including obstructive uropathy, acute on chronic renal failure. Adverse event was hyperglycemia (>350 mg/dL on >2 consecutive readings) in the setting of holding his home insulin detemir and insulin aspart (had been placed on insulin aspart sliding scale alone). After hyperglycemic episodes, was placed back on weight‐based basal/nutritional insulin |
DISCUSSION
In this study of general medicine patients at a large academic medical center, we found that regionalization of care teams on general medicine services was associated with improved recognition of care team members and agreement on estimated date of patient discharge, but was not associated with improvement in overall nurse and physician concordance of the patient care plan, or the odds of preventable AEs.
This intervention importantly addresses the barrier of dispersion of team membership, a well‐recognized barrier to interdisciplinary collaboration,[17, 18] particularly with resident physician teams due to frequently changing team membership. Localization of all team members, in addition to encouragement of daily collaborative bedside rounds as part of the regionalization initiative, likely contributed to our observed improvement in team member identification and discussion of daily care plans. Similarly, regionalization resulted in improved agreement in estimations of date of patient discharge. Focus on early patient discharges was an integral part of the implementation efforts; we therefore hypothesize that mutual focus on discharge planning by both nurses and responding clinicians may have explained this observed result.
On the other hand, regionalization did not appreciably improve the overall concordance of care plan between nurses and interns, despite a significant increase in team members agreeing that the plan had been discussed. Our findings support similar prior research demonstrating that regionalizing hospitalist attendings to single nursing units had limited impact on agreement of care plan between physicians and nurses.[13] Similarly, in settings where physicians and nurses are inherently regionalized, such as the intensive care unit[4] or the operating room,[3] communication between physicians and nurses remains difficult. Collectively, our findings suggest that colocalization of physicians and nurses alone is likely insufficient to improve measured communication between care team members. Existing literature suggests that more standardized approaches to improve communication, such as structured communication tools used during daily inpatient care[19, 20] or formalized team training,[21, 22, 23] lead to improvements in communication and collaboration. Despite these findings, it is important to highlight that this study did not assess other measures of workplace culture, such as teamwork and care team cohesiveness, which may have been positively affected by this intervention, even without measurable effect on concordance of care plan. Additionally, as noted, the average daily census on each team increased by almost a third postintervention, which may have impeded improvements in care team communication.
In addition, we found that our intervention had no significant impact on preventable AEs or severe preventable AEs. Although we cannot exclude the possibility that more subtle AEs were missed with our methodology, our results indicate that regionalized care alone may be inadequate to improve major patient safety outcomes. As discussed, the volume of patients did increase postintervention; thus, another way to state our results is that we were able to increase the daily volume of patients without any significant decreases in patient safety. Nevertheless, the results on patient safety were less than desired. A recent review of interdisciplinary team care interventions on general medical wards similarly demonstrated underwhelming improvements in patient safety outcomes, although the reviewed interventions did not specifically address preventable AEs, a gap in the literature commented on by the authors.[24] Other albeit limited literature has demonstrated improvement in patient safety outcomes via multifaceted efforts aimed at improving care team member communication. Notably, these efforts include colocalization of care team members to single units but also involve additional measures to improve communication and collaboration between care team members, such as structured communication during interdisciplinary rounds, and certification of key interdisciplinary teamwork skills.[11, 14] Although our regionalized care intervention included many similar features to these accountable care units (ACUs) including unit‐based care teams, unit‐level performance reporting, and unit‐based physician and nursing coleadership, significant differences existed. Notably, in addition to the above features, the ACU model also incorporated highly structured communication models for interdisciplinary rounding, and certification processes to ensure an appropriate communication skill base among care team members.[14] Thus, although creation of regionalized care teams is likely a necessary precursor to implementation of these additional measures, alone it may be insufficient to improve patient safety outcomes.
Importantly, in our study we identified that adverse drug events and manifestations of poor glycemic control occurred in high frequency both before and following implementation of regionalized care, supporting other literature that describes the prevalence of these AEs.[11, 25, 26, 27] These results suggest that targeted interventions to address these specific AEs are likely necessary. Notably, the intervention units in our study did not consistently employ clinical pharmacists assigned specifically to that unit's care team to allow for integration within the care team. As prior research has suggested that greater collaboration with clinical pharmacists results in reduction of adverse drug events,[28] next steps may include improved integration of team‐based pharmacists into the activities of the regionalized care teams. Inpatient management of diabetes also requires specific interventions,[29, 30, 31] only some of which may be addressable by having regionalized care and better interdisciplinary communication.
Our findings are subject to several limitations. First, this was a single‐site study and thus our findings may not be generalizable to other institutions. However, regionalized care is increasingly encouraged to optimize communication between care team members.[17, 18] Therefore, our null findings may be pertinent to other institutions looking to improve patient safety outcomes, demonstrating that additional initiatives will likely be required. Second, our modes of outcome measurement possess limitations. In measuring concordance of care plan, although previously used survey techniques were employed,[9] the concordance survey has not been formally validated, and we believe some of the questions may have led to ambiguity on the part of the responders that may have resulted in less accurate responses, thus biasing toward the null. Similarly, in measuring AEs, the screening tool relied on retrospective chart review looking for specific AE types[11] and thus may not have captured more subtle AEs. Additionally, our study may have been underpowered to demonstrate significant reduction in preventable AEs, although other studies of similar methodology demonstrated significant results with similar sample size.[11] This was due in part to our lower‐than‐expected baseline AE rate (6.6% compared with approximately 10.3% in previous studies).[11] Lastly, our study solely examined the association of regionalization with concordance of care plan and preventable AEs, but importantly excluded other clinically important outcomes that may have been positively (or negatively) impacted by these regionalization efforts, such as ED wait times, provider efficiency (eg, fewer pages, less time in transit, more time at the bedside), interdisciplinary teamwork, or patient or provider satisfaction.
CONCLUSION
In summary, our findings suggest that regionalized care teams alone may be insufficient to effectively promote communication between care team members regarding the care plan or to lead to improvements in patient safety, although we recognize that there may have been benefits (or unintended harms) not measured in this study but are nonetheless important for clinical care and workplace culture. This is an important lesson, as many hospitals move toward regionalized care in an effort to improve patient safety outcomes. However, strengthening the infrastructure by colocalizing care team members to maximize opportunity for communication is likely a necessary first step toward facilitating implementation of additional initiatives that may lead to more robust patient safety improvements, such as structured interdisciplinary bedside rounds (eg, facilitating and training all team members to fulfill specific roles), teamwork training, and certification of key interdisciplinary teamwork skills. Additionally, close examination of identified prevalent and preventable AEs can help to determine which additional initiatives are most likely to have greatest impact in improving patient safety.
Disclosures: This research was supported by funds provided by Brigham and Women's Hospital (BWH) and by funds provided by the Department of Medicine at BWH. All authors had full access to all of the data in the study and were integrally involved in the design, implementation, data collection, and analyses. The first author, Dr. Stephanie Mueller, takes responsibility for the integrity for the data and the accuracy of the data analysis. Dr. Schnipper reports grants from Sanofi Aventis, outside the submitted work.
- Joint Commission on Accreditation of Healthcare Organizations. Understanding and Preventing Sentinel Events in Your Health Care Organization. Oak Brook, IL: Joint Commission; 2008.
- , , , et al. Communication failures in the operating room: an observational classification of recurrent types and effects. Qual Saf Health Care. 2004;13(5):330–334.
- , , , et al. Operating room teamwork among physicians and nurses: teamwork in the eye of the beholder. J Am Coll Surg. 2006;202(5):746–752.
- , , . Discrepant attitudes about teamwork among critical care nurses and physicians. Crit Care Med. 2003;31(3):956–959.
- , , , , . Communication failures in patient sign‐out and suggestions for improvement: a critical incident analysis. Qual Saf Health Care. 2005;14(6):401–407.
- , , , et al. Changes in medical errors after implementation of a handoff program. N Engl J Med. 2014;371(19):1803–1812.
- , , , et al. Communication and information deficits in patients discharged to rehabilitation facilities: an evaluation of five acute care hospitals. J Hosp Med. 2009;4(8):E28–E33.
- , , , , , . Deficits in communication and information transfer between hospital‐based and primary care physicians: implications for patient safety and continuity of care. JAMA. 2007;297(8):831–841.
- , , , et al. Patterns of nurse‐physician communication and agreement on the plan of care. Qual Saf Health Care. 2010;19(3):195–199.
- , , , , , . Can we talk? Priorities for patient care differed among health care providers. In: Henriksen K, Battles JB, Marks ES, Lewin DI, eds. Advances in Patient Safety: From Research to Implementation. Vol 1. Rockville, MD: Agency for Healthcare Research and Quality; 2005.
- , , , et al. Structured interdisciplinary rounds in a medical teaching unit: improving patient safety. Arch Intern Med. 2011;171(7):678–684.
- , , , , , . Improving teamwork: impact of structured interdisciplinary rounds on a hospitalist unit. J Hosp Med. 2011;6(2):88–93.
- , , , et al. Impact of localizing physicians to hospital units on nurse‐physician communication and agreement on the plan of care. J Gen Intern Med. 2009;24(11):1223–1227.
- , , , et al. Reorganizing a hospital ward as an accountable care unit. J Hosp Med. 2015;10(1):36–40.
- , , , et al. 5th time's a charm: creation of unit‐based care teams in a high occupancy hospital [abstract]. J Hosp Med. 2015;10 (suppl. 2). Available at: http://www.shmabstracts.com/abstract/5th‐times‐a‐charm‐creation‐of‐unit‐based‐care‐teams‐in‐a‐high‐occupancy‐hospital. Accessed July 28, 2015.
- , , , . Comorbidity measures for use with administrative data. Med Care. 1998;36(1):8–27.
- , , , , , . Teamwork on inpatient medical units: assessing attitudes and barriers. Qual Saf Health Care. 2010;19(2):117–121.
- , , , et al. A model for quality improvement programs in academic departments of medicine. Am J Med. 2008;121(10):922–929.
- , , , , . Improving nurse‐physician communication and satisfaction in the intensive care unit with a daily goals worksheet. Am J Crit Care. 2006;15(2):217–222.
- , , , , , . Improving communication in the ICU using daily goals. J Crit Care. 2003;18(2):71–75.
- , , , et al. Effect of crew resource management training in a multidisciplinary obstetrical setting. Int J Qual Health Care. 2008;20(4):254–263.
- , , , et al. Error reduction and performance improvement in the emergency department through formal teamwork training: evaluation results of the MedTeams project. Health Serv Res. 2002;37(6):1553–1581.
- , , , et al. Effects of teamwork training on adverse outcomes and process of care in labor and delivery: a randomized controlled trial. Obstet Gynecol. 2007;109(1):48–55.
- , , , et al. Effects of interdisciplinary team care interventions on general medical wards: a systematic review. JAMA Intern Med. 2015;175(8):1288–1298.
- , , , et al. Patient risk factors for adverse drug events in hospitalized patients. ADE Prevention Study Group. Arch Intern Med. 1999;159(21):2553–2560.
- , , , et al. Effect of a pharmacist intervention on clinically important medication errors after hospital discharge: a randomized trial. Ann Intern Med. 2012;157(1):1–10.
- , , , . Use of a standardized protocol to decrease medication errors and adverse events related to sliding scale insulin. Qual Saf Health Care. 2006;15(2):89–91.
- , , , . Clinical pharmacists and inpatient medical care: a systematic review. Arch Intern Med. 2006;166(9):955–964.
- , , , , . Improved inpatient use of basal insulin, reduced hypoglycemia, and improved glycemic control: effect of structured subcutaneous insulin orders and an insulin management algorithm. J Hosp Med. 2009;4(1):3–15.
- , , , . Effects of a computerized order set on the inpatient management of hyperglycemia: a cluster‐randomized controlled trial. Endocr Pract. 2010;16(2):209–218.
- , , , . Effects of a subcutaneous insulin protocol, clinical education, and computerized order set on the quality of inpatient management of hyperglycemia: results of a clinical trial. J Hosp Med. 2009;4(1):16–27.

Damage to nearby structure common cause of hernia malpractice claim
JACKSONVILLE, FLA. – General surgeons are among the most sued physicians, and hernia repair is one of the most common operations they perform, so a study was conducted to drill down into the legal data on hernia repair to determine what about the operation is most likely to get surgeons in trouble.
They found that a failure to diagnose a complication caused by damage to a nearby structure during the operation was the most common cause for a malpractice suit for hernia repair, Dr. Nadeem Haddad of the Mayo Clinic in Rochester, Minn., reported at the Association for Academic Surgery/Society of University Surgeons Academic Surgical Congress.
“Hernia repair with more than 1 million cases annually is one of the most common surgical procedures,” Dr. Haddad said. “The most common type of operation for malpractice was inguinal hernia repair. The majority of cases were elective cases where the informed consent was not breached.”
The researchers sampled data on 250 malpractice cases arising from hernia surgery filed with the Westlaw Next legal database between 1985 and 2015, Dr. Haddad said. He added that the sample is not inclusive of all malpractice cases related to hernia repair in that time. “Our objective was to analyze reasons for litigation related to hernia repairs,” he said.
Among the hernia cases from the database, physicians (defendants) won 59%, patients (plaintiffs) won around 27%, and the remainder went to settlement before a verdict. Award payments ranged from $10,000 for a case where a Penrose drain was left in the patient to $16 million in the case of death of an infant due to perioperative hyperkalemia.
Eighty-four percent of the cases in the study involved inguinal or ventral hernia repair, Dr. Haddad said, but the Westlaw Next database did not differentiate between the two types of procedures. Nor did it separate out pediatric or adult repairs. Westlaw Next provides the alleged reason for litigation and gives details about lawsuits. The researchers classified the alleged reasons for the lawsuits based on the time period in which they happened: preoperatively, intraoperatively, and postoperatively.
“The single most common reason for malpractice in hernia repair was failure to diagnose a complication following damage to a surrounding structure,” Dr. Haddad said.
The state of New York had the highest number of medical malpractice cases (46), followed closely by California (42). In 15% of cases (38) the patients claimed a breach of informed consent by the surgeon
“While understanding the reasons why surgeons go to trial, the risk of future lawsuits may lessen if measures are enacted to prevent such outcomes,” Dr. Haddad said. “Following protocols in diagnosis and management, attention to good surgical technique, and keeping a checklist of possible complications are some of the ways to improve patients safety and decrease chances of litigation.”
Dr. Haddad and coauthors had no financial relationships to disclose.
AT THE ANNUAL ACADEMIC SURGICAL CONGRESS
Key clinical point: Failure to diagnose a complication caused by damage to a nearby structure during hernia repair surgery is the most common cause for a malpractice claim for hernia repair.
Major finding: In malpractice cases involving hernia surgery that go to trial, 59% of the rulings are for the plaintiff physicians and about 14% go to settlement before a judge or jury decision.
Data source: Sample of 250 hernia surgical malpractice cases from 1985 to 2015 in the Westlaw Next legal database.
Disclosures: The study authors reported having no financial disclosures.
Potential biomarkers of gray matter damage in MS identified
NEW ORLEANS – Protein profiling of cerebrospinal fluid and MRI has revealed the involvement of exacerbated gray matter demyelination and brain atrophy in the progression of multiple sclerosis.
The pattern of the cerebrospinal fluid (CSF) biomarkers, which correspond to the extent of gray matter damage, have potential value in stratifying patients in terms of disease severity from the onset of multiple sclerosis (MS), Roberta Magliozzi, Ph.D., of the University of Verona (Italy) said at the meeting held by the Americas Committee for Treatment and Research in Multiple Sclerosis.

Gray matter atrophy and the accumulation of cortical lesions are central to the progressive clinical deterioration that occurs in MS. The damage involves a “compartmentalized immune response” featuring meningeal infiltration of certain immune cells, which is associated with increased cortical demyelination and meningeal inflammation. The gray matter damage and inflammation are harbingers of earlier onset and rapid progression of neurological damage in MS, and a more severe disease outcome.
“We sought to find a combination of CSF biomarkers [and] neuropathological and early neuroimaging correlates of disease progression in order to predict onset and rate of MS progression,” Dr. Magliozzi explained.
The investigators assessed gray matter damage with MRI and analyzed CSF proteins in 36 MS patients and 12 healthy controls and also acquired and analyzed meningeal and CSF samples after death from 20 individuals with secondary progressive MS (SPMS) and 10 healthy individuals to detect inflammatory mediators associated with meningeal infiltration that were released to the CSF.
MS patients with meningeal infiltration displayed more extensive gray matter demyelination and more rapid disease progression. They also demonstrated a “pronounced proinflammatory CSF profile” featuring overexpression of an array of molecules associated with chronic inflammation. Patients with less gray matter damage displayed a pattern of increased regulatory molecules. Consistent with the patient data, similar expression patterns were evident in the meninges and CSF samples of postmortem SPMS cases with a higher level of meningeal inflammation and gray matter demyelination.
“Meningeal infiltrates may represent the main source of intrathecal inflammatory activity mediating the gradient of cortical tissue injury since early disease stages and in progressive MS,” Dr. Magliozzi said.
The markedly different CSF profiles in patients with more and less extensive gray matter damage may be an exploitable characteristic to stratify patients early in the course of MS, with benefits in disease prognosis and monitoring, and treatment that is more rationally geared to the patient’s condition.
“The results indicate that we may be able to get an image-based functional profile of patients in relapse, which would be a phenomenal finding,” Dr. Jerry Wolinsky of the University of Texas Health Science Center at Houston, commented in a press conference following the presentation.
The study was funded by Progressive MS Alliance. Dr. Magliozzi had no disclosures.
NEW ORLEANS – Protein profiling of cerebrospinal fluid and MRI has revealed the involvement of exacerbated gray matter demyelination and brain atrophy in the progression of multiple sclerosis.
The pattern of the cerebrospinal fluid (CSF) biomarkers, which correspond to the extent of gray matter damage, have potential value in stratifying patients in terms of disease severity from the onset of multiple sclerosis (MS), Roberta Magliozzi, Ph.D., of the University of Verona (Italy) said at the meeting held by the Americas Committee for Treatment and Research in Multiple Sclerosis.
Gray matter atrophy and the accumulation of cortical lesions are central to the progressive clinical deterioration that occurs in MS. The damage involves a “compartmentalized immune response” featuring meningeal infiltration of certain immune cells, which is associated with increased cortical demyelination and meningeal inflammation. The gray matter damage and inflammation are harbingers of earlier onset and rapid progression of neurological damage in MS, and a more severe disease outcome.
“We sought to find a combination of CSF biomarkers [and] neuropathological and early neuroimaging correlates of disease progression in order to predict onset and rate of MS progression,” Dr. Magliozzi explained.
The investigators assessed gray matter damage with MRI and analyzed CSF proteins in 36 MS patients and 12 healthy controls and also acquired and analyzed meningeal and CSF samples after death from 20 individuals with secondary progressive MS (SPMS) and 10 healthy individuals to detect inflammatory mediators associated with meningeal infiltration that were released to the CSF.
MS patients with meningeal infiltration displayed more extensive gray matter demyelination and more rapid disease progression. They also demonstrated a “pronounced proinflammatory CSF profile” featuring overexpression of an array of molecules associated with chronic inflammation. Patients with less gray matter damage displayed a pattern of increased regulatory molecules. Consistent with the patient data, similar expression patterns were evident in the meninges and CSF samples of postmortem SPMS cases with a higher level of meningeal inflammation and gray matter demyelination.
“Meningeal infiltrates may represent the main source of intrathecal inflammatory activity mediating the gradient of cortical tissue injury since early disease stages and in progressive MS,” Dr. Magliozzi said.
The markedly different CSF profiles in patients with more and less extensive gray matter damage may be an exploitable characteristic to stratify patients early in the course of MS, with benefits in disease prognosis and monitoring, and treatment that is more rationally geared to the patient’s condition.
“The results indicate that we may be able to get an image-based functional profile of patients in relapse, which would be a phenomenal finding,” Dr. Jerry Wolinsky of the University of Texas Health Science Center at Houston, commented in a press conference following the presentation.
The study was funded by Progressive MS Alliance. Dr. Magliozzi had no disclosures.
AT ACTRIMS FORUM 2016
Key clinical point: The different CSF profiles in patients with more and less extensive gray matter damage may be useful to stratify patients early in the course of MS.
Major finding: Protein profiling of CSF and brain MRI has revealed the involvement of exacerbated gray matter demyelination and brain atrophy in the progression of multiple sclerosis.
Data source: A cohort study of 36 MS patients and 12 healthy controls and a postmortem study of 20 individuals with secondary progressive MS and 10 healthy individuals.
Disclosures: The study was funded by Progressive MS Alliance. Dr. Magliozzi had no disclosures.

Fibromyalgia doesn’t fit the disease model