User login
The Design and Evaluation of the Comprehensive Hospitalist Assessment and Mentorship with Portfolios (CHAMP) Ultrasound Program
Point-of-care ultrasound (POCUS) is a valuable tool to assist in the diagnosis and treatment of many common diseases.1-11 Its use has increased in clinical settings over the years, primarily because of more portable, economical, high-quality devices and training availability.12 POCUS improves procedural success and guides the diagnostic management of hospitalized patients.2,9-12 Literature details the training of medical students,13,14 residents,15-21 and providers in emergency medicine22 and critical care,23,24 as well as focused cardiac training with hospitalists.25-27 However, no literature exists describing a comprehensive longitudinal training program for hospitalists or skills retention.
This document details the hospital medicine department’s ultrasound training program from Regions Hospital, part of HealthPartners in Saint Paul, Minnesota, a large tertiary care medical center. We describe the development and effectiveness of the Comprehensive Hospitalist Assessment and Mentorship with Portfolios (CHAMP) Ultrasound Program. This approach is intended to support the development of POCUS training programs at other organizations.
The aim of the program was to build a comprehensive bedside ultrasound training paradigm for hospitalists. The primary objective of the study was to assess the program’s effect on skills over time. Secondary objectives were confidence ratings in the use of ultrasound and with various patient care realms (volume management, quality of physical exam, and ability to narrow the differential diagnosis). We hypothesized there would be higher retention of ultrasound skills in those who completed portfolios and/or monthly scanning sessions as well as increased confidence through all secondary outcome measures (see below).
MATERIALS AND METHODS
This was a retrospective descriptive report of hospitalists who entered the CHAMP Ultrasound Program. Study participants were providers from the 454-bed Regions Hospital in Saint Paul, Minnesota. The study was deemed exempt by the HealthPartners Institutional Review Board. Three discrete 3-day courses and two 1-day in-person courses held at the Regions Hospital Simulation Center (Saint Paul, Minnesota) were studied.
Program Description
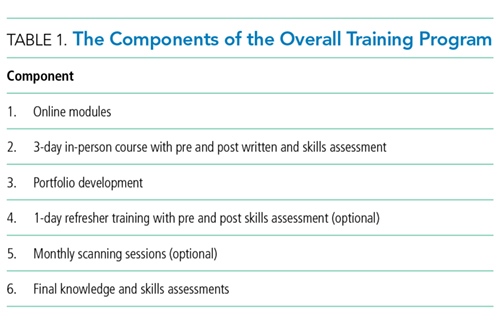
In 2014, a working group was developed in the hospital medicine department to support the hospital-wide POCUS committee with a charter to provide standardized training for providers to complete credentialing.28 The goal of the hospital medicine ultrasound program was to establish the use of ultrasound by credentialed hospitalists into well-defined applications integrated into the practice of hospital medicine. Two providers were selected to lead the efforts and completed additional training through the American College of Chest Physicians (CHEST) Certificate of Completion Program.29 An overall director was designated with the responsibilities delineated in supplementary Appendix 1. This director provided leadership on group practice, protocols, and equipment, creating the organizational framework for success with the training program. The hospital medicine training program had a 3-day in-person component built off the CHEST Critical Care Ultrasonography Program.24 The curriculum was adapted from the American College of Chest Physicians/Société de Réanimation de Langue Française Statement on Competence in Critical Care Ultrasonography.30 See Table 1 for the components of the training program.
Online Modules
3-Day In-Person Course with Assessments
The 3-day course provided 6 hours of didactics, 8 hours of image interpretation, and 9 hours of hands-on instruction (supplementary Appendix 4). Hospitalists first attended a large group didactic, followed by divided groups in image interpretation and hands-on scanning.24
Didactics were provided in a room with a 2-screen set up. Providers used 1 screen to present primary content and the other for simultaneously scanning a human model.
Image interpretation sessions were interactive smaller group learning forums in which participants reviewed high-yield images related to the care of hospital medicine patients and received feedback. Approximately 45 videos with normal and abnormal findings were reviewed during each session.
The hands-on scanning component was accomplished with human models and a faculty-to-participant ratio between 1:2 and
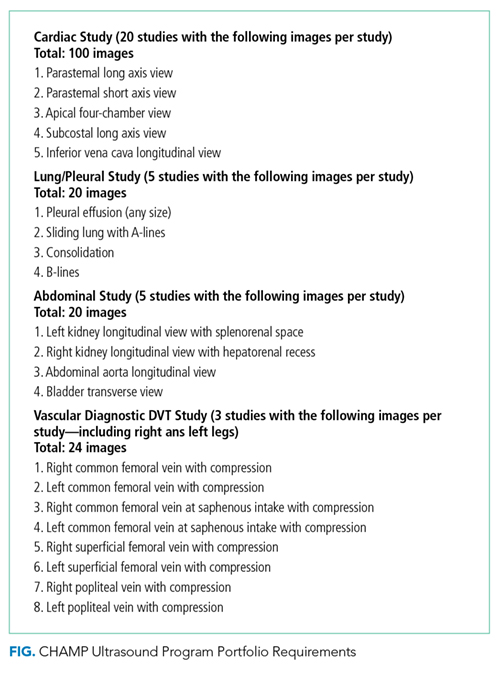
Portfolios
Refresher Training: 1-Day In-Person Course with Assessments and Monthly Scanning Sessions (Optional)
Only hospitalists who completed the 3-day course were eligible to take the 1-day in-person refresher course (supplementary Appendix 5). The first half of the course incorporated scanning with live human models, while the second half of the course had scanning with hospitalized patients focusing on pathology (pleural effusion, hydronephrosis, reduced left ventricular function, etc.). The course was offered at 3, 6, and 12 months after the initial 3-day course.
Monthly scanning sessions occurred for 2 hours every third Friday and were also available prior to the 1-day refresher. The first 90 minutes had a hands-on scanning component with hospitalized patients with faculty supervision (1:2 ratio). The last 30 minutes had an image interpretation component.
Assessments
Knowledge and skills assessment were adapted from the CHEST model (supplementary Appendix 6).24 Before and after the 3-day and 1-day in-person courses, the same hands-on skills assessment with a checklist was provided (supplementary Appendix 7). Before and after the 3-day course, a written knowledge assessment with case-based image interpretation was provided (supplementary Appendix 6).
Measurement
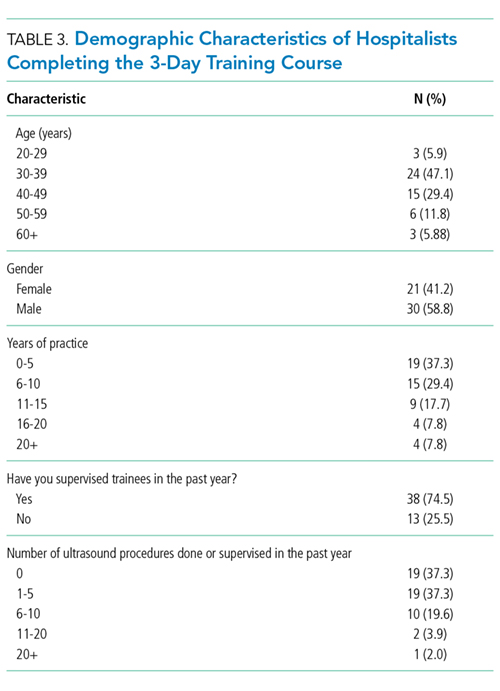
Participant demographic and clinical information was collected at the initial 3-day course for all participants, including age, gender, specialty, years of experience, and number and type of ultrasound procedures personally conducted or supervised in the past year. For skills assessment, a 20-item dichotomous checklist was developed and scored as done correctly or not done/done incorrectly. This same assessment was provided both before and after each of the 3-day and 1-day courses. A 20-question image-based knowledge assessment was also developed and administered both before and after the 3-day course only. The same 20-item checklist was used for the final skills examination. However, a new more detailed 50-question examination was written for the final examination after the portfolio of images was complete. Self-reported measures were confidence in the use of ultrasound, volume management, quality of physical exam, and ability to narrow the differential diagnosis. Confidence in ultrasound use, confidence in volume management, and quality of physical exam were assessed by using a questionnaire both before and after the 3-day course and 1-day course. Participants rated confidence and quality on a 5-point scale, 1 being least confident and 5 being most confident.
Statistical Analysis
Demographics of the included hospitalist population and pre and post 3-day assessments, including knowledge score, skills score, confidence in ultrasound use, confidence in volume management, and quality of physical exam, were summarized. Values for all assessment variables are presented as percentages. Confidence scores were reported as a percentage of the Likert scale (eg, 4/5 was reported as 80%). Skills and written examinations were expressed as percentages of items correct. Data were reported as median and interquartile range or means and standard deviation based on variable distributions. Differences between pre- and postvalues for 3-day course variables were assessed by using 2-sample paired Wilcoxon signed rank tests with a 95% confidence level.
For the subset of hospitalists who also completed the 1-day course, pre and post 1-day course assessments, including skills score, confidence in ultrasound use, confidence in volume management, and quality of physical exam, were summarized. Differences between pre- and postvalues for 1-day assessment variables were assessed by using 2-sample paired Wilcoxon signed rank tests with a 95% confidence level.
Multiple linear regression was performed with the change in skills assessment score from postcompletion of the 3-day course to precompletion of the 1-day course as the dependent variable. Hospitalists were split into 2 age groups (30-39 and 40-49) for the purpose of this analysis. The percent of monthly scanning sessions attended, age category, timing of 1-day course, and percent portfolio were assessed as possible predictors of the skills score by using simple linear regression with a P = .05 cutoff. A final model was chosen based on predictors significant in simple linear regression and included the percent of the portfolio completed and attendance of monthly scanning sessions.
RESULTS
Demographics
3-Day In-Person Course
For the 53 hospitalists who completed skills-based assessments, performance increased significantly after the 3-day course. Knowledge scores also increased significantly from preassessment to postassessment. Self-reported confidence ratings for ultrasound use, confidence in volume management, and quality of physical exam all increased significantly from preassessment to postassessment (Table 2).
Refresher Training: 1-Day In-Person Course
Because the refresher training was encouraged but not required, only 25 of 53 hospitalists, 23 with complete data, completed the 1-day course. For the 23 hospitalists who completed skills-based assessments before and after the 1-day course, mean skills scores increased significantly (Table 2). Self-reported confidence ratings for ultrasound use, confidence in volume management, and quality of physical exam all increased significantly from preassessment to postassessment (Table 2).
Monthly Scanning Sessions and Portfolio Development
The skills retention from initial course to refresher course by portfolio completion and monthly scanning sessions is shown in Table 2. Multiple regression analysis showed that for every 10% increase in the percent of monthly sessions attended, the mean change in skills score was 3.7% (P = .017), and for every 10% increase in the percent of portfolio completed, the mean change in skills score was 2.5% (P = .04), showing that both monthly scanning session attendance and portfolio completion are significantly predictive of skills retention over time.
Final Assessments
DISCUSSION
This is the first description of a successful longitudinal training program with assessments in POCUS for hospital medicine providers that shows an increase in skill retention with the use of a follow-up course and bedside scanning.
The CHAMP Ultrasound Program was developed to provide hospital medicine clinicians with a specialty focused in-house training pathway in POCUS and to assist in sustained skills acquisition by providing opportunities for regular feedback and practice. Practice with regular expert feedback is a critical aspect to develop and maintain skills in POCUS.32,33 Arntfield34 described the utility of remote supervision with feedback for ultrasound training in critical care, which demonstrated varying learning curves in the submission of portfolio images.35,36 The CHAMP Ultrasound training program provided expert oversight, longitudinal supervision, and feedback for course participants. The educational method of mastery learning was employed by setting minimum standards and allowing learners to practice until they met that standard.37-39
This unique program is made possible by the availability of expert-level faculty. Assessment scores improved with an initial 3-day course; however, they also decayed over time, most prominently with hospitalists that did not continue with POCUS scanning after their initial course. Ironically, those who performed more ultrasounds in the year prior to beginning the 3-day course had lower confidence ratings, likely explained by their awareness of their limitations and opportunities for improvement. The incorporation of refresher training to supplement the core 3-day course and portfolio development are key additions that differentiate this training program. These additions and the demonstration of successful training make this a durable pathway for other hospitalist programs. There are many workshops and short courses for medical students, residents, and practicing providers in POCUS.40-43 However, without an opportunity for longitudinal supervision and feedback, there is a noted decrease in the skills for participants. The refresher training with its 2 components (1-day in-person course and monthly scanning sessions) provides evidence of the value of mentored training.
In the initial program development, refresher training was encouraged but optional. We intentionally tracked those that completed refresher training compared with those that did not. Based on the results showing significant skills retention among those attending some form of refresher training, the program is planned to change to make this a requirement. We recommend refresher training within 12 months of the initial introductory course. There were several hospitalists that were unable to accommodate taking a full-day refresher course and, therefore, monthly scanning sessions were provided as an alternative.
The main limitation of the study is that it was completed in a single hospital system with available training mentors in POCUS. This gave us the ability to perform longitudinal training but may make this less reproducible in other hospital systems. Another limitation is that our course participants did not complete the pre- and postknowledge assessments for the refresher training components of the program, though they did for the initial 3-day course. Our pre- and postassessments have not been externally shown to produce valid data, though they are based on the already validated CHEST ultrasound data.44
Finally, our CHAMP Ultrasound Program required a significant time commitment by both faculty and learners. A relatively small percentage of hospitalists have completed the final assessments. The reasons are multifactorial, including program rigor, desire by certain hospitalists to know the basics but not pursue more expertise, and the challenges of developing a skillset that takes dedicated practice over time. We have aimed to address these barriers by providing additional hands-on scanning opportunities, giving timely feedback with portfolios, and obtaining more ultrasound machines. We expect more hospitalists to complete the final assessments in the coming year as evidenced by portfolio submissions to the shared online portal and many choosing to attend either the monthly scanning sessions and/or the 1-day course. We recognize that other institutions may need to adapt our program to suit their local environment.
CONCLUSION
A comprehensive longitudinal ultrasound training program including competency assessments significantly improved ultrasound acquisition skills with hospitalists. Those attending monthly scanning sessions and participating in the portfolio completion as well as a refresher course significantly retained and augmented their skills.
Acknowledgments
The authors would like to acknowledge Kelly Logue, Jason Robertson, MD, Jerome Siy, MD, Shauna Baer, and Jack Dressen for their support in the development and implementation of the POCUS program in hospital medicine.
Disclosure
The authors do not have any relevant financial disclosures to report.
1. Spevack R, Al Shukairi M, Jayaraman D, Dankoff J, Rudski L, Lipes J. Serial lung and IVC ultrasound in the assessment of congestive heart failure. Crit Ultrasound J. 2017;9:7-13. PubMed
2. Soni NJ, Franco R, Velez M, et al. Ultrasound in the diagnosis and management of pleural effusions. J Hosp Med. 2015 Dec;10(12):811-816. PubMed
3. Boyd JH, Sirounis D, Maizel J, Slama M. Echocardiography as a guide for fluid management. Crit Care. 2016;20(1):274-280. PubMed
4. Mantuani D, Frazee BW, Fahimi J, Nagdev A. Point-of-care multi-organ ultrasound improves diagnostic accuracy in adults presenting to the emergency department with acute dyspnea. West J Emerg Med. 2016;17(1):46-53. PubMed
5. Glockner E, Christ M, Geier F, et al. Accuracy of Point-of-Care B-Line Lung Ultrasound in Comparison to NT-ProBNP for Screening Acute Heart Failure. Ultrasound Int Open. 2016;2(3):E90-E92. PubMed
6. Bhagra A, Tierney DM, Sekiguchi H, Soni NH. Point-of-Care Ultrasonography for Primary Care Physicians and General Internists. Mayo Clin Proc. 2016 Dec;91(12):1811-1827. PubMed
7. Crisp JG, Lovato LM, Jang TB. Compression ultrasonography of the lower extremity with portable vascular ultrasonography can accurately detect deep venous thrombosis in the emergency department. Ann Emerg Med. 2010;56(6):601-610. PubMed
8. Squire BT, Fox JC, Anderson C. ABSCESS: Applied bedside sonography for convenient. Evaluation of superficial soft tissue infections. Acad Emerg Med. 2005;12(7):601-606. PubMed
9. Narasimhan M, Koenig SJ, Mayo PH. A Whole-Body Approach to Point of Care Ultrasound. Chest. 2016;150(4):772-776. PubMed
10. Copetti R, Soldati G, Copetti P. Chest sonography: a useful tool to differentiate acute cardiogenic pulmonary edema from acute respiratory distress syndrome. Cardiovasc Ultrasound. 2008;6:16-25. PubMed
11. Soni NJ, Arntfield R, Kory P. Point of Care Ultrasound. Philadelphia: Elsevier Saunders; 2015.
12. Moore CL, Copel JA. Point-of-Care Ultrasonography. N Engl J Med. 2011;364(8):749-757. PubMed
13. Rempell JS, Saldana F, DiSalvo D, et al. Pilot Point-of-Care Ultrasound Curriculum at Harvard Medical School: Early Experience. West J Emerg Med. 2016;17(6):734-740. doi:10.5811/westjem.2016.8.31387. PubMed
14. Heiberg J, Hansen LS, Wemmelund K, et al. Point-of-Care Clinical Ultrasound for Medical Students. Ultrasound Int Open. 2015;1(2):E58-E66. doi:10.1055/s-0035-1565173. PubMed
15. Razi R, Estrada JR, Doll J, Spencer KT. Bedside hand-carried ultrasound by internal medicine residents versus traditional clinical assessment for the identification of systolic dysfunction in patients admitted with decompensated heart failure. J Am Soc Echocardiogr. 2011;24(12):1319-1324. PubMed
16. Alexander JH, Peterson ED, Chen AY, Harding TM, Adams DB, Kisslo JA Jr. Feasibility of point-of-care echocardiography by internal medicine house staff. Am Heart J. 2004;147(3):476-481. PubMed
17. Hellmann DB, Whiting-O’Keefe Q, Shapiro EP, Martin LD, Martire C, Ziegelstein RC. The rate at which residents learn to use hand-held echocardiography at the bedside. Am J Med. 2005;118(9):1010-1018. PubMed
18. Kimura BJ, Amundson SA, Phan JN, Agan DL, Shaw DJ. Observations during development of an internal medicine residency training program in cardiovascular limited ultrasound examination. J Hosp Med. 2012;7(7):537-542. PubMed
19. Akhtar S, Theodoro D, Gaspari R, et al. Resident training in emergency ultrasound: consensus recommendations from the 2008 Council of Emergency Medicine Residency Directors Conference. Acad Emerg Med. 2009;16(s2):S32-S36. PubMed
, , , , , . Can emergency medicine residents detect acute deep venous thrombosis with a limited, two-site ultrasound examination? J Emerg Med. 2007;32(2):197-200. PubMed
, , , . Resident-performed compression ultrasonography for the detection of proximal deep vein thrombosis: fast and accurate. Acad Emerg Med. 2004;11(3):319-322. PubMed
22. Mandavia D, Aragona J, Chan L, et al. Ultrasound training for emergency physicians—a prospective study. Acad Emerg Med. 2000;7(9):1008-1014. PubMed
23. Koenig SJ, Narasimhan M, Mayo PH. Thoracic ultrasonography for the pulmonary specialist. Chest. 2011;140(5):1332-1341. doi: 10.1378/chest.11-0348. PubMed
24. Greenstein YY, Littauer R, Narasimhan M, Mayo PH, Koenig SJ. Effectiveness of a Critical Care Ultrasonography Course. Chest. 2017;151(1):34-40. doi:10.1016/j.chest.2016.08.1465. PubMed
25. Martin LD, Howell EE, Ziegelstein RC, Martire C, Shapiro EP, Hellmann DB. Hospitalist performance of cardiac hand-carried ultrasound after focused training. Am J Med. 2007;120(11):1000-1004. PubMed
26. Martin LD, Howell EE, Ziegelstein RC, et al.
27. Lucas BP, Candotti C, Margeta B, et al. Diagnostic accuracy of hospitalist-performed hand-carried ultrasound echocardiography after a brief training program. J Hosp Med. 2009;4(6):340-349. PubMed
28.
29. Critical Care Ultrasonography Certificate of Completion Program. American College of Chest Physicians. http://www.chestnet.org/Education/Advanced-Clinical-Training/Certificate-of-Completion-Program/Critical-Care-Ultrasonography. Accessed March 30, 2017
30. Mayo PH, Beaulieu Y, Doelken P, et al. American College of Chest Physicians/Société de Réanimation de Langue Française statement on competence in critical care ultrasonography. Chest. 2009;135(4):1050-1060. PubMed
31. Donlon TF, Angoff WH. The scholastic aptitude test. The College Board Admissions Testing Program; 1971:15-47.
32. Ericsson KA, Lehmann AC. Expert and exceptional performance: Evidence of maximal adaptation to task constraints. Annu Rev Psychol. 1996;47:273-305. PubMed
33. Ericcson KA, Krampe RT, Tesch-Romer C. The role of deliberate practice in the acquisition of expert performance. Psychol Rev. 1993;100(3):363-406.
34. Arntfield RT. The utility of remote supervision with feedback as a method to deliver high-volume critical care ultrasound training. J Crit Care. 2015;30(2):441.e1-e6. PubMed
35. Ma OJ, Gaddis G, Norvell JG, Subramanian S. How fast is the focused assessment with sonography for trauma examination learning curve? Emerg Med Australas. 2008;20(1):32-37. PubMed
36. Gaspari RJ, Dickman E, Blehar D. Learning curve of bedside ultrasound of the gallbladder. J Emerg Med. 2009;37(1):51-66. doi:10.1016/j.jemermed.2007.10.070. PubMed
37. Barsuk JH, McGaghie WC, Cohen ER, Balachandran JS, Wane DB. Use of simulation-based mastery learning to improve quality of central venous catheter placement in a medical intensive care unit. J Hosp Med. 2009:4(7):397-403. PubMed
38. McGaghie WC, Issenberg SB, Cohen ER, Barsuk JH, Wayne DB. A critical review of simulation-based mastery learning with translational outcomes. Med Educ. 2014:48(4):375-385. PubMed
39. Guskey TR. The essential elements of mastery learning. J Classroom Interac. 1987;22:19-22.
40. Ultrasound Institute. Introduction to Primary Care Ultrasound. University of South Carolina School of Medicine. http://ultrasoundinstitute.med.sc.edu/UIcme.asp. Accessed October 24, 2017.
41. Society of Critical Care Medicine. Live Critical Care Ultrasound: Adult. http://www.sccm.org/Education-Center/Ultrasound/Pages/Fundamentals.aspx. Accessed October 24, 2017.
42. Castlefest Ultrasound Event. Castlefest 2018. http://castlefest2018.com/. Accessed October 24, 2017.
43. Office of Continuing Medical Education. Point of Care Ultrasound Workshop. UT Health San Antonio Joe R. & Teresa Lozano Long School of Medicine. http://cme.uthscsa.edu/ultrasound.asp. Accessed October 24, 2017.
44. Patrawalla P, Eisen LA, Shiloh A, et al. Development and Validation of an Assessment Tool for Competency in Critical Care Ultrasound. J Grad Med Educ. 2015;7(4):567-573. PubMed
Point-of-care ultrasound (POCUS) is a valuable tool to assist in the diagnosis and treatment of many common diseases.1-11 Its use has increased in clinical settings over the years, primarily because of more portable, economical, high-quality devices and training availability.12 POCUS improves procedural success and guides the diagnostic management of hospitalized patients.2,9-12 Literature details the training of medical students,13,14 residents,15-21 and providers in emergency medicine22 and critical care,23,24 as well as focused cardiac training with hospitalists.25-27 However, no literature exists describing a comprehensive longitudinal training program for hospitalists or skills retention.
This document details the hospital medicine department’s ultrasound training program from Regions Hospital, part of HealthPartners in Saint Paul, Minnesota, a large tertiary care medical center. We describe the development and effectiveness of the Comprehensive Hospitalist Assessment and Mentorship with Portfolios (CHAMP) Ultrasound Program. This approach is intended to support the development of POCUS training programs at other organizations.
The aim of the program was to build a comprehensive bedside ultrasound training paradigm for hospitalists. The primary objective of the study was to assess the program’s effect on skills over time. Secondary objectives were confidence ratings in the use of ultrasound and with various patient care realms (volume management, quality of physical exam, and ability to narrow the differential diagnosis). We hypothesized there would be higher retention of ultrasound skills in those who completed portfolios and/or monthly scanning sessions as well as increased confidence through all secondary outcome measures (see below).
MATERIALS AND METHODS
This was a retrospective descriptive report of hospitalists who entered the CHAMP Ultrasound Program. Study participants were providers from the 454-bed Regions Hospital in Saint Paul, Minnesota. The study was deemed exempt by the HealthPartners Institutional Review Board. Three discrete 3-day courses and two 1-day in-person courses held at the Regions Hospital Simulation Center (Saint Paul, Minnesota) were studied.
Program Description
In 2014, a working group was developed in the hospital medicine department to support the hospital-wide POCUS committee with a charter to provide standardized training for providers to complete credentialing.28 The goal of the hospital medicine ultrasound program was to establish the use of ultrasound by credentialed hospitalists into well-defined applications integrated into the practice of hospital medicine. Two providers were selected to lead the efforts and completed additional training through the American College of Chest Physicians (CHEST) Certificate of Completion Program.29 An overall director was designated with the responsibilities delineated in supplementary Appendix 1. This director provided leadership on group practice, protocols, and equipment, creating the organizational framework for success with the training program. The hospital medicine training program had a 3-day in-person component built off the CHEST Critical Care Ultrasonography Program.24 The curriculum was adapted from the American College of Chest Physicians/Société de Réanimation de Langue Française Statement on Competence in Critical Care Ultrasonography.30 See Table 1 for the components of the training program.
Online Modules
3-Day In-Person Course with Assessments
The 3-day course provided 6 hours of didactics, 8 hours of image interpretation, and 9 hours of hands-on instruction (supplementary Appendix 4). Hospitalists first attended a large group didactic, followed by divided groups in image interpretation and hands-on scanning.24
Didactics were provided in a room with a 2-screen set up. Providers used 1 screen to present primary content and the other for simultaneously scanning a human model.
Image interpretation sessions were interactive smaller group learning forums in which participants reviewed high-yield images related to the care of hospital medicine patients and received feedback. Approximately 45 videos with normal and abnormal findings were reviewed during each session.
The hands-on scanning component was accomplished with human models and a faculty-to-participant ratio between 1:2 and
Portfolios
Refresher Training: 1-Day In-Person Course with Assessments and Monthly Scanning Sessions (Optional)
Only hospitalists who completed the 3-day course were eligible to take the 1-day in-person refresher course (supplementary Appendix 5). The first half of the course incorporated scanning with live human models, while the second half of the course had scanning with hospitalized patients focusing on pathology (pleural effusion, hydronephrosis, reduced left ventricular function, etc.). The course was offered at 3, 6, and 12 months after the initial 3-day course.
Monthly scanning sessions occurred for 2 hours every third Friday and were also available prior to the 1-day refresher. The first 90 minutes had a hands-on scanning component with hospitalized patients with faculty supervision (1:2 ratio). The last 30 minutes had an image interpretation component.
Assessments
Knowledge and skills assessment were adapted from the CHEST model (supplementary Appendix 6).24 Before and after the 3-day and 1-day in-person courses, the same hands-on skills assessment with a checklist was provided (supplementary Appendix 7). Before and after the 3-day course, a written knowledge assessment with case-based image interpretation was provided (supplementary Appendix 6).
Measurement
Participant demographic and clinical information was collected at the initial 3-day course for all participants, including age, gender, specialty, years of experience, and number and type of ultrasound procedures personally conducted or supervised in the past year. For skills assessment, a 20-item dichotomous checklist was developed and scored as done correctly or not done/done incorrectly. This same assessment was provided both before and after each of the 3-day and 1-day courses. A 20-question image-based knowledge assessment was also developed and administered both before and after the 3-day course only. The same 20-item checklist was used for the final skills examination. However, a new more detailed 50-question examination was written for the final examination after the portfolio of images was complete. Self-reported measures were confidence in the use of ultrasound, volume management, quality of physical exam, and ability to narrow the differential diagnosis. Confidence in ultrasound use, confidence in volume management, and quality of physical exam were assessed by using a questionnaire both before and after the 3-day course and 1-day course. Participants rated confidence and quality on a 5-point scale, 1 being least confident and 5 being most confident.
Statistical Analysis
Demographics of the included hospitalist population and pre and post 3-day assessments, including knowledge score, skills score, confidence in ultrasound use, confidence in volume management, and quality of physical exam, were summarized. Values for all assessment variables are presented as percentages. Confidence scores were reported as a percentage of the Likert scale (eg, 4/5 was reported as 80%). Skills and written examinations were expressed as percentages of items correct. Data were reported as median and interquartile range or means and standard deviation based on variable distributions. Differences between pre- and postvalues for 3-day course variables were assessed by using 2-sample paired Wilcoxon signed rank tests with a 95% confidence level.
For the subset of hospitalists who also completed the 1-day course, pre and post 1-day course assessments, including skills score, confidence in ultrasound use, confidence in volume management, and quality of physical exam, were summarized. Differences between pre- and postvalues for 1-day assessment variables were assessed by using 2-sample paired Wilcoxon signed rank tests with a 95% confidence level.
Multiple linear regression was performed with the change in skills assessment score from postcompletion of the 3-day course to precompletion of the 1-day course as the dependent variable. Hospitalists were split into 2 age groups (30-39 and 40-49) for the purpose of this analysis. The percent of monthly scanning sessions attended, age category, timing of 1-day course, and percent portfolio were assessed as possible predictors of the skills score by using simple linear regression with a P = .05 cutoff. A final model was chosen based on predictors significant in simple linear regression and included the percent of the portfolio completed and attendance of monthly scanning sessions.
RESULTS
Demographics
3-Day In-Person Course
For the 53 hospitalists who completed skills-based assessments, performance increased significantly after the 3-day course. Knowledge scores also increased significantly from preassessment to postassessment. Self-reported confidence ratings for ultrasound use, confidence in volume management, and quality of physical exam all increased significantly from preassessment to postassessment (Table 2).
Refresher Training: 1-Day In-Person Course
Because the refresher training was encouraged but not required, only 25 of 53 hospitalists, 23 with complete data, completed the 1-day course. For the 23 hospitalists who completed skills-based assessments before and after the 1-day course, mean skills scores increased significantly (Table 2). Self-reported confidence ratings for ultrasound use, confidence in volume management, and quality of physical exam all increased significantly from preassessment to postassessment (Table 2).
Monthly Scanning Sessions and Portfolio Development
The skills retention from initial course to refresher course by portfolio completion and monthly scanning sessions is shown in Table 2. Multiple regression analysis showed that for every 10% increase in the percent of monthly sessions attended, the mean change in skills score was 3.7% (P = .017), and for every 10% increase in the percent of portfolio completed, the mean change in skills score was 2.5% (P = .04), showing that both monthly scanning session attendance and portfolio completion are significantly predictive of skills retention over time.
Final Assessments
DISCUSSION
This is the first description of a successful longitudinal training program with assessments in POCUS for hospital medicine providers that shows an increase in skill retention with the use of a follow-up course and bedside scanning.
The CHAMP Ultrasound Program was developed to provide hospital medicine clinicians with a specialty focused in-house training pathway in POCUS and to assist in sustained skills acquisition by providing opportunities for regular feedback and practice. Practice with regular expert feedback is a critical aspect to develop and maintain skills in POCUS.32,33 Arntfield34 described the utility of remote supervision with feedback for ultrasound training in critical care, which demonstrated varying learning curves in the submission of portfolio images.35,36 The CHAMP Ultrasound training program provided expert oversight, longitudinal supervision, and feedback for course participants. The educational method of mastery learning was employed by setting minimum standards and allowing learners to practice until they met that standard.37-39
This unique program is made possible by the availability of expert-level faculty. Assessment scores improved with an initial 3-day course; however, they also decayed over time, most prominently with hospitalists that did not continue with POCUS scanning after their initial course. Ironically, those who performed more ultrasounds in the year prior to beginning the 3-day course had lower confidence ratings, likely explained by their awareness of their limitations and opportunities for improvement. The incorporation of refresher training to supplement the core 3-day course and portfolio development are key additions that differentiate this training program. These additions and the demonstration of successful training make this a durable pathway for other hospitalist programs. There are many workshops and short courses for medical students, residents, and practicing providers in POCUS.40-43 However, without an opportunity for longitudinal supervision and feedback, there is a noted decrease in the skills for participants. The refresher training with its 2 components (1-day in-person course and monthly scanning sessions) provides evidence of the value of mentored training.
In the initial program development, refresher training was encouraged but optional. We intentionally tracked those that completed refresher training compared with those that did not. Based on the results showing significant skills retention among those attending some form of refresher training, the program is planned to change to make this a requirement. We recommend refresher training within 12 months of the initial introductory course. There were several hospitalists that were unable to accommodate taking a full-day refresher course and, therefore, monthly scanning sessions were provided as an alternative.
The main limitation of the study is that it was completed in a single hospital system with available training mentors in POCUS. This gave us the ability to perform longitudinal training but may make this less reproducible in other hospital systems. Another limitation is that our course participants did not complete the pre- and postknowledge assessments for the refresher training components of the program, though they did for the initial 3-day course. Our pre- and postassessments have not been externally shown to produce valid data, though they are based on the already validated CHEST ultrasound data.44
Finally, our CHAMP Ultrasound Program required a significant time commitment by both faculty and learners. A relatively small percentage of hospitalists have completed the final assessments. The reasons are multifactorial, including program rigor, desire by certain hospitalists to know the basics but not pursue more expertise, and the challenges of developing a skillset that takes dedicated practice over time. We have aimed to address these barriers by providing additional hands-on scanning opportunities, giving timely feedback with portfolios, and obtaining more ultrasound machines. We expect more hospitalists to complete the final assessments in the coming year as evidenced by portfolio submissions to the shared online portal and many choosing to attend either the monthly scanning sessions and/or the 1-day course. We recognize that other institutions may need to adapt our program to suit their local environment.
CONCLUSION
A comprehensive longitudinal ultrasound training program including competency assessments significantly improved ultrasound acquisition skills with hospitalists. Those attending monthly scanning sessions and participating in the portfolio completion as well as a refresher course significantly retained and augmented their skills.
Acknowledgments
The authors would like to acknowledge Kelly Logue, Jason Robertson, MD, Jerome Siy, MD, Shauna Baer, and Jack Dressen for their support in the development and implementation of the POCUS program in hospital medicine.
Disclosure
The authors do not have any relevant financial disclosures to report.
1. Spevack R, Al Shukairi M, Jayaraman D, Dankoff J, Rudski L, Lipes J. Serial lung and IVC ultrasound in the assessment of congestive heart failure. Crit Ultrasound J. 2017;9:7-13. PubMed
2. Soni NJ, Franco R, Velez M, et al. Ultrasound in the diagnosis and management of pleural effusions. J Hosp Med. 2015 Dec;10(12):811-816. PubMed
3. Boyd JH, Sirounis D, Maizel J, Slama M. Echocardiography as a guide for fluid management. Crit Care. 2016;20(1):274-280. PubMed
4. Mantuani D, Frazee BW, Fahimi J, Nagdev A. Point-of-care multi-organ ultrasound improves diagnostic accuracy in adults presenting to the emergency department with acute dyspnea. West J Emerg Med. 2016;17(1):46-53. PubMed
5. Glockner E, Christ M, Geier F, et al. Accuracy of Point-of-Care B-Line Lung Ultrasound in Comparison to NT-ProBNP for Screening Acute Heart Failure. Ultrasound Int Open. 2016;2(3):E90-E92. PubMed
6. Bhagra A, Tierney DM, Sekiguchi H, Soni NH. Point-of-Care Ultrasonography for Primary Care Physicians and General Internists. Mayo Clin Proc. 2016 Dec;91(12):1811-1827. PubMed
7. Crisp JG, Lovato LM, Jang TB. Compression ultrasonography of the lower extremity with portable vascular ultrasonography can accurately detect deep venous thrombosis in the emergency department. Ann Emerg Med. 2010;56(6):601-610. PubMed
8. Squire BT, Fox JC, Anderson C. ABSCESS: Applied bedside sonography for convenient. Evaluation of superficial soft tissue infections. Acad Emerg Med. 2005;12(7):601-606. PubMed
9. Narasimhan M, Koenig SJ, Mayo PH. A Whole-Body Approach to Point of Care Ultrasound. Chest. 2016;150(4):772-776. PubMed
10. Copetti R, Soldati G, Copetti P. Chest sonography: a useful tool to differentiate acute cardiogenic pulmonary edema from acute respiratory distress syndrome. Cardiovasc Ultrasound. 2008;6:16-25. PubMed
11. Soni NJ, Arntfield R, Kory P. Point of Care Ultrasound. Philadelphia: Elsevier Saunders; 2015.
12. Moore CL, Copel JA. Point-of-Care Ultrasonography. N Engl J Med. 2011;364(8):749-757. PubMed
13. Rempell JS, Saldana F, DiSalvo D, et al. Pilot Point-of-Care Ultrasound Curriculum at Harvard Medical School: Early Experience. West J Emerg Med. 2016;17(6):734-740. doi:10.5811/westjem.2016.8.31387. PubMed
14. Heiberg J, Hansen LS, Wemmelund K, et al. Point-of-Care Clinical Ultrasound for Medical Students. Ultrasound Int Open. 2015;1(2):E58-E66. doi:10.1055/s-0035-1565173. PubMed
15. Razi R, Estrada JR, Doll J, Spencer KT. Bedside hand-carried ultrasound by internal medicine residents versus traditional clinical assessment for the identification of systolic dysfunction in patients admitted with decompensated heart failure. J Am Soc Echocardiogr. 2011;24(12):1319-1324. PubMed
16. Alexander JH, Peterson ED, Chen AY, Harding TM, Adams DB, Kisslo JA Jr. Feasibility of point-of-care echocardiography by internal medicine house staff. Am Heart J. 2004;147(3):476-481. PubMed
17. Hellmann DB, Whiting-O’Keefe Q, Shapiro EP, Martin LD, Martire C, Ziegelstein RC. The rate at which residents learn to use hand-held echocardiography at the bedside. Am J Med. 2005;118(9):1010-1018. PubMed
18. Kimura BJ, Amundson SA, Phan JN, Agan DL, Shaw DJ. Observations during development of an internal medicine residency training program in cardiovascular limited ultrasound examination. J Hosp Med. 2012;7(7):537-542. PubMed
19. Akhtar S, Theodoro D, Gaspari R, et al. Resident training in emergency ultrasound: consensus recommendations from the 2008 Council of Emergency Medicine Residency Directors Conference. Acad Emerg Med. 2009;16(s2):S32-S36. PubMed
, , , , , . Can emergency medicine residents detect acute deep venous thrombosis with a limited, two-site ultrasound examination? J Emerg Med. 2007;32(2):197-200. PubMed
, , , . Resident-performed compression ultrasonography for the detection of proximal deep vein thrombosis: fast and accurate. Acad Emerg Med. 2004;11(3):319-322. PubMed
22. Mandavia D, Aragona J, Chan L, et al. Ultrasound training for emergency physicians—a prospective study. Acad Emerg Med. 2000;7(9):1008-1014. PubMed
23. Koenig SJ, Narasimhan M, Mayo PH. Thoracic ultrasonography for the pulmonary specialist. Chest. 2011;140(5):1332-1341. doi: 10.1378/chest.11-0348. PubMed
24. Greenstein YY, Littauer R, Narasimhan M, Mayo PH, Koenig SJ. Effectiveness of a Critical Care Ultrasonography Course. Chest. 2017;151(1):34-40. doi:10.1016/j.chest.2016.08.1465. PubMed
25. Martin LD, Howell EE, Ziegelstein RC, Martire C, Shapiro EP, Hellmann DB. Hospitalist performance of cardiac hand-carried ultrasound after focused training. Am J Med. 2007;120(11):1000-1004. PubMed
26. Martin LD, Howell EE, Ziegelstein RC, et al.
27. Lucas BP, Candotti C, Margeta B, et al. Diagnostic accuracy of hospitalist-performed hand-carried ultrasound echocardiography after a brief training program. J Hosp Med. 2009;4(6):340-349. PubMed
28.
29. Critical Care Ultrasonography Certificate of Completion Program. American College of Chest Physicians. http://www.chestnet.org/Education/Advanced-Clinical-Training/Certificate-of-Completion-Program/Critical-Care-Ultrasonography. Accessed March 30, 2017
30. Mayo PH, Beaulieu Y, Doelken P, et al. American College of Chest Physicians/Société de Réanimation de Langue Française statement on competence in critical care ultrasonography. Chest. 2009;135(4):1050-1060. PubMed
31. Donlon TF, Angoff WH. The scholastic aptitude test. The College Board Admissions Testing Program; 1971:15-47.
32. Ericsson KA, Lehmann AC. Expert and exceptional performance: Evidence of maximal adaptation to task constraints. Annu Rev Psychol. 1996;47:273-305. PubMed
33. Ericcson KA, Krampe RT, Tesch-Romer C. The role of deliberate practice in the acquisition of expert performance. Psychol Rev. 1993;100(3):363-406.
34. Arntfield RT. The utility of remote supervision with feedback as a method to deliver high-volume critical care ultrasound training. J Crit Care. 2015;30(2):441.e1-e6. PubMed
35. Ma OJ, Gaddis G, Norvell JG, Subramanian S. How fast is the focused assessment with sonography for trauma examination learning curve? Emerg Med Australas. 2008;20(1):32-37. PubMed
36. Gaspari RJ, Dickman E, Blehar D. Learning curve of bedside ultrasound of the gallbladder. J Emerg Med. 2009;37(1):51-66. doi:10.1016/j.jemermed.2007.10.070. PubMed
37. Barsuk JH, McGaghie WC, Cohen ER, Balachandran JS, Wane DB. Use of simulation-based mastery learning to improve quality of central venous catheter placement in a medical intensive care unit. J Hosp Med. 2009:4(7):397-403. PubMed
38. McGaghie WC, Issenberg SB, Cohen ER, Barsuk JH, Wayne DB. A critical review of simulation-based mastery learning with translational outcomes. Med Educ. 2014:48(4):375-385. PubMed
39. Guskey TR. The essential elements of mastery learning. J Classroom Interac. 1987;22:19-22.
40. Ultrasound Institute. Introduction to Primary Care Ultrasound. University of South Carolina School of Medicine. http://ultrasoundinstitute.med.sc.edu/UIcme.asp. Accessed October 24, 2017.
41. Society of Critical Care Medicine. Live Critical Care Ultrasound: Adult. http://www.sccm.org/Education-Center/Ultrasound/Pages/Fundamentals.aspx. Accessed October 24, 2017.
42. Castlefest Ultrasound Event. Castlefest 2018. http://castlefest2018.com/. Accessed October 24, 2017.
43. Office of Continuing Medical Education. Point of Care Ultrasound Workshop. UT Health San Antonio Joe R. & Teresa Lozano Long School of Medicine. http://cme.uthscsa.edu/ultrasound.asp. Accessed October 24, 2017.
44. Patrawalla P, Eisen LA, Shiloh A, et al. Development and Validation of an Assessment Tool for Competency in Critical Care Ultrasound. J Grad Med Educ. 2015;7(4):567-573. PubMed
© 2018 Society of Hospital Medicine
TEAM approach reduced wait time, improved “face” time
ABSTRACT
Purpose In 2013-14, 2 clinics in the Watertown Regional Medical Center (WRMC; in southern Wisconsin) launched a new delivery model, “TEAM (Together Each person Achieves More) Primary Care,” as part of a quality improvement project to enhance the delivery experience for the patient, physician, and medical assistant (MA). New work flows, roles, and responsibilities were designed to reduce cycle time, increase patient time with physicians and staff, and reduce patient wait times.
Methods The new model increased the ratio of MAs to physicians from a baseline MA:MD ratio of 1:1 to 3:2, and trained MAs to assume expanded roles during exam-room entry and discharge, including assisting with documentation during the patient visit. A process engineer timed patient visits. The process engineer and a human resources associate conducted surveys to assess the level of satisfaction for patients, physicians, and MAs.
Results Cycle time decreased by a mean of 6 minutes, from 44 to 38 minutes per patient; time with staff increased a mean of 2 minutes, from 24 to 26 minutes per patient; and waiting time decreased from 9 to 2 minutes per patient. Qualitative interviews with patients, physicians, and MAs identified a high level of satisfaction with the new model.
Conclusion The higher staffing ratios and expanded roles for MAs in the new model improved workflow, increased the face time between patients and their physician and MA, and decreased patient wait times. The TEAM model also appeared to improve patient, physician, and MA satisfaction. We faced many challenges while implementing the new model, which could be further evaluated during wide adoption.
In recent years, we observed that our physicians, nurses, and medical assistants (MAs) appeared to be spending more time on administrative and clerical tasks—including tasks in the exam room with the patient—and less time engaged in direct patient care.1,2 We recognized these factors contribute to burnout and threaten staff retention and anticipated that a new model would improve physician time spent in direct patient care, decrease the demands of administrative tasks, and increase patient, physician, and MA satisfaction.3-6 Burnout, known to affect more than half of US physicians, has a negative impact on quality of care and patient safety and satisfaction.7-11 Improving workflow has been shown to reduce burnout.12
Watertown Regional Medical Center (WRMC) is a small, financially stable integrated delivery system in rural southern Wisconsin, composed of a 90-bed hospital, 10 primary care clinics (7 owned and 3 affiliated), and 24 employed physicians in 9 specialties. Two clinics within WRMC launched a new delivery model, “TEAM (Together Each person Achieves More) Primary Care,” to improve the delivery experience for the entire team, defined as the patient, physician, and MA. New workflows, roles, and responsibilities were designed to reduce cycle time (the total amount of time patients spent in the clinic from check-in to check-out), increase the total time a patient spent with staff (physician and MA or in point-of-care testing and radiology), and reduce the total time a patient spent waiting.13
We describe here WRMC’s experience in developing and implementing workflow improvements as a means of reducing burnout and improving satisfaction.
Continue to: METHODS
METHODS
We selected 2 WRMC sites for TEAM re-engineering based on their experience with quality-improvement projects and perceived likelihood of success with a new transformation initiative. In early 2013, WRMC charged one physician (JM), 2 MAs, the clinic scheduler, and the clinic administrator with designing the details of the model including evaluation metrics. WRMC provided a .5 FTE process engineer (MS) to assist with the design and implementation of the model at no extra expense to the clinics. The model was implemented in late 2013 and into 2014 after regular TEAM planning meetings and observational visits to non-WRMC sites identified as examples of best practices in improving outpatient primary care patient satisfaction: Bellin Health (Green Bay, Wis); ThedaCare (Appleton, Wis); the University of Utah (Salt Lake City); and the University of Wisconsin Health Yahara Clinic (Madison, Wis).
TEAM model
The TEAM model—so named to create top-of-mind awareness of its benefits—increased the MA:MD ratio, maintained consistent team composition so that physician/MA teams learned to work together and become more efficient, and added new MA responsibilities. We trained MAs to assist with documentation in the exam room to ensure that physician time was spent in face-to-face direct patient care.14-20 In these ways, we sought not only to increase patient satisfaction but also to enhance our own “joy in practice,” defined primarily by a high level of work-life satisfaction, a low level of burnout, and a feeling that the medical practice is fulfilling.21
In our traditional model, an MA retrieved the patient from the waiting room, conducted initial assessment in the exam room, and then left the patient to wait for the physician to enter. Once the physician entered and conducted the exam, the patient would be left alone again to wait for the MA to return. In our revised model (TABLE 1), we assigned one MA to each patient from arrival to discharge. After greeting the patient in the waiting room, the MA conducted an initial patient interview in the exam room, then remained in the room with the physician to document the visit. After the physician exited the exam room, the MA completed follow-up orders and provided the patient with a visit summary.

To facilitate consistency throughout the day, we designed a workflow similar to those created in lean models originally designed to increase efficiency in the manufacturing industry (TABLE 2). Visual and electronic cues triggered each step of the process and coordinated the movement of MAs and MDs. Cues included the conventional flag system outside each exam room, an electronic messaging system within the electronic health record (EHR) to indicate when a patient was ready to be seen, and a whiteboard in an area visible to all team members on which we wrote lab and radiology requests.

We experimented with the MA:MD ratio to identify the most effective and efficient team composition. On alternating weeks, we assigned one MA to one MD, 2 MAs to one MD, or 3 MAs to 2 MDs. Additionally, with the 2:1 MA:MD ratio, we varied the visit length in 2 tests; one spanning 30 minutes and the other 20 minutes. The MDs and MAs were seated at side-by-side workstations to make communication easier. We developed protocols and checklists that allowed MAs to enter health maintenance orders and conduct point-of-care testing before the physician entered the room. Such details included immunization management, strep screens, urine analyses, diabetic foot exams, extremity x-ray films, and mammogram and colonoscopy referrals.

Continue to: To prepare MAs...
To prepare MAs, we obtained special permission for team documentation from our Chief Information Officer and developed associated policies and procedures. A physician assistant (PA) trained each MA, introducing the structure and content of subjective, objective, assessment, and plan (SOAP) notes. Training was continuous, as PAs provided feedback when MAs began team documentation. The MAs documented visits using templates, free form, and quick text. We measured visit cycle-time, face time with staff, and patient waiting times. A process engineer with a stopwatch observed and timed the flow (but did not enter the exam room). We also conducted patient interviews immediately post-visit and administered anonymous questionnaires to clinic staff at different phases of the model. Physicians and MAs met weekly to evaluate the design.
We used qualitative interviews of patients, physicians, and MAs to identify the level of satisfaction with the new model. During the first week of implementation, a nurse and our process engineer conducted brief in-person surveys with approximately 20 post-visit patients. Patients, chosen by convenience, were asked if the visit addressed their concerns, whether they left with a thorough understanding of next steps, and if their wait time was acceptable. Twice during the implementation phase, a human resources associate distributed 9-item anonymous questionnaires to staff members during scheduled department meetings.
RESULTS
Times per activity with different MA:MD ratios and visit lengths are shown in TABLE 3. After 6 months, cycle time decreased by a mean of 6 minutes, from 44 to 38 minutes per patient; time with staff increased by a mean of 2 minutes, from 24 to 26 minutes per patient; and wait time decreased by a mean of 7 minutes, from 9 to 2 minutes per patient. We concluded the MA:MD ratio of 3:2 was most efficient because the 2:1 model left MAs with excess non-patient time.

Our delivery model received consistently positive comments from patients. Many expressed gratitude for the extra set of ears and eyes guiding them through the process. One recalled the “old days” when a nurse joined the doctor in the exam room. Another appreciated that both the MA and physician could answer follow-up questions over the phone.
Employee satisfaction
Surveys to assess satisfaction were distributed to all employees whether they were involved in the new model or not. Sixteen employees responded to the pre-implementation questionnaire and 18 responded to the post-implementation one distributed 7 months later. The questionnaires showed an increase in employee satisfaction scores from 3.70 to 3.89 on a 5-point Likert scale, with 5 ranking highest. “I am learning from [Dr. Milford] and understanding things more fully,” wrote one respondent. Another said, “Dr. Milford and his clinical support staff are less stressed.” Individual observations such as, “I can leave sooner with less work left to do,” and “All documentation is done before [the] patient leaves,” reflect the reduction in time that patient records remained open or incomplete. Some physicians reported a reduction in at-home or after-hours work, from about 2 to 4 hours per day to approximately one hour per day.
Continue to: Additional outcomes
Additional outcomes
The TEAM model allowed us to more easily integrate new initiatives into our practice and meet quality metrics by placing needed components within our workflow and checklist. For example, achieving Stage II Meaningful Use measures required that we print and furnish patients with a visit summary and a reminder to access our portal; something we easily incorporated into the MAs’ expanded responsibilities. We also met specific predetermined quality metrics that were part of a payment-withhold program. During the study period, we achieved scores at the 90th percentile and earned back our total withhold.
Finally, more of our patients completed advanced care planning discussions than the other 7 sites in our Honoring Choices Wisconsin cohort. This was achieved not only by integrating the process into our checklist, but because the MAs observed the MD-led patient conversations which they then emulated, presenting the advanced care planning information to patients before or after MD time with the patient.
Errors and defects in care
With ongoing provider guidance and reinforcement, MAs became integral members of the primary care team. They were empowered through protocols to manage and order health maintenance testing and provide needed immunizations. They also began to identify potentially overlooked aspects of care. For example, MAs prompted physicians to retake vital signs, adjust medications, order labs, discuss previous lab results, and pursue specialty referrals or follow-up care.
Billing
Although we tracked billing, the TEAM model was not designed to influence revenue. We noted no significant change in level of evaluation and management billed regardless of staffing ratio. While our panel size increased as we implemented the new process, this change could have been due to normal variation. We do see opportunity to affect future billing by having coders train MAs, which could enhance documentation and increase revenue.
DISCUSSION
The TEAM Primary Care model reduced the time our patients sat unattended, increased our opportunities to meaningfully interact with them, and seemed to reduce our administrative load. By identifying and implementing ways to work as a more cohesive, interconnected unit, we began to address our work as a team rather than as individuals. After implementing the model, we noted several instances where the MAs caught potential errors in care, although we did not consistently track or measure changes in the rate of these occurrences.
Continue to: Achieving these results also came with...
Achieving these results also came with challenges. Investing in and maintaining a new model opened our eyes to unforeseen inconsistencies in our staff profile and to the cost and administrative support needed for implementation. Moreover, our entire team (patients, MAs, and physicians) had to undergo a major cultural shift to adopt a new model.
Personnel variation
We discovered that implementing and sustaining organization change is highly dependent on constancy in human resources. When one team member was on vacation, sick, or leaving the practice, the process tended to fall apart. Hiring replacements and training employees well enough to fill in at a moment’s notice proved difficult. Bringing new employees into this process was also labor intensive. Despite team members being very engaged in change, these staffing inconsistencies caused significant stress and necessitated pauses in the implementation of the new model (reflected in the timeline of our measures). Larger organizational buy-in and support would allow us to hire and train a larger pool of MAs in anticipation of these fluctuations.
Cost
Our small, rural family practice took advantage of WRMC’s Primary Care Transformation project and the half-time process engineer and additional MA they provided. We question whether this model could be implemented without such support. While a process engineer might not prove necessary, expertise in process improvement is vital to help design and measure workflow and to identify opportunities for improvement.
Cultural change
Adopting a new model required asking every member of the team (patient, MA, and physician) to accommodate change and tolerate disruption. We anticipated patients might resist having an additional person in the room. All patients were informed of our new model at the beginning of the visit and told they could opt out. While we did not document patient resistance, JM recalled only 2 patients who expressed a desire not to have the MA present because of personal and sensitive issues. It’s possible some patients did not feel comfortable opting out. But many patients expressed gratitude for having an extra set of ears and eyes to guide them through the visit.
It was more challenging to support MAs as they stepped out of their comfort zone to assist with documentation. It took time for MAs to grow accustomed to the protocols and checklists essential to our workflow. Without protocols, any point-of-care testing that could have been completed at the beginning of the appointment had to be done at the end. This disrupted our workflow and increased patient wait times.
Continue to: We correctly predicted MAs would have...
We correctly predicted MAs would have difficulty documenting the assessment, plan, and medical decision making. We discovered that MAs more easily categorized and articulated information when we reframed the assessment and plan in first-person and placed it under “Patient instructions.” For this to occur, physicians had to learn to accurately articulate their thought process and instructions to the patient.
When training was provided, as previously described, MAs grasped the subjective section quickly. Surprisingly, they had most difficulty understanding terminology within the objective section. In the future, we would avert this problem by working closely with the human resource department. We believe there should be a newly defined position and additional training for MAs in these roles, since duties such as patient-coaching and documentation assistance may warrant separate certification.
Limitations
Our findings should be interpreted in light of several limitations. Implementing the new model was carried out in a single organization. The patients who were selected and agreed to be interviewed may have differed from the patient population as a whole. We did not measure some important outcomes, such as cost effectiveness and patient morbidity. We did not analyze the data to determine whether the apparent improvements in wait time and cycle time were statistically significant. In addition, measurement of any adverse effects was beyond the scope of this study.
Looking forward
The traditional model of physicians working individually with minimal support staff is no longer viable. To echo our co-author (CAS)’s recent statements on physician dissatisfaction, “The days of hero medicine, with the doctor doing it all, belong in the past.”21 The new model appeared to alleviate some administrative burdens and increase physician time with patients. Pressures to achieve quality measures and growing administrative tasks have altered the role and responsibilities of each member of the team.
Any sustainable system must address the larger crisis of physician dissatisfaction.7,22 We cannot focus on a single perspective—patient, physician, or MA—at the expense of the system as a whole. If the health care system is to resolve the epidemic of burnout and physician dissatisfaction, new approaches to patient care must be imagined and realized. Although we faced many challenges in implementing and evaluating the TEAM model, attempts to overcome these challenges appear justified because of our overall favorable impression of it. Innovations like the TEAM Primary Care model may help us improve the well-being of not just our patients but also our health professionals and the health care industry as a whole.
CORRESPONDENCE
James Milford, MD, Three Oaks Health, S.C., 480 Village Walk Lane, Suite F, Johnson Creek, WI 53038; jam@threeoakshealthcare.com.
SUPPORT
Although the Watertown Regional Medical Center has provided general funding for its Primary Care Transformation project, no dollars were specifically earmarked for the TEAM Primary Care process. Support for editorial services in preparing this article was provided by Dr. James Milford.
PRIOR PRESENTATIONS
Co-author Michael R. Strasser, MPA, presented this project at the 2015 i-PrACTISE conference in Madison, Wis, April 12-14, 2015. http://www.fammed.wisc.edu/i-practise/. The proceedings were not published or recorded.
ACKNOWLEDGMENT
We thank Annalynn Skipper and Masarah Van Eyck for their valuable edits.
1. Sinsky C, Colligan L, Li L, et al. Allocation of physician time in ambulatory practice: a time and motion study in 4 specialties. Ann Intern Med. 2016;165:753-760.
2. McDonald CJ, Callaghan FM, Weissman A, et al. Use of internist’s free time by ambulatory care electronic medical record systems. JAMA Intern Med. 2014;174:1860-1863.
3. Shanafelt TD, Dyrbye LN, Sinsky C, et al. Relationship between clerical burden and characteristics of the electronic environment with physician burnout and professional satisfaction. Mayo Clin Proc. 2016;91:836-848.
4. Friedberg MW, Chen PG, Van Busum KR, et al. Factors affecting physician professional satisfaction and their implications for patient care, health systems, and health policy. Available at: http://www.rand.org/pubs/research_reports/RR439.html#key-findings. Accessed October 25, 2016.
5. Babbott S, Manwell LB, Brown R, et al. Electronic medical records and physician stress in primary care: results from the MEMO study. J Am Med Inform Assoc. 2014;21:e100-e106.
6. Institute of Medicine. Crossing the Quality Chasm: A New Health System for the 21st Century. Washington, DC: National Academy Press. 2001.
7. Shanafelt TD, Hasan O, Dyrbye LN, et al. Changes in burnout and satisfaction with work-life balance in physicians and the general US working population between 2011 and 2014. Mayo Clinic Proc. 2015;90:1600-1613.
8. DeMatteo MR, Sherbourne CD, Hays RD, et al. Physicians’ characteristics influence patients’ adherence to medical treatment: Results from the Medical Outcomes Study. Health Psychol. 1993;12:93-102.
9. Shanafelt TD, Bradley KA, Wipf JE, et al. Burnout and self-reported patient care in an internal medicine residency program. Ann Intern Med. 2002;136:358-367.
10. Shanafelt TD, Balch CM, Bechamps G, et al. Burnout and medical errors among American surgeons. Ann Surg. 2010;251:995-1000.
11. Haas JS, Cook EF, Puopolo AL, et al. Is the professional satisfaction of general internists associated with patient satisfaction? J Gen Intern Med. 2000;15:122-128.
12. Linzer M, Poplau S, Grossman E, et al. A cluster randomized trial of interventions to improve work conditions and clinician burnout in primary care: results from the Healthy Work Place (HWP) Study. J Gen Intern Med. 2015;30:1105-1011.
13. Ferrer RL, Mody-Bailey P, Jaén CR, et al. A medical assistant-based program to promote healthy behaviors in primary care. Ann Fam Med. 2009;7:504-512.
14. Sinsky CA, Williard-Grace R, Schutzbank AM, et al. In search of joy in practice: a report of 23 high-functioning primary care practices. Ann Fam Med. 2013;11:272-278.
15. Reuben DB, Knudsen J, Senelick W, et al. The effect of a physician partner program on physician efficiency and patient satisfaction. JAMA Intern Med. 2014;174:1190-1193.
16. Hopkins K, Sinsky CA. Team-based care: saving time and improving efficiency. Fam Pract Manag. 2014;21:23-29.
17. Yan C, Rose S, Rothberg MB, et al. Physician, scribe, and patient perspectives on clinical scribes in primary care. J Gen Intern Med. 2016;31:990-995.
18. Misra-Hebert AD, Rabovsky A, Yan C, et al. A team-based model of primary care delivery and physician-patient interaction. Am J Med. 2015;128:1025-1028.
19. Anderson RJ. Optimizing the role of nursing staff to enhance physician productivity: one physician’s journey. Fam Pract Manag. 2013;20:18-22.
20. Anderson P, Halley MD. A new approach to making your doctor-nurse team more productive. Fam Pract Manag. 2008:15:35-40.
21. Sinsky CA. Dissatisfaction among Wisconsin physicians is part of a serious national trend. Wis Med J. 2015;114:132-133.
22. Bodenheimer T, Sinsky C. From triple to quadruple aim: care of the patient requires care of the provider. Ann Fam Med. 2014;12:573-576.
ABSTRACT
Purpose In 2013-14, 2 clinics in the Watertown Regional Medical Center (WRMC; in southern Wisconsin) launched a new delivery model, “TEAM (Together Each person Achieves More) Primary Care,” as part of a quality improvement project to enhance the delivery experience for the patient, physician, and medical assistant (MA). New work flows, roles, and responsibilities were designed to reduce cycle time, increase patient time with physicians and staff, and reduce patient wait times.
Methods The new model increased the ratio of MAs to physicians from a baseline MA:MD ratio of 1:1 to 3:2, and trained MAs to assume expanded roles during exam-room entry and discharge, including assisting with documentation during the patient visit. A process engineer timed patient visits. The process engineer and a human resources associate conducted surveys to assess the level of satisfaction for patients, physicians, and MAs.
Results Cycle time decreased by a mean of 6 minutes, from 44 to 38 minutes per patient; time with staff increased a mean of 2 minutes, from 24 to 26 minutes per patient; and waiting time decreased from 9 to 2 minutes per patient. Qualitative interviews with patients, physicians, and MAs identified a high level of satisfaction with the new model.
Conclusion The higher staffing ratios and expanded roles for MAs in the new model improved workflow, increased the face time between patients and their physician and MA, and decreased patient wait times. The TEAM model also appeared to improve patient, physician, and MA satisfaction. We faced many challenges while implementing the new model, which could be further evaluated during wide adoption.
In recent years, we observed that our physicians, nurses, and medical assistants (MAs) appeared to be spending more time on administrative and clerical tasks—including tasks in the exam room with the patient—and less time engaged in direct patient care.1,2 We recognized these factors contribute to burnout and threaten staff retention and anticipated that a new model would improve physician time spent in direct patient care, decrease the demands of administrative tasks, and increase patient, physician, and MA satisfaction.3-6 Burnout, known to affect more than half of US physicians, has a negative impact on quality of care and patient safety and satisfaction.7-11 Improving workflow has been shown to reduce burnout.12
Watertown Regional Medical Center (WRMC) is a small, financially stable integrated delivery system in rural southern Wisconsin, composed of a 90-bed hospital, 10 primary care clinics (7 owned and 3 affiliated), and 24 employed physicians in 9 specialties. Two clinics within WRMC launched a new delivery model, “TEAM (Together Each person Achieves More) Primary Care,” to improve the delivery experience for the entire team, defined as the patient, physician, and MA. New workflows, roles, and responsibilities were designed to reduce cycle time (the total amount of time patients spent in the clinic from check-in to check-out), increase the total time a patient spent with staff (physician and MA or in point-of-care testing and radiology), and reduce the total time a patient spent waiting.13
We describe here WRMC’s experience in developing and implementing workflow improvements as a means of reducing burnout and improving satisfaction.
Continue to: METHODS
METHODS
We selected 2 WRMC sites for TEAM re-engineering based on their experience with quality-improvement projects and perceived likelihood of success with a new transformation initiative. In early 2013, WRMC charged one physician (JM), 2 MAs, the clinic scheduler, and the clinic administrator with designing the details of the model including evaluation metrics. WRMC provided a .5 FTE process engineer (MS) to assist with the design and implementation of the model at no extra expense to the clinics. The model was implemented in late 2013 and into 2014 after regular TEAM planning meetings and observational visits to non-WRMC sites identified as examples of best practices in improving outpatient primary care patient satisfaction: Bellin Health (Green Bay, Wis); ThedaCare (Appleton, Wis); the University of Utah (Salt Lake City); and the University of Wisconsin Health Yahara Clinic (Madison, Wis).
TEAM model
The TEAM model—so named to create top-of-mind awareness of its benefits—increased the MA:MD ratio, maintained consistent team composition so that physician/MA teams learned to work together and become more efficient, and added new MA responsibilities. We trained MAs to assist with documentation in the exam room to ensure that physician time was spent in face-to-face direct patient care.14-20 In these ways, we sought not only to increase patient satisfaction but also to enhance our own “joy in practice,” defined primarily by a high level of work-life satisfaction, a low level of burnout, and a feeling that the medical practice is fulfilling.21
In our traditional model, an MA retrieved the patient from the waiting room, conducted initial assessment in the exam room, and then left the patient to wait for the physician to enter. Once the physician entered and conducted the exam, the patient would be left alone again to wait for the MA to return. In our revised model (TABLE 1), we assigned one MA to each patient from arrival to discharge. After greeting the patient in the waiting room, the MA conducted an initial patient interview in the exam room, then remained in the room with the physician to document the visit. After the physician exited the exam room, the MA completed follow-up orders and provided the patient with a visit summary.
To facilitate consistency throughout the day, we designed a workflow similar to those created in lean models originally designed to increase efficiency in the manufacturing industry (TABLE 2). Visual and electronic cues triggered each step of the process and coordinated the movement of MAs and MDs. Cues included the conventional flag system outside each exam room, an electronic messaging system within the electronic health record (EHR) to indicate when a patient was ready to be seen, and a whiteboard in an area visible to all team members on which we wrote lab and radiology requests.
We experimented with the MA:MD ratio to identify the most effective and efficient team composition. On alternating weeks, we assigned one MA to one MD, 2 MAs to one MD, or 3 MAs to 2 MDs. Additionally, with the 2:1 MA:MD ratio, we varied the visit length in 2 tests; one spanning 30 minutes and the other 20 minutes. The MDs and MAs were seated at side-by-side workstations to make communication easier. We developed protocols and checklists that allowed MAs to enter health maintenance orders and conduct point-of-care testing before the physician entered the room. Such details included immunization management, strep screens, urine analyses, diabetic foot exams, extremity x-ray films, and mammogram and colonoscopy referrals.
Continue to: To prepare MAs...
To prepare MAs, we obtained special permission for team documentation from our Chief Information Officer and developed associated policies and procedures. A physician assistant (PA) trained each MA, introducing the structure and content of subjective, objective, assessment, and plan (SOAP) notes. Training was continuous, as PAs provided feedback when MAs began team documentation. The MAs documented visits using templates, free form, and quick text. We measured visit cycle-time, face time with staff, and patient waiting times. A process engineer with a stopwatch observed and timed the flow (but did not enter the exam room). We also conducted patient interviews immediately post-visit and administered anonymous questionnaires to clinic staff at different phases of the model. Physicians and MAs met weekly to evaluate the design.
We used qualitative interviews of patients, physicians, and MAs to identify the level of satisfaction with the new model. During the first week of implementation, a nurse and our process engineer conducted brief in-person surveys with approximately 20 post-visit patients. Patients, chosen by convenience, were asked if the visit addressed their concerns, whether they left with a thorough understanding of next steps, and if their wait time was acceptable. Twice during the implementation phase, a human resources associate distributed 9-item anonymous questionnaires to staff members during scheduled department meetings.
RESULTS
Times per activity with different MA:MD ratios and visit lengths are shown in TABLE 3. After 6 months, cycle time decreased by a mean of 6 minutes, from 44 to 38 minutes per patient; time with staff increased by a mean of 2 minutes, from 24 to 26 minutes per patient; and wait time decreased by a mean of 7 minutes, from 9 to 2 minutes per patient. We concluded the MA:MD ratio of 3:2 was most efficient because the 2:1 model left MAs with excess non-patient time.
Our delivery model received consistently positive comments from patients. Many expressed gratitude for the extra set of ears and eyes guiding them through the process. One recalled the “old days” when a nurse joined the doctor in the exam room. Another appreciated that both the MA and physician could answer follow-up questions over the phone.
Employee satisfaction
Surveys to assess satisfaction were distributed to all employees whether they were involved in the new model or not. Sixteen employees responded to the pre-implementation questionnaire and 18 responded to the post-implementation one distributed 7 months later. The questionnaires showed an increase in employee satisfaction scores from 3.70 to 3.89 on a 5-point Likert scale, with 5 ranking highest. “I am learning from [Dr. Milford] and understanding things more fully,” wrote one respondent. Another said, “Dr. Milford and his clinical support staff are less stressed.” Individual observations such as, “I can leave sooner with less work left to do,” and “All documentation is done before [the] patient leaves,” reflect the reduction in time that patient records remained open or incomplete. Some physicians reported a reduction in at-home or after-hours work, from about 2 to 4 hours per day to approximately one hour per day.
Continue to: Additional outcomes
Additional outcomes
The TEAM model allowed us to more easily integrate new initiatives into our practice and meet quality metrics by placing needed components within our workflow and checklist. For example, achieving Stage II Meaningful Use measures required that we print and furnish patients with a visit summary and a reminder to access our portal; something we easily incorporated into the MAs’ expanded responsibilities. We also met specific predetermined quality metrics that were part of a payment-withhold program. During the study period, we achieved scores at the 90th percentile and earned back our total withhold.
Finally, more of our patients completed advanced care planning discussions than the other 7 sites in our Honoring Choices Wisconsin cohort. This was achieved not only by integrating the process into our checklist, but because the MAs observed the MD-led patient conversations which they then emulated, presenting the advanced care planning information to patients before or after MD time with the patient.
Errors and defects in care
With ongoing provider guidance and reinforcement, MAs became integral members of the primary care team. They were empowered through protocols to manage and order health maintenance testing and provide needed immunizations. They also began to identify potentially overlooked aspects of care. For example, MAs prompted physicians to retake vital signs, adjust medications, order labs, discuss previous lab results, and pursue specialty referrals or follow-up care.
Billing
Although we tracked billing, the TEAM model was not designed to influence revenue. We noted no significant change in level of evaluation and management billed regardless of staffing ratio. While our panel size increased as we implemented the new process, this change could have been due to normal variation. We do see opportunity to affect future billing by having coders train MAs, which could enhance documentation and increase revenue.
DISCUSSION
The TEAM Primary Care model reduced the time our patients sat unattended, increased our opportunities to meaningfully interact with them, and seemed to reduce our administrative load. By identifying and implementing ways to work as a more cohesive, interconnected unit, we began to address our work as a team rather than as individuals. After implementing the model, we noted several instances where the MAs caught potential errors in care, although we did not consistently track or measure changes in the rate of these occurrences.
Continue to: Achieving these results also came with...
Achieving these results also came with challenges. Investing in and maintaining a new model opened our eyes to unforeseen inconsistencies in our staff profile and to the cost and administrative support needed for implementation. Moreover, our entire team (patients, MAs, and physicians) had to undergo a major cultural shift to adopt a new model.
Personnel variation
We discovered that implementing and sustaining organization change is highly dependent on constancy in human resources. When one team member was on vacation, sick, or leaving the practice, the process tended to fall apart. Hiring replacements and training employees well enough to fill in at a moment’s notice proved difficult. Bringing new employees into this process was also labor intensive. Despite team members being very engaged in change, these staffing inconsistencies caused significant stress and necessitated pauses in the implementation of the new model (reflected in the timeline of our measures). Larger organizational buy-in and support would allow us to hire and train a larger pool of MAs in anticipation of these fluctuations.
Cost
Our small, rural family practice took advantage of WRMC’s Primary Care Transformation project and the half-time process engineer and additional MA they provided. We question whether this model could be implemented without such support. While a process engineer might not prove necessary, expertise in process improvement is vital to help design and measure workflow and to identify opportunities for improvement.
Cultural change
Adopting a new model required asking every member of the team (patient, MA, and physician) to accommodate change and tolerate disruption. We anticipated patients might resist having an additional person in the room. All patients were informed of our new model at the beginning of the visit and told they could opt out. While we did not document patient resistance, JM recalled only 2 patients who expressed a desire not to have the MA present because of personal and sensitive issues. It’s possible some patients did not feel comfortable opting out. But many patients expressed gratitude for having an extra set of ears and eyes to guide them through the visit.
It was more challenging to support MAs as they stepped out of their comfort zone to assist with documentation. It took time for MAs to grow accustomed to the protocols and checklists essential to our workflow. Without protocols, any point-of-care testing that could have been completed at the beginning of the appointment had to be done at the end. This disrupted our workflow and increased patient wait times.
Continue to: We correctly predicted MAs would have...
We correctly predicted MAs would have difficulty documenting the assessment, plan, and medical decision making. We discovered that MAs more easily categorized and articulated information when we reframed the assessment and plan in first-person and placed it under “Patient instructions.” For this to occur, physicians had to learn to accurately articulate their thought process and instructions to the patient.
When training was provided, as previously described, MAs grasped the subjective section quickly. Surprisingly, they had most difficulty understanding terminology within the objective section. In the future, we would avert this problem by working closely with the human resource department. We believe there should be a newly defined position and additional training for MAs in these roles, since duties such as patient-coaching and documentation assistance may warrant separate certification.
Limitations
Our findings should be interpreted in light of several limitations. Implementing the new model was carried out in a single organization. The patients who were selected and agreed to be interviewed may have differed from the patient population as a whole. We did not measure some important outcomes, such as cost effectiveness and patient morbidity. We did not analyze the data to determine whether the apparent improvements in wait time and cycle time were statistically significant. In addition, measurement of any adverse effects was beyond the scope of this study.
Looking forward
The traditional model of physicians working individually with minimal support staff is no longer viable. To echo our co-author (CAS)’s recent statements on physician dissatisfaction, “The days of hero medicine, with the doctor doing it all, belong in the past.”21 The new model appeared to alleviate some administrative burdens and increase physician time with patients. Pressures to achieve quality measures and growing administrative tasks have altered the role and responsibilities of each member of the team.
Any sustainable system must address the larger crisis of physician dissatisfaction.7,22 We cannot focus on a single perspective—patient, physician, or MA—at the expense of the system as a whole. If the health care system is to resolve the epidemic of burnout and physician dissatisfaction, new approaches to patient care must be imagined and realized. Although we faced many challenges in implementing and evaluating the TEAM model, attempts to overcome these challenges appear justified because of our overall favorable impression of it. Innovations like the TEAM Primary Care model may help us improve the well-being of not just our patients but also our health professionals and the health care industry as a whole.
CORRESPONDENCE
James Milford, MD, Three Oaks Health, S.C., 480 Village Walk Lane, Suite F, Johnson Creek, WI 53038; jam@threeoakshealthcare.com.
SUPPORT
Although the Watertown Regional Medical Center has provided general funding for its Primary Care Transformation project, no dollars were specifically earmarked for the TEAM Primary Care process. Support for editorial services in preparing this article was provided by Dr. James Milford.
PRIOR PRESENTATIONS
Co-author Michael R. Strasser, MPA, presented this project at the 2015 i-PrACTISE conference in Madison, Wis, April 12-14, 2015. http://www.fammed.wisc.edu/i-practise/. The proceedings were not published or recorded.
ACKNOWLEDGMENT
We thank Annalynn Skipper and Masarah Van Eyck for their valuable edits.
1. Sinsky C, Colligan L, Li L, et al. Allocation of physician time in ambulatory practice: a time and motion study in 4 specialties. Ann Intern Med. 2016;165:753-760.
2. McDonald CJ, Callaghan FM, Weissman A, et al. Use of internist’s free time by ambulatory care electronic medical record systems. JAMA Intern Med. 2014;174:1860-1863.
3. Shanafelt TD, Dyrbye LN, Sinsky C, et al. Relationship between clerical burden and characteristics of the electronic environment with physician burnout and professional satisfaction. Mayo Clin Proc. 2016;91:836-848.
4. Friedberg MW, Chen PG, Van Busum KR, et al. Factors affecting physician professional satisfaction and their implications for patient care, health systems, and health policy. Available at: http://www.rand.org/pubs/research_reports/RR439.html#key-findings. Accessed October 25, 2016.
5. Babbott S, Manwell LB, Brown R, et al. Electronic medical records and physician stress in primary care: results from the MEMO study. J Am Med Inform Assoc. 2014;21:e100-e106.
6. Institute of Medicine. Crossing the Quality Chasm: A New Health System for the 21st Century. Washington, DC: National Academy Press. 2001.
7. Shanafelt TD, Hasan O, Dyrbye LN, et al. Changes in burnout and satisfaction with work-life balance in physicians and the general US working population between 2011 and 2014. Mayo Clinic Proc. 2015;90:1600-1613.
8. DeMatteo MR, Sherbourne CD, Hays RD, et al. Physicians’ characteristics influence patients’ adherence to medical treatment: Results from the Medical Outcomes Study. Health Psychol. 1993;12:93-102.
9. Shanafelt TD, Bradley KA, Wipf JE, et al. Burnout and self-reported patient care in an internal medicine residency program. Ann Intern Med. 2002;136:358-367.
10. Shanafelt TD, Balch CM, Bechamps G, et al. Burnout and medical errors among American surgeons. Ann Surg. 2010;251:995-1000.
11. Haas JS, Cook EF, Puopolo AL, et al. Is the professional satisfaction of general internists associated with patient satisfaction? J Gen Intern Med. 2000;15:122-128.
12. Linzer M, Poplau S, Grossman E, et al. A cluster randomized trial of interventions to improve work conditions and clinician burnout in primary care: results from the Healthy Work Place (HWP) Study. J Gen Intern Med. 2015;30:1105-1011.
13. Ferrer RL, Mody-Bailey P, Jaén CR, et al. A medical assistant-based program to promote healthy behaviors in primary care. Ann Fam Med. 2009;7:504-512.
14. Sinsky CA, Williard-Grace R, Schutzbank AM, et al. In search of joy in practice: a report of 23 high-functioning primary care practices. Ann Fam Med. 2013;11:272-278.
15. Reuben DB, Knudsen J, Senelick W, et al. The effect of a physician partner program on physician efficiency and patient satisfaction. JAMA Intern Med. 2014;174:1190-1193.
16. Hopkins K, Sinsky CA. Team-based care: saving time and improving efficiency. Fam Pract Manag. 2014;21:23-29.
17. Yan C, Rose S, Rothberg MB, et al. Physician, scribe, and patient perspectives on clinical scribes in primary care. J Gen Intern Med. 2016;31:990-995.
18. Misra-Hebert AD, Rabovsky A, Yan C, et al. A team-based model of primary care delivery and physician-patient interaction. Am J Med. 2015;128:1025-1028.
19. Anderson RJ. Optimizing the role of nursing staff to enhance physician productivity: one physician’s journey. Fam Pract Manag. 2013;20:18-22.
20. Anderson P, Halley MD. A new approach to making your doctor-nurse team more productive. Fam Pract Manag. 2008:15:35-40.
21. Sinsky CA. Dissatisfaction among Wisconsin physicians is part of a serious national trend. Wis Med J. 2015;114:132-133.
22. Bodenheimer T, Sinsky C. From triple to quadruple aim: care of the patient requires care of the provider. Ann Fam Med. 2014;12:573-576.

Volumetric Considerations for Valving Long-Arm Casts: The Utility of the Cast Spacer
ABSTRACT
Fiberglass casts are frequently valved to accommodate swelling following injury or surgery. The use of cast spacers has been recommended to bridge this gap between pressure reduction and cast strength, but no studies have assessed their effect on cast pressure.
We applied 30 long-arm fiberglass casts to adult volunteers, divided between a univalve group and a bivalve group. A pediatric blood pressure bladder was applied under the cast to simulate soft tissue swelling. Valved casts were secured using an elastic wrap, 10-mm cast spacer, or 15-mm cast spacer. Measurements of cast pressure and circumference were performed at each stage and compared on the basis of type of valve and securement.
Our results indicated that cast univalving resulted in an approximately 60% reduction in cast pressures, with a 75% reduction seen in the bivalve group. The addition of cast spacers resulted in significant pressure reductions for both valving groups. The univalve group secured with a 10-mm cast spacer produced reductions in cast pressure similar to those of the elastic-wrapped bivalve cast, both with the cast padding intact and with it released.
The use of cast spacers results in significant cast pressure reductions, regardless of valving technique. A univalved cast secured with a cast spacer can produce decreases in cast pressures similar to those seen with an elastic-wrapped bivalved cast, and it is a viable option for reducing cast pressure without compromising cast structural integrity with a bivalve technique.
Continue to: Complications following closed reduction...
Complications following closed reduction and casting of pediatric forearm fractures are rare, but they do occur. Arguably the most devastating of these complications is the risk of developing compartment syndrome or Volkmann contracture secondary to injury-associated swelling under a circumferential cast.1-4 The peak in swelling can develop from 4 to 24 hours following the initial cast application,5 and as such, medical providers may not be able to identify it early because most children are discharged following closed reductions. For this reason, many providers implement prophylactic measures to minimize pressure-related complications.
A popular method for reducing pressure accumulation within a cast is to valve, or cut, the cast. Previous investigations have shown that cast valving results in significant reductions in cast pressure.2,6-9 Bivalving a circumferential cast results in significantly greater reductions in cast pressure when compared with univalve techniques;6,7,9 however, bivalving has also been shown to result in significant impairment in the structural integrity of the cast.10 An additional method to facilitate cast pressure reduction without impairing the structural integrity of the cast that accompanies a bivalve is to incorporate a cast spacer with a univalve technique to hold the split cast open.11 Although this method is commonly used in clinical practice, its ability to mitigate cast pressures has not previously been investigated.
The goal of this study is to investigate the influence of incorporating cast spacers with valved long-arm casts. We hypothesized that cast spacers would provide a greater pressure reduction for both univalved and bivalved casts when compared with the use of an elastic wrap. Additionally, we proposed that by incorporating a cast spacer with a univalved cast, we could attain pressure reduction equivalent to that of a bivalved cast secured with an elastic wrap.
MATERIALS AND METHODS
Upon receiving approval from the Institutional Review Board, experimental testing began with the application of 30 total casts performed on uninjured adult human volunteers. Pressure readings were provided with the use of a bladder from a pediatric blood pressure cuff (Welch Allyn Inc), as previously described.6 The bladder was placed on the volar aspect of the volunteer’s forearm, held in place with a 3-in diameter cotton stockinet (3M). Cotton cast padding (Webril-Kendall) was applied, 3 in wide and 2 layers thick, and a long-arm cast was applied, 2 layers thick with 3-in wide fiberglass casting material (Scotchcast Plus Casting Tape; 3M).
Once the cast was applied and allowed to set, the blood pressure bladder was inflated to 100 mm Hg. After inflation, forearm cast circumference was measured at 2 set points, assessed at points 2 cm distal to the elbow flexor crease and 10 cm distal to the previous point (Figure 1). Using these data, we calculated estimated cast volume using the volumetric equation for a frustum. Following this point, casts were split into 2 experimental groups, univalve or bivalve, with 15 casts comprising each group. The univalve group consisted of a single cut along the dorsum of the extremity, and the bivalve group incorporated a second cut to the volar extremity. Cast valving was performed using an oscillating cast saw (Cast Vac; Stryker Instruments), with care taken to ensure the continuity of the underlying cast padding.
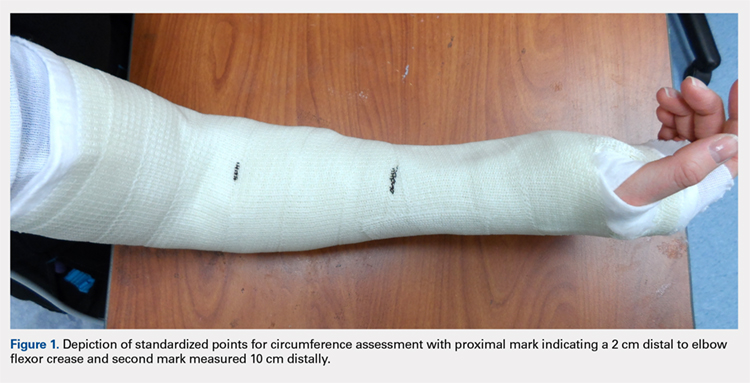
Continue to: Following valving, casts were secured via...
Following valving, casts were secured via 3 separate techniques: overwrap with a 3-in elastic wrap (Econo Wrap; Vitality Medical), application of two 10-mm and 15-mm cast spacers (CastWedge; DM Systems) (Figure 2). After securement, cast pressures were recorded, and circumference measurements were performed at the 2 previously identified points. The cast padding was then cut at the valve site and secured via the 3 listed techniques. Cast pressure and circumference measurements were performed at set time points (Figure 3). Changes in cast pressure were recorded in terms of the amount of change from the initial cast placement to account for differences in the size of volunteers’ forearms. Volumetric calculations were performed only for the spacer subgroups owing to the added material in the elastic wrap group. Estimated cast volume was calculated using the equation for volume of a frustum (Figure 4).
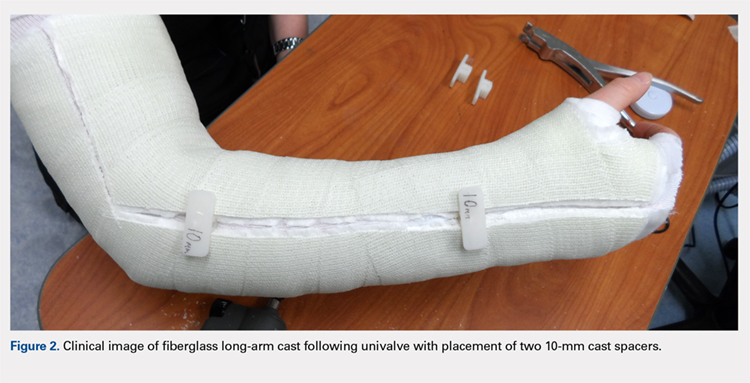
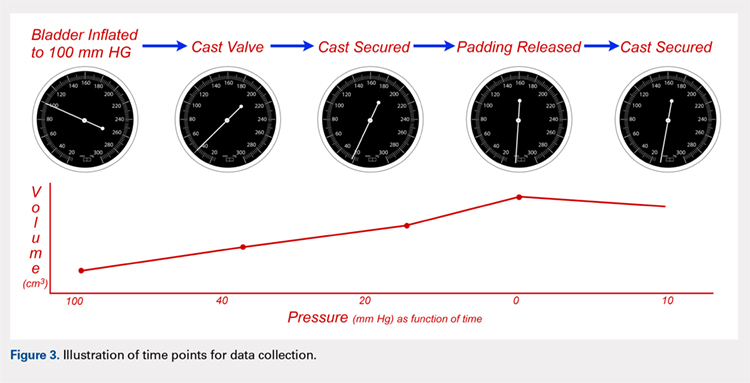
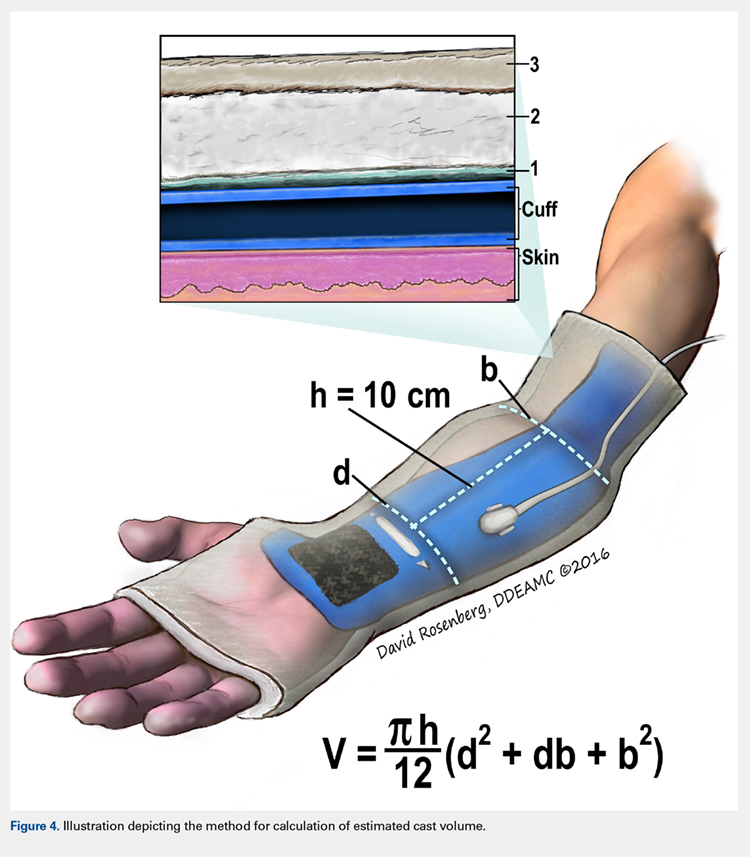
We used a 2-cast type (univalve and bivalve) by 4 securement subgroups (initial, elastic wrap, 10-mm spacer, and 15-mm spacer) design, with cast type serving as a between-subject measure and securement serving as a within-subject variable. An a priori power analysis showed that a minimum sample size of 15 subjects per condition should provide sufficient power of .80 and alpha set at .05, for a total of 30 casts. Statistical analyses were performed using IBM SPSS Statistics software version 21 (IBM). Experimental groups were analyzed using mixed-design analysis of variance (ANOVA). Post hoc comparisons between valving groups and cast securement were performed using Scheffe’s test to control for type II errors. Change in cast volume between the initial cast and cast spacers groups was compared using paired Student’s t tests. Statistical significance was predetermined as P < .05.
RESULTS
A summary of collected data for cast pressure and volume is detailed in Table 1, subdividing the variables on the basis of cast type and type of securement. Recorded pressures of the different subgroups are depicted in Figures 5 and 6 according to type of securement (initial, elastic wrap, 10-mm spacer, or 15-mm spacer). Results of the mixed-design ANOVA demonstrated significant differences between the initial cast pressure and univalve and bivalve groups (P < .05). There was a main effect for bivalve having lower pressure overall (F [1, 1)] = 3321.51, P < .001). There was also a main effect indicating that pressure was different for each type of securement (elastic wrap, 10-mm spacer, 15-mm spacer) (F [1, 28] = 538.54, P <. 01). Post hoc testing confirmed pressure decreased significantly, in descending order from elastic wrap, to 10-mm spacers, to 15-mm spacers (P < .05).
Table 1. Cumulative Data for Two Casting groups at Each Timepoint
Cast | Pressure | Standard Deviation | Volume |
Univalve |
|
|
|
Initial | 100 | --- | 2654.3 |
Elastic Wrap | 39.47 | 3.33 | --- |
10-mm Spacer | 23.93 | 2.73 | 2708.23 |
15-mm Spacer | 18.87 | 2.94 | 2734.86 |
Padding and Elastic Wrap | 20.93 | 2.91 | --- |
Padding and 10-mm Spacer | 15.46 | 2.19 | 2733.24 |
Padding and 15-mm Spacer | 0 | --- | 2819.27 |
Bivalve |
|
|
|
Initial | 100 | --- | 2839.3 |
Elastic Wrap | 25.9 | 3.17 | --- |
10-mm Spacer | 16.53 | 2.32 | 3203.13 |
15-mm Spacer | 13.6 | 2.74 | 3380.32 |
Padding and Elastic Wrap | 12.67 | 1.95 | --- |
Padding and 10-mm Spacer | 0 | --- | 3296.55 |
Padding and 15- mm Spacer | 0 | --- | 3438.67 |
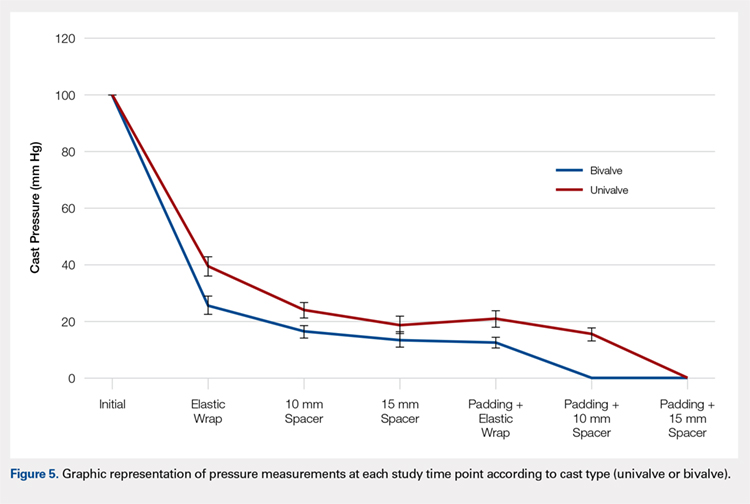
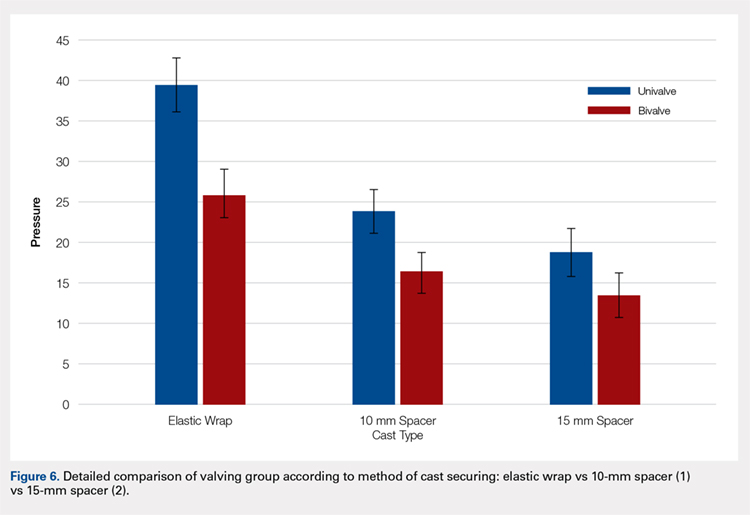
Continue to: Table 2...
The summary of volumetric changes is listed in Table 2. The decrease in pressure correlated with an associated increase in cast volume, as demonstrated in Figure 7. The degree of increase in cast volume was more pronounced in the bivalve group (P < .001). The volume increased in the 15-mm group compared with the 10-mm group for both groups (P < .001) and increased for each spacer group with the release of the underlying padding (P < .05).
Table 2. Volumetric Data
Cast | Average Volumetric change (cm3) | Standard Deviation |
Univalve |
|
|
10-mm Spacer | 175.6 | 65.4 |
15-mm Spacer | 269.4 | 73.3 |
Padding and 10-mm Spacer | 202.3 | 62.5 |
Padding and 15-mm Spacer | 294.1 | 66.9 |
Bivalve |
|
|
10-mm Spacer | 363.7 | 67.2 |
15-mm Spacer | 540.9 | 85.7 |
Padding and 10-mm Spacer | 457.2 | 97.9 |
Padding and 15-mm Spacer | 599.3 | 84.2 |
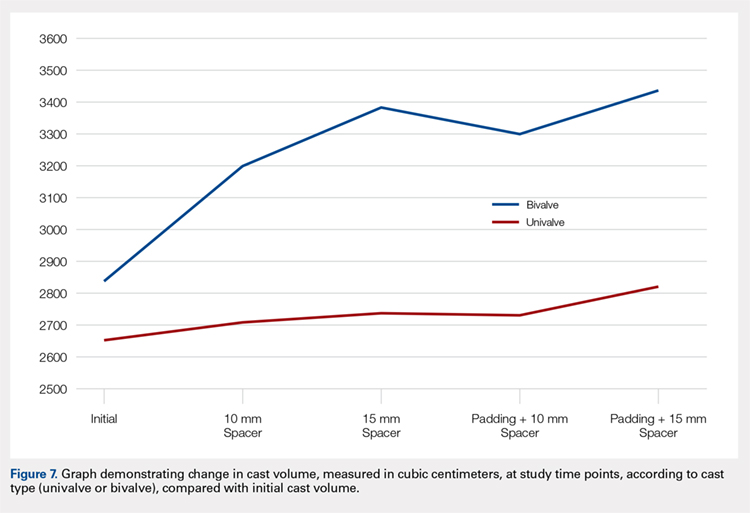
Analysis of the planned comparisons demonstrated no significant difference between the bivalve with elastic wrap and univalve with 10-mm spacer subgroups (t [28] = 1.85, P = .075, d = .68). In comparing the bivalve with elastic wrap group with the univalve and 15-mm spacer subgroup, the univalve group showed significantly lower pressures [t [28] = 6.32, P < .001, d = .2.31).
DISCUSSION
Valving of circumferential casting is a well-established technique to minimize potential pressure-related complications. Previous studies have demonstrated that univalving techniques produce a 65% reduction in cast pressure, whereas bivalving produces an 80% decrease.6,7,9 Our results showed comparable pressure reductions of 75% with bivalving and 60% with univalving. The type of cast padding has been shown to have a significant effect on the cast pressure, favoring lower pressures with cotton padding over synthetic and waterproof padding, which, when released, can provide an additional 10% pressure reduction.6,7
Although bivalving techniques are superior in pressure reduction, the reduction comes at the cost of the cast’s structural integrity. Crickard and colleagues10 performed a biomechanical assessment of the structural integrity by 3-point bending of casts following univalve and bivalve compared with an intact cast. The authors found that valving resulted in a significant decrease in the casts’ bending stiffness and load to failure, with bivalved casts demonstrating a significantly lower load to failure than univalved casts. One technique that has been used to enhance the pressure reduction in univalved casting techniques is the application of a cast spacer. Rang and colleagues11 recommended this technique as part of a graded cast-splitting approach for the treatment of children’s fractures. This technique was applied to fractures with only modest anticipated swelling, which accounted for approximately 95% of casts applied in their children’s hospital. Our results support the use of cast spacers, demonstrating significant reduction in cast pressure in both univalve and bivalve techniques. Additionally, we found that a univalved cast with a 10-mm cast spacer provided pressure reduction similar to that of a bivalved cast.
The theory behind the application of cast spacers is that a split fiberglass cast will not remain open unless held in position.11 Holding the cast open is less of a restraint to pressure reduction in bivalving techniques, because the split cast no longer has the contralateral intact hinge point to resist cast opening, demonstrated in the compromise in structural integrity seen with this technique.10 By maintaining the split cast in an opened position, the effective volume of the cast is increased, which allows for the reduction in cast pressure. This is demonstrated in our results indicating an increase in estimated cast volume with an associated incremental reduction in cast pressure with the application of incrementally sized cast spacers. Although this technique does have the potential for skin irritation caused by cast expansion, as well as local swelling at the cast window location, it is a cost-effective treatment method compared with overwrapping a bivalved cast, $1.55 for 1 cast spacer vs an estimated $200 for a forearm cast application.
This study is not without its limitations. Our model does not account for the soft tissue injury associated with forearm fractures. However, by using human volunteers, we were able to include the viscoelastic properties that are omitted with nonliving models, and our results do align with those of previous investigations regarding pressure change following valving. We did not incorporate a 3-point molding technique commonly used with reduction and casting of acute forearm fractures, owing to the lack of a standardized method for applying the mold to healthy volunteers. Although molding is necessary for most fractures in which valving is considered, we believe our data still provide valuable information. Additionally, valving of circumferential casts has not been shown, prospectively, to result in a reduction of cast-related compartment syndrome, maintenance of reduction, or need for surgery.12,13 However, these results are reflective of reliable patients who completed the requisite follow-up care necessary for inclusion in a randomized controlled trial and may be applicable to unreliable patients or patient situations, a setting in which the compromise in cast structural integrity may be unacceptable.
CONCLUSION
We demonstrated that incorporating cast spacers into valved long-arm casts provides pressure reduction comparable to that achieved with the use of an elastic wrap. The addition of a 10-mm cast spacer to a univalved long-arm cast provides pressure reduction equivalent to that of a bivalved cast secured with an elastic wrap. A univalved cast secured with a cast spacer is a viable option for treatment of displaced pediatric forearm fractures, without compromising the cast’s structural integrity as required with bivalved techniques.
This paper will be judged for the Resident Writer’s Award.
- Halanski M, Noonan KJ. Cast and splint immobilization: complications. J Am Acad Orthop Surg. 2008;16(1):30-40.
- Zaino CJ, Patel MR, Arief MS, Pivec R. The effectiveness of bivalving, cast spreading, and webril cutting to reduce cast pressure in a fiberglass short arm cast. J Bone Joint Surg Am. 2015;97(5):374-380. doi:10.2106/JBJS.N.00579.
- Rodriguez-Merchan EC. Pediatric fractures of the forearm. Clin Orthop Relat Res. 2005;(432):65-72.
- von Volkmann R. Ischaemic muscle paralyses and contractures. Clin Orthop Relat Res. 1967;50:5-56. doi:10.1097/BLO.0b013e318032561f.
- Patrick JH, Levack B. A study of pressures beneath forearm plasters. Injury. 1981;13(1):37-41.
- Roberts A, Shaw KA, Boomsma SE, Cameron CD. Effect of casting material on the cast pressure after sequential cast splitting. J Pediatr Orthop. 2017;37(1):74-77. doi:10.1097/BPO.0000000000000574.
- Garfin SR, Mubarak SJ, Evans KL, Hargens AR, Akeson WH. Quantification of intracompartmental pressure and volume under plaster casts. J Bone Joint Surg Am. 1981;63(3):449-453.
- Capo JT, Renard RL, Moulton MJ, et al. How is forearm compliance affected by various circumferential dressings? Clin Orthop Relat Res. 2014 472(10):3228-3234. doi:10.1007/s11999-014-3747-y.
- Bingold AC. On splitting plasters. A useful analogy. J Bone Joint Surg Br. 1979;61-b(3):294-295.
- Crickard CV, Riccio AI, Carney JR, Anderson TD. Analysis and comparison of the biomechanical properties of univalved and bivalved cast models. J Pediatr Orthop.2011;31(1):39-43. doi:10.1097/BPO.0b013e318202c446.
- Rang M, Wenger DR, Pring ME. Rang's Children's Fractures. 3rd ed. Wenger DR, Rang M, eds. Philadelphia, PA: Lippincott Williams & Wilkins; 2005.
- Schulte D, Habernig S, Zuzak T, et al. Forearm fractures in children: split opinions about splitting the cast. Eur J Pediatr Surg. 2014;24(2):163-167. doi:10.1055/s-0033-1341412.
- Bae DS, Valim C, Connell P, Brustowicz KA, Waters PM. Bivalved versus circumferential cast immobilization for displaced forearm fractures: a randomized clinical trial to assess efficacy and safety. J Pediatr Orthop. 2017;37(4):239-246 doi:10.1097/BPO.0000000000000655.
ABSTRACT
Fiberglass casts are frequently valved to accommodate swelling following injury or surgery. The use of cast spacers has been recommended to bridge this gap between pressure reduction and cast strength, but no studies have assessed their effect on cast pressure.
We applied 30 long-arm fiberglass casts to adult volunteers, divided between a univalve group and a bivalve group. A pediatric blood pressure bladder was applied under the cast to simulate soft tissue swelling. Valved casts were secured using an elastic wrap, 10-mm cast spacer, or 15-mm cast spacer. Measurements of cast pressure and circumference were performed at each stage and compared on the basis of type of valve and securement.
Our results indicated that cast univalving resulted in an approximately 60% reduction in cast pressures, with a 75% reduction seen in the bivalve group. The addition of cast spacers resulted in significant pressure reductions for both valving groups. The univalve group secured with a 10-mm cast spacer produced reductions in cast pressure similar to those of the elastic-wrapped bivalve cast, both with the cast padding intact and with it released.
The use of cast spacers results in significant cast pressure reductions, regardless of valving technique. A univalved cast secured with a cast spacer can produce decreases in cast pressures similar to those seen with an elastic-wrapped bivalved cast, and it is a viable option for reducing cast pressure without compromising cast structural integrity with a bivalve technique.
Continue to: Complications following closed reduction...
Complications following closed reduction and casting of pediatric forearm fractures are rare, but they do occur. Arguably the most devastating of these complications is the risk of developing compartment syndrome or Volkmann contracture secondary to injury-associated swelling under a circumferential cast.1-4 The peak in swelling can develop from 4 to 24 hours following the initial cast application,5 and as such, medical providers may not be able to identify it early because most children are discharged following closed reductions. For this reason, many providers implement prophylactic measures to minimize pressure-related complications.
A popular method for reducing pressure accumulation within a cast is to valve, or cut, the cast. Previous investigations have shown that cast valving results in significant reductions in cast pressure.2,6-9 Bivalving a circumferential cast results in significantly greater reductions in cast pressure when compared with univalve techniques;6,7,9 however, bivalving has also been shown to result in significant impairment in the structural integrity of the cast.10 An additional method to facilitate cast pressure reduction without impairing the structural integrity of the cast that accompanies a bivalve is to incorporate a cast spacer with a univalve technique to hold the split cast open.11 Although this method is commonly used in clinical practice, its ability to mitigate cast pressures has not previously been investigated.
The goal of this study is to investigate the influence of incorporating cast spacers with valved long-arm casts. We hypothesized that cast spacers would provide a greater pressure reduction for both univalved and bivalved casts when compared with the use of an elastic wrap. Additionally, we proposed that by incorporating a cast spacer with a univalved cast, we could attain pressure reduction equivalent to that of a bivalved cast secured with an elastic wrap.
MATERIALS AND METHODS
Upon receiving approval from the Institutional Review Board, experimental testing began with the application of 30 total casts performed on uninjured adult human volunteers. Pressure readings were provided with the use of a bladder from a pediatric blood pressure cuff (Welch Allyn Inc), as previously described.6 The bladder was placed on the volar aspect of the volunteer’s forearm, held in place with a 3-in diameter cotton stockinet (3M). Cotton cast padding (Webril-Kendall) was applied, 3 in wide and 2 layers thick, and a long-arm cast was applied, 2 layers thick with 3-in wide fiberglass casting material (Scotchcast Plus Casting Tape; 3M).
Once the cast was applied and allowed to set, the blood pressure bladder was inflated to 100 mm Hg. After inflation, forearm cast circumference was measured at 2 set points, assessed at points 2 cm distal to the elbow flexor crease and 10 cm distal to the previous point (Figure 1). Using these data, we calculated estimated cast volume using the volumetric equation for a frustum. Following this point, casts were split into 2 experimental groups, univalve or bivalve, with 15 casts comprising each group. The univalve group consisted of a single cut along the dorsum of the extremity, and the bivalve group incorporated a second cut to the volar extremity. Cast valving was performed using an oscillating cast saw (Cast Vac; Stryker Instruments), with care taken to ensure the continuity of the underlying cast padding.
Continue to: Following valving, casts were secured via...
Following valving, casts were secured via 3 separate techniques: overwrap with a 3-in elastic wrap (Econo Wrap; Vitality Medical), application of two 10-mm and 15-mm cast spacers (CastWedge; DM Systems) (Figure 2). After securement, cast pressures were recorded, and circumference measurements were performed at the 2 previously identified points. The cast padding was then cut at the valve site and secured via the 3 listed techniques. Cast pressure and circumference measurements were performed at set time points (Figure 3). Changes in cast pressure were recorded in terms of the amount of change from the initial cast placement to account for differences in the size of volunteers’ forearms. Volumetric calculations were performed only for the spacer subgroups owing to the added material in the elastic wrap group. Estimated cast volume was calculated using the equation for volume of a frustum (Figure 4).
We used a 2-cast type (univalve and bivalve) by 4 securement subgroups (initial, elastic wrap, 10-mm spacer, and 15-mm spacer) design, with cast type serving as a between-subject measure and securement serving as a within-subject variable. An a priori power analysis showed that a minimum sample size of 15 subjects per condition should provide sufficient power of .80 and alpha set at .05, for a total of 30 casts. Statistical analyses were performed using IBM SPSS Statistics software version 21 (IBM). Experimental groups were analyzed using mixed-design analysis of variance (ANOVA). Post hoc comparisons between valving groups and cast securement were performed using Scheffe’s test to control for type II errors. Change in cast volume between the initial cast and cast spacers groups was compared using paired Student’s t tests. Statistical significance was predetermined as P < .05.
RESULTS
A summary of collected data for cast pressure and volume is detailed in Table 1, subdividing the variables on the basis of cast type and type of securement. Recorded pressures of the different subgroups are depicted in Figures 5 and 6 according to type of securement (initial, elastic wrap, 10-mm spacer, or 15-mm spacer). Results of the mixed-design ANOVA demonstrated significant differences between the initial cast pressure and univalve and bivalve groups (P < .05). There was a main effect for bivalve having lower pressure overall (F [1, 1)] = 3321.51, P < .001). There was also a main effect indicating that pressure was different for each type of securement (elastic wrap, 10-mm spacer, 15-mm spacer) (F [1, 28] = 538.54, P <. 01). Post hoc testing confirmed pressure decreased significantly, in descending order from elastic wrap, to 10-mm spacers, to 15-mm spacers (P < .05).
Table 1. Cumulative Data for Two Casting groups at Each Timepoint
Cast | Pressure | Standard Deviation | Volume |
Univalve |
|
|
|
Initial | 100 | --- | 2654.3 |
Elastic Wrap | 39.47 | 3.33 | --- |
10-mm Spacer | 23.93 | 2.73 | 2708.23 |
15-mm Spacer | 18.87 | 2.94 | 2734.86 |
Padding and Elastic Wrap | 20.93 | 2.91 | --- |
Padding and 10-mm Spacer | 15.46 | 2.19 | 2733.24 |
Padding and 15-mm Spacer | 0 | --- | 2819.27 |
Bivalve |
|
|
|
Initial | 100 | --- | 2839.3 |
Elastic Wrap | 25.9 | 3.17 | --- |
10-mm Spacer | 16.53 | 2.32 | 3203.13 |
15-mm Spacer | 13.6 | 2.74 | 3380.32 |
Padding and Elastic Wrap | 12.67 | 1.95 | --- |
Padding and 10-mm Spacer | 0 | --- | 3296.55 |
Padding and 15- mm Spacer | 0 | --- | 3438.67 |
Continue to: Table 2...
The summary of volumetric changes is listed in Table 2. The decrease in pressure correlated with an associated increase in cast volume, as demonstrated in Figure 7. The degree of increase in cast volume was more pronounced in the bivalve group (P < .001). The volume increased in the 15-mm group compared with the 10-mm group for both groups (P < .001) and increased for each spacer group with the release of the underlying padding (P < .05).
Table 2. Volumetric Data
Cast | Average Volumetric change (cm3) | Standard Deviation |
Univalve |
|
|
10-mm Spacer | 175.6 | 65.4 |
15-mm Spacer | 269.4 | 73.3 |
Padding and 10-mm Spacer | 202.3 | 62.5 |
Padding and 15-mm Spacer | 294.1 | 66.9 |
Bivalve |
|
|
10-mm Spacer | 363.7 | 67.2 |
15-mm Spacer | 540.9 | 85.7 |
Padding and 10-mm Spacer | 457.2 | 97.9 |
Padding and 15-mm Spacer | 599.3 | 84.2 |
Analysis of the planned comparisons demonstrated no significant difference between the bivalve with elastic wrap and univalve with 10-mm spacer subgroups (t [28] = 1.85, P = .075, d = .68). In comparing the bivalve with elastic wrap group with the univalve and 15-mm spacer subgroup, the univalve group showed significantly lower pressures [t [28] = 6.32, P < .001, d = .2.31).
DISCUSSION
Valving of circumferential casting is a well-established technique to minimize potential pressure-related complications. Previous studies have demonstrated that univalving techniques produce a 65% reduction in cast pressure, whereas bivalving produces an 80% decrease.6,7,9 Our results showed comparable pressure reductions of 75% with bivalving and 60% with univalving. The type of cast padding has been shown to have a significant effect on the cast pressure, favoring lower pressures with cotton padding over synthetic and waterproof padding, which, when released, can provide an additional 10% pressure reduction.6,7
Although bivalving techniques are superior in pressure reduction, the reduction comes at the cost of the cast’s structural integrity. Crickard and colleagues10 performed a biomechanical assessment of the structural integrity by 3-point bending of casts following univalve and bivalve compared with an intact cast. The authors found that valving resulted in a significant decrease in the casts’ bending stiffness and load to failure, with bivalved casts demonstrating a significantly lower load to failure than univalved casts. One technique that has been used to enhance the pressure reduction in univalved casting techniques is the application of a cast spacer. Rang and colleagues11 recommended this technique as part of a graded cast-splitting approach for the treatment of children’s fractures. This technique was applied to fractures with only modest anticipated swelling, which accounted for approximately 95% of casts applied in their children’s hospital. Our results support the use of cast spacers, demonstrating significant reduction in cast pressure in both univalve and bivalve techniques. Additionally, we found that a univalved cast with a 10-mm cast spacer provided pressure reduction similar to that of a bivalved cast.
The theory behind the application of cast spacers is that a split fiberglass cast will not remain open unless held in position.11 Holding the cast open is less of a restraint to pressure reduction in bivalving techniques, because the split cast no longer has the contralateral intact hinge point to resist cast opening, demonstrated in the compromise in structural integrity seen with this technique.10 By maintaining the split cast in an opened position, the effective volume of the cast is increased, which allows for the reduction in cast pressure. This is demonstrated in our results indicating an increase in estimated cast volume with an associated incremental reduction in cast pressure with the application of incrementally sized cast spacers. Although this technique does have the potential for skin irritation caused by cast expansion, as well as local swelling at the cast window location, it is a cost-effective treatment method compared with overwrapping a bivalved cast, $1.55 for 1 cast spacer vs an estimated $200 for a forearm cast application.
This study is not without its limitations. Our model does not account for the soft tissue injury associated with forearm fractures. However, by using human volunteers, we were able to include the viscoelastic properties that are omitted with nonliving models, and our results do align with those of previous investigations regarding pressure change following valving. We did not incorporate a 3-point molding technique commonly used with reduction and casting of acute forearm fractures, owing to the lack of a standardized method for applying the mold to healthy volunteers. Although molding is necessary for most fractures in which valving is considered, we believe our data still provide valuable information. Additionally, valving of circumferential casts has not been shown, prospectively, to result in a reduction of cast-related compartment syndrome, maintenance of reduction, or need for surgery.12,13 However, these results are reflective of reliable patients who completed the requisite follow-up care necessary for inclusion in a randomized controlled trial and may be applicable to unreliable patients or patient situations, a setting in which the compromise in cast structural integrity may be unacceptable.
CONCLUSION
We demonstrated that incorporating cast spacers into valved long-arm casts provides pressure reduction comparable to that achieved with the use of an elastic wrap. The addition of a 10-mm cast spacer to a univalved long-arm cast provides pressure reduction equivalent to that of a bivalved cast secured with an elastic wrap. A univalved cast secured with a cast spacer is a viable option for treatment of displaced pediatric forearm fractures, without compromising the cast’s structural integrity as required with bivalved techniques.
This paper will be judged for the Resident Writer’s Award.
- Halanski M, Noonan KJ. Cast and splint immobilization: complications. J Am Acad Orthop Surg. 2008;16(1):30-40.
- Zaino CJ, Patel MR, Arief MS, Pivec R. The effectiveness of bivalving, cast spreading, and webril cutting to reduce cast pressure in a fiberglass short arm cast. J Bone Joint Surg Am. 2015;97(5):374-380. doi:10.2106/JBJS.N.00579.
- Rodriguez-Merchan EC. Pediatric fractures of the forearm. Clin Orthop Relat Res. 2005;(432):65-72.
- von Volkmann R. Ischaemic muscle paralyses and contractures. Clin Orthop Relat Res. 1967;50:5-56. doi:10.1097/BLO.0b013e318032561f.
- Patrick JH, Levack B. A study of pressures beneath forearm plasters. Injury. 1981;13(1):37-41.
- Roberts A, Shaw KA, Boomsma SE, Cameron CD. Effect of casting material on the cast pressure after sequential cast splitting. J Pediatr Orthop. 2017;37(1):74-77. doi:10.1097/BPO.0000000000000574.
- Garfin SR, Mubarak SJ, Evans KL, Hargens AR, Akeson WH. Quantification of intracompartmental pressure and volume under plaster casts. J Bone Joint Surg Am. 1981;63(3):449-453.
- Capo JT, Renard RL, Moulton MJ, et al. How is forearm compliance affected by various circumferential dressings? Clin Orthop Relat Res. 2014 472(10):3228-3234. doi:10.1007/s11999-014-3747-y.
- Bingold AC. On splitting plasters. A useful analogy. J Bone Joint Surg Br. 1979;61-b(3):294-295.
- Crickard CV, Riccio AI, Carney JR, Anderson TD. Analysis and comparison of the biomechanical properties of univalved and bivalved cast models. J Pediatr Orthop.2011;31(1):39-43. doi:10.1097/BPO.0b013e318202c446.
- Rang M, Wenger DR, Pring ME. Rang's Children's Fractures. 3rd ed. Wenger DR, Rang M, eds. Philadelphia, PA: Lippincott Williams & Wilkins; 2005.
- Schulte D, Habernig S, Zuzak T, et al. Forearm fractures in children: split opinions about splitting the cast. Eur J Pediatr Surg. 2014;24(2):163-167. doi:10.1055/s-0033-1341412.
- Bae DS, Valim C, Connell P, Brustowicz KA, Waters PM. Bivalved versus circumferential cast immobilization for displaced forearm fractures: a randomized clinical trial to assess efficacy and safety. J Pediatr Orthop. 2017;37(4):239-246 doi:10.1097/BPO.0000000000000655.
TAKE-HOME POINTS
- Valving a long-arm cast results in decreased cast pressures.
- Univalving can produce a 60% reduction in cast pressure.
- Bivalving produces a 75% reduction in cast pressure.
- Release of the underlying cast padding produces an additional pressure reduction.
- Adding a cast spacer to a univalved cast obtains similar pressure reduction to a bivalved cast.
Total Joint Arthroplasty Quality Ratings: How Are They Similar and How Are They Different?
ABSTRACT
A patient’s perception of hospital or provider quality can have far-reaching effects, as it can impact reimbursement, patient selection of a surgeon, and healthcare competition. A variety of organizations offer quality designations for orthopedic surgery and its subspecialties. Our goal is to compare total joint arthroplasty (TJA) quality designation methodology across key quality rating organizations. One researcher conducted an initial Google search to determine organizations providing quality designations for hospitals and surgeons providing orthopedic procedures with a focus on TJA. Organizations that offer quality designation specific to TJA were determined. Organizations that provided general orthopedic surgery or only surgeon-specific quality designation were excluded from the analysis. The senior author confirmed the inclusion of the final organizations. Seven organizations fit our inclusion criteria. Only the private payers and The Joint Commission required hospital accreditation to meet quality designation criteria. Total arthroplasty volume was considered in 86% of the organizations’ methodologies, and 57% of organizations utilized process measurements such as antibiotic prophylaxis and care pathways. In addition, 57% of organizations included patient experience in their methodologies. Only 29% of organizations included a cost element in their methodology. All organizations utilized outcome data and publicly reported all hospitals receiving their quality designation. Hospital quality designation methodologies are inconsistent in the context of TJA. All stakeholders (ie, providers, payers, and patients) should be involved in deciding the definition of quality.
Continue to: Healthcare in the United States...
Healthcare in the United States has begun to move toward a system focused on value for patients, defined as health outcome per dollar expended.1 Indeed, an estimated 30% of Medicare payments are now made using the so-called alternative payment models (eg, bundled payments),2 and there is an expectation that consumerism in medicine will continue to expand.3 In addition, although there is a continuing debate regarding the benefits and pitfalls of hospital mergers, there is no question whether provider consolidation has increased dramatically in recent years.4 At the core of many of these changes is the push to improve healthcare quality and reduce costs.
Quality has the ability to affect payment, patient selection of providers, and hospital competition. Patients (ie, healthcare consumers) are increasingly using the Internet to find a variety of health information.5 Accessible provider quality information online would allow patients to make more informed decisions about where to seek care. In addition, the development of transparent quality ratings could assist payers in driving beneficiaries to higher quality and better value providers, which could mean more business for the highest quality physicians and better patient outcomes with fewer complications. Some payers such as the Centers for Medicare and Medicaid Services (CMS) have already started using quality measures as part of their reimbursement strategy.6 Because CMS is the largest payer in the United States, private insurers tend to follow their lead; thus, quality measurements will become even more common as a factor in reimbursement over the coming years.
To make quality ratings useful, “quality” must be clearly defined. Clarity around which factors are considered in a quality designation will create transparency for patients and allow providers to understand how their performance is being measured so that they focus on improving outcomes for their patients. Numerous organizations, including private payers, public payers, and both not-for-profit and for-profit entities, have created quality designation programs to rate providers. However, within orthopedics and several other medical specialties, there has been an ongoing debate about what measures best reflect quality.7 Although inconsistencies in quality ratings in arthroplasty care have been noted,8 it remains unknown how each quality designation program compares with the others in terms of the factors considered in deciding quality designations.
The purpose of this study is to evaluate publicly available information from key quality designation programs for total joint arthroplasty (TJA) providers to determine what factors are considered by each organization in awarding quality designations; what similarities and differences in quality designations exist across the different organizations; and how many of the organizations publish their quality designation methodologies and final rating results.
MATERIALS AND METHODS
A directed Google search was conducted to determine organizations (ie, payers, independent firms, and government entities) that rate hospitals and/or surgeons in orthopedic surgery. The identified organizations were then examined to determine whether they provided hospital ratings for total hip and/or knee arthroplasty. Entities were included if they provided quality designations for hospitals specifically addressing TJA. Organizations that provided only general hospital, other surgical procedures, orthopedic surgery, or orthopedic surgeon-specific quality designations were excluded. A list of all organizations determined to fit the inclusion criteria was then reviewed for completeness and approved by the senior author.
Continue to: One investigator reviewed the website of each organization...
One investigator reviewed the website of each organization fitting the inclusion criteria to determine the full rating methodology in 1 sitting on July 2, 2016. Detailed notes were taken on each program using publicly available information. For organizations that used proprietary criteria for quality designation (eg, The Joint Commission [TJC]), only publicly available information was used in the analysis. Therefore, the information reported is solely based on data available online to the public.
Detailed quality designation criteria were condensed into broader categories (accreditation, volume, structural, process, outcomes, patient experience, and cost/efficiency) to capture differences between each organization reviewed. In addition, we recorded whether each organization published a list of providers that received its quality designation.
RESULTS
A total of 7 organizations fit our inclusion criteria9-15 (Table). Of these 7 organizations, 3 were private payers (Aetna, UnitedHealth, and Blue Cross Blue Shield [BCBS]), 2 were nongovernmental not-for-profit organizations (TJC and Consumer Reports), and 2 were consumer-based and/or for-profit organizations (HealthGrades and US News & World Report [USNWR]). There were no government agencies that fit our inclusion criteria. BCBS had the following 2 separate quality designations: BCBS Blue Distinction and BCBS Blue Distinction+. The only difference between the 2 BCBS ratings is that BCBS Blue Distinction+ includes cost efficiency ratings, whereas BCBS Blue Distinction does not.
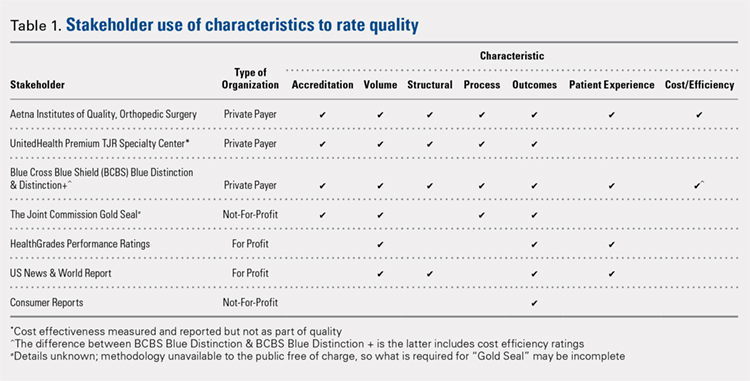
Only the 3 private payers and TJC, the primary hospital accreditation body in the United States, required accreditation as part of its quality designation criteria. TJC requires its own accreditation for quality designation consideration, whereas the 3 private payers allow accreditation from one of a variety of sources. Aetna Institutes of Quality for Orthopedic Surgery requires accreditation by TJC, Healthcare Facilities Accreditation Program, American Osteopathic Association, National Integrated Accreditation for Healthcare Organizations, or Det Norske Veritas Healthcare. UnitedHealth Premium Total Joint Replacement (TJR) Specialty Center requires accreditation by TJC and/or equivalent of TJC accreditation. However, TJC accreditation equivalents are not noted in the UnitedHealth handbook. BCBS Blue Distinction and Distinction+ require accreditation by TJC, Healthcare Facilities Accreditation Program, National Integrated Accreditation for Healthcare Organizations, or Center for Improvement in Healthcare Quality. In addition, BCBS is willing to consider alternative accreditations that are at least as stringent as the national alternatives noted. However, no detailed criteria that must be met to be equivalent to the national standards are noted in the relevant quality designation handbook.
The volume of completed total hip and knee arthroplasty procedures was considered in 6 of the organizations’ quality ratings methodologies. Of those 6, all private payers, TJC (not-for-profit), and 2 for-profit rating agencies were included. Surgeon specialization in TJA was only explicitly noted as a factor considered in UnitedHealth Premium TJR Specialty Center criteria; however, the requirements for surgeon specialization were not clearly defined. In addition, the presence of a multidisciplinary clinical pathway was only explicitly considered for Aetna Institutes of Quality for Orthopedic Surgery.
Structural requirements (eg, use of electronic health records [EHR], staffing levels, etc.) were taken into account in private payer and USNWR quality methodologies. Process measures (eg, antibiotic prophylaxis and other care pathways) were considered for the private payers and TJC but not for USNWR quality designation. Cost and/or efficiency measures were factors in the quality formula for Aetna Institutes of Quality for Orthopedic Surgery and BCBS Distinction+. Aetna utilizes its own cost data and risk-adjusts using a product known as Symmetry Episode Risk Groups to determine cost-effectiveness, while BCBS uses its own Composite Facility Cost Index. Patient experience (eg, Hospital Consumer Assessment of Healthcare Providers and Systems [HCAHPS]) was incorporated into the quality formulas for 4 of the 7 quality designation programs examined.
Continue to: All of the 7 quality designation programs included...
All of the 7 quality designation programs included outcomes (ie, readmission rates and/or mortality rates) and publicly reported the hospitals receiving their quality designation. In contrast, only Aetna explicitly included the presence of multidisciplinary clinical care pathways as part of their quality designation criteria. In addition, only UnitedHealth included surgeon specialization in joint arthroplasty as a factor for quality consideration for its quality designation program. BCBS Distinction+ and Aetna Institutes of Quality for Orthopedic Surgery were the only 2 quality designations that included at least 1 variable that fit into each of the 7 characteristics considered (accreditation, volume, structural, process, outcomes, patient experience, and cost/efficiency).
DISCUSSION
As healthcare continues to shift toward value-based delivery and payment models, quality becomes a critical factor in reimbursement and provider rankings. However, quality is a vague term. Several providers probably do not know what is required to be designated as high quality by a particular rating agency. Moreover, there are multiple quality designation programs, all using distinct criteria to determine “quality,” which further complicates the matter. Our objective was to determine the key stakeholders that provide quality designations in TJA and what criteria each organization uses in assessing quality.
Our idea of comprehensive quality is based on Avedis Donabedian’s enduring framework for healthcare quality focused on structure, process, and outcome.16 We expanded on these 3 areas and analyzed quality designations based on variables fitting into the following categories: accreditation, volume, structural, process, outcomes, patient experience, and cost/efficiency. We believe that these categories encompass a comprehensive rating system that addresses key elements of patient care. However, our results suggest that only 2 major quality designations (BCBS Distinction+ and Aetna Institutes of Quality for Orthopedic Surgery) take all such variables into account.
All quality designation programs that we analyzed required outcome data (ie, readmission and/or mortality rates within 30 days); however, only 2 programs utilized cost in their quality designation criteria (BCBS Distinction+ and Aetna Institutes of Quality for Orthopedic Surgery). Aetna Institutes of Quality for Orthopedic Surgery risk-adjusted for its cost-effectiveness calculations based on age, sex, and other unspecified conditions using a product known as Symmetry Episode Risk Groups. However, the organization also noted that although it did risk-adjust for inpatient mortality, it did not do so for pulmonary embolism or deep vein thrombosis. BCBS Distinction+ also utilized risk adjustment for its cost efficiency measure, and its step-by-step methodology is available online. Further, Consumer Reports does risk-adjust using logistic regression models in their quality analysis, but the description provided is minimal; it is noted that such risk adjustments are already completed by CMS prior to Consumer Reports acquiring the data. The CMS Compare model information is available on the CMS website. The data utilized by several organizations and presented on CMS Compare are already risk-adjusted using CMS’ approach. In contrast, UnitedHealth Premium TJR Specialty Center gathers its own data from providers and does not describe a risk adjustment methodology. Risk adjustment is important because the lack of risk adjustment may lead to physicians “cherry-picking” easy cases to boost positive outcomes, leading to increased financial benefits and higher quality ratings. Having a consistent risk adjustment formula will ensure accurate comparisons across outcomes and cost-effectiveness measures used by quality designation programs.
Factors considered for quality designation varied greatly from one organization to the other. The range of categories of factors considered varied from 1 (Consumer Reports only considered outcome data) to all 7 categories (BCBS Distinction+ and Aetna Institutes of Quality for Orthopedic Surgery). Our findings are consistent with the work by Keswani and colleagues,8 which showed that there is likely variation in factors considered when rating hospital quality more broadly. Our work suggests that quality designation formulas do not appear to get more consistent when focused on TJA.
We found that all organizations in our analysis published the providers earning their quality designation. However, TJC does not provide publicly a detailed methodology on how to qualify for its quality designation. The price to purchase the necessary manual for this information is $146.00 for accredited organizations and $186.00 for all others.17 For large healthcare providers, this is not a large sum of money. Nonetheless, this provides an additional hurdle for stakeholders to gain a full understanding of the requirements to receive a TJC Gold Seal for Orthopedics.
Previous work has evaluated the consistency of and the variety of means of gauging healthcare quality. Previous work by Rothberg and colleagues18 comparing hospital rankings across 5 common consumer-oriented websites found disagreement on hospital rankings within any diagnosis and even among metrics such as mortality. Another study by Halasyamani and Davis19 found that CMS Compare and USNWR rankings were dissimilar and the authors attributed the discrepancy to different methodologies. In addition, a study by Krumholz and colleagues20 focused on Internet report cards, which measured the appropriate use of select medications and mortality rates for acute myocardial infarction as the quality metrics. The authors found that, in aggregate, there was a clear difference in quality of care and outcomes but that comparisons between 2 hospitals provided poor discrimination.20 Other work has analyzed the increasing trend of online ratings of orthopedic surgeons by patients.21 However, there remains no agreed-upon definition of quality. Thus, the use of the term “quality” in several studies may be misleading.
Our results must be interpreted keeping the limitations of our work in mind. First, we used expert knowledge and a public search engine to develop our list of organizations that provide TJA quality designations. However, there is a possibility that we did not include all relevant organizations. Second, although all authors reviewed the final data, it is possible that there was human error in the analysis of each organization’s quality designation criteria.
CONCLUSION
As healthcare progresses further toward a system that rewards providers for delivering value to patients, accurately defining and measuring quality becomes critical because it can be suggestive of value to patients, payers, and providers. Furthermore, it gives providers a goal to focus on as they strive to improve the value of care they deliver to patients. Measuring healthcare quality is currently a novel, imperfect science,22 and there continues to be a debate about what factors should be included in a quality designation formula. Nonetheless, more and more quality designations and performance measurements are being created for orthopedic care, including total hip and total knee arthroplasty. In fact, in 2016, The Leapfrog Group added readmission for patients undergoing TJA to its survey.23 Consensus on a quality definition may facilitate the movement toward a value-based healthcare system. Future research should evaluate strategies for gaining consensus among stakeholders for a universal quality metric in TJA. Surgeons, hospitals, payers, and most importantly patients should play critical roles in defining quality.
- Porter ME. A strategy for health care reform--toward a value-based system. N Engl J Med. 2009;361(2):109-112. doi:10.1056/NEJMp0904131.
- Obama B. United States health care reform: progress to date and next steps. JAMA. 2016;316(5):525-532. doi:10.1001/jama.2016.9797.
- Mulvany C. The march to consumerism the evolution from patient to active shopper continues. Healthc Financ Manage. 2014;68(2):36-38.
- Tsai TC, Jha AK. Hospital consolidation, competition, and quality: is bigger necessarily better? JAMA. 2014;312(1):29-30. doi:10.1001/jama.2014.4692.
- Cline RJ, Haynes KM. Consumer health information seeking on the Internet: the state of the art. Health Educ Res. 2001;16(6):671-692. doi:10.1093/her/16.6.671.
- Werner RM, Kolstad JT, Stuart EA, Polsky D. The effect of pay-for-performance in hospitals: lessons for quality improvement. Health Aff (Millwood). 2011;30(4):690-698. doi:10.1377/hlthaff.2010.1277.
- Birkmeyer JD, Dimick JB, Birkmeyer NJ. Measuring the quality of surgical care: structure, process, or outcomes? J Am Coll Surg. 2004;198(4):626-632. doi:10.1016/j.jamcollsurg.2003.11.017.
- Keswani A, Uhler LM, Bozic KJ. What quality metrics is my hospital being evaluated on and what are the consequences? J Arthroplast. 2016;31(6):1139-1143. doi:10.1016/j.arth.2016.01.075.
- Aetna Inc. Aetna Institutes of Quality® facilities fact book. A comprehensive reference guide for Aetna members, doctors and health care professionals. http://www.aetna.com/individuals-families-health-insurance/document-libr.... Accessed July 2, 2016.
- United HealthCare. UnitedHealth Premium® Program. https://www.uhcprovider.com/en/reports-quality-programs/premium-designation.html. Accessed July 2, 2016.
- 11. Blue Cross Blue Shield. Association. Blue Distinction Specialty Care. Selection criteria and program documentation: knee and hip replacement and spine surgery. https://www.bcbs.com/sites/default/files/fileattachments/page/KneeHip.SelectionCriteria_0.pdf. Published October 2015. Accessed July 2, 2016.
- The Joint Commission. Advanced certification for total hip and total knee replacement eligibility. https://www.jointcommission.org/advanced_certification_for_total_hip_and.... Published December 10, 2015. Accessed July 2, 2016.
- Healthgrades Operating Company. Healthgrades methodology: anatomy of a rating. https://www.healthgrades.com/quality/ratings-awards/methodology. Accessed July 2, 2016.
- Comarow A, Harder B; Dr. Foster Project Team. Methodology: U.S. News & World Report best hospitals for common care. U.S. News & World Report Web site. http://www.usnews.com/pubfiles/BHCC_MethReport_2015.pdf. Published May 20, 2015. Accessed July 2, 2016.
- Consumer Reports. How we rate hospitals. http://static3.consumerreportscdn.org/content/dam/cro/news_articles/heal.... Accessed July 2, 2016.
- Ayanian JZ, Markel H. Donabedian’s lasting framework for health care quality. N Engl J Med. 2016;375(3):205-207. doi:10.1056/NEJMp1605101.
- The Joint Commission. 2016 Certification Manuals. 2016; http://www.jcrinc.com/2016-certification-manuals/. Accessed July 2, 2016.
- Rothberg MB, Morsi E, Benjamin EM, Pekow PS, Lindenauer PK. Choosing the best hospital: the limitations of public quality reporting. Health Aff (Millwood). 2008;27(6):1680-1687. doi:10.1377/hlthaff.27.6.1680.
- Halasyamani LK, Davis MM. Conflicting measures of hospital quality: ratings from "Hospital Compare" versus "Best Hospitals". J Hosp Med. 2007;2(3):128-134. doi:10.1002/jhm.176.
- Krumholz HM, Rathore SS, Chen J, Wang Y, Radford MJ. Evaluation of a consumer-oriented internet health care report card: the risk of quality ratings based on mortality data. JAMA. 2002;287(10):1277-1287.
- Frost C, Mesfin A. Online reviews of orthopedic surgeons: an emerging trend. Orthopedics. 2015;38(4):e257-e262. doi:10.3928/01477447-20150402-52.
- Harder B, Comarow A. Hospital Quality reporting by US News & World Report: why, how, and what's ahead. JAMA. 2015;313(19):1903-1904. doi:10.1001/jama.2015.4566.
- The Leapfrog Group. New in 2016. http://www.leapfroggroup.org/ratings-reports/new-2016. Accessed July 2, 2016.
ABSTRACT
A patient’s perception of hospital or provider quality can have far-reaching effects, as it can impact reimbursement, patient selection of a surgeon, and healthcare competition. A variety of organizations offer quality designations for orthopedic surgery and its subspecialties. Our goal is to compare total joint arthroplasty (TJA) quality designation methodology across key quality rating organizations. One researcher conducted an initial Google search to determine organizations providing quality designations for hospitals and surgeons providing orthopedic procedures with a focus on TJA. Organizations that offer quality designation specific to TJA were determined. Organizations that provided general orthopedic surgery or only surgeon-specific quality designation were excluded from the analysis. The senior author confirmed the inclusion of the final organizations. Seven organizations fit our inclusion criteria. Only the private payers and The Joint Commission required hospital accreditation to meet quality designation criteria. Total arthroplasty volume was considered in 86% of the organizations’ methodologies, and 57% of organizations utilized process measurements such as antibiotic prophylaxis and care pathways. In addition, 57% of organizations included patient experience in their methodologies. Only 29% of organizations included a cost element in their methodology. All organizations utilized outcome data and publicly reported all hospitals receiving their quality designation. Hospital quality designation methodologies are inconsistent in the context of TJA. All stakeholders (ie, providers, payers, and patients) should be involved in deciding the definition of quality.
Continue to: Healthcare in the United States...
Healthcare in the United States has begun to move toward a system focused on value for patients, defined as health outcome per dollar expended.1 Indeed, an estimated 30% of Medicare payments are now made using the so-called alternative payment models (eg, bundled payments),2 and there is an expectation that consumerism in medicine will continue to expand.3 In addition, although there is a continuing debate regarding the benefits and pitfalls of hospital mergers, there is no question whether provider consolidation has increased dramatically in recent years.4 At the core of many of these changes is the push to improve healthcare quality and reduce costs.
Quality has the ability to affect payment, patient selection of providers, and hospital competition. Patients (ie, healthcare consumers) are increasingly using the Internet to find a variety of health information.5 Accessible provider quality information online would allow patients to make more informed decisions about where to seek care. In addition, the development of transparent quality ratings could assist payers in driving beneficiaries to higher quality and better value providers, which could mean more business for the highest quality physicians and better patient outcomes with fewer complications. Some payers such as the Centers for Medicare and Medicaid Services (CMS) have already started using quality measures as part of their reimbursement strategy.6 Because CMS is the largest payer in the United States, private insurers tend to follow their lead; thus, quality measurements will become even more common as a factor in reimbursement over the coming years.
To make quality ratings useful, “quality” must be clearly defined. Clarity around which factors are considered in a quality designation will create transparency for patients and allow providers to understand how their performance is being measured so that they focus on improving outcomes for their patients. Numerous organizations, including private payers, public payers, and both not-for-profit and for-profit entities, have created quality designation programs to rate providers. However, within orthopedics and several other medical specialties, there has been an ongoing debate about what measures best reflect quality.7 Although inconsistencies in quality ratings in arthroplasty care have been noted,8 it remains unknown how each quality designation program compares with the others in terms of the factors considered in deciding quality designations.
The purpose of this study is to evaluate publicly available information from key quality designation programs for total joint arthroplasty (TJA) providers to determine what factors are considered by each organization in awarding quality designations; what similarities and differences in quality designations exist across the different organizations; and how many of the organizations publish their quality designation methodologies and final rating results.
MATERIALS AND METHODS
A directed Google search was conducted to determine organizations (ie, payers, independent firms, and government entities) that rate hospitals and/or surgeons in orthopedic surgery. The identified organizations were then examined to determine whether they provided hospital ratings for total hip and/or knee arthroplasty. Entities were included if they provided quality designations for hospitals specifically addressing TJA. Organizations that provided only general hospital, other surgical procedures, orthopedic surgery, or orthopedic surgeon-specific quality designations were excluded. A list of all organizations determined to fit the inclusion criteria was then reviewed for completeness and approved by the senior author.
Continue to: One investigator reviewed the website of each organization...
One investigator reviewed the website of each organization fitting the inclusion criteria to determine the full rating methodology in 1 sitting on July 2, 2016. Detailed notes were taken on each program using publicly available information. For organizations that used proprietary criteria for quality designation (eg, The Joint Commission [TJC]), only publicly available information was used in the analysis. Therefore, the information reported is solely based on data available online to the public.
Detailed quality designation criteria were condensed into broader categories (accreditation, volume, structural, process, outcomes, patient experience, and cost/efficiency) to capture differences between each organization reviewed. In addition, we recorded whether each organization published a list of providers that received its quality designation.
RESULTS
A total of 7 organizations fit our inclusion criteria9-15 (Table). Of these 7 organizations, 3 were private payers (Aetna, UnitedHealth, and Blue Cross Blue Shield [BCBS]), 2 were nongovernmental not-for-profit organizations (TJC and Consumer Reports), and 2 were consumer-based and/or for-profit organizations (HealthGrades and US News & World Report [USNWR]). There were no government agencies that fit our inclusion criteria. BCBS had the following 2 separate quality designations: BCBS Blue Distinction and BCBS Blue Distinction+. The only difference between the 2 BCBS ratings is that BCBS Blue Distinction+ includes cost efficiency ratings, whereas BCBS Blue Distinction does not.
Only the 3 private payers and TJC, the primary hospital accreditation body in the United States, required accreditation as part of its quality designation criteria. TJC requires its own accreditation for quality designation consideration, whereas the 3 private payers allow accreditation from one of a variety of sources. Aetna Institutes of Quality for Orthopedic Surgery requires accreditation by TJC, Healthcare Facilities Accreditation Program, American Osteopathic Association, National Integrated Accreditation for Healthcare Organizations, or Det Norske Veritas Healthcare. UnitedHealth Premium Total Joint Replacement (TJR) Specialty Center requires accreditation by TJC and/or equivalent of TJC accreditation. However, TJC accreditation equivalents are not noted in the UnitedHealth handbook. BCBS Blue Distinction and Distinction+ require accreditation by TJC, Healthcare Facilities Accreditation Program, National Integrated Accreditation for Healthcare Organizations, or Center for Improvement in Healthcare Quality. In addition, BCBS is willing to consider alternative accreditations that are at least as stringent as the national alternatives noted. However, no detailed criteria that must be met to be equivalent to the national standards are noted in the relevant quality designation handbook.
The volume of completed total hip and knee arthroplasty procedures was considered in 6 of the organizations’ quality ratings methodologies. Of those 6, all private payers, TJC (not-for-profit), and 2 for-profit rating agencies were included. Surgeon specialization in TJA was only explicitly noted as a factor considered in UnitedHealth Premium TJR Specialty Center criteria; however, the requirements for surgeon specialization were not clearly defined. In addition, the presence of a multidisciplinary clinical pathway was only explicitly considered for Aetna Institutes of Quality for Orthopedic Surgery.
Structural requirements (eg, use of electronic health records [EHR], staffing levels, etc.) were taken into account in private payer and USNWR quality methodologies. Process measures (eg, antibiotic prophylaxis and other care pathways) were considered for the private payers and TJC but not for USNWR quality designation. Cost and/or efficiency measures were factors in the quality formula for Aetna Institutes of Quality for Orthopedic Surgery and BCBS Distinction+. Aetna utilizes its own cost data and risk-adjusts using a product known as Symmetry Episode Risk Groups to determine cost-effectiveness, while BCBS uses its own Composite Facility Cost Index. Patient experience (eg, Hospital Consumer Assessment of Healthcare Providers and Systems [HCAHPS]) was incorporated into the quality formulas for 4 of the 7 quality designation programs examined.
Continue to: All of the 7 quality designation programs included...
All of the 7 quality designation programs included outcomes (ie, readmission rates and/or mortality rates) and publicly reported the hospitals receiving their quality designation. In contrast, only Aetna explicitly included the presence of multidisciplinary clinical care pathways as part of their quality designation criteria. In addition, only UnitedHealth included surgeon specialization in joint arthroplasty as a factor for quality consideration for its quality designation program. BCBS Distinction+ and Aetna Institutes of Quality for Orthopedic Surgery were the only 2 quality designations that included at least 1 variable that fit into each of the 7 characteristics considered (accreditation, volume, structural, process, outcomes, patient experience, and cost/efficiency).
DISCUSSION
As healthcare continues to shift toward value-based delivery and payment models, quality becomes a critical factor in reimbursement and provider rankings. However, quality is a vague term. Several providers probably do not know what is required to be designated as high quality by a particular rating agency. Moreover, there are multiple quality designation programs, all using distinct criteria to determine “quality,” which further complicates the matter. Our objective was to determine the key stakeholders that provide quality designations in TJA and what criteria each organization uses in assessing quality.
Our idea of comprehensive quality is based on Avedis Donabedian’s enduring framework for healthcare quality focused on structure, process, and outcome.16 We expanded on these 3 areas and analyzed quality designations based on variables fitting into the following categories: accreditation, volume, structural, process, outcomes, patient experience, and cost/efficiency. We believe that these categories encompass a comprehensive rating system that addresses key elements of patient care. However, our results suggest that only 2 major quality designations (BCBS Distinction+ and Aetna Institutes of Quality for Orthopedic Surgery) take all such variables into account.
All quality designation programs that we analyzed required outcome data (ie, readmission and/or mortality rates within 30 days); however, only 2 programs utilized cost in their quality designation criteria (BCBS Distinction+ and Aetna Institutes of Quality for Orthopedic Surgery). Aetna Institutes of Quality for Orthopedic Surgery risk-adjusted for its cost-effectiveness calculations based on age, sex, and other unspecified conditions using a product known as Symmetry Episode Risk Groups. However, the organization also noted that although it did risk-adjust for inpatient mortality, it did not do so for pulmonary embolism or deep vein thrombosis. BCBS Distinction+ also utilized risk adjustment for its cost efficiency measure, and its step-by-step methodology is available online. Further, Consumer Reports does risk-adjust using logistic regression models in their quality analysis, but the description provided is minimal; it is noted that such risk adjustments are already completed by CMS prior to Consumer Reports acquiring the data. The CMS Compare model information is available on the CMS website. The data utilized by several organizations and presented on CMS Compare are already risk-adjusted using CMS’ approach. In contrast, UnitedHealth Premium TJR Specialty Center gathers its own data from providers and does not describe a risk adjustment methodology. Risk adjustment is important because the lack of risk adjustment may lead to physicians “cherry-picking” easy cases to boost positive outcomes, leading to increased financial benefits and higher quality ratings. Having a consistent risk adjustment formula will ensure accurate comparisons across outcomes and cost-effectiveness measures used by quality designation programs.
Factors considered for quality designation varied greatly from one organization to the other. The range of categories of factors considered varied from 1 (Consumer Reports only considered outcome data) to all 7 categories (BCBS Distinction+ and Aetna Institutes of Quality for Orthopedic Surgery). Our findings are consistent with the work by Keswani and colleagues,8 which showed that there is likely variation in factors considered when rating hospital quality more broadly. Our work suggests that quality designation formulas do not appear to get more consistent when focused on TJA.
We found that all organizations in our analysis published the providers earning their quality designation. However, TJC does not provide publicly a detailed methodology on how to qualify for its quality designation. The price to purchase the necessary manual for this information is $146.00 for accredited organizations and $186.00 for all others.17 For large healthcare providers, this is not a large sum of money. Nonetheless, this provides an additional hurdle for stakeholders to gain a full understanding of the requirements to receive a TJC Gold Seal for Orthopedics.
Previous work has evaluated the consistency of and the variety of means of gauging healthcare quality. Previous work by Rothberg and colleagues18 comparing hospital rankings across 5 common consumer-oriented websites found disagreement on hospital rankings within any diagnosis and even among metrics such as mortality. Another study by Halasyamani and Davis19 found that CMS Compare and USNWR rankings were dissimilar and the authors attributed the discrepancy to different methodologies. In addition, a study by Krumholz and colleagues20 focused on Internet report cards, which measured the appropriate use of select medications and mortality rates for acute myocardial infarction as the quality metrics. The authors found that, in aggregate, there was a clear difference in quality of care and outcomes but that comparisons between 2 hospitals provided poor discrimination.20 Other work has analyzed the increasing trend of online ratings of orthopedic surgeons by patients.21 However, there remains no agreed-upon definition of quality. Thus, the use of the term “quality” in several studies may be misleading.
Our results must be interpreted keeping the limitations of our work in mind. First, we used expert knowledge and a public search engine to develop our list of organizations that provide TJA quality designations. However, there is a possibility that we did not include all relevant organizations. Second, although all authors reviewed the final data, it is possible that there was human error in the analysis of each organization’s quality designation criteria.
CONCLUSION
As healthcare progresses further toward a system that rewards providers for delivering value to patients, accurately defining and measuring quality becomes critical because it can be suggestive of value to patients, payers, and providers. Furthermore, it gives providers a goal to focus on as they strive to improve the value of care they deliver to patients. Measuring healthcare quality is currently a novel, imperfect science,22 and there continues to be a debate about what factors should be included in a quality designation formula. Nonetheless, more and more quality designations and performance measurements are being created for orthopedic care, including total hip and total knee arthroplasty. In fact, in 2016, The Leapfrog Group added readmission for patients undergoing TJA to its survey.23 Consensus on a quality definition may facilitate the movement toward a value-based healthcare system. Future research should evaluate strategies for gaining consensus among stakeholders for a universal quality metric in TJA. Surgeons, hospitals, payers, and most importantly patients should play critical roles in defining quality.
- Porter ME. A strategy for health care reform--toward a value-based system. N Engl J Med. 2009;361(2):109-112. doi:10.1056/NEJMp0904131.
- Obama B. United States health care reform: progress to date and next steps. JAMA. 2016;316(5):525-532. doi:10.1001/jama.2016.9797.
- Mulvany C. The march to consumerism the evolution from patient to active shopper continues. Healthc Financ Manage. 2014;68(2):36-38.
- Tsai TC, Jha AK. Hospital consolidation, competition, and quality: is bigger necessarily better? JAMA. 2014;312(1):29-30. doi:10.1001/jama.2014.4692.
- Cline RJ, Haynes KM. Consumer health information seeking on the Internet: the state of the art. Health Educ Res. 2001;16(6):671-692. doi:10.1093/her/16.6.671.
- Werner RM, Kolstad JT, Stuart EA, Polsky D. The effect of pay-for-performance in hospitals: lessons for quality improvement. Health Aff (Millwood). 2011;30(4):690-698. doi:10.1377/hlthaff.2010.1277.
- Birkmeyer JD, Dimick JB, Birkmeyer NJ. Measuring the quality of surgical care: structure, process, or outcomes? J Am Coll Surg. 2004;198(4):626-632. doi:10.1016/j.jamcollsurg.2003.11.017.
- Keswani A, Uhler LM, Bozic KJ. What quality metrics is my hospital being evaluated on and what are the consequences? J Arthroplast. 2016;31(6):1139-1143. doi:10.1016/j.arth.2016.01.075.
- Aetna Inc. Aetna Institutes of Quality® facilities fact book. A comprehensive reference guide for Aetna members, doctors and health care professionals. http://www.aetna.com/individuals-families-health-insurance/document-libr.... Accessed July 2, 2016.
- United HealthCare. UnitedHealth Premium® Program. https://www.uhcprovider.com/en/reports-quality-programs/premium-designation.html. Accessed July 2, 2016.
- 11. Blue Cross Blue Shield. Association. Blue Distinction Specialty Care. Selection criteria and program documentation: knee and hip replacement and spine surgery. https://www.bcbs.com/sites/default/files/fileattachments/page/KneeHip.SelectionCriteria_0.pdf. Published October 2015. Accessed July 2, 2016.
- The Joint Commission. Advanced certification for total hip and total knee replacement eligibility. https://www.jointcommission.org/advanced_certification_for_total_hip_and.... Published December 10, 2015. Accessed July 2, 2016.
- Healthgrades Operating Company. Healthgrades methodology: anatomy of a rating. https://www.healthgrades.com/quality/ratings-awards/methodology. Accessed July 2, 2016.
- Comarow A, Harder B; Dr. Foster Project Team. Methodology: U.S. News & World Report best hospitals for common care. U.S. News & World Report Web site. http://www.usnews.com/pubfiles/BHCC_MethReport_2015.pdf. Published May 20, 2015. Accessed July 2, 2016.
- Consumer Reports. How we rate hospitals. http://static3.consumerreportscdn.org/content/dam/cro/news_articles/heal.... Accessed July 2, 2016.
- Ayanian JZ, Markel H. Donabedian’s lasting framework for health care quality. N Engl J Med. 2016;375(3):205-207. doi:10.1056/NEJMp1605101.
- The Joint Commission. 2016 Certification Manuals. 2016; http://www.jcrinc.com/2016-certification-manuals/. Accessed July 2, 2016.
- Rothberg MB, Morsi E, Benjamin EM, Pekow PS, Lindenauer PK. Choosing the best hospital: the limitations of public quality reporting. Health Aff (Millwood). 2008;27(6):1680-1687. doi:10.1377/hlthaff.27.6.1680.
- Halasyamani LK, Davis MM. Conflicting measures of hospital quality: ratings from "Hospital Compare" versus "Best Hospitals". J Hosp Med. 2007;2(3):128-134. doi:10.1002/jhm.176.
- Krumholz HM, Rathore SS, Chen J, Wang Y, Radford MJ. Evaluation of a consumer-oriented internet health care report card: the risk of quality ratings based on mortality data. JAMA. 2002;287(10):1277-1287.
- Frost C, Mesfin A. Online reviews of orthopedic surgeons: an emerging trend. Orthopedics. 2015;38(4):e257-e262. doi:10.3928/01477447-20150402-52.
- Harder B, Comarow A. Hospital Quality reporting by US News & World Report: why, how, and what's ahead. JAMA. 2015;313(19):1903-1904. doi:10.1001/jama.2015.4566.
- The Leapfrog Group. New in 2016. http://www.leapfroggroup.org/ratings-reports/new-2016. Accessed July 2, 2016.
TAKE-HOME POINTS
- TJA quality designation methodologies differ substantially across rating organizations.
- Only 29% of TJA quality rating methodologies evaluated include a cost element.
- Only 57% of TJA quality rating methodologies evaluated include patient experience.
- Only 57% of TJA quality rating methodologies evaluated include process measurements, including antibiotic prophylaxis and standardized care pathways.
- There is a need for consistent definitions of quality as healthcare stakeholders continue to shift focus from volume to value.
Risk Stratification for Cellulitis Versus Noncellulitic Conditions of the Lower Extremity: A Retrospective Review of the NEW HAvUN Criteria
Cellulitis is defined as an acute or subacute, bacterial-induced inflammation of subcutaneous tissue that can extend superficially. The inciting incident often is assumed to be invasion of bacteria through loose connective tissue.1 Although cellulitis is bacterial in origin, it often is difficult to culture the offending microorganism from biopsy sites, swabs, or blood. Erythema, fever, induration, and tenderness are largely seen as clinical manifestations. Moderate and severe cases may be accompanied by fever, malaise, and leukocytosis. The lower extremity is the most common location of involvement (Figure 1), and usually a wound, ulcer, or interdigital superficial infection can be identified and implicated as the source of entry.

Effective treatment of cellulitis is necessary because complications such as abscesses, underlying fascia or muscle involvement, and septicemia can develop, leading to poor outcomes. Antibiotics should be administered intravenously in patients with suspected fascial involvement, septicemia, or dermal necrosis, or in those with an immunological comorbidity.2
The differential diagnosis of lower extremity cellulitis is wide due to the existence of several mimicking dermatologic conditions. These so-called pseudocellulitis conditions include stasis dermatitis, venous ulceration, acute lipodermatosclerosis, pigmented purpura, vasculopathy, contact dermatitis, adverse medication reaction, and arthropod bite. Stasis dermatitis and lipodermatosclerosis, both arising from venous insufficiency, are by far 2 of the most common skin conditions that imitate cellulitis.
Stasis dermatitis is a common condition in the United States and Europe, usually manifesting as a pigmented purpuric dermatosis on anterior tibial surfaces, around the ankle, or overlying dependent varicosities. Skin changes can include hyperpigmentation, edema, mild scaling, eczematous patches, and even ulceration.3
Lipodermatosclerosis is a disorder of progressive fibrosis of subcutaneous fat. It is more common in middle-aged women who have a high body mass index and a venous abnormality.4 This form of panniculitis typically affects the lower extremities bilaterally, manifesting as erythematous and indurated skin changes, sometimes described as inverted champagne bottles (Figure 2). At times, there can be accompanying painful ulceration on the erythematous areas, features that closely resemble cellulitis.5,6 Lipodermatosclerosis is commonly misdiagnosed as cellulitis, leading to inappropriate prescription of antibiotics.7

Distinguishing cellulitis from noncellulitic conditions of the lower extremity is paramount to effective patient management in the emergent setting. With a reported incidence of 24.6 per 100 person-years, cellulitis constitutes 1% to 14% of emergency department visits and 4% to 7% of hospital admissions.Therefore, prompt appropriate diagnosis and treatment can avoid life-threatening complications associated with infection such as sepsis, abscess, lymphangitis, and necrotizing fasciitis.8-11
It is estimated that 10% to 20% of patients who have been given a diagnosis of cellulitis do not actually have the disease.2,12 This discrepancy consumes a remarkable amount of hospital resources and can lead to inappropriate or excessive use of antibiotics.13 Although the true incidence of adverse antibiotic reactions is unknown, it is estimated that they are the cause of 3% to 6% of acute hospital admissions and occur in 10% to 15% of inpatients admitted for other primary reasons.14 These findings illustrate the potential for an increased risk for morbidity and increased length of stay for patients beginning an antibiotic regimen, especially when the agents are administered unnecessarily. In addition, inappropriate antibiotic use contributes to antibiotic resistance, which continues to be a major problem, especially in hospitalized patients.
There is a lack of consensus in the literature about methods to risk stratify patients who present with acute dermatologic conditions that include and resemble cellulitis. We sought to identify clinical features based on available clinical literature-derived variables. We tested our scheme in a series of patients with a known diagnosis of cellulitis or other dermatologic pathology of the lower extremity to assess the validity of the following 7 clinical criteria: acute onset, erythema, pyrexia, history of associated trauma, tenderness, unilaterality, and leukocytosis.
Materials and Methods
This retrospective chart review was approved by the Yale University (New Haven, Connecticut) institutional review board (HIC#1409014533). Final diagnosis, demographic data, clinical manifestations, and relevant diagnostic laboratory values of 57 patients were obtained from a database in the dermatology department’s consultation log and electronic medical record database (December 2011 to December 2014). The presence of each clinical symptom—acute onset, erythema, pyrexia, history of associated trauma, tenderness, unilaterality, and leukocytosis—was assigned a score equal to 1; values were tallied to achieve a final score for each patient (Table 1). Patients who were seen initially as a consultation for possible cellulitis but given a final diagnosis of stasis dermatitis or lipodermatosclerosis were included (Table 2).
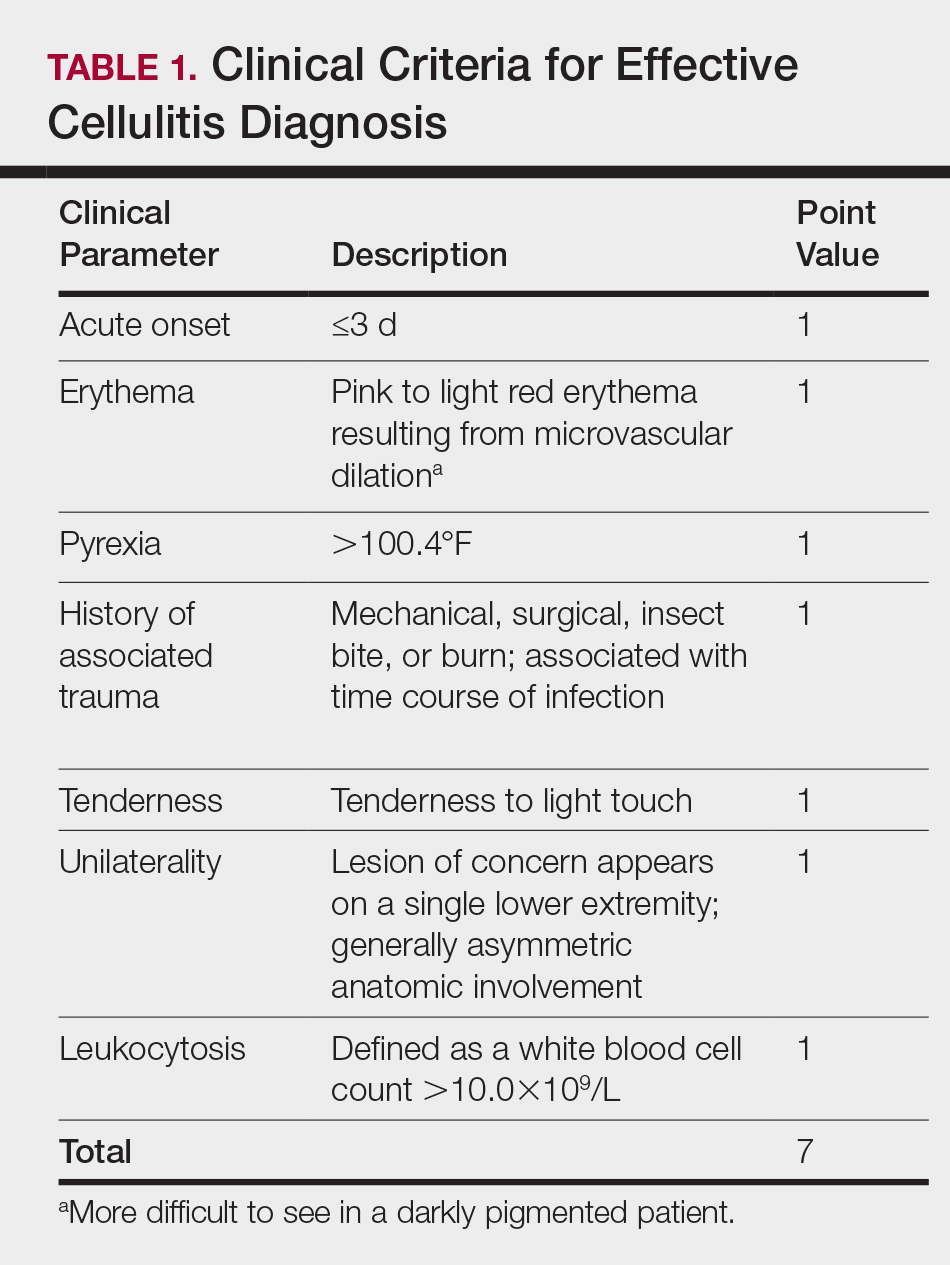

Clinical Criteria
The clinical criteria were developed based largely on clinical experience and relevant secondary literature.15-17 At the patient encounter, presence of each of the variables (Table 1) was assessed according to the following definitions:
- acute onset: within the prior 72 hours and more indicative of an acute infective process than a gradual and chronic consequence of venous stasis
- erythema: a subjective clinical marker for inflammation that can be associated with cellulitis, though darker, erythematous-appearing discolorations also can be seen in patients with chronic venous hypertension or valvular incompetence4,15
- pyrexia: body temperature greater than 100.4°F
- history of associated trauma: encompassing mechanical wounds, surgical incisions, burns, and insect bites that correlate closely to the time course of symptomatic development
- tenderness: tenderness to light touch, which may be more common in patients afflicted with cellulitis than in those with venous insufficiency
- unilaterality: a helpful distinguishing feature that points the diagnosis away from a dermatitislike clinical picture, especially because bilateral cellulitis is rare and regarded as a diagnostic pitfall18
- leukocytosis: white blood cell count greater than 10.0×10⁹/L and is reasonably considered a cardinal metric of inflammatory processes, though it can be confounded by immunocompromise (low count) or steroid use (high count)
Statistical Analysis
Odds ratios (ORs) were calculated and χ2 analysis was performed for each presenting symptom using JMP 10.0 analytical software (SAS Institute Inc). Each patient was rated separately by means of the clinical feature–based scoring system for the calculation of a total score. After application of the score to the patient population, receiver operating characteristic curves were constructed to identify the optimal score threshold for discriminating cellulitis from dermatitis in this group. For each clinical feature, P<.05 was considered significant.
Results
Our cohort included 32 male and 25 female patients with a mean age of 63 and 61 years, respectively. The final clinical diagnosis of cellulitis was made in 20 patients (35%). An established diagnosis of cellulitis was assigned based on a dermatology evaluation located within our electronic medical record database (Table 2).
Each clinical parameter was evaluated separately for each patient; combined results are summarized in Table 3. Acute onset (≤3 days) was a clinical characteristic seen in 80% (16/20) of cellulitis cases and 22% (8/37) of noncellulitis cases (OR, 14.5; P<.001). Erythema had similar significance (OR, 10.3; prevalence, 95% [19/20] vs 65% [24/37]; P=.012). Pyrexia possessed an OR of 99.2 for cellulitis and was seen in 85% (17/20) of cellulitis cases and only 5% (2/37) of noncellulitis cases (P<.001).

A history of associated trauma had an OR of 36.0 for cellulitis, with 50% (10/20) and 3% (1/37) prevalence in cellulitis cases and noncellulitis cases, respectively (P<.001). Tenderness, documented in 90% (18/20) of cellulitis cases and 43% (16/37) of noncellulitis cases, had an OR of 11.8 (P<.001).
Unilaterality had 100% (20/20) prevalence in our cellulitis cohort and was the only characteristic within the algorithm that yielded an incalculable OR. Noncellulitis or stasis dermatitis of the lower extremity exhibited a unilateral lesion in 11 cases (30%), of which 1 case resulted from a unilateral tibial fracture. Leukocytosis was seen in 65% (13/20) of cellulitis cases and 8% (3/37) of noncellulitis cases, with an OR for cellulitis of 21.0 (P<.001).
All parameters were significant by χ2 analysis (Table 3).
Comment
We found that testing positive for 4 of 7 clinical criteria for assessing cellulitis was highly specific (95%) and sensitive (100%) for a diagnosis of cellulitis among its range of mimics (Figure 3). These cellulitis criteria can be remembered, with some modification, using NEW HAvUN as a mnemonic device (New onset,
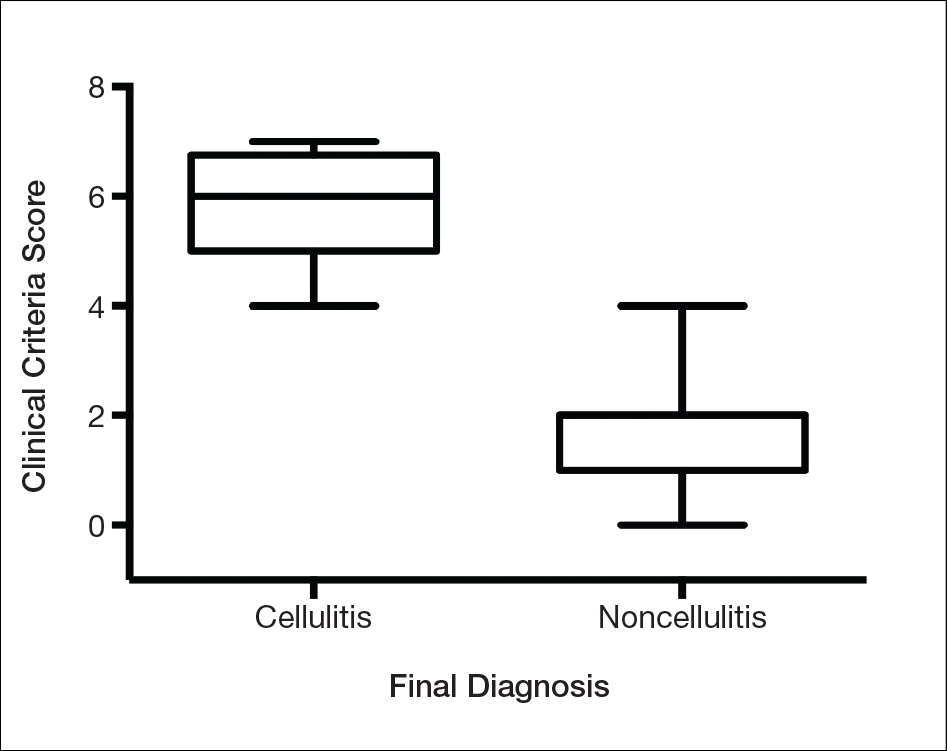
Consistent with the literature, pyrexia, history of associated trauma, and unilaterality also were predictors of cellulitis diagnosis. Unilaterality often is used as a diagnostic tool by dermatologist consultants when a patient lacks other criteria for cellulitis, so these findings are intuitive and consistent with our institutional experience. Interestingly, leukocytosis was seen in only 65% of cellulitis cases and 8% of noncellulitis cases and therefore might not serve as a sensitive independent predictor of a diagnosis of cellulitis, emphasizing the importance of the multifactorial scoring system we have put forward. Additionally, acuity of onset, erythema, and tenderness are not independently associated with cellulitis when assessing a patient because several of those findings are present in other dermatologic conditions of the lower extremity; when combined with the other criteria, however, these 3 findings can play a role in diagnosis.
Effective cellulitis diagnosis provides well-recognized challenges in the acute medical setting because many clinical mimics exist. The estimated rate of misdiagnosed cellulitis is certainly well-established: 30% to 75% in independent and multi-institutional studies. These studies also revealed that patients admitted for bilateral “cellulitis” overwhelmingly tended to be stasis clinical pictures.13,19
Cost implications from inappropriate diagnosis largely regard inappropriate antibiotic use and the potential for microbial resistance, with associated costs estimated to be more than $50 billion (2004 dollars).20,21 The true cost burden is extremely difficult to model or predict due to remarkable variations in the institutional misdiagnosis rate, prescribing pattern, and antibiotic cost and could represent avenues of further study. Misappropriation of antibiotics includes not only a monetary cost that encompasses all aspects of acute treatment and hospitalization but also an unquantifiable cost: human lives associated with the consequences of antibiotic resistance.
Conclusion
There is a lack of consensus or criteria for differentiating cellulitis from its most common clinical counterparts. Here, we propose a convenient clinical correlation system that we hope will lead to more efficient allocation of clinical resources, including antibiotics and hospital admissions, while lowering the incidence of adverse events and leading to better patient outcomes. We recognize that the small sample size of our study may limit broad application of these criteria, though we anticipate that further prospective studies can improve the diagnostic relevance and risk-assessment power of the NEW HAvUN criteria put forth here for assessing cellulitis in the acute medical setting.
Acknowledgement—Author H.H.E. recognizes the loving memory of Nadia Ezaldein for her profound influence on and motivation behind this research.
- Lep
pard BJ, Seal DV, Colman G, et al. The value of bacteriology and serology in the diagnosis of cellulitis and erysipelas. Br J Dermatol. 1985;112:559-567. - Hep
burn MJ, Dooley DP, Skidmore PJ, et al. Comparison of short-course (5 days) and standard (10 days) treatment for uncomplicated cellulitis. Arch Int Med. 2004;164:1669-1674. - Bergan JJ, Schmid-Schönbein GW, Smith PD, et al. Chronic venous disease. N Engl J Med. 2006;355:488-498.
- Bruc
e AJ, Bennett DD, Lohse CM, et al. Lipodermatosclerosis: review of cases evaluated at Mayo Clinic. J Am Acad Dermatol. 2002;46:187-192. - Heym
ann WR. Lipodermatosclerosis. J Am Acad Dermatol. 2009;60:1022-1023. - Vesi
ć S, Vuković J, Medenica LJ, et al. Acute lipodermatosclerosis: an open clinical trial of stanozolol in patients unable to sustain compression therapy. Dermatol Online J. 2008;14:1. - Keller
EC, Tomecki KJ, Alraies MC. Distinguishing cellulitis from its mimics. Cleve Clin J Med. 2012;79:547-552. - Dong SL, Kelly KD, Oland RC, et al. ED management of cellulitis: a review of five urban centers. Am J Emerg Med. 2001;19:535-540.
- Ellis Simonsen SM, van Orman ER, Hatch BE, et al. Cellulitis incidence in a defined population. Epidemiol Infect. 2006;134:293-299.
- Manfredi R, Calza L, Chiodo F. Epidemiology and microbiology of cellulitis and bacterial soft tissue infection during HIV disease: a 10-year survey. J Cutan Pathol. 2002;29:168-172.
- Pascarella L, Schonbein GW, Bergan JJ. Microcirculation and venous ulcers: a review. Ann Vasc Surg. 2005;19:921-927.
- Hepburn MJ, Dooley DP, Ellis MW. Alternative diagnoses that often mimic cellulitis. Am Fam Physician. 2003;67:2471.
- David CV, Chira S, Eells SJ, et al. Diagnostic accuracy in patients admitted to hospitals with cellulitis. Dermatol Online J. 2011;17:1.
- Hay RJ, Adriaans BM. Bacterial infections. In: Thong BY, Tan TC. Epidemiology and risk factors for drug allergy. 8th ed. Br J Clin Pharmacol. 2011;71:684-700.
- Hay RJ, Adriaans BM. Bacterial infections. In: Burns T, Breathnach S, Cox N, et al. Rook’s Textbook of Dermatology. 8th ed. Hoboken, NJ: John Wiley & Sons, Inc; 2004:1345-1426.
- Wolff K, Goldsmith LA, Katz SI, et al. Fitzpatrick’s Dermatology In General Medicine. 7th ed. New York, NY: McGraw-Hill; 2003.
- Sommer LL, Reboli AC, Heymann WR. Bacterial infections. In: Bolognia J, Schaffer J, Cerroni L, et al. Dermatology. Vol 4. Philadelphia, PA: Elsevier Saunders; 2012:1462-1502.
- Cox NH. Management of lower leg cellulitis. Clin Med. 2002;2:23-27.
- Strazzula L, Cotliar J, Fox LP, et al. Inpatient dermatology consultation aids diagnosis of cellulitis among hospitalized patients: a multi-institutional analysis. J Am Acad Dermatol. 2015;73:70-75.
- Pinder R, Sallis A, Berry D, et al. Behaviour change and antibiotic prescribing in healthcare settings: literature review and behavioural analysis. London, UK: Public Health England; February 2015. https://assets.publishing.service.gov.uk/government/
uploads/system/uploads/attachment_data/file/405031
/Behaviour_Change_for_Antibiotic_Prescribing_-_FINAL.pdf. Accessed May 7, 2018. - Smith R, Coast J. The true cost of antimicrobial resistance. BMJ. 2013;346:f1493.
Cellulitis is defined as an acute or subacute, bacterial-induced inflammation of subcutaneous tissue that can extend superficially. The inciting incident often is assumed to be invasion of bacteria through loose connective tissue.1 Although cellulitis is bacterial in origin, it often is difficult to culture the offending microorganism from biopsy sites, swabs, or blood. Erythema, fever, induration, and tenderness are largely seen as clinical manifestations. Moderate and severe cases may be accompanied by fever, malaise, and leukocytosis. The lower extremity is the most common location of involvement (Figure 1), and usually a wound, ulcer, or interdigital superficial infection can be identified and implicated as the source of entry.
Effective treatment of cellulitis is necessary because complications such as abscesses, underlying fascia or muscle involvement, and septicemia can develop, leading to poor outcomes. Antibiotics should be administered intravenously in patients with suspected fascial involvement, septicemia, or dermal necrosis, or in those with an immunological comorbidity.2
The differential diagnosis of lower extremity cellulitis is wide due to the existence of several mimicking dermatologic conditions. These so-called pseudocellulitis conditions include stasis dermatitis, venous ulceration, acute lipodermatosclerosis, pigmented purpura, vasculopathy, contact dermatitis, adverse medication reaction, and arthropod bite. Stasis dermatitis and lipodermatosclerosis, both arising from venous insufficiency, are by far 2 of the most common skin conditions that imitate cellulitis.
Stasis dermatitis is a common condition in the United States and Europe, usually manifesting as a pigmented purpuric dermatosis on anterior tibial surfaces, around the ankle, or overlying dependent varicosities. Skin changes can include hyperpigmentation, edema, mild scaling, eczematous patches, and even ulceration.3
Lipodermatosclerosis is a disorder of progressive fibrosis of subcutaneous fat. It is more common in middle-aged women who have a high body mass index and a venous abnormality.4 This form of panniculitis typically affects the lower extremities bilaterally, manifesting as erythematous and indurated skin changes, sometimes described as inverted champagne bottles (Figure 2). At times, there can be accompanying painful ulceration on the erythematous areas, features that closely resemble cellulitis.5,6 Lipodermatosclerosis is commonly misdiagnosed as cellulitis, leading to inappropriate prescription of antibiotics.7
Distinguishing cellulitis from noncellulitic conditions of the lower extremity is paramount to effective patient management in the emergent setting. With a reported incidence of 24.6 per 100 person-years, cellulitis constitutes 1% to 14% of emergency department visits and 4% to 7% of hospital admissions.Therefore, prompt appropriate diagnosis and treatment can avoid life-threatening complications associated with infection such as sepsis, abscess, lymphangitis, and necrotizing fasciitis.8-11
It is estimated that 10% to 20% of patients who have been given a diagnosis of cellulitis do not actually have the disease.2,12 This discrepancy consumes a remarkable amount of hospital resources and can lead to inappropriate or excessive use of antibiotics.13 Although the true incidence of adverse antibiotic reactions is unknown, it is estimated that they are the cause of 3% to 6% of acute hospital admissions and occur in 10% to 15% of inpatients admitted for other primary reasons.14 These findings illustrate the potential for an increased risk for morbidity and increased length of stay for patients beginning an antibiotic regimen, especially when the agents are administered unnecessarily. In addition, inappropriate antibiotic use contributes to antibiotic resistance, which continues to be a major problem, especially in hospitalized patients.
There is a lack of consensus in the literature about methods to risk stratify patients who present with acute dermatologic conditions that include and resemble cellulitis. We sought to identify clinical features based on available clinical literature-derived variables. We tested our scheme in a series of patients with a known diagnosis of cellulitis or other dermatologic pathology of the lower extremity to assess the validity of the following 7 clinical criteria: acute onset, erythema, pyrexia, history of associated trauma, tenderness, unilaterality, and leukocytosis.
Materials and Methods
This retrospective chart review was approved by the Yale University (New Haven, Connecticut) institutional review board (HIC#1409014533). Final diagnosis, demographic data, clinical manifestations, and relevant diagnostic laboratory values of 57 patients were obtained from a database in the dermatology department’s consultation log and electronic medical record database (December 2011 to December 2014). The presence of each clinical symptom—acute onset, erythema, pyrexia, history of associated trauma, tenderness, unilaterality, and leukocytosis—was assigned a score equal to 1; values were tallied to achieve a final score for each patient (Table 1). Patients who were seen initially as a consultation for possible cellulitis but given a final diagnosis of stasis dermatitis or lipodermatosclerosis were included (Table 2).
Clinical Criteria
The clinical criteria were developed based largely on clinical experience and relevant secondary literature.15-17 At the patient encounter, presence of each of the variables (Table 1) was assessed according to the following definitions:
- acute onset: within the prior 72 hours and more indicative of an acute infective process than a gradual and chronic consequence of venous stasis
- erythema: a subjective clinical marker for inflammation that can be associated with cellulitis, though darker, erythematous-appearing discolorations also can be seen in patients with chronic venous hypertension or valvular incompetence4,15
- pyrexia: body temperature greater than 100.4°F
- history of associated trauma: encompassing mechanical wounds, surgical incisions, burns, and insect bites that correlate closely to the time course of symptomatic development
- tenderness: tenderness to light touch, which may be more common in patients afflicted with cellulitis than in those with venous insufficiency
- unilaterality: a helpful distinguishing feature that points the diagnosis away from a dermatitislike clinical picture, especially because bilateral cellulitis is rare and regarded as a diagnostic pitfall18
- leukocytosis: white blood cell count greater than 10.0×10⁹/L and is reasonably considered a cardinal metric of inflammatory processes, though it can be confounded by immunocompromise (low count) or steroid use (high count)
Statistical Analysis
Odds ratios (ORs) were calculated and χ2 analysis was performed for each presenting symptom using JMP 10.0 analytical software (SAS Institute Inc). Each patient was rated separately by means of the clinical feature–based scoring system for the calculation of a total score. After application of the score to the patient population, receiver operating characteristic curves were constructed to identify the optimal score threshold for discriminating cellulitis from dermatitis in this group. For each clinical feature, P<.05 was considered significant.
Results
Our cohort included 32 male and 25 female patients with a mean age of 63 and 61 years, respectively. The final clinical diagnosis of cellulitis was made in 20 patients (35%). An established diagnosis of cellulitis was assigned based on a dermatology evaluation located within our electronic medical record database (Table 2).
Each clinical parameter was evaluated separately for each patient; combined results are summarized in Table 3. Acute onset (≤3 days) was a clinical characteristic seen in 80% (16/20) of cellulitis cases and 22% (8/37) of noncellulitis cases (OR, 14.5; P<.001). Erythema had similar significance (OR, 10.3; prevalence, 95% [19/20] vs 65% [24/37]; P=.012). Pyrexia possessed an OR of 99.2 for cellulitis and was seen in 85% (17/20) of cellulitis cases and only 5% (2/37) of noncellulitis cases (P<.001).
A history of associated trauma had an OR of 36.0 for cellulitis, with 50% (10/20) and 3% (1/37) prevalence in cellulitis cases and noncellulitis cases, respectively (P<.001). Tenderness, documented in 90% (18/20) of cellulitis cases and 43% (16/37) of noncellulitis cases, had an OR of 11.8 (P<.001).
Unilaterality had 100% (20/20) prevalence in our cellulitis cohort and was the only characteristic within the algorithm that yielded an incalculable OR. Noncellulitis or stasis dermatitis of the lower extremity exhibited a unilateral lesion in 11 cases (30%), of which 1 case resulted from a unilateral tibial fracture. Leukocytosis was seen in 65% (13/20) of cellulitis cases and 8% (3/37) of noncellulitis cases, with an OR for cellulitis of 21.0 (P<.001).
All parameters were significant by χ2 analysis (Table 3).
Comment
We found that testing positive for 4 of 7 clinical criteria for assessing cellulitis was highly specific (95%) and sensitive (100%) for a diagnosis of cellulitis among its range of mimics (Figure 3). These cellulitis criteria can be remembered, with some modification, using NEW HAvUN as a mnemonic device (New onset,
Consistent with the literature, pyrexia, history of associated trauma, and unilaterality also were predictors of cellulitis diagnosis. Unilaterality often is used as a diagnostic tool by dermatologist consultants when a patient lacks other criteria for cellulitis, so these findings are intuitive and consistent with our institutional experience. Interestingly, leukocytosis was seen in only 65% of cellulitis cases and 8% of noncellulitis cases and therefore might not serve as a sensitive independent predictor of a diagnosis of cellulitis, emphasizing the importance of the multifactorial scoring system we have put forward. Additionally, acuity of onset, erythema, and tenderness are not independently associated with cellulitis when assessing a patient because several of those findings are present in other dermatologic conditions of the lower extremity; when combined with the other criteria, however, these 3 findings can play a role in diagnosis.
Effective cellulitis diagnosis provides well-recognized challenges in the acute medical setting because many clinical mimics exist. The estimated rate of misdiagnosed cellulitis is certainly well-established: 30% to 75% in independent and multi-institutional studies. These studies also revealed that patients admitted for bilateral “cellulitis” overwhelmingly tended to be stasis clinical pictures.13,19
Cost implications from inappropriate diagnosis largely regard inappropriate antibiotic use and the potential for microbial resistance, with associated costs estimated to be more than $50 billion (2004 dollars).20,21 The true cost burden is extremely difficult to model or predict due to remarkable variations in the institutional misdiagnosis rate, prescribing pattern, and antibiotic cost and could represent avenues of further study. Misappropriation of antibiotics includes not only a monetary cost that encompasses all aspects of acute treatment and hospitalization but also an unquantifiable cost: human lives associated with the consequences of antibiotic resistance.
Conclusion
There is a lack of consensus or criteria for differentiating cellulitis from its most common clinical counterparts. Here, we propose a convenient clinical correlation system that we hope will lead to more efficient allocation of clinical resources, including antibiotics and hospital admissions, while lowering the incidence of adverse events and leading to better patient outcomes. We recognize that the small sample size of our study may limit broad application of these criteria, though we anticipate that further prospective studies can improve the diagnostic relevance and risk-assessment power of the NEW HAvUN criteria put forth here for assessing cellulitis in the acute medical setting.
Acknowledgement—Author H.H.E. recognizes the loving memory of Nadia Ezaldein for her profound influence on and motivation behind this research.
- Lep
pard BJ, Seal DV, Colman G, et al. The value of bacteriology and serology in the diagnosis of cellulitis and erysipelas. Br J Dermatol. 1985;112:559-567. - Hep
burn MJ, Dooley DP, Skidmore PJ, et al. Comparison of short-course (5 days) and standard (10 days) treatment for uncomplicated cellulitis. Arch Int Med. 2004;164:1669-1674. - Bergan JJ, Schmid-Schönbein GW, Smith PD, et al. Chronic venous disease. N Engl J Med. 2006;355:488-498.
- Bruc
e AJ, Bennett DD, Lohse CM, et al. Lipodermatosclerosis: review of cases evaluated at Mayo Clinic. J Am Acad Dermatol. 2002;46:187-192. - Heym
ann WR. Lipodermatosclerosis. J Am Acad Dermatol. 2009;60:1022-1023. - Vesi
ć S, Vuković J, Medenica LJ, et al. Acute lipodermatosclerosis: an open clinical trial of stanozolol in patients unable to sustain compression therapy. Dermatol Online J. 2008;14:1. - Keller
EC, Tomecki KJ, Alraies MC. Distinguishing cellulitis from its mimics. Cleve Clin J Med. 2012;79:547-552. - Dong SL, Kelly KD, Oland RC, et al. ED management of cellulitis: a review of five urban centers. Am J Emerg Med. 2001;19:535-540.
- Ellis Simonsen SM, van Orman ER, Hatch BE, et al. Cellulitis incidence in a defined population. Epidemiol Infect. 2006;134:293-299.
- Manfredi R, Calza L, Chiodo F. Epidemiology and microbiology of cellulitis and bacterial soft tissue infection during HIV disease: a 10-year survey. J Cutan Pathol. 2002;29:168-172.
- Pascarella L, Schonbein GW, Bergan JJ. Microcirculation and venous ulcers: a review. Ann Vasc Surg. 2005;19:921-927.
- Hepburn MJ, Dooley DP, Ellis MW. Alternative diagnoses that often mimic cellulitis. Am Fam Physician. 2003;67:2471.
- David CV, Chira S, Eells SJ, et al. Diagnostic accuracy in patients admitted to hospitals with cellulitis. Dermatol Online J. 2011;17:1.
- Hay RJ, Adriaans BM. Bacterial infections. In: Thong BY, Tan TC. Epidemiology and risk factors for drug allergy. 8th ed. Br J Clin Pharmacol. 2011;71:684-700.
- Hay RJ, Adriaans BM. Bacterial infections. In: Burns T, Breathnach S, Cox N, et al. Rook’s Textbook of Dermatology. 8th ed. Hoboken, NJ: John Wiley & Sons, Inc; 2004:1345-1426.
- Wolff K, Goldsmith LA, Katz SI, et al. Fitzpatrick’s Dermatology In General Medicine. 7th ed. New York, NY: McGraw-Hill; 2003.
- Sommer LL, Reboli AC, Heymann WR. Bacterial infections. In: Bolognia J, Schaffer J, Cerroni L, et al. Dermatology. Vol 4. Philadelphia, PA: Elsevier Saunders; 2012:1462-1502.
- Cox NH. Management of lower leg cellulitis. Clin Med. 2002;2:23-27.
- Strazzula L, Cotliar J, Fox LP, et al. Inpatient dermatology consultation aids diagnosis of cellulitis among hospitalized patients: a multi-institutional analysis. J Am Acad Dermatol. 2015;73:70-75.
- Pinder R, Sallis A, Berry D, et al. Behaviour change and antibiotic prescribing in healthcare settings: literature review and behavioural analysis. London, UK: Public Health England; February 2015. https://assets.publishing.service.gov.uk/government/
uploads/system/uploads/attachment_data/file/405031
/Behaviour_Change_for_Antibiotic_Prescribing_-_FINAL.pdf. Accessed May 7, 2018. - Smith R, Coast J. The true cost of antimicrobial resistance. BMJ. 2013;346:f1493.
Practice Points
- Distinguishing cellulitis from noncellulitic conditions of the lower extremity is paramount to effective patient management in the emergent setting, given that misdiagnosis consumes hospital resources and can lead to inappropriate or excessive use of antibiotics.
- We evaluated the specificity and sensitivity of the following 7 clinical criteria: acute onset, erythema, pyrexia, history of associated trauma, tenderness, unilaterality, and leukocytosis.
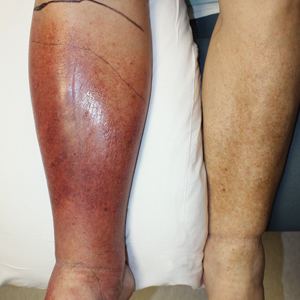
Real-World Evidence for Safety and Effectiveness of Repeated Courses of Hyaluronic Acid Injections on the Time to Knee Replacement Surgery
ABSTRACT
Osteoarthritis (OA) of the knee is a top cause of disability among the elderly. Total knee replacement (TKR) has been available as an effective and definite surgical method to treat severe OA of the knee. However, TKR is a significant procedure with potential risk for serious complications and high costs. Alternative lower risk therapies that can delay or obviate TKR are valuable to those who are poor candidates for surgery or wish to avoid TKR as long as possible. Given the chondroprotective effects of hyaluronic acid (HA) injections, they are a safe and effective treatment to improve pain, function, and longevity of the knee. Thus, HA features the potential to delay or obviate TKR.
We aim to study the safety and effectiveness of repeated courses of HA on the time to TKR over a 3-year period using data from a large US health plan administrative claims database.
Retrospective analyses were conducted by identifying knee OA patients during the selection period (2007-2010). The follow-up period was 36 months, post-index date of initial HA injection. Procedural outcomes and adverse events of interest were tabulated and analyzed. A Cox proportional hazards model was used to model the risk of TKR.
A total of 50,389 patients who received HA for treatment of knee OA and met the study inclusion criteria were analyzed. Successive courses of HA showed a good safety profile and led to high proportions of patients without TKR 3 years after treatment initiation. Multivariate statistical modeling showed that multiple courses of HA injections significantly decreased the rates of TKR (95.0% without TKR for ≥5 courses vs 71.6% without TKR for 1 course; hazard ratio, 0.138; P < .0001).
Repeated courses of treatment with HA are safe and are associated with the delay of TKR for up to 3 years. Additional research is needed to evaluate the effect of repeated HA courses on delaying TKR beyond a 3-year time horizon.
Continue to: Osteoarthritis (OA) of the knee...
Osteoarthritis (OA) of the knee has emerged as one of the main causes of disability in the United States. Although no currently known cure of OA can reverse the progression of the disease, total knee replacement (TKR) is an effective and definitive treatment. However, TKR is an invasive procedure with potential risk for serious complications, and it has imposed high costs on the US healthcare system, with expenses accounting for hospital expenditures of TKR estimated at $28.5 billion in 2009.1Alternative low-risk therapies that can delay or obviate TKR are valuable to a number of patients, especially the poor candidates for surgery or those who wish to avoid TKR.
Intra-articular (IA) hyaluronic acid (HA) injections have been available as a safe and effective treatment option to alleviate pain and to improve joint functions.2 Results of randomized double-blind controlled clinical trials have demonstrated the pain-relieving effect of IA HA injections.3-5 Furthermore, a recent network meta-analysis comparing various pharmacologic interventions for knee OA has confirmed the efficacy of IA HA injections, which outperformed other interventions when compared with oral placebos.6,7 IA therapies are more effective than oral therapies for knee OA pain, with IA HA injections demonstrating the most pain reduction, potentially due to the benefit associated with needle injection and aspiration. Recent experimental studies have also suggested that IA HA may provide cartilage protection, reduce inflammation, and boost the viscosity of synovial fluid;8 IA HA may also exert therapeutic effects by inhibiting bone formation in OA patients.9,10 HA possesses the potential to delay or obviate TKR. Previous research with a case series review of patients in an orthopedic specialty practice reported that the use of IA HA injections in patients with grade IV OA delayed TKR substantially.11 One study analyzed retrospective medical claims data from a single private insurer and discovered potential evidence for the modest benefit of IA HA injections in delaying TKR.12
More detailed research work on a large sample of patients with knee OA and the requirement of TKR as a condition for inclusion using US administrative claims data has demonstrated the TKR-delaying effects of IA HA injections in comparison with a control group without claims for IA HA injections.13,14 This study also uses real-world US administrative data but utilizes a different approach by starting with a sample of patients with knee OA and evidence of IA HA injections and then assessing the effect of repeated courses of HA treatment on the delay of TKR, without TKR as a mandatory condition for inclusion. All patients with knee OA within the time window were included, regardless of the need for TKR compared with previous studies which only considered patients who ultimately received TKR. Safety information and effectiveness information were examined to achieve a balanced risk-benefit assessment. We also analyzed how multiple courses of HA treatment and other potentially relevant covariates at baseline affected the risk of receiving TKR in a multivariate survival model. We aimed to achieve a realistic assessment of the clinical utility of HA injections in delaying TKR in a real-world setting using both safety and effectiveness data.
METHODS
DATA SOURCE
A retrospective cohort observational study using IMS Health’s PharMetrics Plus Health Plan Claims Database was conducted by identifying knee OA patients with claims indicating initiation of HA injection at an index date during the selection period (July 1, 2007 to June 30, 2010). All common HA agents in the US market during this period (Euflexxa, Hyalgan, Orthovisc, Supartz, and Synvisc) were selected via the corresponding J-codes and pooled for investigation of HA class effects. The follow-up period was 36 months, post-index date of the initial HA injection. Outcomes were measured, and adverse events were identified during this period. The time window for identification of adverse events was within 2 weeks from any injection during the course of therapy (evidence of an emergency room visit and/or physician office visit with requisite code). The data during the 12-month pre-index baseline period from the claims database was used to obtain information about baseline patient characteristics, such as age, gender, type of coverage, physician specialty, Charlson Comorbidity Index (CCI), major comorbidities, and major medications of interest commonly used among patients with knee OA.
STUDY SAMPLE SELECTION
The eligible patients required an outpatient claim indicating the initiation of HA injection. The date of the first claim for the patient within the selection window was defined as their index date. Patients had to be ≥18 years of age in the year of their index date. They had to present at least 1 clinical knee OA diagnosis at any point in the 12-month pre-index period (including the index date), and only patients who were continuously enrolled from 12 months pre-index to 36 months post-index date were evaluated. Among these patients (approximately 1.4 million), the following were excluded to minimize complications in data analysis and interpretation: patients with evidence of any HA use in the pre-index period; patients with evidence of a different kind of HA index medication in the post-index period; patients with evidence of TKR within 30 days of the index event during the post-index period; patients with evidence of 2 different kinds of HA index medications on the index date; and patients with evidence of diagnosis of hip OA, fibromyalgia, rheumatoid arthritis, lupus, or gout during the pre-index period.
Five patient cohorts were defined according to the number of courses of IA HA injections over the entire post-index period.
Continue to: Statistical analysis...
STATISTICAL ANALYSIS
All statistical analyses were performed using SAS version 9.2 (SAS Institute Inc.). Descriptive statistics such as means, standard deviations, medians, and 25% and 75% percentiles (Q1 and Q3, respectively) were provided for the continuous variables. Numbers and percentages were provided for the categorical variables. For statistical testing, Student’s t-tests were applied for the continuous variables and chi-square tests for the categorical variables. All the statistical tests were two-tailed. The sample sizes in this database study are remarkably large, such that differences that are not clinically important could still be statistically significant at the conventional alpha level of 0.05. Thus, we applied a more stringent requirement of the alpha level of 0.0001 to identify highly statistically significant results. The number and percentage of patients within each cohort with at least 1 instance of an adverse event of interest (those adverse events commonly expected for patients who receive IA injections for knee OA) were assessed. Times to TKR during the 36-month post-index period were analyzed and compared among different cohorts. Any patients who had not undergone TKR by the end of the post-index period were considered censored at 36 months. The Kaplan-Meier method was employed to model survival curves with time to TKR data, and log-rank tests were used to compare survival curves among different cohorts. A Cox proportional hazards model (PHM) was used to model the risk of TKR with a pre-specified set of covariates adjusted for baseline attributes, such as age, gender, comorbidities, and pre-index healthcare costs. Hazard ratios with 95% confidence intervals were used to examine the measures of event risk.
RESULTS
PATIENT CHARACTERISTICS
Applying study selection criteria to the claims database yielded 50,389 patients (Figure 1), providing an ample sample size for the statistical analysis. Only patients with evidence of knee OA and use of HA injections (the index medication of interest) were selected, regardless of whether they received TKR during the post-index period. The requirement for a knee OA diagnosis during the 12-month pre-index period resulted in the significant attrition of patients, with 584,956 patients being excluded. Among the 50,389 patients who received HA for treatment of knee OA, 36,260 (72.0%) received a single course of treatment, 8709 (17.3%) received 2 courses, 3179 (6.3%) received 3 courses, 1354 (2.7%) received 4 courses, and 887 (1.8%) received ≥5 courses of treatment.
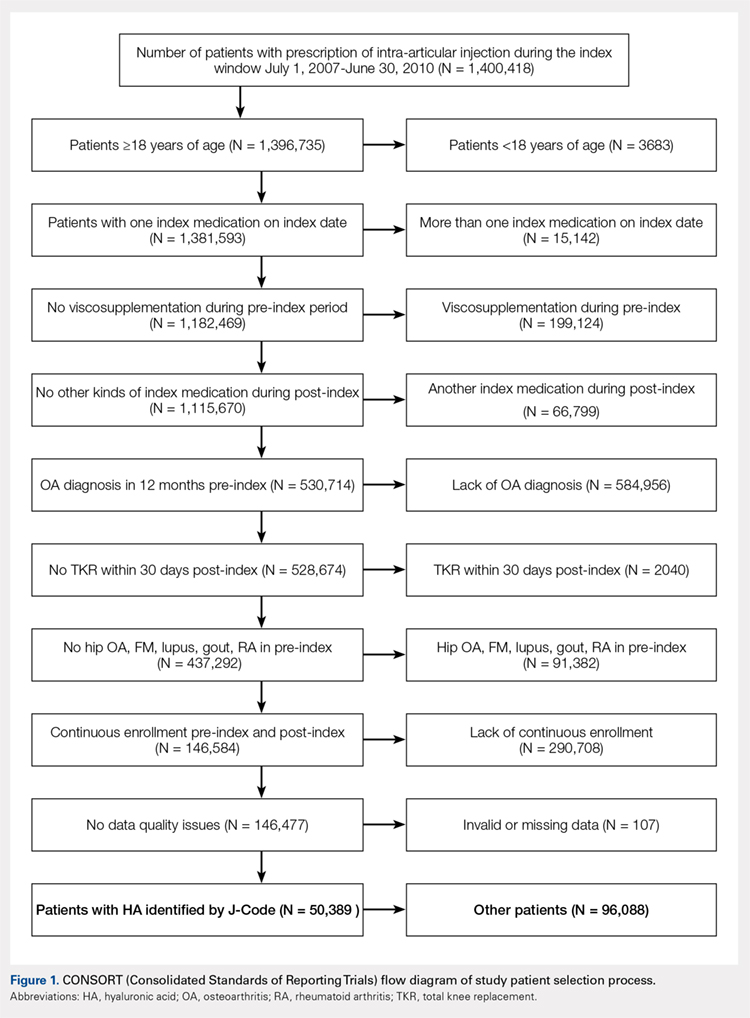
Comparison of baseline characteristics among the 5 IA HA cohorts showed the fairly similar baseline characteristics of all cohorts (Table 1). Geographic region, physician specialty, and opioid use showed differences among the cohorts. Cohorts with ≥5 HA courses presented lower proportions of patients from Southern US states, patients seeing orthopedic surgeons, and patients using opioids than cohorts with fewer HA courses.
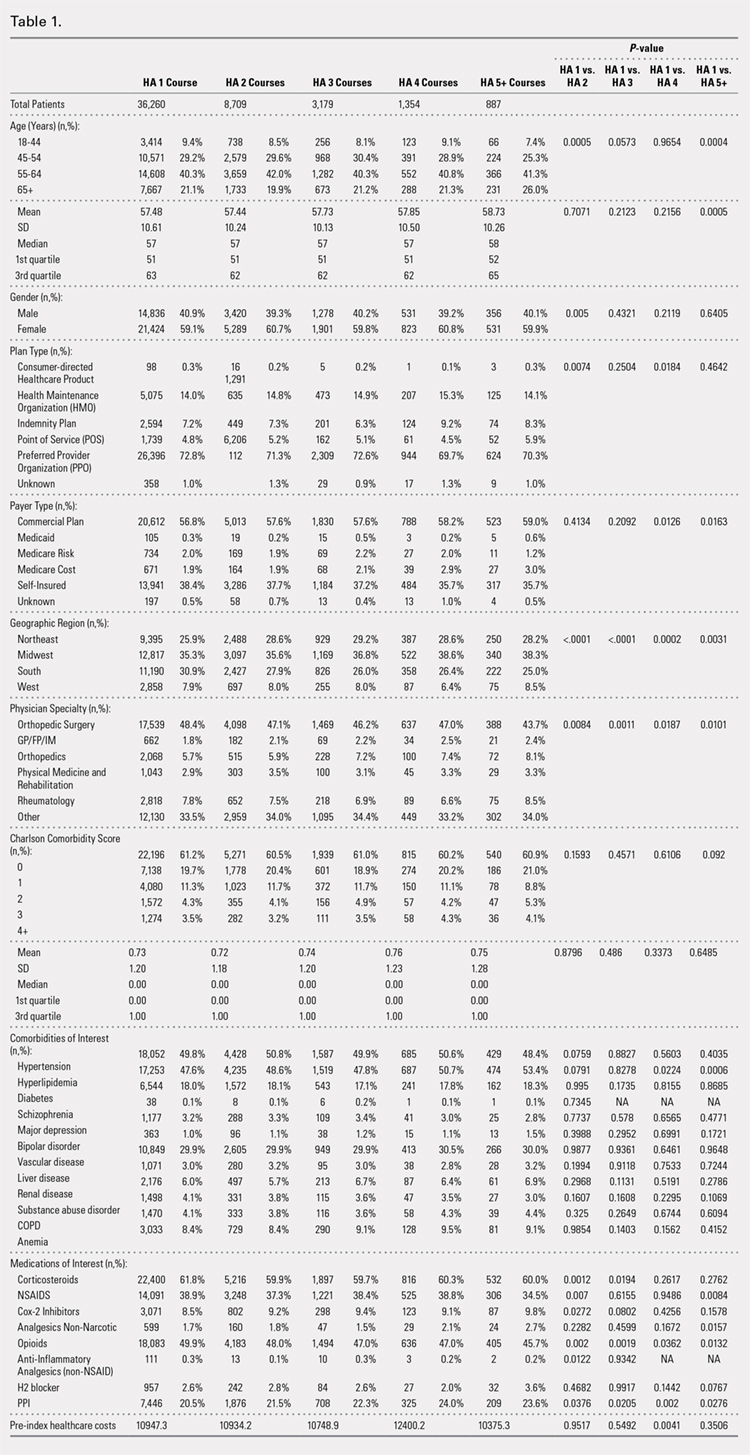
PROCEDURES OF INTEREST
An analysis of the procedures patients received after HA treatment initiation showed that higher numbers of HA treatment courses resulted in lower proportions of patients receiving TKR within 3 years after HA treatment initiation (Table 2). With an increasing number of HA treatment courses, the proportion of patients with TKR within 3 years post-index consistently decreased from 28.4% (for 1 HA course) to 5.0% (for ≥5 HA courses), with all differences being highly statistically significant (P < .0001). Similarly, partial knee replacement exhibited a similar trend, with the proportion of patients decreasing from 3.3% (for 1 HA course) to 0.8% (for ≥5 HA courses; P < .0001). Among the patients with TKR within 3 years post-index, increasing numbers of treatment courses correlated with increasing time to TKR, with a mean of 375.6 days (for 1 HA course) rising to a mean of 971.5 days (for ≥5 HA courses; P < .0001). On the other hand, patients with multiple courses of HA treatment were more likely to undergo radiologic examinations of the knee, arthrocenteses, and image-guided injections than patients with only a single course of HA treatment (P < .0001).
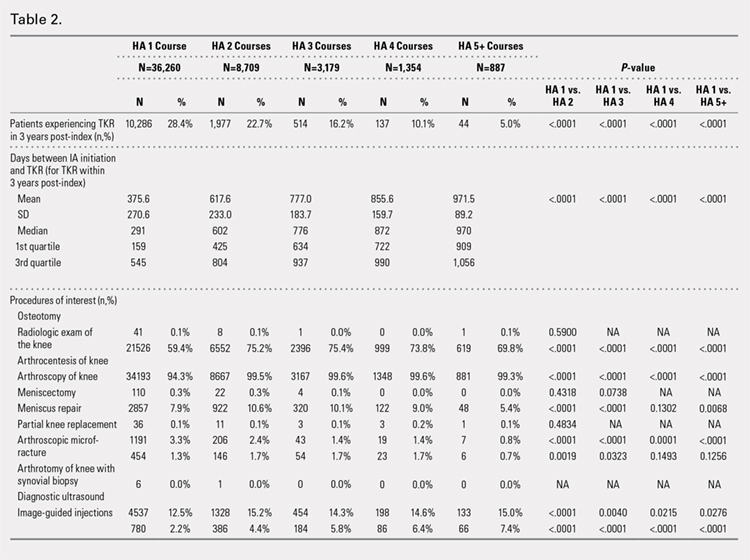
ADVERSE EVENTS
Arthralgia and joint pain in the knee were the most commonly recorded adverse events (Table 3). More courses of HA treatment were associated with higher rates of adverse events. Overall, the reported adverse events profile of repeated courses of HA treatment consisted of mostly common and mild adverse events and displayed no safety concern for patients with knee OA that was followed-up for 3 years. The causality of these adverse events directly related to HA injections vs a specific disease state cannot be determined from an administrative claims data set.
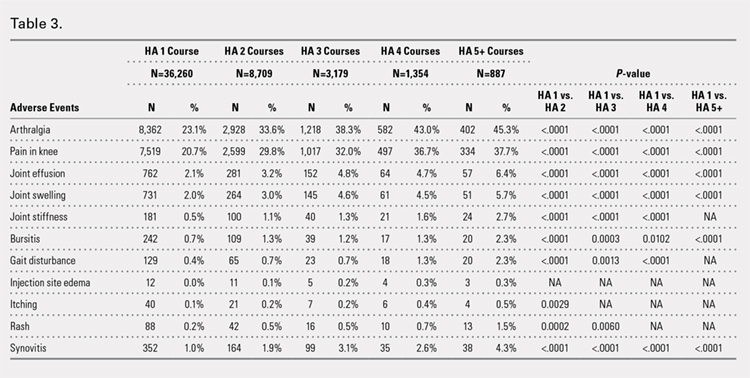
TIME TO TKR
Successive courses of HA led to high proportions of patients without TKR 3 years after HA treatment initiation. This result is evident in the Kaplan-Meier survival curves of time to TKR for different HA cohorts (Figure 2), with log-rank tests of multiple courses vs a single course of HA (P < .0001) showing highly statistically significance. Tabulation of proportions of patients without TKR by various time points showed that increasing numbers of HA treatment courses correlated with higher proportions of patients without TKR at almost all time points (Table 4); within 3 years post-index, 71.6% of patients in the 1 HA course cohort exhibited no TKR, whereas 95.0% of patients in ≥5 HA courses cohort presented no TKR. We also performed a multivariate Cox PHM (Table 5) to account for baseline characteristics of different HA cohorts with covariates when estimating the risks of receiving TKR. The results of the Cox PHM showed that multiple courses of HA treatment significantly decreased the risk of TKR (hazard ratio, 0.138 for ≥5 HA courses vs 1 HA course; P < .0001). Inspection of other highly significant covariates showed that being older, living in the Midwest region of the US (vs the Northeast), receiving pre-index corticosteroids, having an orthopedic surgeon as a treating physician (vs a general practitioner, a rheumatologist, or a physical medicine and rehabilitation specialist), experiencing hypertension or hyperlipidemia, and higher pre-index total healthcare costs were associated with an increased risk of TKR (all P < .0001). Vascular disease and high CCI scores were associated with a decreased risk of TKR (P < .0001).
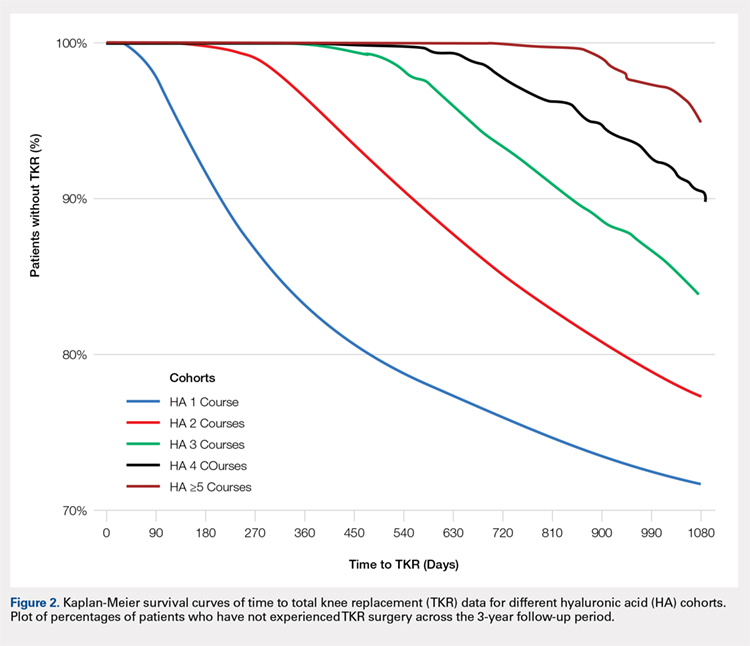
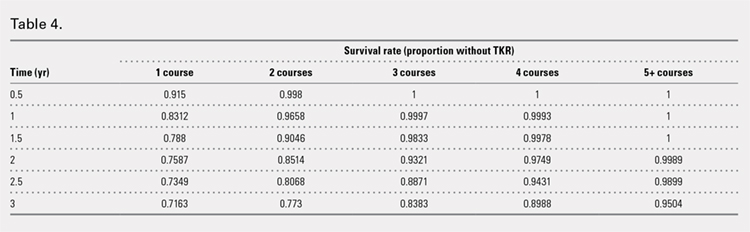
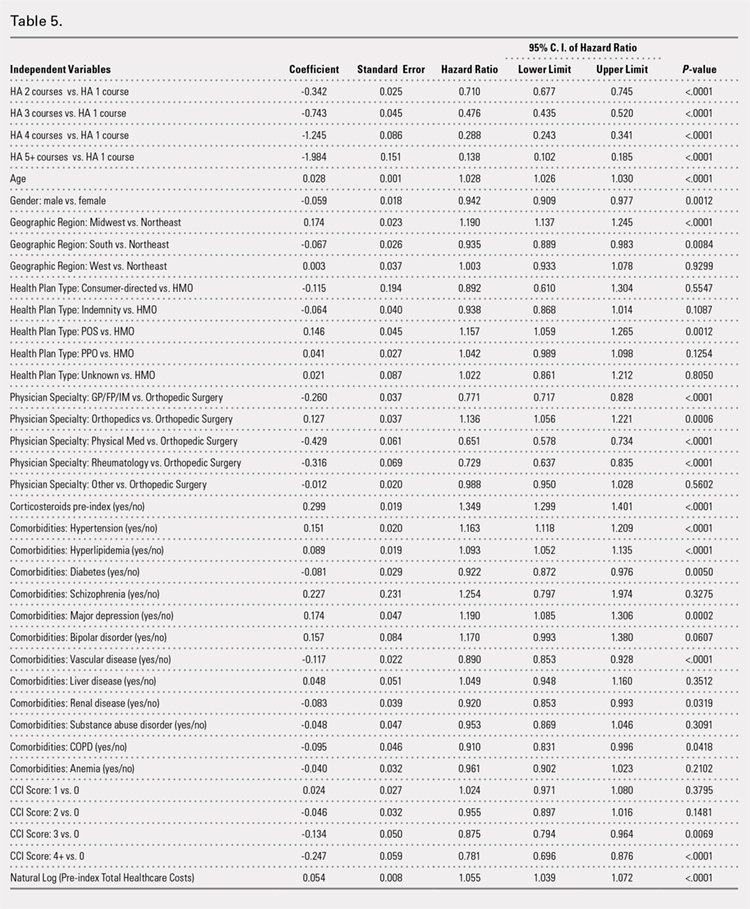
Continue to: Discussion...
DISCUSSION
This study demonstrated that multiple courses of HA treatment can delay the need for surgery for up to 3 years, with risk for both TKR and partial knee replacement decreasing in a dose-dependent manner. The potentially confounding effect of differences in baseline characteristics that could influence patients’ propensity to receive TKR in a database study was controlled by performing a multivariate analysis with covariate adjustment. The TKR-delaying effect of HA injection was more prominent in cohorts with a high number of HA treatment courses: 19 out of 20 patients in the cohort of ≥5 HA courses were free of TKR at the end of the 3-year post-index period. Such a high proportion of patients avoiding TKR with repeated courses of HA suggests that some patients may be able to successfully delay TKR well beyond the 3-year time span. This finding is counter-evidence to the frequently made assumption15 that all patients with knee OA will eventually progress to a state of disability, making TKR inevitable. The patients with end-stage radiographic knee OA can also benefit from IA HA injections for an extended period of time;16 the latest evidence indicates that nonoperative management can improve symptoms irrespective of radiographic disease severity, implying that TKR needs not to be the only therapeutic option for patients with end-stage radiographic knee OA.17 This finding suggests that HA treatment should be considered an important clinical treatment option for patients with knee OA.
Although the incidence rates of certain adverse events, such as arthralgia/joint pain, are sizable, these temporary adverse events commonly occur among patients who receive IA injections for knee OA; most of these events may simply include symptoms of the remaining underlying knee OA. These results are consistent with those of previous literature reporting the safety of repeated treatment with IA HA injections in a prospective clinical trial18 and demonstrating that repeated courses of HA treatment pose no greater safety risk than a single course of HA treatment.
Multivariate modeling outcomes of factors influencing risk of receiving TKR are broadly consistent with the generally accepted notions that different levels of disease severity and patients’ willingness to consider TKR at baseline influence the likelihood and timing of receiving TKR.19,20 Age and obesity are common risk factors for progression of OA. Orthopedic surgeons are more likely to recommend surgery than non-surgeons. The pre-index use of corticosteroids and high pre-index healthcare costs could be associated with more severe symptoms at baseline. Patients with vascular disease or severe comorbidities, as evidenced by high CCI scores, make poor candidates for major elective surgeries such as TKR. These results are intuitive and validate the clinical insights of this study. Moreover, inclusion of these covariates in the analysis model allows for indirect adjustment of the most important prognostic factors for TKR at baseline, permitting proper statistical comparison of the results for different cohort groups.
Recently, the efficacy of HA injections for OA patients has become the subject of debate when the American Academy of Orthopaedic Surgeons (AAOS) revised its clinical practice guideline, recommending against the use of HA.21 The AAOS’ findings differ from those of other clinical societies, such as the American College of Rheumatology22 and the European League Against Rheumatism,23 which provide no strong recommendation against the use of HA injections. The announcement of the new guideline by AAOS caused concern among clinicians and payers who had valued IA HA injections as a means to control knee OA pain before patients progress to TKR;24 on the other hand, the demand for nonoperative treatment of knee OA remains high. Utilization rates of TKR have increased dramatically, and surgeries are now performed on younger patients with increasing burden on the healthcare system,25,26 in spite of the fact that as high as a third of TKR surgeries may have been performed in inappropriate patients.27 Part of the confusion surrounding clinical utility of HA stems from the fact that up until recently, relatively little research looked into the practical benefits of HA in actual clinical practice. Analyses of databases such as registries are now gaining attention to overcome that problem. Examination of large administrative databases maintained by commercial payers offers the benefit of probing realistically the safety and efficacy of treatments in actual clinical environments in a very large number of patients with heterogeneous backgrounds. Recently, the Agency for Healthcare Research and Quality’s Technology Assessment Program in the US called for such studies to determine whether HA injections can delay progression to TKR.28 The results of this study and several others11,13,14,16 suggest that use of HA to treat OA of the knee is associated with the delay of TKR, supporting the utility of HA in clinical practice and the healthcare system. Potential clinical benefits of delaying TKR may include the reduced risk of aseptic loosening if younger patients can wait for TKR or more time to allow the modification of risk factors in patients who will ultimately undergo TKR.
LIMITATIONS
Follow-up period was limited to 3 years post-index date because longer follow-up data were not available at the time of the study design. If an incorrect adverse event or OA diagnosis was listed in the medical record, or if the medical record was incomplete, then patients might have been misclassified, resulting in selection bias. The claims dataset includes no uninsured and Medicare patients, as the population in the database consisted primarily of commercially-insured patients in the US. Therefore, the results are most generalizable to other commercially-insured patients in the US. Generalizability to other populations may not be assured if they differ in their accessibility to physician services or prescriptions from the patients in this study. Other treatments such as the nonsteroidal anti-inflammatory drugs used by patients were not included within the pre-specified statistical model because their potential effects were assumed to be short-lived and much less than those of corticosteroid. Including these treatments would overload the statistical model with too many covariates, leading to potential computational instability. The database used provides no information on systemic factors, including plan limits on medication use, that could affect care. Given the large and diverse nature of the healthcare plans in the database. However, these factors should not have materially affected our study results. The claims database also lacks direct indicators of OA disease severity, such as Kellgren-Lawrence scores or patient-reported outcomes, including pain and function questionnaire scores. Our multivariate analysis indirectly makes up for this deficiency by considering other baseline characteristics or clinical indicators that may be correlated with information unavailable in a claims database. Patients who opt to undergo repeated courses of HA treatment may be more inclined to avoid surgery or may naturally experience OA disease progression more slowly, making them potentially different from patients who select to undergo surgery earlier without repeated courses of HA treatment. This condition may introduce a bias that causes difficulty in proving the causality between repeated HA use and delay of TKR.
CONCLUSION
Analysis of the knee OA patient data from a real-world database showed that repeated courses of treatment with HA are safe and are associated with the delay of TKR for up to 3 years. Additional research is needed to evaluate the effects of repeated HA courses on delaying TKR beyond a 3-year period.
- Murphy L, Helmick CG. The impact of osteoarthritis in the United States: a population-health perspective. Am J Nurs. 2012;112(3 Suppl 1):S13-S19.
- Arnold W, Fullerton DS, Holder S, May CS. Viscosupplementation: managed care issues for osteoarthritis of the knee. J Manag Care Pharm. 2007;13(4 Suppl):S3-S19.
- Strand V, Conaghan PG, Lohmander LS, et al. An integrated analysis of five double-blind, randomized controlled trials evaluating the safety and efficacy of a hyaluronan product for intra-articular injection in osteoarthritis of the knee. Osteoarthritis Cartilage. 2006;14(9):859-866.
- Strand V, Baraf HS, Lavin PT, Lim S, Hosokawa H. A multicenter, randomized controlled trial comparing a single intra-articular injection of Gel-200, a new cross-linked formulation of hyaluronic acid, to phosphate buffered saline for treatment of osteoarthritis of the knee. Osteoarthritis Cartilage. 2012;20(5):350-356.
- Strand V, McIntyre LF, Beach WR, Miller LE, Block JE. Safety and efficacy of US-approved viscosupplements for knee osteoarthritis: a systematic review and meta-analysis of randomized, saline-controlled trials. J Pain Res. 2015;8:217-228.
- Bannuru RR, Schmid CH, Kent DM, Vaysbrott EE, Wong JB, McAlindon TE. Comparative effectiveness of pharmacologic interventions for knee osteoarthritis: a systematic review and network meta-analysis. Ann Intern Med. 2015;162(1):46-54.
- Mandl LA, Losina E. Relative efficacy of knee osteoarthritis treatments: are all placebos created equal? Ann Intern Med. 2015;162(1):71-72.
- Kusayama Y, Akamatsu Y, Kumagai K, Kobayashi H, Aratake M, Saito T. Changes in synovial fluid biomarkers and clinical efficacy of intra-articular injections of hyaluronic acid for patients with knee osteoarthritis. J Exp Orthop. 2014;1(1):16. doi:10.1186/s40634-014-0016-7.
- Kaneko K, Higuchi C, Kunugiza Y, et al. Hyaluronan inhibits BMP-induced osteoblast differentiation. FEBS Lett. 2015;589(4):447-454. doi:10.1016/j.febslet.2014.
- Altman RD, Manjoo A, Fierlinger A, Niazi F, Nicholls M. The mechanism of action for hyaluronic acid treatment in the osteoarthritic knee: a systematic review. BMC Musculoskelet Disord. 2015;16:321. doi:10.1186/s12891-015-0775-z.
- Waddell DD, Bricker DC. Total knee replacement delayed with hylan G-F 20 use in patients with grade IV osteoarthritis. J Manag Care Pharm. 2007;13(2):113-121.
- Khan T, Nanchanatt G, Farber K, Jan S. Analysis of the effectiveness of hyaluronic acid in prevention of total knee replacement in osteoarthritis patients. J Manag Care Pharm. 2014;20:S49.
- Abbott T, Altman RD, Dimeff R, et al. Do hyaluronic acid injections delay total knee replacement surgery? Arthritis Rheum. 2013;65(Suppl 10):2139.
- Altman R, Lim S, Steen R, Dasa V. Intra-articular hyaluronic acid delays total knee replacement in patients with knee osteoarthritis: evidence from a large U.S. health claims database. Osteoarthritis Cartilage. 2015;23(Suppl 2):A403-A404.
- Mather RC 3rd, Hug KT, Orlando LA, et al. Economic evaluation of access to musculoskeletal care: the case of waiting for total knee arthroplasty. BMC Musculoskelet Disord. 2014;15:22. doi:10.1186/1471-2474-15-22.
- Waddell DD, Joseph B. Delayed total knee replacement with Hylan G-F 20. J Knee Surg. 2016;29(2):159-168. doi:10.1055/s-0034-1395281.
- Atukorala I, Makovey J, Williams M, Ochoa Albiztegui E, Eyles JP, Hunter DJ. If you have end-stage radiographic knee osteoarthritis can you respond to non-surgical management? Osteoarthritis Cartilage. 2015;23(Suppl 2):A329.
- Strand V, Baraf HS, Lavin PT, Lim S, Hosokawa H. Effectiveness and safety of a multicenter extension and retreatment trial of Gel-200 in patients with knee osteoarthritis. Cartilage. 2012;3(4):297-304. doi:10.1177/1947603512451024.
- Riddle DL, Kong X, Jiranek WA. Two-year incidence and predictors of future knee arthroplasty in persons with symptomatic knee osteoarthritis: preliminary analysis of longitudinal data from the osteoarthritis initiative. Knee. 2009;16(6):494-500.
- Hawker GA, Guan J, Croxford R, et al. A prospective population-based study of the predictors of undergoing total joint arthroplasty. Arthritis Rheum. 2006;54(10):3212-3220.
- Jevsevar DS. Treatment of osteoarthritis of the knee: evidence-based guideline, 2nd edition. J Am Acad Orthop Surg. 2013;21(9):571-576. doi:10.5435/JAAOS-21-09-571.
- Hochberg MC, Altman RD, April KT, et al. American College of Rheumatology 2012 recommendations for the use of nonpharmacologic and pharmacologic therapies in osteoarthritis of the hand, hip, and knee. Arthritis Care Res (Hoboken). 2012;64(4):465-474.
- Jordan KM, Arden NK, Doherty M, et al. EULAR Recommendations 2003: an evidence based approach to the management of knee osteoarthritis: report of a task force of the standing committee for international clinical studies including therapeutic trials (ESCISIT). Ann Rheum Dis. 2003;62(12):1145-1155.
- Bannuru RR, Vaysbrot EE, McIntyre LF. Did the American Academy of Orthopaedic Surgeons osteoarthritis guidelines miss the mark? Arthroscopy. 2014;30(1):86-89. doi:10.1016/j.arthro.2013.10.007.
- Losina E, Thornhill TS, Rome BN, Wright J, Katz JN. The dramatic increase in total knee replacement utilization rates in the United States cannot be fully explained by growth in population size and the obesity epidemic. J Bone Joint Surg Am. 2012;94(3):201-207. doi:10.2106/JBJS.J.01958.
- Weinstein AM, Rome BN, Reichmann WM, et al. Estimating the burden of total knee replacement in the United States. J Bone Joint Surg Am. 2013;95(5):385-392. doi:10.2106/JBJS.L.00206.
- Riddle DL, Jiranek WA, Hayes CW. Use of a validated algorithm to judge the appropriateness of total knee arthroplasty in the United States: a multicenter longitudinal cohort study. Arthritis Rheumatol. 2014;66(8):2134-2143. doi:10.1002/art.38685.
- NewBerry SJ, Fitzgerald JD, Maglione MA, et al. Agency for Healthcare Research and Quality Web site. Systematic Review for Effectiveness of Hyaluronic Acid in the Treatment of Severe Degenerative Joint Disease (DJD) of the Knee: Technology Assessment Report. http://www.ahrq.gov/research/findings/ta/call-for-public-review.html. Published July 23, 2015. Accessed December 22, 2014.
ABSTRACT
Osteoarthritis (OA) of the knee is a top cause of disability among the elderly. Total knee replacement (TKR) has been available as an effective and definite surgical method to treat severe OA of the knee. However, TKR is a significant procedure with potential risk for serious complications and high costs. Alternative lower risk therapies that can delay or obviate TKR are valuable to those who are poor candidates for surgery or wish to avoid TKR as long as possible. Given the chondroprotective effects of hyaluronic acid (HA) injections, they are a safe and effective treatment to improve pain, function, and longevity of the knee. Thus, HA features the potential to delay or obviate TKR.
We aim to study the safety and effectiveness of repeated courses of HA on the time to TKR over a 3-year period using data from a large US health plan administrative claims database.
Retrospective analyses were conducted by identifying knee OA patients during the selection period (2007-2010). The follow-up period was 36 months, post-index date of initial HA injection. Procedural outcomes and adverse events of interest were tabulated and analyzed. A Cox proportional hazards model was used to model the risk of TKR.
A total of 50,389 patients who received HA for treatment of knee OA and met the study inclusion criteria were analyzed. Successive courses of HA showed a good safety profile and led to high proportions of patients without TKR 3 years after treatment initiation. Multivariate statistical modeling showed that multiple courses of HA injections significantly decreased the rates of TKR (95.0% without TKR for ≥5 courses vs 71.6% without TKR for 1 course; hazard ratio, 0.138; P < .0001).
Repeated courses of treatment with HA are safe and are associated with the delay of TKR for up to 3 years. Additional research is needed to evaluate the effect of repeated HA courses on delaying TKR beyond a 3-year time horizon.
Continue to: Osteoarthritis (OA) of the knee...
Osteoarthritis (OA) of the knee has emerged as one of the main causes of disability in the United States. Although no currently known cure of OA can reverse the progression of the disease, total knee replacement (TKR) is an effective and definitive treatment. However, TKR is an invasive procedure with potential risk for serious complications, and it has imposed high costs on the US healthcare system, with expenses accounting for hospital expenditures of TKR estimated at $28.5 billion in 2009.1Alternative low-risk therapies that can delay or obviate TKR are valuable to a number of patients, especially the poor candidates for surgery or those who wish to avoid TKR.
Intra-articular (IA) hyaluronic acid (HA) injections have been available as a safe and effective treatment option to alleviate pain and to improve joint functions.2 Results of randomized double-blind controlled clinical trials have demonstrated the pain-relieving effect of IA HA injections.3-5 Furthermore, a recent network meta-analysis comparing various pharmacologic interventions for knee OA has confirmed the efficacy of IA HA injections, which outperformed other interventions when compared with oral placebos.6,7 IA therapies are more effective than oral therapies for knee OA pain, with IA HA injections demonstrating the most pain reduction, potentially due to the benefit associated with needle injection and aspiration. Recent experimental studies have also suggested that IA HA may provide cartilage protection, reduce inflammation, and boost the viscosity of synovial fluid;8 IA HA may also exert therapeutic effects by inhibiting bone formation in OA patients.9,10 HA possesses the potential to delay or obviate TKR. Previous research with a case series review of patients in an orthopedic specialty practice reported that the use of IA HA injections in patients with grade IV OA delayed TKR substantially.11 One study analyzed retrospective medical claims data from a single private insurer and discovered potential evidence for the modest benefit of IA HA injections in delaying TKR.12
More detailed research work on a large sample of patients with knee OA and the requirement of TKR as a condition for inclusion using US administrative claims data has demonstrated the TKR-delaying effects of IA HA injections in comparison with a control group without claims for IA HA injections.13,14 This study also uses real-world US administrative data but utilizes a different approach by starting with a sample of patients with knee OA and evidence of IA HA injections and then assessing the effect of repeated courses of HA treatment on the delay of TKR, without TKR as a mandatory condition for inclusion. All patients with knee OA within the time window were included, regardless of the need for TKR compared with previous studies which only considered patients who ultimately received TKR. Safety information and effectiveness information were examined to achieve a balanced risk-benefit assessment. We also analyzed how multiple courses of HA treatment and other potentially relevant covariates at baseline affected the risk of receiving TKR in a multivariate survival model. We aimed to achieve a realistic assessment of the clinical utility of HA injections in delaying TKR in a real-world setting using both safety and effectiveness data.
METHODS
DATA SOURCE
A retrospective cohort observational study using IMS Health’s PharMetrics Plus Health Plan Claims Database was conducted by identifying knee OA patients with claims indicating initiation of HA injection at an index date during the selection period (July 1, 2007 to June 30, 2010). All common HA agents in the US market during this period (Euflexxa, Hyalgan, Orthovisc, Supartz, and Synvisc) were selected via the corresponding J-codes and pooled for investigation of HA class effects. The follow-up period was 36 months, post-index date of the initial HA injection. Outcomes were measured, and adverse events were identified during this period. The time window for identification of adverse events was within 2 weeks from any injection during the course of therapy (evidence of an emergency room visit and/or physician office visit with requisite code). The data during the 12-month pre-index baseline period from the claims database was used to obtain information about baseline patient characteristics, such as age, gender, type of coverage, physician specialty, Charlson Comorbidity Index (CCI), major comorbidities, and major medications of interest commonly used among patients with knee OA.
STUDY SAMPLE SELECTION
The eligible patients required an outpatient claim indicating the initiation of HA injection. The date of the first claim for the patient within the selection window was defined as their index date. Patients had to be ≥18 years of age in the year of their index date. They had to present at least 1 clinical knee OA diagnosis at any point in the 12-month pre-index period (including the index date), and only patients who were continuously enrolled from 12 months pre-index to 36 months post-index date were evaluated. Among these patients (approximately 1.4 million), the following were excluded to minimize complications in data analysis and interpretation: patients with evidence of any HA use in the pre-index period; patients with evidence of a different kind of HA index medication in the post-index period; patients with evidence of TKR within 30 days of the index event during the post-index period; patients with evidence of 2 different kinds of HA index medications on the index date; and patients with evidence of diagnosis of hip OA, fibromyalgia, rheumatoid arthritis, lupus, or gout during the pre-index period.
Five patient cohorts were defined according to the number of courses of IA HA injections over the entire post-index period.
Continue to: Statistical analysis...
STATISTICAL ANALYSIS
All statistical analyses were performed using SAS version 9.2 (SAS Institute Inc.). Descriptive statistics such as means, standard deviations, medians, and 25% and 75% percentiles (Q1 and Q3, respectively) were provided for the continuous variables. Numbers and percentages were provided for the categorical variables. For statistical testing, Student’s t-tests were applied for the continuous variables and chi-square tests for the categorical variables. All the statistical tests were two-tailed. The sample sizes in this database study are remarkably large, such that differences that are not clinically important could still be statistically significant at the conventional alpha level of 0.05. Thus, we applied a more stringent requirement of the alpha level of 0.0001 to identify highly statistically significant results. The number and percentage of patients within each cohort with at least 1 instance of an adverse event of interest (those adverse events commonly expected for patients who receive IA injections for knee OA) were assessed. Times to TKR during the 36-month post-index period were analyzed and compared among different cohorts. Any patients who had not undergone TKR by the end of the post-index period were considered censored at 36 months. The Kaplan-Meier method was employed to model survival curves with time to TKR data, and log-rank tests were used to compare survival curves among different cohorts. A Cox proportional hazards model (PHM) was used to model the risk of TKR with a pre-specified set of covariates adjusted for baseline attributes, such as age, gender, comorbidities, and pre-index healthcare costs. Hazard ratios with 95% confidence intervals were used to examine the measures of event risk.
RESULTS
PATIENT CHARACTERISTICS
Applying study selection criteria to the claims database yielded 50,389 patients (Figure 1), providing an ample sample size for the statistical analysis. Only patients with evidence of knee OA and use of HA injections (the index medication of interest) were selected, regardless of whether they received TKR during the post-index period. The requirement for a knee OA diagnosis during the 12-month pre-index period resulted in the significant attrition of patients, with 584,956 patients being excluded. Among the 50,389 patients who received HA for treatment of knee OA, 36,260 (72.0%) received a single course of treatment, 8709 (17.3%) received 2 courses, 3179 (6.3%) received 3 courses, 1354 (2.7%) received 4 courses, and 887 (1.8%) received ≥5 courses of treatment.
Comparison of baseline characteristics among the 5 IA HA cohorts showed the fairly similar baseline characteristics of all cohorts (Table 1). Geographic region, physician specialty, and opioid use showed differences among the cohorts. Cohorts with ≥5 HA courses presented lower proportions of patients from Southern US states, patients seeing orthopedic surgeons, and patients using opioids than cohorts with fewer HA courses.
PROCEDURES OF INTEREST
An analysis of the procedures patients received after HA treatment initiation showed that higher numbers of HA treatment courses resulted in lower proportions of patients receiving TKR within 3 years after HA treatment initiation (Table 2). With an increasing number of HA treatment courses, the proportion of patients with TKR within 3 years post-index consistently decreased from 28.4% (for 1 HA course) to 5.0% (for ≥5 HA courses), with all differences being highly statistically significant (P < .0001). Similarly, partial knee replacement exhibited a similar trend, with the proportion of patients decreasing from 3.3% (for 1 HA course) to 0.8% (for ≥5 HA courses; P < .0001). Among the patients with TKR within 3 years post-index, increasing numbers of treatment courses correlated with increasing time to TKR, with a mean of 375.6 days (for 1 HA course) rising to a mean of 971.5 days (for ≥5 HA courses; P < .0001). On the other hand, patients with multiple courses of HA treatment were more likely to undergo radiologic examinations of the knee, arthrocenteses, and image-guided injections than patients with only a single course of HA treatment (P < .0001).
ADVERSE EVENTS
Arthralgia and joint pain in the knee were the most commonly recorded adverse events (Table 3). More courses of HA treatment were associated with higher rates of adverse events. Overall, the reported adverse events profile of repeated courses of HA treatment consisted of mostly common and mild adverse events and displayed no safety concern for patients with knee OA that was followed-up for 3 years. The causality of these adverse events directly related to HA injections vs a specific disease state cannot be determined from an administrative claims data set.
TIME TO TKR
Successive courses of HA led to high proportions of patients without TKR 3 years after HA treatment initiation. This result is evident in the Kaplan-Meier survival curves of time to TKR for different HA cohorts (Figure 2), with log-rank tests of multiple courses vs a single course of HA (P < .0001) showing highly statistically significance. Tabulation of proportions of patients without TKR by various time points showed that increasing numbers of HA treatment courses correlated with higher proportions of patients without TKR at almost all time points (Table 4); within 3 years post-index, 71.6% of patients in the 1 HA course cohort exhibited no TKR, whereas 95.0% of patients in ≥5 HA courses cohort presented no TKR. We also performed a multivariate Cox PHM (Table 5) to account for baseline characteristics of different HA cohorts with covariates when estimating the risks of receiving TKR. The results of the Cox PHM showed that multiple courses of HA treatment significantly decreased the risk of TKR (hazard ratio, 0.138 for ≥5 HA courses vs 1 HA course; P < .0001). Inspection of other highly significant covariates showed that being older, living in the Midwest region of the US (vs the Northeast), receiving pre-index corticosteroids, having an orthopedic surgeon as a treating physician (vs a general practitioner, a rheumatologist, or a physical medicine and rehabilitation specialist), experiencing hypertension or hyperlipidemia, and higher pre-index total healthcare costs were associated with an increased risk of TKR (all P < .0001). Vascular disease and high CCI scores were associated with a decreased risk of TKR (P < .0001).
Continue to: Discussion...
DISCUSSION
This study demonstrated that multiple courses of HA treatment can delay the need for surgery for up to 3 years, with risk for both TKR and partial knee replacement decreasing in a dose-dependent manner. The potentially confounding effect of differences in baseline characteristics that could influence patients’ propensity to receive TKR in a database study was controlled by performing a multivariate analysis with covariate adjustment. The TKR-delaying effect of HA injection was more prominent in cohorts with a high number of HA treatment courses: 19 out of 20 patients in the cohort of ≥5 HA courses were free of TKR at the end of the 3-year post-index period. Such a high proportion of patients avoiding TKR with repeated courses of HA suggests that some patients may be able to successfully delay TKR well beyond the 3-year time span. This finding is counter-evidence to the frequently made assumption15 that all patients with knee OA will eventually progress to a state of disability, making TKR inevitable. The patients with end-stage radiographic knee OA can also benefit from IA HA injections for an extended period of time;16 the latest evidence indicates that nonoperative management can improve symptoms irrespective of radiographic disease severity, implying that TKR needs not to be the only therapeutic option for patients with end-stage radiographic knee OA.17 This finding suggests that HA treatment should be considered an important clinical treatment option for patients with knee OA.
Although the incidence rates of certain adverse events, such as arthralgia/joint pain, are sizable, these temporary adverse events commonly occur among patients who receive IA injections for knee OA; most of these events may simply include symptoms of the remaining underlying knee OA. These results are consistent with those of previous literature reporting the safety of repeated treatment with IA HA injections in a prospective clinical trial18 and demonstrating that repeated courses of HA treatment pose no greater safety risk than a single course of HA treatment.
Multivariate modeling outcomes of factors influencing risk of receiving TKR are broadly consistent with the generally accepted notions that different levels of disease severity and patients’ willingness to consider TKR at baseline influence the likelihood and timing of receiving TKR.19,20 Age and obesity are common risk factors for progression of OA. Orthopedic surgeons are more likely to recommend surgery than non-surgeons. The pre-index use of corticosteroids and high pre-index healthcare costs could be associated with more severe symptoms at baseline. Patients with vascular disease or severe comorbidities, as evidenced by high CCI scores, make poor candidates for major elective surgeries such as TKR. These results are intuitive and validate the clinical insights of this study. Moreover, inclusion of these covariates in the analysis model allows for indirect adjustment of the most important prognostic factors for TKR at baseline, permitting proper statistical comparison of the results for different cohort groups.
Recently, the efficacy of HA injections for OA patients has become the subject of debate when the American Academy of Orthopaedic Surgeons (AAOS) revised its clinical practice guideline, recommending against the use of HA.21 The AAOS’ findings differ from those of other clinical societies, such as the American College of Rheumatology22 and the European League Against Rheumatism,23 which provide no strong recommendation against the use of HA injections. The announcement of the new guideline by AAOS caused concern among clinicians and payers who had valued IA HA injections as a means to control knee OA pain before patients progress to TKR;24 on the other hand, the demand for nonoperative treatment of knee OA remains high. Utilization rates of TKR have increased dramatically, and surgeries are now performed on younger patients with increasing burden on the healthcare system,25,26 in spite of the fact that as high as a third of TKR surgeries may have been performed in inappropriate patients.27 Part of the confusion surrounding clinical utility of HA stems from the fact that up until recently, relatively little research looked into the practical benefits of HA in actual clinical practice. Analyses of databases such as registries are now gaining attention to overcome that problem. Examination of large administrative databases maintained by commercial payers offers the benefit of probing realistically the safety and efficacy of treatments in actual clinical environments in a very large number of patients with heterogeneous backgrounds. Recently, the Agency for Healthcare Research and Quality’s Technology Assessment Program in the US called for such studies to determine whether HA injections can delay progression to TKR.28 The results of this study and several others11,13,14,16 suggest that use of HA to treat OA of the knee is associated with the delay of TKR, supporting the utility of HA in clinical practice and the healthcare system. Potential clinical benefits of delaying TKR may include the reduced risk of aseptic loosening if younger patients can wait for TKR or more time to allow the modification of risk factors in patients who will ultimately undergo TKR.
LIMITATIONS
Follow-up period was limited to 3 years post-index date because longer follow-up data were not available at the time of the study design. If an incorrect adverse event or OA diagnosis was listed in the medical record, or if the medical record was incomplete, then patients might have been misclassified, resulting in selection bias. The claims dataset includes no uninsured and Medicare patients, as the population in the database consisted primarily of commercially-insured patients in the US. Therefore, the results are most generalizable to other commercially-insured patients in the US. Generalizability to other populations may not be assured if they differ in their accessibility to physician services or prescriptions from the patients in this study. Other treatments such as the nonsteroidal anti-inflammatory drugs used by patients were not included within the pre-specified statistical model because their potential effects were assumed to be short-lived and much less than those of corticosteroid. Including these treatments would overload the statistical model with too many covariates, leading to potential computational instability. The database used provides no information on systemic factors, including plan limits on medication use, that could affect care. Given the large and diverse nature of the healthcare plans in the database. However, these factors should not have materially affected our study results. The claims database also lacks direct indicators of OA disease severity, such as Kellgren-Lawrence scores or patient-reported outcomes, including pain and function questionnaire scores. Our multivariate analysis indirectly makes up for this deficiency by considering other baseline characteristics or clinical indicators that may be correlated with information unavailable in a claims database. Patients who opt to undergo repeated courses of HA treatment may be more inclined to avoid surgery or may naturally experience OA disease progression more slowly, making them potentially different from patients who select to undergo surgery earlier without repeated courses of HA treatment. This condition may introduce a bias that causes difficulty in proving the causality between repeated HA use and delay of TKR.
CONCLUSION
Analysis of the knee OA patient data from a real-world database showed that repeated courses of treatment with HA are safe and are associated with the delay of TKR for up to 3 years. Additional research is needed to evaluate the effects of repeated HA courses on delaying TKR beyond a 3-year period.
- Murphy L, Helmick CG. The impact of osteoarthritis in the United States: a population-health perspective. Am J Nurs. 2012;112(3 Suppl 1):S13-S19.
- Arnold W, Fullerton DS, Holder S, May CS. Viscosupplementation: managed care issues for osteoarthritis of the knee. J Manag Care Pharm. 2007;13(4 Suppl):S3-S19.
- Strand V, Conaghan PG, Lohmander LS, et al. An integrated analysis of five double-blind, randomized controlled trials evaluating the safety and efficacy of a hyaluronan product for intra-articular injection in osteoarthritis of the knee. Osteoarthritis Cartilage. 2006;14(9):859-866.
- Strand V, Baraf HS, Lavin PT, Lim S, Hosokawa H. A multicenter, randomized controlled trial comparing a single intra-articular injection of Gel-200, a new cross-linked formulation of hyaluronic acid, to phosphate buffered saline for treatment of osteoarthritis of the knee. Osteoarthritis Cartilage. 2012;20(5):350-356.
- Strand V, McIntyre LF, Beach WR, Miller LE, Block JE. Safety and efficacy of US-approved viscosupplements for knee osteoarthritis: a systematic review and meta-analysis of randomized, saline-controlled trials. J Pain Res. 2015;8:217-228.
- Bannuru RR, Schmid CH, Kent DM, Vaysbrott EE, Wong JB, McAlindon TE. Comparative effectiveness of pharmacologic interventions for knee osteoarthritis: a systematic review and network meta-analysis. Ann Intern Med. 2015;162(1):46-54.
- Mandl LA, Losina E. Relative efficacy of knee osteoarthritis treatments: are all placebos created equal? Ann Intern Med. 2015;162(1):71-72.
- Kusayama Y, Akamatsu Y, Kumagai K, Kobayashi H, Aratake M, Saito T. Changes in synovial fluid biomarkers and clinical efficacy of intra-articular injections of hyaluronic acid for patients with knee osteoarthritis. J Exp Orthop. 2014;1(1):16. doi:10.1186/s40634-014-0016-7.
- Kaneko K, Higuchi C, Kunugiza Y, et al. Hyaluronan inhibits BMP-induced osteoblast differentiation. FEBS Lett. 2015;589(4):447-454. doi:10.1016/j.febslet.2014.
- Altman RD, Manjoo A, Fierlinger A, Niazi F, Nicholls M. The mechanism of action for hyaluronic acid treatment in the osteoarthritic knee: a systematic review. BMC Musculoskelet Disord. 2015;16:321. doi:10.1186/s12891-015-0775-z.
- Waddell DD, Bricker DC. Total knee replacement delayed with hylan G-F 20 use in patients with grade IV osteoarthritis. J Manag Care Pharm. 2007;13(2):113-121.
- Khan T, Nanchanatt G, Farber K, Jan S. Analysis of the effectiveness of hyaluronic acid in prevention of total knee replacement in osteoarthritis patients. J Manag Care Pharm. 2014;20:S49.
- Abbott T, Altman RD, Dimeff R, et al. Do hyaluronic acid injections delay total knee replacement surgery? Arthritis Rheum. 2013;65(Suppl 10):2139.
- Altman R, Lim S, Steen R, Dasa V. Intra-articular hyaluronic acid delays total knee replacement in patients with knee osteoarthritis: evidence from a large U.S. health claims database. Osteoarthritis Cartilage. 2015;23(Suppl 2):A403-A404.
- Mather RC 3rd, Hug KT, Orlando LA, et al. Economic evaluation of access to musculoskeletal care: the case of waiting for total knee arthroplasty. BMC Musculoskelet Disord. 2014;15:22. doi:10.1186/1471-2474-15-22.
- Waddell DD, Joseph B. Delayed total knee replacement with Hylan G-F 20. J Knee Surg. 2016;29(2):159-168. doi:10.1055/s-0034-1395281.
- Atukorala I, Makovey J, Williams M, Ochoa Albiztegui E, Eyles JP, Hunter DJ. If you have end-stage radiographic knee osteoarthritis can you respond to non-surgical management? Osteoarthritis Cartilage. 2015;23(Suppl 2):A329.
- Strand V, Baraf HS, Lavin PT, Lim S, Hosokawa H. Effectiveness and safety of a multicenter extension and retreatment trial of Gel-200 in patients with knee osteoarthritis. Cartilage. 2012;3(4):297-304. doi:10.1177/1947603512451024.
- Riddle DL, Kong X, Jiranek WA. Two-year incidence and predictors of future knee arthroplasty in persons with symptomatic knee osteoarthritis: preliminary analysis of longitudinal data from the osteoarthritis initiative. Knee. 2009;16(6):494-500.
- Hawker GA, Guan J, Croxford R, et al. A prospective population-based study of the predictors of undergoing total joint arthroplasty. Arthritis Rheum. 2006;54(10):3212-3220.
- Jevsevar DS. Treatment of osteoarthritis of the knee: evidence-based guideline, 2nd edition. J Am Acad Orthop Surg. 2013;21(9):571-576. doi:10.5435/JAAOS-21-09-571.
- Hochberg MC, Altman RD, April KT, et al. American College of Rheumatology 2012 recommendations for the use of nonpharmacologic and pharmacologic therapies in osteoarthritis of the hand, hip, and knee. Arthritis Care Res (Hoboken). 2012;64(4):465-474.
- Jordan KM, Arden NK, Doherty M, et al. EULAR Recommendations 2003: an evidence based approach to the management of knee osteoarthritis: report of a task force of the standing committee for international clinical studies including therapeutic trials (ESCISIT). Ann Rheum Dis. 2003;62(12):1145-1155.
- Bannuru RR, Vaysbrot EE, McIntyre LF. Did the American Academy of Orthopaedic Surgeons osteoarthritis guidelines miss the mark? Arthroscopy. 2014;30(1):86-89. doi:10.1016/j.arthro.2013.10.007.
- Losina E, Thornhill TS, Rome BN, Wright J, Katz JN. The dramatic increase in total knee replacement utilization rates in the United States cannot be fully explained by growth in population size and the obesity epidemic. J Bone Joint Surg Am. 2012;94(3):201-207. doi:10.2106/JBJS.J.01958.
- Weinstein AM, Rome BN, Reichmann WM, et al. Estimating the burden of total knee replacement in the United States. J Bone Joint Surg Am. 2013;95(5):385-392. doi:10.2106/JBJS.L.00206.
- Riddle DL, Jiranek WA, Hayes CW. Use of a validated algorithm to judge the appropriateness of total knee arthroplasty in the United States: a multicenter longitudinal cohort study. Arthritis Rheumatol. 2014;66(8):2134-2143. doi:10.1002/art.38685.
- NewBerry SJ, Fitzgerald JD, Maglione MA, et al. Agency for Healthcare Research and Quality Web site. Systematic Review for Effectiveness of Hyaluronic Acid in the Treatment of Severe Degenerative Joint Disease (DJD) of the Knee: Technology Assessment Report. http://www.ahrq.gov/research/findings/ta/call-for-public-review.html. Published July 23, 2015. Accessed December 22, 2014.
TAKE-HOME POINTS
- Repeated courses of treatment with HA are safe and are associated with the delay of TKR for up to 3 years.
- HA treatment should be considered an important clinical treatment option for patients with knee OA.
- Repeated courses of treatment with HA are safe.
- Repeated courses of HA treatment pose no greater safety risk than a single course of HA treatment.
- Additional research is needed to evaluate the effects of repeated HA courses on delaying TKR beyond a 3-year period.
Treatment of Grade III Acromioclavicular Separations in Professional Baseball Pitchers: A Survey of Major League Baseball Team Physicians
ABSTRACT
Despite advancements in surgical technique and understanding of throwing mechanics, controversy persists regarding the treatment of grade III acromioclavicular (AC) joint separations, particularly in throwing athletes. Twenty-eight major league baseball (MLB) orthopedic team physicians were surveyed to determine their definitive management of a grade III AC separation in the dominant arm of a professional baseball pitcher and their experience treating AC joint separations in starting pitchers and position players. Return-to-play outcomes were also evaluated. Twenty (71.4%) team physicians recommended nonoperative intervention compared to 8 (28.6%) who would have operated acutely. Eighteen (64.3%) team physicians had treated at least 1 professional pitcher with a grade III AC separation; 51 (77.3%) pitchers had been treated nonoperatively compared to 15 (22.7%) operatively. No difference was observed in the proportion of pitchers who returned to the same level of play (P = .54), had full, unrestricted range of motion (P = .23), or had full pain relief (P = .19) between the operatively and nonoperatively treated MLB pitchers. The majority (53.6%) of physicians would not include an injection if the injury was treated nonoperatively. Open coracoclavicular reconstruction (65.2%) was preferred for operative cases; 66.7% of surgeons would also include distal clavicle excision as an adjunct procedure. About 90% of physicians would return pitchers to throwing >12 weeks after surgery compared to after 4 to 6 weeks in nonoperatively treated cases. In conclusion, MLB team physicians preferred nonoperative management for an acute grade III AC joint separation in professional pitchers. If operative intervention is required, ligament reconstruction with adjunct distal clavicle excision were the most commonly performed procedures.
Continue to: Despite advancements in surgucal technique...
Despite advancements in surgical technique and improved understanding of the physiology of throwing mechanics, controversy persists regarding the preferred treatment for grade III acromioclavicular (AC) joint separations.1-6 Nonsurgical management has demonstrated return to prior function with fewer complications.7 However, there is a growing body of evidence demonstrating that surgical intervention is associated with more favorable outcomes8 and should be considered in patients who place high functional demands on their shoulders.9
The reported results on professional athletes in the literature remain ambivalent. Multiple small case reports/series have reported successful nonoperative treatment of elite athletes.10-12 Not surprisingly, McFarland and colleagues13 reported in 1997 that 69% of major league baseball (MLB) team physicians preferred nonoperative treatment for a theoretical starting pitcher sustaining a grade III AC separation 1 week prior to the start of the season. In contrast, reports of an inability to throw at a pre-injury level are equally commonplace.14,15 Nevertheless, all of these studies were limited to small cohorts, as the incidence of grade III AC separations in elite throwing athletes is relatively uncommon.13,16
In this study, we re-evaluated the study performed by McFarland and colleagues13 in 1997 by surveying all active MLB team orthopedic surgeons. We asked them how they would treat a grade III AC separation in a starting professional baseball pitcher. The physicians were also asked about their personal experience evaluating outcomes in these elite athletes. Given our improved understanding of the anatomy, pathophysiology, and surgical techniques for treating grade III AC separations, we hypothesize that more MLB team physicians would favor operative intervention treatment in professional baseball pitchers, as their vocation places higher demands on their shoulders.
MATERIALS AND METHODS
A questionnaire (Appendix A) was distributed to the team physicians of all 30 MLB teams. In addition to surgeon demographics, including age, years in practice, and years of taking care of an MLB team, the initial section of the questionnaire asked orthopedic surgeons how they would treat a theoretical starting pitcher who sustained a grade III AC joint separation of the dominant throwing arm 1 week prior to the start of the season. Physicians who preferred nonoperative treatment were asked whether they would use an injection (and what type), as well as when they would allow the pitcher to start a progressive interval throwing program. Physicians who preferred operative treatment were asked to rank their indications for operating, what procedure they would use (eg, open vs arthroscopic or coracoclavicular ligament repair vs reconstruction), and whether the surgical intervention would include distal clavicle excision. Both groups of physicians were also asked if their preferred treatment would change if the injury were to occur at the end of the season.
The second portion of the questionnaire asked surgeons about their experience treating AC joint separations in both starting pitchers and position players, as well as to describe the long-term outcomes of their preferred treatment, including time to return to full clearance for pitching, whether their patients returned to their prior level of play, and whether these patients had full pain relief. Finally, physicians were asked if any of the nonoperatively treated players ultimately crossed over and required operative intervention.
Continue to: Statistics...
STATISTICS
Descriptive statistics were used for continuous variables, and frequencies were used for categorical variables. Linear regression was performed to determine the correlation between the physician’s training or experience in treating AC joint separations and their recommended treatment. Fischer’s exact test/chi-square analysis was used to compare categorical variables. All tests were conducted using 2-sided hypothesis testing with statistical significance set at P < .05. All statistical analyses were conducted with SPSS 21.0 software (IBM Corporation).
RESULTS
A total of 28 MLB team physicians completed the questionnaires from 18 of the 30 MLB teams. The average age of the responders was 50.5 years (range, 34-60 years), with an average of 18.2 years in practice (range, 2-30 years) and 10.8 years (range, 1-24 years) taking care of their current professional baseball team. About 82% of the team physicians completed a sports medicine fellowship. On average, physicians saw 16.6 (range, 5-50) grade III or higher AC joint separations per year, and operated on 4.6 (range, 0-10) per year.
Nonoperative treatment was the preferred treatment for a grade III AC joint separation in a starting professional baseball pitcher for the majority of team physicians (20/28). No correlation was observed between the physician’s age (P = .881), years in practice (P = .915), years taking care of their professional team (P = .989), percentage of practice focused on shoulders (P = .986), number of AC joint injuries seen (P = .325), or number of surgeries performed per year (P = .807) with the team physician’s preferred treatment. Compared to the proportion reported originally by McFarland and colleagues13 in 1997 (69%), there was no difference in the proportion of team physicians that recommended nonoperative treatment (P = 1).
If treating this injury nonoperatively, 46.4% of physicians would also use an injection, with orthobiologics (eg, platelet-rich plasma) as the most popular choice (Table 1). No consensus was provided on the timeframe to return pitchers back to a progressive interval throwing program; however, 46.67% of physicians would return pitchers 4 to 6 weeks after a nonoperatively treated injury, while 35.7% would return pitchers 7 to 12 weeks after the initial injury.
Table 1. Treatment Preferences of Grade III AC Separation by MLB Team Physicians
Nonoperativea | |
Yes injection | 13 (46.4%) |
Cortisone | 3 (23.1%) |
Orthobiologic | 10 (76.9%) |
Local anesthetic (eg, lidocaine) | 1 (7.7%) |
Intramuscular toradol | 3 (23.1%) |
No injection | 15 (53.6%) |
Operativea | |
Open coracoclavicular ligament repair | 3 (13.0%) |
Open coracoclavicular ligament reconstruction | 15 (65.2%) |
Arthroscopic reconstruction with graft | 6 (26.1%) |
Arthroscopic repair with implant (ie, tight-rope) | 2 (8.7%) |
Distal clavicle excisionb | 16 (66.7%) |
Would not intervene operatively | 5 (17.9%) |
|
|
aRespondents were allowed to choose more than 1 treatment in each category. bChosen as an adjunct treatment.
Abbreviations: AC, acromioclavicular; MLB, major league baseball.
Most physicians (64.3%) cited functional limitations as the most important reason for indicating operative treatment, followed by pain (21.4%), and a deformity (14.3%). About 65% preferred open coracoclavicular ligament reconstruction. No physician recommended the Weaver-Dunn procedure or use of hardware (eg, hook plate). Of those who preferred an operative intervention, 66.7% would also include a distal clavicle excision, which is significantly higher than the proportion reported by McFarland and colleagues13 (23%, P = .0170). About 90% of physicians would return pitchers to play >12 weeks after operative treatment.
Continue to: If the injury occurred at the end ...
If the injury occurred at the end of the season, 7 of the 20 orthopedists (35%) who recommended nonoperative treatment said they would change to an operative intervention. Eighteen of 28 responders would have the same algorithm for MLB position players. Team physicians were less likely to recommend operative intervention in position players due to less demand on the arm and increased ability to accommodate the injury by altering their throwing mechanics.
Eighteen (64%) of the team physicians had treated at least 1 professional pitcher with a grade III AC separation in his dominant arm, and 11 (39.3%) had treated >1. Collectively, team physicians had treated 15 professional pitchers operatively, and 51 nonoperatively; only 3 patients converted to operative intervention after a failed nonoperative treatment.
Of the pitchers treated operatively, 93.3% (14) of pitchers returned to their prior level of pitching. The 1 patient who failed to return to the same level of pitching retired instead of returning to play. About 80% (12) of the pitchers had full pain relief, and 93.3% (14) had full range of motion (ROM). The pitcher who failed to regain full ROM also had a concomitant rotator cuff repair. The only complication reported from an operative intervention was a pitcher who sustained a coracoid fracture 10 months postoperatively while throwing 100 mph. Of the pitchers treated nonoperatively, 96% returned to their prior level of pitching, 92.2% (47) had full complete pain relief when throwing, and 100% had full ROM. No differences were observed between the proportion of pitchers who returned to their prior level of pitching, regained full ROM, or had full pain relief in the operative and nonoperative groups (Table 2).
Table 2. Outcomes of Treatment of Grade III AC Separation in 58 Professional Baseball Players
| Operative | Nonoperative | P-value |
Return to same level of play | 14/15 (93.3%) | 49/51 (96%) | 0.54 |
Full pain relief | 12/15 (80%) | 47/51 (92.2%) | 0.19 |
Full ROM | 14/15 (93.3%) | 51/51 (100%) | 0.23 |
Abbreviations: AC, acromioclavicular; ROM, range of motion.
DISCUSSION
Controversy persists regarding the optimal management of acute grade III AC separations, with the current available evidence potentially suggesting better cosmetic and radiological results but no definite differences in clinical results.1-6,17,18 In the absence of formal clinical practice guidelines, surgeons rely on their own experience or defer to the anecdotal experience of experts in the field. Our initial hypothesis was false in this survey of MLB team physicians taking care of overhead throwing athletes at the highest level. Our results demonstrate that despite improved techniques and an increased understanding of the pathophysiology of AC joint separations, conservative management is still the preferred treatment for acute grade III AC joint separations in professional baseball pitchers. The proportion of team physicians recommending nonoperative treatment in our series was essentially equivalent to the results reported by McFarland and colleagues13 in 1997, suggesting that the pendulum continues to favor conservative management initially. This status quo likely reflects both the dearth of literature suggesting a substantial benefit of acute operative repair, as well as the ability to accommodate with conservative measures after most grade III AC injuries, even at the highest level of athletic competition.
These results are also consistent with trends from the last few decades. In the 1970s, the overwhelming preference for treating an acute complete AC joint separation was surgical repair, with Powers and Bach10 reporting in a 1974 survey of 163 chairmen of orthopedic programs around the country that 91.5% advocated surgical treatment. However, surgical preference had reversed by the 1990s. Of the 187 chairmen and 59 team physicians surveyed by Cox19 in 1992, 72% and 86% respectively preferred nonoperative treatment in a theoretical 21-year-old athlete with a grade III AC separation. Nissen and Chatterjee20 reported in 2007 on a survey of all American Orthopaedic Society for Sports Medicine surgeons (N = 577) and Accreditation Council for Graduate Medical Education orthopedic program residency directors (N = 87) that >80% of responders preferred conservative measures for this acute injury. The reversal of trends has also been corroborated by recent multicenter trials demonstrating no difference in clinical outcomes between operative and nonoperative treatment of high grade AC joint dislocations, albeit these patients were not all high level overhead throwing athletes.17,18
Continue to: The trends in surgical interventions are notable...
The trends in surgical interventions are notable within the smaller subset of patients who are indicated for operative repair. Use of hardware and primary ligament repair, while popular in the surveys conducted in the 1970s10 and 1990s13 and even present in Nissen and Chatterjee’s20 2007 survey, were noticeably absent from our survey results, with the majority of respondents preferring open coracoclavicular ligament reconstruction. The role of distal clavicle excision has also expanded, from 23% of team physicians recommending it in 199713 to 57% to 59% in Nissen and Chatterjee’s20 2007 survey, to 66.7% in our series. This trend is not surprising as several recent cadaveric biomechanical studies have demonstrated that not only do peak graft forces not increase significantly,21 the anterior-posterior and superior-inferior motion at the AC joint following ligament reconstruction is maintained despite resection of the lateral clavicle.22 Additionally, primary distal clavicle excision may prevent the development of post-traumatic arthritis at the AC joint and osteolysis of the distal clavicle as a possible pain generator in the future.23 However, some respondents cautioned against performing a concomitant distal clavicle excision, as some biomechanical data demonstrate that resecting the distal clavicle may lead to increased horizontal translation at the AC joint despite intact superior and posterior AC capsules.24 Professional baseball pitchers may also be more lax and thus prone to more instability. Primary repair or reconstruction may not always lead to complete pre-injury stability in these individuals. This subtle unrecognized instability is hard to diagnosis and may be a persistent source of pain; thus, adding a distal clavicle excision may actually exacerbate the instability.
The nuanced indications for operative intervention, such as the presence of associated lesions were not captured by our survey.25 While most team physicians cited functional limitations as their most common reason for offering surgery, several MLB orthopedic surgeons also commented on evaluating the stability of the AC joint after a grade III injury, akin to the consensus statement from the International Society of Arthroscopy, Knee Surgery and Orthopaedic Sports Medicine (ISAKOS) Upper Extremity Committee26 in 2014 that diversified the Rockwood Grade III AC joint separation into its IIIA and IIIB classifications. The ISAKOS recommendations include initial conservative management and a second evaluation (both clinical and radiographic) for grade III lesions 3 to 6 weeks after the injury. However, as professional baseball is an incredibly profitable sport with an annual revenue approaching $9.5 billion27 and pitching salaries up to $32.5 million in 2015, serious financial considerations must be given to players who wish to avoid undergoing delayed surgery.
This study has shortcomings typical of expert opinion papers. The retrospective nature of this study places the data at risk of recall bias. Objective data (eg, terminal ROM, pain relief, and return to play) were obtained from a retrospective chart review; however, no standard documentation or collection method was used given the number of surgeons involved and, thus, conclusions based on treatment outcomes are imperfect. Another major weakness of this survey is the relatively small number of patients and respondents. An a priori power analysis was not available, as this was a retrospective review. A comparative trial will be necessary to definitively support one treatment over another. Assuming a 95% return to play in the nonoperatively treated group, approximately 300 patients would be needed in a prospective 2-armed study with 80% power to detect a 10% reduction in the incidence of return to play using an alpha level of 0.05 and assuming no loss to follow-up. This sample size would be difficult to achieve in this patient population.
However, compared to past series,13 the number of professional baseball players treated by the collective experience of these MLB team physicians is the largest reported to date. As suggested above, the rarity of this condition in elite athletes precludes the ability to have matched controls to definitively determine the optimal treatment, which may explain the lack of difference in the return to play, ROM, and pain relief outcomes. Instead, we can only extrapolate based on the collective anecdotal experience of the MLB team physicians.
CONCLUSION
Despite advances in surgical technique and understanding of throwing mechanics, the majority of MLB team physicians preferred nonoperative management for an acute grade III AC joint separation in a professional baseball pitcher. Open coracoclavicular ligament reconstruction was preferred for those who preferred operative intervention. An increasing number of orthopedic surgeons now consider a distal clavicle excision as an adjunct procedure.
This paper will be judged for the Resident Writer’s Award.
- Spencer EE Jr. Treatment of grade III acromioclavicular joint injuries: a systematic review. Clin Orthop Relat Res. 2007;455:38-44. doi:10.1097/BLO.0b013e318030df83.
- Ceccarelli E, Bondì R, Alviti F, Garofalo R, Miulli F, Padua R. Treatment of acute grade III acromioclavicular dislocation: A lack of evidence. J Orthop Traumatol. 2008;9(2):105-108. doi:10.1007/s10195-008-0013-7.
- Smith TO, Chester R, Pearse EO, Hing CB. Operative versus non-operative management following rockwood grade III acromioclavicular separation: a meta-analysis of the current evidence base. J Orthop Traumatol. 2011;12(1):19-27. doi:10.1007/s10195-011-0127-1.
- Beitzel K, Cote MP, Apostolakos J, et al. Current concepts in the treatment of acromioclavicular joint dislocations. Arthroscopy. 2013;29(2):387-397. doi:10.1016/j.arthro.2012.11.023.
- Korsten K, Gunning AC, Leenen LP. Operative or conservative treatment in patients with rockwood type III acromioclavicular dislocation: a systematic review and update of current literature. Int Orthop. 2014;38(4):831-838. doi:10.1007/s00264-013-2143-7.
- Modi CS, Beazley J, Zywiel MG, Lawrence TM, Veillette CJ. Controversies relating to the management of acromioclavicular joint dislocations. Bone Joint J. 2013;95-B(12):1595-1602. doi:10.1302/0301-620X.95B12.31802.
- Reid D, Polson K, Johnson L. Acromioclavicular joint separations grades I-III: a review of the literature and development of best practice guidelines. Sports Med. 2012;42(8):681-696. doi:10.2165/11633460-000000000-00000.
- Farber AJ, Cascio BM, Wilckens JH. Type III acromioclavicular separation: rationale for anatomical reconstruction. Am J Orthop. 2008;37(7):349-355.
- Li X, Ma R, Bedi A, Dines DM, Altchek DW, Dines JS. Management of acromioclavicular joint injuries. J Bone Joint Surg Am. 2014;96(1):73-84. doi:10.2106/JBJS.L.00734.
- Powers JA, Bach PJ. Acromioclavicular separations. Closed or open treatment? Clin Orthop Relat Res. 1974;104(104):213-223. doi:10.1097/00003086-197410000-00024.
- Glick JM, Milburn LJ, Haggerty JF, Nishimoto D. Dislocated acromioclavicular joint: follow-up study of 35 unreduced acromioclavicular dislocations. Am J Sports Med. 1977;5(6):264-270. doi:10.1177/036354657700500614.
- Watson ST, Wyland DJ. Return to play after nonoperative management for a severe type III acromioclavicular separation in the throwing shoulder of a collegiate pitcher. Phys Sportsmed. 2015;43(1):99-103. doi:10.1080/00913847.2015.1001937.
- McFarland EG, Blivin SJ, Doehring CB, Curl LA, Silberstein C. Treatment of grade III acromioclavicular separations in professional throwing athletes: results of a survey. Am J Orthop. 1997;26(11):771-774.
- Wojtys EM, Nelson G. Conservative treatment of grade III acromioclavicular dislocations. Clin Orthop Relat Res. 1991;268(268):112-119.
- Galpin RD, Hawkins RJ, Grainger RW. A comparative analysis of operative versus nonoperative treatment of grade III acromioclavicular separations. Clin Orthop Relat Res. 1985;193(193):150-155. doi:10.1097/00003086-198503000-00020.
- Pallis M, Cameron KL, Svoboda SJ, Owens BD. Epidemiology of acromioclavicular joint injury in young athletes. Am J Sports Med. 2012;40(9):2072-2077. doi:10.1177/0363546512450162.
- Canadian Orthopaedic Trauma Society. Multicenter randomized clinical trial of nonoperative versus operative treatment of acute acromio-clavicular joint dislocation. J Orthop Trauma. 2015;29(11):479-487. doi:10.1097/BOT.0000000000000437.
- Joukainen A, Kröger H, Niemitukia L, Mäkelä EA, Väätäinen U. Results of operative and nonoperative treatment of rockwood types III and V acromioclavicular joint dislocation: a prospective, randomized trial with an 18- to 20-year follow-up. Orthop J Sports Med. 2014;2(12):2325967114560130. doi:10.1177/2325967114560130.
- Cox JS. Current method of treatment of acromioclavicular joint dislocations. Orthopedics. 1992;15(9):1041-1044.
- Nissen CW, Chatterjee A. Type III acromioclavicular separation: results of a recent survey on its management. Am J Orthop. 2007;36(2):89-93.
- Kowalsky MS, Kremenic IJ, Orishimo KF, McHugh MP, Nicholas SJ, Lee SJ. The effect of distal clavicle excision on in situ graft forces in coracoclavicular ligament reconstruction. Am J Sports Med. 2010;38(11):2313-2319. doi:10.1177/0363546510374447.
- Beaver AB, Parks BG, Hinton RY. Biomechanical analysis of distal clavicle excision with acromioclavicular joint reconstruction. Am J Sports Med. 2013;41(7):1684-1688. doi:10.1177/0363546513488750.
- Mumford EB. Acromioclavicular dislocation. J Bone Joint Surg Am. 1941;23:799-802.
- Beitzel K, Sablan N, Chowaniec DM, et al. Sequential resection of the distal clavicle and its effects on horizontal acromioclavicular joint translation. Am J Sports Med. 2012;40(3):681-685. doi:10.1177/0363546511428880.
- Arrigoni P, Brady PC, Zottarelli L, et al. Associated lesions requiring additional surgical treatment in grade 3 acromioclavicular joint dislocations. Arthroscopy. 2014;30(1):6-10. doi:10.1016/j.arthro.2013.10.006.
- Beitzel K, Mazzocca AD, Bak K, et al. ISAKOS upper extremity committee consensus statement on the need for diversification of the rockwood classification for acromioclavicular joint injuries. Arthroscopy. 2014;30(2):271-278. doi:10.1016/j.arthro.2013.11.005.
- Brown M. MLB sees record revenues for 2015, up $500 million and approaching $9.5 billion. Forbes Web site. http://www.forbes.com/sites/maurybrown/2015/12/04/mlb-sees-record-revenu.... Published December 4, 2015. Accessed February 4, 2016.
ABSTRACT
Despite advancements in surgical technique and understanding of throwing mechanics, controversy persists regarding the treatment of grade III acromioclavicular (AC) joint separations, particularly in throwing athletes. Twenty-eight major league baseball (MLB) orthopedic team physicians were surveyed to determine their definitive management of a grade III AC separation in the dominant arm of a professional baseball pitcher and their experience treating AC joint separations in starting pitchers and position players. Return-to-play outcomes were also evaluated. Twenty (71.4%) team physicians recommended nonoperative intervention compared to 8 (28.6%) who would have operated acutely. Eighteen (64.3%) team physicians had treated at least 1 professional pitcher with a grade III AC separation; 51 (77.3%) pitchers had been treated nonoperatively compared to 15 (22.7%) operatively. No difference was observed in the proportion of pitchers who returned to the same level of play (P = .54), had full, unrestricted range of motion (P = .23), or had full pain relief (P = .19) between the operatively and nonoperatively treated MLB pitchers. The majority (53.6%) of physicians would not include an injection if the injury was treated nonoperatively. Open coracoclavicular reconstruction (65.2%) was preferred for operative cases; 66.7% of surgeons would also include distal clavicle excision as an adjunct procedure. About 90% of physicians would return pitchers to throwing >12 weeks after surgery compared to after 4 to 6 weeks in nonoperatively treated cases. In conclusion, MLB team physicians preferred nonoperative management for an acute grade III AC joint separation in professional pitchers. If operative intervention is required, ligament reconstruction with adjunct distal clavicle excision were the most commonly performed procedures.
Continue to: Despite advancements in surgucal technique...
Despite advancements in surgical technique and improved understanding of the physiology of throwing mechanics, controversy persists regarding the preferred treatment for grade III acromioclavicular (AC) joint separations.1-6 Nonsurgical management has demonstrated return to prior function with fewer complications.7 However, there is a growing body of evidence demonstrating that surgical intervention is associated with more favorable outcomes8 and should be considered in patients who place high functional demands on their shoulders.9
The reported results on professional athletes in the literature remain ambivalent. Multiple small case reports/series have reported successful nonoperative treatment of elite athletes.10-12 Not surprisingly, McFarland and colleagues13 reported in 1997 that 69% of major league baseball (MLB) team physicians preferred nonoperative treatment for a theoretical starting pitcher sustaining a grade III AC separation 1 week prior to the start of the season. In contrast, reports of an inability to throw at a pre-injury level are equally commonplace.14,15 Nevertheless, all of these studies were limited to small cohorts, as the incidence of grade III AC separations in elite throwing athletes is relatively uncommon.13,16
In this study, we re-evaluated the study performed by McFarland and colleagues13 in 1997 by surveying all active MLB team orthopedic surgeons. We asked them how they would treat a grade III AC separation in a starting professional baseball pitcher. The physicians were also asked about their personal experience evaluating outcomes in these elite athletes. Given our improved understanding of the anatomy, pathophysiology, and surgical techniques for treating grade III AC separations, we hypothesize that more MLB team physicians would favor operative intervention treatment in professional baseball pitchers, as their vocation places higher demands on their shoulders.
MATERIALS AND METHODS
A questionnaire (Appendix A) was distributed to the team physicians of all 30 MLB teams. In addition to surgeon demographics, including age, years in practice, and years of taking care of an MLB team, the initial section of the questionnaire asked orthopedic surgeons how they would treat a theoretical starting pitcher who sustained a grade III AC joint separation of the dominant throwing arm 1 week prior to the start of the season. Physicians who preferred nonoperative treatment were asked whether they would use an injection (and what type), as well as when they would allow the pitcher to start a progressive interval throwing program. Physicians who preferred operative treatment were asked to rank their indications for operating, what procedure they would use (eg, open vs arthroscopic or coracoclavicular ligament repair vs reconstruction), and whether the surgical intervention would include distal clavicle excision. Both groups of physicians were also asked if their preferred treatment would change if the injury were to occur at the end of the season.
The second portion of the questionnaire asked surgeons about their experience treating AC joint separations in both starting pitchers and position players, as well as to describe the long-term outcomes of their preferred treatment, including time to return to full clearance for pitching, whether their patients returned to their prior level of play, and whether these patients had full pain relief. Finally, physicians were asked if any of the nonoperatively treated players ultimately crossed over and required operative intervention.
Continue to: Statistics...
STATISTICS
Descriptive statistics were used for continuous variables, and frequencies were used for categorical variables. Linear regression was performed to determine the correlation between the physician’s training or experience in treating AC joint separations and their recommended treatment. Fischer’s exact test/chi-square analysis was used to compare categorical variables. All tests were conducted using 2-sided hypothesis testing with statistical significance set at P < .05. All statistical analyses were conducted with SPSS 21.0 software (IBM Corporation).
RESULTS
A total of 28 MLB team physicians completed the questionnaires from 18 of the 30 MLB teams. The average age of the responders was 50.5 years (range, 34-60 years), with an average of 18.2 years in practice (range, 2-30 years) and 10.8 years (range, 1-24 years) taking care of their current professional baseball team. About 82% of the team physicians completed a sports medicine fellowship. On average, physicians saw 16.6 (range, 5-50) grade III or higher AC joint separations per year, and operated on 4.6 (range, 0-10) per year.
Nonoperative treatment was the preferred treatment for a grade III AC joint separation in a starting professional baseball pitcher for the majority of team physicians (20/28). No correlation was observed between the physician’s age (P = .881), years in practice (P = .915), years taking care of their professional team (P = .989), percentage of practice focused on shoulders (P = .986), number of AC joint injuries seen (P = .325), or number of surgeries performed per year (P = .807) with the team physician’s preferred treatment. Compared to the proportion reported originally by McFarland and colleagues13 in 1997 (69%), there was no difference in the proportion of team physicians that recommended nonoperative treatment (P = 1).
If treating this injury nonoperatively, 46.4% of physicians would also use an injection, with orthobiologics (eg, platelet-rich plasma) as the most popular choice (Table 1). No consensus was provided on the timeframe to return pitchers back to a progressive interval throwing program; however, 46.67% of physicians would return pitchers 4 to 6 weeks after a nonoperatively treated injury, while 35.7% would return pitchers 7 to 12 weeks after the initial injury.
Table 1. Treatment Preferences of Grade III AC Separation by MLB Team Physicians
Nonoperativea | |
Yes injection | 13 (46.4%) |
Cortisone | 3 (23.1%) |
Orthobiologic | 10 (76.9%) |
Local anesthetic (eg, lidocaine) | 1 (7.7%) |
Intramuscular toradol | 3 (23.1%) |
No injection | 15 (53.6%) |
Operativea | |
Open coracoclavicular ligament repair | 3 (13.0%) |
Open coracoclavicular ligament reconstruction | 15 (65.2%) |
Arthroscopic reconstruction with graft | 6 (26.1%) |
Arthroscopic repair with implant (ie, tight-rope) | 2 (8.7%) |
Distal clavicle excisionb | 16 (66.7%) |
Would not intervene operatively | 5 (17.9%) |
|
|
aRespondents were allowed to choose more than 1 treatment in each category. bChosen as an adjunct treatment.
Abbreviations: AC, acromioclavicular; MLB, major league baseball.
Most physicians (64.3%) cited functional limitations as the most important reason for indicating operative treatment, followed by pain (21.4%), and a deformity (14.3%). About 65% preferred open coracoclavicular ligament reconstruction. No physician recommended the Weaver-Dunn procedure or use of hardware (eg, hook plate). Of those who preferred an operative intervention, 66.7% would also include a distal clavicle excision, which is significantly higher than the proportion reported by McFarland and colleagues13 (23%, P = .0170). About 90% of physicians would return pitchers to play >12 weeks after operative treatment.
Continue to: If the injury occurred at the end ...
If the injury occurred at the end of the season, 7 of the 20 orthopedists (35%) who recommended nonoperative treatment said they would change to an operative intervention. Eighteen of 28 responders would have the same algorithm for MLB position players. Team physicians were less likely to recommend operative intervention in position players due to less demand on the arm and increased ability to accommodate the injury by altering their throwing mechanics.
Eighteen (64%) of the team physicians had treated at least 1 professional pitcher with a grade III AC separation in his dominant arm, and 11 (39.3%) had treated >1. Collectively, team physicians had treated 15 professional pitchers operatively, and 51 nonoperatively; only 3 patients converted to operative intervention after a failed nonoperative treatment.
Of the pitchers treated operatively, 93.3% (14) of pitchers returned to their prior level of pitching. The 1 patient who failed to return to the same level of pitching retired instead of returning to play. About 80% (12) of the pitchers had full pain relief, and 93.3% (14) had full range of motion (ROM). The pitcher who failed to regain full ROM also had a concomitant rotator cuff repair. The only complication reported from an operative intervention was a pitcher who sustained a coracoid fracture 10 months postoperatively while throwing 100 mph. Of the pitchers treated nonoperatively, 96% returned to their prior level of pitching, 92.2% (47) had full complete pain relief when throwing, and 100% had full ROM. No differences were observed between the proportion of pitchers who returned to their prior level of pitching, regained full ROM, or had full pain relief in the operative and nonoperative groups (Table 2).
Table 2. Outcomes of Treatment of Grade III AC Separation in 58 Professional Baseball Players
| Operative | Nonoperative | P-value |
Return to same level of play | 14/15 (93.3%) | 49/51 (96%) | 0.54 |
Full pain relief | 12/15 (80%) | 47/51 (92.2%) | 0.19 |
Full ROM | 14/15 (93.3%) | 51/51 (100%) | 0.23 |
Abbreviations: AC, acromioclavicular; ROM, range of motion.
DISCUSSION
Controversy persists regarding the optimal management of acute grade III AC separations, with the current available evidence potentially suggesting better cosmetic and radiological results but no definite differences in clinical results.1-6,17,18 In the absence of formal clinical practice guidelines, surgeons rely on their own experience or defer to the anecdotal experience of experts in the field. Our initial hypothesis was false in this survey of MLB team physicians taking care of overhead throwing athletes at the highest level. Our results demonstrate that despite improved techniques and an increased understanding of the pathophysiology of AC joint separations, conservative management is still the preferred treatment for acute grade III AC joint separations in professional baseball pitchers. The proportion of team physicians recommending nonoperative treatment in our series was essentially equivalent to the results reported by McFarland and colleagues13 in 1997, suggesting that the pendulum continues to favor conservative management initially. This status quo likely reflects both the dearth of literature suggesting a substantial benefit of acute operative repair, as well as the ability to accommodate with conservative measures after most grade III AC injuries, even at the highest level of athletic competition.
These results are also consistent with trends from the last few decades. In the 1970s, the overwhelming preference for treating an acute complete AC joint separation was surgical repair, with Powers and Bach10 reporting in a 1974 survey of 163 chairmen of orthopedic programs around the country that 91.5% advocated surgical treatment. However, surgical preference had reversed by the 1990s. Of the 187 chairmen and 59 team physicians surveyed by Cox19 in 1992, 72% and 86% respectively preferred nonoperative treatment in a theoretical 21-year-old athlete with a grade III AC separation. Nissen and Chatterjee20 reported in 2007 on a survey of all American Orthopaedic Society for Sports Medicine surgeons (N = 577) and Accreditation Council for Graduate Medical Education orthopedic program residency directors (N = 87) that >80% of responders preferred conservative measures for this acute injury. The reversal of trends has also been corroborated by recent multicenter trials demonstrating no difference in clinical outcomes between operative and nonoperative treatment of high grade AC joint dislocations, albeit these patients were not all high level overhead throwing athletes.17,18
Continue to: The trends in surgical interventions are notable...
The trends in surgical interventions are notable within the smaller subset of patients who are indicated for operative repair. Use of hardware and primary ligament repair, while popular in the surveys conducted in the 1970s10 and 1990s13 and even present in Nissen and Chatterjee’s20 2007 survey, were noticeably absent from our survey results, with the majority of respondents preferring open coracoclavicular ligament reconstruction. The role of distal clavicle excision has also expanded, from 23% of team physicians recommending it in 199713 to 57% to 59% in Nissen and Chatterjee’s20 2007 survey, to 66.7% in our series. This trend is not surprising as several recent cadaveric biomechanical studies have demonstrated that not only do peak graft forces not increase significantly,21 the anterior-posterior and superior-inferior motion at the AC joint following ligament reconstruction is maintained despite resection of the lateral clavicle.22 Additionally, primary distal clavicle excision may prevent the development of post-traumatic arthritis at the AC joint and osteolysis of the distal clavicle as a possible pain generator in the future.23 However, some respondents cautioned against performing a concomitant distal clavicle excision, as some biomechanical data demonstrate that resecting the distal clavicle may lead to increased horizontal translation at the AC joint despite intact superior and posterior AC capsules.24 Professional baseball pitchers may also be more lax and thus prone to more instability. Primary repair or reconstruction may not always lead to complete pre-injury stability in these individuals. This subtle unrecognized instability is hard to diagnosis and may be a persistent source of pain; thus, adding a distal clavicle excision may actually exacerbate the instability.
The nuanced indications for operative intervention, such as the presence of associated lesions were not captured by our survey.25 While most team physicians cited functional limitations as their most common reason for offering surgery, several MLB orthopedic surgeons also commented on evaluating the stability of the AC joint after a grade III injury, akin to the consensus statement from the International Society of Arthroscopy, Knee Surgery and Orthopaedic Sports Medicine (ISAKOS) Upper Extremity Committee26 in 2014 that diversified the Rockwood Grade III AC joint separation into its IIIA and IIIB classifications. The ISAKOS recommendations include initial conservative management and a second evaluation (both clinical and radiographic) for grade III lesions 3 to 6 weeks after the injury. However, as professional baseball is an incredibly profitable sport with an annual revenue approaching $9.5 billion27 and pitching salaries up to $32.5 million in 2015, serious financial considerations must be given to players who wish to avoid undergoing delayed surgery.
This study has shortcomings typical of expert opinion papers. The retrospective nature of this study places the data at risk of recall bias. Objective data (eg, terminal ROM, pain relief, and return to play) were obtained from a retrospective chart review; however, no standard documentation or collection method was used given the number of surgeons involved and, thus, conclusions based on treatment outcomes are imperfect. Another major weakness of this survey is the relatively small number of patients and respondents. An a priori power analysis was not available, as this was a retrospective review. A comparative trial will be necessary to definitively support one treatment over another. Assuming a 95% return to play in the nonoperatively treated group, approximately 300 patients would be needed in a prospective 2-armed study with 80% power to detect a 10% reduction in the incidence of return to play using an alpha level of 0.05 and assuming no loss to follow-up. This sample size would be difficult to achieve in this patient population.
However, compared to past series,13 the number of professional baseball players treated by the collective experience of these MLB team physicians is the largest reported to date. As suggested above, the rarity of this condition in elite athletes precludes the ability to have matched controls to definitively determine the optimal treatment, which may explain the lack of difference in the return to play, ROM, and pain relief outcomes. Instead, we can only extrapolate based on the collective anecdotal experience of the MLB team physicians.
CONCLUSION
Despite advances in surgical technique and understanding of throwing mechanics, the majority of MLB team physicians preferred nonoperative management for an acute grade III AC joint separation in a professional baseball pitcher. Open coracoclavicular ligament reconstruction was preferred for those who preferred operative intervention. An increasing number of orthopedic surgeons now consider a distal clavicle excision as an adjunct procedure.
This paper will be judged for the Resident Writer’s Award.
- Spencer EE Jr. Treatment of grade III acromioclavicular joint injuries: a systematic review. Clin Orthop Relat Res. 2007;455:38-44. doi:10.1097/BLO.0b013e318030df83.
- Ceccarelli E, Bondì R, Alviti F, Garofalo R, Miulli F, Padua R. Treatment of acute grade III acromioclavicular dislocation: A lack of evidence. J Orthop Traumatol. 2008;9(2):105-108. doi:10.1007/s10195-008-0013-7.
- Smith TO, Chester R, Pearse EO, Hing CB. Operative versus non-operative management following rockwood grade III acromioclavicular separation: a meta-analysis of the current evidence base. J Orthop Traumatol. 2011;12(1):19-27. doi:10.1007/s10195-011-0127-1.
- Beitzel K, Cote MP, Apostolakos J, et al. Current concepts in the treatment of acromioclavicular joint dislocations. Arthroscopy. 2013;29(2):387-397. doi:10.1016/j.arthro.2012.11.023.
- Korsten K, Gunning AC, Leenen LP. Operative or conservative treatment in patients with rockwood type III acromioclavicular dislocation: a systematic review and update of current literature. Int Orthop. 2014;38(4):831-838. doi:10.1007/s00264-013-2143-7.
- Modi CS, Beazley J, Zywiel MG, Lawrence TM, Veillette CJ. Controversies relating to the management of acromioclavicular joint dislocations. Bone Joint J. 2013;95-B(12):1595-1602. doi:10.1302/0301-620X.95B12.31802.
- Reid D, Polson K, Johnson L. Acromioclavicular joint separations grades I-III: a review of the literature and development of best practice guidelines. Sports Med. 2012;42(8):681-696. doi:10.2165/11633460-000000000-00000.
- Farber AJ, Cascio BM, Wilckens JH. Type III acromioclavicular separation: rationale for anatomical reconstruction. Am J Orthop. 2008;37(7):349-355.
- Li X, Ma R, Bedi A, Dines DM, Altchek DW, Dines JS. Management of acromioclavicular joint injuries. J Bone Joint Surg Am. 2014;96(1):73-84. doi:10.2106/JBJS.L.00734.
- Powers JA, Bach PJ. Acromioclavicular separations. Closed or open treatment? Clin Orthop Relat Res. 1974;104(104):213-223. doi:10.1097/00003086-197410000-00024.
- Glick JM, Milburn LJ, Haggerty JF, Nishimoto D. Dislocated acromioclavicular joint: follow-up study of 35 unreduced acromioclavicular dislocations. Am J Sports Med. 1977;5(6):264-270. doi:10.1177/036354657700500614.
- Watson ST, Wyland DJ. Return to play after nonoperative management for a severe type III acromioclavicular separation in the throwing shoulder of a collegiate pitcher. Phys Sportsmed. 2015;43(1):99-103. doi:10.1080/00913847.2015.1001937.
- McFarland EG, Blivin SJ, Doehring CB, Curl LA, Silberstein C. Treatment of grade III acromioclavicular separations in professional throwing athletes: results of a survey. Am J Orthop. 1997;26(11):771-774.
- Wojtys EM, Nelson G. Conservative treatment of grade III acromioclavicular dislocations. Clin Orthop Relat Res. 1991;268(268):112-119.
- Galpin RD, Hawkins RJ, Grainger RW. A comparative analysis of operative versus nonoperative treatment of grade III acromioclavicular separations. Clin Orthop Relat Res. 1985;193(193):150-155. doi:10.1097/00003086-198503000-00020.
- Pallis M, Cameron KL, Svoboda SJ, Owens BD. Epidemiology of acromioclavicular joint injury in young athletes. Am J Sports Med. 2012;40(9):2072-2077. doi:10.1177/0363546512450162.
- Canadian Orthopaedic Trauma Society. Multicenter randomized clinical trial of nonoperative versus operative treatment of acute acromio-clavicular joint dislocation. J Orthop Trauma. 2015;29(11):479-487. doi:10.1097/BOT.0000000000000437.
- Joukainen A, Kröger H, Niemitukia L, Mäkelä EA, Väätäinen U. Results of operative and nonoperative treatment of rockwood types III and V acromioclavicular joint dislocation: a prospective, randomized trial with an 18- to 20-year follow-up. Orthop J Sports Med. 2014;2(12):2325967114560130. doi:10.1177/2325967114560130.
- Cox JS. Current method of treatment of acromioclavicular joint dislocations. Orthopedics. 1992;15(9):1041-1044.
- Nissen CW, Chatterjee A. Type III acromioclavicular separation: results of a recent survey on its management. Am J Orthop. 2007;36(2):89-93.
- Kowalsky MS, Kremenic IJ, Orishimo KF, McHugh MP, Nicholas SJ, Lee SJ. The effect of distal clavicle excision on in situ graft forces in coracoclavicular ligament reconstruction. Am J Sports Med. 2010;38(11):2313-2319. doi:10.1177/0363546510374447.
- Beaver AB, Parks BG, Hinton RY. Biomechanical analysis of distal clavicle excision with acromioclavicular joint reconstruction. Am J Sports Med. 2013;41(7):1684-1688. doi:10.1177/0363546513488750.
- Mumford EB. Acromioclavicular dislocation. J Bone Joint Surg Am. 1941;23:799-802.
- Beitzel K, Sablan N, Chowaniec DM, et al. Sequential resection of the distal clavicle and its effects on horizontal acromioclavicular joint translation. Am J Sports Med. 2012;40(3):681-685. doi:10.1177/0363546511428880.
- Arrigoni P, Brady PC, Zottarelli L, et al. Associated lesions requiring additional surgical treatment in grade 3 acromioclavicular joint dislocations. Arthroscopy. 2014;30(1):6-10. doi:10.1016/j.arthro.2013.10.006.
- Beitzel K, Mazzocca AD, Bak K, et al. ISAKOS upper extremity committee consensus statement on the need for diversification of the rockwood classification for acromioclavicular joint injuries. Arthroscopy. 2014;30(2):271-278. doi:10.1016/j.arthro.2013.11.005.
- Brown M. MLB sees record revenues for 2015, up $500 million and approaching $9.5 billion. Forbes Web site. http://www.forbes.com/sites/maurybrown/2015/12/04/mlb-sees-record-revenu.... Published December 4, 2015. Accessed February 4, 2016.
TAKE-HOME POINTS
- There was no difference in return to previous level of play between professional pitchers treated nonoperatively and operatively for grade III AC separation.
- MLB team physicians prefer nonoperative management for acute grade III AC joint separation in professional pitchers.
- The majority of MLB physicians do not use injections for nonoperative treatment of grade III AC separations; however, use of orthobiologics (eg, PRP) is becoming more commonplace.
- Persistent functional limitations and pain are the most common surgical indications for treatment of grade III AC separation in high level throwing athletes.
- If operative intervention is indicated for grade III AC separation, open coracoclavicular reconstruction and adjunct distal clavicle excision are preferred by most MLB team physicians.
Biomechanical Analysis of a Novel Buried Fixation Technique Using Headless Compression Screws for the Treatment of Patella Fractures
ABSTRACT
The traditional technique for patella fracture fixation utilizes prominent hardware. Prominent hardware use, however, results in a high rate of reoperation for symptomatic implant removal. This biomechanical study evaluates the effectiveness of a novel patella fixation technique that minimizes implant prominence.
Patellar transverse osteotomies were created in 13 pairs of cadaveric knees. Paired knees were assigned to either standard fixation (SF) using cannulated partially threaded screws and stainless steel wire tension band, or buried fixation (BF) using headless compression screws with a No. 2 FiberWire tension band and a No. 5 FiberWire cerclage suture. Quadriceps tendons were cyclically loaded to full extension followed by load to failure. The gap across the fracture site, stiffness, and load to failure were measured.
The differences in stiffness and load to failure between the 2 groups were not statistically significant. During cyclic loading, significantly greater gapping was observed across the fracture site in the BF group compared with SF group (P < .05).
Both constructs failed under loads that exceeded typical loads experienced during the postoperative rehabilitation period. Nevertheless, the BF technique demonstrated larger gap formation and a reduced load to failure than the SF technique. Further clinical studies are therefore underway to determine whether the use of constructs with decreased stability but increased patient comfort could improve clinical outcomes and reduce reoperation rates.
Continue to: Patella fractures are common...
Patella fractures are common injuries that can cause considerable disability to the knee extensor apparatus.1-3 Transverse patella fractures are the most common fracture pattern associated with patella fractures.{Harrell, 2003 #3}2 Given that the patella plays a crucial role in knee extensor biomechanics, its proper integrity is vital for physiological knee motion and ambulation.4 Traditionally, patella fractures with >2 mm of displacement have been managed with cannulated screws or Kirschner wires (K-wires) and a stainless-steel wire tension band.5-9 The goal in the treatment of patellar fractures is to reduce fracture fragments accurately and to minimize additional insults to the articular cartilage.10
Despite advances in surgical protocols and acceptable radiographic outcomes, functional impairment remains common after the treatment of patella fractures. Functional impairment includes knee pain, screw head pain, implant removal, wire breakage, and patella baja.1 The need for implant removal is one of the most common complications following the open reduction internal fixation of patella fractures.2,11 The subcutaneous and exposed nature of the patella in conjunction with soft tissue irritation resulting from standard fixation (SF) predisposes the patient toward prominence and discomfort with the retained implant. Although nonunion rates are low, the rate of implant removal can reach as high as 52%.2,10-12 To overcome some of these complications, we designed a novel buried fixation (BF) method for the treatment of transverse fractures. Our method minimizes the amount of exposed implant to improve patient comfort and potentially reduce the need for future implant removal. These effects are achieved by using headless compression screws and nonabsorbable sutures to attenuate the soft tissue irritation associated with traditional fixation.13 While our novel technique has demonstrated improved clinical results, it has not been tested biomechanically against a traditional fixation technique. Therefore, this study aims to evaluate and compare the structural integrity of our novel BF technique with that of the standard technique that uses cannulated screws and wire tension band. We hypothesized that the stability provided by our technique would be similar to that provided by SF for transverse patella fractures.
MATERIALS AND METHODS
SPECIMEN PREPARATION
Thirteen matched pairs of fresh-frozen human cadaveric knees were obtained from a Cedars-Sinai approved tissue bank. Specimens were cut midfemur and were intact to the foot. Legs with major structural bony or ligamentous abnormalities, extensor mechanism disruption, or septic knees were excluded from testing. To assess the bone quality of each specimen prior to testing, dual-energy X-ray absorptiometry was performed using a GE Lunar iDXA scanner (GE Healthcare). Specimens were stored at −30°C and thawed at room temperature for 24 hours prior to biomechanical testing.
A midline anterior approach to the patella was performed, and the extensor retinaculum, quadriceps tendon, and patellar tendon were exposed. A digital caliper was used to measure the craniocaudal and mediolateral dimensions of the patella, and a transverse osteotomy (Arbeitsgemeinschaft für Osteosynthesefragen/Orthopaedic Trauma Association [AO/OTA] type 34-C1) was created at the midway point between superior and inferior poles by using an oscillating saw. The retinaculum was then incised to the level of the midaxial line of the femur. One leg from each matched pair was allocated to the SF group, and the other was allocated to the BF group. Left and right legs were alternately assigned to each group to ensure that laterality was balanced between the 2 groups.
SURGICAL TECHNIQUE
The repair of the specimens in the SF group involved the use of 2 parallel 4.0-mm partially threaded cannulated screws (Acumed) and an 18-gauge monofilament steel wire (Ethicon) in a figure-eight tension band (Figure 1A). The repair of the specimens in the BF group involved the use of 2 parallel standard Acutrak headless compression screws (Acumed), a No. 2 FiberWire (Arthrex) in a figure-eight tension band, and a No. 5 FiberWire (Arthrex) was applied as cerclage around the patella (Figure 1B).
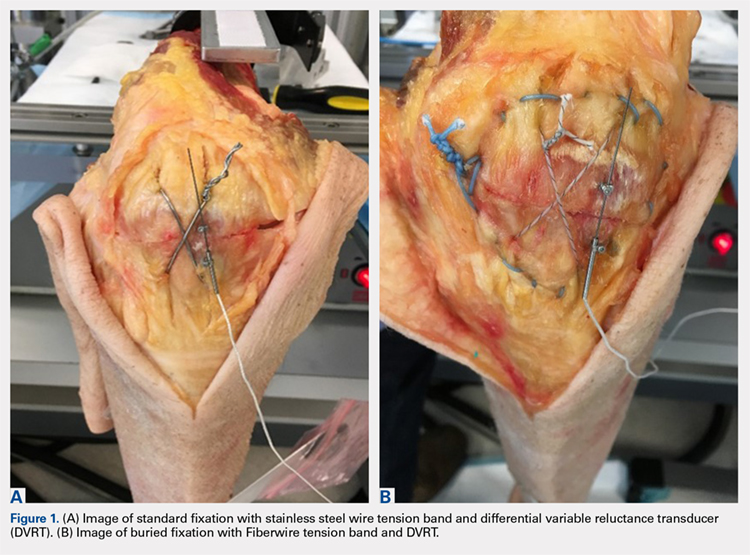
Continue to: Mechanical testing...
MECHANICAL TESTING
Mechanical testing was performed on a biaxial 370.02 Bionix Testing System (MTS Systems Corp.). The femur was rigidly and horizontally secured to a custom-built test frame, and the lower leg was left free to move. The quadriceps tendon was secured in a freeze clamp and was attached to the MTS actuator for loading via a pulley system such that raising the actuator was translated into a simulated quadriceps extensor force.
A differential variable reluctance transducer (DVRT) (Lord MicroStrain) was placed across the osteotomy site to measure the distraction, or gap, across the fracture line. The minimum load to full extension for each specimen was then determined under a slow, controlled increase in load until the leg was in a fully extended position. Any distraction across the fracture line during the initial loading phase was determined by using digital calipers. The specimen was then subjected to a preconditioning phase with 10 cycles from 0 N to full extension under the previously determined load, which was applied at the rate of 5 N/s. Meanwhile, displacement across the fracture site was recorded via the DVRT. Following the preconditioning phase, each specimen was then tested to failure in displacement control at the rate of 1.5 mm/s. Failure was defined as implant failure (screw pullout) or DVRT gapping across the osteotomy site >3 mm.10,14
Outcome measures included stiffness (N/mm), which was calculated as the slope of the linear change in load from full extension to failure vs DVRT displacement during the final loading phase; failure load (N); gapping (mm) across the osteotomy site at each cycle during the preconditioning phase; and failure mode (pullout vs >3.0 mm gap).
STATISTICAL ANALYSIS
An a priori power analysis revealed that 13 knees per group would be required to obtain an α of 0.05 and a power of 0.80. This calculation was based on a 20% difference in fracture displacement calculated by using the standard deviation and mean previously reported for cannulated screws with nonabsorbable sutures.14
Means and standard deviations for all dependent outcome measures were computed and compared across the independent measure of fixation type (BF vs SF) through repeated measures Analysis of variance (ANOVA-GLM, SAS 9.3, SAS Institute, Inc.) after controlling for bone mineral density (BMD), gender, and age. Multivariate repeated-measures ANOVA with Tukey's studentized range was applied to cyclic gap data. The mode of failure was compared across fixation type (BF vs SF) for matched data using McNemar’s test. Intracorrelations were computed and examined over all data and separately on the basis of screw fixation type (BF vs SF). All tests were considered statistically significant when P < .05.
Continue to: Results...
RESULTS
Specimen donors were 46% (6/13) male with an average age of 78.5 years (±13.77; range, 56-91 years) and 54% (7/13) female with an average age of 76.57 years (±14.37; range, 59-102 years). Average BMD was significantly lower in female (0.71 ± 0.18) than in male specimens (1.15 ± 0.33) (P < .05).
The average load to full extension across all specimens was 272 N (±54; range, 160-360 N) and was well balanced across matched pairs (270 ± 56 N for BF and 273 ± 54 N for SF). Of the 13 BF specimens, 4 experienced distraction across the fracture line during the determination of the minimum load to full extension. This initial pretest gap was measured with digital calipers (average, 1.5 mm; range, 0.90-1.85 mm) and added as an offset to the respective DVRT displacement data recorded during testing.
The total number of specimens included in the displacement data calculations decreased from 13 to 11 per group because DVRT data were not recorded during cyclic loading for 1 specimen and were considered unreliable in another. The maximum displacement measured across the fracture site during cyclic loading was significantly higher in the BF (0.94 ± 1.21) group than in the SF group (0.19 ± 0.26) as shown in the Table. The average slope of the gap per cycle for each specimen was calculated and compared between the BF and SF groups. The BF group demonstrated a significantly greater increase in gap per cycle than the SF group (Figure 2). Stiffness during load to failure was calculated for all but 1 specimen that did not display any measurable displacement during the final loading cycle. The average final stiffness and failure load between the BF and SF groups were not significantly different (Table). An equal number of specimens in both groups failed through gapping (6/13) and pullout (7/13).
Table. Means and Standard Deviations of the Main Outcome Measures
| Standard Fixation | Buried Fixation | N | P-value |
Load at Failure (N) | 1112.78 ± 457.25 | 973.20 ± 321.38 | 13 | 0.265 |
Final Stiffness (N/mm) | 358.42 ± 165.45 | 445.33 ± 310.09 | 11 | 0.175 |
Max Cyclic Gap (mm) | 0.19 ± 0.26 | 0.94 ± 1.21 | 11 | 0.026a |
Pullout: Gap Failure (ratio) | 7:6 | 7:6 | 13 | NS |
aIndicates statistical significance (P < .05).
Abbreviation: NS, not significant.
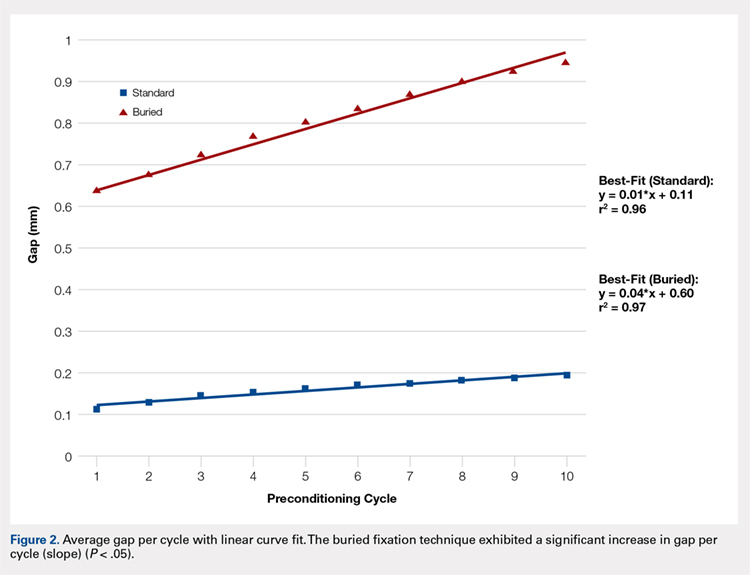
Failure load was significantly positively correlated with BMD (R = 0.62, P < .001) when all specimens were grouped together. When analyzed separately, the SF group was significantly correlated with BMD (P < .01), whereas the BF group had a marginally significant correlation (P = .06) with BMD (Figure 3). In both groups, BMD was positively correlated with stiffness and negatively correlated with gapping. Neither of these trends, however, was significant.
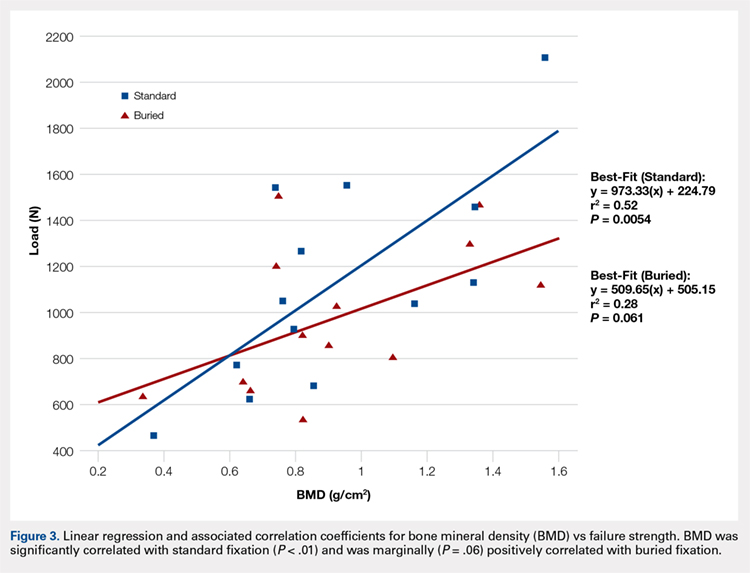
Continue to: Discussion...
DISCUSSION
We proposed a novel BF technique for the treatment of noncomminuted transverse patella fractures. Our technique utilizes headless cannulated compression screws and nonabsorbable suture tension bands. We then biomechanically compared our proposed technique with an established fixation technique that uses partially threaded cannulated screws and stainless steel wire tension bands. We hypothesized that the mechanical response of the BF technique to cyclic and failure loading would be similar to that of the SF technique. Our results demonstrate a significant increase in gap formation across the fracture site among knees and an overall reduced load to failure in the BF group (Figure 2). Whether these inferior results manifest clinically is not yet established. Both constructs could withstand forces that are typically experienced during the postoperative period. Given the high rate of symptomatic implant removal associated with the traditional technique, the low-profile buried technique might be an attractive alternative that provides increased patient comfort but may require an extended period of postoperative protection against bony ingrowths.
Patellar fixation constructs that use a combination of cannulated screws and a wire tension band provide the best resistance to patella fracture displacement when compared with screws or wires alone.4,15 Although this combination is biomechanically favorable, the steel wire often causes the painful irritation of the surrounding soft tissues and can break or migrate, thus increasing the rates of implant removal surgery to as high as 52%.4,10,12,15 We developed our novel BF technique, which uses headless compression screws and a No. 2 FiberWire tension band, to address the high rates of reoperation and patient dissatisfaction associated with the SF technique.
Headless compression screws have been successfully used in the reduction and fixation of scaphoid fractures and sesamoid fractures.16,17 The pull-out strengths of these screws are comparable with those of other commonly used screws, such as Twinfix and Herbert-Whipple screws.16 Similarly, the strength of a No. 5 FiberWire is comparable with that of an 18-gauge stainless-steel wire.14,18 Several studies have also obtained good outcomes with nonmetallic constructs that use nonabsorbable sutures alone.19,20 In this study, we utilized a No. 2 FiberWire as the tension band. The use of the No. 2 FiberWire facilitated threading through headless cannulated screws and created a low-profile knot. However, the use of thin FiberWire, despite a No. 5 FiberWire cerclage, likely contributed to the increase in distraction across the fracture.
The highest patellofemoral joint reaction force during level walking is approximately 35 kg (half body weight), which is equivalent to 350 N.15,21,22 This force is similar to the average cyclic load used in this experiment (272 ± 54 N). Gapping increased in the BF group but did not reach the defined failure value of 3 mm, and the ultimate load to failure was relatively high across both groups (SF, 1123 N; BF, 973 N). These results suggest that both fixation methods can withstand the typical patellofemoral joint forces that are experienced during the postoperative period.4 In addition, in a clinical setting, patients are placed in hinged knee braces for at least 2 weeks to limit their flexion angle and to allow for healing and bony ingrowth. Postoperative knee-brace protection presumably increases the overall strength of the fixation.
The number of specimens (n = 26) evaluated in this study was greater than that used in other biomechanical patella fracture studies.14 Furthermore, none of our specimens were reused. Our study design was further strengthened given that fellowship-trained trauma surgeons performed all surgical procedures. Finally, the data collection and analysis of numerous clinically relevant factors, such as BMD, age, and cyclical loading, contributed to the comprehensive description of each technique with respect to patient-specific criteria.
Similar to all cadaveric studies, our data only represent the immediate postoperative condition and does not represent any healing that would occur during postoperative rehabilitation. Postoperative knee-brace protection and bone healing across the fracture site would likely strengthen both constructs in a clinical setting. In addition, the average age of our specimens is 77.5 years, and therefore does not best represent the age range (20-50 years) of the typical adult population affected by patella fractures.3,23,24 Finally, postsurgical reduction was confirmed through visual inspection and not through fluoroscopy as in a clinical setting. Radiographic images were obtained after each experiment only to confirm screw placement post facto (Figures 4A, 4B).
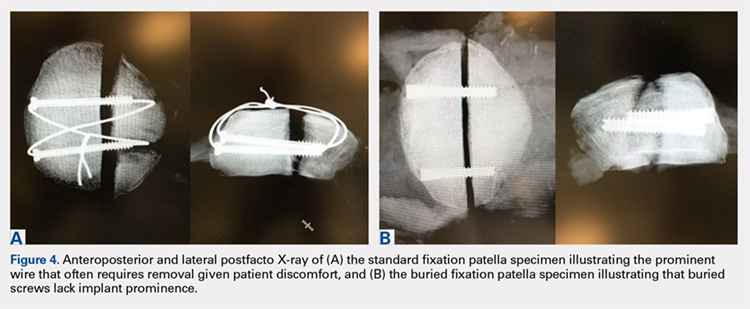
CONCLUSION
This study demonstrates the utility of a novel BF technique. Nevertheless, the proposed technique exhibited increased gapping and a lower load to failure than the current gold standard. The significance of these inferior results in clinical and functional settings has not been established. The proposed BF technique may be an appealing alternative to the SF technique given its low profile and potential to reduce the rates of future implant removal. Further studies on the long-term outcomes of patients treated through the BF technique are currently under way and will ultimately determine the utility of the proposed construct.
This paper will be judged for the Resident Writer’s Award.
- Lazaro LE, Wellman DS, Sauro G, et al. Outcomes after operative fixation of complete articular patellar fractures: assessment of functional impairment. J Bone Joint Surg Am. 2013;95(14):e96 1-8. doi:10.2106/JBJS.L.00012.
- Bostman O, Kiviluoto O, Santavirta S, Nirhamo J, Wilppula E. Fractures of the patella treated by operation. Arch Orthop Trauma Surg. 1983;102(2):78-81.
- Gwinner C, Märdian S, Schwabe P, Schaser KD, Krapohl BD, Jung TM. Current concepts review: fractures of the patella. GMS Interdiscip Plast Reconstr Surg DGPW. 2016;5:Doc01. doi:10.3205/iprs000080.
- Carpenter JE, Kasman RA, Patel N, Lee ML, Goldstein SA. Biomechanical evaluation of current patella fracture fixation techniques. J Orthop Trauma. 1997;11(5):351-356.
- Patel VR, Parks BG, Wang Y, Ebert FR, Jinnah RH. Fixation of patella fractures with braided polyester suture: a biomechanical study. Injury. 2000;31(1):1-6.
- Harrell RM, Tong J, Weinhold PS, Dahners LE. Comparison of the mechanical properties of different tension band materials and suture techniques. J Orthop Trauma. 2003;17(2):119-122.
- Banks KE, Ambrose CG, Wheeless JS, Tissue CM, Sen M. An alternative patellar fracture fixation: a biomechanical study. J Orthop Trauma. 2013;27(6):345-351. doi:10.1097/BOT.0b013e31826623eb.
- Thelen S, Schneppendahl J, Baumgartner R, et al. Cyclic long-term loading of a bilateral fixed-angle plate in comparison with tension band wiring with K-wires or cannulated screws in transverse patella fractures. Knee Surg Sports Traumatol Arthrosc. 2013;21(2):311-317. doi:10.1007/s00167-012-1999-1.
- Thelen S, Schneppendahl J, Jopen E, et al. Biomechanical cadaver testing of a fixed-angle plate in comparison to tension wiring and screw fixation in transverse patella fractures. Injury. 2012;43(8):1290-1295. doi:10.1016/j.injury.2012.04.020.
- LeBrun CT, Langford JR, Sagi HC. Functional outcomes after operatively treated patella fractures. J Orthop Trauma. 2012;26(7):422-426. doi:10.1097/BOT.0b013e318228c1a1.
- Dy CJ, Little MT, Berkes MB, et al. Meta-analysis of re-operation, nonunion, and infection after open reduction and internal fixation of patella fractures. J Trauma Acute Care Surg. 2012;73(4):928-932. doi:10.1097/TA.0b013e31825168b6.
- Smith ST, Cramer KE, Karges DE, Watson JT, Moed BR. Early complications in the operative treatment of patella fractures. J Orthop Trauma. 1997;11(3):183-187.
- Berg EE. Open reduction internal fixation of displaced transverse patella fractures with figure-eight wiring through parallel cannulated compression screws. J Orthop Trauma. 1997;11(8):573-576.
- Bryant TL, Anderson CL, Stevens CG, Conrad BP, Vincent HK, Sadasivan KK. Comparison of cannulated screws with FiberWire or stainless steel wire for patella fracture fixation: A pilot study. J Orthop. 2015;12(2):92-96. doi:10.1016/j.jor.2014.04.011.
- Burvant JG, Thomas KA, Alexander R, Harris MB. Evaluation of methods of internal fixation of transverse patella fractures: a biomechanical study. J Orthop Trauma. 1994;8(2):147-153.
- Crawford LA, Powell ES, Trail IA. The fixation strength of scaphoid bone screws: an in vitro investigation using polyurethane foam. J Hand Surg Am. 2012;37(2):255-260. doi:10.1016/j.jhsa.2011.10.021.
- Eddy AL, Galuppo LD, Stover SM, Taylor KT, Jensen DG. A biomechanical comparison of headless tapered variable pitch compression and ao cortical bone screws for fixation of a simulated midbody transverse fracture of the proximal sesamoid bone in horses. Vet Surg. 2004;33(3):253-262. doi:10.1111/j.1532-950X.2004.04037.x.
- Camarda L, La Gattuta A, Butera M, Siragusa F, D'Arienzo M. FiberWire tension band for patellar fractures. J Orthop Traumatol. 2016;17(1):75-80. doi:10.1007/s10195-015-0359-6.
- Camarda L, Morello S, Balistreri F, D'Arienzo A, D'Arienzo M. Non-metallic implant for patellar fracture fixation: A systematic review. Injury. 2016;47(8):1613-1617. doi:10.1016/j.injury.2016.05.039.
- Han F, Pearce CJ, Ng DQ, et al. A double button adjustable loop device is biomechanically equivalent to tension band wire in the fixation of transverse patellar fractures-A cadaveric study. Injury. 2017;48(2):270-276. doi:10.1016/j.injury.2016.11.013.
- Reilly DT, Martens M. Experimental analysis of the quadriceps muscle force and patello-femoral joint reaction force for various activities. Acta Orthop Scand. 1972;43(2):126-137. doi:10.1016/j.injury.2016.11.013.
- Buff HU, Jones LC, Hungerford DS. Experimental determination of forces transmitted through the patello-femoral joint. J Biomech. 1988;21(1):17-23.
- Bostrom A. Fracture of the patella. A study of 422 patellar fractures. Acta Orthop Scand Suppl. 1972;143:1-80.
- Court-Brown CM, Caesar B. Epidemiology of adult fractures: A review. Injury. 2006;37(8):691-697. doi:10.1111/iwj.12675.
ABSTRACT
The traditional technique for patella fracture fixation utilizes prominent hardware. Prominent hardware use, however, results in a high rate of reoperation for symptomatic implant removal. This biomechanical study evaluates the effectiveness of a novel patella fixation technique that minimizes implant prominence.
Patellar transverse osteotomies were created in 13 pairs of cadaveric knees. Paired knees were assigned to either standard fixation (SF) using cannulated partially threaded screws and stainless steel wire tension band, or buried fixation (BF) using headless compression screws with a No. 2 FiberWire tension band and a No. 5 FiberWire cerclage suture. Quadriceps tendons were cyclically loaded to full extension followed by load to failure. The gap across the fracture site, stiffness, and load to failure were measured.
The differences in stiffness and load to failure between the 2 groups were not statistically significant. During cyclic loading, significantly greater gapping was observed across the fracture site in the BF group compared with SF group (P < .05).
Both constructs failed under loads that exceeded typical loads experienced during the postoperative rehabilitation period. Nevertheless, the BF technique demonstrated larger gap formation and a reduced load to failure than the SF technique. Further clinical studies are therefore underway to determine whether the use of constructs with decreased stability but increased patient comfort could improve clinical outcomes and reduce reoperation rates.
Continue to: Patella fractures are common...
Patella fractures are common injuries that can cause considerable disability to the knee extensor apparatus.1-3 Transverse patella fractures are the most common fracture pattern associated with patella fractures.{Harrell, 2003 #3}2 Given that the patella plays a crucial role in knee extensor biomechanics, its proper integrity is vital for physiological knee motion and ambulation.4 Traditionally, patella fractures with >2 mm of displacement have been managed with cannulated screws or Kirschner wires (K-wires) and a stainless-steel wire tension band.5-9 The goal in the treatment of patellar fractures is to reduce fracture fragments accurately and to minimize additional insults to the articular cartilage.10
Despite advances in surgical protocols and acceptable radiographic outcomes, functional impairment remains common after the treatment of patella fractures. Functional impairment includes knee pain, screw head pain, implant removal, wire breakage, and patella baja.1 The need for implant removal is one of the most common complications following the open reduction internal fixation of patella fractures.2,11 The subcutaneous and exposed nature of the patella in conjunction with soft tissue irritation resulting from standard fixation (SF) predisposes the patient toward prominence and discomfort with the retained implant. Although nonunion rates are low, the rate of implant removal can reach as high as 52%.2,10-12 To overcome some of these complications, we designed a novel buried fixation (BF) method for the treatment of transverse fractures. Our method minimizes the amount of exposed implant to improve patient comfort and potentially reduce the need for future implant removal. These effects are achieved by using headless compression screws and nonabsorbable sutures to attenuate the soft tissue irritation associated with traditional fixation.13 While our novel technique has demonstrated improved clinical results, it has not been tested biomechanically against a traditional fixation technique. Therefore, this study aims to evaluate and compare the structural integrity of our novel BF technique with that of the standard technique that uses cannulated screws and wire tension band. We hypothesized that the stability provided by our technique would be similar to that provided by SF for transverse patella fractures.
MATERIALS AND METHODS
SPECIMEN PREPARATION
Thirteen matched pairs of fresh-frozen human cadaveric knees were obtained from a Cedars-Sinai approved tissue bank. Specimens were cut midfemur and were intact to the foot. Legs with major structural bony or ligamentous abnormalities, extensor mechanism disruption, or septic knees were excluded from testing. To assess the bone quality of each specimen prior to testing, dual-energy X-ray absorptiometry was performed using a GE Lunar iDXA scanner (GE Healthcare). Specimens were stored at −30°C and thawed at room temperature for 24 hours prior to biomechanical testing.
A midline anterior approach to the patella was performed, and the extensor retinaculum, quadriceps tendon, and patellar tendon were exposed. A digital caliper was used to measure the craniocaudal and mediolateral dimensions of the patella, and a transverse osteotomy (Arbeitsgemeinschaft für Osteosynthesefragen/Orthopaedic Trauma Association [AO/OTA] type 34-C1) was created at the midway point between superior and inferior poles by using an oscillating saw. The retinaculum was then incised to the level of the midaxial line of the femur. One leg from each matched pair was allocated to the SF group, and the other was allocated to the BF group. Left and right legs were alternately assigned to each group to ensure that laterality was balanced between the 2 groups.
SURGICAL TECHNIQUE
The repair of the specimens in the SF group involved the use of 2 parallel 4.0-mm partially threaded cannulated screws (Acumed) and an 18-gauge monofilament steel wire (Ethicon) in a figure-eight tension band (Figure 1A). The repair of the specimens in the BF group involved the use of 2 parallel standard Acutrak headless compression screws (Acumed), a No. 2 FiberWire (Arthrex) in a figure-eight tension band, and a No. 5 FiberWire (Arthrex) was applied as cerclage around the patella (Figure 1B).
Continue to: Mechanical testing...
MECHANICAL TESTING
Mechanical testing was performed on a biaxial 370.02 Bionix Testing System (MTS Systems Corp.). The femur was rigidly and horizontally secured to a custom-built test frame, and the lower leg was left free to move. The quadriceps tendon was secured in a freeze clamp and was attached to the MTS actuator for loading via a pulley system such that raising the actuator was translated into a simulated quadriceps extensor force.
A differential variable reluctance transducer (DVRT) (Lord MicroStrain) was placed across the osteotomy site to measure the distraction, or gap, across the fracture line. The minimum load to full extension for each specimen was then determined under a slow, controlled increase in load until the leg was in a fully extended position. Any distraction across the fracture line during the initial loading phase was determined by using digital calipers. The specimen was then subjected to a preconditioning phase with 10 cycles from 0 N to full extension under the previously determined load, which was applied at the rate of 5 N/s. Meanwhile, displacement across the fracture site was recorded via the DVRT. Following the preconditioning phase, each specimen was then tested to failure in displacement control at the rate of 1.5 mm/s. Failure was defined as implant failure (screw pullout) or DVRT gapping across the osteotomy site >3 mm.10,14
Outcome measures included stiffness (N/mm), which was calculated as the slope of the linear change in load from full extension to failure vs DVRT displacement during the final loading phase; failure load (N); gapping (mm) across the osteotomy site at each cycle during the preconditioning phase; and failure mode (pullout vs >3.0 mm gap).
STATISTICAL ANALYSIS
An a priori power analysis revealed that 13 knees per group would be required to obtain an α of 0.05 and a power of 0.80. This calculation was based on a 20% difference in fracture displacement calculated by using the standard deviation and mean previously reported for cannulated screws with nonabsorbable sutures.14
Means and standard deviations for all dependent outcome measures were computed and compared across the independent measure of fixation type (BF vs SF) through repeated measures Analysis of variance (ANOVA-GLM, SAS 9.3, SAS Institute, Inc.) after controlling for bone mineral density (BMD), gender, and age. Multivariate repeated-measures ANOVA with Tukey's studentized range was applied to cyclic gap data. The mode of failure was compared across fixation type (BF vs SF) for matched data using McNemar’s test. Intracorrelations were computed and examined over all data and separately on the basis of screw fixation type (BF vs SF). All tests were considered statistically significant when P < .05.
Continue to: Results...
RESULTS
Specimen donors were 46% (6/13) male with an average age of 78.5 years (±13.77; range, 56-91 years) and 54% (7/13) female with an average age of 76.57 years (±14.37; range, 59-102 years). Average BMD was significantly lower in female (0.71 ± 0.18) than in male specimens (1.15 ± 0.33) (P < .05).
The average load to full extension across all specimens was 272 N (±54; range, 160-360 N) and was well balanced across matched pairs (270 ± 56 N for BF and 273 ± 54 N for SF). Of the 13 BF specimens, 4 experienced distraction across the fracture line during the determination of the minimum load to full extension. This initial pretest gap was measured with digital calipers (average, 1.5 mm; range, 0.90-1.85 mm) and added as an offset to the respective DVRT displacement data recorded during testing.
The total number of specimens included in the displacement data calculations decreased from 13 to 11 per group because DVRT data were not recorded during cyclic loading for 1 specimen and were considered unreliable in another. The maximum displacement measured across the fracture site during cyclic loading was significantly higher in the BF (0.94 ± 1.21) group than in the SF group (0.19 ± 0.26) as shown in the Table. The average slope of the gap per cycle for each specimen was calculated and compared between the BF and SF groups. The BF group demonstrated a significantly greater increase in gap per cycle than the SF group (Figure 2). Stiffness during load to failure was calculated for all but 1 specimen that did not display any measurable displacement during the final loading cycle. The average final stiffness and failure load between the BF and SF groups were not significantly different (Table). An equal number of specimens in both groups failed through gapping (6/13) and pullout (7/13).
Table. Means and Standard Deviations of the Main Outcome Measures
| Standard Fixation | Buried Fixation | N | P-value |
Load at Failure (N) | 1112.78 ± 457.25 | 973.20 ± 321.38 | 13 | 0.265 |
Final Stiffness (N/mm) | 358.42 ± 165.45 | 445.33 ± 310.09 | 11 | 0.175 |
Max Cyclic Gap (mm) | 0.19 ± 0.26 | 0.94 ± 1.21 | 11 | 0.026a |
Pullout: Gap Failure (ratio) | 7:6 | 7:6 | 13 | NS |
aIndicates statistical significance (P < .05).
Abbreviation: NS, not significant.
Failure load was significantly positively correlated with BMD (R = 0.62, P < .001) when all specimens were grouped together. When analyzed separately, the SF group was significantly correlated with BMD (P < .01), whereas the BF group had a marginally significant correlation (P = .06) with BMD (Figure 3). In both groups, BMD was positively correlated with stiffness and negatively correlated with gapping. Neither of these trends, however, was significant.
Continue to: Discussion...
DISCUSSION
We proposed a novel BF technique for the treatment of noncomminuted transverse patella fractures. Our technique utilizes headless cannulated compression screws and nonabsorbable suture tension bands. We then biomechanically compared our proposed technique with an established fixation technique that uses partially threaded cannulated screws and stainless steel wire tension bands. We hypothesized that the mechanical response of the BF technique to cyclic and failure loading would be similar to that of the SF technique. Our results demonstrate a significant increase in gap formation across the fracture site among knees and an overall reduced load to failure in the BF group (Figure 2). Whether these inferior results manifest clinically is not yet established. Both constructs could withstand forces that are typically experienced during the postoperative period. Given the high rate of symptomatic implant removal associated with the traditional technique, the low-profile buried technique might be an attractive alternative that provides increased patient comfort but may require an extended period of postoperative protection against bony ingrowths.
Patellar fixation constructs that use a combination of cannulated screws and a wire tension band provide the best resistance to patella fracture displacement when compared with screws or wires alone.4,15 Although this combination is biomechanically favorable, the steel wire often causes the painful irritation of the surrounding soft tissues and can break or migrate, thus increasing the rates of implant removal surgery to as high as 52%.4,10,12,15 We developed our novel BF technique, which uses headless compression screws and a No. 2 FiberWire tension band, to address the high rates of reoperation and patient dissatisfaction associated with the SF technique.
Headless compression screws have been successfully used in the reduction and fixation of scaphoid fractures and sesamoid fractures.16,17 The pull-out strengths of these screws are comparable with those of other commonly used screws, such as Twinfix and Herbert-Whipple screws.16 Similarly, the strength of a No. 5 FiberWire is comparable with that of an 18-gauge stainless-steel wire.14,18 Several studies have also obtained good outcomes with nonmetallic constructs that use nonabsorbable sutures alone.19,20 In this study, we utilized a No. 2 FiberWire as the tension band. The use of the No. 2 FiberWire facilitated threading through headless cannulated screws and created a low-profile knot. However, the use of thin FiberWire, despite a No. 5 FiberWire cerclage, likely contributed to the increase in distraction across the fracture.
The highest patellofemoral joint reaction force during level walking is approximately 35 kg (half body weight), which is equivalent to 350 N.15,21,22 This force is similar to the average cyclic load used in this experiment (272 ± 54 N). Gapping increased in the BF group but did not reach the defined failure value of 3 mm, and the ultimate load to failure was relatively high across both groups (SF, 1123 N; BF, 973 N). These results suggest that both fixation methods can withstand the typical patellofemoral joint forces that are experienced during the postoperative period.4 In addition, in a clinical setting, patients are placed in hinged knee braces for at least 2 weeks to limit their flexion angle and to allow for healing and bony ingrowth. Postoperative knee-brace protection presumably increases the overall strength of the fixation.
The number of specimens (n = 26) evaluated in this study was greater than that used in other biomechanical patella fracture studies.14 Furthermore, none of our specimens were reused. Our study design was further strengthened given that fellowship-trained trauma surgeons performed all surgical procedures. Finally, the data collection and analysis of numerous clinically relevant factors, such as BMD, age, and cyclical loading, contributed to the comprehensive description of each technique with respect to patient-specific criteria.
Similar to all cadaveric studies, our data only represent the immediate postoperative condition and does not represent any healing that would occur during postoperative rehabilitation. Postoperative knee-brace protection and bone healing across the fracture site would likely strengthen both constructs in a clinical setting. In addition, the average age of our specimens is 77.5 years, and therefore does not best represent the age range (20-50 years) of the typical adult population affected by patella fractures.3,23,24 Finally, postsurgical reduction was confirmed through visual inspection and not through fluoroscopy as in a clinical setting. Radiographic images were obtained after each experiment only to confirm screw placement post facto (Figures 4A, 4B).
CONCLUSION
This study demonstrates the utility of a novel BF technique. Nevertheless, the proposed technique exhibited increased gapping and a lower load to failure than the current gold standard. The significance of these inferior results in clinical and functional settings has not been established. The proposed BF technique may be an appealing alternative to the SF technique given its low profile and potential to reduce the rates of future implant removal. Further studies on the long-term outcomes of patients treated through the BF technique are currently under way and will ultimately determine the utility of the proposed construct.
This paper will be judged for the Resident Writer’s Award.
- Lazaro LE, Wellman DS, Sauro G, et al. Outcomes after operative fixation of complete articular patellar fractures: assessment of functional impairment. J Bone Joint Surg Am. 2013;95(14):e96 1-8. doi:10.2106/JBJS.L.00012.
- Bostman O, Kiviluoto O, Santavirta S, Nirhamo J, Wilppula E. Fractures of the patella treated by operation. Arch Orthop Trauma Surg. 1983;102(2):78-81.
- Gwinner C, Märdian S, Schwabe P, Schaser KD, Krapohl BD, Jung TM. Current concepts review: fractures of the patella. GMS Interdiscip Plast Reconstr Surg DGPW. 2016;5:Doc01. doi:10.3205/iprs000080.
- Carpenter JE, Kasman RA, Patel N, Lee ML, Goldstein SA. Biomechanical evaluation of current patella fracture fixation techniques. J Orthop Trauma. 1997;11(5):351-356.
- Patel VR, Parks BG, Wang Y, Ebert FR, Jinnah RH. Fixation of patella fractures with braided polyester suture: a biomechanical study. Injury. 2000;31(1):1-6.
- Harrell RM, Tong J, Weinhold PS, Dahners LE. Comparison of the mechanical properties of different tension band materials and suture techniques. J Orthop Trauma. 2003;17(2):119-122.
- Banks KE, Ambrose CG, Wheeless JS, Tissue CM, Sen M. An alternative patellar fracture fixation: a biomechanical study. J Orthop Trauma. 2013;27(6):345-351. doi:10.1097/BOT.0b013e31826623eb.
- Thelen S, Schneppendahl J, Baumgartner R, et al. Cyclic long-term loading of a bilateral fixed-angle plate in comparison with tension band wiring with K-wires or cannulated screws in transverse patella fractures. Knee Surg Sports Traumatol Arthrosc. 2013;21(2):311-317. doi:10.1007/s00167-012-1999-1.
- Thelen S, Schneppendahl J, Jopen E, et al. Biomechanical cadaver testing of a fixed-angle plate in comparison to tension wiring and screw fixation in transverse patella fractures. Injury. 2012;43(8):1290-1295. doi:10.1016/j.injury.2012.04.020.
- LeBrun CT, Langford JR, Sagi HC. Functional outcomes after operatively treated patella fractures. J Orthop Trauma. 2012;26(7):422-426. doi:10.1097/BOT.0b013e318228c1a1.
- Dy CJ, Little MT, Berkes MB, et al. Meta-analysis of re-operation, nonunion, and infection after open reduction and internal fixation of patella fractures. J Trauma Acute Care Surg. 2012;73(4):928-932. doi:10.1097/TA.0b013e31825168b6.
- Smith ST, Cramer KE, Karges DE, Watson JT, Moed BR. Early complications in the operative treatment of patella fractures. J Orthop Trauma. 1997;11(3):183-187.
- Berg EE. Open reduction internal fixation of displaced transverse patella fractures with figure-eight wiring through parallel cannulated compression screws. J Orthop Trauma. 1997;11(8):573-576.
- Bryant TL, Anderson CL, Stevens CG, Conrad BP, Vincent HK, Sadasivan KK. Comparison of cannulated screws with FiberWire or stainless steel wire for patella fracture fixation: A pilot study. J Orthop. 2015;12(2):92-96. doi:10.1016/j.jor.2014.04.011.
- Burvant JG, Thomas KA, Alexander R, Harris MB. Evaluation of methods of internal fixation of transverse patella fractures: a biomechanical study. J Orthop Trauma. 1994;8(2):147-153.
- Crawford LA, Powell ES, Trail IA. The fixation strength of scaphoid bone screws: an in vitro investigation using polyurethane foam. J Hand Surg Am. 2012;37(2):255-260. doi:10.1016/j.jhsa.2011.10.021.
- Eddy AL, Galuppo LD, Stover SM, Taylor KT, Jensen DG. A biomechanical comparison of headless tapered variable pitch compression and ao cortical bone screws for fixation of a simulated midbody transverse fracture of the proximal sesamoid bone in horses. Vet Surg. 2004;33(3):253-262. doi:10.1111/j.1532-950X.2004.04037.x.
- Camarda L, La Gattuta A, Butera M, Siragusa F, D'Arienzo M. FiberWire tension band for patellar fractures. J Orthop Traumatol. 2016;17(1):75-80. doi:10.1007/s10195-015-0359-6.
- Camarda L, Morello S, Balistreri F, D'Arienzo A, D'Arienzo M. Non-metallic implant for patellar fracture fixation: A systematic review. Injury. 2016;47(8):1613-1617. doi:10.1016/j.injury.2016.05.039.
- Han F, Pearce CJ, Ng DQ, et al. A double button adjustable loop device is biomechanically equivalent to tension band wire in the fixation of transverse patellar fractures-A cadaveric study. Injury. 2017;48(2):270-276. doi:10.1016/j.injury.2016.11.013.
- Reilly DT, Martens M. Experimental analysis of the quadriceps muscle force and patello-femoral joint reaction force for various activities. Acta Orthop Scand. 1972;43(2):126-137. doi:10.1016/j.injury.2016.11.013.
- Buff HU, Jones LC, Hungerford DS. Experimental determination of forces transmitted through the patello-femoral joint. J Biomech. 1988;21(1):17-23.
- Bostrom A. Fracture of the patella. A study of 422 patellar fractures. Acta Orthop Scand Suppl. 1972;143:1-80.
- Court-Brown CM, Caesar B. Epidemiology of adult fractures: A review. Injury. 2006;37(8):691-697. doi:10.1111/iwj.12675.
TAKE-HOME POINTS
- Symptomatic implant removal rates are high after patella fixation with standard techniques.
- Novel buried technique may address the issue of symptomatic implants and is an attractive alternative.
- Both techniques withstand physiologic loads, but the buried technique had overall increased gapping and lower load to failure.
- The significance of these inferior results in clinical and functional settings has not been established.
- Long-term functional outcome studies will delineate the utility of the proposed new construct.
Acne Treatment: Analysis of Acne-Related Social Media Posts and the Impact on Patient Care
Social media has become a prominent source of medical information for patients, including those with dermatologic conditions.1,2 Physicians, patients, and pharmaceutical companies can use social media platforms to communicate with each other and share knowledge and advertisements related to conditions. Social media can influence patients’ perceptions of their disease and serve as a modality to acquire medical treatments.3 Furthermore, social media posts from illicit pharmacies can result in patients buying harmful medications without physician oversight.4,5 Examination of the content and sources of social media posts related to acne may be useful in determining those who are primarily utilizing social media and for what purpose. The goal of this systematic review was to identify sources of acne-related social media posts to determine communication trends to gain a better understanding of the potential impact social media may have on patient care.
Methods
Social media posts were identified (May 2008 to May 2016) using the search terms acne and treatment across all social media platforms available through a commercial social media data aggregating software (Crimson Hexagon). Information from relevant posts was extracted and compiled into a spreadsheet that included the content, post date, social media platform, and hyperlink. To further analyze the data, the first 100 posts on acne treatment from May 2008 to May 2016 were selected and manually classified by the following types of communication: (1) patient-to-patient (eg, testimonies of patients’ medical experiences); (2) professional-to-patient (eg, clinical knowledge or experience provided by a medical provider and/or cited article in reference to relevant treatments); (3) pharmaceutical company–to-patient (eg, information from reputable drug manufacturers regarding drug activity and adverse effects); (4) illicit pharmacy–to-patient (eg, pharmacies with advertisements calling patients to buy a drug online or offering discrete shipping without a prescription)4,5; or (5) other-to-patient (eg, posts that did not contain enough detail to be classified).
Results
Hundreds of thousands of social media posts discussing acne treatment were identified over the 8-year study period (Figure 1). The social media data aggregator extracted posts from various blogs, website comment sections, and online forums, as well as major social media platforms (ie, Facebook, Twitter, Google+, Tumblr). The first 100 posts selected for further analysis included 0 from 2008, 6 from 2009, 36 from 2010, 15 from 2011, 7 from 2012, 8 from 2013, 12 from 2014, 11 from 2015, and 5 from 2016. From this sample, 65 posts were considered to have an illicit source; conversely, 18 posts were from patients and 7 posts were from pharmaceutical companies (Figure 2).


Comment
This study demonstrated that discussion of acne treatment is prevalent in social media. Although our research underrepresents the social media interest in specific acne treatments, as only posts mentioning the terms acne and treatment were evaluated to gain insights into how social media platforms are being used by individuals with cutaneous disease. As such, even with this potential underrepresentation, our study demonstrated a high incidence of illicit marketing of prescription acne medications across multiple social media platforms (Figure 2). The sale of dermatologic pharmaceuticals (eg, isotretinoin) without a prescription is recognized by the US Government as a problem that is rapidly growing.4,5 Illicit pharmacies pose as legitimate pharmacies that can provide prescription medications to consumers without a prescription.5,6 The fact that these illicit pharmacy–to-patient posts were the most abundant in our study may speak to their relative success on social media platforms in encouraging patients to purchase prescription medications without physician oversight. These findings should concern health care providers, as the procurement of prescription medications without a prescription may put patients at risk.
- Alinia H, Moradi Tuchayi S, Farhangian ME, et al. Rosacea patients seeking advice: qualitative analysis of patients’ posts on a rosacea support forum. J Dermatolog Treat. 2016;27:99-102.
- Karimkhani C, Connett J, Boyers L, et al. Dermatology on Instagram. Dermatology Online J. 2014:20. pii:13030/qt71g178w9.
- Smailhodzic E, Hooijsma W, Boonstra A, et al. Social media use in healthcare: a systematic review of effects on patients and on their relationship with healthcare professionals. BMC Health Serv Res. 2016;16:442.
- Lagan BM, Dolk H, White B, et al. Assessing the availability of the teratogenic drug isotretinoin outside the pregnancy prevention programme: a survey of e-pharmacies. Pharmacoepidemiol Drug Saf. 2014;23:411-418.
- Lott JP, Kovarik CL. Availability of oral isotretinoin and terbinafine on the Internet. J Am Acad Dermatol. 2010;62:153-154.
- Mahé E, Beauchet A. Dermatologists and the Internet. J Am Acad Dermatol. 2010;63:908.
Social media has become a prominent source of medical information for patients, including those with dermatologic conditions.1,2 Physicians, patients, and pharmaceutical companies can use social media platforms to communicate with each other and share knowledge and advertisements related to conditions. Social media can influence patients’ perceptions of their disease and serve as a modality to acquire medical treatments.3 Furthermore, social media posts from illicit pharmacies can result in patients buying harmful medications without physician oversight.4,5 Examination of the content and sources of social media posts related to acne may be useful in determining those who are primarily utilizing social media and for what purpose. The goal of this systematic review was to identify sources of acne-related social media posts to determine communication trends to gain a better understanding of the potential impact social media may have on patient care.
Methods
Social media posts were identified (May 2008 to May 2016) using the search terms acne and treatment across all social media platforms available through a commercial social media data aggregating software (Crimson Hexagon). Information from relevant posts was extracted and compiled into a spreadsheet that included the content, post date, social media platform, and hyperlink. To further analyze the data, the first 100 posts on acne treatment from May 2008 to May 2016 were selected and manually classified by the following types of communication: (1) patient-to-patient (eg, testimonies of patients’ medical experiences); (2) professional-to-patient (eg, clinical knowledge or experience provided by a medical provider and/or cited article in reference to relevant treatments); (3) pharmaceutical company–to-patient (eg, information from reputable drug manufacturers regarding drug activity and adverse effects); (4) illicit pharmacy–to-patient (eg, pharmacies with advertisements calling patients to buy a drug online or offering discrete shipping without a prescription)4,5; or (5) other-to-patient (eg, posts that did not contain enough detail to be classified).
Results
Hundreds of thousands of social media posts discussing acne treatment were identified over the 8-year study period (Figure 1). The social media data aggregator extracted posts from various blogs, website comment sections, and online forums, as well as major social media platforms (ie, Facebook, Twitter, Google+, Tumblr). The first 100 posts selected for further analysis included 0 from 2008, 6 from 2009, 36 from 2010, 15 from 2011, 7 from 2012, 8 from 2013, 12 from 2014, 11 from 2015, and 5 from 2016. From this sample, 65 posts were considered to have an illicit source; conversely, 18 posts were from patients and 7 posts were from pharmaceutical companies (Figure 2).
Comment
This study demonstrated that discussion of acne treatment is prevalent in social media. Although our research underrepresents the social media interest in specific acne treatments, as only posts mentioning the terms acne and treatment were evaluated to gain insights into how social media platforms are being used by individuals with cutaneous disease. As such, even with this potential underrepresentation, our study demonstrated a high incidence of illicit marketing of prescription acne medications across multiple social media platforms (Figure 2). The sale of dermatologic pharmaceuticals (eg, isotretinoin) without a prescription is recognized by the US Government as a problem that is rapidly growing.4,5 Illicit pharmacies pose as legitimate pharmacies that can provide prescription medications to consumers without a prescription.5,6 The fact that these illicit pharmacy–to-patient posts were the most abundant in our study may speak to their relative success on social media platforms in encouraging patients to purchase prescription medications without physician oversight. These findings should concern health care providers, as the procurement of prescription medications without a prescription may put patients at risk.
- Alinia H, Moradi Tuchayi S, Farhangian ME, et al. Rosacea patients seeking advice: qualitative analysis of patients’ posts on a rosacea support forum. J Dermatolog Treat. 2016;27:99-102.
- Karimkhani C, Connett J, Boyers L, et al. Dermatology on Instagram. Dermatology Online J. 2014:20. pii:13030/qt71g178w9.
- Smailhodzic E, Hooijsma W, Boonstra A, et al. Social media use in healthcare: a systematic review of effects on patients and on their relationship with healthcare professionals. BMC Health Serv Res. 2016;16:442.
- Lagan BM, Dolk H, White B, et al. Assessing the availability of the teratogenic drug isotretinoin outside the pregnancy prevention programme: a survey of e-pharmacies. Pharmacoepidemiol Drug Saf. 2014;23:411-418.
- Lott JP, Kovarik CL. Availability of oral isotretinoin and terbinafine on the Internet. J Am Acad Dermatol. 2010;62:153-154.
- Mahé E, Beauchet A. Dermatologists and the Internet. J Am Acad Dermatol. 2010;63:908.
Practice Points
- Social media content can influence patients’ perceptions of their disease and serve as a modality to acquire medical treatments, though the source often is unknown.
- This study aimed to identify sources of acne-related social media posts to determine communication trends to gain a better understanding of the potential impact social media may have on patient care.
- Due to the potential for illicit marketing of prescription acne medications across multiple social media platforms, it is important to ask your patients what resources they use to learn about acne and offer to answer any questions regarding acne and its treatment.