User login
Mortality, Length of Stay, and Cost of Weekend Admissions
The “weekend effect” refers to the association between weekend hospital admissions and poorer outcomes, such as higher mortality rates. Analysis of National Health Service claims data from the United Kingdom suggested a 10% increase in 30-day mortality in patients admitted on Saturdays and 15% in patients admitted on Sundays,1 leading to the push for a 7-day work week and invoking controversial changes in their junior doctor (residency) working contract. Studies in the United States highlighting differences in outcomes for patients admitted on weekends compared to weekdays have mostly focused on specific diagnoses and results have been variable. Few have gone on to look at the association of weekend hospital admissions on cost2,3 and length of stay3 but results are overall inconclusive. Some have suggested that such poorer outcomes for patients admitted on weekends are due to reduced staffing and delayed procedures on weekends compared to weekdays, although this has been debated.4 The lack of consensus has made it difficult for hospitals to plan if and how to expand weekend manpower or services.
In the United States, increase in mortality rate for patients admitted on weekends has been demonstrated for a range of diagnoses, including pulmonary embolism,5 intracerebral hemorrhage,6 upper gastrointestinal hemorrhage,7,8 ruptured aortic aneurysm,9 heart failure,10 and acute kidney injury.11 However, other diagnoses such as atrial flutter or fibrillation,2 hip fractures,12 ischemic stroke,13 and esophageal variceal hemorrhage,14 show no difference in mortality between weekday and weekend admissions. Yet, other conditions such as myocardial infarction15,16 and subarachnoid hemorrhage17,18 have multiple studies with conflicting results. None of these studies have comprehensively looked at the effect of weekend admissions across all diagnoses nor compared the effect size between common diagnoses in the United States using the same risk adjustment. Reporting of differences in length of stay and cost is also rare.
We postulated that the weekend admissions are associated with increased mortality and length of stay, but that the effect would be heterogeneous between different diagnosis groups. Using a large nationally representative inpatient database, we investigated the association between weekend versus weekday admissions on in-hospital mortality, length of stay, and cost for acute hospitalizations in the United States. We performed subgroup analyses of the top 20 diagnoses to determine which diagnoses, if any, should be targeted for expanded weekend manpower or services.
METHODS
Data Sources
We used information from the National Inpatient Sample (NIS) database for this study,19 which is the largest all-payer inpatient healthcare database in the United States. It contains administrative claims information on a 20% stratified sample of discharges from all hospitals participating in the Healthcare Cost and Utilization Project (HCUP), which includes over 90% of hospitals and 95% of discharges in the country. The NIS contains clinical and nonclinical data elements, including diagnoses, severity and comorbidity measures, demographics, admission characteristics, and charges.
Study Patients
The study included all patients who were 18 years or older and were admitted to hospitals participating in HCUP from 2012 to 2014. Elective or planned admissions were excluded from this study because of the anticipated degree of unmeasured confounding that would be present between patients electively admitted on weekends compared to weekdays.
Study Variables
The primary exposure variable was admission on weekends (defined as Friday midnight to Sunday midnight) compared to the rest of the week. The primary outcome variable was in-hospital mortality. The secondary outcome variables were length of stay (measured in integer days) and cost. Length of stay was compared only using only patients who survived the hospital admission to eliminate the effect of death in shortening the length of stay. Cost was calculated by using charges available in the NIS and multiplied by the accompanying cost-to-charge ratios. Charges reflect total amount that hospitals billed for services but do not reflect how much these services actually cost. The HCUP cost-to-charge ratios are hospital-specific data based on hospital accounting reports collected by the Centers for Medicare & Medicaid Services.19
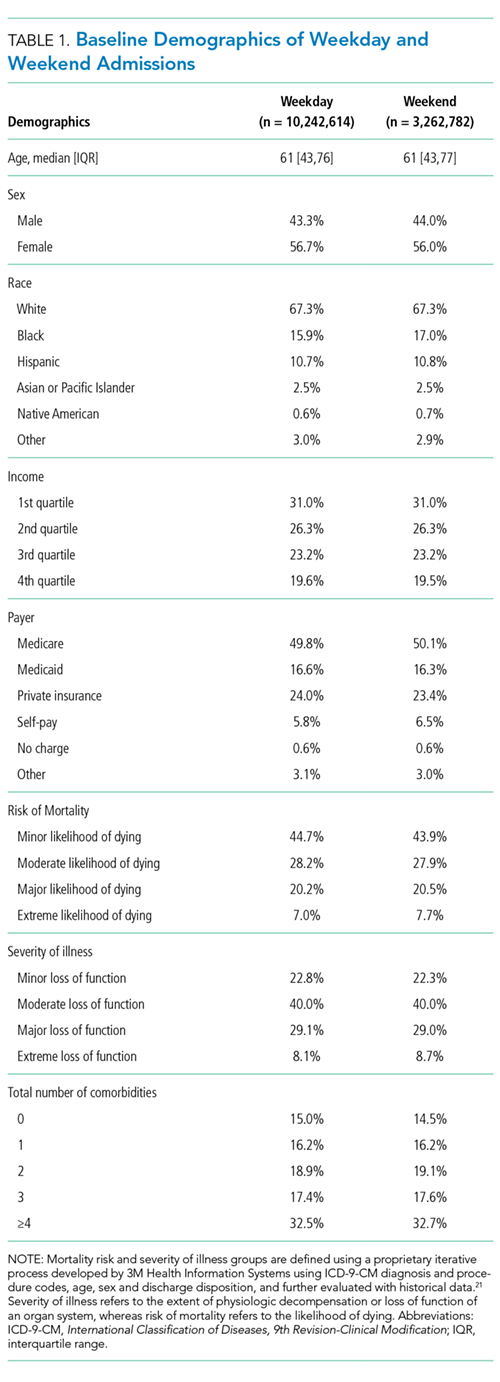
Covariates included age, sex, race, income, payer, presence or absence of comorbidities as defined by the Elixhauser comorbidity index,20 risk of mortality, and severity of illness scores as defined by the 3M Health Information Systems.21 Mortality risk and severity of illness groups are defined by using a proprietary iterative process developed by 3M Health Information Systems using International Classification of Diseases, 9th Revision-Clinical Modification (ICD-9-CM) principal and secondary diagnosis codes and procedure codes, age, sex, and discharge disposition, evaluated with historical data.21 Severity of illness refers to the extent of physiologic decompensation or loss of function of an organ system, whereas risk of mortality refers to the likelihood of dying.
Statistical Analysis
We compared patient characteristics and other covariates between patients emergently admitted on weekends and weekdays. Continuous variables that were not normally distributed were either categorized (age, risk of mortality, and severity of illness scores) or log-transformed if right skewed (length of stay and cost). Categorical data were reported as percentages and continuous data as medians (interquartile range). We compared the inpatient mortality rate between weekend and weekday admissions by using χ2 tests. Multivariable logistic regression was used to adjust for covariates of age, gender, race, payer, income, risk of mortality and severity of illness scores, number of comorbidities, and the presence or absence of each of the 29 comorbidities available in the database to determine an adjusted odds ratio (OR), P values, and confidence intervals (CIs).
We also compared the length of stay amongst survivors and costs between weekend and weekday admissions. Multivariable linear regression was applied to the natural log of these outcome variables and the coefficients exponentiated to determine the difference in length of stay and cost of weekend admissions as compared to weekday. Covariates in the model were the same as those used for the primary outcome.
To determine if particular diagnoses had a pronounced weekend effect, the above analyses were repeated in subgroups of the top 20 most prevalent diagnoses on weekends by using the Clinical Classifications Software for ICD-9-CM diagnosis groups. For subgroup analyses, a Bonferroni correction was used, so P values of <.0025 were considered significant.
Statistical analyses were performed by using SAS version 9.4 (SAS Institute Inc, Cary, NC). All regression models were run using PROC SURVEYREG for continuous outcomes and PROC SURVEYLOGISTIC for binary outcomes to account for the sampling structure of NIS. Two-sided P values of .05 were considered significant, apart from the Bonferroni correction applied to the subgroup analysis. As this study involved publicly available deidentified data, our study was exempt from institutional board review.
RESULTS
Patient Characteristics
Mortality
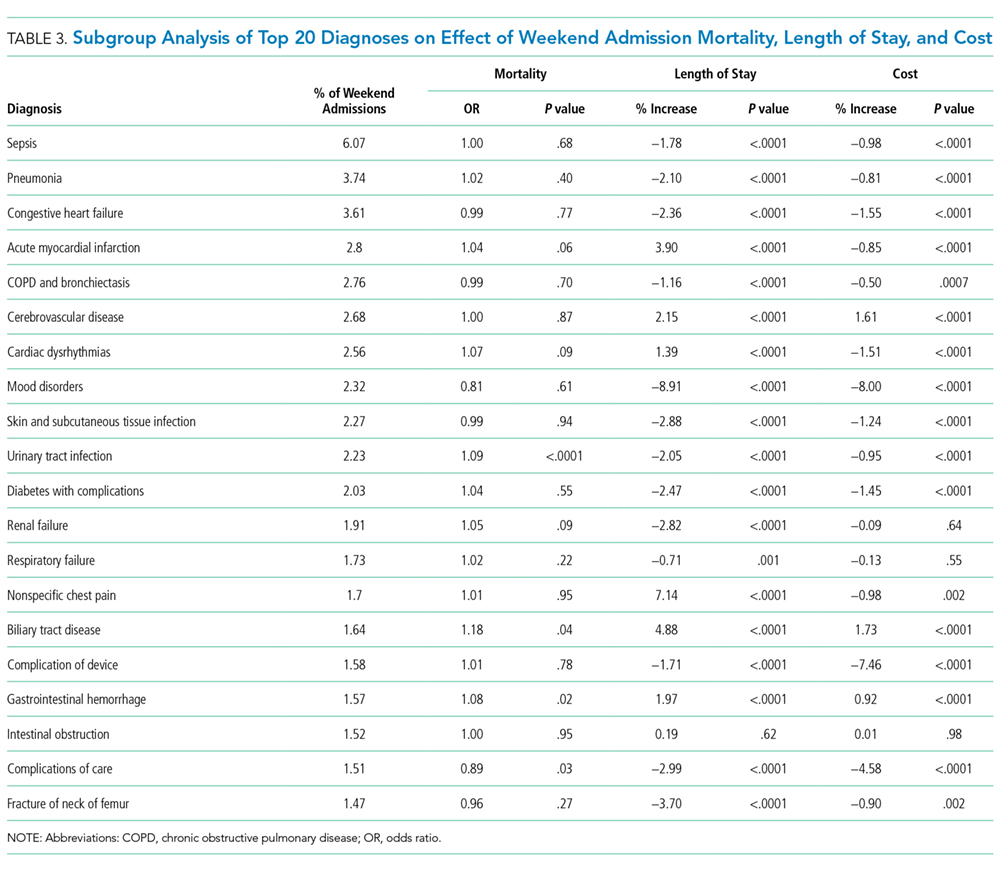
The crude in-hospital mortality rate was 2.8% for patients admitted on weekends and 2.5% for patients admitted on weekdays (unadjusted OR, 1.110; 95% CI, 1.105-1.113; P < .0001). This relationship was attenuated after adjustment for demographics, severity, and comorbidities, but remained statistically significant (OR 1.029; 95% CI, 1.020-1.039; P < .0001; Table 2), which corresponds to an adjusted risk difference of 0.07% increase in mortality of weekend admissions. The OR for mortality on weekends compared to weekdays was further calculated for each of the top 20 diagnoses (Table 3). Out of all the diagnosis groups, only 1 (urinary tract infection) had a statistically significant P value after Bonferroni correction. We also looked separately at patients who were electively admitted—there was a highly significant OR of mortality of 1.67 (95% CI, 1.60-1.74). Patients classified as elective admissions were excluded for subsequent analyses.
Length of Stay
![]()
Cost
DISCUSSION

The magnitude of association between weekend admissions and mortality in this large administrative database contradicts existing literature, which some believe conclusively proves the international phenomenon of the weekend effect.22,23 However, our results support a minimal increase in odds of death of 2.9%, with no consistent effect amongst the top 20 diagnoses. Only 1 diagnosis group (urinary tract infection) showed a statistically significant increase in mortality, which could be due to chance. In contrast, the policy-influencing paper in the United Kingdom reports that patients admitted on Saturdays and Sundays have an increased risk of death of 10% and 15%, respectively, compared to patients admitted on Wednesdays.24 They also repeated their measurements on a United Health Care Systems database, comprising 254 leading managed care hospitals in the US, over a time period of 3 months in 2010, and found a hazard ratio of 1.18 (95% CI, 1.11-1.26). Ruiz et al.22 combined almost 3 million medical records from 28 metropolitan hospitals in 5 different countries in the Global Comparators Project, including 5 in the United States, and showed increased mortality on weekends in all countries, concluding that the weekend effect is a systematic phenomenon.
There are several possible explanations for differences in our findings. Freemantle’s study differed to ours by comparing outcomes of weekends to an index of Wednesday; they also found an increased mortality on Mondays and Fridays, which could suggest the presence of residual confounding and doubt as to whether Wednesday is the ideal control group. A further difference is the definition of mortality—we looked at in-hospital mortality, as compared to 30-day mortality. In addition, Freemantle’s study included elective admissions. When we looked at the effect of weekend admissions on mortality, we found a highly significant OR of 1.67, compared to 1.03 in emergency admissions. We attributed this discrepancy to unmeasured confounding, such as preference of physicians or difference in classification of elective admissions in different hospitals. Because of significant effect modification of elective compared to emergency admissions, we decided to restrict our analysis to emergency admissions only. This also enabled direct associations with potential policy recommendations on whether to expand weekend clinical care, which is most relevant to emergency admissions. Finally, the Global Comparators Project only samples a small proportion of hospitals in each country, leading to limited generalizability; in addition, international comparisons are difficult to interpret due to differing health systems.
The overall and diagnosis-specific difference in length of stay was small and of doubtful clinical significance. With an adjusted decrease in length of stay in patients admitted on weekends of 2.24%, when applied to a median length of stay of 3 days, it translates into a 1.7-hour difference in length of stay. However, there was striking heterogeneity noted between diagnoses, with a difference ranging from 8.91% decrease in length of stay (mood disorders) to 7.14% increase in length of stay (nonspecific chest pain), which is likely to explain the overall small magnitude of effect. We noted that the diagnoses associated with increased length of stay for weekend admissions tended to be those requiring inpatient procedures or investigations, such as acute myocardial infarction (3.90% increase), acute cerebrovascular disease (2.15% increase), cardiac dysrhythmias (1.39% increase), nonspecific chest pain (7.14% increase), and biliary tract disease (4.88% increase). As hospitals often do not provide certain nonemergent procedures or investigations on weekends, delay in procedures or investigations may explain the increase in length of stay. These include percutaneous coronary intervention or stress testing for evaluation of cardiac ischemia and endoscopic procedures for biliary tract disease and gastrointestinal hemorrhage. It must, however, be noted in conjunction that numerous studies have established higher complication rates when nonemergent surgeries are performed out of hours or on weekends.25-28 Therefore, we suggest further studies to compare the effect of weekends on increased procedural complications as to any morbidity caused by increased length of stay, which the present dataset was unable to capture. Another potential explanation for the heterogeneity in length of stay could be the greater availability of caregivers to assist with discharge on weekends, such as for patients admitted for mood disorders.
Surprisingly, weekend admissions appeared to be less costly than weekday admissions overall. Because of the large sample size, very minor differences in cost are likely to be statistically significant. Indeed, for the absolute difference of 0.45%, given a median cost of $6562 on weekends, this only represents a cost saving of approximately $30 per patient admission. There was also heterogeneity observed amongst the different diagnosis groups, and cerebrovascular disease, biliary tract disease and gastrointestinal hemorrhage, which were also associated with increase length of stay, were associated with an increased cost. However, our study is unable to establish causation, and differences in staffing numbers and reimbursement on weekends may confound cost estimates. We propose that further studies using hospital databases with greater granularity in data are necessary to determine the etiology of cost differences between weekends and weekdays.
Our study’s key strengths are the large sample size and generalizability to the US. As a large administrative database, we recognize the likelihood of inconsistencies in hospital coding for covariates, diagnoses, and charges, which may lead to misclassification bias. The NIS definition of weekend (Friday midnight to Sunday midnight) may differ from other definitions of weekend; ideally Friday 5
CONCLUSION
Our study does not suggest that system-wide policies to increase weekend service coverage will impact mortality, although effects on length of stay and cost are inconclusive. Hospitals wishing to improve coverage may consider focusing on procedural diagnoses as listed above which may shorten length of stay, although the out-of-hours complication rate should be carefully monitored.
Disclosure
The authors declare no conflicts of interest.
1. Freemantle N, Ray D, McNulty D, et al. Increased mortality associated with weekend hospital admission: a case for expanded seven day services? BMJ. 2015;351:h4596. PubMed
2. Weeda ER, Hodgdon N, Do T, et al. Association between weekend admission for atrial fibrillation or flutter and in-hospital mortality, procedure utilization, length-of-stay and treatment costs. Int J Cardiol. 2016;202:427-429. PubMed
3. Khanna R, Wachsberg K, Marouni A, Feinglass J, Williams MV, Wayne DB. The association between night or weekend admission and hospitalization-relevant patient outcomes. J Hosp Med. 2011;6(1):10-14. PubMed
4. Aldridge C, Bion J, Boyal A, et al. Weekend specialist intensity and admission mortality in acute hospital trusts in England: a cross-sectional study. Lancet. 2016;388(10040):178-186. PubMed
5. Coleman CI, Brunault RD, Saulsberry WJ. Association between weekend admission and in-hospital mortality for pulmonary embolism: An observational study and meta-analysis. Int J Cardiol. 2015;194:72-74. PubMed
6. Crowley RW, Yeoh HK, Stukenborg GJ, Medel R, Kassell NF, Dumont AS. Influence of weekend hospital admission on short-term mortality after intracerebral hemorrhage. Stroke. 2009;40(7):2387-2392. PubMed
7. Dorn SD, Shah ND, Berg BP, Naessens JM. Effect of weekend hospital admission on gastrointestinal hemorrhage outcomes. Dig Dis Sci. 2010;55(6):1658-1666. PubMed
8. Shaheen AA, Kaplan GG, Myers RP. Weekend versus weekday admission and mortality from gastrointestinal hemorrhage caused by peptic ulcer disease. Clin Gastroenterol Hepatol. 2009;7(3):303-310. PubMed
9. Groves EM, Khoshchehreh M, Le C, Malik S. Effects of weekend admission on the outcomes and management of ruptured aortic aneurysms. J Vasc Surg. 2014;60(2):318-324. PubMed
10. Horwich TB, Hernandez AF, Liang L, et al. Weekend hospital admission and discharge for heart failure: association with quality of care and clinical outcomes. Am Heart J. 2009;158(3):451-458. PubMed
11. James MT, Wald R, Bell CM, et al. Weekend hospital admission, acute kidney injury, and mortality. J Am Soc Nephrol. 2010;21(5):845-851. PubMed
12. Boylan MR, Rosenbaum J, Adler A, Naziri Q, Paulino CB. Hip Fracture and the Weekend Effect: Does Weekend Admission Affect Patient Outcomes? Am J Orthop (Belle Mead NJ). 2015;44(10):458-464. PubMed
13. Myers RP, Kaplan GG, Shaheen AM. The effect of weekend versus weekday admission on outcomes of esophageal variceal hemorrhage. Can J Gastroenterol. 2009;23(7):495-501. PubMed
14. Hoh BL, Chi YY, Waters MF, Mocco J, Barker FG 2nd. Effect of weekend compared with weekday stroke admission on thrombolytic use, in-hospital mortality, discharge disposition, hospital charges, and length of stay in the Nationwide Inpatient Sample Database, 2002 to 2007. Stroke. 2010;41(10):2323-2328. PubMed
15. Kostis WJ, Demissie K, Marcella SW, Shao YH, Wilson AC, Moreyra AE. Weekend versus weekday admission and mortality from myocardial infarction. N Engl J Med. 2007;356(11):1099-1109. PubMed
16. Noad R, Stevenson M, Herity NA. Analysis of weekend effect on 30-day mortality among patients with acute myocardial infarction. Open Heart. 2017;4:1-5. PubMed
17. Crowley RW, Yeoh HK, Stukenborg GJ, Ionescu AA, Kassell NF, Dumont AS. Influence of weekend versus weekday hospital admission on mortality following subarachnoid hemorrhage. J Neurosurg. 2009;111(1):60-66. PubMed
18. Nguyen E, Tsoi A, Lee K, Farasat S, Coleman CI. Association between weekend admission for intracerebral and subarachnoid hemorrhage and in-hospital mortality. Int J Cardiol. 2016;212:26-28. PubMed
19. Healthcare Cost and Utilization Project. Overview of the National (Nationwide) Inpatient Sample (NIS). https://www.hcup-us.ahrq.gov/nisoverview.jsp. Accessed June 20, 2017.
20. Healthcare Cost and Utilization Project. Elixhauser Comorbidity Software, Version 3.7. https://www.hcup-us.ahrq.gov/toolssoftware/comorbidity/comorbidity.jsp. Accessed Feburary 20, 2017.
21. 3M Health Information Systems. All Patient Refined Diagnosis Related Groups (APR-DRGs), Version 20.0, Methodology Overview. 2003; https://www.hcup-us.ahrq.gov/db/nation/nis/APR-DRGsV20MethodologyOverviewandBibliography.pdf. Accessed on Feburary 20, 2017.
22. Ruiz M, Bottle A, Aylin PP. The Global Comparators project: international comparison of 30-day in-hospital mortality by day of the week. BMJ Qual Saf. 2015;24(8):492-504. PubMed
23. Lilford RJ, Chen YF. The ubiquitous weekend effect: moving past proving it exists to clarifying what causes it. BMJ Qual Saf. 2015;24(8):480-482. PubMed
24. Freemantle N, Richardson M, Wood J, et al. Weekend hospitalization and additional risk of death: an analysis of inpatient data. J R Soc Med. 2012;105(2):74-84. PubMed
25. Aylin P, Alexandrescu R, Jen MH, Mayer EK, Bottle A. Day of week of procedure and 30 day mortality for elective surgery: retrospective analysis of hospital episode statistics. BMJ. 2013;346:f2424. PubMed
26. Bendavid E, Kaganova Y, Needleman J, Gruenberg L, Weissman JS. Complication rates on weekends and weekdays in US hospitals. Am J Med. 2007;120(5):422-428. PubMed
27. Zapf MA, Kothari AN, Markossian T, et al. The “weekend effect” in urgent general operative procedures. Surgery. 2015;158(2):508-514. PubMed
28. Glaser R, Naidu SS, Selzer F, et al. Factors associated with poorer prognosis for patients undergoing primary percutaneous coronary intervention during off-hours: biology or systems failure? JACC Cardiovasc Interv. 2008;1(6):681-688. PubMed
The “weekend effect” refers to the association between weekend hospital admissions and poorer outcomes, such as higher mortality rates. Analysis of National Health Service claims data from the United Kingdom suggested a 10% increase in 30-day mortality in patients admitted on Saturdays and 15% in patients admitted on Sundays,1 leading to the push for a 7-day work week and invoking controversial changes in their junior doctor (residency) working contract. Studies in the United States highlighting differences in outcomes for patients admitted on weekends compared to weekdays have mostly focused on specific diagnoses and results have been variable. Few have gone on to look at the association of weekend hospital admissions on cost2,3 and length of stay3 but results are overall inconclusive. Some have suggested that such poorer outcomes for patients admitted on weekends are due to reduced staffing and delayed procedures on weekends compared to weekdays, although this has been debated.4 The lack of consensus has made it difficult for hospitals to plan if and how to expand weekend manpower or services.
In the United States, increase in mortality rate for patients admitted on weekends has been demonstrated for a range of diagnoses, including pulmonary embolism,5 intracerebral hemorrhage,6 upper gastrointestinal hemorrhage,7,8 ruptured aortic aneurysm,9 heart failure,10 and acute kidney injury.11 However, other diagnoses such as atrial flutter or fibrillation,2 hip fractures,12 ischemic stroke,13 and esophageal variceal hemorrhage,14 show no difference in mortality between weekday and weekend admissions. Yet, other conditions such as myocardial infarction15,16 and subarachnoid hemorrhage17,18 have multiple studies with conflicting results. None of these studies have comprehensively looked at the effect of weekend admissions across all diagnoses nor compared the effect size between common diagnoses in the United States using the same risk adjustment. Reporting of differences in length of stay and cost is also rare.
We postulated that the weekend admissions are associated with increased mortality and length of stay, but that the effect would be heterogeneous between different diagnosis groups. Using a large nationally representative inpatient database, we investigated the association between weekend versus weekday admissions on in-hospital mortality, length of stay, and cost for acute hospitalizations in the United States. We performed subgroup analyses of the top 20 diagnoses to determine which diagnoses, if any, should be targeted for expanded weekend manpower or services.
METHODS
Data Sources
We used information from the National Inpatient Sample (NIS) database for this study,19 which is the largest all-payer inpatient healthcare database in the United States. It contains administrative claims information on a 20% stratified sample of discharges from all hospitals participating in the Healthcare Cost and Utilization Project (HCUP), which includes over 90% of hospitals and 95% of discharges in the country. The NIS contains clinical and nonclinical data elements, including diagnoses, severity and comorbidity measures, demographics, admission characteristics, and charges.
Study Patients
The study included all patients who were 18 years or older and were admitted to hospitals participating in HCUP from 2012 to 2014. Elective or planned admissions were excluded from this study because of the anticipated degree of unmeasured confounding that would be present between patients electively admitted on weekends compared to weekdays.
Study Variables
The primary exposure variable was admission on weekends (defined as Friday midnight to Sunday midnight) compared to the rest of the week. The primary outcome variable was in-hospital mortality. The secondary outcome variables were length of stay (measured in integer days) and cost. Length of stay was compared only using only patients who survived the hospital admission to eliminate the effect of death in shortening the length of stay. Cost was calculated by using charges available in the NIS and multiplied by the accompanying cost-to-charge ratios. Charges reflect total amount that hospitals billed for services but do not reflect how much these services actually cost. The HCUP cost-to-charge ratios are hospital-specific data based on hospital accounting reports collected by the Centers for Medicare & Medicaid Services.19
Covariates included age, sex, race, income, payer, presence or absence of comorbidities as defined by the Elixhauser comorbidity index,20 risk of mortality, and severity of illness scores as defined by the 3M Health Information Systems.21 Mortality risk and severity of illness groups are defined by using a proprietary iterative process developed by 3M Health Information Systems using International Classification of Diseases, 9th Revision-Clinical Modification (ICD-9-CM) principal and secondary diagnosis codes and procedure codes, age, sex, and discharge disposition, evaluated with historical data.21 Severity of illness refers to the extent of physiologic decompensation or loss of function of an organ system, whereas risk of mortality refers to the likelihood of dying.
Statistical Analysis
We compared patient characteristics and other covariates between patients emergently admitted on weekends and weekdays. Continuous variables that were not normally distributed were either categorized (age, risk of mortality, and severity of illness scores) or log-transformed if right skewed (length of stay and cost). Categorical data were reported as percentages and continuous data as medians (interquartile range). We compared the inpatient mortality rate between weekend and weekday admissions by using χ2 tests. Multivariable logistic regression was used to adjust for covariates of age, gender, race, payer, income, risk of mortality and severity of illness scores, number of comorbidities, and the presence or absence of each of the 29 comorbidities available in the database to determine an adjusted odds ratio (OR), P values, and confidence intervals (CIs).
We also compared the length of stay amongst survivors and costs between weekend and weekday admissions. Multivariable linear regression was applied to the natural log of these outcome variables and the coefficients exponentiated to determine the difference in length of stay and cost of weekend admissions as compared to weekday. Covariates in the model were the same as those used for the primary outcome.
To determine if particular diagnoses had a pronounced weekend effect, the above analyses were repeated in subgroups of the top 20 most prevalent diagnoses on weekends by using the Clinical Classifications Software for ICD-9-CM diagnosis groups. For subgroup analyses, a Bonferroni correction was used, so P values of <.0025 were considered significant.
Statistical analyses were performed by using SAS version 9.4 (SAS Institute Inc, Cary, NC). All regression models were run using PROC SURVEYREG for continuous outcomes and PROC SURVEYLOGISTIC for binary outcomes to account for the sampling structure of NIS. Two-sided P values of .05 were considered significant, apart from the Bonferroni correction applied to the subgroup analysis. As this study involved publicly available deidentified data, our study was exempt from institutional board review.
RESULTS
Patient Characteristics
Mortality
The crude in-hospital mortality rate was 2.8% for patients admitted on weekends and 2.5% for patients admitted on weekdays (unadjusted OR, 1.110; 95% CI, 1.105-1.113; P < .0001). This relationship was attenuated after adjustment for demographics, severity, and comorbidities, but remained statistically significant (OR 1.029; 95% CI, 1.020-1.039; P < .0001; Table 2), which corresponds to an adjusted risk difference of 0.07% increase in mortality of weekend admissions. The OR for mortality on weekends compared to weekdays was further calculated for each of the top 20 diagnoses (Table 3). Out of all the diagnosis groups, only 1 (urinary tract infection) had a statistically significant P value after Bonferroni correction. We also looked separately at patients who were electively admitted—there was a highly significant OR of mortality of 1.67 (95% CI, 1.60-1.74). Patients classified as elective admissions were excluded for subsequent analyses.
Length of Stay
![]()
Cost
DISCUSSION
The magnitude of association between weekend admissions and mortality in this large administrative database contradicts existing literature, which some believe conclusively proves the international phenomenon of the weekend effect.22,23 However, our results support a minimal increase in odds of death of 2.9%, with no consistent effect amongst the top 20 diagnoses. Only 1 diagnosis group (urinary tract infection) showed a statistically significant increase in mortality, which could be due to chance. In contrast, the policy-influencing paper in the United Kingdom reports that patients admitted on Saturdays and Sundays have an increased risk of death of 10% and 15%, respectively, compared to patients admitted on Wednesdays.24 They also repeated their measurements on a United Health Care Systems database, comprising 254 leading managed care hospitals in the US, over a time period of 3 months in 2010, and found a hazard ratio of 1.18 (95% CI, 1.11-1.26). Ruiz et al.22 combined almost 3 million medical records from 28 metropolitan hospitals in 5 different countries in the Global Comparators Project, including 5 in the United States, and showed increased mortality on weekends in all countries, concluding that the weekend effect is a systematic phenomenon.
There are several possible explanations for differences in our findings. Freemantle’s study differed to ours by comparing outcomes of weekends to an index of Wednesday; they also found an increased mortality on Mondays and Fridays, which could suggest the presence of residual confounding and doubt as to whether Wednesday is the ideal control group. A further difference is the definition of mortality—we looked at in-hospital mortality, as compared to 30-day mortality. In addition, Freemantle’s study included elective admissions. When we looked at the effect of weekend admissions on mortality, we found a highly significant OR of 1.67, compared to 1.03 in emergency admissions. We attributed this discrepancy to unmeasured confounding, such as preference of physicians or difference in classification of elective admissions in different hospitals. Because of significant effect modification of elective compared to emergency admissions, we decided to restrict our analysis to emergency admissions only. This also enabled direct associations with potential policy recommendations on whether to expand weekend clinical care, which is most relevant to emergency admissions. Finally, the Global Comparators Project only samples a small proportion of hospitals in each country, leading to limited generalizability; in addition, international comparisons are difficult to interpret due to differing health systems.
The overall and diagnosis-specific difference in length of stay was small and of doubtful clinical significance. With an adjusted decrease in length of stay in patients admitted on weekends of 2.24%, when applied to a median length of stay of 3 days, it translates into a 1.7-hour difference in length of stay. However, there was striking heterogeneity noted between diagnoses, with a difference ranging from 8.91% decrease in length of stay (mood disorders) to 7.14% increase in length of stay (nonspecific chest pain), which is likely to explain the overall small magnitude of effect. We noted that the diagnoses associated with increased length of stay for weekend admissions tended to be those requiring inpatient procedures or investigations, such as acute myocardial infarction (3.90% increase), acute cerebrovascular disease (2.15% increase), cardiac dysrhythmias (1.39% increase), nonspecific chest pain (7.14% increase), and biliary tract disease (4.88% increase). As hospitals often do not provide certain nonemergent procedures or investigations on weekends, delay in procedures or investigations may explain the increase in length of stay. These include percutaneous coronary intervention or stress testing for evaluation of cardiac ischemia and endoscopic procedures for biliary tract disease and gastrointestinal hemorrhage. It must, however, be noted in conjunction that numerous studies have established higher complication rates when nonemergent surgeries are performed out of hours or on weekends.25-28 Therefore, we suggest further studies to compare the effect of weekends on increased procedural complications as to any morbidity caused by increased length of stay, which the present dataset was unable to capture. Another potential explanation for the heterogeneity in length of stay could be the greater availability of caregivers to assist with discharge on weekends, such as for patients admitted for mood disorders.
Surprisingly, weekend admissions appeared to be less costly than weekday admissions overall. Because of the large sample size, very minor differences in cost are likely to be statistically significant. Indeed, for the absolute difference of 0.45%, given a median cost of $6562 on weekends, this only represents a cost saving of approximately $30 per patient admission. There was also heterogeneity observed amongst the different diagnosis groups, and cerebrovascular disease, biliary tract disease and gastrointestinal hemorrhage, which were also associated with increase length of stay, were associated with an increased cost. However, our study is unable to establish causation, and differences in staffing numbers and reimbursement on weekends may confound cost estimates. We propose that further studies using hospital databases with greater granularity in data are necessary to determine the etiology of cost differences between weekends and weekdays.
Our study’s key strengths are the large sample size and generalizability to the US. As a large administrative database, we recognize the likelihood of inconsistencies in hospital coding for covariates, diagnoses, and charges, which may lead to misclassification bias. The NIS definition of weekend (Friday midnight to Sunday midnight) may differ from other definitions of weekend; ideally Friday 5
CONCLUSION
Our study does not suggest that system-wide policies to increase weekend service coverage will impact mortality, although effects on length of stay and cost are inconclusive. Hospitals wishing to improve coverage may consider focusing on procedural diagnoses as listed above which may shorten length of stay, although the out-of-hours complication rate should be carefully monitored.
Disclosure
The authors declare no conflicts of interest.
1. Freemantle N, Ray D, McNulty D, et al. Increased mortality associated with weekend hospital admission: a case for expanded seven day services? BMJ. 2015;351:h4596. PubMed
2. Weeda ER, Hodgdon N, Do T, et al. Association between weekend admission for atrial fibrillation or flutter and in-hospital mortality, procedure utilization, length-of-stay and treatment costs. Int J Cardiol. 2016;202:427-429. PubMed
3. Khanna R, Wachsberg K, Marouni A, Feinglass J, Williams MV, Wayne DB. The association between night or weekend admission and hospitalization-relevant patient outcomes. J Hosp Med. 2011;6(1):10-14. PubMed
4. Aldridge C, Bion J, Boyal A, et al. Weekend specialist intensity and admission mortality in acute hospital trusts in England: a cross-sectional study. Lancet. 2016;388(10040):178-186. PubMed
5. Coleman CI, Brunault RD, Saulsberry WJ. Association between weekend admission and in-hospital mortality for pulmonary embolism: An observational study and meta-analysis. Int J Cardiol. 2015;194:72-74. PubMed
6. Crowley RW, Yeoh HK, Stukenborg GJ, Medel R, Kassell NF, Dumont AS. Influence of weekend hospital admission on short-term mortality after intracerebral hemorrhage. Stroke. 2009;40(7):2387-2392. PubMed
7. Dorn SD, Shah ND, Berg BP, Naessens JM. Effect of weekend hospital admission on gastrointestinal hemorrhage outcomes. Dig Dis Sci. 2010;55(6):1658-1666. PubMed
8. Shaheen AA, Kaplan GG, Myers RP. Weekend versus weekday admission and mortality from gastrointestinal hemorrhage caused by peptic ulcer disease. Clin Gastroenterol Hepatol. 2009;7(3):303-310. PubMed
9. Groves EM, Khoshchehreh M, Le C, Malik S. Effects of weekend admission on the outcomes and management of ruptured aortic aneurysms. J Vasc Surg. 2014;60(2):318-324. PubMed
10. Horwich TB, Hernandez AF, Liang L, et al. Weekend hospital admission and discharge for heart failure: association with quality of care and clinical outcomes. Am Heart J. 2009;158(3):451-458. PubMed
11. James MT, Wald R, Bell CM, et al. Weekend hospital admission, acute kidney injury, and mortality. J Am Soc Nephrol. 2010;21(5):845-851. PubMed
12. Boylan MR, Rosenbaum J, Adler A, Naziri Q, Paulino CB. Hip Fracture and the Weekend Effect: Does Weekend Admission Affect Patient Outcomes? Am J Orthop (Belle Mead NJ). 2015;44(10):458-464. PubMed
13. Myers RP, Kaplan GG, Shaheen AM. The effect of weekend versus weekday admission on outcomes of esophageal variceal hemorrhage. Can J Gastroenterol. 2009;23(7):495-501. PubMed
14. Hoh BL, Chi YY, Waters MF, Mocco J, Barker FG 2nd. Effect of weekend compared with weekday stroke admission on thrombolytic use, in-hospital mortality, discharge disposition, hospital charges, and length of stay in the Nationwide Inpatient Sample Database, 2002 to 2007. Stroke. 2010;41(10):2323-2328. PubMed
15. Kostis WJ, Demissie K, Marcella SW, Shao YH, Wilson AC, Moreyra AE. Weekend versus weekday admission and mortality from myocardial infarction. N Engl J Med. 2007;356(11):1099-1109. PubMed
16. Noad R, Stevenson M, Herity NA. Analysis of weekend effect on 30-day mortality among patients with acute myocardial infarction. Open Heart. 2017;4:1-5. PubMed
17. Crowley RW, Yeoh HK, Stukenborg GJ, Ionescu AA, Kassell NF, Dumont AS. Influence of weekend versus weekday hospital admission on mortality following subarachnoid hemorrhage. J Neurosurg. 2009;111(1):60-66. PubMed
18. Nguyen E, Tsoi A, Lee K, Farasat S, Coleman CI. Association between weekend admission for intracerebral and subarachnoid hemorrhage and in-hospital mortality. Int J Cardiol. 2016;212:26-28. PubMed
19. Healthcare Cost and Utilization Project. Overview of the National (Nationwide) Inpatient Sample (NIS). https://www.hcup-us.ahrq.gov/nisoverview.jsp. Accessed June 20, 2017.
20. Healthcare Cost and Utilization Project. Elixhauser Comorbidity Software, Version 3.7. https://www.hcup-us.ahrq.gov/toolssoftware/comorbidity/comorbidity.jsp. Accessed Feburary 20, 2017.
21. 3M Health Information Systems. All Patient Refined Diagnosis Related Groups (APR-DRGs), Version 20.0, Methodology Overview. 2003; https://www.hcup-us.ahrq.gov/db/nation/nis/APR-DRGsV20MethodologyOverviewandBibliography.pdf. Accessed on Feburary 20, 2017.
22. Ruiz M, Bottle A, Aylin PP. The Global Comparators project: international comparison of 30-day in-hospital mortality by day of the week. BMJ Qual Saf. 2015;24(8):492-504. PubMed
23. Lilford RJ, Chen YF. The ubiquitous weekend effect: moving past proving it exists to clarifying what causes it. BMJ Qual Saf. 2015;24(8):480-482. PubMed
24. Freemantle N, Richardson M, Wood J, et al. Weekend hospitalization and additional risk of death: an analysis of inpatient data. J R Soc Med. 2012;105(2):74-84. PubMed
25. Aylin P, Alexandrescu R, Jen MH, Mayer EK, Bottle A. Day of week of procedure and 30 day mortality for elective surgery: retrospective analysis of hospital episode statistics. BMJ. 2013;346:f2424. PubMed
26. Bendavid E, Kaganova Y, Needleman J, Gruenberg L, Weissman JS. Complication rates on weekends and weekdays in US hospitals. Am J Med. 2007;120(5):422-428. PubMed
27. Zapf MA, Kothari AN, Markossian T, et al. The “weekend effect” in urgent general operative procedures. Surgery. 2015;158(2):508-514. PubMed
28. Glaser R, Naidu SS, Selzer F, et al. Factors associated with poorer prognosis for patients undergoing primary percutaneous coronary intervention during off-hours: biology or systems failure? JACC Cardiovasc Interv. 2008;1(6):681-688. PubMed
© 2018 Society of Hospital Medicine
Implementation of a Process for Initiating Naltrexone in Patients Hospitalized for Alcohol Detoxification or Withdrawal
Alcohol use disorders (AUDs) are common, with an estimated lifetime prevalence of 17.8% for alcohol dependence.1 Alcohol misuse is costly, accounting for $24.6 billion in annual healthcare expenditures, including $5.1 billion for alcohol-related hospitalizations.2 A number of trials have demonstrated that naltrexone can help patients with AUDs maintain abstinence or diminish heavy drinking.3-10 A recent meta-analysis of pharmacotherapy trials for patients with AUDs reported that for patients using 50 mg of naltrexone daily, the number needed to treat was 12 to prevent a return to heavy drinking and 20 to prevent a return to any drinking.11 Despite good evidence for its effectiveness, naltrexone is not prescribed to the majority of patients with AUDs. In a study of veterans with AUDs cared for in the Veterans Affairs health system, only 1.9% of patients were prescribed naltrexone over the 6-month study period.12 A 2003 survey of 2 professional organizations for addiction treatment specialists reported that a mean of 13% of providers prescribed naltrexone to their patients.13
When naltrexone is prescribed, it is most frequently in the outpatient setting.3-10 Data for initiation of naltrexone in the inpatient setting are more limited. Wei et al.14 reported on the implementation of a discharge protocol, including counseling about naltrexone, for hospitalized patients with AUDs at an urban academic medical center. They reported a significant increase in the prescription of naltrexone to eligible patients by the time of discharge that was associated with a significant decrease in 30-day readmissions. Initiation of naltrexone in the inpatient versus the outpatient setting has some potential advantages. First, patients hospitalized for alcohol withdrawal have AUDs, obviating the need for screening. Second, the outpatient trials of naltrexone typically required 3 days of sobriety before initiation, which is generally achieved during hospitalization for detoxification or withdrawal.
Previous work at our institution centered on standardizing the process of evaluating patients needing alcohol detoxification at the time of referral for admission.15 The use of a standardized protocol reduced the number of inpatient admissions for alcohol-related diagnoses but had no effect on the 30-day readmission rate (28%) for those patients who were hospitalized. Our hospitalist group had no standardized process for discharging hospitalized patients with AUDs, and the discharge process rarely included counseling on medications for maintenance of sobriety. In this manuscript, we describe the implementation and impact of a process for counseling patients hospitalized for alcohol detoxification or withdrawal about naltrexone for maintenance of sobriety by the time of hospital discharge.
METHODS
Study Setting
The University of North Carolina (UNC) Hospitals is an 803-bed tertiary academic center. UNC Hospital Medicine is staffed by 29 physicians and 3 advanced practice providers (APPs). During the study period, there were 3 hospital medicine services at UNC Hospitals with a combined average daily census of approximately 40 patients, and each service was staffed by one attending physician every day of the week and one APP Monday through Friday.
Study Design
We used a pre-post study design, in which we implemented a new process for standardizing the discharge of hospitalized patients with AUDs, including a process for counseling about naltrexone by the time of discharge. We sought and received institutional review board (IRB) approval for this study (UNC IRB 15-1441).
Interventions
We formed an improvement team that included 3 physicians and an APP in hospital medicine, a general internist and a psychiatrist, both with expertise in the use of medications for maintenance of sobriety, the director of UNC’s Alcohol and Substance Abuse Program, and 2 case managers. The team developed a number of interventions, including group education, a process for patient identification, and algorithms for counseling about, prescribing, and documenting the discussion of naltrexone.
Group Education
We presented evidence about medications for the maintenance of sobriety at a regularly scheduled hospitalist meeting. An hour-long session on motivational interviewing techniques was also presented at a separate meeting. All created algorithms were circulated to the group electronically and posted at workstations in the hospitalist work area. As data were generated postimplementation, control charts of process measures were created, posted in the hospitalist work area, and presented at subsequent group meetings.
Identification of Patients
We focused our interventions on patients admitted for alcohol detoxification or withdrawal (including withdrawal seizures). We asked our group to preferentially admit these patients to 1 of our 3 hospitalists services, on which the service APP (K.S.) was also an improvement team member.
Creation of Algorithms and Scripts for Counseling
We created a simple algorithm for evaluating patients for naltrexone. We recommended that all patients admitted for alcohol detoxification or withdrawal be counseled about naltrexone for the maintenance of sobriety before discharge. The contraindications to naltrexone we included were (1) concurrent opioid use, (2) documented cirrhosis, and/or (3) liver function tests greater than 3 times the upper limit of normal by the time of hospital discharge.
We also created a suggested script for motivational interviewing (supplemental Appendix 1). This was presented at a group meeting and circulated via e-mail. The actual counseling technique and process was left up to individual providers. In practice, counseling took place in the course of daily rounds, generally the day before or day of hospital discharge.
Prescription of Medication
For interested patients without contraindications, we recommended a prescription of naltrexone at 50 mg daily for 3 months. For patients prescribed naltrexone without medical insurance (n = 17), we utilized our existing pharmacy assistance program, whereby discharging patients can obtain an initial 14-day supply after applying to the program and then can fill subsequent prescriptions if they meet program financial requirements.
Follow-up Appointments
For patients with established outpatient providers, we asked patients to schedule follow-up appointments within a month of discharge. Patients prescribed naltrexone without primary providers (n = 16) were eligible for an existing program, the UNC Transitions Program, whereby patients identified as having moderate-to-high risk of hospital readmission can receive a follow-up appointment at UNC Internal Medicine or UNC Family Medicine within 2 weeks of discharge.
Creation of “Smart Phrases”
To aid in documentation, we created “smart phrases” (easily accessed, previously created phrases that can be adopted by all users) within the hospital electronic health record. We created one smart phrase for documentation of counseling about naltrexone, which included dropdown menus for contraindications and the patient’s preference and one for discharge instructions for patients started on naltrexone (supplemental Appendix 2).
Implementation
After the presentation of suggested interventions in July 2015 and the subsequent dissemination of educational materials, we implemented our new process on August 1, 2015.
Data Collection
Patients were identified for inclusion in the study analysis by querying UNC Hospitals’ billing database for the inpatient diagnosis codes (diagnosis-related groupings) 896 and 897, “alcohol/drug abuse or dependence without rehabilitation therapy,” with and without major comorbidity or complication, respectively, and with hospital medicine as the discharging service. All encounters were then manually reviewed by 2 investigators (J.S. and C.M.). Encounters were included if the history and physical indicated that the primary reason for admission was alcohol detoxification or withdrawal. Encounters with other primary reasons for admission (eg, pancreatitis, gastrointestinal bleeding) were excluded. For patients with multiple encounters, only the first eligible encounter in the pre- and/or postimplementation period was included. Comorbidities for identified patients were assessed via the search of study encounters for the International Classification of Diseases, 9th Revision-Clinical Modification codes for hypertension, anxiety, depression, cirrhosis, diabetes, and congestive heart failure.
Process, Outcomes, and Balancing Measures
The study process measures included the percentage of patients hospitalized for alcohol detoxification or withdrawal with documentation of counseling about naltrexone by the time of discharge, before and after process intervention. Documentation was defined as the description of counseling about naltrexone in the discharge summary or progress notes of identified encounters. We also measured the percentage of patients started on naltrexone before and after intervention. Lastly, we measured the percentage of patients prescribed naltrexone who filled at least 1 prescription for the medication, assessed by calls to the pharmacy where the medication was prescribed. Prescriptions that could not be confirmed (ie, paper rather than electronic prescriptions) were counted as not filled.
For outcome measures, we recorded the percentages of study patients who returned to the emergency department (ED) and were readmitted to UNC Hospitals (inpatient or observation) for any reason within 30 days of discharge. These outcomes were determined by a manual chart review.
In order to ensure the new process was not associated with delays in patient discharge, we measured the mean length of stay in days for study patient encounters before and after intervention as a balancing measure.
Statistical Analysis
Demographic and clinical characteristics for included patients were compared for the 16 months preimplementation (April 1, 2014 through July 31, 2015) and the 19 months postimplementation (August 1, 2015 through February 28, 2017). Descriptive statistics were calculated by using the Student t test for continuous variables and the χ2 test for dichotomous variables. We used multivariate logistic regression to evaluate the associations between the intervention arms (pre- vs postintervention) and study outcomes, adjusting for age, gender, race, insurance type, and medical comorbidities. We chose these variables for inclusion based on their association with study outcomes at the P ≤ .20 level in bivariate analyses. P < .05 was considered statistically significant. All analyses were performed by using Stata version 13.1 (StataCorp LLC, College Station, TX).
For 2 process measures, the percentages of patients counseled about and started on naltrexone, we plotted consecutive samples of 10 patients before and after intervention on a control chart, using preintervention data to calculate means and control limits.
Subgroup Analysis
We used multivariate logistic regression to evaluate the associations between counseling versus no counseling and prescription of naltrexone versus no prescription for study outcomes in the postintervention subgroup, adjusting for age, gender, race, insurance type, and medical comorbidities.
RESULTS
Patients
We identified 188 preimplementation encounters and excluded 12 patients (6.4%) for primary admission reasons other than alcohol withdrawal or detoxification and 48 (25.5%) repeat hospitalizations, leaving 128 unique patient encounters. We identified 166 postimplementation encounters and excluded 25 (15.1%) hospitalizations for admission reason and 27 repeat hospitalizations (16.3%), leaving 114 unique patient encounters (flow diagram in supplemental Appendix 3). The most common admission reason for the exclusion of encounters was withdrawal from a substance other than alcohol (supplemental Appendix 4). The percentages of encounters excluded in preimplementation and postimplementation periods were similar at 31.9% and 31.4%, respectively.
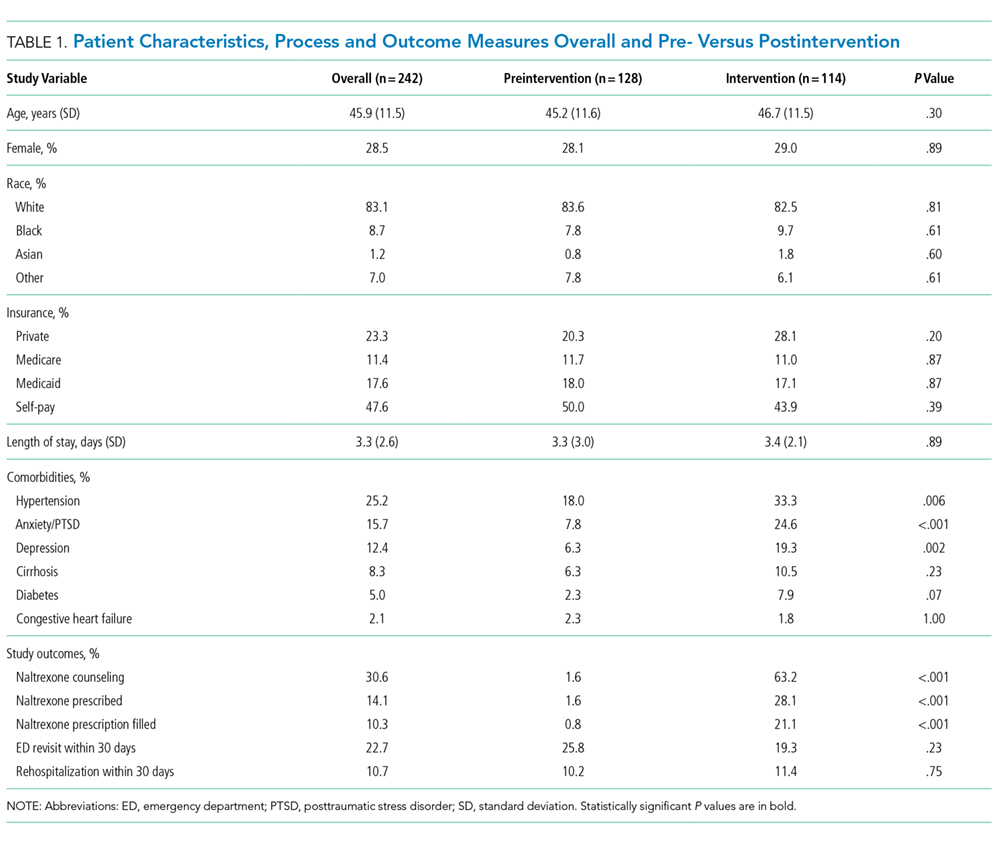
The majority of patients were male and white, and almost half were uninsured (Table 1). There were no demographic differences between patients in the pre- versus postimplementation groups. For studied comorbidities, postintervention patients were more likely to have hypertension, anxiety, and depression.
Process Measures
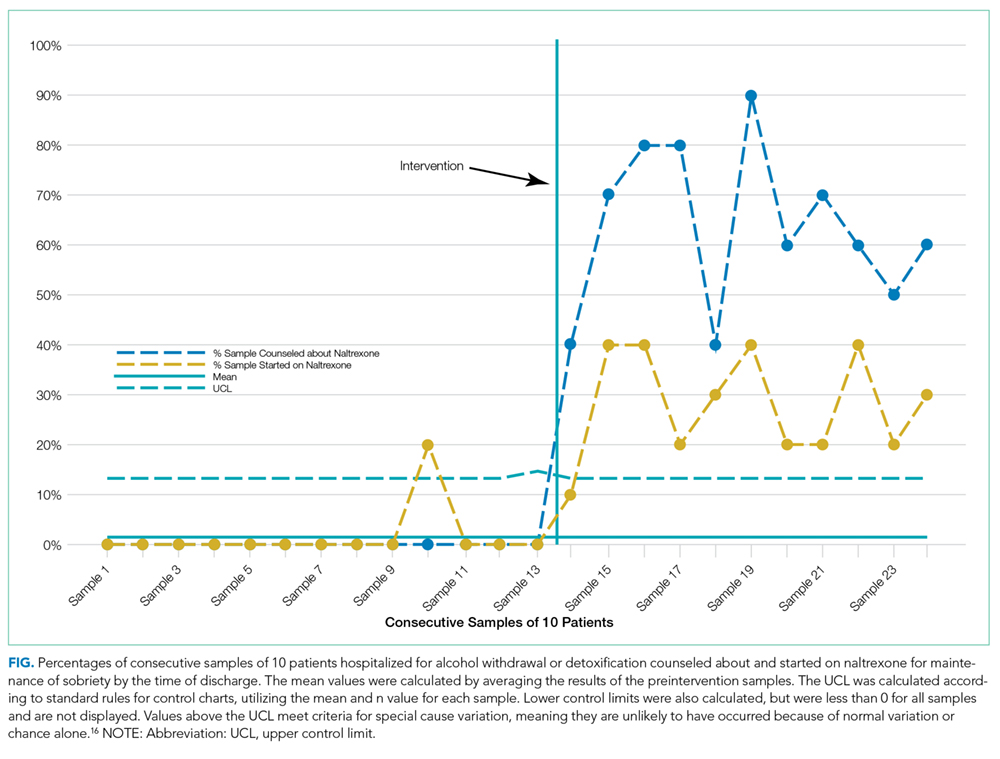
Among those counseled about naltrexone before discharge, 34 of 74 patients (45.9%) had no contraindications to naltrexone and were interested in taking the medication. Among the 40 patients who were counseled about but not prescribed naltrexone, 19 (47.5%) declined, 9 (22.5%) had liver function tests elevated more than 3 times the upper limit of the reference range, 9 (22.5%) had concurrent opiate use, and 3 (7.5%) had multiple contraindications.
Among the 34 patients who were prescribed naltrexone, 25 (73.5%) filled at least 1 prescription as confirmed by phone call to the relevant pharmacy.
Outcome Measures
Subgroup Analysis
Balancing Measure
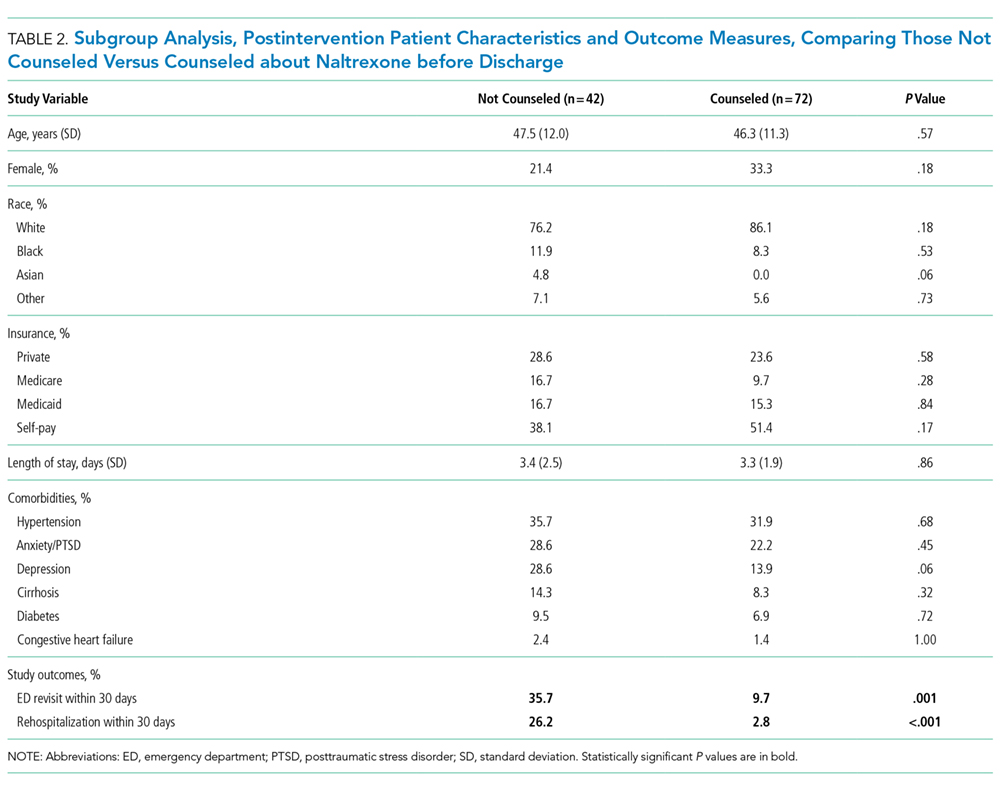
The mean length of stay for all patient encounters was 3.3 days. There were no differences in length of stay comparing pre- with postintervention patient encounters (Table 1) or those postintervention patients counseled versus not counseled (Table 2).
DISCUSSION
Our study demonstrates that counseling about medications for the maintenance of sobriety can be implemented as part of the routine care of hospitalized patients with AUDs. In our experience, about half of the patients counseled had no contraindications to naltrexone and were willing to take it at discharge. Almost three-fourths of those who were prescribed naltrexone filled the prescription at least once. The counseling process was not associated with increased length of stay. In the adjusted analysis, postintervention patients had significantly lower odds of 30-day ED returns. Additionally, in subgroup analysis, postintervention patients counseled about naltrexone had significantly lower rates of subsequent healthcare utilization compared with those not counseled, with absolute differences of 26% for ED revisits and 22% for rehospitalizations within 30 days.
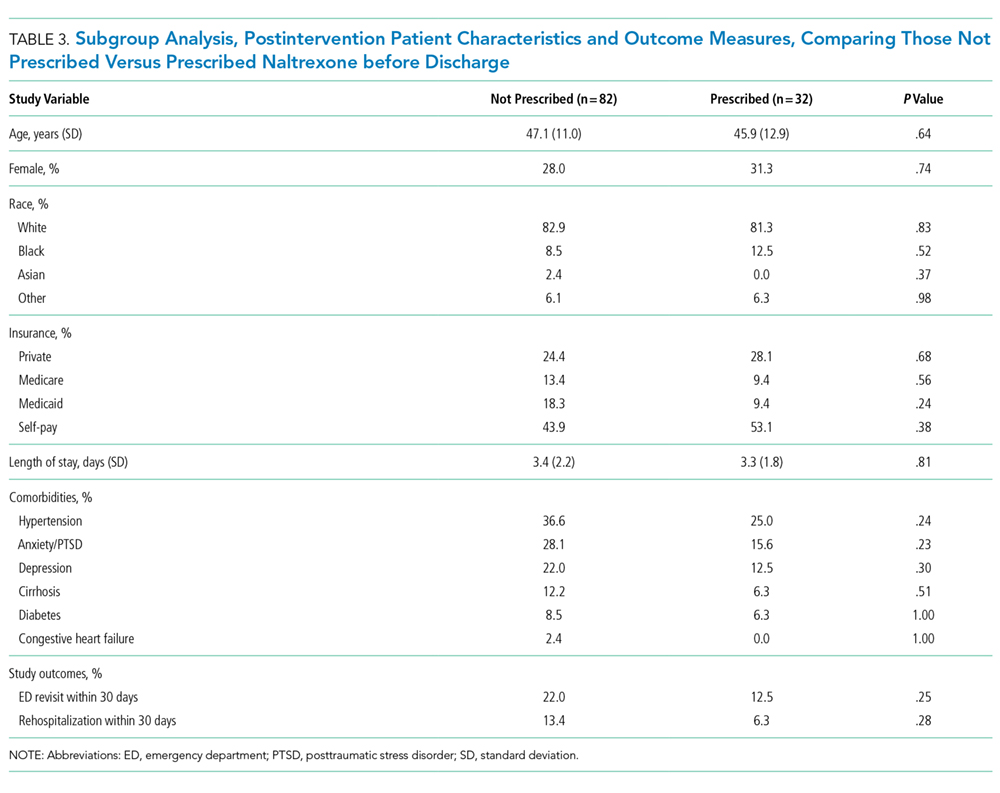
The failure to demonstrate a difference in adjusted rehospitalization rates in the postintervention versus the preintervention group has several possible explanations. First, we had incomplete fidelity to our interventions, documenting counseling about naltrexone before discharge in over 60% of postintervention patients, raising the possibility that better fidelity may have resulted in improved outcomes. Related to this, only 28% of postintervention patients were prescribed naltrexone, which may be an inadequate sample size to demonstrate positive effects from the medication. Another possible explanation is that the postintervention group had higher rates of some of the comorbidities we assessed, namely, anxiety, depression, and hypertension, which could have negatively impacted the effectiveness of the interventions to prevent rehospitalization; however, after adjusting for comorbidities, the odds of rehospitalization were still not significantly different. It is interesting that the odds of postintervention ED revisits (but not rehospitalizations) were lower in the adjusted analysis. It may be that patients who revisit the ED and are not rehospitalized are different in important ways from those who are readmitted. Alternately, the larger number of ED revisits overall (about twice the rate of rehospitalization) may have made it easier to identify positive effects from the intervention for this outcome than rehospitalization (ie, the study may have been underpowered to detect a relatively small reduction in rehospitalization). It is also possible, however, that the interventions were simply insufficient to prevent rehospitalization.
The subgroup analysis, however, did find significant differences in both outcome measures for postintervention patients counseled versus not counseled about naltrexone before discharge. There are several possible explanations for these results. First, there may have been unmeasured differences in those counseled versus not counseled that explain the reductions observed in subsequent healthcare utilization. For example, the counseled patients could have been more motivated to change and, thus, more readily approached by providers for counseling. The lack of any demographic differences between the 2 groups and the relative simplicity of the counseling part of the intervention occurring as part of daily rounds argue against this hypothesis, but there are many potential unmeasured confounders (eg, homelessness, ability to afford medications), and this possibility remains. A second possible explanation is that patients counseled about naltrexone could have been more likely than those not counseled to seek subsequent care at other institutions. A third possibility is that that the counseling about (and prescribing when appropriate) naltrexone itself led to the observed decreases in subsequent ED visits and hospitalizations. This hypothesis would have been more supported had we been able to demonstrate a statistically significant reduction in healthcare utilization in those prescribed versus not prescribed naltrexone. But there were nonsignificant trends in the reduction of ED revisits and rehospitalizations among those prescribed the medication, suggesting we may have been able to demonstrate statistically significant reductions with a larger sample size.
Comparing our results with existing literature is challenging. The majority of randomized trials of naltrexone for AUDs were conducted in the outpatient setting.3-10 Most of these trials utilized some type of psychosocial intervention in addition to naltrexone.3-5,8-10 The 1 prior naltrexone study we identified conducted in the inpatient setting by Wei et al.14 is the most similar to our study. The authors reported the effects of a new process for assessing hospitalized patients with AUDs, including the use of a discharge planning tool for all patients admitted with alcohol dependence. The discharge tool included prompts for naltrexone in appropriate patients. The measured outcomes included the percentage of eligible patients prescribed naltrexone at discharge and the percentages of ED revisits and rehospitalizations within 30 days. Postintervention, 64% of eligible patients were prescribed naltrexone compared with 0% before, very similar to our results. There were significant decreases among all discharged patients with alcohol dependence for 30-day ED revisits (18.8% pre- vs 6.1% postimplementation) and rehospitalizations (23.4% vs 8.2%). The study differed from ours in a number of important respects, including a location in a large urban setting and implementation on a teaching service rather than an attending-only hospitalist service. Additionally, the authors studied 1 month of process implementation and compared it to another month 1 year before the new process, with an overall smaller sample size of 64 patients before and 49 patients after implementation. Potential reasons why Wei et al.14 were able to document lower rehospitalization rates postintervention when we did not include the differences in patient population (eg, high homeless rate, lower percentage of female patients in Wei study) and secular trends unrelated to interventions in either study.
Limitations of our study include the nonrandomized and uncontrolled design, which introduces the possibility of unmeasured confounding factors leading to the decrease we observed in healthcare utilization. Additionally, the single-center design precludes our ability to assess for healthcare utilization outcomes in other nearby facilities. We had incomplete implementation of our new process, counseling just over 60% of patients. As our primary outcomes relied on documentation in the medical record, both undersampling (not documenting some interventions) and reporting bias (being more likely to record positive sessions from intervention) are possible. Lastly, despite a moderate total sample size of almost 250 patients, the relatively small numbers of patients who were actually prescribed naltrexone in our study lessens our ability to show direct impact.
In conclusion, our study demonstrates a practical process for counseling about and prescribing naltrexone to patients hospitalized for alcohol detoxification or withdrawal. We demonstrate that many of these patients will be interested in starting naltrexone at discharge and will reliably fill the prescriptions if written. Counseling was associated with a significant reduction in subsequent healthcare utilization. These results have a wide potential impact given the ubiquitous nature of AUDs among hospitalized patients in community and academic settings.
Disclosure
The authors have no conflicts of interest relevant to this article to disclose. There were no sources of funding for this work.
1. Hasin DS, Stinson FS, Ogburn E, Grant BF. Prevalence, correlates, disability, and comorbidity of DSM-IV alcohol abuse and dependence in the United States: results from the National Epidemiologic Survey on Alcohol and Related Conditions. Arch Gen Psychiatry. 2007;64(7):830-842. PubMed
2. Bouchery EE, Harwood HJ, Sacks JJ, Simon CJ, Brewer RD. Economic costs of excessive alcohol consumption in the U.S., 2006. Am J Prev Med. 2011;41(5):516-524. PubMed
3. Anton RF, Moak DH, Waid LR, Latham PK, Malcolm RJ, Dias JK. Naltrexone and cognitive behavioral therapy for the treatment of outpatient alcoholics: results of a placebo-controlled trial. Am J Psychiatry. 1999;156(11):1758-1764. PubMed
4. Anton RF, Moak DH, Latham P, et al. Naltrexone combined with either cognitive behavioral or motivational enhancement therapy for alcohol dependence. J Clin Psychopharmacol. 2005;25(4):349-357. PubMed
5. Guardia J, Caso C, Arias F, et al. A double-blind, placebo-controlled study of naltrexone in the treatment of alcohol-dependence disorder: results from a multicenter clinical trial. Alcohol Clin Exp Res. 2002;26(9):1381-1387. PubMed
6. Kiefer F, Jahn H, Tarnaske T, et al. Comparing and combining naltrexone and acamprosate in relapse prevention of alcoholism: a double-blind, placebo-controlled study. Arch Gen Psychiatry. 2003;60(1):92-99. PubMed
7. Latt NC, Jurd S, Houseman J, Wutzke SE. Naltrexone in alcohol dependence: a randomised controlled trial of effectiveness in a standard clinical setting. Med J Aust. 2002;176(11):530-534. PubMed
8. Morris PL, Hopwood M, Whelan G, Gardiner J, Drummond E. Naltrexone for alcohol dependence: a randomized controlled trial. Addiction. 2001;96(11):1565-1573. PubMed
9. O’Malley SS, Jaffe AJ, Chang G, Schottenfeld RS, Meyer RE, Rounsaville B. Naltrexone and coping skills therapy for alcohol dependence. A controlled study. Arch Gen Psychiatry. 1992;49(11):881-887. PubMed
10. O’Malley SS, Robin RW, Levenson AL, et al. Naltrexone alone and with sertraline for the treatment of alcohol dependence in Alaska natives and non-natives residing in rural settings: a randomized controlled trial. Alcohol Clin Exp Res. 2008;32(7):1271-1283. PubMed
11. Jonas DE, Amick HR, Feltner C, et al. Pharmacotherapy for adults with alcohol use disorders in outpatient settings: a systematic review and meta-analysis. JAMA 2014;311(18):1889-1900. PubMed
12. Petrakis IL, Leslie D, Rosenheck R. Use of naltrexone in the treatment of alcoholism nationally in the Department of Veterans Affairs. Alcohol Clin Exp Res. 2003;27(11):1780-1784. PubMed
13. Mark TL, Kranzler HR, Song X. Understanding US addiction physicians’ low rate of naltrexone prescription. Drug Alcohol Depend. 2003;71(3):219-228. PubMed
14. Wei J, Defries T, Lozada M, Young N, Huen W, Tulsky J. An inpatient treatment and discharge planning protocol for alcohol dependence: efficacy in reducing 30-day readmissions and emergency department visits. J Gen Intern Med. 2015;30(3):365-370. PubMed
15. Stephens JR, Liles EA, Dancel R, Gilchrist M, Kirsch J, DeWalt DA. Who needs inpatient detox? Development and implementation of a hospitalist protocol for the evaluation of patients for alcohol detoxification. J Gen Intern Med. 2014;29(4):587-593. PubMed
16. Provost LP, Murray SK. The Health Care Data Guide: Learning from Data for Improvement. San Francisco: Jossey-Bass; 2011.
Alcohol use disorders (AUDs) are common, with an estimated lifetime prevalence of 17.8% for alcohol dependence.1 Alcohol misuse is costly, accounting for $24.6 billion in annual healthcare expenditures, including $5.1 billion for alcohol-related hospitalizations.2 A number of trials have demonstrated that naltrexone can help patients with AUDs maintain abstinence or diminish heavy drinking.3-10 A recent meta-analysis of pharmacotherapy trials for patients with AUDs reported that for patients using 50 mg of naltrexone daily, the number needed to treat was 12 to prevent a return to heavy drinking and 20 to prevent a return to any drinking.11 Despite good evidence for its effectiveness, naltrexone is not prescribed to the majority of patients with AUDs. In a study of veterans with AUDs cared for in the Veterans Affairs health system, only 1.9% of patients were prescribed naltrexone over the 6-month study period.12 A 2003 survey of 2 professional organizations for addiction treatment specialists reported that a mean of 13% of providers prescribed naltrexone to their patients.13
When naltrexone is prescribed, it is most frequently in the outpatient setting.3-10 Data for initiation of naltrexone in the inpatient setting are more limited. Wei et al.14 reported on the implementation of a discharge protocol, including counseling about naltrexone, for hospitalized patients with AUDs at an urban academic medical center. They reported a significant increase in the prescription of naltrexone to eligible patients by the time of discharge that was associated with a significant decrease in 30-day readmissions. Initiation of naltrexone in the inpatient versus the outpatient setting has some potential advantages. First, patients hospitalized for alcohol withdrawal have AUDs, obviating the need for screening. Second, the outpatient trials of naltrexone typically required 3 days of sobriety before initiation, which is generally achieved during hospitalization for detoxification or withdrawal.
Previous work at our institution centered on standardizing the process of evaluating patients needing alcohol detoxification at the time of referral for admission.15 The use of a standardized protocol reduced the number of inpatient admissions for alcohol-related diagnoses but had no effect on the 30-day readmission rate (28%) for those patients who were hospitalized. Our hospitalist group had no standardized process for discharging hospitalized patients with AUDs, and the discharge process rarely included counseling on medications for maintenance of sobriety. In this manuscript, we describe the implementation and impact of a process for counseling patients hospitalized for alcohol detoxification or withdrawal about naltrexone for maintenance of sobriety by the time of hospital discharge.
METHODS
Study Setting
The University of North Carolina (UNC) Hospitals is an 803-bed tertiary academic center. UNC Hospital Medicine is staffed by 29 physicians and 3 advanced practice providers (APPs). During the study period, there were 3 hospital medicine services at UNC Hospitals with a combined average daily census of approximately 40 patients, and each service was staffed by one attending physician every day of the week and one APP Monday through Friday.
Study Design
We used a pre-post study design, in which we implemented a new process for standardizing the discharge of hospitalized patients with AUDs, including a process for counseling about naltrexone by the time of discharge. We sought and received institutional review board (IRB) approval for this study (UNC IRB 15-1441).
Interventions
We formed an improvement team that included 3 physicians and an APP in hospital medicine, a general internist and a psychiatrist, both with expertise in the use of medications for maintenance of sobriety, the director of UNC’s Alcohol and Substance Abuse Program, and 2 case managers. The team developed a number of interventions, including group education, a process for patient identification, and algorithms for counseling about, prescribing, and documenting the discussion of naltrexone.
Group Education
We presented evidence about medications for the maintenance of sobriety at a regularly scheduled hospitalist meeting. An hour-long session on motivational interviewing techniques was also presented at a separate meeting. All created algorithms were circulated to the group electronically and posted at workstations in the hospitalist work area. As data were generated postimplementation, control charts of process measures were created, posted in the hospitalist work area, and presented at subsequent group meetings.
Identification of Patients
We focused our interventions on patients admitted for alcohol detoxification or withdrawal (including withdrawal seizures). We asked our group to preferentially admit these patients to 1 of our 3 hospitalists services, on which the service APP (K.S.) was also an improvement team member.
Creation of Algorithms and Scripts for Counseling
We created a simple algorithm for evaluating patients for naltrexone. We recommended that all patients admitted for alcohol detoxification or withdrawal be counseled about naltrexone for the maintenance of sobriety before discharge. The contraindications to naltrexone we included were (1) concurrent opioid use, (2) documented cirrhosis, and/or (3) liver function tests greater than 3 times the upper limit of normal by the time of hospital discharge.
We also created a suggested script for motivational interviewing (supplemental Appendix 1). This was presented at a group meeting and circulated via e-mail. The actual counseling technique and process was left up to individual providers. In practice, counseling took place in the course of daily rounds, generally the day before or day of hospital discharge.
Prescription of Medication
For interested patients without contraindications, we recommended a prescription of naltrexone at 50 mg daily for 3 months. For patients prescribed naltrexone without medical insurance (n = 17), we utilized our existing pharmacy assistance program, whereby discharging patients can obtain an initial 14-day supply after applying to the program and then can fill subsequent prescriptions if they meet program financial requirements.
Follow-up Appointments
For patients with established outpatient providers, we asked patients to schedule follow-up appointments within a month of discharge. Patients prescribed naltrexone without primary providers (n = 16) were eligible for an existing program, the UNC Transitions Program, whereby patients identified as having moderate-to-high risk of hospital readmission can receive a follow-up appointment at UNC Internal Medicine or UNC Family Medicine within 2 weeks of discharge.
Creation of “Smart Phrases”
To aid in documentation, we created “smart phrases” (easily accessed, previously created phrases that can be adopted by all users) within the hospital electronic health record. We created one smart phrase for documentation of counseling about naltrexone, which included dropdown menus for contraindications and the patient’s preference and one for discharge instructions for patients started on naltrexone (supplemental Appendix 2).
Implementation
After the presentation of suggested interventions in July 2015 and the subsequent dissemination of educational materials, we implemented our new process on August 1, 2015.
Data Collection
Patients were identified for inclusion in the study analysis by querying UNC Hospitals’ billing database for the inpatient diagnosis codes (diagnosis-related groupings) 896 and 897, “alcohol/drug abuse or dependence without rehabilitation therapy,” with and without major comorbidity or complication, respectively, and with hospital medicine as the discharging service. All encounters were then manually reviewed by 2 investigators (J.S. and C.M.). Encounters were included if the history and physical indicated that the primary reason for admission was alcohol detoxification or withdrawal. Encounters with other primary reasons for admission (eg, pancreatitis, gastrointestinal bleeding) were excluded. For patients with multiple encounters, only the first eligible encounter in the pre- and/or postimplementation period was included. Comorbidities for identified patients were assessed via the search of study encounters for the International Classification of Diseases, 9th Revision-Clinical Modification codes for hypertension, anxiety, depression, cirrhosis, diabetes, and congestive heart failure.
Process, Outcomes, and Balancing Measures
The study process measures included the percentage of patients hospitalized for alcohol detoxification or withdrawal with documentation of counseling about naltrexone by the time of discharge, before and after process intervention. Documentation was defined as the description of counseling about naltrexone in the discharge summary or progress notes of identified encounters. We also measured the percentage of patients started on naltrexone before and after intervention. Lastly, we measured the percentage of patients prescribed naltrexone who filled at least 1 prescription for the medication, assessed by calls to the pharmacy where the medication was prescribed. Prescriptions that could not be confirmed (ie, paper rather than electronic prescriptions) were counted as not filled.
For outcome measures, we recorded the percentages of study patients who returned to the emergency department (ED) and were readmitted to UNC Hospitals (inpatient or observation) for any reason within 30 days of discharge. These outcomes were determined by a manual chart review.
In order to ensure the new process was not associated with delays in patient discharge, we measured the mean length of stay in days for study patient encounters before and after intervention as a balancing measure.
Statistical Analysis
Demographic and clinical characteristics for included patients were compared for the 16 months preimplementation (April 1, 2014 through July 31, 2015) and the 19 months postimplementation (August 1, 2015 through February 28, 2017). Descriptive statistics were calculated by using the Student t test for continuous variables and the χ2 test for dichotomous variables. We used multivariate logistic regression to evaluate the associations between the intervention arms (pre- vs postintervention) and study outcomes, adjusting for age, gender, race, insurance type, and medical comorbidities. We chose these variables for inclusion based on their association with study outcomes at the P ≤ .20 level in bivariate analyses. P < .05 was considered statistically significant. All analyses were performed by using Stata version 13.1 (StataCorp LLC, College Station, TX).
For 2 process measures, the percentages of patients counseled about and started on naltrexone, we plotted consecutive samples of 10 patients before and after intervention on a control chart, using preintervention data to calculate means and control limits.
Subgroup Analysis
We used multivariate logistic regression to evaluate the associations between counseling versus no counseling and prescription of naltrexone versus no prescription for study outcomes in the postintervention subgroup, adjusting for age, gender, race, insurance type, and medical comorbidities.
RESULTS
Patients
We identified 188 preimplementation encounters and excluded 12 patients (6.4%) for primary admission reasons other than alcohol withdrawal or detoxification and 48 (25.5%) repeat hospitalizations, leaving 128 unique patient encounters. We identified 166 postimplementation encounters and excluded 25 (15.1%) hospitalizations for admission reason and 27 repeat hospitalizations (16.3%), leaving 114 unique patient encounters (flow diagram in supplemental Appendix 3). The most common admission reason for the exclusion of encounters was withdrawal from a substance other than alcohol (supplemental Appendix 4). The percentages of encounters excluded in preimplementation and postimplementation periods were similar at 31.9% and 31.4%, respectively.
The majority of patients were male and white, and almost half were uninsured (Table 1). There were no demographic differences between patients in the pre- versus postimplementation groups. For studied comorbidities, postintervention patients were more likely to have hypertension, anxiety, and depression.
Process Measures
Among those counseled about naltrexone before discharge, 34 of 74 patients (45.9%) had no contraindications to naltrexone and were interested in taking the medication. Among the 40 patients who were counseled about but not prescribed naltrexone, 19 (47.5%) declined, 9 (22.5%) had liver function tests elevated more than 3 times the upper limit of the reference range, 9 (22.5%) had concurrent opiate use, and 3 (7.5%) had multiple contraindications.
Among the 34 patients who were prescribed naltrexone, 25 (73.5%) filled at least 1 prescription as confirmed by phone call to the relevant pharmacy.
Outcome Measures
Subgroup Analysis
Balancing Measure
The mean length of stay for all patient encounters was 3.3 days. There were no differences in length of stay comparing pre- with postintervention patient encounters (Table 1) or those postintervention patients counseled versus not counseled (Table 2).
DISCUSSION
Our study demonstrates that counseling about medications for the maintenance of sobriety can be implemented as part of the routine care of hospitalized patients with AUDs. In our experience, about half of the patients counseled had no contraindications to naltrexone and were willing to take it at discharge. Almost three-fourths of those who were prescribed naltrexone filled the prescription at least once. The counseling process was not associated with increased length of stay. In the adjusted analysis, postintervention patients had significantly lower odds of 30-day ED returns. Additionally, in subgroup analysis, postintervention patients counseled about naltrexone had significantly lower rates of subsequent healthcare utilization compared with those not counseled, with absolute differences of 26% for ED revisits and 22% for rehospitalizations within 30 days.
The failure to demonstrate a difference in adjusted rehospitalization rates in the postintervention versus the preintervention group has several possible explanations. First, we had incomplete fidelity to our interventions, documenting counseling about naltrexone before discharge in over 60% of postintervention patients, raising the possibility that better fidelity may have resulted in improved outcomes. Related to this, only 28% of postintervention patients were prescribed naltrexone, which may be an inadequate sample size to demonstrate positive effects from the medication. Another possible explanation is that the postintervention group had higher rates of some of the comorbidities we assessed, namely, anxiety, depression, and hypertension, which could have negatively impacted the effectiveness of the interventions to prevent rehospitalization; however, after adjusting for comorbidities, the odds of rehospitalization were still not significantly different. It is interesting that the odds of postintervention ED revisits (but not rehospitalizations) were lower in the adjusted analysis. It may be that patients who revisit the ED and are not rehospitalized are different in important ways from those who are readmitted. Alternately, the larger number of ED revisits overall (about twice the rate of rehospitalization) may have made it easier to identify positive effects from the intervention for this outcome than rehospitalization (ie, the study may have been underpowered to detect a relatively small reduction in rehospitalization). It is also possible, however, that the interventions were simply insufficient to prevent rehospitalization.
The subgroup analysis, however, did find significant differences in both outcome measures for postintervention patients counseled versus not counseled about naltrexone before discharge. There are several possible explanations for these results. First, there may have been unmeasured differences in those counseled versus not counseled that explain the reductions observed in subsequent healthcare utilization. For example, the counseled patients could have been more motivated to change and, thus, more readily approached by providers for counseling. The lack of any demographic differences between the 2 groups and the relative simplicity of the counseling part of the intervention occurring as part of daily rounds argue against this hypothesis, but there are many potential unmeasured confounders (eg, homelessness, ability to afford medications), and this possibility remains. A second possible explanation is that patients counseled about naltrexone could have been more likely than those not counseled to seek subsequent care at other institutions. A third possibility is that that the counseling about (and prescribing when appropriate) naltrexone itself led to the observed decreases in subsequent ED visits and hospitalizations. This hypothesis would have been more supported had we been able to demonstrate a statistically significant reduction in healthcare utilization in those prescribed versus not prescribed naltrexone. But there were nonsignificant trends in the reduction of ED revisits and rehospitalizations among those prescribed the medication, suggesting we may have been able to demonstrate statistically significant reductions with a larger sample size.
Comparing our results with existing literature is challenging. The majority of randomized trials of naltrexone for AUDs were conducted in the outpatient setting.3-10 Most of these trials utilized some type of psychosocial intervention in addition to naltrexone.3-5,8-10 The 1 prior naltrexone study we identified conducted in the inpatient setting by Wei et al.14 is the most similar to our study. The authors reported the effects of a new process for assessing hospitalized patients with AUDs, including the use of a discharge planning tool for all patients admitted with alcohol dependence. The discharge tool included prompts for naltrexone in appropriate patients. The measured outcomes included the percentage of eligible patients prescribed naltrexone at discharge and the percentages of ED revisits and rehospitalizations within 30 days. Postintervention, 64% of eligible patients were prescribed naltrexone compared with 0% before, very similar to our results. There were significant decreases among all discharged patients with alcohol dependence for 30-day ED revisits (18.8% pre- vs 6.1% postimplementation) and rehospitalizations (23.4% vs 8.2%). The study differed from ours in a number of important respects, including a location in a large urban setting and implementation on a teaching service rather than an attending-only hospitalist service. Additionally, the authors studied 1 month of process implementation and compared it to another month 1 year before the new process, with an overall smaller sample size of 64 patients before and 49 patients after implementation. Potential reasons why Wei et al.14 were able to document lower rehospitalization rates postintervention when we did not include the differences in patient population (eg, high homeless rate, lower percentage of female patients in Wei study) and secular trends unrelated to interventions in either study.
Limitations of our study include the nonrandomized and uncontrolled design, which introduces the possibility of unmeasured confounding factors leading to the decrease we observed in healthcare utilization. Additionally, the single-center design precludes our ability to assess for healthcare utilization outcomes in other nearby facilities. We had incomplete implementation of our new process, counseling just over 60% of patients. As our primary outcomes relied on documentation in the medical record, both undersampling (not documenting some interventions) and reporting bias (being more likely to record positive sessions from intervention) are possible. Lastly, despite a moderate total sample size of almost 250 patients, the relatively small numbers of patients who were actually prescribed naltrexone in our study lessens our ability to show direct impact.
In conclusion, our study demonstrates a practical process for counseling about and prescribing naltrexone to patients hospitalized for alcohol detoxification or withdrawal. We demonstrate that many of these patients will be interested in starting naltrexone at discharge and will reliably fill the prescriptions if written. Counseling was associated with a significant reduction in subsequent healthcare utilization. These results have a wide potential impact given the ubiquitous nature of AUDs among hospitalized patients in community and academic settings.
Disclosure
The authors have no conflicts of interest relevant to this article to disclose. There were no sources of funding for this work.
1. Hasin DS, Stinson FS, Ogburn E, Grant BF. Prevalence, correlates, disability, and comorbidity of DSM-IV alcohol abuse and dependence in the United States: results from the National Epidemiologic Survey on Alcohol and Related Conditions. Arch Gen Psychiatry. 2007;64(7):830-842. PubMed
2. Bouchery EE, Harwood HJ, Sacks JJ, Simon CJ, Brewer RD. Economic costs of excessive alcohol consumption in the U.S., 2006. Am J Prev Med. 2011;41(5):516-524. PubMed
3. Anton RF, Moak DH, Waid LR, Latham PK, Malcolm RJ, Dias JK. Naltrexone and cognitive behavioral therapy for the treatment of outpatient alcoholics: results of a placebo-controlled trial. Am J Psychiatry. 1999;156(11):1758-1764. PubMed
4. Anton RF, Moak DH, Latham P, et al. Naltrexone combined with either cognitive behavioral or motivational enhancement therapy for alcohol dependence. J Clin Psychopharmacol. 2005;25(4):349-357. PubMed
5. Guardia J, Caso C, Arias F, et al. A double-blind, placebo-controlled study of naltrexone in the treatment of alcohol-dependence disorder: results from a multicenter clinical trial. Alcohol Clin Exp Res. 2002;26(9):1381-1387. PubMed
6. Kiefer F, Jahn H, Tarnaske T, et al. Comparing and combining naltrexone and acamprosate in relapse prevention of alcoholism: a double-blind, placebo-controlled study. Arch Gen Psychiatry. 2003;60(1):92-99. PubMed
7. Latt NC, Jurd S, Houseman J, Wutzke SE. Naltrexone in alcohol dependence: a randomised controlled trial of effectiveness in a standard clinical setting. Med J Aust. 2002;176(11):530-534. PubMed
8. Morris PL, Hopwood M, Whelan G, Gardiner J, Drummond E. Naltrexone for alcohol dependence: a randomized controlled trial. Addiction. 2001;96(11):1565-1573. PubMed
9. O’Malley SS, Jaffe AJ, Chang G, Schottenfeld RS, Meyer RE, Rounsaville B. Naltrexone and coping skills therapy for alcohol dependence. A controlled study. Arch Gen Psychiatry. 1992;49(11):881-887. PubMed
10. O’Malley SS, Robin RW, Levenson AL, et al. Naltrexone alone and with sertraline for the treatment of alcohol dependence in Alaska natives and non-natives residing in rural settings: a randomized controlled trial. Alcohol Clin Exp Res. 2008;32(7):1271-1283. PubMed
11. Jonas DE, Amick HR, Feltner C, et al. Pharmacotherapy for adults with alcohol use disorders in outpatient settings: a systematic review and meta-analysis. JAMA 2014;311(18):1889-1900. PubMed
12. Petrakis IL, Leslie D, Rosenheck R. Use of naltrexone in the treatment of alcoholism nationally in the Department of Veterans Affairs. Alcohol Clin Exp Res. 2003;27(11):1780-1784. PubMed
13. Mark TL, Kranzler HR, Song X. Understanding US addiction physicians’ low rate of naltrexone prescription. Drug Alcohol Depend. 2003;71(3):219-228. PubMed
14. Wei J, Defries T, Lozada M, Young N, Huen W, Tulsky J. An inpatient treatment and discharge planning protocol for alcohol dependence: efficacy in reducing 30-day readmissions and emergency department visits. J Gen Intern Med. 2015;30(3):365-370. PubMed
15. Stephens JR, Liles EA, Dancel R, Gilchrist M, Kirsch J, DeWalt DA. Who needs inpatient detox? Development and implementation of a hospitalist protocol for the evaluation of patients for alcohol detoxification. J Gen Intern Med. 2014;29(4):587-593. PubMed
16. Provost LP, Murray SK. The Health Care Data Guide: Learning from Data for Improvement. San Francisco: Jossey-Bass; 2011.
© 2018 Society of Hospital Medicine
What Is Career Success for Academic Hospitalists? A Qualitative Analysis of Early-Career Faculty Perspectives
Academic hospital medicine is a young specialty, with most faculty at the rank of instructor or assistant professor.1 Traditional markers of academic success for clinical and translational investigators emphasize progressive, externally funded grants, achievements in basic science research, and prolific publication in the peer-reviewed literature.2 Promotion is often used as a proxy measure for academic success.
Conceptual models of career success derived from nonhealthcare industries and for physician-scientists include both extrinsic and intrinsic domains.3,4 Extrinsic domains of career success include financial rewards (compensation) and progression in hierarchical status (advancement).3,4 Intrinsic domains of career success include pleasure derived from daily work (job satisfaction) and satisfaction derived from aspects of the career over time (career satisfaction).3,4
Research is limited regarding hospitalist faculty beliefs about career success. A better understanding of hospitalist perspectives can inform program development to support junior faculty in academic hospital medicine. In this phenomenological, qualitative study, we explore the global concept of career success as perceived by early-career clinician-educator hospitalists.
METHODS
Study Design, Setting, and Participants
We conducted interviews with hospitalists from 3 academic medical centers between May 2016 and October 2016. Purposeful sampling was used.5 Leaders within each hospital medicine group identified early-career faculty with approximately 2 to 5 years in academic medicine with a rank of instructor or assistant professor at each institution likely to self-identify as clinician-educators for targeted solicitation to enroll. Additional subjects were recruited until thematic saturation had been achieved on the personal definition of career success. Participants received disclosure and consent documents prior to enrollment. No compensation was provided to participants. This study was approved by the Colorado Multiple Institutional Review Board.
Interview Guide Development and Content
The semistructured interview format was developed and validated through an iterative process. Proposed questions were developed by study investigators on the basis of review of the literature on career success in nonhealthcare industries and academic hospitalist promotion. The questions were assessed for content validity through a review of interview domains by an academic hospitalist program director (R. P.). Cognitive interviewing with 3 representative academic hospitalists who were not part of the study cohort was done as an additional face-validation step of the question probe structure. As a result of the cognitive interviews, 1 question was eliminated, and a framework for clarifications and answer probes was derived prior to the enrollment of the first study subject. No changes were made to the interview format during the study period.
Data Collection
The principal investigator (E.C.) performed all interviews by using the interview tool consisting of 7 demographic questions and 11 open-ended questions and exploring aspects of the concept of career success. The initial open-ended question, “How would you personally define career success as an academic hospitalist at this stage in your career?” represented the primary question of interest. Follow-up questions were used to better understand responses to the primary question. All interviews were audio recorded, deidentified, and transcribed by the principal investigator. Transcripts were randomly audited by a second investigator (E.Y.) for accuracy and completeness.
Sample Size Determination
Interviews were continued to thematic saturation. After the first 3 interviews were transcribed, 2 members of the research team (E.C. and P.K.) reviewed the transcripts and developed a preliminary thematic codebook for the primary question. Subsequent interviews were reviewed and analyzed against these themes. Interviews were continued to thematic saturation, which was defined as more than 3 sequential interviews with no new identified themes.6
Data Analysis
By using qualitative data analysis software (ATLAS.ti version 7; ATLAS.ti Scientific Software Development GmbH, Berlin, Germany), transcriptions were analyzed with a team-based, mixed inductive-deductive approach. An inductive approach was utilized to allow basic theme codes to emerge from the raw text, and thus remaining open to unanticipated themes. Investigators assessed each distinct quote for new themes, confirmatory themes, and challenges to previously developed concepts. Basic themes were then discussed among research team members to determine prominent themes, with basic theme codes added, removed, or combined at this stage of the analysis. Responses to each follow-up question were subsequently assessed for new themes, confirmatory themes, or challenges to previously developed concepts related to the personal definition of career success. A deductive approach was then used to map our inductively generated themes back to the organizing themes of the existing conceptual framework.
RESULTS
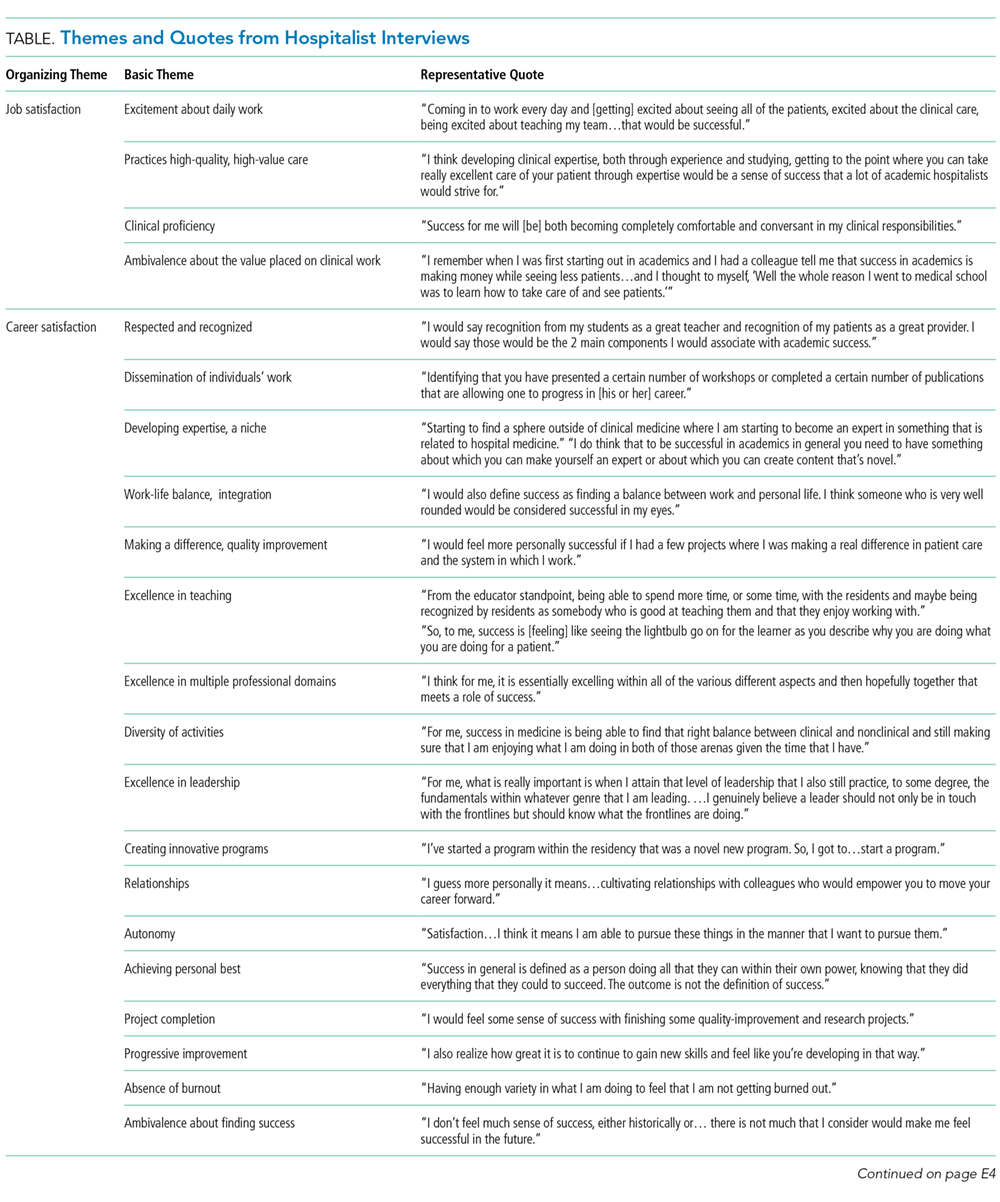
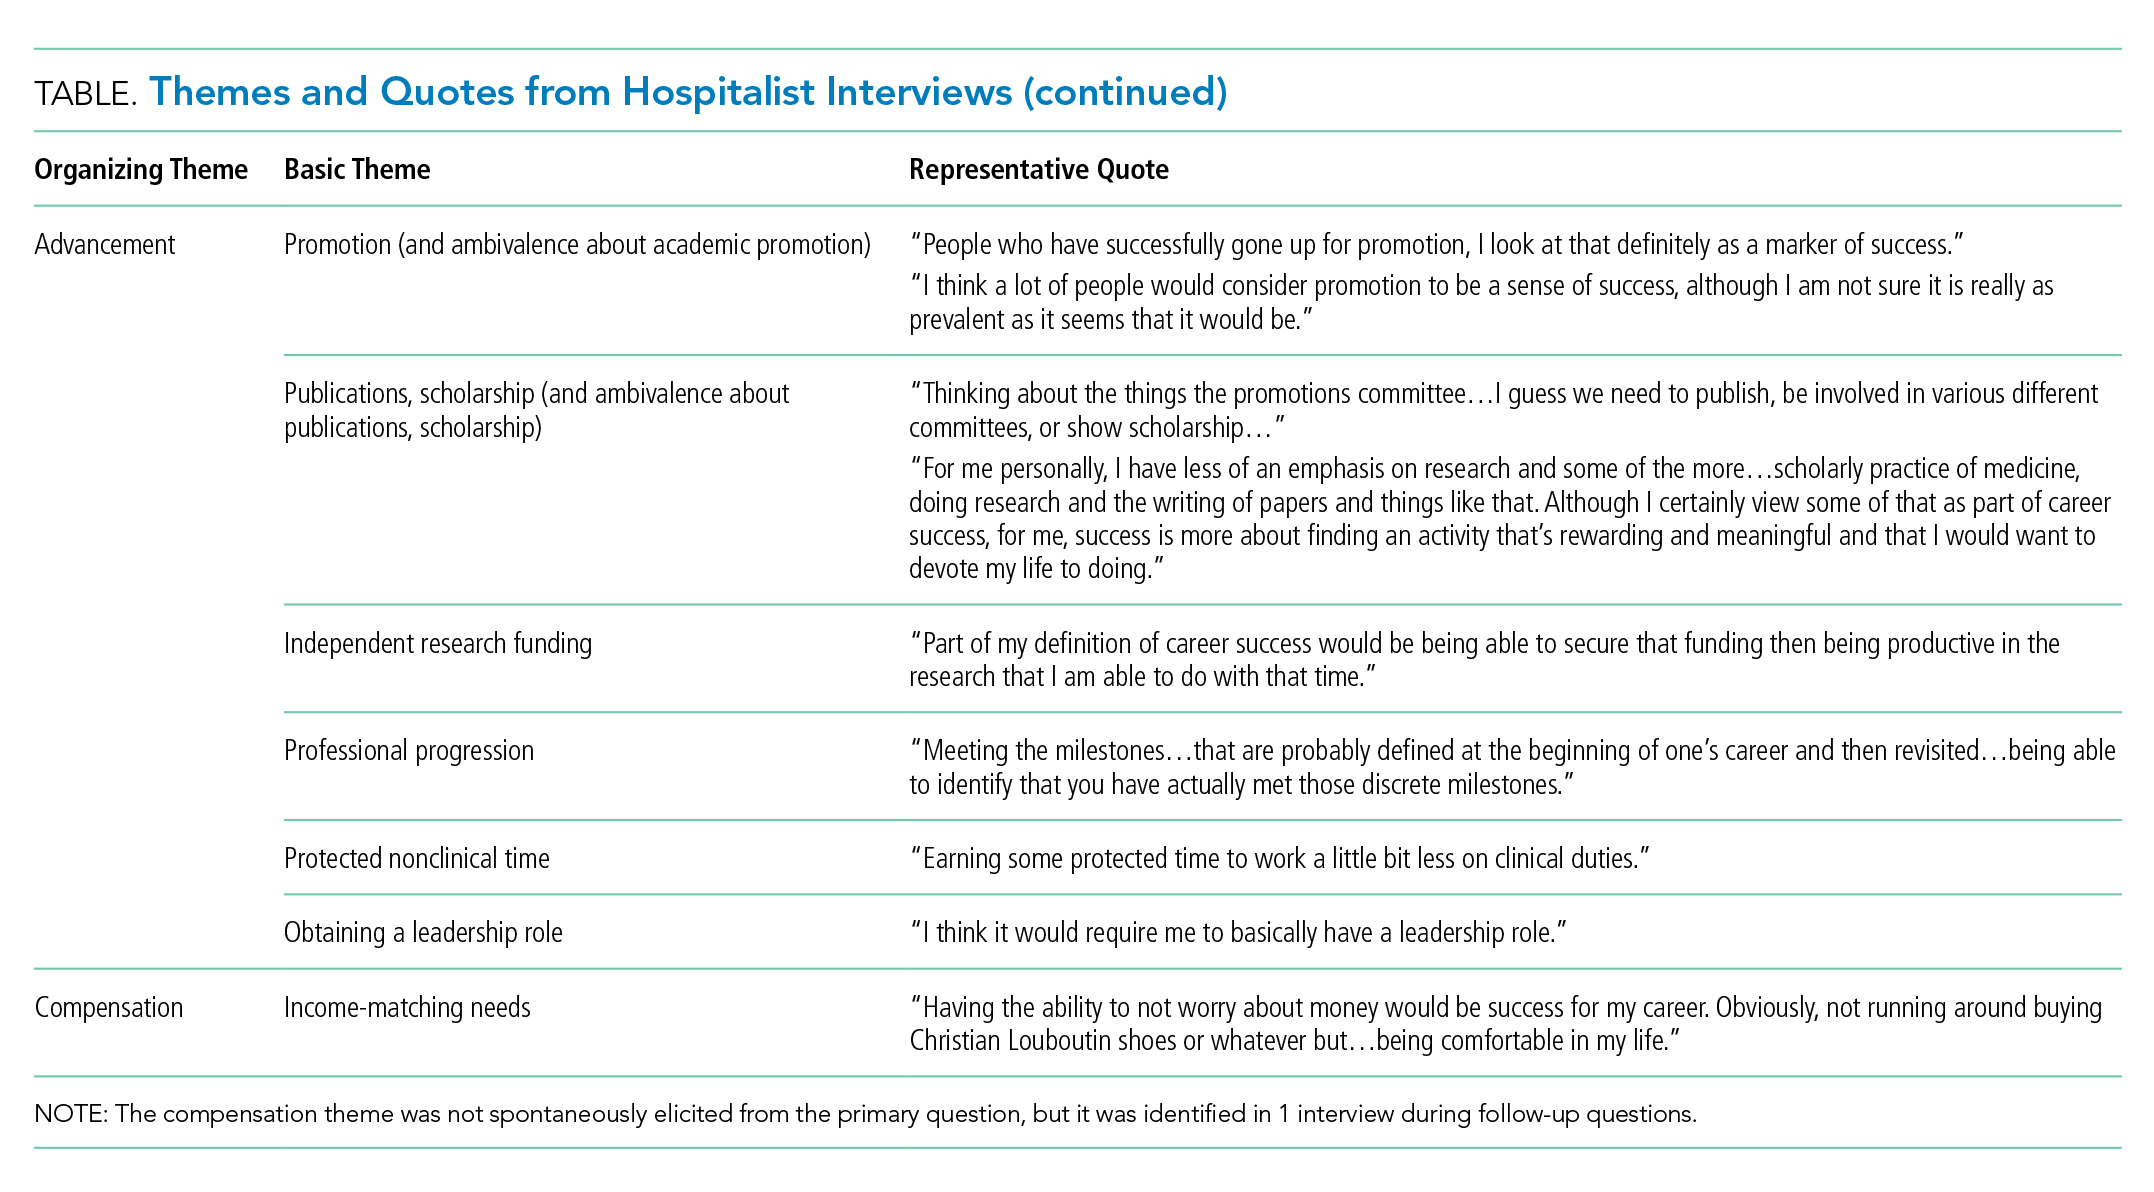
Thematic Mapping to Organizing Themes of the Conceptual Model (Table)
The single most dominant theme, “excitement about daily work” was connected to an intrinsic sense of job satisfaction. Career satisfaction emerged from interviews more frequently than extrinsic organizing themes, such as advancement or compensation. Advancement through promotion was infrequently referenced as part of success, and tenure was never raised despite being available for clinician-educators at 2 of the 3 institutions. Compensation was not referenced in any interviewee’s initial definition of career success, although in 1 interview, it came up in response to a follow-up question. The Figure visually represents the relative weighting (shown by the sizes of the boxes) of organizing themes to the early-career hospitalists’ self-concepts of career success. Relationships among organizing themes as they emerged from interviews are represented by arrows.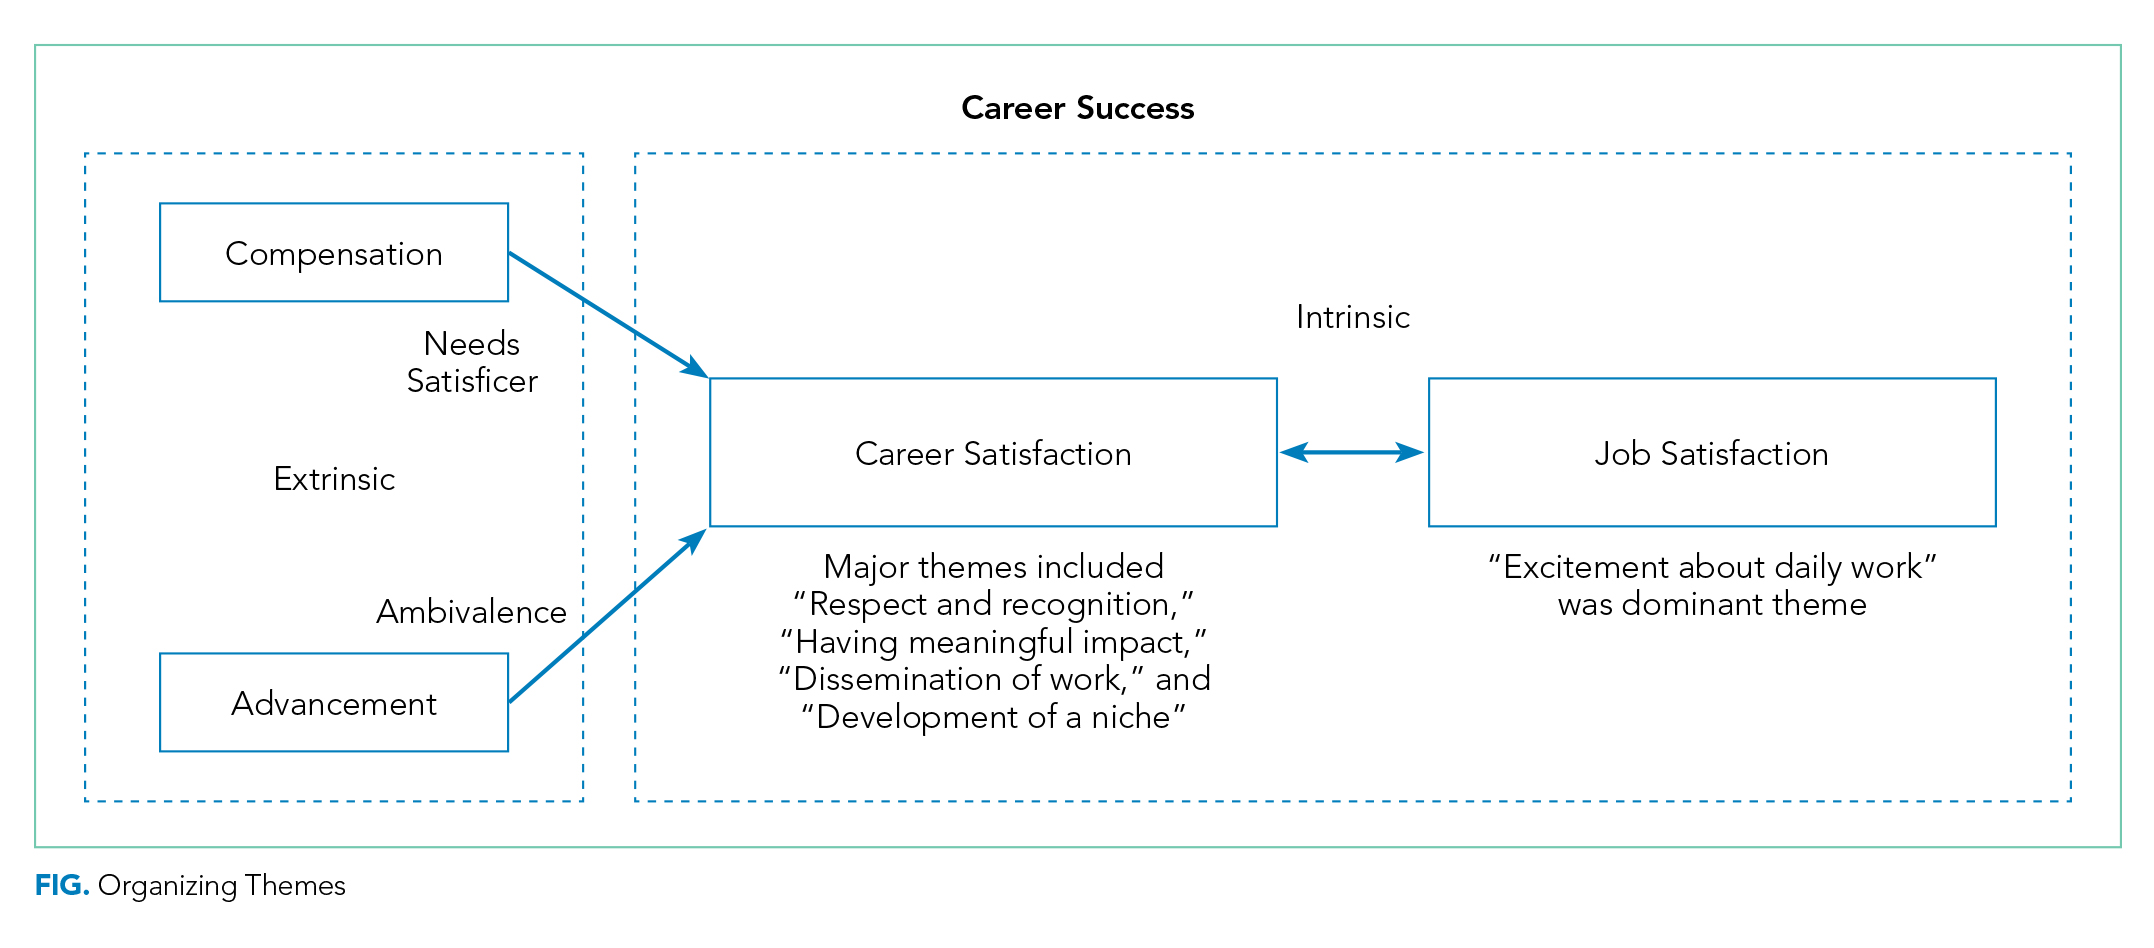
Intrinsic—Job Satisfaction
With regard to job satisfaction, early-career faculty often invoked words such as “excitement,” “enjoyment,” and “passionate” to describe an overall theme of “excitement about daily work.” A positive affective state created by the nature of daily work was described as integral to the personal sense of career success. It was also strongly associated with perception of sustainability in a hospitalist career.
“I think [career success] would be job satisfaction. …So, for me, that would be happiness with my job. I like coming to work. I like doing what I do and at the end of the day going home and saying that was a good day. I like to think that would be success at work…is how I would define it.”
This theme was also related to a negative aspect often referred to as burnout, which many identified as antithetical to career success. More often, they described success as a heightened state of enthusiasm for the daily work experience.
“I am staying engaged and excited. So, I am not just taking care of patients; I am not just teaching. Having enough excitement from my work to come home and talk about it at dinner. To enjoy my days off but at the same time being excited to get back to work.”
This description of passion toward the work of being a hospitalist was often linked to a sense of deeper purpose found through the delivery of clinical care and education of learners.
“I really feel that we have the opportunity to very meaningfully and powerfully impact people’s lives, and that to me is meaningful. …That’s value. ...That’s coming home at the end of the day and thinking that you have had a positive impact.”
The interviews reflected that core to meaningful work was a sense of personal efficacy as a clinician, which was reflected in the themes of clinical proficiency and practicing high-quality care.
“I think developing clinical expertise, both through experience and studying. Getting to the point to where you can take really excellent care of your patient through expertise would be a sense of success that a lot of academic hospitalists would strive for.”
Intrinsic—Career Satisfaction
Within career satisfaction, participants described that “being respected and recognized” and “dissemination of work” were important contributors to career success. Reputation was frequently referenced as a measure of career success. Reputation was defined by some in a local context of having the respect of learners, peers, and others as a national renown. As a prerequisite for developing a reputation beyond the local academic environment, dissemination of work was often referenced as an important component of satisfaction in the career. This dissemination extended beyond peer-reviewed publications and included other forms of scholarship, presentations at conferences, and sharing clinical innovations between hospitals.
“For me personally, I have less of an emphasis on research and some of the more, I don’t want to say ‘academic’ because I think education is academic, but maybe some of the more scholarly practice of medicine, doing research and the writing of papers and things like that, although I certainly view some of that as a part of career success.”
Within career satisfaction, participants also described a diverse set of themes, including progressive improvement in skills, developing a self-perception of excellence in 1 or more arenas of academic medicine, leadership, work–life integration, innovation, and relationships. The concept of developing a niche, or becoming an expert in a particular domain of hospital medicine, was frequently referenced.
“I think part of [success] is ‘Have they identified a niche?’ Because I think if you want to be in an academic center, as much as I value teaching and taking care of patients, I think 1 of the advantages is the opportunity to potentially identify an area of expertise.”
Participants frequently alluded to the idea that the most important aspects of career satisfaction are not static phenomena but rather values that could evolve over the course of a career. For instance, in the early-career, making a difference with individual learners or patients could have greater valence, but as the career progressed, finding a niche, disseminating work, and building a national reputation would gain importance to a personal sense of career satisfaction.
Extrinsic—Advancement
Promotion was typically referenced when discussing career success, but it was not uniformly valued by early career hospitalists. Some expressed significant ambivalence about its effect on their personal sense of career success. Academic hospitalists identified a number of organizations with definitions of success that influence them. Definitions of success for the university were more relevant to interviewees compared to those of the hospital or professional societies. Interviewees were able to describe a variety of criteria by which their universities define or recognize career success. These commonly included promotion, publications and/or scholarship, and research. The list of factors perceived as success by the hospital were often distinct from those of the university and included cost-effective care, patient safety, and clinical leadership roles.
Participants described a sense of internal conflict when external-stakeholder definitions of success diverged from internal motivators. This was particularly true when this divergence led academic hospitalists to engage in activities for advancement that they did not find personally fulfilling. Academic hospitalists recognized that advancement was central to the concept of career success for organizations even if this was not identified as being core to their personal definitions of success.
“I think that for me, the idea of being promoted and being a leader in the field is less important to me than...for the organization.”
Hospitalists expressed that objective markers, such as promotion and publications, were perceived as more important at higher levels of the academic organization, whereas more subjective aspects of success, aligned with intrinsic personal definitions, were more valued within the hospital medicine group.
Extrinsic—Compensation
Compensation was notable for its absence in participants’ discussion of career success. When asked about their definitions of career success, academic hospitalists did not spontaneously raise the topic of compensation. The only mention of compensation was in response to a question about how personal and external definitions of career success differ.
Unexpected Findings
While it was almost universally recognized by participants as important, ambivalence toward the “academic value of clinical work,” “scholarship,” and especially “promotion” represented an unexpected thematic family.
“I can’t quite get excited about a title attached to my name or the number of times my name pops up when I enter it into PubMed. My personal definition is more…where do I have something that I am interested [in] that someone else values. And that value is not shown as an associate professorship or an assistant professorship next to my name. …When you push me on it, you could call me clinical instructor forever, and I don’t think I would care too much.”
The interaction between work and personal activities as representing complementary aspects of a global sense of success was also unexpected and ran contrary to a simplistic conception of work and life in conflict. Academic hospitalists referenced that the ability to participate in aspects of life external to the workplace was important to their sense of career success. Participants frequently used phrases such as “work–life balance” to encompass a larger sense that work and nonwork life needed to merge to form a holistic sense of having a positive impact.
“Personal success is becoming what I have termed a ‘man of worth.’ I think [that is] someone who feels as though they make a positive impact in the world. Through both my career, but I guess the things that I do that are external to my career. Those would be defined by being a good husband, a good son, a philanthropist out in the community…sometimes, these are not things that can necessarily go on a [curriculum vitae].”
Conflict Among Organizing Themes
At times, academic hospitalists described a tension between day-to-day job satisfaction and what would be necessary to accomplish longer-term career success in the other organizing themes. This was reflected by a sense of trade-off. For instance, activities that lead to some aspects of career satisfaction or advancement would take time away from the direct exposure to learners and clinical care that currently drive job satisfaction.
“If the institution wanted me to be more productive from a research standpoint or…advocate that I receive funding so I could buy down clinical time and interactions I have with my students and my patients, then I can see my satisfaction going down.”
Many described a sense of engaging in activities they did not find personally fulfilling because of a sense of expectation that those activities were considered successful by others. Some described a state in which the drive toward advancement as an extrinsic incentive could come at the expense of the intrinsic rewards of being an academic hospitalist.
DISCUSSION
Career success has been defined as “the positive psychological or work-related outcomes or achievements one accumulates as a result of work experiences.”4,7,8 Academic career success for hospitalist faculty isn’t as well defined and has not been examined from the perspectives of early-career clinician-educator hospitalist faculty themselves.
The themes that emerged in this study describe a definition of success anchored in the daily work of striving to become an exceptional clinician and teacher. The major themes included (1) having excitement about daily work, (2) having meaningful impact, (3) development of a niche (4) a sense of respect within the sphere of academic medicine, and (5) disseminating work.
Success was very much internally defined as having a positive, meaningful impact on patients, learners, and the systems in which they practice. The faculty had a conception of what promotion committees value and often internalized aspects of this, such as developing a national reputation and giving talks at national meetings. Participants typically self-identified as clinician-educators, and yet dissemination of work remained an important component of personal success. While promotion was clearly identified as a marker of success, academic hospitalists often rejected the supposition of promotion itself as a professional goal. They expressed hope, and some skepticism, that external recognition of career success would follow the pursuit of internally meaningful goals.
While promotion and peer-reviewed publications represent easily measured markers often used as proxies for individual career and programmatic success, our research demonstrates that there is a deep well of externally imperceptible influences on an individual’s sense of success as an academic hospitalist. In our analysis, intrinsic elements of career success received far greater weight with early-career academic hospitalists. Our findings are supported by a prior survey of academic physicians that similarly found that faculty with >50% of their time devoted to clinical care placed greater career value in patient care, relationships with patients, and recognition by patients and residents compared to national reputation.9 Similar to our own findings, highly clinical faculty in that study were also less likely to value promotion and tenure as indicators of career success.9
The main focus of our questions was how early-career faculty define success at this point in their careers. When asked to extrapolate to a future state of career success, the concept of progression was repeatedly raised. This included successive promotions to higher academic ranks, increasing responsibility, titles, leadership, and achieving competitive roles or awards. It also included a progressively increasing impact of scholarship, growing national reputation, and becoming part of a network of accomplished academic hospitalists across the country. Looking forward, our early-career hospitalists felt that long-term career success would represent accomplishing these things and still being able to be focused on being excellent clinicians to patients, having a work–life balance, and keeping joy and excitement in daily activities.
Our work has limitations, including a focus on early-career clinician-educator hospitalists. The perception of career success may evolve over time, and future work to examine perceptions in more advanced academic hospitalists would be of interest. Our work used purposeful sampling to capture individuals who were likely to self-identify as academic clinician-educators, and results may not generalize to hospitalist physician-scientists or hospitalists in community practices.
Our analysis suggests that external organizations influence internal perceptions of career success. However, success is ultimately defined by the individual and not the institution. Efforts to measure and improve academic hospitalists’ attainment of career success should attend to intrinsic aspects of satisfaction in addition to objective measures, such as publications and promotion. This may provide a mechanism to address burnout and improve retention. As important as commonality in themes is the variation in self-definitions of career success among individuals. This suggests the value of inquiry by academic leadership in exploring and understanding what success is from the individual faculty perspective. This may enhance the alignment among personal definitions, organizational values, and, ultimately, sustainable, successful careers.
Disclosure: The authors have nothing to disclose.
1. Harrison R, Hunter AJ, Sharpe B, Auerbach AD. Survey of US Academic Hospitalist Leaders About Mentorship and Academic Activities in Hospitalist Groups. J Hosp Med. 2011;6(1):5-9. PubMed
2. Buddeberg-Fischer B, Stamm M, Buddeberg C, Klaghofer R. Career-Success Scale. A New Instrument to Assess Young Physicians Academic Career Steps. BMC Health Serv Res. 2008;8:120. PubMed
3. Rubio DM, Primack BA, Switzer GE, Bryce CL, Selzer DL, Kapoor WN. A Comprehensive Career-Success Model for Physician-Scientists. Acad Med. 2011;86(12):1571-1576. PubMed
4. Judge TA, Cable DM, Boudreau JW, Bretz RD. An empirical investigation of the predictors of executive career success (CAHRS Working Paper #94-08). Ithaca, NY: Cornell University, School of Industrial and Labor Relations, Center for Advanced Human Resource Studies. 1994. http://digitalcommons.ilr.cornell.edu/cahrswp/233. Accessed November 27, 2017.
5. Palinkas LA, Horwitz SM, Green CA, Wisdom JP, Duan N, Hoagwood K. Purposeful sampling for qualitative data collection and analysis in mixed method implementation research. Adm Policy Ment Health. 2015;42(5):533-544. PubMed
6. Francis JJ, Johnston M, Robertson C, et al. What is an adequate sample size? Operationalising data saturation for theory-based interview studies. Psychol Health. 2010;25(10):1229-1245. PubMed
7. Abele AE, Spurk, D. The longitudinal impact of self-efficacy and career goals on objective and subjective career success. J Vocat Behav. 2009;74(1):53-62.
8. Seibert SE, Kraimer ML. The five-factor model of personality and career success. J Vocat Behav. 2011;58(1):1-21.
9. Buckley, LM, Sanders K, Shih M, Hampton CL. Attitudes of Clinical Faculty About Career Progress, Career Success, and Commitment to Academic Medicine: Results of a Survey. Arch Intern Med. 2000;160(17):2625-2629. PubMed
Academic hospital medicine is a young specialty, with most faculty at the rank of instructor or assistant professor.1 Traditional markers of academic success for clinical and translational investigators emphasize progressive, externally funded grants, achievements in basic science research, and prolific publication in the peer-reviewed literature.2 Promotion is often used as a proxy measure for academic success.
Conceptual models of career success derived from nonhealthcare industries and for physician-scientists include both extrinsic and intrinsic domains.3,4 Extrinsic domains of career success include financial rewards (compensation) and progression in hierarchical status (advancement).3,4 Intrinsic domains of career success include pleasure derived from daily work (job satisfaction) and satisfaction derived from aspects of the career over time (career satisfaction).3,4
Research is limited regarding hospitalist faculty beliefs about career success. A better understanding of hospitalist perspectives can inform program development to support junior faculty in academic hospital medicine. In this phenomenological, qualitative study, we explore the global concept of career success as perceived by early-career clinician-educator hospitalists.
METHODS
Study Design, Setting, and Participants
We conducted interviews with hospitalists from 3 academic medical centers between May 2016 and October 2016. Purposeful sampling was used.5 Leaders within each hospital medicine group identified early-career faculty with approximately 2 to 5 years in academic medicine with a rank of instructor or assistant professor at each institution likely to self-identify as clinician-educators for targeted solicitation to enroll. Additional subjects were recruited until thematic saturation had been achieved on the personal definition of career success. Participants received disclosure and consent documents prior to enrollment. No compensation was provided to participants. This study was approved by the Colorado Multiple Institutional Review Board.
Interview Guide Development and Content
The semistructured interview format was developed and validated through an iterative process. Proposed questions were developed by study investigators on the basis of review of the literature on career success in nonhealthcare industries and academic hospitalist promotion. The questions were assessed for content validity through a review of interview domains by an academic hospitalist program director (R. P.). Cognitive interviewing with 3 representative academic hospitalists who were not part of the study cohort was done as an additional face-validation step of the question probe structure. As a result of the cognitive interviews, 1 question was eliminated, and a framework for clarifications and answer probes was derived prior to the enrollment of the first study subject. No changes were made to the interview format during the study period.
Data Collection
The principal investigator (E.C.) performed all interviews by using the interview tool consisting of 7 demographic questions and 11 open-ended questions and exploring aspects of the concept of career success. The initial open-ended question, “How would you personally define career success as an academic hospitalist at this stage in your career?” represented the primary question of interest. Follow-up questions were used to better understand responses to the primary question. All interviews were audio recorded, deidentified, and transcribed by the principal investigator. Transcripts were randomly audited by a second investigator (E.Y.) for accuracy and completeness.
Sample Size Determination
Interviews were continued to thematic saturation. After the first 3 interviews were transcribed, 2 members of the research team (E.C. and P.K.) reviewed the transcripts and developed a preliminary thematic codebook for the primary question. Subsequent interviews were reviewed and analyzed against these themes. Interviews were continued to thematic saturation, which was defined as more than 3 sequential interviews with no new identified themes.6
Data Analysis
By using qualitative data analysis software (ATLAS.ti version 7; ATLAS.ti Scientific Software Development GmbH, Berlin, Germany), transcriptions were analyzed with a team-based, mixed inductive-deductive approach. An inductive approach was utilized to allow basic theme codes to emerge from the raw text, and thus remaining open to unanticipated themes. Investigators assessed each distinct quote for new themes, confirmatory themes, and challenges to previously developed concepts. Basic themes were then discussed among research team members to determine prominent themes, with basic theme codes added, removed, or combined at this stage of the analysis. Responses to each follow-up question were subsequently assessed for new themes, confirmatory themes, or challenges to previously developed concepts related to the personal definition of career success. A deductive approach was then used to map our inductively generated themes back to the organizing themes of the existing conceptual framework.
RESULTS
Thematic Mapping to Organizing Themes of the Conceptual Model (Table)
The single most dominant theme, “excitement about daily work” was connected to an intrinsic sense of job satisfaction. Career satisfaction emerged from interviews more frequently than extrinsic organizing themes, such as advancement or compensation. Advancement through promotion was infrequently referenced as part of success, and tenure was never raised despite being available for clinician-educators at 2 of the 3 institutions. Compensation was not referenced in any interviewee’s initial definition of career success, although in 1 interview, it came up in response to a follow-up question. The Figure visually represents the relative weighting (shown by the sizes of the boxes) of organizing themes to the early-career hospitalists’ self-concepts of career success. Relationships among organizing themes as they emerged from interviews are represented by arrows.
Intrinsic—Job Satisfaction
With regard to job satisfaction, early-career faculty often invoked words such as “excitement,” “enjoyment,” and “passionate” to describe an overall theme of “excitement about daily work.” A positive affective state created by the nature of daily work was described as integral to the personal sense of career success. It was also strongly associated with perception of sustainability in a hospitalist career.
“I think [career success] would be job satisfaction. …So, for me, that would be happiness with my job. I like coming to work. I like doing what I do and at the end of the day going home and saying that was a good day. I like to think that would be success at work…is how I would define it.”
This theme was also related to a negative aspect often referred to as burnout, which many identified as antithetical to career success. More often, they described success as a heightened state of enthusiasm for the daily work experience.
“I am staying engaged and excited. So, I am not just taking care of patients; I am not just teaching. Having enough excitement from my work to come home and talk about it at dinner. To enjoy my days off but at the same time being excited to get back to work.”
This description of passion toward the work of being a hospitalist was often linked to a sense of deeper purpose found through the delivery of clinical care and education of learners.
“I really feel that we have the opportunity to very meaningfully and powerfully impact people’s lives, and that to me is meaningful. …That’s value. ...That’s coming home at the end of the day and thinking that you have had a positive impact.”
The interviews reflected that core to meaningful work was a sense of personal efficacy as a clinician, which was reflected in the themes of clinical proficiency and practicing high-quality care.
“I think developing clinical expertise, both through experience and studying. Getting to the point to where you can take really excellent care of your patient through expertise would be a sense of success that a lot of academic hospitalists would strive for.”
Intrinsic—Career Satisfaction
Within career satisfaction, participants described that “being respected and recognized” and “dissemination of work” were important contributors to career success. Reputation was frequently referenced as a measure of career success. Reputation was defined by some in a local context of having the respect of learners, peers, and others as a national renown. As a prerequisite for developing a reputation beyond the local academic environment, dissemination of work was often referenced as an important component of satisfaction in the career. This dissemination extended beyond peer-reviewed publications and included other forms of scholarship, presentations at conferences, and sharing clinical innovations between hospitals.
“For me personally, I have less of an emphasis on research and some of the more, I don’t want to say ‘academic’ because I think education is academic, but maybe some of the more scholarly practice of medicine, doing research and the writing of papers and things like that, although I certainly view some of that as a part of career success.”
Within career satisfaction, participants also described a diverse set of themes, including progressive improvement in skills, developing a self-perception of excellence in 1 or more arenas of academic medicine, leadership, work–life integration, innovation, and relationships. The concept of developing a niche, or becoming an expert in a particular domain of hospital medicine, was frequently referenced.
“I think part of [success] is ‘Have they identified a niche?’ Because I think if you want to be in an academic center, as much as I value teaching and taking care of patients, I think 1 of the advantages is the opportunity to potentially identify an area of expertise.”
Participants frequently alluded to the idea that the most important aspects of career satisfaction are not static phenomena but rather values that could evolve over the course of a career. For instance, in the early-career, making a difference with individual learners or patients could have greater valence, but as the career progressed, finding a niche, disseminating work, and building a national reputation would gain importance to a personal sense of career satisfaction.
Extrinsic—Advancement
Promotion was typically referenced when discussing career success, but it was not uniformly valued by early career hospitalists. Some expressed significant ambivalence about its effect on their personal sense of career success. Academic hospitalists identified a number of organizations with definitions of success that influence them. Definitions of success for the university were more relevant to interviewees compared to those of the hospital or professional societies. Interviewees were able to describe a variety of criteria by which their universities define or recognize career success. These commonly included promotion, publications and/or scholarship, and research. The list of factors perceived as success by the hospital were often distinct from those of the university and included cost-effective care, patient safety, and clinical leadership roles.
Participants described a sense of internal conflict when external-stakeholder definitions of success diverged from internal motivators. This was particularly true when this divergence led academic hospitalists to engage in activities for advancement that they did not find personally fulfilling. Academic hospitalists recognized that advancement was central to the concept of career success for organizations even if this was not identified as being core to their personal definitions of success.
“I think that for me, the idea of being promoted and being a leader in the field is less important to me than...for the organization.”
Hospitalists expressed that objective markers, such as promotion and publications, were perceived as more important at higher levels of the academic organization, whereas more subjective aspects of success, aligned with intrinsic personal definitions, were more valued within the hospital medicine group.
Extrinsic—Compensation
Compensation was notable for its absence in participants’ discussion of career success. When asked about their definitions of career success, academic hospitalists did not spontaneously raise the topic of compensation. The only mention of compensation was in response to a question about how personal and external definitions of career success differ.
Unexpected Findings
While it was almost universally recognized by participants as important, ambivalence toward the “academic value of clinical work,” “scholarship,” and especially “promotion” represented an unexpected thematic family.
“I can’t quite get excited about a title attached to my name or the number of times my name pops up when I enter it into PubMed. My personal definition is more…where do I have something that I am interested [in] that someone else values. And that value is not shown as an associate professorship or an assistant professorship next to my name. …When you push me on it, you could call me clinical instructor forever, and I don’t think I would care too much.”
The interaction between work and personal activities as representing complementary aspects of a global sense of success was also unexpected and ran contrary to a simplistic conception of work and life in conflict. Academic hospitalists referenced that the ability to participate in aspects of life external to the workplace was important to their sense of career success. Participants frequently used phrases such as “work–life balance” to encompass a larger sense that work and nonwork life needed to merge to form a holistic sense of having a positive impact.
“Personal success is becoming what I have termed a ‘man of worth.’ I think [that is] someone who feels as though they make a positive impact in the world. Through both my career, but I guess the things that I do that are external to my career. Those would be defined by being a good husband, a good son, a philanthropist out in the community…sometimes, these are not things that can necessarily go on a [curriculum vitae].”
Conflict Among Organizing Themes
At times, academic hospitalists described a tension between day-to-day job satisfaction and what would be necessary to accomplish longer-term career success in the other organizing themes. This was reflected by a sense of trade-off. For instance, activities that lead to some aspects of career satisfaction or advancement would take time away from the direct exposure to learners and clinical care that currently drive job satisfaction.
“If the institution wanted me to be more productive from a research standpoint or…advocate that I receive funding so I could buy down clinical time and interactions I have with my students and my patients, then I can see my satisfaction going down.”
Many described a sense of engaging in activities they did not find personally fulfilling because of a sense of expectation that those activities were considered successful by others. Some described a state in which the drive toward advancement as an extrinsic incentive could come at the expense of the intrinsic rewards of being an academic hospitalist.
DISCUSSION
Career success has been defined as “the positive psychological or work-related outcomes or achievements one accumulates as a result of work experiences.”4,7,8 Academic career success for hospitalist faculty isn’t as well defined and has not been examined from the perspectives of early-career clinician-educator hospitalist faculty themselves.
The themes that emerged in this study describe a definition of success anchored in the daily work of striving to become an exceptional clinician and teacher. The major themes included (1) having excitement about daily work, (2) having meaningful impact, (3) development of a niche (4) a sense of respect within the sphere of academic medicine, and (5) disseminating work.
Success was very much internally defined as having a positive, meaningful impact on patients, learners, and the systems in which they practice. The faculty had a conception of what promotion committees value and often internalized aspects of this, such as developing a national reputation and giving talks at national meetings. Participants typically self-identified as clinician-educators, and yet dissemination of work remained an important component of personal success. While promotion was clearly identified as a marker of success, academic hospitalists often rejected the supposition of promotion itself as a professional goal. They expressed hope, and some skepticism, that external recognition of career success would follow the pursuit of internally meaningful goals.
While promotion and peer-reviewed publications represent easily measured markers often used as proxies for individual career and programmatic success, our research demonstrates that there is a deep well of externally imperceptible influences on an individual’s sense of success as an academic hospitalist. In our analysis, intrinsic elements of career success received far greater weight with early-career academic hospitalists. Our findings are supported by a prior survey of academic physicians that similarly found that faculty with >50% of their time devoted to clinical care placed greater career value in patient care, relationships with patients, and recognition by patients and residents compared to national reputation.9 Similar to our own findings, highly clinical faculty in that study were also less likely to value promotion and tenure as indicators of career success.9
The main focus of our questions was how early-career faculty define success at this point in their careers. When asked to extrapolate to a future state of career success, the concept of progression was repeatedly raised. This included successive promotions to higher academic ranks, increasing responsibility, titles, leadership, and achieving competitive roles or awards. It also included a progressively increasing impact of scholarship, growing national reputation, and becoming part of a network of accomplished academic hospitalists across the country. Looking forward, our early-career hospitalists felt that long-term career success would represent accomplishing these things and still being able to be focused on being excellent clinicians to patients, having a work–life balance, and keeping joy and excitement in daily activities.
Our work has limitations, including a focus on early-career clinician-educator hospitalists. The perception of career success may evolve over time, and future work to examine perceptions in more advanced academic hospitalists would be of interest. Our work used purposeful sampling to capture individuals who were likely to self-identify as academic clinician-educators, and results may not generalize to hospitalist physician-scientists or hospitalists in community practices.
Our analysis suggests that external organizations influence internal perceptions of career success. However, success is ultimately defined by the individual and not the institution. Efforts to measure and improve academic hospitalists’ attainment of career success should attend to intrinsic aspects of satisfaction in addition to objective measures, such as publications and promotion. This may provide a mechanism to address burnout and improve retention. As important as commonality in themes is the variation in self-definitions of career success among individuals. This suggests the value of inquiry by academic leadership in exploring and understanding what success is from the individual faculty perspective. This may enhance the alignment among personal definitions, organizational values, and, ultimately, sustainable, successful careers.
Disclosure: The authors have nothing to disclose.
1. Harrison R, Hunter AJ, Sharpe B, Auerbach AD. Survey of US Academic Hospitalist Leaders About Mentorship and Academic Activities in Hospitalist Groups. J Hosp Med. 2011;6(1):5-9. PubMed
2. Buddeberg-Fischer B, Stamm M, Buddeberg C, Klaghofer R. Career-Success Scale. A New Instrument to Assess Young Physicians Academic Career Steps. BMC Health Serv Res. 2008;8:120. PubMed
3. Rubio DM, Primack BA, Switzer GE, Bryce CL, Selzer DL, Kapoor WN. A Comprehensive Career-Success Model for Physician-Scientists. Acad Med. 2011;86(12):1571-1576. PubMed
4. Judge TA, Cable DM, Boudreau JW, Bretz RD. An empirical investigation of the predictors of executive career success (CAHRS Working Paper #94-08). Ithaca, NY: Cornell University, School of Industrial and Labor Relations, Center for Advanced Human Resource Studies. 1994. http://digitalcommons.ilr.cornell.edu/cahrswp/233. Accessed November 27, 2017.
5. Palinkas LA, Horwitz SM, Green CA, Wisdom JP, Duan N, Hoagwood K. Purposeful sampling for qualitative data collection and analysis in mixed method implementation research. Adm Policy Ment Health. 2015;42(5):533-544. PubMed
6. Francis JJ, Johnston M, Robertson C, et al. What is an adequate sample size? Operationalising data saturation for theory-based interview studies. Psychol Health. 2010;25(10):1229-1245. PubMed
7. Abele AE, Spurk, D. The longitudinal impact of self-efficacy and career goals on objective and subjective career success. J Vocat Behav. 2009;74(1):53-62.
8. Seibert SE, Kraimer ML. The five-factor model of personality and career success. J Vocat Behav. 2011;58(1):1-21.
9. Buckley, LM, Sanders K, Shih M, Hampton CL. Attitudes of Clinical Faculty About Career Progress, Career Success, and Commitment to Academic Medicine: Results of a Survey. Arch Intern Med. 2000;160(17):2625-2629. PubMed
©2018 Society of Hospital Medicine
A Prescription for Note Bloat: An Effective Progress Note Template
The widespread adoption of electronic health records (EHRs) has led to significant progress in the modernization of healthcare delivery. Ease of access has improved clinical efficiency, and digital data have allowed for point-of-care decision support tools ranging from predicting the 30-day risk of readmission to providing up-to-date guidelines for the care of various diseases.1,2 Documentation tools such as copy-forward and autopopulation increase the speed of documentation, and typed notes improve legibility and ease of note transmission.3,4
However, all of these benefits come with a potential for harm, particularly with respect to accurate and concise documentation. Many experts have described the perpetuation of false information leading to errors, copying-forward of inconsistent and outdated information, and the phenomenon of “note bloat” — physician notes that contain multiple pages of nonessential information, often leaving key aspects buried or lost.5-7 Providers seem to recognize the hazards of copy-and-paste functionality yet persist in utilizing it. In 1 survey, more than 70% of attendings and residents felt that copy and paste led to inaccurate and outdated information, yet 80% stated they would still use it.8
There is little evidence to guide institutions on ways to improve EHR documentation practices. Recent studies have shown that operative note templates improved documentation and decreased the number of missing components.9,10 In the nonoperative setting, 1 small pilot study of pediatric interns demonstrated that a bundled intervention composed of a note template and classroom teaching resulted in improvement in overall note quality and a decrease in “note clutter.”11 In a larger study of pediatric residents, a standardized and simplified note template resulted in a shorter note, although notes were completed later in the day.12 The present study seeks to build upon these efforts by investigating the effect of didactic teaching and an electronic progress note template on note quality, length, and timeliness across 4 academic internal medicine residency programs.
METHODS
Study Design
This prospective quality improvement study took place across 4 academic institutions: University of California Los Angeles (UCLA), University of California San Francisco (UCSF), University of California San Diego (UCSD), and University of Iowa, all of which use Epic EHR (Epic Corp., Madison, WI). The intervention combined brief educational conferences directed at housestaff and attendings with the implementation of an electronic progress note template. Guided by resident input, a note-writing task force at UCSF and UCLA developed a set of best practice guidelines and an aligned note template for progress notes (supplementary Appendix 1). UCSD and the University of Iowa adopted them at their respective institutions. The template’s design minimized autopopulation while encouraging providers to enter relevant data via free text fields (eg, physical exam), prompts (eg, “I have reviewed all the labs from today. Pertinent labs include…”), and drop-down menus (eg, deep vein thrombosis [DVT] prophylaxis: enoxaparin, heparin subcutaneously, etc; supplementary Appendix 2). Additionally, an inpatient checklist was included at the end of the note to serve as a reminder for key inpatient concerns and quality measures, such as Foley catheter days, discharge planning, and code status. Lectures that focused on issues with documentation in the EHR, the best practice guidelines, and a review of the note template with instructions on how to access it were presented to the housestaff. Each institution tailored the lecture to suit their culture. Housestaff were encouraged but not required to use the note template.
Selection and Grading of Progress Notes
Progress notes were eligible for the study if they were written by an intern on an internal medicine teaching service, from a patient with a hospitalization length of at least 3 days with a progress note selected from hospital day 2 or 3, and written while the patient was on the general medicine wards. The preintervention notes were authored from September 2013 to December 2013 and the postintervention notes from April 2014 to June 2014. One note was selected per patient and no more than 3 notes were selected per intern. Each institution selected the first 50 notes chronologically that met these criteria for both the preintervention and the postintervention periods, for a total of 400 notes. The note-grading tool consisted of the following 3 sections to analyze note quality: (1) a general impression of the note (eg, below average, average, above average); (2) the validated Physician Documentation Quality Instrument, 9-item version (PDQI-9) that evaluates notes on 9 domains (up to date, accurate, thorough, useful, organized, comprehensible, succinct, synthesized, internally consistent) on a Likert scale from 1 (not at all) to 5 (extremely); and (3) a note competency questionnaire based on the Accreditation Council for Graduate Medical Education competency note checklist that asked yes or no questions about best practice elements (eg, is there a relevant and focused physical exam).12
Graders were internal medicine teaching faculty involved in the study and were assigned to review notes from their respective sites by directly utilizing the EHR. Although this introduces potential for bias, it was felt that many of the grading elements required the grader to know details of the patient that would not be captured if the note was removed from the context of the EHR. Additionally, graders documented note length (number of lines of text), the time signed by the housestaff, and whether the template was used. Three different graders independently evaluated each note and submitted ratings by using Research Electronic Data Capture.13
Statistical Analysis
Means for each item on the grading tool were computed across raters for each progress note. These were summarized by institution as well as by pre- and postintervention. Cumulative logit mixed effects models were used to compare item responses between study conditions. The number of lines per note before and after the note template intervention was compared by using a mixed effects negative binomial regression model. The timestamp on each note, representing the time of day the note was signed, was compared pre- and postintervention by using a linear mixed effects model. All models included random note and rater effects, and fixed institution and intervention period effects, as well as their interaction. Inter-rater reliability of the grading tool was assessed by calculating the intraclass correlation coefficient (ICC) using the estimated variance components. Data obtained from the PDQI-9 portion were analyzed by individual components as well as by sum score combining each component. The sum score was used to generate odds ratios to assess the likelihood that postintervention notes that used the template compared to those that did not would increase PDQI-9 sum scores. Both cumulative and site-specific data were analyzed. P values < .05 were considered statistically significant. All analyses were performed using SAS version 9.4 (SAS Institute Inc, Cary, NC).
RESULTS
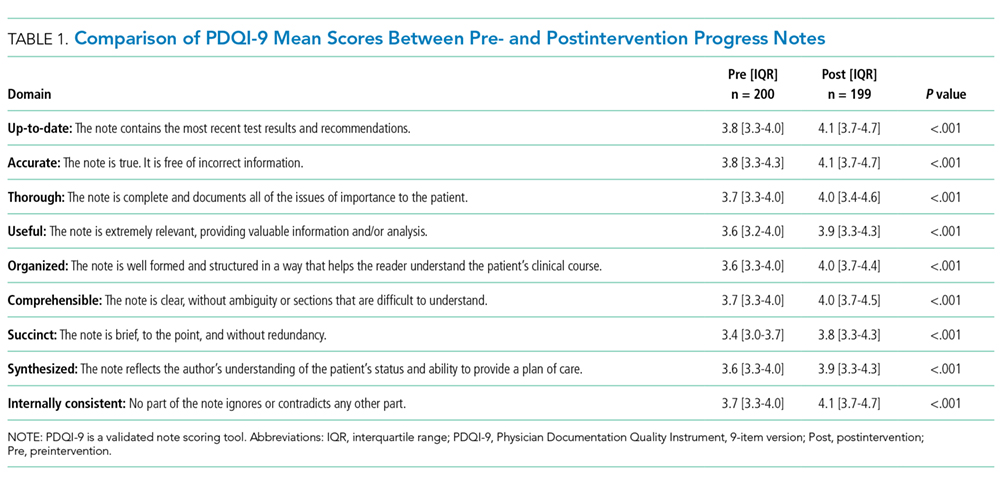
The mean general impression score significantly improved from 2.0 to 2.3 (on a 1-3 scale in which 2 is average) after the intervention (P < .001). Additionally, note quality significantly improved across each domain of the PDQI-9 (P < .001 for all domains, Table 1). The ICC was 0.245 for the general impression score and 0.143 for the PDQI-9 sum score.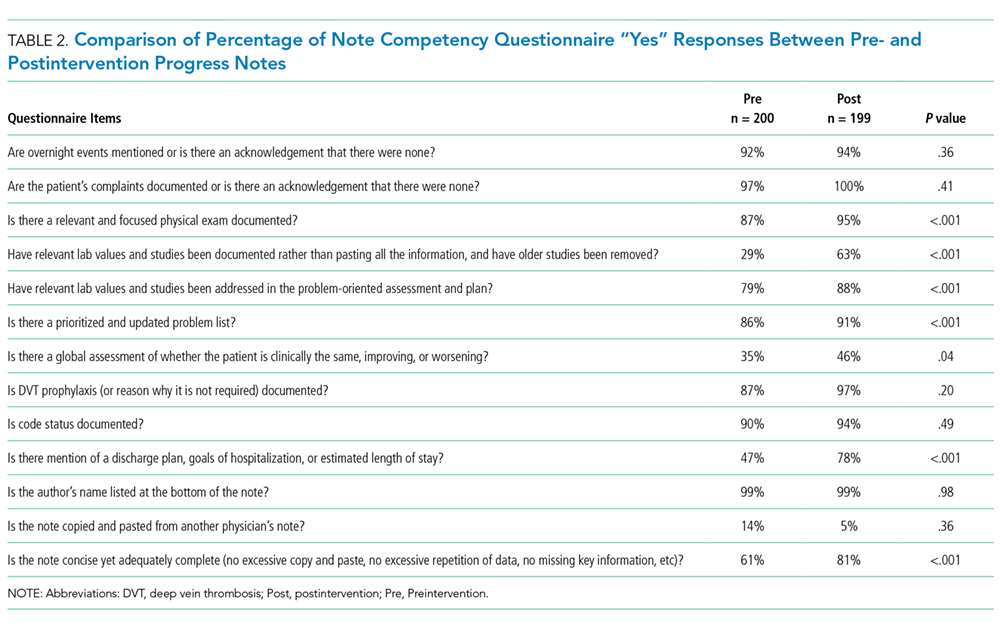
Three of 4 institutions documented the number of lines per note and the time the note was signed by the intern. Mean number of lines per note decreased by 25% (361 lines preintervention, 265 lines postintervention, P < .001). Mean time signed was approximately 1 hour and 15 minutes earlier in the day (3:27
Site-specific data revealed variation between sites. Template use was 92% at UCSF, 90% at UCLA, 79% at Iowa, and 21% at UCSD. The mean general impression score significantly improved at UCSF, UCLA, and UCSD, but not at Iowa. The PDQI-9 score improved across all domains at UCSF and UCLA, 2 domains at UCSD, and 0 domains at Iowa. Documentation of pertinent labs and studies significantly improved at UCSF, UCLA, and Iowa, but not UCSD. Note length decreased at UCSF and UCLA, but not at UCSD. Notes were signed earlier at UCLA and UCSD, but not at UCSF.
When comparing postintervention notes based on template use, notes that used the template were significantly more likely to receive a higher mean impression score (odds ratio [OR] 11.95, P < .001), higher PDQI-9 sum score (OR 3.05, P < .001), be approximately 25% shorter (326 lines vs 239 lines, P < .001), and be completed approximately 1 hour and 20 minutes earlier (3:07
DISCUSSION
A bundled intervention consisting of educational lectures and a best practice progress note template significantly improved the quality, decreased the length, and resulted in earlier completion of inpatient progress notes. These findings are consistent with a prior study that demonstrated that a bundled note template intervention improved total note score and reduced note clutter.11 We saw a broad improvement in progress notes across all 9 domains of the PDQI-9, which corresponded with an improved general impression score. We also found statistically significant improvements in 7 of the 13 categories of the competency questionnaire.
Arguably the greatest impact of the intervention was shortening the documentation of labs and studies. Autopopulation can lead to the appearance of a comprehensive note; however, key data are often lost in a sea of numbers and imaging reports.6,14 Using simple prompts followed by free text such as, “I have reviewed all the labs from today. Pertinent labs include…” reduced autopopulation and reminded housestaff to identify only the key information that affected patient care for that day, resulting in a more streamlined, clear, and high-yield note.
The time spent documenting care is an important consideration for physician workflow and for uptake of any note intervention.14-18 One study from 2016 revealed that internal medicine housestaff spend more than half of an average shift using the computer, with 52% of that time spent on documentation.17 Although functions such as autopopulation and copy-forward were created as efficiency tools, we hypothesize that they may actually prolong note writing time by leading to disorganized, distended notes that are difficult to use the following day. There was concern that limiting these “efficiency functions” might discourage housestaff from using the progress note template. It was encouraging to find that postintervention notes were signed 1.3 hours earlier in the day. This study did not measure the impact of shorter notes and earlier completion time, but in theory, this could allow interns to spend more time in direct patient care and to be at lower risk of duty hour violations.19 Furthermore, while the clinical impact of this is unknown, it is possible that timely note completion may improve patient care by making notes available earlier for consultants and other members of the care team.
We found that adding an “inpatient checklist” to the progress note template facilitated a review of key inpatient concerns and quality measures. Although we did not specifically compare before-and-after documentation of all of the components of the checklist, there appeared to be improvement in the domains measured. Notably, there was a 31% increase (P < .001) in the percentage of notes documenting the “discharge plan, goals of hospitalization, or estimated length of stay.” In the surgical literature, studies have demonstrated that incorporating checklists improves patient safety, the delivery of care, and potentially shortens the length of stay.20-22 Future studies should explore the impact of adding a checklist to the daily progress note, as there may be potential to improve both process and outcome measures.
Institution-specific data provided insightful results. UCSD encountered low template use among their interns; however, they still had evidence of improvement in note quality, though not at the same level of UCLA and UCSF. Some barriers to uptake identified were as follows: (1) interns were accustomed to import labs and studies into their note to use as their rounding report, and (2) the intervention took place late in the year when interns had developed a functional writing system that they were reluctant to change. The University of Iowa did not show significant improvement in their note quality despite a relatively high template uptake. Both of these outcomes raise the possibility that in addition to the template, there were other factors at play. Perhaps because UCSF and UCLA created the best practice guidelines and template, it was a better fit for their culture and they had more institutional buy-in. Or because the educational lectures were similar, but not standardized across institutions, some lectures may have been more effective than others. However, when evaluating the postintervention notes at UCSD and Iowa, templated notes were found to be much more likely to score higher on the PDQI-9 than nontemplated notes, which serves as evidence of the efficacy of the note template.
Some of the strengths of this study include the relatively large sample size spanning 4 institutions and the use of 3 different assessment tools for grading progress note quality (general impression score, PDQI-9, and competency note questionnaire). An additional strength is our unique finding suggesting that note writing may be more efficient by removing, rather than adding, “efficiency functions.” There were several limitations of this study. Pre- and postintervention notes were examined at different points in the same academic year, thus certain domains may have improved as interns progressed in clinical skill and comfort with documentation, independent of our intervention.21 However, our analysis of postintervention notes across the same time period revealed that use of the template was strongly associated with higher quality, shorter notes and earlier completion time arguing that the effect seen was not merely intern experience. The poor interrater reliability is also a limitation. Although the PDQI-9 was previously validated, future use of the grading tool may require more rater training for calibration or more objective wording.23 The study was not blinded, and thus, bias may have falsely elevated postintervention scores; however, we attempted to minimize bias by incorporating a more objective yes/no competency questionnaire and by having each note scored by 3 graders. Other studies have attempted to address this form of bias by printing out notes and blinding the graders. This design, however, isolates the note from all other data in the medical record, making it difficult to assess domains such as accuracy and completeness. Our inclusion of objective outcomes such as note length and time of note completion help to mitigate some of the bias.
Future research can expand on the results of this study by introducing similar progress note interventions at other institutions and/or in nonacademic environments to validate the results and expand generalizability. Longer term follow-up would be useful to determine if these effects are transient or long lasting. Similarly, it would be interesting to determine if such results are sustained even after new interns start suggesting that institutional culture can be changed. Investigators could focus on similar projects to improve other notes that are particularly at a high risk for propagating false information, such as the History and Physical or Discharge Summary. Future research should also focus on outcomes data, including whether a more efficient note can allow housestaff to spend more time with patients, decrease patient length of stay, reduce clinical errors, and improve educational time for trainees. Lastly, we should determine if interventions such as this can mitigate the widespread frustrations with electronic documentation that are associated with physician and provider burnout.15,24 One would hope that the technology could be harnessed to improve provider productivity and be effectively integrated into comprehensive patient care.
Our research makes progress toward recommendations made by the American College of Physicians “to improve accuracy of information recorded and the value of information,” and develop automated tools that “enhance documentation quality without facilitating improper behaviors.”19 Institutions should consider developing internal best practices for clinical documentation and building structured note templates.19 Our research would suggest that, combined with a small educational intervention, such templates can make progress notes more accurate and succinct, make note writing more efficient, and be harnessed to improve quality metrics.
ACKNOWLEDGMENTS
The authors thank Michael Pfeffer, MD, and Sitaram Vangala, MS, for their contributions to and support of this research study and manuscript.
Disclosure: The authors declare no conflicts of interest.
1. Herzig SJ, Guess JR, Feinbloom DB, et al. Improving appropriateness of acid-suppressive medication use via computerized clinical decision support. J Hosp Med. 2015;10(1):41-45. PubMed
2. Nguyen OK, Makam AN, Clark C, et al. Predicting all-cause readmissions using electronic health record data from the entire hospitalization: Model development and comparison. J Hosp Med. 2016;11(7):473-480. PubMed
3. Donati A, Gabbanelli V, Pantanetti S, et al. The impact of a clinical information system in an intensive care unit. J Clin Monit Comput. 2008;22(1):31-36. PubMed
4. Schiff GD, Bates DW. Can electronic clinical documentation help prevent diagnostic errors? N Engl J Med. 2010;362(12):1066-1069. PubMed
5. Hartzband P, Groopman J. Off the record--avoiding the pitfalls of going electronic. N Engl J Med. 2008;358(16):1656-1658. PubMed
6. Hirschtick RE. A piece of my mind. Copy-and-paste. JAMA. 2006;295(20):2335-2336. PubMed
7. Hirschtick RE. A piece of my mind. John Lennon’s elbow. JAMA. 2012;308(5):463-464. PubMed
8. O’Donnell HC, Kaushal R, Barrón Y, Callahan MA, Adelman RD, Siegler EL. Physicians’ attitudes towards copy and pasting in electronic note writing. J Gen Intern Med. 2009;24(1):63-68. PubMed
9. Mahapatra P, Ieong E. Improving Documentation and Communication Using Operative Note Proformas. BMJ Qual Improv Rep. 2016;5(1):u209122.w3712. PubMed
10. Thomson DR, Baldwin MJ, Bellini MI, Silva MA. Improving the quality of operative notes for laparoscopic cholecystectomy: Assessing the impact of a standardized operation note proforma. Int J Surg. 2016;27:17-20. PubMed
11. Dean SM, Eickhoff JC, Bakel LA. The effectiveness of a bundled intervention to improve resident progress notes in an electronic health record. J Hosp Med. 2015;10(2):104-107. PubMed
12. Aylor M, Campbell EM, Winter C, Phillipi CA. Resident Notes in an Electronic Health Record: A Mixed-Methods Study Using a Standardized Intervention With Qualitative Analysis. Clin Pediatr (Phila). 2016;6(3):257-262.
13. Harris PA, Taylor R, Thielke R, Payne J, Gonzalez N, Conde JG. Research electronic data capture (REDCap)--a metadata-driven methodology and workflow process for providing translational research informatics support. J Biomed Inform. 2009;42(2):377-381. PubMed
14. Chi J, Kugler J, Chu IM, et al. Medical students and the electronic health record: ‘an epic use of time’. Am J Med. 2014;127(9):891-895. PubMed
15. Martin SA, Sinsky CA. The map is not the territory: medical records and 21st century practice. Lancet. 2016;388(10055):2053-2056. PubMed
16. Oxentenko AS, Manohar CU, McCoy CP, et al. Internal medicine residents’ computer use in the inpatient setting. J Grad Med Educ. 2012;4(4):529-532. PubMed
17. Mamykina L, Vawdrey DK, Hripcsak G. How Do Residents Spend Their Shift Time? A Time and Motion Study With a Particular Focus on the Use of Computers. Acad Med. 2016;91(6):827-832. PubMed
18. Chen L, Guo U, Illipparambil LC, et al. Racing Against the Clock: Internal Medicine Residents’ Time Spent On Electronic Health Records. J Grad Med Educ. 2016;8(1):39-44. PubMed
19. Kuhn T, Basch P, Barr M, Yackel T, Physicians MICotACo. Clinical documentation in the 21st century: executive summary of a policy position paper from the American College of Physicians. Ann Intern Med. 2015;162(4):301-303. PubMed
20. Treadwell JR, Lucas S, Tsou AY. Surgical checklists: a systematic review of impacts and implementation. BMJ Qual Saf. 2014;23(4):299-318. PubMed
21. Ko HC, Turner TJ, Finnigan MA. Systematic review of safety checklists for use by medical care teams in acute hospital settings--limited evidence of effectiveness. BMC Health Serv Res. 2011;11:211. PubMed
22. Diaz-Montes TP, Cobb L, Ibeanu OA, Njoku P, Gerardi MA. Introduction of checklists at daily progress notes improves patient care among the gynecological oncology service. J Patient Saf. 2012;8(4):189-193. PubMed
23. Stetson PD, Bakken S, Wrenn JO, Siegler EL. Assessing Electronic Note Quality Using the Physician Documentation Quality Instrument (PDQI-9). Appl Clin Inform. 2012;3(2):164-174. PubMed
24. Friedberg MW, Chen PG, Van Busum KR, et al. Factors affecting physician professional satisfaction and their implications for patient care, health systems, and health policy. Santa Monica, CA: RAND Corporation; 2013. PubMed
The widespread adoption of electronic health records (EHRs) has led to significant progress in the modernization of healthcare delivery. Ease of access has improved clinical efficiency, and digital data have allowed for point-of-care decision support tools ranging from predicting the 30-day risk of readmission to providing up-to-date guidelines for the care of various diseases.1,2 Documentation tools such as copy-forward and autopopulation increase the speed of documentation, and typed notes improve legibility and ease of note transmission.3,4
However, all of these benefits come with a potential for harm, particularly with respect to accurate and concise documentation. Many experts have described the perpetuation of false information leading to errors, copying-forward of inconsistent and outdated information, and the phenomenon of “note bloat” — physician notes that contain multiple pages of nonessential information, often leaving key aspects buried or lost.5-7 Providers seem to recognize the hazards of copy-and-paste functionality yet persist in utilizing it. In 1 survey, more than 70% of attendings and residents felt that copy and paste led to inaccurate and outdated information, yet 80% stated they would still use it.8
There is little evidence to guide institutions on ways to improve EHR documentation practices. Recent studies have shown that operative note templates improved documentation and decreased the number of missing components.9,10 In the nonoperative setting, 1 small pilot study of pediatric interns demonstrated that a bundled intervention composed of a note template and classroom teaching resulted in improvement in overall note quality and a decrease in “note clutter.”11 In a larger study of pediatric residents, a standardized and simplified note template resulted in a shorter note, although notes were completed later in the day.12 The present study seeks to build upon these efforts by investigating the effect of didactic teaching and an electronic progress note template on note quality, length, and timeliness across 4 academic internal medicine residency programs.
METHODS
Study Design
This prospective quality improvement study took place across 4 academic institutions: University of California Los Angeles (UCLA), University of California San Francisco (UCSF), University of California San Diego (UCSD), and University of Iowa, all of which use Epic EHR (Epic Corp., Madison, WI). The intervention combined brief educational conferences directed at housestaff and attendings with the implementation of an electronic progress note template. Guided by resident input, a note-writing task force at UCSF and UCLA developed a set of best practice guidelines and an aligned note template for progress notes (supplementary Appendix 1). UCSD and the University of Iowa adopted them at their respective institutions. The template’s design minimized autopopulation while encouraging providers to enter relevant data via free text fields (eg, physical exam), prompts (eg, “I have reviewed all the labs from today. Pertinent labs include…”), and drop-down menus (eg, deep vein thrombosis [DVT] prophylaxis: enoxaparin, heparin subcutaneously, etc; supplementary Appendix 2). Additionally, an inpatient checklist was included at the end of the note to serve as a reminder for key inpatient concerns and quality measures, such as Foley catheter days, discharge planning, and code status. Lectures that focused on issues with documentation in the EHR, the best practice guidelines, and a review of the note template with instructions on how to access it were presented to the housestaff. Each institution tailored the lecture to suit their culture. Housestaff were encouraged but not required to use the note template.
Selection and Grading of Progress Notes
Progress notes were eligible for the study if they were written by an intern on an internal medicine teaching service, from a patient with a hospitalization length of at least 3 days with a progress note selected from hospital day 2 or 3, and written while the patient was on the general medicine wards. The preintervention notes were authored from September 2013 to December 2013 and the postintervention notes from April 2014 to June 2014. One note was selected per patient and no more than 3 notes were selected per intern. Each institution selected the first 50 notes chronologically that met these criteria for both the preintervention and the postintervention periods, for a total of 400 notes. The note-grading tool consisted of the following 3 sections to analyze note quality: (1) a general impression of the note (eg, below average, average, above average); (2) the validated Physician Documentation Quality Instrument, 9-item version (PDQI-9) that evaluates notes on 9 domains (up to date, accurate, thorough, useful, organized, comprehensible, succinct, synthesized, internally consistent) on a Likert scale from 1 (not at all) to 5 (extremely); and (3) a note competency questionnaire based on the Accreditation Council for Graduate Medical Education competency note checklist that asked yes or no questions about best practice elements (eg, is there a relevant and focused physical exam).12
Graders were internal medicine teaching faculty involved in the study and were assigned to review notes from their respective sites by directly utilizing the EHR. Although this introduces potential for bias, it was felt that many of the grading elements required the grader to know details of the patient that would not be captured if the note was removed from the context of the EHR. Additionally, graders documented note length (number of lines of text), the time signed by the housestaff, and whether the template was used. Three different graders independently evaluated each note and submitted ratings by using Research Electronic Data Capture.13
Statistical Analysis
Means for each item on the grading tool were computed across raters for each progress note. These were summarized by institution as well as by pre- and postintervention. Cumulative logit mixed effects models were used to compare item responses between study conditions. The number of lines per note before and after the note template intervention was compared by using a mixed effects negative binomial regression model. The timestamp on each note, representing the time of day the note was signed, was compared pre- and postintervention by using a linear mixed effects model. All models included random note and rater effects, and fixed institution and intervention period effects, as well as their interaction. Inter-rater reliability of the grading tool was assessed by calculating the intraclass correlation coefficient (ICC) using the estimated variance components. Data obtained from the PDQI-9 portion were analyzed by individual components as well as by sum score combining each component. The sum score was used to generate odds ratios to assess the likelihood that postintervention notes that used the template compared to those that did not would increase PDQI-9 sum scores. Both cumulative and site-specific data were analyzed. P values < .05 were considered statistically significant. All analyses were performed using SAS version 9.4 (SAS Institute Inc, Cary, NC).
RESULTS
The mean general impression score significantly improved from 2.0 to 2.3 (on a 1-3 scale in which 2 is average) after the intervention (P < .001). Additionally, note quality significantly improved across each domain of the PDQI-9 (P < .001 for all domains, Table 1). The ICC was 0.245 for the general impression score and 0.143 for the PDQI-9 sum score.
Three of 4 institutions documented the number of lines per note and the time the note was signed by the intern. Mean number of lines per note decreased by 25% (361 lines preintervention, 265 lines postintervention, P < .001). Mean time signed was approximately 1 hour and 15 minutes earlier in the day (3:27
Site-specific data revealed variation between sites. Template use was 92% at UCSF, 90% at UCLA, 79% at Iowa, and 21% at UCSD. The mean general impression score significantly improved at UCSF, UCLA, and UCSD, but not at Iowa. The PDQI-9 score improved across all domains at UCSF and UCLA, 2 domains at UCSD, and 0 domains at Iowa. Documentation of pertinent labs and studies significantly improved at UCSF, UCLA, and Iowa, but not UCSD. Note length decreased at UCSF and UCLA, but not at UCSD. Notes were signed earlier at UCLA and UCSD, but not at UCSF.
When comparing postintervention notes based on template use, notes that used the template were significantly more likely to receive a higher mean impression score (odds ratio [OR] 11.95, P < .001), higher PDQI-9 sum score (OR 3.05, P < .001), be approximately 25% shorter (326 lines vs 239 lines, P < .001), and be completed approximately 1 hour and 20 minutes earlier (3:07
DISCUSSION
A bundled intervention consisting of educational lectures and a best practice progress note template significantly improved the quality, decreased the length, and resulted in earlier completion of inpatient progress notes. These findings are consistent with a prior study that demonstrated that a bundled note template intervention improved total note score and reduced note clutter.11 We saw a broad improvement in progress notes across all 9 domains of the PDQI-9, which corresponded with an improved general impression score. We also found statistically significant improvements in 7 of the 13 categories of the competency questionnaire.
Arguably the greatest impact of the intervention was shortening the documentation of labs and studies. Autopopulation can lead to the appearance of a comprehensive note; however, key data are often lost in a sea of numbers and imaging reports.6,14 Using simple prompts followed by free text such as, “I have reviewed all the labs from today. Pertinent labs include…” reduced autopopulation and reminded housestaff to identify only the key information that affected patient care for that day, resulting in a more streamlined, clear, and high-yield note.
The time spent documenting care is an important consideration for physician workflow and for uptake of any note intervention.14-18 One study from 2016 revealed that internal medicine housestaff spend more than half of an average shift using the computer, with 52% of that time spent on documentation.17 Although functions such as autopopulation and copy-forward were created as efficiency tools, we hypothesize that they may actually prolong note writing time by leading to disorganized, distended notes that are difficult to use the following day. There was concern that limiting these “efficiency functions” might discourage housestaff from using the progress note template. It was encouraging to find that postintervention notes were signed 1.3 hours earlier in the day. This study did not measure the impact of shorter notes and earlier completion time, but in theory, this could allow interns to spend more time in direct patient care and to be at lower risk of duty hour violations.19 Furthermore, while the clinical impact of this is unknown, it is possible that timely note completion may improve patient care by making notes available earlier for consultants and other members of the care team.
We found that adding an “inpatient checklist” to the progress note template facilitated a review of key inpatient concerns and quality measures. Although we did not specifically compare before-and-after documentation of all of the components of the checklist, there appeared to be improvement in the domains measured. Notably, there was a 31% increase (P < .001) in the percentage of notes documenting the “discharge plan, goals of hospitalization, or estimated length of stay.” In the surgical literature, studies have demonstrated that incorporating checklists improves patient safety, the delivery of care, and potentially shortens the length of stay.20-22 Future studies should explore the impact of adding a checklist to the daily progress note, as there may be potential to improve both process and outcome measures.
Institution-specific data provided insightful results. UCSD encountered low template use among their interns; however, they still had evidence of improvement in note quality, though not at the same level of UCLA and UCSF. Some barriers to uptake identified were as follows: (1) interns were accustomed to import labs and studies into their note to use as their rounding report, and (2) the intervention took place late in the year when interns had developed a functional writing system that they were reluctant to change. The University of Iowa did not show significant improvement in their note quality despite a relatively high template uptake. Both of these outcomes raise the possibility that in addition to the template, there were other factors at play. Perhaps because UCSF and UCLA created the best practice guidelines and template, it was a better fit for their culture and they had more institutional buy-in. Or because the educational lectures were similar, but not standardized across institutions, some lectures may have been more effective than others. However, when evaluating the postintervention notes at UCSD and Iowa, templated notes were found to be much more likely to score higher on the PDQI-9 than nontemplated notes, which serves as evidence of the efficacy of the note template.
Some of the strengths of this study include the relatively large sample size spanning 4 institutions and the use of 3 different assessment tools for grading progress note quality (general impression score, PDQI-9, and competency note questionnaire). An additional strength is our unique finding suggesting that note writing may be more efficient by removing, rather than adding, “efficiency functions.” There were several limitations of this study. Pre- and postintervention notes were examined at different points in the same academic year, thus certain domains may have improved as interns progressed in clinical skill and comfort with documentation, independent of our intervention.21 However, our analysis of postintervention notes across the same time period revealed that use of the template was strongly associated with higher quality, shorter notes and earlier completion time arguing that the effect seen was not merely intern experience. The poor interrater reliability is also a limitation. Although the PDQI-9 was previously validated, future use of the grading tool may require more rater training for calibration or more objective wording.23 The study was not blinded, and thus, bias may have falsely elevated postintervention scores; however, we attempted to minimize bias by incorporating a more objective yes/no competency questionnaire and by having each note scored by 3 graders. Other studies have attempted to address this form of bias by printing out notes and blinding the graders. This design, however, isolates the note from all other data in the medical record, making it difficult to assess domains such as accuracy and completeness. Our inclusion of objective outcomes such as note length and time of note completion help to mitigate some of the bias.
Future research can expand on the results of this study by introducing similar progress note interventions at other institutions and/or in nonacademic environments to validate the results and expand generalizability. Longer term follow-up would be useful to determine if these effects are transient or long lasting. Similarly, it would be interesting to determine if such results are sustained even after new interns start suggesting that institutional culture can be changed. Investigators could focus on similar projects to improve other notes that are particularly at a high risk for propagating false information, such as the History and Physical or Discharge Summary. Future research should also focus on outcomes data, including whether a more efficient note can allow housestaff to spend more time with patients, decrease patient length of stay, reduce clinical errors, and improve educational time for trainees. Lastly, we should determine if interventions such as this can mitigate the widespread frustrations with electronic documentation that are associated with physician and provider burnout.15,24 One would hope that the technology could be harnessed to improve provider productivity and be effectively integrated into comprehensive patient care.
Our research makes progress toward recommendations made by the American College of Physicians “to improve accuracy of information recorded and the value of information,” and develop automated tools that “enhance documentation quality without facilitating improper behaviors.”19 Institutions should consider developing internal best practices for clinical documentation and building structured note templates.19 Our research would suggest that, combined with a small educational intervention, such templates can make progress notes more accurate and succinct, make note writing more efficient, and be harnessed to improve quality metrics.
ACKNOWLEDGMENTS
The authors thank Michael Pfeffer, MD, and Sitaram Vangala, MS, for their contributions to and support of this research study and manuscript.
Disclosure: The authors declare no conflicts of interest.
1. Herzig SJ, Guess JR, Feinbloom DB, et al. Improving appropriateness of acid-suppressive medication use via computerized clinical decision support. J Hosp Med. 2015;10(1):41-45. PubMed
2. Nguyen OK, Makam AN, Clark C, et al. Predicting all-cause readmissions using electronic health record data from the entire hospitalization: Model development and comparison. J Hosp Med. 2016;11(7):473-480. PubMed
3. Donati A, Gabbanelli V, Pantanetti S, et al. The impact of a clinical information system in an intensive care unit. J Clin Monit Comput. 2008;22(1):31-36. PubMed
4. Schiff GD, Bates DW. Can electronic clinical documentation help prevent diagnostic errors? N Engl J Med. 2010;362(12):1066-1069. PubMed
5. Hartzband P, Groopman J. Off the record--avoiding the pitfalls of going electronic. N Engl J Med. 2008;358(16):1656-1658. PubMed
6. Hirschtick RE. A piece of my mind. Copy-and-paste. JAMA. 2006;295(20):2335-2336. PubMed
7. Hirschtick RE. A piece of my mind. John Lennon’s elbow. JAMA. 2012;308(5):463-464. PubMed
8. O’Donnell HC, Kaushal R, Barrón Y, Callahan MA, Adelman RD, Siegler EL. Physicians’ attitudes towards copy and pasting in electronic note writing. J Gen Intern Med. 2009;24(1):63-68. PubMed
9. Mahapatra P, Ieong E. Improving Documentation and Communication Using Operative Note Proformas. BMJ Qual Improv Rep. 2016;5(1):u209122.w3712. PubMed
10. Thomson DR, Baldwin MJ, Bellini MI, Silva MA. Improving the quality of operative notes for laparoscopic cholecystectomy: Assessing the impact of a standardized operation note proforma. Int J Surg. 2016;27:17-20. PubMed
11. Dean SM, Eickhoff JC, Bakel LA. The effectiveness of a bundled intervention to improve resident progress notes in an electronic health record. J Hosp Med. 2015;10(2):104-107. PubMed
12. Aylor M, Campbell EM, Winter C, Phillipi CA. Resident Notes in an Electronic Health Record: A Mixed-Methods Study Using a Standardized Intervention With Qualitative Analysis. Clin Pediatr (Phila). 2016;6(3):257-262.
13. Harris PA, Taylor R, Thielke R, Payne J, Gonzalez N, Conde JG. Research electronic data capture (REDCap)--a metadata-driven methodology and workflow process for providing translational research informatics support. J Biomed Inform. 2009;42(2):377-381. PubMed
14. Chi J, Kugler J, Chu IM, et al. Medical students and the electronic health record: ‘an epic use of time’. Am J Med. 2014;127(9):891-895. PubMed
15. Martin SA, Sinsky CA. The map is not the territory: medical records and 21st century practice. Lancet. 2016;388(10055):2053-2056. PubMed
16. Oxentenko AS, Manohar CU, McCoy CP, et al. Internal medicine residents’ computer use in the inpatient setting. J Grad Med Educ. 2012;4(4):529-532. PubMed
17. Mamykina L, Vawdrey DK, Hripcsak G. How Do Residents Spend Their Shift Time? A Time and Motion Study With a Particular Focus on the Use of Computers. Acad Med. 2016;91(6):827-832. PubMed
18. Chen L, Guo U, Illipparambil LC, et al. Racing Against the Clock: Internal Medicine Residents’ Time Spent On Electronic Health Records. J Grad Med Educ. 2016;8(1):39-44. PubMed
19. Kuhn T, Basch P, Barr M, Yackel T, Physicians MICotACo. Clinical documentation in the 21st century: executive summary of a policy position paper from the American College of Physicians. Ann Intern Med. 2015;162(4):301-303. PubMed
20. Treadwell JR, Lucas S, Tsou AY. Surgical checklists: a systematic review of impacts and implementation. BMJ Qual Saf. 2014;23(4):299-318. PubMed
21. Ko HC, Turner TJ, Finnigan MA. Systematic review of safety checklists for use by medical care teams in acute hospital settings--limited evidence of effectiveness. BMC Health Serv Res. 2011;11:211. PubMed
22. Diaz-Montes TP, Cobb L, Ibeanu OA, Njoku P, Gerardi MA. Introduction of checklists at daily progress notes improves patient care among the gynecological oncology service. J Patient Saf. 2012;8(4):189-193. PubMed
23. Stetson PD, Bakken S, Wrenn JO, Siegler EL. Assessing Electronic Note Quality Using the Physician Documentation Quality Instrument (PDQI-9). Appl Clin Inform. 2012;3(2):164-174. PubMed
24. Friedberg MW, Chen PG, Van Busum KR, et al. Factors affecting physician professional satisfaction and their implications for patient care, health systems, and health policy. Santa Monica, CA: RAND Corporation; 2013. PubMed
© 2018 Society of Hospital Medicine
Caregiver Perspectives on Communication During Hospitalization at an Academic Pediatric Institution: A Qualitative Study
Provision of high-quality, high-value medical care hinges upon effective communication. During a hospitalization, critical information is communicated between patients, caregivers, and providers multiple times each day. This can cause inconsistent and misinterpreted messages, leaving ample room for error.1 The Joint Commission notes that communication failures occurring between medical providers account for ~60% of all sentinel or serious adverse events that result in death or harm to a patient.2 Communication that occurs between patients and/or their caregivers and medical providers is also critically important. The content and consistency of this communication is highly valued by patients and providers and can affect patient outcomes during hospitalizations and during transitions to home.3,4 Still, the multifactorial, complex nature of communication in the pediatric inpatient setting is not well understood.5,6
During hospitalization, communication happens continuously during both daytime and nighttime hours. It also precedes the particularly fragile period of transition from hospital to home. Studies have shown that nighttime communication between caregivers and medical providers (ie, nurses and physicians), as well as caregivers’ perceptions of interactions that occur between nurses and physicians, may be closely linked to that caregiver’s satisfaction and perceived quality of care.6,7 Communication that occurs between inpatient and outpatient providers is also subject to barriers (eg, limited availability for direct communication)8-12; studies have shown that patient and/or caregiver satisfaction has also been tied to perceptions of this communication.13,14 Moreover, a caregiver’s ability to understand diagnoses and adhere to postdischarge care plans is intimately tied to communication during the hospitalization and at discharge. Although many improvement efforts have aimed to enhance communication during these vulnerable time periods,3,15,16 there remains much work to be done.1,10,12
The many facets and routes of communication, and the multiple stakeholders involved, make improvement efforts challenging. We believe that more effective communication strategies could result from a deeper understanding of how caregivers view communication successes and challenges during a hospitalization. We see this as key to developing meaningful interventions that are directed towards improving communication and, by extension, patient satisfaction and safety. Here, we sought to extend findings from a broader qualitative study17 by developing an in-depth understanding of communication issues experienced by families during their child’s hospitalization and during the transition to home.
METHODS
Setting
The analyses presented here emerged from the Hospital to Home Outcomes Study (H2O). The first objective of H2O was to explore the caregiver perspective on hospital-to-home transitions. Here, we present the results related to caregiver perspectives of communication, while broader results of our qualitative investigation have been published elsewhere.17 This objective informed the latter 2 aims of the H2O study, which were to modify an existing nurse-led transitional home visit (THV) program and to study the effectiveness of the modified THV on reutilization and patient-specific outcomes via a randomized control trial. The specifics of the H2O protocol and design have been presented elsewhere.18
H2O was approved by the Institutional Review Board at Cincinnati Children’s Hospital Medical Center (CCHMC), a free-standing, academic children’s hospital with ~600 inpatient beds. This teaching hospital has >800 total medical students, residents, and fellows. Approximately 8000 children are hospitalized annually at CCHMC for general pediatric conditions, with ~85% of such admissions staffed by hospitalists from the Division of Hospital Medicine. The division is composed of >40 providers who devote the majority of their clinical time to the hospital medicine service; 15 additional providers work on the hospital medicine service but have primary clinical responsibilities in another division.
Family-centered rounds (FCR) are the standard of care at CCHMC, involving family members at the bedside to discuss patient care plans and diagnoses with the medical team.19 On a typical day, a team conducting FCR is composed of 1 attending, 1 fellow, 2 to 3 pediatric residents, 2 to 3 medical students, a charge nurse or bedside nurse, and a pharmacist. Other ancillary staff, such as social workers, care coordinators, nurse practitioners, or dieticians, may also participate on rounds, particularly for children with greater medical complexity.
Population
Caregivers of children discharged with acute medical conditions were eligible for recruitment if they were English-speaking (we did not have access to interpreter services during focus groups/interviews), had a child admitted to 1 of 3 services (hospital medicine, neurology, or neurosurgery), and could attend a focus group within 30 days of the child’s discharge. The majority of participants had a child admitted to hospital medicine; however, caregivers with a generally healthy child admitted to either neurology or neurosurgery were eligible to participate in the study.
Study Design
As presented elsewhere,17,20 we used focus groups and individual in-depth interviews to generate consensus themes about patient and caregiver experiences during the transition from hospital to home. Because there is evidence suggesting that focus group participants are more willing to talk openly when among others of similar backgrounds, we stratified the sample by the family’s estimated socioeconomic status.21,22 Socioeconomic status was estimated by identifying the poverty rate in the census tract in which each participant lived. Census tracts, relatively homogeneous areas of ~4000 individuals, have been previously shown to effectively detect socioeconomic gradients.23-26 Here, we separated participants into 2 socioeconomically distinct groupings (those in census tracts where <15% or ≥15% of the population lived below the federal poverty level).26 This cut point ensured an equivalent number of eligible participants within each stratum and diversity within our sample.
Data Collection
Caregivers were recruited on the inpatient unit during their child’s hospitalization. Participants then returned to CCHMC facilities for the focus group within 30 days of discharge. Though efforts were made to enhance participation by scheduling sessions at multiple sites and during various days and times of the week, 4 sessions yielded just 1 participant; thus, the format for those became an individual interview. Childcare was provided, and participants received a gift card for their participation.
An open-ended, semistructured question guide,17 developed de novo by the research team, directed the discussion for focus groups and interviews. As data collection progressed, the question guide was adapted to incorporate new issues raised by participants. Questions broadly focused on aspects of the inpatient experience, discharge processes, and healthcare system and family factors thought to be most relevant to patient- and family-centered outcomes. Communication-related questions addressed information shared with families from the medical team about discharge, diagnoses, instructions, and care plans. An experienced moderator and qualitative research methodologist (SNS) used probes to further elucidate responses and expand discussion by participants. Sessions were held in private conference rooms, lasted ~90 minutes, were audiotaped, and were transcribed verbatim. Identifiers were stripped and transcripts were reviewed for accuracy. After conducting 11 focus groups (generally composed of 5-10 participants) and 4 individual interviews, the research team determined that theoretical saturation27 was achieved, and recruitment was suspended.
Data Analysis
An inductive, thematic approach was used for analysis.27 Transcripts were independently reviewed by a multidisciplinary team of 4 researchers, including 2 pediatricians (LGS and AFB), a clinical research coordinator (SAS), and a qualitative research methodologist (SNS). The study team identified emerging concepts and themes related to the transition from hospital to home; themes related to communication during hospitalization are presented here.
During the first phase of analysis, investigators independently read transcripts and later convened to identify and define initial concepts and themes. A preliminary codebook was then designed. Investigators continued to review and code transcripts independently, meeting regularly to discuss coding decisions collaboratively, resolving differences through consensus.28 As patterns in the data became apparent, the codebook was modified iteratively, adding, subtracting, and refining codes as needed and grouping related codes. Results were reviewed with key stakeholders, including parents, inpatient and outpatient pediatricians, and home health nurses, throughout the analytic process.27,28 Coded data were maintained in an electronic database accessible only to study personnel.
RESULTS
Participants
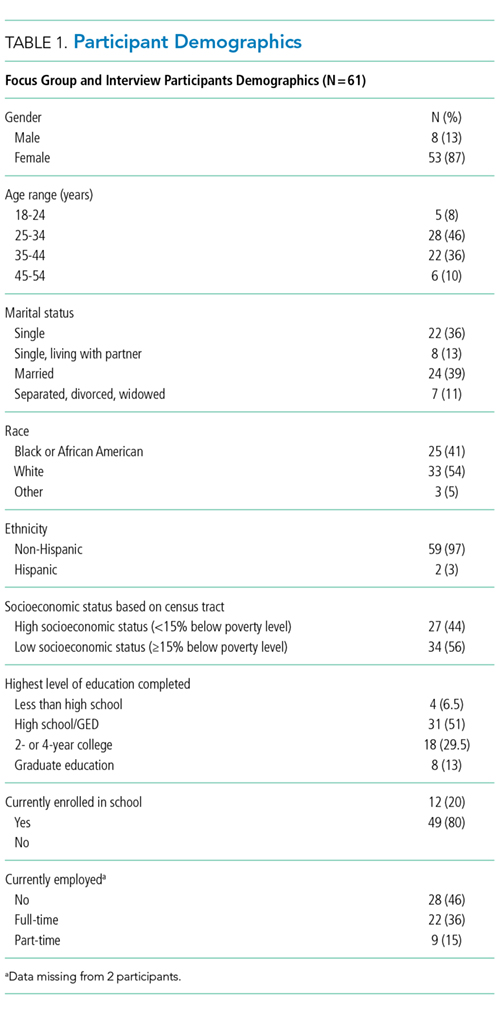
Resulting Themes
Analyses revealed the following 3 major communication-related themes with associated subthemes: (1) experiences that affect caregiver perceptions of communication between the inpatient medical team and families, (2) communication challenges for caregivers related to a teaching hospital environment, and (3) caregiver perceptions of communication between medical providers. Each theme (and subtheme) is explored below with accompanying verbatim quotes in the narrative and the tables.
Major Theme 1: Experiences that Affect Caregiver Perceptions of Communication Between the Inpatient Medical Team and Families
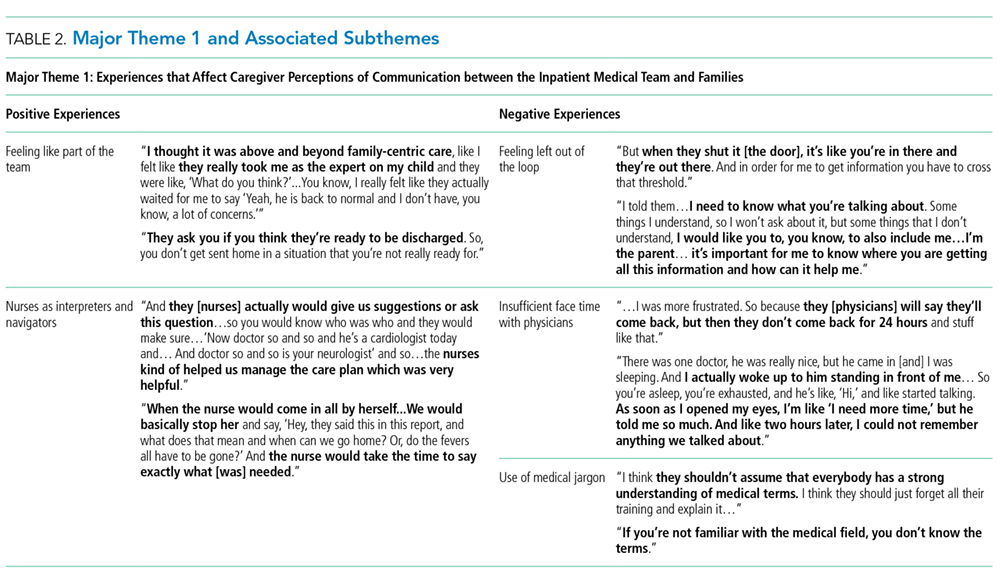
In contrast, some of the negative experiences shared by participants related to feeling excluded from discussions about their child’s care. One participant said, “They tell you…as much as they want to tell you. They don’t fully inform you on things.” Additionally, concerns were voiced about insufficient time for face-to-face discussions with physicians: “I forget what I have to say and it’s something really, really important…But now, my doctor is going, you can’t get the doctor back.” Finally, participants discussed how the use of medical jargon often made it more difficult to understand things, especially for those not in the medical field.
Major Theme 2: Communication Challenges for Caregivers Related to a Teaching Hospital Environment
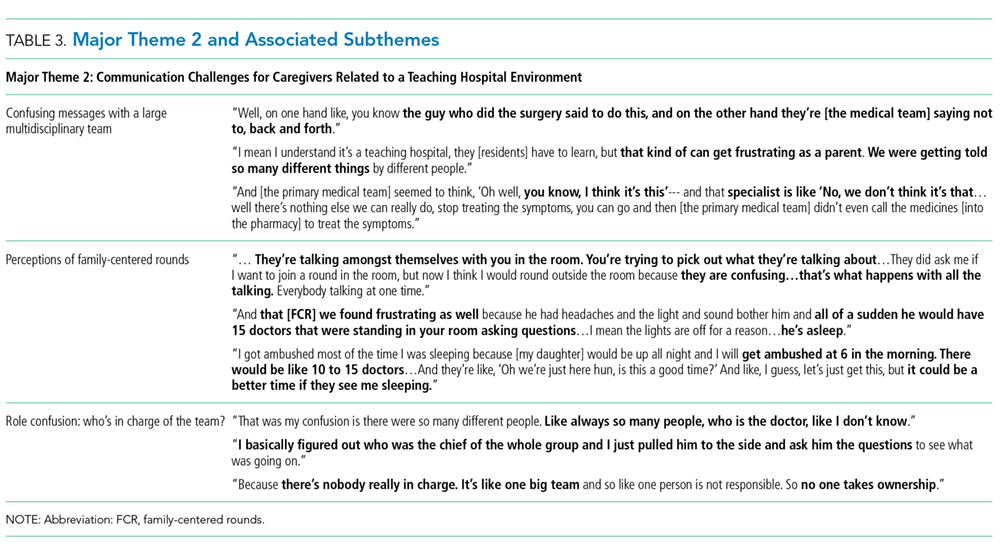
Major Theme 3: Caregiver Perceptions of Communication Between Medical Providers

Perceptions were not isolated to the inpatient setting. Based on their experiences, caregivers similarly described their sense of how inpatient and outpatient providers were communicating with each other. In some cases, it was clear that good communication, as perceived by the participant, had occurred in situations in which the primary care physician knew “everything” about the hospitalization when they saw the patient in follow-up. One participant described, “We didn’t even realize at the time, [the medical team] had actually called our doctor and filled them in on our situation, and we got [to the follow up visit]…He already knew the entire situation.” There were others, however, who shared their uncertainty about whether the information exchange about their child’s hospitalization had actually occurred. They, therefore, voiced apprehension around who to call for advice after discharge; would their outpatient provider have their child’s hospitalization history and be able to properly advise them?
DISCUSSION
Communication during a hospitalization and at transition from hospital to home happens in both formal and informal ways; it is a vital component of appropriate, effective patient care. When done poorly, it has the potential to negatively affect a patient’s safety, care, and key outcomes.2 During a hospitalization, the multifaceted nature of communication and multidisciplinary approach to care provision can create communication challenges and make fixing challenges difficult. In order to more comprehensively move toward mitigation, it is important to gather perspectives of key stakeholders, such as caregivers. Caregivers are an integral part of their child’s care during the hospitalization and particularly at home during their child’s recovery. They are also a valued member of the team, particularly in this era of family-centered care.19,29 The perspectives of the caregivers presented here identified both successes and challenges of their communication experiences with the medical team during their child’s hospitalization. These perspectives included experiences affecting perceptions of communication between the inpatient medical team and families; communication related to the teaching hospital environment, including confusing messages associated with large multidisciplinary teams, aspects of FCR, and confusion about medical team member roles; and caregivers’ perceptions of communication between providers in and out of the hospital, including types of communication caregivers observed or believed occurred between medical providers. We believe that these qualitative results are crucial to developing better, more targeted interventions to improve communication.
Maintaining a healthy and productive relationship with patients and their caregivers is critical to providing comprehensive and safe patient care. As supported in the literature, we found that when caregivers were included in conversations, they felt appreciated and valued; in addition, when answers were not directly shared by providers or there were lingering questions, nurses often served as “interpreters.”29,30 Indeed, nurses were seen as a critical touchpoint for many participants, individuals that could not only answer questions but also be a trusted source of information. Supporting such a relationship, and helping enhance the relationship between the family and other team members, may be particularly important considering the degree to which a hospitalization can stress a patient, caregiver, and family.31-34 Developing rapport with families and facilitating relationships with the inclusion of nursing during FCR can be particularly helpful. Though this can be challenging with the many competing priorities of medical providers and the fast-paced, acute nature of inpatient care, making an effort to include nursing staff on rounds can cut down on confusion and assist the family in understanding care plans. This, in turn, can minimize the stress associated with hospitalization and improve the patient and family experience.
While academic institutions’ resources and access to subspecialties are often thought to be advantageous, there are other challenges inherent to providing care in such complex environments. Some caregivers cited confusion related to large teams of providers with, to them, indistinguishable roles asking redundant questions. These experiences affected their perceptions of FCR, generally leading to a fixation on its overwhelming aspects. Certain caregivers highlighted that FCR caused them, and their child, to feel overwhelmed and more confused about the plan for the day. It is important to find ways to mitigate these feelings while simultaneously continuing to support the inclusion of caregivers during their child’s hospitalization and understanding of care plans. Some initiatives (in addition to including nursing on FCR as discussed above) focus on improving the ways in which providers communicate with families during rounds and throughout the day, seeking to decrease miscommunications and medical errors while also striving for better quality of care and patient/family satisfaction.35 Other initiatives seek to clarify identities and roles of the often large and confusing medical team. One such example of this is the development of a face sheet tool, which provides families with medical team members’ photos and role descriptions. Unaka et al.36 found that the use of the face sheet tool improved the ability of caregivers to correctly identify providers and their roles. Thinking beyond interventions at the bedside, it is also important to include caregivers on higher level committees within the institution, such as on family advisory boards and/or peer support groups, to inform systems-wide interventions that support the tenants of family-centered care.29 Efforts such as these are worth trialing in order to improve the patient and family experience and quality of communication.
Multiple studies have evaluated the challenges with ensuring consistent and useful handoffs across the inpatient-to-outpatient transition,8-10,12 but few have looked at it from the perspective of the caregiver.13 After leaving the hospital to care for their recovering child, caregivers often feel overwhelmed; they may want, or need, to rely on the support of others in the outpatient environment. This support can be enhanced when outpatient providers are intimately aware of what occurred during the hospitalization; trust erodes if this is not the case. Given the value caregivers place on this communication occurring and occurring well, interventions supporting this communication are critical. Furthermore, as providers, we should also inform families that communication with outpatient providers is happening. Examples of efforts that have worked to improve the quality and consistency of communication with outpatient providers include improving discharge summary documentation, ensuring timely faxing of documentation to outpatient providers, and reliably making phone calls to outpatient providers.37-39 These types of interventions seek to bridge the gap between inpatient and outpatient care and facilitate a smooth transfer of information in order to provide optimal quality of care and avoid undesired outcomes (eg, emergency department revisits, readmissions, medication errors, etc) and can be adopted by institutions to address the issue of communication between inpatient and outpatient providers.
We acknowledge limitations to our study. This was done at a single academic institution with only English-speaking participants. Thus, our results may not be reflective of caregivers of children cared for in different, more ethnically or linguistically diverse settings. The patient population at CCHMC, however, is diverse both demographically and clinically, which was reflected in the composition of our focus groups and interviews. Additionally, the inclusion of participants who received a nurse home visit after discharge may limit generalizability. However, only 4 participants had a nurse home visit; thus, the overwhelming majority of participants did not receive such an intervention. We also acknowledge that those willing to participate may have differed from nonparticipants, specifically sharing more positive experiences. We believe that our sampling strategy and use of an unbiased, nonhospital affiliated moderator minimized this possibility. Recall bias is possible, as participants were asked to reflect back on a discharge experience occurring in their past. We attempted to minimize this by holding sessions no more than 30 days from the day of discharge. Finally, we present data on caregivers’ perception of communication and not directly observed communication occurrences. Still, we expect that perception is powerful in and of itself, relevant to both outcomes and to interventions.
CONCLUSION
Communication during hospitalization influences how caregivers understand diagnoses and care plans. Communication perceived as effective fosters mutual understandings and positive relationships with the potential to result in better care and improved outcomes. Communication perceived as ineffective negatively affects experiences of patients and their caregivers and can adversely affect patient outcomes. Learning from caregivers’ experiences with communication during their child’s hospitalization can help identify modifiable factors and inform strategies to improve communication, support families through hospitalization, and facilitate a smooth reentry home.
ACKNOWLEDGMENTS
This manuscript is submitted on behalf of the H2O study group: Katherine A. Auger, MD, MSc, JoAnne Bachus, BSN, Monica L. Borell, BSN, Lenisa V. Chang, MA, PhD, Jennifer M. Gold, BSN, Judy A. Heilman, RN, Joseph A. Jabour, BS, Jane C. Khoury, PhD, Margo J. Moore, BSN, CCRP, Rita H. Pickler, PNP, PhD, Anita N. Shah, DO, Angela M. Statile, MD, MEd, Heidi J. Sucharew, PhD, Karen P. Sullivan, BSN, Heather L. Tubbs-Cooley, RN, PhD, Susan Wade-Murphy, MSN, and Christine M. White, MD, MAT.
Disclaimer
All statements in this report, including its findings and conclusions, are solely those of the authors and do not necessarily represent the views of the Patient-Centered Outcomes Research Institute (PCORI), its Board of Governors, or Methodology Committee.
Disclosure
This work was (partially) supported through a Patient-Centered Outcomes Research Institute (PCORI) Award (HIS-1306-0081). The authors have no financial relationships relevant to this article to disclose. The authors have no conflicts of interest to disclose.
1. Riesenberg LA, Leitzsch J, Massucci JL, et al. Residents’ and Attending Physicians’ Handoffs: A Systematic Review of the Literature. Acad Med. 2009;84(12):1775-1787. PubMed
6. Comp D. Improving parent satisfaction by sharing the inpatient daily plan of care: an evidence review with implications for practice and research. Pediatr Nurs. 2011;37(5):237-242. PubMed
30. Latta LC, Dick R, Parry C, Tamura GS. Parental responses to involvement in rounds on a pediatric inpatient unit at a teaching hospital: a qualitative study. Acad Med. 2008;83(3):292-297. PubMed
Provision of high-quality, high-value medical care hinges upon effective communication. During a hospitalization, critical information is communicated between patients, caregivers, and providers multiple times each day. This can cause inconsistent and misinterpreted messages, leaving ample room for error.1 The Joint Commission notes that communication failures occurring between medical providers account for ~60% of all sentinel or serious adverse events that result in death or harm to a patient.2 Communication that occurs between patients and/or their caregivers and medical providers is also critically important. The content and consistency of this communication is highly valued by patients and providers and can affect patient outcomes during hospitalizations and during transitions to home.3,4 Still, the multifactorial, complex nature of communication in the pediatric inpatient setting is not well understood.5,6
During hospitalization, communication happens continuously during both daytime and nighttime hours. It also precedes the particularly fragile period of transition from hospital to home. Studies have shown that nighttime communication between caregivers and medical providers (ie, nurses and physicians), as well as caregivers’ perceptions of interactions that occur between nurses and physicians, may be closely linked to that caregiver’s satisfaction and perceived quality of care.6,7 Communication that occurs between inpatient and outpatient providers is also subject to barriers (eg, limited availability for direct communication)8-12; studies have shown that patient and/or caregiver satisfaction has also been tied to perceptions of this communication.13,14 Moreover, a caregiver’s ability to understand diagnoses and adhere to postdischarge care plans is intimately tied to communication during the hospitalization and at discharge. Although many improvement efforts have aimed to enhance communication during these vulnerable time periods,3,15,16 there remains much work to be done.1,10,12
The many facets and routes of communication, and the multiple stakeholders involved, make improvement efforts challenging. We believe that more effective communication strategies could result from a deeper understanding of how caregivers view communication successes and challenges during a hospitalization. We see this as key to developing meaningful interventions that are directed towards improving communication and, by extension, patient satisfaction and safety. Here, we sought to extend findings from a broader qualitative study17 by developing an in-depth understanding of communication issues experienced by families during their child’s hospitalization and during the transition to home.
METHODS
Setting
The analyses presented here emerged from the Hospital to Home Outcomes Study (H2O). The first objective of H2O was to explore the caregiver perspective on hospital-to-home transitions. Here, we present the results related to caregiver perspectives of communication, while broader results of our qualitative investigation have been published elsewhere.17 This objective informed the latter 2 aims of the H2O study, which were to modify an existing nurse-led transitional home visit (THV) program and to study the effectiveness of the modified THV on reutilization and patient-specific outcomes via a randomized control trial. The specifics of the H2O protocol and design have been presented elsewhere.18
H2O was approved by the Institutional Review Board at Cincinnati Children’s Hospital Medical Center (CCHMC), a free-standing, academic children’s hospital with ~600 inpatient beds. This teaching hospital has >800 total medical students, residents, and fellows. Approximately 8000 children are hospitalized annually at CCHMC for general pediatric conditions, with ~85% of such admissions staffed by hospitalists from the Division of Hospital Medicine. The division is composed of >40 providers who devote the majority of their clinical time to the hospital medicine service; 15 additional providers work on the hospital medicine service but have primary clinical responsibilities in another division.
Family-centered rounds (FCR) are the standard of care at CCHMC, involving family members at the bedside to discuss patient care plans and diagnoses with the medical team.19 On a typical day, a team conducting FCR is composed of 1 attending, 1 fellow, 2 to 3 pediatric residents, 2 to 3 medical students, a charge nurse or bedside nurse, and a pharmacist. Other ancillary staff, such as social workers, care coordinators, nurse practitioners, or dieticians, may also participate on rounds, particularly for children with greater medical complexity.
Population
Caregivers of children discharged with acute medical conditions were eligible for recruitment if they were English-speaking (we did not have access to interpreter services during focus groups/interviews), had a child admitted to 1 of 3 services (hospital medicine, neurology, or neurosurgery), and could attend a focus group within 30 days of the child’s discharge. The majority of participants had a child admitted to hospital medicine; however, caregivers with a generally healthy child admitted to either neurology or neurosurgery were eligible to participate in the study.
Study Design
As presented elsewhere,17,20 we used focus groups and individual in-depth interviews to generate consensus themes about patient and caregiver experiences during the transition from hospital to home. Because there is evidence suggesting that focus group participants are more willing to talk openly when among others of similar backgrounds, we stratified the sample by the family’s estimated socioeconomic status.21,22 Socioeconomic status was estimated by identifying the poverty rate in the census tract in which each participant lived. Census tracts, relatively homogeneous areas of ~4000 individuals, have been previously shown to effectively detect socioeconomic gradients.23-26 Here, we separated participants into 2 socioeconomically distinct groupings (those in census tracts where <15% or ≥15% of the population lived below the federal poverty level).26 This cut point ensured an equivalent number of eligible participants within each stratum and diversity within our sample.
Data Collection
Caregivers were recruited on the inpatient unit during their child’s hospitalization. Participants then returned to CCHMC facilities for the focus group within 30 days of discharge. Though efforts were made to enhance participation by scheduling sessions at multiple sites and during various days and times of the week, 4 sessions yielded just 1 participant; thus, the format for those became an individual interview. Childcare was provided, and participants received a gift card for their participation.
An open-ended, semistructured question guide,17 developed de novo by the research team, directed the discussion for focus groups and interviews. As data collection progressed, the question guide was adapted to incorporate new issues raised by participants. Questions broadly focused on aspects of the inpatient experience, discharge processes, and healthcare system and family factors thought to be most relevant to patient- and family-centered outcomes. Communication-related questions addressed information shared with families from the medical team about discharge, diagnoses, instructions, and care plans. An experienced moderator and qualitative research methodologist (SNS) used probes to further elucidate responses and expand discussion by participants. Sessions were held in private conference rooms, lasted ~90 minutes, were audiotaped, and were transcribed verbatim. Identifiers were stripped and transcripts were reviewed for accuracy. After conducting 11 focus groups (generally composed of 5-10 participants) and 4 individual interviews, the research team determined that theoretical saturation27 was achieved, and recruitment was suspended.
Data Analysis
An inductive, thematic approach was used for analysis.27 Transcripts were independently reviewed by a multidisciplinary team of 4 researchers, including 2 pediatricians (LGS and AFB), a clinical research coordinator (SAS), and a qualitative research methodologist (SNS). The study team identified emerging concepts and themes related to the transition from hospital to home; themes related to communication during hospitalization are presented here.
During the first phase of analysis, investigators independently read transcripts and later convened to identify and define initial concepts and themes. A preliminary codebook was then designed. Investigators continued to review and code transcripts independently, meeting regularly to discuss coding decisions collaboratively, resolving differences through consensus.28 As patterns in the data became apparent, the codebook was modified iteratively, adding, subtracting, and refining codes as needed and grouping related codes. Results were reviewed with key stakeholders, including parents, inpatient and outpatient pediatricians, and home health nurses, throughout the analytic process.27,28 Coded data were maintained in an electronic database accessible only to study personnel.
RESULTS
Participants
Resulting Themes
Analyses revealed the following 3 major communication-related themes with associated subthemes: (1) experiences that affect caregiver perceptions of communication between the inpatient medical team and families, (2) communication challenges for caregivers related to a teaching hospital environment, and (3) caregiver perceptions of communication between medical providers. Each theme (and subtheme) is explored below with accompanying verbatim quotes in the narrative and the tables.
Major Theme 1: Experiences that Affect Caregiver Perceptions of Communication Between the Inpatient Medical Team and Families
In contrast, some of the negative experiences shared by participants related to feeling excluded from discussions about their child’s care. One participant said, “They tell you…as much as they want to tell you. They don’t fully inform you on things.” Additionally, concerns were voiced about insufficient time for face-to-face discussions with physicians: “I forget what I have to say and it’s something really, really important…But now, my doctor is going, you can’t get the doctor back.” Finally, participants discussed how the use of medical jargon often made it more difficult to understand things, especially for those not in the medical field.
Major Theme 2: Communication Challenges for Caregivers Related to a Teaching Hospital Environment
Major Theme 3: Caregiver Perceptions of Communication Between Medical Providers
Perceptions were not isolated to the inpatient setting. Based on their experiences, caregivers similarly described their sense of how inpatient and outpatient providers were communicating with each other. In some cases, it was clear that good communication, as perceived by the participant, had occurred in situations in which the primary care physician knew “everything” about the hospitalization when they saw the patient in follow-up. One participant described, “We didn’t even realize at the time, [the medical team] had actually called our doctor and filled them in on our situation, and we got [to the follow up visit]…He already knew the entire situation.” There were others, however, who shared their uncertainty about whether the information exchange about their child’s hospitalization had actually occurred. They, therefore, voiced apprehension around who to call for advice after discharge; would their outpatient provider have their child’s hospitalization history and be able to properly advise them?
DISCUSSION
Communication during a hospitalization and at transition from hospital to home happens in both formal and informal ways; it is a vital component of appropriate, effective patient care. When done poorly, it has the potential to negatively affect a patient’s safety, care, and key outcomes.2 During a hospitalization, the multifaceted nature of communication and multidisciplinary approach to care provision can create communication challenges and make fixing challenges difficult. In order to more comprehensively move toward mitigation, it is important to gather perspectives of key stakeholders, such as caregivers. Caregivers are an integral part of their child’s care during the hospitalization and particularly at home during their child’s recovery. They are also a valued member of the team, particularly in this era of family-centered care.19,29 The perspectives of the caregivers presented here identified both successes and challenges of their communication experiences with the medical team during their child’s hospitalization. These perspectives included experiences affecting perceptions of communication between the inpatient medical team and families; communication related to the teaching hospital environment, including confusing messages associated with large multidisciplinary teams, aspects of FCR, and confusion about medical team member roles; and caregivers’ perceptions of communication between providers in and out of the hospital, including types of communication caregivers observed or believed occurred between medical providers. We believe that these qualitative results are crucial to developing better, more targeted interventions to improve communication.
Maintaining a healthy and productive relationship with patients and their caregivers is critical to providing comprehensive and safe patient care. As supported in the literature, we found that when caregivers were included in conversations, they felt appreciated and valued; in addition, when answers were not directly shared by providers or there were lingering questions, nurses often served as “interpreters.”29,30 Indeed, nurses were seen as a critical touchpoint for many participants, individuals that could not only answer questions but also be a trusted source of information. Supporting such a relationship, and helping enhance the relationship between the family and other team members, may be particularly important considering the degree to which a hospitalization can stress a patient, caregiver, and family.31-34 Developing rapport with families and facilitating relationships with the inclusion of nursing during FCR can be particularly helpful. Though this can be challenging with the many competing priorities of medical providers and the fast-paced, acute nature of inpatient care, making an effort to include nursing staff on rounds can cut down on confusion and assist the family in understanding care plans. This, in turn, can minimize the stress associated with hospitalization and improve the patient and family experience.
While academic institutions’ resources and access to subspecialties are often thought to be advantageous, there are other challenges inherent to providing care in such complex environments. Some caregivers cited confusion related to large teams of providers with, to them, indistinguishable roles asking redundant questions. These experiences affected their perceptions of FCR, generally leading to a fixation on its overwhelming aspects. Certain caregivers highlighted that FCR caused them, and their child, to feel overwhelmed and more confused about the plan for the day. It is important to find ways to mitigate these feelings while simultaneously continuing to support the inclusion of caregivers during their child’s hospitalization and understanding of care plans. Some initiatives (in addition to including nursing on FCR as discussed above) focus on improving the ways in which providers communicate with families during rounds and throughout the day, seeking to decrease miscommunications and medical errors while also striving for better quality of care and patient/family satisfaction.35 Other initiatives seek to clarify identities and roles of the often large and confusing medical team. One such example of this is the development of a face sheet tool, which provides families with medical team members’ photos and role descriptions. Unaka et al.36 found that the use of the face sheet tool improved the ability of caregivers to correctly identify providers and their roles. Thinking beyond interventions at the bedside, it is also important to include caregivers on higher level committees within the institution, such as on family advisory boards and/or peer support groups, to inform systems-wide interventions that support the tenants of family-centered care.29 Efforts such as these are worth trialing in order to improve the patient and family experience and quality of communication.
Multiple studies have evaluated the challenges with ensuring consistent and useful handoffs across the inpatient-to-outpatient transition,8-10,12 but few have looked at it from the perspective of the caregiver.13 After leaving the hospital to care for their recovering child, caregivers often feel overwhelmed; they may want, or need, to rely on the support of others in the outpatient environment. This support can be enhanced when outpatient providers are intimately aware of what occurred during the hospitalization; trust erodes if this is not the case. Given the value caregivers place on this communication occurring and occurring well, interventions supporting this communication are critical. Furthermore, as providers, we should also inform families that communication with outpatient providers is happening. Examples of efforts that have worked to improve the quality and consistency of communication with outpatient providers include improving discharge summary documentation, ensuring timely faxing of documentation to outpatient providers, and reliably making phone calls to outpatient providers.37-39 These types of interventions seek to bridge the gap between inpatient and outpatient care and facilitate a smooth transfer of information in order to provide optimal quality of care and avoid undesired outcomes (eg, emergency department revisits, readmissions, medication errors, etc) and can be adopted by institutions to address the issue of communication between inpatient and outpatient providers.
We acknowledge limitations to our study. This was done at a single academic institution with only English-speaking participants. Thus, our results may not be reflective of caregivers of children cared for in different, more ethnically or linguistically diverse settings. The patient population at CCHMC, however, is diverse both demographically and clinically, which was reflected in the composition of our focus groups and interviews. Additionally, the inclusion of participants who received a nurse home visit after discharge may limit generalizability. However, only 4 participants had a nurse home visit; thus, the overwhelming majority of participants did not receive such an intervention. We also acknowledge that those willing to participate may have differed from nonparticipants, specifically sharing more positive experiences. We believe that our sampling strategy and use of an unbiased, nonhospital affiliated moderator minimized this possibility. Recall bias is possible, as participants were asked to reflect back on a discharge experience occurring in their past. We attempted to minimize this by holding sessions no more than 30 days from the day of discharge. Finally, we present data on caregivers’ perception of communication and not directly observed communication occurrences. Still, we expect that perception is powerful in and of itself, relevant to both outcomes and to interventions.
CONCLUSION
Communication during hospitalization influences how caregivers understand diagnoses and care plans. Communication perceived as effective fosters mutual understandings and positive relationships with the potential to result in better care and improved outcomes. Communication perceived as ineffective negatively affects experiences of patients and their caregivers and can adversely affect patient outcomes. Learning from caregivers’ experiences with communication during their child’s hospitalization can help identify modifiable factors and inform strategies to improve communication, support families through hospitalization, and facilitate a smooth reentry home.
ACKNOWLEDGMENTS
This manuscript is submitted on behalf of the H2O study group: Katherine A. Auger, MD, MSc, JoAnne Bachus, BSN, Monica L. Borell, BSN, Lenisa V. Chang, MA, PhD, Jennifer M. Gold, BSN, Judy A. Heilman, RN, Joseph A. Jabour, BS, Jane C. Khoury, PhD, Margo J. Moore, BSN, CCRP, Rita H. Pickler, PNP, PhD, Anita N. Shah, DO, Angela M. Statile, MD, MEd, Heidi J. Sucharew, PhD, Karen P. Sullivan, BSN, Heather L. Tubbs-Cooley, RN, PhD, Susan Wade-Murphy, MSN, and Christine M. White, MD, MAT.
Disclaimer
All statements in this report, including its findings and conclusions, are solely those of the authors and do not necessarily represent the views of the Patient-Centered Outcomes Research Institute (PCORI), its Board of Governors, or Methodology Committee.
Disclosure
This work was (partially) supported through a Patient-Centered Outcomes Research Institute (PCORI) Award (HIS-1306-0081). The authors have no financial relationships relevant to this article to disclose. The authors have no conflicts of interest to disclose.
1. Riesenberg LA, Leitzsch J, Massucci JL, et al. Residents’ and Attending Physicians’ Handoffs: A Systematic Review of the Literature. Acad Med. 2009;84(12):1775-1787. PubMed
6. Comp D. Improving parent satisfaction by sharing the inpatient daily plan of care: an evidence review with implications for practice and research. Pediatr Nurs. 2011;37(5):237-242. PubMed
30. Latta LC, Dick R, Parry C, Tamura GS. Parental responses to involvement in rounds on a pediatric inpatient unit at a teaching hospital: a qualitative study. Acad Med. 2008;83(3):292-297. PubMed
© 2018 Society of Hospital Medicine
Perceptions of Tanning Risk Among Melanoma Patients With a History of Indoor Tanning
The incidence of melanoma is increasing at a rate greater than any other cancer,1 possibly due to the increasing use of indoor tanning devices. These devices emit unnaturally high levels of UVA and low levels of UVA and UVB rays.2 The risks of using these devices include increased incidence of melanoma (3438 cases attributed to indoor tanning in 2008) and keratinocytes cancer (increased risk of squamous cell carcinoma by 67% and basal cell carcinoma by 29%), severe sunburns (61.1% of female users and 44.6% of male users have reported sunburns), and aggravation of underlying disorders such as systemic lupus erythematosus.3-5
The literature varies in its explanation of how indoor tanning increases the risk of developing melanoma. Some authors suggest it is due to increased frequency of use, duration of sessions, and years of using tanning devices.1,6 Others suggest the increased cancer risk is the result of starting to tan at an earlier age.2,3,6-10 There is conflicting literature on the level of increased risk of melanoma in those who tan indoors at a young age (<35 years). Although the estimated rate of increased skin cancer risk varies, with rates up to 75% compared to nonusers, nearly all sources support an increased rate.6 Despite the growing body of knowledge that indoor tanning is dangerous, as well as the academic publication of these risks (eg, carcinogenesis, short-term and long-term eye injury, burns, UV sensitivity when combined with certain medications), teenagers in the United States and affluent countries appear to disregard the risks of tanning.11
Tanning companies have promoted the misconception that only UVB rays cause cell damage and UVA rays, which the devices emit, result in “damage-free” or “safe” tans.2,3 Until 2013, indoor tanning devices were classified by the US Food and Drug Administration (FDA) as class I, indicating that they are safe in terms of electrical shock. Many indoor tanning facilities have promoted the FDA “safe” label without clarifying that the safety indications only referred to electrical-shock potential. Nonetheless, it is known now that these devices, which emit high UVA and low UVB rays, promote melanoma, nonmelanoma skin cancers, and severe sunburns, as well as aggravate existing conditions (eg, systemic lupus erythematosus).4 As a result of an unacceptably high incidence of these disease complications, a 2014 FDA regulation categorized tanning beds as class II, requiring that tanning bed users be informed of the risk of skin cancer in an effort to reverse the growing trend of indoor tanning.12 Despite these regulatory interventions, it is not clear if this knowledge of cancer risk deters patients from indoor tanning.
The purpose of this study was to investigate the patients’ perspective on indoor tanning behaviors as associated with the severity of their melanoma and the time frame in which they were diagnosed as well as their perceived views on the safety of indoor tanning and the frequency in which they continue to tan indoors. This information is highly relevant in helping to determine if requiring a warning of the risk of skin cancer will deter patients from this unhealthy habit, especially given recent reclassification of sunbeds as class II by the FDA. Additional insights from these data may clarify if indoor tanning decreases the time frame in which melanoma is diagnosed or increases the severity of the resulting melanoma. Moreover, it will help elucidate whether or not the age at which indoor tanning is initiated affects the time frame to melanoma onset and corresponding severity.
Methods
An original unvalidated online survey was conducted worldwide via a link distributed to the following supporting institutions: Advanced Dermatology & Cosmetic Surgery, Ameriderm Research, Melanoma Research Foundation (a melanoma patient advocacy group), Florida State University Department of Dermatology, Moffitt Cancer Center Cutaneous Oncology Program, Cleveland Clinic, Ohio State University Division of Medical Oncology, Harvard Medical School Department of Dermatology, The University of Texas MD Anderson Cancer Center Department of Dermatology, University of Colorado Department of Dermatology, and Northwestern University Department of Dermatology. However, there was not confirmation that all of these institutions promoted the survey. Additionally, respondents were recruited through patient advocacy groups and social media sites including Facebook, Twitter, LinkedIn, Tumblr, and Instagram. The patient advocacy groups and social media sites invited participation through recruitment announcements, including DermNetNZ (a global dermatology patient information site), with additional help from the International Federation of Dermatology Clinical Trial Network.
The survey was restricted to those who were self-identified as 18 years or older and who self-reported a diagnosis of melanoma following the use of indoor tanning devices. The survey was hosted by SurveyMonkey, which allowed consent to be obtained and responses to remain anonymous. Access to the survey was sponsored by the Basal Cell Carcinoma Nevus Syndrome Life Support Network. The University of Central Florida (Orlando, Florida) institutional review board reviewed and approved this study as exempt human research.
Survey responses collected from January 2014 to June 2015 were analyzed herein. The survey contained 58 questions and was divided into different topics including indoor tanning background (eg, states/countries in which participants tanned indoors, age when they first tanned, frequency of tanning), consenting process (eg, length, did someone review the consent with participants, what was contained in the consent), indoor tanning and melanoma (eg, how long after tanning did melanoma develop, age at development, location of melanoma), indoor tanning postmelanoma (eg, did participants tan after diagnosis and why), and other risk factors (eg, did participants smoke or drink pre- or postmelanoma).
Statistical Analysis
The data consist of both categorical and continuous variables. The categorical variables included age (<35 years or ≥35 years), frequency of indoor tanning (≤1 time weekly or >1 time weekly), and onset of melanoma diagnosis (within or after 5 years
Difference in proportions among groups, age, frequency of tanning, onset of melanoma diagnosis within or after 5 years of starting indoor tanning, and knowledge of cancer risks was tested for significance using the χ² test. Reported P values were 2-tailed, corresponding with a significance level of P<.05. All data were analyzed using SPSS (version 21.0). All statistical analyses were conducted independent of the participants’ sex.
Results
Of the 454 participants who accessed the survey, 448 were analyzed in this study; 6 participants did not complete the questionnaire. Both males and females were analyzed: 289 females, 12 males, and 153 who did not report gender. The age range of participants was 18 to 69 years. The age at start of indoor tanning ranged from 8 to 54 years, with a mean of 22 years. Additional participant characteristics are described in Table 1. The mean frequency of indoor tanning was reported as 2 times weekly. When participants were asked if they were warned of the risk of skin cancer, 21.5% reported yes while 78.4% reported not being told of the risk. This knowledge was compared to their frequency of indoor tanning. Having the knowledge of the risk of skin cancer had no influence on their frequency of indoor tanning (Table 2).
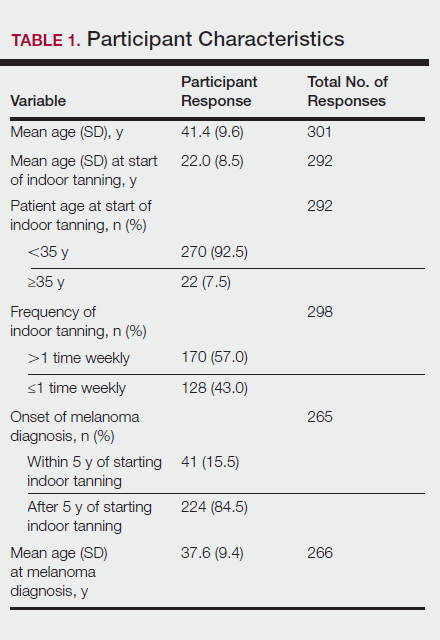
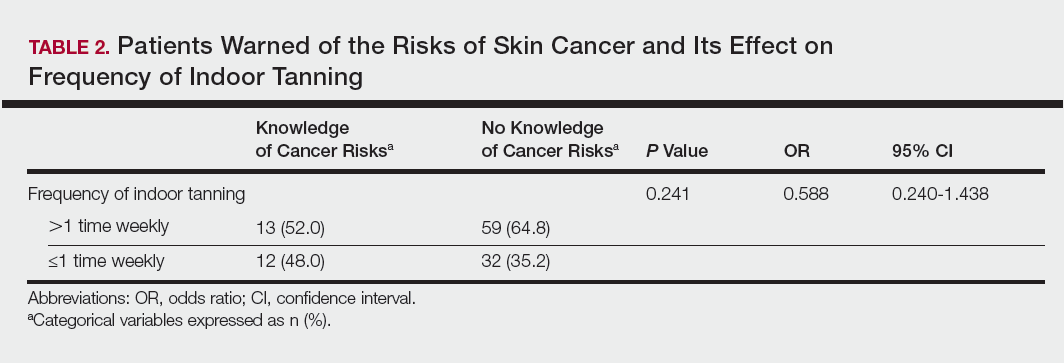
Among responders, those who perceived indoor tanning as safer than outdoor tanning tanned indoors more frequently than those who do not (Spearman r=−0.224; P<.05)(Table 3). The frequency of indoor tanning was divided into those who tanned indoors more than once weekly and those who tanned indoors once a week or less. This study showed that the frequency of indoor tanning had no effect on the latency time between the commencement of indoor tanning and diagnosis of melanoma (Table 4). The time frame from the onset of melanoma diagnosis also was compared to the age at which the participants started to tan indoors. Age was divided into those younger than 35 years and those 35 years and older. There was no correlation between the age when indoor tanning began and the time frame in which the melanoma was diagnosed (eTable).
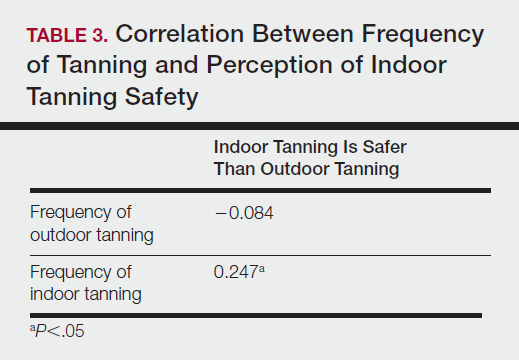
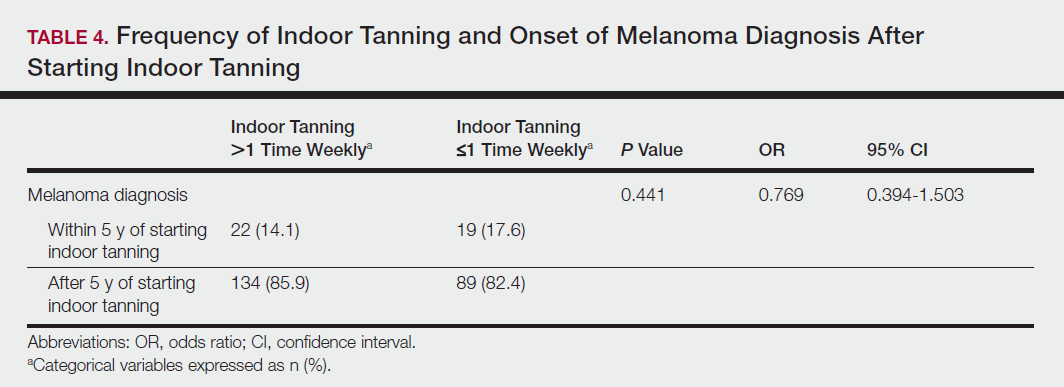
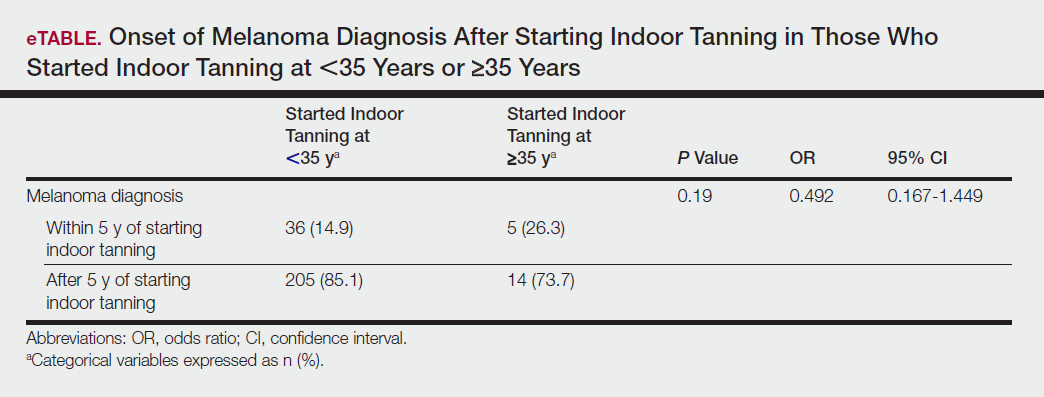
Table 5 shows the correlations between indoor tanning behaviors and melanoma characteristics. Those who started indoor tanning at an earlier age were diagnosed with melanoma at an earlier age compared to those who started indoor tanning later in life (r=0.549; P<.01). Moreover, those who started indoor tanning at a later age reported being diagnosed with a melanoma of greater Breslow depth (r=0.173; P<.01). Those who reported being diagnosed with a greater Breslow depth also reported a higher Clark level (r=0.608; P<.01). Among responders, those who more frequently tanned indoors also reported greater frequency of outdoor tanning (r=0.197; P<.01). This study showed no correlation between the age at melanoma diagnosis and the frequency of indoor (r=0.004; P>.05 not significant) or outdoor (r=0.093; P>.05 not significant) tanning. Having the knowledge of the risk of skin cancer had no relationship on the frequency of indoor tanning (r=−0.04; P>.05 not significant).
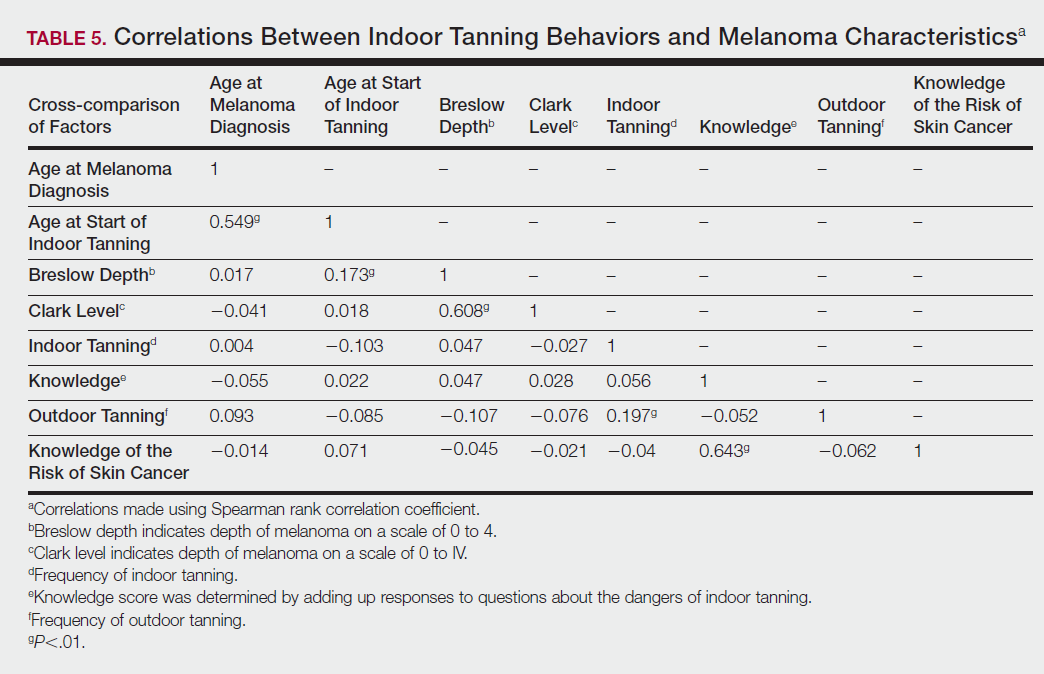
Comment
Thirty million Americans utilize indoor tanning devices at least once a year.13 UVA light comprises the majority of the spectrum used by indoor tanning devices, with a fraction (<5%) being UVB light. Until recently, UVB light was the only solar spectrum considered carcinogenic. In 2009, the International Agency for Research on Cancer classified the whole spectrum as carcinogenic to humans.5,11 Despite this evidence, indoor tanning facilities have promoted indoor tanning as damage free.3 The goal of this study was to collect the patient perspective on the safety of indoor tanning, indoor tanning behaviors, time frame of onset of melanoma, and the severity (ie, Breslow depth) of those melanomas.
Melanoma is the most prevalent cancer in females aged 25 to 29 years.3 The median age of diagnosis of melanoma (with and without the use of indoor tanning devices) is approximately 60 years14 versus our study, which found the average age at diagnosis was 37.6 years. Our findings are consistent with other literature in that those who start indoor tanning earlier (<35 years of age) develop melanoma at an earlier age.14,15 Cust et al14 also promoted the idea that patients develop melanoma earlier because younger individuals are more biologically susceptible to the carcinogenic effects of artificial UV light. However, our study found that those who started indoor tanning at an older age reported being diagnosed with a melanoma of greater Breslow depth, seemingly incongruent with the aforementioned hypothesis. One limitation is the age range for this research sample (18–69 years). The young age range may be attributable to the recruitment through social media, which is geared toward a younger population. Additionally, indoor tanning is a relatively new phenomenon practiced since the 1980s,2 which may contribute to the younger sample size. However, 2.7 billion individuals use social media worldwide with 40% of those older than 65 years on social media.16
Prior research has shown that those who start indoor tanning before the age of 35 years have a 75% increased risk of developing melanoma.14 Another study also has suggested that UVA-rich sunlamps may shorten the latency period for induction of melanoma and nonmelanoma skin cancers.3 Our study used similar age cutoffs in concluding that there was no earlier onset of melanoma diagnosis between those who started indoor tanning before the age of 35 years and those who started at the age of 35 years or older. Limitations include that our study is cross-sectional, and therefore time course cannot be established. Also, survey responses were self-reported, allowing the possibility of recall bias.
A plethora of research has been conducted to determine if there is a connection between the use of indoor tanning devices and developing melanoma. Cust et al14 suggested the risk of melanoma was 41% higher for those who had ever used a sunbed in comparison to those who had not. Other studies describe the difficulty in making the connection between indoor tanning and melanoma, as those who more frequently tan indoors also more frequently tan outdoors,11 as suggested by this study. However, there is a paucity of literature on the patients’ perspectives on the safety of indoor tanning. This study determined that those who more frequently tan indoors believed that indoor tanning is safer than outdoor tanning. With this altered perception promoted by the indoor tanning industry, the FDA has added a warning label to all indoor tanning devices about the risk of skin cancer. Our study revealed that having the knowledge of the risk of skin cancer had no influence on the frequency of indoor tanning. This concerning finding highlights a pressing need for an alternative approach to increase awareness of the harmful consequences that accompany indoor tanning. Further studies may elaborate on potential effective methods and messages to relate to an indoor tanning population comprised mostly of young females.
Acknowledgments
Supported and funded by the Basal Cell Carcinoma Nevus Syndrome Life Support Network. This research project was completed as part of the FIRE Module at the University of Central Florida, College of Medicine. We thank the FIRE Module faculty and staff for their assistance with this project.
- Fisher DE, James WD. Indoor tanning—science, behavior, and policy. N Engl J Med. 2010;363:901-903.
- Boniol M, Autier P, Boyle P, et al. Cutaneous melanoma attributable to sunbed use: systematic review and meta-analysis. BMJ. 2012;345:e4757.
- Coelho SG, Hearing VJ. UVA tanning is involved in the increased incidence of skin cancers in fair-skinned young women. Pigment Cell Melanoma Res. 2010;23:57-63.
- Klein RS, Sayre RM, Dowdy JC, et al. The risk of ultraviolet radiation exposure from indoor lamps in lupus erythematosus. Autoimmun Rev. 2009;8:320-324.
- O’Sullivan NA, Tait CP. Tanning bed and nail lamp use and the risk of cutaneous malignancy: a review of the literature. Australas J Dermatol. 2014;55:99-106.
- Schmidt CW. UV radiation and skin cancer: the science behind age restrictions for tanning beds. Environ Health Perspect. 2012;120:a308-a313.
- Lazovich D, Vogel RI, Berwick M, et al. Indoor tanning and risk of melanoma: a case-control study in a highly exposed population. Cancer Epidemiol Biomarkers Prev. 2010;19:1557-1568.
- Centers for Disease Control and Prevention (CDC). Use of indoor tanning devices by adults—United States, 2010. MMWR Morb Mortal Wkly Rep. 2012;61:323-326.
- Nielsen K, Masback A, Olsson H, et al. A prospective, population-based study of 40,000 women regarding host factors, UV exposure and sunbed use in relation to risk and anatomic site of cutaneous melanoma. Int J Cancer. 2012;131:706-715.
- Gandini S, Autier P, Boniol M. Reviews on sun exposure and artificial light and melanoma. Prog Biophys Mol Biol. 2011;107:362-366.
- Indoor tanning: the risks of ultraviolet rays. US Food and Drug Administration website. http://www.fda.gov/ForConsumers/ConsumerUpdates/ucm186687.htm. Updated September 11, 2017. Accessed November 2, 2017.
- Food and Drug Administration, HHS. General and plastic surgery devices: reclassification of ultraviolet lamps for tanning, henceforth to be known as sunlamp products and ultraviolet lamps intended for use in sunlamp products. Fed Regist. 2014;79:31205-31214.
- Brady MS. Public health and the tanning bed controversy. J Clin Oncol. 2012;30:1571-1573.
- Cust AE, Armstrong BK, Goumas C, et al. Sunbed use during adolescence and early adulthood is associated with increased risk of early-onset melanoma. Int J Cancer. 2011;128:2425-2435.
- International Agency for Research on Cancer Working Group on artificial ultraviolet (UV) light and skin cancer. The association of use of sunbeds with cutaneous malignant melanoma and other skin cancers: a systematic review. Int J Cancer. 2007;120:1116-1122.
- Greenwood S, Perrin A, Duggan M. Social media update 2016. Pew Research Center website. http://www.pewinternet.org/2016/11/11/social-media-update-2016/. Published November 11, 2016. Accessed December 12, 2017.
The incidence of melanoma is increasing at a rate greater than any other cancer,1 possibly due to the increasing use of indoor tanning devices. These devices emit unnaturally high levels of UVA and low levels of UVA and UVB rays.2 The risks of using these devices include increased incidence of melanoma (3438 cases attributed to indoor tanning in 2008) and keratinocytes cancer (increased risk of squamous cell carcinoma by 67% and basal cell carcinoma by 29%), severe sunburns (61.1% of female users and 44.6% of male users have reported sunburns), and aggravation of underlying disorders such as systemic lupus erythematosus.3-5
The literature varies in its explanation of how indoor tanning increases the risk of developing melanoma. Some authors suggest it is due to increased frequency of use, duration of sessions, and years of using tanning devices.1,6 Others suggest the increased cancer risk is the result of starting to tan at an earlier age.2,3,6-10 There is conflicting literature on the level of increased risk of melanoma in those who tan indoors at a young age (<35 years). Although the estimated rate of increased skin cancer risk varies, with rates up to 75% compared to nonusers, nearly all sources support an increased rate.6 Despite the growing body of knowledge that indoor tanning is dangerous, as well as the academic publication of these risks (eg, carcinogenesis, short-term and long-term eye injury, burns, UV sensitivity when combined with certain medications), teenagers in the United States and affluent countries appear to disregard the risks of tanning.11
Tanning companies have promoted the misconception that only UVB rays cause cell damage and UVA rays, which the devices emit, result in “damage-free” or “safe” tans.2,3 Until 2013, indoor tanning devices were classified by the US Food and Drug Administration (FDA) as class I, indicating that they are safe in terms of electrical shock. Many indoor tanning facilities have promoted the FDA “safe” label without clarifying that the safety indications only referred to electrical-shock potential. Nonetheless, it is known now that these devices, which emit high UVA and low UVB rays, promote melanoma, nonmelanoma skin cancers, and severe sunburns, as well as aggravate existing conditions (eg, systemic lupus erythematosus).4 As a result of an unacceptably high incidence of these disease complications, a 2014 FDA regulation categorized tanning beds as class II, requiring that tanning bed users be informed of the risk of skin cancer in an effort to reverse the growing trend of indoor tanning.12 Despite these regulatory interventions, it is not clear if this knowledge of cancer risk deters patients from indoor tanning.
The purpose of this study was to investigate the patients’ perspective on indoor tanning behaviors as associated with the severity of their melanoma and the time frame in which they were diagnosed as well as their perceived views on the safety of indoor tanning and the frequency in which they continue to tan indoors. This information is highly relevant in helping to determine if requiring a warning of the risk of skin cancer will deter patients from this unhealthy habit, especially given recent reclassification of sunbeds as class II by the FDA. Additional insights from these data may clarify if indoor tanning decreases the time frame in which melanoma is diagnosed or increases the severity of the resulting melanoma. Moreover, it will help elucidate whether or not the age at which indoor tanning is initiated affects the time frame to melanoma onset and corresponding severity.
Methods
An original unvalidated online survey was conducted worldwide via a link distributed to the following supporting institutions: Advanced Dermatology & Cosmetic Surgery, Ameriderm Research, Melanoma Research Foundation (a melanoma patient advocacy group), Florida State University Department of Dermatology, Moffitt Cancer Center Cutaneous Oncology Program, Cleveland Clinic, Ohio State University Division of Medical Oncology, Harvard Medical School Department of Dermatology, The University of Texas MD Anderson Cancer Center Department of Dermatology, University of Colorado Department of Dermatology, and Northwestern University Department of Dermatology. However, there was not confirmation that all of these institutions promoted the survey. Additionally, respondents were recruited through patient advocacy groups and social media sites including Facebook, Twitter, LinkedIn, Tumblr, and Instagram. The patient advocacy groups and social media sites invited participation through recruitment announcements, including DermNetNZ (a global dermatology patient information site), with additional help from the International Federation of Dermatology Clinical Trial Network.
The survey was restricted to those who were self-identified as 18 years or older and who self-reported a diagnosis of melanoma following the use of indoor tanning devices. The survey was hosted by SurveyMonkey, which allowed consent to be obtained and responses to remain anonymous. Access to the survey was sponsored by the Basal Cell Carcinoma Nevus Syndrome Life Support Network. The University of Central Florida (Orlando, Florida) institutional review board reviewed and approved this study as exempt human research.
Survey responses collected from January 2014 to June 2015 were analyzed herein. The survey contained 58 questions and was divided into different topics including indoor tanning background (eg, states/countries in which participants tanned indoors, age when they first tanned, frequency of tanning), consenting process (eg, length, did someone review the consent with participants, what was contained in the consent), indoor tanning and melanoma (eg, how long after tanning did melanoma develop, age at development, location of melanoma), indoor tanning postmelanoma (eg, did participants tan after diagnosis and why), and other risk factors (eg, did participants smoke or drink pre- or postmelanoma).
Statistical Analysis
The data consist of both categorical and continuous variables. The categorical variables included age (<35 years or ≥35 years), frequency of indoor tanning (≤1 time weekly or >1 time weekly), and onset of melanoma diagnosis (within or after 5 years
Difference in proportions among groups, age, frequency of tanning, onset of melanoma diagnosis within or after 5 years of starting indoor tanning, and knowledge of cancer risks was tested for significance using the χ² test. Reported P values were 2-tailed, corresponding with a significance level of P<.05. All data were analyzed using SPSS (version 21.0). All statistical analyses were conducted independent of the participants’ sex.
Results
Of the 454 participants who accessed the survey, 448 were analyzed in this study; 6 participants did not complete the questionnaire. Both males and females were analyzed: 289 females, 12 males, and 153 who did not report gender. The age range of participants was 18 to 69 years. The age at start of indoor tanning ranged from 8 to 54 years, with a mean of 22 years. Additional participant characteristics are described in Table 1. The mean frequency of indoor tanning was reported as 2 times weekly. When participants were asked if they were warned of the risk of skin cancer, 21.5% reported yes while 78.4% reported not being told of the risk. This knowledge was compared to their frequency of indoor tanning. Having the knowledge of the risk of skin cancer had no influence on their frequency of indoor tanning (Table 2).
Among responders, those who perceived indoor tanning as safer than outdoor tanning tanned indoors more frequently than those who do not (Spearman r=−0.224; P<.05)(Table 3). The frequency of indoor tanning was divided into those who tanned indoors more than once weekly and those who tanned indoors once a week or less. This study showed that the frequency of indoor tanning had no effect on the latency time between the commencement of indoor tanning and diagnosis of melanoma (Table 4). The time frame from the onset of melanoma diagnosis also was compared to the age at which the participants started to tan indoors. Age was divided into those younger than 35 years and those 35 years and older. There was no correlation between the age when indoor tanning began and the time frame in which the melanoma was diagnosed (eTable).
Table 5 shows the correlations between indoor tanning behaviors and melanoma characteristics. Those who started indoor tanning at an earlier age were diagnosed with melanoma at an earlier age compared to those who started indoor tanning later in life (r=0.549; P<.01). Moreover, those who started indoor tanning at a later age reported being diagnosed with a melanoma of greater Breslow depth (r=0.173; P<.01). Those who reported being diagnosed with a greater Breslow depth also reported a higher Clark level (r=0.608; P<.01). Among responders, those who more frequently tanned indoors also reported greater frequency of outdoor tanning (r=0.197; P<.01). This study showed no correlation between the age at melanoma diagnosis and the frequency of indoor (r=0.004; P>.05 not significant) or outdoor (r=0.093; P>.05 not significant) tanning. Having the knowledge of the risk of skin cancer had no relationship on the frequency of indoor tanning (r=−0.04; P>.05 not significant).
Comment
Thirty million Americans utilize indoor tanning devices at least once a year.13 UVA light comprises the majority of the spectrum used by indoor tanning devices, with a fraction (<5%) being UVB light. Until recently, UVB light was the only solar spectrum considered carcinogenic. In 2009, the International Agency for Research on Cancer classified the whole spectrum as carcinogenic to humans.5,11 Despite this evidence, indoor tanning facilities have promoted indoor tanning as damage free.3 The goal of this study was to collect the patient perspective on the safety of indoor tanning, indoor tanning behaviors, time frame of onset of melanoma, and the severity (ie, Breslow depth) of those melanomas.
Melanoma is the most prevalent cancer in females aged 25 to 29 years.3 The median age of diagnosis of melanoma (with and without the use of indoor tanning devices) is approximately 60 years14 versus our study, which found the average age at diagnosis was 37.6 years. Our findings are consistent with other literature in that those who start indoor tanning earlier (<35 years of age) develop melanoma at an earlier age.14,15 Cust et al14 also promoted the idea that patients develop melanoma earlier because younger individuals are more biologically susceptible to the carcinogenic effects of artificial UV light. However, our study found that those who started indoor tanning at an older age reported being diagnosed with a melanoma of greater Breslow depth, seemingly incongruent with the aforementioned hypothesis. One limitation is the age range for this research sample (18–69 years). The young age range may be attributable to the recruitment through social media, which is geared toward a younger population. Additionally, indoor tanning is a relatively new phenomenon practiced since the 1980s,2 which may contribute to the younger sample size. However, 2.7 billion individuals use social media worldwide with 40% of those older than 65 years on social media.16
Prior research has shown that those who start indoor tanning before the age of 35 years have a 75% increased risk of developing melanoma.14 Another study also has suggested that UVA-rich sunlamps may shorten the latency period for induction of melanoma and nonmelanoma skin cancers.3 Our study used similar age cutoffs in concluding that there was no earlier onset of melanoma diagnosis between those who started indoor tanning before the age of 35 years and those who started at the age of 35 years or older. Limitations include that our study is cross-sectional, and therefore time course cannot be established. Also, survey responses were self-reported, allowing the possibility of recall bias.
A plethora of research has been conducted to determine if there is a connection between the use of indoor tanning devices and developing melanoma. Cust et al14 suggested the risk of melanoma was 41% higher for those who had ever used a sunbed in comparison to those who had not. Other studies describe the difficulty in making the connection between indoor tanning and melanoma, as those who more frequently tan indoors also more frequently tan outdoors,11 as suggested by this study. However, there is a paucity of literature on the patients’ perspectives on the safety of indoor tanning. This study determined that those who more frequently tan indoors believed that indoor tanning is safer than outdoor tanning. With this altered perception promoted by the indoor tanning industry, the FDA has added a warning label to all indoor tanning devices about the risk of skin cancer. Our study revealed that having the knowledge of the risk of skin cancer had no influence on the frequency of indoor tanning. This concerning finding highlights a pressing need for an alternative approach to increase awareness of the harmful consequences that accompany indoor tanning. Further studies may elaborate on potential effective methods and messages to relate to an indoor tanning population comprised mostly of young females.
Acknowledgments
Supported and funded by the Basal Cell Carcinoma Nevus Syndrome Life Support Network. This research project was completed as part of the FIRE Module at the University of Central Florida, College of Medicine. We thank the FIRE Module faculty and staff for their assistance with this project.
- Fisher DE, James WD. Indoor tanning—science, behavior, and policy. N Engl J Med. 2010;363:901-903.
- Boniol M, Autier P, Boyle P, et al. Cutaneous melanoma attributable to sunbed use: systematic review and meta-analysis. BMJ. 2012;345:e4757.
- Coelho SG, Hearing VJ. UVA tanning is involved in the increased incidence of skin cancers in fair-skinned young women. Pigment Cell Melanoma Res. 2010;23:57-63.
- Klein RS, Sayre RM, Dowdy JC, et al. The risk of ultraviolet radiation exposure from indoor lamps in lupus erythematosus. Autoimmun Rev. 2009;8:320-324.
- O’Sullivan NA, Tait CP. Tanning bed and nail lamp use and the risk of cutaneous malignancy: a review of the literature. Australas J Dermatol. 2014;55:99-106.
- Schmidt CW. UV radiation and skin cancer: the science behind age restrictions for tanning beds. Environ Health Perspect. 2012;120:a308-a313.
- Lazovich D, Vogel RI, Berwick M, et al. Indoor tanning and risk of melanoma: a case-control study in a highly exposed population. Cancer Epidemiol Biomarkers Prev. 2010;19:1557-1568.
- Centers for Disease Control and Prevention (CDC). Use of indoor tanning devices by adults—United States, 2010. MMWR Morb Mortal Wkly Rep. 2012;61:323-326.
- Nielsen K, Masback A, Olsson H, et al. A prospective, population-based study of 40,000 women regarding host factors, UV exposure and sunbed use in relation to risk and anatomic site of cutaneous melanoma. Int J Cancer. 2012;131:706-715.
- Gandini S, Autier P, Boniol M. Reviews on sun exposure and artificial light and melanoma. Prog Biophys Mol Biol. 2011;107:362-366.
- Indoor tanning: the risks of ultraviolet rays. US Food and Drug Administration website. http://www.fda.gov/ForConsumers/ConsumerUpdates/ucm186687.htm. Updated September 11, 2017. Accessed November 2, 2017.
- Food and Drug Administration, HHS. General and plastic surgery devices: reclassification of ultraviolet lamps for tanning, henceforth to be known as sunlamp products and ultraviolet lamps intended for use in sunlamp products. Fed Regist. 2014;79:31205-31214.
- Brady MS. Public health and the tanning bed controversy. J Clin Oncol. 2012;30:1571-1573.
- Cust AE, Armstrong BK, Goumas C, et al. Sunbed use during adolescence and early adulthood is associated with increased risk of early-onset melanoma. Int J Cancer. 2011;128:2425-2435.
- International Agency for Research on Cancer Working Group on artificial ultraviolet (UV) light and skin cancer. The association of use of sunbeds with cutaneous malignant melanoma and other skin cancers: a systematic review. Int J Cancer. 2007;120:1116-1122.
- Greenwood S, Perrin A, Duggan M. Social media update 2016. Pew Research Center website. http://www.pewinternet.org/2016/11/11/social-media-update-2016/. Published November 11, 2016. Accessed December 12, 2017.
Practice Points
- Despite US Food and Drug Administration reclassification and publicity of the risks of skin cancer, many patients continue to use sunbeds.
- It is important to assess how patients are obtaining information regarding sunbed safety, as indoor tanning companies are promoting sunbeds as “safe” tans.
- The increased combination of sunbed use and outdoor tanning is putting people at greater risk for the development of melanoma and nonmelanoma skin cancer.
Biomechanical Evaluation of a Novel Suture Augment in Patella Fixation
Take-Home Points
- Suture augmentation improves construct strength for patella fixation.
- Krackow sutures may be placed in the quadriceps and patella tendons, then secured over the anterior patella (much like an anterior tension band).
- The Krackow technique described was superior to the suture cerclage technique based on mean load values, but did not reach statistical significance.
- The Krackow suture technique is a viable and easily applied technique for suture augmentation of patella fixation constructs.
Patella fractures are relatively uncommon, accounting for only 1% of skeletal injuries.1 Restoration of the function of the patella and the extensor mechanism is vital for knee extension and gait. However, patella fractures have an inherently high rate of complications, making these injuries challenging to treat.2-4 In patients with intact extensor function, displacement of <4 mm, and articular step-off of <3 mm, nonoperative management is extremely effective, with 99% of patients reporting favorable results.5 However, for fractures in which the extensor mechanism is disrupted, surgical intervention typically is indicated.6
Authors have reported various surgical interventions, one of the most commonly used being the anterior tension band (ATB) technique, first described by the AO (Arbeitsgemeinschaft für Osteosynthesefragen) group in the 1950s.7 By converting distractive anterior force during knee flexion to compressive force at the fracture site, the ATB technique provides a repair stronger than the previously used cerclage repair.8 Although initially considered standard of care, the ATB technique was soon found to be associated with implant failure and subcutaneous irritation prompting implant removal.9
To address these issues, Berg10 and Carpenter and colleagues11 evaluated an ATB technique that used cannulated screws instead of Kirschner wires (K-wires). This variation on the ATB technique reduced the implant-related issues while maintaining the mechanical advantage of the tension band. The more rigid design also permitted earlier postoperative rehabilitation, which significantly reduced development of arthrofibrosis.6,7,10 This modified ATB (MATB) technique has since been investigated for additional augments, mainly focusing on use of different tension band materials, including polyester suture and braided composite suture.12-14
However, there is little research on augments that incorporate the surrounding soft tissue, specifically the quadriceps and patellar tendons. In a recent retrospective clinical study, Oh and colleagues15 found positive clinical results with use of Krackow sutures, though 2 or 3 vertically oriented stainless steel wires were used instead of cannulated screws.
We conducted a study to determine the biomechanical efficacy of using a cerclage suture augment and a Krackow suture augment coupled with and compared with conventional MATB repair. If effective, this technique may represent another strategy for increasing repair strength and thereby improve postoperative outcomes.
Materials and Methods
Specimen Preparation
Fresh-frozen cadaver extensor mechanisms (quadriceps tendon, patella, surrounding retinaculum, patellar tendon) were kept frozen at –4°C until preparation. Fifteen specimens were selected. Mean (SD) age at death was 68 (10) years (range, 51-85 years). One specimen was excluded for a short patella tendon, which precluded adequate attachment for testing. All specimens were free of overt osseous pathology.
After specimens were thawed overnight, the patellae were transversely osteotomized with an osteotome at the junction of the middle and distal thirds of the patella. Sharp dissection was performed to carry the division through the medial and lateral retinaculum at the same level. All 14 specimens were then repaired using the MATB technique. First, the transverse fracture was reduced with a reduction clamp. Then, two 4-mm cannulated screws (DePuy Synthes) were inserted parallel to each other and perpendicular to the fracture. An 18-gauge stainless steel wire was then passed through each screw, crossed anteriorly, and tightened to create a figure-of-8 ATB. The specimens were then randomly divided into 3 groups—MATB; MATB with cerclage suture augment; MATB with Krackow suture augment—while ensuring specimens from a single cadaver were placed in different groups to avoid confounding based on bone density differences.
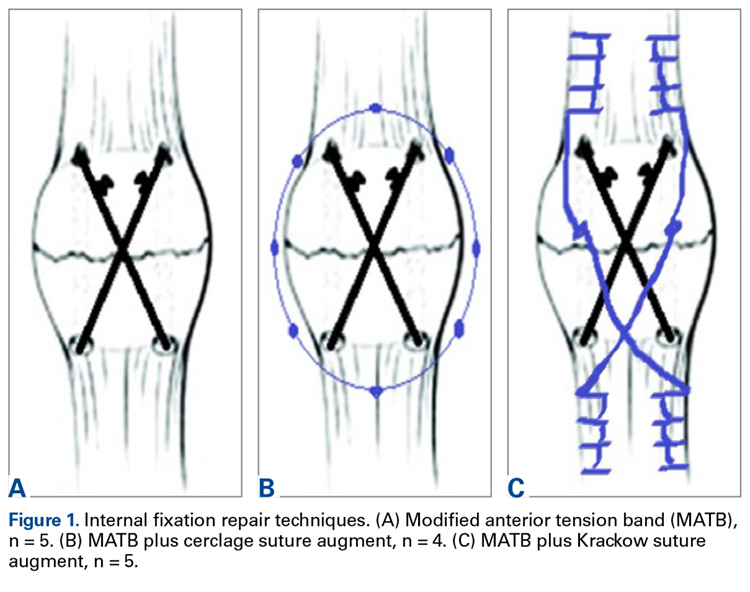
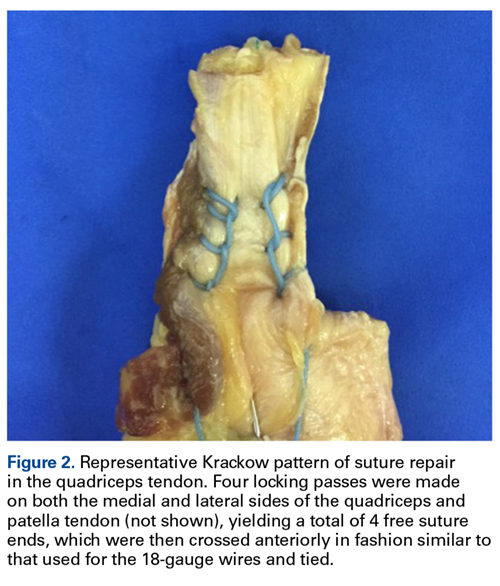
Experimental Setup
Repaired specimens were secured with tissue clamps at the quadriceps and patellar tendons on an MTS Bionix 858 (MTS Systems) hydraulic arm. 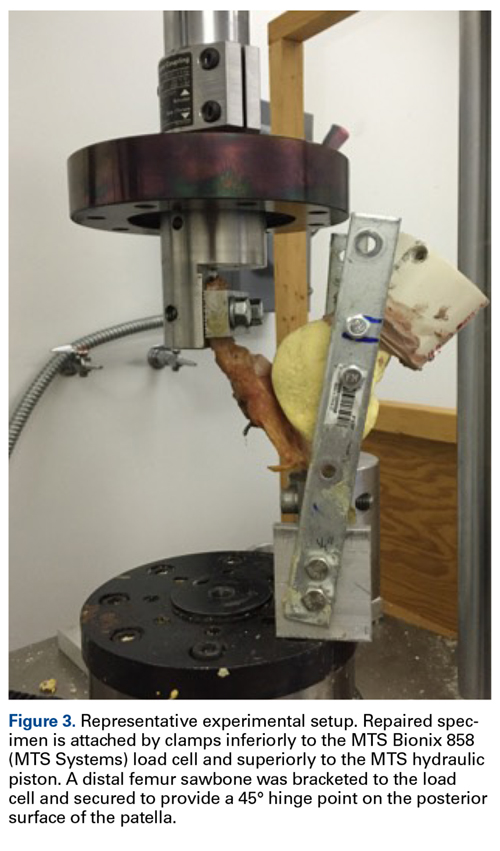
Each patella was secured for cyclic testing. Initially it was placed under 10 N of tension. Then it underwent tensile loading from 10 N to 300 N at 50 N/s for 10 cycles. These parameters were based on previous biomechanical patella studies.10,11 Load was measured with the MTS load cell and displacement with the displacement transducer. Fracture displacement associated with 300-N cyclic tension was recorded. Displacement was calculated as the difference between 10th cycle and 2nd cycle values, which accounted for any degree of initial tissue slippage. After cyclic testing, the patella was placed back in 10 N of tensile loading and subjected to maximum force loading to determine ultimate repair strength. For maximum loading, the patella was stretched progressively at 50 N/s until failure. Again, load and displacement were measured with MTS.
Statistical Analysis
After testing, fracture displacement and maximum load force data were compiled for analysis. One-way analysis of variance with Bonferroni correction was used to determine if there were significant differences between groups. Significance level was set at P < .05.
Results
For cyclic testing, mean total displacement was measured over 10 cycles for each group. Again, displacement was determined by taking the difference between 10th cycle and 2nd cycle values, allowing for system stabilization. 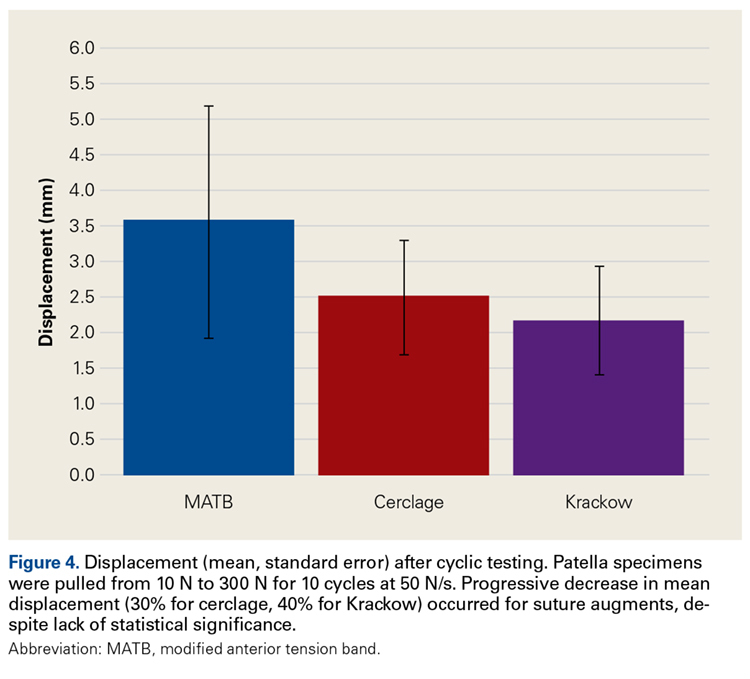
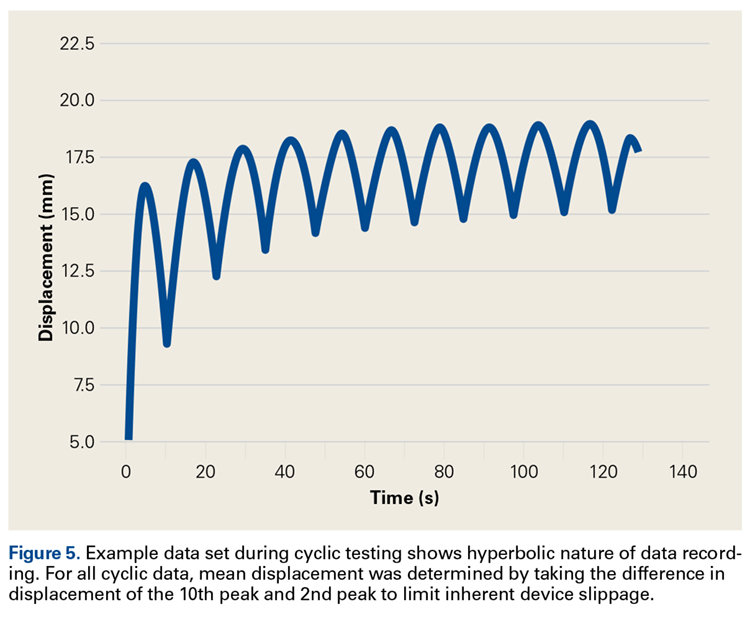
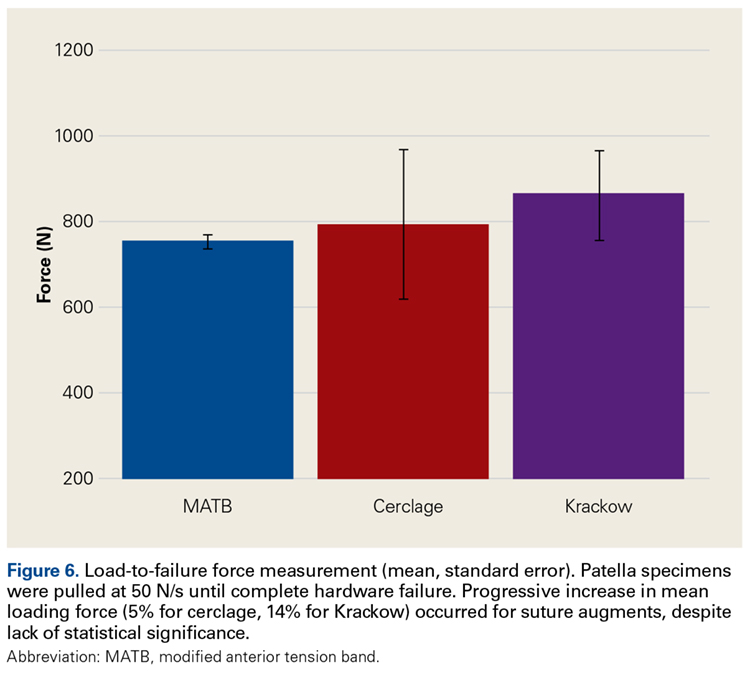
Discussion
Our main objective was to compare the efficacy of a novel suture augment technique with that of other patella fracture repair techniques. Our hypothesis—that adding a Krackow suture augment would increase strength in both cyclic and maximum loading—was supported. Although testing results were not statistically significant because of the small sample size, we think this novel technique has clinically relevant descriptive significance and warrants further investigation.
Proper anatomical reduction and postoperative stabilization are of utmost importance in clinical approaches to patella fractures. In addition, regardless of which technical procedure is used, open reduction should also allow for early range of motion to prevent joint arthrofibrosis. Ever since the ATB technique was first described by the AO group, postoperative outcomes have improved significantly. In a retrospective study by Levack and colleagues,17 30 of 64 patients with patella fractures underwent internal fixation. Mean follow-up was 6.2 years. By both objective and subjective measures, the best functional outcomes were associated with internal tension band fixation (vs cerclage repair). Lotke and Ecker18 also documented the efficacy of the tension band technique. Sixteen patients with patella fractures underwent anterior tension banding; those with a comminuted fracture also underwent cerclage repair for patella stabilization during tension banding. At 6-week follow-up, all patients had good range of motion (≥90° flexion), relatively few symptoms, and no implant failures. Results were similar to those of Levack and colleagues.17
Although it improves stability and functional outcomes over conventional patellectomy and cerclage wiring, the ATB technique has been associated with subcutaneous irritation caused by the K-wires used to secure the band. Hung and colleagues9 followed up 68 patients with patellar fractures. Five of these patients underwent tension banding. Although there was a high level of adequate functional outcomes, implant irritation was found to be “quite frequent.”
To address this issue, Carpenter and colleagues11 evaluated an ATB technique that uses K-wires instead of cannulated screws. Biomechanical testing in a cadaver model revealed less fracture displacement and overall more repair strength through cyclic and maximum load testing. Clinically, these results were supported by Berg,10 who followed up 10 patients with transverse patella fractures repaired with the MATB technique. At a mean follow-up of 24 months, 7 of the 10 patients had good to excellent outcomes, and there were no implant failures.
Further investigation into patella repairs has mainly focused on improving the MATB technique and experimenting with different tension band materials. Rabalais and colleagues13 biomechanically tested high-strength polyethylene suture as a replacement for standard 18-gauge wire, and Bryant and colleagues14 tested a braided composite suture (FiberWire; Arthrex) as a replacement for standard 18-gauge stainless steel wire. Both found no significant difference with use of augmented tension band material, but Rabalais and colleagues13 did find more advantages with a parallel tension band construct than with a standard figure-of-8 arrangement.
In developing our novel technique, we considered that Krackow sutures are routinely used in both quadriceps tendon repair and patellar tendon repair, including partial patellectomy for distal patella fracture. With a suture placed in both tendons, the augment could be expected to resist longitudinal gapping and augment the tension band across the anterior patella. First described by Krackow and colleagues,19 the Krackow suture is widely used for tendon reconstruction. In an interlocking system of sutures, the Krackow suture provides a repair that is more stable than repair with conventional suture techniques, specifically in the context of tendon repair.20 Given the sesamoidal nature of the patella, its repair shares the goal of gap prevention with other tendon repairs. In theory, anchoring the supporting structures that are above and below the patella provides support for the intervening patella and ultimately improves fracture fixation strength.
Oh and colleagues15 reported on the clinical efficacy of a Krackow augment in distal pole patella repairs. Similarly, we found a Krackow augment to be efficacious, supporting its potential in clinical approaches to patella repairs. Our results indicate this augment can be a useful clinical adjunct in biomechanical evaluation.
Limitations of this study include its use of dissected extensor mechanisms, which may have less biofidelity than whole-knee specimens. In our model, specimens were secured at the patellar tendon and the quadriceps tendons, as opposed to the quadriceps tendon and the tibia distally. Use of this model could have led to an increase in early displacement during cyclic testing as a result of tissue slippage. Furthermore, our small sample size could have affected our ability to demonstrate a difference between these techniques.
Given its increased strength as demonstrated by mean displacement during cyclic loading and mean load to failure, as well as the early clinical data recently published, the Krackow suture augment represents a feasible technique for patella fixation. It likely will be most useful in cases in which conventional techniques are prone to failure or cannot be applied, such as severe distal comminution or poor bone density. Further biomechanical testing with a larger number of specimens may be required for statistical significance.
Conclusion
In patella fracture repair strategies, the Krackow suture augment increased strength when used with a MATB technique. Failure to reach statistical significance likely resulted from our small sample size. Further biomechanical testing and clinical studies are needed for more complete evaluation of this technique. We think it will be most useful in the setting of poor bone quality or severe comminution, which can limit fixation options. As increased repair strength allows earlier postoperative rehabilitation and maintains fracture reduction, patient outcomes should improve. This novel technique represents another strategy for managing challenging patella fractures.
1. Boström Å. Fracture of the patella. A study of 422 patellar fractures. Acta Orthop Scand Suppl. 1972;143:1-80.
2. Hungerford DS, Barry M. Biomechanics of the patellofemoral joint. Clin Orthop Relat Res. 1979;(144):9-15.
3. LeBrun CT, Langford JR, Sagi HC. Functional outcomes after operatively treated patella fractures. J Orthop Trauma. 2012;26(7):422-426.
4. Kaufer H. Mechanical function of the patella. J Bone Joint Surg Am. 1971;53(8):1551-1560.
5. Braun W, Wiedemann M, Rüter A, Kundel K, Kolbinger S. Indications and results of nonoperative treatment of patellar fractures. Clin Orthop Relat Res. 1993;(289):197-201.
6. Melvin JS, Mehta S. Patellar fractures in adults. J Am Acad Orthop Surg. 2011;19(4):198-207.
7. Müller M, Allgöwer M, Schneider R, Willeneger H. Manual of Internal Fixation: Techniques Recommended by the AO Group. Berlin, Germany: Springer; 1979.
8. Weber MJ, Janecki CJ, McLeod P, Nelson CL, Thompson JA. Efficacy of various forms of fixation of transverse fractures of the patella. J Bone Joint Surg Am. 1980;62(2):215-220.
9. Hung LK, Chan KM, Chow YN, Leung PC. Fractured patella: operative treatment using the tension band principle. Injury. 1985;16(5):343-347.
10. Berg EE. Open reduction internal fixation of displaced transverse patella fractures with figure-eight wiring through parallel cannulated compression screws. J Orthop Trauma. 1997;11(8):573-576.
11. Carpenter JE, Kasman RA, Patel N, Lee ML, Goldstein SA. Biomechanical evaluation of current patella fracture fixation techniques. J Orthop Trauma. 1997;11(5):351-356.
12. Hughes SC, Stott PM, Hearnden AJ, Ripley LG. A new and effective tension-band braided polyester suture technique for transverse patellar fracture fixation. Injury. 2007;38(2):212-222.
13. Rabalais RD, Burger E, Lu Y, Mansour A, Baratta RV. Comparison of two tension-band fixation materials and techniques in transverse patella fractures: a biomechanical study. Orthopedics. 2008;31(2):128.
14. Bryant TL, Anderson CL, Stevens CG, Conrad BP, Vincent HK, Sadasivan KK. Comparison of cannulated screws with FiberWire or stainless steel wire for patella fracture fixation: a pilot study. J Orthop. 2014;12(2):92-96.
15. Oh HK, Choo SK, Kim JW, Lee M. Internal fixation of displaced inferior pole of the patella fractures using vertical wiring augmented with Krachow suturing. Injury. 2015;46(12):2512-2515.
16. Goodfellow J, Hungerford DS, Zindel M. Patello-femoral joint mechanics and pathology. 1. Functional anatomy of the patello-femoral joint. J Bone Joint Surg Br. 1976;58(3):287-290.
17. Levack B, Flannagan JP, Hobbs S. Results of surgical treatment of patellar fractures. J Bone Joint Surg Br. 1985;67(3):416-419.
18. Lotke PA, Ecker ML. Transverse fractures of the patella. Clin Orthop Relat Res. 1981;(158):180-184.
19. Krackow KA, Thomas SC, Jones LC. Ligament-tendon fixation: analysis of a new stitch and comparison with standard techniques. Orthopedics. 1988;11(6):909-917.
20. Hahn JM, Inceoğlu S, Wongworawat MD. Biomechanical comparison of Krackow locking stitch versus nonlocking loop stitch with varying number of throws. Am J Sports Med. 2014;42(12):3003-3008.
Take-Home Points
- Suture augmentation improves construct strength for patella fixation.
- Krackow sutures may be placed in the quadriceps and patella tendons, then secured over the anterior patella (much like an anterior tension band).
- The Krackow technique described was superior to the suture cerclage technique based on mean load values, but did not reach statistical significance.
- The Krackow suture technique is a viable and easily applied technique for suture augmentation of patella fixation constructs.
Patella fractures are relatively uncommon, accounting for only 1% of skeletal injuries.1 Restoration of the function of the patella and the extensor mechanism is vital for knee extension and gait. However, patella fractures have an inherently high rate of complications, making these injuries challenging to treat.2-4 In patients with intact extensor function, displacement of <4 mm, and articular step-off of <3 mm, nonoperative management is extremely effective, with 99% of patients reporting favorable results.5 However, for fractures in which the extensor mechanism is disrupted, surgical intervention typically is indicated.6
Authors have reported various surgical interventions, one of the most commonly used being the anterior tension band (ATB) technique, first described by the AO (Arbeitsgemeinschaft für Osteosynthesefragen) group in the 1950s.7 By converting distractive anterior force during knee flexion to compressive force at the fracture site, the ATB technique provides a repair stronger than the previously used cerclage repair.8 Although initially considered standard of care, the ATB technique was soon found to be associated with implant failure and subcutaneous irritation prompting implant removal.9
To address these issues, Berg10 and Carpenter and colleagues11 evaluated an ATB technique that used cannulated screws instead of Kirschner wires (K-wires). This variation on the ATB technique reduced the implant-related issues while maintaining the mechanical advantage of the tension band. The more rigid design also permitted earlier postoperative rehabilitation, which significantly reduced development of arthrofibrosis.6,7,10 This modified ATB (MATB) technique has since been investigated for additional augments, mainly focusing on use of different tension band materials, including polyester suture and braided composite suture.12-14
However, there is little research on augments that incorporate the surrounding soft tissue, specifically the quadriceps and patellar tendons. In a recent retrospective clinical study, Oh and colleagues15 found positive clinical results with use of Krackow sutures, though 2 or 3 vertically oriented stainless steel wires were used instead of cannulated screws.
We conducted a study to determine the biomechanical efficacy of using a cerclage suture augment and a Krackow suture augment coupled with and compared with conventional MATB repair. If effective, this technique may represent another strategy for increasing repair strength and thereby improve postoperative outcomes.
Materials and Methods
Specimen Preparation
Fresh-frozen cadaver extensor mechanisms (quadriceps tendon, patella, surrounding retinaculum, patellar tendon) were kept frozen at –4°C until preparation. Fifteen specimens were selected. Mean (SD) age at death was 68 (10) years (range, 51-85 years). One specimen was excluded for a short patella tendon, which precluded adequate attachment for testing. All specimens were free of overt osseous pathology.
After specimens were thawed overnight, the patellae were transversely osteotomized with an osteotome at the junction of the middle and distal thirds of the patella. Sharp dissection was performed to carry the division through the medial and lateral retinaculum at the same level. All 14 specimens were then repaired using the MATB technique. First, the transverse fracture was reduced with a reduction clamp. Then, two 4-mm cannulated screws (DePuy Synthes) were inserted parallel to each other and perpendicular to the fracture. An 18-gauge stainless steel wire was then passed through each screw, crossed anteriorly, and tightened to create a figure-of-8 ATB. The specimens were then randomly divided into 3 groups—MATB; MATB with cerclage suture augment; MATB with Krackow suture augment—while ensuring specimens from a single cadaver were placed in different groups to avoid confounding based on bone density differences.
Experimental Setup
Repaired specimens were secured with tissue clamps at the quadriceps and patellar tendons on an MTS Bionix 858 (MTS Systems) hydraulic arm.
Each patella was secured for cyclic testing. Initially it was placed under 10 N of tension. Then it underwent tensile loading from 10 N to 300 N at 50 N/s for 10 cycles. These parameters were based on previous biomechanical patella studies.10,11 Load was measured with the MTS load cell and displacement with the displacement transducer. Fracture displacement associated with 300-N cyclic tension was recorded. Displacement was calculated as the difference between 10th cycle and 2nd cycle values, which accounted for any degree of initial tissue slippage. After cyclic testing, the patella was placed back in 10 N of tensile loading and subjected to maximum force loading to determine ultimate repair strength. For maximum loading, the patella was stretched progressively at 50 N/s until failure. Again, load and displacement were measured with MTS.
Statistical Analysis
After testing, fracture displacement and maximum load force data were compiled for analysis. One-way analysis of variance with Bonferroni correction was used to determine if there were significant differences between groups. Significance level was set at P < .05.
Results
For cyclic testing, mean total displacement was measured over 10 cycles for each group. Again, displacement was determined by taking the difference between 10th cycle and 2nd cycle values, allowing for system stabilization.
Discussion
Our main objective was to compare the efficacy of a novel suture augment technique with that of other patella fracture repair techniques. Our hypothesis—that adding a Krackow suture augment would increase strength in both cyclic and maximum loading—was supported. Although testing results were not statistically significant because of the small sample size, we think this novel technique has clinically relevant descriptive significance and warrants further investigation.
Proper anatomical reduction and postoperative stabilization are of utmost importance in clinical approaches to patella fractures. In addition, regardless of which technical procedure is used, open reduction should also allow for early range of motion to prevent joint arthrofibrosis. Ever since the ATB technique was first described by the AO group, postoperative outcomes have improved significantly. In a retrospective study by Levack and colleagues,17 30 of 64 patients with patella fractures underwent internal fixation. Mean follow-up was 6.2 years. By both objective and subjective measures, the best functional outcomes were associated with internal tension band fixation (vs cerclage repair). Lotke and Ecker18 also documented the efficacy of the tension band technique. Sixteen patients with patella fractures underwent anterior tension banding; those with a comminuted fracture also underwent cerclage repair for patella stabilization during tension banding. At 6-week follow-up, all patients had good range of motion (≥90° flexion), relatively few symptoms, and no implant failures. Results were similar to those of Levack and colleagues.17
Although it improves stability and functional outcomes over conventional patellectomy and cerclage wiring, the ATB technique has been associated with subcutaneous irritation caused by the K-wires used to secure the band. Hung and colleagues9 followed up 68 patients with patellar fractures. Five of these patients underwent tension banding. Although there was a high level of adequate functional outcomes, implant irritation was found to be “quite frequent.”
To address this issue, Carpenter and colleagues11 evaluated an ATB technique that uses K-wires instead of cannulated screws. Biomechanical testing in a cadaver model revealed less fracture displacement and overall more repair strength through cyclic and maximum load testing. Clinically, these results were supported by Berg,10 who followed up 10 patients with transverse patella fractures repaired with the MATB technique. At a mean follow-up of 24 months, 7 of the 10 patients had good to excellent outcomes, and there were no implant failures.
Further investigation into patella repairs has mainly focused on improving the MATB technique and experimenting with different tension band materials. Rabalais and colleagues13 biomechanically tested high-strength polyethylene suture as a replacement for standard 18-gauge wire, and Bryant and colleagues14 tested a braided composite suture (FiberWire; Arthrex) as a replacement for standard 18-gauge stainless steel wire. Both found no significant difference with use of augmented tension band material, but Rabalais and colleagues13 did find more advantages with a parallel tension band construct than with a standard figure-of-8 arrangement.
In developing our novel technique, we considered that Krackow sutures are routinely used in both quadriceps tendon repair and patellar tendon repair, including partial patellectomy for distal patella fracture. With a suture placed in both tendons, the augment could be expected to resist longitudinal gapping and augment the tension band across the anterior patella. First described by Krackow and colleagues,19 the Krackow suture is widely used for tendon reconstruction. In an interlocking system of sutures, the Krackow suture provides a repair that is more stable than repair with conventional suture techniques, specifically in the context of tendon repair.20 Given the sesamoidal nature of the patella, its repair shares the goal of gap prevention with other tendon repairs. In theory, anchoring the supporting structures that are above and below the patella provides support for the intervening patella and ultimately improves fracture fixation strength.
Oh and colleagues15 reported on the clinical efficacy of a Krackow augment in distal pole patella repairs. Similarly, we found a Krackow augment to be efficacious, supporting its potential in clinical approaches to patella repairs. Our results indicate this augment can be a useful clinical adjunct in biomechanical evaluation.
Limitations of this study include its use of dissected extensor mechanisms, which may have less biofidelity than whole-knee specimens. In our model, specimens were secured at the patellar tendon and the quadriceps tendons, as opposed to the quadriceps tendon and the tibia distally. Use of this model could have led to an increase in early displacement during cyclic testing as a result of tissue slippage. Furthermore, our small sample size could have affected our ability to demonstrate a difference between these techniques.
Given its increased strength as demonstrated by mean displacement during cyclic loading and mean load to failure, as well as the early clinical data recently published, the Krackow suture augment represents a feasible technique for patella fixation. It likely will be most useful in cases in which conventional techniques are prone to failure or cannot be applied, such as severe distal comminution or poor bone density. Further biomechanical testing with a larger number of specimens may be required for statistical significance.
Conclusion
In patella fracture repair strategies, the Krackow suture augment increased strength when used with a MATB technique. Failure to reach statistical significance likely resulted from our small sample size. Further biomechanical testing and clinical studies are needed for more complete evaluation of this technique. We think it will be most useful in the setting of poor bone quality or severe comminution, which can limit fixation options. As increased repair strength allows earlier postoperative rehabilitation and maintains fracture reduction, patient outcomes should improve. This novel technique represents another strategy for managing challenging patella fractures.
1. Boström Å. Fracture of the patella. A study of 422 patellar fractures. Acta Orthop Scand Suppl. 1972;143:1-80.
2. Hungerford DS, Barry M. Biomechanics of the patellofemoral joint. Clin Orthop Relat Res. 1979;(144):9-15.
3. LeBrun CT, Langford JR, Sagi HC. Functional outcomes after operatively treated patella fractures. J Orthop Trauma. 2012;26(7):422-426.
4. Kaufer H. Mechanical function of the patella. J Bone Joint Surg Am. 1971;53(8):1551-1560.
5. Braun W, Wiedemann M, Rüter A, Kundel K, Kolbinger S. Indications and results of nonoperative treatment of patellar fractures. Clin Orthop Relat Res. 1993;(289):197-201.
6. Melvin JS, Mehta S. Patellar fractures in adults. J Am Acad Orthop Surg. 2011;19(4):198-207.
7. Müller M, Allgöwer M, Schneider R, Willeneger H. Manual of Internal Fixation: Techniques Recommended by the AO Group. Berlin, Germany: Springer; 1979.
8. Weber MJ, Janecki CJ, McLeod P, Nelson CL, Thompson JA. Efficacy of various forms of fixation of transverse fractures of the patella. J Bone Joint Surg Am. 1980;62(2):215-220.
9. Hung LK, Chan KM, Chow YN, Leung PC. Fractured patella: operative treatment using the tension band principle. Injury. 1985;16(5):343-347.
10. Berg EE. Open reduction internal fixation of displaced transverse patella fractures with figure-eight wiring through parallel cannulated compression screws. J Orthop Trauma. 1997;11(8):573-576.
11. Carpenter JE, Kasman RA, Patel N, Lee ML, Goldstein SA. Biomechanical evaluation of current patella fracture fixation techniques. J Orthop Trauma. 1997;11(5):351-356.
12. Hughes SC, Stott PM, Hearnden AJ, Ripley LG. A new and effective tension-band braided polyester suture technique for transverse patellar fracture fixation. Injury. 2007;38(2):212-222.
13. Rabalais RD, Burger E, Lu Y, Mansour A, Baratta RV. Comparison of two tension-band fixation materials and techniques in transverse patella fractures: a biomechanical study. Orthopedics. 2008;31(2):128.
14. Bryant TL, Anderson CL, Stevens CG, Conrad BP, Vincent HK, Sadasivan KK. Comparison of cannulated screws with FiberWire or stainless steel wire for patella fracture fixation: a pilot study. J Orthop. 2014;12(2):92-96.
15. Oh HK, Choo SK, Kim JW, Lee M. Internal fixation of displaced inferior pole of the patella fractures using vertical wiring augmented with Krachow suturing. Injury. 2015;46(12):2512-2515.
16. Goodfellow J, Hungerford DS, Zindel M. Patello-femoral joint mechanics and pathology. 1. Functional anatomy of the patello-femoral joint. J Bone Joint Surg Br. 1976;58(3):287-290.
17. Levack B, Flannagan JP, Hobbs S. Results of surgical treatment of patellar fractures. J Bone Joint Surg Br. 1985;67(3):416-419.
18. Lotke PA, Ecker ML. Transverse fractures of the patella. Clin Orthop Relat Res. 1981;(158):180-184.
19. Krackow KA, Thomas SC, Jones LC. Ligament-tendon fixation: analysis of a new stitch and comparison with standard techniques. Orthopedics. 1988;11(6):909-917.
20. Hahn JM, Inceoğlu S, Wongworawat MD. Biomechanical comparison of Krackow locking stitch versus nonlocking loop stitch with varying number of throws. Am J Sports Med. 2014;42(12):3003-3008.
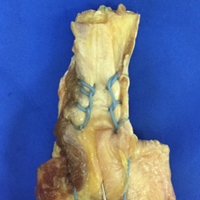
Transitioning from General Pediatric to Adult-Oriented Inpatient Care: National Survey of US Children’s Hospitals
Over 90% of children with chronic diseases now survive into adulthood.1,2 Clinical advances overcoming diseases previously fatal in childhood create new challenges for health systems with limited capacity to manage young adults with complicated and unfamiliar childhood-onset conditions. Consequently, improving the transition from pediatric to adult-oriented care has become a national priority.
Although major pediatric-adult transition initiatives—such as the Six Core Elements Framework,3 a technical brief from the Agency for Healthcare Research and Quality,4 and joint statements from major medical societies5,6—outline key transition recommendations generally and for outpatients, they contain limited or no guidance specifically devoted to transitioning inpatient hospital care from pediatric to adult-oriented settings. Key unknowns include whether, when, and how to transition inpatient care from children’s to nonchildren’s hospitals and how this can be integrated into comprehensive youth-adult transition care.
Nevertheless, the number of discharges of 18- to 21-year-old patients with chronic conditions admitted to children’s hospitals is increasing at a faster rate than discharges of other age groups,7 suggesting both that the population is growing in size and that there are important barriers to transitioning these patients into nonchildren’s hospital settings. Spending on adult patients 18 years or older admitted to children’s hospitals has grown to $1 billion annually.8 Hospitalizations are a commonly proposed outcome measure of pediatric-adult transition work.1,9,10 For example, higher rates of avoidable hospitalizations during early adulthood have been observed for 15- to 22-year-olds with kidney failure cared for exclusively in adult-oriented facilities and during the years immediately after transfer to adult care.11
While research is beginning to describe outcomes of adult-aged patients with childhood-onset chronic conditions admitted to children’s hospitals,7,12,13 there has been no comprehensive description of efforts within children’s hospitals to transition such patients into adult-oriented inpatient settings. This information is necessary to outline institutional needs, delineate opportunities for improvement, and help clinicians strategically organize services for patients requiring this transition.
We sought to characterize the current state of the transition from pediatric- to adult-oriented inpatient care across general pediatric inpatient services at US children’s hospitals. We hypothesized that only a limited and inconsistent set of activities would be practiced. We also hypothesized that institutions having formal outpatient transition processes or providers with specialization to care for this age group, such as dual-trained internal medicine–pediatrics (med–peds) physicians, would report performing more activities.
METHODS
Study Design, Setting, Participants
We conducted a national survey of leaders of inpatient general pediatrics services at US children’s hospitals from January 2016 to July 2016. Hospitals were identified using the online Children’s Hospital Association directory. Hospitals without inpatient general pediatrics services (eg, rehabilitation or subspecialty-only facilities) were excluded.
We identified a single respondent from each of the 195 remaining children’s hospitals using a structured protocol. Phone numbers and e-mail addresses of potential respondents were gathered from hospital or medical school directories. Following a standard script, study team members contacted potential respondents to describe the purpose of the study and to confirm their contact information. Hospitals were also allowed to designate a different individual with more specific expertise to participate, when relevant (eg, specific faculty member leading a related quality improvement initiative). The goal was to identify a leader of inpatient care with the most knowledge of institutional practices related to the transition to adult inpatient care. Examples of respondent roles included director of inpatient pediatrics, chief of hospital medicine or general pediatrics, medical director, and similar titles.
Survey Elements
As part of a larger quality improvement initiative at our institution, a multidisciplinary team of pediatric and internal medicine healthcare providers (physicians, nurse practitioners, nurses, case managers, social workers, child life specialists), as well as parents and patients, developed an “ideal state” with this transition and a consensus-based conceptual framework of key patient and institutional determinants of a formal inpatient transition initiative for children with chronic conditions within a children’s hospital (Figure). 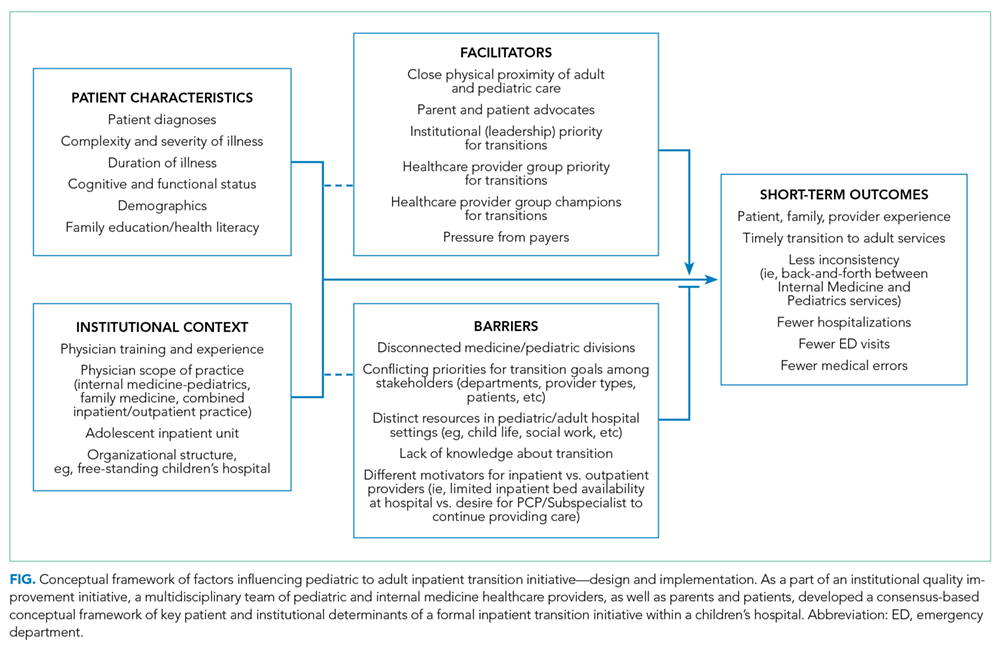
Institutional Context and Factors Influencing Inpatient Transitions
The following hospital characteristics were assessed: administrative structure (free-standing, hospital-within-hospital, or “free-leaning,” ie, separate physical structure but same administrative structure as a general hospital), urban versus rural, academic versus nonacademic, presence of an inpatient adolescent unit, presence of subspecialty admitting services, and providers with med–peds or family medicine training. The following provider group characteristics were assessed: number of full-time equivalents (FTEs), scope of practice (inpatient only, combination inpatient/outpatient), proportion of providers at a “senior” level (ie, at least 7 years posttraining or at an associate professor rank), estimated number of discharges per week, and proportion of patients cared for without resident physicians.
Inpatient Transition Initiative
Each institution was categorized as having or not having an inpatient transition initiative by whether they indicated having either (1) an institutional leader of the transition from pediatric to adult-oriented inpatient settings or (2) an inpatient transition process, for which “process” was defined as “a standard, organized, and predictable set of transition activities that may or may not be documented, but the steps are generally agreed upon.”
Specific Inpatient Transition Activities
Respondents indicated whether 22 activities occurred consistently, defined as at least 50% of the time. To facilitate description, activities were grouped into categories using the labels from the Six Core Elements framework3 (Table 1): Policy, Tracking and Monitoring, Readiness, Planning, Transfer of Care, and Transfer Completion. Respondents were also asked whether outpatient pediatric-adult transition activities existed at their institution and whether they were linked to inpatient transition activities.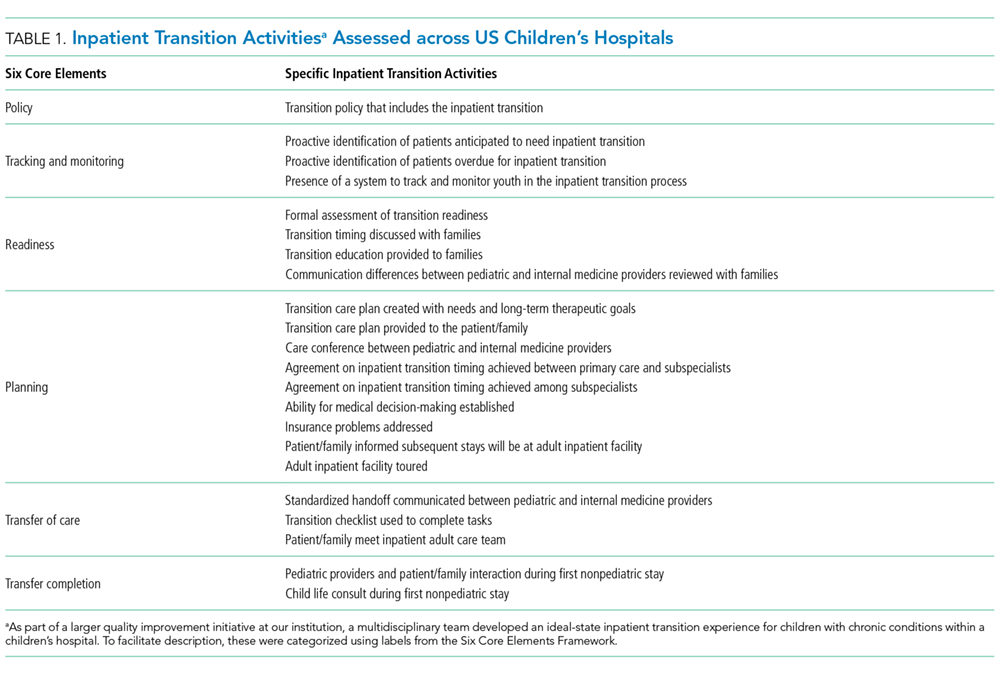
Data Collection
After verifying contact information, respondents received an advanced priming phone call followed by a mailed request to participate with a printed uniform resource locator (URL) to the web survey. Two email reminders containing the URL were sent to nonresponders at 5 and 10 days after the initial mailing. Remaining nonresponders then received a reminder phone call, followed by a mailed paper copy of the survey questionnaire to be completed by hand approximately 2 weeks after the last emailed request. The survey was administered using the Qualtrics web survey platform (www.qualtrics.com). Data collection occurred between January 2016 and July 2016. Participants received a $20 incentive.
Statistical Analysis
Descriptive statistics summarized the current state of inpatient transition at general pediatrics services across US children’s hospitals. Exploratory factor analysis assessed whether individual activities were sufficiently correlated to allow grouping items and constructing scales. Differences in institutional or respondent characteristics between hospitals that did and did not report having an inpatient initiative were compared using t tests for continuous data. Fisher’s exact test was used for categorical data because some cell sizes were ≤5. Bivariate logistic regression quantified associations between presence versus absence of specific transition activities and presence versus absence of an inpatient transition initiative. Analyses were completed in STATA (SE version 14.0; StataCorp, College Station, Texas). The institutional review board at our institution approved this study.
RESULTS
Responses were received from 96 of 195 children’s hospitals (49.2% response rate). Responding institution characteristics are summarized in Table 2. Free-standing children’s hospitals made up just over one-third of the sample (36%), while the remaining were free-leaning (22%) or hospital-within-hospital (43%). Most children’s hospitals (58%) did not have a specific adult-oriented hospital identified to receive transitioning patients. Slightly more than 10% had an inpatient adolescent unit. The majority of institutions were academic medical centers (78%) in urban locations (88%). Respondents represented small (<5 FTE, 21%), medium (6-10 FTE, 36%), and large provider groups (11+ FTE, 44%). Although 70% of respondents described their groups as “hospitalist only,” meaning providers only practiced inpatient general pediatrics, nearly 30% had providers practicing inpatient and outpatient general pediatrics. Just over 40% of respondents reported having med–peds providers. Pediatric-adult transition processes for outpatient care were present at 45% of institutions.
Transition Activities
Thirty-eight percent of children’s hospitals had an inpatient transition initiative using our study definition—31% by having a set of generally agreed upon activities, 19% by having a leader, and 11% having both. Inpatient transition leaders included pediatric hospitalists (43%), pediatric subspecialists and primary care providers (14% each), med–peds providers (11%), or case managers (7%). Respondent and institutional characteristics were similar at institutions that did and did not have an inpatient transition initiative (Table 2); however, children’s hospitals with inpatient transition initiatives more often had med–peds providers (P = .04). Institutions with pediatric-adult outpatient care transition processes more often had an inpatient initiative (71% and 29%, respectively; P = .001).
Exploratory factor analysis identified 2 groups of well-correlated items, which we grouped into “preparation” and “transfer initiation” scales (supplementary Appendix). The preparation scale was composed of the following 5 items (Cronbach α = 0.84): proactive identification of patients anticipated to need transition, proactive identification of patients overdue for transition, readiness formally assessed, timing discussed with family, and patient and/or family informed that the next stay would be at the adult facility. The transfer initiation scale comprised the following 6 items (Cronbach α = 0.72): transition education provided to families, primary care–subspecialist agreement on timing, subspecialist–subspecialist agreement on timing, patient decision-making ability established, adult facility tour, and standardized handoff communication between healthcare providers. While these items were analyzed only in this scale, other activities were analyzed as independent variables. In this analysis, 40.9% of institutions had a preparation scale score of 0 (no items performed), while 13% had all 5 items performed. Transfer initiation scale scores ranged from 0 (47%) to 6 (2%).
Specific activities varied widely across institutions, and none of the activities occurred at a majority of children’s hospitals (Table 3). Only 11% of children’s hospital transition policies referenced transitions of inpatient care. The activity most commonly reported across children’s hospitals was addressing potential insurance problems (41%). The least common inpatient transition activities were having child life consult during the first adult hospital stay (6%) or having a system to track and monitor youth in the inpatient transition process (2%). Transition processes and policies were relatively new among institutions that had them—average years an inpatient transition process had been in place was 1.2 (SD 0.4), and average years with a transition policy, including inpatient care, was 1.3 (SD 0.4).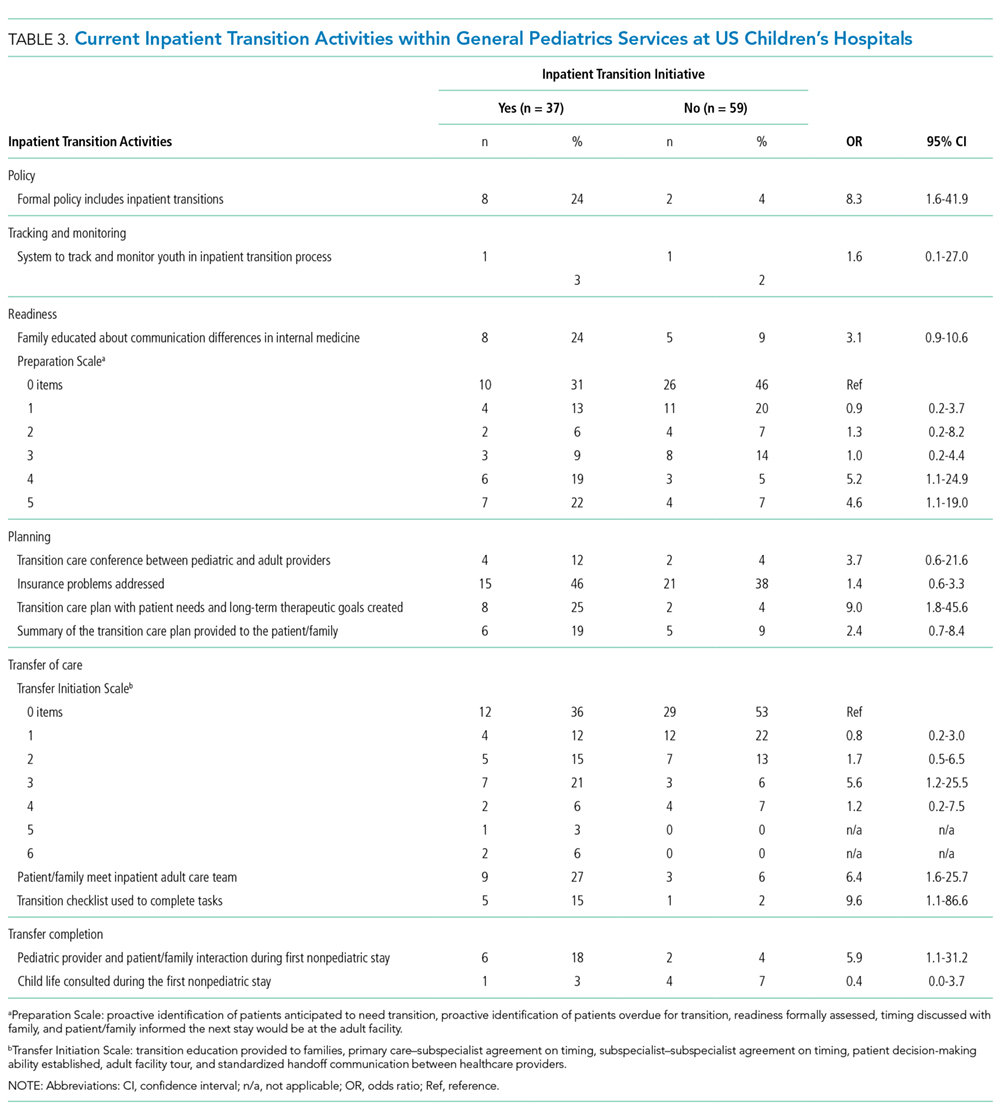
Transition Activities at Hospitals With and Without an Inpatient Transition Initiative
Most activities assessed in this study (both scales plus 5 of 11 individual activities) were significantly more common in children’s hospitals with an inpatient transition initiative (Table 3). The most common activity was addressing potential insurance problems (46%), and the least common activity was having a system to track and monitor youth in the inpatient transition process (3%). The majority of institutions without an inpatient transition initiative (53%) performed 0 transfer initiation scale items. Large effect sizes between hospitals with and without a transition initiative were observed for use of a checklist to complete tasks (odds ratio [OR] 9.6, P = .04) and creation of a transition care plan (OR 9.0, P = .008). Of the 6 activities performed at similarly low frequencies at institutions with and without an initiative, half involved transition planning, the essential step after readiness but before actual transfer of care.
DISCUSSION
We conducted the first national survey describing the policies and procedures of the transition of general inpatient care from children’s to adult-oriented hospitals for youth and young adults with chronic conditions. Our main findings demonstrate that a relatively small number of general inpatient services at children’s hospitals have leaders or dedicated processes to shepherd this transition, and a minority have a specific adult hospital identified to receive their patients. Even among institutions with inpatient transition initiatives, there is wide variability in the performance of activities to facilitate transitioning out of US children’s hospitals. In these institutions, performance seems to be more lacking in later links of the transition chain. Results from this work can serve as a baseline and identify organizational needs and opportunities for future work.
Children’s hospital general services with and without an inpatient pediatric-adult transition initiative had largely similar characteristics; however, the limited sample size may lack power to detect some differences. Perhaps not surprisingly, having med–peds providers and outpatient transition processes were the characteristics most associated with having an inpatient pediatric-adult transition initiative. The observation that over 70% of hospitals with an outpatient process had an inpatient transition leader or dedicated process makes us optimistic that as general transition efforts expand, more robust inpatient transition activities may be achievable.
We appreciate that the most appropriate location to care for hospitalized young adults with childhood-onset chronic conditions is neither known nor answered with this study. Both options face challenges—adult-oriented hospitals may not be equipped to care for adult manifestations of childhood-onset conditions,14,15 while children’s hospitals may lack the resources and expertise to provide comprehensive care to adults.7 Although hospital charges and lengths of stay may be greater when adults with childhood-onset chronic conditions are admitted to children’s compared with adult hospitals,12,13,16 important confounders such as severity of illness could explain why adult-aged patients may both remain in children’s hospitals at older ages and simultaneously have worse outcomes than peers. Regardless, at some point, transitioning care into an adult-oriented hospital may be in patients’ best interests. If so, families and providers need guidance on (1) the important aspects of this transition and (2) how to effectively implement the transition.
Because the most important inpatient transition care activities are not empirically known, we designed our survey to assess a broad set of desirable activities emerging from our multidisciplinary quality improvement work. We mapped these activities to the categories used by the Six Core Elements framework.3 Addressing insurance issues was one of the most commonly reported activities, although still fewer than 50% of hospitals reported addressing these problems. It was notable that the majority of institutions without a transition initiative performed none of the transfer initiation scale items. In addition, 2 features of transition efforts highlighted by advocates nationally—use of a checklist and creation of a transition care plan— were 9 times more likely when sites had transition initiatives. Such findings may be motivating for institutions that are considering establishing a transition initiative. Overall, we were not surprised with hospitals’ relatively low performance across most transition activities because only about 40% of US families of children with special healthcare needs report receiving the general services they need to transition to adult healthcare.17
We suspect that a number of the studied inpatient transition activities may be uncommon for structural reasons. For example, having child life consultation during an initial adult stay was rare. In fact, we observed post hoc that it occurred only in hospital-within-hospital systems, an expected finding because adult-only facilities are unlikely to have child life personnel. Other barriers, however, are less obviously structural. Almost no respondents indicated providing a tour of an adult facility, which was true whether the children’s hospital was free-standing or hospital-within-hospital. Given that hospitals with med–peds providers more often had inpatient transition initiatives, it would be interesting to examine whether institutions with med–peds training programs are able to overcome more of these barriers because of the bridges inherently created between departments even when at physically separated sites.
Having a system to track and/or monitor youth going through the transition process was also uncommon. This presumably valuable activity is one of the Six Core Elements3 and is reminiscent of population management strategies increasingly common in primary care.18 Pediatric hospitalists might benefit from adopting a similar philosophy for certain patient populations. Determining whether this activity would be most appropriately managed by inpatient providers versus being integrated into a comprehensive tracking and/or monitoring strategy (ie, inpatient care plus primary care, subspecialty care, school, employment, insurance, etc.) is worth continued consideration.
Although the activities we studied spanned many important dimensions, the most important transition activities in any given context may differ based on institutional resources and those of nearby adult healthcare providers.16 For example, an activity may be absent at a children’s hospital because it is already readily handled in primary care within that health system. Understanding how local resources and patient needs influence the relationship between transition activities and outcomes is an important next step in this line of work. Such research could inform how institutions adapt effective transition activities (eg, developing care plans) to most efficiently meet the needs of their patients and families.
Our findings align with and advance the limited work published on this aspect of transition. A systematic literature review of general healthcare transition interventions found that meeting adult providers prior to transitioning out of the pediatric system was associated with less concern about admission to the adult hospital floor.9 Formally recognizing inpatient care as a part of a comprehensive approach to transition may help adults with childhood-onset chronic conditions progress into adult-oriented hospitals. Inpatient and outpatient providers can educate one another on critical aspects of transition that span across settings. The Cystic Fibrosis (CF) Foundation has established a set of processes to facilitate the transition to adult care and specifically articulates the transfer to adult inpatient settings.19,20 Perhaps as a result, CF is also one of few conditions with fewer adult patients being admitted to children’s hospitals7 despite the increasing number of adults living with the condition.19 Adapting the CF Foundation approach to other chronic conditions may be an effective approach.
Our study has important limitations. Most pertinently, the list of transition activities was developed at a single institution. Although drawing on accepted national guidelines and a diverse local quality improvement group, our listed activities could not be exhaustive. Care plan development and posttransition follow-up activities may benefit from ongoing development in subsequent work. Continuing to identify and integrate approaches taken at other children’s hospitals will also be informative. For example, some children’s hospitals have introduced adult medicine consultative services to focus on transition, attending children’s hospital safety rounds, and sharing standard care protocols for adult patients still cared for in pediatric settings (eg, stroke and myocardial infarction).16
In addition, our findings are limited to generalist teams at children’s hospitals and may not be applicable to inpatient subspecialty services. We could not compare differences in respondents versus nonrespondents to determine whether important selection bias exists. Respondent answers could not be verified. Despite our attempt to identify the most informed respondent at each hospital, responses may have differed with other hospital respondents. We used a novel instrument with unknown psychometric properties. Our data provide only the children’s hospital perspective, and perspectives of others (eg, families, primary care pediatricians or internists, subspecialists, etc.) will be valuable to explore in subsequent research. Subsequent research should investigate the relative importance and feasibility of specific inpatient transition activities, ideal timing, as well as the expected outcomes of high-quality inpatient transition. An important question for future work is to identify which patients are most likely to benefit by having inpatient care as part of their transition plan.
CONCLUSIONS
Nevertheless, the clinical and health services implications of this facet of transition appear to be substantial.16 To meet the Maternal and Child Health Bureau (MCHB) core outcome for children with special healthcare needs to receive “the services necessary to make transitions to adult healthcare,”21 development, validation, and implementation of effective inpatient-specific transition activities and a set of measurable processes and outcomes are needed. A key direction for the healthcare transitions field, with respect to inpatient care, is to determine the activities most effective at improving relevant patient and family outcomes. Ultimately, we advocate that the transition of inpatient care be integrated into comprehensive approaches to transitional care.
Disclosure: The project described was supported in part by the Clinical and Translational Science Award (CTSA) program, through the National Institutes of Health (NIH) National Center for Advancing Translational Sciences (NCATS), grant UL1TR000427. The content is solely the responsibility of the authors and does not necessarily represent the official views of the NIH. The project was also supported by the University of Wisconsin Departments of Pediatrics and Medicine. The authors have no financial or other relationships relevant to this article to disclose.
1. Vaks Y, Bensen R, Steidtmann D, et al. Better health, less spending: Redesigning the transition from pediatric to adult healthcare for youth with chronic illness. Healthc (Amst). 2016;4(1):57-68.
2. Bensen R, Steidtmann D, Vaks Y. A Triple Aim Approach to Transition from Pediatric to Adult Health Care for Youth with Special Health Care Needs. Palo Alto, CA: Lucile Packard Foundation for Children’s Health; 2014.
3. Got Transition. Center for Health Care Transition Improvement 2016; http://www.gottransition.org/. Accessed April 4, 2016.
4. McPheeters M, Davis AM, Taylor JL, Brown RF, Potter SA, Epstein RA. Transition Care for Children with Special Health Needs. Technical Brief No. 15. Rockville, MD: Agency for Healthcare Research and Quality; 2014.
5. American Academy of Pediatrics, American Academy of Family Physicians, American College of Physicians, Transitions Clinical Report Authoring Group, Cooley WC, Sagerman PJ. Supporting the health care transition from adolescence to adulthood in the medical home. Pediatrics. 2011;128(1):182-200.
6. American Academy of Pediatrics, American Academy of Family Physicians, American College of Physicians-American Society of Internal Medicine. A consensus statement on health care transitions for young adults with special health care needs. Pediatrics. 2002;110(6 Pt 2):1304-1306.
7. Goodman DM, Hall M, Levin A, et al. Adults with chronic health conditions originating in childhood: inpatient experience in children’s hospitals. Pediatrics. 2011;128(1):5-13.
8. Goodman DM, Mendez E, Throop C, Ogata ES. Adult survivors of pediatric illness: the impact on pediatric hospitals. Pediatrics. 2002;110(3):583-589.
9. Bloom SR, Kuhlthau K, Van Cleave J, Knapp AA, Newacheck P, Perrin JM. Health care transition for youth with special health care needs. J Adolesc Health. 2012;51(3):213-219.
10. Fair C, Cuttance J, Sharma N, et al. International and Interdisciplinary Identification of Health Care Transition Outcomes. JAMA Pediatr. 2016;170(3):205-211.
11. Samuel SM, Nettel-Aguirre A, Soo A, Hemmelgarn B, Tonelli M, Foster B. Avoidable hospitalizations in youth with kidney failure after transfer to or with only adult care. Pediatrics. 2014;133(4):e993-e1000.
12. Okumura MJ, Campbell AD, Nasr SZ, Davis MM. Inpatient health care use among adult survivors of chronic childhood illnesses in the United States. Arch Pediatr Adolesc Med. 2006;160(10):1054-1060.
13. Edwards JD, Houtrow AJ, Vasilevskis EE, Dudley RA, Okumura MJ. Multi-institutional profile of adults admitted to pediatric intensive care units. JAMA Pediatr. 2013;167(5):436-443.
14. Peter NG, Forke CM, Ginsburg KR, Schwarz DF. Transition from pediatric to adult care: internists’ perspectives. Pediatrics. 2009;123(2):417-423.
15. Okumura MJ, Heisler M, Davis MM, Cabana MD, Demonner S, Kerr EA. Comfort of general internists and general pediatricians in providing care for young adults with chronic illnesses of childhood. J Gen Intern Med. 2008;23(10):1621-1627.
16. Kinnear B, O’Toole JK. Care of Adults in Children’s Hospitals: Acknowledging the Aging Elephant in the Room. JAMA Pediatr. 2015;169(12):1081-1082.
17. McManus MA, Pollack LR, Cooley WC, et al. Current status of transition preparation among youth with special needs in the United States. Pediatrics. 2013;131(6):1090-1097.
18. Kelleher KJ, Cooper J, Deans K, et al. Cost saving and quality of care in a pediatric accountable care organization. Pediatrics. 2015;135(3):e582-e589.
19. Tuchman LK, Schwartz LA, Sawicki GS, Britto MT. Cystic fibrosis and transition to adult medical care. Pediatrics. 2010;125(3):566-573.
20. Yankaskas JR, Marshall BC, Sufian B, Simon RH, Rodman D. Cystic fibrosis adult care: consensus conference report. Chest. 2004;125(1 Suppl):1S-39S.
21. CSHCN Core System Outcomes: Goals for a System of Care. The National Survey of Children with Special Health Care Needs Chartbook 2009-2010. http://mchb.hrsa.gov/cshcn0910/core/co.html Accessed November 30, 2016.
Over 90% of children with chronic diseases now survive into adulthood.1,2 Clinical advances overcoming diseases previously fatal in childhood create new challenges for health systems with limited capacity to manage young adults with complicated and unfamiliar childhood-onset conditions. Consequently, improving the transition from pediatric to adult-oriented care has become a national priority.
Although major pediatric-adult transition initiatives—such as the Six Core Elements Framework,3 a technical brief from the Agency for Healthcare Research and Quality,4 and joint statements from major medical societies5,6—outline key transition recommendations generally and for outpatients, they contain limited or no guidance specifically devoted to transitioning inpatient hospital care from pediatric to adult-oriented settings. Key unknowns include whether, when, and how to transition inpatient care from children’s to nonchildren’s hospitals and how this can be integrated into comprehensive youth-adult transition care.
Nevertheless, the number of discharges of 18- to 21-year-old patients with chronic conditions admitted to children’s hospitals is increasing at a faster rate than discharges of other age groups,7 suggesting both that the population is growing in size and that there are important barriers to transitioning these patients into nonchildren’s hospital settings. Spending on adult patients 18 years or older admitted to children’s hospitals has grown to $1 billion annually.8 Hospitalizations are a commonly proposed outcome measure of pediatric-adult transition work.1,9,10 For example, higher rates of avoidable hospitalizations during early adulthood have been observed for 15- to 22-year-olds with kidney failure cared for exclusively in adult-oriented facilities and during the years immediately after transfer to adult care.11
While research is beginning to describe outcomes of adult-aged patients with childhood-onset chronic conditions admitted to children’s hospitals,7,12,13 there has been no comprehensive description of efforts within children’s hospitals to transition such patients into adult-oriented inpatient settings. This information is necessary to outline institutional needs, delineate opportunities for improvement, and help clinicians strategically organize services for patients requiring this transition.
We sought to characterize the current state of the transition from pediatric- to adult-oriented inpatient care across general pediatric inpatient services at US children’s hospitals. We hypothesized that only a limited and inconsistent set of activities would be practiced. We also hypothesized that institutions having formal outpatient transition processes or providers with specialization to care for this age group, such as dual-trained internal medicine–pediatrics (med–peds) physicians, would report performing more activities.
METHODS
Study Design, Setting, Participants
We conducted a national survey of leaders of inpatient general pediatrics services at US children’s hospitals from January 2016 to July 2016. Hospitals were identified using the online Children’s Hospital Association directory. Hospitals without inpatient general pediatrics services (eg, rehabilitation or subspecialty-only facilities) were excluded.
We identified a single respondent from each of the 195 remaining children’s hospitals using a structured protocol. Phone numbers and e-mail addresses of potential respondents were gathered from hospital or medical school directories. Following a standard script, study team members contacted potential respondents to describe the purpose of the study and to confirm their contact information. Hospitals were also allowed to designate a different individual with more specific expertise to participate, when relevant (eg, specific faculty member leading a related quality improvement initiative). The goal was to identify a leader of inpatient care with the most knowledge of institutional practices related to the transition to adult inpatient care. Examples of respondent roles included director of inpatient pediatrics, chief of hospital medicine or general pediatrics, medical director, and similar titles.
Survey Elements
As part of a larger quality improvement initiative at our institution, a multidisciplinary team of pediatric and internal medicine healthcare providers (physicians, nurse practitioners, nurses, case managers, social workers, child life specialists), as well as parents and patients, developed an “ideal state” with this transition and a consensus-based conceptual framework of key patient and institutional determinants of a formal inpatient transition initiative for children with chronic conditions within a children’s hospital (Figure).
Institutional Context and Factors Influencing Inpatient Transitions
The following hospital characteristics were assessed: administrative structure (free-standing, hospital-within-hospital, or “free-leaning,” ie, separate physical structure but same administrative structure as a general hospital), urban versus rural, academic versus nonacademic, presence of an inpatient adolescent unit, presence of subspecialty admitting services, and providers with med–peds or family medicine training. The following provider group characteristics were assessed: number of full-time equivalents (FTEs), scope of practice (inpatient only, combination inpatient/outpatient), proportion of providers at a “senior” level (ie, at least 7 years posttraining or at an associate professor rank), estimated number of discharges per week, and proportion of patients cared for without resident physicians.
Inpatient Transition Initiative
Each institution was categorized as having or not having an inpatient transition initiative by whether they indicated having either (1) an institutional leader of the transition from pediatric to adult-oriented inpatient settings or (2) an inpatient transition process, for which “process” was defined as “a standard, organized, and predictable set of transition activities that may or may not be documented, but the steps are generally agreed upon.”
Specific Inpatient Transition Activities
Respondents indicated whether 22 activities occurred consistently, defined as at least 50% of the time. To facilitate description, activities were grouped into categories using the labels from the Six Core Elements framework3 (Table 1): Policy, Tracking and Monitoring, Readiness, Planning, Transfer of Care, and Transfer Completion. Respondents were also asked whether outpatient pediatric-adult transition activities existed at their institution and whether they were linked to inpatient transition activities.
Data Collection
After verifying contact information, respondents received an advanced priming phone call followed by a mailed request to participate with a printed uniform resource locator (URL) to the web survey. Two email reminders containing the URL were sent to nonresponders at 5 and 10 days after the initial mailing. Remaining nonresponders then received a reminder phone call, followed by a mailed paper copy of the survey questionnaire to be completed by hand approximately 2 weeks after the last emailed request. The survey was administered using the Qualtrics web survey platform (www.qualtrics.com). Data collection occurred between January 2016 and July 2016. Participants received a $20 incentive.
Statistical Analysis
Descriptive statistics summarized the current state of inpatient transition at general pediatrics services across US children’s hospitals. Exploratory factor analysis assessed whether individual activities were sufficiently correlated to allow grouping items and constructing scales. Differences in institutional or respondent characteristics between hospitals that did and did not report having an inpatient initiative were compared using t tests for continuous data. Fisher’s exact test was used for categorical data because some cell sizes were ≤5. Bivariate logistic regression quantified associations between presence versus absence of specific transition activities and presence versus absence of an inpatient transition initiative. Analyses were completed in STATA (SE version 14.0; StataCorp, College Station, Texas). The institutional review board at our institution approved this study.
RESULTS
Responses were received from 96 of 195 children’s hospitals (49.2% response rate). Responding institution characteristics are summarized in Table 2. Free-standing children’s hospitals made up just over one-third of the sample (36%), while the remaining were free-leaning (22%) or hospital-within-hospital (43%). Most children’s hospitals (58%) did not have a specific adult-oriented hospital identified to receive transitioning patients. Slightly more than 10% had an inpatient adolescent unit. The majority of institutions were academic medical centers (78%) in urban locations (88%). Respondents represented small (<5 FTE, 21%), medium (6-10 FTE, 36%), and large provider groups (11+ FTE, 44%). Although 70% of respondents described their groups as “hospitalist only,” meaning providers only practiced inpatient general pediatrics, nearly 30% had providers practicing inpatient and outpatient general pediatrics. Just over 40% of respondents reported having med–peds providers. Pediatric-adult transition processes for outpatient care were present at 45% of institutions.
Transition Activities
Thirty-eight percent of children’s hospitals had an inpatient transition initiative using our study definition—31% by having a set of generally agreed upon activities, 19% by having a leader, and 11% having both. Inpatient transition leaders included pediatric hospitalists (43%), pediatric subspecialists and primary care providers (14% each), med–peds providers (11%), or case managers (7%). Respondent and institutional characteristics were similar at institutions that did and did not have an inpatient transition initiative (Table 2); however, children’s hospitals with inpatient transition initiatives more often had med–peds providers (P = .04). Institutions with pediatric-adult outpatient care transition processes more often had an inpatient initiative (71% and 29%, respectively; P = .001).
Exploratory factor analysis identified 2 groups of well-correlated items, which we grouped into “preparation” and “transfer initiation” scales (supplementary Appendix). The preparation scale was composed of the following 5 items (Cronbach α = 0.84): proactive identification of patients anticipated to need transition, proactive identification of patients overdue for transition, readiness formally assessed, timing discussed with family, and patient and/or family informed that the next stay would be at the adult facility. The transfer initiation scale comprised the following 6 items (Cronbach α = 0.72): transition education provided to families, primary care–subspecialist agreement on timing, subspecialist–subspecialist agreement on timing, patient decision-making ability established, adult facility tour, and standardized handoff communication between healthcare providers. While these items were analyzed only in this scale, other activities were analyzed as independent variables. In this analysis, 40.9% of institutions had a preparation scale score of 0 (no items performed), while 13% had all 5 items performed. Transfer initiation scale scores ranged from 0 (47%) to 6 (2%).
Specific activities varied widely across institutions, and none of the activities occurred at a majority of children’s hospitals (Table 3). Only 11% of children’s hospital transition policies referenced transitions of inpatient care. The activity most commonly reported across children’s hospitals was addressing potential insurance problems (41%). The least common inpatient transition activities were having child life consult during the first adult hospital stay (6%) or having a system to track and monitor youth in the inpatient transition process (2%). Transition processes and policies were relatively new among institutions that had them—average years an inpatient transition process had been in place was 1.2 (SD 0.4), and average years with a transition policy, including inpatient care, was 1.3 (SD 0.4).
Transition Activities at Hospitals With and Without an Inpatient Transition Initiative
Most activities assessed in this study (both scales plus 5 of 11 individual activities) were significantly more common in children’s hospitals with an inpatient transition initiative (Table 3). The most common activity was addressing potential insurance problems (46%), and the least common activity was having a system to track and monitor youth in the inpatient transition process (3%). The majority of institutions without an inpatient transition initiative (53%) performed 0 transfer initiation scale items. Large effect sizes between hospitals with and without a transition initiative were observed for use of a checklist to complete tasks (odds ratio [OR] 9.6, P = .04) and creation of a transition care plan (OR 9.0, P = .008). Of the 6 activities performed at similarly low frequencies at institutions with and without an initiative, half involved transition planning, the essential step after readiness but before actual transfer of care.
DISCUSSION
We conducted the first national survey describing the policies and procedures of the transition of general inpatient care from children’s to adult-oriented hospitals for youth and young adults with chronic conditions. Our main findings demonstrate that a relatively small number of general inpatient services at children’s hospitals have leaders or dedicated processes to shepherd this transition, and a minority have a specific adult hospital identified to receive their patients. Even among institutions with inpatient transition initiatives, there is wide variability in the performance of activities to facilitate transitioning out of US children’s hospitals. In these institutions, performance seems to be more lacking in later links of the transition chain. Results from this work can serve as a baseline and identify organizational needs and opportunities for future work.
Children’s hospital general services with and without an inpatient pediatric-adult transition initiative had largely similar characteristics; however, the limited sample size may lack power to detect some differences. Perhaps not surprisingly, having med–peds providers and outpatient transition processes were the characteristics most associated with having an inpatient pediatric-adult transition initiative. The observation that over 70% of hospitals with an outpatient process had an inpatient transition leader or dedicated process makes us optimistic that as general transition efforts expand, more robust inpatient transition activities may be achievable.
We appreciate that the most appropriate location to care for hospitalized young adults with childhood-onset chronic conditions is neither known nor answered with this study. Both options face challenges—adult-oriented hospitals may not be equipped to care for adult manifestations of childhood-onset conditions,14,15 while children’s hospitals may lack the resources and expertise to provide comprehensive care to adults.7 Although hospital charges and lengths of stay may be greater when adults with childhood-onset chronic conditions are admitted to children’s compared with adult hospitals,12,13,16 important confounders such as severity of illness could explain why adult-aged patients may both remain in children’s hospitals at older ages and simultaneously have worse outcomes than peers. Regardless, at some point, transitioning care into an adult-oriented hospital may be in patients’ best interests. If so, families and providers need guidance on (1) the important aspects of this transition and (2) how to effectively implement the transition.
Because the most important inpatient transition care activities are not empirically known, we designed our survey to assess a broad set of desirable activities emerging from our multidisciplinary quality improvement work. We mapped these activities to the categories used by the Six Core Elements framework.3 Addressing insurance issues was one of the most commonly reported activities, although still fewer than 50% of hospitals reported addressing these problems. It was notable that the majority of institutions without a transition initiative performed none of the transfer initiation scale items. In addition, 2 features of transition efforts highlighted by advocates nationally—use of a checklist and creation of a transition care plan— were 9 times more likely when sites had transition initiatives. Such findings may be motivating for institutions that are considering establishing a transition initiative. Overall, we were not surprised with hospitals’ relatively low performance across most transition activities because only about 40% of US families of children with special healthcare needs report receiving the general services they need to transition to adult healthcare.17
We suspect that a number of the studied inpatient transition activities may be uncommon for structural reasons. For example, having child life consultation during an initial adult stay was rare. In fact, we observed post hoc that it occurred only in hospital-within-hospital systems, an expected finding because adult-only facilities are unlikely to have child life personnel. Other barriers, however, are less obviously structural. Almost no respondents indicated providing a tour of an adult facility, which was true whether the children’s hospital was free-standing or hospital-within-hospital. Given that hospitals with med–peds providers more often had inpatient transition initiatives, it would be interesting to examine whether institutions with med–peds training programs are able to overcome more of these barriers because of the bridges inherently created between departments even when at physically separated sites.
Having a system to track and/or monitor youth going through the transition process was also uncommon. This presumably valuable activity is one of the Six Core Elements3 and is reminiscent of population management strategies increasingly common in primary care.18 Pediatric hospitalists might benefit from adopting a similar philosophy for certain patient populations. Determining whether this activity would be most appropriately managed by inpatient providers versus being integrated into a comprehensive tracking and/or monitoring strategy (ie, inpatient care plus primary care, subspecialty care, school, employment, insurance, etc.) is worth continued consideration.
Although the activities we studied spanned many important dimensions, the most important transition activities in any given context may differ based on institutional resources and those of nearby adult healthcare providers.16 For example, an activity may be absent at a children’s hospital because it is already readily handled in primary care within that health system. Understanding how local resources and patient needs influence the relationship between transition activities and outcomes is an important next step in this line of work. Such research could inform how institutions adapt effective transition activities (eg, developing care plans) to most efficiently meet the needs of their patients and families.
Our findings align with and advance the limited work published on this aspect of transition. A systematic literature review of general healthcare transition interventions found that meeting adult providers prior to transitioning out of the pediatric system was associated with less concern about admission to the adult hospital floor.9 Formally recognizing inpatient care as a part of a comprehensive approach to transition may help adults with childhood-onset chronic conditions progress into adult-oriented hospitals. Inpatient and outpatient providers can educate one another on critical aspects of transition that span across settings. The Cystic Fibrosis (CF) Foundation has established a set of processes to facilitate the transition to adult care and specifically articulates the transfer to adult inpatient settings.19,20 Perhaps as a result, CF is also one of few conditions with fewer adult patients being admitted to children’s hospitals7 despite the increasing number of adults living with the condition.19 Adapting the CF Foundation approach to other chronic conditions may be an effective approach.
Our study has important limitations. Most pertinently, the list of transition activities was developed at a single institution. Although drawing on accepted national guidelines and a diverse local quality improvement group, our listed activities could not be exhaustive. Care plan development and posttransition follow-up activities may benefit from ongoing development in subsequent work. Continuing to identify and integrate approaches taken at other children’s hospitals will also be informative. For example, some children’s hospitals have introduced adult medicine consultative services to focus on transition, attending children’s hospital safety rounds, and sharing standard care protocols for adult patients still cared for in pediatric settings (eg, stroke and myocardial infarction).16
In addition, our findings are limited to generalist teams at children’s hospitals and may not be applicable to inpatient subspecialty services. We could not compare differences in respondents versus nonrespondents to determine whether important selection bias exists. Respondent answers could not be verified. Despite our attempt to identify the most informed respondent at each hospital, responses may have differed with other hospital respondents. We used a novel instrument with unknown psychometric properties. Our data provide only the children’s hospital perspective, and perspectives of others (eg, families, primary care pediatricians or internists, subspecialists, etc.) will be valuable to explore in subsequent research. Subsequent research should investigate the relative importance and feasibility of specific inpatient transition activities, ideal timing, as well as the expected outcomes of high-quality inpatient transition. An important question for future work is to identify which patients are most likely to benefit by having inpatient care as part of their transition plan.
CONCLUSIONS
Nevertheless, the clinical and health services implications of this facet of transition appear to be substantial.16 To meet the Maternal and Child Health Bureau (MCHB) core outcome for children with special healthcare needs to receive “the services necessary to make transitions to adult healthcare,”21 development, validation, and implementation of effective inpatient-specific transition activities and a set of measurable processes and outcomes are needed. A key direction for the healthcare transitions field, with respect to inpatient care, is to determine the activities most effective at improving relevant patient and family outcomes. Ultimately, we advocate that the transition of inpatient care be integrated into comprehensive approaches to transitional care.
Disclosure: The project described was supported in part by the Clinical and Translational Science Award (CTSA) program, through the National Institutes of Health (NIH) National Center for Advancing Translational Sciences (NCATS), grant UL1TR000427. The content is solely the responsibility of the authors and does not necessarily represent the official views of the NIH. The project was also supported by the University of Wisconsin Departments of Pediatrics and Medicine. The authors have no financial or other relationships relevant to this article to disclose.
1. Vaks Y, Bensen R, Steidtmann D, et al. Better health, less spending: Redesigning the transition from pediatric to adult healthcare for youth with chronic illness. Healthc (Amst). 2016;4(1):57-68.
2. Bensen R, Steidtmann D, Vaks Y. A Triple Aim Approach to Transition from Pediatric to Adult Health Care for Youth with Special Health Care Needs. Palo Alto, CA: Lucile Packard Foundation for Children’s Health; 2014.
3. Got Transition. Center for Health Care Transition Improvement 2016; http://www.gottransition.org/. Accessed April 4, 2016.
4. McPheeters M, Davis AM, Taylor JL, Brown RF, Potter SA, Epstein RA. Transition Care for Children with Special Health Needs. Technical Brief No. 15. Rockville, MD: Agency for Healthcare Research and Quality; 2014.
5. American Academy of Pediatrics, American Academy of Family Physicians, American College of Physicians, Transitions Clinical Report Authoring Group, Cooley WC, Sagerman PJ. Supporting the health care transition from adolescence to adulthood in the medical home. Pediatrics. 2011;128(1):182-200.
6. American Academy of Pediatrics, American Academy of Family Physicians, American College of Physicians-American Society of Internal Medicine. A consensus statement on health care transitions for young adults with special health care needs. Pediatrics. 2002;110(6 Pt 2):1304-1306.
7. Goodman DM, Hall M, Levin A, et al. Adults with chronic health conditions originating in childhood: inpatient experience in children’s hospitals. Pediatrics. 2011;128(1):5-13.
8. Goodman DM, Mendez E, Throop C, Ogata ES. Adult survivors of pediatric illness: the impact on pediatric hospitals. Pediatrics. 2002;110(3):583-589.
9. Bloom SR, Kuhlthau K, Van Cleave J, Knapp AA, Newacheck P, Perrin JM. Health care transition for youth with special health care needs. J Adolesc Health. 2012;51(3):213-219.
10. Fair C, Cuttance J, Sharma N, et al. International and Interdisciplinary Identification of Health Care Transition Outcomes. JAMA Pediatr. 2016;170(3):205-211.
11. Samuel SM, Nettel-Aguirre A, Soo A, Hemmelgarn B, Tonelli M, Foster B. Avoidable hospitalizations in youth with kidney failure after transfer to or with only adult care. Pediatrics. 2014;133(4):e993-e1000.
12. Okumura MJ, Campbell AD, Nasr SZ, Davis MM. Inpatient health care use among adult survivors of chronic childhood illnesses in the United States. Arch Pediatr Adolesc Med. 2006;160(10):1054-1060.
13. Edwards JD, Houtrow AJ, Vasilevskis EE, Dudley RA, Okumura MJ. Multi-institutional profile of adults admitted to pediatric intensive care units. JAMA Pediatr. 2013;167(5):436-443.
14. Peter NG, Forke CM, Ginsburg KR, Schwarz DF. Transition from pediatric to adult care: internists’ perspectives. Pediatrics. 2009;123(2):417-423.
15. Okumura MJ, Heisler M, Davis MM, Cabana MD, Demonner S, Kerr EA. Comfort of general internists and general pediatricians in providing care for young adults with chronic illnesses of childhood. J Gen Intern Med. 2008;23(10):1621-1627.
16. Kinnear B, O’Toole JK. Care of Adults in Children’s Hospitals: Acknowledging the Aging Elephant in the Room. JAMA Pediatr. 2015;169(12):1081-1082.
17. McManus MA, Pollack LR, Cooley WC, et al. Current status of transition preparation among youth with special needs in the United States. Pediatrics. 2013;131(6):1090-1097.
18. Kelleher KJ, Cooper J, Deans K, et al. Cost saving and quality of care in a pediatric accountable care organization. Pediatrics. 2015;135(3):e582-e589.
19. Tuchman LK, Schwartz LA, Sawicki GS, Britto MT. Cystic fibrosis and transition to adult medical care. Pediatrics. 2010;125(3):566-573.
20. Yankaskas JR, Marshall BC, Sufian B, Simon RH, Rodman D. Cystic fibrosis adult care: consensus conference report. Chest. 2004;125(1 Suppl):1S-39S.
21. CSHCN Core System Outcomes: Goals for a System of Care. The National Survey of Children with Special Health Care Needs Chartbook 2009-2010. http://mchb.hrsa.gov/cshcn0910/core/co.html Accessed November 30, 2016.
© 2018 Society of Hospital Medicine
Characterizing Hospitalist Practice and Perceptions of Critical Care Delivery
Despite calls for board-certified intensivist physicians to lead critical care delivery,1-3 the intensivist shortage in the United States continues to worsen,4 with projected shortfalls of 22% by 2020 and 35% by 2030.5 Many hospitals currently have inadequate or no board-certified intensivist support.6 The intensivist shortage has necessitated the development of alternative intensive care unit (ICU) staffing models, including engagement in telemedicine,7 the utilization of advanced practice providers,8 and dependence on hospitalists9 to deliver critical care services to ICU patients. Presently, research does not clearly show consistent differences in clinical outcomes based on the training of the clinical provider, although optimized teamwork and team rounds in the ICU do seem to be associated with improved outcomes.10-12
In its 2016 annual survey of hospital medicine (HM) leaders, the Society of Hospital Medicine (SHM) documented that most HM groups care for ICU patients, with up to 80% of hospitalist groups in some regions delivering critical care.13 In many United States hospitals, hospitalists serve as the primary if not lone physician providers of critical care.6,14 HM, with its team-based approach and on-site presence, shares many of the key attributes and values that define high-functioning critical care teams, and many hospitalists likely capably deliver some critical care services.9 However, hospitalists are also a highly heterogeneous work force with varied exposure to and comfort with critical care medicine, making it difficult to generalize hospitalists’ scope of practice in the ICU.
Because hospitalists render a significant amount of critical care in the United States, we surveyed practicing hospitalists to understand their demographics and practice roles in the ICU setting and to ascertain how they are supported when doing so. Additionally, we sought to identify mismatches between the ICU services that hospitalists provide and what they feel prepared and supported to deliver. Finally, we attempted to elucidate how hospitalists who practice in the ICU might respond to novel educational offerings targeted to mitigate cognitive or procedural gaps.
METHODS
We developed and deployed a survey to address the aforementioned questions. The survey content was developed iteratively by the Critical Care Task Force of SHM’s Education Committee and subsequently approved by SHM’s Education Committee and Board of Directors. Members of the Critical Care Task Force include critical care physicians and hospitalists. The survey included 25 items (supplemental Appendix A). Seventeen questions addressed the demographics and practice roles of hospitalists in the ICU, 5 addressed cognitive and procedural practice gaps, and 3 addressed how hospitalists would respond to educational opportunities in critical care. We used conditional formatting to ensure that only respondents who deliver ICU care could answer questions related to ICU practice. The survey was delivered by using an online survey platform (Survey Monkey, San Mateo, CA).
The survey was deployed in 3 phases from March to October of 2016. Initially, we distributed a pilot survey to professional contacts of the Critical Care Task Force to solicit feedback and refine the survey’s format and content. These contacts were largely academic hospitalists from our local institutions. We then distributed the survey to hospitalists via professional networks with instructions to forward the link to interested hospitalists. Finally, we distributed the survey to approximately 4000 hospitalists randomly selected from SHM’s national listserv of approximately 12,000 hospitalists. Respondents could enter a drawing for a monetary prize upon completion of the survey.
None of the survey questions changed during the 3 phases of survey deployment, and the data reported herein were compiled from all 3 phases of the survey deployment. Frequency tables were created using Tableau (version 10.0; Tableau Software, Seattle, WA). Comparisons between categorical questions were made by using χ2 and Fischer exact tests to calculate P values for associations by using SAS (version 9.3; SAS Institute, Cary, NC). Associations with P values below .05 were considered statistically significant.
RESULTS
Objective 1: Demographics and Practice Role
Four hundred and twenty-five hospitalists responded to the survey. The first 2 phases (pilot survey and distribution via professional networks) generated 101 responses, and the third phase (via SHM’s listserv) generated an additional 324 responses. As the survey was anonymous, we could not determine which hospitals or geographic regions were represented. Three hundred and twenty-five of the 425 hospitalists who completed the survey (77%) reported that they delivered care in the ICU. Of these 325 hospitalists, 45 served only as consultants, while the remaining 280 (66% of the total sample) served as the primary attending physician in the ICU. Among these primary providers of care in the ICU, 60 (21%) practiced in rural settings and 220 (79%) practiced in nonrural settings (Figure 1).
The demographics of our respondents were similar to those of the SHM annual survey,13 in which 66% of respondents delivered ICU care. Forty-one percent of our respondents worked in critical access or small community hospitals, 24% in academic medical centers, and 34% in large community centers with an academic affiliation. The SHM annual survey cohort included more physicians from nonteaching hospitals (58.7%) and fewer from academic medical centers (14.8%).13
Hospitalists’ presence in the ICU varied by practice setting (Table 1). 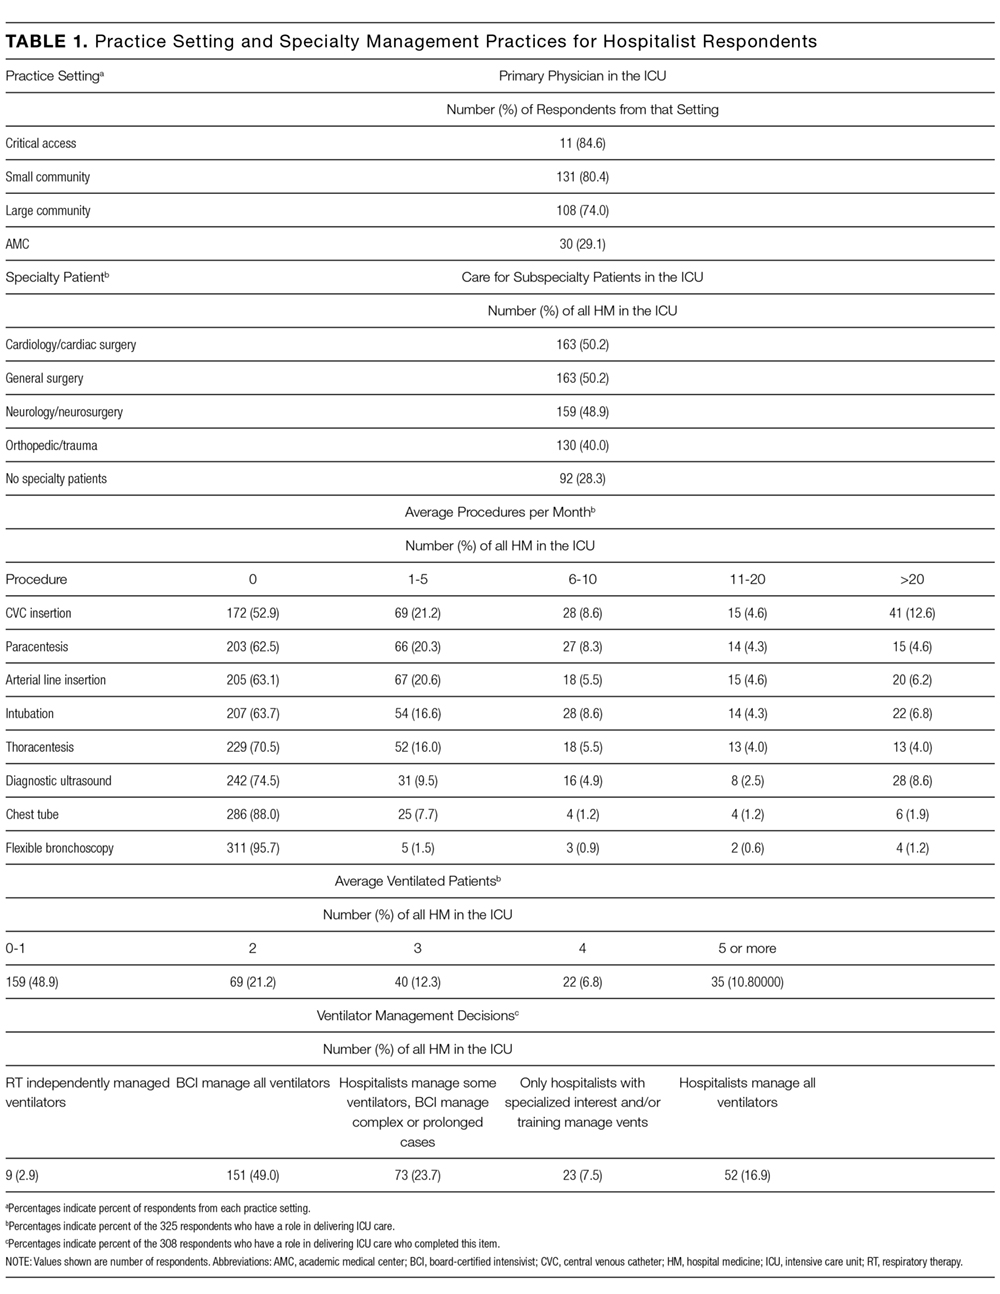
Hospitalists were significantly more prevalent in rural ICUs than in nonrural settings (96% vs 73%; Table 2). 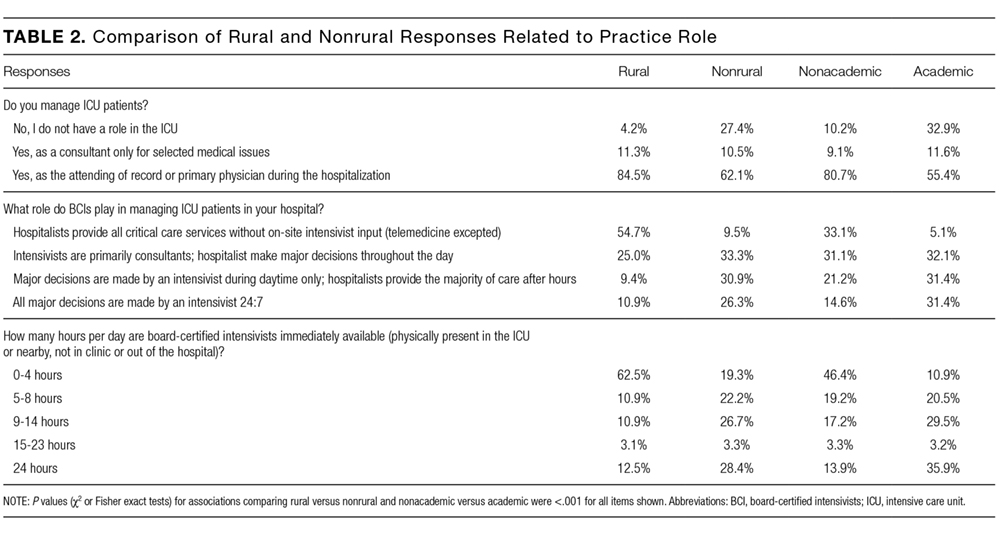
We found similar results when comparing academic hospitalists (those working in an academic medical center or academic-affiliated hospital) with nonacademic hospitalists (those working in critical access or small community centers). Specifically, hospitalists in nonacademic settings were significantly more prevalent in ICUs (90% vs 67%; Table 2), more likely to serve as the primary attending (81% vs 55%), and more likely to deliver all critical care services (64% vs 25%). Sixty-four percent of respondents from nonacademic settings reported that hospitalists manage all or most ICU patients in their hospital as opposed to 25% for academic respondents (χ2P value for association <.001). Intensivist availability was also significantly lower in nonacademic ICUs (Table 2).
We also sought to determine whether the ability to transfer critically ill patients to higher levels of care effectively mitigated shortfalls in intensivist staffing. When restricted to hospitalists who served as primary providers for ICU patients, 28% of all respondents and 51% of rural hospitalists reported transferring patients to a higher level of care.
Sixty-seven percent of hospitalists who served as primary physicians for ICU patients in any setting reported at least moderate difficulty arranging transfers to higher levels of care.
Objective 2: Identifying the Practice Gap
Hospitalists’ perceptions of practicing critical care beyond their skill level and without sufficient board-certified intensivist support varied by both practice location and practice type (Table 3). 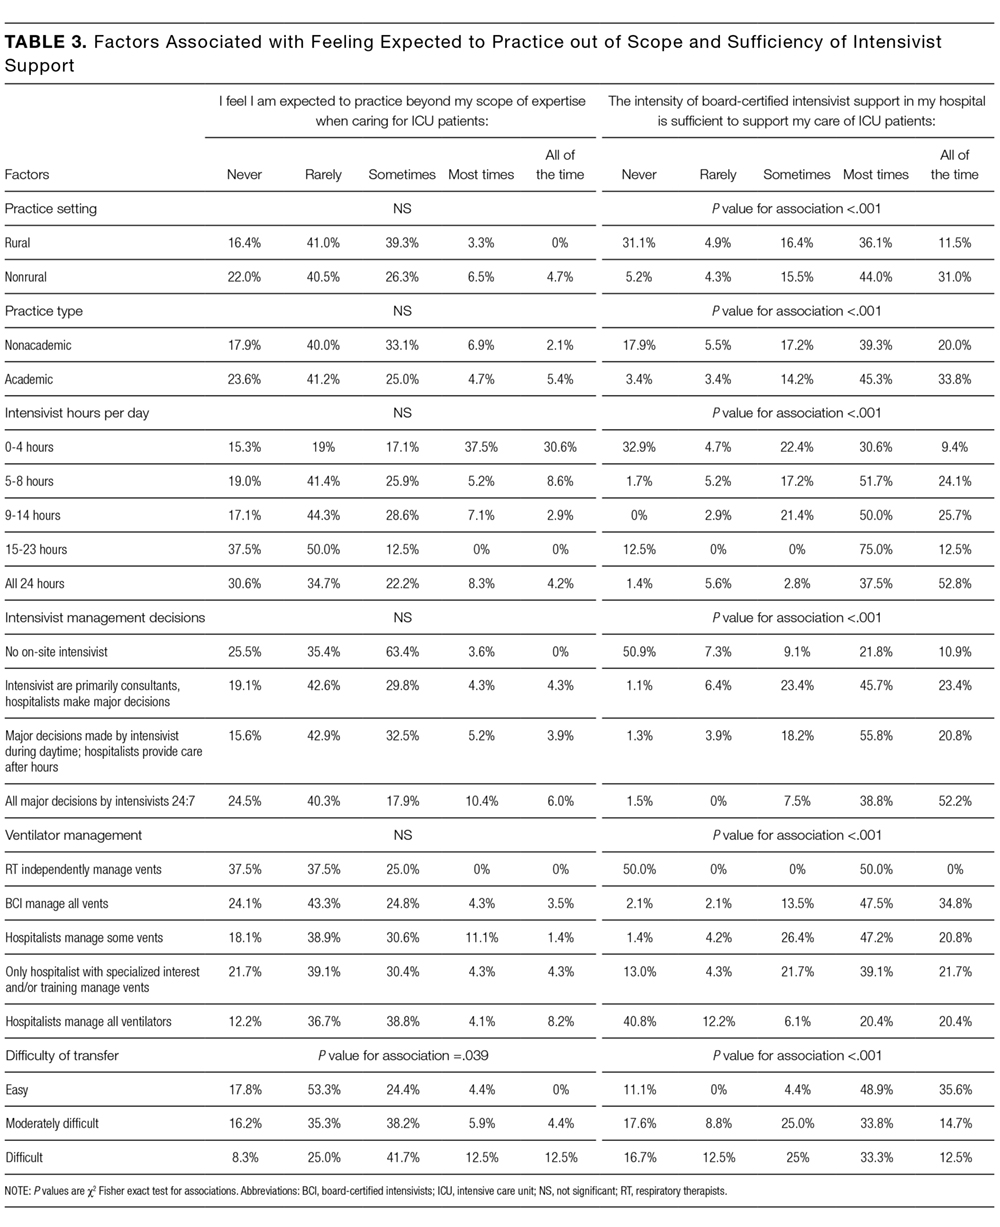
There were similar discrepancies between academic and nonacademic respondents. Forty-two percent of respondents practicing in nonacademic settings reported being expected to practice beyond their scope at least some of the time, and 18% reported that intensivist support was never sufficient. This contrasts with academic hospitalists, of whom 35% reported feeling expected to practice outside their scope, and less than 4% reported the available support from intensivists was never sufficient. For comparisons of academic and nonacademic respondents, only perceptions of sufficient board-certified intensivist support reached statistical significance (Table 3).
The role of intensivists in making management decisions and the strategy for ventilator management decisions correlated significantly with perception of intensivist support (P < .001) but not with the perception of practicing beyond one’s scope. The number of ventilated patients did not correlate significantly with either perception of intensivist support or of being expected to practice beyond scope.
Difficulty transferring patients to a higher level of care was the only attribute that significantly correlated with hospitalists’ perceptions of having to practice beyond their skill level (P < .05; Table 3). Difficulty of transfer was also significantly associated with perceived adequacy of board-certified intensivist support (P < .001). Total hours of intensivist coverage, intensivist role in decision making, and ventilator management arrangements also correlated significantly with the perceived adequacy of board-certified intensivist support (P < .001 for all; Table 3).
Objective 3: Assessing Interest in Critical Care Education
More than 85% of respondents indicated interest in obtaining additional critical care training and some form of certification short of fellowship training. Preferred modes of content delivery included courses or precourses at national meetings, academies, or online modules. Hospitalists in smaller communities indicated preference for online resources.
DISCUSSION
This survey of a large national cohort of hospitalists from diverse practice settings validates previous studies suggesting that hospitalists deliver critical care services, most notably in community and rural hospitals.13 A substantial subset of our respondents represented rural practice settings, which allowed us to compare rural and nonrural hospitalists as well as those practicing in academic and nonacademic settings. In assessing both the objective services that hospitalists provided as well as their subjective perceptions of how they practiced, we could correlate factors associated with the sense of practicing beyond one’s skill or feeling inadequately supported by board-certified intensivists.
More than a third of responding hospitalists who practiced in the ICU reported that they practiced beyond their self-perceived skill level, and almost three-fourths indicated that they practiced without consistent or adequate board-certified intensivist support. Rural and nonacademic hospitalists were far more likely to report delivering critical care beyond their comfort level and having insufficient board-certified intensivist support.
Calls for board-certified intensivists to deliver critical care to all critically ill patients do not reflect the reality in many American hospitals and, either by intent or by default, hospitalists have become the major and often sole providers of critical care services in many hospitals without robust intensivist support. We suspect that this phenomenon has been consistently underreported in the literature because academic hospitalists generally do not practice critical care.15
Many potential solutions to the intensivist shortage have been explored. Prior efforts in the United States have focused largely on care standardization and the recruitment of more trainees into existing critical care training pathways.16 Other countries have created multidisciplinary critical care training pathways that delink critical care from specific subspecialty training programs.17 Another potential solution to ensure that critically ill patients receive care from board-certified intensivists is to regionalize critical care such that the sickest patients are consistently transferred to referral centers with robust intensivist staffing.1,18 While such an approach has been effectively implemented for trauma patients7, it has yet to materialize on a systemic basis for other critically ill cohorts. Moreover, our data suggest that hospitalists who attempt to transfer patients to higher levels of critical care find doing so burdensome and difficult.
Our surveyed hospitalists overwhelmingly expressed interest in augmenting their critical care skills and knowledge. However, most existing critical care educational offerings are not optimized for hospitalists, either focusing on very specific skills or knowledge (eg, procedural techniques or point-of-care ultrasound) or providing entry-level or very foundational education. None of these offerings provide comprehensive, structured training schemas for hospitalists who need to evolve beyond basic critical care skills to manage critically ill patients competently and consistently for extended periods of time.
Our study has several limitations. First, we estimate that about 10% of invited participants responded to this survey, but as respondents could forward the survey via professional networks, this is only an estimate. It is possible but unlikely that some respondents could have completed the survey more than once. Second, because our analysis identified only associations, we cannot infer causality for any of our findings. Third, the questionnaire was not designed to capture the acuity threshold at which point each respondent would prefer to transfer their patients into an ICU setting or to another institution for assistance in critical care management. We recognize that definitions and perceptions of patient acuity vary markedly from one hospital to the next, and a patient who can be comfortably managed in a floor setting in one hospital may require ICU care in a smaller or less well-resourced hospital. Practice patterns relating to acuity thresholds could have a substantial impact both on critical care patient volumes and on provider perceptions and, as such, warrant further study.
Finally, as respondents participated voluntarily, our sample may have overrepresented hospitalists who practice or are interested in critical care, thereby overestimating the scope of the problem and hospitalists’ interest in nonfellowship critical care training and certification. However, this seems unlikely given that, relative to SHM’s annual survey, we overrepresented hospitalists from academic and large community medical centers who generally provide less critical care than other hospitalists.13 Provided that roughly 85% of the estimated 50,000 American hospitalists practice outside of academic medical centers,13 perhaps as many as 37,000 hospitalists regularly deliver care to critically ill patients in ICUs. In light of the evolving intensivist shortage,4,5 this number seems likely to continue to grow. Whatever biases may exist in our sample, it is evident that a substantial number of ICU patients are managed by hospitalists who feel unprepared and undersupported to perform the task.
Without a massive and sustained increase in the number of board-certified intensivists or a systemic national plan to regionalize critical care delivery, hospitalists will continue to practice critical care, frequently with inadequate knowledge, skills, or intensivist support. Fortunately, these same hospitalists appear to be highly interested in augmenting their skills to care for their critically ill patients. The HM and critical care communities must rise to this challenge and help these providers deliver safe, appropriate, and high-quality care to their critically ill patients.
Disclosure
Mark V. Williams, MD, FACP, MHM, receives funding from the Patient Centered Outcomes Research Institute, Agency for Healthcare Research and Quality, Centers for Medicare & Medicaid Services, and Society of Hospital Medicine honoraria.
Society of Hospital Medicine Resources
1. Barnato AE, Kahn JM, Rubenfeld GD, et al. Prioritizing the organization and management of intensive care services in the United States: the PrOMIS Conference. Crit Care Med. 2007;35(4):1003-1011. PubMed
2. The Leapfrog Group. Factsheet: ICU Physician Staffing. Leapfrog Hospital Survey. Washington, DC: The Leapfrog Group; 2016.
3. Baumann MH, Simpson SQ, Stahl M, Raoof S, Marciniuk DD, Gutterman DD. First, do no harm: less training not equal quality care. Am J Crit Care. Jul 2012;21(4):227-230. PubMed
4. Krell K. Critical care workforce. Crit Care Med. 2008;36(4):1350-1353. PubMed
5. Angus DC, Kelley MA, Schmitz RJ, White A, Popovich J, Jr. Caring for the critically ill patient. Current and projected workforce requirements for care of the critically ill and patients with pulmonary disease: can we meet the requirements of an aging population? JAMA. 2000;284(21):2762-2770. PubMed
6. Hyzy RC, Flanders SA, Pronovost PJ, et al. Characteristics of intensive care units in Michigan: not an open and closed case. J Hosp Med. 2010;5(1):4-9. PubMed
7. Kahn JM, Cicero BD, Wallace DJ, Iwashyna TJ. Adoption of ICU telemedicine in the United States. Crit Care Med. 2014;42(2):362-368. PubMed
8. Kleinpell RM, Ely EW, Grabenkort R. Nurse practitioners and physician assistants in the intensive care unit: an evidence-based review. Crit Care Med. 2008;36(10):2888-2897. PubMed
9. Heisler M. Hospitalists and intensivists: partners in caring for the critically ill--the time has come. J Hosp Med. 2010;5(1):1-3. PubMed
10. Checkley W, Martin GS, Brown SM, et al. Structure, process, and annual ICU mortality across 69 centers: United States Critical Illness and Injury Trials Group Critical Illness Outcomes Study. Crit Care Med. 2014;42(2):344-356. PubMed
11. Wise KR, Akopov VA, Williams BR, Jr., Ido MS, Leeper KV, Jr., Dressler DD. Hospitalists and intensivists in the medical ICU: a prospective observational study comparing mortality and length of stay between two staffing models. J Hosp Med. 2012;7(3):183-189. PubMed
12. Yoo EJ, Edwards JD, Dean ML, Dudley RA. Multidisciplinary Critical Care and Intensivist Staffing: Results of a Statewide Survey and Association With Mortality. J Intensive Care Med. 2016;31(5):325-332. PubMed
13. Society of Hospital Medicine. 2016 State of Hospital Medicine Report. Philadelphia: Society of Hospital Medicine; 2016.
14. Siegal EM, Dressler DD, Dichter JR, Gorman MJ, Lipsett PA. Training a hospitalist workforce to address the intensivist shortage in American hospitals: a position paper from the Society of Hospital Medicine and the Society of Critical Care Medicine. Crit Care Med. 2012;40(6):1952-1956. PubMed
15. Weled BJ, Adzhigirey LA, Hodgman TM, et al. Critical Care Delivery: The Importance of Process of Care and ICU Structure to Improved Outcomes: An Update From the American College of Critical Care Medicine Task Force on Models of Critical Care. Crit Care Med. 2015;43(7):1520-1525. PubMed
16. Kelley MA, Angus D, Chalfin DB, et al. The critical care crisis in the United States: a report from the profession. Chest. 2004;125(4):1514-1517. PubMed
17. Bion JF, Ramsay G, Roussos C, Burchardi H. Intensive care training and specialty status in Europe: international comparisons. Task Force on Educational issues of the European Society of Intensive Care Medicine. Intensive Care Med. 1998;24(4);372-377. PubMed
18. Kahn JM, Branas CC, Schwab CW, Asch DA. Regionalization of medical critical care: what can we learn from the trauma experience? Crit Care Med. 2008;36(11):3085-3088. PubMed
Despite calls for board-certified intensivist physicians to lead critical care delivery,1-3 the intensivist shortage in the United States continues to worsen,4 with projected shortfalls of 22% by 2020 and 35% by 2030.5 Many hospitals currently have inadequate or no board-certified intensivist support.6 The intensivist shortage has necessitated the development of alternative intensive care unit (ICU) staffing models, including engagement in telemedicine,7 the utilization of advanced practice providers,8 and dependence on hospitalists9 to deliver critical care services to ICU patients. Presently, research does not clearly show consistent differences in clinical outcomes based on the training of the clinical provider, although optimized teamwork and team rounds in the ICU do seem to be associated with improved outcomes.10-12
In its 2016 annual survey of hospital medicine (HM) leaders, the Society of Hospital Medicine (SHM) documented that most HM groups care for ICU patients, with up to 80% of hospitalist groups in some regions delivering critical care.13 In many United States hospitals, hospitalists serve as the primary if not lone physician providers of critical care.6,14 HM, with its team-based approach and on-site presence, shares many of the key attributes and values that define high-functioning critical care teams, and many hospitalists likely capably deliver some critical care services.9 However, hospitalists are also a highly heterogeneous work force with varied exposure to and comfort with critical care medicine, making it difficult to generalize hospitalists’ scope of practice in the ICU.
Because hospitalists render a significant amount of critical care in the United States, we surveyed practicing hospitalists to understand their demographics and practice roles in the ICU setting and to ascertain how they are supported when doing so. Additionally, we sought to identify mismatches between the ICU services that hospitalists provide and what they feel prepared and supported to deliver. Finally, we attempted to elucidate how hospitalists who practice in the ICU might respond to novel educational offerings targeted to mitigate cognitive or procedural gaps.
METHODS
We developed and deployed a survey to address the aforementioned questions. The survey content was developed iteratively by the Critical Care Task Force of SHM’s Education Committee and subsequently approved by SHM’s Education Committee and Board of Directors. Members of the Critical Care Task Force include critical care physicians and hospitalists. The survey included 25 items (supplemental Appendix A). Seventeen questions addressed the demographics and practice roles of hospitalists in the ICU, 5 addressed cognitive and procedural practice gaps, and 3 addressed how hospitalists would respond to educational opportunities in critical care. We used conditional formatting to ensure that only respondents who deliver ICU care could answer questions related to ICU practice. The survey was delivered by using an online survey platform (Survey Monkey, San Mateo, CA).
The survey was deployed in 3 phases from March to October of 2016. Initially, we distributed a pilot survey to professional contacts of the Critical Care Task Force to solicit feedback and refine the survey’s format and content. These contacts were largely academic hospitalists from our local institutions. We then distributed the survey to hospitalists via professional networks with instructions to forward the link to interested hospitalists. Finally, we distributed the survey to approximately 4000 hospitalists randomly selected from SHM’s national listserv of approximately 12,000 hospitalists. Respondents could enter a drawing for a monetary prize upon completion of the survey.
None of the survey questions changed during the 3 phases of survey deployment, and the data reported herein were compiled from all 3 phases of the survey deployment. Frequency tables were created using Tableau (version 10.0; Tableau Software, Seattle, WA). Comparisons between categorical questions were made by using χ2 and Fischer exact tests to calculate P values for associations by using SAS (version 9.3; SAS Institute, Cary, NC). Associations with P values below .05 were considered statistically significant.
RESULTS
Objective 1: Demographics and Practice Role
Four hundred and twenty-five hospitalists responded to the survey. The first 2 phases (pilot survey and distribution via professional networks) generated 101 responses, and the third phase (via SHM’s listserv) generated an additional 324 responses. As the survey was anonymous, we could not determine which hospitals or geographic regions were represented. Three hundred and twenty-five of the 425 hospitalists who completed the survey (77%) reported that they delivered care in the ICU. Of these 325 hospitalists, 45 served only as consultants, while the remaining 280 (66% of the total sample) served as the primary attending physician in the ICU. Among these primary providers of care in the ICU, 60 (21%) practiced in rural settings and 220 (79%) practiced in nonrural settings (Figure 1).
The demographics of our respondents were similar to those of the SHM annual survey,13 in which 66% of respondents delivered ICU care. Forty-one percent of our respondents worked in critical access or small community hospitals, 24% in academic medical centers, and 34% in large community centers with an academic affiliation. The SHM annual survey cohort included more physicians from nonteaching hospitals (58.7%) and fewer from academic medical centers (14.8%).13
Hospitalists’ presence in the ICU varied by practice setting (Table 1).
Hospitalists were significantly more prevalent in rural ICUs than in nonrural settings (96% vs 73%; Table 2).
We found similar results when comparing academic hospitalists (those working in an academic medical center or academic-affiliated hospital) with nonacademic hospitalists (those working in critical access or small community centers). Specifically, hospitalists in nonacademic settings were significantly more prevalent in ICUs (90% vs 67%; Table 2), more likely to serve as the primary attending (81% vs 55%), and more likely to deliver all critical care services (64% vs 25%). Sixty-four percent of respondents from nonacademic settings reported that hospitalists manage all or most ICU patients in their hospital as opposed to 25% for academic respondents (χ2P value for association <.001). Intensivist availability was also significantly lower in nonacademic ICUs (Table 2).
We also sought to determine whether the ability to transfer critically ill patients to higher levels of care effectively mitigated shortfalls in intensivist staffing. When restricted to hospitalists who served as primary providers for ICU patients, 28% of all respondents and 51% of rural hospitalists reported transferring patients to a higher level of care.
Sixty-seven percent of hospitalists who served as primary physicians for ICU patients in any setting reported at least moderate difficulty arranging transfers to higher levels of care.
Objective 2: Identifying the Practice Gap
Hospitalists’ perceptions of practicing critical care beyond their skill level and without sufficient board-certified intensivist support varied by both practice location and practice type (Table 3).
There were similar discrepancies between academic and nonacademic respondents. Forty-two percent of respondents practicing in nonacademic settings reported being expected to practice beyond their scope at least some of the time, and 18% reported that intensivist support was never sufficient. This contrasts with academic hospitalists, of whom 35% reported feeling expected to practice outside their scope, and less than 4% reported the available support from intensivists was never sufficient. For comparisons of academic and nonacademic respondents, only perceptions of sufficient board-certified intensivist support reached statistical significance (Table 3).
The role of intensivists in making management decisions and the strategy for ventilator management decisions correlated significantly with perception of intensivist support (P < .001) but not with the perception of practicing beyond one’s scope. The number of ventilated patients did not correlate significantly with either perception of intensivist support or of being expected to practice beyond scope.
Difficulty transferring patients to a higher level of care was the only attribute that significantly correlated with hospitalists’ perceptions of having to practice beyond their skill level (P < .05; Table 3). Difficulty of transfer was also significantly associated with perceived adequacy of board-certified intensivist support (P < .001). Total hours of intensivist coverage, intensivist role in decision making, and ventilator management arrangements also correlated significantly with the perceived adequacy of board-certified intensivist support (P < .001 for all; Table 3).
Objective 3: Assessing Interest in Critical Care Education
More than 85% of respondents indicated interest in obtaining additional critical care training and some form of certification short of fellowship training. Preferred modes of content delivery included courses or precourses at national meetings, academies, or online modules. Hospitalists in smaller communities indicated preference for online resources.
DISCUSSION
This survey of a large national cohort of hospitalists from diverse practice settings validates previous studies suggesting that hospitalists deliver critical care services, most notably in community and rural hospitals.13 A substantial subset of our respondents represented rural practice settings, which allowed us to compare rural and nonrural hospitalists as well as those practicing in academic and nonacademic settings. In assessing both the objective services that hospitalists provided as well as their subjective perceptions of how they practiced, we could correlate factors associated with the sense of practicing beyond one’s skill or feeling inadequately supported by board-certified intensivists.
More than a third of responding hospitalists who practiced in the ICU reported that they practiced beyond their self-perceived skill level, and almost three-fourths indicated that they practiced without consistent or adequate board-certified intensivist support. Rural and nonacademic hospitalists were far more likely to report delivering critical care beyond their comfort level and having insufficient board-certified intensivist support.
Calls for board-certified intensivists to deliver critical care to all critically ill patients do not reflect the reality in many American hospitals and, either by intent or by default, hospitalists have become the major and often sole providers of critical care services in many hospitals without robust intensivist support. We suspect that this phenomenon has been consistently underreported in the literature because academic hospitalists generally do not practice critical care.15
Many potential solutions to the intensivist shortage have been explored. Prior efforts in the United States have focused largely on care standardization and the recruitment of more trainees into existing critical care training pathways.16 Other countries have created multidisciplinary critical care training pathways that delink critical care from specific subspecialty training programs.17 Another potential solution to ensure that critically ill patients receive care from board-certified intensivists is to regionalize critical care such that the sickest patients are consistently transferred to referral centers with robust intensivist staffing.1,18 While such an approach has been effectively implemented for trauma patients7, it has yet to materialize on a systemic basis for other critically ill cohorts. Moreover, our data suggest that hospitalists who attempt to transfer patients to higher levels of critical care find doing so burdensome and difficult.
Our surveyed hospitalists overwhelmingly expressed interest in augmenting their critical care skills and knowledge. However, most existing critical care educational offerings are not optimized for hospitalists, either focusing on very specific skills or knowledge (eg, procedural techniques or point-of-care ultrasound) or providing entry-level or very foundational education. None of these offerings provide comprehensive, structured training schemas for hospitalists who need to evolve beyond basic critical care skills to manage critically ill patients competently and consistently for extended periods of time.
Our study has several limitations. First, we estimate that about 10% of invited participants responded to this survey, but as respondents could forward the survey via professional networks, this is only an estimate. It is possible but unlikely that some respondents could have completed the survey more than once. Second, because our analysis identified only associations, we cannot infer causality for any of our findings. Third, the questionnaire was not designed to capture the acuity threshold at which point each respondent would prefer to transfer their patients into an ICU setting or to another institution for assistance in critical care management. We recognize that definitions and perceptions of patient acuity vary markedly from one hospital to the next, and a patient who can be comfortably managed in a floor setting in one hospital may require ICU care in a smaller or less well-resourced hospital. Practice patterns relating to acuity thresholds could have a substantial impact both on critical care patient volumes and on provider perceptions and, as such, warrant further study.
Finally, as respondents participated voluntarily, our sample may have overrepresented hospitalists who practice or are interested in critical care, thereby overestimating the scope of the problem and hospitalists’ interest in nonfellowship critical care training and certification. However, this seems unlikely given that, relative to SHM’s annual survey, we overrepresented hospitalists from academic and large community medical centers who generally provide less critical care than other hospitalists.13 Provided that roughly 85% of the estimated 50,000 American hospitalists practice outside of academic medical centers,13 perhaps as many as 37,000 hospitalists regularly deliver care to critically ill patients in ICUs. In light of the evolving intensivist shortage,4,5 this number seems likely to continue to grow. Whatever biases may exist in our sample, it is evident that a substantial number of ICU patients are managed by hospitalists who feel unprepared and undersupported to perform the task.
Without a massive and sustained increase in the number of board-certified intensivists or a systemic national plan to regionalize critical care delivery, hospitalists will continue to practice critical care, frequently with inadequate knowledge, skills, or intensivist support. Fortunately, these same hospitalists appear to be highly interested in augmenting their skills to care for their critically ill patients. The HM and critical care communities must rise to this challenge and help these providers deliver safe, appropriate, and high-quality care to their critically ill patients.
Disclosure
Mark V. Williams, MD, FACP, MHM, receives funding from the Patient Centered Outcomes Research Institute, Agency for Healthcare Research and Quality, Centers for Medicare & Medicaid Services, and Society of Hospital Medicine honoraria.
Society of Hospital Medicine Resources
1. Barnato AE, Kahn JM, Rubenfeld GD, et al. Prioritizing the organization and management of intensive care services in the United States: the PrOMIS Conference. Crit Care Med. 2007;35(4):1003-1011. PubMed
2. The Leapfrog Group. Factsheet: ICU Physician Staffing. Leapfrog Hospital Survey. Washington, DC: The Leapfrog Group; 2016.
3. Baumann MH, Simpson SQ, Stahl M, Raoof S, Marciniuk DD, Gutterman DD. First, do no harm: less training not equal quality care. Am J Crit Care. Jul 2012;21(4):227-230. PubMed
4. Krell K. Critical care workforce. Crit Care Med. 2008;36(4):1350-1353. PubMed
5. Angus DC, Kelley MA, Schmitz RJ, White A, Popovich J, Jr. Caring for the critically ill patient. Current and projected workforce requirements for care of the critically ill and patients with pulmonary disease: can we meet the requirements of an aging population? JAMA. 2000;284(21):2762-2770. PubMed
6. Hyzy RC, Flanders SA, Pronovost PJ, et al. Characteristics of intensive care units in Michigan: not an open and closed case. J Hosp Med. 2010;5(1):4-9. PubMed
7. Kahn JM, Cicero BD, Wallace DJ, Iwashyna TJ. Adoption of ICU telemedicine in the United States. Crit Care Med. 2014;42(2):362-368. PubMed
8. Kleinpell RM, Ely EW, Grabenkort R. Nurse practitioners and physician assistants in the intensive care unit: an evidence-based review. Crit Care Med. 2008;36(10):2888-2897. PubMed
9. Heisler M. Hospitalists and intensivists: partners in caring for the critically ill--the time has come. J Hosp Med. 2010;5(1):1-3. PubMed
10. Checkley W, Martin GS, Brown SM, et al. Structure, process, and annual ICU mortality across 69 centers: United States Critical Illness and Injury Trials Group Critical Illness Outcomes Study. Crit Care Med. 2014;42(2):344-356. PubMed
11. Wise KR, Akopov VA, Williams BR, Jr., Ido MS, Leeper KV, Jr., Dressler DD. Hospitalists and intensivists in the medical ICU: a prospective observational study comparing mortality and length of stay between two staffing models. J Hosp Med. 2012;7(3):183-189. PubMed
12. Yoo EJ, Edwards JD, Dean ML, Dudley RA. Multidisciplinary Critical Care and Intensivist Staffing: Results of a Statewide Survey and Association With Mortality. J Intensive Care Med. 2016;31(5):325-332. PubMed
13. Society of Hospital Medicine. 2016 State of Hospital Medicine Report. Philadelphia: Society of Hospital Medicine; 2016.
14. Siegal EM, Dressler DD, Dichter JR, Gorman MJ, Lipsett PA. Training a hospitalist workforce to address the intensivist shortage in American hospitals: a position paper from the Society of Hospital Medicine and the Society of Critical Care Medicine. Crit Care Med. 2012;40(6):1952-1956. PubMed
15. Weled BJ, Adzhigirey LA, Hodgman TM, et al. Critical Care Delivery: The Importance of Process of Care and ICU Structure to Improved Outcomes: An Update From the American College of Critical Care Medicine Task Force on Models of Critical Care. Crit Care Med. 2015;43(7):1520-1525. PubMed
16. Kelley MA, Angus D, Chalfin DB, et al. The critical care crisis in the United States: a report from the profession. Chest. 2004;125(4):1514-1517. PubMed
17. Bion JF, Ramsay G, Roussos C, Burchardi H. Intensive care training and specialty status in Europe: international comparisons. Task Force on Educational issues of the European Society of Intensive Care Medicine. Intensive Care Med. 1998;24(4);372-377. PubMed
18. Kahn JM, Branas CC, Schwab CW, Asch DA. Regionalization of medical critical care: what can we learn from the trauma experience? Crit Care Med. 2008;36(11):3085-3088. PubMed
© 2018 Society of Hospital Medicine
Clinical Decision-Making: Observing the Smartphone UserAn Observational Study in Predicting Acute Surgical Patients’ Suitability for Discharge
The value placed on bedside clinical observation in the decision-making process of a patient’s illness has been diminished by today’s armamentarium of sophisticated technology. Increasing reliance is now placed on the result of nonspecific tests in preference to bedside clinical judgement in the diagnostic and management process. While diagnostic investigations have undoubtedly provided great advancements in medical care, they come at time and financial costs. Physicians should therefore continue to be encouraged to make clinical decisions based on their bedside assessment.
With hospital overcrowding a significant problem within the healthcare system and the expectation that it will worsen with an ageing population, identifying factors that predict patient suitability for discharge has become an important focus for clinicians.1,2 There exists a paucity of literature predicting discharge suitability of general surgical patients admitted through the emergency department (ED). Furthermore, despite the extensive research into the effectiveness of discharge planning,3 little research has been conducted to describe positive predictive indicators for discharge. Observations made during surgical rounds have led the authors to consider that individuals who are using a smartphone during their bedside assessment may be clinically well enough for discharge.
The aim of this study was to assess whether the clinical assessment of an acute surgical patient could be usefully augmented by the observation of the active use of smartphones (the smartphone sign) and whether this could be used as a surrogate marker to indicate a patient’s well-being and suitability for same-day discharge from the hospital in acute surgical patients.
METHODS
Design and Setting
This was a prospective observational study performed over 2 periods at a tertiary hospital in South Australia, Australia. At our institution, acute surgical patients are admitted to the acute surgical unit (ASU) from the ED by junior surgical doctors. Patients are then reviewed by the on-call surgical consultant, who implements management plans or advises discharge on 2 occasions per day.
Participants
All patients admitted under the ASU were considered eligible for the study. Exclusion criteria included patients that (i) required immediate surgical intervention (defined as time of review to theatre of less than 4 hours) and (ii) had immediate admission to the intensive care unit.
Consultant surgeons are employed within a general surgical subspecialty, including upper gastrointestinal, hepatobiliary, breast and endocrine, and colorectal. All surgeons from each team partake in the general surgery on-call roster. Each surgeon was included at least once within the observation periods. Experience of consultant surgeons ranged from 5 years of postfellowship experience to surgeons with more than 30 years of experience, with the majority having more than 10 years of postfellowship experience.
Patients were stratified into 2 distinct cohorts upon consultant review: smartphone positive (spP) was defined as a patient who was using a smartphone or who had their phone on their bed; a patient was classified as smartphone negative (spN) if they did not fulfil these criteria. The presence or absence of a smartphone was recorded by the authors, who were present on consultant ward rounds but not involved in the decision-making process of patient care. In order to minimize bias, only 1 surgeon (PGD) was aware that the study was being conducted and all patients were blinded to the study. Additional information that was collected included patient demographics, requirement for surgery, and length of stay (LOS). A patient who was discharged on the same day as the consultant review was considered to be discharged on day 1, all other patients were considered to have LOS greater than 1 day. Requirement for surgery was defined as a patient who underwent a surgical procedure in an operating suite. Thirty-day unplanned readmission rates for all patients were examined. Readmission to another public hospital within the state was also included within the readmission data.
Observation Periods
An initial 4-week pilot study was conducted to assess for a possible association between spP and same-day discharge. A second 8-week study period was undertaken 1 year later accounting for the employment of the authors at the study’s institution. Unless stated, the results described are the accumulation of both study periods.
Statistical Analysis
As this is the first study of its kind, no prior estimates of numbers were known. After 2 weeks of data collection, data were analyzed in order to provide an estimate of the total number of patients required to provide a statistically valid result (α = 0.05; power = 0.80). Sample size was calculated to be 40 subjects. It was agreed that in order to make the study as robust as possible, data should be collected for the 2 observation periods.
Demographic data are presented as means with standard deviations (SDs) or frequencies with percentages. A 2-sample Student t test was used to compare the age of spP and spN patients. A χ2 test and logistic regressions were used to assess the association between smartphone status and patient demographics, LOS, and requirement for surgery. Results are presented as odds ratios (ORs) with 95% confidence intervals (CIs). A P value of <0.05 was considered significant. All data were analyzed by using R 3.2.3 (R Foundation for Statistical Computing, Vienna, Austria).
RESULTS

During the 2 observation periods, a total of 227 eligible surgical admissions were observed with complete data for 221 patients. Six patients were excluded as their smartphone status was not recorded. The study sample represents our population of interest within an ASU, and we had complete data for 97.4% of participants with a 100% follow-up. There was no significant effect of study between the 2 observation periods (χ2 = 140.19; P = 0.10). The mean age of patients was 50.24 years. Further demographic data are presented in Table 1. Twenty-five (11.3%) patients were spP and 196 (88.7%) were spN. Fifty-two (23.5%) patients were discharged home on day 1, and 169 (76.5%) had admissions longer than 1 day (see Figure). Sixty (27%) patients underwent surgery during their admission. Twenty-two patients had unplanned readmissions; only 1 of these patients had been observed to be spP.
There was a statistically significant difference in ages between the spP and spN groups (t = 8.40; P < 0.0005), with the average age of spP patients being 31.84 years compared with 52.58 years for spN patients. There was no statistical difference between gender and smartphone status (χ2 = 1.78; P = 0.18; Table 2).
For those patients discharged home on day 1, there was a statistically significant association with being spP (χ2 = 14.55, P = 0.0001). Patients who were spP were 5.29 times more likely to be discharged on day 1 (95% CI, 2.24-12.84). Of the variables analyzed, only gender failed to demonstrate an effect on discharge home on day 1 (Table 3). Overall, the presence of a smartphone was found to have a sensitivity of 56.0% (95% CI, 34.93-75.60) and a specificity of 80.6% (95% CI, 74.37-85.90) in regard to same-day discharge. However, it was found to have a negative predictive value of 93.49% (95% CI, 88.65-96.71).
When examining readmission rates, only 4% of spP patients were readmitted versus 10.7% of spN patients. Accounting for variables, spP patients were 4 times less likely to be readmitted, though this was not statistically significant (OR 4.02; 95% CI, 0.43-37.2; P = 0.22). Furthermore, when examining only those patients discharged on day 1, smartphone status was not a predictor of readmission (OR 0.94; 95% CI, 0.06-15.2; P = 0 .97).
To mitigate the effect of age, analysis was conducted excluding those aged over 55 years (the previous retirement age in Australia), leaving 131 patients for analysis. The average age of spP patients was 31.8 years (SD 10.0) compared with 36.7 years (SD 10.9) for spN patients, representing a significant difference (t = 2.14; P = 0.04); 51.1% of patients were male, 19.1% of patients were spP, 26.0% of patients proceeded to an operation, the oldest spP was 51 years, and 29.0% of patients were discharged home on day 1. There was no difference in gender and smartphone status (χ2 = 0.33; P = 0.6). When analyzing those discharged on day 1, again spP patients were more likely to be discharged home (χ2 = 9.4; P = 0.002), and spP patients were 3.6 times more likely to be discharged home on day 1.
There were 4 spP patients who underwent an operation. Two patients had an incision and drainage of a perianal abscess, 1 patient underwent a laparotomy for an internal hernia after recently undergoing a Roux-en-Y gastric bypass at another hospital, and the final patient underwent a laparoscopic appendicectomy. One of these patients was still discharged home on day 1.
DISCUSSION
As J. A. Lindsay4 said, “For one mistake made for not knowing, ten mistakes are made for not looking.” At medical school, we are taught the finer techniques of the physical examination in order to support our diagnosis made from the history. It is not until we are experienced clinicians do we develop the clinical acumen and ability to tell an unwell patient from a well patient at a glance—colloquially known as the “end of the bed” assessment. In the pretechnology era, a well patient could frequently be seen reading their book, eg, the “novel-sign.” With the advent of the smartphone and electronic devices upon which novels can be read, statuses updated, and locations “checked into” (ie, the modern “vital signs”), the book sign may be a thing of the past. However, the ability for the clinician to assess a patient’s wellness is still crucial, and the value of any additional “physical signs” need to be estimated.
We observed a cohort of patients through a busy ASU in a tertiary hospital in South Australia, Australia. Acute surgical patients admitted to the hospital who were observed to be on their phones upon consultant review were more than 5 times likely to be discharged that same day. To the best of our knowledge, this is the first study to prospectively collect data to assess a frequently used but unevaluated clinical observation.
The use of a smartphone can tell us a lot about an individual’s physiology. We can assume the individual’s airway and breathing are adequate, allowing enough oxygen to reach the lungs and subsequently circulate. The individual is usually sitting up in bed and thus has an adequate blood pressure and blood oxygenation that can maintain cerebral perfusion. They have the cognitive and cerebral processing in place to function the device, and we can examine their cerebellar function by looking for fine-motor movements.
Mobile phone ownership is pervasive within Australia,5 with a conservative estimated 85.7% of the population (20.57 million people of a total population of approximately 24 million) owning a mobile phone and an estimated 50% to 79% of mobile phone ownership being of a smartphone.6,7 This ownership is not just limited to the young, with 74% of Australians over 65 owning or using a mobile phone.8 Despite this high phone ownership among those over 65, it is still significantly less than their younger counterparts and may be one reason for the absence of spP in those older than 51 years. A key point in the study is that overall phone ownership was not known, and, thus, it is not possible to determine the proportion of spN patients who were negative because they did not own a phone. However, based on general population data, the incidence of spP patients was well below that seen in the community (11.3%)5 and even when excluding those over 55, the percentage of spP patients only rose to 19.1%. Unsurprisingly, increasing age was associated with a decreased likelihood of being spP (P < 0.0005), as younger people are more likely to own a phone.8 There was no association with gender (P = 0.18). There are a number of explanations that may explain the lower than expected percentage of spP patients, including the inability for the patient to gather their possessions during a medical emergency, patients storing their phones prior to doctor review (72%-85% of Australians report talking on phones in public places to be rude or intrusive5), but more importantly, that our hypothesis that patients were too unwell to use their device appears to hold true.
There are potential alternate reasons other than smartphone status that may account for patients being discharged home on day 1. While there was no association seen with gender, the need for an operation prolonged a patient’s stay (OR 1.64; 95% CI, 0.046-0.46), and there was a trend seen with increasing age (OR 0.98; 95% CI, 0.96-1.00). Neither of these 2 demographics are unsurprising: increasing age is associated with increasing medical comorbidities and thus complexity; even the simplest of operations require a postprocedure observation period, automatically increasing their LOS. Additionally, measured demographics are limited and there may be further unmeasured reasons that account for earlier discharge.
The other key component to this study is the value of the physical examination, albeit only assessing 1 component: the general inspection. In their review of the value of the physical examination of the cardiovascular system, Elder et al. highlight an important point: in traditional teaching, the value of a physical sign is compared with a diagnostic reference, typically imaging or an invasive test.9 They argue that this definition undervalues the physical examination and list other values aside from accuracy including accessibility, contribution to clinical care beyond diagnoses, cost effectiveness, patients’ safety, patients’ perceptions, and pedagogic value; and they argue that the physical examination should always be considered in regard to the clinical context—in this case, the newly admitted general surgical patient.
The assessment of the presence or absence of a smartphone is readily performed upon general inspection and is easily visible; general inspection of the patient and failure to observe the clinical sign when present are 2 of the greatest errors associated with physical examination.10 Furthermore, given its unique status as a physical sign, the authors’ opinion and experience is that it is readily teachable. McGee states, “…a fundamental lesson [in regards to teaching] is that the diagnosis of many clinical problems, despite modern testing, still depends primarily on what the clinician sees, hears, and feels.”11 In their article, Paley et al. found that more than 80% of patients admitted from the ED under internal medicine could be accurately diagnosed based largely on history and examination alone and concluded that basic clinical skills are sufficient for achieving an accurate diagnosis in most cases.12 Although Paley et al. were assisted with basic tests (such as electrocardiogram and basic haematological and biochemistry results), the point of clinical skills is not lost. Furthermore, this assessment was made in a group of patients generally considered to be complex in contrast to the “standard” appendicitis or cholecystitis patient that makes up a significant proportion of general surgical patients.
There are a number of limitations to this study, however, including smartphones that may have been missed during the observational period. Potential confounding variables such as socioeconomic status and the overall smartphone ownership of our subjects were not known. We did not ask all admitted patients whether they owned a phone or whether they had a phone in their possession. Knowledge of those who owned phones but were not in possession of them could strengthen our argument that spN patients were not using their phone because they were unwell, rather than just not having access to it.
However, this study has a number of strengths, including a large sample size and data that were prospectively collected by a method and in a setting that was the same for all participants. Clear and appropriate definitions were used, which minimizes misclassification bias. Participants and decision makers were blinded to the study, and potentially confounding variables such as age and sex were accounted for.
Assessing the suitability for discharge from the hospital is a decision encountered by hospital-based clinicians every day. These skills are not taught, but are rather learned as a junior doctor acquires experience. It is unlikely that protocols will be developed to aid identification of potential discharges from an acute surgical ward; acute surgical conditions are too varied and dynamic to be able to pool all data. We continue to rely on our own and fellow colleagues’ (doctors, nurses, and other staff
CONCLUSION
While these observations might appear to be rather a simplistic way of trying to quantify whether or not a patient is fit for discharge, any clues that hint towards a patient’s well-being should be taken into account when making an overall assessment. The active use of a smartphone is one such measure.
Acknowledgments
The authors thank Emma Knight and Nancy Briggs from the Data Management & Analysis Centre, Discipline of Public Health, University of Adelaide.
Disclosure
No author nor the institution received any payment or services from a third party for any aspect of the submitted work and report no conflict of interest. There are no reported financial relationships with any entities by any of the authors. There are no patents pending based upon this publication. There are no relationships or activities that readers could perceive to have influenced, or give the appearance of influencing, the submitted work. The corresponding author is not in receipt of a research scholarship. The paper is not based on a previous communication.
1. Sprivulis PC, Da Silva JA, Jacobs IG, Frazer AR, Jelinek GA. The association between hospital overcrowding and mortality among patients admitted via Western Australian emergency departments. Med J Aust. 2006;184(5):208-212. PubMed
2. Shepherd T. Hospital Overcrowding kills as many as our road toll. The Advertiser. November 23, 2010. Available from: http://www.adelaidenow.com.au/news/south-australia/hospital-overcrowding-kills-as-many-as-our-road-toll/news-story/3389668c23b8b141f1d335b096ced416. Accessed February 2, 2017.
3. Shepperd S, Lannin NA, Clemson LM, McCluskey A, Cameron ID, Barras SL. Discharge planning from hospital to home. Cochrane Database Syst Rev. 2013;Jan 31(1):CD000313. PubMed
4. Breathnach CS, Moynihan JB. James Alexander Lindsay (1856–1931), and his clinical axioms and aphorisms. Ulster Med J. 2012;81(3):149-153. PubMed
5. Enhanced Media Metrics Australia. Product Insights Report. Digital Australia: A snapshot of attitudes and usage. August 2013. Ipsos Australia. North Sydney, Australia. Report available from: https://emma.com.au/wp-content/uploads/2013/10/digital.pdf
6. Australian Communications and Media Authority. Communications report 2013-24. Melbounre: Commonwealth of Australia; 2014. http://www.acma.gov.au/~/media/Research%20and%20Analysis/Publication/Comms%20Report%202013%2014/PDF/Communications%20report%20201314_LOW-RES%20FOR%20WEB%20pdf.pdf
7. Drumm J, Johnston S. Mobile Consumer Survery 2015—The Australian Cut. Deloitte. Australia; 2015. Deloitte Touche Tohmatsu. Sydney, Australia. file:///C:/Users/user/Desktop/deloitte-au-tmt-mobile-consumer-survey-2015-291015.pdf
8. Older Australians Resist Cutting the Cord: Australian Communications and Media Authority. 2014. http://www.acma.gov.au/theACMA/engage-blogs/engage-blogs/Research-snapshots/Older-Australians-resist-cutting-the-cord. Accessed February 23, 2017.
9. Elder A, Japp A, Verghese A. How valuable is physical examination of the cardiovascular system? BMJ. 2016;354:i3309. PubMed
10. Verghese A, Charlton B, Kassirer JP, Ramsey M, Ioannidis JP. Inadequacies of physical examination as a cause of medical errors and adverse events: a collection of vignettes. Am J Med. 2015;128(12):1322-1324.e3. PubMed
11. McGee S. A piece of my mind. Bedside teaching rounds reconsidered. JAMA. 2014;311(19):1971-1972. PubMed
12. Paley L, Zornitzki T, Cohen J, Friedman J, Kozak N, Schattner A. Utility of clinical examination in the diagnosis of emergency department patients admitted to the department of medicine of an academic hospital. Arch Intern Med. 2011;171(15):1394-1396. PubMed
The value placed on bedside clinical observation in the decision-making process of a patient’s illness has been diminished by today’s armamentarium of sophisticated technology. Increasing reliance is now placed on the result of nonspecific tests in preference to bedside clinical judgement in the diagnostic and management process. While diagnostic investigations have undoubtedly provided great advancements in medical care, they come at time and financial costs. Physicians should therefore continue to be encouraged to make clinical decisions based on their bedside assessment.
With hospital overcrowding a significant problem within the healthcare system and the expectation that it will worsen with an ageing population, identifying factors that predict patient suitability for discharge has become an important focus for clinicians.1,2 There exists a paucity of literature predicting discharge suitability of general surgical patients admitted through the emergency department (ED). Furthermore, despite the extensive research into the effectiveness of discharge planning,3 little research has been conducted to describe positive predictive indicators for discharge. Observations made during surgical rounds have led the authors to consider that individuals who are using a smartphone during their bedside assessment may be clinically well enough for discharge.
The aim of this study was to assess whether the clinical assessment of an acute surgical patient could be usefully augmented by the observation of the active use of smartphones (the smartphone sign) and whether this could be used as a surrogate marker to indicate a patient’s well-being and suitability for same-day discharge from the hospital in acute surgical patients.
METHODS
Design and Setting
This was a prospective observational study performed over 2 periods at a tertiary hospital in South Australia, Australia. At our institution, acute surgical patients are admitted to the acute surgical unit (ASU) from the ED by junior surgical doctors. Patients are then reviewed by the on-call surgical consultant, who implements management plans or advises discharge on 2 occasions per day.
Participants
All patients admitted under the ASU were considered eligible for the study. Exclusion criteria included patients that (i) required immediate surgical intervention (defined as time of review to theatre of less than 4 hours) and (ii) had immediate admission to the intensive care unit.
Consultant surgeons are employed within a general surgical subspecialty, including upper gastrointestinal, hepatobiliary, breast and endocrine, and colorectal. All surgeons from each team partake in the general surgery on-call roster. Each surgeon was included at least once within the observation periods. Experience of consultant surgeons ranged from 5 years of postfellowship experience to surgeons with more than 30 years of experience, with the majority having more than 10 years of postfellowship experience.
Patients were stratified into 2 distinct cohorts upon consultant review: smartphone positive (spP) was defined as a patient who was using a smartphone or who had their phone on their bed; a patient was classified as smartphone negative (spN) if they did not fulfil these criteria. The presence or absence of a smartphone was recorded by the authors, who were present on consultant ward rounds but not involved in the decision-making process of patient care. In order to minimize bias, only 1 surgeon (PGD) was aware that the study was being conducted and all patients were blinded to the study. Additional information that was collected included patient demographics, requirement for surgery, and length of stay (LOS). A patient who was discharged on the same day as the consultant review was considered to be discharged on day 1, all other patients were considered to have LOS greater than 1 day. Requirement for surgery was defined as a patient who underwent a surgical procedure in an operating suite. Thirty-day unplanned readmission rates for all patients were examined. Readmission to another public hospital within the state was also included within the readmission data.
Observation Periods
An initial 4-week pilot study was conducted to assess for a possible association between spP and same-day discharge. A second 8-week study period was undertaken 1 year later accounting for the employment of the authors at the study’s institution. Unless stated, the results described are the accumulation of both study periods.
Statistical Analysis
As this is the first study of its kind, no prior estimates of numbers were known. After 2 weeks of data collection, data were analyzed in order to provide an estimate of the total number of patients required to provide a statistically valid result (α = 0.05; power = 0.80). Sample size was calculated to be 40 subjects. It was agreed that in order to make the study as robust as possible, data should be collected for the 2 observation periods.
Demographic data are presented as means with standard deviations (SDs) or frequencies with percentages. A 2-sample Student t test was used to compare the age of spP and spN patients. A χ2 test and logistic regressions were used to assess the association between smartphone status and patient demographics, LOS, and requirement for surgery. Results are presented as odds ratios (ORs) with 95% confidence intervals (CIs). A P value of <0.05 was considered significant. All data were analyzed by using R 3.2.3 (R Foundation for Statistical Computing, Vienna, Austria).
RESULTS
During the 2 observation periods, a total of 227 eligible surgical admissions were observed with complete data for 221 patients. Six patients were excluded as their smartphone status was not recorded. The study sample represents our population of interest within an ASU, and we had complete data for 97.4% of participants with a 100% follow-up. There was no significant effect of study between the 2 observation periods (χ2 = 140.19; P = 0.10). The mean age of patients was 50.24 years. Further demographic data are presented in Table 1. Twenty-five (11.3%) patients were spP and 196 (88.7%) were spN. Fifty-two (23.5%) patients were discharged home on day 1, and 169 (76.5%) had admissions longer than 1 day (see Figure). Sixty (27%) patients underwent surgery during their admission. Twenty-two patients had unplanned readmissions; only 1 of these patients had been observed to be spP.
There was a statistically significant difference in ages between the spP and spN groups (t = 8.40; P < 0.0005), with the average age of spP patients being 31.84 years compared with 52.58 years for spN patients. There was no statistical difference between gender and smartphone status (χ2 = 1.78; P = 0.18; Table 2).
For those patients discharged home on day 1, there was a statistically significant association with being spP (χ2 = 14.55, P = 0.0001). Patients who were spP were 5.29 times more likely to be discharged on day 1 (95% CI, 2.24-12.84). Of the variables analyzed, only gender failed to demonstrate an effect on discharge home on day 1 (Table 3). Overall, the presence of a smartphone was found to have a sensitivity of 56.0% (95% CI, 34.93-75.60) and a specificity of 80.6% (95% CI, 74.37-85.90) in regard to same-day discharge. However, it was found to have a negative predictive value of 93.49% (95% CI, 88.65-96.71).
When examining readmission rates, only 4% of spP patients were readmitted versus 10.7% of spN patients. Accounting for variables, spP patients were 4 times less likely to be readmitted, though this was not statistically significant (OR 4.02; 95% CI, 0.43-37.2; P = 0.22). Furthermore, when examining only those patients discharged on day 1, smartphone status was not a predictor of readmission (OR 0.94; 95% CI, 0.06-15.2; P = 0 .97).
To mitigate the effect of age, analysis was conducted excluding those aged over 55 years (the previous retirement age in Australia), leaving 131 patients for analysis. The average age of spP patients was 31.8 years (SD 10.0) compared with 36.7 years (SD 10.9) for spN patients, representing a significant difference (t = 2.14; P = 0.04); 51.1% of patients were male, 19.1% of patients were spP, 26.0% of patients proceeded to an operation, the oldest spP was 51 years, and 29.0% of patients were discharged home on day 1. There was no difference in gender and smartphone status (χ2 = 0.33; P = 0.6). When analyzing those discharged on day 1, again spP patients were more likely to be discharged home (χ2 = 9.4; P = 0.002), and spP patients were 3.6 times more likely to be discharged home on day 1.
There were 4 spP patients who underwent an operation. Two patients had an incision and drainage of a perianal abscess, 1 patient underwent a laparotomy for an internal hernia after recently undergoing a Roux-en-Y gastric bypass at another hospital, and the final patient underwent a laparoscopic appendicectomy. One of these patients was still discharged home on day 1.
DISCUSSION
As J. A. Lindsay4 said, “For one mistake made for not knowing, ten mistakes are made for not looking.” At medical school, we are taught the finer techniques of the physical examination in order to support our diagnosis made from the history. It is not until we are experienced clinicians do we develop the clinical acumen and ability to tell an unwell patient from a well patient at a glance—colloquially known as the “end of the bed” assessment. In the pretechnology era, a well patient could frequently be seen reading their book, eg, the “novel-sign.” With the advent of the smartphone and electronic devices upon which novels can be read, statuses updated, and locations “checked into” (ie, the modern “vital signs”), the book sign may be a thing of the past. However, the ability for the clinician to assess a patient’s wellness is still crucial, and the value of any additional “physical signs” need to be estimated.
We observed a cohort of patients through a busy ASU in a tertiary hospital in South Australia, Australia. Acute surgical patients admitted to the hospital who were observed to be on their phones upon consultant review were more than 5 times likely to be discharged that same day. To the best of our knowledge, this is the first study to prospectively collect data to assess a frequently used but unevaluated clinical observation.
The use of a smartphone can tell us a lot about an individual’s physiology. We can assume the individual’s airway and breathing are adequate, allowing enough oxygen to reach the lungs and subsequently circulate. The individual is usually sitting up in bed and thus has an adequate blood pressure and blood oxygenation that can maintain cerebral perfusion. They have the cognitive and cerebral processing in place to function the device, and we can examine their cerebellar function by looking for fine-motor movements.
Mobile phone ownership is pervasive within Australia,5 with a conservative estimated 85.7% of the population (20.57 million people of a total population of approximately 24 million) owning a mobile phone and an estimated 50% to 79% of mobile phone ownership being of a smartphone.6,7 This ownership is not just limited to the young, with 74% of Australians over 65 owning or using a mobile phone.8 Despite this high phone ownership among those over 65, it is still significantly less than their younger counterparts and may be one reason for the absence of spP in those older than 51 years. A key point in the study is that overall phone ownership was not known, and, thus, it is not possible to determine the proportion of spN patients who were negative because they did not own a phone. However, based on general population data, the incidence of spP patients was well below that seen in the community (11.3%)5 and even when excluding those over 55, the percentage of spP patients only rose to 19.1%. Unsurprisingly, increasing age was associated with a decreased likelihood of being spP (P < 0.0005), as younger people are more likely to own a phone.8 There was no association with gender (P = 0.18). There are a number of explanations that may explain the lower than expected percentage of spP patients, including the inability for the patient to gather their possessions during a medical emergency, patients storing their phones prior to doctor review (72%-85% of Australians report talking on phones in public places to be rude or intrusive5), but more importantly, that our hypothesis that patients were too unwell to use their device appears to hold true.
There are potential alternate reasons other than smartphone status that may account for patients being discharged home on day 1. While there was no association seen with gender, the need for an operation prolonged a patient’s stay (OR 1.64; 95% CI, 0.046-0.46), and there was a trend seen with increasing age (OR 0.98; 95% CI, 0.96-1.00). Neither of these 2 demographics are unsurprising: increasing age is associated with increasing medical comorbidities and thus complexity; even the simplest of operations require a postprocedure observation period, automatically increasing their LOS. Additionally, measured demographics are limited and there may be further unmeasured reasons that account for earlier discharge.
The other key component to this study is the value of the physical examination, albeit only assessing 1 component: the general inspection. In their review of the value of the physical examination of the cardiovascular system, Elder et al. highlight an important point: in traditional teaching, the value of a physical sign is compared with a diagnostic reference, typically imaging or an invasive test.9 They argue that this definition undervalues the physical examination and list other values aside from accuracy including accessibility, contribution to clinical care beyond diagnoses, cost effectiveness, patients’ safety, patients’ perceptions, and pedagogic value; and they argue that the physical examination should always be considered in regard to the clinical context—in this case, the newly admitted general surgical patient.
The assessment of the presence or absence of a smartphone is readily performed upon general inspection and is easily visible; general inspection of the patient and failure to observe the clinical sign when present are 2 of the greatest errors associated with physical examination.10 Furthermore, given its unique status as a physical sign, the authors’ opinion and experience is that it is readily teachable. McGee states, “…a fundamental lesson [in regards to teaching] is that the diagnosis of many clinical problems, despite modern testing, still depends primarily on what the clinician sees, hears, and feels.”11 In their article, Paley et al. found that more than 80% of patients admitted from the ED under internal medicine could be accurately diagnosed based largely on history and examination alone and concluded that basic clinical skills are sufficient for achieving an accurate diagnosis in most cases.12 Although Paley et al. were assisted with basic tests (such as electrocardiogram and basic haematological and biochemistry results), the point of clinical skills is not lost. Furthermore, this assessment was made in a group of patients generally considered to be complex in contrast to the “standard” appendicitis or cholecystitis patient that makes up a significant proportion of general surgical patients.
There are a number of limitations to this study, however, including smartphones that may have been missed during the observational period. Potential confounding variables such as socioeconomic status and the overall smartphone ownership of our subjects were not known. We did not ask all admitted patients whether they owned a phone or whether they had a phone in their possession. Knowledge of those who owned phones but were not in possession of them could strengthen our argument that spN patients were not using their phone because they were unwell, rather than just not having access to it.
However, this study has a number of strengths, including a large sample size and data that were prospectively collected by a method and in a setting that was the same for all participants. Clear and appropriate definitions were used, which minimizes misclassification bias. Participants and decision makers were blinded to the study, and potentially confounding variables such as age and sex were accounted for.
Assessing the suitability for discharge from the hospital is a decision encountered by hospital-based clinicians every day. These skills are not taught, but are rather learned as a junior doctor acquires experience. It is unlikely that protocols will be developed to aid identification of potential discharges from an acute surgical ward; acute surgical conditions are too varied and dynamic to be able to pool all data. We continue to rely on our own and fellow colleagues’ (doctors, nurses, and other staff
CONCLUSION
While these observations might appear to be rather a simplistic way of trying to quantify whether or not a patient is fit for discharge, any clues that hint towards a patient’s well-being should be taken into account when making an overall assessment. The active use of a smartphone is one such measure.
Acknowledgments
The authors thank Emma Knight and Nancy Briggs from the Data Management & Analysis Centre, Discipline of Public Health, University of Adelaide.
Disclosure
No author nor the institution received any payment or services from a third party for any aspect of the submitted work and report no conflict of interest. There are no reported financial relationships with any entities by any of the authors. There are no patents pending based upon this publication. There are no relationships or activities that readers could perceive to have influenced, or give the appearance of influencing, the submitted work. The corresponding author is not in receipt of a research scholarship. The paper is not based on a previous communication.
1. Sprivulis PC, Da Silva JA, Jacobs IG, Frazer AR, Jelinek GA. The association between hospital overcrowding and mortality among patients admitted via Western Australian emergency departments. Med J Aust. 2006;184(5):208-212. PubMed
2. Shepherd T. Hospital Overcrowding kills as many as our road toll. The Advertiser. November 23, 2010. Available from: http://www.adelaidenow.com.au/news/south-australia/hospital-overcrowding-kills-as-many-as-our-road-toll/news-story/3389668c23b8b141f1d335b096ced416. Accessed February 2, 2017.
3. Shepperd S, Lannin NA, Clemson LM, McCluskey A, Cameron ID, Barras SL. Discharge planning from hospital to home. Cochrane Database Syst Rev. 2013;Jan 31(1):CD000313. PubMed
4. Breathnach CS, Moynihan JB. James Alexander Lindsay (1856–1931), and his clinical axioms and aphorisms. Ulster Med J. 2012;81(3):149-153. PubMed
5. Enhanced Media Metrics Australia. Product Insights Report. Digital Australia: A snapshot of attitudes and usage. August 2013. Ipsos Australia. North Sydney, Australia. Report available from: https://emma.com.au/wp-content/uploads/2013/10/digital.pdf
6. Australian Communications and Media Authority. Communications report 2013-24. Melbounre: Commonwealth of Australia; 2014. http://www.acma.gov.au/~/media/Research%20and%20Analysis/Publication/Comms%20Report%202013%2014/PDF/Communications%20report%20201314_LOW-RES%20FOR%20WEB%20pdf.pdf
7. Drumm J, Johnston S. Mobile Consumer Survery 2015—The Australian Cut. Deloitte. Australia; 2015. Deloitte Touche Tohmatsu. Sydney, Australia. file:///C:/Users/user/Desktop/deloitte-au-tmt-mobile-consumer-survey-2015-291015.pdf
8. Older Australians Resist Cutting the Cord: Australian Communications and Media Authority. 2014. http://www.acma.gov.au/theACMA/engage-blogs/engage-blogs/Research-snapshots/Older-Australians-resist-cutting-the-cord. Accessed February 23, 2017.
9. Elder A, Japp A, Verghese A. How valuable is physical examination of the cardiovascular system? BMJ. 2016;354:i3309. PubMed
10. Verghese A, Charlton B, Kassirer JP, Ramsey M, Ioannidis JP. Inadequacies of physical examination as a cause of medical errors and adverse events: a collection of vignettes. Am J Med. 2015;128(12):1322-1324.e3. PubMed
11. McGee S. A piece of my mind. Bedside teaching rounds reconsidered. JAMA. 2014;311(19):1971-1972. PubMed
12. Paley L, Zornitzki T, Cohen J, Friedman J, Kozak N, Schattner A. Utility of clinical examination in the diagnosis of emergency department patients admitted to the department of medicine of an academic hospital. Arch Intern Med. 2011;171(15):1394-1396. PubMed
© 2018 Society of Hospital Medicine