User login
The Hospitalist only
The latest research you need to know
In This Edition
- Generic vs. brand-name drugs.
- Rapid-response teams and mortality.
- A new prediction rule for mortality in acute pancreatitis.
- Viral causes of community-acquired pneumonia.
- Intensive insulin therapy in the ICU.
- New preoperative and intraoperative risk factors.
- Timing of ICU feedings and mortality.
- Aspirin as primary prevention in diabetics.
Generic, Brand-Name Drugs Used for Cardiovascular Disease Are Clinically Equivalent
Clinical question: Is there a clinical risk when substituting generic drugs for brand-name drugs in the treatment of cardiovascular disease?
Background: Spending on healthcare in the U.S. has reached critical levels. Increasing prescription drug costs make up a large portion of healthcare expenditures. The high cost of medicines directly affect adherence to treatment regimens and contribute to poor health outcomes. Cardiovascular drugs make up the largest portion of outpatient prescription drug spending.
Study design: Systematic review of relevant articles with a meta-analysis performed to determine an aggregate effect size.
Setting: Multiple locations and varied patient populations.
Synopsis: A total of 47 articles were included in the review, of which 38 were randomized controlled trials (RCTs). The studies measured both clinical efficacy and safety end points. More than half the articles were published prior to 2000. Clinical equivalence was noted in all seven beta-blocker RCTs; 10 of 11 diuretic RCTs; five of seven calcium-channel-blocker RCTs; all three antiplatelet-agent RCTs (clopidogrel, enteric-coated aspirin); two statin RCTs; one ACE-inhibitor RCT; and one alpha-blocker RCT. For drugs with a narrow therapeutic index, clinical equivalence was noted in all five warfarin RCTs and a single Class 1 anti-arrhythmic-agent RCT.
The aggregate effect size was -0.03 (95% CI, -0.15 to 0.08), which indicates nearly complete overlap of the generic and brand-name distributions. The data show no evidence of superiority of brand-name to generic drugs in clinical outcomes measured in the various studies.
In a separate review of editorials addressing generic substitution for cardiovascular drugs, 53% expressed a negative view of generic-drug substitution.
Bottom line: There is clinical equivalency between generic and brand-name drugs used in the treatment of cardiovascular disease. Despite this conclusion, a substantial number of editorials advise against generic substitution, which affects both patient and physician drug preferences.
Citation: Kesselheim A, Misono A, Lee J, et al. Clinical equivalence of generic and brand-name drugs used in cardiovascular disease: a systematic review and meta-analysis. JAMA. 2008; 300(21):2514-2526.
PEDIATRIC LITERATURE

Oral Prednisolone Does Not Shorten Hospitalization in Preschool-Age Children with Acute Virus-Induced Wheezing
Clinical question: Does oral prednisolone shorten duration of hospitalization in preschool-age children with acute virus-induced wheezing?
Background: Wheezing illnesses in young children are commonly associated with viral infections and may resolve with age without further stigmata of atopic asthma. Although systemic corticosteroids are commonly recommended for this population, evidence of their effectiveness is limited.
Study design: Randomized, double-blind, placebo-controlled trial.
Setting: Three hospitals in the United Kingdom.
Synopsis: Children between 10 and 60 months that presented to a hospital with a physician-diagnosed attack of wheezing preceded by a viral infection were randomized to receive oral prednisolone or a placebo. There was no significant difference between the groups in the time to hospital discharge. There also was no difference in the prespecified subgroup analysis of children at high risk for atopic asthma.
The median time between presentation and “fit for discharge” was relatively low in this sample—12 hours in the placebo group and 10.1 hours in the prednisolone group. Nearly half the patients were discharged within the first several hours after presentation, and not all patients were admitted to a pediatric ward. A short-stay observation ward within the ED was an option. Thus, the results may be most applicable to patients with mild to moderate disease, some of which may not be admitted to a traditional inpatient unit.
Bottom line: Systemic corticosteroids do not dramatically shorten hospital and ED stays in preschool-aged children with mild to moderate virus-induced wheezing.
Citation: Panickar J, Lakhanpaul M, Lambert P, et al. Oral prednisolone for preschool children with acute virus-induced wheezing. N Engl J Med. 2009;360(4):329-338.
Reviewed by pediatric editor Mark Shen, MD, medical director of hospital medicine at Dell Children’s Medical Center, Austin, Texas.
RRT Implement-ation Doesn’t Affect Hospitalwide Code Rates or Mortality
Clinical question: Does the use of a rapid-response team (RRT) affect hospitalwide code rates and mortality?
Background: In the 100,000 Lives campaign, the Institute for Healthcare Improvement recommended that hospitals implement RRTs to help reduce preventable, in-hospital deaths. Studies have demonstrated that rates of non-ICU codes decrease after RRT implementation. It is unclear if this translates to changes in mortality rates.
Study design: Prospective cohort study of adult inpatients.
Setting: Saint Luke’s Hospital, a 404-bed tertiary-care academic hospital in Kansas City, Mo.
Synopsis: The hospital documented a total of 376 RRT activations. After RRT implementation, mean hospitalwide code rates decreased to 7.5 per 1,000 admissions from 11.2 per 1,000 admissions. This was not associated with a statistically significant reduction in hospitalwide code rates (adjusted odds ratio 0.76; 95% CI; 0.57-1.01; P=0.06). Secondary analyses noted lower rates of non-ICU codes (0.59; 95% CI, 0.40-0.89) compared with ICU codes (0.95; 95% CI; 0.64-1.43; P=0.03 for interaction). Finally, the RRT implementation was not associated with lower hospital-wide mortality (0.95; 95% CI; 0.81-1.11; P=0.52).
Secondary analyses also revealed few instances of RRT undertreatment or underutilization that may have affected the mortality numbers.
A limitation of this study is that it was slightly underpowered (78%) to detect a significant mortality difference. The findings also represent a single institution experience, and may not be generalized to other adult hospital settings or RRT programs.
Bottom line: Implementation of an RRT does not confer lower rates of hospital-wide code arrests or mortality.
Citation: Chan P, Khalid A, Longmore L, et al. Hospital-wide code rates and mortality before and after implementation of a rapid response team. JAMA. 2008;300(21):2506-2513.
Simple Scoring System Provides Timely Prediction of Mortality in Acute Pancreatitis
Clinical question: How can physicians predict mortality in acute pancreatitis?
Background: Historical predictors of mortality in acute pancreatitis require up to 48 hours of data, such as with the Ranson Criteria, or extensive amounts of data, such as with the APACHE II score. An easier tool is needed to predict which patients are at higher risk of mortality.
Study design: Retrospective cohort.
Setting: Patients in the Cardinal Health clinical outcomes research database, which supports public reporting of hospital performance.
Synopsis: The authors identified patients with the principal diagnosis of pancreatitis from 2000-2001 and explored numerous diagnostic findings available within the first 24 hours. Ultimately, BUN >25, impaired mental status, presence of SIRS (systemic inflammatory response syndrome), age >60, and presence of a pleural effusion were found to be predictive of mortality. These diagnostic findings correspond to the mnemonic BISAP. The BISAP score was then validated in a second cohort that included patients from 2004-2005.
Each finding in the BISAP score was given one point. A score of less than 2 was present in approximately 60% of patients admitted with acute pancreatitis, and corresponded to a mortality of less than 1%. A score of 2 corresponded to a mortality of 2%. Higher scores were associated with steeply increasing mortality, with a score of 5 corresponding with greater than 20% mortality.
The BISAP score performed similarly to the APACHE II score, but the former is easier to calculate on the day of admission and has fewer parameters. A more challenging research step will be to demonstrate that using the BISAP score to determine treatment strategies can affect patient outcomes.
Bottom line: The easy-to-calculate BISAP score is a new method for predicting mortality in patients with acute pancreatitis. This tool should help hospitalists determine, on the day of admission, to what extent patients with acute pancreatitis need aggressive management, such as ICU admission and early involvement of specialists.
Citation: Wu B, Johannes R, Sun X, Tabak Y, Conwell D, Banks P. The early prediction of mortality in acute pancreatitis: a large population-based study. Gut. 2008;57(12): 1698-1703.
Nasal Swabs Identify Viral Causes in CAP Patients
Clinical question: How often is viral infection associated with community-acquired pneumonia (CAP) in adults?
Background: CAP is a clinically important disease that is associated with significant hospitalization and mortality. CAP treatment guidelines acknowledge respiratory viruses as an etiology for pneumonia, but few recommendations are made regarding management of these viral infections.
Study design: Prospective study.
Setting: Five hospitals in Edmonton, Alberta, from 2004-2006.
Synopsis: The authors enrolled 193 hospitalized adults, median age 71. Nucleic amplification tests (NATs) from nasopharyngeal swab specimens were tested for human metapneumovirus, respiratory syncytial virus, rhinovirus, parainfluenza virus 1-4, coronaviruses, and adenovirus.
Fifteen percent of these patients had a nasal swab positive for a viral infection. Interestingly, 4% of patients had both a positive viral nasal swab and positive bacterial cultures. Compared with bacterial infection, patients with viral infection tended to be older (76 vs. 64 years, P=0.01), have limited ambulation (66% vs. 32%, P=0.006), and have a history of cardiac disease (66% vs. 32%, P=0.02). Patients with bacterial pneumonia showed a statistically significant trend toward having chest pain, an abnormal white blood count, and a lobar infiltrate on chest X-ray.
Further investigations might look at how nasal swab data could be used to improve infection control within the hospital for patients found to have easily transmissible viruses. Further research could explore the feasibility of avoiding antibiotic use in patients found to have viral pneumonia, assuming bacterial co-infection is reliably excluded.
Bottom line: Nasal swabs using NAT technology could play a significant role in identifying pathogens in CAP patients. How this technology should affect clinical decision-making and how it might improve outcomes remains unknown.
Citation: Johnstone J, Majumdar S, Fox J, Marrie T. Viral infection in adults hospitalized with community-acquired pneumonia: prevalence, pathogens, and presentation. Chest. 2008;134(6):1141-1148.
Intensive Insulin Therapy Doesn’t Reduce ICU Mortality
Clinical question: Does the use of intensive insulin therapy decrease mortality in the intensive-care unit (ICU)?
Background: In 2001, Van den Berghe et al (N Engl J Med. 2001;345(19):1359-67) reported a reduction in morbidity and mortality with intensive insulin therapy (IIT) in surgical ICU patients. This study led to the adoption of IIT protocols in many hospitals. Since 2001, further studies have failed to reproduce the same dramatic benefit of IIT.
Study design: Randomized, controlled trial.
Setting: National Guard King Abdulaziz Medical City, a tertiary-care teaching hospital in Saudi Arabia.
Synopsis: Patients were included in this study if they were 18 years or older with serum glucose levels greater than 110 mg/dL during the first 24 hours of ICU admission. There were multiple exclusion criteria, including patients with Type I diabetes, documented hypoglycemia on ICU admission (glucose <40), or diabetic ketoacidosis.
Enrolled patients were randomized to IIT or conventional insulin therapy (CIT). A multidisciplinary team designed the protocols to maintain glucose levels of 80 to 110 mg/dL and 180 to 200 mg/dL in the IIT and the CIT groups, respectively. The primary endpoint measured was ICU mortality.
The study did not produce a statistically significant difference in ICU mortality (13.5% for IIT vs. 17.1% for CIT; P=0.30). The adjusted hypoglycemia rate was 6.8 per 100 treatment days with IIT and 0.4 per 100 treatment days with CIT (P<0.0001). Patients with hypoglycemia had higher ICU mortality (23.8% vs. 13.7%, P=0.02).
In the measurement of secondary endpoints, there was a trend toward lower episodes of severe sepsis and septic shock in the IIT group (20.7% in IIT vs. 27.2% in CIT, P=0.08). However, this result was not statistically significant.
Bottom line: This well-designed study failed to show a survival benefit with IIT use in the critical-care setting. Given the findings of this and several other recent studies, one should question whether IIT should be prescribed as the standard of care in all critically-ill patients.
Citation: Arabi Y, Dabbagh O, Tamim H, et al. Intensive versus conventional insulin therapy: a randomized controlled trial in medical and surgical critically ill patients. Crit Care Med. 2008;36(12):3190-3197.
Preoperative and Intraoperative Predictors of Cardiac Adverse Events
Clinical question: What are the incidence and risk factors for perioperative cardiac adverse events after noncardiac surgery?
Background: In the past few decades, the incidence of cardiac adverse events (CAEs) for a general surgery population has remained largely unchanged (approximately 1%). This is in spite of multiple studies evaluating predictive models and attempts at preventive treatment, including preoperative coronary revascularization and perioperative beta blockers.
Study design: Prospective observational study.
Setting: Single, large, tertiary-care university hospital.
Synopsis: A total of 7,740 cases were reviewed in this study, which consisted of general surgery (4,937), vascular surgery (1,846), and urological surgery (957). A trained nurse followed up for perioperative CAEs as many as 30 days after the operation via medical chart review, phone calls, and letters. CAEs were defined as: Q-wave myocardial infarction (MI), non-ST elevation MI, cardiac arrest, or new cardiac dysrhythmia. A total of 83 CAEs (1.1% of patients) had cardiac arrest, with cardiac dysrhythmia being most common.
A total of seven preoperative risk factors were identified as independent predictors for CAEs: age 68, BMI 30, emergent surgery, prior coronary intervention or cardiac surgery, active congestive heart failure, cerebrovascular disease, and hypertension. In addition, two intraoperative risk factors were identified: intraoperative transfusion of packed red blood cells and operative duration of 3.8 hours. (The P value was 0.05 for all independent predictors.)
A further evaluation of intraoperative parameters of high-risk patients experiencing a CAE showed that these patients were more likely to have an episode of mean arterial pressure (MAP) <50 mmHg, an episode of 40% decrease in MAP, and an episode of tachycardia (heart rate >100).
Bottom line: A combination of preoperative predictors and intraoperative elements can help improve risk assessment for perioperative CAEs after noncardiac surgery.
Citation: Kheterpal S, O’Reilly M, Englesbe M, et al. Preoperative and intraoperative predictors of cardiac adverse events after general, vascular, and urological surgery. Anesthesiology. 2009;110(1):58-66.
Early Feeding in the ICU Does Not Affect Hospital Mortality
Clinical question: Will implementing evidence-based feeding guidelines improve feeding practices and reduce mortality in ICU patients?
Background: There is evidence suggesting that providing nutritional support to ICU patients within 24 hours of admission may decrease mortality. It is widely understood that patient care varies between ICUs, and there exist no uniform, evidence-based guidelines for nutritional support. Many patients remain unfed after 48 hours.
Study design: Cluster, randomized-controlled trial.
Setting: ICUs in 27 community and tertiary-care hospitals in Australia and New Zealand.
Synopsis: Hospitals were randomized to intervention or control groups. Dietitian and intensivist co-investigators from intervention ICUs developed guidelines using the Clinical Practice Guideline Development Cycle. Control ICUs were requested to make no new ICU nutritional management changes. The study enrolled 1,118 eligible patients and included adults expected to stay longer than two days. Excluded were patients taking oral diets, patients receiving palliative care or with suspected brain death, and patients sent from other facilities.
Guidelines were implemented using several methods—educational outreach visits, one-on-one conversations, active reminders, passive reminders, and educational in-services. The guidelines were successful in evoking significant practice changes in all of the intervention ICUs. Significantly more patients received nutritional support during their ICU stays in guideline ICUs, and patients in these ICUs were fed significantly earlier. There were, however, no significant differences between guideline and control ICUs with regard to hospital discharge mortality (28.9% vs. 27.4%; 95% CI; -6.3% to 12.0%; P=0.75). The groups also showed no statistical difference in hospital or ICU length of stay.
Bottom line: Significantly more patients in the guideline ICUs were fed within 24 hours, but this did not translate into improvements in mortality or other clinical outcomes.
Citation: Doig G, Simpson F, Finfer S, et al. Effect of evidence-based feeding guidelines on mortality of critically ill adults: a cluster randomized controlled trial. JAMA. 2008;300(23):2731-2741.
Low-Dose Aspirin Doesn’t Reduce Cardiovascular Events in Type 2 Diabetes Patients
Clinical question: Is low-dose aspirin effective for the primary prevention of atherosclerotic events in patients with Type 2 diabetes?
Background: Diabetes is a significant risk factor for cardiovascular events. Several prior studies have shown that aspirin therapy is effective as a secondary prevention strategy for cardiovascular events. The American Diabetes Association also recommends use of aspirin as a primary prevention strategy. Clinical trial data is currently insufficient in this area.
Study design: Prospective, randomized, open-label, controlled trial with blinded endpoint assessment.
Setting: 163 institutions in Japan.
Synopsis: The study enrolled 2,539 diabetic patients between 30 and 85 years old—mean age was 65—and included patients without EKG changes or a significant history or ongoing treatment of atherosclerotic disease. Patients were randomly assigned into an aspirin group (81 mg or 100 mg once daily) or a nonaspirin group. Patients had a median follow up of 4.37 years.
The primary endpoint was any atherosclerotic event, ranging from sudden death to ischemic heart disease or stroke. The incidence of atherosclerotic events was not statistically different in the aspirin group (68 events, 5.4%) than in the nonaspirin group (86 events, 6.7%) (HR, 0.80; 95% CI; 0.58-1.10; log-rank test, P=0.16). However, there was a suggested benefit of primary prevention in the subgroup aged 65 years or older. In addition, the combined endpoint of fatal coronary and cerebrovascular events occurred in one patient in the aspirin group and 10 patients in the nonaspirin group (HR, 0.10; 95 % CI, 0.01-0.79; P=.0037). This study is limited by the low incidence of atherosclerotic disease in Japan.
Bottom line: Low-dose aspirin used in patients with Type 2 diabetes does not significantly demonstrate primary prevention of cardiovascular events.
Citation: Ogawa H, Nakayama M, Morimoto T, et al. Low-dose aspirin for primary prevention of atherosclerotic events in patients with type 2 diabetes: a randomized controlled trial. JAMA. 2008;300(18):2134-2141. TH
In This Edition
- Generic vs. brand-name drugs.
- Rapid-response teams and mortality.
- A new prediction rule for mortality in acute pancreatitis.
- Viral causes of community-acquired pneumonia.
- Intensive insulin therapy in the ICU.
- New preoperative and intraoperative risk factors.
- Timing of ICU feedings and mortality.
- Aspirin as primary prevention in diabetics.
Generic, Brand-Name Drugs Used for Cardiovascular Disease Are Clinically Equivalent
Clinical question: Is there a clinical risk when substituting generic drugs for brand-name drugs in the treatment of cardiovascular disease?
Background: Spending on healthcare in the U.S. has reached critical levels. Increasing prescription drug costs make up a large portion of healthcare expenditures. The high cost of medicines directly affect adherence to treatment regimens and contribute to poor health outcomes. Cardiovascular drugs make up the largest portion of outpatient prescription drug spending.
Study design: Systematic review of relevant articles with a meta-analysis performed to determine an aggregate effect size.
Setting: Multiple locations and varied patient populations.
Synopsis: A total of 47 articles were included in the review, of which 38 were randomized controlled trials (RCTs). The studies measured both clinical efficacy and safety end points. More than half the articles were published prior to 2000. Clinical equivalence was noted in all seven beta-blocker RCTs; 10 of 11 diuretic RCTs; five of seven calcium-channel-blocker RCTs; all three antiplatelet-agent RCTs (clopidogrel, enteric-coated aspirin); two statin RCTs; one ACE-inhibitor RCT; and one alpha-blocker RCT. For drugs with a narrow therapeutic index, clinical equivalence was noted in all five warfarin RCTs and a single Class 1 anti-arrhythmic-agent RCT.
The aggregate effect size was -0.03 (95% CI, -0.15 to 0.08), which indicates nearly complete overlap of the generic and brand-name distributions. The data show no evidence of superiority of brand-name to generic drugs in clinical outcomes measured in the various studies.
In a separate review of editorials addressing generic substitution for cardiovascular drugs, 53% expressed a negative view of generic-drug substitution.
Bottom line: There is clinical equivalency between generic and brand-name drugs used in the treatment of cardiovascular disease. Despite this conclusion, a substantial number of editorials advise against generic substitution, which affects both patient and physician drug preferences.
Citation: Kesselheim A, Misono A, Lee J, et al. Clinical equivalence of generic and brand-name drugs used in cardiovascular disease: a systematic review and meta-analysis. JAMA. 2008; 300(21):2514-2526.
PEDIATRIC LITERATURE
Oral Prednisolone Does Not Shorten Hospitalization in Preschool-Age Children with Acute Virus-Induced Wheezing
Clinical question: Does oral prednisolone shorten duration of hospitalization in preschool-age children with acute virus-induced wheezing?
Background: Wheezing illnesses in young children are commonly associated with viral infections and may resolve with age without further stigmata of atopic asthma. Although systemic corticosteroids are commonly recommended for this population, evidence of their effectiveness is limited.
Study design: Randomized, double-blind, placebo-controlled trial.
Setting: Three hospitals in the United Kingdom.
Synopsis: Children between 10 and 60 months that presented to a hospital with a physician-diagnosed attack of wheezing preceded by a viral infection were randomized to receive oral prednisolone or a placebo. There was no significant difference between the groups in the time to hospital discharge. There also was no difference in the prespecified subgroup analysis of children at high risk for atopic asthma.
The median time between presentation and “fit for discharge” was relatively low in this sample—12 hours in the placebo group and 10.1 hours in the prednisolone group. Nearly half the patients were discharged within the first several hours after presentation, and not all patients were admitted to a pediatric ward. A short-stay observation ward within the ED was an option. Thus, the results may be most applicable to patients with mild to moderate disease, some of which may not be admitted to a traditional inpatient unit.
Bottom line: Systemic corticosteroids do not dramatically shorten hospital and ED stays in preschool-aged children with mild to moderate virus-induced wheezing.
Citation: Panickar J, Lakhanpaul M, Lambert P, et al. Oral prednisolone for preschool children with acute virus-induced wheezing. N Engl J Med. 2009;360(4):329-338.
Reviewed by pediatric editor Mark Shen, MD, medical director of hospital medicine at Dell Children’s Medical Center, Austin, Texas.
RRT Implement-ation Doesn’t Affect Hospitalwide Code Rates or Mortality
Clinical question: Does the use of a rapid-response team (RRT) affect hospitalwide code rates and mortality?
Background: In the 100,000 Lives campaign, the Institute for Healthcare Improvement recommended that hospitals implement RRTs to help reduce preventable, in-hospital deaths. Studies have demonstrated that rates of non-ICU codes decrease after RRT implementation. It is unclear if this translates to changes in mortality rates.
Study design: Prospective cohort study of adult inpatients.
Setting: Saint Luke’s Hospital, a 404-bed tertiary-care academic hospital in Kansas City, Mo.
Synopsis: The hospital documented a total of 376 RRT activations. After RRT implementation, mean hospitalwide code rates decreased to 7.5 per 1,000 admissions from 11.2 per 1,000 admissions. This was not associated with a statistically significant reduction in hospitalwide code rates (adjusted odds ratio 0.76; 95% CI; 0.57-1.01; P=0.06). Secondary analyses noted lower rates of non-ICU codes (0.59; 95% CI, 0.40-0.89) compared with ICU codes (0.95; 95% CI; 0.64-1.43; P=0.03 for interaction). Finally, the RRT implementation was not associated with lower hospital-wide mortality (0.95; 95% CI; 0.81-1.11; P=0.52).
Secondary analyses also revealed few instances of RRT undertreatment or underutilization that may have affected the mortality numbers.
A limitation of this study is that it was slightly underpowered (78%) to detect a significant mortality difference. The findings also represent a single institution experience, and may not be generalized to other adult hospital settings or RRT programs.
Bottom line: Implementation of an RRT does not confer lower rates of hospital-wide code arrests or mortality.
Citation: Chan P, Khalid A, Longmore L, et al. Hospital-wide code rates and mortality before and after implementation of a rapid response team. JAMA. 2008;300(21):2506-2513.
Simple Scoring System Provides Timely Prediction of Mortality in Acute Pancreatitis
Clinical question: How can physicians predict mortality in acute pancreatitis?
Background: Historical predictors of mortality in acute pancreatitis require up to 48 hours of data, such as with the Ranson Criteria, or extensive amounts of data, such as with the APACHE II score. An easier tool is needed to predict which patients are at higher risk of mortality.
Study design: Retrospective cohort.
Setting: Patients in the Cardinal Health clinical outcomes research database, which supports public reporting of hospital performance.
Synopsis: The authors identified patients with the principal diagnosis of pancreatitis from 2000-2001 and explored numerous diagnostic findings available within the first 24 hours. Ultimately, BUN >25, impaired mental status, presence of SIRS (systemic inflammatory response syndrome), age >60, and presence of a pleural effusion were found to be predictive of mortality. These diagnostic findings correspond to the mnemonic BISAP. The BISAP score was then validated in a second cohort that included patients from 2004-2005.
Each finding in the BISAP score was given one point. A score of less than 2 was present in approximately 60% of patients admitted with acute pancreatitis, and corresponded to a mortality of less than 1%. A score of 2 corresponded to a mortality of 2%. Higher scores were associated with steeply increasing mortality, with a score of 5 corresponding with greater than 20% mortality.
The BISAP score performed similarly to the APACHE II score, but the former is easier to calculate on the day of admission and has fewer parameters. A more challenging research step will be to demonstrate that using the BISAP score to determine treatment strategies can affect patient outcomes.
Bottom line: The easy-to-calculate BISAP score is a new method for predicting mortality in patients with acute pancreatitis. This tool should help hospitalists determine, on the day of admission, to what extent patients with acute pancreatitis need aggressive management, such as ICU admission and early involvement of specialists.
Citation: Wu B, Johannes R, Sun X, Tabak Y, Conwell D, Banks P. The early prediction of mortality in acute pancreatitis: a large population-based study. Gut. 2008;57(12): 1698-1703.
Nasal Swabs Identify Viral Causes in CAP Patients
Clinical question: How often is viral infection associated with community-acquired pneumonia (CAP) in adults?
Background: CAP is a clinically important disease that is associated with significant hospitalization and mortality. CAP treatment guidelines acknowledge respiratory viruses as an etiology for pneumonia, but few recommendations are made regarding management of these viral infections.
Study design: Prospective study.
Setting: Five hospitals in Edmonton, Alberta, from 2004-2006.
Synopsis: The authors enrolled 193 hospitalized adults, median age 71. Nucleic amplification tests (NATs) from nasopharyngeal swab specimens were tested for human metapneumovirus, respiratory syncytial virus, rhinovirus, parainfluenza virus 1-4, coronaviruses, and adenovirus.
Fifteen percent of these patients had a nasal swab positive for a viral infection. Interestingly, 4% of patients had both a positive viral nasal swab and positive bacterial cultures. Compared with bacterial infection, patients with viral infection tended to be older (76 vs. 64 years, P=0.01), have limited ambulation (66% vs. 32%, P=0.006), and have a history of cardiac disease (66% vs. 32%, P=0.02). Patients with bacterial pneumonia showed a statistically significant trend toward having chest pain, an abnormal white blood count, and a lobar infiltrate on chest X-ray.
Further investigations might look at how nasal swab data could be used to improve infection control within the hospital for patients found to have easily transmissible viruses. Further research could explore the feasibility of avoiding antibiotic use in patients found to have viral pneumonia, assuming bacterial co-infection is reliably excluded.
Bottom line: Nasal swabs using NAT technology could play a significant role in identifying pathogens in CAP patients. How this technology should affect clinical decision-making and how it might improve outcomes remains unknown.
Citation: Johnstone J, Majumdar S, Fox J, Marrie T. Viral infection in adults hospitalized with community-acquired pneumonia: prevalence, pathogens, and presentation. Chest. 2008;134(6):1141-1148.
Intensive Insulin Therapy Doesn’t Reduce ICU Mortality
Clinical question: Does the use of intensive insulin therapy decrease mortality in the intensive-care unit (ICU)?
Background: In 2001, Van den Berghe et al (N Engl J Med. 2001;345(19):1359-67) reported a reduction in morbidity and mortality with intensive insulin therapy (IIT) in surgical ICU patients. This study led to the adoption of IIT protocols in many hospitals. Since 2001, further studies have failed to reproduce the same dramatic benefit of IIT.
Study design: Randomized, controlled trial.
Setting: National Guard King Abdulaziz Medical City, a tertiary-care teaching hospital in Saudi Arabia.
Synopsis: Patients were included in this study if they were 18 years or older with serum glucose levels greater than 110 mg/dL during the first 24 hours of ICU admission. There were multiple exclusion criteria, including patients with Type I diabetes, documented hypoglycemia on ICU admission (glucose <40), or diabetic ketoacidosis.
Enrolled patients were randomized to IIT or conventional insulin therapy (CIT). A multidisciplinary team designed the protocols to maintain glucose levels of 80 to 110 mg/dL and 180 to 200 mg/dL in the IIT and the CIT groups, respectively. The primary endpoint measured was ICU mortality.
The study did not produce a statistically significant difference in ICU mortality (13.5% for IIT vs. 17.1% for CIT; P=0.30). The adjusted hypoglycemia rate was 6.8 per 100 treatment days with IIT and 0.4 per 100 treatment days with CIT (P<0.0001). Patients with hypoglycemia had higher ICU mortality (23.8% vs. 13.7%, P=0.02).
In the measurement of secondary endpoints, there was a trend toward lower episodes of severe sepsis and septic shock in the IIT group (20.7% in IIT vs. 27.2% in CIT, P=0.08). However, this result was not statistically significant.
Bottom line: This well-designed study failed to show a survival benefit with IIT use in the critical-care setting. Given the findings of this and several other recent studies, one should question whether IIT should be prescribed as the standard of care in all critically-ill patients.
Citation: Arabi Y, Dabbagh O, Tamim H, et al. Intensive versus conventional insulin therapy: a randomized controlled trial in medical and surgical critically ill patients. Crit Care Med. 2008;36(12):3190-3197.
Preoperative and Intraoperative Predictors of Cardiac Adverse Events
Clinical question: What are the incidence and risk factors for perioperative cardiac adverse events after noncardiac surgery?
Background: In the past few decades, the incidence of cardiac adverse events (CAEs) for a general surgery population has remained largely unchanged (approximately 1%). This is in spite of multiple studies evaluating predictive models and attempts at preventive treatment, including preoperative coronary revascularization and perioperative beta blockers.
Study design: Prospective observational study.
Setting: Single, large, tertiary-care university hospital.
Synopsis: A total of 7,740 cases were reviewed in this study, which consisted of general surgery (4,937), vascular surgery (1,846), and urological surgery (957). A trained nurse followed up for perioperative CAEs as many as 30 days after the operation via medical chart review, phone calls, and letters. CAEs were defined as: Q-wave myocardial infarction (MI), non-ST elevation MI, cardiac arrest, or new cardiac dysrhythmia. A total of 83 CAEs (1.1% of patients) had cardiac arrest, with cardiac dysrhythmia being most common.
A total of seven preoperative risk factors were identified as independent predictors for CAEs: age 68, BMI 30, emergent surgery, prior coronary intervention or cardiac surgery, active congestive heart failure, cerebrovascular disease, and hypertension. In addition, two intraoperative risk factors were identified: intraoperative transfusion of packed red blood cells and operative duration of 3.8 hours. (The P value was 0.05 for all independent predictors.)
A further evaluation of intraoperative parameters of high-risk patients experiencing a CAE showed that these patients were more likely to have an episode of mean arterial pressure (MAP) <50 mmHg, an episode of 40% decrease in MAP, and an episode of tachycardia (heart rate >100).
Bottom line: A combination of preoperative predictors and intraoperative elements can help improve risk assessment for perioperative CAEs after noncardiac surgery.
Citation: Kheterpal S, O’Reilly M, Englesbe M, et al. Preoperative and intraoperative predictors of cardiac adverse events after general, vascular, and urological surgery. Anesthesiology. 2009;110(1):58-66.
Early Feeding in the ICU Does Not Affect Hospital Mortality
Clinical question: Will implementing evidence-based feeding guidelines improve feeding practices and reduce mortality in ICU patients?
Background: There is evidence suggesting that providing nutritional support to ICU patients within 24 hours of admission may decrease mortality. It is widely understood that patient care varies between ICUs, and there exist no uniform, evidence-based guidelines for nutritional support. Many patients remain unfed after 48 hours.
Study design: Cluster, randomized-controlled trial.
Setting: ICUs in 27 community and tertiary-care hospitals in Australia and New Zealand.
Synopsis: Hospitals were randomized to intervention or control groups. Dietitian and intensivist co-investigators from intervention ICUs developed guidelines using the Clinical Practice Guideline Development Cycle. Control ICUs were requested to make no new ICU nutritional management changes. The study enrolled 1,118 eligible patients and included adults expected to stay longer than two days. Excluded were patients taking oral diets, patients receiving palliative care or with suspected brain death, and patients sent from other facilities.
Guidelines were implemented using several methods—educational outreach visits, one-on-one conversations, active reminders, passive reminders, and educational in-services. The guidelines were successful in evoking significant practice changes in all of the intervention ICUs. Significantly more patients received nutritional support during their ICU stays in guideline ICUs, and patients in these ICUs were fed significantly earlier. There were, however, no significant differences between guideline and control ICUs with regard to hospital discharge mortality (28.9% vs. 27.4%; 95% CI; -6.3% to 12.0%; P=0.75). The groups also showed no statistical difference in hospital or ICU length of stay.
Bottom line: Significantly more patients in the guideline ICUs were fed within 24 hours, but this did not translate into improvements in mortality or other clinical outcomes.
Citation: Doig G, Simpson F, Finfer S, et al. Effect of evidence-based feeding guidelines on mortality of critically ill adults: a cluster randomized controlled trial. JAMA. 2008;300(23):2731-2741.
Low-Dose Aspirin Doesn’t Reduce Cardiovascular Events in Type 2 Diabetes Patients
Clinical question: Is low-dose aspirin effective for the primary prevention of atherosclerotic events in patients with Type 2 diabetes?
Background: Diabetes is a significant risk factor for cardiovascular events. Several prior studies have shown that aspirin therapy is effective as a secondary prevention strategy for cardiovascular events. The American Diabetes Association also recommends use of aspirin as a primary prevention strategy. Clinical trial data is currently insufficient in this area.
Study design: Prospective, randomized, open-label, controlled trial with blinded endpoint assessment.
Setting: 163 institutions in Japan.
Synopsis: The study enrolled 2,539 diabetic patients between 30 and 85 years old—mean age was 65—and included patients without EKG changes or a significant history or ongoing treatment of atherosclerotic disease. Patients were randomly assigned into an aspirin group (81 mg or 100 mg once daily) or a nonaspirin group. Patients had a median follow up of 4.37 years.
The primary endpoint was any atherosclerotic event, ranging from sudden death to ischemic heart disease or stroke. The incidence of atherosclerotic events was not statistically different in the aspirin group (68 events, 5.4%) than in the nonaspirin group (86 events, 6.7%) (HR, 0.80; 95% CI; 0.58-1.10; log-rank test, P=0.16). However, there was a suggested benefit of primary prevention in the subgroup aged 65 years or older. In addition, the combined endpoint of fatal coronary and cerebrovascular events occurred in one patient in the aspirin group and 10 patients in the nonaspirin group (HR, 0.10; 95 % CI, 0.01-0.79; P=.0037). This study is limited by the low incidence of atherosclerotic disease in Japan.
Bottom line: Low-dose aspirin used in patients with Type 2 diabetes does not significantly demonstrate primary prevention of cardiovascular events.
Citation: Ogawa H, Nakayama M, Morimoto T, et al. Low-dose aspirin for primary prevention of atherosclerotic events in patients with type 2 diabetes: a randomized controlled trial. JAMA. 2008;300(18):2134-2141. TH
Telemedicine Can Help Solve Intensivist Shortage
Having spent my medical career in the ICU and the hospital, I have followed the recent articles on the struggle to care for ICU patients with interest. Gretchen Henkel’s article on hospitalists filling ICU manpower gaps (“The New Intensivists,” October 2008, p. 1) poses a very real question for community hospitals, which face the greatest challenges in this area. Two issues are common: 1) difficulty in providing 24/7 ICU coverage and 2) the competing priorities that ICU medical leaders face. For these challenges, telemedicine offers a possible solution.
This unique, high-intensity, multidisciplinary approach to the patient population—an integral part of intensivist training—is a proven process shown to have meaningful results in the ICU. However, the team approach to managing ICU patients can be hard to come by. As suggested in Henkel’s article, there are several ways to approach this, but simply having a hospitalist consult on an ICU patient is not, I believe, a solution. Not only can this add to the strain on a hospitalist team, but a proactive approach to the ICU patient also can be hampered by the need for hospitalists to be present in the medical-surgical areas. Ideally, an intensivist should lead a multiprofessional team; however, there is a tremendous intensivist shortage, with less than 20% of ICUs staffed with them. Telemedicine offers a way to bridge the gap of expertise and manpower in many settings, bringing intensivists to the forefront of the ICU multidisciplinary team.
For the multidisciplinary approach to be effective, a physician must be committed to creating the team and identifying the measures that it will impact. In many community hospitals, this is the ICU medical director. However, competing priorities can make this directive difficult to achieve. Teleintensivists, intensivists that practice medicine via telemedicine, proactively establish best practices and a multidisciplinary approach, thus dramatically affecting the quality and financial metrics of the ICU.
Lack of 24/7 ICU coverage is another big challenge for community hospitals. Trying to meet this challenge by simply adding intensivists is likely to be met with defeat, given the shortage of hospitalists. And adding more hospitalists in the ICU continues to drive the hospitalist shortage. There is a variety of solutions for bedside procedures; however, the constant need to respond to phone calls and unpredictable patient interventions remains. While utilizing midlevel providers can help, this approach is not likely to support the demand of the aging population.
Hospitals increasingly are considering telemedicine to meet the 24/7 need. Teleintensivists have risen to add manpower and immediate response to ICU patients. Without the distraction of constant interruptions and with a process to manage the deluge of data, community hospitals with teleintensivist programs are seeing a drop in ventilator-associated pneumonia, better blood glucose management, and compliance with sepsis and other bundles.
This proactive approach to ICU patient care has led to significant decreases in mortality and lengths of stay.
A recent article in The New York Times focused on “disruptive innovation” in healthcare.1 Given the pressing issues facing the industry, disruptive innovation―at the bedside as well as with telemedicine technology―will be a key factor in meeting our ICU needs successfully.
Mary Jo Gorman, MD, MBA
Editor’s note: Dr. Gorman, a former SHM president, is the CEO of St. Louis-based Advanced ICU Care, which provides intensivists to community hospitals using telemedicine. TH
Reference
1. Rae-Dupree J. Disruptive innovation, applied to health care. The New York Times Web site. Available at: www.nytimes.com/2009/02/01/business/01unbox.html?scp=1&sq=disruptive%20innovation&st=cse. Accessed March 3, 2009.
Non-Physician Providers: Vital HM Resources
Enter text here
Enter text here
Enter text here
Project BOOST Expands
SHM’s Project BOOST (Better Outcomes for Older Adults through Safe Transitions) is an initiative to improve practices in transition care and reduce readmission rates for hospitals across the country. The project’s toolkit, mentoring program, and national advocacy efforts have proven so successful that the program is expanding this year.
In 2008, SHM began the first round of the Project BOOST mentoring program in six pilot hospitals. The first full cycle of Project BOOST mentoring sites began in March at 24 sites. The Hospitalist will feature updates on the full cycle of Project BOOST later this year. For more information about Project BOOST, visit www.hospitalmedicine.org/BOOST or e-mail BOOST@hospitalmedicine.org.
As a pilot site, Southwestern Vermont Medical Center in Bennington has worked with mentors for the past six months. We caught up with project leader Jennifer Fells, RN, MS, to discuss the institution’s participation.
—Jennifer Fells, RN, MS, Southwestern Vermont Medical Center, Bennington
Question: Why did your group choose to participate in the mentoring program?
Answer: We wanted to reduce our readmission rate, and we knew we weren’t doing a service to patients. This was also a goal of our organization overall; it’s not only a benefit to the hospital, but a larger value when the patient goes back to the community.
Q: How has the BOOST mentoring program benefited your program?
A: It helped us get organized by beginning the process and affirmed our belief that there were ways to address readmissions. The toolkit has proved to be invaluable. The mentors helped us keep on track and offered us guidance. They share the experiences of the other Project BOOST teams, and we benefit from that information.
Chapter Updates

Georgia Coastal
The chapter’s second meeting was well attended by both of the large hospitalist groups in Atlanta; two hospitalists from a rural institution also were in attendance. Leena Dutta, MD, of North Fulton Regional Hospital in Roswell, spoke about her experience as a hospitalist and the uses of Tygacil.

Los Angeles
The chapter met Feb. 3 for dinner at Valentino’s Restaurant in Santa Monica. Twenty-five hospitalists and residents from academic and private institutions attended the meeting, which featured two presentations. The night started off with a discussion about the management of bloodstream infections, led by Anjay Rastogi, MD, of UCLA Medical Center. Robert Schultz and Craig Steinhauer of financial planning services firm NWF discussed “Navigating Through Rocky Times: A Guide to Investment and Retirement Strategies.”
Miami/South Florida
The chapter met Jan. 22, and the keynote speaker was treasurer Efren Manjarrez, MD, who gave a presentation on “Transition of Care.” He revealed data from a soon-to-be-released SHM task force paper. The presentation was well received, and the local HM programs agreed to collaborate to collect more data for future studies.
The changes in the approach to the discharge process were a surprise to us. After we developed our team, we discovered how fragmented the discharge process was throughout the entire organization. Discharges were handled over multiple disciplines, and it was fragmented by design.
For example, our documentation, discharge plans, discharge recommendations, and patient-education materials are in different parts of our documentation system.
Q: What did you learn about your program through the initial Project BOOST step: analyze care delivery?
A: We realized that disciplines were not coordinated with one another and there was not enough time for the physician to complete the discharge plan. The process was cumbersome, awkward, and very time-consuming. We were looking to create efficiency in the information that needs to be coordinated to do those discharge orders.
Q: What additional changes do you hope to see in the remaining time with BOOST mentors?
A: We definitely hope to improve our process. We want to have implemented the tools and have a coordinated discharge process, and a centralized way to communicate the discharge plan. We found a lack of communication creates a barrier among disciplines, and we hope to correct that and become more customer-friendly to patients.
Q: How did your site’s BOOST mentor assist in the implementation process? What was the outcome?
A: Our site mentor helped with the clarification of data to be collected for measurement, keeping us on track with the toolkit, and served as another set of eyes. When you are in an organization, and even when you have the appropriate team, you always need somebody to say, “What do you think about this?” or “Did you think about this item?”
It’s another perspective, sharing gained knowledge from other organizations. That’s very critical.
SHM marketing coordinator Nadia Clenending contributed to this report.
SHM’s Project BOOST (Better Outcomes for Older Adults through Safe Transitions) is an initiative to improve practices in transition care and reduce readmission rates for hospitals across the country. The project’s toolkit, mentoring program, and national advocacy efforts have proven so successful that the program is expanding this year.
In 2008, SHM began the first round of the Project BOOST mentoring program in six pilot hospitals. The first full cycle of Project BOOST mentoring sites began in March at 24 sites. The Hospitalist will feature updates on the full cycle of Project BOOST later this year. For more information about Project BOOST, visit www.hospitalmedicine.org/BOOST or e-mail BOOST@hospitalmedicine.org.
As a pilot site, Southwestern Vermont Medical Center in Bennington has worked with mentors for the past six months. We caught up with project leader Jennifer Fells, RN, MS, to discuss the institution’s participation.
—Jennifer Fells, RN, MS, Southwestern Vermont Medical Center, Bennington
Question: Why did your group choose to participate in the mentoring program?
Answer: We wanted to reduce our readmission rate, and we knew we weren’t doing a service to patients. This was also a goal of our organization overall; it’s not only a benefit to the hospital, but a larger value when the patient goes back to the community.
Q: How has the BOOST mentoring program benefited your program?
A: It helped us get organized by beginning the process and affirmed our belief that there were ways to address readmissions. The toolkit has proved to be invaluable. The mentors helped us keep on track and offered us guidance. They share the experiences of the other Project BOOST teams, and we benefit from that information.
Chapter Updates
Georgia Coastal
The chapter’s second meeting was well attended by both of the large hospitalist groups in Atlanta; two hospitalists from a rural institution also were in attendance. Leena Dutta, MD, of North Fulton Regional Hospital in Roswell, spoke about her experience as a hospitalist and the uses of Tygacil.
Los Angeles
The chapter met Feb. 3 for dinner at Valentino’s Restaurant in Santa Monica. Twenty-five hospitalists and residents from academic and private institutions attended the meeting, which featured two presentations. The night started off with a discussion about the management of bloodstream infections, led by Anjay Rastogi, MD, of UCLA Medical Center. Robert Schultz and Craig Steinhauer of financial planning services firm NWF discussed “Navigating Through Rocky Times: A Guide to Investment and Retirement Strategies.”
Miami/South Florida
The chapter met Jan. 22, and the keynote speaker was treasurer Efren Manjarrez, MD, who gave a presentation on “Transition of Care.” He revealed data from a soon-to-be-released SHM task force paper. The presentation was well received, and the local HM programs agreed to collaborate to collect more data for future studies.
The changes in the approach to the discharge process were a surprise to us. After we developed our team, we discovered how fragmented the discharge process was throughout the entire organization. Discharges were handled over multiple disciplines, and it was fragmented by design.
For example, our documentation, discharge plans, discharge recommendations, and patient-education materials are in different parts of our documentation system.
Q: What did you learn about your program through the initial Project BOOST step: analyze care delivery?
A: We realized that disciplines were not coordinated with one another and there was not enough time for the physician to complete the discharge plan. The process was cumbersome, awkward, and very time-consuming. We were looking to create efficiency in the information that needs to be coordinated to do those discharge orders.
Q: What additional changes do you hope to see in the remaining time with BOOST mentors?
A: We definitely hope to improve our process. We want to have implemented the tools and have a coordinated discharge process, and a centralized way to communicate the discharge plan. We found a lack of communication creates a barrier among disciplines, and we hope to correct that and become more customer-friendly to patients.
Q: How did your site’s BOOST mentor assist in the implementation process? What was the outcome?
A: Our site mentor helped with the clarification of data to be collected for measurement, keeping us on track with the toolkit, and served as another set of eyes. When you are in an organization, and even when you have the appropriate team, you always need somebody to say, “What do you think about this?” or “Did you think about this item?”
It’s another perspective, sharing gained knowledge from other organizations. That’s very critical.
SHM marketing coordinator Nadia Clenending contributed to this report.
The latest research you need to know
Literature at a Glance
A guide to this month’s studies.
- Score predicts risk of intracerebral hemorrhage after thrombolysis.
- Trigylcerides and stroke-risk predictors.
- PPI use and risk of community-acquired pneumonia.
- Clopidogrel before coronary intervention might improve outcomes.
- High-dose clopidogrel after coronary intervention is beneficial.
- B-type natriuretic peptide level and sepsis.
- Thrombolytic use in pulmonary embolism.
- Hospitalists and ED patient flow.
Simple Clinical Score Predicts Intracerebral Hemorrhage after Thrombolysis
Clinical question: Is there a simple scoring tool that will predict the risk of intracerebral hemorrhage (ICH) following IV tissue-plasminogen activator (t-PA) in ischemic strokes?
Background: The use of t-PA in acute ischemic stroke (AIS) is about 2% to 4%, due in part to fear of conversion of an ischemic event to an ICH. Several studies using t-PA after AIS have identified risk factors for ICH; however, none has looked at the cumulative risk and prognosis for an individual candidate based on these factors.
Study design: Retrospective, observational cohort study.
Setting: The National Institute of Neurological Disorders and Stroke Trials 1 and 2, and consecutive patients treated at Beth Israel Deaconess Medical Center, Boston.
Synopsis: After an extensive literature review, a five-point scale to determine the risk of hemorrhage after t-PA (HAT) was developed using the top four predictive factors based on odds ratios. These included the National Institutes of Health Stroke Scale (NIHSS), presence and extent of hypodensity on initial CT scan, history of diabetes, and high baseline serum glucose. The predictive value of this scale was tested against two independent cohorts of patients with AIS treated with IV t-PA. The HAT scale was able to reasonably predict both the risk of ICH following t-PA and the functional outcome at 90 days. Higher scores on the scale tended to do worse, especially scores of three or more. Its retrospective nature and small number of patients experiencing ICH limit this study.
Bottom line: The HAT score is a quick bedside tool that can help in the counseling of patients and families in conjunction with the risks and benefits of t-PA after ischemic stroke.
Citation: Lou M, Safdar A, Mehdiratta M, et al. The HAT Score: a simple grading scale for predicting hemorrhage after thrombolysis. Neurology. 2008;71:1417-1423.
Nonfasting Triglycerides Predict Stroke Risk
Clinical question: Is there a correlation between nonfasting triglyceride levels and ischemic stroke?
Background: Most individuals are in a nonfasting state, with the exception of several hours prior to breakfast. Fasting cholesterol levels exclude most remnant lipoproteins, which might play a role in early atherosclerotic disease. Increased levels of triglycerides in a nonfasting state indicate the presence of these remnants.
Study design: Prospective, population-based cohort study.
Setting: The Copenhagen City Heart Study.
Synopsis: The study included 13,956 individuals between the ages of 20 and 93 with a follow-up period of up to 31 years. Cholesterol levels were checked during four evaluation periods: 1976-1978, 1981-1983, 1991-1994, and 2001-2003. Eighty-two percent of the participants had eaten a meal within three hours of the blood draw; the other 18% had eaten more than three hours prior to the draw. The study showed an association between increasing nonfasting triglyceride levels and a step-wise increase in the risk of ischemic stroke. The highest risk came in individuals with nonfasting triglyceride levels > 443mg/dl, which was associated with a three- to fourfold greater risk of ischemic stroke. The study was limited in that it evaluated a homogenous group of individuals, which may not reflect other racial or ethnic populations.
Bottom line: Increasing levels of nonfasting triglycerides are associated with an increased risk of ischemic stroke.
Citation: Freiberg J, Tybjaerg-Hansen A, Jensen JS, Nordestgaard BG. Nonfasting triglycerides and risk of ischemic stroke in the general population. JAMA. 2008;300(18):2142-2152.
Proton-Pump Inhibitor (PPI) Use Increases the Risk of Community-Acquired Pneumonia (CAP)
Clinical question: Is there an association between PPI use and CAP?
Background: CAP is associated with significant morbidity, annually accounting for billions of healthcare dollars. Proton-pump inhibitors (PPI) are a mainstay treatment for gastric acid suppression. Previous studies have suggested using PPIs may increase the risk of developing CAP.
Study design: Nested case control study.
Setting: Outpatient general practices, United Kingdom.
Synopsis: The association between PPI use and CAP was evaluated in a cohort of more than 7 million patients using the UK’s general-practice research database. Eligible participants were divided into two groups: case patients and control patients. Initial results indicated an increased risk of CAP with PPI use. After adjusting for confounding variables, the use of a PPI was strongly associated with CAP development when used within 30 days prior of the diagnosis, and most notably within 48 hours of diagnosis. It also was noted that the risk of developing CAP with longer-term PPI use was much lower. This inverse temporal relationship was noted in two previous studies. The limitations of this study were related to presumed adherence and compliance with PPI therapy. There also was no radiographic data to support the diagnosis of pneumonia in these cases, both of which could bias the results.
Bottom line: There appears to be an increased risk of CAP with PPI use. This risk is most notable within 48 hours. However, long-term, chronic PPI use was not associated with an increased risk of CAP.
Citation: Sarkar M, Hennessy S, Yang YX. Proton-pump inhibitor use and the risk for community-acquired pneumonia. Ann Intern Med. 2008;149:391-398.
Clopidogrel Prior to Percutaneous Intervention (PCI) Might Improve Outcomes in Patients with Acute ST-Elevation Myocardial Infarction (STEMI)
Clinical question: Does pretreatment with clopidogrel prior to PCI in acute STEMI improve outcomes?
Background: Extant guidelines for early utilization of clopidogrel in STEMI patients are based on results of studies of patients with non-ST-elevation acute coronary syndromes or treatment with thrombolytics.
Study design: Systematic review.
Setting: MEDLINE and Cochrane Controlled Trials Register of randomized controlled trials.
Synopsis: The authors selected 38 treatment groups, including 8,429 patients with STEMI who underwent primary PCI. They found a statistically significant difference in initial patency, and further found clopidogrel pretreatment was an independent predictor of early reperfusion and improved clinical outcome. This study suggests a benefit to pretreatment with clopidogrel but likely is not sufficient to establish such pretreatment as the standard of care. The limitations of this study were a retrospective review/meta-analysis, as the ability to limit the influence of confounding variables is reduced.
Bottom line: Pretreatment with clopidogrel in patients with acute STEMI undergoing primary PCI appears beneficial based on the results of this review of available evidence.
Citation: Vlaar PJ, Svilaas T, Damman K, et al. Impact of pretreatment with clopidogrel on initial patency and outcomes in patients treated with primary percutaneous coronary intervention for ST-segment elevation myocardial infarction: a systematic review. Circulation. 2008;118:1828-1836.
High-Dose Clopidogrel after PCI Is Beneficial
Clinical question: Does high-dose clopidogrel improve patient outcome following PCI?
Background: Studies have shown antiplatelet resistance after PCI is associated with an increased risk of cardiovascular events, including in-stent thrombosis and death. Other studies have shown the benefit of high-dose clopidogrel by the inhibition of platelet aggregation. Limited information is available regarding the applicability to patients after PCI.
Study design: Retrospective study of 2,954 consecutive patients divided into two groups, low-dose and high-dose clopidogrel use.
Setting: Single hospital in France.
Synopsis: The low-dose study group undergoing PCI was pretreated with 300 mg clopidogrel, followed by ASA 75 mg and clopidogrel 75 mg daily for two months. The second group undergoing PCI was pretreated with 600 mg clopidogrel followed by ASA 75 mg and clopidogrel 150 mg for 15 days, then maintained on ASA 75 mg and clopidogrel 75 mg. Patients received follow-up at two months and were evaluated for in-stent thrombosis, myocardial infarction (MI), death, and hemorrhagic complications. The two groups were matched one-to-one using propensity scoring and the nearest-pair-matching method blinded to patient outcome.
The high-dose clopidogrel group showed a decreased incidence of MI, in-stent thrombosis, and death. This benefit confirms the importance of achieving early and adequate antiplatelet therapy. However, the study authors noted a higher percentage of major bleeding and minor bleeding, although the increase was not statistically significant (2.8% vs. 3.5%, P=0.379, and 7.4% vs. 8.2%, P=0.699, respectively).
Bottom line: High-dose clopidogrel before and within the first 15 days after PCI decreases the risk of MI, in-stent thrombosis, and death, with no statistical increase in bleeding complications. Long-range studies beyond the two-month interval might be beneficial.
Citation: Lemesle G, Delhaye C, Sudre A, et al. Impact of high loading and maintenance dose of clopidogrel within the first 15 days after percutaneous coronary intervention on patient outcome. Am Heart J. 2008;10:1-8.
B-Type Natriuretic Peptide (BNP) Identifies Patients Developing Sepsis-Induced Myocardial Depression
Clinical question: Can plasma BNP be used as a marker to identify patients at risk for sepsis-induced depression of myocardial function?
Background: Previous studies have established BNP levels are increased in patients with septic shock but have not examined the relationship between plasma BNP concentration and left ventricular (LV) systolic dysfunction.
Study design: Prospective cohort.
Setting: Academic medical center.
Synopsis: The authors divided 93 prospectively selected ICU patients with severe sepsis into two groups: one with normal left ventricular (LV) function and a group with LV systolic dysfunction. Comparison of the plasma BNP concentrations between these two groups demonstrated a significant positive correlation between the BNP level and the degree of LV systolic dysfunction, suggesting BNP is a reasonable marker for identification of septic patients with sepsis-induced myocardial depression.
Further, the study’s results suggest BNP measurements early in the course of septic shock might be useful prognostic indicators. However, it is unclear to what extent the knowledge gained from such measurements would alter care management, or how BNP compares to echocardiography in terms of diagnostic and prognostic utility. Thus, these results might not be adequate to justify the routine measurement of BNP in patients with severe sepsis.
Bottom line: Elevated BNP in septic patients is associated with the presence or risk of sepsis-induced myocardial depression, and might be a negative prognostic indicator.
Citation: Post F, Weilemann LS, Messow CM, Sinning C, Munzel T. B-type natriuretic peptide as a marker for sepsis-induced myocardial depression in intensive care patients. Crit Care Med. 2008;36:3030–3037.
High Risk of Death with Thrombolytic Use in Low-Risk Pulmonary Embolism (PE)
Clinical question: Is there an advantage to thrombolytic therapy in the treatment of acute PE versus treatment with unfractionated or low-molecular-weight (LMW) heparin?
Background: Given the high mortality linked to PE, consistent indications for thrombolytic therapy in acute PE are needed. An assessment of the prevalence of thrombolytic therapy and mortality, as compared with standard anticoagulation, has been described inconsistently.
Study design: Retrospective cohort study.
Setting: 186 acute-care hospitals in Pennsylvania.
Synopsis: Using a database of ICD-9 codes, 15,116 patients were reviewed. Logistic regression was used to evaluate the association between thrombolytic therapy and 30-day mortality. Poisson regression was used to evaluate the association between thrombolytic therapy and in-hospital mortality. For those receiving thrombolysis and considered unlikely candidates for the therapy based on documentation at presentation (low predicted probability), the in-hospital mortality and overall 30-day mortality rate were higher when compared with those who did not receive thrombolysis. An exception to this was a group of patients with high predicted probability of receiving thrombolysis. In this group, thrombolysis was not associated with increased risk. Limitations to the study include lack of assessment of right ventricular function, changes in condition after presentation, lack of long-term outcomes, and lack of exact cause of death.
Bottom line: Thrombolytic therapy is associated with higher mortality in patients with hemodynamically uncomplicated PE, and therefore not indicated. Thrombolytic therapy in a subgroup of patients with hemodynamic instability or right ventricular dysfunction improves the clinical course and outcome.
Citation: Ibrahim SA, Stone RA, Obrosky S, Geng M, Fine MJ, Aujesky D. Thrombolytic therapy and mortality in patients with acute pulmonary embolism. Arch Intern Med. 2008;168(20):2183-2190.
Hospitalists Improve Patient Flow in the ED
Clinical question: Can active-bed management by hospitalists reduce ED throughput times and diversionary status?
Background: ED overcrowding leads to ambulance diversion, which has been associated with increased mortality. A primary cause of ED crowding is inpatient boarding, which can reduce patient satisfaction and quality of care. Previous studies targeting the ED have had little impact on throughput and ambulance diversion.
Study design: Pre-post case study in a single institution.
Setting: Academic teaching hospital in Baltimore.
Synopsis: ED throughput times and ambulance diversion hours were measured for all adult patients registered in the department from November 2005 to February 2006 (control period) and November 2006 to February 2007 (intervention period). Active-bed management was defined as appointing a hospitalist to assess bed availability in real time and assigning department of medicine admissions to the appropriate clinical setting, as well as the creation of a bed director. Although the ED census was 8.8% higher during the intervention period, throughput time for admitted patients decreased by 98 minutes per patient, to 458 from 360. The time spent under diversionary status for overcrowding or lack of ICU beds decreased by 6% and 27%, respectively. Limitations of this study include the pre-post design and the implementation at a single institution. Additionally, active-bed management is expensive, and in this case required the hiring of three full-time-equivalent faculty. However, this study successfully demonstrates that a quality improvement partnership between hospitalists and the ED can substantially reduce overcrowding.
Bottom line: Active-bed management by hospitalists improves ED throughput by decreasing the length of time admitted patients spend in the ED and reducing ambulance diversion hours.
Citation: Howell E, Bessman E, Kravet S, Kolodner K, Marshall R, Wright S. Active bed management by hospitalists and emergency department throughput. Ann Int Med. 2008;149(11):804-810.
Eagle-Eye Your Payors
Protection of the Medicare program has reached new heights in recent years. One of the most important ways hospitalist groups can protect their Medicare funding is the discovery and recovery of improper contractor payments of Medicare claims.
The Centers for Medicare and Medicaid Services (CMS) reviews various types of contractors—Medicare administrative contractors (MACs), carriers, durable medical equipment regional carriers (DMERCs), fiscal intermediaries (FIs), and quality improvement organizations (QIOs)—through its protection efforts as part of the Comprehensive Error Rate Testing (CERT) program and Hospital Payment Monitoring Program (HPMP). The CERT program’s contractors review physician (i.e., professional) claims processed by MACs and carriers.
The primary goal of a contractor is to “pay it right”—that is, pay the correct amount to the right provider for covered and correctly coded services.1 During the 12-month reporting period ending Sept. 30, 2007, the CERT program sampled 129,875 claims from carriers, DMERCs, FIs, and MACs.
The CERT contractor randomly and electronically selects about 172 claims each month from each type of claims-processing contractor. Since some of these contractors were transitioning to MACs, the target Part B (i.e., professional) sample size for the May 2008 report was approximately 2,000 reviewable claims per MAC cluster. However, this might have varied if a MAC was not processing claims during the entire sampling period.
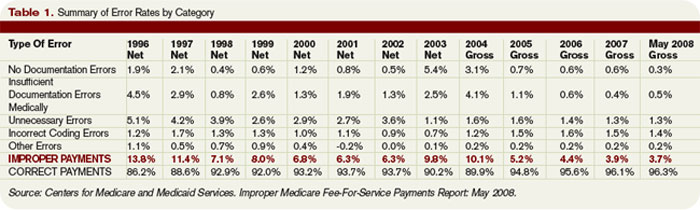
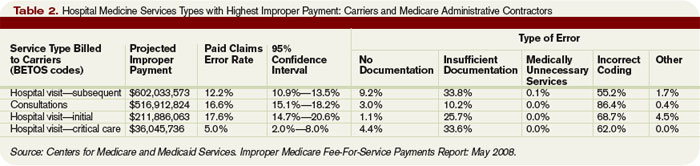
Document Requests
Physicians need to be mindful of CERT requests for documentation. When possible, every attempt is made to benefit the physician. Initial CERT requests are attempted by way of a letter. If the physician does not respond within 30 days, the CERT contractor attempts one to three more contacts with correspondence and phone calls. If documentation is received after 75 days, it is considered “late.” It then will be reviewed, unless the reporting period has expired.
However, this should not be considered a prudent approach, and timely responses are ideal. If the physician offers no response, and documentation is not received, it is counted as a “no documentation” error.
Physicians often worry about accusations of fraud. The purpose of the CERT program is not to assume or accuse physicians of fraud, although it may serve as a deterrent. It does not, and cannot, label a claim fraudulent.
One scenario of potential fraud the CERT program is able to identify occurs when a CERT documentation contractor is unable to locate a provider or supplier when requesting medical record documentation.2
Outcomes
Individual contractors are notified of improper payments. These include overpayments and underpayments. Unfortunately, contractors do not have to resolve CERT issues involving underpayments, although they are encouraged to do so by CMS.
The CERT program identified overpayments totaling $875,005 during the 12-month reporting period, but collected only $650,418 in overpayments after consideration of appeals that overturned a CERT decision or the provider discontinued business operations. (See Table 1, p. 18, for error rates and Table 2, p. 18, for highest rates of improper payment)
To improve billing compliance and prevent repetitive errors, contractors must implement provider education regarding erroneously paid claims. A contractor may determine the best education method to distribute information about Medicare rules and effectively answer coverage and coding questions.
Some contractors have designed Web-based training modules, Web pages with frequently-asked-questions sections, or local coverage analyses to address contractor-specific errors. Detailed CERT contractor information can be found at www.cms.hhs.gov/ mcd/indexes.asp?from2=indexes.asp&
Due to its successful outcomes, future CMS goals include the continuation of the CERT program. MACs will look more closely at service types based on identified error rates.
Apart from CERT requests, prepayment contractor reviews already exist for most of the services included in Table 2 (p. 18). Timely response is crucial to justify and receive appropriate reimbursement. TH
Carol Pohlig is a billing and coding expert with the University of Pennsylvania Medical Center, Philadelphia. She is on the faculty of SHM’s inpatient coding course.
References
1. Centers for Medicare and Medicaid Services. Improper Medicare fee-for-service payments report: May 2008. CMS Web site. Available at: www.cms.hhs.gov/apps/er_report/preview_er_report.asp?from=public&which=long&reportID=9. Accessed Dec. 20, 2008.
2. Beebe M, Dalton J, Espronceda M, Evans D, Glenn R. Current Procedural Terminology Professional Edition. Chicago: American Medical Association; 2008.
Protection of the Medicare program has reached new heights in recent years. One of the most important ways hospitalist groups can protect their Medicare funding is the discovery and recovery of improper contractor payments of Medicare claims.
The Centers for Medicare and Medicaid Services (CMS) reviews various types of contractors—Medicare administrative contractors (MACs), carriers, durable medical equipment regional carriers (DMERCs), fiscal intermediaries (FIs), and quality improvement organizations (QIOs)—through its protection efforts as part of the Comprehensive Error Rate Testing (CERT) program and Hospital Payment Monitoring Program (HPMP). The CERT program’s contractors review physician (i.e., professional) claims processed by MACs and carriers.
The primary goal of a contractor is to “pay it right”—that is, pay the correct amount to the right provider for covered and correctly coded services.1 During the 12-month reporting period ending Sept. 30, 2007, the CERT program sampled 129,875 claims from carriers, DMERCs, FIs, and MACs.
The CERT contractor randomly and electronically selects about 172 claims each month from each type of claims-processing contractor. Since some of these contractors were transitioning to MACs, the target Part B (i.e., professional) sample size for the May 2008 report was approximately 2,000 reviewable claims per MAC cluster. However, this might have varied if a MAC was not processing claims during the entire sampling period.
Document Requests
Physicians need to be mindful of CERT requests for documentation. When possible, every attempt is made to benefit the physician. Initial CERT requests are attempted by way of a letter. If the physician does not respond within 30 days, the CERT contractor attempts one to three more contacts with correspondence and phone calls. If documentation is received after 75 days, it is considered “late.” It then will be reviewed, unless the reporting period has expired.
However, this should not be considered a prudent approach, and timely responses are ideal. If the physician offers no response, and documentation is not received, it is counted as a “no documentation” error.
Physicians often worry about accusations of fraud. The purpose of the CERT program is not to assume or accuse physicians of fraud, although it may serve as a deterrent. It does not, and cannot, label a claim fraudulent.
One scenario of potential fraud the CERT program is able to identify occurs when a CERT documentation contractor is unable to locate a provider or supplier when requesting medical record documentation.2
Outcomes
Individual contractors are notified of improper payments. These include overpayments and underpayments. Unfortunately, contractors do not have to resolve CERT issues involving underpayments, although they are encouraged to do so by CMS.
The CERT program identified overpayments totaling $875,005 during the 12-month reporting period, but collected only $650,418 in overpayments after consideration of appeals that overturned a CERT decision or the provider discontinued business operations. (See Table 1, p. 18, for error rates and Table 2, p. 18, for highest rates of improper payment)
To improve billing compliance and prevent repetitive errors, contractors must implement provider education regarding erroneously paid claims. A contractor may determine the best education method to distribute information about Medicare rules and effectively answer coverage and coding questions.
Some contractors have designed Web-based training modules, Web pages with frequently-asked-questions sections, or local coverage analyses to address contractor-specific errors. Detailed CERT contractor information can be found at www.cms.hhs.gov/ mcd/indexes.asp?from2=indexes.asp&
Due to its successful outcomes, future CMS goals include the continuation of the CERT program. MACs will look more closely at service types based on identified error rates.
Apart from CERT requests, prepayment contractor reviews already exist for most of the services included in Table 2 (p. 18). Timely response is crucial to justify and receive appropriate reimbursement. TH
Carol Pohlig is a billing and coding expert with the University of Pennsylvania Medical Center, Philadelphia. She is on the faculty of SHM’s inpatient coding course.
References
1. Centers for Medicare and Medicaid Services. Improper Medicare fee-for-service payments report: May 2008. CMS Web site. Available at: www.cms.hhs.gov/apps/er_report/preview_er_report.asp?from=public&which=long&reportID=9. Accessed Dec. 20, 2008.
2. Beebe M, Dalton J, Espronceda M, Evans D, Glenn R. Current Procedural Terminology Professional Edition. Chicago: American Medical Association; 2008.
What is the best antibiotic treatment for C.difficile-associated diarrhea?
Case
An 84-year-old woman presents with watery diarrhea. She recently received a fluoroquinolone antibiotic during a hospitalization for pneumonia. Her temperature is 101 degrees, her heart rate is 110 beats per minute, and her respiratory rate is 22 breaths per minute. Her abdominal exam is significant for mild distention, hyperactive bowel sounds, and diffuse, mild tenderness without rebound or guarding. Her white blood cell count is 18,200 cells/mm3. You suspect C. difficile infection. Should you treat empirically with antibiotics and, if so, which antibiotic should you prescribe?
Overview
C. difficile is an anaerobic gram-positive bacillus that produces spores and toxins. In 1978, C. difficile was identified as the causative agent for antibiotic-associated diarrhea.1 The portal of entry is via the fecal-oral route.
Some patients carry C. difficile in their intestinal flora and show no signs of infection. Patients who develop symptoms commonly present with profuse, watery diarrhea. Nausea, vomiting, and abdominal pain also can be seen. Severe cases of C. difficile-associated diarrhea (CDAD) can present with significant abdominal pain and multisystem organ failure, with toxic megacolon resulting from toxin production and ileus.2 In severe cases due to ileus, diarrhea may be absent. Risk of mortality in severe cases is high, with some reviews citing death rates of 57% in patients requiring total colectomy.3 Risk factors for developing CDAD include the prior or current use of antibiotics, advanced age, hospitalization, and prior gastrointestinal surgery or procedures.4
The initial CDAD treatment involves removal of the agent that incited the infection. In most cases, this means discontinuation of an antimicrobial agent. Removal of the inciting agent allows restoration of the normal bowel flora. In mild CDAD cases, this may be sufficient therapy. However, most CDAD cases require treatment. Although many antimicrobial and probiotic agents have been used in CDAD treatment, metronidazole and vancomycin are the most commonly prescribed agents. There is an ongoing debate as to which should be considered the first-line agent.
Review of the Data
Metronidazole and vancomycin have the longest histories of use and are the most studied agents in CDAD. Metronidazole is prescribed 250 mg four times daily (or 500 mg twice daily) for 14 days. It is reasonably tolerated, although it can cause a metallic taste in the mouth. Vancomycin is given 125 mg four times daily (or 500 mg three times daily) for 10 to 14 days. Unlike metronidazole, which can be given by mouth or intravenously, only oral vancomycin is effective in CDAD.
Historically, metronidazole has been prescribed more frequently as the first-line agent in CDAD. Proponents of the drug tout its low cost and the importance of minimizing the development of vancomycin-resistant enteric pathogens. There are two small, prospective, randomized studies comparing the efficacy of the agents against one another in the treatment of C. difficile infection, with similar efficacy demonstrated in both studies. In the early 1980s, Teasley and colleagues randomized 94 patients with C. difficile infection to either metronidazole or vancomycin.5 All the patients receiving vancomycin resolved their disease; 95% of patients receiving metronidazole were cured. The differences were not statistically significant.
In the mid-1990s, Wenisch and colleagues randomized patients with C. difficile infection to receive vancomycin, metronidazole, fusidic acid, or teicoplanin therapy.6 Ninety-four percent of patients in both the vancomycin and metronidazole groups were cured.
However, since 2000, investigators have reported higher failure rates with metronidazole therapy in C. difficile infections. For example, in 2005, Pepin and colleagues reviewed cases of C. difficile infections at a hospital in Quebec.7 They determined the number of patients with C. difficile infection initially treated with metronidazole who required additional therapy had markedly increased. Between 1991 and 2002, 9.6% of patients who initially were treated with metronidazole required a switch to vancomycin (or the addition of vancomycin) because of a disappointing response. This figure doubled to 25.7% in 2003-2004. The 60-day probability of recurrence also increased in the 2003-2004 test group (47.2%), compared with the 1991-2002 group (20.8%). Both results were statistically significant. Such data contributed to the debate regarding whether metronidazole or vancomycin is the superior agent in the treatment of C. difficile infections.
In 2007, Zar and colleagues studied the efficacy of metronidazole and vancomycin in the treatment of CDAD patients, but the study stratified patients according to disease severity.8 This allowed the authors to investigate whether one agent was superior in treating mild or severe CDAD. They determined disease severity by assigning points to individual patient characteristics. Patients with two or more points were deemed to have “severe” CDAD.
The investigators assigned one point for each of the following patient characteristics: temperature >38.3 degrees Celsius, age >60 years, albumin level <2.5 mg/dL, and white blood cell count >15,000 cells/mm3 within 48 hours of enrolling in the study. Any patient with endoscopic evidence of pseudomembrane formation or admission to the intensive-care unit (ICU) for CDAD treatment was considered to have severe disease.

This was a prospective, randomized controlled trial of 150 patients. Patients were randomly prescribed 500 mg metronidazole by mouth three times daily or 125 mg of vancomycin by mouth four times daily. Patients with mild CDAD had similar cure rates: 90% metronidazole versus 98% vancomycin (P=0.36). However, patients with severe CDAD fared statistically better when treated with oral vancomycin. Ninety-seven percent of severe CDAD patients treated with oral vancomycin had a clinical cure, while only 76% of those treated with metronidazole were cured (P=0.02). Recurrence of the disease was similar in each treatment group.
Based on this study, metronidazole and vancomycin appear equally effective in the treatment of mild CDAD, but vancomycin is the superior agent in the treatment of patients with severe CDAD.
Back to the Case
Our patient had several risk factors predisposing her to developing CDAD. She was of advanced age and took a fluoroquinolone antibiotic during a recent hospitalization. She also presented with signs consistent with a severe case of CDAD. She had a fever, a white blood cell count >15,000 cells/mm3, and was older than 60. Thus, she should be treated with supportive care, placed on contact precautions, and administered oral vancomycin 125 mg by mouth every six hours for 10 days as empiric therapy for CDAD. Stool cultures should be sent to confirm the presence of the C. difficile toxin.
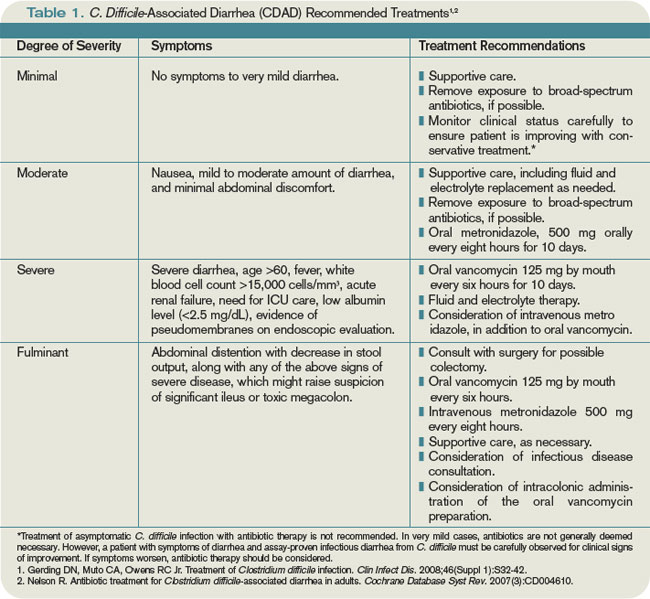
Bottom Line
The appropriate antibiotic choice to treat CDAD in any patient depends upon the clinical severity of the disease. Treat patients with mild CDAD with metronidazole; prescribe oral vancomycin for patients with severe CDAD. TH
Dr. Mattison, instructor of medicine at Harvard Medical School, is a hospitalist and co-director of the Inpatient Geriatrics Unit at Beth Israel Deaconess Medical Center (BIDMC) in Boston. Dr. Li, assistant professor of medicine at Harvard Medical School, is director of hospital medicine and associate chief of BIDMC’s Division of General Medicine and Primary Care.
References
1.Bartlett JG, Moon N, Chang TW, Taylor N, Onderdonk AB. Role of C. difficile in antibiotic-associated pseudomembranous colitis. Gastroenterology. 1978;75(5):778-782.
2.Poutanen SM, Simor AE. C. difficile-associated diarrhea in adults. CMAJ. 2004;171(1):51-58.
3.Dallal RM, Harbrecht BG, Boujoukas AJ, et al. Fulminant C. difficile: an underappreciated and increasing cause of death and complications. Ann Surg. 2002;235(3):363-372.
4.Bartlett JG. Narrative review: the new epidemic of C. difficile-associated enteric disease. Ann Intern Med. 2006;145(10):758-764.
5.Teasley DG, Gerding DN, Olson MM, et al. Prospective randomized trial of metronidazole versus vancomycin for C. difficile-associated diarrhea and colitis. Lancet. 1983;2:1043-1046.
6.Wenisch C, Parschalk B, Hasenhündl M, Hirschl AM, Graninger W. Comparison of vancomycin, teicoplanin, metronidazole, and fusidic acid for the treatment of C. difficile-associated diarrhea. Clin Infect Dis. 1996;22:813-818.
7.Pepin J, Alary M, Valiquette L, et al. Increasing risk of relapse after treatment of C. difficile colitis in Quebec, Canada. Clin Infect Dis. 2005;40:1591-1597.
8.Zar FA, Bakkanagari SR, Moorthi KM, Davis MB. A comparison of vancomycin and metronidazole for the treatment of C. difficile-associated diarrhea, stratified by disease severity. Clin Infect Dis. 2007;45(3):302-307.
Case
An 84-year-old woman presents with watery diarrhea. She recently received a fluoroquinolone antibiotic during a hospitalization for pneumonia. Her temperature is 101 degrees, her heart rate is 110 beats per minute, and her respiratory rate is 22 breaths per minute. Her abdominal exam is significant for mild distention, hyperactive bowel sounds, and diffuse, mild tenderness without rebound or guarding. Her white blood cell count is 18,200 cells/mm3. You suspect C. difficile infection. Should you treat empirically with antibiotics and, if so, which antibiotic should you prescribe?
Overview
C. difficile is an anaerobic gram-positive bacillus that produces spores and toxins. In 1978, C. difficile was identified as the causative agent for antibiotic-associated diarrhea.1 The portal of entry is via the fecal-oral route.
Some patients carry C. difficile in their intestinal flora and show no signs of infection. Patients who develop symptoms commonly present with profuse, watery diarrhea. Nausea, vomiting, and abdominal pain also can be seen. Severe cases of C. difficile-associated diarrhea (CDAD) can present with significant abdominal pain and multisystem organ failure, with toxic megacolon resulting from toxin production and ileus.2 In severe cases due to ileus, diarrhea may be absent. Risk of mortality in severe cases is high, with some reviews citing death rates of 57% in patients requiring total colectomy.3 Risk factors for developing CDAD include the prior or current use of antibiotics, advanced age, hospitalization, and prior gastrointestinal surgery or procedures.4
The initial CDAD treatment involves removal of the agent that incited the infection. In most cases, this means discontinuation of an antimicrobial agent. Removal of the inciting agent allows restoration of the normal bowel flora. In mild CDAD cases, this may be sufficient therapy. However, most CDAD cases require treatment. Although many antimicrobial and probiotic agents have been used in CDAD treatment, metronidazole and vancomycin are the most commonly prescribed agents. There is an ongoing debate as to which should be considered the first-line agent.
Review of the Data
Metronidazole and vancomycin have the longest histories of use and are the most studied agents in CDAD. Metronidazole is prescribed 250 mg four times daily (or 500 mg twice daily) for 14 days. It is reasonably tolerated, although it can cause a metallic taste in the mouth. Vancomycin is given 125 mg four times daily (or 500 mg three times daily) for 10 to 14 days. Unlike metronidazole, which can be given by mouth or intravenously, only oral vancomycin is effective in CDAD.
Historically, metronidazole has been prescribed more frequently as the first-line agent in CDAD. Proponents of the drug tout its low cost and the importance of minimizing the development of vancomycin-resistant enteric pathogens. There are two small, prospective, randomized studies comparing the efficacy of the agents against one another in the treatment of C. difficile infection, with similar efficacy demonstrated in both studies. In the early 1980s, Teasley and colleagues randomized 94 patients with C. difficile infection to either metronidazole or vancomycin.5 All the patients receiving vancomycin resolved their disease; 95% of patients receiving metronidazole were cured. The differences were not statistically significant.
In the mid-1990s, Wenisch and colleagues randomized patients with C. difficile infection to receive vancomycin, metronidazole, fusidic acid, or teicoplanin therapy.6 Ninety-four percent of patients in both the vancomycin and metronidazole groups were cured.
However, since 2000, investigators have reported higher failure rates with metronidazole therapy in C. difficile infections. For example, in 2005, Pepin and colleagues reviewed cases of C. difficile infections at a hospital in Quebec.7 They determined the number of patients with C. difficile infection initially treated with metronidazole who required additional therapy had markedly increased. Between 1991 and 2002, 9.6% of patients who initially were treated with metronidazole required a switch to vancomycin (or the addition of vancomycin) because of a disappointing response. This figure doubled to 25.7% in 2003-2004. The 60-day probability of recurrence also increased in the 2003-2004 test group (47.2%), compared with the 1991-2002 group (20.8%). Both results were statistically significant. Such data contributed to the debate regarding whether metronidazole or vancomycin is the superior agent in the treatment of C. difficile infections.
In 2007, Zar and colleagues studied the efficacy of metronidazole and vancomycin in the treatment of CDAD patients, but the study stratified patients according to disease severity.8 This allowed the authors to investigate whether one agent was superior in treating mild or severe CDAD. They determined disease severity by assigning points to individual patient characteristics. Patients with two or more points were deemed to have “severe” CDAD.
The investigators assigned one point for each of the following patient characteristics: temperature >38.3 degrees Celsius, age >60 years, albumin level <2.5 mg/dL, and white blood cell count >15,000 cells/mm3 within 48 hours of enrolling in the study. Any patient with endoscopic evidence of pseudomembrane formation or admission to the intensive-care unit (ICU) for CDAD treatment was considered to have severe disease.
This was a prospective, randomized controlled trial of 150 patients. Patients were randomly prescribed 500 mg metronidazole by mouth three times daily or 125 mg of vancomycin by mouth four times daily. Patients with mild CDAD had similar cure rates: 90% metronidazole versus 98% vancomycin (P=0.36). However, patients with severe CDAD fared statistically better when treated with oral vancomycin. Ninety-seven percent of severe CDAD patients treated with oral vancomycin had a clinical cure, while only 76% of those treated with metronidazole were cured (P=0.02). Recurrence of the disease was similar in each treatment group.
Based on this study, metronidazole and vancomycin appear equally effective in the treatment of mild CDAD, but vancomycin is the superior agent in the treatment of patients with severe CDAD.
Back to the Case
Our patient had several risk factors predisposing her to developing CDAD. She was of advanced age and took a fluoroquinolone antibiotic during a recent hospitalization. She also presented with signs consistent with a severe case of CDAD. She had a fever, a white blood cell count >15,000 cells/mm3, and was older than 60. Thus, she should be treated with supportive care, placed on contact precautions, and administered oral vancomycin 125 mg by mouth every six hours for 10 days as empiric therapy for CDAD. Stool cultures should be sent to confirm the presence of the C. difficile toxin.
Bottom Line
The appropriate antibiotic choice to treat CDAD in any patient depends upon the clinical severity of the disease. Treat patients with mild CDAD with metronidazole; prescribe oral vancomycin for patients with severe CDAD. TH
Dr. Mattison, instructor of medicine at Harvard Medical School, is a hospitalist and co-director of the Inpatient Geriatrics Unit at Beth Israel Deaconess Medical Center (BIDMC) in Boston. Dr. Li, assistant professor of medicine at Harvard Medical School, is director of hospital medicine and associate chief of BIDMC’s Division of General Medicine and Primary Care.
References
1.Bartlett JG, Moon N, Chang TW, Taylor N, Onderdonk AB. Role of C. difficile in antibiotic-associated pseudomembranous colitis. Gastroenterology. 1978;75(5):778-782.
2.Poutanen SM, Simor AE. C. difficile-associated diarrhea in adults. CMAJ. 2004;171(1):51-58.
3.Dallal RM, Harbrecht BG, Boujoukas AJ, et al. Fulminant C. difficile: an underappreciated and increasing cause of death and complications. Ann Surg. 2002;235(3):363-372.
4.Bartlett JG. Narrative review: the new epidemic of C. difficile-associated enteric disease. Ann Intern Med. 2006;145(10):758-764.
5.Teasley DG, Gerding DN, Olson MM, et al. Prospective randomized trial of metronidazole versus vancomycin for C. difficile-associated diarrhea and colitis. Lancet. 1983;2:1043-1046.
6.Wenisch C, Parschalk B, Hasenhündl M, Hirschl AM, Graninger W. Comparison of vancomycin, teicoplanin, metronidazole, and fusidic acid for the treatment of C. difficile-associated diarrhea. Clin Infect Dis. 1996;22:813-818.
7.Pepin J, Alary M, Valiquette L, et al. Increasing risk of relapse after treatment of C. difficile colitis in Quebec, Canada. Clin Infect Dis. 2005;40:1591-1597.
8.Zar FA, Bakkanagari SR, Moorthi KM, Davis MB. A comparison of vancomycin and metronidazole for the treatment of C. difficile-associated diarrhea, stratified by disease severity. Clin Infect Dis. 2007;45(3):302-307.
Bonus-Pay Bonanza

Although there is a lot of debate about the effectiveness of pay-for-performance (P4P) plans, I think the plans are only going to increase in the foreseeable future.
We need more research to tell us the relative impact of public reporting of performance data and P4P programs. Most importantly, the details of how these plans are set up, how and what they measure, and the dollar amount involved will have everything to do with whether they are successful in improving the value of care we provide.
SHM’S Practice Management Committee conducted a mini-survey of hospitalist group leaders in 2006. Here are some of the key findings.
P4P Prevalence
Forty-one percent (60 out of 146) of hospital medicine group (HMG) leaders reported their groups have a quality-incentive program. Of those HMG leaders more likely to report participation in a quality-incentive program:
- 60% were at hospitals participating in a P4P program;
- 50% were at multispecialty/PCP medical groups; and
- 50% were in the Southern region.
Of those HMG leaders less likely to report participation in P4P programs, 28% were at academic programs and 31% were at local hospitalist-only groups.
Group vs. Individual Incentives
Of the HMG leaders participating in a quality-incentive program:
- 43% reported it was an individual incentive;
- 35% reported it was a group incentive;
- 10% reported the plan had elements of both individual and group incentives; and
- 12% were not sure if their plans had individual or group incentives.
Basis of Quality Targets
Of the HMG leaders reporting that they participate in a quality-incentive program (respondents could indicate one or more answers):
- 60% of the programs have targets based on national benchmarks;
- 23% have targets based on local or regional benchmarks;
- 37% have targets based on their hospital’s previous experience; and
- 47% have targets based on improvement over a baseline.
Maximum Impact of Incentives
Of the HMG leaders reporting that they participate in a quality-incentive program:
- 16% report the maximum impact is less than 3%;
- 24% report the maximum impact is from 3% to 7%;
- 35% report the maximum impact is from 8% to 10%;
- 17% report the maximum impact is from 11% to 20%;
- 3% report the maximum impact is more than 20%; and
- 5% report they do not know the maximum impact.
Group vs. Individual Incentives
Of the HMG leaders reporting that they participate in a quality-incentive program:
- 61% said they have received an incentive payment;
- 37% have not received an incentive payment; and
- 2% were unsure if they have received an incentive payment.
Quality Metrics
The most common metrics used in P4P programs, based on 29 responses to the SHM survey:
- 93% of HM programs have metrics based on The Joint Commission’s (JCAHO) heart failure measures;
- 86% have metrics based on JCAHO pneumonia measures;
- 79% have metrics based on JCAHO myocardial infarction measures;
- 28% have metrics based on a measure of medication reconciliation;
- 24% have metrics based on avoidance of unapproved abbreviations;
- 24% have metrics based on 100,000 Lives Campaign measures;
- 21% have metrics based on patient satisfaction measures;
- 17% have metrics based on transitions-of-care measures;
- 10% have metrics based on throughput measures;
- 7% have metrics based on end-of-life measures;
- 7% have metrics based on “good citizenship” measures;
- 7% have metrics based on mortality rate measures; and
- 7% have metrics based on readmission rate measures.
The most common metrics used in quality-incentive programs, based on 45 responses to SHM’s survey:
- 73% of programs use JCAHO heart failure measures;
- 73% use “good citizenship” measures;
- 73% use patient satisfaction measures;
- 67% use JCAHO pneumonia measures;
- 51% use transitions-of-care measures;
- 44% use JCAHO M.I. measures;
- 31% use throughput measures;
- 27% use avoidance of unapproved abbreviations;
- 24% use a measure based on medication reconciliation;
- 11% use 100,000 Lives Campaign measures;
- 9% use readmission rate measures;
- 7% use mortality rate measures; and
- 2% use end-of-life measures.
Recommendations
The prevalence of hospitalist quality-based compensation plans is continuing to grow rapidly, but the details of the plans’ structure will govern whether they benefit our patients, improve the overall value of the care we provide, and serve as a meaningful component of our compensation. I suggest each practice consider implementing plans with the following attributes:
A total dollar amount available for performance that is enough to influence hospitalist behavior. I think quality incentives should compose as much as 15% to 20% of a hospitalist’s annual income. Plans connecting quality performance to equal to or less than 7% of annual compensation (the case for 40% of groups in the above survey) rarely are effective.
Money vs. metrics. It usually is better to establish a plan based on a sliding scale of improved performance rather than a single threshold. For example, if all of the bonus money is available for a 10% improvement in performance, consider providing 10% of the total available money for each 1% improvement in performance.
Degree of difficulty. Performance thresholds should be set so that hospitalists need to change their practices to achieve them, but not so far out of reach that hospitalists give up on them. This can get tricky. Many practices set thresholds that are very easy to reach (e.g., they may be near the current level of performance).
Metrics for which trusted data is readily available. In most cases, this means using data already being collected. Avoid hard-to-track metrics, as they are likely to lead to disagreements about their accuracy.
Group vs. individual measures. Most performance metrics can’t be clearly attributed to one hospitalist as compared to another. For example, who gets the credit or blame for Ms. Smith getting or not getting a pneumovax? The majority of performance metrics are best measured and paid on a group basis. Some metrics, such as documenting medicine reconciliation on admission and discharge, can be effectively attributed to a single hospitalist and could be paid on an individual basis.
Small number of metrics, A meaningfully large amount of money should be connected to each one. Don’t make the mistake of having a $10,000 per doctor annual quality bonus pool divided among 20 metrics (each metric would pay a maximum of $500 per year).
Rotating metrics. Consider an annual meeting with members of your hospital’s administration to jointly establish the metrics used in the hospitalist quality incentive for that year. It is reasonable to change the metrics periodically.
It seems to me P4P programs are in their infancy, and will continue to evolve rapidly. Plans that fail to improve outcomes enough to justify the complexity of implementing, tracking, and paying for them will disappear slowly. (I wonder if payment for pneumovax administration during the hospital stay will be in this category.) And new, more effective, and more valuable programs will be developed.
Hospitalist practices will need to be nimble to keep pace with all of this change. Although SHM can alert you to how new P4P initiatives might affect your practice, and even recommend methods to improve your performance, you and your hospitalist colleagues still will have a lot of work to operationalize these programs in your practice. TH
Dr. Nelson has been a practicing hospitalist since 1988 and is co-founder and past president of SHM. He is a principal in Nelson/Flores Associates, a national hospitalist practice management consulting firm. He is part of the faculty for SHM’s “Best Practices in Managing a Hospital Medicine Program” course. This column represents his views and is not intended to reflect an official position of SHM.
What is the proper duration of antibiotic treatment in adults hospitalized with community-acquired pneumonia?
Case
An 83-year-old male with hypertension, coronary artery disease, and obstructive sleep apnea presents with progressive shortness of breath, a productive cough, wheezing, and tachypnea. His blood pressure is 158/70 mm/Hg; temperature is 101.8; respirations are 26 breaths per minute; and oxygen saturation is 87% on room air. He has coarse breath sounds bilaterally, and decreased breath sounds over the right lower lung fields. His chest X-ray reveals a right lower lobe infiltrate. He is admitted to the hospital with a diagnosis of community-acquired pneumonia (CAP), and medical therapy is started. How should his antibiotic treatment be managed?
Overview
Community-acquired pneumonia is the most common infection-related cause of death in the U.S., and the eighth-leading cause of mortality overall.1 According to a 2006 survey, CAP results in more than 1.2 million hospital admissions annually, with an average length of stay of 5.1 days.2 Though less than 20% of CAP patients require hospitalization, cases necessitating admission contribute to more than 90% of the overall cost of pneumonia care.3
During the past several years, the availability of new antibiotics and the evolution of microbial resistance patterns have changed CAP treatment strategies. Furthermore, the development of prognostic scoring systems and increasing pressure to streamline resource utilization while improving quality of care have led to new treatment considerations, such as managing low-risk cases as outpatients.
More recently, attention has been directed to the optimal duration of antibiotic treatment, with a focus on shortening the duration of therapy. Historically, CAP treatment duration has been variable and not evidence-based. Shortening the course of antibiotics might limit antibiotic resistance, decrease costs, and improve patient adherence and tolerability.4 However, before defining the appropriate antibiotic duration for a patient hospitalized with CAP, other factors must be considered, such as the choice of empiric antibiotics, the patient’s initial response to treatment, severity of the disease, and presence of co-morbidities.
Review of the Data
Antibiotic choice. The most widely referenced practice guidelines for the management of CAP patients were published in 2007 by representatives of the Infectious Diseases Society of America (IDSA) and the American Thoracic Society (ATS).5 Table 1 (above, right) summarizes the recommendations for empiric antibiotics for patients requiring inpatient treatment.
Time to clinical stability. A patient’s clinical response to empiric antibiotic therapy contributes heavily to the decision regarding treatment course and duration. The IDSA/ATS guidelines recommend patients be afebrile for 48 to 72 hours and have no more than one CAP-associated sign of clinical instability before discontinuation of therapy. Although studies have used different definitions of clinical stability, the consensus guidelines refer to six parameters, which are summarized in Table 2 (right).
With appropriate antibiotic therapy, most patients hospitalized with CAP achieve clinical stability in approximately three days.6,7 Providers should expect to see some improvement in vital signs within 48 to 72 hours of admission. Should a patient fail to demonstrate objective improvement during that time, providers should look for unusual pathogens, resistant organisms, nosocomial superinfections, or noninfectious conditions.5 Certain patients, such as those with multilobar pneumonia, associated pleural effusion, or higher pneumonia-severity index scores, also take longer to reach clinical stability.8
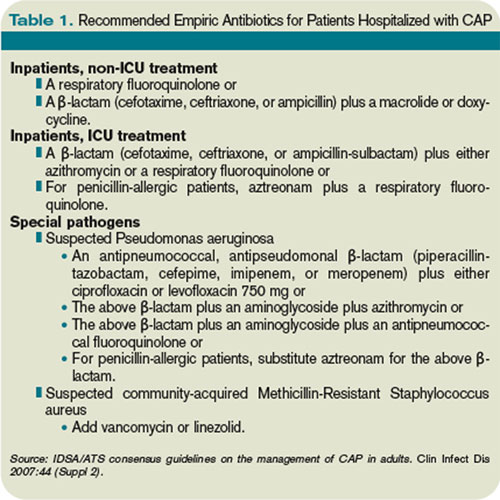
Switch to oral therapy. The ability to achieve clinical stability has important implications for hospital length of stay. Most patients hospitalized with CAP initially are treated with intravenous (IV) antibiotics and require transition to oral therapy in anticipation of discharge. Several studies have found there is no advantage to continuing IV medication once a patient is deemed clinically stable and is able to tolerate oral medication.9,10 There are no specific guidelines regarding choice of oral antibiotics, but it is common practice, supported by the IDSA/ATS recommendations, to use the same agent as the IV antibiotic or a medication in the same drug class. For patients started on β-lactam and macrolide combination therapy, it usually is appropriate to switch to a macrolide alone.5 In cases in which a pathogen has been identified, antibiotic selection should be based on the susceptibility profile.
Once patients are switched to oral antibiotics, it is not necessary for them to remain in the hospital for further observation, provided they have no other active medical problems or social needs. A retrospective analysis of 39,232 patients hospitalized with CAP compared those who were observed overnight after switching to oral antibiotics with those who were not and found no difference in 14-day readmission rate or 30-day mortality rate.11 These findings, in conjunction with the strategy of an early switch to oral therapy, suggest hospital length of stay may be safely reduced for many patients with uncomplicated CAP.
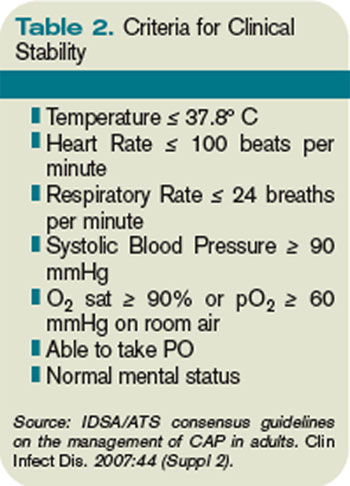
Duration of therapy. After a patient becomes clinically stable and a decision is made to switch to oral medication and a plan for hospital discharge, the question becomes how long to continue the course of antibiotics. Historically, clinical practice has extended treatment for up to two weeks, despite lack of evidence for this duration of therapy. The IDSA/ATS guidelines offer some general recommendations, noting patients should be treated for a minimum of five days, in addition to being afebrile for 48 to 72 hours and meet other criteria for clinical stability.5
Li and colleagues conducted a systematic review evaluating 15 randomized controlled trials comparing short-course (less than seven days) with extended (more than seven days) monotherapy for CAP in adults.4 Overall, the authors found no difference in the risk of treatment failure between short-course and extended-course antibiotic therapy, and they found no difference in bacteriologic eradication or mortality. It is important to note the studies included in this analysis enrolled patients with mild to moderate CAP, including those treated as outpatients, which limits the ability to extrapolate to exclusively inpatient populations and more severely ill patients.
Another meta-analysis, published shortly thereafter, examined randomized controlled trials in outpatients and inpatients not requiring intensive care. It compared different durations of treatment with the same agent in the same dosage. The authors similarly found no difference in effectiveness or safety of short (less than seven days) versus longer (at least two additional days of therapy) courses.12 Table 3 (above) reviews selected trials of short courses of antibiotics, which have been studied in inpatient populations.
The trials summarized in these meta-analyses examined monotherapy with levofloxacin for five days; gemifloxacin for seven days, azithromycin for three to five days; ceftriaxone for five days; cefuroxime for seven days; amoxicillin for three days; or telithromycin for five to seven days. The variety of antibiotics in these studies contrasts the IDSA/ATS guidelines, which recommend only fluoroquinolones as monotherapy for inpatient CAP.
One important randomized, double-blind study of fluoroquinolones compared a five-day course of levofloxacin 750 mg daily, with a 10-day course of levofloxacin, 500 mg daily, in 528 patients with mild to severe CAP.13 The authors found no difference in clinical success or microbiologic eradication between the two groups, concluding high-dose levofloxacin for five days is an effective and well-tolerated alternative to a longer course of a lower dose, likely related to the drug’s concentration-dependent properties.

Azithromycin also offers potential for short courses of therapy, as pulmonary concentrations of azithromycin remain elevated for as many as five days following a single oral dose.14 Several small studies have demonstrated the safety, efficacy, and cost-effectiveness of three to five days of azithromycin, as summarized in a meta-analysis by Contopoulos-Ioannidis and colleagues.15 Most of these trials, however, were limited to outpatients or inpatients with mild disease or confirmed atypical pneumonia. One randomized trial of 40 inpatients with mild to moderately severe CAP found comparable clinical outcomes with a three-day course of oral azithromycin 500 mg daily versus clarithromycin for at least eight days.16 Larger studies in more severely ill patients must be completed before routinely recommending this approach in hospitalized patients. Furthermore, due to the rising prevalence of macrolide resistance, empiric therapy with a macrolide alone can only be used for the treatment of carefully selected hospitalized patients with nonsevere diseases and without risk factors for drug-resistant Streptococcus pneumoniae.5
Telithromycin is a ketolide antibiotic, which has been studied in mild to moderate CAP, including multidrug-resistant strains of S. pneumoniae, in courses of five to seven days.17 However, severe adverse reactions, including hepatotoxicity, have been reported. At the time of the 2007 guidelines, the IDSA/ATS committee waited for additional safety data before making any recommendations on its use.
One additional study of note was a trial of amoxicillin in adult inpatients with mild to moderately severe CAP.18 One hundred twenty-one patients who clinically improved (based on a composite score of pulmonary symptoms and general improvement) following three days of IV amoxicillin were randomized to oral amoxicillin for an additional five days or given a placebo. At days 10 and 28, there was no difference in clinical success between the two groups. The authors concluded that a total of three days of treatment was not inferior to eight days in patients who substantially improved after the first 72 hours of empiric treatment. This trial was conducted in the Netherlands, where amoxicillin is the preferred empiric antibiotic for CAP and patterns of antimicrobial resistance differ greatly from those found in the U.S.
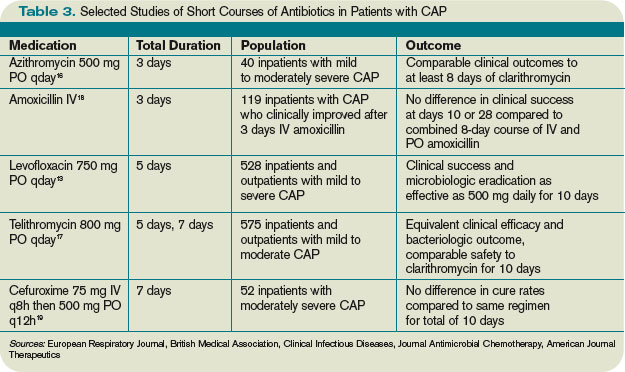
Other considerations. While some evidence supports shorter courses of antibiotics, many of the existing studies are limited by their inclusion of outpatients, adults with mild to moderate CAP, or small sample size. Hence, clinical judgment continues to play an important role in determining the appropriate duration of therapy. Factors such as pre-existing co-morbidities, severity of illness, and occurrence of complications should be considered. Data is limited on the appropriate duration of antibiotics in CAP patients requiring intensive care. It also is important to note the IDSA/ATS recommendations and most of the studies reviewed exclude patients with human immunodeficiency virus (HIV), and it is unknown whether these shorter courses of antibiotics are appropriate in the HIV population.
Lastly, the IDSA/ATS guidelines note longer durations of treatment may be required if the initial therapy was not active against the identified pathogen, or in cases complicated by extrapulmonary infections, such as endocarditis or meningitis.
Back to the Case
Our patient with moderately severe CAP was hospitalized based on his age and hypoxia. He was immediately treated with supplemental oxygen by nasal cannula, IV fluids, and a dose of IV levofloxacin 750 mg. Within 48 hours he met criteria for clinical stability, including defervescence, a decline in his respiratory rate to 19 breaths per minute, and improvement in oxygen saturation to 95% on room air. At this point, he was changed from IV to oral antibiotics. He continued on levofloxacin 750 mg daily and later that day was discharged home in good condition to complete a five-day course.
Bottom Line
For hospitalized adults with mild to moderately severe CAP, five to seven days of treatment, depending on the antibiotic selected, appears to be effective in most cases. Patients should be afebrile for 48 to 72 hours and demonstrate signs of clinical stability before therapy is discontinued. TH
Kelly Cunningham, MD, and Shelley Ellis, MD, MPH, are members of the Section of Hospital Medicine at Vanderbilt University in Nashville, Tenn. Sunil Kripalani, MD, MSc, serves as the section chief.
References
1. Kung HC, Hoyert DL, Xu J, Murphy SL. Deaths: final data for 2005. Natl Vital Stat Rep. 2008;56.
2. DeFrances CJ, Lucas CA, Buie VC, Golosinskiy A. 2006 National Hospital Discharge Survey. Natl Health Stat Report. 2008;5.
3. Niederman MS. Recent advances in community-acquired pneumonia: inpatient and outpatient. Chest. 2007;131:1205-1215.
4. Li JZ, Winston LG, Moore DH, Bent S. Efficacy of short-course antibiotic regimens for community-acquired pneumonia: a meta-analysis. Am J Med. 2007;120:783-790.
5. Mandell LA, Wunderink RG, Anzueto A et al. Infectious Diseases Society of America/American Thoracic Society consensus guidelines on the management of community-acquired pneumonia in adults. Clin Infect Dis. 2007;44(Suppl 2):S27-72.
6. Ramirez JA, Bordon J. Early switch from intravenous to oral antibiotics in hospitalized patients with bacteremic community-acquired Streptococcus pneumoniae pneumonia. Arch Intern Med. 2001;161:848-850.
7. Halm EA, Fine MJ, Marrie TJ et al. Time to clinical stability in patients hospitalized with community-acquired pneumonia: implications for practice guidelines. JAMA. 1998;279:1452-1457.
8. Menendez R, Torres A, Rodriguez de Castro F et al. Reaching stability in community-acquired pneumonia: the effects of the severity of disease, treatment, and the characteristics of patients. Clin Infect Dis. 2004;39:1783-1790.
9. Siegal RE, Halpern NA, Almenoff PL et al. A prospective randomised study of inpatient IV antibiotics for community-acquired pneumonia: the optimal duration of therapy. Chest. 1996;110:965-971.
10. Oosterheert JJ, Bonten MJ, Schneider MM et al. Effectiveness of early switch from intravenous to oral antibiotics in severe community acquired pneumonia: multicentre randomized trial. BMJ. 2006;333:1193-1197.
11. Nathan RV, Rhew DC, Murray C et al. In-hospital observation after antibiotic switch in pneumonia: a national evaluation. Am J Med. 2006;119:512-518.
12. Dimopoulos G, Matthaiou DK, Karageorgopoulos DE, et al. Short- versus long-course antibacterial therapy for community-acquired pneumonia: a meta-analysis. Drugs. 2008;68:1841-1854.
13. Dunbar LM, Wunderink RG, Habib MP et al. High-dose, short-course levofloxacin for community-acquired pneumonia: a new treatment paradigm. Clin Infect Dis. 2003;37:752-760.
14. Morris DL, De Souza A, Jones JA, Morgan WE. High and prolonged pulmonary tissue concentrations of azithromycin following a single oral dose. Eur J Clin Microbiol Infect Dis. 1991;10:859-861.
15. Contopoulos-Ioannidis DG, Ioannidis JPA, Chew P, Lau J. Meta-analysis of randomized controlled trials on the comparative efficacy and safety of azithromycin against other antibiotics for lower respiratory tract infections. J Antimicrob Chemother. 2001;48:691-703.
16. Rizzato G, Montemurro L, Fraioli P et al. Efficacy of a three-day course of azithromycin in moderately severe community-acquired pneumonia. Eur Respir J. 1995;8:398-402.
17. Tellier G, Niederman MS, Nusrat R et al. Clinical and bacteriological efficacy and safety of 5- and 7-day regimens of telithromycin once daily compared with a 10-day regimen of clarithromycin twice daily in patients with mild to moderate community-acquired pneumonia. J Antimicrob Chemother. 2004;54:515.
18. El Moussaoui R, de Borgie CA, van den Broek P et al. Effectiveness of discontinuing antibiotic treatment after three days versus eight days in mild to moderate-severe community acquired pneumonia: randomised, double blind study. BMJ. 2006;332:1355-1361.
19. Siegel RE, Alicea M, Lee A, Blaiklock R. Comparison of 7 versus 10 days of antibiotic therapy for hospitalized patients with uncomplicated community-acquired pneumonia: a prospective, randomized double-blind study. Am J Ther. 1999;6:217-222.
Case
An 83-year-old male with hypertension, coronary artery disease, and obstructive sleep apnea presents with progressive shortness of breath, a productive cough, wheezing, and tachypnea. His blood pressure is 158/70 mm/Hg; temperature is 101.8; respirations are 26 breaths per minute; and oxygen saturation is 87% on room air. He has coarse breath sounds bilaterally, and decreased breath sounds over the right lower lung fields. His chest X-ray reveals a right lower lobe infiltrate. He is admitted to the hospital with a diagnosis of community-acquired pneumonia (CAP), and medical therapy is started. How should his antibiotic treatment be managed?
Overview
Community-acquired pneumonia is the most common infection-related cause of death in the U.S., and the eighth-leading cause of mortality overall.1 According to a 2006 survey, CAP results in more than 1.2 million hospital admissions annually, with an average length of stay of 5.1 days.2 Though less than 20% of CAP patients require hospitalization, cases necessitating admission contribute to more than 90% of the overall cost of pneumonia care.3
During the past several years, the availability of new antibiotics and the evolution of microbial resistance patterns have changed CAP treatment strategies. Furthermore, the development of prognostic scoring systems and increasing pressure to streamline resource utilization while improving quality of care have led to new treatment considerations, such as managing low-risk cases as outpatients.
More recently, attention has been directed to the optimal duration of antibiotic treatment, with a focus on shortening the duration of therapy. Historically, CAP treatment duration has been variable and not evidence-based. Shortening the course of antibiotics might limit antibiotic resistance, decrease costs, and improve patient adherence and tolerability.4 However, before defining the appropriate antibiotic duration for a patient hospitalized with CAP, other factors must be considered, such as the choice of empiric antibiotics, the patient’s initial response to treatment, severity of the disease, and presence of co-morbidities.
Review of the Data
Antibiotic choice. The most widely referenced practice guidelines for the management of CAP patients were published in 2007 by representatives of the Infectious Diseases Society of America (IDSA) and the American Thoracic Society (ATS).5 Table 1 (above, right) summarizes the recommendations for empiric antibiotics for patients requiring inpatient treatment.
Time to clinical stability. A patient’s clinical response to empiric antibiotic therapy contributes heavily to the decision regarding treatment course and duration. The IDSA/ATS guidelines recommend patients be afebrile for 48 to 72 hours and have no more than one CAP-associated sign of clinical instability before discontinuation of therapy. Although studies have used different definitions of clinical stability, the consensus guidelines refer to six parameters, which are summarized in Table 2 (right).
With appropriate antibiotic therapy, most patients hospitalized with CAP achieve clinical stability in approximately three days.6,7 Providers should expect to see some improvement in vital signs within 48 to 72 hours of admission. Should a patient fail to demonstrate objective improvement during that time, providers should look for unusual pathogens, resistant organisms, nosocomial superinfections, or noninfectious conditions.5 Certain patients, such as those with multilobar pneumonia, associated pleural effusion, or higher pneumonia-severity index scores, also take longer to reach clinical stability.8
Switch to oral therapy. The ability to achieve clinical stability has important implications for hospital length of stay. Most patients hospitalized with CAP initially are treated with intravenous (IV) antibiotics and require transition to oral therapy in anticipation of discharge. Several studies have found there is no advantage to continuing IV medication once a patient is deemed clinically stable and is able to tolerate oral medication.9,10 There are no specific guidelines regarding choice of oral antibiotics, but it is common practice, supported by the IDSA/ATS recommendations, to use the same agent as the IV antibiotic or a medication in the same drug class. For patients started on β-lactam and macrolide combination therapy, it usually is appropriate to switch to a macrolide alone.5 In cases in which a pathogen has been identified, antibiotic selection should be based on the susceptibility profile.
Once patients are switched to oral antibiotics, it is not necessary for them to remain in the hospital for further observation, provided they have no other active medical problems or social needs. A retrospective analysis of 39,232 patients hospitalized with CAP compared those who were observed overnight after switching to oral antibiotics with those who were not and found no difference in 14-day readmission rate or 30-day mortality rate.11 These findings, in conjunction with the strategy of an early switch to oral therapy, suggest hospital length of stay may be safely reduced for many patients with uncomplicated CAP.
Duration of therapy. After a patient becomes clinically stable and a decision is made to switch to oral medication and a plan for hospital discharge, the question becomes how long to continue the course of antibiotics. Historically, clinical practice has extended treatment for up to two weeks, despite lack of evidence for this duration of therapy. The IDSA/ATS guidelines offer some general recommendations, noting patients should be treated for a minimum of five days, in addition to being afebrile for 48 to 72 hours and meet other criteria for clinical stability.5
Li and colleagues conducted a systematic review evaluating 15 randomized controlled trials comparing short-course (less than seven days) with extended (more than seven days) monotherapy for CAP in adults.4 Overall, the authors found no difference in the risk of treatment failure between short-course and extended-course antibiotic therapy, and they found no difference in bacteriologic eradication or mortality. It is important to note the studies included in this analysis enrolled patients with mild to moderate CAP, including those treated as outpatients, which limits the ability to extrapolate to exclusively inpatient populations and more severely ill patients.
Another meta-analysis, published shortly thereafter, examined randomized controlled trials in outpatients and inpatients not requiring intensive care. It compared different durations of treatment with the same agent in the same dosage. The authors similarly found no difference in effectiveness or safety of short (less than seven days) versus longer (at least two additional days of therapy) courses.12 Table 3 (above) reviews selected trials of short courses of antibiotics, which have been studied in inpatient populations.
The trials summarized in these meta-analyses examined monotherapy with levofloxacin for five days; gemifloxacin for seven days, azithromycin for three to five days; ceftriaxone for five days; cefuroxime for seven days; amoxicillin for three days; or telithromycin for five to seven days. The variety of antibiotics in these studies contrasts the IDSA/ATS guidelines, which recommend only fluoroquinolones as monotherapy for inpatient CAP.
One important randomized, double-blind study of fluoroquinolones compared a five-day course of levofloxacin 750 mg daily, with a 10-day course of levofloxacin, 500 mg daily, in 528 patients with mild to severe CAP.13 The authors found no difference in clinical success or microbiologic eradication between the two groups, concluding high-dose levofloxacin for five days is an effective and well-tolerated alternative to a longer course of a lower dose, likely related to the drug’s concentration-dependent properties.
Azithromycin also offers potential for short courses of therapy, as pulmonary concentrations of azithromycin remain elevated for as many as five days following a single oral dose.14 Several small studies have demonstrated the safety, efficacy, and cost-effectiveness of three to five days of azithromycin, as summarized in a meta-analysis by Contopoulos-Ioannidis and colleagues.15 Most of these trials, however, were limited to outpatients or inpatients with mild disease or confirmed atypical pneumonia. One randomized trial of 40 inpatients with mild to moderately severe CAP found comparable clinical outcomes with a three-day course of oral azithromycin 500 mg daily versus clarithromycin for at least eight days.16 Larger studies in more severely ill patients must be completed before routinely recommending this approach in hospitalized patients. Furthermore, due to the rising prevalence of macrolide resistance, empiric therapy with a macrolide alone can only be used for the treatment of carefully selected hospitalized patients with nonsevere diseases and without risk factors for drug-resistant Streptococcus pneumoniae.5
Telithromycin is a ketolide antibiotic, which has been studied in mild to moderate CAP, including multidrug-resistant strains of S. pneumoniae, in courses of five to seven days.17 However, severe adverse reactions, including hepatotoxicity, have been reported. At the time of the 2007 guidelines, the IDSA/ATS committee waited for additional safety data before making any recommendations on its use.
One additional study of note was a trial of amoxicillin in adult inpatients with mild to moderately severe CAP.18 One hundred twenty-one patients who clinically improved (based on a composite score of pulmonary symptoms and general improvement) following three days of IV amoxicillin were randomized to oral amoxicillin for an additional five days or given a placebo. At days 10 and 28, there was no difference in clinical success between the two groups. The authors concluded that a total of three days of treatment was not inferior to eight days in patients who substantially improved after the first 72 hours of empiric treatment. This trial was conducted in the Netherlands, where amoxicillin is the preferred empiric antibiotic for CAP and patterns of antimicrobial resistance differ greatly from those found in the U.S.
Other considerations. While some evidence supports shorter courses of antibiotics, many of the existing studies are limited by their inclusion of outpatients, adults with mild to moderate CAP, or small sample size. Hence, clinical judgment continues to play an important role in determining the appropriate duration of therapy. Factors such as pre-existing co-morbidities, severity of illness, and occurrence of complications should be considered. Data is limited on the appropriate duration of antibiotics in CAP patients requiring intensive care. It also is important to note the IDSA/ATS recommendations and most of the studies reviewed exclude patients with human immunodeficiency virus (HIV), and it is unknown whether these shorter courses of antibiotics are appropriate in the HIV population.
Lastly, the IDSA/ATS guidelines note longer durations of treatment may be required if the initial therapy was not active against the identified pathogen, or in cases complicated by extrapulmonary infections, such as endocarditis or meningitis.
Back to the Case
Our patient with moderately severe CAP was hospitalized based on his age and hypoxia. He was immediately treated with supplemental oxygen by nasal cannula, IV fluids, and a dose of IV levofloxacin 750 mg. Within 48 hours he met criteria for clinical stability, including defervescence, a decline in his respiratory rate to 19 breaths per minute, and improvement in oxygen saturation to 95% on room air. At this point, he was changed from IV to oral antibiotics. He continued on levofloxacin 750 mg daily and later that day was discharged home in good condition to complete a five-day course.
Bottom Line
For hospitalized adults with mild to moderately severe CAP, five to seven days of treatment, depending on the antibiotic selected, appears to be effective in most cases. Patients should be afebrile for 48 to 72 hours and demonstrate signs of clinical stability before therapy is discontinued. TH
Kelly Cunningham, MD, and Shelley Ellis, MD, MPH, are members of the Section of Hospital Medicine at Vanderbilt University in Nashville, Tenn. Sunil Kripalani, MD, MSc, serves as the section chief.
References
1. Kung HC, Hoyert DL, Xu J, Murphy SL. Deaths: final data for 2005. Natl Vital Stat Rep. 2008;56.
2. DeFrances CJ, Lucas CA, Buie VC, Golosinskiy A. 2006 National Hospital Discharge Survey. Natl Health Stat Report. 2008;5.
3. Niederman MS. Recent advances in community-acquired pneumonia: inpatient and outpatient. Chest. 2007;131:1205-1215.
4. Li JZ, Winston LG, Moore DH, Bent S. Efficacy of short-course antibiotic regimens for community-acquired pneumonia: a meta-analysis. Am J Med. 2007;120:783-790.
5. Mandell LA, Wunderink RG, Anzueto A et al. Infectious Diseases Society of America/American Thoracic Society consensus guidelines on the management of community-acquired pneumonia in adults. Clin Infect Dis. 2007;44(Suppl 2):S27-72.
6. Ramirez JA, Bordon J. Early switch from intravenous to oral antibiotics in hospitalized patients with bacteremic community-acquired Streptococcus pneumoniae pneumonia. Arch Intern Med. 2001;161:848-850.
7. Halm EA, Fine MJ, Marrie TJ et al. Time to clinical stability in patients hospitalized with community-acquired pneumonia: implications for practice guidelines. JAMA. 1998;279:1452-1457.
8. Menendez R, Torres A, Rodriguez de Castro F et al. Reaching stability in community-acquired pneumonia: the effects of the severity of disease, treatment, and the characteristics of patients. Clin Infect Dis. 2004;39:1783-1790.
9. Siegal RE, Halpern NA, Almenoff PL et al. A prospective randomised study of inpatient IV antibiotics for community-acquired pneumonia: the optimal duration of therapy. Chest. 1996;110:965-971.
10. Oosterheert JJ, Bonten MJ, Schneider MM et al. Effectiveness of early switch from intravenous to oral antibiotics in severe community acquired pneumonia: multicentre randomized trial. BMJ. 2006;333:1193-1197.
11. Nathan RV, Rhew DC, Murray C et al. In-hospital observation after antibiotic switch in pneumonia: a national evaluation. Am J Med. 2006;119:512-518.
12. Dimopoulos G, Matthaiou DK, Karageorgopoulos DE, et al. Short- versus long-course antibacterial therapy for community-acquired pneumonia: a meta-analysis. Drugs. 2008;68:1841-1854.
13. Dunbar LM, Wunderink RG, Habib MP et al. High-dose, short-course levofloxacin for community-acquired pneumonia: a new treatment paradigm. Clin Infect Dis. 2003;37:752-760.
14. Morris DL, De Souza A, Jones JA, Morgan WE. High and prolonged pulmonary tissue concentrations of azithromycin following a single oral dose. Eur J Clin Microbiol Infect Dis. 1991;10:859-861.
15. Contopoulos-Ioannidis DG, Ioannidis JPA, Chew P, Lau J. Meta-analysis of randomized controlled trials on the comparative efficacy and safety of azithromycin against other antibiotics for lower respiratory tract infections. J Antimicrob Chemother. 2001;48:691-703.
16. Rizzato G, Montemurro L, Fraioli P et al. Efficacy of a three-day course of azithromycin in moderately severe community-acquired pneumonia. Eur Respir J. 1995;8:398-402.
17. Tellier G, Niederman MS, Nusrat R et al. Clinical and bacteriological efficacy and safety of 5- and 7-day regimens of telithromycin once daily compared with a 10-day regimen of clarithromycin twice daily in patients with mild to moderate community-acquired pneumonia. J Antimicrob Chemother. 2004;54:515.
18. El Moussaoui R, de Borgie CA, van den Broek P et al. Effectiveness of discontinuing antibiotic treatment after three days versus eight days in mild to moderate-severe community acquired pneumonia: randomised, double blind study. BMJ. 2006;332:1355-1361.
19. Siegel RE, Alicea M, Lee A, Blaiklock R. Comparison of 7 versus 10 days of antibiotic therapy for hospitalized patients with uncomplicated community-acquired pneumonia: a prospective, randomized double-blind study. Am J Ther. 1999;6:217-222.
Safety in Numbers
Patient safety organizations, commonly referred to as PSOs, are about to take off. And when they do, PSOs should provide hospitalists with invaluable data on improving patient safety.
“PSOs are a great concept, but even though it’s been around since 2005, I haven’t seen it clinically,” says Janet Nagamine, RN, MD, hospitalist at Kaiser Permanente in Santa Clara, Calif., and chair of SHM’s Hospital Quality and Patient Safety Committee.
This calendar year, Nagamine and the rest of hospital medicine should start to see some movement—“PSO 1.0,” if you will.
Background
PSOs are public and private organizations approved by the Agency for Healthcare Research and Quality (AHRQ); they include such groups as Health Watch Inc., Human Performance Technology Group, and the Institute for Safe Medication Practices, which will collect, aggregate, and analyze data on patient safety events. Hospitals and other healthcare providers will voluntarily and confidentially report data. The ultimate goal is to advance changes in culture, processes, and systems to enhance patient safety.
PSOs grew out of the Patient Safety and Quality Improvement Act of 2005, which was a response to the Institute of Medicine’s landmark report “To Err Is Human: Building a Safer Health System.” But it wasn’t until last year that the U.S. Department of Health and Human Services issued a final rule outlining PSO requirements and procedures. The rule became effective Jan. 19, 2009.
AHRQ is responsible for coordinating the development of a set of common definitions and reporting formats, called common formats, for collecting the data. Eventually, AHRQ will create a network of patient safety databases to which PSOs, providers, and others can voluntarily contribute non-identifiable patient safety information. This network will serve as an interactive evidence-based management resource for providers, PSOs, and other entities. AHRQ will use data from the network to analyze national and regional statistics regarding patient safety events. Findings will be made public and will be included in AHRQ’s annual National Healthcare Quality Report.
IT Example
To date, the only comparable data-collection system is MedMarx, which compiles information on medication errors. The Joint Commission requires providers to supply a root-cause analysis on every Level 1 incident, “but that’s just scratching the surface of what occurs,” Dr. Nagamine says. “There are far many more Level 2 and Level 3 events with the same precursors, and that information would be very valuable.”
By collecting nationwide data on patient safety events, PSOs will be able to bridge the gaps in the reporting system and provide crucial patient safety information to the healthcare industry. “In general, the concept of aggregate information that allows us to compare events is incredibly important,” Dr. Nagamine says. “A hospitalist working in one hospital has only the information about events in that hospital, but 5,000 hospitals can provide more specific and actionable information. We just haven’t seen this operationalized yet.”
Dr. Nagamine uses a technology example to show the value PSOs could have in identifying patterns or problems that threaten patient safety: “Every hospital has a horror story of implementing a new information technology (IT) system, and we’re getting some very interesting feedback from hospitals about unintended consequences,” she says. “We’re hearing that patients are being hurt because of mistakes in systems—the use of dropdown menus (on computer screens) that don’t drop down far enough to reveal all options, or a screen where it’s easy to click the wrong item.”
Current systems might not allow problems like these to be highlighted. Even if staff knows of a problem, their hospital’s coding system might not allow them to detail it. “It may fall under ‘communications’ or ‘physician computerized order entry’ or something vague, so the data won’t show the specifics of what happened,” Dr. Nagamine points out. “If we had aggregate data on issues like this, we could address it. Right now, we just have word of mouth.”
An isolated event at a hospital is one thing, but similar data from around the nation is significant. “Drug companies or IT vendors confronted with (patterns) might make some changes,” she says. “That kind of data is powerful.”
Hospital Medicine on Board
When hospitals start reporting data to PSOs, where will hospitalists fit into the process? Hospitalists likely will be interviewed to answer some of the PSO’s questions, but they will not be the ones filling out the forms, Dr. Nagamine says. Hospitalists also will be among the ranks of healthcare professionals eagerly awaiting the release of the data. “The way that PSOs approach patient safety and quality—what’s near and dear to our hearts—is it gives us more data,” Dr. Nagamine says. This is crucial for hospitalists leading quality-improvement projects and similar tasks. “Without that data, it’s hard to get traction and movement. That data will help convince someone to invest more time and money in a particular problem area.”
Phase One: Participation
AHRQ has established a comprehensive Web site (www.pso.ahrq.gov) that includes information on the first draft of common formats for use with hospital inpatients. These are found on downloadable paper forms, available at the PSO Privacy Protection Center (PPC) Web site at www.psoppc.org/ web/patientsafety/paperforms.
“The forms are a first step,” Dr. Nagamine explains. “If we had these data points on every incident at every hospital, we’d know a lot more than we do now. We’d be able to harness that information.”
It will be a while before healthcare providers can search the data for patterns and possible solutions in patient safety, but the wait should be worth it. “You’ve got to start somewhere, and it’s not going to happen in one sweep,” Dr. Nagamine says. “This is simply a start. Hopefully, in a decade, we’ll have a lot more actionable information.” TH
Jane Jerrard is a medical writer based in Chicago.