User login
Leadership & Professional Development: Cultivating Habits for the Hospitalist
“We are what we repeatedly do. Excellence, then, is not an act, but a habit.”
—Will Durant
We are a collection of our habits—the routine, repetitive, subconscious behaviors we perform on a daily basis. Some of these behaviors are positive, others less so. Habits allow us to perform tasks automatically, without the need for active decision making. Amidst a constantly changing clinical environment, cultivating consistent habits can improve our adherence to best practices and free cognitive effort toward more challenging diagnostic or therapeutic tasks.
Establishing habits requires practice and intentionality. First, identify those habits that are desirable in your personal and professional life. Next, find a method to develop the habit. Then, hold yourself accountable as you work to embed the habit. Simple? Not quite.
In “The Power of Habit,” author Charles Duhigg introduces habit loops as a way to successfully develop this practice.1 Habit loops—sequences comprising a cue, routine, and reward—are integral to developing routines that support professional and personal aspects of hospitalist life. Consider a hospitalist seeking to develop a prerounds routine to increase efficiency and limit missed patient information. First, the clinician should identify a cue to start the routine, such as sitting down to log in at a specific workstation. Second, a sequence of actions is “chunked” into a consistent order, such as a review of vital signs, clinical notes, and patient labs. After the routine is completed, the clinician should finish with a reward, such as a cup of coffee after rounds. Want to set up a habit for ensuring learning goals are set with trainees at the beginning of every block? Set a calendar reminder for this on the first day, standardize how you communicate goals, and reward yourself with a team lunch at the end of the rotation. What if it’s a busy first day on service? Doesn’t matter. As Clay Christensen notes in “How Will You Measure Your Life?,” making one commitment to a habit is easier than deciding whether or not to engage in the routine every time new circumstances arise.2 The intentionality that comes with this act ensures consistency in the practice.
As a busy hospitalist, establishing habits for personal and professional development requires cues and rewards. For example, do you want to cement a habit of reading the latest journal articles or carving out time each day to reflect on your work? Then cultivate the routine by creating a cue, such as a dashboard on a wall to visualize how many articles you’ve read this week or whether you’ve paused to reflect on your rotation. Reinforce the routine by creating a reward: a walk outside, time with family, or another activity you enjoy. Pair the same reward with the same routine to strengthen the habit loop.
A few additional tips for cultivating habits: it is useful to pair an existing reliable habit, or “anchor habit,” with a new one, such as a short meditation after brushing your teeth.3 Doing so reinforces behaviors in a positive way. You may use the same principles to lose unwanted habits (eg, checking e-mail excessively) by removing cues, such as turning off notifications or using airplane mode and rewarding yourself when you see the behavior through.
Habits are larger than behaviors; they can impact your personal and professional life in important ways. By actively creating habits that align with your long-term priorities, you can create a safety net if and when change arrives. Understanding the psychology of habits and employing cues and rewards effectively can lead hospitalists to create positive routines that improve their clinical practice and personal lives.
1. Duhigg C. The Power of Habit: Why We Do What We Do in Life and Business. Random House; 2012.
2. Christensen CM. How Will You Measure Your Life? (Harvard Business Review Classics). Harvard Business Review Press; 2017.
3. Fogg B. Tiny Habits w/Dr. BJ Fogg-Behavior Change: Tiny Habits; 2011.
“We are what we repeatedly do. Excellence, then, is not an act, but a habit.”
—Will Durant
We are a collection of our habits—the routine, repetitive, subconscious behaviors we perform on a daily basis. Some of these behaviors are positive, others less so. Habits allow us to perform tasks automatically, without the need for active decision making. Amidst a constantly changing clinical environment, cultivating consistent habits can improve our adherence to best practices and free cognitive effort toward more challenging diagnostic or therapeutic tasks.
Establishing habits requires practice and intentionality. First, identify those habits that are desirable in your personal and professional life. Next, find a method to develop the habit. Then, hold yourself accountable as you work to embed the habit. Simple? Not quite.
In “The Power of Habit,” author Charles Duhigg introduces habit loops as a way to successfully develop this practice.1 Habit loops—sequences comprising a cue, routine, and reward—are integral to developing routines that support professional and personal aspects of hospitalist life. Consider a hospitalist seeking to develop a prerounds routine to increase efficiency and limit missed patient information. First, the clinician should identify a cue to start the routine, such as sitting down to log in at a specific workstation. Second, a sequence of actions is “chunked” into a consistent order, such as a review of vital signs, clinical notes, and patient labs. After the routine is completed, the clinician should finish with a reward, such as a cup of coffee after rounds. Want to set up a habit for ensuring learning goals are set with trainees at the beginning of every block? Set a calendar reminder for this on the first day, standardize how you communicate goals, and reward yourself with a team lunch at the end of the rotation. What if it’s a busy first day on service? Doesn’t matter. As Clay Christensen notes in “How Will You Measure Your Life?,” making one commitment to a habit is easier than deciding whether or not to engage in the routine every time new circumstances arise.2 The intentionality that comes with this act ensures consistency in the practice.
As a busy hospitalist, establishing habits for personal and professional development requires cues and rewards. For example, do you want to cement a habit of reading the latest journal articles or carving out time each day to reflect on your work? Then cultivate the routine by creating a cue, such as a dashboard on a wall to visualize how many articles you’ve read this week or whether you’ve paused to reflect on your rotation. Reinforce the routine by creating a reward: a walk outside, time with family, or another activity you enjoy. Pair the same reward with the same routine to strengthen the habit loop.
A few additional tips for cultivating habits: it is useful to pair an existing reliable habit, or “anchor habit,” with a new one, such as a short meditation after brushing your teeth.3 Doing so reinforces behaviors in a positive way. You may use the same principles to lose unwanted habits (eg, checking e-mail excessively) by removing cues, such as turning off notifications or using airplane mode and rewarding yourself when you see the behavior through.
Habits are larger than behaviors; they can impact your personal and professional life in important ways. By actively creating habits that align with your long-term priorities, you can create a safety net if and when change arrives. Understanding the psychology of habits and employing cues and rewards effectively can lead hospitalists to create positive routines that improve their clinical practice and personal lives.
1. Duhigg C. The Power of Habit: Why We Do What We Do in Life and Business. Random House; 2012.
2. Christensen CM. How Will You Measure Your Life? (Harvard Business Review Classics). Harvard Business Review Press; 2017.
3. Fogg B. Tiny Habits w/Dr. BJ Fogg-Behavior Change: Tiny Habits; 2011.
1. Duhigg C. The Power of Habit: Why We Do What We Do in Life and Business. Random House; 2012.
2. Christensen CM. How Will You Measure Your Life? (Harvard Business Review Classics). Harvard Business Review Press; 2017.
3. Fogg B. Tiny Habits w/Dr. BJ Fogg-Behavior Change: Tiny Habits; 2011.
© 2020 Society of Hospital Medicine
Fulfilling the Potential of Point-of-Care Ultrasound in Hospital Medicine
The enthusiasm surrounding point-of-care ultrasound (POCUS) is clear and well founded. POCUS is a powerful tool that produces valuable diagnostic information for common and important clinical problems faced by hospitalists, such as pneumonia, soft-tissue infections,1 and myriad other applications. It can inform the evaluation and management of complex clinical problems such as dyspnea.2 Beyond its diagnostic potential, POCUS is well known to improve common procedures performed by adult and pediatric hospitalists by improving success rates and decreasing complications.
Excitement surrounding this technology continues to grow among hospitalists, leading to a proliferation of high-quality educational programs over the last 5 years. Most notable among these offerings has been the more comprehensive training available through the Society of Hospital Medicine (SHM) certificate-based pathway, though many other strong options exist, including institution-based curricula, such as the HealthPartners CHAMP program,3 and pediatric-focused programs. Growth in training is also occurring among medical students and residents. As of a 2012 survey, the majority (51%) of US medical schools had begun to weave ultrasound into their curricula,4 and this growth is also occurring in internal medicine and pediatric residency programs.5
Given the high potential for this technology and the growth in interest, it is an excellent time to pause and review some of the challenges faced by practitioners, hospitalist groups, and educators seeking to optimize POCUS implementation. A deliberate approach to POCUS education, the development of shared standards for high-quality use, and an ongoing dedication to develop specialty-specific practices will largely determine how much of this potential is fulfilled.
The largest challenge is likely to be educational. Educating clinicians to be able to integrate POCUS into practice is a complex, multistep process requiring not only an adequate core of didactic training and access to machines, but also the structured opportunity to develop rudimentary hands-on skills. Such initial training should be followed by continued practice and feedback as developing POCUS users progress toward independent practice. The study by Kumar et al.6 reaffirms that brief didactic lectures and access to machines are necessary, but they are clearly insufficient for learners to be able to use POCUS independently for a wide variety of applications. Their intervention also contrasts markedly with the 20 hours of didactics and 150 supervised scans recommended by the American College of Emergency Physicians prior to independent use for a core of six applications.7
Shared standards for education, use, and oversight will be crucial to fulfilling the potential of POCUS within hospital medicine. Our belief is that much can be learned from the thoughtful approach taken during the development of POCUS as a mainstream tool in emergency medicine in the early 2000s. In this approach, emergency physicians determined a sufficient and achievable standard of training for core POCUS applications, which was widely adopted. Based on completion of this training, physicians who were required to complete credentialing from their hospitals were widely able to achieve it, without any need for external certification. Emergency medicine guidelines further mandated the documentation of examinations and the creation of an exam report, features that improve clinical communication and facilitate quality improvement. Quality assurance processes that reviewed images and clinician interpretations were established as mandatory, which they should be in hospital medicine. Evidence was produced as to which exams physicians could do reliably with this focused training and which they could not. In the context of these thoughtful constructs, lawsuits have been noted to be exceedingly rare; and when they do occur, they have typically been for the failure to use POCUS rather than the converse.8
While many of these precepts deserve replication, others should also be modified to reflect changes in technology, medical education, and medical practice over the last 20 years and to improve upon this base of success. For example, with POCUS training now appearing in many medical school and residency curricula, training paradigms for both residents and attendings will need to accommodate a wider range of incoming skills. Emphasis should continue to be shifted toward competency-based assessments and entrustment and away from a fixed training time or exam number threshold. Important financial aspects have also changed. The cost of practical machines has dropped considerably, and medicine is shifting away from a fee-for-service model. While it remains appropriate that physicians may bill for POCUS examinations, it is likely that improved diagnosis, improved throughput, and a reduction in complications will yield greater value and should be the emphasis of cost/value discussions.9 Finally, while hospitals may impose credentialing, this process can also create a burden not present for most other noninvasive skills and may deter appropriate use. If this approach is chosen by a hospital, requirements should ideally remain modest, and as these skills become more widespread, POCUS should ultimately be built into board examinations and core credentialing.9
Thoughtful and concerted effort will be required by hospitalist leaders, educational innovators, and professional societies in developing POCUS to best serve hospitalists and their patients. This work has already begun. For example, in 2019 SHM offered a position statement outlining important aspects such as current evidence-based applications, training pathways, quality assurance, and program management.10 These recommendations should guide both adult and pediatric hospitalists. The Alliance for Academic Internal Medicine offered a similar position statement for resident training.11 Interest groups are growing in numerous professional societies, which will facilitate collaboration and promote propagation of best practices. High-quality educational tools are continuing to be developed by numerous organizations.
While further development is needed to add the detail, granularity, and practical tools that educational and practice leaders need to assure that POCUS achieves its potential in hospital medicine, the foundation for POCUS use within the specialty is being thoughtfully constructed. As this process proceeds, it will be vital to continue to learn from our emergency medicine colleagues, who have already met similar challenges, while at the same time be able to develop a modern POCUS model optimized for hospital medicine workflow, training, and patient care.
1. Kinnear B, Kelleher M, Chorny V. Clinical practice update: Point-of-care ultrasound for the pediatric hospitalist. J Hosp Med. 2019;15(3):170-172. https://doi.org/10.12788/jhm.3325.
2. Kelleher M, Kinnear B, Olson A. Clinical progress note: Point-of-care ultrasound in the evaluation of the dyspneic adult. J Hosp Med. 2020;15(3):173-175. https://doi.org/10.12788/jhm.3340.
3. Mathews BK, Reierson K, Vuong K, et al. The design and evaluation of the Comprehensive Hospitalist Assessment and Mentorship with Portfolios (CHAMP) Ultrasound Program. J Hosp Med. 2018;13(8):544-550. https://doi.org/10.12788/jhm.2938.
4. Bahner DP, Goldman E, Way D, Royall NA, Liu YT. The state of ultrasound education in U.S. medical schools: Results of a national survey. Acad Med. 2014;89(12):1681-1686. https://doi.org/10.1097/ACM.0000000000000414.
5. Reaume M, Siuba M, Wagner M, Woodwyk A, Melgar TA. Prevalence and Scope of point-of-care ultrasound education in internal medicine, pediatric, and medicine-pediatric residency programs in the United States. J Ultrasound Med. 2019;38(6):1433-1439. https://doi.org/10.1002/jum.14821.
6. Kumar A, Weng Y, Wang L, et al. Portable ultrasound device usage and learning outcomes among internal medicine trainees: a parallel-group randomized trial. J Hosp Med. 2020;15(3):154-159. https://doi.org/10.12788/jhm.3351.
7. Ultrasound Guidelines: Emergency, Point-of-Care and Clinical Ultrasound Guidelines in Medicine. Ann Emerg Med. 2017;69(5):e27-e54. https://doi.org/10.1016/j.annemergmed.2016.08.457.
8. Stolz L, O’Brien KM, Miller ML, Winters-Brown ND, Blaivas M, Adhikari S. A review of lawsuits related to point-of-care emergency ultrasound applications. West J Emerg Med. 2015;16(1):1-4. https://doi.org/10.5811/westjem.2014.11.23592.
9, Soni NJ, Tierney DM, Jensen TP, Lucas BP. Certification of Point-of-Care Ultrasound Competency. J Hosp Med. 2017;12(9):775-776. doi:10.12788/jhm.2812
10. Soni NJ, Schnobrich D, Matthews BK, et al. Point-of-Care Ultrasound for hospitalists: A position statement of the society of hospital medicine. J Hosp Med. 2019;14. https://doi.org/10.12788/jhm.3079.
11. LoPresti CM, Jensen TP, Dversdal RK, Astiz DJ. Point-of-Care Ultrasound for Internal Medicine Residency Training: A position statement from the Alliance of Academic Internal Medicine. Am J Med. 2019 Nov;132(11):1356-1360. https://doi.org/10.1016/j.amjmed.2019.07.019.
The enthusiasm surrounding point-of-care ultrasound (POCUS) is clear and well founded. POCUS is a powerful tool that produces valuable diagnostic information for common and important clinical problems faced by hospitalists, such as pneumonia, soft-tissue infections,1 and myriad other applications. It can inform the evaluation and management of complex clinical problems such as dyspnea.2 Beyond its diagnostic potential, POCUS is well known to improve common procedures performed by adult and pediatric hospitalists by improving success rates and decreasing complications.
Excitement surrounding this technology continues to grow among hospitalists, leading to a proliferation of high-quality educational programs over the last 5 years. Most notable among these offerings has been the more comprehensive training available through the Society of Hospital Medicine (SHM) certificate-based pathway, though many other strong options exist, including institution-based curricula, such as the HealthPartners CHAMP program,3 and pediatric-focused programs. Growth in training is also occurring among medical students and residents. As of a 2012 survey, the majority (51%) of US medical schools had begun to weave ultrasound into their curricula,4 and this growth is also occurring in internal medicine and pediatric residency programs.5
Given the high potential for this technology and the growth in interest, it is an excellent time to pause and review some of the challenges faced by practitioners, hospitalist groups, and educators seeking to optimize POCUS implementation. A deliberate approach to POCUS education, the development of shared standards for high-quality use, and an ongoing dedication to develop specialty-specific practices will largely determine how much of this potential is fulfilled.
The largest challenge is likely to be educational. Educating clinicians to be able to integrate POCUS into practice is a complex, multistep process requiring not only an adequate core of didactic training and access to machines, but also the structured opportunity to develop rudimentary hands-on skills. Such initial training should be followed by continued practice and feedback as developing POCUS users progress toward independent practice. The study by Kumar et al.6 reaffirms that brief didactic lectures and access to machines are necessary, but they are clearly insufficient for learners to be able to use POCUS independently for a wide variety of applications. Their intervention also contrasts markedly with the 20 hours of didactics and 150 supervised scans recommended by the American College of Emergency Physicians prior to independent use for a core of six applications.7
Shared standards for education, use, and oversight will be crucial to fulfilling the potential of POCUS within hospital medicine. Our belief is that much can be learned from the thoughtful approach taken during the development of POCUS as a mainstream tool in emergency medicine in the early 2000s. In this approach, emergency physicians determined a sufficient and achievable standard of training for core POCUS applications, which was widely adopted. Based on completion of this training, physicians who were required to complete credentialing from their hospitals were widely able to achieve it, without any need for external certification. Emergency medicine guidelines further mandated the documentation of examinations and the creation of an exam report, features that improve clinical communication and facilitate quality improvement. Quality assurance processes that reviewed images and clinician interpretations were established as mandatory, which they should be in hospital medicine. Evidence was produced as to which exams physicians could do reliably with this focused training and which they could not. In the context of these thoughtful constructs, lawsuits have been noted to be exceedingly rare; and when they do occur, they have typically been for the failure to use POCUS rather than the converse.8
While many of these precepts deserve replication, others should also be modified to reflect changes in technology, medical education, and medical practice over the last 20 years and to improve upon this base of success. For example, with POCUS training now appearing in many medical school and residency curricula, training paradigms for both residents and attendings will need to accommodate a wider range of incoming skills. Emphasis should continue to be shifted toward competency-based assessments and entrustment and away from a fixed training time or exam number threshold. Important financial aspects have also changed. The cost of practical machines has dropped considerably, and medicine is shifting away from a fee-for-service model. While it remains appropriate that physicians may bill for POCUS examinations, it is likely that improved diagnosis, improved throughput, and a reduction in complications will yield greater value and should be the emphasis of cost/value discussions.9 Finally, while hospitals may impose credentialing, this process can also create a burden not present for most other noninvasive skills and may deter appropriate use. If this approach is chosen by a hospital, requirements should ideally remain modest, and as these skills become more widespread, POCUS should ultimately be built into board examinations and core credentialing.9
Thoughtful and concerted effort will be required by hospitalist leaders, educational innovators, and professional societies in developing POCUS to best serve hospitalists and their patients. This work has already begun. For example, in 2019 SHM offered a position statement outlining important aspects such as current evidence-based applications, training pathways, quality assurance, and program management.10 These recommendations should guide both adult and pediatric hospitalists. The Alliance for Academic Internal Medicine offered a similar position statement for resident training.11 Interest groups are growing in numerous professional societies, which will facilitate collaboration and promote propagation of best practices. High-quality educational tools are continuing to be developed by numerous organizations.
While further development is needed to add the detail, granularity, and practical tools that educational and practice leaders need to assure that POCUS achieves its potential in hospital medicine, the foundation for POCUS use within the specialty is being thoughtfully constructed. As this process proceeds, it will be vital to continue to learn from our emergency medicine colleagues, who have already met similar challenges, while at the same time be able to develop a modern POCUS model optimized for hospital medicine workflow, training, and patient care.
1. Kinnear B, Kelleher M, Chorny V. Clinical practice update: Point-of-care ultrasound for the pediatric hospitalist. J Hosp Med. 2019;15(3):170-172. https://doi.org/10.12788/jhm.3325.
2. Kelleher M, Kinnear B, Olson A. Clinical progress note: Point-of-care ultrasound in the evaluation of the dyspneic adult. J Hosp Med. 2020;15(3):173-175. https://doi.org/10.12788/jhm.3340.
3. Mathews BK, Reierson K, Vuong K, et al. The design and evaluation of the Comprehensive Hospitalist Assessment and Mentorship with Portfolios (CHAMP) Ultrasound Program. J Hosp Med. 2018;13(8):544-550. https://doi.org/10.12788/jhm.2938.
4. Bahner DP, Goldman E, Way D, Royall NA, Liu YT. The state of ultrasound education in U.S. medical schools: Results of a national survey. Acad Med. 2014;89(12):1681-1686. https://doi.org/10.1097/ACM.0000000000000414.
5. Reaume M, Siuba M, Wagner M, Woodwyk A, Melgar TA. Prevalence and Scope of point-of-care ultrasound education in internal medicine, pediatric, and medicine-pediatric residency programs in the United States. J Ultrasound Med. 2019;38(6):1433-1439. https://doi.org/10.1002/jum.14821.
6. Kumar A, Weng Y, Wang L, et al. Portable ultrasound device usage and learning outcomes among internal medicine trainees: a parallel-group randomized trial. J Hosp Med. 2020;15(3):154-159. https://doi.org/10.12788/jhm.3351.
7. Ultrasound Guidelines: Emergency, Point-of-Care and Clinical Ultrasound Guidelines in Medicine. Ann Emerg Med. 2017;69(5):e27-e54. https://doi.org/10.1016/j.annemergmed.2016.08.457.
8. Stolz L, O’Brien KM, Miller ML, Winters-Brown ND, Blaivas M, Adhikari S. A review of lawsuits related to point-of-care emergency ultrasound applications. West J Emerg Med. 2015;16(1):1-4. https://doi.org/10.5811/westjem.2014.11.23592.
9, Soni NJ, Tierney DM, Jensen TP, Lucas BP. Certification of Point-of-Care Ultrasound Competency. J Hosp Med. 2017;12(9):775-776. doi:10.12788/jhm.2812
10. Soni NJ, Schnobrich D, Matthews BK, et al. Point-of-Care Ultrasound for hospitalists: A position statement of the society of hospital medicine. J Hosp Med. 2019;14. https://doi.org/10.12788/jhm.3079.
11. LoPresti CM, Jensen TP, Dversdal RK, Astiz DJ. Point-of-Care Ultrasound for Internal Medicine Residency Training: A position statement from the Alliance of Academic Internal Medicine. Am J Med. 2019 Nov;132(11):1356-1360. https://doi.org/10.1016/j.amjmed.2019.07.019.
© 2020 Society of Hospital Medicine
MISSION Possible, but Incomplete: Pairing Better Access with Better Transitions in Veteran Care
What childhood game better captures communication exchange than “telephone”: as whispers pass from ear to ear, the original message degrades or transforms entirely. In complex healthcare systems, a more perilous version of “telephone” emerges, distinct from the well-worn metaphor: the signal never arrives at all. The primary care provider never even knew the patient was in the hospital; the discharge summary was never received; the patient cannot remember important details; and key medications are missing. In this edition of the Journal, Roman Ayele et al.1 used qualitative methods to explore this transitional black box between community hospitals and Veterans’ Affairs (VA) primary care clinics, illuminating how signal fragmentation may render the increasing use of care services outside the VA system as inversely proportionate to quality.
To understand why, a small amount of historical context is necessary. The VA has increasingly focused on expanding healthcare options to its nine million veterans. On June 6, 2019, the VA Maintaining Internal Systems and Strengthening Integrated Outside Networks (MISSION) Act was passed to consolidate existing programs and lower barriers for Veterans to seek care in non-VA urgent care and subspecialty settings.2 Though this act is not specifically focused on access to community hospitals, patients seeking urgent and subspecialty care are likely to be increasingly hospitalized outside of the VA due to geographic factors affecting point-of-care decisions. Concurrent with this expansion of options is the planned replacement of the VA’s legacy electronic health record, VistA.3 Both transformations indicate the need for the VA to be watchful and to intensify its focus on safe, effective exchanges of information.
Against this backdrop, Ayele et al.3 use stakeholder interviews with veterans and both non-VA and VA clinicians to identify the current lack of standardized practices for transitions of veteran care from community hospitals to VA primary care in Eastern Colorado. The themes most linked to care fragmentation included difficulty in identifying veterans and notifying VA primary care of hospital discharges, transferring medical records, making follow-up appointments, and coordinating prescribing with VA pharmacies. Participants identified incomplete or delayed information exchanges that were further complicated by the inability to confirm transmission across systems. A patchwork of postacute care solutions failed to prevent wasteful, low-value transitional care, including unscheduled primary care walk-ins and ED visits for medication refills. Participants arrived at a simple common solution: develop a clinically trained “VA liaison” to work at the interface between VA primary care and non-VA community hospitals so as to provide a single point of contact to coordinate these transitions. In short, to have someone to pick up the phone.
The strengths of this qualitative study lie in its insights into the current gaps in care transitions through the eyes of key stakeholders. By engaging patients and providers in imagining system changes that are actionable in the near- (clinical VA liaisons) and longer-term (pharmacy and EHR integration), Ayele et al. have provided a helpful starting place in studying and improving the interface between VA and non-VA care. Stakeholders emphasized the importance of a clear access point so that outside providers can easily notify VA clinics, arrange follow-ups, and streamline physician prescribing to avoid dangerous and costly delays in care.4 Though similar issues have been illuminated in prior work on care fragmentation,4 perspective in context is a fundamental strength of qualitative research, and further highlights the urgency of this period in veteran care.
There is the old adage: “if you have seen one VA, you have seen one VA”. This is arguably reflected in how each VA medical center is situated in a different regional and local healthcare delivery context, despite a common national infrastructure. The authors acknowledge limited generalizability but provide a framework for reproducing such work in regional VA systems. A national model for transitioning patients from regional community partners to VA primary care would require further testing, and to be a credible system-wide investment, would necessitate meaningful measurement across multiple sites. Given recent evidence of strong internal VA performance compared to the private sector,5 it is time for the VA to intensify focus on external care transitions. Given its history and continued commitment to funding innovation,6 the VA ought to be up to the task. Yet, as VA hospitalists, we know only too well that the system is increasingly under pressure to apply constrained resources inside and outside its own walls. Sending business elsewhere might not only fail at improving care but also weaken the fragile care delivery infrastructure.7
The idea that access and continuity may be in conflict raises an ethical question in modern practice and shared decision-making: how do we advise patients navigating complicated and imperfect health systems to understand the choices they are making and the risks they are taking when they spread care across systems? How are access and convenience weighed against the troubled movement of information across systems? How great is the risk if their care teams do not hear the same message? Knowing that increased fragmentation disproportionately affects the marginalized and vulnerable, especially those with complex chronic care needs,8 should we advise certain patients to stay in place within a single system?
As hospitalists, we are implied players in this dangerous version of the telephone game at a fascinating time in healthcare. Unlike when we advise patients on the risks and benefits of treatment, we have little evidence to guide our patients on when to stay put and when to leave to get care outside the system, inviting the risk of lost signals, garbled messages, and worst of all, frustrating, duplicative, unsafe care. As we strive for incremental improvements toward sweeping transformations in healthcare, we may for a few more years have to remind each other—and our students—of the incredible value of one more phone call: to make sure the intended message was
Disclaimer
The contents of this publication do not represent the views of the U.S. Department of Veterans Affairs or the United States Government.
1. Ayele RA, Lawrence E, McCreight M, et al. Perspectives of clinicians, staff, and veterans in transitioning veterans from non-VA hospitals to primary care in a single VA healthcare system. J Hosp Med. 2020;15(3):133-139. https://doi.org/10.12788/jhm.3320.
2. US Department of Veterans Affairs: VA Maintaining Internal Systems and Strengthening Integrated Outside Networks (MISSION) Act of 2018. https://missionact.va.gov/ at https://www.congress.gov/115/bills/s2372/BILLS-115s2372enr.pdf. Accessed October 31, 2019.
3. US Department of Veterans Affairs: VA EHR Modernization. ehrm.va.gov. Accessed October 31, 2019.
4. Thorpe JM, Thorpe CT, Schleiden L, et al. Association between dual use of Department of Veterans Affairs and Medicare Part D drug benefits and potentially unsafe prescribing. JAMA Intern Med. 2019;179(11):1584-1586. https://doi.org/10.1001/jamainternmed.2019.2788.
5. Weeks WB, West AN. Veterans Health Administration hospitals outperform non–Veterans health administration hospitals in most health care markets. Ann Intern Med. 2018;170(6):426-428. https://doi.org/10.7326/M18-1540.
6. US Department of Veterans Affairs: VA Innovation Center. https://www.innovation.va.gov/. Accessed October 31, 2019.
7. Shulkin, DL. Implications for veterans’ Health Care: the danger becomes clearer [published online ahead of print July 22, 2019. JAMA Intern Med. 2019. https://doi.org/10.1001/jamainternmed.2019.2996.
8. Englander H, Michaels L, Chan B, Kansagara D. The care transitions innovation (C-TraIn) for socioeconomically disadvantaged adults: results of a cluster randomized controlled trial. J Gen Intern Med. 2014;29(11):1460-1467. https://doi.org/10.1007/s11606-014-2903-0.
What childhood game better captures communication exchange than “telephone”: as whispers pass from ear to ear, the original message degrades or transforms entirely. In complex healthcare systems, a more perilous version of “telephone” emerges, distinct from the well-worn metaphor: the signal never arrives at all. The primary care provider never even knew the patient was in the hospital; the discharge summary was never received; the patient cannot remember important details; and key medications are missing. In this edition of the Journal, Roman Ayele et al.1 used qualitative methods to explore this transitional black box between community hospitals and Veterans’ Affairs (VA) primary care clinics, illuminating how signal fragmentation may render the increasing use of care services outside the VA system as inversely proportionate to quality.
To understand why, a small amount of historical context is necessary. The VA has increasingly focused on expanding healthcare options to its nine million veterans. On June 6, 2019, the VA Maintaining Internal Systems and Strengthening Integrated Outside Networks (MISSION) Act was passed to consolidate existing programs and lower barriers for Veterans to seek care in non-VA urgent care and subspecialty settings.2 Though this act is not specifically focused on access to community hospitals, patients seeking urgent and subspecialty care are likely to be increasingly hospitalized outside of the VA due to geographic factors affecting point-of-care decisions. Concurrent with this expansion of options is the planned replacement of the VA’s legacy electronic health record, VistA.3 Both transformations indicate the need for the VA to be watchful and to intensify its focus on safe, effective exchanges of information.
Against this backdrop, Ayele et al.3 use stakeholder interviews with veterans and both non-VA and VA clinicians to identify the current lack of standardized practices for transitions of veteran care from community hospitals to VA primary care in Eastern Colorado. The themes most linked to care fragmentation included difficulty in identifying veterans and notifying VA primary care of hospital discharges, transferring medical records, making follow-up appointments, and coordinating prescribing with VA pharmacies. Participants identified incomplete or delayed information exchanges that were further complicated by the inability to confirm transmission across systems. A patchwork of postacute care solutions failed to prevent wasteful, low-value transitional care, including unscheduled primary care walk-ins and ED visits for medication refills. Participants arrived at a simple common solution: develop a clinically trained “VA liaison” to work at the interface between VA primary care and non-VA community hospitals so as to provide a single point of contact to coordinate these transitions. In short, to have someone to pick up the phone.
The strengths of this qualitative study lie in its insights into the current gaps in care transitions through the eyes of key stakeholders. By engaging patients and providers in imagining system changes that are actionable in the near- (clinical VA liaisons) and longer-term (pharmacy and EHR integration), Ayele et al. have provided a helpful starting place in studying and improving the interface between VA and non-VA care. Stakeholders emphasized the importance of a clear access point so that outside providers can easily notify VA clinics, arrange follow-ups, and streamline physician prescribing to avoid dangerous and costly delays in care.4 Though similar issues have been illuminated in prior work on care fragmentation,4 perspective in context is a fundamental strength of qualitative research, and further highlights the urgency of this period in veteran care.
There is the old adage: “if you have seen one VA, you have seen one VA”. This is arguably reflected in how each VA medical center is situated in a different regional and local healthcare delivery context, despite a common national infrastructure. The authors acknowledge limited generalizability but provide a framework for reproducing such work in regional VA systems. A national model for transitioning patients from regional community partners to VA primary care would require further testing, and to be a credible system-wide investment, would necessitate meaningful measurement across multiple sites. Given recent evidence of strong internal VA performance compared to the private sector,5 it is time for the VA to intensify focus on external care transitions. Given its history and continued commitment to funding innovation,6 the VA ought to be up to the task. Yet, as VA hospitalists, we know only too well that the system is increasingly under pressure to apply constrained resources inside and outside its own walls. Sending business elsewhere might not only fail at improving care but also weaken the fragile care delivery infrastructure.7
The idea that access and continuity may be in conflict raises an ethical question in modern practice and shared decision-making: how do we advise patients navigating complicated and imperfect health systems to understand the choices they are making and the risks they are taking when they spread care across systems? How are access and convenience weighed against the troubled movement of information across systems? How great is the risk if their care teams do not hear the same message? Knowing that increased fragmentation disproportionately affects the marginalized and vulnerable, especially those with complex chronic care needs,8 should we advise certain patients to stay in place within a single system?
As hospitalists, we are implied players in this dangerous version of the telephone game at a fascinating time in healthcare. Unlike when we advise patients on the risks and benefits of treatment, we have little evidence to guide our patients on when to stay put and when to leave to get care outside the system, inviting the risk of lost signals, garbled messages, and worst of all, frustrating, duplicative, unsafe care. As we strive for incremental improvements toward sweeping transformations in healthcare, we may for a few more years have to remind each other—and our students—of the incredible value of one more phone call: to make sure the intended message was
Disclaimer
The contents of this publication do not represent the views of the U.S. Department of Veterans Affairs or the United States Government.
1. Ayele RA, Lawrence E, McCreight M, et al. Perspectives of clinicians, staff, and veterans in transitioning veterans from non-VA hospitals to primary care in a single VA healthcare system. J Hosp Med. 2020;15(3):133-139. https://doi.org/10.12788/jhm.3320.
2. US Department of Veterans Affairs: VA Maintaining Internal Systems and Strengthening Integrated Outside Networks (MISSION) Act of 2018. https://missionact.va.gov/ at https://www.congress.gov/115/bills/s2372/BILLS-115s2372enr.pdf. Accessed October 31, 2019.
3. US Department of Veterans Affairs: VA EHR Modernization. ehrm.va.gov. Accessed October 31, 2019.
4. Thorpe JM, Thorpe CT, Schleiden L, et al. Association between dual use of Department of Veterans Affairs and Medicare Part D drug benefits and potentially unsafe prescribing. JAMA Intern Med. 2019;179(11):1584-1586. https://doi.org/10.1001/jamainternmed.2019.2788.
5. Weeks WB, West AN. Veterans Health Administration hospitals outperform non–Veterans health administration hospitals in most health care markets. Ann Intern Med. 2018;170(6):426-428. https://doi.org/10.7326/M18-1540.
6. US Department of Veterans Affairs: VA Innovation Center. https://www.innovation.va.gov/. Accessed October 31, 2019.
7. Shulkin, DL. Implications for veterans’ Health Care: the danger becomes clearer [published online ahead of print July 22, 2019. JAMA Intern Med. 2019. https://doi.org/10.1001/jamainternmed.2019.2996.
8. Englander H, Michaels L, Chan B, Kansagara D. The care transitions innovation (C-TraIn) for socioeconomically disadvantaged adults: results of a cluster randomized controlled trial. J Gen Intern Med. 2014;29(11):1460-1467. https://doi.org/10.1007/s11606-014-2903-0.
© 2020 Society of Hospital Medicine
Contrasting qSOFA and SIRS Criteria for Early Sepsis Identification in a Veteran Population (FULL)
Sepsis is a major public health concern: 10% of patients with sepsis die, and mortality quadruples with progression to septic shock.1 Systemic inflammatory response syndrome (SIRS) criteria, originally published in 1992, are commonly used to detect sepsis, but as early as 2001, these criteria were recognized as lacking specificity.2 Nonetheless, the use of SIRS criteria has persisted in practice. Sepsis was redefined in Sepsis-3 (2016) to guide earlier and more appropriate identification and treatment, which has been shown to greatly improve patient outcomes.1,3 Key recommendations in Sepsis 3 included eliminating SIRS criteria, defining organ dysfunction by the Sequential Organ Failure Assessment (SOFA) score, and introducing the quick SOFA (qSOFA) score.1
The qSOFA combines 3 clinical variables to provide a rapid, simple bedside score that measures the likelihood of poor outcomes, such as admission to an intensive care unit (ICU) or mortality in adults with suspected infection.1,3 The qSOFA score is intended to aid healthcare professionals in more timely stratification of those patients who need escalated care to prevent deterioration.1 The assessment also has been explored as a screening tool for sepsis in clinical practice; however, limited data exists concerning the comparative utility of qSOFA and SIRS in this capacity, and study results are inconsistent.4-6
The most important attribute of a screening tool is high sensitivity, but high specificity also is desired. The qSOFA could supplant SIRS as a screening tool for sepsis if it maintained similarly high sensitivity but achieved superior specificity. Therefore, our primary objective for this study was to determine the effectiveness of qSOFA as a screening assessment for sepsis in the setting of a general inpatient medicine service by contrasting the sensitivity and specificity of qSOFA with SIRS in predicting sepsis, using a retrospective chart review design.
Methods
Administrative data from the Department of Veterans Affairs (VA) Corporate Data Warehouse were accessed via the VA Informatics and Computing Infrastructure (VINCI) and used to identify VA inpatient admissions and obtain the laboratory and vital sign data necessary to calculate SIRS, qSOFA, and SOFA scores. The data were supplemented by manual review of VA health records to obtain information that was not readily available in administrative records, including septic shock outcomes and laboratory and vital sign data obtained in the ICU. This study was approved by the institutional review board at the University of Iowa and the research and development committee at the Iowa City VA Medical Center (ICVAMC).
Patients
The study population included veterans admitted to the nonsurgical medicine unit at ICVAMC between August 1, 2014 and August 1, 2016 who were transferred to an ICU after admission; direct ICU admissions were not included as the qSOFA has been shown in studies to be more beneficial and offer better predictive validity outside the ICU. Excluding these direct admissions prevented any potential skewing of the data. To control for possible selection bias, veterans also were excluded if they transferred from another facility, were admitted under observation status, or if they had been admitted within the prior 30 days. These patients may have been more critically ill than those who presented directly to our facility and any prior treatment could affect the clinical status of the patient and assessment for sepsis at the time of presentation to the VA. Veterans were further required to have evidence of suspected infection based on manual review of the health record, which was determined by receipt of an antibiotic relevant to the empiric treatment of sepsis within 48 hours of admission.
Sepsis and Septic Shock Assessment Tools
As outlined in the Sepsis-3 guidelines, sepsis was defined as suspected or confirmed infection with an acute change in the SOFA score of ≥ 2 points, which is assumed to be 0 in those not known to have preexisting dysfunction.1 The SOFA score includes variables from the respiratory, coagulation, hepatic, cardiovascular, renal, and central nervous systems.1 Septic shock was defined as vasopressor administration and a serum lactic acid level > 2 mmol/L occurring up to 24 hours apart and within 3 days of the first antibiotic dose administered.
The SIRS assessment includes 4 clinical variables (temperature, heart rate, respiratory rate, and white blood cell count) while qSOFA is comprised of 3 variables (respiratory rate, systolic blood pressure, and altered mental status).1 With both assessments, a score ≥ 2 is considered positive, which indicates increased risk for sepsis in patients with suspected infection.1 In keeping with existing studies, qSOFA and SIRS assessments were scored using maximum values found within 48 hours before and 24 hours after the first administered antibiotic dose.3
Outcomes
The primary outcome variable was the presence of sepsis in adults with evidence of infection within 48 hours of admission. Secondary outcome measures included 30-day mortality and septic shock.
Performance between the SIRS and qSOFA assessments was contrasted using sensitivity, specificity, and positive and negative predictive value measurements. Associations of qSOFA and SIRS with septic shock and 30-day mortality were evaluated using a 2-tailed Fisher’s exact test with a threshold of α = 0.05 to determine statistical significance.
Results
The study sample of 481 veterans had a mean age of 67.4 years, 94% were male, and 91.1% were white (Table 1). 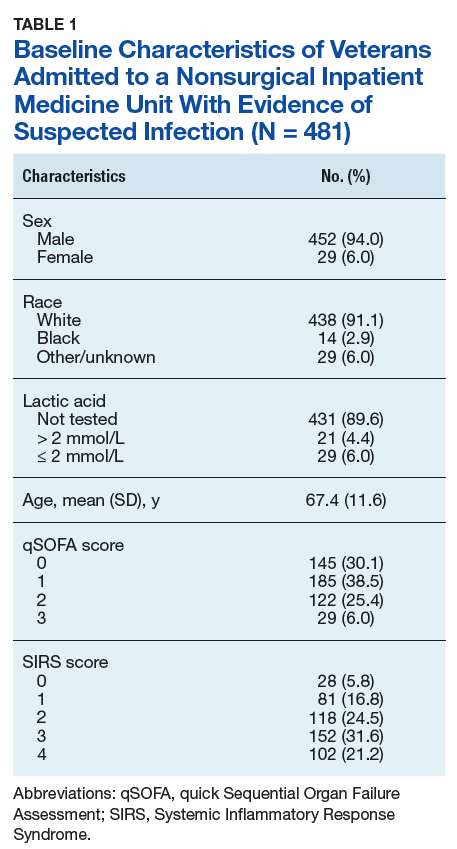
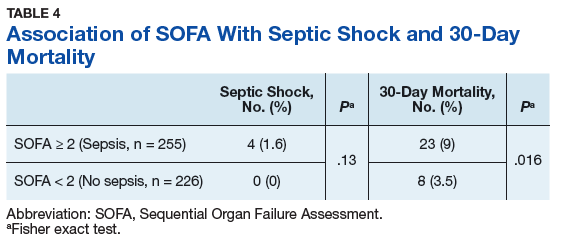
Scores for qSOFA, but not SIRS, were significantly associated with septic shock (Fisher’s exact test; qSOFA: P = .009; SIRS: P = .58) (Table 3). 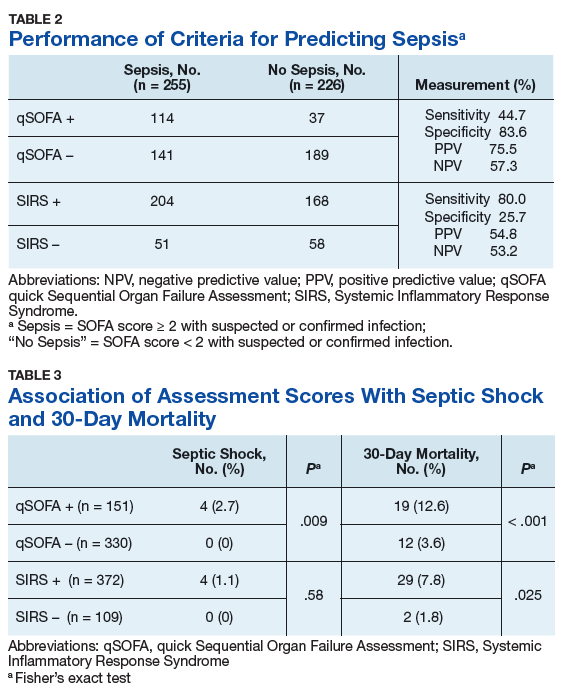
Discussion
High sensitivity is critical for a sepsis screening tool. To be clinically useful, it has been suggested that biomarkers predicting poor outcomes for sepsis should have a sensitivity of > 80%.4 Although qSOFA demonstrated greater specificity than SIRS in our study (83.6% vs 25.7%), qSOFA showed lower sensitivity (44.7% vs 80.0%), which resulted in a greater potential for false negatives; 55.3% of those with sepsis would go undetected. Therefore, our study does not support qSOFA as a better screening assessment than SIRS for sepsis in the veteran population.
Most studies concur with our findings of low sensitivity and high specificity of qSOFA. In a systematic review and meta-analysis, Serafim and colleagues identified 10 studies published after Sepsis-3 that reported sensitivity or specificity of qSOFA and SIRS for sepsis diagnosis.5 Seven of the 10 studies reported sensitivities and favored SIRS in the diagnosis of sepsis (Relative risk: 1.32; 95% CI: 0.40-2.24; P < .0001; I2 = 100%). The authors noted that substantial heterogeneity among studies, including differences in study design, sample size, and criteria for determination of infection, was an important limitation. In addition, most studies that contrast qSOFA and SIRS center on prognostic value in predicting mortality, rather than as a screening test for a diagnosis of sepsis.
We concluded SIRS was more sensitive and thus superior to qSOFA when used as a screening tool for sepsis but conceded that more prospective and homogenous investigations were necessary. To our knowledge, only 1 published study has deviated from this conclusion and reported comparable sensitivity between SIRS (92%) and qSOFA (90%).6 Our study adds to existing literature as it is the first conducted in a veteran population. Additionally, we performed our investigation in a general medicine population with methods similar to existing literature, including the key study validating clinical criteria for sepsis by Seymour and colleagues.3
Limitations
This study is not without limitations, including potential misclassification of cases if essential data points were not available during data collection via health record review or the data points were not representative of a true change from baseline (eg, the Glasgow Coma Scale score for altered mental status in the qSOFA or the SOFA score for organ dysfunction). Generalizability of the results also may be limited due to our retrospective, single-center design and characteristics typical of a veteran population (eg, older, white males). Additionally, many veterans were excluded from the study if they transferred from another facility. These veterans may have been more critically ill than those who presented directly to our facility, which possibly introduced selection bias.
Conclusion
Our findings do not support use of the qSOFA as a suitable replacement for SIRS as a sepsis screening tool among patients with suspected infection in the general medicine inpatient setting. The clinical concern with SIRS is that unfavorable specificity leads to unnecessary antibiotic exposure among patients who are falsely positive. While qSOFA has demonstrated higher specificity, its use would cause many sepsis cases to go undetected due to the technique’s low sensitivity. Frequent false negative qSOFA results could thus serve to impede, rather than enhance, early recognition and intervention for sepsis.
The ideal sepsis screening tool is rapid and possesses high sensitivity and specificity to promptly identify and manage sepsis and avert unfavorable outcomes such as septic shock and death. While the SIRS criteria do not satisfy these ideal features, its measurement characteristics are more suitable for the application of sepsis screening than the qSOFA and should thus remain the standard tool in this setting. Future prospectively designed studies with more uniform methodologies are necessary to ascertain the most effective approach to identify sepsis for which novel screening approaches with more clinically suitable measurement properties are greatly needed.
Acknowledgements
This research was supported by the Iowa City VA Health Care System, Department of Pharmacy Services. Additional support was provided by the Health Services Research and Development Service, Department of Veterans Affairs.
1. Singer M, Deutchman CS, Seymour CW, et al. The Third International Consensus Definitions for Sepsis and Septic Shock (Sepsis-3). JAMA. 2016;315(8):801-810.
2. Levy MM, Fink MP, Marshall JC, et al; SCCM/ESICM/ACCP/ATS/SIS. 2001 SCCM/ESICM/ACCP/ATS/SIS International Sepsis Definitions Conference. Crit Care Med. 2003;31(4):1250-1256.
3. Seymour CW, Liu VX, Iwashyna TJ, et al. Assessment of clinical criteria for sepsis: for the Third International Consensus Definitions for Sepsis and Septic Shock (Sepsis-3). JAMA. 2016;315(8):762-774.
4. Giamorellos-Bourboulis EJ, Tsaganos T, Tsangaris I, et al; Hellenic Sepsis Study Group. Validation of the new Sepsis-3 definitions: proposal for improvement of early risk identification. Clin Microbiol Infect. 2016;23(2):104-109.
5. Serafim R, Gomes JA, Salluh J, Póvoa P. A Comparison of the Quick-SOFA and Systemic Inflammatory Response Syndrome criteria for the diagnosis of sepsis and prediction of mortality: a systematic review and meta-analysis. Chest. 2018;153(3):646-655.
6. Forward E, Konecny P, Burston J, Adhikari S, Doolan H, Jensen T. Predictive validity of qSOFA criteria for sepsis in non-ICU patients. Intensive Care Med. 2017;43(6):945-946.
Sepsis is a major public health concern: 10% of patients with sepsis die, and mortality quadruples with progression to septic shock.1 Systemic inflammatory response syndrome (SIRS) criteria, originally published in 1992, are commonly used to detect sepsis, but as early as 2001, these criteria were recognized as lacking specificity.2 Nonetheless, the use of SIRS criteria has persisted in practice. Sepsis was redefined in Sepsis-3 (2016) to guide earlier and more appropriate identification and treatment, which has been shown to greatly improve patient outcomes.1,3 Key recommendations in Sepsis 3 included eliminating SIRS criteria, defining organ dysfunction by the Sequential Organ Failure Assessment (SOFA) score, and introducing the quick SOFA (qSOFA) score.1
The qSOFA combines 3 clinical variables to provide a rapid, simple bedside score that measures the likelihood of poor outcomes, such as admission to an intensive care unit (ICU) or mortality in adults with suspected infection.1,3 The qSOFA score is intended to aid healthcare professionals in more timely stratification of those patients who need escalated care to prevent deterioration.1 The assessment also has been explored as a screening tool for sepsis in clinical practice; however, limited data exists concerning the comparative utility of qSOFA and SIRS in this capacity, and study results are inconsistent.4-6
The most important attribute of a screening tool is high sensitivity, but high specificity also is desired. The qSOFA could supplant SIRS as a screening tool for sepsis if it maintained similarly high sensitivity but achieved superior specificity. Therefore, our primary objective for this study was to determine the effectiveness of qSOFA as a screening assessment for sepsis in the setting of a general inpatient medicine service by contrasting the sensitivity and specificity of qSOFA with SIRS in predicting sepsis, using a retrospective chart review design.
Methods
Administrative data from the Department of Veterans Affairs (VA) Corporate Data Warehouse were accessed via the VA Informatics and Computing Infrastructure (VINCI) and used to identify VA inpatient admissions and obtain the laboratory and vital sign data necessary to calculate SIRS, qSOFA, and SOFA scores. The data were supplemented by manual review of VA health records to obtain information that was not readily available in administrative records, including septic shock outcomes and laboratory and vital sign data obtained in the ICU. This study was approved by the institutional review board at the University of Iowa and the research and development committee at the Iowa City VA Medical Center (ICVAMC).
Patients
The study population included veterans admitted to the nonsurgical medicine unit at ICVAMC between August 1, 2014 and August 1, 2016 who were transferred to an ICU after admission; direct ICU admissions were not included as the qSOFA has been shown in studies to be more beneficial and offer better predictive validity outside the ICU. Excluding these direct admissions prevented any potential skewing of the data. To control for possible selection bias, veterans also were excluded if they transferred from another facility, were admitted under observation status, or if they had been admitted within the prior 30 days. These patients may have been more critically ill than those who presented directly to our facility and any prior treatment could affect the clinical status of the patient and assessment for sepsis at the time of presentation to the VA. Veterans were further required to have evidence of suspected infection based on manual review of the health record, which was determined by receipt of an antibiotic relevant to the empiric treatment of sepsis within 48 hours of admission.
Sepsis and Septic Shock Assessment Tools
As outlined in the Sepsis-3 guidelines, sepsis was defined as suspected or confirmed infection with an acute change in the SOFA score of ≥ 2 points, which is assumed to be 0 in those not known to have preexisting dysfunction.1 The SOFA score includes variables from the respiratory, coagulation, hepatic, cardiovascular, renal, and central nervous systems.1 Septic shock was defined as vasopressor administration and a serum lactic acid level > 2 mmol/L occurring up to 24 hours apart and within 3 days of the first antibiotic dose administered.
The SIRS assessment includes 4 clinical variables (temperature, heart rate, respiratory rate, and white blood cell count) while qSOFA is comprised of 3 variables (respiratory rate, systolic blood pressure, and altered mental status).1 With both assessments, a score ≥ 2 is considered positive, which indicates increased risk for sepsis in patients with suspected infection.1 In keeping with existing studies, qSOFA and SIRS assessments were scored using maximum values found within 48 hours before and 24 hours after the first administered antibiotic dose.3
Outcomes
The primary outcome variable was the presence of sepsis in adults with evidence of infection within 48 hours of admission. Secondary outcome measures included 30-day mortality and septic shock.
Performance between the SIRS and qSOFA assessments was contrasted using sensitivity, specificity, and positive and negative predictive value measurements. Associations of qSOFA and SIRS with septic shock and 30-day mortality were evaluated using a 2-tailed Fisher’s exact test with a threshold of α = 0.05 to determine statistical significance.
Results
The study sample of 481 veterans had a mean age of 67.4 years, 94% were male, and 91.1% were white (Table 1).
Scores for qSOFA, but not SIRS, were significantly associated with septic shock (Fisher’s exact test; qSOFA: P = .009; SIRS: P = .58) (Table 3).
Discussion
High sensitivity is critical for a sepsis screening tool. To be clinically useful, it has been suggested that biomarkers predicting poor outcomes for sepsis should have a sensitivity of > 80%.4 Although qSOFA demonstrated greater specificity than SIRS in our study (83.6% vs 25.7%), qSOFA showed lower sensitivity (44.7% vs 80.0%), which resulted in a greater potential for false negatives; 55.3% of those with sepsis would go undetected. Therefore, our study does not support qSOFA as a better screening assessment than SIRS for sepsis in the veteran population.
Most studies concur with our findings of low sensitivity and high specificity of qSOFA. In a systematic review and meta-analysis, Serafim and colleagues identified 10 studies published after Sepsis-3 that reported sensitivity or specificity of qSOFA and SIRS for sepsis diagnosis.5 Seven of the 10 studies reported sensitivities and favored SIRS in the diagnosis of sepsis (Relative risk: 1.32; 95% CI: 0.40-2.24; P < .0001; I2 = 100%). The authors noted that substantial heterogeneity among studies, including differences in study design, sample size, and criteria for determination of infection, was an important limitation. In addition, most studies that contrast qSOFA and SIRS center on prognostic value in predicting mortality, rather than as a screening test for a diagnosis of sepsis.
We concluded SIRS was more sensitive and thus superior to qSOFA when used as a screening tool for sepsis but conceded that more prospective and homogenous investigations were necessary. To our knowledge, only 1 published study has deviated from this conclusion and reported comparable sensitivity between SIRS (92%) and qSOFA (90%).6 Our study adds to existing literature as it is the first conducted in a veteran population. Additionally, we performed our investigation in a general medicine population with methods similar to existing literature, including the key study validating clinical criteria for sepsis by Seymour and colleagues.3
Limitations
This study is not without limitations, including potential misclassification of cases if essential data points were not available during data collection via health record review or the data points were not representative of a true change from baseline (eg, the Glasgow Coma Scale score for altered mental status in the qSOFA or the SOFA score for organ dysfunction). Generalizability of the results also may be limited due to our retrospective, single-center design and characteristics typical of a veteran population (eg, older, white males). Additionally, many veterans were excluded from the study if they transferred from another facility. These veterans may have been more critically ill than those who presented directly to our facility, which possibly introduced selection bias.
Conclusion
Our findings do not support use of the qSOFA as a suitable replacement for SIRS as a sepsis screening tool among patients with suspected infection in the general medicine inpatient setting. The clinical concern with SIRS is that unfavorable specificity leads to unnecessary antibiotic exposure among patients who are falsely positive. While qSOFA has demonstrated higher specificity, its use would cause many sepsis cases to go undetected due to the technique’s low sensitivity. Frequent false negative qSOFA results could thus serve to impede, rather than enhance, early recognition and intervention for sepsis.
The ideal sepsis screening tool is rapid and possesses high sensitivity and specificity to promptly identify and manage sepsis and avert unfavorable outcomes such as septic shock and death. While the SIRS criteria do not satisfy these ideal features, its measurement characteristics are more suitable for the application of sepsis screening than the qSOFA and should thus remain the standard tool in this setting. Future prospectively designed studies with more uniform methodologies are necessary to ascertain the most effective approach to identify sepsis for which novel screening approaches with more clinically suitable measurement properties are greatly needed.
Acknowledgements
This research was supported by the Iowa City VA Health Care System, Department of Pharmacy Services. Additional support was provided by the Health Services Research and Development Service, Department of Veterans Affairs.
1. Singer M, Deutchman CS, Seymour CW, et al. The Third International Consensus Definitions for Sepsis and Septic Shock (Sepsis-3). JAMA. 2016;315(8):801-810.
2. Levy MM, Fink MP, Marshall JC, et al; SCCM/ESICM/ACCP/ATS/SIS. 2001 SCCM/ESICM/ACCP/ATS/SIS International Sepsis Definitions Conference. Crit Care Med. 2003;31(4):1250-1256.
3. Seymour CW, Liu VX, Iwashyna TJ, et al. Assessment of clinical criteria for sepsis: for the Third International Consensus Definitions for Sepsis and Septic Shock (Sepsis-3). JAMA. 2016;315(8):762-774.
4. Giamorellos-Bourboulis EJ, Tsaganos T, Tsangaris I, et al; Hellenic Sepsis Study Group. Validation of the new Sepsis-3 definitions: proposal for improvement of early risk identification. Clin Microbiol Infect. 2016;23(2):104-109.
5. Serafim R, Gomes JA, Salluh J, Póvoa P. A Comparison of the Quick-SOFA and Systemic Inflammatory Response Syndrome criteria for the diagnosis of sepsis and prediction of mortality: a systematic review and meta-analysis. Chest. 2018;153(3):646-655.
6. Forward E, Konecny P, Burston J, Adhikari S, Doolan H, Jensen T. Predictive validity of qSOFA criteria for sepsis in non-ICU patients. Intensive Care Med. 2017;43(6):945-946.
Clinical Guideline Highlights for the Hospitalist: The GOLD and NICE Guidelines for the Management of COPD
Chronic obstructive pulmonary disease (COPD), projected to be the third leading cause of death by 2020, accounts for 6% of deaths globally.3 Hospitalization for COPD exacerbations is common and impacts patients’ disease trajectory, and mortality, with fewer than half of patients hospitalized for exacerbation surviving 5 years.4 Hospitalization provides an opportunity to optimize care. Due to recent practice-changing evidence, the National Institute for Health and Care Excellence (NICE) and the Global Initiative for Chronic Obstructive Lung Disease (GOLD) published updated guidelines.
KEY RECOMMENDATIONS
These are selected recommendations relevant to adult hospitalists. The GOLD guidelines grade recommendations by evidence strength from category A (randomized control trial data) to category D (expert consensus). The NICE guidelines relay strength of evidence through terminology referring to the presence or absence of a strong recommendation. Recommendations without evidence level specified are NS.
Diagnosis and Classification of COPD Severity
Recommendation 1. In patients with risk factors for and symptoms of COPD, spirometry is required to confirm the diagnosis, defined as a postbronchodilator FEV1/FVC ratio of <0.7 (NS, NICE, GOLD). The Global Lung Function Initiative (GLI) 2012 reference ranges5 are recommended (NS, NICE). Recommendation 2. Severity of airflow obstruction should be assessed according to reduction in the postbronchodilator FEV1 as: Stage I, Mild: FEV1 ≥80%; Stage II, Moderate: FEV1 = 50-79%; Stage III, Severe FEV1 = 30%-49%; Stage IV, FEV1<30% (NS, NICE, GOLD). Recommendation 3. Reversibility testing (aka bronchodilator response) does not indicate long-term response to therapy (NS, NICE, GOLD). Recommendation 4. The combined COPD assessment to classify patient symptoms and disease severity in one of four groups (A, B, C, or D) based on exacerbation history and daily symptom control (NS, GOLD). Use the Medical Research Council dyspnea scale to classify symptoms (strong, NICE).
Pharmacologic COPD Management
Recommendation 5. Short-acting inhaled bronchodilators such as short-acting beta2 agonists (SABAs) or short-acting muscarinic antagonists (SAMAs) improve FEV1 and symptoms. Combining SABA/SAMA is superior to monotherapy (A, GOLD). Recommendation 6. Long-acting bronchodilators, such as long-acting antimuscarinics (LAMAs) or long-acting beta2 agonists (LABAs), improve lung function and dyspnea and reduce exacerbations. Combination therapy (LABA/LAMA) is superior to using a single agent (LABA or LAMA) for improving FEV1 and reducing exacerbations (A, GOLD). Recommendation 7. Triple therapy of inhaled corticosteroid ICS/LAMA/LABA is more effective than the individual components in reducing exacerbations in the case of moderate to severe COPD (A, GOLD). Recommendation 8. Treatment with an ICS increases pneumonia risk (A, GOLD). Discuss these side effects (Strong, NICE). Recommendation 9. Use SABAs and SAMAs as initial treatment for patients with COPD (Strong, NICE). LABAs and LAMAs are preferred over short-acting agents except for patients with mild symptoms (A, GOLD). Recommendation 10. For symptomatic patients on long-acting monotherapy, escalate to combination LABA/LAMA, or if asthmatic features or elevated eosinophils (≥300 cells/µL) are present, combination LABA/ICS (A, GOLD; Strong, NICE). Recommendation 11. Assess and correct patient inhaler technique (NS, GOLD; Strong, NICE).
Nonpharmacologic COPD Management
Oxygen. Recommendation 12. Long-term oxygen supplementation increases survival in patients with resting arterial hypoxemia (PaO2<55 mm Hg) or hypoxemia (PaO2<60 mm Hg) with cor pulmonale (A, GOLD). Recommendation 13. In patients with moderate resting (89%-93%) or exercise-induced arterial desaturation (80%-90%), long-term oxygen does not improve outcomes (A, GOLD).6Recommendation 14. Consider long-term oxygan after a risk assessment of fall and burn risk. Do not offer oxygen to those who continue to smoke (Strong, NICE).
Tobacco
Pulmonary Rehabilitation. Recommendation 17. Provide rehabilitation to patients with high exacerbation risk and relevant symptoms (A, GOLD). Offer pulmonary rehabilitation to patients with recent hospitalizations and/or severe dyspnea (Strong, NICE).
Immunizations. Recommendation 18. Influenza and pneumococcal vaccinations (PPSV23 as well as PCV13 when age ≥ 65 years) are recommended for patients with COPD (NS, GOLD; Strong, NICE).
Palliative Care. Recommendation 19. For patients with end-stage COPD or poorly controlled symptoms, provide access to palliative care (NS, GOLD; Strong, NICE).
Management of COPD Exacerbations and Patients at high risk for Exacerbations
Recommendation 20. Use SABAs with or without SAMAs as initial bronchodilators to treat acute exacerbations (C, GOLD). Recommendation 21. Systemic corticosteroids for exacerbations improve lung function, oxygenation, and recovery time. Recommend 5 to 7 days of therapy (A, GOLD; Strong, NICE). Recommendation 22. Antibiotics shorten recovery time and reduce treatment failure and rehospitalization. Treatment should be 5 to 7 days (B, GOLD). Consider antibiotics while balancing the severity of symptoms and hospitalization need (Conditional, NICE). Recommendation 23. Noninvasive mechanical ventilation is the preferred mode of ventilation for COPD patients with acute respiratory failure without acute contraindications (A, GOLD). Recommendation 24. Avoid long-term oral corticosteroids therapy (A, GOLD). Recommendation 25. Consider roflumilast for patients with exacerbations despite LABA/ICS or LABA/LAMA/ICS, and seek respiratory medicine consultation (B, GOLD; Strong, NICE). For former smokers with exacerbations despite appropriate therapy, consider azithromycin (B, GOLD; Strong, NICE).
CRITIQUE
GOLD is an International committee of experts who compile the report based on scientific literature review. NICE is an independent organization funded by Department of Health and Social Care in the United Kingdom responsible for evidence-based guidance on healthcare determined by an expert committee through scientific review and a transparent process that details committee formation and framework (GRADE) used and stakeholder input. While both guidelines review current publications, practice-influencing clinical trials of recent publication may be missed.
On the GOLD Science committee, 17/20 members have pharmaceutical relationships, with no mitigation plan provided. The NICE guidelines detail a panel with few industry ties and a mitigation plan for potential conflicts of interest.
These recommendations comprehensively cover outpatient and inpatient COPD management. The GOLD and NICE guidelines are similar with the exception of recommendations surrounding use of oxygen. The NICE guidelines, based on the adverse events documented in the recent Long-Term Oxygen Treatment Trial,6 recommend against oxygen use by patients who smoke because of the risk of fire-related injuries;7 GOLD guidelines do not differentiate oxygen recommendation by patient population.
Differences in the strength of NICE and GOLD recommendations highlight areas for further study. Investigations determining distinct COPD phenotypes will likely influence future guidelines. More discriminative multidimensional prognostication tools are needed to improve precision surrounding prognosis.
1. NICE. Overview. Chronic obstructive pulmonary disease in over 16s: Diagnosis and management, Guidance. https://www.nice.org.uk/guidance/ng115. Accessed November 21, 2019
2. GOLD Reports for Personal Use. Global Initiative for Chronic Obstructive Lung Disease - GOLD. https://goldcopd.org/gold-reports/. Accessed September 17, 2019.
3. Lozano R, Naghavi M, Foreman K, et al. Global and regional mortality from 235 causes of death for 20 age groups in 1990 and 2010: A systematic analysis for the Global Burden of Disease Study 2010. Lancet. 2012;380(9859):2095-128. https://doi.org/10.1016/S0140-6736(12)61728-0.
4. Suissa S, Dell’Aniello S, Ernst P. Long-term natural history of chronic obstructive pulmonary disease: Severe exacerbations and mortality. Thorax. 2012;67(11):957-63. https://doi.org/10.1136/thoraxjnl-2011-201518.
5. Quanjer PH, Stanojevic S, Cole TJ, et al. Multi-ethnic reference values for spirometry for the 3–95-yr age range: The global lung function 2012 equations. Eur Respir J. 2012;40(6):1324-43. https://doi.org/10.1183/09031936.00080312.
6. Albert RK, Au DH, Blackford AL, et al. Long-term oxygen treatment trial research group. A randomized trial of long-term oxygen for COPD with moderate desaturation. N Engl J Med. 2016;375(17):1617-27. https://doi.org/10.1056/NEJMoa1604344.
7. National Institute for Health and Care Excellence. Chronic obstructive pulmonary disease in over 16s: diagnosis and management [B} Oxygen therapy in people with stable COPD. https://www.nice.org.uk/guidance/ng115/evidence/b-oxygen-therapy-in-people-with-stable-copd-pdf-6602768751. Accessed November 21, 2019.
Chronic obstructive pulmonary disease (COPD), projected to be the third leading cause of death by 2020, accounts for 6% of deaths globally.3 Hospitalization for COPD exacerbations is common and impacts patients’ disease trajectory, and mortality, with fewer than half of patients hospitalized for exacerbation surviving 5 years.4 Hospitalization provides an opportunity to optimize care. Due to recent practice-changing evidence, the National Institute for Health and Care Excellence (NICE) and the Global Initiative for Chronic Obstructive Lung Disease (GOLD) published updated guidelines.
KEY RECOMMENDATIONS
These are selected recommendations relevant to adult hospitalists. The GOLD guidelines grade recommendations by evidence strength from category A (randomized control trial data) to category D (expert consensus). The NICE guidelines relay strength of evidence through terminology referring to the presence or absence of a strong recommendation. Recommendations without evidence level specified are NS.
Diagnosis and Classification of COPD Severity
Recommendation 1. In patients with risk factors for and symptoms of COPD, spirometry is required to confirm the diagnosis, defined as a postbronchodilator FEV1/FVC ratio of <0.7 (NS, NICE, GOLD). The Global Lung Function Initiative (GLI) 2012 reference ranges5 are recommended (NS, NICE). Recommendation 2. Severity of airflow obstruction should be assessed according to reduction in the postbronchodilator FEV1 as: Stage I, Mild: FEV1 ≥80%; Stage II, Moderate: FEV1 = 50-79%; Stage III, Severe FEV1 = 30%-49%; Stage IV, FEV1<30% (NS, NICE, GOLD). Recommendation 3. Reversibility testing (aka bronchodilator response) does not indicate long-term response to therapy (NS, NICE, GOLD). Recommendation 4. The combined COPD assessment to classify patient symptoms and disease severity in one of four groups (A, B, C, or D) based on exacerbation history and daily symptom control (NS, GOLD). Use the Medical Research Council dyspnea scale to classify symptoms (strong, NICE).
Pharmacologic COPD Management
Recommendation 5. Short-acting inhaled bronchodilators such as short-acting beta2 agonists (SABAs) or short-acting muscarinic antagonists (SAMAs) improve FEV1 and symptoms. Combining SABA/SAMA is superior to monotherapy (A, GOLD). Recommendation 6. Long-acting bronchodilators, such as long-acting antimuscarinics (LAMAs) or long-acting beta2 agonists (LABAs), improve lung function and dyspnea and reduce exacerbations. Combination therapy (LABA/LAMA) is superior to using a single agent (LABA or LAMA) for improving FEV1 and reducing exacerbations (A, GOLD). Recommendation 7. Triple therapy of inhaled corticosteroid ICS/LAMA/LABA is more effective than the individual components in reducing exacerbations in the case of moderate to severe COPD (A, GOLD). Recommendation 8. Treatment with an ICS increases pneumonia risk (A, GOLD). Discuss these side effects (Strong, NICE). Recommendation 9. Use SABAs and SAMAs as initial treatment for patients with COPD (Strong, NICE). LABAs and LAMAs are preferred over short-acting agents except for patients with mild symptoms (A, GOLD). Recommendation 10. For symptomatic patients on long-acting monotherapy, escalate to combination LABA/LAMA, or if asthmatic features or elevated eosinophils (≥300 cells/µL) are present, combination LABA/ICS (A, GOLD; Strong, NICE). Recommendation 11. Assess and correct patient inhaler technique (NS, GOLD; Strong, NICE).
Nonpharmacologic COPD Management
Oxygen. Recommendation 12. Long-term oxygen supplementation increases survival in patients with resting arterial hypoxemia (PaO2<55 mm Hg) or hypoxemia (PaO2<60 mm Hg) with cor pulmonale (A, GOLD). Recommendation 13. In patients with moderate resting (89%-93%) or exercise-induced arterial desaturation (80%-90%), long-term oxygen does not improve outcomes (A, GOLD).6Recommendation 14. Consider long-term oxygan after a risk assessment of fall and burn risk. Do not offer oxygen to those who continue to smoke (Strong, NICE).
Tobacco
Pulmonary Rehabilitation. Recommendation 17. Provide rehabilitation to patients with high exacerbation risk and relevant symptoms (A, GOLD). Offer pulmonary rehabilitation to patients with recent hospitalizations and/or severe dyspnea (Strong, NICE).
Immunizations. Recommendation 18. Influenza and pneumococcal vaccinations (PPSV23 as well as PCV13 when age ≥ 65 years) are recommended for patients with COPD (NS, GOLD; Strong, NICE).
Palliative Care. Recommendation 19. For patients with end-stage COPD or poorly controlled symptoms, provide access to palliative care (NS, GOLD; Strong, NICE).
Management of COPD Exacerbations and Patients at high risk for Exacerbations
Recommendation 20. Use SABAs with or without SAMAs as initial bronchodilators to treat acute exacerbations (C, GOLD). Recommendation 21. Systemic corticosteroids for exacerbations improve lung function, oxygenation, and recovery time. Recommend 5 to 7 days of therapy (A, GOLD; Strong, NICE). Recommendation 22. Antibiotics shorten recovery time and reduce treatment failure and rehospitalization. Treatment should be 5 to 7 days (B, GOLD). Consider antibiotics while balancing the severity of symptoms and hospitalization need (Conditional, NICE). Recommendation 23. Noninvasive mechanical ventilation is the preferred mode of ventilation for COPD patients with acute respiratory failure without acute contraindications (A, GOLD). Recommendation 24. Avoid long-term oral corticosteroids therapy (A, GOLD). Recommendation 25. Consider roflumilast for patients with exacerbations despite LABA/ICS or LABA/LAMA/ICS, and seek respiratory medicine consultation (B, GOLD; Strong, NICE). For former smokers with exacerbations despite appropriate therapy, consider azithromycin (B, GOLD; Strong, NICE).
CRITIQUE
GOLD is an International committee of experts who compile the report based on scientific literature review. NICE is an independent organization funded by Department of Health and Social Care in the United Kingdom responsible for evidence-based guidance on healthcare determined by an expert committee through scientific review and a transparent process that details committee formation and framework (GRADE) used and stakeholder input. While both guidelines review current publications, practice-influencing clinical trials of recent publication may be missed.
On the GOLD Science committee, 17/20 members have pharmaceutical relationships, with no mitigation plan provided. The NICE guidelines detail a panel with few industry ties and a mitigation plan for potential conflicts of interest.
These recommendations comprehensively cover outpatient and inpatient COPD management. The GOLD and NICE guidelines are similar with the exception of recommendations surrounding use of oxygen. The NICE guidelines, based on the adverse events documented in the recent Long-Term Oxygen Treatment Trial,6 recommend against oxygen use by patients who smoke because of the risk of fire-related injuries;7 GOLD guidelines do not differentiate oxygen recommendation by patient population.
Differences in the strength of NICE and GOLD recommendations highlight areas for further study. Investigations determining distinct COPD phenotypes will likely influence future guidelines. More discriminative multidimensional prognostication tools are needed to improve precision surrounding prognosis.
1. NICE. Overview. Chronic obstructive pulmonary disease in over 16s: Diagnosis and management, Guidance. https://www.nice.org.uk/guidance/ng115. Accessed November 21, 2019
2. GOLD Reports for Personal Use. Global Initiative for Chronic Obstructive Lung Disease - GOLD. https://goldcopd.org/gold-reports/. Accessed September 17, 2019.
3. Lozano R, Naghavi M, Foreman K, et al. Global and regional mortality from 235 causes of death for 20 age groups in 1990 and 2010: A systematic analysis for the Global Burden of Disease Study 2010. Lancet. 2012;380(9859):2095-128. https://doi.org/10.1016/S0140-6736(12)61728-0.
4. Suissa S, Dell’Aniello S, Ernst P. Long-term natural history of chronic obstructive pulmonary disease: Severe exacerbations and mortality. Thorax. 2012;67(11):957-63. https://doi.org/10.1136/thoraxjnl-2011-201518.
5. Quanjer PH, Stanojevic S, Cole TJ, et al. Multi-ethnic reference values for spirometry for the 3–95-yr age range: The global lung function 2012 equations. Eur Respir J. 2012;40(6):1324-43. https://doi.org/10.1183/09031936.00080312.
6. Albert RK, Au DH, Blackford AL, et al. Long-term oxygen treatment trial research group. A randomized trial of long-term oxygen for COPD with moderate desaturation. N Engl J Med. 2016;375(17):1617-27. https://doi.org/10.1056/NEJMoa1604344.
7. National Institute for Health and Care Excellence. Chronic obstructive pulmonary disease in over 16s: diagnosis and management [B} Oxygen therapy in people with stable COPD. https://www.nice.org.uk/guidance/ng115/evidence/b-oxygen-therapy-in-people-with-stable-copd-pdf-6602768751. Accessed November 21, 2019.
© 2020 Society of Hospital Medicine
Hahnemann’s Closure as a Lesson in Private Equity Healthcare
The recent closure of Hahnemann University Hospital, a 500-bed teaching hospital in downtown Philadelphia, Pennsylvania, offers a case study of a new form of for-profit business involvement in academic medicine —private equity investment. Though the closure of this 171-year-old institution is the result of multiple factors affecting the hospital’s financial health over decades and may not have been avoidable, the hospital’s final years in the hands of a private equity firm led to a closure process that was chaotic, uncoordinated, and fundamentally not aligned with the needs of the patients and trainees that make up the core constituent
Tracing the hospital’s history, much of its financial troubles began over 20 years ago. In 1993, the Allegheny Health, Education, and Research Foundation (AHERF), a nonprofit Pittsburgh-based hospital and physician practice organization, acquired Hahnemann Medical College. Forming the MCP-Hahnemann Medical School, AHERF merged the institution with another acquisition, Medical College of Pennsylvania (MCP),1 formerly known as the Woman’s Medical College of Pennsylvania, one of the first American medical schools devoted to exclusively training female physicians.1,2 This was part of AHERF’s aggressive growth strategy at the time and resulted in the acquisition of 14 hospitals and more than 300 Philadelphia-area primary care physician practices by 1998. This caused about $1.3 billion of debt and over $1 million in losses per day, which led AHERF to file for bankruptcy that year,2 the country’s largest nonprofit healthcare bankruptcy at the time.1 That same year, Tenet Healthcare Corporation, a for-profit healthcare company, bought AHERF’s assets in the Philadelphia region from bankruptcy for $345 million, acquiring eight hospitals, as well as all of AHREF’s physician practices.2 Ultimately, Tenet sold or closed six of the acquired hospitals by 2007, leaving just Hahnemann and St. Christopher’s Hospital for Children,3 while Drexel University, a private, nonprofit university, came forward to salvage AHERF’s educational programs, creating the Drexel University College of Medicine.2 Under the ownership of Tenet, Hahnemann’s financial health declined as its patient population included a growing proportion of those utilizing Medicare, Medicaid, and charity care, which resulted in a negative operating profit margin annually for the final 14 years under Tenet.3,4 In this setting, American Academic Health System, LLC (AAHS) stepped in to purchase Hahnemann and St. Christopher’s from Tenet and, eventually, chose to close Hahnemann.4
That Hahnemann found itself in the hands of a private equity firm was not surprising. Such investment firms’ acquisitions of hospitals and physician practices have become increasingly more common, with the number of these types of deals increasing by 48% and reaching a value of $42.6 billion from 2010 to 2017.5 While for-profit hospitals have been shown to have higher mortality6 and lower patient satisfaction7 than nonprofit hospitals, the relatively new and growing trend of private equity investment in healthcare has not been rigorously evaluated. By nature, these firms use investor capital to acquire assets with the goal of increasing their value and selling them off at a profit after about 3-7 years.5 Thus, healthcare services provided by private equity–owned facilities are valued and supported based on their profitability. Low-profit services, such as primary care and psychiatry, are minimized while more profitable services, such as same-day surgery, are maximized.5 In addition, given that for-profit hospitals tend to invest less in charity care8 and population health9 as compared with nonprofit institutions, private equity–owned hospitals likely follow suit, in contrast to the humanistic values of academic medicine. Ultimately, Hahnemann’s decades-long financial troubles set the stage for a buyout by private equity investors. But this transaction was the death knell for this teaching hospital and eventually proved to be a disadvantage for the community it served.
Purchasing Hahnemann and St Christopher’s from Tenet in early 2018 for $170 million, AAHS—an affiliate of the private equity firm, Paladin Healthcare Capital, LLC, led by investment banker Joel Freedman—entered the Philadelphia healthcare market in partnership with Chicago-based healthcare real estate private equity firm, Harrison Street Real Estate Capital, LLC.4 Paladin had previously invested in smaller hospitals serving underserved communities,4 and as it began its venture with this large teaching hospital, Paladin’s president, Barry Wolfman, stated that the company’s goal was “to return [Hahnemann] to its rightful place in the landscape of healthcare.”3 However, given the real estate firm’s involvement in the deal and the permissive tier of zoning for Hahnemann’s real estate,10 there were suspicions that the purchase of the hospital was a means to acquire and develop the valuable Center City real estate rather than to serve the community.3
Within months of the hospital purchase, AAHS‘s Philadelphia venture proved difficult. Four CEOs came and went as time passed, with some holding their position for only a couple of months.11 About 175 of Hahnemann’s nurses, support staff, and managers were laid off in April of 2019, but the hospital finances did not improve significantly.12 As it became evident that AAHS planned to close the hospital, efforts were made to prevent the closure. Drexel University filed an unsuccessful lawsuit, claiming that it would be a violation of the academic agreement between the university and hospital.13 Once AAHS announced plans for hospital closure, the Pennsylvania Secretary of Health, Rachel Levine, MD, wrote to AAHS leadership ordering a “cease and desist” of any action toward hospital closure.12 Despite this, AAHS began cutting vital hospital services, including trauma and cardiothoracic surgery services, within days of the closure announcement.14 While there is a state law that a hospital cannot be closed with less than 90 days’ notice, AAHS filed for bankruptcy and shut down Hahnemann’s service to the community in about half that time.13 The hospital real estate was separated from the operating businesses and was excluded from the bankruptcy filing,10 which further cemented suspicions that the involved private equity firms looked to profit off the land once the hospital closed.
The immediate and long-term effects of the closure of Hahnemann University Hospital on healthcare and medical education in Philadelphia are yet to be rigorously measured and evaluated. However, the hasty closure of a large inner-city teaching hospital that served as a healthcare safety net for a largely underserved minority population with 50,000 ED visits per year4 is a dangerous disruption to a community. The way that the hospital was closed not only defied regulatory attempts at protecting the community but also defied the values of the healthcare workers working in the hospital. Because AAHS ceased payments to hospital vendors, medical supplies were low during the final weeks at Hahnemann, which didn’t even have enough cups on the wards to provide drinking water for patients.15 Nurses reported feeling shame as they used scissors to cut wash cloths in half to have enough to wash their patients.15 The teaching hospital’s humanistic and social capital was being liquidated quickly. Even after Hahnemann’s 570 graduate medical trainees endured the stressful and chaotic process of being displaced and fortunately taken in by other programs,16 AAHS attempted to auction off Hahnemann’s graduate medical education (GME) slots and their associated government funding to the highest bidder. While a US bankruptcy judge initially approved the sale of those GME slots to a consortium of academic institutions in the Philadelphia area,17 the Center for Medicare & Medicaid Services (CMS) has appealed that decision, which resulted in a current stay on the transaction.17 AAHS treating GME trainee positions as assets to be bought and sold is a dangerous precedent to set, especially since it attempts to bypass CMS’s existing regulated process for redistributing the slots.
While time will reveal the effects of the hospital closure, the most concerning element of this story is that the methods of a private equity firm in closing a large inner-city teaching hospital flouted attempts by regulatory agencies acting to preserve the hospital’s mission to the community. The governor of Pennsylvania, Tom Wolf (D), and mayor of Philadelphia, Jim Kenney (D), issued a joint statement chastising the actions of AAHS: “The situation at Hahnemann University Hospital, caused by CEO Joel Freedman and his team of venture capitalists, is an absolute disgrace and shows a greed-driven lack of care for the community.”18 This chaotic situation inspired Philadelphia Councilperson Helen Gym (D) to propose city legislation requiring 180 days’ notice of a hospital closure, bestowing a strong local means of protecting the city’s people from similar healthcare fiascos in the future.15
At its core, healthcare is a human-to-human interaction with the purpose of improving and maintaining the health and life of the patient. Adding to that the noble efforts in educating students and trainees to provide that public good, academic medicine is a virtuous endeavor. The new and growing phenomenon of private equity in healthcare prioritizes maximizing a return on investment, so the closure of Hahnemann University Hospital in Philadelphia highlights manifestations of the discordance of the missions of private equity and academic medicine and serves as “the canary in the coal mine,” warning teaching hospitals and communities that this disconnect necessitates regulatory policies to protect academic medicine’s service to the community while private equity investment continues to spread in healthcare.
1. Burling, S. Hahnemann University Hospital: 171 years of Philadelphia medical history. The Philadelphia Inquirer. https://www.inquirer.com/health/hahnemann-university-hospital-timeline-history-20190821.html. August 21, 2019. Accessed October 10, 2019.
2. Klasko S and Ekarius J. Collision course: The privatization of graduate medical education at one university. Acad Med. 2007;82(3):238-244. https://doi.org/10.1097/ACM.0b013e3180305fb1.
3. Brubaker H. Tenet will leave Philly, selling Hahnemann, St. Christopher’s to Paladin. The Philadelphia Inquirer. https://www.inquirer.com/philly/business/tenet-leaves-philly-selling-hahnemann-st-christophers-to-paladin-20170901.html. September 1, 2017. Accessed October 10, 2019.
4. Brubaker H. This California banker bet on turning around Philly’s Hahnemann Hospital. He’s running out of time. The Philadelphia Inquirer. https://www.inquirer.com/business/hahnemann-turnaround-closure-california-banker-joel-freedman-20190408.html. April 8, 2019. Accessed October 10, 2019.
5. Gondi S and Song Z. Potential implications of private equity investments in health care delivery. JAMA. 2019;321(11):1047-1048. https://doi.org/10.1001/jama.2019.1077.
6. Devereaux PJ, Choi PT, Lacchetti C, et al. A systematic review and meta-analysis of studies comparing mortality rates of private for-profit and private not-for-profit hospitals. CMAJ. 2002;166(11):1399-1406.
7. Mazurenko O, Collum T, Ferdinand A, and Menachemi N. Predictors of hospital patient satisfaction as measured by HCAHPS: A systematic review. J of Healthc Manag. 2017;62(4):272-283. https://doi.org/10.1097/JHM-D-15-00050.
8. Valdovinos E, Le S, Hsia RY. In California, not-for-profit hospitals spent more operating expenses on charity care than for-profit hospitals spent. Health Affairs. 2015;34(8):1296-1303. https://doi.org/10.1377/hlthaff.2014.1208.
9. Gabriel MH, Atkins D, Liu X, Tregerman R. Examining the relationship between hospital ownership and population health efforts. J Health Organ Manag. 2018 Nov 19;32(8):934-942. https://doi.org/10.1108/JHOM-02-2018-0042.
10. Feldman N. Hospital union wants city to rezone Hahnemann property so it can’t be flipped. WHYY.org. https://whyy.org/articles/hospital-union-wants-city-to-rezone-hahnemann-property-so-it-cant-be-flipped/. August 2, 2019. Accessed October 10, 2019.
11. Brubaker H. New CEO fired at Hahnemann and St. Christopher’s Hospital for Children, two months into the job. The Philadelphia Inquirer. https://www.inquirer.com/business/hahnemann-st-christophers-hospital-ceo-turnover-20190308.html. March 8, 2019. Accessed October 10, 2019.
12. Rush M. Hahnemann University Hospital’s inner turmoil: A timeline of changes, layoffs, and closing. The Philadelphia Inquirer. https://www.inquirer.com/business/health/hahnemann-university-hospital-closing-timeline-20190626.html. July 1, 2019. Accessed October 10, 2019.
13. Brubaker H. Drexel sues to block threatened closure of Hahnemann University Hospital. The Philadelphia Inquirer. https://www.inquirer.com/business/hahnemann-hospital-drexel-freedman-closure-20190624.html. June 24, 2019. Accessed October 10, 2019.
14. Fernandez B, Dunn C. Hahnemann officially closes emergency room to critically ill. Nurses’ union says the hospital lacks basic supplies. The Philadelphia Inquirer. https://www.inquirer.com/news/hahnemann-hospital-emergency-room-closing-turmoil-20190629.html. June 29, 2019. Accessed October 10, 2019.
15. Bate D. Bill to prevent sudden hospital closures (like Hahnemann) moves along in City Council. WHYY.org. https://whyy.org/articles/bill-to-prevent-sudden-hospital-closures-like-hahnemann-moves-along-in-city-council/. November 20, 2019. Accessed October 10, 2019.
16. Aizenberg DJ and Logio LS. The Graduate Medical Education (GME) gold rush: GME slots and funding as a financial asset. Acad Med. 2019. https://doi.org/10.1097/ACM.0000000000003133.
17. Feldman N. Judge puts freeze on sale of Hahnemann residency program – for now. WHYY.org. https://whyy.org/articles/judge-puts-freeze-on-sale-of-hahnemann-residency-program-for-now/. September 16, 2019. Accessed October 11, 2019.
18. Pennsylvania Governor’s Office Press Release: Governor Wolf, Mayor Kenney Joint Statement on Hahnemann University Hospital. https://www.governor.pa.gov/newsroom/governor-wolf-mayor-kenney-joint-statement-on-hahnemann-university-hospital. July 11, 2019. Accessed October 18, 2019.
The recent closure of Hahnemann University Hospital, a 500-bed teaching hospital in downtown Philadelphia, Pennsylvania, offers a case study of a new form of for-profit business involvement in academic medicine —private equity investment. Though the closure of this 171-year-old institution is the result of multiple factors affecting the hospital’s financial health over decades and may not have been avoidable, the hospital’s final years in the hands of a private equity firm led to a closure process that was chaotic, uncoordinated, and fundamentally not aligned with the needs of the patients and trainees that make up the core constituent
Tracing the hospital’s history, much of its financial troubles began over 20 years ago. In 1993, the Allegheny Health, Education, and Research Foundation (AHERF), a nonprofit Pittsburgh-based hospital and physician practice organization, acquired Hahnemann Medical College. Forming the MCP-Hahnemann Medical School, AHERF merged the institution with another acquisition, Medical College of Pennsylvania (MCP),1 formerly known as the Woman’s Medical College of Pennsylvania, one of the first American medical schools devoted to exclusively training female physicians.1,2 This was part of AHERF’s aggressive growth strategy at the time and resulted in the acquisition of 14 hospitals and more than 300 Philadelphia-area primary care physician practices by 1998. This caused about $1.3 billion of debt and over $1 million in losses per day, which led AHERF to file for bankruptcy that year,2 the country’s largest nonprofit healthcare bankruptcy at the time.1 That same year, Tenet Healthcare Corporation, a for-profit healthcare company, bought AHERF’s assets in the Philadelphia region from bankruptcy for $345 million, acquiring eight hospitals, as well as all of AHREF’s physician practices.2 Ultimately, Tenet sold or closed six of the acquired hospitals by 2007, leaving just Hahnemann and St. Christopher’s Hospital for Children,3 while Drexel University, a private, nonprofit university, came forward to salvage AHERF’s educational programs, creating the Drexel University College of Medicine.2 Under the ownership of Tenet, Hahnemann’s financial health declined as its patient population included a growing proportion of those utilizing Medicare, Medicaid, and charity care, which resulted in a negative operating profit margin annually for the final 14 years under Tenet.3,4 In this setting, American Academic Health System, LLC (AAHS) stepped in to purchase Hahnemann and St. Christopher’s from Tenet and, eventually, chose to close Hahnemann.4
That Hahnemann found itself in the hands of a private equity firm was not surprising. Such investment firms’ acquisitions of hospitals and physician practices have become increasingly more common, with the number of these types of deals increasing by 48% and reaching a value of $42.6 billion from 2010 to 2017.5 While for-profit hospitals have been shown to have higher mortality6 and lower patient satisfaction7 than nonprofit hospitals, the relatively new and growing trend of private equity investment in healthcare has not been rigorously evaluated. By nature, these firms use investor capital to acquire assets with the goal of increasing their value and selling them off at a profit after about 3-7 years.5 Thus, healthcare services provided by private equity–owned facilities are valued and supported based on their profitability. Low-profit services, such as primary care and psychiatry, are minimized while more profitable services, such as same-day surgery, are maximized.5 In addition, given that for-profit hospitals tend to invest less in charity care8 and population health9 as compared with nonprofit institutions, private equity–owned hospitals likely follow suit, in contrast to the humanistic values of academic medicine. Ultimately, Hahnemann’s decades-long financial troubles set the stage for a buyout by private equity investors. But this transaction was the death knell for this teaching hospital and eventually proved to be a disadvantage for the community it served.
Purchasing Hahnemann and St Christopher’s from Tenet in early 2018 for $170 million, AAHS—an affiliate of the private equity firm, Paladin Healthcare Capital, LLC, led by investment banker Joel Freedman—entered the Philadelphia healthcare market in partnership with Chicago-based healthcare real estate private equity firm, Harrison Street Real Estate Capital, LLC.4 Paladin had previously invested in smaller hospitals serving underserved communities,4 and as it began its venture with this large teaching hospital, Paladin’s president, Barry Wolfman, stated that the company’s goal was “to return [Hahnemann] to its rightful place in the landscape of healthcare.”3 However, given the real estate firm’s involvement in the deal and the permissive tier of zoning for Hahnemann’s real estate,10 there were suspicions that the purchase of the hospital was a means to acquire and develop the valuable Center City real estate rather than to serve the community.3
Within months of the hospital purchase, AAHS‘s Philadelphia venture proved difficult. Four CEOs came and went as time passed, with some holding their position for only a couple of months.11 About 175 of Hahnemann’s nurses, support staff, and managers were laid off in April of 2019, but the hospital finances did not improve significantly.12 As it became evident that AAHS planned to close the hospital, efforts were made to prevent the closure. Drexel University filed an unsuccessful lawsuit, claiming that it would be a violation of the academic agreement between the university and hospital.13 Once AAHS announced plans for hospital closure, the Pennsylvania Secretary of Health, Rachel Levine, MD, wrote to AAHS leadership ordering a “cease and desist” of any action toward hospital closure.12 Despite this, AAHS began cutting vital hospital services, including trauma and cardiothoracic surgery services, within days of the closure announcement.14 While there is a state law that a hospital cannot be closed with less than 90 days’ notice, AAHS filed for bankruptcy and shut down Hahnemann’s service to the community in about half that time.13 The hospital real estate was separated from the operating businesses and was excluded from the bankruptcy filing,10 which further cemented suspicions that the involved private equity firms looked to profit off the land once the hospital closed.
The immediate and long-term effects of the closure of Hahnemann University Hospital on healthcare and medical education in Philadelphia are yet to be rigorously measured and evaluated. However, the hasty closure of a large inner-city teaching hospital that served as a healthcare safety net for a largely underserved minority population with 50,000 ED visits per year4 is a dangerous disruption to a community. The way that the hospital was closed not only defied regulatory attempts at protecting the community but also defied the values of the healthcare workers working in the hospital. Because AAHS ceased payments to hospital vendors, medical supplies were low during the final weeks at Hahnemann, which didn’t even have enough cups on the wards to provide drinking water for patients.15 Nurses reported feeling shame as they used scissors to cut wash cloths in half to have enough to wash their patients.15 The teaching hospital’s humanistic and social capital was being liquidated quickly. Even after Hahnemann’s 570 graduate medical trainees endured the stressful and chaotic process of being displaced and fortunately taken in by other programs,16 AAHS attempted to auction off Hahnemann’s graduate medical education (GME) slots and their associated government funding to the highest bidder. While a US bankruptcy judge initially approved the sale of those GME slots to a consortium of academic institutions in the Philadelphia area,17 the Center for Medicare & Medicaid Services (CMS) has appealed that decision, which resulted in a current stay on the transaction.17 AAHS treating GME trainee positions as assets to be bought and sold is a dangerous precedent to set, especially since it attempts to bypass CMS’s existing regulated process for redistributing the slots.
While time will reveal the effects of the hospital closure, the most concerning element of this story is that the methods of a private equity firm in closing a large inner-city teaching hospital flouted attempts by regulatory agencies acting to preserve the hospital’s mission to the community. The governor of Pennsylvania, Tom Wolf (D), and mayor of Philadelphia, Jim Kenney (D), issued a joint statement chastising the actions of AAHS: “The situation at Hahnemann University Hospital, caused by CEO Joel Freedman and his team of venture capitalists, is an absolute disgrace and shows a greed-driven lack of care for the community.”18 This chaotic situation inspired Philadelphia Councilperson Helen Gym (D) to propose city legislation requiring 180 days’ notice of a hospital closure, bestowing a strong local means of protecting the city’s people from similar healthcare fiascos in the future.15
At its core, healthcare is a human-to-human interaction with the purpose of improving and maintaining the health and life of the patient. Adding to that the noble efforts in educating students and trainees to provide that public good, academic medicine is a virtuous endeavor. The new and growing phenomenon of private equity in healthcare prioritizes maximizing a return on investment, so the closure of Hahnemann University Hospital in Philadelphia highlights manifestations of the discordance of the missions of private equity and academic medicine and serves as “the canary in the coal mine,” warning teaching hospitals and communities that this disconnect necessitates regulatory policies to protect academic medicine’s service to the community while private equity investment continues to spread in healthcare.
1. Burling, S. Hahnemann University Hospital: 171 years of Philadelphia medical history. The Philadelphia Inquirer. https://www.inquirer.com/health/hahnemann-university-hospital-timeline-history-20190821.html. August 21, 2019. Accessed October 10, 2019.
2. Klasko S and Ekarius J. Collision course: The privatization of graduate medical education at one university. Acad Med. 2007;82(3):238-244. https://doi.org/10.1097/ACM.0b013e3180305fb1.
3. Brubaker H. Tenet will leave Philly, selling Hahnemann, St. Christopher’s to Paladin. The Philadelphia Inquirer. https://www.inquirer.com/philly/business/tenet-leaves-philly-selling-hahnemann-st-christophers-to-paladin-20170901.html. September 1, 2017. Accessed October 10, 2019.
4. Brubaker H. This California banker bet on turning around Philly’s Hahnemann Hospital. He’s running out of time. The Philadelphia Inquirer. https://www.inquirer.com/business/hahnemann-turnaround-closure-california-banker-joel-freedman-20190408.html. April 8, 2019. Accessed October 10, 2019.
5. Gondi S and Song Z. Potential implications of private equity investments in health care delivery. JAMA. 2019;321(11):1047-1048. https://doi.org/10.1001/jama.2019.1077.
6. Devereaux PJ, Choi PT, Lacchetti C, et al. A systematic review and meta-analysis of studies comparing mortality rates of private for-profit and private not-for-profit hospitals. CMAJ. 2002;166(11):1399-1406.
7. Mazurenko O, Collum T, Ferdinand A, and Menachemi N. Predictors of hospital patient satisfaction as measured by HCAHPS: A systematic review. J of Healthc Manag. 2017;62(4):272-283. https://doi.org/10.1097/JHM-D-15-00050.
8. Valdovinos E, Le S, Hsia RY. In California, not-for-profit hospitals spent more operating expenses on charity care than for-profit hospitals spent. Health Affairs. 2015;34(8):1296-1303. https://doi.org/10.1377/hlthaff.2014.1208.
9. Gabriel MH, Atkins D, Liu X, Tregerman R. Examining the relationship between hospital ownership and population health efforts. J Health Organ Manag. 2018 Nov 19;32(8):934-942. https://doi.org/10.1108/JHOM-02-2018-0042.
10. Feldman N. Hospital union wants city to rezone Hahnemann property so it can’t be flipped. WHYY.org. https://whyy.org/articles/hospital-union-wants-city-to-rezone-hahnemann-property-so-it-cant-be-flipped/. August 2, 2019. Accessed October 10, 2019.
11. Brubaker H. New CEO fired at Hahnemann and St. Christopher’s Hospital for Children, two months into the job. The Philadelphia Inquirer. https://www.inquirer.com/business/hahnemann-st-christophers-hospital-ceo-turnover-20190308.html. March 8, 2019. Accessed October 10, 2019.
12. Rush M. Hahnemann University Hospital’s inner turmoil: A timeline of changes, layoffs, and closing. The Philadelphia Inquirer. https://www.inquirer.com/business/health/hahnemann-university-hospital-closing-timeline-20190626.html. July 1, 2019. Accessed October 10, 2019.
13. Brubaker H. Drexel sues to block threatened closure of Hahnemann University Hospital. The Philadelphia Inquirer. https://www.inquirer.com/business/hahnemann-hospital-drexel-freedman-closure-20190624.html. June 24, 2019. Accessed October 10, 2019.
14. Fernandez B, Dunn C. Hahnemann officially closes emergency room to critically ill. Nurses’ union says the hospital lacks basic supplies. The Philadelphia Inquirer. https://www.inquirer.com/news/hahnemann-hospital-emergency-room-closing-turmoil-20190629.html. June 29, 2019. Accessed October 10, 2019.
15. Bate D. Bill to prevent sudden hospital closures (like Hahnemann) moves along in City Council. WHYY.org. https://whyy.org/articles/bill-to-prevent-sudden-hospital-closures-like-hahnemann-moves-along-in-city-council/. November 20, 2019. Accessed October 10, 2019.
16. Aizenberg DJ and Logio LS. The Graduate Medical Education (GME) gold rush: GME slots and funding as a financial asset. Acad Med. 2019. https://doi.org/10.1097/ACM.0000000000003133.
17. Feldman N. Judge puts freeze on sale of Hahnemann residency program – for now. WHYY.org. https://whyy.org/articles/judge-puts-freeze-on-sale-of-hahnemann-residency-program-for-now/. September 16, 2019. Accessed October 11, 2019.
18. Pennsylvania Governor’s Office Press Release: Governor Wolf, Mayor Kenney Joint Statement on Hahnemann University Hospital. https://www.governor.pa.gov/newsroom/governor-wolf-mayor-kenney-joint-statement-on-hahnemann-university-hospital. July 11, 2019. Accessed October 18, 2019.
© 2020 Society of Hospital Medicine
Clinical Progress Note: Care of Children Hospitalized for Acute Asthma Exacerbation
Since the last National Heart, Lung, and Blood Institute’s (NHLBI) guidelines that were released in 2007, additional evidence has emerged in several areas of asthma care.1 To provide a concise clinical update relevant to the practice of pediatric hospital medicine, we searched PubMed for asthma publications in the last 10 years with a particular focus on articles published in the last 5 years. We used a validated pediatric search filter to identify pediatric studies, MeSH term for “Asthma,” and the following terms: “Clinical Pathways,” “Clinical Protocols,” “Dexamethasone,” and “Albuterol.” From these articles, we identified three areas of emerging evidence supporting practice change relative to the inpatient care of children with asthma, which are summarized in this brief review. This clinical practice update covers the emerging evidence supporting dexamethasone use for acute asthma exacerbations, the shift away from nebulized albuterol toward metered dose inhaler (MDI) albuterol, and the utility of asthma clinical pathways.
DEXAMETHASONE VS PREDNISONE FOR ACUTE ASTHMA EXACERBATIONS
In the last decade, emergency departments (EDs) have increasingly prescribed dexamethasone over prednisone because it is noninferior and has a superior side-effect profile, including less vomiting.2 However, the evidence for dexamethasone use in hospitalized children lagged behind ED practice change. This led to uncertainty among pediatric hospitalists regarding the most appropriate oral steroid to use, particularly for children who received dexamethasone in the ED prior to admission.3
Several studies have been published to address this gap in the literature. In 2015 Parikh et al. published a multicenter retrospective cohort study of dexamethasone vs prednisone among hospitalized children using the Pediatric Health Information Systems (PHIS) database. 4 The authors compared 1,166 patients who received dexamethasone only with a propensity-matched cohort of 1,284 patients receiving only prednisone/prednisolone. Outcomes included the proportion with a length of stay (LOS) greater than 3 days, all-cause readmission at 7 and 30 days, and cost of admission. A greater proportion of patients receiving prednisone/prednisolone had a LOS greater than 3 days when compared with those in the dexamethasone cohort. There were no significant differences in all cause 7- or 30-day readmission. The dexamethasone cohort had statistically significantly lower costs. The authors concluded that dexamethasone may be a viable alternative to prednisone/prednisolone for children admitted for acute asthma exacerbation not requiring admission to the pediatric intensive care unit (PICU).
In 2019, Tyler et al. published a single-center, retrospective, cohort study that used interrupted time series analysis to evaluate outcomes for inpatients with asthma before and after an ED’s protocol was changed to dexamethasone.5 Outcomes analyzed included LOS, hospital charges, and PICU transfer rates. The study included 1,015 subjects over a 36-month period. In the post–protocol change group, 65% of the subjects received dexamethasone only while 28% received a combination of dexamethasone and prednisone/prednisolone. The authors found no immediate significant differences in LOS, ICU transfers, or charges after the protocol change. However, they did see an overall 10% increased rate of PICU transfers in the period following the protocol change, a trend that could have been caused by difficult-to-measure differences in severity of patients before and after the protocol change. If the increase in PICU transfer rate was temporally associated with the ED protocol change, an immediate change in rate would be expected, and this was not seen. The authors speculated that dexamethasone may be inferior to prednisone for inpatients with the highest severity of asthma.
Combined with the practical benefit of dexamethasone’s shorter treatment course and decreased vomiting,2 these two studies support the use of dexamethasone in the inpatient setting for patients who don’t require ICU level care. A feasibility trial to determine noninferiority of dexamethasone vs prednisone is currently enrolling, according to clinicaltrials.gov.
NEBULIZED VS METERED-DOSE INHALER ALBUTEROL FOR ACUTE ASTHMA EXACERBATIONS
The 2007 NHLBI guidelines are clear that short-acting beta-2 agonists (SABA), delivered via nebulization or metered-dose inhaler (MDI) with a valved holding chamber (VHC), along with systemic steroids, should be the primary treatment in pediatric acute asthma exacerbations.1 The guidelines caution that nebulization therapy might be needed for patients who are ineffective in using MDIs because of age, level of agitation, or severity of asthma symptoms. Specific recommendations for management in the inpatient setting are brief but note that inpatient medication administration and care should mirror ED management strategies.1 Specific in-hospital management recommendations regarding nebulization vs MDI are not addressed.
A Cochrane Review by Cates et al. assessed pediatric and adult randomized trials comparing SABA delivery via MDI-VHC with that via nebulization.6 The analysis included 39 trials with a total of 729 adults and 1,897 children. Six of the included trials were conducted in an inpatient setting (207 enrolled children in these studies). The authors found that mechanism of SABA delivery did not affect ED admission rates or significantly influence other markers of treatment response (peak flow and forced expiratory volumes). In children, MDI-VHC use was associated with shorter ED length of stay, as well as a decreased frequency of common SABA side effects (ie, tachycardia and tremor). This review cites several areas in which research is needed, including MDI use in severe asthma exacerbations. This population often falls outside pediatric hospitalists’ scope of practice because these patients often require ICU-level care.
A recent systematic review of pediatric acute asthma management strategies by Castro-Rodriguez et al. found that using MDI-VHC to deliver SABA was superior to using nebulization as measured by decreased ED admission rates and ED length of stay, improved asthma clinical scores, and reduced SABA side effects.7 A 2016 prospective randomized trial of MDI-VHC vs nebulization in preschool-aged children presenting to an ED with asthma or virally mediated wheeze found that the SABA delivered via MDI-VHC was at least as effective as that delivered via nebulization.8
International asthma management guidelines more strongly recommend MDI-only treatment for pediatric patients admitted with moderate asthma.9 Despite this guidance, and the literature supporting transition in inpatient settings to bronchodilator administration via MDI, there are several barriers to exclusive MDI use in the inpatient setting. As mentioned by Cates et al., a recognized challenge in MDI-VHC adoption is overcoming the “nebulizer culture” in treating pediatric acute asthma symptoms.6 Perhaps not surprisingly, Press et al., in a retrospective secondary analysis of 25 institutions managing adults and children with acute asthma symptoms, found that 32% of all pediatric patients assessed received only nebulized SABA treatments during their hospitalization.10 Transitioning from nebulized albuterol to exclusively MDI-VHC albuterol will require significant systems changes.
UTILITY OF CLINICAL PATHWAYS
Clinical pathways operationalize practice guidelines and provide guidance on the treatments, testing, and management of an illness. Use of pediatric asthma pathways has increased steadily in the past decade, with one study of over 300 hospitals finding that, between 2005 to 2015, pathway implementation increased from 27% to 86%.11 This expanded use has coincided with a proliferation of publications evaluating the effects of these pathways. A systematic review examining the implementation and impact of asthma protocols identified over 100 articles published between 1986 and 2010, with the majority published after 2005.12 The study found implementation of guidelines through an asthma pathway generally improved patient care and provider performance regardless of implementation method.
Since that review, Kaiser et al. investigated the effects of pathway implementation at 42 children’s hospitals.13 They used interrupted time series to determine the effect of pathway implementation on LOS. Secondary outcomes included cost, use of bronchodilators, antibiotic use, and 30-day readmissions. This study found pathway implementation was associated with an 8.8% decrease in LOS and 3% decrease in hospital costs while increasing bronchodilator administration and decreasing antibiotic exposure. To determine the factors that allowed successful implementation of asthma pathways (as determined by reduction in LOS), Kaiser et al. performed qualitative interviews of key stakeholders at high- and low-performing hospitals.14 The most successful hospitals all used rigorous data-driven quality-improvement methodologies, set shared goals with key stakeholders, integrated the pathway into their electronic medical record, allowed nurses and respiratory therapists to titrate albuterol frequency, and engaged hospital leadership to secure needed resources.
Although in each of these studies, pathway implementation led to improvements in the acute management of patients, there was no reduction in pediatric asthma readmissions at 30 days.12,13 A meta-analysis of asthma-related quality improvement interventions also did not find an association between pathway implementation alone and decreased readmissions or ED revisits.15 The lack of improvement in these metrics may have been caused by the tendency for pathways to focus on the acute asthma management and lack of focus on chronic asthma severity. Asthma admissions are an opportunity for full evaluation of disease severity, allergen exposures, and education on medication and spacer technique. Refinement of pathways with a focus on chronic control and on transition from hospital to home may move the needle on decreasing the long-term morbidity of pediatric asthma.
CONCLUSION
Current evidence suggests pediatric hospitalists should consider transitioning from prednisolone/prednisone to dexamethasone and from nebulized albuterol delivery to MDI albuterol delivery for children admitted for acute asthma exacerbation who do not require ICU-level care. Implementing asthma clinical pathways that use rigorous quality improvement methods is an effective approach to adopt these and other evidence-based practice changes.
Disclosures
The authors have nothing to disclose.
1. National Asthma E, Prevention P. Expert Panel Report 3 (EPR-3): Guidelines for the Diagnosis and Management of Asthma–Summary Report 2007. J Allergy Clin Immunol. 2007;120(5 Suppl):S94-S138. https://doi.org/10.1016/j.jaci.2007.09.029.
2. Keeney GE, Gray MP, Morrison AK, et al. Dexamethasone for acute asthma exacerbations in children: a meta-analysis. Pediatrics. 2014;133(3):493-499. https://doi.org/10.1542/peds.2013-2273.
3. Cotter JM, Tyler A, Reese J, et al. Steroid variability in pediatric inpatient asthmatics: Survey on provider preferences of dexamethasone versus prednisone. J Asthma. 2019:1-7. https://doi.org/10.1080/02770903.2019.1622713.
4. Parikh K, Hall M, Mittal V, et al. Comparative effectiveness of dexamethasone versus prednisone in children hospitalized with asthma. J Pediatr. 2015;167(3):639-644.e1. https://doi.org/10.1016/j.jpeds.2015.06.038.
5. Tyler A, Cotter JM, Moss A, et al. Outcomes for pediatric asthmatic inpatients after implementation of an emergency department dexamethasone treatment protocol. Hosp Pediatr. 2019;9(2):92-99. https://doi.org/10.1542/hpeds.2018-0099.
6. Cates CJ, Welsh EJ, Rowe BH. Holding chambers (spacers) versus nebulisers for beta-agonist treatment of acute asthma. Cochrane Database Syst Rev. 2013;(9):CD000052. https://doi.org/10.1002/14651858.CD000052.pub3.
7. Castro-Rodriguez JA, J Rodrigo G, E Rodriguea-Martinez C. Principal findings of systematic reviews of acute asthma treatment in childhood. J Asthma. 2015;52(10):1038-1045. https://doi.org/10.3109/02770903.2015.1033725.
8. Mitselou N, Hedlin G, Hederos CA. Spacers versus nebulizers in treatment of acute asthma - a prospective randomized study in preschool children. J Asthma. 2016;53(10):1059-1062. https://doi.org/10.1080/02770903.2016.1185114.
9. Global Initiative for Asthma. Global Strategy for Asthma Management and Prevention. https://www.ginasthma.org. Accessed December 10, 2019.
10. Press VG, Hasegawa K, Heidt J, Bittner JC, Camargo CA Jr. Missed opportunities to transition from nebulizers to inhalers during hospitalization for acute asthma: A multicenter observational study. J Asthma. 2017;54(9):968-976. https://doi.org/10.1080/02770903.2017.
11. Kaiser SV, Rodean J, Bekmezian A, et al. Rising utilization of inpatient pediatric asthma pathways. J Asthma. 2018;55(2):196-207. https://doi.org/ 10.1080/02770903.2017.1316392.
12. Dexheimer JW, Borycki EM, Chiu KW, Johnson KB, Aronsky D. A systematic review of the implementation and impact of asthma protocols. BMC Med Inform Decis Mak. 2014;14:82. https://doi.org/10.1186/1472-6947-14-82.
13. Kaiser SV, Rodean J, Bekmezian A, et al. effectiveness of pediatric asthma pathways for hospitalized children: A multicenter, national analysis. J Pediatr. 2018;197:165-171.e2. https://doi.org/10.1016/j.jpeds.2018.01.084.
14. Kaiser SV, Lam R, Cabana MD, et al. Best practices in implementing inpatient pediatric asthma pathways: a qualitative study. J Asthma. 2019:1-11. https://doi.org/10.1080/02770903.2019.1606237.
15. Parikh K, Keller S, Ralston S. Inpatient quality improvement interventions for asthma: A meta-analysis. Pediatrics. 2018;141(5). https://doi.org/10.1542/peds.2017-3334.
Since the last National Heart, Lung, and Blood Institute’s (NHLBI) guidelines that were released in 2007, additional evidence has emerged in several areas of asthma care.1 To provide a concise clinical update relevant to the practice of pediatric hospital medicine, we searched PubMed for asthma publications in the last 10 years with a particular focus on articles published in the last 5 years. We used a validated pediatric search filter to identify pediatric studies, MeSH term for “Asthma,” and the following terms: “Clinical Pathways,” “Clinical Protocols,” “Dexamethasone,” and “Albuterol.” From these articles, we identified three areas of emerging evidence supporting practice change relative to the inpatient care of children with asthma, which are summarized in this brief review. This clinical practice update covers the emerging evidence supporting dexamethasone use for acute asthma exacerbations, the shift away from nebulized albuterol toward metered dose inhaler (MDI) albuterol, and the utility of asthma clinical pathways.
DEXAMETHASONE VS PREDNISONE FOR ACUTE ASTHMA EXACERBATIONS
In the last decade, emergency departments (EDs) have increasingly prescribed dexamethasone over prednisone because it is noninferior and has a superior side-effect profile, including less vomiting.2 However, the evidence for dexamethasone use in hospitalized children lagged behind ED practice change. This led to uncertainty among pediatric hospitalists regarding the most appropriate oral steroid to use, particularly for children who received dexamethasone in the ED prior to admission.3
Several studies have been published to address this gap in the literature. In 2015 Parikh et al. published a multicenter retrospective cohort study of dexamethasone vs prednisone among hospitalized children using the Pediatric Health Information Systems (PHIS) database. 4 The authors compared 1,166 patients who received dexamethasone only with a propensity-matched cohort of 1,284 patients receiving only prednisone/prednisolone. Outcomes included the proportion with a length of stay (LOS) greater than 3 days, all-cause readmission at 7 and 30 days, and cost of admission. A greater proportion of patients receiving prednisone/prednisolone had a LOS greater than 3 days when compared with those in the dexamethasone cohort. There were no significant differences in all cause 7- or 30-day readmission. The dexamethasone cohort had statistically significantly lower costs. The authors concluded that dexamethasone may be a viable alternative to prednisone/prednisolone for children admitted for acute asthma exacerbation not requiring admission to the pediatric intensive care unit (PICU).
In 2019, Tyler et al. published a single-center, retrospective, cohort study that used interrupted time series analysis to evaluate outcomes for inpatients with asthma before and after an ED’s protocol was changed to dexamethasone.5 Outcomes analyzed included LOS, hospital charges, and PICU transfer rates. The study included 1,015 subjects over a 36-month period. In the post–protocol change group, 65% of the subjects received dexamethasone only while 28% received a combination of dexamethasone and prednisone/prednisolone. The authors found no immediate significant differences in LOS, ICU transfers, or charges after the protocol change. However, they did see an overall 10% increased rate of PICU transfers in the period following the protocol change, a trend that could have been caused by difficult-to-measure differences in severity of patients before and after the protocol change. If the increase in PICU transfer rate was temporally associated with the ED protocol change, an immediate change in rate would be expected, and this was not seen. The authors speculated that dexamethasone may be inferior to prednisone for inpatients with the highest severity of asthma.
Combined with the practical benefit of dexamethasone’s shorter treatment course and decreased vomiting,2 these two studies support the use of dexamethasone in the inpatient setting for patients who don’t require ICU level care. A feasibility trial to determine noninferiority of dexamethasone vs prednisone is currently enrolling, according to clinicaltrials.gov.
NEBULIZED VS METERED-DOSE INHALER ALBUTEROL FOR ACUTE ASTHMA EXACERBATIONS
The 2007 NHLBI guidelines are clear that short-acting beta-2 agonists (SABA), delivered via nebulization or metered-dose inhaler (MDI) with a valved holding chamber (VHC), along with systemic steroids, should be the primary treatment in pediatric acute asthma exacerbations.1 The guidelines caution that nebulization therapy might be needed for patients who are ineffective in using MDIs because of age, level of agitation, or severity of asthma symptoms. Specific recommendations for management in the inpatient setting are brief but note that inpatient medication administration and care should mirror ED management strategies.1 Specific in-hospital management recommendations regarding nebulization vs MDI are not addressed.
A Cochrane Review by Cates et al. assessed pediatric and adult randomized trials comparing SABA delivery via MDI-VHC with that via nebulization.6 The analysis included 39 trials with a total of 729 adults and 1,897 children. Six of the included trials were conducted in an inpatient setting (207 enrolled children in these studies). The authors found that mechanism of SABA delivery did not affect ED admission rates or significantly influence other markers of treatment response (peak flow and forced expiratory volumes). In children, MDI-VHC use was associated with shorter ED length of stay, as well as a decreased frequency of common SABA side effects (ie, tachycardia and tremor). This review cites several areas in which research is needed, including MDI use in severe asthma exacerbations. This population often falls outside pediatric hospitalists’ scope of practice because these patients often require ICU-level care.
A recent systematic review of pediatric acute asthma management strategies by Castro-Rodriguez et al. found that using MDI-VHC to deliver SABA was superior to using nebulization as measured by decreased ED admission rates and ED length of stay, improved asthma clinical scores, and reduced SABA side effects.7 A 2016 prospective randomized trial of MDI-VHC vs nebulization in preschool-aged children presenting to an ED with asthma or virally mediated wheeze found that the SABA delivered via MDI-VHC was at least as effective as that delivered via nebulization.8
International asthma management guidelines more strongly recommend MDI-only treatment for pediatric patients admitted with moderate asthma.9 Despite this guidance, and the literature supporting transition in inpatient settings to bronchodilator administration via MDI, there are several barriers to exclusive MDI use in the inpatient setting. As mentioned by Cates et al., a recognized challenge in MDI-VHC adoption is overcoming the “nebulizer culture” in treating pediatric acute asthma symptoms.6 Perhaps not surprisingly, Press et al., in a retrospective secondary analysis of 25 institutions managing adults and children with acute asthma symptoms, found that 32% of all pediatric patients assessed received only nebulized SABA treatments during their hospitalization.10 Transitioning from nebulized albuterol to exclusively MDI-VHC albuterol will require significant systems changes.
UTILITY OF CLINICAL PATHWAYS
Clinical pathways operationalize practice guidelines and provide guidance on the treatments, testing, and management of an illness. Use of pediatric asthma pathways has increased steadily in the past decade, with one study of over 300 hospitals finding that, between 2005 to 2015, pathway implementation increased from 27% to 86%.11 This expanded use has coincided with a proliferation of publications evaluating the effects of these pathways. A systematic review examining the implementation and impact of asthma protocols identified over 100 articles published between 1986 and 2010, with the majority published after 2005.12 The study found implementation of guidelines through an asthma pathway generally improved patient care and provider performance regardless of implementation method.
Since that review, Kaiser et al. investigated the effects of pathway implementation at 42 children’s hospitals.13 They used interrupted time series to determine the effect of pathway implementation on LOS. Secondary outcomes included cost, use of bronchodilators, antibiotic use, and 30-day readmissions. This study found pathway implementation was associated with an 8.8% decrease in LOS and 3% decrease in hospital costs while increasing bronchodilator administration and decreasing antibiotic exposure. To determine the factors that allowed successful implementation of asthma pathways (as determined by reduction in LOS), Kaiser et al. performed qualitative interviews of key stakeholders at high- and low-performing hospitals.14 The most successful hospitals all used rigorous data-driven quality-improvement methodologies, set shared goals with key stakeholders, integrated the pathway into their electronic medical record, allowed nurses and respiratory therapists to titrate albuterol frequency, and engaged hospital leadership to secure needed resources.
Although in each of these studies, pathway implementation led to improvements in the acute management of patients, there was no reduction in pediatric asthma readmissions at 30 days.12,13 A meta-analysis of asthma-related quality improvement interventions also did not find an association between pathway implementation alone and decreased readmissions or ED revisits.15 The lack of improvement in these metrics may have been caused by the tendency for pathways to focus on the acute asthma management and lack of focus on chronic asthma severity. Asthma admissions are an opportunity for full evaluation of disease severity, allergen exposures, and education on medication and spacer technique. Refinement of pathways with a focus on chronic control and on transition from hospital to home may move the needle on decreasing the long-term morbidity of pediatric asthma.
CONCLUSION
Current evidence suggests pediatric hospitalists should consider transitioning from prednisolone/prednisone to dexamethasone and from nebulized albuterol delivery to MDI albuterol delivery for children admitted for acute asthma exacerbation who do not require ICU-level care. Implementing asthma clinical pathways that use rigorous quality improvement methods is an effective approach to adopt these and other evidence-based practice changes.
Disclosures
The authors have nothing to disclose.
1. National Asthma E, Prevention P. Expert Panel Report 3 (EPR-3): Guidelines for the Diagnosis and Management of Asthma–Summary Report 2007. J Allergy Clin Immunol. 2007;120(5 Suppl):S94-S138. https://doi.org/10.1016/j.jaci.2007.09.029.
2. Keeney GE, Gray MP, Morrison AK, et al. Dexamethasone for acute asthma exacerbations in children: a meta-analysis. Pediatrics. 2014;133(3):493-499. https://doi.org/10.1542/peds.2013-2273.
3. Cotter JM, Tyler A, Reese J, et al. Steroid variability in pediatric inpatient asthmatics: Survey on provider preferences of dexamethasone versus prednisone. J Asthma. 2019:1-7. https://doi.org/10.1080/02770903.2019.1622713.
4. Parikh K, Hall M, Mittal V, et al. Comparative effectiveness of dexamethasone versus prednisone in children hospitalized with asthma. J Pediatr. 2015;167(3):639-644.e1. https://doi.org/10.1016/j.jpeds.2015.06.038.
5. Tyler A, Cotter JM, Moss A, et al. Outcomes for pediatric asthmatic inpatients after implementation of an emergency department dexamethasone treatment protocol. Hosp Pediatr. 2019;9(2):92-99. https://doi.org/10.1542/hpeds.2018-0099.
6. Cates CJ, Welsh EJ, Rowe BH. Holding chambers (spacers) versus nebulisers for beta-agonist treatment of acute asthma. Cochrane Database Syst Rev. 2013;(9):CD000052. https://doi.org/10.1002/14651858.CD000052.pub3.
7. Castro-Rodriguez JA, J Rodrigo G, E Rodriguea-Martinez C. Principal findings of systematic reviews of acute asthma treatment in childhood. J Asthma. 2015;52(10):1038-1045. https://doi.org/10.3109/02770903.2015.1033725.
8. Mitselou N, Hedlin G, Hederos CA. Spacers versus nebulizers in treatment of acute asthma - a prospective randomized study in preschool children. J Asthma. 2016;53(10):1059-1062. https://doi.org/10.1080/02770903.2016.1185114.
9. Global Initiative for Asthma. Global Strategy for Asthma Management and Prevention. https://www.ginasthma.org. Accessed December 10, 2019.
10. Press VG, Hasegawa K, Heidt J, Bittner JC, Camargo CA Jr. Missed opportunities to transition from nebulizers to inhalers during hospitalization for acute asthma: A multicenter observational study. J Asthma. 2017;54(9):968-976. https://doi.org/10.1080/02770903.2017.
11. Kaiser SV, Rodean J, Bekmezian A, et al. Rising utilization of inpatient pediatric asthma pathways. J Asthma. 2018;55(2):196-207. https://doi.org/ 10.1080/02770903.2017.1316392.
12. Dexheimer JW, Borycki EM, Chiu KW, Johnson KB, Aronsky D. A systematic review of the implementation and impact of asthma protocols. BMC Med Inform Decis Mak. 2014;14:82. https://doi.org/10.1186/1472-6947-14-82.
13. Kaiser SV, Rodean J, Bekmezian A, et al. effectiveness of pediatric asthma pathways for hospitalized children: A multicenter, national analysis. J Pediatr. 2018;197:165-171.e2. https://doi.org/10.1016/j.jpeds.2018.01.084.
14. Kaiser SV, Lam R, Cabana MD, et al. Best practices in implementing inpatient pediatric asthma pathways: a qualitative study. J Asthma. 2019:1-11. https://doi.org/10.1080/02770903.2019.1606237.
15. Parikh K, Keller S, Ralston S. Inpatient quality improvement interventions for asthma: A meta-analysis. Pediatrics. 2018;141(5). https://doi.org/10.1542/peds.2017-3334.
© 2020 Society of Hospital Medicine
Factors Associated with Differential Readmission Diagnoses Following Acute Exacerbations of Chronic Obstructive Pulmonary Disease
Readmissions following hospitalization for exacerbations of chronic obstructive pulmonary disease (COPD) are common and economically burdensome.1 The Affordable Care Act2 outlined the Hospital Readmissions Reduction Program (HRRP),3 which aims to improve the quality of care and reduce the costs for patients with pneumonia, myocardial infarction, congestive heart failure, and COPD.3 With the implementation of the HRRP, readmission reduction has become a key priority of health systems.
Multiple approaches to reduce readmissions are published, with variable degrees of success across respiratory and all-cause rehospitalizations.4 Patient self-management programs are heterogenous with inconsistent utilization reductions.5-7 While some transitional care programs demonstrate benefits,8-10 one notable study of an intensive transitional care and self-management program showed increaseNod acute care utilization without improving health-related quality of life.11-13 Another study of COPD comprehensive care management was stopped prematurely for increased mortality in the intervention group.14 Telehealth monitoring may predict exacerbations,15,16 but inconsistent effects on quality of life and utilization are observed.17,18 Pulmonary rehabilitation improves quality of life but not healthcare utilization.19 Dispensing respiratory medications at hospital discharge shows improved prescription fills and fewer readmissions,20 further reinforced by inhaler training prior to discharge.21 Postdischarge oxygen therapy does not improve health-related quality of life or acute care utilization.22 The fact that these approaches have not reliably succeeded raises the need for further study on the drivers of readmissions in COPD. Previous studies found differences in factors associated with the timing of COPD readmissions and return diagnoses.23,24 While HRRP is Medicare-specific, health systems likely use programs targeting their entire population when planning readmission reduction strategies. Previous analyses were primarily single-center studies25 and Medicare24 or private insurance claims.26
In this analysis, we explore how comorbidity burden27-29 may differentially influence readmissions for recurrent COPD exacerbations versus other diagnoses. Our approach uses a national all-payer sample that covers a diverse geographic area across the United States, providing robust estimates of factors influencing readmission and valuable insights for planning and implementing effective readmission reduction programs. By including data from a period that encompasses the implementation of HRRP, we also provide new information on the factors in the HRRP postimplementation that are not yet available in published literature.
METHODS
Data Source
The Nationwide Readmissions Database (NRD) is a nationally representative, all-payer, 100% sample of community acute care hospital discharges from multiple states.30 We pooled COPD discharge records spanning 2010-2016, excluding those where the patients were not residents of the state in which they were hospitalized to minimize loss to follow-up.
Inclusion/Exclusion Criteria
Selection criteria mirrored the methodology used by the HRRP,31,32 defining an index discharge as a patient ≥40 years of age with a qualifying COPD diagnosis (Appendix Tables 1-2), discharged alive, with at least 30 days elapsed since previous hospitalization. We excluded discharges against medical advice or those from a hospital with fewer than 25 COPD discharges in that calendar year as per HRRP,31,32 as well as those involving lung transplants. In this pooled cross-sectional analysis, record identifiers were not reliably unique across years. We restricted to observations originating February-November because January stays may not have had the requisite HRRP 30-day washout period from last admission and December stays could not be tracked into the subsequent January.
Outcomes
We defined a readmission as subsequent hospitalization for any cause within 30 days of the index discharge, with exemptions defined by the HRRP (Appendix Figure 1).31,32 We segmented the readmission outcome into two parts: those readmitted with diagnoses that met the COPD HRRP criteria versus for any other diagnoses. We also tabulated diagnosis-related groups (DRGs) coded for the readmission observation to capture attributable cause for rehospitalization.
Our main independent variable was the Elixhauser Comorbidity Index score,33 constructed using adaptations of published software,34,35 having previously validated its use for modeling COPD readmissions.36 We involved covariates provided with the database, including sociodemographic variables (eg, age, sex, community characteristics, payer, and median income at patient’s ZIP code) and hospital characteristics (eg, size, ownership, teaching status). We constructed additional covariates to account for in-hospital events by aggregating ICD diagnosis and procedure codes (eg, mechanical ventilation), hospital discharge volume, and proportion of annual within-hospital Medicaid patient days as a surrogate marker for safety-net hospitals. A detailed explanation of database construction and selection criteria is found in the Supplemental Methods Appendix.
Statistical Analysis
We tabulated patient-level descriptive statistics across the three outcomes of interest (ie, not readmitted, readmitted for a stay that would have qualified as COPD-related by HRRP criteria and readmitted for any other diagnosis). Continuous variables were compared using Welch’s t-tests (ie, unequal variance) and categorical variables using Chi-squared tests. At the hospital level, we tabulated the proportions of hospitals within categories in key variables of interest and a sub-population readmission rate for that particular characteristic, compared using Chi-squared tests.
We fit a multilevel multinomial logistic regression with random intercepts at the hospital cluster level, with the tripartite readmission outcome described above with “not readmitted” as the reference group. We included fixed effects for year, Elixhauser score, and patient- and hospital-level covariates as described above. Time to readmission for each group was plotted to assess the time distribution for each outcome. In-hospital mortality during each readmission event was tabulated.
Sensitivity Analyses and Missing Data
We conducted sensitivity analyses to determine whether a lower age cutoff (≥18 years) affects modeling. We also tested the stability of our estimates across each individual year of the pooled analysis. To test the effect of time to differential readmission, we fit a Cox proportional hazards model within the readmitted patient subgroup with Huber-White standard errors clustered at the hospital level to estimate the differential hazard of readmission for COPD versus non-COPD diagnoses across the same variables of interest as a sensitivity analysis. We also tested using a liberal classification of readmission diagnoses by sorting into “respiratory” versus “nonrespiratory” returns, with DRGs 163 through 208 for “respiratory” versus all others, respectively. We tested the agreement between the HRRP ICD-based classification and DRG classification using Cohen’s kappa.
We designated a threshold of 10% missing data to necessitate imputation techniques, determined a priori for our main variables, none of which met this level. Complete case analyses were used for all models. Analyses were performed in Stata version 15.1 (StataCorp, College Station, Texas) with weighted estimates reported using patient-level survey weights for national representativeness.37 The study protocol was reviewed by the institutional review board at the University of California, Los Angeles, and deemed exempt from oversight due to the publicly available, deidentified nature of the data (IRB# 18-001208).
RESULTS
Out of 104,897,595 hospitalizations in the NRD, a final sample of 1,622,983 COPD discharges was identified for our analysis (sample weighted effective population 3,743,164). The overall readmission rate was 17.25%, with 7.69% of patients readmitted for COPD and 9.56% readmitted for other diagnoses. Those with COPD readmissions were significantly younger with a lower proportion of Medicare and a higher proportion of Medicaid as the primary payer compared with those readmitted for all other causes (Table 1). Compared with non-COPD-readmitted patients, COPD-readmitted patients were more frequently discharged home without services and had shorter lengths of stay. Noninvasive ventilation was more common among COPD readmissions while mechanical ventilation and tracheostomy placement were less frequent compared with non-COPD readmissions. Compared with non-COPD-readmitted patients, COPD-readmitted patients had significantly lower mean Elixhauser Comorbidity Index scores (17.8 vs 22.8), rates of congestive heart failure (28.3% vs 38.6%), and renal failure (11.8% vs 21.5%; Appendix Table 3).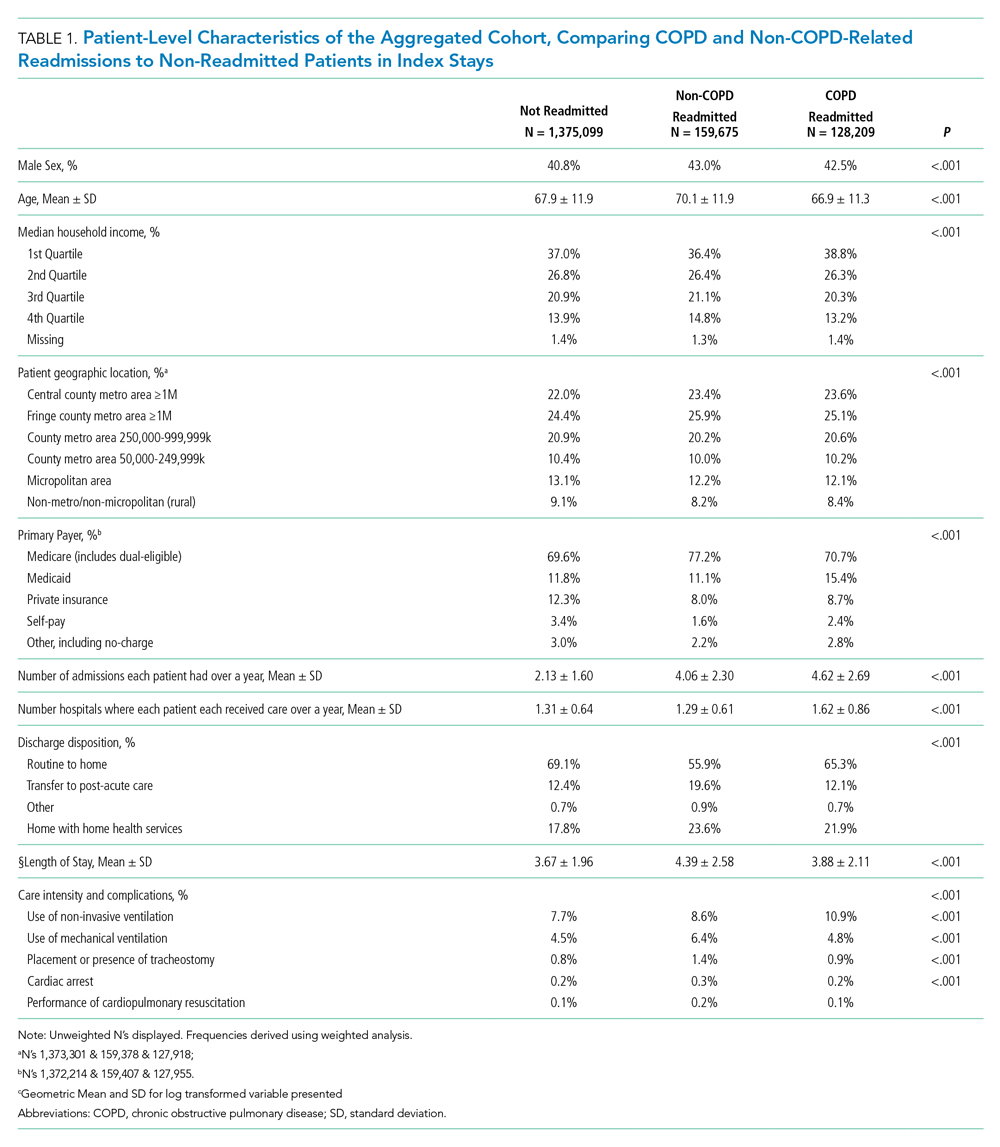
Readmission rates were significantly higher for non-COPD causes than for COPD causes across all hospital types by ownership, teaching status, or size (Table 2). Parallel patterns were observed for non-COPD and COPD readmissions across hospital types, with two key exceptions. Across categories of hospital ownership, for-profit hospitals had the highest rates for non-COPD readmissions, with no differences in hospital control for COPD rehospitalizations. While rates did not vary for non-COPD readmissions by within-hospital Medicaid prevalence, COPD readmission rates significantly increased as Medicaid-paid patient-days increased within hospitals.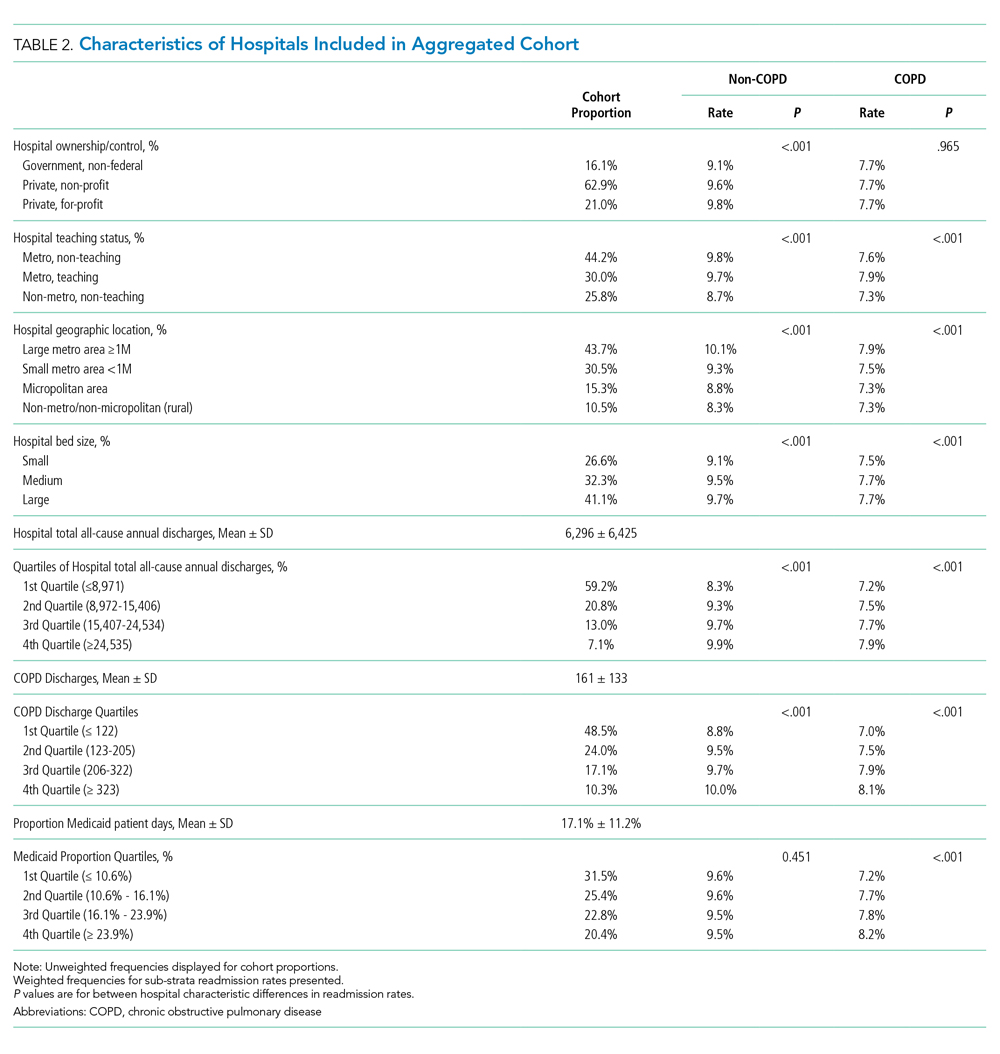
The median time to non-COPD readmission was 13 days, whereas COPD readmission was 14 days. More COPD readmissions occurred in the first 2.4 days after discharge, after which the proportion of non-COPD cases readmitted consistently increased. Observed readmission rates for COPD and other diagnoses trended down over the study period (Figure 1A), as did mortality rates during readmission stays (Figure 1B). Sepsis, heart failure, and respiratory infections were seven of the top 10 ranked DRGs for the non-COPD rehospitalizations (Appendix Table 4). In trend analyses (Appendix Tables 5-8), sepsis and DRGs with major comorbidities increased in proportion each year across the study period, possibly reflecting changes in coding practices.38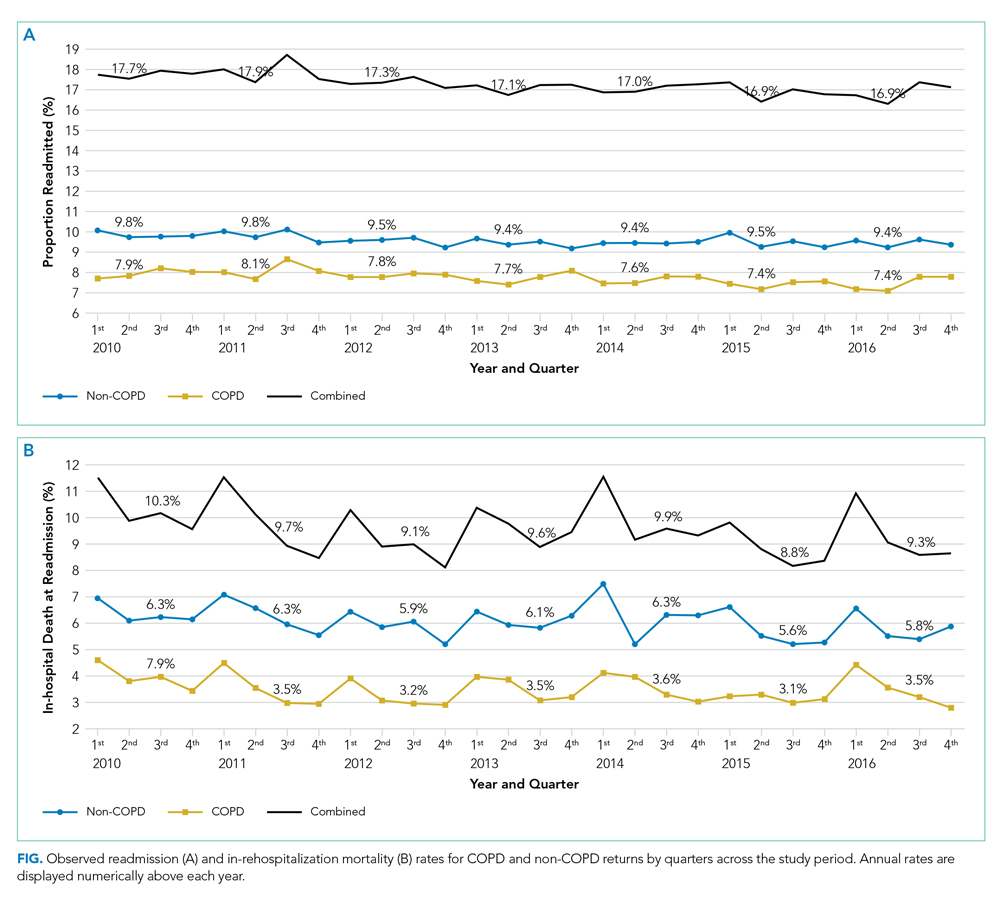
In our adjusted multinomial logistic regression model (Table 3), where the outcomes were not readmitted (reference category) versus readmitted for non-COPD diagnosis or for qualifying COPD diagnosis, the effect size of comorbidity, operationalized by change in the Elixhauser Comorbidity Index, was larger for non-COPD than non-COPD readmissions (odds ratio [OR] 1.19 vs 1.04 per one-half standard deviation of Elixhauser Index, an approximately 7.5 unit change in score). Increases in age were associated with higher non-COPD readmissions (OR 1.06 per 10 years) while actually protective against COPD readmissions (OR 0.89 per 10 years). Compared with Medicare patients, Medicaid patients had higher odds of COPD readmission (OR 1.10 vs 1.03) while the converse was observed in the privately insured (OR 0.65 vs 0.76). Transfers to postacute care facilities, referenced against discharges home, had a larger association with readmissions for non-COPD causes (OR 1.35 vs 1.00), whereas home-health had nearly equal adjusted readmission odds for each outcome (1.31 vs 1.30). Length of stay was associated with 1% greater odds per day for readmission for non-COPD causes than COPD returns. Regarding in-hospital events, odds of COPD readmission were higher for noninvasive ventilation (OR 1.37 vs 0.89) and mechanical ventilation (OR 0.87 vs 0.79, Appendix Table 9), which should be interpreted in the context that analyses were restricted to those discharged alive from their index admission, possibly biasing the true effect estimates due to competing risk of index in-hospital mortality.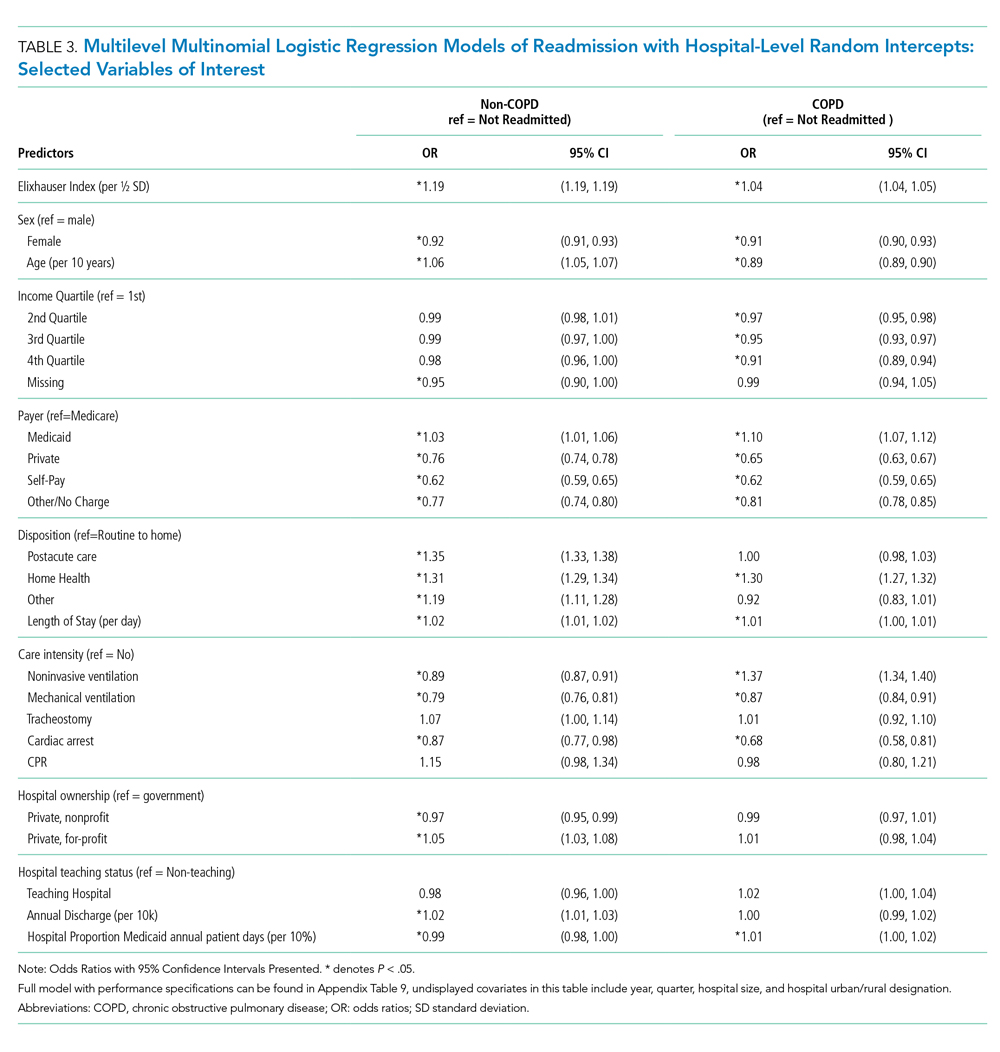
In sensitivity analyses, we found no significant differences between our Cox proportional hazards model (Appendix Table 10) and our multinomial model. When we liberalized readmission outcome definitions to respiratory versus nonrespiratory DRGs, we observed 86% agreement between the HRRP and DRG classification systems (κ = 0.73, P < .001). Among the discordant observations, 13% of non-COPD readmissions under HRRP criteria were reclassified as respiratory by DRG and 1% of COPD readmissions under HRRP reclassified as nonrespiratory. When our multinomial model (Appendix Table 11) was re-fit using the DRG-based outcome, only slight changes in effect size occurred. For the Elixhauser Index, the OR for COPD by HRRP was slightly lower than that for respiratory DRGs (1.04 vs 1.05), parallel with the difference between non-COPD by HRRP and nonrespiratory DRG classification (1.19 vs 1.21, respectively). This result underscores the greater influence of comorbidity on non-COPD than COPD readmissions. Only one sign change was observed in those who underwent tracheostomy (OR 0.91 for “nonrespiratory” DRG vs 1.07 for “non-COPD” by HRRP), likely reflecting the shift of some non-COPD diagnoses into the respiratory categorization based on tracheostomy having its own DRG. We also evaluated the multinomial model without the Elixhauser Index (only covariates) and found minor adjustments to the effect sizes of the covariates, particularly for discharge disposition. However, no sign changes were observed for any of the odds ratios (Appendix Table 12). Readmission odds by the Elixhauser score for each condition were stable across years (Appendix Figure 2 & Appendix Table 13). Finally, including 18-39-year-old patients in the cohort did not substantially change our estimates (Appendix Table 14).
DISCUSSION
In this assessment of readmission odds following hospitalizations for COPD in a nationally representative all-payer sample, we demonstrate that 55% of rehospitalizations following COPD exacerbations are attributable to non-COPD diagnoses and describe the important role of comorbidity on influencing diagnoses at rehospitalization. These findings are consistent with a prior study of Medicare patients by Shah et al.24 and expand upon the results of Jacobs et al. using a pre-HRRP sample of the NRD.23 Our study offers an expanded analysis by including data spanning HRRP implementation, which went into effect for COPD in October 2014.3 Effect estimates were stable across all seven years of our study in sensitivity analyses, demonstrating the robustness of our findings. Our analysis also adds to the existing body of literature by assessing which factors are associated with readmissions related to ongoing COPD versus other diagnoses.
In our study, an increase in aggregated comorbidity by the Elixhauser Index was associated with a significantly higher readmission odds, with over four times the effect size for non-COPD than COPD returns. Comorbidity also moderated the effect of other factors, such as income and discharge disposition. While overall readmission rates declined across the course of the study period, the effect of comorbidity on readmission odds for both groups remained significant in annualized models. We also observed higher rates of nearly every individual Elixhauser component comorbidity in those readmitted for non-COPD causes compared with those readmitted for COPD causes. Taken together, these results underscore the need to account for comorbidities at the individual and composite levels when identifying those at highest risk for readmissions and necessitate a multidisciplinary approach to reduce risk for the multimorbid patient.
In a 2018 report, the American Thoracic Society highlighted the focus of programs on adherence to guidelines and reducing variability in COPD care as a potential pitfall in efforts to reduce COPD readmissions.39 We demonstrate that a majority of patients who are readmitted return for diagnoses other than COPD. This finding further highlights that readmission reduction programs need not only focus on COPD control but on the overall management of the patient’s complex medical comorbidities. HRRP penalties are assessed for all-cause readmissions,31,32 and attention to the entire range of diagnoses leading to return to hospital is important to reduce readmission rates and expenditures. Use of strategies such as multispecialty clinics or integrated practice units may be useful in mitigating risk in multimorbid COPD patients.
Other significant factors that deserve further investigation include the use of postacute care services, including home health and skilled nursing facilities. Both factors were associated with higher likelihood of returning for non-COPD than for COPD-related diagnoses. This finding may be collinear to some degree with comorbidity because complex patients are probably less likely to be discharged home directly. Interestingly, those discharged to a postacute care facility had substantially high odds of readmission for a non-COPD cause. Transitional care programs, including short stays in a nursing home, are often employed to mitigate the risk of adverse outcomes after discharge in sicker patients,40 which may be insufficient based on these data.
We applied the HRRP criteria for coding a COPD-related admission to the readmission diagnoses, which is more stringent than using only a principal diagnosis or DRGs, to maintain the same standard for defining the index and readmission event. In the sensitivity analyses, we did not find significant differences in our estimates of comorbidity’s effect on outcomes using a more liberal DRG classification system.
We also used DRGs to classify the readmission causes in order to use the same grouping logic that a payer would use when determining the cause. When evaluating which DRG patients returned for following a COPD exacerbation, pneumonia or other respiratory infections make up 13.8%, which may represent the evolution of respiratory infections that provoked the original exacerbation. Heart failure comprised 9.1% of the non-COPD causes, with about one-third of our COPD cohort having known comorbid heart failure at the time of index admission, illustrating significant overlap between these two conditions. Heart failure and pneumonia are conditions of interest in the HRRP and would potentially garner their own penalties had sufficient time elapsed since a prior hospitalization. Among other causes in the top 20 return DRGs were esophagitis, gastritis, gastrointestinal bleeding, and psychoses, which may be potentially associated with the use of corticosteroids to treat a COPD exacerbation, as described in other population studies.41,42 Lack of medication regimen data in our analysis precludes further attribution of these causes, but the potential associations are interesting and warrant additional study.
The structure of our data as pooled annual cross sections rather than a true longitudinal cohort limited us to use only 10 months (February to November) of index hospitalizations in order to stay aligned with HRRP policy inclusion criteria. As such, we may have missed some important observations during peak respiratory virus season. As in any administrative data analysis, we are limited to codes in the discharge records, which may not reflect the entire nature of a hospitalization. Administrative data are particularly problematic in identifying true COPD exacerbations, particularly with multiple comorbid cardiopulmonary conditions.43,44 Validating coding algorithms for identifying COPD was beyond the scope of our evaluation, which purposefully used HRRP methodology. Further study thereof would be a useful endeavor, especially with transition to ICD-10, considering that previously published evaluation was limited to ICD-9.44 Despite these limitations, we were left with a robust and representative national cohort, which is an acceptable tradeoff.
CONCLUSION
Our study highlights the importance of understanding comorbidity as a major determinant of readmissions following COPD exacerbations, particularly in distinguishing which patients will return for COPD versus non-COPD-related diagnoses. At the health system level, readmission programs should be designed with the multimorbid patient in mind. Engagement of care teams, facilitating communication, and shared decision making are strategies to mitigate readmission risk in addition to COPD-focused disease management.39 These data highlight the need to use risk prediction tools in assigning resources to reduce readmissions,45 as well as the need to move readmission reduction programs beyond COPD management alone. Developing such systems to prospectively identify which patients are at risk of returning for both COPD and non-COPD reasons may further elucidate readmission mitigation strategies and should be a subject of future prospective study.
Acknowledgments
Data were made available through the Agency for Healthcare Research and Quality’s Healthcare Utilization Project. A full list of partner organizations providing data for the Nationwide Readmission Database can be found at https://www.hcup-us.ahrq.gov/db/hcupdatapartners.jsp.
Prior Presentation
Portions of this work were presented in abstract form at the 2018 American Thoracic Society International Conference (May 2018, San Diego, CA). This manuscript is derived from the doctoral dissertation for the degree of PhD in Health Policy and Management of the corresponding author, conferred in June 2019.
Disclaimer
This article does not necessarily represent the views and policies of the Department of Veterans Affairs or the USPSTF.
1. Press VG, Konetzka RT, White SR. Insights about the economic impact of chronic obstructive pulmonary disease readmissions post implementation of the hospital readmission reduction program. Curr Opin Pulm Med. 2018;24(2):138-146. https://doi.org/10.1097/MCP.0000000000000454.
2. Patient protection and affordable care act, 124. Stat. 1886;10939:119 U.S.C, §3025(q). 2010).
3. Centers for Medicare & Medicaid Services. Readmissions Reduction Program. Updated 30 November 2017. https://www.cms.gov/Medicare/Medicare-Fee-for-Service-Payment/AcuteInpatientPPS/Readmissions-Reduction-Program.html. Published. Accessed February 7, 2018; 2017.
4. Shah T, Press VG, Huisingh-Scheetz M, White SR. COPD readmissions: addressing COPD in the era of Value-Based Health Care. Chest. 2016;150(4):916-926. https://doi.org/10.1016/j.chest.2016.05.002.
5. Gadoury MA, Schwartzman K, Rouleau M, et al. Self-management reduces both short- and long-term hospitalisation in COPD. Eur Respir J. 2005;26(5):853-857. https://doi.org/10.1183/09031936.05.00093204.
6. Zwerink M, Brusse-Keizer M, van der Valk PD, et al. Self management for patients with chronic obstructive pulmonary disease. Cochrane Database Syst Rev. 2014;3(3):CD002990. https://doi.org/10.1002/14651858.CD002990.pub3.
7. Lenferink A, van der Palen J, van der Valk PDLPM, et al. Exacerbation action plans for patients with COPD and comorbidities: a randomised controlled trial. Eur Respir J. 2019;54(5). https://doi.org/10.1183/13993003.02134-2018.
8. Jackson CT, Trygstad TK, DeWalt DA, DuBard CA. Transitional care cut hospital readmissions for North Carolina Medicaid patients with complex chronic conditions. Health Aff (Millwood). 2013;32(8):1407-1415. https://doi.org/10.1377/hlthaff.2013.0047.
9. Verhaegh KJ, MacNeil-Vroomen JL, Eslami S et al. Transitional care interventions prevent hospital readmissions for adults with chronic illnesses. Health Aff (Millwood). 2014;33(9):1531-1539. https://doi.org/10.1377/hlthaff.2014.0160.
10. Ridwan ES, Hadi H, Wu YL, Tsai PS. Effects of transitional care on hospital readmission and mortality rate in subjects With COPD: A systematic review and meta-analysis. Respir Care. 2019;64(9):1146-1156. https://doi.org/10.4187/respcare.06959.
11. Aboumatar H, Naqibuddin M, Chung S, et al. Effect of a program combining transitional care and long-term self-management support on outcomes of hospitalized patients With chronic obstructive pulmonary disease: A randomized clinical trial. JAMA. 2018;320(22):2335-2343. https://doi.org/10.1001/jama.2018.17933.
12. Aboumatar H, Naqibuddin M, Chung S, et al. Effect of a program combining transitional care and long-term self-management support on outcomes of hospitalized patients with chronic obstructive pulmonary disease: a randomized clinical trial. JAMA. 2018;320(22):2335-2343. https://doi.org/10.1001/jama.2018.17933.
13. Aboumatar H, Naqibuddin M, Chung S, et al. Effect of a hospital-initiated program combining transitional care and long-term self-management support on outcomes of patients hospitalized with chronic obstructive pulmonary disease: A randomized clinical trial. JAMA. 2019;322(14):1371-1380. https://doi.org/10.1001/jama.2019.11982.
14. Fan VS, Gaziano JM, Lew R, et al. A comprehensive care management program to prevent chronic obstructive pulmonary disease hospitalizations: a randomized, controlled trial. Ann Intern Med. 2012;156(10):673-683. https://doi.org/10.7326/0003-4819-156-10-201205150-00003.
15. Jensen MH, Cichosz SL, Dinesen B, Hejlesen OK. Moving prediction of exacerbation in chronic obstructive pulmonary disease for patients in telecare. J Telemed Telecare. 2012;18(2):99-103. https://doi.org/10.1258/jtt.2011.110607.
16. Pedone C, Chiurco D, Scarlata S, Incalzi RA. Efficacy of multiparametric telemonitoring on respiratory outcomes in elderly people with COPD: a randomized controlled trial. BMC Health Serv Res. 2013;13:82. https://doi.org/10.1186/1472-6963-13-82.
17. Pinnock H, Hanley J, McCloughan L, et al. Effectiveness of telemonitoring integrated into existing clinical services on hospital admission for exacerbation of chronic obstructive pulmonary disease: researcher blind, multicentre, randomised controlled trial. BMJ. 2013;347:f6070. https://doi.org/10.1136/bmj.f6070.
18. McLean S, Nurmatov U, Liu JL et al. Telehealthcare for chronic obstructive pulmonary disease. Cochrane Database Syst Rev. 2011;7(7):CD007718. https://doi.org/10.1002/14651858.CD007718.pub2.
19. Ko FW, Dai DL, Ngai J, et al. Effect of early pulmonary rehabilitation on health care utilization and health status in patients hospitalized with acute exacerbations of COPD. Respirology. 2011;16(4):617-624. https://doi.org/10.1111/j.1440-1843.2010.01921.x.
20. Blee J, Roux RK, Gautreaux S, Sherer JT, Garey KW. Dispensing inhalers to patients with chronic obstructive pulmonary disease on hospital discharge: effects on prescription filling and readmission. Am J Health Syst Pharm. 2015;72(14):1204-1208. https://doi.org/10.2146/ajhp140621.
21. Press VG, Arora VM, Trela KC, et al. Effectiveness of interventions to teach metered-dose and Diskus inhaler techniques. A randomized trial. Ann Am Thor Soc. 2016;13(6):816-824. https://doi.org/10.1513/AnnalsATS.201509-603OC.
22. Eaton T, Fergusson W, Kolbe J, Lewis CA, West T. Short-burst oxygen therapy for COPD patients: a 6-month randomised, controlled study. Eur Respir J. 2006;27(4):697-704. https://doi.org/10.1183/09031936.06.00098805.
23. Jacobs DM, Noyes K, Zhao J, et al. Early hospital readmissions after an acute exacerbation of chronic obstructive pulmonary disease in the Nationwide Readmissions Database. Ann Am Thor Soc. 2018;15(7):837-845. https://doi.org/10.1513/AnnalsATS.201712-913OC.
24. Shah T, Churpek MM, Coca Perraillon M, Konetzka RT. Understanding why patients with COPD get readmitted: a large national study to delineate the Medicare population for the readmissions penalty expansion. Chest. 2015;147(5):1219-1226. https://doi.org/10.1378/chest.14-2181.
25. Glaser JB, El-Haddad H. Exploring novel Medicare readmission risk variables in chronic obstructive pulmonary disease patients at high risk of readmission within 30 days of hospital discharge. Ann Am Thor Soc. 2015;12(9):1288-1293. https://doi.org/10.1513/AnnalsATS.201504-228OC.
26. Sharif R, Parekh TM, Pierson KS, Kuo YF, Sharma G. Predictors of early readmission among patients 40 to 64 years of age hospitalized for chronic obstructive pulmonary disease. Ann Am Thor Soc. 2014;11(5):685-694. https://doi.org/10.1513/AnnalsATS.201310-358OC.
27. Global Initiative for Chronic Obstructive Lung Disease. Global strategy for the prevention, diagnosis, and management of COPD. https://goldcopd.org/wp-content/uploads/2018/11/GOLD-2019-v1.7-FINAL-14Nov2018-WMS.pdf. Published; 2019.
28. Spece LJ, Epler EM, Donovan LM, et al. Role of comorbidities in treatment and outcomes after chronic obstructive pulmonary disease exacerbations. Ann Am Thor Soc. 2018;15(9):1033-1038. https://doi.org/10.1513/AnnalsATS.201804-255OC.
29. Westney G, Foreman MG, Xu J et al. Impact of comorbidities Among Medicaid enrollees With chronic obstructive pulmonary disease, United States, 2009. Prev Chronic Dis. 2017;14:E31. https://doi.org/10.5888/pcd14.160333.
30. HCUP Nationwide Readmissions Database (NRD). https://www.hcup-us.ahrq.gov/nrdoverview.jsp; 2010-2016. Agency for Healthcare Research and Quality. Accessed September 1, 2018.
31. Yale New Haven Health Services Corporation/Center for Outcomes Research & Evaluation. 2016 Condition-Specific Measures Updates and Specifications Report Hospital-Level 30-Day Risk-Standardized Readmission Measures. Baltimore, MD: Centers for Medicare & Medicaid Services; 2016. Available from: https://www.qualitynet.org/files/5d0d3ac7764be766b0104a88?filename=2016_Rdmsn_Msr_Resources.zip. Accessed August 29, 2018.
32. Yale New Haven Health Services Corporation/Center for Outcomes Research & Evaluation. 2017 Condition-Specific Measures Updates and Specifications Report Hospital-Level 30-Day Risk-Standardized Readmission Measures. Baltimore, MD: Centers for Medicare & Medicaid Services; 2016. Available from: https://www.cms.gov/Medicare/Quality-Initiatives-Patient-Assessment-Instruments/HospitalQualityInits/Downloads/AMI-HF-PN-COPD-and-Stroke-Readmission-Updates.zip. Accessed November 7, 2018.
33. Moore BJ, White S, Washington R, Coenen N, Elixhauser A. Identifying increased risk of readmission and in-hospital mortality using hospital administrative data: the AHRQ Elixhauser comorbidity index. Med Care. 2017;55(7):698-705. https://doi.org/10.1097/MLR.0000000000000735.
34. Stagg V. Elixhauser. Stata Module to Calculate Elixhauser Index of Comorbidity [computer program]. Boston: College Department of Economics: Statistical Software Components; 2015.
35. Agency for Healthcare Research and Quality. Healthcare Cost and Utilization Project. HCUP Elixhauser comorbidity software. www.hcup-us.ahrq.gov/toolssoftware/comorbidity/comorbidity.jsp. Accessed March 1, 2019.
36. Buhr RG, Jackson NJ, Kominski GF, et al. Comorbidity and thirty-day hospital readmission odds in chronic obstructive pulmonary disease: a comparison of the Charlson and Elixhauser comorbidity indices. BMC Health Serv Res. 2019;19(1):701. https://doi.org/10.1186/s12913-019-4549-4.
37. Healthcare Cost and Utilization Project. Introduction to the HCUP Nationwide Readmissions Database (NRD). https://www.hcup-us.ahrq.gov/db/nation/nrd/Introduction_NRD_2010-2016.jsp. Published. Updated August 2018. Accessed October 15, 2018.
38. Steinwald B, Dummit LA. Hospital case-mix change: sicker patients or DRG creep? Health Aff (Millwood). 1989;8(2):35-47. https://doi.org/10.1377/hlthaff.8.2.35.
39. Press VG, Au DH, Bourbeau J, et al. Reducing chronic obstructive pulmonary disease hospital readmissions. An Official American Thoracic Society Workshop Report. Ann Am Thorac Soc. An Official American Thoracic Society Workshop Report. 2019;16(2):161-170. https://doi.org/10.1513/AnnalsATS.201811-755WS.
40. McHugh JP, Foster A, Mor V, et al. Reducing hospital readmissions Through preferred networks of skilled nursing facilities. Health Aff (Millwood). 2017;36(9):1591-1598. https://doi.org/10.1377/hlthaff.2017.0211.
41. Huang KW, Kuan YC, Chi NF et al. Chronic obstructive pulmonary disease is associated with increased recurrent peptic ulcer bleeding risk. Eur J Intern Med. 2017;37:75-82. https://doi.org/10.1016/j.ejim.2016.09.020.
42. Judd LL, Schettler PJ, Brown ES, et al. Adverse consequences of glucocorticoid medication: psychological, cognitive, and behavioral effects. Am J Psychiatry. 2014;171(10):1045-1051. https://doi.org/10.1176/appi.ajp.2014.13091264.
43. Stein BD, Bautista A, Schumock GT, et al. The validity of International Classification of Diseases, ninth Revision, Clinical Modification diagnosis codes for identifying patients hospitalized for COPD exacerbations. Chest. 2012;141(1):87-93. https://doi.org/10.1378/chest.11-0024.
44. Prieto-Centurion V, Rolle AJ, Au DH et al.Multicenter study comparing case definitions used to identify patients with chronic obstructive pulmonary disease. Am J Respir Crit Care Med. 2014;190(9):989-995. https://doi.org/10.1164/rccm.201406-1166OC.
45. Press VG. Is it time to move on from identifying risk factors for 30-day chronic obstructive pulmonary disease readmission? A call for risk prediction tools. Ann Am Thor Soc. 2018;15(7):801-803. https://doi.org/10.1513/AnnalsATS.201804-246ED.
Readmissions following hospitalization for exacerbations of chronic obstructive pulmonary disease (COPD) are common and economically burdensome.1 The Affordable Care Act2 outlined the Hospital Readmissions Reduction Program (HRRP),3 which aims to improve the quality of care and reduce the costs for patients with pneumonia, myocardial infarction, congestive heart failure, and COPD.3 With the implementation of the HRRP, readmission reduction has become a key priority of health systems.
Multiple approaches to reduce readmissions are published, with variable degrees of success across respiratory and all-cause rehospitalizations.4 Patient self-management programs are heterogenous with inconsistent utilization reductions.5-7 While some transitional care programs demonstrate benefits,8-10 one notable study of an intensive transitional care and self-management program showed increaseNod acute care utilization without improving health-related quality of life.11-13 Another study of COPD comprehensive care management was stopped prematurely for increased mortality in the intervention group.14 Telehealth monitoring may predict exacerbations,15,16 but inconsistent effects on quality of life and utilization are observed.17,18 Pulmonary rehabilitation improves quality of life but not healthcare utilization.19 Dispensing respiratory medications at hospital discharge shows improved prescription fills and fewer readmissions,20 further reinforced by inhaler training prior to discharge.21 Postdischarge oxygen therapy does not improve health-related quality of life or acute care utilization.22 The fact that these approaches have not reliably succeeded raises the need for further study on the drivers of readmissions in COPD. Previous studies found differences in factors associated with the timing of COPD readmissions and return diagnoses.23,24 While HRRP is Medicare-specific, health systems likely use programs targeting their entire population when planning readmission reduction strategies. Previous analyses were primarily single-center studies25 and Medicare24 or private insurance claims.26
In this analysis, we explore how comorbidity burden27-29 may differentially influence readmissions for recurrent COPD exacerbations versus other diagnoses. Our approach uses a national all-payer sample that covers a diverse geographic area across the United States, providing robust estimates of factors influencing readmission and valuable insights for planning and implementing effective readmission reduction programs. By including data from a period that encompasses the implementation of HRRP, we also provide new information on the factors in the HRRP postimplementation that are not yet available in published literature.
METHODS
Data Source
The Nationwide Readmissions Database (NRD) is a nationally representative, all-payer, 100% sample of community acute care hospital discharges from multiple states.30 We pooled COPD discharge records spanning 2010-2016, excluding those where the patients were not residents of the state in which they were hospitalized to minimize loss to follow-up.
Inclusion/Exclusion Criteria
Selection criteria mirrored the methodology used by the HRRP,31,32 defining an index discharge as a patient ≥40 years of age with a qualifying COPD diagnosis (Appendix Tables 1-2), discharged alive, with at least 30 days elapsed since previous hospitalization. We excluded discharges against medical advice or those from a hospital with fewer than 25 COPD discharges in that calendar year as per HRRP,31,32 as well as those involving lung transplants. In this pooled cross-sectional analysis, record identifiers were not reliably unique across years. We restricted to observations originating February-November because January stays may not have had the requisite HRRP 30-day washout period from last admission and December stays could not be tracked into the subsequent January.
Outcomes
We defined a readmission as subsequent hospitalization for any cause within 30 days of the index discharge, with exemptions defined by the HRRP (Appendix Figure 1).31,32 We segmented the readmission outcome into two parts: those readmitted with diagnoses that met the COPD HRRP criteria versus for any other diagnoses. We also tabulated diagnosis-related groups (DRGs) coded for the readmission observation to capture attributable cause for rehospitalization.
Our main independent variable was the Elixhauser Comorbidity Index score,33 constructed using adaptations of published software,34,35 having previously validated its use for modeling COPD readmissions.36 We involved covariates provided with the database, including sociodemographic variables (eg, age, sex, community characteristics, payer, and median income at patient’s ZIP code) and hospital characteristics (eg, size, ownership, teaching status). We constructed additional covariates to account for in-hospital events by aggregating ICD diagnosis and procedure codes (eg, mechanical ventilation), hospital discharge volume, and proportion of annual within-hospital Medicaid patient days as a surrogate marker for safety-net hospitals. A detailed explanation of database construction and selection criteria is found in the Supplemental Methods Appendix.
Statistical Analysis
We tabulated patient-level descriptive statistics across the three outcomes of interest (ie, not readmitted, readmitted for a stay that would have qualified as COPD-related by HRRP criteria and readmitted for any other diagnosis). Continuous variables were compared using Welch’s t-tests (ie, unequal variance) and categorical variables using Chi-squared tests. At the hospital level, we tabulated the proportions of hospitals within categories in key variables of interest and a sub-population readmission rate for that particular characteristic, compared using Chi-squared tests.
We fit a multilevel multinomial logistic regression with random intercepts at the hospital cluster level, with the tripartite readmission outcome described above with “not readmitted” as the reference group. We included fixed effects for year, Elixhauser score, and patient- and hospital-level covariates as described above. Time to readmission for each group was plotted to assess the time distribution for each outcome. In-hospital mortality during each readmission event was tabulated.
Sensitivity Analyses and Missing Data
We conducted sensitivity analyses to determine whether a lower age cutoff (≥18 years) affects modeling. We also tested the stability of our estimates across each individual year of the pooled analysis. To test the effect of time to differential readmission, we fit a Cox proportional hazards model within the readmitted patient subgroup with Huber-White standard errors clustered at the hospital level to estimate the differential hazard of readmission for COPD versus non-COPD diagnoses across the same variables of interest as a sensitivity analysis. We also tested using a liberal classification of readmission diagnoses by sorting into “respiratory” versus “nonrespiratory” returns, with DRGs 163 through 208 for “respiratory” versus all others, respectively. We tested the agreement between the HRRP ICD-based classification and DRG classification using Cohen’s kappa.
We designated a threshold of 10% missing data to necessitate imputation techniques, determined a priori for our main variables, none of which met this level. Complete case analyses were used for all models. Analyses were performed in Stata version 15.1 (StataCorp, College Station, Texas) with weighted estimates reported using patient-level survey weights for national representativeness.37 The study protocol was reviewed by the institutional review board at the University of California, Los Angeles, and deemed exempt from oversight due to the publicly available, deidentified nature of the data (IRB# 18-001208).
RESULTS
Out of 104,897,595 hospitalizations in the NRD, a final sample of 1,622,983 COPD discharges was identified for our analysis (sample weighted effective population 3,743,164). The overall readmission rate was 17.25%, with 7.69% of patients readmitted for COPD and 9.56% readmitted for other diagnoses. Those with COPD readmissions were significantly younger with a lower proportion of Medicare and a higher proportion of Medicaid as the primary payer compared with those readmitted for all other causes (Table 1). Compared with non-COPD-readmitted patients, COPD-readmitted patients were more frequently discharged home without services and had shorter lengths of stay. Noninvasive ventilation was more common among COPD readmissions while mechanical ventilation and tracheostomy placement were less frequent compared with non-COPD readmissions. Compared with non-COPD-readmitted patients, COPD-readmitted patients had significantly lower mean Elixhauser Comorbidity Index scores (17.8 vs 22.8), rates of congestive heart failure (28.3% vs 38.6%), and renal failure (11.8% vs 21.5%; Appendix Table 3).
Readmission rates were significantly higher for non-COPD causes than for COPD causes across all hospital types by ownership, teaching status, or size (Table 2). Parallel patterns were observed for non-COPD and COPD readmissions across hospital types, with two key exceptions. Across categories of hospital ownership, for-profit hospitals had the highest rates for non-COPD readmissions, with no differences in hospital control for COPD rehospitalizations. While rates did not vary for non-COPD readmissions by within-hospital Medicaid prevalence, COPD readmission rates significantly increased as Medicaid-paid patient-days increased within hospitals.
The median time to non-COPD readmission was 13 days, whereas COPD readmission was 14 days. More COPD readmissions occurred in the first 2.4 days after discharge, after which the proportion of non-COPD cases readmitted consistently increased. Observed readmission rates for COPD and other diagnoses trended down over the study period (Figure 1A), as did mortality rates during readmission stays (Figure 1B). Sepsis, heart failure, and respiratory infections were seven of the top 10 ranked DRGs for the non-COPD rehospitalizations (Appendix Table 4). In trend analyses (Appendix Tables 5-8), sepsis and DRGs with major comorbidities increased in proportion each year across the study period, possibly reflecting changes in coding practices.38
In our adjusted multinomial logistic regression model (Table 3), where the outcomes were not readmitted (reference category) versus readmitted for non-COPD diagnosis or for qualifying COPD diagnosis, the effect size of comorbidity, operationalized by change in the Elixhauser Comorbidity Index, was larger for non-COPD than non-COPD readmissions (odds ratio [OR] 1.19 vs 1.04 per one-half standard deviation of Elixhauser Index, an approximately 7.5 unit change in score). Increases in age were associated with higher non-COPD readmissions (OR 1.06 per 10 years) while actually protective against COPD readmissions (OR 0.89 per 10 years). Compared with Medicare patients, Medicaid patients had higher odds of COPD readmission (OR 1.10 vs 1.03) while the converse was observed in the privately insured (OR 0.65 vs 0.76). Transfers to postacute care facilities, referenced against discharges home, had a larger association with readmissions for non-COPD causes (OR 1.35 vs 1.00), whereas home-health had nearly equal adjusted readmission odds for each outcome (1.31 vs 1.30). Length of stay was associated with 1% greater odds per day for readmission for non-COPD causes than COPD returns. Regarding in-hospital events, odds of COPD readmission were higher for noninvasive ventilation (OR 1.37 vs 0.89) and mechanical ventilation (OR 0.87 vs 0.79, Appendix Table 9), which should be interpreted in the context that analyses were restricted to those discharged alive from their index admission, possibly biasing the true effect estimates due to competing risk of index in-hospital mortality.
In sensitivity analyses, we found no significant differences between our Cox proportional hazards model (Appendix Table 10) and our multinomial model. When we liberalized readmission outcome definitions to respiratory versus nonrespiratory DRGs, we observed 86% agreement between the HRRP and DRG classification systems (κ = 0.73, P < .001). Among the discordant observations, 13% of non-COPD readmissions under HRRP criteria were reclassified as respiratory by DRG and 1% of COPD readmissions under HRRP reclassified as nonrespiratory. When our multinomial model (Appendix Table 11) was re-fit using the DRG-based outcome, only slight changes in effect size occurred. For the Elixhauser Index, the OR for COPD by HRRP was slightly lower than that for respiratory DRGs (1.04 vs 1.05), parallel with the difference between non-COPD by HRRP and nonrespiratory DRG classification (1.19 vs 1.21, respectively). This result underscores the greater influence of comorbidity on non-COPD than COPD readmissions. Only one sign change was observed in those who underwent tracheostomy (OR 0.91 for “nonrespiratory” DRG vs 1.07 for “non-COPD” by HRRP), likely reflecting the shift of some non-COPD diagnoses into the respiratory categorization based on tracheostomy having its own DRG. We also evaluated the multinomial model without the Elixhauser Index (only covariates) and found minor adjustments to the effect sizes of the covariates, particularly for discharge disposition. However, no sign changes were observed for any of the odds ratios (Appendix Table 12). Readmission odds by the Elixhauser score for each condition were stable across years (Appendix Figure 2 & Appendix Table 13). Finally, including 18-39-year-old patients in the cohort did not substantially change our estimates (Appendix Table 14).
DISCUSSION
In this assessment of readmission odds following hospitalizations for COPD in a nationally representative all-payer sample, we demonstrate that 55% of rehospitalizations following COPD exacerbations are attributable to non-COPD diagnoses and describe the important role of comorbidity on influencing diagnoses at rehospitalization. These findings are consistent with a prior study of Medicare patients by Shah et al.24 and expand upon the results of Jacobs et al. using a pre-HRRP sample of the NRD.23 Our study offers an expanded analysis by including data spanning HRRP implementation, which went into effect for COPD in October 2014.3 Effect estimates were stable across all seven years of our study in sensitivity analyses, demonstrating the robustness of our findings. Our analysis also adds to the existing body of literature by assessing which factors are associated with readmissions related to ongoing COPD versus other diagnoses.
In our study, an increase in aggregated comorbidity by the Elixhauser Index was associated with a significantly higher readmission odds, with over four times the effect size for non-COPD than COPD returns. Comorbidity also moderated the effect of other factors, such as income and discharge disposition. While overall readmission rates declined across the course of the study period, the effect of comorbidity on readmission odds for both groups remained significant in annualized models. We also observed higher rates of nearly every individual Elixhauser component comorbidity in those readmitted for non-COPD causes compared with those readmitted for COPD causes. Taken together, these results underscore the need to account for comorbidities at the individual and composite levels when identifying those at highest risk for readmissions and necessitate a multidisciplinary approach to reduce risk for the multimorbid patient.
In a 2018 report, the American Thoracic Society highlighted the focus of programs on adherence to guidelines and reducing variability in COPD care as a potential pitfall in efforts to reduce COPD readmissions.39 We demonstrate that a majority of patients who are readmitted return for diagnoses other than COPD. This finding further highlights that readmission reduction programs need not only focus on COPD control but on the overall management of the patient’s complex medical comorbidities. HRRP penalties are assessed for all-cause readmissions,31,32 and attention to the entire range of diagnoses leading to return to hospital is important to reduce readmission rates and expenditures. Use of strategies such as multispecialty clinics or integrated practice units may be useful in mitigating risk in multimorbid COPD patients.
Other significant factors that deserve further investigation include the use of postacute care services, including home health and skilled nursing facilities. Both factors were associated with higher likelihood of returning for non-COPD than for COPD-related diagnoses. This finding may be collinear to some degree with comorbidity because complex patients are probably less likely to be discharged home directly. Interestingly, those discharged to a postacute care facility had substantially high odds of readmission for a non-COPD cause. Transitional care programs, including short stays in a nursing home, are often employed to mitigate the risk of adverse outcomes after discharge in sicker patients,40 which may be insufficient based on these data.
We applied the HRRP criteria for coding a COPD-related admission to the readmission diagnoses, which is more stringent than using only a principal diagnosis or DRGs, to maintain the same standard for defining the index and readmission event. In the sensitivity analyses, we did not find significant differences in our estimates of comorbidity’s effect on outcomes using a more liberal DRG classification system.
We also used DRGs to classify the readmission causes in order to use the same grouping logic that a payer would use when determining the cause. When evaluating which DRG patients returned for following a COPD exacerbation, pneumonia or other respiratory infections make up 13.8%, which may represent the evolution of respiratory infections that provoked the original exacerbation. Heart failure comprised 9.1% of the non-COPD causes, with about one-third of our COPD cohort having known comorbid heart failure at the time of index admission, illustrating significant overlap between these two conditions. Heart failure and pneumonia are conditions of interest in the HRRP and would potentially garner their own penalties had sufficient time elapsed since a prior hospitalization. Among other causes in the top 20 return DRGs were esophagitis, gastritis, gastrointestinal bleeding, and psychoses, which may be potentially associated with the use of corticosteroids to treat a COPD exacerbation, as described in other population studies.41,42 Lack of medication regimen data in our analysis precludes further attribution of these causes, but the potential associations are interesting and warrant additional study.
The structure of our data as pooled annual cross sections rather than a true longitudinal cohort limited us to use only 10 months (February to November) of index hospitalizations in order to stay aligned with HRRP policy inclusion criteria. As such, we may have missed some important observations during peak respiratory virus season. As in any administrative data analysis, we are limited to codes in the discharge records, which may not reflect the entire nature of a hospitalization. Administrative data are particularly problematic in identifying true COPD exacerbations, particularly with multiple comorbid cardiopulmonary conditions.43,44 Validating coding algorithms for identifying COPD was beyond the scope of our evaluation, which purposefully used HRRP methodology. Further study thereof would be a useful endeavor, especially with transition to ICD-10, considering that previously published evaluation was limited to ICD-9.44 Despite these limitations, we were left with a robust and representative national cohort, which is an acceptable tradeoff.
CONCLUSION
Our study highlights the importance of understanding comorbidity as a major determinant of readmissions following COPD exacerbations, particularly in distinguishing which patients will return for COPD versus non-COPD-related diagnoses. At the health system level, readmission programs should be designed with the multimorbid patient in mind. Engagement of care teams, facilitating communication, and shared decision making are strategies to mitigate readmission risk in addition to COPD-focused disease management.39 These data highlight the need to use risk prediction tools in assigning resources to reduce readmissions,45 as well as the need to move readmission reduction programs beyond COPD management alone. Developing such systems to prospectively identify which patients are at risk of returning for both COPD and non-COPD reasons may further elucidate readmission mitigation strategies and should be a subject of future prospective study.
Acknowledgments
Data were made available through the Agency for Healthcare Research and Quality’s Healthcare Utilization Project. A full list of partner organizations providing data for the Nationwide Readmission Database can be found at https://www.hcup-us.ahrq.gov/db/hcupdatapartners.jsp.
Prior Presentation
Portions of this work were presented in abstract form at the 2018 American Thoracic Society International Conference (May 2018, San Diego, CA). This manuscript is derived from the doctoral dissertation for the degree of PhD in Health Policy and Management of the corresponding author, conferred in June 2019.
Disclaimer
This article does not necessarily represent the views and policies of the Department of Veterans Affairs or the USPSTF.
1. Press VG, Konetzka RT, White SR. Insights about the economic impact of chronic obstructive pulmonary disease readmissions post implementation of the hospital readmission reduction program. Curr Opin Pulm Med. 2018;24(2):138-146. https://doi.org/10.1097/MCP.0000000000000454.
2. Patient protection and affordable care act, 124. Stat. 1886;10939:119 U.S.C, §3025(q). 2010).
3. Centers for Medicare & Medicaid Services. Readmissions Reduction Program. Updated 30 November 2017. https://www.cms.gov/Medicare/Medicare-Fee-for-Service-Payment/AcuteInpatientPPS/Readmissions-Reduction-Program.html. Published. Accessed February 7, 2018; 2017.
4. Shah T, Press VG, Huisingh-Scheetz M, White SR. COPD readmissions: addressing COPD in the era of Value-Based Health Care. Chest. 2016;150(4):916-926. https://doi.org/10.1016/j.chest.2016.05.002.
5. Gadoury MA, Schwartzman K, Rouleau M, et al. Self-management reduces both short- and long-term hospitalisation in COPD. Eur Respir J. 2005;26(5):853-857. https://doi.org/10.1183/09031936.05.00093204.
6. Zwerink M, Brusse-Keizer M, van der Valk PD, et al. Self management for patients with chronic obstructive pulmonary disease. Cochrane Database Syst Rev. 2014;3(3):CD002990. https://doi.org/10.1002/14651858.CD002990.pub3.
7. Lenferink A, van der Palen J, van der Valk PDLPM, et al. Exacerbation action plans for patients with COPD and comorbidities: a randomised controlled trial. Eur Respir J. 2019;54(5). https://doi.org/10.1183/13993003.02134-2018.
8. Jackson CT, Trygstad TK, DeWalt DA, DuBard CA. Transitional care cut hospital readmissions for North Carolina Medicaid patients with complex chronic conditions. Health Aff (Millwood). 2013;32(8):1407-1415. https://doi.org/10.1377/hlthaff.2013.0047.
9. Verhaegh KJ, MacNeil-Vroomen JL, Eslami S et al. Transitional care interventions prevent hospital readmissions for adults with chronic illnesses. Health Aff (Millwood). 2014;33(9):1531-1539. https://doi.org/10.1377/hlthaff.2014.0160.
10. Ridwan ES, Hadi H, Wu YL, Tsai PS. Effects of transitional care on hospital readmission and mortality rate in subjects With COPD: A systematic review and meta-analysis. Respir Care. 2019;64(9):1146-1156. https://doi.org/10.4187/respcare.06959.
11. Aboumatar H, Naqibuddin M, Chung S, et al. Effect of a program combining transitional care and long-term self-management support on outcomes of hospitalized patients With chronic obstructive pulmonary disease: A randomized clinical trial. JAMA. 2018;320(22):2335-2343. https://doi.org/10.1001/jama.2018.17933.
12. Aboumatar H, Naqibuddin M, Chung S, et al. Effect of a program combining transitional care and long-term self-management support on outcomes of hospitalized patients with chronic obstructive pulmonary disease: a randomized clinical trial. JAMA. 2018;320(22):2335-2343. https://doi.org/10.1001/jama.2018.17933.
13. Aboumatar H, Naqibuddin M, Chung S, et al. Effect of a hospital-initiated program combining transitional care and long-term self-management support on outcomes of patients hospitalized with chronic obstructive pulmonary disease: A randomized clinical trial. JAMA. 2019;322(14):1371-1380. https://doi.org/10.1001/jama.2019.11982.
14. Fan VS, Gaziano JM, Lew R, et al. A comprehensive care management program to prevent chronic obstructive pulmonary disease hospitalizations: a randomized, controlled trial. Ann Intern Med. 2012;156(10):673-683. https://doi.org/10.7326/0003-4819-156-10-201205150-00003.
15. Jensen MH, Cichosz SL, Dinesen B, Hejlesen OK. Moving prediction of exacerbation in chronic obstructive pulmonary disease for patients in telecare. J Telemed Telecare. 2012;18(2):99-103. https://doi.org/10.1258/jtt.2011.110607.
16. Pedone C, Chiurco D, Scarlata S, Incalzi RA. Efficacy of multiparametric telemonitoring on respiratory outcomes in elderly people with COPD: a randomized controlled trial. BMC Health Serv Res. 2013;13:82. https://doi.org/10.1186/1472-6963-13-82.
17. Pinnock H, Hanley J, McCloughan L, et al. Effectiveness of telemonitoring integrated into existing clinical services on hospital admission for exacerbation of chronic obstructive pulmonary disease: researcher blind, multicentre, randomised controlled trial. BMJ. 2013;347:f6070. https://doi.org/10.1136/bmj.f6070.
18. McLean S, Nurmatov U, Liu JL et al. Telehealthcare for chronic obstructive pulmonary disease. Cochrane Database Syst Rev. 2011;7(7):CD007718. https://doi.org/10.1002/14651858.CD007718.pub2.
19. Ko FW, Dai DL, Ngai J, et al. Effect of early pulmonary rehabilitation on health care utilization and health status in patients hospitalized with acute exacerbations of COPD. Respirology. 2011;16(4):617-624. https://doi.org/10.1111/j.1440-1843.2010.01921.x.
20. Blee J, Roux RK, Gautreaux S, Sherer JT, Garey KW. Dispensing inhalers to patients with chronic obstructive pulmonary disease on hospital discharge: effects on prescription filling and readmission. Am J Health Syst Pharm. 2015;72(14):1204-1208. https://doi.org/10.2146/ajhp140621.
21. Press VG, Arora VM, Trela KC, et al. Effectiveness of interventions to teach metered-dose and Diskus inhaler techniques. A randomized trial. Ann Am Thor Soc. 2016;13(6):816-824. https://doi.org/10.1513/AnnalsATS.201509-603OC.
22. Eaton T, Fergusson W, Kolbe J, Lewis CA, West T. Short-burst oxygen therapy for COPD patients: a 6-month randomised, controlled study. Eur Respir J. 2006;27(4):697-704. https://doi.org/10.1183/09031936.06.00098805.
23. Jacobs DM, Noyes K, Zhao J, et al. Early hospital readmissions after an acute exacerbation of chronic obstructive pulmonary disease in the Nationwide Readmissions Database. Ann Am Thor Soc. 2018;15(7):837-845. https://doi.org/10.1513/AnnalsATS.201712-913OC.
24. Shah T, Churpek MM, Coca Perraillon M, Konetzka RT. Understanding why patients with COPD get readmitted: a large national study to delineate the Medicare population for the readmissions penalty expansion. Chest. 2015;147(5):1219-1226. https://doi.org/10.1378/chest.14-2181.
25. Glaser JB, El-Haddad H. Exploring novel Medicare readmission risk variables in chronic obstructive pulmonary disease patients at high risk of readmission within 30 days of hospital discharge. Ann Am Thor Soc. 2015;12(9):1288-1293. https://doi.org/10.1513/AnnalsATS.201504-228OC.
26. Sharif R, Parekh TM, Pierson KS, Kuo YF, Sharma G. Predictors of early readmission among patients 40 to 64 years of age hospitalized for chronic obstructive pulmonary disease. Ann Am Thor Soc. 2014;11(5):685-694. https://doi.org/10.1513/AnnalsATS.201310-358OC.
27. Global Initiative for Chronic Obstructive Lung Disease. Global strategy for the prevention, diagnosis, and management of COPD. https://goldcopd.org/wp-content/uploads/2018/11/GOLD-2019-v1.7-FINAL-14Nov2018-WMS.pdf. Published; 2019.
28. Spece LJ, Epler EM, Donovan LM, et al. Role of comorbidities in treatment and outcomes after chronic obstructive pulmonary disease exacerbations. Ann Am Thor Soc. 2018;15(9):1033-1038. https://doi.org/10.1513/AnnalsATS.201804-255OC.
29. Westney G, Foreman MG, Xu J et al. Impact of comorbidities Among Medicaid enrollees With chronic obstructive pulmonary disease, United States, 2009. Prev Chronic Dis. 2017;14:E31. https://doi.org/10.5888/pcd14.160333.
30. HCUP Nationwide Readmissions Database (NRD). https://www.hcup-us.ahrq.gov/nrdoverview.jsp; 2010-2016. Agency for Healthcare Research and Quality. Accessed September 1, 2018.
31. Yale New Haven Health Services Corporation/Center for Outcomes Research & Evaluation. 2016 Condition-Specific Measures Updates and Specifications Report Hospital-Level 30-Day Risk-Standardized Readmission Measures. Baltimore, MD: Centers for Medicare & Medicaid Services; 2016. Available from: https://www.qualitynet.org/files/5d0d3ac7764be766b0104a88?filename=2016_Rdmsn_Msr_Resources.zip. Accessed August 29, 2018.
32. Yale New Haven Health Services Corporation/Center for Outcomes Research & Evaluation. 2017 Condition-Specific Measures Updates and Specifications Report Hospital-Level 30-Day Risk-Standardized Readmission Measures. Baltimore, MD: Centers for Medicare & Medicaid Services; 2016. Available from: https://www.cms.gov/Medicare/Quality-Initiatives-Patient-Assessment-Instruments/HospitalQualityInits/Downloads/AMI-HF-PN-COPD-and-Stroke-Readmission-Updates.zip. Accessed November 7, 2018.
33. Moore BJ, White S, Washington R, Coenen N, Elixhauser A. Identifying increased risk of readmission and in-hospital mortality using hospital administrative data: the AHRQ Elixhauser comorbidity index. Med Care. 2017;55(7):698-705. https://doi.org/10.1097/MLR.0000000000000735.
34. Stagg V. Elixhauser. Stata Module to Calculate Elixhauser Index of Comorbidity [computer program]. Boston: College Department of Economics: Statistical Software Components; 2015.
35. Agency for Healthcare Research and Quality. Healthcare Cost and Utilization Project. HCUP Elixhauser comorbidity software. www.hcup-us.ahrq.gov/toolssoftware/comorbidity/comorbidity.jsp. Accessed March 1, 2019.
36. Buhr RG, Jackson NJ, Kominski GF, et al. Comorbidity and thirty-day hospital readmission odds in chronic obstructive pulmonary disease: a comparison of the Charlson and Elixhauser comorbidity indices. BMC Health Serv Res. 2019;19(1):701. https://doi.org/10.1186/s12913-019-4549-4.
37. Healthcare Cost and Utilization Project. Introduction to the HCUP Nationwide Readmissions Database (NRD). https://www.hcup-us.ahrq.gov/db/nation/nrd/Introduction_NRD_2010-2016.jsp. Published. Updated August 2018. Accessed October 15, 2018.
38. Steinwald B, Dummit LA. Hospital case-mix change: sicker patients or DRG creep? Health Aff (Millwood). 1989;8(2):35-47. https://doi.org/10.1377/hlthaff.8.2.35.
39. Press VG, Au DH, Bourbeau J, et al. Reducing chronic obstructive pulmonary disease hospital readmissions. An Official American Thoracic Society Workshop Report. Ann Am Thorac Soc. An Official American Thoracic Society Workshop Report. 2019;16(2):161-170. https://doi.org/10.1513/AnnalsATS.201811-755WS.
40. McHugh JP, Foster A, Mor V, et al. Reducing hospital readmissions Through preferred networks of skilled nursing facilities. Health Aff (Millwood). 2017;36(9):1591-1598. https://doi.org/10.1377/hlthaff.2017.0211.
41. Huang KW, Kuan YC, Chi NF et al. Chronic obstructive pulmonary disease is associated with increased recurrent peptic ulcer bleeding risk. Eur J Intern Med. 2017;37:75-82. https://doi.org/10.1016/j.ejim.2016.09.020.
42. Judd LL, Schettler PJ, Brown ES, et al. Adverse consequences of glucocorticoid medication: psychological, cognitive, and behavioral effects. Am J Psychiatry. 2014;171(10):1045-1051. https://doi.org/10.1176/appi.ajp.2014.13091264.
43. Stein BD, Bautista A, Schumock GT, et al. The validity of International Classification of Diseases, ninth Revision, Clinical Modification diagnosis codes for identifying patients hospitalized for COPD exacerbations. Chest. 2012;141(1):87-93. https://doi.org/10.1378/chest.11-0024.
44. Prieto-Centurion V, Rolle AJ, Au DH et al.Multicenter study comparing case definitions used to identify patients with chronic obstructive pulmonary disease. Am J Respir Crit Care Med. 2014;190(9):989-995. https://doi.org/10.1164/rccm.201406-1166OC.
45. Press VG. Is it time to move on from identifying risk factors for 30-day chronic obstructive pulmonary disease readmission? A call for risk prediction tools. Ann Am Thor Soc. 2018;15(7):801-803. https://doi.org/10.1513/AnnalsATS.201804-246ED.
© 2020 Society of Hospital Medicine
Hospital Care of Opioid-Exposed Newborns: Clinical and Psychosocial Challenges
In the past two decades, the incidence rate of opioid use disorder (OUD) among pregnant women has increased by more than 400%, constituting a United States public health crisis.1 Newborns exposed to intrauterine opioids are at risk for the postnatal withdrawal syndrome known as neonatal abstinence syndrome (NAS), which requires increased hospital resources, such as neonatal intensive care unit (NICU) admission and prolonged length of stay.2 Given the medical and psychosocial challenges associated with maternal OUD and NAS, a multidisciplinary, patient-centered approach to hospital care for affected newborns and their mothers is warranted. A large and growing body of research has focused on the epidemiology of NAS and approaches for its prevention, screening, and management. This review appraises updates to the literature within the past five years, with an emphasis on considerations for newborn discharge to promote optimal care for this population.
DEFINITION
NAS is a complex disorder arising from the abrupt cessation of placental transfer of opioids after birth, although other maternal substances, including benzodiazepines and other antidepressants, have been less commonly implicated.2 The term neonatal opioid withdrawal syndrome is sometimes used to indicate withdrawal from opioids specifically.3 The central and autonomic nervous systems and the gastrointestinal system (eg, tremors, increased muscle tone, high-pitched crying, feeding difficulties) are affected in NAS, with most newborns demonstrating symptoms within the first few days of life.4 Previously reported factors associated with NAS include opioid type, timing of exposure during pregnancy, maternal tobacco use, infant sex, and gestational age.5 Literature demonstrates that concurrent exposure to other prenatal substances, particularly antidepressants, benzodiazepines, and gabapentin, is significantly associated with increased risk of NAS.6 Recent studies also suggest that expression of NAS may relate to newborn genetic variations, particularly at the OPRM1, COMT, and CYP2B6 gene sites.7, 8
State health departments have increasingly deemed NAS as a reportable diagnosis for public health surveillance, which relies on the accurate diagnosis and documentation of NAS during birth hospitalization.9 The diagnosis codes for NAS include the International Classification of Diseases, Ninth Revision, Clinical Modification code (ICD-9-CM) 779.5 and the International Classification of Diseases, Tenth Revision, Clinical Modification ICD-10-CM code P96.1.10 However, given the variation in the presentation and severity of NAS, no consensus has been established with regard to a standardized case definition for reporting across hospitals and states.9 In fact, NAS should be conceptualized as a continuum of withdrawal symptoms along which every infant with intrauterine opioid exposure resides; this continuum ranges from minor findings, which do not affect the infant’s ability to grow and develop, to severe withdrawal, resulting in excessive weight loss, dehydration, or seizures.3,11 Ultimately, the diagnosis of NAS is made clinically based on cardinal symptoms in the setting of known or highly suspected opioid exposure. In a recent study of Tennessee Medicaid claims data, >25% of infants with a confirmed diagnosis code for NAS did not receive pharmacotherapy.10 Pharmacologic treatment of NAS, therefore, may be more appropriately considered as a marker of disease severity, rather than a requirement for diagnosis.
EPIDEMIOLOGY
Although the opioid crisis and resulting rise in NAS have affected communities across the US, substantial statewide variation exists, with extremes ranging from 0.7 per 1,000 births affected by NAS in Hawaii to 33.4 per 1,000 births in West Virginia.12 Within states, increased maternal OUD and NAS rates have also disproportionately affected rural communities possibly due to reduced access to healthcare and mental health services and poor economic conditions.13 A recent national study demonstrated that the proportion of newborns with NAS who were born in rural hospitals increased from 12.9% to 21.2% over the past decade; these rural newborns with NAS are more likely to be publicly insured and to require transfer after birth than newborns in urban hospitals.14 These data suggest a particular need among rural communities for increased resources targeting NAS care as well as maternal OUD prevention and treatment.
RISK IDENTIFICATION
The American College of Obstetricians and Gynecologists (ACOG) recommends early universal screening for maternal substance use at the first prenatal visit with a validated screening tool; examples include the 4Ps (parents, partners, past, and pregnancy), CRAFFT (car, relax, alone, forget, friends, trouble), and the National Institute on Drug Abuse quick screen, which have all been well studied and have a high sensitivity for detecting substance use and misuse.15
Toxicology Screening
Toxicology testing for both mother and newborn is helpful in identifying or confirming intrauterine exposures, particularly in cases of polysubstance use or when a newborn manifests signs of NAS but whose mother denies opioid use. All toxicology testing should be performed with the mother’s consent, and any potential legal or mandatory ramifications of a positive test should be considered. Although universal maternal toxicology testing improves the identification of newborns at risk for NAS, this approach remains controversial; most hospitals use a risk-based approach for maternal toxicology testing.16,17
Newborn toxicology testing can be performed from samples of hair, urine, meconium, and umbilical cord. Although frequently used, newborn urine testing has the shortest window of detection, ie, the last few days prior to delivery (Table 1). Meconium drug testing has been considered the gold standard and can detect exposures from the last 20 weeks of gestation, providing information on chronic exposures.18 In a recent survey, 10% of hospitals reported using umbilical cord toxicology as the primary method for detecting intrauterine exposures.17 This approach allows greater ease of specimen collection but may not yield results that are exactly equivalent to meconium testing.19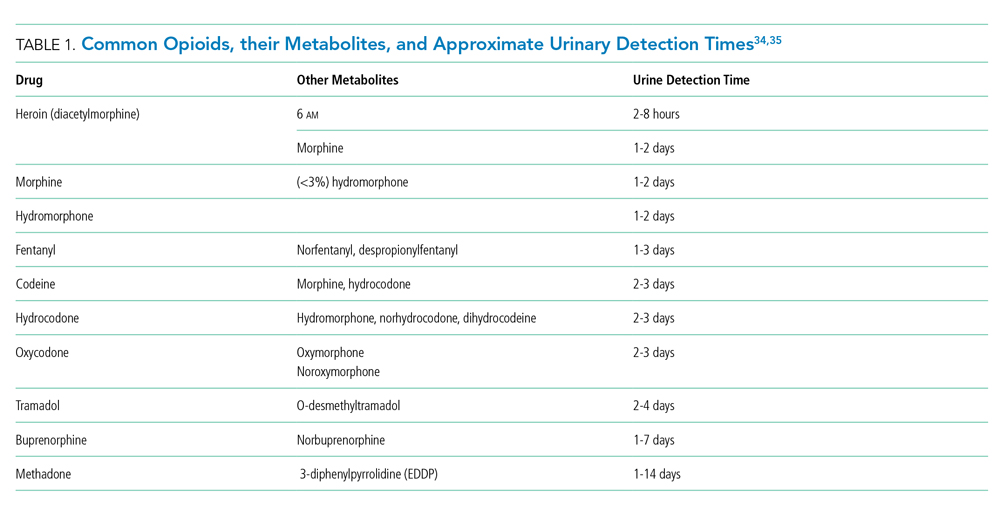
MONITORING AND EVALUATION
Close monitoring for development of NAS after birth is indicated for all newborns with confirmed or suspected intrauterine opioid exposure. Although the current American Academy of Pediatrics (AAP) guidelines recommend three days of newborn observation for exposure to short-acting opioids and five to seven days for longer acting opioids, substantial variation has been described across US hospitals in policies related to newborn length of stay for NAS observation.17, 20 In most hospitals, monitoring for NAS occurs in the routine postpartum unit (ie, level 1 nursery), with transfer to the NICU if pharmacologic treatment is indicated.17
The most widely used assessment tool for NAS is the Finnegan Neonatal Abstinence Scoring System (FNASS) or the modified FNASS, which assigns points for the 21 most common opioid withdrawal symptoms based on perceived severity.17, 21 This tool allows for assessment of symptoms, helps determine need for pharmacologic intervention, and can guide monitoring of symptoms and weaning of therapy. A commonly used score cutoff of 8 is based on prior research validating scores >8 as indicative of withdrawal symptoms as opposed to normal newborn findings.22 Despite its popularity and widespread usage, FNASS has limitations, including the need for the newborn to be stimulated or disturbed to produce an accurate assessment and scoring for nonspecific signs of withdrawal, including sneezing, yawning, and stuffiness. Recent work has attempted to simplify and shorten the FNASS to elements that are unique and specific for withdrawal.23,24 Further research is needed to establish the validity of common scoring practices (ie, use of 8 as a cutoff) to determine the need for pharmacologic treatment.25
Recent studies suggest that simple, function-based assessments, such as the Eat, Sleep, Console (ESC) approach developed by Grossman and colleagues, may serve as an alternative to the FNASS for evaluating withdrawal.26,27 With ESC, the need for pharmacotherapy is evaluated by the newborn’s ability to (1) eat (breastfeed successfully or eat at least 1oz per feed), (2) sleep uninterrupted for at least one hour, and (3) be consoled within 10 minutes. To date, research on the implementation of ESC has primarily focused on reducing length of stay and need for pharmacologic treatment in the context of quality improvement initiatives.26,27 Further prospective studies are warranted that compare ESC to traditional approaches involving the FNASS, and that evaluate post-discharge outcomes including newborn weight gain, ongoing withdrawal symptoms at home, and readmission.
NONPHARMACOLOGIC TREATMENT
In recent years, research increasingly supports the critical role of nonpharmacological care in management of all opioid-exposed newborns, regardless of NAS severity.11,27, 28 Rooming-in of mothers or caregivers has been shown to decrease the need for pharmacologic treatment, shorten the length of stay, and reduce hospital costs.28,29 Other well-established practices include maintaining a low stimulus environment for infants with low lighting and sound, swaddling, maximizing caregiver contact with kangaroo care and skin to skin, and minimizing interventions. Therapeutic modalities, such as massage and music therapy, have been used for infants with NAS, but no evidence has supported their use. Recent studies have increasingly supported the use of acupuncture as an emerging modality in treating NAS. 30
Feeding
Breastfeeding is encouraged for mothers who are stable on their methadone or buprenorphine maintenance treatment, are not using heroin or other illicit drugs, and have no other contraindications to breastfeeding, such as human immunodeficiency virus.31 Despite the known benefits of breastfeeding, which include decreased NAS severity, decreased need for pharmacological treatment, and shortened length of hospital stay, breastfeeding rates among mothers with OUD are low.31 Hospital policies that can promote maternal success in breastfeeding include tailored breastfeeding support, rooming in, and early, consistent maternal education on the benefits and safety of breastfeeding.32 A small percentage of hospitals use donor breastmilk for this population, although data on outcomes are limited.17 For formula-fed newborns, emerging research suggests that early initiation of high-calorie (22-24 kcal/ounce) formula may be beneficial to prevent excessive weight loss and poor weight gain after intrauterine opioid exposure.33
PHARMACOLOGIC TREATMENT
When supportive therapy fails to adequately control symptoms of withdrawal, pharmacological management is initiated to improve infant discomfort, allow for adequate feeding and nutrition, and facilitate parental bonding (Table 2).11 Opioids are the primary agent used for pharmacologic treatment, and morphine is the most commonly utilized.17 Morphine is a short-acting opioid and can be prescribed either as a weight-based weaning protocol or symptom-based regimen. Methadone is also widely used, and as a long-acting opioid, it has the advantage of twice daily dosing after the initial loading dose. Recently, buprenorphine, a partial mu opioid agonist with a long half-life, has emerged as a promising primary opioid treatment agent and has been shown to reduce the length of stay and the number of opioid treatment days compared with morphine and methadone.36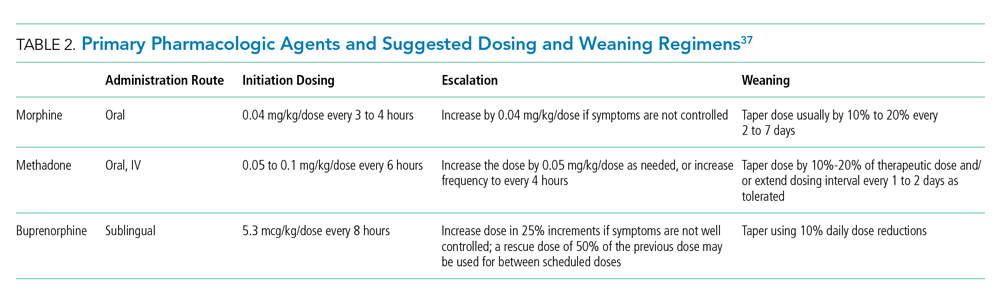
When the signs and symptoms of NAS are not effectively controlled with a primary opioid or in the case of polysubstance exposure, adjunctive agents are often used, with phenobarbital and clonidine being the most common (Table 3).11 Regardless of opioid agent used, multicenter quality improvement initiatives demonstrate that having a standardized weaning protocol is critical to minimizing the overall length of stay and reducing the need for adjunctive agents.38,39 Additionally, modeling tools such as pharmacometrics for methadone and buprenorphine have shown promise in optimizing dose selection.40,41 Modeling may include pharmacodynamic data (ie, clinical response to treatment), pharmacokinetics (ie, measures of drug distribution and clearance), and other factors, such as patient demographics, intrauterine exposure type, and symptom severity. Future studies should examine weight versus symptom-based dosing regimens as well as compare weaning schedules versus “as needed” dosing regimens.11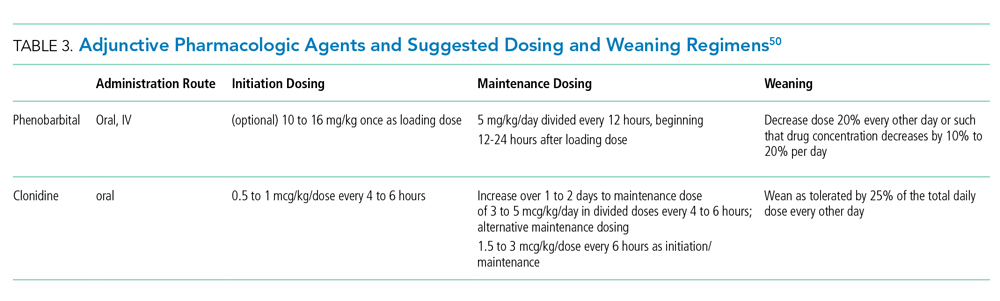
PSYCHOSOCIAL CONSIDERATIONS
The need for comprehensive medical and psychosocial supports for mothers with OUD cannot be overstated, given the high rates of concurrent illicit or other substance use, comorbid depression and anxiety, physical and sexual trauma, poverty and homelessness, intravenous drug use, and sex-related risk patterns.15 Significant issues of healthcare-associated stigma and criminality also affect this population. As of 2019, 23 states and the District of Columbia classify substance use during pregnancy as child abuse under civil child-welfare statutes, potentially resulting in termination of parental rights.42 Studies of mothers with OUD have demonstrated that they often experience guilt, shame, and fear of loss of custody, all of which can impede their trust in hospital providers and future engagement in care.43 They also report frustration with and mistrust of NAS scoring assessments, which they can perceive to be disruptive and potentially biased.44 Multiple approaches should be considered to standardize and improve the hospital experience for this population, in a way that emphasizes the mother’s role as a capable, respected participant in her newborn’s care.
Maternal Support
A coordinated, multidisciplinary approach to comprehensively support mothers with OUD should involve team members from pediatrics, neonatology, obstetrics, nursing, social work, case management, and lactation.35 This support includes screening for adequate resources and a safe, supportive, drug-free home environment as well as evaluating co-occurring mental health conditions. Referrals should be provided as needed to social services, postpartum psychiatry or behavioral health services, OUD treatment and relapse-prevention programs, and harm reduction services (eg, naloxone training). In addition to the healthcare team, other community members can be enlisted to serve as a trusted, consistent, and nonjudgmental support during the hospitalization; examples may include a peer support (another mother with OUD), an OUD program caseworker, or a doula.44
Clinical Pathways
Hospitals should establish clinical pathways for women with OUD to standardize care and communication across the continuum of care for themselves and their newborn, with input from all healthcare team members involved (prenatal, intrapartum, and postpartum).35 Early, consistent information should be provided regarding expected newborn hospital course, including toxicology testing, NAS monitoring, possible NICU admission, and involvement of social work.
Provider Training
Educational opportunities in the form of continuing medical education, in-service trainings, etc., should be provided for clinical staff who care for mothers with OUD and their newborns, regarding issues of substance use, stigma, bias, and trauma-informed care.35 Online training resources are available through the American Society of Addiction Medicine, the ACOG, AAP, the Centers for Disease Control and Prevention, and the Substance Abuse and Mental Health Services Administration.
DISCHARGE PLANNING
Regardless of whether or not NAS is treated pharmacologically, newborns with opioid exposure may experience residual symptoms of withdrawal that persist for months.4 Current research suggests increased risk for morbidity, emergency department utilization, and rehospitalization after discharge in this population as well as difficulty in accessing and engaging with pediatric preventative care.45, 46
A clear plan should be established upon discharge to ensure optimal newborn care and follow-up. A complete record of the newborn’s hospital stay, including maternal toxicology screenings and summary of any social work documentation, should be communicated to the primary care provider upon discharge. Close postdischarge monitoring involves addressing parenting knowledge gaps, assessing illness and injury risk, and evaluating for the presence of ongoing withdrawal symptoms.4 Primary care providers can also play a key role in assessing maternal stress, coping, and parenting skills as well as helping families connect to resources. Further research is warranted on how pediatric primary care systems can better build maternal trust, address parenting needs, and engage this population in routine well-child care.47
Child Welfare, Early Intervention, and Other Services
In general, newborn safety and keeping families intact should be prioritized, with disposition into foster care only in cases of concern for child maltreatment or neglect. Under the Child Abuse Prevention and Treatment Act (CAPTA), states are required to develop Plans of Safe Care for women and newborns affected by OUD, with the goal of fostering collaboration between healthcare and social service organizations around care of these families.48 Given the variable interpretation of Plans of Safe Care across the U.S., providers should be knowledgeable about state and local statutes and reporting requirements related to parental substance use.
As part of Plans of Safe Care, providers may be well-positioned to initiate referrals for early intervention, home visiting, and other programs designed to provide developmental or wrap-around support for families. Under Part C of the Individuals with Disabilities Education Act, many states offer early intervention on the basis of NAS as an automatic qualifying diagnosis; however, attrition of eligible families along the referral and enrollment process is substantial.49 A standardized approach to discharging opioid-exposed newborns includes referrals to available resources and discussion of their importance with families and may increase utilization and decrease variation in care.50
CONCLUSION
Maternal OUD presents a unique combination of medical and psychosocial challenges that affect hospital care for mothers and their newborns. Optimal care for this population warrants a multidisciplinary team of providers who are knowledgeable, collaborative, and mindful of the important role of the mother as a key participant in her newborn’s care. Despite a large and growing body of research focused on NAS prevention, screening, and treatment, ongoing efforts are needed to create hospital policies and clinical pathways that are responsive to the healthcare needs of this population, navigate sensitive issues of criminality and stigma, and ultimately support maternal parenting success.
Disclosures
The authors have no financial relationships and conflicts of interest relevant to this article to disclose.
Funding
Funding for this work was provided by Cincinnati Children’s Hospital Medical Center and Nemours/AI duPont Hospital for Children.
2. Tolia VN, Patrick SW, Bennett MM, et al. Increasing incidence of the neonatal abstinence syndrome in U.S. neonatal ICUs. N Engl J Med. 2015;372(22):2118-2126. https://doi.org/10.1056/NEJMsa1500439.
3. Devlin LA, Davis JM. A practical approach to neonatal opiate withdrawal syndrome. Am J Perinatol. 2018;35(4):324-330. https://doi.org/10.1055/s-0037-1608630.
4. Kocherlakota P. Neonatal abstinence syndrome. Pediatrics. 2014;134(2):e547-e561. https://doi.org/10.1542/peds.2013-3524.
5. Kaltenbach K, Holbrook AM, Coyle MG, et al. Predicting treatment for neonatal abstinence syndrome in infants born to women maintained on opioid agonist medication. Addiction. 2012;107 Supplement 1:45-52. https://doi.org/10.1111/j.1360-0443.2012.04038.x.
6. Huybrechts KF, Bateman BT, Desai RJ, et al. Risk of neonatal drug withdrawal after intrauterine co-exposure to opioids and psychotropic medications: cohort study. BMJ. 2017;358:j3326. https://doi.org/10.1136/bmj.j3326.
7. Wachman EM, Hayes MJ, Brown MS, et al. Association of OPRM1 and COMT single-nucleotide polymorphisms with hospital length of stay and treatment of neonatal abstinence syndrome. JAMA. 2013;309(17):1821-1827. https://doi.org/10.1001/jama.2013.3411.
8. Mactier H, McLaughlin P, Gillis C, Osselton MD. Variations in infant CYP2B6 genotype associated with the need for pharmacological treatment for neonatal abstinence syndrome in infants of methadone-maintained opioid-dependent mothers. Am J Perinatol. 2017;34(9):918–921. https://doi.org/10.1055/s-0037-1600917.
9. Jilani SM, Frey MT, Pepin D, et al. Evaluation of state-mandated reporting of neonatal abstinence syndrome - six states, 2013-2017. MMWR Morb Mortal Wkly Rep. 2019;68(1):6-10. https://doi.org/10.15585/mmwr.mm6801a2.
10. Maalouf FI, Cooper WO, Stratton SM, et al. Positive predictive value of administrative data for neonatal abstinence syndrome. Pediatrics. 2019;143(1). https://doi.org/10.1542/peds.2017-4183.
11. Mangat AK, Schmölzer GM, Kraft WK. Pharmacological and non-pharmacological treatments for the Neonatal Abstinence Syndrome (NAS). Semin Fetal Neonat Med. 2019;24(2):133-141. https://doi.org/10.1016/j.siny.2019.01.009.
12. Ko JY, Wolicki S, Barfield WD, et al. CDC Grand Rounds: public health strategies to prevent neonatal abstinence syndrome. MMWR Morb Mortal Wkly Rep. 2017;66(9):242-245. https://doi.org/10.15585/mmwr.mm6609a2.
13. Patrick SW, Faherty LJ, Dick AW, et al. Association Among County-Level economic factors, clinician supply, metropolitan or rural location, and neonatal abstinence syndrome. JAMA. 2019;321(4):385-393. https://doi.org/10.1001/jama.2018.20851.
14. Villapiano NL, Winkelman TN, Kozhimannil KB, Davis MM, Patrick SW. Rural and urban differences in neonatal abstinence syndrome and maternal opioid use, 2004 to 2013. JAMA Pediatr. 2017;171(2):194-196. https://doi.org/10.1001/jamapediatrics.2016.3750.
15. Committee on Obstetric Practice. Committee Opinion No. 711: Opioid use and opioid use disorder in pregnancy. Committee Opinion No. 711: Opioid Use and Opioid Use Disorder in Pregnancy. Obstet Gynecol. 2017;130(2):e81-e94. https://doi.org/10.1097/AOG.0000000000002235.
16. Wexelblatt SL, Ward LP, Torok K, et al. Universal maternal drug testing in a high-prevalence region of prescription opiate abuse. J Pediatr. 2015;166(3):582-586. https://doi.org/10.1016/j.jpeds.2014.10.004.
17. Bogen DL, Whalen BL, Kair LR, Vining M, King BA. Wide variation found in care of opioid-exposed newborns. Acad Pediatr. 2017;17(4):374-380. https://doi.org/10.1016/j.acap.2016.10.003.
18. Cotten SW. Drug testing in the neonate. Clin Lab Med. 2012;32(3):449-466. https://doi.org/10.1016/j.cll.2012.06.008.
19. Colby JM, Adams BC, Morad A, Presley LD, Patrick SW. Umbilical cord tissue and meconium may not be equivalent for confirming in utero substance exposure. J Pediatr. 2019;205:277-280. https://doi.org/10.1016/j.jpeds.2018.09.046.
20. Hudak ML, Tan RC, COMMITTEE ON DRUGS, COMMITTEE ON FETUS AND NEWBORN, American Academy of Pediatrics. Neonatal drug withdrawal. Pediatrics. 2012;129(2):e540-e560. https://doi.org/10.1542/peds.2011-3212.
21. Finnegan LP, Connaughton JF, Jr, Kron RE, Emich JP. Neonatal abstinence syndrome: assessment and management. Addict Dis. 1975;2(1-2):141-158.
22. Zimmermann-Baer U, Nötzli U, Rentsch K, Bucher HU. Finnegan neonatal abstinence scoring system: normal values for first 3 days and weeks 5-6 in non-addicted infants. Addiction. 2010;105(3):524-528. https://doi.org/10.1111/j.1360-0443.2009.02802.x.
23. Jones HE, Seashore C, Johnson E, et al. Measurement of neonatal abstinence syndrome: evaluation of short forms. J Opioid Manag. 2016;12(1):19-23. https://doi.org/10.5055/jom.2016.0308.
24. Isemann BT, Stoeckle EC, Taleghani AA, Mueller EW. Early prediction tool to identify the need for pharmacotherapy in infants at risk of neonatal abstinence syndrome. Pharmacotherapy. 2017;37(7):840-848. https://doi.org/10.1002/phar.1948.
25. Schiff DM, Grossman MR. Beyond the Finnegan scoring system: novel assessment and diagnostic techniques for the opioid-exposed infant. Semin Fetal Neonat Med. 2019;24(2):115-120. https://doi.org/10.1016/j.siny.2019.01.003.
26. Grossman MR, Berkwitt AK, Osborn RR, et al. An initiative to improve the quality of care of infants With neonatal abstinence syndrome. Pediatrics. 2017;139(6). https://doi.org/10.1542/peds.2016-3360.
27. Wachman EM, Grossman M, Schiff DM, et al. Quality improvement initiative to improve inpatient outcomes for Neonatal Abstinence Syndrome. J Perinatol. 2018;38(8):1114-1122. https://doi.org/10.1038/s41372-018-0109-8.
28. Holmes AV, Atwood EC, Whalen B, et al. Rooming-in to treat neonatal abstinence syndrome: improved family-centered care at lower cost. Pediatrics. 2016;137(6). https://doi.org/10.1542/peds.2015-2929.
29. MacMillan KDL, Rendon CP, Verma K, et al. Association of rooming-in With outcomes for neonatal abstinence syndrome: A systematic review and meta-analysis. JAMA Pediatr. 2018 Apr 1;172(4):345-351. https://doi.org/10.1001/jamapediatrics.2017.5195.
30. Jackson HJ, Lopez C, Miller S, Engelhardt B. A scoping review of acupuncture as a potential intervention for neonatal abstinence syndrome. Med Acupunct. 2019;31(2):69-84. https://doi.org/10.1089/acu.2018.1323.
31. Reece-Stremtan S, Marinelli KA. ABM clinical protocol #21: Guidelines for breastfeeding and substance use or substance use disorder, revised 2015. Breastfeed Med. 2015;10(3):135-141. https://doi.org/10.1089/bfm.2015.9992.
32. Krans EE, Campopiano M, Cleveland LM, et al. National partnership for maternal safety: consensus bundle on obstetric care for women With opioid use disorder. Obstet Gynecol. 2019;134(2):365-375. https://doi.org/10.1097/AOG.0000000000003381.
33. Bogen DL, Hanusa BH, Baker R, Medoff-Cooper B, Cohlan B. Randomized clinical trial of standard- Versus high-calorie formula for methadone-exposed infants: A feasibility study. Hosp Pediatr. 2018;8(1):7-14. https://doi.org/10.1542/hpeds.2017-0114.
34. Lexicomp. Opioids, Urine, Screen and Confirmation. https://online.lexi.com/lco/action/doc/retrieve/docid/lthdph/382929. Accessed September 4, 2019.
35. Mayo Clinic Laboratories. Opiates. https://www.mayocliniclabs.com/test-info/drug-book/opiates.html. Accessed Sept 4, 2019.
36. Kraft WK, Adeniyi-Jones SC, Chervoneva I, et al. Buprenorphine for the treatment of the neonatal abstinence syndrome. N Engl J Med. 2017;376(24):2341-2348. https://doi.org/10.1056/NEJMoa1614835.
37. Lexicomp. https://online.lexi.com/lco/action/home. Accessed September 4, 2019
38. Hall ES, Wexelblatt SL, Crowley M, et al. Implementation of a neonatal abstinence syndrome weaning protocol: A multicenter cohort study. Pediatrics. 2015;136(4):e803-e810. https://doi.org/10.1542/peds.2015-1141.
39. Patrick SW, Schumacher RE, Horbar JD, et al. Improving care for neonatal abstinence syndrome. Pediatrics. 2016;137(5):38. https://doi.org/10.1542/peds.2015-3835.
40. Wiles JR, Isemann B, Mizuno T, et al. Pharmacokinetics of oral methadone in the treatment of neonatal abstinence syndrome: A pilot study. J Pediatr. 2015;167(6):1214–20.e3. https://doi.org/10.1016/j.jpeds.2015.08.032.
41. Ng CM, Dombrowsky E, Lin H, et al. Population pharmacokinetic model of sublingual buprenorphine in neonatal abstinence syndrome. Pharmacotherapy. 2015;35(7):670-680. https://doi.org/10.1002/phar.1610.
42. The Guttmacher Institute. Substance abuse During pregnancy. https://www.guttmacher.org/state-policy/explore/substance-use-during-pregnancy. Accessed November 20, 2019; Updated November 1, 2019.
43. Cleveland LM, Bonugli R. Experiences of mothers of infants with neonatal abstinence syndrome in the neonatal intensive care unit. J Obstet Gynecol Neonat Nurs. 2014;43(3):318-329. https://doi.org/10.1111/1552-6909.12306.
44. Rockefeller K, Macken LC, Craig A. Trying to do what is best: A qualitative study of maternal-infant bonding and neonatal abstinence syndrome. Adv Neonat Care. 2019;19(5):E3-E15. https://doi.org/10.1097/ANC.0000000000000616.
45. Liu G, Kong L, Leslie DL, Corr TE. A longitudinal healthcare use profile of children with a history of neonatal abstinence syndrome. J Pediatr. 2019;204:111-117. https://doi.org/10.1016/j.jpeds.2018.08.032.
46. Goyal NK, Rhode JF, Short V, et al. Well child care adherence during the first 2 years of life after intrauterine opioid exposure. Pediatrics. In press.
47. Short VL, Goyal NK, Chung EK, Hand DJ, Abatemarco DJ. Perceptions of pediatric primary care among mothers in treatment for opioid use disorder. J Commun Health. 2019 Dec;44(6):1127-1134. https://doi.org/10.1007/s10900-019-00701-1.
48. Plans of Safe Care. Administration for Children and Families. https://www.acf.hhs.gov/sites/default/files/cb/pi1702.pdf. Accessed September 1, 2019.
49. Peacock-Chambers E, Leyenaar JK, Foss S, et al. Early Intervention referral and enrollment among infants with neonatal abstinence syndrome. J Dev Behav Pediatr. 2019;40(6):441-450. https://doi.org/10.1097/DBP.0000000000000679.
50. Crook TW, Munn EK, Scott TA, et al. Improving the discharge process for opioid-exposed neonates. Hosp Pediatr. 2019;9(8):643-648. https://doi.org/10.1542/hpeds.2019-0088.
In the past two decades, the incidence rate of opioid use disorder (OUD) among pregnant women has increased by more than 400%, constituting a United States public health crisis.1 Newborns exposed to intrauterine opioids are at risk for the postnatal withdrawal syndrome known as neonatal abstinence syndrome (NAS), which requires increased hospital resources, such as neonatal intensive care unit (NICU) admission and prolonged length of stay.2 Given the medical and psychosocial challenges associated with maternal OUD and NAS, a multidisciplinary, patient-centered approach to hospital care for affected newborns and their mothers is warranted. A large and growing body of research has focused on the epidemiology of NAS and approaches for its prevention, screening, and management. This review appraises updates to the literature within the past five years, with an emphasis on considerations for newborn discharge to promote optimal care for this population.
DEFINITION
NAS is a complex disorder arising from the abrupt cessation of placental transfer of opioids after birth, although other maternal substances, including benzodiazepines and other antidepressants, have been less commonly implicated.2 The term neonatal opioid withdrawal syndrome is sometimes used to indicate withdrawal from opioids specifically.3 The central and autonomic nervous systems and the gastrointestinal system (eg, tremors, increased muscle tone, high-pitched crying, feeding difficulties) are affected in NAS, with most newborns demonstrating symptoms within the first few days of life.4 Previously reported factors associated with NAS include opioid type, timing of exposure during pregnancy, maternal tobacco use, infant sex, and gestational age.5 Literature demonstrates that concurrent exposure to other prenatal substances, particularly antidepressants, benzodiazepines, and gabapentin, is significantly associated with increased risk of NAS.6 Recent studies also suggest that expression of NAS may relate to newborn genetic variations, particularly at the OPRM1, COMT, and CYP2B6 gene sites.7, 8
State health departments have increasingly deemed NAS as a reportable diagnosis for public health surveillance, which relies on the accurate diagnosis and documentation of NAS during birth hospitalization.9 The diagnosis codes for NAS include the International Classification of Diseases, Ninth Revision, Clinical Modification code (ICD-9-CM) 779.5 and the International Classification of Diseases, Tenth Revision, Clinical Modification ICD-10-CM code P96.1.10 However, given the variation in the presentation and severity of NAS, no consensus has been established with regard to a standardized case definition for reporting across hospitals and states.9 In fact, NAS should be conceptualized as a continuum of withdrawal symptoms along which every infant with intrauterine opioid exposure resides; this continuum ranges from minor findings, which do not affect the infant’s ability to grow and develop, to severe withdrawal, resulting in excessive weight loss, dehydration, or seizures.3,11 Ultimately, the diagnosis of NAS is made clinically based on cardinal symptoms in the setting of known or highly suspected opioid exposure. In a recent study of Tennessee Medicaid claims data, >25% of infants with a confirmed diagnosis code for NAS did not receive pharmacotherapy.10 Pharmacologic treatment of NAS, therefore, may be more appropriately considered as a marker of disease severity, rather than a requirement for diagnosis.
EPIDEMIOLOGY
Although the opioid crisis and resulting rise in NAS have affected communities across the US, substantial statewide variation exists, with extremes ranging from 0.7 per 1,000 births affected by NAS in Hawaii to 33.4 per 1,000 births in West Virginia.12 Within states, increased maternal OUD and NAS rates have also disproportionately affected rural communities possibly due to reduced access to healthcare and mental health services and poor economic conditions.13 A recent national study demonstrated that the proportion of newborns with NAS who were born in rural hospitals increased from 12.9% to 21.2% over the past decade; these rural newborns with NAS are more likely to be publicly insured and to require transfer after birth than newborns in urban hospitals.14 These data suggest a particular need among rural communities for increased resources targeting NAS care as well as maternal OUD prevention and treatment.
RISK IDENTIFICATION
The American College of Obstetricians and Gynecologists (ACOG) recommends early universal screening for maternal substance use at the first prenatal visit with a validated screening tool; examples include the 4Ps (parents, partners, past, and pregnancy), CRAFFT (car, relax, alone, forget, friends, trouble), and the National Institute on Drug Abuse quick screen, which have all been well studied and have a high sensitivity for detecting substance use and misuse.15
Toxicology Screening
Toxicology testing for both mother and newborn is helpful in identifying or confirming intrauterine exposures, particularly in cases of polysubstance use or when a newborn manifests signs of NAS but whose mother denies opioid use. All toxicology testing should be performed with the mother’s consent, and any potential legal or mandatory ramifications of a positive test should be considered. Although universal maternal toxicology testing improves the identification of newborns at risk for NAS, this approach remains controversial; most hospitals use a risk-based approach for maternal toxicology testing.16,17
Newborn toxicology testing can be performed from samples of hair, urine, meconium, and umbilical cord. Although frequently used, newborn urine testing has the shortest window of detection, ie, the last few days prior to delivery (Table 1). Meconium drug testing has been considered the gold standard and can detect exposures from the last 20 weeks of gestation, providing information on chronic exposures.18 In a recent survey, 10% of hospitals reported using umbilical cord toxicology as the primary method for detecting intrauterine exposures.17 This approach allows greater ease of specimen collection but may not yield results that are exactly equivalent to meconium testing.19
MONITORING AND EVALUATION
Close monitoring for development of NAS after birth is indicated for all newborns with confirmed or suspected intrauterine opioid exposure. Although the current American Academy of Pediatrics (AAP) guidelines recommend three days of newborn observation for exposure to short-acting opioids and five to seven days for longer acting opioids, substantial variation has been described across US hospitals in policies related to newborn length of stay for NAS observation.17, 20 In most hospitals, monitoring for NAS occurs in the routine postpartum unit (ie, level 1 nursery), with transfer to the NICU if pharmacologic treatment is indicated.17
The most widely used assessment tool for NAS is the Finnegan Neonatal Abstinence Scoring System (FNASS) or the modified FNASS, which assigns points for the 21 most common opioid withdrawal symptoms based on perceived severity.17, 21 This tool allows for assessment of symptoms, helps determine need for pharmacologic intervention, and can guide monitoring of symptoms and weaning of therapy. A commonly used score cutoff of 8 is based on prior research validating scores >8 as indicative of withdrawal symptoms as opposed to normal newborn findings.22 Despite its popularity and widespread usage, FNASS has limitations, including the need for the newborn to be stimulated or disturbed to produce an accurate assessment and scoring for nonspecific signs of withdrawal, including sneezing, yawning, and stuffiness. Recent work has attempted to simplify and shorten the FNASS to elements that are unique and specific for withdrawal.23,24 Further research is needed to establish the validity of common scoring practices (ie, use of 8 as a cutoff) to determine the need for pharmacologic treatment.25
Recent studies suggest that simple, function-based assessments, such as the Eat, Sleep, Console (ESC) approach developed by Grossman and colleagues, may serve as an alternative to the FNASS for evaluating withdrawal.26,27 With ESC, the need for pharmacotherapy is evaluated by the newborn’s ability to (1) eat (breastfeed successfully or eat at least 1oz per feed), (2) sleep uninterrupted for at least one hour, and (3) be consoled within 10 minutes. To date, research on the implementation of ESC has primarily focused on reducing length of stay and need for pharmacologic treatment in the context of quality improvement initiatives.26,27 Further prospective studies are warranted that compare ESC to traditional approaches involving the FNASS, and that evaluate post-discharge outcomes including newborn weight gain, ongoing withdrawal symptoms at home, and readmission.
NONPHARMACOLOGIC TREATMENT
In recent years, research increasingly supports the critical role of nonpharmacological care in management of all opioid-exposed newborns, regardless of NAS severity.11,27, 28 Rooming-in of mothers or caregivers has been shown to decrease the need for pharmacologic treatment, shorten the length of stay, and reduce hospital costs.28,29 Other well-established practices include maintaining a low stimulus environment for infants with low lighting and sound, swaddling, maximizing caregiver contact with kangaroo care and skin to skin, and minimizing interventions. Therapeutic modalities, such as massage and music therapy, have been used for infants with NAS, but no evidence has supported their use. Recent studies have increasingly supported the use of acupuncture as an emerging modality in treating NAS. 30
Feeding
Breastfeeding is encouraged for mothers who are stable on their methadone or buprenorphine maintenance treatment, are not using heroin or other illicit drugs, and have no other contraindications to breastfeeding, such as human immunodeficiency virus.31 Despite the known benefits of breastfeeding, which include decreased NAS severity, decreased need for pharmacological treatment, and shortened length of hospital stay, breastfeeding rates among mothers with OUD are low.31 Hospital policies that can promote maternal success in breastfeeding include tailored breastfeeding support, rooming in, and early, consistent maternal education on the benefits and safety of breastfeeding.32 A small percentage of hospitals use donor breastmilk for this population, although data on outcomes are limited.17 For formula-fed newborns, emerging research suggests that early initiation of high-calorie (22-24 kcal/ounce) formula may be beneficial to prevent excessive weight loss and poor weight gain after intrauterine opioid exposure.33
PHARMACOLOGIC TREATMENT
When supportive therapy fails to adequately control symptoms of withdrawal, pharmacological management is initiated to improve infant discomfort, allow for adequate feeding and nutrition, and facilitate parental bonding (Table 2).11 Opioids are the primary agent used for pharmacologic treatment, and morphine is the most commonly utilized.17 Morphine is a short-acting opioid and can be prescribed either as a weight-based weaning protocol or symptom-based regimen. Methadone is also widely used, and as a long-acting opioid, it has the advantage of twice daily dosing after the initial loading dose. Recently, buprenorphine, a partial mu opioid agonist with a long half-life, has emerged as a promising primary opioid treatment agent and has been shown to reduce the length of stay and the number of opioid treatment days compared with morphine and methadone.36
When the signs and symptoms of NAS are not effectively controlled with a primary opioid or in the case of polysubstance exposure, adjunctive agents are often used, with phenobarbital and clonidine being the most common (Table 3).11 Regardless of opioid agent used, multicenter quality improvement initiatives demonstrate that having a standardized weaning protocol is critical to minimizing the overall length of stay and reducing the need for adjunctive agents.38,39 Additionally, modeling tools such as pharmacometrics for methadone and buprenorphine have shown promise in optimizing dose selection.40,41 Modeling may include pharmacodynamic data (ie, clinical response to treatment), pharmacokinetics (ie, measures of drug distribution and clearance), and other factors, such as patient demographics, intrauterine exposure type, and symptom severity. Future studies should examine weight versus symptom-based dosing regimens as well as compare weaning schedules versus “as needed” dosing regimens.11
PSYCHOSOCIAL CONSIDERATIONS
The need for comprehensive medical and psychosocial supports for mothers with OUD cannot be overstated, given the high rates of concurrent illicit or other substance use, comorbid depression and anxiety, physical and sexual trauma, poverty and homelessness, intravenous drug use, and sex-related risk patterns.15 Significant issues of healthcare-associated stigma and criminality also affect this population. As of 2019, 23 states and the District of Columbia classify substance use during pregnancy as child abuse under civil child-welfare statutes, potentially resulting in termination of parental rights.42 Studies of mothers with OUD have demonstrated that they often experience guilt, shame, and fear of loss of custody, all of which can impede their trust in hospital providers and future engagement in care.43 They also report frustration with and mistrust of NAS scoring assessments, which they can perceive to be disruptive and potentially biased.44 Multiple approaches should be considered to standardize and improve the hospital experience for this population, in a way that emphasizes the mother’s role as a capable, respected participant in her newborn’s care.
Maternal Support
A coordinated, multidisciplinary approach to comprehensively support mothers with OUD should involve team members from pediatrics, neonatology, obstetrics, nursing, social work, case management, and lactation.35 This support includes screening for adequate resources and a safe, supportive, drug-free home environment as well as evaluating co-occurring mental health conditions. Referrals should be provided as needed to social services, postpartum psychiatry or behavioral health services, OUD treatment and relapse-prevention programs, and harm reduction services (eg, naloxone training). In addition to the healthcare team, other community members can be enlisted to serve as a trusted, consistent, and nonjudgmental support during the hospitalization; examples may include a peer support (another mother with OUD), an OUD program caseworker, or a doula.44
Clinical Pathways
Hospitals should establish clinical pathways for women with OUD to standardize care and communication across the continuum of care for themselves and their newborn, with input from all healthcare team members involved (prenatal, intrapartum, and postpartum).35 Early, consistent information should be provided regarding expected newborn hospital course, including toxicology testing, NAS monitoring, possible NICU admission, and involvement of social work.
Provider Training
Educational opportunities in the form of continuing medical education, in-service trainings, etc., should be provided for clinical staff who care for mothers with OUD and their newborns, regarding issues of substance use, stigma, bias, and trauma-informed care.35 Online training resources are available through the American Society of Addiction Medicine, the ACOG, AAP, the Centers for Disease Control and Prevention, and the Substance Abuse and Mental Health Services Administration.
DISCHARGE PLANNING
Regardless of whether or not NAS is treated pharmacologically, newborns with opioid exposure may experience residual symptoms of withdrawal that persist for months.4 Current research suggests increased risk for morbidity, emergency department utilization, and rehospitalization after discharge in this population as well as difficulty in accessing and engaging with pediatric preventative care.45, 46
A clear plan should be established upon discharge to ensure optimal newborn care and follow-up. A complete record of the newborn’s hospital stay, including maternal toxicology screenings and summary of any social work documentation, should be communicated to the primary care provider upon discharge. Close postdischarge monitoring involves addressing parenting knowledge gaps, assessing illness and injury risk, and evaluating for the presence of ongoing withdrawal symptoms.4 Primary care providers can also play a key role in assessing maternal stress, coping, and parenting skills as well as helping families connect to resources. Further research is warranted on how pediatric primary care systems can better build maternal trust, address parenting needs, and engage this population in routine well-child care.47
Child Welfare, Early Intervention, and Other Services
In general, newborn safety and keeping families intact should be prioritized, with disposition into foster care only in cases of concern for child maltreatment or neglect. Under the Child Abuse Prevention and Treatment Act (CAPTA), states are required to develop Plans of Safe Care for women and newborns affected by OUD, with the goal of fostering collaboration between healthcare and social service organizations around care of these families.48 Given the variable interpretation of Plans of Safe Care across the U.S., providers should be knowledgeable about state and local statutes and reporting requirements related to parental substance use.
As part of Plans of Safe Care, providers may be well-positioned to initiate referrals for early intervention, home visiting, and other programs designed to provide developmental or wrap-around support for families. Under Part C of the Individuals with Disabilities Education Act, many states offer early intervention on the basis of NAS as an automatic qualifying diagnosis; however, attrition of eligible families along the referral and enrollment process is substantial.49 A standardized approach to discharging opioid-exposed newborns includes referrals to available resources and discussion of their importance with families and may increase utilization and decrease variation in care.50
CONCLUSION
Maternal OUD presents a unique combination of medical and psychosocial challenges that affect hospital care for mothers and their newborns. Optimal care for this population warrants a multidisciplinary team of providers who are knowledgeable, collaborative, and mindful of the important role of the mother as a key participant in her newborn’s care. Despite a large and growing body of research focused on NAS prevention, screening, and treatment, ongoing efforts are needed to create hospital policies and clinical pathways that are responsive to the healthcare needs of this population, navigate sensitive issues of criminality and stigma, and ultimately support maternal parenting success.
Disclosures
The authors have no financial relationships and conflicts of interest relevant to this article to disclose.
Funding
Funding for this work was provided by Cincinnati Children’s Hospital Medical Center and Nemours/AI duPont Hospital for Children.
2. Tolia VN, Patrick SW, Bennett MM, et al. Increasing incidence of the neonatal abstinence syndrome in U.S. neonatal ICUs. N Engl J Med. 2015;372(22):2118-2126. https://doi.org/10.1056/NEJMsa1500439.
3. Devlin LA, Davis JM. A practical approach to neonatal opiate withdrawal syndrome. Am J Perinatol. 2018;35(4):324-330. https://doi.org/10.1055/s-0037-1608630.
4. Kocherlakota P. Neonatal abstinence syndrome. Pediatrics. 2014;134(2):e547-e561. https://doi.org/10.1542/peds.2013-3524.
5. Kaltenbach K, Holbrook AM, Coyle MG, et al. Predicting treatment for neonatal abstinence syndrome in infants born to women maintained on opioid agonist medication. Addiction. 2012;107 Supplement 1:45-52. https://doi.org/10.1111/j.1360-0443.2012.04038.x.
6. Huybrechts KF, Bateman BT, Desai RJ, et al. Risk of neonatal drug withdrawal after intrauterine co-exposure to opioids and psychotropic medications: cohort study. BMJ. 2017;358:j3326. https://doi.org/10.1136/bmj.j3326.
7. Wachman EM, Hayes MJ, Brown MS, et al. Association of OPRM1 and COMT single-nucleotide polymorphisms with hospital length of stay and treatment of neonatal abstinence syndrome. JAMA. 2013;309(17):1821-1827. https://doi.org/10.1001/jama.2013.3411.
8. Mactier H, McLaughlin P, Gillis C, Osselton MD. Variations in infant CYP2B6 genotype associated with the need for pharmacological treatment for neonatal abstinence syndrome in infants of methadone-maintained opioid-dependent mothers. Am J Perinatol. 2017;34(9):918–921. https://doi.org/10.1055/s-0037-1600917.
9. Jilani SM, Frey MT, Pepin D, et al. Evaluation of state-mandated reporting of neonatal abstinence syndrome - six states, 2013-2017. MMWR Morb Mortal Wkly Rep. 2019;68(1):6-10. https://doi.org/10.15585/mmwr.mm6801a2.
10. Maalouf FI, Cooper WO, Stratton SM, et al. Positive predictive value of administrative data for neonatal abstinence syndrome. Pediatrics. 2019;143(1). https://doi.org/10.1542/peds.2017-4183.
11. Mangat AK, Schmölzer GM, Kraft WK. Pharmacological and non-pharmacological treatments for the Neonatal Abstinence Syndrome (NAS). Semin Fetal Neonat Med. 2019;24(2):133-141. https://doi.org/10.1016/j.siny.2019.01.009.
12. Ko JY, Wolicki S, Barfield WD, et al. CDC Grand Rounds: public health strategies to prevent neonatal abstinence syndrome. MMWR Morb Mortal Wkly Rep. 2017;66(9):242-245. https://doi.org/10.15585/mmwr.mm6609a2.
13. Patrick SW, Faherty LJ, Dick AW, et al. Association Among County-Level economic factors, clinician supply, metropolitan or rural location, and neonatal abstinence syndrome. JAMA. 2019;321(4):385-393. https://doi.org/10.1001/jama.2018.20851.
14. Villapiano NL, Winkelman TN, Kozhimannil KB, Davis MM, Patrick SW. Rural and urban differences in neonatal abstinence syndrome and maternal opioid use, 2004 to 2013. JAMA Pediatr. 2017;171(2):194-196. https://doi.org/10.1001/jamapediatrics.2016.3750.
15. Committee on Obstetric Practice. Committee Opinion No. 711: Opioid use and opioid use disorder in pregnancy. Committee Opinion No. 711: Opioid Use and Opioid Use Disorder in Pregnancy. Obstet Gynecol. 2017;130(2):e81-e94. https://doi.org/10.1097/AOG.0000000000002235.
16. Wexelblatt SL, Ward LP, Torok K, et al. Universal maternal drug testing in a high-prevalence region of prescription opiate abuse. J Pediatr. 2015;166(3):582-586. https://doi.org/10.1016/j.jpeds.2014.10.004.
17. Bogen DL, Whalen BL, Kair LR, Vining M, King BA. Wide variation found in care of opioid-exposed newborns. Acad Pediatr. 2017;17(4):374-380. https://doi.org/10.1016/j.acap.2016.10.003.
18. Cotten SW. Drug testing in the neonate. Clin Lab Med. 2012;32(3):449-466. https://doi.org/10.1016/j.cll.2012.06.008.
19. Colby JM, Adams BC, Morad A, Presley LD, Patrick SW. Umbilical cord tissue and meconium may not be equivalent for confirming in utero substance exposure. J Pediatr. 2019;205:277-280. https://doi.org/10.1016/j.jpeds.2018.09.046.
20. Hudak ML, Tan RC, COMMITTEE ON DRUGS, COMMITTEE ON FETUS AND NEWBORN, American Academy of Pediatrics. Neonatal drug withdrawal. Pediatrics. 2012;129(2):e540-e560. https://doi.org/10.1542/peds.2011-3212.
21. Finnegan LP, Connaughton JF, Jr, Kron RE, Emich JP. Neonatal abstinence syndrome: assessment and management. Addict Dis. 1975;2(1-2):141-158.
22. Zimmermann-Baer U, Nötzli U, Rentsch K, Bucher HU. Finnegan neonatal abstinence scoring system: normal values for first 3 days and weeks 5-6 in non-addicted infants. Addiction. 2010;105(3):524-528. https://doi.org/10.1111/j.1360-0443.2009.02802.x.
23. Jones HE, Seashore C, Johnson E, et al. Measurement of neonatal abstinence syndrome: evaluation of short forms. J Opioid Manag. 2016;12(1):19-23. https://doi.org/10.5055/jom.2016.0308.
24. Isemann BT, Stoeckle EC, Taleghani AA, Mueller EW. Early prediction tool to identify the need for pharmacotherapy in infants at risk of neonatal abstinence syndrome. Pharmacotherapy. 2017;37(7):840-848. https://doi.org/10.1002/phar.1948.
25. Schiff DM, Grossman MR. Beyond the Finnegan scoring system: novel assessment and diagnostic techniques for the opioid-exposed infant. Semin Fetal Neonat Med. 2019;24(2):115-120. https://doi.org/10.1016/j.siny.2019.01.003.
26. Grossman MR, Berkwitt AK, Osborn RR, et al. An initiative to improve the quality of care of infants With neonatal abstinence syndrome. Pediatrics. 2017;139(6). https://doi.org/10.1542/peds.2016-3360.
27. Wachman EM, Grossman M, Schiff DM, et al. Quality improvement initiative to improve inpatient outcomes for Neonatal Abstinence Syndrome. J Perinatol. 2018;38(8):1114-1122. https://doi.org/10.1038/s41372-018-0109-8.
28. Holmes AV, Atwood EC, Whalen B, et al. Rooming-in to treat neonatal abstinence syndrome: improved family-centered care at lower cost. Pediatrics. 2016;137(6). https://doi.org/10.1542/peds.2015-2929.
29. MacMillan KDL, Rendon CP, Verma K, et al. Association of rooming-in With outcomes for neonatal abstinence syndrome: A systematic review and meta-analysis. JAMA Pediatr. 2018 Apr 1;172(4):345-351. https://doi.org/10.1001/jamapediatrics.2017.5195.
30. Jackson HJ, Lopez C, Miller S, Engelhardt B. A scoping review of acupuncture as a potential intervention for neonatal abstinence syndrome. Med Acupunct. 2019;31(2):69-84. https://doi.org/10.1089/acu.2018.1323.
31. Reece-Stremtan S, Marinelli KA. ABM clinical protocol #21: Guidelines for breastfeeding and substance use or substance use disorder, revised 2015. Breastfeed Med. 2015;10(3):135-141. https://doi.org/10.1089/bfm.2015.9992.
32. Krans EE, Campopiano M, Cleveland LM, et al. National partnership for maternal safety: consensus bundle on obstetric care for women With opioid use disorder. Obstet Gynecol. 2019;134(2):365-375. https://doi.org/10.1097/AOG.0000000000003381.
33. Bogen DL, Hanusa BH, Baker R, Medoff-Cooper B, Cohlan B. Randomized clinical trial of standard- Versus high-calorie formula for methadone-exposed infants: A feasibility study. Hosp Pediatr. 2018;8(1):7-14. https://doi.org/10.1542/hpeds.2017-0114.
34. Lexicomp. Opioids, Urine, Screen and Confirmation. https://online.lexi.com/lco/action/doc/retrieve/docid/lthdph/382929. Accessed September 4, 2019.
35. Mayo Clinic Laboratories. Opiates. https://www.mayocliniclabs.com/test-info/drug-book/opiates.html. Accessed Sept 4, 2019.
36. Kraft WK, Adeniyi-Jones SC, Chervoneva I, et al. Buprenorphine for the treatment of the neonatal abstinence syndrome. N Engl J Med. 2017;376(24):2341-2348. https://doi.org/10.1056/NEJMoa1614835.
37. Lexicomp. https://online.lexi.com/lco/action/home. Accessed September 4, 2019
38. Hall ES, Wexelblatt SL, Crowley M, et al. Implementation of a neonatal abstinence syndrome weaning protocol: A multicenter cohort study. Pediatrics. 2015;136(4):e803-e810. https://doi.org/10.1542/peds.2015-1141.
39. Patrick SW, Schumacher RE, Horbar JD, et al. Improving care for neonatal abstinence syndrome. Pediatrics. 2016;137(5):38. https://doi.org/10.1542/peds.2015-3835.
40. Wiles JR, Isemann B, Mizuno T, et al. Pharmacokinetics of oral methadone in the treatment of neonatal abstinence syndrome: A pilot study. J Pediatr. 2015;167(6):1214–20.e3. https://doi.org/10.1016/j.jpeds.2015.08.032.
41. Ng CM, Dombrowsky E, Lin H, et al. Population pharmacokinetic model of sublingual buprenorphine in neonatal abstinence syndrome. Pharmacotherapy. 2015;35(7):670-680. https://doi.org/10.1002/phar.1610.
42. The Guttmacher Institute. Substance abuse During pregnancy. https://www.guttmacher.org/state-policy/explore/substance-use-during-pregnancy. Accessed November 20, 2019; Updated November 1, 2019.
43. Cleveland LM, Bonugli R. Experiences of mothers of infants with neonatal abstinence syndrome in the neonatal intensive care unit. J Obstet Gynecol Neonat Nurs. 2014;43(3):318-329. https://doi.org/10.1111/1552-6909.12306.
44. Rockefeller K, Macken LC, Craig A. Trying to do what is best: A qualitative study of maternal-infant bonding and neonatal abstinence syndrome. Adv Neonat Care. 2019;19(5):E3-E15. https://doi.org/10.1097/ANC.0000000000000616.
45. Liu G, Kong L, Leslie DL, Corr TE. A longitudinal healthcare use profile of children with a history of neonatal abstinence syndrome. J Pediatr. 2019;204:111-117. https://doi.org/10.1016/j.jpeds.2018.08.032.
46. Goyal NK, Rhode JF, Short V, et al. Well child care adherence during the first 2 years of life after intrauterine opioid exposure. Pediatrics. In press.
47. Short VL, Goyal NK, Chung EK, Hand DJ, Abatemarco DJ. Perceptions of pediatric primary care among mothers in treatment for opioid use disorder. J Commun Health. 2019 Dec;44(6):1127-1134. https://doi.org/10.1007/s10900-019-00701-1.
48. Plans of Safe Care. Administration for Children and Families. https://www.acf.hhs.gov/sites/default/files/cb/pi1702.pdf. Accessed September 1, 2019.
49. Peacock-Chambers E, Leyenaar JK, Foss S, et al. Early Intervention referral and enrollment among infants with neonatal abstinence syndrome. J Dev Behav Pediatr. 2019;40(6):441-450. https://doi.org/10.1097/DBP.0000000000000679.
50. Crook TW, Munn EK, Scott TA, et al. Improving the discharge process for opioid-exposed neonates. Hosp Pediatr. 2019;9(8):643-648. https://doi.org/10.1542/hpeds.2019-0088.
© 2020 Society of Hospital Medicine
Diagnosis and Management of UTI in Febrile Infants Age 0–2 Months: Applicability of the AAP Guideline
Urinary tract infections (UTIs) are the most common bacterial infection and one of the most common reasons for hospitalization in young infants.1,2 The American Academy of Pediatrics (AAP) has published several clinical practice guidelines for the evaluation and management of febrile children ages 2-24 months with first-time UTIs, most recently in 2011 and affirmed in 2016.3 These guidelines do not provide recommendations for infants aged <2 months, which leads to uncertainty regarding the diagnosis and management of UTIs for infants in this age group. We assess the applicability of the AAP UTI Guideline’s action statements for infants aged <2 months presenting with first-time UTIs, with an emphasis on recent evidence. Because the considerations for bacterial infections differ for febrile infants aged <2 months compared with older infants, we do not discuss action statements one and two (determination of the likelihood of UTIs and decision to test urine) and statement seven (medical evaluation for fever after first UTI).3 Additionally, because concomitant bacteremia and meningitis are more common in this age group than in older infants, we review some of the controversies surrounding the diagnosis and treatment of these disease entities.
DIAGNOSIS
“Action Statement 3: To establish the diagnosis of UTI, clinicians should require both urinalysis results that suggest infection (pyuria and/or bacteriuria) and the presence of at least 50,000 colony-forming units (CFUs) per mL of a uropathogen cultured from a urine specimen obtained through catheterization or SPA.”3
To distinguish asymptomatic bacteriuria or contamination from a true UTI, the AAP Guideline requires both a positive urinalysis (UA) and culture for a diagnosis of a UTI.3 Historically, the UA was considered to be poorly sensitive for infections in young infants, with older studies reporting sensitivities ranging from 40% to 82% using urine culture as the gold standard.4-7 Thus, infants aged <2 months with positive urine cultures and negative UAs are often treated as having true UTIs, though this practice varies by institution.8 Possible explanations for the low UA sensitivity in this population include rapid bladder emptying, immature immune systems, and inability to concentrate urine. However, a negative UA plus a positive urine culture could also represent a “true negative” UA and a “false positive” culture, a finding that may be more common in young infants in whom sterile urine obtainment is often challenging.
Two recent studies have addressed this issue by evaluating the UA sensitivity in patients with bacteremic UTIs, as growth of the same pathogenic organism from the blood and urine almost certainly represents true infection.9,10 In a retrospective study of 203 infants aged <3 months with bacteremic UTIs, the presence of any leukocyte esterase (LE) or pyuria (>3 white blood cells per high-powered field [WBC/HPF]) had a sensitivity of 99.5% (95% CI: 98.5%-100%) and specificity of 93.9% (95% CI: 87.8%-93.2%).9 In a prospective, multicenter study of 4,147 febrile infants aged ≤60 days, of whom 27 infants had bacteremic UTIs, a positive UA (any LE, >5 WBC/HPF, or nitrite) had a sensitivity and specificity of 1.00 (95% CI: 0.87-1.00) and 0.91 (95% CI: 0.90-0.91), respectively.10 Although screening tests may appear to have higher sensitivity in more severely diseased populations (“spectrum bias”),11 it is not clear that infants with bacteremic UTIs are definitively sicker than infants with nonbacteremic UTIs (see “bacteremic UTI” section below). Additionally, this study found similarly excellent sensitivity (0.94 [95% CI: 0.90-0.96]) and specificity (0.91 [95% CI: 0.90-0.91]) of the UA among infants with nonbacteremic UTIs, including infants <28 days old.10
UA sensitivity (using urine culture as the gold standard) may be lower for non-Escherichia coli UTIs.9,10,12 In a retrospective study that included 90 infants <2 months old with UTIs, urine cultures yielding Pseudomonas aeruginosa, Enterococcus, or Klebsiella species were significantly less likely (odds ratio [95% CI]: 0.19 [0.06-0.60]; 0.14 [0.07-0.28]; 0.34 [0.17-0.68], respectively) to have pyuria (≥5 WBC/HPF) or LE (1+ or greater) than urine cultures yielding E. coli.,12 though an alternative explanation for this finding is that these organisms may be more likely to cause asymptomatic bacteriuria or contamination.13
The appropriate CFU/mL threshold to define a UTI and the extent that this threshold should vary by urine collection methods are still unclear. In the aforementioned bacteremic UTI study,9 12 patients with E. coli bacteremia had urine cultures with <50,000 CFU/mL plus pyuria (WBC or LE) in the UA, indicating that true UTIs may occur with <50,000 CFU/mL.
Based on these recent studies, we believe that the recommendation to incorporate UA results into the diagnoses of UTIs can be applied to infants <2 months old, as well as consideration for a UTI for colony counts of ≥10,000 CFU/mL if the UA is positive. For infants with positive urine cultures and negative UAs who have not received antibiotics, we suggest repeating both studies if treatment is being considered. For those who have started antibiotics, the pretest probability of a UTI, initial illness severity, and risks and benefits of continuing treatment should be considered.
TREATMENT
“Action Statement 4a: When initiating treatment, the clinician should base the choice of route of administration on practical considerations. Initiating treatment orally or parenterally is equally efficacious. The clinician should base the choice of agent on local antimicrobial sensitivity patterns (if available) and should adjust the choice according to sensitivity testing of the isolated uropathogen.”3
Most infants <2 months old with UTIs are hospitalized initially because of fever. Therefore, the decision point for most clinicians is not whether to hospitalize but for how long to hospitalize and treat with intravenous (IV) antibiotics prior to discharging home on oral antibiotics. Although all-oral antibiotic regimens are used to treat UTIs in older infants and children,14-18 to our knowledge, there are no randomized controlled trials (RCTs) comparing all-IV vs all-oral antibiotics or a longer vs shorter initial IV course that include infants <1 month old. In the trials that do include infants aged 1-2 months,14,18 the number of subjects in this age group is too small to draw conclusions, a finding supported by a 2014 Cochrane review.19 An adequately powered RCT of different IV antibiotic durations in this age group would be challenging. For example, nearly 1,000 subjects would be needed to demonstrate a statistically significant difference between a 5% and 10% relapse risk between groups, a difference that some may find clinically important.
The paucity of evidence in this age group may explain the considerable variability in the approach to IV antibiotic duration in young infants. Concerns about enteral absorption and underdeveloped immune systems may prompt some physicians to treat the youngest patients more aggressively. One study demonstrated that the proportion of patients <2 months old receiving prolonged courses (≥4 days) of IV antibiotics for UTIs in 46 U.S. children’s hospitals ranged from 0% to 67%.20 Similar variability across hospitals has been described in other observational studies21,22 and across subspecialties in one survey of pediatricians.23
Several observational studies provide additional evidence supporting shorter IV courses. In two studies that examined administrative databases, there was no difference in treatment failure rates between infants aged <2 months20 and <6 months21 receiving longer (≥4 days) vs shorter IV courses. In a study of 172 infants <1 month old with UTIs, the median IV duration was 4 days (range 2-12 days), and no subjects experienced treatment failure or relapse.24 In a multicenter study of 251 infants <3 months old with bacteremic UTIs, mean IV antibiotic durations ranged from 5.5–12 days, and no patient had a relapsed bacteremic UTI. Six infants (2.4%) had a relapsed UTI without bacteremia, with no association between IV antibiotic duration and relapse.22
Based on the available data and known risks of hospitalization and prolonged IV therapy, a reasonable approach for infants <1 month old would be to hospitalize for two to three days while awaiting blood and cerebral spinal fluid (CSF) culture results. Given the possibility of Enterococcus or Enterobacteriaceae that are resistant to third-generation cephalosporins, standard therapy of ampicillin and gentamicin for febrile neonates is reasonable, assuming there is no concern for meningitis. Antibiotics should be narrowed when susceptibilities are known. Once culture results return and signs and symptoms have resolved, discharge home on oral antibiotics is justifiable based on the available literature. For well-appearing infants aged 1-2 months with a presumptive UTI (based on UA results), if hospitalization is not warranted for other reasons, then we recommend outpatient treatment with oral or intramuscular therapy based on local susceptibilities (typically a cephalosporin) and close follow-up for one to two days while awaiting culture results. Although empiric cephalosporin therapy may not provide 100% coverage for all potential organisms, clinical deterioration is uncommon in infants and children receiving discordant therapy.25
“Action Statement 4b: The clinician should choose 7 to 14 days as the duration of antimicrobial therapy.”3
The AAP’s recommendation to provide antibiotics (by oral or parenteral route) for a minimum of seven days total stems from a 2002 meta-analysis comparing long (7-14 days) vs short (≤3 days) courses, where the pooled relative risk of treatment failure with short-course therapy was 1.94 (95% CI: 1.19-3.15).26 However, in this analysis, the trials that demonstrated inferiority with short courses were all trials that used single doses of antibiotics, and a similar Cochrane review comparing 2-4 days with 7-14 days demonstrated no differences in outcomes.27 Therefore, shorter total courses, but not a single dose, are probably appropriate for most UTIs in children. Although there are no obvious biologic reasons why longer total courses would be needed in young infants, there are unfortunately limited data comparing different total antibiotic durations in this age group. We believe that 7-14 days of total therapy is a reasonable recommendation for infants <2 months old, and that future studies should investigate shorter total courses.
IMAGING
“Action Statement 5: Febrile infants with UTIs should undergo renal and bladder ultrasonography (RBUS).”3
The AAP Guideline acknowledges that the RBUS is a poor screening test for the detection of genitourinary abnormalities in infants.3 The RBUS can be normal in infants with vesicoureteral reflux (VUR) or show nonspecific findings of unclear clinical significance.28 In a prospective study of 220 infants <3 months old by Tsai et al, 9/39 infants (23%) with grade III-V VUR had normal RBUS.29 Studies that included older infants have found a similar false-negative rate of 0%-40% for detecting grade IV-V VUR by RBUS.28 Nonetheless, since a RBUS is safe and noninvasive, we feel that the benefits of screening for abnormalities such as hydronephrosis (that could indicate posterior urethral valves or ureteropelvic junction obstruction) outweigh the risks (eg, false positives, overdiagnosis, and cost) of performing a RBUS after a first-time UTI.
“Action Statement 6a: Voiding cystourethrography (VCUG) should not be performed routinely after the first febrile UTI; VCUG is indicated if RBUS reveals hydronephrosis, scarring, or other findings that would suggest either high-grade VUR or obstructive uropathy, as well as in other atypical or complex clinical circumstances.”3
“Action Statement 6b: Further evaluation should be conducted if there is a recurrence of febrile UTI.”3
The RBUS may be normal in infants with VUR. Therefore, the AAP’s recommendation to perform a VCUG only if the RBUS is abnormal or after a recurrent UTI concedes that there will be infants with VUR who are missed after the first UTI.3
The United Kingdom’s National Institute for Health and Care Excellence guideline recommends a VCUG for infants <6 months old with a bacteremic or non-E. coli UTI.30 Whether high-grade VUR is more common in young infants with bacteremic UTIs than nonbacteremic UTIs remains inconclusive. In the Honkinen et al. study that included 87 infants <3 months old with bacteremic UTIs, the prevalence of grade IV-V VUR (10%) and obstruction (7%) was higher than that of the 88 nonbacteremic infants (2% grade IV-V VUR and 2% with obstruction). In the multicenter study of 251 infants <3 months old with bacteremic UTIs, the prevalence of grade IV-V VUR was 12.1%.31 This is higher than that of the nonbacteremic infants in Honkinen et al.’s study32 but more similar to the prevalence of grade IV-V VUR found in Tsai et al. (8.2%) and Ismaili et al.’s (7.0%) studies of UTIs in general.29,33
There does appear to be a higher prevalence of urinary tract abnormalities in young infants with non-E. coli vs E. coli UTIs.31,32,34,35 The odds of an abnormal VCUG was 8.0 (95% CI: 2.3-28) times higher for non-E. coli than E. coli UTIs in the study of 251 bacteremic infants.31 In a study of 122 infants <3 months old, the odds of grade III-V VUR was 10 (95% CI 2.6-41) times higher for non-E. coli than E. coli UTIs.35
However, the need for early detection of VUR is controversial, and VCUGs are invasive, involve ionizing radiation, and may require sedation. Two recent trials (one which included only children with VUR and another in which 42% of subjects had VUR) demonstrated a modest effect of prophylactic antibiotics in preventing recurrent UTIs (>5,000 doses of antibiotics needed to prevent one UTI recurrence), but the effect size did not differ by the presence or degree of VUR, and neither demonstrated any benefit in reducing future renal scarring.36, 37 The benefit of surgical interventions for VUR also remains unclear, though studies are limited.38 Overall, there is no evidence suggesting that infants <2 months old require more vigilance for VUR detection than the 2-24 month age group.
SPECIAL CONSIDERATIONS
Bacteremic UTI
The prevalence of bacteremia in infants ≤60 days old with UTIs was 9% in a study conducted from 2008 to 2013 in 26 EDs and has ranged from 3% to 17% in older studies.10, 22 Many studies have described similar clinical and laboratory findings in young infants with bacteremic and nonbacteremic UTIs.39-41 Despite this, bacteremic UTIs have been associated with prolonged parenteral antibiotic courses, resulting in longer hospitalizations and increased costs.40 Two recent multicenter studies of infants with bacteremic UTIs (251 infants <3 months old22 and 115 infants ≤60 days old42) demonstrated variable IV courses and no association between IV duration and relapsed UTI. The latter study showed no risk difference in the adjusted 30-day UTI recurrence (risk difference 3%, 95% CI: −5.8 to 12.7) or all-cause reutilization (risk difference 3%, 95% CI: −14.5 to 20.6) between long and short IV groups.42 Neither study had patients with relapsed bacteremic UTIs or reported that patients suffered clinical deterioration while on oral antibiotics.22,42
Based on these data demonstrating that adverse outcomes are rare in infants with bacteremic UTIs and not associated with parenteral antibiotic duration, we recommend short parenteral courses (2-3 days) with conversion to oral therapy once infants have clinically improved.
Positive Urinalysis and Testing for Meningitis
Multiple risk stratification algorithms for febrile infants aged ≤60 days categorize infants with a positive UA (and therefore likely UTI) as high-risk for having concomitant bacteremia or meningitis, for which lumbar puncture (LP) is typically recommended.43-45 The risk of not testing CSF is the potential to insufficiently treat meningitis because treatment for UTIs and meningitis differ in dosing, route, and duration. Recent studies have challenged the practice of routine LPs for infants aged 1-2 months with a suspected UTI due to the low prevalence (0%-0.3%) of concomitant meningitis.39,46-48 A meta-analysis of 20 studies reporting rates of concomitant meningitis with UTI in infants aged 29-90 days found a pooled prevalence of 0.25% (95% CI: 0.09%-0.70%).49 Furthermore, a study of febrile infants ages 29-60 days found that the prevalence of meningitis did not differ between those with a positive vs negative UA (3/337 [0.9%] vs 5/498 [1.0%], respectively), suggesting that a positive UA alone should not modify the pretest probability of meningitis in this age group.50
Two studies have also examined the risk of delayed meningitis among infants ≤60 days old treated for UTIs without CSF testing. A northern California study that examined 345 episodes among 341 UA-positive infants aged 29-60 days found zero cases (95% CI: 0%-1.1%) of delayed meningitis within 30 days of evaluation.50 A multicenter study of well-appearing febrile infants aged 7-60 days found 0/505 cases (95% CI: 0%-0.6%) of delayed meningitis within 7 days of discharge; 407 (81%) were aged 31-60 days.51 In summary, studies have shown a low rate of concomitant meningitis and a low risk of delayed meningitis in infants aged 1-2 months treated for UTI without CSF testing. Given this, clinically targeted (eg, based on ill appearance and/or lethargy), rather than routine, CSF testing in this age group can be considered.
CONCLUSION
While the AAP UTI Guideline is directed toward 2-24-month-old infants, recent evidence suggests that action statements 3-6 apply to infants <2 months old. Incorporation of pyuria as a diagnostic criterion for UTIs, early transition to oral therapy, and selective VCUG testing are all warranted based on the available evidence and consideration of known risks and benefits. Future studies with larger sample sizes that include infants <2 months old would be beneficial to ensure that the available studies, which have relatively small cohorts, do not suffer from type II error. We propose that future studies examine shorter (<7 days) vs longer total antibiotic duration, shorter vs longer initial IV antibiotics (especially in infants <1 month old or with bacteremic UTIs), and whether RBUS can be performed in a targeted manner. RCTs comparing universal vs targeted imaging strategies would help ascertain whether the increased diagnostic yield that accompanies more aggressive imaging strategies translates into improved outcomes. Application of these AAP guidelines to the <2-month age group and enhancement of the evidence base can promote the high-value care of young infants with UTIs.
1. Greenhow TL, Hung YY, Herz AM, Losada E, Pantell RH. The changing epidemiology of serious bacterial infections in young infants. Pediatr Infect Dis J. 2014;33(6):595-599. https://doi.org/10.1097/INF.0000000000000225.
2. Spencer JD, Schwaderer A, McHugh K, Hains DS. Pediatric urinary tract infections: an analysis of hospitalizations, charges, and costs in the USA. Pediatr Nephrol. 2010;25(12):2469-2475. https://doi.org/10.1007/s00467-010-1625-8.
3. Subcommittee On Urinary Tract Infection. Reaffirmation of AAP Clinical Practice Guideline: the diagnosis and management of the initial urinary tract infection in febrile infants and young children 2-24 months of age. Pediatrics. 2016;138(6):1-5. https://doi.org/10.1542/peds.2016-3026.
4. Crain EF, Gershel JC. Urinary tract infections in febrile infants younger than 8 weeks of age. Pediatrics. 1990;86(3):363-367. https://doi.org/10.1542/peds.105.2.e20
5. Dayan PS, Bennett J, Best R, et al. Test characteristics of the urine Gram stain in infants <or= 60 days of age with fever. Pediatr Emerg Care. 2002;18(1):12-14. https://doi.org/10.1097/00006565-200202000-00004.
6. Bachur R, Harper MB. Reliability of the urinalysis for predicting urinary tract infections in young febrile children. Arch Pediatr Adolesc Med. 2001;155(1):60-65. https://doi.org/10.1001/archpedi.155.1.60.
7. Reardon JM, Carstairs KL, Rudinsky SL, Simon LV, Riffenburgh RH, Tanen DA. Urinalysis is not reliable to detect a urinary tract infection in febrile infants presenting to the ED. Am J Emerg Med. 2009;27(8):930-932. https://doi.org/10.1016/j.ajem.2008.07.015.
8. Schroeder AR, Lucas BP, Garber MD, McCulloh RJ, Joshi-Patel AA, Biondi EA. Negative urinalyses in febrile infants age 7 to 60 days treated for urinary tract infection. J Hosp Med. 2019;14(2):101-104. https://doi.org/10.12788/jhm.3120.
9. Schroeder AR, Chang PW, Shen MW, Biondi EA, Greenhow TL. Diagnostic accuracy of the urinalysis for urinary tract infection in infants <3 months of age. Pediatrics. 2015;135(6):965-971. https://doi.org/10.1542/peds.2015-0012.
10. Tzimenatos L, Mahajan P, Dayan PS, et al. Accuracy of the urinalysis for urinary tract infections in febrile infants 60 days and younger. Pediatrics. 2018;141(2):e20173068. https://doi.org/10.1542/peds.2017-3068.
11. Newman TB, Kohn MA. Evidence-based diagnosis. Practical Guides to Biostatistics and Epidemiology. Cambridge; New York: Cambridge University Press, 2009.
12. Shaikh N, Shope TR, Hoberman A, Vigliotti A, Kurs-Lasky M, Martin JM. Association Between Uropathogen and Pyuria. Pediatrics. 2016;138(1):e20160087. https://doi.org/10.1542/peds.2016-0087.
13. Eliacik K, Kanik A, Yavascan O, et al. A comparison of bladder catheterization and suprapubic aspiration methods for urine sample collection from infants with a suspected urinary tract infection. Clin Pediatr. 2016;55(9):819-824. https://doi.org/10.1177/0009922815608278.
14. Bocquet N, Sergent Alaoui A, Jais JP, et al. Randomized trial of oral versus sequential IV/oral antibiotic for acute pyelonephritis in children. Pediatrics. 2012;129(2):e269-e275. https://doi.org/10.1542/peds.2011-0814.
15. Bouissou F, Munzer C, Decramer S, et al. Prospective, randomized trial comparing short and long intravenous antibiotic treatment of acute pyelonephritis in children: dimercaptosuccinic acid scintigraphic evaluation at 9 months. Pediatrics. 2008;121(3):e553-e560. https://doi.org/10.1542/peds.2006-3632.
16. Hodson EM, Willis NS, Craig JC. Antibiotics for acute pyelonephritis in children. Cochrane Database Syst Rev. 2007(4):CD003772. https://doi.org/10.1002/14651858.CD003772.pub3.
17. Neuhaus TJ, Berger C, Buechner K, et al. Randomised trial of oral versus sequential intravenous/oral cephalosporins in children with pyelonephritis. Eur J Pediatr. 2008;167(9):1037-1047. https://doi.org/10.1007/s00431-007-0638-1
18. Hoberman A, Wald ER, Hickey RW, et al. Oral versus initial intravenous therapy for urinary tract infections in young febrile children. Pediatrics. 1999;104(1 Pt 1):79-86. https://doi.org/10.1542/peds.104.1.79.
19. Strohmeier Y, Hodson EM, Willis NS, Webster AC, Craig JC. Antibiotics for acute pyelonephritis in children. Cochrane Database Syst Rev. 2014(7):CD003772. https://doi.org/10.1002/14651858.CD003772.pub4.
20. Lewis-de Los Angeles WW, Thurm C, Hersh AL, et al. Trends in intravenous antibiotic duration for urinary tract infections in young infants. Pediatrics. 2017;140(6):e20171021. https://doi.org/10.1542/peds.2017-1021.
21. Brady PW, Conway PH, Goudie A. Length of intravenous antibiotic therapy and treatment failure in infants with urinary tract infections. Pediatrics. 2010;126(2):196-203. https://doi.org/10.1542/peds.2009-2948.
22. Schroeder AR, Shen MW, Biondi EA, et al. Bacteraemic urinary tract infection: management and outcomes in young infants. Arch Dis Child. 2016;101(2):125-130. https://doi.org/10.1136/archdischild-2014-307997.
23. Joshi NS, Lucas BP, Schroeder AR. Physician preferences surrounding urinary tract infection management in neonates. Hosp Pediatr. 2018;8(1):21-27. https://doi.org/10.1542/hpeds.2017-0082.
24. Magin EC, Garcia-Garcia JJ, Sert SZ, Giralt AG, Cubells CL. Efficacy of short-term intravenous antibiotic in neonates with urinary tract infection. Pediatr Emerg Care. 2007;23(2):83-86. https://doi.org/10.1097/PEC.0b013e3180302c47.
25. Wang ME, Lee V, Greenhow TL, et al. Clinical response to discordant therapy in third-generation cephalosporin-resistant UTIs. Pediatrics. 2019; In press.
26. Keren R, Chan E. A meta-analysis of randomized, controlled trials comparing short- and long-course antibiotic therapy for urinary tract infections in children. Pediatrics. 2002;109(5):E70. https://doi.org/10.1542/peds.109.5.e70.
27. Michael M, Hodson EM, Craig JC, Martin S, Moyer VA. Short versus standard duration oral antibiotic therapy for acute urinary tract infection in children. Cochrane Database Syst Rev. 2003(1):CD003966. https://doi.org/10.1002/14651858.CD003966.
28. Finnell SM, Carroll AE, Downs SM, Subcommittee on Urinary Tract I. Technical report-Diagnosis and management of an initial UTI in febrile infants and young children. Pediatrics. 2011;128(3):e749-e770. https://doi.org/10.1542/peds.2011-1332.
29. Tsai JD, Huang CT, Lin PY, et al. Screening high-grade vesicoureteral reflux in young infants with a febrile urinary tract infection. Pediatr Nephrol. 2012;27(6):955-963. https://doi.org/10.1007/s00467-012-2104-1.
30. National Institue for Health and Care Excellence. Urinary Tract Infection in Children. http://www.nice.org.uk/guidance/cg54/evidence/cg54-urinary-tract-infection-in-children-full-guideline2. Published August 2007. Accessed August 2019.
31. Chang PW, Abidari JM, Shen MW, et al. Urinary imaging findings in young infants with bacteremic urinary tract infection. Hosp Pediatr. 2016;6(11):647-652. https://doi.org/10.1542/hpeds.2015-0229.
32. Honkinen O, Jahnukainen T, Mertsola J, Eskola J, Ruuskanen O. Bacteremic urinary tract infection in children. Pediatr Infect Dis J. 2000;19(7):630-634. https://doi.org/10.1097/00006454-200007000-00009
33. Ismaili K, Lolin K, Damry N, Alexander M, Lepage P, Hall M. Febrile urinary tract infections in 0- to 3-month-old infants: a prospective follow-up study. J Pediatr. 2011;158(1):91-94. https://doi.org/10.1016/j.jpeds.2010.06.053.
34. Cleper R, Krause I, Eisenstein B, Davidovits M. Prevalence of vesicoureteral reflux in neonatal urinary tract infection. Clin Pediatr. 2004;43(7):619-625. https://doi.org/10.1177/000992280404300706.
35. Pauchard JY, Chehade H, Kies CZ, Girardin E, Cachat F, Gehri M. Avoidance of voiding cystourethrography in infants younger than 3 months with Escherichia coli urinary tract infection and normal renal ultrasound. Arch Dis Child. 2017;102(9):804-808. https://doi.org/10.1136/archdischild-2016-311587.
36. Craig JC, Simpson JM, Williams GJ, et al. Antibiotic prophylaxis and recurrent urinary tract infection in children. N Engl J Med. 2009;361(18):1748-1759. https://doi.org/10.1056/NEJMoa0902295.
37. Hoberman A, Greenfield SP, Mattoo TK, et al. Antimicrobial prophylaxis for children with vesicoureteral reflux. N Engl J Med. 2014;370(25):2367-2376. https://doi.org/10.1056/NEJMoa1401811.
38. Williams G, Hodson EM, Craig JC. Interventions for primary vesicoureteric reflux. Cochrane Database Syst Rev. 2019;(2):CD001532. https://doi.org/10.1002/14651858.CD001532.pub4.
39. Schnadower D, Kuppermann N, Macias CG, et al. Febrile infants with urinary tract infections at very low risk for adverse events and bacteremia. Pediatrics. 2010;126(6):1074-1083. https://doi.org/10.1542/peds.2010-0479,
40. Roman HK, Chang PW, Schroeder AR. Diagnosis and management of bacteremic urinary tract infection in infants. Hosp Pediatr. 2015;5(1):1-8. https://doi.org/10.1542/hpeds.2014-0051.
41. Newman TB, Bernzweig JA, Takayama JI, Finch SA, Wasserman RC, Pantell RH. Urine testing and urinary tract infections in febrile infants seen in office settings: the Pediatric Research in Office Settings’ Febrile Infant Study. Arch Pediatr Adolesc Med. 2002;156(1):44-54. https://doi.org/10.1001/archpedi.156.1.44.
42. Desai S, Aronson PL, Shabanova V, et al. Parenteral antibiotic therapy duration in young infants with bacteremic urinary tract infections. Pediatrics. 2019;144(3):e20183844. https://doi.org/10.1542/peds.2018-3844,
43. Gomez B, Mintegi S, Bressan S, et al. Validation of the “Step-by-Step” approach in the management of young febrile infants. Pediatrics. 2016;138(2):e20154381. https://doi.org/10.1542/peds.2015-4381.
44. Kuppermann N, Dayan PS, Levine DA, et al. A clinical prediction rule to identify febrile infants 60 days and younger at low risk for serious bacterial infections. JAMA Pediatr. 2019;173(4):342-351. https://doi.org/10.1001/jamapediatrics.2018.5501.
45. DePorre AG, Aronson PL, McCulloh RJ. Facing the ongoing challenge of the febrile young infant. Crit Care. 2017;21(1):68. https://doi.org/10.1186/s13054-017-1646-9,
46. Tebruegge M, Pantazidou A, Clifford V, et al. The age-related risk of co-existing meningitis in children with urinary tract infection. PLoS One. 2011;6(11):e26576. https://doi.org/10.1371/journal.pone.0026576.
47. Thomson J, Cruz AT, Nigrovic LE, et al. Concomitant bacterial meningitis in infants with urinary tract infection. Pediatr Infect Dis J. 2017;36(9):908-910. https://doi.org/10.1097/INF.0000000000001626.
48. Wallace SS, Brown DN, Cruz AT. Prevalence of concomitant acute bacterial meningitis in neonates with febrile urinary tract infection: a retrospective cross-sectional study. J Pediatr. 2017;184:199-203. https://doi.org/10.1016/j.jpeds.2017.01.022.
49. Nugent J, Childers M, Singh-Miller N, Howard R, Allard R, Eberly M. Risk of meningitis in infants aged 29 to 90 days with urinary tract infection: a systematic review and meta-analysis. J Pediatr. 2019;212:102-110.e5. https://doi.org/10.1016/j.jpeds.2019.04.053.
50. Young BR, Nguyen THP, Alabaster A, Greenhow TL. The prevalence of bacterial meningitis in febrile infants 29-60 days with positive urinalysis. Hosp Pediatr. 2018;8(8):450-457. https
51. Wang ME, Biondi EA, McCulloh RJ, et al. Testing for meningitis in febrile well-appearing young infants with a positive urinalysis. Pediatrics. 2019;144(3):e20183979. https://doi.org/10.1542/peds.2018-3979.
Urinary tract infections (UTIs) are the most common bacterial infection and one of the most common reasons for hospitalization in young infants.1,2 The American Academy of Pediatrics (AAP) has published several clinical practice guidelines for the evaluation and management of febrile children ages 2-24 months with first-time UTIs, most recently in 2011 and affirmed in 2016.3 These guidelines do not provide recommendations for infants aged <2 months, which leads to uncertainty regarding the diagnosis and management of UTIs for infants in this age group. We assess the applicability of the AAP UTI Guideline’s action statements for infants aged <2 months presenting with first-time UTIs, with an emphasis on recent evidence. Because the considerations for bacterial infections differ for febrile infants aged <2 months compared with older infants, we do not discuss action statements one and two (determination of the likelihood of UTIs and decision to test urine) and statement seven (medical evaluation for fever after first UTI).3 Additionally, because concomitant bacteremia and meningitis are more common in this age group than in older infants, we review some of the controversies surrounding the diagnosis and treatment of these disease entities.
DIAGNOSIS
“Action Statement 3: To establish the diagnosis of UTI, clinicians should require both urinalysis results that suggest infection (pyuria and/or bacteriuria) and the presence of at least 50,000 colony-forming units (CFUs) per mL of a uropathogen cultured from a urine specimen obtained through catheterization or SPA.”3
To distinguish asymptomatic bacteriuria or contamination from a true UTI, the AAP Guideline requires both a positive urinalysis (UA) and culture for a diagnosis of a UTI.3 Historically, the UA was considered to be poorly sensitive for infections in young infants, with older studies reporting sensitivities ranging from 40% to 82% using urine culture as the gold standard.4-7 Thus, infants aged <2 months with positive urine cultures and negative UAs are often treated as having true UTIs, though this practice varies by institution.8 Possible explanations for the low UA sensitivity in this population include rapid bladder emptying, immature immune systems, and inability to concentrate urine. However, a negative UA plus a positive urine culture could also represent a “true negative” UA and a “false positive” culture, a finding that may be more common in young infants in whom sterile urine obtainment is often challenging.
Two recent studies have addressed this issue by evaluating the UA sensitivity in patients with bacteremic UTIs, as growth of the same pathogenic organism from the blood and urine almost certainly represents true infection.9,10 In a retrospective study of 203 infants aged <3 months with bacteremic UTIs, the presence of any leukocyte esterase (LE) or pyuria (>3 white blood cells per high-powered field [WBC/HPF]) had a sensitivity of 99.5% (95% CI: 98.5%-100%) and specificity of 93.9% (95% CI: 87.8%-93.2%).9 In a prospective, multicenter study of 4,147 febrile infants aged ≤60 days, of whom 27 infants had bacteremic UTIs, a positive UA (any LE, >5 WBC/HPF, or nitrite) had a sensitivity and specificity of 1.00 (95% CI: 0.87-1.00) and 0.91 (95% CI: 0.90-0.91), respectively.10 Although screening tests may appear to have higher sensitivity in more severely diseased populations (“spectrum bias”),11 it is not clear that infants with bacteremic UTIs are definitively sicker than infants with nonbacteremic UTIs (see “bacteremic UTI” section below). Additionally, this study found similarly excellent sensitivity (0.94 [95% CI: 0.90-0.96]) and specificity (0.91 [95% CI: 0.90-0.91]) of the UA among infants with nonbacteremic UTIs, including infants <28 days old.10
UA sensitivity (using urine culture as the gold standard) may be lower for non-Escherichia coli UTIs.9,10,12 In a retrospective study that included 90 infants <2 months old with UTIs, urine cultures yielding Pseudomonas aeruginosa, Enterococcus, or Klebsiella species were significantly less likely (odds ratio [95% CI]: 0.19 [0.06-0.60]; 0.14 [0.07-0.28]; 0.34 [0.17-0.68], respectively) to have pyuria (≥5 WBC/HPF) or LE (1+ or greater) than urine cultures yielding E. coli.,12 though an alternative explanation for this finding is that these organisms may be more likely to cause asymptomatic bacteriuria or contamination.13
The appropriate CFU/mL threshold to define a UTI and the extent that this threshold should vary by urine collection methods are still unclear. In the aforementioned bacteremic UTI study,9 12 patients with E. coli bacteremia had urine cultures with <50,000 CFU/mL plus pyuria (WBC or LE) in the UA, indicating that true UTIs may occur with <50,000 CFU/mL.
Based on these recent studies, we believe that the recommendation to incorporate UA results into the diagnoses of UTIs can be applied to infants <2 months old, as well as consideration for a UTI for colony counts of ≥10,000 CFU/mL if the UA is positive. For infants with positive urine cultures and negative UAs who have not received antibiotics, we suggest repeating both studies if treatment is being considered. For those who have started antibiotics, the pretest probability of a UTI, initial illness severity, and risks and benefits of continuing treatment should be considered.
TREATMENT
“Action Statement 4a: When initiating treatment, the clinician should base the choice of route of administration on practical considerations. Initiating treatment orally or parenterally is equally efficacious. The clinician should base the choice of agent on local antimicrobial sensitivity patterns (if available) and should adjust the choice according to sensitivity testing of the isolated uropathogen.”3
Most infants <2 months old with UTIs are hospitalized initially because of fever. Therefore, the decision point for most clinicians is not whether to hospitalize but for how long to hospitalize and treat with intravenous (IV) antibiotics prior to discharging home on oral antibiotics. Although all-oral antibiotic regimens are used to treat UTIs in older infants and children,14-18 to our knowledge, there are no randomized controlled trials (RCTs) comparing all-IV vs all-oral antibiotics or a longer vs shorter initial IV course that include infants <1 month old. In the trials that do include infants aged 1-2 months,14,18 the number of subjects in this age group is too small to draw conclusions, a finding supported by a 2014 Cochrane review.19 An adequately powered RCT of different IV antibiotic durations in this age group would be challenging. For example, nearly 1,000 subjects would be needed to demonstrate a statistically significant difference between a 5% and 10% relapse risk between groups, a difference that some may find clinically important.
The paucity of evidence in this age group may explain the considerable variability in the approach to IV antibiotic duration in young infants. Concerns about enteral absorption and underdeveloped immune systems may prompt some physicians to treat the youngest patients more aggressively. One study demonstrated that the proportion of patients <2 months old receiving prolonged courses (≥4 days) of IV antibiotics for UTIs in 46 U.S. children’s hospitals ranged from 0% to 67%.20 Similar variability across hospitals has been described in other observational studies21,22 and across subspecialties in one survey of pediatricians.23
Several observational studies provide additional evidence supporting shorter IV courses. In two studies that examined administrative databases, there was no difference in treatment failure rates between infants aged <2 months20 and <6 months21 receiving longer (≥4 days) vs shorter IV courses. In a study of 172 infants <1 month old with UTIs, the median IV duration was 4 days (range 2-12 days), and no subjects experienced treatment failure or relapse.24 In a multicenter study of 251 infants <3 months old with bacteremic UTIs, mean IV antibiotic durations ranged from 5.5–12 days, and no patient had a relapsed bacteremic UTI. Six infants (2.4%) had a relapsed UTI without bacteremia, with no association between IV antibiotic duration and relapse.22
Based on the available data and known risks of hospitalization and prolonged IV therapy, a reasonable approach for infants <1 month old would be to hospitalize for two to three days while awaiting blood and cerebral spinal fluid (CSF) culture results. Given the possibility of Enterococcus or Enterobacteriaceae that are resistant to third-generation cephalosporins, standard therapy of ampicillin and gentamicin for febrile neonates is reasonable, assuming there is no concern for meningitis. Antibiotics should be narrowed when susceptibilities are known. Once culture results return and signs and symptoms have resolved, discharge home on oral antibiotics is justifiable based on the available literature. For well-appearing infants aged 1-2 months with a presumptive UTI (based on UA results), if hospitalization is not warranted for other reasons, then we recommend outpatient treatment with oral or intramuscular therapy based on local susceptibilities (typically a cephalosporin) and close follow-up for one to two days while awaiting culture results. Although empiric cephalosporin therapy may not provide 100% coverage for all potential organisms, clinical deterioration is uncommon in infants and children receiving discordant therapy.25
“Action Statement 4b: The clinician should choose 7 to 14 days as the duration of antimicrobial therapy.”3
The AAP’s recommendation to provide antibiotics (by oral or parenteral route) for a minimum of seven days total stems from a 2002 meta-analysis comparing long (7-14 days) vs short (≤3 days) courses, where the pooled relative risk of treatment failure with short-course therapy was 1.94 (95% CI: 1.19-3.15).26 However, in this analysis, the trials that demonstrated inferiority with short courses were all trials that used single doses of antibiotics, and a similar Cochrane review comparing 2-4 days with 7-14 days demonstrated no differences in outcomes.27 Therefore, shorter total courses, but not a single dose, are probably appropriate for most UTIs in children. Although there are no obvious biologic reasons why longer total courses would be needed in young infants, there are unfortunately limited data comparing different total antibiotic durations in this age group. We believe that 7-14 days of total therapy is a reasonable recommendation for infants <2 months old, and that future studies should investigate shorter total courses.
IMAGING
“Action Statement 5: Febrile infants with UTIs should undergo renal and bladder ultrasonography (RBUS).”3
The AAP Guideline acknowledges that the RBUS is a poor screening test for the detection of genitourinary abnormalities in infants.3 The RBUS can be normal in infants with vesicoureteral reflux (VUR) or show nonspecific findings of unclear clinical significance.28 In a prospective study of 220 infants <3 months old by Tsai et al, 9/39 infants (23%) with grade III-V VUR had normal RBUS.29 Studies that included older infants have found a similar false-negative rate of 0%-40% for detecting grade IV-V VUR by RBUS.28 Nonetheless, since a RBUS is safe and noninvasive, we feel that the benefits of screening for abnormalities such as hydronephrosis (that could indicate posterior urethral valves or ureteropelvic junction obstruction) outweigh the risks (eg, false positives, overdiagnosis, and cost) of performing a RBUS after a first-time UTI.
“Action Statement 6a: Voiding cystourethrography (VCUG) should not be performed routinely after the first febrile UTI; VCUG is indicated if RBUS reveals hydronephrosis, scarring, or other findings that would suggest either high-grade VUR or obstructive uropathy, as well as in other atypical or complex clinical circumstances.”3
“Action Statement 6b: Further evaluation should be conducted if there is a recurrence of febrile UTI.”3
The RBUS may be normal in infants with VUR. Therefore, the AAP’s recommendation to perform a VCUG only if the RBUS is abnormal or after a recurrent UTI concedes that there will be infants with VUR who are missed after the first UTI.3
The United Kingdom’s National Institute for Health and Care Excellence guideline recommends a VCUG for infants <6 months old with a bacteremic or non-E. coli UTI.30 Whether high-grade VUR is more common in young infants with bacteremic UTIs than nonbacteremic UTIs remains inconclusive. In the Honkinen et al. study that included 87 infants <3 months old with bacteremic UTIs, the prevalence of grade IV-V VUR (10%) and obstruction (7%) was higher than that of the 88 nonbacteremic infants (2% grade IV-V VUR and 2% with obstruction). In the multicenter study of 251 infants <3 months old with bacteremic UTIs, the prevalence of grade IV-V VUR was 12.1%.31 This is higher than that of the nonbacteremic infants in Honkinen et al.’s study32 but more similar to the prevalence of grade IV-V VUR found in Tsai et al. (8.2%) and Ismaili et al.’s (7.0%) studies of UTIs in general.29,33
There does appear to be a higher prevalence of urinary tract abnormalities in young infants with non-E. coli vs E. coli UTIs.31,32,34,35 The odds of an abnormal VCUG was 8.0 (95% CI: 2.3-28) times higher for non-E. coli than E. coli UTIs in the study of 251 bacteremic infants.31 In a study of 122 infants <3 months old, the odds of grade III-V VUR was 10 (95% CI 2.6-41) times higher for non-E. coli than E. coli UTIs.35
However, the need for early detection of VUR is controversial, and VCUGs are invasive, involve ionizing radiation, and may require sedation. Two recent trials (one which included only children with VUR and another in which 42% of subjects had VUR) demonstrated a modest effect of prophylactic antibiotics in preventing recurrent UTIs (>5,000 doses of antibiotics needed to prevent one UTI recurrence), but the effect size did not differ by the presence or degree of VUR, and neither demonstrated any benefit in reducing future renal scarring.36, 37 The benefit of surgical interventions for VUR also remains unclear, though studies are limited.38 Overall, there is no evidence suggesting that infants <2 months old require more vigilance for VUR detection than the 2-24 month age group.
SPECIAL CONSIDERATIONS
Bacteremic UTI
The prevalence of bacteremia in infants ≤60 days old with UTIs was 9% in a study conducted from 2008 to 2013 in 26 EDs and has ranged from 3% to 17% in older studies.10, 22 Many studies have described similar clinical and laboratory findings in young infants with bacteremic and nonbacteremic UTIs.39-41 Despite this, bacteremic UTIs have been associated with prolonged parenteral antibiotic courses, resulting in longer hospitalizations and increased costs.40 Two recent multicenter studies of infants with bacteremic UTIs (251 infants <3 months old22 and 115 infants ≤60 days old42) demonstrated variable IV courses and no association between IV duration and relapsed UTI. The latter study showed no risk difference in the adjusted 30-day UTI recurrence (risk difference 3%, 95% CI: −5.8 to 12.7) or all-cause reutilization (risk difference 3%, 95% CI: −14.5 to 20.6) between long and short IV groups.42 Neither study had patients with relapsed bacteremic UTIs or reported that patients suffered clinical deterioration while on oral antibiotics.22,42
Based on these data demonstrating that adverse outcomes are rare in infants with bacteremic UTIs and not associated with parenteral antibiotic duration, we recommend short parenteral courses (2-3 days) with conversion to oral therapy once infants have clinically improved.
Positive Urinalysis and Testing for Meningitis
Multiple risk stratification algorithms for febrile infants aged ≤60 days categorize infants with a positive UA (and therefore likely UTI) as high-risk for having concomitant bacteremia or meningitis, for which lumbar puncture (LP) is typically recommended.43-45 The risk of not testing CSF is the potential to insufficiently treat meningitis because treatment for UTIs and meningitis differ in dosing, route, and duration. Recent studies have challenged the practice of routine LPs for infants aged 1-2 months with a suspected UTI due to the low prevalence (0%-0.3%) of concomitant meningitis.39,46-48 A meta-analysis of 20 studies reporting rates of concomitant meningitis with UTI in infants aged 29-90 days found a pooled prevalence of 0.25% (95% CI: 0.09%-0.70%).49 Furthermore, a study of febrile infants ages 29-60 days found that the prevalence of meningitis did not differ between those with a positive vs negative UA (3/337 [0.9%] vs 5/498 [1.0%], respectively), suggesting that a positive UA alone should not modify the pretest probability of meningitis in this age group.50
Two studies have also examined the risk of delayed meningitis among infants ≤60 days old treated for UTIs without CSF testing. A northern California study that examined 345 episodes among 341 UA-positive infants aged 29-60 days found zero cases (95% CI: 0%-1.1%) of delayed meningitis within 30 days of evaluation.50 A multicenter study of well-appearing febrile infants aged 7-60 days found 0/505 cases (95% CI: 0%-0.6%) of delayed meningitis within 7 days of discharge; 407 (81%) were aged 31-60 days.51 In summary, studies have shown a low rate of concomitant meningitis and a low risk of delayed meningitis in infants aged 1-2 months treated for UTI without CSF testing. Given this, clinically targeted (eg, based on ill appearance and/or lethargy), rather than routine, CSF testing in this age group can be considered.
CONCLUSION
While the AAP UTI Guideline is directed toward 2-24-month-old infants, recent evidence suggests that action statements 3-6 apply to infants <2 months old. Incorporation of pyuria as a diagnostic criterion for UTIs, early transition to oral therapy, and selective VCUG testing are all warranted based on the available evidence and consideration of known risks and benefits. Future studies with larger sample sizes that include infants <2 months old would be beneficial to ensure that the available studies, which have relatively small cohorts, do not suffer from type II error. We propose that future studies examine shorter (<7 days) vs longer total antibiotic duration, shorter vs longer initial IV antibiotics (especially in infants <1 month old or with bacteremic UTIs), and whether RBUS can be performed in a targeted manner. RCTs comparing universal vs targeted imaging strategies would help ascertain whether the increased diagnostic yield that accompanies more aggressive imaging strategies translates into improved outcomes. Application of these AAP guidelines to the <2-month age group and enhancement of the evidence base can promote the high-value care of young infants with UTIs.
1. Greenhow TL, Hung YY, Herz AM, Losada E, Pantell RH. The changing epidemiology of serious bacterial infections in young infants. Pediatr Infect Dis J. 2014;33(6):595-599. https://doi.org/10.1097/INF.0000000000000225.
2. Spencer JD, Schwaderer A, McHugh K, Hains DS. Pediatric urinary tract infections: an analysis of hospitalizations, charges, and costs in the USA. Pediatr Nephrol. 2010;25(12):2469-2475. https://doi.org/10.1007/s00467-010-1625-8.
3. Subcommittee On Urinary Tract Infection. Reaffirmation of AAP Clinical Practice Guideline: the diagnosis and management of the initial urinary tract infection in febrile infants and young children 2-24 months of age. Pediatrics. 2016;138(6):1-5. https://doi.org/10.1542/peds.2016-3026.
4. Crain EF, Gershel JC. Urinary tract infections in febrile infants younger than 8 weeks of age. Pediatrics. 1990;86(3):363-367. https://doi.org/10.1542/peds.105.2.e20
5. Dayan PS, Bennett J, Best R, et al. Test characteristics of the urine Gram stain in infants <or= 60 days of age with fever. Pediatr Emerg Care. 2002;18(1):12-14. https://doi.org/10.1097/00006565-200202000-00004.
6. Bachur R, Harper MB. Reliability of the urinalysis for predicting urinary tract infections in young febrile children. Arch Pediatr Adolesc Med. 2001;155(1):60-65. https://doi.org/10.1001/archpedi.155.1.60.
7. Reardon JM, Carstairs KL, Rudinsky SL, Simon LV, Riffenburgh RH, Tanen DA. Urinalysis is not reliable to detect a urinary tract infection in febrile infants presenting to the ED. Am J Emerg Med. 2009;27(8):930-932. https://doi.org/10.1016/j.ajem.2008.07.015.
8. Schroeder AR, Lucas BP, Garber MD, McCulloh RJ, Joshi-Patel AA, Biondi EA. Negative urinalyses in febrile infants age 7 to 60 days treated for urinary tract infection. J Hosp Med. 2019;14(2):101-104. https://doi.org/10.12788/jhm.3120.
9. Schroeder AR, Chang PW, Shen MW, Biondi EA, Greenhow TL. Diagnostic accuracy of the urinalysis for urinary tract infection in infants <3 months of age. Pediatrics. 2015;135(6):965-971. https://doi.org/10.1542/peds.2015-0012.
10. Tzimenatos L, Mahajan P, Dayan PS, et al. Accuracy of the urinalysis for urinary tract infections in febrile infants 60 days and younger. Pediatrics. 2018;141(2):e20173068. https://doi.org/10.1542/peds.2017-3068.
11. Newman TB, Kohn MA. Evidence-based diagnosis. Practical Guides to Biostatistics and Epidemiology. Cambridge; New York: Cambridge University Press, 2009.
12. Shaikh N, Shope TR, Hoberman A, Vigliotti A, Kurs-Lasky M, Martin JM. Association Between Uropathogen and Pyuria. Pediatrics. 2016;138(1):e20160087. https://doi.org/10.1542/peds.2016-0087.
13. Eliacik K, Kanik A, Yavascan O, et al. A comparison of bladder catheterization and suprapubic aspiration methods for urine sample collection from infants with a suspected urinary tract infection. Clin Pediatr. 2016;55(9):819-824. https://doi.org/10.1177/0009922815608278.
14. Bocquet N, Sergent Alaoui A, Jais JP, et al. Randomized trial of oral versus sequential IV/oral antibiotic for acute pyelonephritis in children. Pediatrics. 2012;129(2):e269-e275. https://doi.org/10.1542/peds.2011-0814.
15. Bouissou F, Munzer C, Decramer S, et al. Prospective, randomized trial comparing short and long intravenous antibiotic treatment of acute pyelonephritis in children: dimercaptosuccinic acid scintigraphic evaluation at 9 months. Pediatrics. 2008;121(3):e553-e560. https://doi.org/10.1542/peds.2006-3632.
16. Hodson EM, Willis NS, Craig JC. Antibiotics for acute pyelonephritis in children. Cochrane Database Syst Rev. 2007(4):CD003772. https://doi.org/10.1002/14651858.CD003772.pub3.
17. Neuhaus TJ, Berger C, Buechner K, et al. Randomised trial of oral versus sequential intravenous/oral cephalosporins in children with pyelonephritis. Eur J Pediatr. 2008;167(9):1037-1047. https://doi.org/10.1007/s00431-007-0638-1
18. Hoberman A, Wald ER, Hickey RW, et al. Oral versus initial intravenous therapy for urinary tract infections in young febrile children. Pediatrics. 1999;104(1 Pt 1):79-86. https://doi.org/10.1542/peds.104.1.79.
19. Strohmeier Y, Hodson EM, Willis NS, Webster AC, Craig JC. Antibiotics for acute pyelonephritis in children. Cochrane Database Syst Rev. 2014(7):CD003772. https://doi.org/10.1002/14651858.CD003772.pub4.
20. Lewis-de Los Angeles WW, Thurm C, Hersh AL, et al. Trends in intravenous antibiotic duration for urinary tract infections in young infants. Pediatrics. 2017;140(6):e20171021. https://doi.org/10.1542/peds.2017-1021.
21. Brady PW, Conway PH, Goudie A. Length of intravenous antibiotic therapy and treatment failure in infants with urinary tract infections. Pediatrics. 2010;126(2):196-203. https://doi.org/10.1542/peds.2009-2948.
22. Schroeder AR, Shen MW, Biondi EA, et al. Bacteraemic urinary tract infection: management and outcomes in young infants. Arch Dis Child. 2016;101(2):125-130. https://doi.org/10.1136/archdischild-2014-307997.
23. Joshi NS, Lucas BP, Schroeder AR. Physician preferences surrounding urinary tract infection management in neonates. Hosp Pediatr. 2018;8(1):21-27. https://doi.org/10.1542/hpeds.2017-0082.
24. Magin EC, Garcia-Garcia JJ, Sert SZ, Giralt AG, Cubells CL. Efficacy of short-term intravenous antibiotic in neonates with urinary tract infection. Pediatr Emerg Care. 2007;23(2):83-86. https://doi.org/10.1097/PEC.0b013e3180302c47.
25. Wang ME, Lee V, Greenhow TL, et al. Clinical response to discordant therapy in third-generation cephalosporin-resistant UTIs. Pediatrics. 2019; In press.
26. Keren R, Chan E. A meta-analysis of randomized, controlled trials comparing short- and long-course antibiotic therapy for urinary tract infections in children. Pediatrics. 2002;109(5):E70. https://doi.org/10.1542/peds.109.5.e70.
27. Michael M, Hodson EM, Craig JC, Martin S, Moyer VA. Short versus standard duration oral antibiotic therapy for acute urinary tract infection in children. Cochrane Database Syst Rev. 2003(1):CD003966. https://doi.org/10.1002/14651858.CD003966.
28. Finnell SM, Carroll AE, Downs SM, Subcommittee on Urinary Tract I. Technical report-Diagnosis and management of an initial UTI in febrile infants and young children. Pediatrics. 2011;128(3):e749-e770. https://doi.org/10.1542/peds.2011-1332.
29. Tsai JD, Huang CT, Lin PY, et al. Screening high-grade vesicoureteral reflux in young infants with a febrile urinary tract infection. Pediatr Nephrol. 2012;27(6):955-963. https://doi.org/10.1007/s00467-012-2104-1.
30. National Institue for Health and Care Excellence. Urinary Tract Infection in Children. http://www.nice.org.uk/guidance/cg54/evidence/cg54-urinary-tract-infection-in-children-full-guideline2. Published August 2007. Accessed August 2019.
31. Chang PW, Abidari JM, Shen MW, et al. Urinary imaging findings in young infants with bacteremic urinary tract infection. Hosp Pediatr. 2016;6(11):647-652. https://doi.org/10.1542/hpeds.2015-0229.
32. Honkinen O, Jahnukainen T, Mertsola J, Eskola J, Ruuskanen O. Bacteremic urinary tract infection in children. Pediatr Infect Dis J. 2000;19(7):630-634. https://doi.org/10.1097/00006454-200007000-00009
33. Ismaili K, Lolin K, Damry N, Alexander M, Lepage P, Hall M. Febrile urinary tract infections in 0- to 3-month-old infants: a prospective follow-up study. J Pediatr. 2011;158(1):91-94. https://doi.org/10.1016/j.jpeds.2010.06.053.
34. Cleper R, Krause I, Eisenstein B, Davidovits M. Prevalence of vesicoureteral reflux in neonatal urinary tract infection. Clin Pediatr. 2004;43(7):619-625. https://doi.org/10.1177/000992280404300706.
35. Pauchard JY, Chehade H, Kies CZ, Girardin E, Cachat F, Gehri M. Avoidance of voiding cystourethrography in infants younger than 3 months with Escherichia coli urinary tract infection and normal renal ultrasound. Arch Dis Child. 2017;102(9):804-808. https://doi.org/10.1136/archdischild-2016-311587.
36. Craig JC, Simpson JM, Williams GJ, et al. Antibiotic prophylaxis and recurrent urinary tract infection in children. N Engl J Med. 2009;361(18):1748-1759. https://doi.org/10.1056/NEJMoa0902295.
37. Hoberman A, Greenfield SP, Mattoo TK, et al. Antimicrobial prophylaxis for children with vesicoureteral reflux. N Engl J Med. 2014;370(25):2367-2376. https://doi.org/10.1056/NEJMoa1401811.
38. Williams G, Hodson EM, Craig JC. Interventions for primary vesicoureteric reflux. Cochrane Database Syst Rev. 2019;(2):CD001532. https://doi.org/10.1002/14651858.CD001532.pub4.
39. Schnadower D, Kuppermann N, Macias CG, et al. Febrile infants with urinary tract infections at very low risk for adverse events and bacteremia. Pediatrics. 2010;126(6):1074-1083. https://doi.org/10.1542/peds.2010-0479,
40. Roman HK, Chang PW, Schroeder AR. Diagnosis and management of bacteremic urinary tract infection in infants. Hosp Pediatr. 2015;5(1):1-8. https://doi.org/10.1542/hpeds.2014-0051.
41. Newman TB, Bernzweig JA, Takayama JI, Finch SA, Wasserman RC, Pantell RH. Urine testing and urinary tract infections in febrile infants seen in office settings: the Pediatric Research in Office Settings’ Febrile Infant Study. Arch Pediatr Adolesc Med. 2002;156(1):44-54. https://doi.org/10.1001/archpedi.156.1.44.
42. Desai S, Aronson PL, Shabanova V, et al. Parenteral antibiotic therapy duration in young infants with bacteremic urinary tract infections. Pediatrics. 2019;144(3):e20183844. https://doi.org/10.1542/peds.2018-3844,
43. Gomez B, Mintegi S, Bressan S, et al. Validation of the “Step-by-Step” approach in the management of young febrile infants. Pediatrics. 2016;138(2):e20154381. https://doi.org/10.1542/peds.2015-4381.
44. Kuppermann N, Dayan PS, Levine DA, et al. A clinical prediction rule to identify febrile infants 60 days and younger at low risk for serious bacterial infections. JAMA Pediatr. 2019;173(4):342-351. https://doi.org/10.1001/jamapediatrics.2018.5501.
45. DePorre AG, Aronson PL, McCulloh RJ. Facing the ongoing challenge of the febrile young infant. Crit Care. 2017;21(1):68. https://doi.org/10.1186/s13054-017-1646-9,
46. Tebruegge M, Pantazidou A, Clifford V, et al. The age-related risk of co-existing meningitis in children with urinary tract infection. PLoS One. 2011;6(11):e26576. https://doi.org/10.1371/journal.pone.0026576.
47. Thomson J, Cruz AT, Nigrovic LE, et al. Concomitant bacterial meningitis in infants with urinary tract infection. Pediatr Infect Dis J. 2017;36(9):908-910. https://doi.org/10.1097/INF.0000000000001626.
48. Wallace SS, Brown DN, Cruz AT. Prevalence of concomitant acute bacterial meningitis in neonates with febrile urinary tract infection: a retrospective cross-sectional study. J Pediatr. 2017;184:199-203. https://doi.org/10.1016/j.jpeds.2017.01.022.
49. Nugent J, Childers M, Singh-Miller N, Howard R, Allard R, Eberly M. Risk of meningitis in infants aged 29 to 90 days with urinary tract infection: a systematic review and meta-analysis. J Pediatr. 2019;212:102-110.e5. https://doi.org/10.1016/j.jpeds.2019.04.053.
50. Young BR, Nguyen THP, Alabaster A, Greenhow TL. The prevalence of bacterial meningitis in febrile infants 29-60 days with positive urinalysis. Hosp Pediatr. 2018;8(8):450-457. https
51. Wang ME, Biondi EA, McCulloh RJ, et al. Testing for meningitis in febrile well-appearing young infants with a positive urinalysis. Pediatrics. 2019;144(3):e20183979. https://doi.org/10.1542/peds.2018-3979.
© 2020 Society of Hospital Medicine