User login
Median Income and Clinical Outcomes of Hospitalized Persons With COVID-19 at an Urban Veterans Affairs Medical Center
Median Income and Clinical Outcomes of Hospitalized Persons With COVID-19 at an Urban Veterans Affairs Medical Center
Large epidemiologic studies have shown disparities in COVID-19 outcomes by race, ethnicity, and socioeconomic status (SES). Racial and ethnic minorities and individuals of lower SES have experienced disproportionately higher rates of intensive care unit (ICU) admission and death. In Washington, DC, Black individuals (47% of the population) accounted for 51% of COVID-19 cases and 75% of deaths. In comparison, White individuals (41% of the population) accounted for 21% of cases and 11% of deaths.1 Place of residence, such as living in socially vulnerable communities, has also been shown to be associated with higher rates of COVID-19 mortality and lower vaccination rates.2-4 Social and structural inequities, such as limited access to health care services and mistrust of the health care system, may explain some of the observed disparities.5 However, data are limited regarding COVID-19 outcomes for individuals with equal access to care.
The Veterans Health Administration (VHA) is the largest integrated US health care system and operates 123 acute care hospitals. Previous research has demonstrated that disparities in outcomes for other diseases are attenuated or erased among veterans receiving VHA care.6,7 Based on literature from the pandemic, markers of health care inequity relating to SES (eg, place of residence, median income) are expected to impact the outcomes of patients acutely hospitalized with COVID-19.4 We hypothesized that the impact on clinical outcomes of infection would be mitigated for veterans receiving VHA care.
This retrospective cohort study included veterans who presented to Washington Veterans Affairs Medical Center (WVAMC) with the goal of determining whether place of residence as a marker of SES, health care access, and median income were predictive of COVID-19 disease severity.
Methods
The WVAMC serves about 125,000 veterans across the metropolitan area, including parts of Maryland and Virginia. It is a high-complexity hospital with 164 acute care beds, 30 psychosocial residential rehabilitation beds, and an adjacent 120-bed community living center providing long-term, hospice, and palliative care.8
The WVAMC developed a dashboard that tracked patients with COVID-19 through on-site testing by admission date, ward, and other key demographics (PowerBi, Corporate Data Warehouse). All patients admitted to WVAMC with a diagnosis of COVID-19 between March 1, 2020, and June 30, 2021, were included in this retrospective review. Using the Computerized Patient Record System (CPRS) and the dashboard, we collected demographic information, baseline clinical diagnoses, laboratory results, and clinical interventions for all patients with documented COVID-19 infection as established by laboratory testing methods available at the time of diagnosis. Veterans treated exclusively outside the WVAMC were excluded. Hospitalization was defined as any acute inpatient admission or transfer recorded within 5 days before and 30 days after the laboratory collection of a positive COVID-19 test. Home testing kits were not widely available during the study period. An ICU stay was defined as any inpatient admission or transfer recorded within 5 days before or 30 days after the laboratory collection of a positive COVID-19 test for which the ward location had the specialty of medical or surgical ICU. Death due to COVID-19 was defined as occurring within 42 days (6 weeks) of a positive COVID-19 test.9 This definition assumed that during the peak of the pandemic, COVID-19 was the attributable cause of death, despite the possible contribution of underlying health conditions.
Patients’ admission periods were based on US Centers for Disease Control and Prevention (CDC) national data and classified as early 2020 (January 2020–April 2020), mid-2020 (May 2020–August 2020), late 2020 (September 2020–December 2020), and early 2021 (January 2021–April 2021).10 We chose to use these time periods as surrogates for the frequent changes in circulating COVID-19 variants, surges in case numbers, therapies and interventions available during the pandemic. The dominant COVID-19 variant during the study period was Alpha (B.1.17). Beta (B.1.351) variants were circulating infrequently, and Delta and Omicron appeared after the study period.11 Treatment strategies evolved rapidly with emerging evidence, including the use of dexamethasone, beginning in June 2020.12 WVAMC followed the Advisory Committee on Immunization Practices guidance on vaccination rollout beginning in December 2020.13
Patients' income was estimated by the median household income of the zip code residence based on US Census Bureau 2021 estimates and was assessed as both a continuous and categorical variable.14 The Charlson Comorbidity Index (CCI) was included in models as a continuous variable.15 Variables contributing to the CCI include myocardial infarction, congestive heart failure, peripheral vascular disease, cerebrovascular disease, dementia, hemiplegia or paraplegia, ulcer disease, hepatic disease, diabetes (with or without end-organ damage), chronic obstructive pulmonary disease (COPD), connective tissue disease, leukemia, lymphoma, moderate or severe renal disease, solid tumor (with or without metastases), and HIV/AIDS. The WVAMC Institutional Review Board approved this study (IRB #1573071).
Variables
This study assessed 3 primary outcomes as indicators of disease severity during hospitalization: need for high-flow oxygen (HFO), intubation, and presumed mortality at any time during hospitalization. The following variables were collected as potential social determinants or clinical risk-adjustment predictors of disease severity outcomes: age; sex; race and ethnicity; median income for patient’s zip code residence, state, and county; wards within Washington, DC; comorbidities, CCI; tobacco use; and body mass index.15 Although medications at baseline, treatments during hospitalization for COVID-19, and laboratory parameters during hospitalization are shown in eAppendices 1 and 2, they are beyond the scope of this analysis.
Statistical Analysis
Three types of logistic regression models were calculated for predicting the disease severity outcomes: (1) simple unadjusted models; (2) models predicting from single variables plus age (age-adjusted); and (3) multivariable models using all nonredundant potential predictors with adequate sample sizes (multivariable). Variables were considered to have inadequate sample sizes if there was nontrivial missing data or small numbers within categories, (eg, AIDS, connective tissue disease). Potential predictors for the multivariable model included age, sex, race, median income by zip code residence, CCI, CDC admission period, obesity, hypertension, chronic kidney disease, obstructive sleep apnea (OSA), diabetes, COPD or asthma, liver disease, antibiotics, and acute kidney injury.
For the multivariable models, the following modifications were made to avoid unreliable parameter estimation and computation problems (quasi-separation): age and CCI were included as continuous rather than categorical variables. Race was recoded as a 2-category variable (Black vs other [White, Hispanic, American Indian, Alaska Native, Asian, Native Hawaiian, and Pacific Islander]), and ethnicity was excluded because of the small number of patients in this group (n = 16). Admission period was included. Predicted probability plots were generated for each outcome with continuous independent predictors (income and CCI), both unadjusted and adjusted for age as a continuous covariate. All analyses were performed using SAS version 9.4.
Heat Maps
Heat maps were generated to visualize the geospatial distribution of COVID-19 cases and median incomes across zip codes in the greater Washington, DC area. Patient case data and median income, aggregated by zip code, were imported using ArcGIS Online. A zip code boundary layer from Esri (United States Zip Code Boundaries) was used to spatially align the case data. Data were joined by matching zip codes or median incomes in the patient dataset to those in the boundary layer. The resulting polygon layer was styled using the Counts and Amounts (Color) symbology in ArcGIS Online, with case counts or median income determining the intensity of the color gradient.
Results
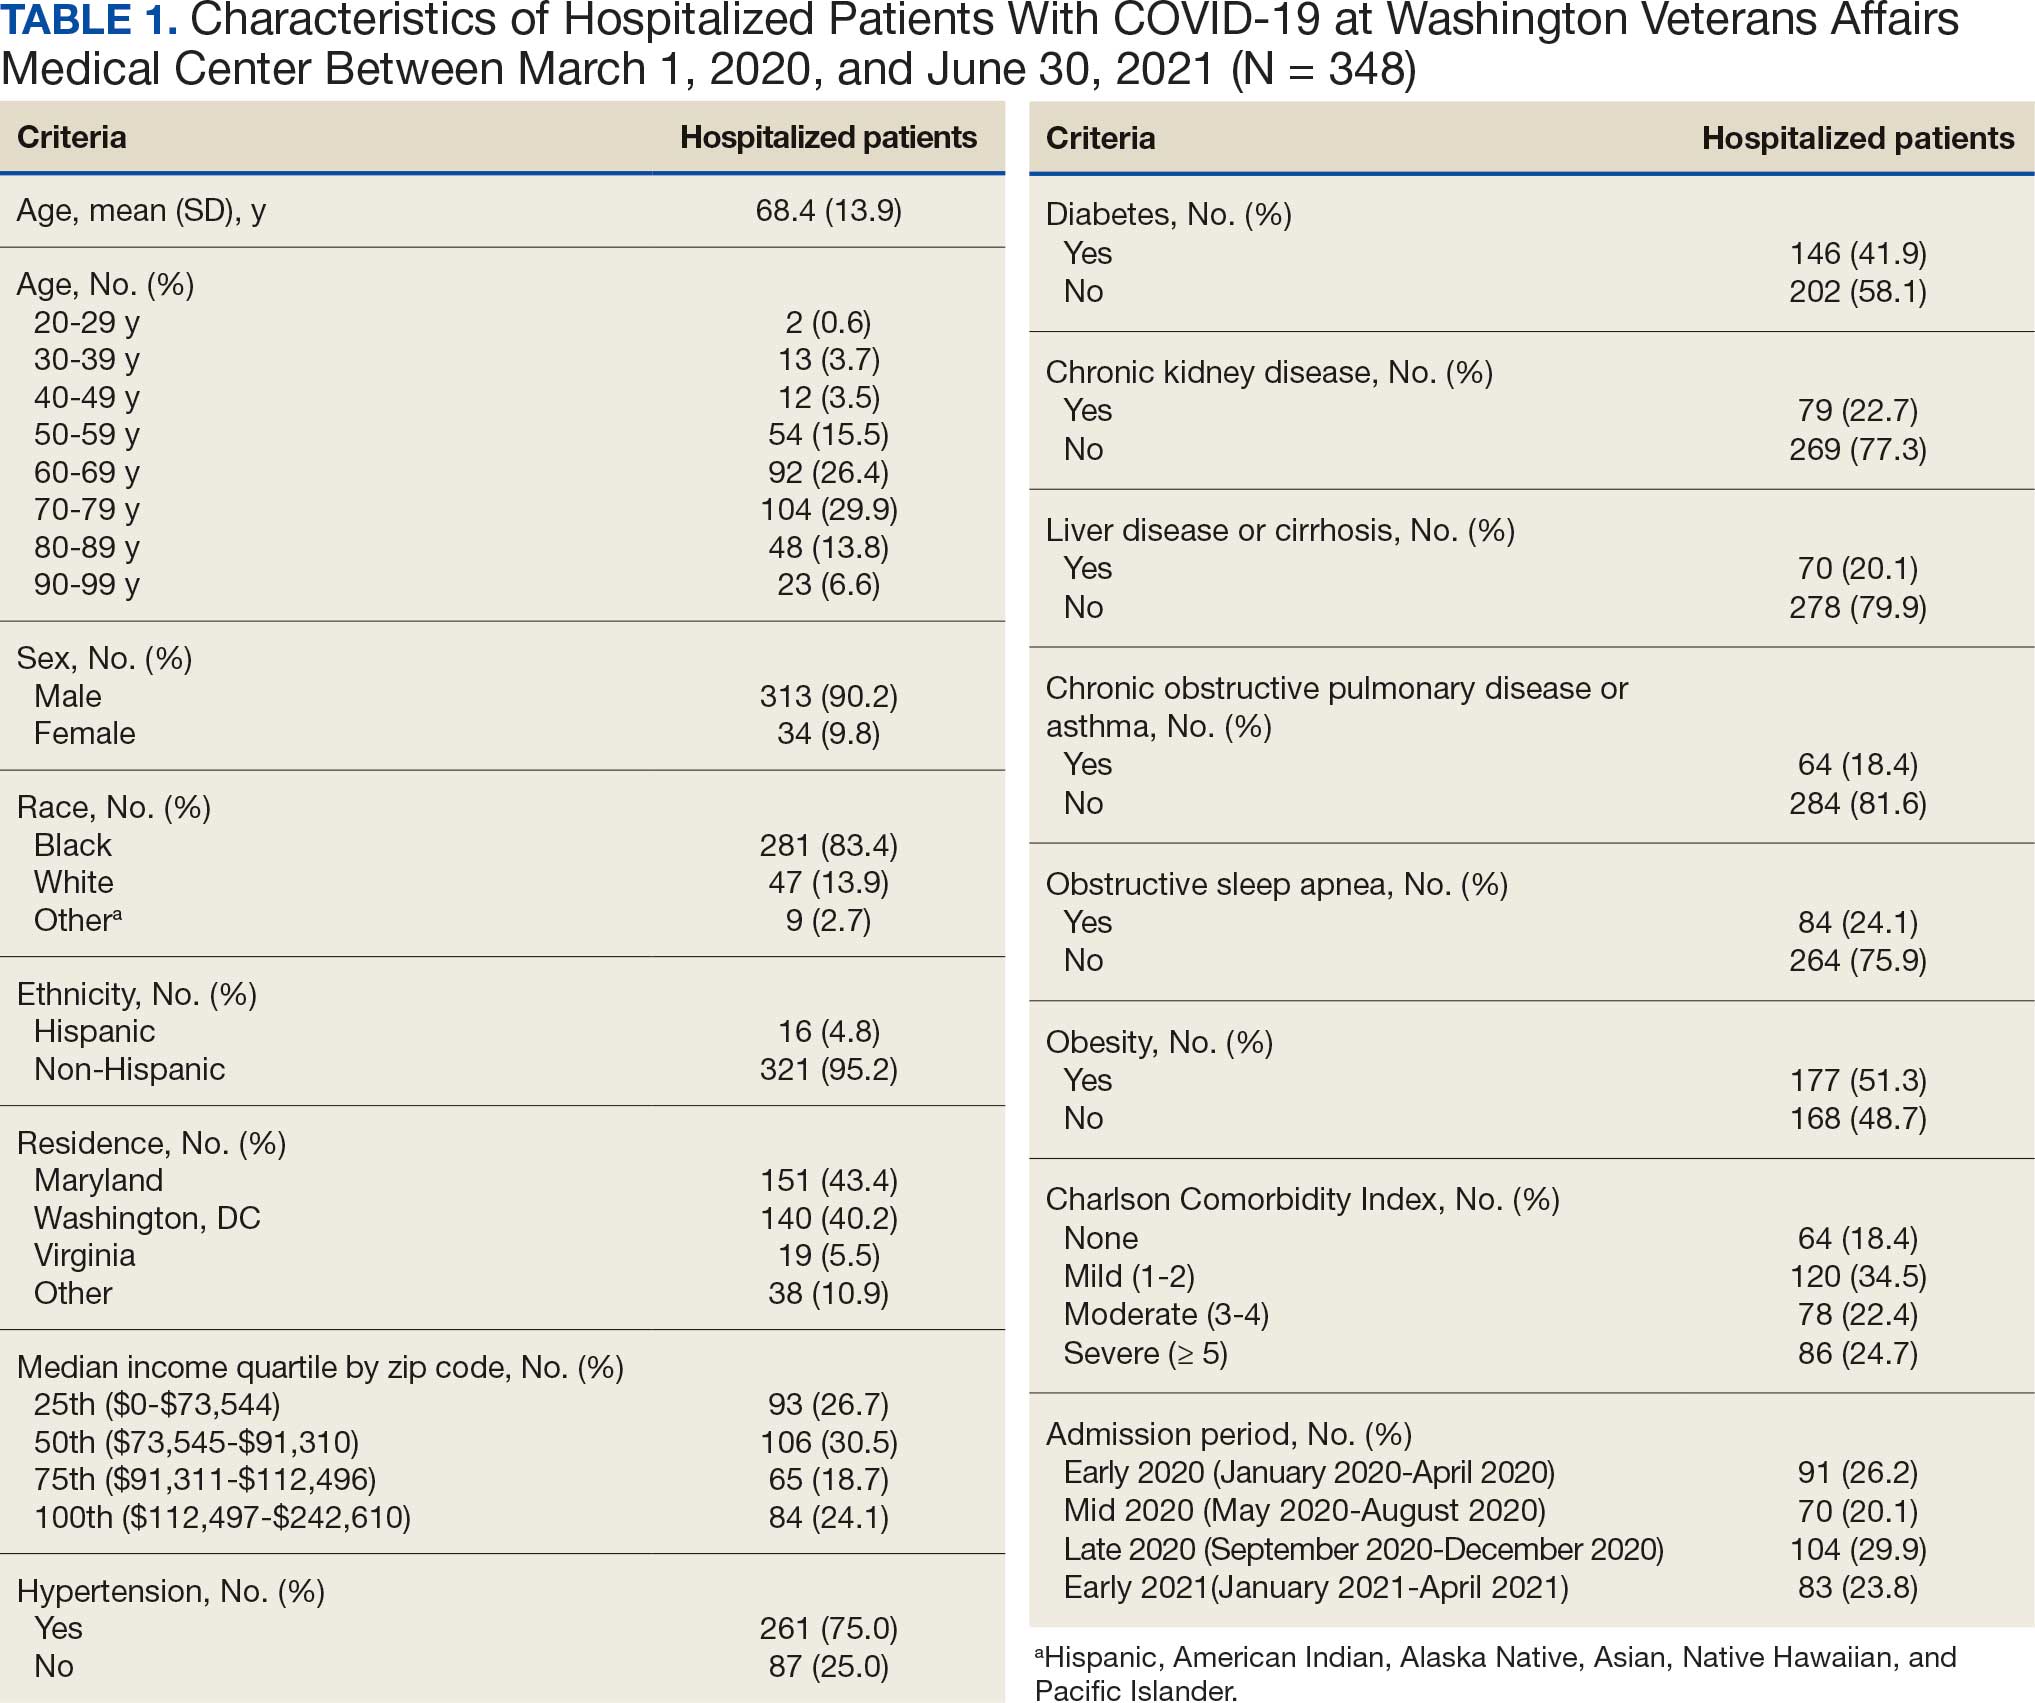
Between March 1, 2020, and June 30, 2021, 348 patients were hospitalized with COVID-19 (Table 1). The mean (SD) age was 68.4 (13.9) years, 313 patients (90.2%) were male, 281 patients (83.4%) were Black, 47 patients (13.6%) were White, and 16 patients (4.8%) were Hispanic. One hundred forty patients (40.2%) resided in Washington, DC, 151 (43.4%) in Maryland, and 19 (5.5%) in Virginia. HFO was received by 86 patients (24.7%), 33 (9.5%) required intubation and mechanical ventilation, and 57 (16.4%) died. All intubations and deaths occurred among patients aged > 50 years, with death occurring in 17.8% of patients aged > 50 years.
Demographic characteristics and baseline comorbidities associated with COVID-19 disease severity can be found in eAppendix 2. In unadjusted analyses, age was significantly associated with the risk of HFO, with a mean (SD) age of 72.5 (11.7) years among those requiring HFO and 67.1 (14.4) years among patients without HFO (odds ratio [OR], 1.03; 95% CI, 1.01-1.05; P = .002). Although age was not associated with the risk of intubation, it was significantly associated with mortality. Patients who died had a mean (SD) age of 76.8 (11.8) years compared with 66.8 (13.7) years among survivors (OR, 1.06; 95% CI, 1.04-1.09; P < .001).
Compared with patients with no comorbidities, CCI categories of mild, moderate, and severe were associated with increased risk of requiring HFO (eAppendix 3). The adjusted OR (aOR) was highest among patients with severe CCI (aOR, 7.00; 95% CI, 2.42-20.32; P = .0007). In age-adjusted analyses, CCI was not associated with intubation or mortality.
Geospatial Analyses
State of residence, county of residence, and geographic area (including Washington, DC wards, and geographic divisions within counties of residence in Maryland and Virginia) were not associated with the clinical outcomes studied (eAppendix 4). However, zip code-based median income, analyzed as a continuous variable, was associated with a reduced likelihood of receiving HFO (aOR, 0.91; 95% CI, 0.84-0.99; P = .03). Income was not significantly associated with intubation or mortality.
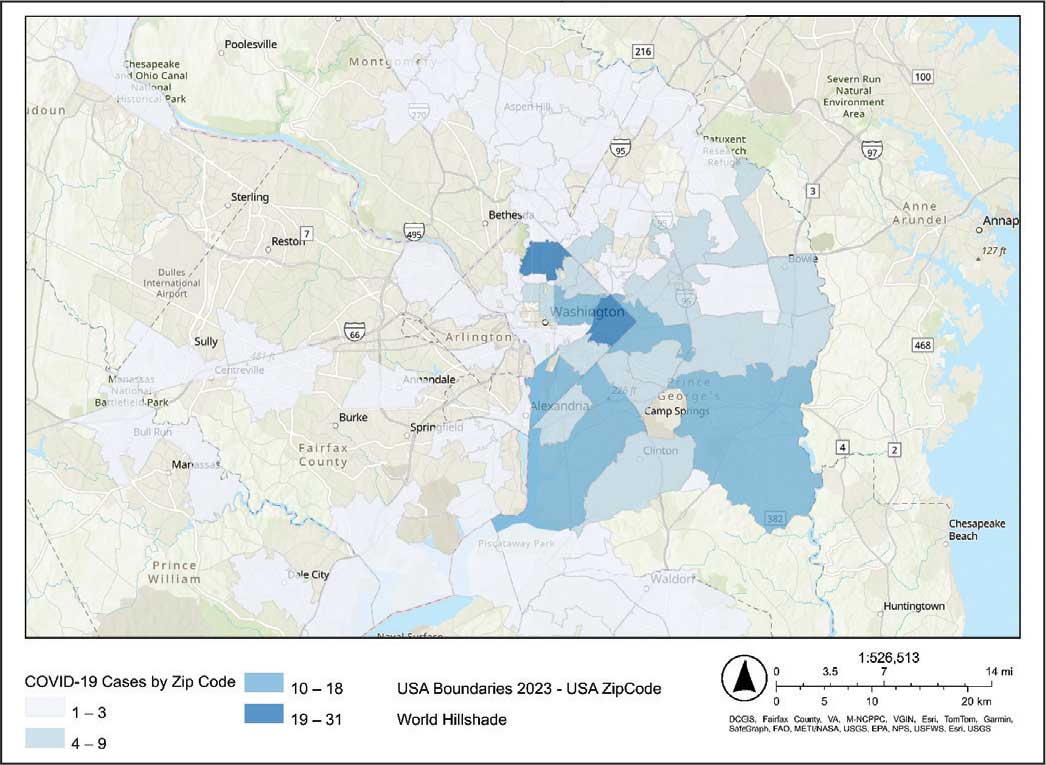
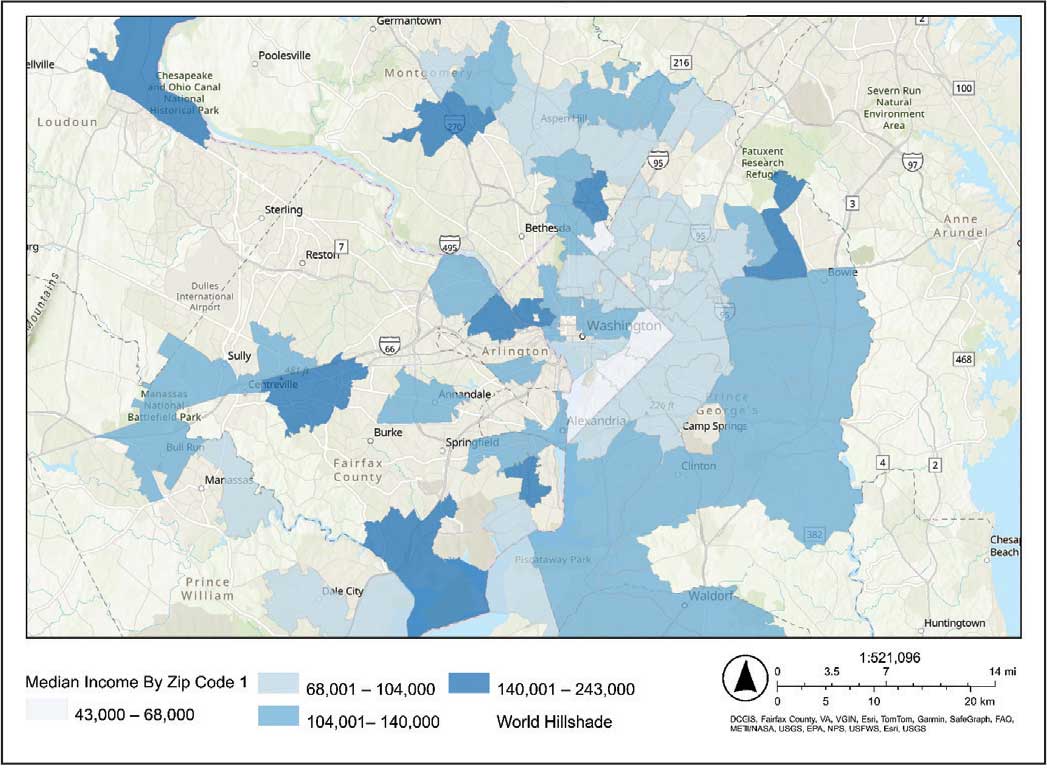
The majority of patients hospitalized for COVID-19 at WVAMC resided in zip codes in eastern Washington, DC, inclusive of wards 7 and 8, and Prince George’s County, Maryland (Figure 1). These areas also corresponded to the lowest median household income by zip code (Figure 2).
Code
Code
Multivariable Analysis
Significant predictors of HFO requirement included comorbid diabetes (OR, 2.42; 95% CI, 1.27-4.61; P = .006) and liver disease or cirrhosis (OR, 2.19; 95% CI, 1.09-4.39; P = .02) (Table 2). CDC admission period was also associated with HFO need. Patients admitted after early 2020 had lower odds of receiving HFO. Race and median income based on zip code residence were not associated with HFO requirement.
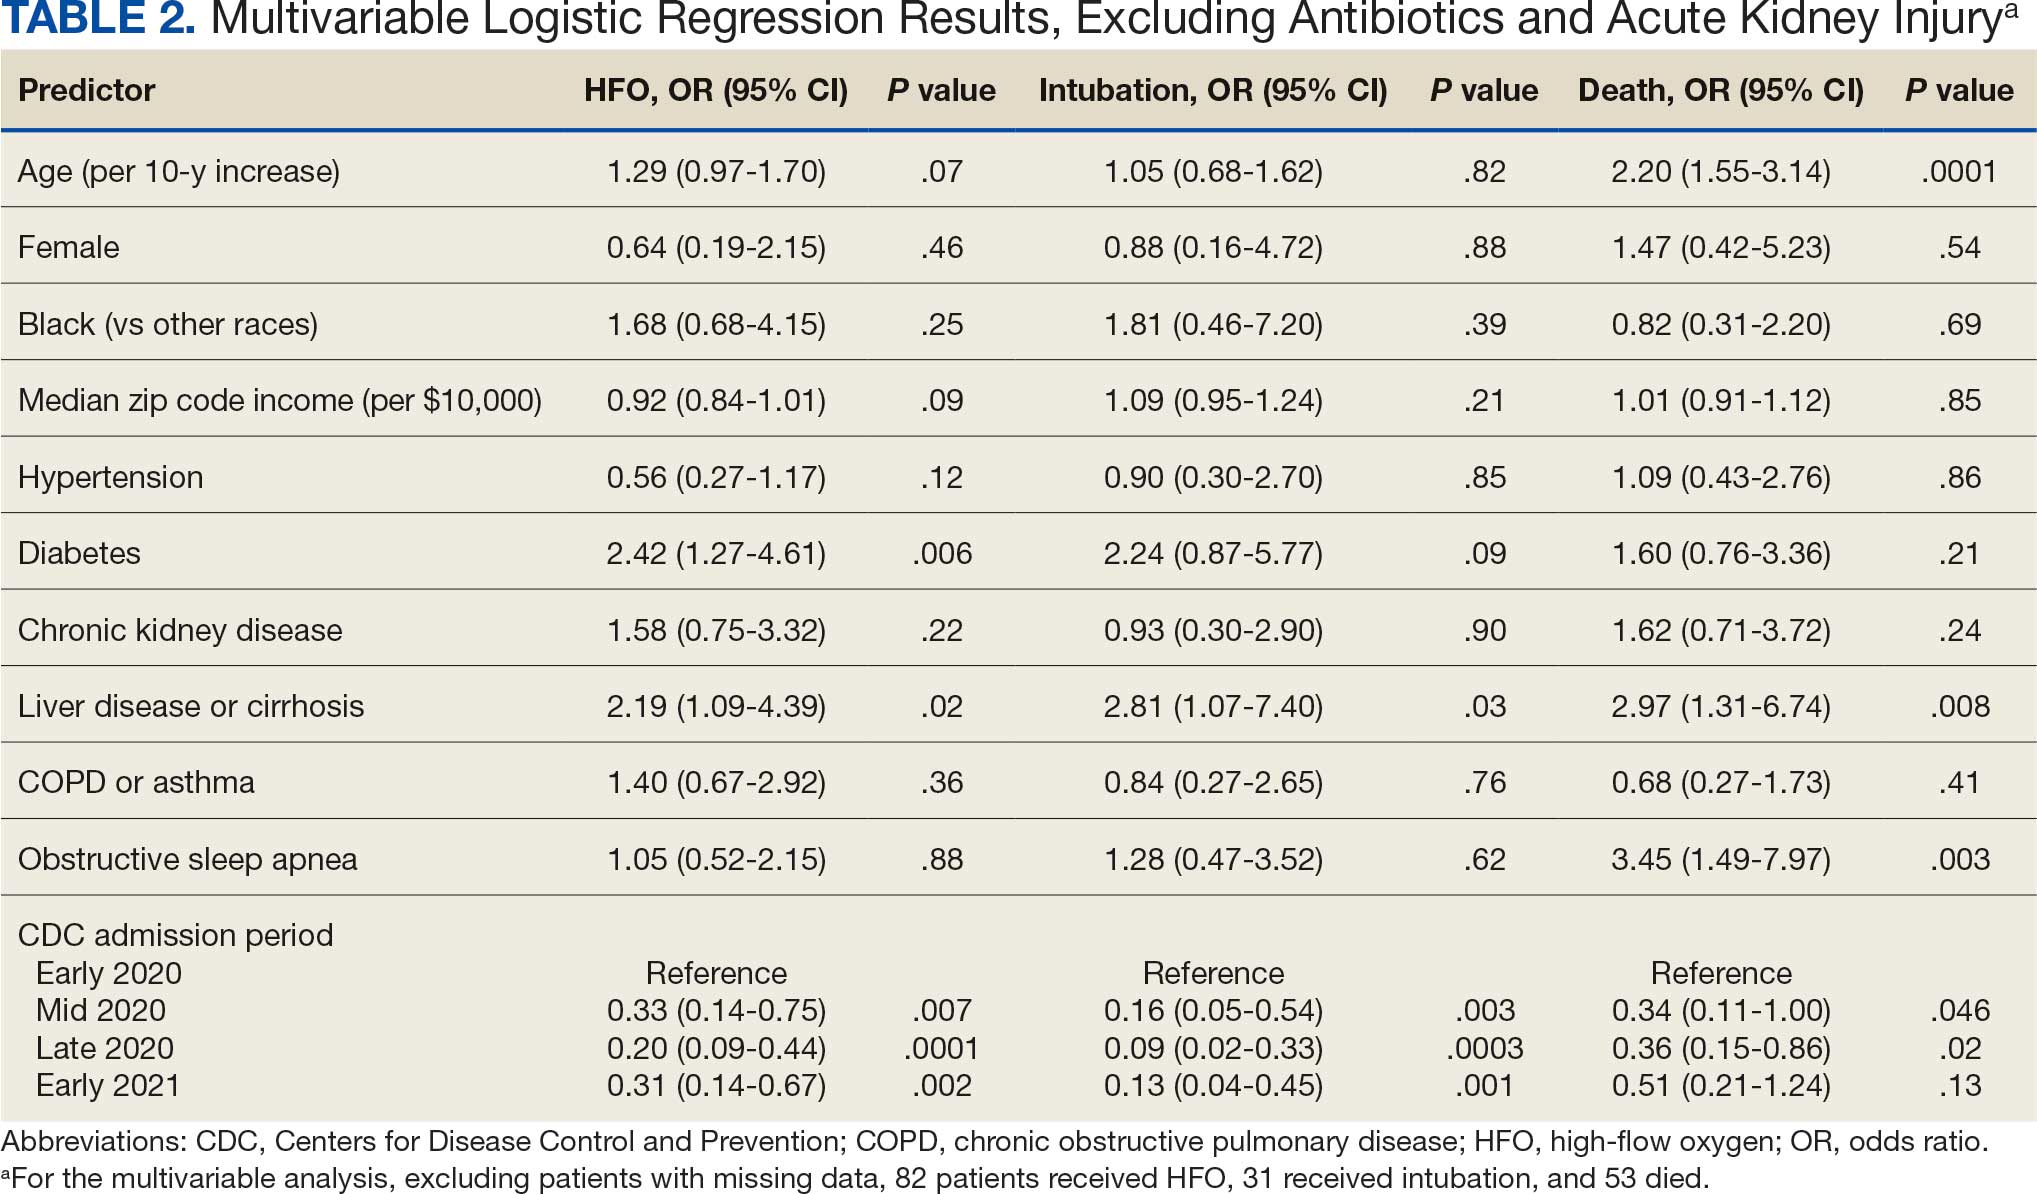
Comorbid liver disease or cirrhosis was a significant predictor of intubation (OR, 2.81; 95% CI, 1.07-7.40; P = .03). CDC admission period was associated with intubation with lower odds of intubation for patients admitted after early 2020. Race and median income by zip code were not associated with intubation.
Significant predictors of mortality included age (OR, 2.20; 95% CI, 1.55-3.14; P = .0001), comorbid liver disease or cirrhosis (OR, 2.97; 95% CI, 1.31-6.74; P = .008), and OSA (OR, 3.45; 95% CI, 1.49-7.97; P = .003). CDC admission period was associated with mortality, with lower odds of intubation for patients admitted in mid- and late 2020. Race and median income by zip code residence were not associated with intubation.
Discussion
In this study of COVID-19 disease severity at a large integrated health care system that provides equal access to care, race, ethnicity, and geographic location were not associated with the need for HFO, intubation, or presumed mortality. Median income by zip code residence was associated with reduced HFO use in univariable analyses but not in multivariable models.
These findings support existing literature suggesting that race and ethnicity alone do not explain disparities in COVID-19 outcomes. Multiple studies have demonstrated that disparities in health outcomes have been reduced for patients receiving VHA care.6,16-19 However, even within a health care system with assumed equal access, the finding of an association between income and need for HFO in the univariable analysis may reflect a greater likelihood of delays in care due to structural barriers. Multiple studies suggest low SES may be an independent risk factor for severe COVID-19 disease. Individuals with low SES have higher rates of chronic diseases of obesity, diabetes, heart disease, and lung disease; thus, they are also at greater risk of serious illness with COVID-19.20-24 Socioeconomic disadvantage may also have limited individuals’ ability to engage in protective behaviors to reduce COVID-19 infection risk, including food stockpiling, social distancing, avoidance of public transportation, and refraining from working in “essential jobs.”21
Beyond SES, place of residence also influences health outcomes. Prior literature supports using zip codes to assess area-based SES status and monitor health disparities.25 The Social Vulnerability Index incorporates SES factors for communities and measures social determinates of health at a zip code level exclusive of race and ethnicity.26 Socially vulnerable communities are known to have higher rates of chronic diseases, COVID-19 mortality, and lower vaccination rates.3 Within a defined geographic area, an individual’s outcome for COVID-19 can be influenced by individual resources such as access to care and median income. Disposable income may mitigate COVID-19 risk by facilitating timely care, reducing occupational exposure, improving housing stability, and supporting health-promoting behaviors.21
Limitations
Due to the evolving nature of the COVID-19 pandemic, variants, treatments, and interventions varied throughout the study period and are not included in this analysis. In late December 2020, COVID-19 vaccination was approved with a tiered allocation for at-risk patients and direct health care professionals. Three of the 4 study periods analyzed in this study were prior to vaccine rollout and therefore vaccination history was not assessed. However, we tried to capture the evolving changes in COVID-19 variants, treatments and interventions, and skill in treating the disease through use of CDC-defined time frames. Another limitation is that some studies have shown that use of median income by zip code residence can underestimate mortality.27 Also, shared resources and access to other sources of disposable income can impact the immediate attainment of social needs. For example, during the COVID-19 pandemic, health care systems in Washington, DC assisted vulnerable individuals by providing food, housing, and other resources.28,29 Finally, the modest sample size limits generalizability and power to detect differences for certain variables, including Hispanic ethnicity.
Conclusions
There have been widely described disparities in disease severity and death during the COVID-19 pandemic. In this urban veteran cohort of hospitalized patients, there was no difference in the need for intubation or mortality associated with race. The findings suggest that a lower median income by zip code residence may be associated with greater disease severity at presentation, but do not predict severe outcomes and mortality overall. VHA care, which provides equal access to care, may mitigate the disparities seen in the private sector.
- District of Columbia: All Race & Ethnicity Data. The COVID Tracking Project. Accessed December 10, 2025. https://covidtracking.com/data/state/district-of-columbia/race-ethnicity
- Freese KE, Vega A, Lawrence JJ, et al. Social vulnerability is associated with risk of COVID-19 related mortality in U.S. counties with confirmed cases. J Health Care Poor Underserved. 2021;32:245-257. doi:10.1353/hpu.2021.0022
- Saulsberry L, Bhargava A, Zeng S, et al. The social vulnerability metric (SVM) as a new tool for public health. Health Serv Res. 2023;58:873-881. doi:10.1111/1475-6773.14102
- Romano SD, Blackstock AJ, Taylor EV, et al. Trends in racial and ethnic disparities in COVID-19 hospitalizations, by region - United States, March-December 2020. MMWR Morb Mortal Wkly Rep. 2021;70:560-565. doi:10.15585/mmwr.mm7015e2
- Kullar R, Marcelin JR, Swartz TH, et al. Racial disparity of coronavirus disease 2019 in African American communities. J Infect Dis. 2020;222:890-893. doi:10.1093/infdis/jiaa372
- Riviere P, Luterstein E, Kumar A, et al. Survival of African American and non-Hispanic White men with prostate cancer in an equal-access health care system. Cancer. 2020;126:1683-1690. doi:10.1002/cncr.32666
- Ohl ME, Richardson Miell K, Beck BF, et al. Mortality among US veterans admitted to community vs Veterans Health Administration hospitals for COVID-19. JAMA Netw Open. 2023;6:e2315902. doi:10.1001/jamanetworkopen.2023.15902
- US Department of Veterans Affairs. VA Washington DC Health Care. Accessed January 16, 2026. https://www.va.gov/washington-dc-health-care/about-us/
- Trottier C, La J, Li LL, et al. Maintaining the utility of coronavirus disease 2019 pandemic severity surveillance: evaluation of trends in attributable deaths and development and validation of a measurement tool. Clin Infect Dis. 2023;77:1247-1256. doi:10.1093/cid/ciad381
- Centers for Disease Control and Prevention. CDC Museum COVID-19 Timeline. Updated July 8, 2024. Accessed January 16, 2026. https://www.cdc.gov/museum/timeline/covid19.html#Early-2020
- Centers for Disease Control and Prevention. Covid-surveillance and data analytics. September 5, 2025. Accessed January 16, 2026. cdc.gov/covid/php/surveillance/index.html12.
- RECOVERY Collaborative Group, Horby P, Lim WS, et al. Dexamethasone in hospitalized patients with Covid-19. N Engl J Med. 2021;384:693-704. doi:10.1056/NEJMoa2021436
- Dooling K, Marin M, Wallace M, et al. The Advisory Committee on Immunization Practices’ updated interim recommendation for allocation of COVID-19 Vaccine - United States, December 2020. MMWR Morb Mortal Wkly Rep. 2021;69:1657-1660. doi:10.15585/mmwr.mm695152e2
- US Census Bureau. Explore census data. Accessed December 10, 2025. https://data.census.gov/profile?q=Income%20by%20Zip%20code%20tabulation%20area
- Charlson ME, Pompei P, Ales KL, et al. A new method of classifying prognostic comorbidity in longitudinal studies: development and validation. J Chronic Dis. 1987;40:373-383. doi:10.1016/0021-9681(87)90171-8
- Zullig LL, Carpenter WR, Provenzale D, Weinberger M, Reeve BB, Jackson GL. Examining potential colorectal cancer care disparities in the Veterans Affairs health care system. J Clin Oncol. 2013;31:3579-3584. doi:10.1200/JCO.2013.50.4753
- Grubaugh AL, Slagle DM, Long M, Frueh BC, Magruder KM. Racial disparities in trauma exposure, psychiatric symptoms, and service use among female patients in Veterans Affairs primary care clinics. Womens Health Issues. 2008;18:433-441. doi:10.1016/j.whi.2008.08.001
- Bosworth HB, Parsey KS, Butterfield MI, et al. Racial variation in wanting and obtaining mental health services among women veterans in a primary care clinic. J Natl Med Assoc. 2000;92:231-236.
- Luo J, Rosales M, Wei G, et al. Hospitalization, mechanical ventilation, and case-fatality outcomes in US veterans with COVID-19 disease between years 2020-2021. Ann Epidemiol. 2022;70:37-44. doi:10.1016/j.annepidem.2022.04.003
- Kondo K, Low A, Everson T, et al. Health disparities in veterans: a map of the evidence. Med Care. 2017;55 Suppl 9 Suppl 2:S9-S15. doi:10.1097/MLR.0000000000000756
- Grosicki GJ, Bunsawat K, Jeong S, Robinson AT. Racial and ethnic disparities in cardiometabolic disease and COVID-19 outcomes in White, Black/African American, and Latinx populations: Social determinants of health. Prog Cardiovasc Dis. 2022;71:4-10. doi:10.1016/j.pcad.2022.04.004
- National Center for Immunization and Respiratory Diseases (U.S.). Division of Viral Diseases. Coronavirus Disease 2019 (COVID-19): COVID-19 in Racial and Ethnic Minority Groups: June 4, 2020. CDC Stacks. June 4, 2020. Accessed January 14, 2026. https://stacks.cdc.gov/view/cdc/88770
- Yancy CW. COVID-19 and African Americans. JAMA. 2020;323:1891-1892. doi:10.1001/jama.2020.6548
- Magesh S, John D, Li WT, et al. Disparities in COVID-19 outcomes by race, ethnicity, and socioeconomic status: a systematic-review and meta-analysis. JAMA Netw Open. 2021;4:e2134147. doi:10.1001/jamanetworkopen.2021.34147
- Berkowitz SA, Traore CY, Singer DE, Atlas SJ. Evaluating area-based socioeconomic status indicators for monitoring disparities within health care systems: results from a primary care network. Health Serv Res. 2015;50:398-417. doi:10.1111/1475-6773.12229
- Social Vulnerability Index. Agency for Toxicity and Disease Registry. July 22, 2024. Accessed January 14, 2026. https://www.atsdr.cdc.gov/placeandhealth/svi/index.html
- Moss JL, Johnson NJ, Yu M, Altekruse SF, Cronin KA. Comparisons of individual- and area-level socioeconomic status as proxies for individual-level measures: evidence from the Mortality Disparities in American Communities study. Popul Health Metr. 2021;19:1. doi:10.1186/s12963-020-00244-x
- DC Department of Human Services. Response to COVID-19. Accessed January 14, 2026. https://dhs.dc.gov/page/responsetocovid19
- Wang PG, Brisbon NM, Hubbell H, et al. Is the Gap Closing? Comparison of sociodemographic cisparities in COVID-19 hospitalizations and outcomes between two temporal waves of admissions. J Racial Ethn Health Disparities. 2023;10:593-602. doi:10.1007/s40615-022-01249-y
Large epidemiologic studies have shown disparities in COVID-19 outcomes by race, ethnicity, and socioeconomic status (SES). Racial and ethnic minorities and individuals of lower SES have experienced disproportionately higher rates of intensive care unit (ICU) admission and death. In Washington, DC, Black individuals (47% of the population) accounted for 51% of COVID-19 cases and 75% of deaths. In comparison, White individuals (41% of the population) accounted for 21% of cases and 11% of deaths.1 Place of residence, such as living in socially vulnerable communities, has also been shown to be associated with higher rates of COVID-19 mortality and lower vaccination rates.2-4 Social and structural inequities, such as limited access to health care services and mistrust of the health care system, may explain some of the observed disparities.5 However, data are limited regarding COVID-19 outcomes for individuals with equal access to care.
The Veterans Health Administration (VHA) is the largest integrated US health care system and operates 123 acute care hospitals. Previous research has demonstrated that disparities in outcomes for other diseases are attenuated or erased among veterans receiving VHA care.6,7 Based on literature from the pandemic, markers of health care inequity relating to SES (eg, place of residence, median income) are expected to impact the outcomes of patients acutely hospitalized with COVID-19.4 We hypothesized that the impact on clinical outcomes of infection would be mitigated for veterans receiving VHA care.
This retrospective cohort study included veterans who presented to Washington Veterans Affairs Medical Center (WVAMC) with the goal of determining whether place of residence as a marker of SES, health care access, and median income were predictive of COVID-19 disease severity.
Methods
The WVAMC serves about 125,000 veterans across the metropolitan area, including parts of Maryland and Virginia. It is a high-complexity hospital with 164 acute care beds, 30 psychosocial residential rehabilitation beds, and an adjacent 120-bed community living center providing long-term, hospice, and palliative care.8
The WVAMC developed a dashboard that tracked patients with COVID-19 through on-site testing by admission date, ward, and other key demographics (PowerBi, Corporate Data Warehouse). All patients admitted to WVAMC with a diagnosis of COVID-19 between March 1, 2020, and June 30, 2021, were included in this retrospective review. Using the Computerized Patient Record System (CPRS) and the dashboard, we collected demographic information, baseline clinical diagnoses, laboratory results, and clinical interventions for all patients with documented COVID-19 infection as established by laboratory testing methods available at the time of diagnosis. Veterans treated exclusively outside the WVAMC were excluded. Hospitalization was defined as any acute inpatient admission or transfer recorded within 5 days before and 30 days after the laboratory collection of a positive COVID-19 test. Home testing kits were not widely available during the study period. An ICU stay was defined as any inpatient admission or transfer recorded within 5 days before or 30 days after the laboratory collection of a positive COVID-19 test for which the ward location had the specialty of medical or surgical ICU. Death due to COVID-19 was defined as occurring within 42 days (6 weeks) of a positive COVID-19 test.9 This definition assumed that during the peak of the pandemic, COVID-19 was the attributable cause of death, despite the possible contribution of underlying health conditions.
Patients’ admission periods were based on US Centers for Disease Control and Prevention (CDC) national data and classified as early 2020 (January 2020–April 2020), mid-2020 (May 2020–August 2020), late 2020 (September 2020–December 2020), and early 2021 (January 2021–April 2021).10 We chose to use these time periods as surrogates for the frequent changes in circulating COVID-19 variants, surges in case numbers, therapies and interventions available during the pandemic. The dominant COVID-19 variant during the study period was Alpha (B.1.17). Beta (B.1.351) variants were circulating infrequently, and Delta and Omicron appeared after the study period.11 Treatment strategies evolved rapidly with emerging evidence, including the use of dexamethasone, beginning in June 2020.12 WVAMC followed the Advisory Committee on Immunization Practices guidance on vaccination rollout beginning in December 2020.13
Patients' income was estimated by the median household income of the zip code residence based on US Census Bureau 2021 estimates and was assessed as both a continuous and categorical variable.14 The Charlson Comorbidity Index (CCI) was included in models as a continuous variable.15 Variables contributing to the CCI include myocardial infarction, congestive heart failure, peripheral vascular disease, cerebrovascular disease, dementia, hemiplegia or paraplegia, ulcer disease, hepatic disease, diabetes (with or without end-organ damage), chronic obstructive pulmonary disease (COPD), connective tissue disease, leukemia, lymphoma, moderate or severe renal disease, solid tumor (with or without metastases), and HIV/AIDS. The WVAMC Institutional Review Board approved this study (IRB #1573071).
Variables
This study assessed 3 primary outcomes as indicators of disease severity during hospitalization: need for high-flow oxygen (HFO), intubation, and presumed mortality at any time during hospitalization. The following variables were collected as potential social determinants or clinical risk-adjustment predictors of disease severity outcomes: age; sex; race and ethnicity; median income for patient’s zip code residence, state, and county; wards within Washington, DC; comorbidities, CCI; tobacco use; and body mass index.15 Although medications at baseline, treatments during hospitalization for COVID-19, and laboratory parameters during hospitalization are shown in eAppendices 1 and 2, they are beyond the scope of this analysis.
Statistical Analysis
Three types of logistic regression models were calculated for predicting the disease severity outcomes: (1) simple unadjusted models; (2) models predicting from single variables plus age (age-adjusted); and (3) multivariable models using all nonredundant potential predictors with adequate sample sizes (multivariable). Variables were considered to have inadequate sample sizes if there was nontrivial missing data or small numbers within categories, (eg, AIDS, connective tissue disease). Potential predictors for the multivariable model included age, sex, race, median income by zip code residence, CCI, CDC admission period, obesity, hypertension, chronic kidney disease, obstructive sleep apnea (OSA), diabetes, COPD or asthma, liver disease, antibiotics, and acute kidney injury.
For the multivariable models, the following modifications were made to avoid unreliable parameter estimation and computation problems (quasi-separation): age and CCI were included as continuous rather than categorical variables. Race was recoded as a 2-category variable (Black vs other [White, Hispanic, American Indian, Alaska Native, Asian, Native Hawaiian, and Pacific Islander]), and ethnicity was excluded because of the small number of patients in this group (n = 16). Admission period was included. Predicted probability plots were generated for each outcome with continuous independent predictors (income and CCI), both unadjusted and adjusted for age as a continuous covariate. All analyses were performed using SAS version 9.4.
Heat Maps
Heat maps were generated to visualize the geospatial distribution of COVID-19 cases and median incomes across zip codes in the greater Washington, DC area. Patient case data and median income, aggregated by zip code, were imported using ArcGIS Online. A zip code boundary layer from Esri (United States Zip Code Boundaries) was used to spatially align the case data. Data were joined by matching zip codes or median incomes in the patient dataset to those in the boundary layer. The resulting polygon layer was styled using the Counts and Amounts (Color) symbology in ArcGIS Online, with case counts or median income determining the intensity of the color gradient.
Results
Between March 1, 2020, and June 30, 2021, 348 patients were hospitalized with COVID-19 (Table 1). The mean (SD) age was 68.4 (13.9) years, 313 patients (90.2%) were male, 281 patients (83.4%) were Black, 47 patients (13.6%) were White, and 16 patients (4.8%) were Hispanic. One hundred forty patients (40.2%) resided in Washington, DC, 151 (43.4%) in Maryland, and 19 (5.5%) in Virginia. HFO was received by 86 patients (24.7%), 33 (9.5%) required intubation and mechanical ventilation, and 57 (16.4%) died. All intubations and deaths occurred among patients aged > 50 years, with death occurring in 17.8% of patients aged > 50 years.
Demographic characteristics and baseline comorbidities associated with COVID-19 disease severity can be found in eAppendix 2. In unadjusted analyses, age was significantly associated with the risk of HFO, with a mean (SD) age of 72.5 (11.7) years among those requiring HFO and 67.1 (14.4) years among patients without HFO (odds ratio [OR], 1.03; 95% CI, 1.01-1.05; P = .002). Although age was not associated with the risk of intubation, it was significantly associated with mortality. Patients who died had a mean (SD) age of 76.8 (11.8) years compared with 66.8 (13.7) years among survivors (OR, 1.06; 95% CI, 1.04-1.09; P < .001).
Compared with patients with no comorbidities, CCI categories of mild, moderate, and severe were associated with increased risk of requiring HFO (eAppendix 3). The adjusted OR (aOR) was highest among patients with severe CCI (aOR, 7.00; 95% CI, 2.42-20.32; P = .0007). In age-adjusted analyses, CCI was not associated with intubation or mortality.
Geospatial Analyses
State of residence, county of residence, and geographic area (including Washington, DC wards, and geographic divisions within counties of residence in Maryland and Virginia) were not associated with the clinical outcomes studied (eAppendix 4). However, zip code-based median income, analyzed as a continuous variable, was associated with a reduced likelihood of receiving HFO (aOR, 0.91; 95% CI, 0.84-0.99; P = .03). Income was not significantly associated with intubation or mortality.
The majority of patients hospitalized for COVID-19 at WVAMC resided in zip codes in eastern Washington, DC, inclusive of wards 7 and 8, and Prince George’s County, Maryland (Figure 1). These areas also corresponded to the lowest median household income by zip code (Figure 2).
Code
Code
Multivariable Analysis
Significant predictors of HFO requirement included comorbid diabetes (OR, 2.42; 95% CI, 1.27-4.61; P = .006) and liver disease or cirrhosis (OR, 2.19; 95% CI, 1.09-4.39; P = .02) (Table 2). CDC admission period was also associated with HFO need. Patients admitted after early 2020 had lower odds of receiving HFO. Race and median income based on zip code residence were not associated with HFO requirement.
Comorbid liver disease or cirrhosis was a significant predictor of intubation (OR, 2.81; 95% CI, 1.07-7.40; P = .03). CDC admission period was associated with intubation with lower odds of intubation for patients admitted after early 2020. Race and median income by zip code were not associated with intubation.
Significant predictors of mortality included age (OR, 2.20; 95% CI, 1.55-3.14; P = .0001), comorbid liver disease or cirrhosis (OR, 2.97; 95% CI, 1.31-6.74; P = .008), and OSA (OR, 3.45; 95% CI, 1.49-7.97; P = .003). CDC admission period was associated with mortality, with lower odds of intubation for patients admitted in mid- and late 2020. Race and median income by zip code residence were not associated with intubation.
Discussion
In this study of COVID-19 disease severity at a large integrated health care system that provides equal access to care, race, ethnicity, and geographic location were not associated with the need for HFO, intubation, or presumed mortality. Median income by zip code residence was associated with reduced HFO use in univariable analyses but not in multivariable models.
These findings support existing literature suggesting that race and ethnicity alone do not explain disparities in COVID-19 outcomes. Multiple studies have demonstrated that disparities in health outcomes have been reduced for patients receiving VHA care.6,16-19 However, even within a health care system with assumed equal access, the finding of an association between income and need for HFO in the univariable analysis may reflect a greater likelihood of delays in care due to structural barriers. Multiple studies suggest low SES may be an independent risk factor for severe COVID-19 disease. Individuals with low SES have higher rates of chronic diseases of obesity, diabetes, heart disease, and lung disease; thus, they are also at greater risk of serious illness with COVID-19.20-24 Socioeconomic disadvantage may also have limited individuals’ ability to engage in protective behaviors to reduce COVID-19 infection risk, including food stockpiling, social distancing, avoidance of public transportation, and refraining from working in “essential jobs.”21
Beyond SES, place of residence also influences health outcomes. Prior literature supports using zip codes to assess area-based SES status and monitor health disparities.25 The Social Vulnerability Index incorporates SES factors for communities and measures social determinates of health at a zip code level exclusive of race and ethnicity.26 Socially vulnerable communities are known to have higher rates of chronic diseases, COVID-19 mortality, and lower vaccination rates.3 Within a defined geographic area, an individual’s outcome for COVID-19 can be influenced by individual resources such as access to care and median income. Disposable income may mitigate COVID-19 risk by facilitating timely care, reducing occupational exposure, improving housing stability, and supporting health-promoting behaviors.21
Limitations
Due to the evolving nature of the COVID-19 pandemic, variants, treatments, and interventions varied throughout the study period and are not included in this analysis. In late December 2020, COVID-19 vaccination was approved with a tiered allocation for at-risk patients and direct health care professionals. Three of the 4 study periods analyzed in this study were prior to vaccine rollout and therefore vaccination history was not assessed. However, we tried to capture the evolving changes in COVID-19 variants, treatments and interventions, and skill in treating the disease through use of CDC-defined time frames. Another limitation is that some studies have shown that use of median income by zip code residence can underestimate mortality.27 Also, shared resources and access to other sources of disposable income can impact the immediate attainment of social needs. For example, during the COVID-19 pandemic, health care systems in Washington, DC assisted vulnerable individuals by providing food, housing, and other resources.28,29 Finally, the modest sample size limits generalizability and power to detect differences for certain variables, including Hispanic ethnicity.
Conclusions
There have been widely described disparities in disease severity and death during the COVID-19 pandemic. In this urban veteran cohort of hospitalized patients, there was no difference in the need for intubation or mortality associated with race. The findings suggest that a lower median income by zip code residence may be associated with greater disease severity at presentation, but do not predict severe outcomes and mortality overall. VHA care, which provides equal access to care, may mitigate the disparities seen in the private sector.
- District of Columbia: All Race & Ethnicity Data. The COVID Tracking Project. Accessed December 10, 2025. https://covidtracking.com/data/state/district-of-columbia/race-ethnicity
- Freese KE, Vega A, Lawrence JJ, et al. Social vulnerability is associated with risk of COVID-19 related mortality in U.S. counties with confirmed cases. J Health Care Poor Underserved. 2021;32:245-257. doi:10.1353/hpu.2021.0022
- Saulsberry L, Bhargava A, Zeng S, et al. The social vulnerability metric (SVM) as a new tool for public health. Health Serv Res. 2023;58:873-881. doi:10.1111/1475-6773.14102
- Romano SD, Blackstock AJ, Taylor EV, et al. Trends in racial and ethnic disparities in COVID-19 hospitalizations, by region - United States, March-December 2020. MMWR Morb Mortal Wkly Rep. 2021;70:560-565. doi:10.15585/mmwr.mm7015e2
- Kullar R, Marcelin JR, Swartz TH, et al. Racial disparity of coronavirus disease 2019 in African American communities. J Infect Dis. 2020;222:890-893. doi:10.1093/infdis/jiaa372
- Riviere P, Luterstein E, Kumar A, et al. Survival of African American and non-Hispanic White men with prostate cancer in an equal-access health care system. Cancer. 2020;126:1683-1690. doi:10.1002/cncr.32666
- Ohl ME, Richardson Miell K, Beck BF, et al. Mortality among US veterans admitted to community vs Veterans Health Administration hospitals for COVID-19. JAMA Netw Open. 2023;6:e2315902. doi:10.1001/jamanetworkopen.2023.15902
- US Department of Veterans Affairs. VA Washington DC Health Care. Accessed January 16, 2026. https://www.va.gov/washington-dc-health-care/about-us/
- Trottier C, La J, Li LL, et al. Maintaining the utility of coronavirus disease 2019 pandemic severity surveillance: evaluation of trends in attributable deaths and development and validation of a measurement tool. Clin Infect Dis. 2023;77:1247-1256. doi:10.1093/cid/ciad381
- Centers for Disease Control and Prevention. CDC Museum COVID-19 Timeline. Updated July 8, 2024. Accessed January 16, 2026. https://www.cdc.gov/museum/timeline/covid19.html#Early-2020
- Centers for Disease Control and Prevention. Covid-surveillance and data analytics. September 5, 2025. Accessed January 16, 2026. cdc.gov/covid/php/surveillance/index.html12.
- RECOVERY Collaborative Group, Horby P, Lim WS, et al. Dexamethasone in hospitalized patients with Covid-19. N Engl J Med. 2021;384:693-704. doi:10.1056/NEJMoa2021436
- Dooling K, Marin M, Wallace M, et al. The Advisory Committee on Immunization Practices’ updated interim recommendation for allocation of COVID-19 Vaccine - United States, December 2020. MMWR Morb Mortal Wkly Rep. 2021;69:1657-1660. doi:10.15585/mmwr.mm695152e2
- US Census Bureau. Explore census data. Accessed December 10, 2025. https://data.census.gov/profile?q=Income%20by%20Zip%20code%20tabulation%20area
- Charlson ME, Pompei P, Ales KL, et al. A new method of classifying prognostic comorbidity in longitudinal studies: development and validation. J Chronic Dis. 1987;40:373-383. doi:10.1016/0021-9681(87)90171-8
- Zullig LL, Carpenter WR, Provenzale D, Weinberger M, Reeve BB, Jackson GL. Examining potential colorectal cancer care disparities in the Veterans Affairs health care system. J Clin Oncol. 2013;31:3579-3584. doi:10.1200/JCO.2013.50.4753
- Grubaugh AL, Slagle DM, Long M, Frueh BC, Magruder KM. Racial disparities in trauma exposure, psychiatric symptoms, and service use among female patients in Veterans Affairs primary care clinics. Womens Health Issues. 2008;18:433-441. doi:10.1016/j.whi.2008.08.001
- Bosworth HB, Parsey KS, Butterfield MI, et al. Racial variation in wanting and obtaining mental health services among women veterans in a primary care clinic. J Natl Med Assoc. 2000;92:231-236.
- Luo J, Rosales M, Wei G, et al. Hospitalization, mechanical ventilation, and case-fatality outcomes in US veterans with COVID-19 disease between years 2020-2021. Ann Epidemiol. 2022;70:37-44. doi:10.1016/j.annepidem.2022.04.003
- Kondo K, Low A, Everson T, et al. Health disparities in veterans: a map of the evidence. Med Care. 2017;55 Suppl 9 Suppl 2:S9-S15. doi:10.1097/MLR.0000000000000756
- Grosicki GJ, Bunsawat K, Jeong S, Robinson AT. Racial and ethnic disparities in cardiometabolic disease and COVID-19 outcomes in White, Black/African American, and Latinx populations: Social determinants of health. Prog Cardiovasc Dis. 2022;71:4-10. doi:10.1016/j.pcad.2022.04.004
- National Center for Immunization and Respiratory Diseases (U.S.). Division of Viral Diseases. Coronavirus Disease 2019 (COVID-19): COVID-19 in Racial and Ethnic Minority Groups: June 4, 2020. CDC Stacks. June 4, 2020. Accessed January 14, 2026. https://stacks.cdc.gov/view/cdc/88770
- Yancy CW. COVID-19 and African Americans. JAMA. 2020;323:1891-1892. doi:10.1001/jama.2020.6548
- Magesh S, John D, Li WT, et al. Disparities in COVID-19 outcomes by race, ethnicity, and socioeconomic status: a systematic-review and meta-analysis. JAMA Netw Open. 2021;4:e2134147. doi:10.1001/jamanetworkopen.2021.34147
- Berkowitz SA, Traore CY, Singer DE, Atlas SJ. Evaluating area-based socioeconomic status indicators for monitoring disparities within health care systems: results from a primary care network. Health Serv Res. 2015;50:398-417. doi:10.1111/1475-6773.12229
- Social Vulnerability Index. Agency for Toxicity and Disease Registry. July 22, 2024. Accessed January 14, 2026. https://www.atsdr.cdc.gov/placeandhealth/svi/index.html
- Moss JL, Johnson NJ, Yu M, Altekruse SF, Cronin KA. Comparisons of individual- and area-level socioeconomic status as proxies for individual-level measures: evidence from the Mortality Disparities in American Communities study. Popul Health Metr. 2021;19:1. doi:10.1186/s12963-020-00244-x
- DC Department of Human Services. Response to COVID-19. Accessed January 14, 2026. https://dhs.dc.gov/page/responsetocovid19
- Wang PG, Brisbon NM, Hubbell H, et al. Is the Gap Closing? Comparison of sociodemographic cisparities in COVID-19 hospitalizations and outcomes between two temporal waves of admissions. J Racial Ethn Health Disparities. 2023;10:593-602. doi:10.1007/s40615-022-01249-y
Median Income and Clinical Outcomes of Hospitalized Persons With COVID-19 at an Urban Veterans Affairs Medical Center
Median Income and Clinical Outcomes of Hospitalized Persons With COVID-19 at an Urban Veterans Affairs Medical Center

Discharge Summary Completion
Discharge summaries (DS) correlate with rates of rehospitalization1, 2 and adverse events after discharge.3 The Joint Commission on the Accreditation of Healthcare Organizations acknowledges their importance and mandates that certain elements be included.4 Thus far, however, DS are not standardized across institutions and there is no expectation that they be available at postdischarge visits. There have been numerous attempts to improve the quality of DS by using more structured formats or computer generated summaries with positive results in term of comprehensiveness, clarity, and practitioner satisfaction58 but with persistence of serious errors and omissions.9
Postgraduate training is often the first opportunity for physicians to learn information transfer management skills. Unfortunately, DS are created by house staff who have minimal training in this area11 and feel like they have to learn by osmosis,12 resulting in poor quality DS and lack of availability at the point of care.1315
Previous research suggested that individualized feedback sessions for Internal Medicine residents improved the quality of certain aspects of their completed DS.10 We postulated that an audit and feedback educational intervention on DS for first year geriatric medicine fellows would also improve their quality. This technique involves chart or case review of clinical practice behaviors for a specific task followed by recommendation of new behaviors when applicable.16 Audit and feedback incorporates adult learning theory,1719 an essential part of continuous quality improvement that fits within the Accreditation Council for Graduate Medical Education (ACGME) competency of practice based learning and improvement,20 as an educational activity.
Methods
Setting
We conducted a preintervention post intervention study at the Brookdale Department of Geriatrics and Palliative Medicine at Mount Sinai Medical Center (MSMC) in New York City between July 1, 2006 and June 30, 2007. The study received an exemption from the MSMC Institutional Review Board. First year geriatric medicine fellows at MSMC were required to complete 2 months of inpatient service; the first during the first 6 months of the academic year and the second during the last 6 months of the year. Fellows dictated all DS, which were transcribed and routed for signature to the attending of record. Prior to our study, a discharge summary template consisting of 21 items was developed for clinical use. Template items, agreed upon by an expert internal panel of geriatricians and interprofessional faculty, were selected for their importance in assuring a safe transition of older adults from the inpatient to the outpatient setting.
Participants
All 5 first‐year fellows at the Brookdale Department of Geriatrics and Palliative Medicine at MSMC were invited to participate in the study.
Intervention
Audit #1
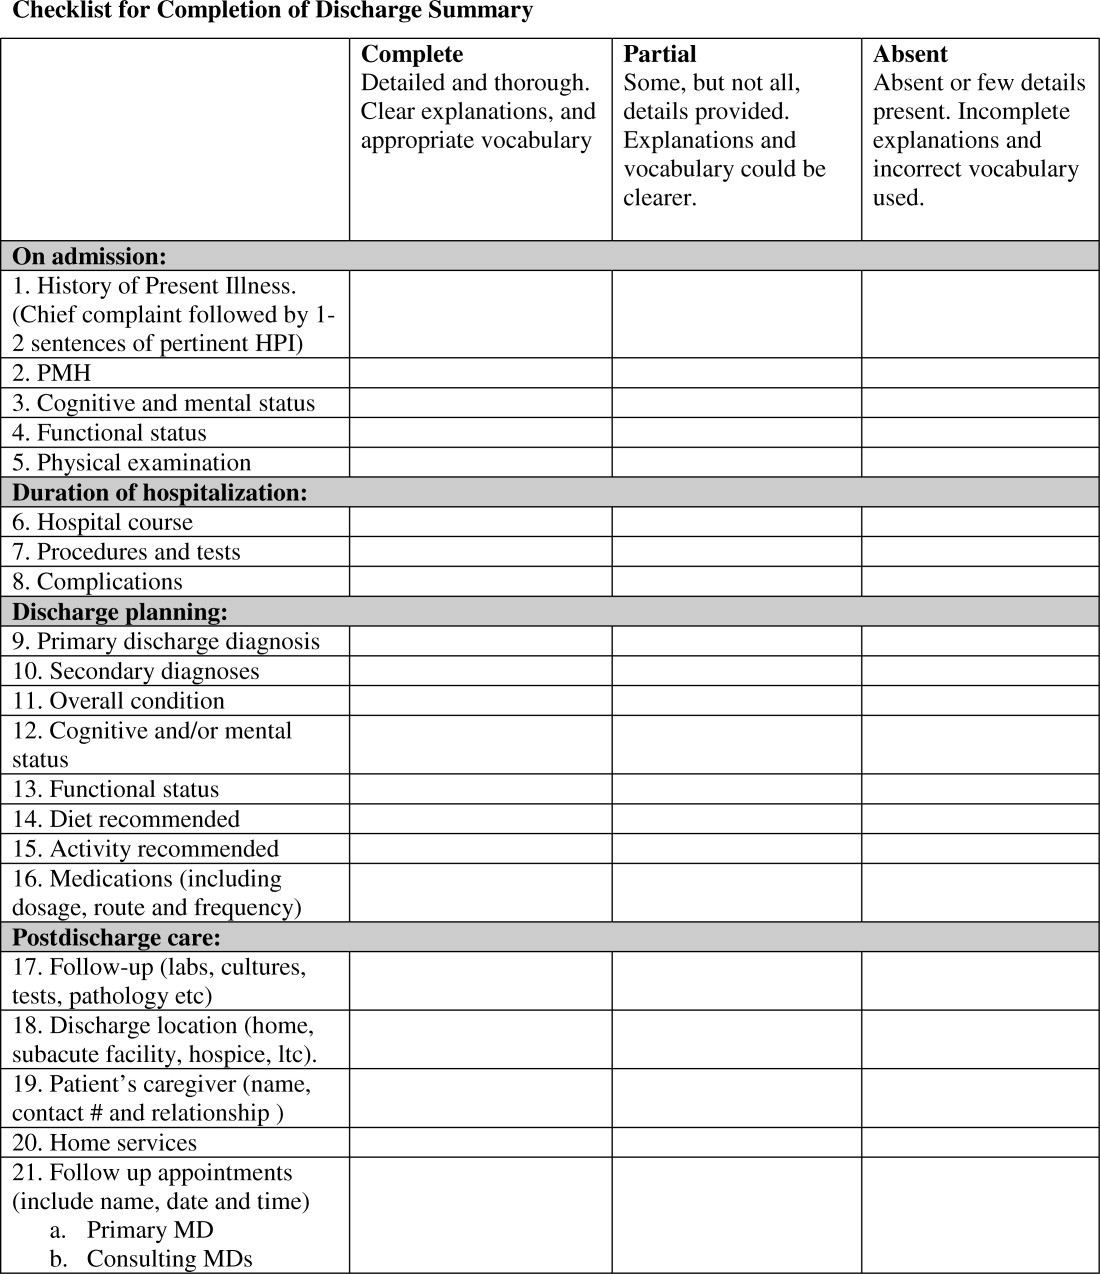
All available DS for each fellow's first month of inpatient service were audited for completeness of the 21 item discharge summary template by 1 author (AD). The 21 items were focused on 4 distinct periods of the hospitalization: admission, hospital course, discharge planning, and postdischarge care (Figure 1).

Content under each of the 21 items was classified as complete, partially complete, or absent. An item was considered complete if most information was present and appropriate medical terms were used, partially complete if information was unclear, and absent if no information was present for that area of the DS. To ensure investigator reliability, a random sample of 25% of each fellow's DS was scored by 2 additional investigators (RK and HF) and all disagreements were reviewed and resolved by consensus.
Feedback
Between December 2006 and January 2007, one‐on‐one formative feedback sessions were scheduled. The sessions were approximately 30 minutes long, confidential, performed by 1 of the authors (AD) and followed a written format. During these sessions, each fellow received the results of their discharge summary audit, each partially complete or absent item was discussed, and the importance of DS was emphasized.
Audit #2
All available DS for each fellow's second month of inpatient service were audited for completeness, using the same 21 item assessment tool and the same scoring system.
Statistical Analysis
To determine the impact of our audit and feedback intervention, we compared scores before and after formative feedback sessions, both overall and for the composite discharge summary scores for each of the 4 domains of care: admission, hospital course, discharge‐planning, and postdischarge care. Scores were dichotomized as being complete or partially complete or absent. We used generalized estimating equations to account for the clustering of DS within fellows. Analyses were performed using SAS 9.1 (SAS Institute, Inc., Cary, NC). All statistical tests were 2‐tailed and used a type I error rate of 0.01 to account for multiple comparisons.
Results
Five fellows participated, 4 of whom were women; 2 were in postgraduate year 4, 3 in year 5. A total of 158 DS were audited, 89 prefeedback and 79 postfeedback. Each fellow dictated an average of 17 DS during each inpatient month.
During Audit #1, the 21 item DS were complete among 71%, incomplete among 18%, absent among 11%. Admission items, hospital course items, and discharge planning items were complete among 70%, 78%, and 77% of DS respectively, but postdischarge items were complete among only 57%. Examining individual items, the lowest completion rates were found for test result follow‐up (42%), caregiver information (10%), and home services (64%), as well for assessment at admission and discharge of cognitive and mental status (56% and 53% respectively) and functional status (57% and 40%). Of note, all these items are of particular importance to geriatric care.
After receiving the audit and feedback intervention, fellows were more likely to complete all required discharge summary data when compared to prior‐to‐feedback (91% vs. 71%, P 0.001). Discharge summary completeness improved for all composite outcomes examining the four domains of care: admission (93% vs. 70%, P 0.001), hospital course (93% vs. 78%, P 0.001), discharge planning (93% vs. 77%, P 0.02), and postdischarge care (83% vs. 57%., P 0.001) (Table 1).
| Criteria | Preintervention | Postintervention | P Value* | ||
|---|---|---|---|---|---|
| Complete | Absent | Complete | Absent | ||
| |||||
| Admission composite (5 items) | 70 (3585) | 30 (1565) | 93 (79100) | 7 (021) | 0.001 |
| HPI | 79 (38100) | 21 (1563) | 100 | 0 | 0.001 |
| PMH | 94 (75100) | 5 (025) | 99 (93100) | 1 (07) | 0.001 |
| Cognitive/mental status | 56 (1979) | 44 (2182) | 99 (93100) | 1 (07) | 0.001 |
| Functional status | 57 (2588) | 43 (1375) | 97 (89100) | 2 (010) | 0.001 |
| Physical exam | 63 (19100) | 37 (082) | 72 (0100) | 28 (5100) | 0.27 |
| Hospital course composite (3 items) | 78 (2593) | 22 (775) | 93 (76100) | 7 (023) | 0.001 |
| Hospital course | 84 (25100) | 15 (076) | 99 (93100) | 1 (07) | 0.001 |
| Procedures and tests | 70 (690) | 30 (1094) | 90 (57100) | 10 (043) | 0.001 |
| Complications | 80 (4490) | 20 (556) | 90 (77100) | 10 (023) | 0.07 |
| Discharge planning composite (8 items) | 77 (4989) | 22 (1151) | 93 (64100) | 7 (036) | 0.02 |
| Primary diagnosis | 93 (75100) | 6 (026) | 100 | 0 | 0.03 |
| Secondary diagnosis | 82 (56100) | 18 (044) | 100 | 0 | 0.002 |
| Overall condition | 81 (38100) | 19 (062) | 86 (21100) | 14 (079) | 0.47 |
| Cognitive/mental status | 53 (1380) | 57 (2088) | 97 (93100) | 3 (07) | 0.001 |
| Functional status | 40 (1381) | 50 (1988) | 99 (93100) | 1 (07) | 0.001 |
| Diet | 89 (63100) | 12 (538) | 81 (0100) | 19 (0100) | 0.25 |
| Activity | 89 (69100) | 11 (032) | 82 (0100) | 18 (0100) | 0.49 |
| Medications | 83 (50100) | 17 (050) | 100 | 0 | 0.002 |
| Postdischarge care composite (5 items) | 57 (4183) | 43 (1759) | 83 (6998) | 18 (231) | 0.001 |
| F/U results | 42 (1190) | 58 (1089) | 81 (50100) | 20 (050) | 0.02 |
| Discharge location | 92 (88100) | 8 (012) | 100 | 0 | 0.02 |
| Caregiver info | 10 (025) | 89 (75100) | 48 (795) | 52 (584) | 0.001 |
| Home services | 64 (32100) | 35 (068) | 87 (7195) | 12 (029) | 0.001 |
| F/U appointments | 78 (33100) | 23 (067) | 96 (86100) | 4 (014) | 0.001 |
| Overall composite (21 items) | 71 (4287) | 29 (1358) | 91 (7399) | 9 (227) | 0.001 |
Discussion
Our study found that audit and feedback sessions significantly improved the completeness of DS dictated by geriatric medicine fellows at 1 academic medical center. Before feedback, completeness was high in most traditional areas of the DS including admission data, hospital course, and discharge planning, but was low in other areas critical for safe transitions of older adults such as postdischarge care, test follow‐up, caregiver information, and cognitive and functional status changes. These findings were surprising, as using a template should render a completion rate close to 100%. Notably, during feedback sessions, fellows suggested low completion rates were due to lack of awareness regarding the importance of completing all 21 items of the template and missing documentation in patient medical records.
Feedback sessions dramatically improved overall completeness of subsequent DS and in most of areas of specific importance for geriatric care, although we remain uncertain why all areas did not show improvement (for example, caregiver information completion remained low). One possible explanation is the lack of accurate documentation for all necessary items in the hospital medical record. Moreover, we did not observe completion improvement for other items, ie, diet and activity. Overall, we believe that drawing attention to areas of particular importance to geriatric care transitions and providing learners with individual reports on their performance increased their awareness and motivated changes to their practice, improving discharge summary completion.
Our study has limitations. This study was a pilot intervention without a control group, because of time and budgetary constraints. Also, we were unable to assess for sustainability because the fellows studied for this project graduated after the second audit. Third, we studied discharge summary completion; further research should focus on accuracy of discharge summary content. Finally, while we did not use any advanced technologies or materials, faculty time required to conduct the audit and feedback in this study was estimated at 45 hours. In our opinion this estimate would classify our audit and feedback intervention as a low external cost and moderately‐high human cost intervention, which may represent a potential barrier to generalizability. On the other hand, we believe that even an audit of a small sample of DS done by a physician could provide valuable data for feedback and would involve less faculty time.
Our finding that audit and feedback sessions improved the completeness of DS among house‐staff is important for 2 reasons. First, we were able to demonstrate that focused feedback targeted to areas of particular importance to the transition of older adults changed subsequent behavior and resulted in improved documentation of these areas. Second, our study provides evidence of a programmatic approach to address the ACGME competency of practice‐based learning and improvement. We believe that our intervention can be reproduced by training programs across the country and are hopeful that such interventions will result in improved patient outcomes during critical care transitions such as hospital discharge.
- ,Quality assessment of a discharge summary system.CMAJ.1995;152:1437–1442.
- ,,Accuracy of information on medicines in hospital discharge summaries.Intern Med J.2006;36:221–225.
- ,,,,The incidence and severity of adverse events affecting patients after discharge from the hospital.Ann Intern Med.2003;138:161–167.
- Available at: http://www.jointcommission.org./. The Joint Commission Requirements/Hospitals/Record of Care/Patient safety. Accessed July2010.
- ,,,,General practitioners' attitudes to computer‐generated surgical discharge letters.Med J Aust.1992;157(6):380–382.
- ,,,Do primary care physicians prefer dictated or computer‐generated discharge summaries?Am J Dis Child.1993;147(9):986–988.
- ,,,,,Evaluation of a computer‐generated discharge summary for patients with acute coronary syndromes.Br J Gen Pract.1998;48(429):1163–1164.
- ,,, et al.Creating a better discharge summary: improvement in quality and timeliness using an electronic dischanrge summary,J Hosp Med.2009;4(4):219–225.
- ,Communication with general practitioners after accident and emergency attendance: computer generated letters are often deficient.Emerg Med J.2003;20(3):256–257.
- ,,Evaluation of electronic discharge summaries: a comparison of documentation in electronic and handwritten discharge summaries.Int J Med Inform.2008;77:613–620.
- ,,,,,Are discharge summaries teachable? The effects of a discharge summary curriculum on the quality of discharge summaries in an internal medicine residency program.Acad Med.2006;81:S5–S8.
- ,,Experience of medical senior house officers in preparing discharge summaries.BMJ.1996;312:350.
- ,,,,,Deficits in communication and information transfer between hospital‐based and primary care physicians: implications for patient safety and continuity of care.JAMA.2007;297:831–841.
- ,,,Primary care physician attitudes regarding communication with hospitalists.Dis Mon.2002;48:218–229.
- ,,Improving the continuity of care following discharge of patients hospitalized with heart failure: is the discharge summary adequate?Can J Cardiol.2003;19:365–370.
- Effects of continuing medical education on improving physician clinical care and patient health: a review of systematic reviews.Int J Technol Assess Health Care.2005;21:380–385.
- ,,, et al.Impact of feedback and didactic sessions on the reporting behavior of upper endoscopic findings by physicians and nurses.Clin Gastroenterol Hepatol.2007;5:326–330.
- ,,Prospective assessment of the impact of feedback on colonoscopy performance.Aliment Pharmacol Ther.2006;24:313–318.
- ,,, et al.Inpatient care to community care: improving clinical handover in the private mental health setting.Med J Aust.2009;190(11 Suppl):S144–S149.
- Available at: http://www.Acgme.org, Record of care, Treatment, and Serives, Standard RC.02.04.01. Accessed July2010.
Discharge summaries (DS) correlate with rates of rehospitalization1, 2 and adverse events after discharge.3 The Joint Commission on the Accreditation of Healthcare Organizations acknowledges their importance and mandates that certain elements be included.4 Thus far, however, DS are not standardized across institutions and there is no expectation that they be available at postdischarge visits. There have been numerous attempts to improve the quality of DS by using more structured formats or computer generated summaries with positive results in term of comprehensiveness, clarity, and practitioner satisfaction58 but with persistence of serious errors and omissions.9
Postgraduate training is often the first opportunity for physicians to learn information transfer management skills. Unfortunately, DS are created by house staff who have minimal training in this area11 and feel like they have to learn by osmosis,12 resulting in poor quality DS and lack of availability at the point of care.1315
Previous research suggested that individualized feedback sessions for Internal Medicine residents improved the quality of certain aspects of their completed DS.10 We postulated that an audit and feedback educational intervention on DS for first year geriatric medicine fellows would also improve their quality. This technique involves chart or case review of clinical practice behaviors for a specific task followed by recommendation of new behaviors when applicable.16 Audit and feedback incorporates adult learning theory,1719 an essential part of continuous quality improvement that fits within the Accreditation Council for Graduate Medical Education (ACGME) competency of practice based learning and improvement,20 as an educational activity.
Methods
Setting
We conducted a preintervention post intervention study at the Brookdale Department of Geriatrics and Palliative Medicine at Mount Sinai Medical Center (MSMC) in New York City between July 1, 2006 and June 30, 2007. The study received an exemption from the MSMC Institutional Review Board. First year geriatric medicine fellows at MSMC were required to complete 2 months of inpatient service; the first during the first 6 months of the academic year and the second during the last 6 months of the year. Fellows dictated all DS, which were transcribed and routed for signature to the attending of record. Prior to our study, a discharge summary template consisting of 21 items was developed for clinical use. Template items, agreed upon by an expert internal panel of geriatricians and interprofessional faculty, were selected for their importance in assuring a safe transition of older adults from the inpatient to the outpatient setting.
Participants
All 5 first‐year fellows at the Brookdale Department of Geriatrics and Palliative Medicine at MSMC were invited to participate in the study.
Intervention
Audit #1
All available DS for each fellow's first month of inpatient service were audited for completeness of the 21 item discharge summary template by 1 author (AD). The 21 items were focused on 4 distinct periods of the hospitalization: admission, hospital course, discharge planning, and postdischarge care (Figure 1).
Content under each of the 21 items was classified as complete, partially complete, or absent. An item was considered complete if most information was present and appropriate medical terms were used, partially complete if information was unclear, and absent if no information was present for that area of the DS. To ensure investigator reliability, a random sample of 25% of each fellow's DS was scored by 2 additional investigators (RK and HF) and all disagreements were reviewed and resolved by consensus.
Feedback
Between December 2006 and January 2007, one‐on‐one formative feedback sessions were scheduled. The sessions were approximately 30 minutes long, confidential, performed by 1 of the authors (AD) and followed a written format. During these sessions, each fellow received the results of their discharge summary audit, each partially complete or absent item was discussed, and the importance of DS was emphasized.
Audit #2
All available DS for each fellow's second month of inpatient service were audited for completeness, using the same 21 item assessment tool and the same scoring system.
Statistical Analysis
To determine the impact of our audit and feedback intervention, we compared scores before and after formative feedback sessions, both overall and for the composite discharge summary scores for each of the 4 domains of care: admission, hospital course, discharge‐planning, and postdischarge care. Scores were dichotomized as being complete or partially complete or absent. We used generalized estimating equations to account for the clustering of DS within fellows. Analyses were performed using SAS 9.1 (SAS Institute, Inc., Cary, NC). All statistical tests were 2‐tailed and used a type I error rate of 0.01 to account for multiple comparisons.
Results
Five fellows participated, 4 of whom were women; 2 were in postgraduate year 4, 3 in year 5. A total of 158 DS were audited, 89 prefeedback and 79 postfeedback. Each fellow dictated an average of 17 DS during each inpatient month.
During Audit #1, the 21 item DS were complete among 71%, incomplete among 18%, absent among 11%. Admission items, hospital course items, and discharge planning items were complete among 70%, 78%, and 77% of DS respectively, but postdischarge items were complete among only 57%. Examining individual items, the lowest completion rates were found for test result follow‐up (42%), caregiver information (10%), and home services (64%), as well for assessment at admission and discharge of cognitive and mental status (56% and 53% respectively) and functional status (57% and 40%). Of note, all these items are of particular importance to geriatric care.
After receiving the audit and feedback intervention, fellows were more likely to complete all required discharge summary data when compared to prior‐to‐feedback (91% vs. 71%, P 0.001). Discharge summary completeness improved for all composite outcomes examining the four domains of care: admission (93% vs. 70%, P 0.001), hospital course (93% vs. 78%, P 0.001), discharge planning (93% vs. 77%, P 0.02), and postdischarge care (83% vs. 57%., P 0.001) (Table 1).
| Criteria | Preintervention | Postintervention | P Value* | ||
|---|---|---|---|---|---|
| Complete | Absent | Complete | Absent | ||
| |||||
| Admission composite (5 items) | 70 (3585) | 30 (1565) | 93 (79100) | 7 (021) | 0.001 |
| HPI | 79 (38100) | 21 (1563) | 100 | 0 | 0.001 |
| PMH | 94 (75100) | 5 (025) | 99 (93100) | 1 (07) | 0.001 |
| Cognitive/mental status | 56 (1979) | 44 (2182) | 99 (93100) | 1 (07) | 0.001 |
| Functional status | 57 (2588) | 43 (1375) | 97 (89100) | 2 (010) | 0.001 |
| Physical exam | 63 (19100) | 37 (082) | 72 (0100) | 28 (5100) | 0.27 |
| Hospital course composite (3 items) | 78 (2593) | 22 (775) | 93 (76100) | 7 (023) | 0.001 |
| Hospital course | 84 (25100) | 15 (076) | 99 (93100) | 1 (07) | 0.001 |
| Procedures and tests | 70 (690) | 30 (1094) | 90 (57100) | 10 (043) | 0.001 |
| Complications | 80 (4490) | 20 (556) | 90 (77100) | 10 (023) | 0.07 |
| Discharge planning composite (8 items) | 77 (4989) | 22 (1151) | 93 (64100) | 7 (036) | 0.02 |
| Primary diagnosis | 93 (75100) | 6 (026) | 100 | 0 | 0.03 |
| Secondary diagnosis | 82 (56100) | 18 (044) | 100 | 0 | 0.002 |
| Overall condition | 81 (38100) | 19 (062) | 86 (21100) | 14 (079) | 0.47 |
| Cognitive/mental status | 53 (1380) | 57 (2088) | 97 (93100) | 3 (07) | 0.001 |
| Functional status | 40 (1381) | 50 (1988) | 99 (93100) | 1 (07) | 0.001 |
| Diet | 89 (63100) | 12 (538) | 81 (0100) | 19 (0100) | 0.25 |
| Activity | 89 (69100) | 11 (032) | 82 (0100) | 18 (0100) | 0.49 |
| Medications | 83 (50100) | 17 (050) | 100 | 0 | 0.002 |
| Postdischarge care composite (5 items) | 57 (4183) | 43 (1759) | 83 (6998) | 18 (231) | 0.001 |
| F/U results | 42 (1190) | 58 (1089) | 81 (50100) | 20 (050) | 0.02 |
| Discharge location | 92 (88100) | 8 (012) | 100 | 0 | 0.02 |
| Caregiver info | 10 (025) | 89 (75100) | 48 (795) | 52 (584) | 0.001 |
| Home services | 64 (32100) | 35 (068) | 87 (7195) | 12 (029) | 0.001 |
| F/U appointments | 78 (33100) | 23 (067) | 96 (86100) | 4 (014) | 0.001 |
| Overall composite (21 items) | 71 (4287) | 29 (1358) | 91 (7399) | 9 (227) | 0.001 |
Discussion
Our study found that audit and feedback sessions significantly improved the completeness of DS dictated by geriatric medicine fellows at 1 academic medical center. Before feedback, completeness was high in most traditional areas of the DS including admission data, hospital course, and discharge planning, but was low in other areas critical for safe transitions of older adults such as postdischarge care, test follow‐up, caregiver information, and cognitive and functional status changes. These findings were surprising, as using a template should render a completion rate close to 100%. Notably, during feedback sessions, fellows suggested low completion rates were due to lack of awareness regarding the importance of completing all 21 items of the template and missing documentation in patient medical records.
Feedback sessions dramatically improved overall completeness of subsequent DS and in most of areas of specific importance for geriatric care, although we remain uncertain why all areas did not show improvement (for example, caregiver information completion remained low). One possible explanation is the lack of accurate documentation for all necessary items in the hospital medical record. Moreover, we did not observe completion improvement for other items, ie, diet and activity. Overall, we believe that drawing attention to areas of particular importance to geriatric care transitions and providing learners with individual reports on their performance increased their awareness and motivated changes to their practice, improving discharge summary completion.
Our study has limitations. This study was a pilot intervention without a control group, because of time and budgetary constraints. Also, we were unable to assess for sustainability because the fellows studied for this project graduated after the second audit. Third, we studied discharge summary completion; further research should focus on accuracy of discharge summary content. Finally, while we did not use any advanced technologies or materials, faculty time required to conduct the audit and feedback in this study was estimated at 45 hours. In our opinion this estimate would classify our audit and feedback intervention as a low external cost and moderately‐high human cost intervention, which may represent a potential barrier to generalizability. On the other hand, we believe that even an audit of a small sample of DS done by a physician could provide valuable data for feedback and would involve less faculty time.
Our finding that audit and feedback sessions improved the completeness of DS among house‐staff is important for 2 reasons. First, we were able to demonstrate that focused feedback targeted to areas of particular importance to the transition of older adults changed subsequent behavior and resulted in improved documentation of these areas. Second, our study provides evidence of a programmatic approach to address the ACGME competency of practice‐based learning and improvement. We believe that our intervention can be reproduced by training programs across the country and are hopeful that such interventions will result in improved patient outcomes during critical care transitions such as hospital discharge.
- ,Quality assessment of a discharge summary system.CMAJ.1995;152:1437–1442.
- ,,Accuracy of information on medicines in hospital discharge summaries.Intern Med J.2006;36:221–225.
- ,,,,The incidence and severity of adverse events affecting patients after discharge from the hospital.Ann Intern Med.2003;138:161–167.
- Available at: http://www.jointcommission.org./. The Joint Commission Requirements/Hospitals/Record of Care/Patient safety. Accessed July2010.
- ,,,,General practitioners' attitudes to computer‐generated surgical discharge letters.Med J Aust.1992;157(6):380–382.
- ,,,Do primary care physicians prefer dictated or computer‐generated discharge summaries?Am J Dis Child.1993;147(9):986–988.
- ,,,,,Evaluation of a computer‐generated discharge summary for patients with acute coronary syndromes.Br J Gen Pract.1998;48(429):1163–1164.
- ,,, et al.Creating a better discharge summary: improvement in quality and timeliness using an electronic dischanrge summary,J Hosp Med.2009;4(4):219–225.
- ,Communication with general practitioners after accident and emergency attendance: computer generated letters are often deficient.Emerg Med J.2003;20(3):256–257.
- ,,Evaluation of electronic discharge summaries: a comparison of documentation in electronic and handwritten discharge summaries.Int J Med Inform.2008;77:613–620.
- ,,,,,Are discharge summaries teachable? The effects of a discharge summary curriculum on the quality of discharge summaries in an internal medicine residency program.Acad Med.2006;81:S5–S8.
- ,,Experience of medical senior house officers in preparing discharge summaries.BMJ.1996;312:350.
- ,,,,,Deficits in communication and information transfer between hospital‐based and primary care physicians: implications for patient safety and continuity of care.JAMA.2007;297:831–841.
- ,,,Primary care physician attitudes regarding communication with hospitalists.Dis Mon.2002;48:218–229.
- ,,Improving the continuity of care following discharge of patients hospitalized with heart failure: is the discharge summary adequate?Can J Cardiol.2003;19:365–370.
- Effects of continuing medical education on improving physician clinical care and patient health: a review of systematic reviews.Int J Technol Assess Health Care.2005;21:380–385.
- ,,, et al.Impact of feedback and didactic sessions on the reporting behavior of upper endoscopic findings by physicians and nurses.Clin Gastroenterol Hepatol.2007;5:326–330.
- ,,Prospective assessment of the impact of feedback on colonoscopy performance.Aliment Pharmacol Ther.2006;24:313–318.
- ,,, et al.Inpatient care to community care: improving clinical handover in the private mental health setting.Med J Aust.2009;190(11 Suppl):S144–S149.
- Available at: http://www.Acgme.org, Record of care, Treatment, and Serives, Standard RC.02.04.01. Accessed July2010.