User login
Feeding during High-Flow Nasal Cannula for Bronchiolitis: Associations with Time to Discharge
Bronchiolitis is the most common cause of nonbirth hospitalization in children in the United States less than one year of age.1 For children with severe bronchiolitis, high-flow nasal cannula (HFNC) is increasingly used2-4 to reduce work of breathing and prevent the need for further escalation of ventilatory support.5,6 Although previous studies suggest that enteral feeding is recommended in the management of patients hospitalized with bronchiolitis,7-9 limited evidence exists to guide feeding practices for patients receiving HFNC support.5,10,11
Respiratory support with HFNC has been associated with prolonged periods without enteral hydration/nutrition (ie, nil per os [NPO])12 primarily due to anticipation of further escalation of respiratory support or concern for increased risk of aspiration. The majority of patients with bronchiolitis managed with HFNC, however, do not require escalation of care.5,13 When feeding is attempted during HFNC support, it is frequently interrupted.5 Moreover, keeping all children NPO when receiving HFNC may be associated with weight loss and longer length of stay (LOS).12,14 Two small studies found that children admitted to the intensive care unit who received HFNC support for bronchiolitis did not have increased rates of emesis, worsening respiratory distress or aspiration pneumonia when enterally fed.10,11 However, no comparison of adverse events or LOS has been made between patients who were fed and those who were not fed during HFNC therapy, and previous studies have included only patients who have received HFNC in the intensive care setting.
Supporting safe feeding early in hospitalizations for bronchiolitis may facilitate expedited clinical improvement and discharge. As part of an ongoing bronchiolitis quality improvement initiative at our hospital, we sought to characterize feeding practices during HFNC therapy and assess whether feeding exposure was associated with (1) time to discharge after HFNC or (2) feeding-related adverse events. We hypothesized that feeding during HFNC therapy would be associated with a shorter time to discharge after HFNC cessation.
METHODS
Study Design, Setting, Participants
This was a retrospective cohort study of patients aged 1-24 months receiving HFNC support for respiratory failure due to bronchiolitis at an academic children’s hospital between January 1, 2015 and March 1, 2017. Our institution has had a clinical practice guideline, associated order set, and respiratory therapy protocol for general care patients with bronchiolitis since 2009. Patients with bronchiolitis who were weaning HFNC have been cared for in both the intensive and general care settings since 2013. A formal process for initiation of HFNC on general care units was instituted in January of 2017. During the study period, no patients with HFNC support for bronchiolitis had all their care entirely outside the intensive care unit at our institution. However, initiation and subsequent use of HFNC may have occurred in either the intensive care or general care setting. No specific guidance for feeding during HFNC existed during this period.
Patients were identified using the Virtual PICU Systems database, (VPS LLC, myvps.org, Los Angeles, California) and, by definition, all patients received at least some of their care in the intensive care unit. Patients with comorbid conditions of prematurity (<35 weeks) and those with cardiopulmonary, neuromuscular, and genetic diseases were included. Patients with preexisting dysphagia, defined as ongoing outpatient speech therapy for swallowing concerns, an admission diagnosis of aspiration pneumonia or on home respiratory support, were excluded. Children (n = 7) were excluded if they had more than one period of HFNC during admission. This study was determined to be exempt by the University of Wisconsin School of Medicine and Public Health’s Institutional Review Board.
Data Collection and Study Variables
The following variables were collected from VPS administrative data: patient gender, age, admission and discharge date and time, type and total hours of respiratory support, intensive care admission, and LOS (in hours). Additional demographic, clinical, and feeding exposure variables were abstracted manually from the electronic medical record (Epic, Verona, Wisconsin) using a structured data collection tool and stored in REDCap (Research Electronic Data Capture)15 including prematurity, race/ethnicity, insurance status, primary language, and passive tobacco smoke exposure. Clinical variables included duration of illness (days) at the time of admission, unit of HFNC initiation (emergency department, general care, intensive care, respiratory rate and oxygen saturation at HFNC initiation (<90%, 91%-92%, or >92%), acquisition of blood gas at HFNC admission, duration of time on HFNC (hours) and need for intubation or noninvasive ventilation prior to HFNC. The Pediatric Index of Mortality 2 Risk of Mortality (PIM 2 ROM)16 was used to estimate the severity of illness. The PIM2ROM uses clinical variables (systolic blood pressure, fixed pupils, measure of hypoxia using PaO2/FiO2 ratio, base excess, mechanical ventilation, elective admission, recovery from surgery, cardiac bypass, high-risk diagnosis, low-risk diagnosis) collected at the time of intensive care admission to generate a score that predicts the risk of mortality for an individual patient.17
Feeding exposures were documented in three-hour intervals from HFNC initiation to completion using a structured protocol. At each interval the following feeding information was abstracted from a review of nursing and physician documentation and relevant clinical flowsheets: presence or absence of feeding during the interval, route of feeding (oral, nasogastric [NG] or nasojejunal [NJ]). Feeding exposure was categorized a priori as fed at any point during HFNC (vs not fed at any point). Fed children were further characterized as (1) mixed feeding consisting of oral and tube feeds (NG or NJ) or (2) exclusive oral feeding throughout HFNC support (Appendix 1).
The primary outcome was the number of hours to discharge from HFNC cessation. Secondary outcomes were time to discharge from HFNC initiation, all-cause readmissions within seven days of discharge, and potential feeding-related adverse events. Potential adverse events included: (1) aspiration, defined as initiation of antibiotic AND either chest radiograph official interpreted as evidence for aspiration and/or documented concern for aspiration from the treating physician, or (2) intubation after feeding during HFNC.
Statistical Analysis
Descriptive statistics evaluated differences in demographics and clinical variables for feeding exposure groups. We used chi-squared tests for differences in proportions and t-tests or Wilcoxon Rank-Sum tests for differences in means or medians for continuous variables, respectively. Associations between feeding exposure during HFNC and time to discharge (measured in hours) after HFNC completion were modeled with Cox proportional hazards regression. Using this approach, hazard ratios (HR)>1 indicate a higher hazard (rate) of discharge for children with a feeding exposure than for children without the exposure. For example, a hazard ratio equal to two indicates that the exposed population is discharged at twice the rate per unit time as the nonexposed population. Death or censoring events did not occur. Feeding exposure was first modeled dichotomously as not fed or fed. To further explore associations between feeding modality and our outcome, we then modeled feeding exposure categorically as not fed (reference), mixed (oral and tube) feeding, or exclusive oral feeding throughout HFNC.
After constructing a set of unadjusted models, we then adjusted the models for variables having independent (bivariate P < .10) associations with time to discharge: age, unit of HFNC initiation, highest respiratory support required before HFNC, and HFNC duration. Finally, to attempt to account for residual confounding from latent constructs, we also created a set of propensity-weighted Cox proportional hazards models. Propensity weights18 reflecting the probability of being fed or never being fed during HFNC were created using logistic regression with predictors we hypothesized a priori that may have influenced the clinical decision to feed during HFNC: age, day of illness on admission, prematurity, PIM2 ROM score, respiratory rate, oxygen saturation and blood gas acquisition at HFNC initiation, and highest respiratory support required before HFNC. All analyses were conducted using STATA 14.0 (StataCorp, College Station, Texas), and adjusted hazard ratios (aHR) with 95% confidence intervals (95% CIs) were reported.
RESULTS
Patients (n = 123) had a mean age of 7.3 months (standard deviation [SD] 7.1) and presented on day of illness 4.8 (SD 2.3). Prior to HFNC, 10% required higher respiratory support (3% mechanical ventilation). Former preterm children were 12% of the overall sample.
During HFNC, 37% of patients were never fed, 41% were exclusively orally fed, and 23% had tube or mixed oral and tube feedings (Table 1 and Appendix 2). Children who were not fed were older, but groups were otherwise similar in terms of gender, race/ethnicity, passive smoke exposure, day of illness, unit of HFNC initiation, respiratory support required prior to HFNC, and respiratory rate at HFNC initiation.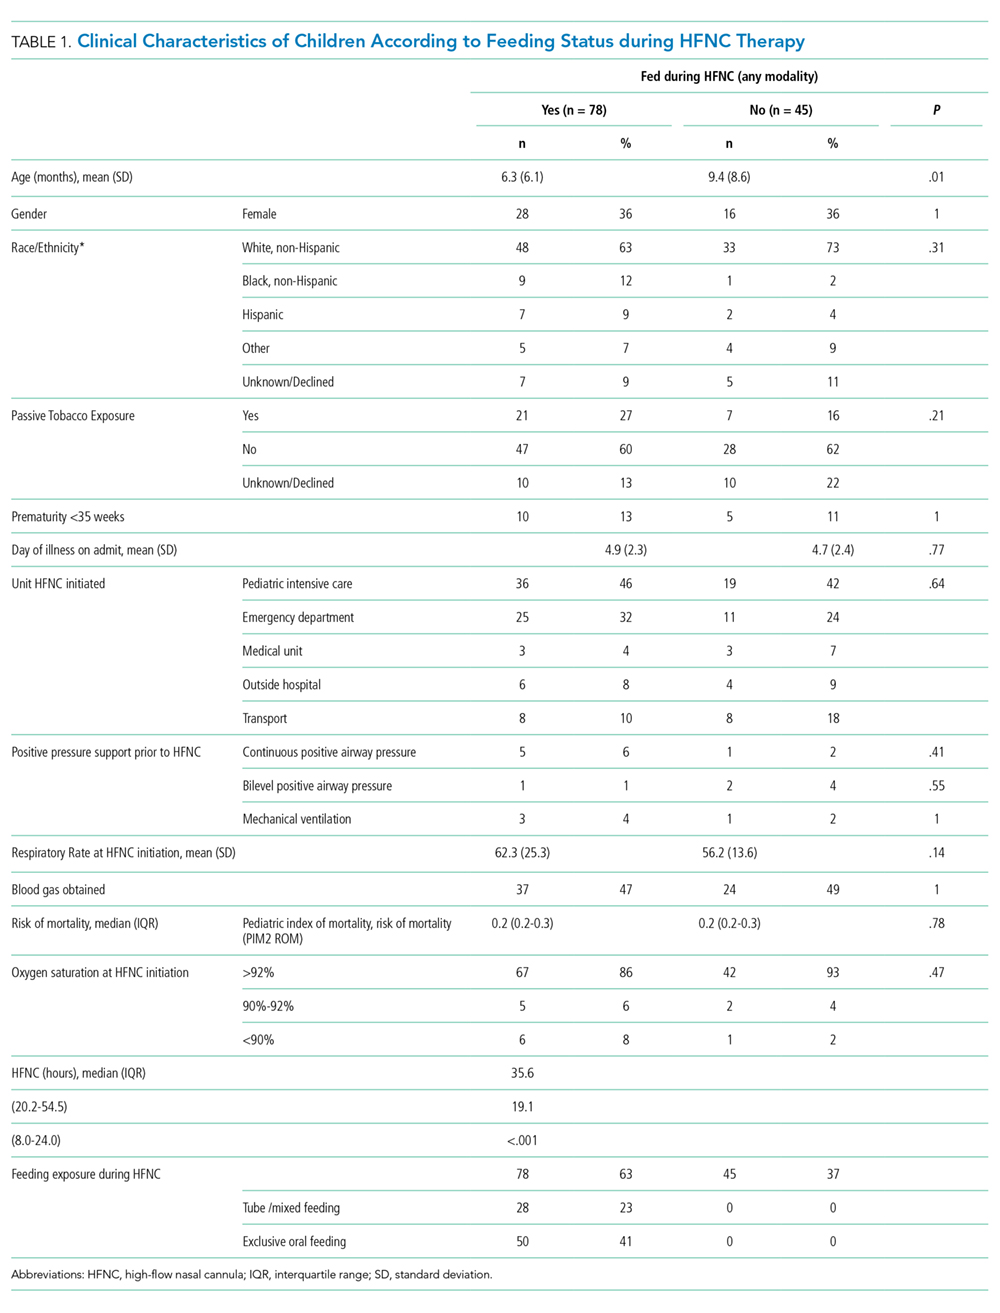
Median time to discharge after HFNC completion was 31.4 hours (interquartile range [IQR] 23.9-52). Median (IQR) time to discharge was 29.5 (IQR 23.5-47.9) hours in children who were fed and 39.8 (26.4-61.5) hours in those who were not fed (unadjusted HR 1.25 [0.86-1.82], aHR 1.83 [95% CI: 1.16-2.88]). Time to discharge was shortest when children were fed exclusively orally (Figure). Compared with children who were not fed, time to discharge following HFNC completion was significantly shorter for those who were exclusively orally fed (aHR 2.13 [95% CI: 1.31-3.45]; Table 2). Results of the propensity-weighted model were similar: time to discharge after completing HFNC was shorter in fed versus not fed children (HR 2.17; 95 % CI: 1.34-3.50). The secondary outcome, time to discharge from HFNC initiation, had a similar relationship, ie, shorter time to discharge with exclusive oral feeding vs not feeding [aHR 1.95 (95% CI: 1.19-3.18)]. Time to discharge after initiation of HFNC was also shorter for fed versus not fed in propensity-weighted analysis (HR 1.97; 95% CI: 1.13-3.43).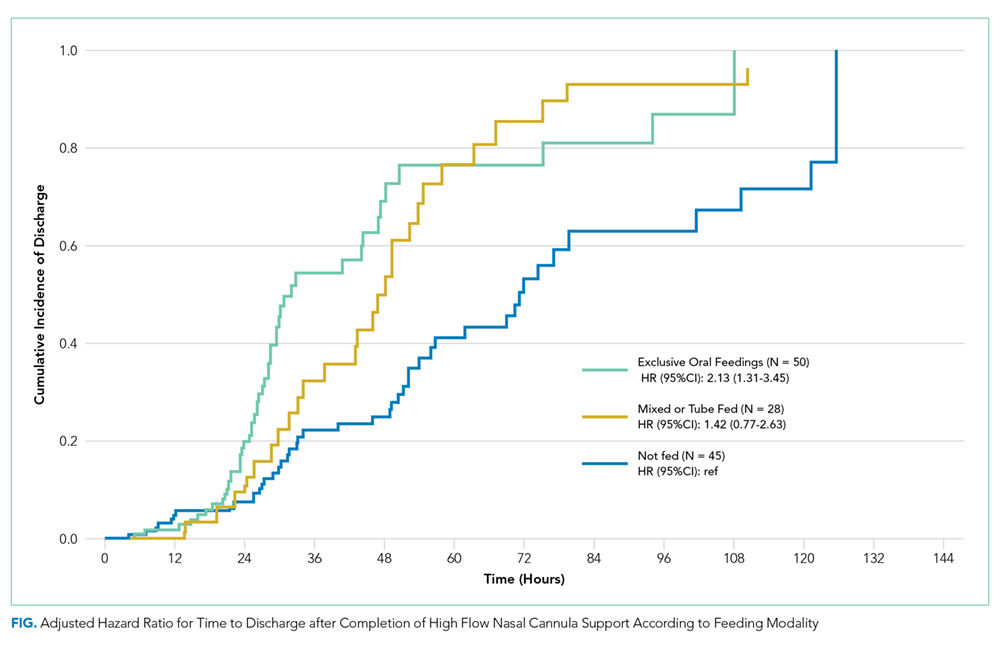
DISCUSSION
This observational study found that being fed during HFNC was associated with shorter time to discharge after HFNC support was completed. Exclusive oral feeding was associated with the shortest time to discharge, and these results were consistent across a variety of analytical approaches. Adverse events were rare and occurred in both fed and unfed children.
These findings advance research on relationships between nutrition and bronchiolitis outcomes. Studies of general care patients with bronchiolitis without HFNC have observed associations between poor nutrition and prolonged LOS.19,20 Two previous studies of patients receiving HFNC therapy for bronchiolitis concluded that frequent interruption11 and later initiation of enteral nutrition10 during ICU stay was associated with longer time to discharge.11 To our knowledge, this is the first study of patients with bronchiolitis treated with HFNC in both general care and ICU settings that compared outcomes according to whether children were fed during HFNC therapy. Our results extend previous work demonstrating that delays in feeding may be associated with longer LOS.
Decisions to feed children with respiratory distress due to bronchiolitis are complex and often subjective. Readiness to feed may be based upon the assessment of a child’s work of breathing, trajectory of illness, institutional culture, and individual physician, nurse, respiratory therapist or speech-language pathologist comfort. In the absence of established feeding best practices,21 some institutions have developed guidelines based on local expert opinion; however, often these recommendations remain largely subjective and nonspecific.5,10,22-24 Although decisions to feed may be influenced by concern about a child’s clinical stability and feeding risk, we found few objective clinical differences between children fed (orally or by enteral tube) or not fed. Moreover, our results were consistent even when we used a propensity-weighted model to account for measured factors that may have been associated with the decision to initiate feeding. This suggests the decision to feed could be more arbitrary than we assume and is important to investigate in future research.
Additionally, although a few early studies have aimed to standardize the process of weaning HFNC support in bronchiolitis,25,26 this process is also largely subjective.10,22,23 As such, the weaning process may be influenced by perceptions of the child’s overall health. Orally fed children may be viewed as more comfortable or well and thus, more readily weaned, which ultimately influences the length of HFNC therapy. Our study design attempted to account for this potential bias by measuring time to discharge following HFNC therapy, rather than measuring total LOS. Meeting adequate calorie, weight, or hydration goals prior to discharge may take longer if feeds have been withheld. We speculate that prolonged periods of NPO might also risk transient oral aversion or feeding discoordination that could influence LOS. Previous research involving broad intensive care unit populations has established the importance of providing nutrition to critically ill children as soon as possible as a means of improving outcomes.27-29 Patients receiving HFNC support for bronchiolitis could plausibly experience similar benefits.
This single-center study with a relatively small sample size has important limitations to consider. The observational design limits our ability to draw conclusions about causal relationships between feeding, time to discharge, and adverse events. In particular, feeding exposure did not account for nuances in feeding timing, feeding density, and other elements of feeding exposure. Additionally, adverse events are rare, and this study is inadequately powered to detect differences between exposure groups. Although we included children cared for in general and intensive care units, our findings may not be generalizable to other hospitals with different placement criteria. Despite the creation of adjusted and propensity-weighted models, our results are still subject to possible residual indication bias. We cannot control for all possible confounders, particularly unmeasured factors which might simultaneously motivate decisions whether, when, and how to feed children receiving HFNC therapy and influence time to discharge after HFNC is finished. Although this study observed associations between feeding during HFNC and both our primary (time to discharge after HFNC was complete) and secondary (time to discharge after HFNC was initiated) outcomes, future work should evaluate how feeding strategies might impact total LOS, particularly as management becomes more standardized.
Prospective studies of feeding exposures during HFNC therapy in bronchiolitis, as well as rigorous interventional study designs, are needed to confirm shorter lengths of stay and safety with larger and more diverse samples. Future research should evaluate methods to safely and effectively feed children with severe bronchiolitis, which would inform standardized evidence-based approaches. Given the scale on which children with bronchiolitis are admitted each year, the implications of such work could be substantial.
CONCLUSION
Children fed while receiving HFNC for bronchiolitis may have shorter time to discharge than those who are not fed. Feeding-related adverse events were rare regardless of the feeding method. Controlled prospective studies addressing residual confounding are needed to justify a change in the current practice.
Acknowledgments
The authors would like to acknowledge the valuable feedback on earlier drafts from members of the University of Wisconsin Division of Pediatric Hospital Medicine CREATE writing group.
1. HCUPnet. http s://hcupnet.ahrq.gov/. Accessed February 7, 2019.
2. Beggs S, Wong ZH, Kaul S, Ogden KJ, Walters JA. High-flow nasal cannula therapy for infants with bronchiolitis. Cochrane Database Syst Rev. 2014;1(1):CD009609. https://doi.org/10.1002/14651858.CD009609.pub2.
3. Mayfield S, Bogossian F, O’Malley L, Schibler A. High-flow nasal cannula oxygen therapy for infants with bronchiolitis: pilot study. J Paediatr Child Health. 2014;50(5):373-378. https://doi.org/10.1111/jpc.12509.
4. Hilliard TN, Archer N, Laura H, et al. Pilot study of vapotherm oxygen delivery in moderately severe bronchiolitis. Arch Dis Child. 2012;97(2):182-183. https://doi.org/10.1136/archdischild-2011-301151.
5. Franklin D, Babl FE, Schlapbach LJ, et al. A randomized trial of high-flow oxygen therapy in infants with bronchiolitis. N Engl J Med. 2018;378(12):1121-1131. https://doi.org/10.1056/NEJMoa1714855.
6. McKiernan C, Chua LC, Visintainer PF, Allen H. High flow nasal cannulae therapy in infants with bronchiolitis. J Pediatr. 2010;156(4):634-638. https://doi.org/10.1016/j.jpeds.2009.10.039.
7. Maffey A, Moviglia T, Mirabello C, et al. Swallowing and respiratory distress in hospitalized patients with bronchiolitis. Dysphagia. 2013;28(4):582-587. https://doi.org/10.1007/s00455-013-9470-0.
8. Kugelman A, Raibin K, Dabbah H, et al. Intravenous fluids versus gastric-tube feeding in hospitalized infants with viral bronchiolitis: a randomized, prospective pilot study. J Pediatr. 2013;162(3):640-642.e641. https://doi.org/10.1016/j.jpeds.2012.10.057.
9. Oakley E, Borland M, Neutze J, et al. Nasogastric hydration versus intravenous hydration for infants with bronchiolitis: a randomised trial. Lancet Respir Med. 2013;1(2):113-120. https://doi.org/10.1016/S2213-2600(12)70053-X.
10. Slain KN, Martinez-Schlurmann N, Shein SL, Stormorken A. Nutrition and high-flow nasal cannula respiratory support in children with bronchiolitis. Hosp Pediatr. 2017;7(5):256-262. https://doi.org/10.1542/hpeds.2016-0194.
11. Sochet AA, McGee JA, October TW. Oral nutrition in children with bronchiolitis on high-flow nasal cannula is well tolerated. Hosp Pediatr. 2017;7(5):249-255. https://doi.org/10.1542/hpeds.2016-0131.
12. Canarie MF, Barry S, Carroll CL, et al. Risk factors for delayed enteral nutrition in critically ill children. Pediatr Crit Care Med. 2015;16(8):e283-e289. https://doi.org/10.1097/PCC.0000000000000527.
13. Schibler A, Pham TM, Dunster KR, et al. Reduced intubation rates for infants after introduction of high-flow nasal prong oxygen delivery. Intensive Care Med. 2011;37(5):847-852. https://doi.org/10.1007/s00134-011-2177-5.
14. Hamilton S, McAleer DM, Ariagno K, et al. A stepwise enteral nutrition algorithm for critically ill children helps achieve nutrient delivery goals*. Pediatr Crit Care Med. 2014;15(7):583-589. https://doi.org/10.1097/PCC.0000000000000179.
15. Harris PA, Taylor R, Thielke R, et al. Research electronic data capture (REDCap)--a metadata-driven methodology and workflow process for providing translational research informatics support. J Biomed Inform. 2009;42(2):377-381. https://doi.org/10.1016/j.jbi.2008.08.010.
16. Slater A, Shann F, Group APS. The suitability of the Pediatric Index of Mortality (PIM), PIM2, the Pediatric Risk of Mortality (PRISM), and PRISM III for monitoring the quality of pediatric intensive care in Australia and New Zealand. Pediatr Crit Care Med. 2004;5(5):447-454. https://doi.org/10.1097/01.PCC.0000138557.31831.65.
17. Slater A, Shann F, Pearson G, Paediatric Index of Mortality Study G. PIM2: a revised version of the Paediatric Index of Mortality. Intensive Care Med. 2003;29(2):278-285. https://doi.org/10.1007/s00134-002-1601-2.
18. Lanza ST, Moore JE, Butera NM. Drawing causal inferences using propensity scores: a practical guide for community psychologists. Am J Commun Psychol. 2013;52(3-4):380-392. https://doi.org/10.1007/s10464-013-9604-4.
19. Weisgerber MC, Lye PS, Li SH, et al. Factors predicting prolonged hospital stay for infants with bronchiolitis. J Hosp Med. 2011;6(5):264-270. https://doi.org/10.1002/jhm.903.
20. Halvorson EE, Chandler N, Neiberg R, Ervin SE. Association of NPO status and type of nutritional support on weight and length of stay in infants hospitalized with bronchiolitis. Hosp Pediatr. 2013;3(4):366-370. https://doi.org/10.1542/hpeds.2013-0011.
21. Ralston SL, Lieberthal AS, Meissner HC, et al. Clinical practice guideline: the diagnosis, management, and prevention of bronchiolitis. Pediatrics. 2014;134(5):e1474-e1502. https://doi.org/10.1542/peds.2014-2742.
22. Seattle Children’s Hospital ZS, Beardsley E, Crotwell D, et al. Bronchiolitis Pathway. http:// www.seattlechildrens.org/pdf/bronchiolitis-pathway.pdf. Accessed January 29, 2019.
23. Children’s Hospital of Philidelphia DM, Zorc J, Kreindler, J, et al. Inpatient Pathway for Treatment of the Child with Bronchiolitis. https://www.chop.edu/clinical-pathway/bronchiolitis-inpatient-treatment-clinical-pathway. Accessed January 29, 2019.
24. Children’s Hospital Colorado TA, Topoz I, Freeman J, et al. Pediatric Viral Bronchiolitis. https://www.childrenscolorado.org/globalassets/healthcare-professionals/clinical-pathways/bronchiolitis.pdf. Accessed January 29, 2019.
25. Betters KA, Hebbar KB, McCracken C, et al. A novel weaning protocol for high-flow nasal cannula in the PICU. Pediatr Crit Care Med. 2017;18(7):e274-e280. https://doi.org/10.1097/PCC.0000000000001181.
26. Kepreotes E, Whitehead B, Attia J, et al. High-flow warm humidified oxygen versus standard low-flow nasal cannula oxygen for moderate bronchiolitis (HFWHO RCT): an open, phase 4, randomised controlled trial. Lancet. 2017;389(10072):930-939. https://doi.org/10.1016/S0140-6736(17)30061-2.
Bronchiolitis is the most common cause of nonbirth hospitalization in children in the United States less than one year of age.1 For children with severe bronchiolitis, high-flow nasal cannula (HFNC) is increasingly used2-4 to reduce work of breathing and prevent the need for further escalation of ventilatory support.5,6 Although previous studies suggest that enteral feeding is recommended in the management of patients hospitalized with bronchiolitis,7-9 limited evidence exists to guide feeding practices for patients receiving HFNC support.5,10,11
Respiratory support with HFNC has been associated with prolonged periods without enteral hydration/nutrition (ie, nil per os [NPO])12 primarily due to anticipation of further escalation of respiratory support or concern for increased risk of aspiration. The majority of patients with bronchiolitis managed with HFNC, however, do not require escalation of care.5,13 When feeding is attempted during HFNC support, it is frequently interrupted.5 Moreover, keeping all children NPO when receiving HFNC may be associated with weight loss and longer length of stay (LOS).12,14 Two small studies found that children admitted to the intensive care unit who received HFNC support for bronchiolitis did not have increased rates of emesis, worsening respiratory distress or aspiration pneumonia when enterally fed.10,11 However, no comparison of adverse events or LOS has been made between patients who were fed and those who were not fed during HFNC therapy, and previous studies have included only patients who have received HFNC in the intensive care setting.
Supporting safe feeding early in hospitalizations for bronchiolitis may facilitate expedited clinical improvement and discharge. As part of an ongoing bronchiolitis quality improvement initiative at our hospital, we sought to characterize feeding practices during HFNC therapy and assess whether feeding exposure was associated with (1) time to discharge after HFNC or (2) feeding-related adverse events. We hypothesized that feeding during HFNC therapy would be associated with a shorter time to discharge after HFNC cessation.
METHODS
Study Design, Setting, Participants
This was a retrospective cohort study of patients aged 1-24 months receiving HFNC support for respiratory failure due to bronchiolitis at an academic children’s hospital between January 1, 2015 and March 1, 2017. Our institution has had a clinical practice guideline, associated order set, and respiratory therapy protocol for general care patients with bronchiolitis since 2009. Patients with bronchiolitis who were weaning HFNC have been cared for in both the intensive and general care settings since 2013. A formal process for initiation of HFNC on general care units was instituted in January of 2017. During the study period, no patients with HFNC support for bronchiolitis had all their care entirely outside the intensive care unit at our institution. However, initiation and subsequent use of HFNC may have occurred in either the intensive care or general care setting. No specific guidance for feeding during HFNC existed during this period.
Patients were identified using the Virtual PICU Systems database, (VPS LLC, myvps.org, Los Angeles, California) and, by definition, all patients received at least some of their care in the intensive care unit. Patients with comorbid conditions of prematurity (<35 weeks) and those with cardiopulmonary, neuromuscular, and genetic diseases were included. Patients with preexisting dysphagia, defined as ongoing outpatient speech therapy for swallowing concerns, an admission diagnosis of aspiration pneumonia or on home respiratory support, were excluded. Children (n = 7) were excluded if they had more than one period of HFNC during admission. This study was determined to be exempt by the University of Wisconsin School of Medicine and Public Health’s Institutional Review Board.
Data Collection and Study Variables
The following variables were collected from VPS administrative data: patient gender, age, admission and discharge date and time, type and total hours of respiratory support, intensive care admission, and LOS (in hours). Additional demographic, clinical, and feeding exposure variables were abstracted manually from the electronic medical record (Epic, Verona, Wisconsin) using a structured data collection tool and stored in REDCap (Research Electronic Data Capture)15 including prematurity, race/ethnicity, insurance status, primary language, and passive tobacco smoke exposure. Clinical variables included duration of illness (days) at the time of admission, unit of HFNC initiation (emergency department, general care, intensive care, respiratory rate and oxygen saturation at HFNC initiation (<90%, 91%-92%, or >92%), acquisition of blood gas at HFNC admission, duration of time on HFNC (hours) and need for intubation or noninvasive ventilation prior to HFNC. The Pediatric Index of Mortality 2 Risk of Mortality (PIM 2 ROM)16 was used to estimate the severity of illness. The PIM2ROM uses clinical variables (systolic blood pressure, fixed pupils, measure of hypoxia using PaO2/FiO2 ratio, base excess, mechanical ventilation, elective admission, recovery from surgery, cardiac bypass, high-risk diagnosis, low-risk diagnosis) collected at the time of intensive care admission to generate a score that predicts the risk of mortality for an individual patient.17
Feeding exposures were documented in three-hour intervals from HFNC initiation to completion using a structured protocol. At each interval the following feeding information was abstracted from a review of nursing and physician documentation and relevant clinical flowsheets: presence or absence of feeding during the interval, route of feeding (oral, nasogastric [NG] or nasojejunal [NJ]). Feeding exposure was categorized a priori as fed at any point during HFNC (vs not fed at any point). Fed children were further characterized as (1) mixed feeding consisting of oral and tube feeds (NG or NJ) or (2) exclusive oral feeding throughout HFNC support (Appendix 1).
The primary outcome was the number of hours to discharge from HFNC cessation. Secondary outcomes were time to discharge from HFNC initiation, all-cause readmissions within seven days of discharge, and potential feeding-related adverse events. Potential adverse events included: (1) aspiration, defined as initiation of antibiotic AND either chest radiograph official interpreted as evidence for aspiration and/or documented concern for aspiration from the treating physician, or (2) intubation after feeding during HFNC.
Statistical Analysis
Descriptive statistics evaluated differences in demographics and clinical variables for feeding exposure groups. We used chi-squared tests for differences in proportions and t-tests or Wilcoxon Rank-Sum tests for differences in means or medians for continuous variables, respectively. Associations between feeding exposure during HFNC and time to discharge (measured in hours) after HFNC completion were modeled with Cox proportional hazards regression. Using this approach, hazard ratios (HR)>1 indicate a higher hazard (rate) of discharge for children with a feeding exposure than for children without the exposure. For example, a hazard ratio equal to two indicates that the exposed population is discharged at twice the rate per unit time as the nonexposed population. Death or censoring events did not occur. Feeding exposure was first modeled dichotomously as not fed or fed. To further explore associations between feeding modality and our outcome, we then modeled feeding exposure categorically as not fed (reference), mixed (oral and tube) feeding, or exclusive oral feeding throughout HFNC.
After constructing a set of unadjusted models, we then adjusted the models for variables having independent (bivariate P < .10) associations with time to discharge: age, unit of HFNC initiation, highest respiratory support required before HFNC, and HFNC duration. Finally, to attempt to account for residual confounding from latent constructs, we also created a set of propensity-weighted Cox proportional hazards models. Propensity weights18 reflecting the probability of being fed or never being fed during HFNC were created using logistic regression with predictors we hypothesized a priori that may have influenced the clinical decision to feed during HFNC: age, day of illness on admission, prematurity, PIM2 ROM score, respiratory rate, oxygen saturation and blood gas acquisition at HFNC initiation, and highest respiratory support required before HFNC. All analyses were conducted using STATA 14.0 (StataCorp, College Station, Texas), and adjusted hazard ratios (aHR) with 95% confidence intervals (95% CIs) were reported.
RESULTS
Patients (n = 123) had a mean age of 7.3 months (standard deviation [SD] 7.1) and presented on day of illness 4.8 (SD 2.3). Prior to HFNC, 10% required higher respiratory support (3% mechanical ventilation). Former preterm children were 12% of the overall sample.
During HFNC, 37% of patients were never fed, 41% were exclusively orally fed, and 23% had tube or mixed oral and tube feedings (Table 1 and Appendix 2). Children who were not fed were older, but groups were otherwise similar in terms of gender, race/ethnicity, passive smoke exposure, day of illness, unit of HFNC initiation, respiratory support required prior to HFNC, and respiratory rate at HFNC initiation.
Median time to discharge after HFNC completion was 31.4 hours (interquartile range [IQR] 23.9-52). Median (IQR) time to discharge was 29.5 (IQR 23.5-47.9) hours in children who were fed and 39.8 (26.4-61.5) hours in those who were not fed (unadjusted HR 1.25 [0.86-1.82], aHR 1.83 [95% CI: 1.16-2.88]). Time to discharge was shortest when children were fed exclusively orally (Figure). Compared with children who were not fed, time to discharge following HFNC completion was significantly shorter for those who were exclusively orally fed (aHR 2.13 [95% CI: 1.31-3.45]; Table 2). Results of the propensity-weighted model were similar: time to discharge after completing HFNC was shorter in fed versus not fed children (HR 2.17; 95 % CI: 1.34-3.50). The secondary outcome, time to discharge from HFNC initiation, had a similar relationship, ie, shorter time to discharge with exclusive oral feeding vs not feeding [aHR 1.95 (95% CI: 1.19-3.18)]. Time to discharge after initiation of HFNC was also shorter for fed versus not fed in propensity-weighted analysis (HR 1.97; 95% CI: 1.13-3.43).
DISCUSSION
This observational study found that being fed during HFNC was associated with shorter time to discharge after HFNC support was completed. Exclusive oral feeding was associated with the shortest time to discharge, and these results were consistent across a variety of analytical approaches. Adverse events were rare and occurred in both fed and unfed children.
These findings advance research on relationships between nutrition and bronchiolitis outcomes. Studies of general care patients with bronchiolitis without HFNC have observed associations between poor nutrition and prolonged LOS.19,20 Two previous studies of patients receiving HFNC therapy for bronchiolitis concluded that frequent interruption11 and later initiation of enteral nutrition10 during ICU stay was associated with longer time to discharge.11 To our knowledge, this is the first study of patients with bronchiolitis treated with HFNC in both general care and ICU settings that compared outcomes according to whether children were fed during HFNC therapy. Our results extend previous work demonstrating that delays in feeding may be associated with longer LOS.
Decisions to feed children with respiratory distress due to bronchiolitis are complex and often subjective. Readiness to feed may be based upon the assessment of a child’s work of breathing, trajectory of illness, institutional culture, and individual physician, nurse, respiratory therapist or speech-language pathologist comfort. In the absence of established feeding best practices,21 some institutions have developed guidelines based on local expert opinion; however, often these recommendations remain largely subjective and nonspecific.5,10,22-24 Although decisions to feed may be influenced by concern about a child’s clinical stability and feeding risk, we found few objective clinical differences between children fed (orally or by enteral tube) or not fed. Moreover, our results were consistent even when we used a propensity-weighted model to account for measured factors that may have been associated with the decision to initiate feeding. This suggests the decision to feed could be more arbitrary than we assume and is important to investigate in future research.
Additionally, although a few early studies have aimed to standardize the process of weaning HFNC support in bronchiolitis,25,26 this process is also largely subjective.10,22,23 As such, the weaning process may be influenced by perceptions of the child’s overall health. Orally fed children may be viewed as more comfortable or well and thus, more readily weaned, which ultimately influences the length of HFNC therapy. Our study design attempted to account for this potential bias by measuring time to discharge following HFNC therapy, rather than measuring total LOS. Meeting adequate calorie, weight, or hydration goals prior to discharge may take longer if feeds have been withheld. We speculate that prolonged periods of NPO might also risk transient oral aversion or feeding discoordination that could influence LOS. Previous research involving broad intensive care unit populations has established the importance of providing nutrition to critically ill children as soon as possible as a means of improving outcomes.27-29 Patients receiving HFNC support for bronchiolitis could plausibly experience similar benefits.
This single-center study with a relatively small sample size has important limitations to consider. The observational design limits our ability to draw conclusions about causal relationships between feeding, time to discharge, and adverse events. In particular, feeding exposure did not account for nuances in feeding timing, feeding density, and other elements of feeding exposure. Additionally, adverse events are rare, and this study is inadequately powered to detect differences between exposure groups. Although we included children cared for in general and intensive care units, our findings may not be generalizable to other hospitals with different placement criteria. Despite the creation of adjusted and propensity-weighted models, our results are still subject to possible residual indication bias. We cannot control for all possible confounders, particularly unmeasured factors which might simultaneously motivate decisions whether, when, and how to feed children receiving HFNC therapy and influence time to discharge after HFNC is finished. Although this study observed associations between feeding during HFNC and both our primary (time to discharge after HFNC was complete) and secondary (time to discharge after HFNC was initiated) outcomes, future work should evaluate how feeding strategies might impact total LOS, particularly as management becomes more standardized.
Prospective studies of feeding exposures during HFNC therapy in bronchiolitis, as well as rigorous interventional study designs, are needed to confirm shorter lengths of stay and safety with larger and more diverse samples. Future research should evaluate methods to safely and effectively feed children with severe bronchiolitis, which would inform standardized evidence-based approaches. Given the scale on which children with bronchiolitis are admitted each year, the implications of such work could be substantial.
CONCLUSION
Children fed while receiving HFNC for bronchiolitis may have shorter time to discharge than those who are not fed. Feeding-related adverse events were rare regardless of the feeding method. Controlled prospective studies addressing residual confounding are needed to justify a change in the current practice.
Acknowledgments
The authors would like to acknowledge the valuable feedback on earlier drafts from members of the University of Wisconsin Division of Pediatric Hospital Medicine CREATE writing group.
Bronchiolitis is the most common cause of nonbirth hospitalization in children in the United States less than one year of age.1 For children with severe bronchiolitis, high-flow nasal cannula (HFNC) is increasingly used2-4 to reduce work of breathing and prevent the need for further escalation of ventilatory support.5,6 Although previous studies suggest that enteral feeding is recommended in the management of patients hospitalized with bronchiolitis,7-9 limited evidence exists to guide feeding practices for patients receiving HFNC support.5,10,11
Respiratory support with HFNC has been associated with prolonged periods without enteral hydration/nutrition (ie, nil per os [NPO])12 primarily due to anticipation of further escalation of respiratory support or concern for increased risk of aspiration. The majority of patients with bronchiolitis managed with HFNC, however, do not require escalation of care.5,13 When feeding is attempted during HFNC support, it is frequently interrupted.5 Moreover, keeping all children NPO when receiving HFNC may be associated with weight loss and longer length of stay (LOS).12,14 Two small studies found that children admitted to the intensive care unit who received HFNC support for bronchiolitis did not have increased rates of emesis, worsening respiratory distress or aspiration pneumonia when enterally fed.10,11 However, no comparison of adverse events or LOS has been made between patients who were fed and those who were not fed during HFNC therapy, and previous studies have included only patients who have received HFNC in the intensive care setting.
Supporting safe feeding early in hospitalizations for bronchiolitis may facilitate expedited clinical improvement and discharge. As part of an ongoing bronchiolitis quality improvement initiative at our hospital, we sought to characterize feeding practices during HFNC therapy and assess whether feeding exposure was associated with (1) time to discharge after HFNC or (2) feeding-related adverse events. We hypothesized that feeding during HFNC therapy would be associated with a shorter time to discharge after HFNC cessation.
METHODS
Study Design, Setting, Participants
This was a retrospective cohort study of patients aged 1-24 months receiving HFNC support for respiratory failure due to bronchiolitis at an academic children’s hospital between January 1, 2015 and March 1, 2017. Our institution has had a clinical practice guideline, associated order set, and respiratory therapy protocol for general care patients with bronchiolitis since 2009. Patients with bronchiolitis who were weaning HFNC have been cared for in both the intensive and general care settings since 2013. A formal process for initiation of HFNC on general care units was instituted in January of 2017. During the study period, no patients with HFNC support for bronchiolitis had all their care entirely outside the intensive care unit at our institution. However, initiation and subsequent use of HFNC may have occurred in either the intensive care or general care setting. No specific guidance for feeding during HFNC existed during this period.
Patients were identified using the Virtual PICU Systems database, (VPS LLC, myvps.org, Los Angeles, California) and, by definition, all patients received at least some of their care in the intensive care unit. Patients with comorbid conditions of prematurity (<35 weeks) and those with cardiopulmonary, neuromuscular, and genetic diseases were included. Patients with preexisting dysphagia, defined as ongoing outpatient speech therapy for swallowing concerns, an admission diagnosis of aspiration pneumonia or on home respiratory support, were excluded. Children (n = 7) were excluded if they had more than one period of HFNC during admission. This study was determined to be exempt by the University of Wisconsin School of Medicine and Public Health’s Institutional Review Board.
Data Collection and Study Variables
The following variables were collected from VPS administrative data: patient gender, age, admission and discharge date and time, type and total hours of respiratory support, intensive care admission, and LOS (in hours). Additional demographic, clinical, and feeding exposure variables were abstracted manually from the electronic medical record (Epic, Verona, Wisconsin) using a structured data collection tool and stored in REDCap (Research Electronic Data Capture)15 including prematurity, race/ethnicity, insurance status, primary language, and passive tobacco smoke exposure. Clinical variables included duration of illness (days) at the time of admission, unit of HFNC initiation (emergency department, general care, intensive care, respiratory rate and oxygen saturation at HFNC initiation (<90%, 91%-92%, or >92%), acquisition of blood gas at HFNC admission, duration of time on HFNC (hours) and need for intubation or noninvasive ventilation prior to HFNC. The Pediatric Index of Mortality 2 Risk of Mortality (PIM 2 ROM)16 was used to estimate the severity of illness. The PIM2ROM uses clinical variables (systolic blood pressure, fixed pupils, measure of hypoxia using PaO2/FiO2 ratio, base excess, mechanical ventilation, elective admission, recovery from surgery, cardiac bypass, high-risk diagnosis, low-risk diagnosis) collected at the time of intensive care admission to generate a score that predicts the risk of mortality for an individual patient.17
Feeding exposures were documented in three-hour intervals from HFNC initiation to completion using a structured protocol. At each interval the following feeding information was abstracted from a review of nursing and physician documentation and relevant clinical flowsheets: presence or absence of feeding during the interval, route of feeding (oral, nasogastric [NG] or nasojejunal [NJ]). Feeding exposure was categorized a priori as fed at any point during HFNC (vs not fed at any point). Fed children were further characterized as (1) mixed feeding consisting of oral and tube feeds (NG or NJ) or (2) exclusive oral feeding throughout HFNC support (Appendix 1).
The primary outcome was the number of hours to discharge from HFNC cessation. Secondary outcomes were time to discharge from HFNC initiation, all-cause readmissions within seven days of discharge, and potential feeding-related adverse events. Potential adverse events included: (1) aspiration, defined as initiation of antibiotic AND either chest radiograph official interpreted as evidence for aspiration and/or documented concern for aspiration from the treating physician, or (2) intubation after feeding during HFNC.
Statistical Analysis
Descriptive statistics evaluated differences in demographics and clinical variables for feeding exposure groups. We used chi-squared tests for differences in proportions and t-tests or Wilcoxon Rank-Sum tests for differences in means or medians for continuous variables, respectively. Associations between feeding exposure during HFNC and time to discharge (measured in hours) after HFNC completion were modeled with Cox proportional hazards regression. Using this approach, hazard ratios (HR)>1 indicate a higher hazard (rate) of discharge for children with a feeding exposure than for children without the exposure. For example, a hazard ratio equal to two indicates that the exposed population is discharged at twice the rate per unit time as the nonexposed population. Death or censoring events did not occur. Feeding exposure was first modeled dichotomously as not fed or fed. To further explore associations between feeding modality and our outcome, we then modeled feeding exposure categorically as not fed (reference), mixed (oral and tube) feeding, or exclusive oral feeding throughout HFNC.
After constructing a set of unadjusted models, we then adjusted the models for variables having independent (bivariate P < .10) associations with time to discharge: age, unit of HFNC initiation, highest respiratory support required before HFNC, and HFNC duration. Finally, to attempt to account for residual confounding from latent constructs, we also created a set of propensity-weighted Cox proportional hazards models. Propensity weights18 reflecting the probability of being fed or never being fed during HFNC were created using logistic regression with predictors we hypothesized a priori that may have influenced the clinical decision to feed during HFNC: age, day of illness on admission, prematurity, PIM2 ROM score, respiratory rate, oxygen saturation and blood gas acquisition at HFNC initiation, and highest respiratory support required before HFNC. All analyses were conducted using STATA 14.0 (StataCorp, College Station, Texas), and adjusted hazard ratios (aHR) with 95% confidence intervals (95% CIs) were reported.
RESULTS
Patients (n = 123) had a mean age of 7.3 months (standard deviation [SD] 7.1) and presented on day of illness 4.8 (SD 2.3). Prior to HFNC, 10% required higher respiratory support (3% mechanical ventilation). Former preterm children were 12% of the overall sample.
During HFNC, 37% of patients were never fed, 41% were exclusively orally fed, and 23% had tube or mixed oral and tube feedings (Table 1 and Appendix 2). Children who were not fed were older, but groups were otherwise similar in terms of gender, race/ethnicity, passive smoke exposure, day of illness, unit of HFNC initiation, respiratory support required prior to HFNC, and respiratory rate at HFNC initiation.
Median time to discharge after HFNC completion was 31.4 hours (interquartile range [IQR] 23.9-52). Median (IQR) time to discharge was 29.5 (IQR 23.5-47.9) hours in children who were fed and 39.8 (26.4-61.5) hours in those who were not fed (unadjusted HR 1.25 [0.86-1.82], aHR 1.83 [95% CI: 1.16-2.88]). Time to discharge was shortest when children were fed exclusively orally (Figure). Compared with children who were not fed, time to discharge following HFNC completion was significantly shorter for those who were exclusively orally fed (aHR 2.13 [95% CI: 1.31-3.45]; Table 2). Results of the propensity-weighted model were similar: time to discharge after completing HFNC was shorter in fed versus not fed children (HR 2.17; 95 % CI: 1.34-3.50). The secondary outcome, time to discharge from HFNC initiation, had a similar relationship, ie, shorter time to discharge with exclusive oral feeding vs not feeding [aHR 1.95 (95% CI: 1.19-3.18)]. Time to discharge after initiation of HFNC was also shorter for fed versus not fed in propensity-weighted analysis (HR 1.97; 95% CI: 1.13-3.43).
DISCUSSION
This observational study found that being fed during HFNC was associated with shorter time to discharge after HFNC support was completed. Exclusive oral feeding was associated with the shortest time to discharge, and these results were consistent across a variety of analytical approaches. Adverse events were rare and occurred in both fed and unfed children.
These findings advance research on relationships between nutrition and bronchiolitis outcomes. Studies of general care patients with bronchiolitis without HFNC have observed associations between poor nutrition and prolonged LOS.19,20 Two previous studies of patients receiving HFNC therapy for bronchiolitis concluded that frequent interruption11 and later initiation of enteral nutrition10 during ICU stay was associated with longer time to discharge.11 To our knowledge, this is the first study of patients with bronchiolitis treated with HFNC in both general care and ICU settings that compared outcomes according to whether children were fed during HFNC therapy. Our results extend previous work demonstrating that delays in feeding may be associated with longer LOS.
Decisions to feed children with respiratory distress due to bronchiolitis are complex and often subjective. Readiness to feed may be based upon the assessment of a child’s work of breathing, trajectory of illness, institutional culture, and individual physician, nurse, respiratory therapist or speech-language pathologist comfort. In the absence of established feeding best practices,21 some institutions have developed guidelines based on local expert opinion; however, often these recommendations remain largely subjective and nonspecific.5,10,22-24 Although decisions to feed may be influenced by concern about a child’s clinical stability and feeding risk, we found few objective clinical differences between children fed (orally or by enteral tube) or not fed. Moreover, our results were consistent even when we used a propensity-weighted model to account for measured factors that may have been associated with the decision to initiate feeding. This suggests the decision to feed could be more arbitrary than we assume and is important to investigate in future research.
Additionally, although a few early studies have aimed to standardize the process of weaning HFNC support in bronchiolitis,25,26 this process is also largely subjective.10,22,23 As such, the weaning process may be influenced by perceptions of the child’s overall health. Orally fed children may be viewed as more comfortable or well and thus, more readily weaned, which ultimately influences the length of HFNC therapy. Our study design attempted to account for this potential bias by measuring time to discharge following HFNC therapy, rather than measuring total LOS. Meeting adequate calorie, weight, or hydration goals prior to discharge may take longer if feeds have been withheld. We speculate that prolonged periods of NPO might also risk transient oral aversion or feeding discoordination that could influence LOS. Previous research involving broad intensive care unit populations has established the importance of providing nutrition to critically ill children as soon as possible as a means of improving outcomes.27-29 Patients receiving HFNC support for bronchiolitis could plausibly experience similar benefits.
This single-center study with a relatively small sample size has important limitations to consider. The observational design limits our ability to draw conclusions about causal relationships between feeding, time to discharge, and adverse events. In particular, feeding exposure did not account for nuances in feeding timing, feeding density, and other elements of feeding exposure. Additionally, adverse events are rare, and this study is inadequately powered to detect differences between exposure groups. Although we included children cared for in general and intensive care units, our findings may not be generalizable to other hospitals with different placement criteria. Despite the creation of adjusted and propensity-weighted models, our results are still subject to possible residual indication bias. We cannot control for all possible confounders, particularly unmeasured factors which might simultaneously motivate decisions whether, when, and how to feed children receiving HFNC therapy and influence time to discharge after HFNC is finished. Although this study observed associations between feeding during HFNC and both our primary (time to discharge after HFNC was complete) and secondary (time to discharge after HFNC was initiated) outcomes, future work should evaluate how feeding strategies might impact total LOS, particularly as management becomes more standardized.
Prospective studies of feeding exposures during HFNC therapy in bronchiolitis, as well as rigorous interventional study designs, are needed to confirm shorter lengths of stay and safety with larger and more diverse samples. Future research should evaluate methods to safely and effectively feed children with severe bronchiolitis, which would inform standardized evidence-based approaches. Given the scale on which children with bronchiolitis are admitted each year, the implications of such work could be substantial.
CONCLUSION
Children fed while receiving HFNC for bronchiolitis may have shorter time to discharge than those who are not fed. Feeding-related adverse events were rare regardless of the feeding method. Controlled prospective studies addressing residual confounding are needed to justify a change in the current practice.
Acknowledgments
The authors would like to acknowledge the valuable feedback on earlier drafts from members of the University of Wisconsin Division of Pediatric Hospital Medicine CREATE writing group.
1. HCUPnet. http s://hcupnet.ahrq.gov/. Accessed February 7, 2019.
2. Beggs S, Wong ZH, Kaul S, Ogden KJ, Walters JA. High-flow nasal cannula therapy for infants with bronchiolitis. Cochrane Database Syst Rev. 2014;1(1):CD009609. https://doi.org/10.1002/14651858.CD009609.pub2.
3. Mayfield S, Bogossian F, O’Malley L, Schibler A. High-flow nasal cannula oxygen therapy for infants with bronchiolitis: pilot study. J Paediatr Child Health. 2014;50(5):373-378. https://doi.org/10.1111/jpc.12509.
4. Hilliard TN, Archer N, Laura H, et al. Pilot study of vapotherm oxygen delivery in moderately severe bronchiolitis. Arch Dis Child. 2012;97(2):182-183. https://doi.org/10.1136/archdischild-2011-301151.
5. Franklin D, Babl FE, Schlapbach LJ, et al. A randomized trial of high-flow oxygen therapy in infants with bronchiolitis. N Engl J Med. 2018;378(12):1121-1131. https://doi.org/10.1056/NEJMoa1714855.
6. McKiernan C, Chua LC, Visintainer PF, Allen H. High flow nasal cannulae therapy in infants with bronchiolitis. J Pediatr. 2010;156(4):634-638. https://doi.org/10.1016/j.jpeds.2009.10.039.
7. Maffey A, Moviglia T, Mirabello C, et al. Swallowing and respiratory distress in hospitalized patients with bronchiolitis. Dysphagia. 2013;28(4):582-587. https://doi.org/10.1007/s00455-013-9470-0.
8. Kugelman A, Raibin K, Dabbah H, et al. Intravenous fluids versus gastric-tube feeding in hospitalized infants with viral bronchiolitis: a randomized, prospective pilot study. J Pediatr. 2013;162(3):640-642.e641. https://doi.org/10.1016/j.jpeds.2012.10.057.
9. Oakley E, Borland M, Neutze J, et al. Nasogastric hydration versus intravenous hydration for infants with bronchiolitis: a randomised trial. Lancet Respir Med. 2013;1(2):113-120. https://doi.org/10.1016/S2213-2600(12)70053-X.
10. Slain KN, Martinez-Schlurmann N, Shein SL, Stormorken A. Nutrition and high-flow nasal cannula respiratory support in children with bronchiolitis. Hosp Pediatr. 2017;7(5):256-262. https://doi.org/10.1542/hpeds.2016-0194.
11. Sochet AA, McGee JA, October TW. Oral nutrition in children with bronchiolitis on high-flow nasal cannula is well tolerated. Hosp Pediatr. 2017;7(5):249-255. https://doi.org/10.1542/hpeds.2016-0131.
12. Canarie MF, Barry S, Carroll CL, et al. Risk factors for delayed enteral nutrition in critically ill children. Pediatr Crit Care Med. 2015;16(8):e283-e289. https://doi.org/10.1097/PCC.0000000000000527.
13. Schibler A, Pham TM, Dunster KR, et al. Reduced intubation rates for infants after introduction of high-flow nasal prong oxygen delivery. Intensive Care Med. 2011;37(5):847-852. https://doi.org/10.1007/s00134-011-2177-5.
14. Hamilton S, McAleer DM, Ariagno K, et al. A stepwise enteral nutrition algorithm for critically ill children helps achieve nutrient delivery goals*. Pediatr Crit Care Med. 2014;15(7):583-589. https://doi.org/10.1097/PCC.0000000000000179.
15. Harris PA, Taylor R, Thielke R, et al. Research electronic data capture (REDCap)--a metadata-driven methodology and workflow process for providing translational research informatics support. J Biomed Inform. 2009;42(2):377-381. https://doi.org/10.1016/j.jbi.2008.08.010.
16. Slater A, Shann F, Group APS. The suitability of the Pediatric Index of Mortality (PIM), PIM2, the Pediatric Risk of Mortality (PRISM), and PRISM III for monitoring the quality of pediatric intensive care in Australia and New Zealand. Pediatr Crit Care Med. 2004;5(5):447-454. https://doi.org/10.1097/01.PCC.0000138557.31831.65.
17. Slater A, Shann F, Pearson G, Paediatric Index of Mortality Study G. PIM2: a revised version of the Paediatric Index of Mortality. Intensive Care Med. 2003;29(2):278-285. https://doi.org/10.1007/s00134-002-1601-2.
18. Lanza ST, Moore JE, Butera NM. Drawing causal inferences using propensity scores: a practical guide for community psychologists. Am J Commun Psychol. 2013;52(3-4):380-392. https://doi.org/10.1007/s10464-013-9604-4.
19. Weisgerber MC, Lye PS, Li SH, et al. Factors predicting prolonged hospital stay for infants with bronchiolitis. J Hosp Med. 2011;6(5):264-270. https://doi.org/10.1002/jhm.903.
20. Halvorson EE, Chandler N, Neiberg R, Ervin SE. Association of NPO status and type of nutritional support on weight and length of stay in infants hospitalized with bronchiolitis. Hosp Pediatr. 2013;3(4):366-370. https://doi.org/10.1542/hpeds.2013-0011.
21. Ralston SL, Lieberthal AS, Meissner HC, et al. Clinical practice guideline: the diagnosis, management, and prevention of bronchiolitis. Pediatrics. 2014;134(5):e1474-e1502. https://doi.org/10.1542/peds.2014-2742.
22. Seattle Children’s Hospital ZS, Beardsley E, Crotwell D, et al. Bronchiolitis Pathway. http:// www.seattlechildrens.org/pdf/bronchiolitis-pathway.pdf. Accessed January 29, 2019.
23. Children’s Hospital of Philidelphia DM, Zorc J, Kreindler, J, et al. Inpatient Pathway for Treatment of the Child with Bronchiolitis. https://www.chop.edu/clinical-pathway/bronchiolitis-inpatient-treatment-clinical-pathway. Accessed January 29, 2019.
24. Children’s Hospital Colorado TA, Topoz I, Freeman J, et al. Pediatric Viral Bronchiolitis. https://www.childrenscolorado.org/globalassets/healthcare-professionals/clinical-pathways/bronchiolitis.pdf. Accessed January 29, 2019.
25. Betters KA, Hebbar KB, McCracken C, et al. A novel weaning protocol for high-flow nasal cannula in the PICU. Pediatr Crit Care Med. 2017;18(7):e274-e280. https://doi.org/10.1097/PCC.0000000000001181.
26. Kepreotes E, Whitehead B, Attia J, et al. High-flow warm humidified oxygen versus standard low-flow nasal cannula oxygen for moderate bronchiolitis (HFWHO RCT): an open, phase 4, randomised controlled trial. Lancet. 2017;389(10072):930-939. https://doi.org/10.1016/S0140-6736(17)30061-2.
1. HCUPnet. http s://hcupnet.ahrq.gov/. Accessed February 7, 2019.
2. Beggs S, Wong ZH, Kaul S, Ogden KJ, Walters JA. High-flow nasal cannula therapy for infants with bronchiolitis. Cochrane Database Syst Rev. 2014;1(1):CD009609. https://doi.org/10.1002/14651858.CD009609.pub2.
3. Mayfield S, Bogossian F, O’Malley L, Schibler A. High-flow nasal cannula oxygen therapy for infants with bronchiolitis: pilot study. J Paediatr Child Health. 2014;50(5):373-378. https://doi.org/10.1111/jpc.12509.
4. Hilliard TN, Archer N, Laura H, et al. Pilot study of vapotherm oxygen delivery in moderately severe bronchiolitis. Arch Dis Child. 2012;97(2):182-183. https://doi.org/10.1136/archdischild-2011-301151.
5. Franklin D, Babl FE, Schlapbach LJ, et al. A randomized trial of high-flow oxygen therapy in infants with bronchiolitis. N Engl J Med. 2018;378(12):1121-1131. https://doi.org/10.1056/NEJMoa1714855.
6. McKiernan C, Chua LC, Visintainer PF, Allen H. High flow nasal cannulae therapy in infants with bronchiolitis. J Pediatr. 2010;156(4):634-638. https://doi.org/10.1016/j.jpeds.2009.10.039.
7. Maffey A, Moviglia T, Mirabello C, et al. Swallowing and respiratory distress in hospitalized patients with bronchiolitis. Dysphagia. 2013;28(4):582-587. https://doi.org/10.1007/s00455-013-9470-0.
8. Kugelman A, Raibin K, Dabbah H, et al. Intravenous fluids versus gastric-tube feeding in hospitalized infants with viral bronchiolitis: a randomized, prospective pilot study. J Pediatr. 2013;162(3):640-642.e641. https://doi.org/10.1016/j.jpeds.2012.10.057.
9. Oakley E, Borland M, Neutze J, et al. Nasogastric hydration versus intravenous hydration for infants with bronchiolitis: a randomised trial. Lancet Respir Med. 2013;1(2):113-120. https://doi.org/10.1016/S2213-2600(12)70053-X.
10. Slain KN, Martinez-Schlurmann N, Shein SL, Stormorken A. Nutrition and high-flow nasal cannula respiratory support in children with bronchiolitis. Hosp Pediatr. 2017;7(5):256-262. https://doi.org/10.1542/hpeds.2016-0194.
11. Sochet AA, McGee JA, October TW. Oral nutrition in children with bronchiolitis on high-flow nasal cannula is well tolerated. Hosp Pediatr. 2017;7(5):249-255. https://doi.org/10.1542/hpeds.2016-0131.
12. Canarie MF, Barry S, Carroll CL, et al. Risk factors for delayed enteral nutrition in critically ill children. Pediatr Crit Care Med. 2015;16(8):e283-e289. https://doi.org/10.1097/PCC.0000000000000527.
13. Schibler A, Pham TM, Dunster KR, et al. Reduced intubation rates for infants after introduction of high-flow nasal prong oxygen delivery. Intensive Care Med. 2011;37(5):847-852. https://doi.org/10.1007/s00134-011-2177-5.
14. Hamilton S, McAleer DM, Ariagno K, et al. A stepwise enteral nutrition algorithm for critically ill children helps achieve nutrient delivery goals*. Pediatr Crit Care Med. 2014;15(7):583-589. https://doi.org/10.1097/PCC.0000000000000179.
15. Harris PA, Taylor R, Thielke R, et al. Research electronic data capture (REDCap)--a metadata-driven methodology and workflow process for providing translational research informatics support. J Biomed Inform. 2009;42(2):377-381. https://doi.org/10.1016/j.jbi.2008.08.010.
16. Slater A, Shann F, Group APS. The suitability of the Pediatric Index of Mortality (PIM), PIM2, the Pediatric Risk of Mortality (PRISM), and PRISM III for monitoring the quality of pediatric intensive care in Australia and New Zealand. Pediatr Crit Care Med. 2004;5(5):447-454. https://doi.org/10.1097/01.PCC.0000138557.31831.65.
17. Slater A, Shann F, Pearson G, Paediatric Index of Mortality Study G. PIM2: a revised version of the Paediatric Index of Mortality. Intensive Care Med. 2003;29(2):278-285. https://doi.org/10.1007/s00134-002-1601-2.
18. Lanza ST, Moore JE, Butera NM. Drawing causal inferences using propensity scores: a practical guide for community psychologists. Am J Commun Psychol. 2013;52(3-4):380-392. https://doi.org/10.1007/s10464-013-9604-4.
19. Weisgerber MC, Lye PS, Li SH, et al. Factors predicting prolonged hospital stay for infants with bronchiolitis. J Hosp Med. 2011;6(5):264-270. https://doi.org/10.1002/jhm.903.
20. Halvorson EE, Chandler N, Neiberg R, Ervin SE. Association of NPO status and type of nutritional support on weight and length of stay in infants hospitalized with bronchiolitis. Hosp Pediatr. 2013;3(4):366-370. https://doi.org/10.1542/hpeds.2013-0011.
21. Ralston SL, Lieberthal AS, Meissner HC, et al. Clinical practice guideline: the diagnosis, management, and prevention of bronchiolitis. Pediatrics. 2014;134(5):e1474-e1502. https://doi.org/10.1542/peds.2014-2742.
22. Seattle Children’s Hospital ZS, Beardsley E, Crotwell D, et al. Bronchiolitis Pathway. http:// www.seattlechildrens.org/pdf/bronchiolitis-pathway.pdf. Accessed January 29, 2019.
23. Children’s Hospital of Philidelphia DM, Zorc J, Kreindler, J, et al. Inpatient Pathway for Treatment of the Child with Bronchiolitis. https://www.chop.edu/clinical-pathway/bronchiolitis-inpatient-treatment-clinical-pathway. Accessed January 29, 2019.
24. Children’s Hospital Colorado TA, Topoz I, Freeman J, et al. Pediatric Viral Bronchiolitis. https://www.childrenscolorado.org/globalassets/healthcare-professionals/clinical-pathways/bronchiolitis.pdf. Accessed January 29, 2019.
25. Betters KA, Hebbar KB, McCracken C, et al. A novel weaning protocol for high-flow nasal cannula in the PICU. Pediatr Crit Care Med. 2017;18(7):e274-e280. https://doi.org/10.1097/PCC.0000000000001181.
26. Kepreotes E, Whitehead B, Attia J, et al. High-flow warm humidified oxygen versus standard low-flow nasal cannula oxygen for moderate bronchiolitis (HFWHO RCT): an open, phase 4, randomised controlled trial. Lancet. 2017;389(10072):930-939. https://doi.org/10.1016/S0140-6736(17)30061-2.
© 2019 Society of Hospital Medicine
Does Scheduling a Postdischarge Visit with a Primary Care Physician Increase Rates of Follow-up and Decrease Readmissions?
Under the Hospital Readmission Reduction Program (HRRP), hospitals with higher than expected readmissions for select conditions receive a financial penalty. In 2017, hospitals were penalized a total of $528 million.1,2 In an effort to deter readmissions, hospitals have focused on the transition from inpatient to outpatient care with particular emphasis on timely follow-up with a primary care physician (PCP).3-7 Medicare has also introduced transitional care codes, which reimburse physicians for follow-up care after a hospitalization.
METHODS
Postdischarge Appointment Service
In the fall of 2009, Beth Israel Deaconess introduced a postdischarge appointment intervention to facilitate follow-up with PCPs and specialty physicians after discharge from the hospital. Within the provider order entry system, attending and resident physicians enter a discharge appointment request for specified providers within and outside of the medical center and a specified time period. For example, a physician may enter a request to schedule a PCP appointment within 2-3, 4-8, 9-15, 16-30, or >30 days of discharge.
Study Population
We conducted a retrospective, cohort study at Beth Israel Deaconess Medical Center, a tertiary care hospital, using data derived from electronic health records for all hospitalizations
Outcomes
The primary outcomes of this study were kept PCP follow-up visits within seven days and readmission within 30 days of discharge. We focused on PCP visits within seven days, as this has been the measure used in prior research,5,7 but conducted a sensitivity analysis of PCP follow-up within 14 days. No-shows for the scheduled follow-up PCP appointments were not included. We focused on readmissions within 30 days of discharge, given this is the measure used in the HRRP,16 but conducted a sensitivity analysis of 14 days. Secondary outcomes included ED revisit within the 30 days. Given the data available, we only observed physician visits and hospitalizations that occurred within the Beth Israel Deaconess system.
Analyses
We conducted two analyses to assess whether the implementation of the postdischarge appointment service was associated with an increase in PCP follow-up and a decrease in the readmission rate.
In the first analysis, we focused only on hospitalizations from the medical and cardiology services during the postintervention period between January 2011 and September 2015 (n = 17,582). We compared the PCP follow-up rate and the readmission rate among hospitalizations where the postdischarge appointment service was used versus those where it was not used. We used a multivariable logistic regression, and the covariates included in the model were age, gender, hospital length of stay, and diagnosis-related group (DRG) cost weight. The DRG cost weight captures the average resources used to treat Medicare patients’ hospitalizations within a given DRG category and was used as a surrogate marker for the complexity of hospitalization.17 Instead of presenting odds ratios, we used predictive margins to generate adjusted percentage point estimates of the differences in our outcomes associated with the use of the postdischarge appointment service.18
This instrumental variable exploits the fact that the postdischarge appointment service was only available on weekdays and that physicians are asked to only submit the order for follow-up appointments on the day of discharge. We focused on the day of the week of admission (versus discharge) because of concerns that patients with more complicated hospital courses might be kept in the hospital over the weekend (eg, to facilitate testing available only on weekdays or to consult with regular physicians only available on weekdays). This would create a relationship between the day of discharge and the outcomes (follow-up visits, readmissions). The day of admission is less likely to be impacted by this bias. Given concerns that admissions on different days of the week might be different, our instrument is the day of the week interacted with the time period. Therefore, to create bias, there must be a systematic change in the nature of admissions on a given day of the week during this time period. We provide more details on this analysis, testing of the instrument, and results in the Appendix.
Analyses were conducted in Stata, version 14.2 (StataCorp LP, College Station, Texas). Statistical testing was two-sided, with a significance level of 0.05, and the project was judged exempt by the Committee on Clinical Investigations for Beth Israel Deaconess Medical Center.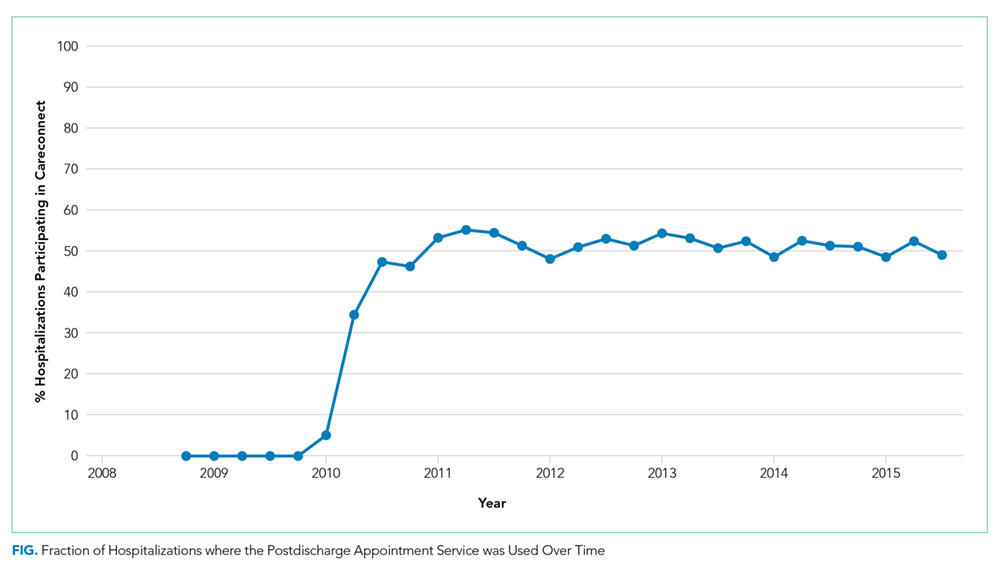
RESULTS
Overall, there were 17,582 hospitalizations on the medicine and cardiology services following implementation of the postdischarge appointment service. The use of the postdischarge appointment service rose rapidly after it was introduced (Figure) and then plateaued at roughly 50%. 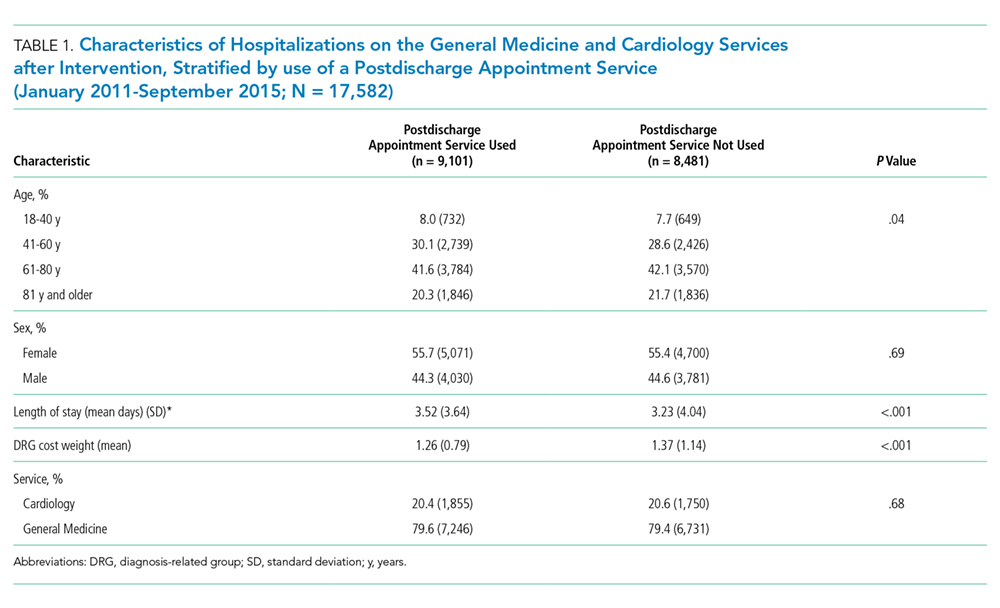
Multivariable Logistic Regression
In this analysis, we focused on the 17,582 hospitalizations from January 2011 to September 2015 on the general medicine and cardiology services that occurred after the postdischarge appointment service was introduced. Among these hospitalizations, the postdischarge appointment service was used in 51.8% of discharges.
In an unadjusted analysis, patients discharged using the tool had higher rates of seven-day PCP follow-up (60.2% vs 29.2%, P < .001) and lower 30-day readmission rates (14.7% vs 16.7%; P < .001) than those who were not (Table 2). There was no significant difference in 30-day ED revisit between hospitalizations with and without use of the postdischarge appointment service (22.3% vs 23.1%; P = .23).
This was echoed in our multivariable analysis where, controlling for other patient factors, use of the postdischarge appointment service was associated with an increased rate of follow-up with a PCP in seven days (+31.9 percentage points; 95% CI: 30.2, 33.6; P < .01) and a decreased likelihood of readmission within 30 days (−3.8 percentage points; 95% CI: −5.2, −2.4; P < .01) (Table 2).
Instrumental Variable Analysis
In our instrumental variable analysis, we used all hospitalizations both before and after the introduction of the intervention. In this analysis, we estimate that use of the postdischarge appointment service increases the probability of visiting a PCP within seven days by 33.4 percentage points (95% CI: 7.9%, 58.9%; P = .01) (Table 3). The use of the postdischarge appointment was associated with a 2.5 percentage point (95% CI: −22.0%, 17.1%; P = .80) reduction in readmissions and a 4.8 percentage point (95% CI; −27.5%, 17.9%; P = .68) reduction in an ED visit within 30 days (Table 3). Neither of these differences were statistically significant with wide confidence intervals.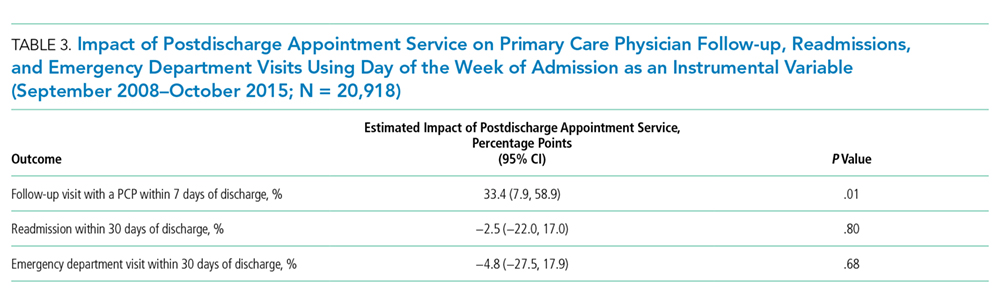
In sensitivity analyses, we obtained similar results when we considered PCP visits and readmissions within 14 days.
DISCUSSION
The hospital introduced the postdischarge appointment service to facilitate postdischarge appointments and to deter readmissions. In our analyses the use of the postdischarge appointment service was associated with a substantial 30 percentage point increase in the likelihood of a PCP follow-up visit within seven days after hospital discharge. There was a roughly 2% reduction in 30-day readmissions, but this difference was not consistently statistically significant across our analyses. Together, our evaluation implies that this type of intervention may make it much easier for patients to attend a PCP appointment, but scheduling an appointment alone may have a modest impact on deterring a readmission.
Our findings are inconsistent with prior studies that described a strong association between early PCP follow-up and readmissions. However, our results were consistent with research where follow-up visits were not clearly protective against readmissions.20 One potential explanation of the discrepant findings is that there are unmeasured socioeconomic differences between patients who have a PCP follow-up appointment and those who do not.
Regardless of the impact on readmissions, it is important to acknowledge that early PCP follow-up offers many potential benefits. Continuing to evaluate and treat new diagnoses, adjusting and reconciling medications, reconnecting with outpatient providers, capturing new incidental findings, and ensuring stability through regular follow-up are just a few of the potential benefits. We believe the dramatic increase observed in PCP follow-up reflects the administrative complexity required for a patient to call their PCP’s office and to schedule a follow-up appointment soon after they are discharged from the hospital.
Our study has many limitations. The study was limited to a single academic center, and the intervention was limited to patients cared for by the general medicine and cardiology services.
In summary, we found that the introduction of a postdischarge appointment service resulted in substantially increased rates of early PCP follow-up but less clear benefits in preventing readmissions.
1. Boccutti C, Casillas G. Aiming for Fewer Hospital U-turns: The Medicare Hospital Readmission Reduction Program; March 10, 2017. https://www.kff.org/medicare/issue-brief/aiming-for-fewer-hospital-u-turns-the-medicare-hospital-readmission-reduction-program. Accessed July 22, 2019
2. Centers for Medicare and Medicaid Services. FY 2017 IPPS Final Rule: Hospital Readmissions Reduction Program Su pplemental Data File. https://www.cms.gov/Medicare/Medicare-Fee-for-Service-Payment/AcuteInpatientPPS/Archived-Supplemental-Data-Files.html. Accessed June 22, 2019
3. Sharma G, Kuo YF, Freeman JL, Zhang DD, Goodwin JS. Outpatient follow-up visit and 30-day emergency department visit and readmission in patients hospitalized for chronic obstructive pulmonary disease. Arch Intern Med. 2010;170(18):1664-1670. https://doi.org/10.1001/archinternmed.2010.345.
4. Rennke S, Nguyen OK, Shoeb MH, et al. Hospital-initiated transitional care interventions as a patient safety strategy: a systematic review. Ann Intern Med. 2013;158(5 Pt 2):433-440. https://doi.org/10.7326/0003-4819-158-5-201303051-00011.
5. Misky GJ, Wald HL, Coleman EA. Post hospitalization transitions: examining the effects of timing of primary care provider follow-up. J Hosp Med. 2010;5(7):392-397. https://doi.org/10.1002/jhm.666.
6. Hesselink G, Schoonhoven L, Barach P, et al. Improving patient handovers from hospital to primary care: a systematic review. Ann Intern Med. 2012;157(6):417-428. https://doi.org/10.7326/0003-4819-157-6-201209180-00006.
7. Hernandez AF, Greiner MA, Fonarow GC, et al. Relationship between early physician follow-up and 30-day readmission among Medicare beneficiaries hospitalized for heart failure. JAMA. 2010;303(17):1716-1722. https://doi.org/10.1001/jama.2010.533.
8. Muus KJ, Knudson A, Klug MG, et al. Effect of post discharge follow-up care on re-admissions among US veterans with congestive heart failure: a rural-urban comparison. Rural Remote Health. 2010;10(2):1447.
9. Brooke BS, Stone DH, Cronenwett JL, et al. Early primary care provider follow-up and readmission after high-risk surgery. JAMA Surg. 2014;149(8):821-828. https://doi.org/10.1001/jamasurg.2014.157.
10. Leschke J, Panepinto JA, Nimmer M, et al. Outpatient follow-up and rehospitalizations for sickle cell disease patients. Pediatr Blood Cancer. 2012;58(3):406-409. https://doi.org/10.1002/pbc.23140.
11. Field TS, Ogarek J, Garber L, Reed G, Gurwitz JH. Association of early post discharge follow-up by a primary care physician and 30-day rehospitalization among older adults. J Gen Intern Med. 2015;30(5):565-571. https://doi.org/10.1007/s11606-014-3106-4.
12. Kashiwagi DT, Burton MC, Kirkland LL, Cha S, Varkey P. Do timely outpatient follow-up visits decrease hospital readmission rates? Am J Med Qual. 2012;27(1):11-15. https://doi.org/10.1177/1062860611409197.
13. Hansen LO, Young RS, Hinami K, Leung A, Williams MV. Interventions to reduce 30-day rehospitalization: a systematic review. Ann Intern Med. 2011;155(8):520-528. https://doi.org/10.7326/0003-4819-155-8-201110180-00008.
14. Ryan J, Kang S, Dolacky S, Ingrassia J, Ganeshan R. Change in readmissions and follow-up visits as part of a heart failure readmission quality improvement initiative. Am J Med. 2013;126(11):989–994.e1. https://doi.org/10.1016/j.amjmed.2013.06.027.
15. Coleman EA, Parry C, Chalmers S, Min SJ. The care transitions intervention: results of a randomized controlled trial. Arch Intern Med. 2006;166(17):1822-1828. https://doi.org/10.1001/archinte.166.17.1822.
16. Thomas JW. Should episode-based economic profiles be risk adjusted to account for differences in patients’ health risks? Health Serv Res. 2006;41(2):581-598. https://doi.org/10.1111/j.1475-6773.2005.00499.x.
17. Mendez CM, Harrington DW, Christenson P, Spellberg B. Impact of hospital variables on case mix index as a marker of disease severity. Popul Health Manag. 2014;17(1):28-34. https://doi.org/10.1089/pop.2013.0002.
18. Muller CJ, MacLehose RF. Estimating predicted probabilities from logistic regression: different methods correspond to different target populations. Int J Epidemiol. 2014;43(3):962-970. https://doi.org/10.1093/ije/dyu029.
19. Angrist JD, Krueger AB. Instrumental variables and the search for identification: From supply and demand to natural experiments. J Econ Perspect. 2001;15(4):69-85. https://doi.org/10.1257/jep.15.4.69.
20. Dimick JB, Ryan AM. Methods for evaluating changes in health care policy: the difference-in-differences approach. JAMA. 2014;312(22):2401-2402. https://doi.org/10.1001/jama.2014.16153.
21. Peikes D, Chen A, Schore J, Brown R. Effects of care coordination on hospitalization, quality of care, and health care expenditures among Medicare beneficiaries: 15 randomized trials. JAMA. 2009;301(6):603-618. https://doi.org/10.1001/jama.2009.126.
22. Jack BW, Chetty VK, Anthony D, et al. A reengineered hospital discharge program to decrease rehospitalization: a randomized trial. Ann Intern Med. 2009;150(3):178-187. https://doi.org/10.7326/0003-4819-150-3-200902030-00007.
23. Naylor MD, Brooten DA, Campbell RL, et al. Transitional care of older adults hospitalized with heart failure: a randomized, controlled trial. J Am Geriatr Soc. 2004;52(5):675-684. https://doi.org/10.1111/j.1532-5415.2004.52202.x.
24. Leppin AL, Gionfriddo MR, Kessler M, et al. Preventing 30-day hospital readmissions: a systematic review and meta-analysis of randomized trials. JAMA Intern Med. 2014;174(7):1095-1107. https://doi.org/10.1001/jamainternmed.2014.1608.
25. Kripalani S, LeFevre F, Phillips CO, et al. Deficits in communication and information transfer between hospital-based and primary care physicians: implications for patient safety and continuity of care. JAMA. 2007;297(8):831-841. https://doi.org/10.1001/jama.297.8.831.
26. van Walraven C, Seth R, Austin PC, Laupacis A. Effect of discharge summary availability during post discharge visits on hospital readmission. J Gen Intern Med. 2002;17(3):186-192. https://doi.org/10.1046/j.1525-1497.2002.10741.x.
27. Hoyer EH, Brotman DJ, Apfel A, et al. Improving outcomes after hospitalization: A prospective observational multicenter evaluation of care coordination strategies for reducing 30-day readmissions to Maryland Hospitals. J Gen Intern Med. 2018;33(5):621-627. https://doi.org/10.1007/s11606-017-4218-4.
Under the Hospital Readmission Reduction Program (HRRP), hospitals with higher than expected readmissions for select conditions receive a financial penalty. In 2017, hospitals were penalized a total of $528 million.1,2 In an effort to deter readmissions, hospitals have focused on the transition from inpatient to outpatient care with particular emphasis on timely follow-up with a primary care physician (PCP).3-7 Medicare has also introduced transitional care codes, which reimburse physicians for follow-up care after a hospitalization.
METHODS
Postdischarge Appointment Service
In the fall of 2009, Beth Israel Deaconess introduced a postdischarge appointment intervention to facilitate follow-up with PCPs and specialty physicians after discharge from the hospital. Within the provider order entry system, attending and resident physicians enter a discharge appointment request for specified providers within and outside of the medical center and a specified time period. For example, a physician may enter a request to schedule a PCP appointment within 2-3, 4-8, 9-15, 16-30, or >30 days of discharge.
Study Population
We conducted a retrospective, cohort study at Beth Israel Deaconess Medical Center, a tertiary care hospital, using data derived from electronic health records for all hospitalizations
Outcomes
The primary outcomes of this study were kept PCP follow-up visits within seven days and readmission within 30 days of discharge. We focused on PCP visits within seven days, as this has been the measure used in prior research,5,7 but conducted a sensitivity analysis of PCP follow-up within 14 days. No-shows for the scheduled follow-up PCP appointments were not included. We focused on readmissions within 30 days of discharge, given this is the measure used in the HRRP,16 but conducted a sensitivity analysis of 14 days. Secondary outcomes included ED revisit within the 30 days. Given the data available, we only observed physician visits and hospitalizations that occurred within the Beth Israel Deaconess system.
Analyses
We conducted two analyses to assess whether the implementation of the postdischarge appointment service was associated with an increase in PCP follow-up and a decrease in the readmission rate.
In the first analysis, we focused only on hospitalizations from the medical and cardiology services during the postintervention period between January 2011 and September 2015 (n = 17,582). We compared the PCP follow-up rate and the readmission rate among hospitalizations where the postdischarge appointment service was used versus those where it was not used. We used a multivariable logistic regression, and the covariates included in the model were age, gender, hospital length of stay, and diagnosis-related group (DRG) cost weight. The DRG cost weight captures the average resources used to treat Medicare patients’ hospitalizations within a given DRG category and was used as a surrogate marker for the complexity of hospitalization.17 Instead of presenting odds ratios, we used predictive margins to generate adjusted percentage point estimates of the differences in our outcomes associated with the use of the postdischarge appointment service.18
This instrumental variable exploits the fact that the postdischarge appointment service was only available on weekdays and that physicians are asked to only submit the order for follow-up appointments on the day of discharge. We focused on the day of the week of admission (versus discharge) because of concerns that patients with more complicated hospital courses might be kept in the hospital over the weekend (eg, to facilitate testing available only on weekdays or to consult with regular physicians only available on weekdays). This would create a relationship between the day of discharge and the outcomes (follow-up visits, readmissions). The day of admission is less likely to be impacted by this bias. Given concerns that admissions on different days of the week might be different, our instrument is the day of the week interacted with the time period. Therefore, to create bias, there must be a systematic change in the nature of admissions on a given day of the week during this time period. We provide more details on this analysis, testing of the instrument, and results in the Appendix.
Analyses were conducted in Stata, version 14.2 (StataCorp LP, College Station, Texas). Statistical testing was two-sided, with a significance level of 0.05, and the project was judged exempt by the Committee on Clinical Investigations for Beth Israel Deaconess Medical Center.
RESULTS
Overall, there were 17,582 hospitalizations on the medicine and cardiology services following implementation of the postdischarge appointment service. The use of the postdischarge appointment service rose rapidly after it was introduced (Figure) and then plateaued at roughly 50%.
Multivariable Logistic Regression
In this analysis, we focused on the 17,582 hospitalizations from January 2011 to September 2015 on the general medicine and cardiology services that occurred after the postdischarge appointment service was introduced. Among these hospitalizations, the postdischarge appointment service was used in 51.8% of discharges.
In an unadjusted analysis, patients discharged using the tool had higher rates of seven-day PCP follow-up (60.2% vs 29.2%, P < .001) and lower 30-day readmission rates (14.7% vs 16.7%; P < .001) than those who were not (Table 2). There was no significant difference in 30-day ED revisit between hospitalizations with and without use of the postdischarge appointment service (22.3% vs 23.1%; P = .23).
This was echoed in our multivariable analysis where, controlling for other patient factors, use of the postdischarge appointment service was associated with an increased rate of follow-up with a PCP in seven days (+31.9 percentage points; 95% CI: 30.2, 33.6; P < .01) and a decreased likelihood of readmission within 30 days (−3.8 percentage points; 95% CI: −5.2, −2.4; P < .01) (Table 2).
Instrumental Variable Analysis
In our instrumental variable analysis, we used all hospitalizations both before and after the introduction of the intervention. In this analysis, we estimate that use of the postdischarge appointment service increases the probability of visiting a PCP within seven days by 33.4 percentage points (95% CI: 7.9%, 58.9%; P = .01) (Table 3). The use of the postdischarge appointment was associated with a 2.5 percentage point (95% CI: −22.0%, 17.1%; P = .80) reduction in readmissions and a 4.8 percentage point (95% CI; −27.5%, 17.9%; P = .68) reduction in an ED visit within 30 days (Table 3). Neither of these differences were statistically significant with wide confidence intervals.
In sensitivity analyses, we obtained similar results when we considered PCP visits and readmissions within 14 days.
DISCUSSION
The hospital introduced the postdischarge appointment service to facilitate postdischarge appointments and to deter readmissions. In our analyses the use of the postdischarge appointment service was associated with a substantial 30 percentage point increase in the likelihood of a PCP follow-up visit within seven days after hospital discharge. There was a roughly 2% reduction in 30-day readmissions, but this difference was not consistently statistically significant across our analyses. Together, our evaluation implies that this type of intervention may make it much easier for patients to attend a PCP appointment, but scheduling an appointment alone may have a modest impact on deterring a readmission.
Our findings are inconsistent with prior studies that described a strong association between early PCP follow-up and readmissions. However, our results were consistent with research where follow-up visits were not clearly protective against readmissions.20 One potential explanation of the discrepant findings is that there are unmeasured socioeconomic differences between patients who have a PCP follow-up appointment and those who do not.
Regardless of the impact on readmissions, it is important to acknowledge that early PCP follow-up offers many potential benefits. Continuing to evaluate and treat new diagnoses, adjusting and reconciling medications, reconnecting with outpatient providers, capturing new incidental findings, and ensuring stability through regular follow-up are just a few of the potential benefits. We believe the dramatic increase observed in PCP follow-up reflects the administrative complexity required for a patient to call their PCP’s office and to schedule a follow-up appointment soon after they are discharged from the hospital.
Our study has many limitations. The study was limited to a single academic center, and the intervention was limited to patients cared for by the general medicine and cardiology services.
In summary, we found that the introduction of a postdischarge appointment service resulted in substantially increased rates of early PCP follow-up but less clear benefits in preventing readmissions.
Under the Hospital Readmission Reduction Program (HRRP), hospitals with higher than expected readmissions for select conditions receive a financial penalty. In 2017, hospitals were penalized a total of $528 million.1,2 In an effort to deter readmissions, hospitals have focused on the transition from inpatient to outpatient care with particular emphasis on timely follow-up with a primary care physician (PCP).3-7 Medicare has also introduced transitional care codes, which reimburse physicians for follow-up care after a hospitalization.
METHODS
Postdischarge Appointment Service
In the fall of 2009, Beth Israel Deaconess introduced a postdischarge appointment intervention to facilitate follow-up with PCPs and specialty physicians after discharge from the hospital. Within the provider order entry system, attending and resident physicians enter a discharge appointment request for specified providers within and outside of the medical center and a specified time period. For example, a physician may enter a request to schedule a PCP appointment within 2-3, 4-8, 9-15, 16-30, or >30 days of discharge.
Study Population
We conducted a retrospective, cohort study at Beth Israel Deaconess Medical Center, a tertiary care hospital, using data derived from electronic health records for all hospitalizations
Outcomes
The primary outcomes of this study were kept PCP follow-up visits within seven days and readmission within 30 days of discharge. We focused on PCP visits within seven days, as this has been the measure used in prior research,5,7 but conducted a sensitivity analysis of PCP follow-up within 14 days. No-shows for the scheduled follow-up PCP appointments were not included. We focused on readmissions within 30 days of discharge, given this is the measure used in the HRRP,16 but conducted a sensitivity analysis of 14 days. Secondary outcomes included ED revisit within the 30 days. Given the data available, we only observed physician visits and hospitalizations that occurred within the Beth Israel Deaconess system.
Analyses
We conducted two analyses to assess whether the implementation of the postdischarge appointment service was associated with an increase in PCP follow-up and a decrease in the readmission rate.
In the first analysis, we focused only on hospitalizations from the medical and cardiology services during the postintervention period between January 2011 and September 2015 (n = 17,582). We compared the PCP follow-up rate and the readmission rate among hospitalizations where the postdischarge appointment service was used versus those where it was not used. We used a multivariable logistic regression, and the covariates included in the model were age, gender, hospital length of stay, and diagnosis-related group (DRG) cost weight. The DRG cost weight captures the average resources used to treat Medicare patients’ hospitalizations within a given DRG category and was used as a surrogate marker for the complexity of hospitalization.17 Instead of presenting odds ratios, we used predictive margins to generate adjusted percentage point estimates of the differences in our outcomes associated with the use of the postdischarge appointment service.18
This instrumental variable exploits the fact that the postdischarge appointment service was only available on weekdays and that physicians are asked to only submit the order for follow-up appointments on the day of discharge. We focused on the day of the week of admission (versus discharge) because of concerns that patients with more complicated hospital courses might be kept in the hospital over the weekend (eg, to facilitate testing available only on weekdays or to consult with regular physicians only available on weekdays). This would create a relationship between the day of discharge and the outcomes (follow-up visits, readmissions). The day of admission is less likely to be impacted by this bias. Given concerns that admissions on different days of the week might be different, our instrument is the day of the week interacted with the time period. Therefore, to create bias, there must be a systematic change in the nature of admissions on a given day of the week during this time period. We provide more details on this analysis, testing of the instrument, and results in the Appendix.
Analyses were conducted in Stata, version 14.2 (StataCorp LP, College Station, Texas). Statistical testing was two-sided, with a significance level of 0.05, and the project was judged exempt by the Committee on Clinical Investigations for Beth Israel Deaconess Medical Center.
RESULTS
Overall, there were 17,582 hospitalizations on the medicine and cardiology services following implementation of the postdischarge appointment service. The use of the postdischarge appointment service rose rapidly after it was introduced (Figure) and then plateaued at roughly 50%.
Multivariable Logistic Regression
In this analysis, we focused on the 17,582 hospitalizations from January 2011 to September 2015 on the general medicine and cardiology services that occurred after the postdischarge appointment service was introduced. Among these hospitalizations, the postdischarge appointment service was used in 51.8% of discharges.
In an unadjusted analysis, patients discharged using the tool had higher rates of seven-day PCP follow-up (60.2% vs 29.2%, P < .001) and lower 30-day readmission rates (14.7% vs 16.7%; P < .001) than those who were not (Table 2). There was no significant difference in 30-day ED revisit between hospitalizations with and without use of the postdischarge appointment service (22.3% vs 23.1%; P = .23).
This was echoed in our multivariable analysis where, controlling for other patient factors, use of the postdischarge appointment service was associated with an increased rate of follow-up with a PCP in seven days (+31.9 percentage points; 95% CI: 30.2, 33.6; P < .01) and a decreased likelihood of readmission within 30 days (−3.8 percentage points; 95% CI: −5.2, −2.4; P < .01) (Table 2).
Instrumental Variable Analysis
In our instrumental variable analysis, we used all hospitalizations both before and after the introduction of the intervention. In this analysis, we estimate that use of the postdischarge appointment service increases the probability of visiting a PCP within seven days by 33.4 percentage points (95% CI: 7.9%, 58.9%; P = .01) (Table 3). The use of the postdischarge appointment was associated with a 2.5 percentage point (95% CI: −22.0%, 17.1%; P = .80) reduction in readmissions and a 4.8 percentage point (95% CI; −27.5%, 17.9%; P = .68) reduction in an ED visit within 30 days (Table 3). Neither of these differences were statistically significant with wide confidence intervals.
In sensitivity analyses, we obtained similar results when we considered PCP visits and readmissions within 14 days.
DISCUSSION
The hospital introduced the postdischarge appointment service to facilitate postdischarge appointments and to deter readmissions. In our analyses the use of the postdischarge appointment service was associated with a substantial 30 percentage point increase in the likelihood of a PCP follow-up visit within seven days after hospital discharge. There was a roughly 2% reduction in 30-day readmissions, but this difference was not consistently statistically significant across our analyses. Together, our evaluation implies that this type of intervention may make it much easier for patients to attend a PCP appointment, but scheduling an appointment alone may have a modest impact on deterring a readmission.
Our findings are inconsistent with prior studies that described a strong association between early PCP follow-up and readmissions. However, our results were consistent with research where follow-up visits were not clearly protective against readmissions.20 One potential explanation of the discrepant findings is that there are unmeasured socioeconomic differences between patients who have a PCP follow-up appointment and those who do not.
Regardless of the impact on readmissions, it is important to acknowledge that early PCP follow-up offers many potential benefits. Continuing to evaluate and treat new diagnoses, adjusting and reconciling medications, reconnecting with outpatient providers, capturing new incidental findings, and ensuring stability through regular follow-up are just a few of the potential benefits. We believe the dramatic increase observed in PCP follow-up reflects the administrative complexity required for a patient to call their PCP’s office and to schedule a follow-up appointment soon after they are discharged from the hospital.
Our study has many limitations. The study was limited to a single academic center, and the intervention was limited to patients cared for by the general medicine and cardiology services.
In summary, we found that the introduction of a postdischarge appointment service resulted in substantially increased rates of early PCP follow-up but less clear benefits in preventing readmissions.
1. Boccutti C, Casillas G. Aiming for Fewer Hospital U-turns: The Medicare Hospital Readmission Reduction Program; March 10, 2017. https://www.kff.org/medicare/issue-brief/aiming-for-fewer-hospital-u-turns-the-medicare-hospital-readmission-reduction-program. Accessed July 22, 2019
2. Centers for Medicare and Medicaid Services. FY 2017 IPPS Final Rule: Hospital Readmissions Reduction Program Su pplemental Data File. https://www.cms.gov/Medicare/Medicare-Fee-for-Service-Payment/AcuteInpatientPPS/Archived-Supplemental-Data-Files.html. Accessed June 22, 2019
3. Sharma G, Kuo YF, Freeman JL, Zhang DD, Goodwin JS. Outpatient follow-up visit and 30-day emergency department visit and readmission in patients hospitalized for chronic obstructive pulmonary disease. Arch Intern Med. 2010;170(18):1664-1670. https://doi.org/10.1001/archinternmed.2010.345.
4. Rennke S, Nguyen OK, Shoeb MH, et al. Hospital-initiated transitional care interventions as a patient safety strategy: a systematic review. Ann Intern Med. 2013;158(5 Pt 2):433-440. https://doi.org/10.7326/0003-4819-158-5-201303051-00011.
5. Misky GJ, Wald HL, Coleman EA. Post hospitalization transitions: examining the effects of timing of primary care provider follow-up. J Hosp Med. 2010;5(7):392-397. https://doi.org/10.1002/jhm.666.
6. Hesselink G, Schoonhoven L, Barach P, et al. Improving patient handovers from hospital to primary care: a systematic review. Ann Intern Med. 2012;157(6):417-428. https://doi.org/10.7326/0003-4819-157-6-201209180-00006.
7. Hernandez AF, Greiner MA, Fonarow GC, et al. Relationship between early physician follow-up and 30-day readmission among Medicare beneficiaries hospitalized for heart failure. JAMA. 2010;303(17):1716-1722. https://doi.org/10.1001/jama.2010.533.
8. Muus KJ, Knudson A, Klug MG, et al. Effect of post discharge follow-up care on re-admissions among US veterans with congestive heart failure: a rural-urban comparison. Rural Remote Health. 2010;10(2):1447.
9. Brooke BS, Stone DH, Cronenwett JL, et al. Early primary care provider follow-up and readmission after high-risk surgery. JAMA Surg. 2014;149(8):821-828. https://doi.org/10.1001/jamasurg.2014.157.
10. Leschke J, Panepinto JA, Nimmer M, et al. Outpatient follow-up and rehospitalizations for sickle cell disease patients. Pediatr Blood Cancer. 2012;58(3):406-409. https://doi.org/10.1002/pbc.23140.
11. Field TS, Ogarek J, Garber L, Reed G, Gurwitz JH. Association of early post discharge follow-up by a primary care physician and 30-day rehospitalization among older adults. J Gen Intern Med. 2015;30(5):565-571. https://doi.org/10.1007/s11606-014-3106-4.
12. Kashiwagi DT, Burton MC, Kirkland LL, Cha S, Varkey P. Do timely outpatient follow-up visits decrease hospital readmission rates? Am J Med Qual. 2012;27(1):11-15. https://doi.org/10.1177/1062860611409197.
13. Hansen LO, Young RS, Hinami K, Leung A, Williams MV. Interventions to reduce 30-day rehospitalization: a systematic review. Ann Intern Med. 2011;155(8):520-528. https://doi.org/10.7326/0003-4819-155-8-201110180-00008.
14. Ryan J, Kang S, Dolacky S, Ingrassia J, Ganeshan R. Change in readmissions and follow-up visits as part of a heart failure readmission quality improvement initiative. Am J Med. 2013;126(11):989–994.e1. https://doi.org/10.1016/j.amjmed.2013.06.027.
15. Coleman EA, Parry C, Chalmers S, Min SJ. The care transitions intervention: results of a randomized controlled trial. Arch Intern Med. 2006;166(17):1822-1828. https://doi.org/10.1001/archinte.166.17.1822.
16. Thomas JW. Should episode-based economic profiles be risk adjusted to account for differences in patients’ health risks? Health Serv Res. 2006;41(2):581-598. https://doi.org/10.1111/j.1475-6773.2005.00499.x.
17. Mendez CM, Harrington DW, Christenson P, Spellberg B. Impact of hospital variables on case mix index as a marker of disease severity. Popul Health Manag. 2014;17(1):28-34. https://doi.org/10.1089/pop.2013.0002.
18. Muller CJ, MacLehose RF. Estimating predicted probabilities from logistic regression: different methods correspond to different target populations. Int J Epidemiol. 2014;43(3):962-970. https://doi.org/10.1093/ije/dyu029.
19. Angrist JD, Krueger AB. Instrumental variables and the search for identification: From supply and demand to natural experiments. J Econ Perspect. 2001;15(4):69-85. https://doi.org/10.1257/jep.15.4.69.
20. Dimick JB, Ryan AM. Methods for evaluating changes in health care policy: the difference-in-differences approach. JAMA. 2014;312(22):2401-2402. https://doi.org/10.1001/jama.2014.16153.
21. Peikes D, Chen A, Schore J, Brown R. Effects of care coordination on hospitalization, quality of care, and health care expenditures among Medicare beneficiaries: 15 randomized trials. JAMA. 2009;301(6):603-618. https://doi.org/10.1001/jama.2009.126.
22. Jack BW, Chetty VK, Anthony D, et al. A reengineered hospital discharge program to decrease rehospitalization: a randomized trial. Ann Intern Med. 2009;150(3):178-187. https://doi.org/10.7326/0003-4819-150-3-200902030-00007.
23. Naylor MD, Brooten DA, Campbell RL, et al. Transitional care of older adults hospitalized with heart failure: a randomized, controlled trial. J Am Geriatr Soc. 2004;52(5):675-684. https://doi.org/10.1111/j.1532-5415.2004.52202.x.
24. Leppin AL, Gionfriddo MR, Kessler M, et al. Preventing 30-day hospital readmissions: a systematic review and meta-analysis of randomized trials. JAMA Intern Med. 2014;174(7):1095-1107. https://doi.org/10.1001/jamainternmed.2014.1608.
25. Kripalani S, LeFevre F, Phillips CO, et al. Deficits in communication and information transfer between hospital-based and primary care physicians: implications for patient safety and continuity of care. JAMA. 2007;297(8):831-841. https://doi.org/10.1001/jama.297.8.831.
26. van Walraven C, Seth R, Austin PC, Laupacis A. Effect of discharge summary availability during post discharge visits on hospital readmission. J Gen Intern Med. 2002;17(3):186-192. https://doi.org/10.1046/j.1525-1497.2002.10741.x.
27. Hoyer EH, Brotman DJ, Apfel A, et al. Improving outcomes after hospitalization: A prospective observational multicenter evaluation of care coordination strategies for reducing 30-day readmissions to Maryland Hospitals. J Gen Intern Med. 2018;33(5):621-627. https://doi.org/10.1007/s11606-017-4218-4.
1. Boccutti C, Casillas G. Aiming for Fewer Hospital U-turns: The Medicare Hospital Readmission Reduction Program; March 10, 2017. https://www.kff.org/medicare/issue-brief/aiming-for-fewer-hospital-u-turns-the-medicare-hospital-readmission-reduction-program. Accessed July 22, 2019
2. Centers for Medicare and Medicaid Services. FY 2017 IPPS Final Rule: Hospital Readmissions Reduction Program Su pplemental Data File. https://www.cms.gov/Medicare/Medicare-Fee-for-Service-Payment/AcuteInpatientPPS/Archived-Supplemental-Data-Files.html. Accessed June 22, 2019
3. Sharma G, Kuo YF, Freeman JL, Zhang DD, Goodwin JS. Outpatient follow-up visit and 30-day emergency department visit and readmission in patients hospitalized for chronic obstructive pulmonary disease. Arch Intern Med. 2010;170(18):1664-1670. https://doi.org/10.1001/archinternmed.2010.345.
4. Rennke S, Nguyen OK, Shoeb MH, et al. Hospital-initiated transitional care interventions as a patient safety strategy: a systematic review. Ann Intern Med. 2013;158(5 Pt 2):433-440. https://doi.org/10.7326/0003-4819-158-5-201303051-00011.
5. Misky GJ, Wald HL, Coleman EA. Post hospitalization transitions: examining the effects of timing of primary care provider follow-up. J Hosp Med. 2010;5(7):392-397. https://doi.org/10.1002/jhm.666.
6. Hesselink G, Schoonhoven L, Barach P, et al. Improving patient handovers from hospital to primary care: a systematic review. Ann Intern Med. 2012;157(6):417-428. https://doi.org/10.7326/0003-4819-157-6-201209180-00006.
7. Hernandez AF, Greiner MA, Fonarow GC, et al. Relationship between early physician follow-up and 30-day readmission among Medicare beneficiaries hospitalized for heart failure. JAMA. 2010;303(17):1716-1722. https://doi.org/10.1001/jama.2010.533.
8. Muus KJ, Knudson A, Klug MG, et al. Effect of post discharge follow-up care on re-admissions among US veterans with congestive heart failure: a rural-urban comparison. Rural Remote Health. 2010;10(2):1447.
9. Brooke BS, Stone DH, Cronenwett JL, et al. Early primary care provider follow-up and readmission after high-risk surgery. JAMA Surg. 2014;149(8):821-828. https://doi.org/10.1001/jamasurg.2014.157.
10. Leschke J, Panepinto JA, Nimmer M, et al. Outpatient follow-up and rehospitalizations for sickle cell disease patients. Pediatr Blood Cancer. 2012;58(3):406-409. https://doi.org/10.1002/pbc.23140.
11. Field TS, Ogarek J, Garber L, Reed G, Gurwitz JH. Association of early post discharge follow-up by a primary care physician and 30-day rehospitalization among older adults. J Gen Intern Med. 2015;30(5):565-571. https://doi.org/10.1007/s11606-014-3106-4.
12. Kashiwagi DT, Burton MC, Kirkland LL, Cha S, Varkey P. Do timely outpatient follow-up visits decrease hospital readmission rates? Am J Med Qual. 2012;27(1):11-15. https://doi.org/10.1177/1062860611409197.
13. Hansen LO, Young RS, Hinami K, Leung A, Williams MV. Interventions to reduce 30-day rehospitalization: a systematic review. Ann Intern Med. 2011;155(8):520-528. https://doi.org/10.7326/0003-4819-155-8-201110180-00008.
14. Ryan J, Kang S, Dolacky S, Ingrassia J, Ganeshan R. Change in readmissions and follow-up visits as part of a heart failure readmission quality improvement initiative. Am J Med. 2013;126(11):989–994.e1. https://doi.org/10.1016/j.amjmed.2013.06.027.
15. Coleman EA, Parry C, Chalmers S, Min SJ. The care transitions intervention: results of a randomized controlled trial. Arch Intern Med. 2006;166(17):1822-1828. https://doi.org/10.1001/archinte.166.17.1822.
16. Thomas JW. Should episode-based economic profiles be risk adjusted to account for differences in patients’ health risks? Health Serv Res. 2006;41(2):581-598. https://doi.org/10.1111/j.1475-6773.2005.00499.x.
17. Mendez CM, Harrington DW, Christenson P, Spellberg B. Impact of hospital variables on case mix index as a marker of disease severity. Popul Health Manag. 2014;17(1):28-34. https://doi.org/10.1089/pop.2013.0002.
18. Muller CJ, MacLehose RF. Estimating predicted probabilities from logistic regression: different methods correspond to different target populations. Int J Epidemiol. 2014;43(3):962-970. https://doi.org/10.1093/ije/dyu029.
19. Angrist JD, Krueger AB. Instrumental variables and the search for identification: From supply and demand to natural experiments. J Econ Perspect. 2001;15(4):69-85. https://doi.org/10.1257/jep.15.4.69.
20. Dimick JB, Ryan AM. Methods for evaluating changes in health care policy: the difference-in-differences approach. JAMA. 2014;312(22):2401-2402. https://doi.org/10.1001/jama.2014.16153.
21. Peikes D, Chen A, Schore J, Brown R. Effects of care coordination on hospitalization, quality of care, and health care expenditures among Medicare beneficiaries: 15 randomized trials. JAMA. 2009;301(6):603-618. https://doi.org/10.1001/jama.2009.126.
22. Jack BW, Chetty VK, Anthony D, et al. A reengineered hospital discharge program to decrease rehospitalization: a randomized trial. Ann Intern Med. 2009;150(3):178-187. https://doi.org/10.7326/0003-4819-150-3-200902030-00007.
23. Naylor MD, Brooten DA, Campbell RL, et al. Transitional care of older adults hospitalized with heart failure: a randomized, controlled trial. J Am Geriatr Soc. 2004;52(5):675-684. https://doi.org/10.1111/j.1532-5415.2004.52202.x.
24. Leppin AL, Gionfriddo MR, Kessler M, et al. Preventing 30-day hospital readmissions: a systematic review and meta-analysis of randomized trials. JAMA Intern Med. 2014;174(7):1095-1107. https://doi.org/10.1001/jamainternmed.2014.1608.
25. Kripalani S, LeFevre F, Phillips CO, et al. Deficits in communication and information transfer between hospital-based and primary care physicians: implications for patient safety and continuity of care. JAMA. 2007;297(8):831-841. https://doi.org/10.1001/jama.297.8.831.
26. van Walraven C, Seth R, Austin PC, Laupacis A. Effect of discharge summary availability during post discharge visits on hospital readmission. J Gen Intern Med. 2002;17(3):186-192. https://doi.org/10.1046/j.1525-1497.2002.10741.x.
27. Hoyer EH, Brotman DJ, Apfel A, et al. Improving outcomes after hospitalization: A prospective observational multicenter evaluation of care coordination strategies for reducing 30-day readmissions to Maryland Hospitals. J Gen Intern Med. 2018;33(5):621-627. https://doi.org/10.1007/s11606-017-4218-4.
© 2019 Society of Hospital Medicine
Impact of the Hospital-Acquired Conditions Initiative on Falls and Physical Restraints: A Longitudinal Study
Accidental falls are among the most common incidents reported in hospitals, complicating approximately 2% of hospital stays.1-3 Approximately 25% of falls in hospitalized patients result in injury, and 2% involve fractures.4 Substantial costs are associated with falls, including patient care costs associated with increased length of stay and liability.5-7
Beginning October 1, 2008, the Centers for Medicare & Medicaid Services (CMS) stopped reimbursing hospitals for the additional care associated with eight hospital-acquired conditions (HACs), including serious fall-related injury, which were believed to be “reasonably preventable.”8,9 Before this change, hospitals recovered the costs of these “never events” by assigning a higher level MS-DRG (Medicare Severity Diagnosis-Related Group) code for patients experiencing such an event. This is no longer allowed under the revised CMS Prospective Payment System rules.
Although the financial penalty for iatrogenic injury was modest, the payment change placed pressure on hospital staff to decrease falls, and some nurses reported changing practice to be more restrictive of patient mobility.10 Increased use of physical restraints is a potential unintended consequence of this rule change.11 Restraints are known to cause agitation, delirium, decubiti, deconditioning, strangulation, and death.12 Not surprisingly, use of restraints is discouraged in hospitals and is a CMS quality of care indicator.13,14 Although there is no evidence that restraint use prevents patients from falling,15,16 there is a perception among both health professionals and patients that restraints reduce the risk of falling, and they are often used as a “last resort” method of fall prevention.17-19
The aim of this longitudinal study was to determine whether this payment change was associated with changes in short-, intermediate-, and long-term rates of falls, injurious falls, and physical restraint use in acute care hospitals. The CMS has included fall-related hip fracture in newer value-based purchasing programs by adding Patient Safety Indictor (PSI) 90 to both the HACs Reduction Program (HACRP)20 and the Hospital Value-Based Purchasing (VBP)21 in FY2015. However, the HACs Initiative remains the only Medicare value program that directly penalizes all injurious inpatient falls.
METHODS
Study Units
As previously described,22 the National Database of Nursing Quality Indicators (NDNQI) is a data collection project initiated by the American Nurses Association (ANA). The NDNQI provides national comparative data at the unit and facility levels on nursing-sensitive indicators endorsed by the National Quality Forum. More than 2,000 hospitals voluntarily participate in the NDNQI, including virtually all ANA Magnet-recognized hospitals, and more than 90% of nursing units participate in the fall measures (NDNQI, personal communication). At the start of study data collection, the project was administered by the School of Nursing at the University of Kansas Medical Center. In 2014, the ownership of the NDNQI was transferred from the ANA to Press Ganey Associates, Inc. In addition to standardized data on unit, facility, and staffing characteristics, the NDNQI member hospitals can elect to submit monthly data on falls and quarterly data on physical restraint use prevalence.
We examined the data collected from adult medical, medical-surgical, and surgical units in United States acute care hospitals that elected to participate in the fall and physical restraint use data collection within the NDNQI for the 27 months before and the 87 months after the implementation of the CMS rule change. Eligible units contributed at least one fall and physical restraint use data point during both the 27 months preceding October 1, 2008, and the 87 months immediately after. The Institutional Review Board at the University of Kansas Medical Center reviewed and approved the study before its implementation.
Endpoints
Fall Events
The NDNQI defines a patient fall as an unplanned descent to the floor, regardless of whether the fall results in injury and regardless of whether the patient was assisted to the floor by a member of the hospital staff. Events in which a patient lands on a surface where one would not expect to find a patient (eg, on a mat next to a low bed) are also counted as falls.
Using internal data sources (eg, medical records, incident reports), participating hospitals report the number of inpatient falls each month to the NDNQI. We analyzed the falls data for the period July 1, 2006, through December 31, 2015. Thus, each unit could contribute 114 months (27 months before the rule change and 87 months after the rule change) of falls data.
Hospitals classify the injury level of each fall as none, minor (resulting in bruise, pain, abrasion, wound cleaning, or limb elevation, or in the use of ice, dressing, or topical medication), moderate (resulting in suturing, splinting, muscle or joint strain, or application of steri-strips or skin glue), major (resulting in surgery, casting, traction, any type of fracture, consultation for neurological or internal injury, or receipt of blood products for patients with coagulopathy), or death (resulting from injuries sustained from falling). For this study, a fall resulting in any injury (including minor) was considered as an injurious fall. The NDNQI data have been validated for falls and fall injury.23,24
Based on patient counts from unit censuses and/or internal data on actual patient hours on the unit, hospitals also report to the NDNQI the monthly number of patient days for each unit for which falls data are reported. The NDNQI uses these data to calculate each unit’s total and injurious fall rate per 1,000 patient days.
Physical Restraint Use
The NDNQI follows the CMS definition of restraint, which is “any manual method, physical or mechanical device, material, or equipment that immobilizes or reduces the ability of a patient to move his or her arms, legs, body, or head freely”.13 The NDNQI restraint use data are collected quarterly. Participating hospitals choose one day each quarter to conduct a restraint use prevalence survey on participating units. On the selected day, designated RNs within these hospitals visually assess each patient on the unit for restraint use. Based on this survey, hospitals report to the NDNQI the total count of patients surveyed and whether each was restrained. For restrained patients, hospitals also report the type of restraint as limb, vest, or other (eg, four side rails, net beds, mitts not attached to the bed).
We analyzed the restraint use data for the period October 1, 2006, through December 31, 2015. Thus, 37 quarters of data (eight pre- and 29 postrule change) were available. For this study, we computed for each unit the quarterly proportion of surveyed patients who were physically restrained by dividing the total count of restrained patients (regardless of the type of restraint) on the day of the survey by the total count of surveyed patients.
Covariates
Unit- and facility-level covariates were included in several model specifications to determine whether patient or facility characteristics affected the results. The unit-level covariates included the type of nursing unit (medical, medical and surgical, or surgical), monthly rates of total nursing hours per patient day, and nursing skill mix (percent registered nurses/total nursing personnel). The three facility-level variables included urban–rural location (defined as metropolitan [located in an area containing an urban core with a population of at least 50,000], micropolitan [located in an area containing an urban core with a population of 10,000-49,999], or neither), bed size (<300 beds or ≥300 beds), and teaching status (academic health center, major teaching hospital, or nonteaching hospital).
Because larger, academically affiliated hospitals are overrepresented in the NDNQI, we conducted stratified analyses of these variables to explore how change in the rates of falls and restraint use in the entire sample might differ between hospitals according to bed size (<300 beds, ≥300 beds) and teaching status (nonteaching versus teaching and academic health center).
Statistical Methods
We compared the mean annual rates of change in falls, injurious falls, and physical restraint use prevalence during the two years before the HACs Initiative went into effect (October 2006-September 2008) with the mean annual rates of change following the implementation of the payment rule. Short-term (one-year) change was the slope from October 2008 to September 2009, intermediate-term (four-year) change was the slope from October 2008 to September 2012, and long-term (seven-year) change was the slope from October 2008 to September 2015.
Monthly rates of falls and injurious falls over the 114-month period were modeled using negative binomial models with a random intercept to account for heterogeneity between units. Each base mean model included the preimplementation intercept and slope (over time), the postimplementation intercept, and slope (both linear and quadratic). We also fit the models that included the terms in the base model and facility-level covariates, unit-level covariates, both individually and combined. All models included terms for seasonality.
Quarterly prevalence rates of restraint use over the 37 quarters were modeled using beta-binomial models with a random intercept to account for heterogeneity between units. Each base mean model included the preimplementation intercept and slope (over time), the postimplementation intercept, and slope (both linear and quadratic). Similar to the one specified for falls, models were also fitted that included facility- and unit-level covariates as described above.
To adjust for multiple comparisons of the three postimplementation slopes, all confidence intervals were Bonferroni corrected.
RESULTS
Nursing Units
We included nursing units with one or more months of falls data and one or more quarters of restraint use data before and after the rule change. Of the 11,117 nursing units that submitted data to the NDNQI, 2,862 units (983 medical, 1,219 medical-surgical, and 660 surgical) with the requisite demographic, falls, and restraint use data were considered for inclusion in the study. The characteristics of the nursing units (ie, the type of unit, total nursing hours per patient day, and nursing skill mix) and hospitals (ie, location, bed size, teaching status) included in the study were similar to those of the overall NDNQI member units.
Baseline Characteristics
In the first study month (July 2006), 1,941 sample nursing units reported 5,101 falls during 1,401,652 patient-days of observation. Of these, 1,502 (29%) resulted in injury (1,281 minor, 144 moderate, 75 major, and two deaths). Across falls, the median (interquartile range [IQR]) patient age was 70 (55-80) years, with males accounting for 51% of falls. Most of the falls, 4,328 (85%), were documented as unassisted. A total of 209 (4%) falls occurred while physical restraints were in use.
In the first quarterly restraint use prevalence survey (October 2006), the 829 participating nursing units surveyed 19,979 patients (median [IQR] = 23 [20-23] patients per nursing unit). The median (IQR) age was 66 (51-78) years, and 54% of them were females. At the time of the survey, restraints were in use for 326 (1.6%) patients. Restrained patients were older than unrestrained patients (median age: 78 vs 65 years) and more likely to be male (56% vs 46%). Limb restraints were used for 139 patients, vest restraints for 66, both limb and vest restraints for 24, and other restraint types were used for 113 patients (including 11 in limb restraints and 5 in limb and vest restraints).
Change in Endpoints after Implementation of the HACs Initiative
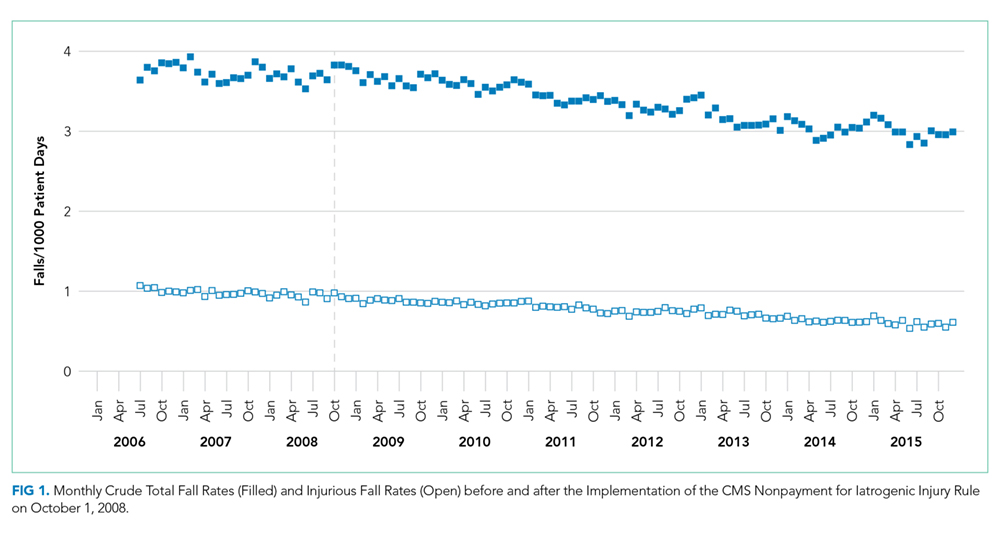
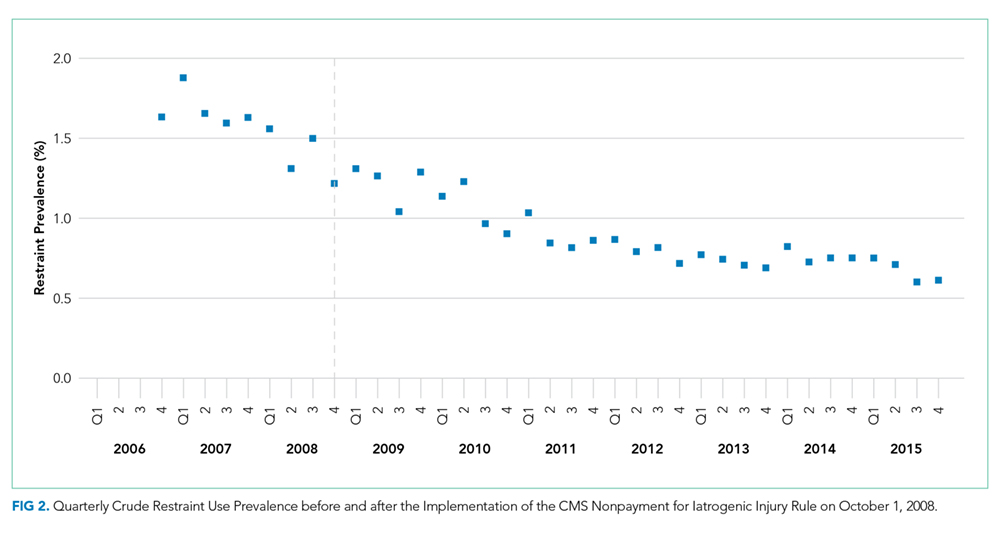
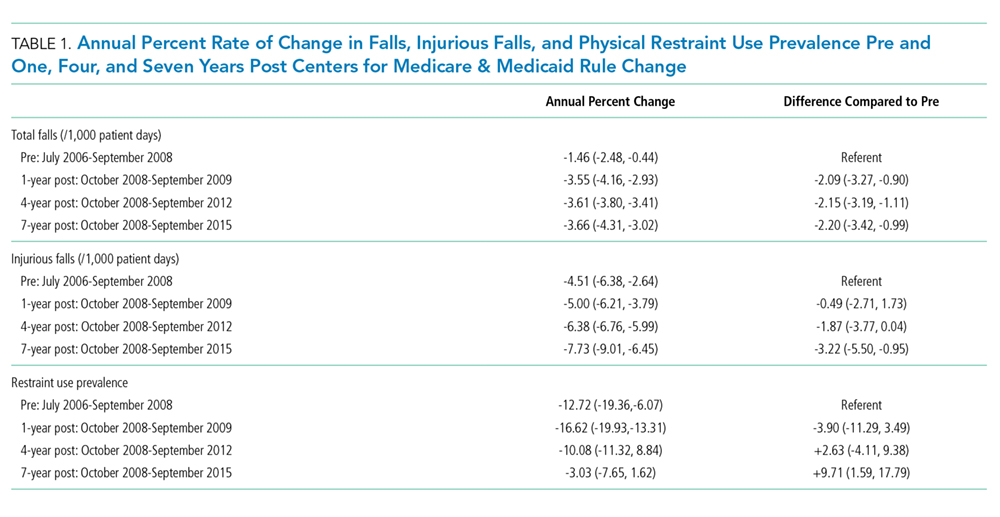
Stratified Analysis
At baseline, fall rates and restraint use prevalence were slightly higher, whereas the rate of injurious falls was slightly lower, among teaching and academic medical centers compared to those in nonteaching hospitals. Declines in falls rate and restraint use prevalence were higher in teaching hospitals than in nonteaching hospitals (data not included).
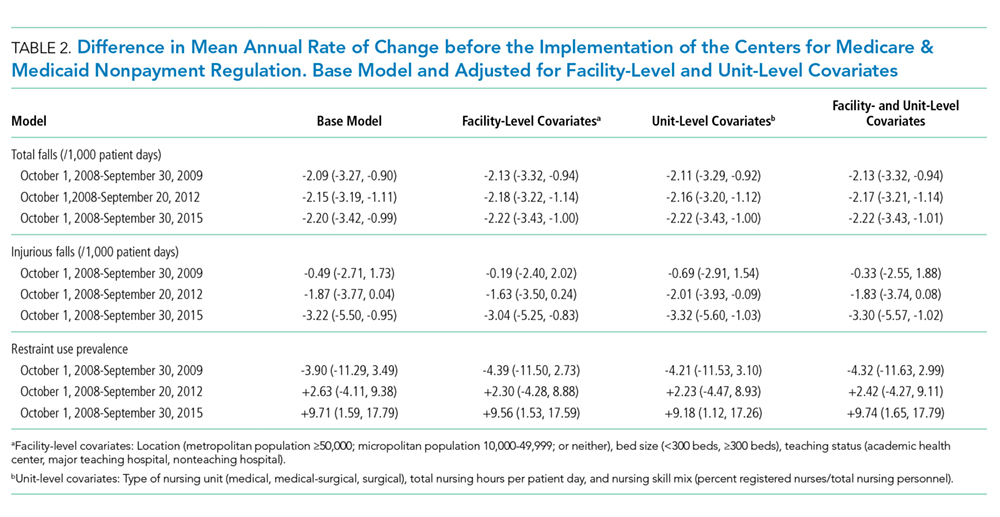
CONCLUSIONS
We examined the rates of falls and fall injuries among 2,862 hospital units before and after the implementation of the HACs Initiative. Implementation of the CMS payment change was associated with a modest improvement in the rate of decrease for falls; a statistically significant effect on the rate of decrease for injurious falls was detectable only at seven years postchange. Fall reductions were the greatest among teaching and larger hospitals. These findings are consistent with our previous analysis of NDNQI data that found no short-term effect of the rule change on the rate of injurious falls.25
We found no evidence indicating that restraint use prevalence increased because of this payment change. Physical -restraint use prevalence showed a rapidly decreasing trend before 2008, and although the rate of decline was attenuated seven years after the rule change, the overall physical restraint use prevalence in these units in 2015 was less than half of that in 2006. Unlike falls, the steepest declines in restraint use prevalence occurred in smaller hospitals.
The CMS decision to include falls with injury among the “reasonably preventable” HACs was controversial.11 Inpatient falls are largely attributable to individual patient risk factors and are unusual among HACs in the extent to which patient behavior plays a role in their occurrence. Although hospital fall prevention guidelines have been published, only a few controlled trials have been conducted, with little evidence supporting the recommendations.1,26 A quantitative review found no evidence of benefit in published hospital fall prevention studies using concurrent controls (internal rate of return = 0.92; 95% CI: 0.65-1.30),26 and a recent, well-executed, cluster randomized trial of multifactorial fall prevention interventions found no change in fall rates compared with controls.27 Current hospital fall prevention guidelines are limited to unproven and time-consuming nursing-level (eg, toileting schedules and use of alarms) or organizational-level strategies (eg, changing staff attitudes regarding the inevitability of falls or “leadership support”).1,28
Despite the large sample size and the use of nurse-reported data that include patient falls from all age groups and not subject to bias due to the regulation itself (eg, ICD coding changes), our findings should be interpreted taking into account several limitations.
First, hospitals participating in the NDNQI self-select to participate and are larger and disproportionately urban compared with nonparticipating hospitals.29 Although our findings were unchanged when hospital-level covariates were included in modeling, analyses stratified by teaching status and bed size demonstrated important differences. Larger teaching hospitals experienced greater fall reductions, whereas restraint use prevalence decreased more rapidly in smaller hospitals.
Second, the absence of a control group prevents us from conclusively attributing changes in falls rate and restraint use prevalence to the 2008 CMS payment change.30 Our findings may have been influenced by other policy changes. For example, in October 2014, the CMS implemented the Hospital-Acquired Condition Reduction Program (HACRP)20 and the Hospital Value-Based Purchasing (VBP)21 Program. Under these programs, falls with hip fractures were an indicator that could alter hospital payment.
Third, we did not ascertain the use of all available fall prevention measures such as companions, bed rails, very low beds, bed alarms, and restricted activity.31 Nor could the study address changes in patient functional status or discharge location. In a before- and after-study of four hospitals in a single hospital system, we found that bed alarm use increased, restraint orders decreased, and the use of room change or sitters remained stable after the implementation of the CMS payment.32
Nevertheless, we believe that these findings are consistent with the hypothesis that the HACs Initiative increased the cost of patient falls to hospitals, and, in response, some hospitals were able to modestly reduce the rate of falls. We found no evidence that physical restraint use prevalence increased.
In summary, our findings suggest modest impact of the HACs Initiative on falls and injurious falls, but no unintended impact on restraint use. These results highlight the importance of ensuring that pay-for-performance initiatives target outcomes where there are evidence-based approaches to prevention. The creation or identification of prevention tools and guidelines does not make an outcome preventable. Despite interval improvement in these self-selected hospital units in fall rates and physical restraint use prevalence, falls remain a difficult patient safety problem for hospitals, and further research is required to develop cost-effective, generalizable strategies for their prevention.
1. Miake-Lye IM, Hempel S, Ganz DA, Shekelle PG. Inpatient fall prevention programs as a patient safety strategy: a systematic review. Ann Intern Med. 2013;158(5):390-396. https://doi.org/10.7326/0003-4819-158-5-201303051-00005
2. Healey F, Darowski A. Older patients and falls in hospital. Clin Risk. 2012;18(5):170-176. https://doi.org/10.1258/cr.2012.012020.
3. Oliver D, Healey F, Haines TP. Preventing falls and fall-related injuries in hospitals. Clin Geriatr Med. 2010;26(4):645-692. https://doi.org/10.1016/j.cger.2010.06.005.
4. Currie L. Fall and Injury Prevention. In: Hughes RG, ed. Patient safety and quality: an evidence-based handbook for nurses (Prepared with support from the Robert Wood Johnson Foundation). AHRQ Publication NO.08-0043. Rockville, MD: Agency for Healthcare Research and Quality; 2008.
5. Wong CA, Recktenwald AJ, Jones ML, Waterman BM, Bollini ML, Dunagan WC. The cost of serious fall-related injuries at three Midwestern hospitals. Jt Comm J Qual Patient Saf. 2011;37(2):81-87. https://doi.org/10.1016/S1553-7250(11)37010-9.
6. Bates DW, Pruess K, Souney P, Platt R. Serious falls in hospitalized patients: correlates and resource utilization. Am J Med. 1995;99(2):137-143. https://doi.org/10.1016/s0002-9343(99)80133-8.
7. Fiesta J. Liability for falls. Nurs Manage. 1998;29(3):24-26. https://doi.org/10.1097/00006247-199803000-00007.
8. Rosenthal MB. Nonpayment for performance? Medicare’s new reimbursement rule. N Engl J Med. 2007;357(16):1573-1575. https://doi.org/10.1056/NEJMp078184.
9. Department of Health and Human Services, Centers for Medicare and Medicaid Services. 42 CFR Parts 411, 412, 413, and 489. Medicare program; proposed changes to the hospital inpatient prospective payment systems and fiscal year. 2008 rates; final rule. Federal Register. 2007;72(62):47130-47178.
10. King B, Pecanac K, Krupp A, Liebzeit D, Mahoney J. Impact of fall prevention on nurses and care of fall risk patients. Gerontologist. 2018;58(2):331-340. https://doi.org/10.1093/geront/gnw156.
11. Inouye SK, Brown CJ, Tinetti ME. Medicare nonpayment, hospital falls, and unintended consequences. N Engl J Med. 2009;360(23):2390-2393. https://doi.org/10.1056/NEJMp0900963.
12. Rakhmatullina M, Taub A, Jacob T. Morbidity and mortality associated with the utilization of restraints : a review of literature. Psychiatr Q. 2013;84(4):499-512. https://doi.org/10.1007/s11126-013-9262-6.
13. State Operations Manual Appendix A - Survey Protocol, Regulations and Interpretive Guidelines for Hospitals. (Revision 116, 06-06-14). http://cms.hhs.gov/Regulations-and-Guidance/Guidance/Manuals/downloads/som107ap_a_hospitals.pdf. Accessed October 26, 2014.
14. Nursing Sensitive Measures. NQF # 0203, Restraint prevalence (vest and limb only). Status: Endorsed on: August 05, 2009; Steward(s): The Joint Commission. Washington, D.C.: National Quality Forum; 2009.
15. Kopke S, Muhlhauser I, Gerlach A, et al. Effect of a guideline-based multicomponent intervention on use of physical restraints in nursing homes: a randomized controlled trial. JAMA. 2012;307(20):2177-2184. https://doi.org/10.1001/jama.2012.4517.
16. Enns E, Rhemtulla R, Ewa V, Fruetel K, Holroyd-Leduc JM. A controlled quality improvement trial to reduce the use of physical restraints in older hospitalized adults. J Am Geriatr Soc. 2014;62(3):541-545. https://doi.org/10.1111/jgs.12710.
17. Heinze C, Dassen T, Grittner U. Use of physical restraints in nursing homes and hospitals and related factors: a cross-sectional study. J Clin Nurs. 2012;21(7-8):1033-1040. https://doi.org/10.1111/j.1365-2702.2011.03931.x.
18. Minnick AF, Fogg L, Mion LC, Catrambone C, Johnson ME. Resource clusters and variation in physical restraint use. J Nurs Scholarsh. 2007;39(4):363-370. https://doi.org/10.1111/j.1547-5069.2007.00194.x.
19. Vassallo M, Wilkinson C, Stockdale R, Malik N, Baker R, Allen S. Attitudes to restraint for the prevention of falls in hospital. Gerontology. 2005;51(1):66-70. https://doi.org/10.1159/000081438.
20. Centers for Medicare & Medicaid Services. Hospital-Acquired Condition Reduction Program (HACRP). https://www.cms.gov/Medicare/Medicare-Fee-for-Service-Payment/AcuteInpatientPPS/HAC-Reduction-Program.html. Accessed September 9. 2018.
21. Centers for Medicare & Medicaid Services. The Hospital Value-Based Purchasing (VBP) Program. https://www.cms.gov/Medicare/Quality-Initiatives-Patient-Assessment-Instruments/Value-Based-Programs/HVBP/Hospital-Value-Based-Purchasing.html. Accessed September 9, 2018.
22. Dunton NE. Take a cue from the NDNQI. Nurs Manage. 2008;39(4):20, 22-23. https://doi.org/10.1097/01.NUMA.0000316054.35317.bf.
23. Garrard L, Boyle DK, Simon M, Dunton N, Gajewski B. Reliability and Validity of the NDNQI(R) Injury Falls Measure. West J Nurs Res. 2016;38(1):111-128. https://doi.org/10.1177/0193945914542851
24. Garrard L, Boyle DK, Simon M, Dunton N, Gajewski B. Reliability and validity of the NDNQI(R) injury falls measure. West J Nurs Res. 2016;38(1):111-128. https://doi.org/10.1177/0193945914542851.
25. Waters TM, Daniels MJ, Bazzoli GJ, et al. Effect of Medicare’s nonpayment for hospital-acquired conditions: lessons for future policy. JAMA Intern Med. 2015;175(3):347-354.
26. Hempel S, Newberry S, Wang Z, et al. Hospital fall prevention: a systematic review of implementation, components, adherence, and effectiveness. J Am Geriatr Soc. 2013;61(4):483-494. https://doi.org/10.1001/jamainternmed.2014.5486.
27. Barker AL, Morello RT, Wolfe R, et al. 6-PACK programme to decrease fall injuries in acute hospitals: cluster randomised controlled trial. BMJ. 2016;352:h6781. https://doi.org/10.1136/bmj.h6781.
28. Goldsack J, Bergey M, Mascioli S, Cunningham J. Hourly rounding and patient falls: what factors boost success? Nursing. 2015;45(2):25-30. https://doi.org/10.1097/01.NURSE.0000459798.79840.95.
29. Montalvo I. The National Database of Nursing Quality Indicators (NDNQI). Online Journal of Issues in Nursing. 2007;12(3).
30. Soumerai SB, Ceccarelli R, Koppel R. False dichotomies and health policy research designs: randomized trials are not always the answer. J Gen Intern Med. 2017;32(2):204-209. https://doi.org/10.1007/s11606-016-3841-9.
31. Growdon ME, Shorr RI, Inouye SK. The tension between promoting mobility and preventing falls in the hospital. JAMA Intern Med. 2017;177(6):759-760. https://doi.org/10.1001/jamainternmed.2017.0840.
32. Fehlberg EA, Lucero RJ, Weaver MT, et al. Impact of the CMS no-pay policy on hospital-acquired fall prevention related practice patterns. Innov Aging. 2017;1(3):igx036-igx036. https://doi.org/10.1093/geroni/igx036.
Accidental falls are among the most common incidents reported in hospitals, complicating approximately 2% of hospital stays.1-3 Approximately 25% of falls in hospitalized patients result in injury, and 2% involve fractures.4 Substantial costs are associated with falls, including patient care costs associated with increased length of stay and liability.5-7
Beginning October 1, 2008, the Centers for Medicare & Medicaid Services (CMS) stopped reimbursing hospitals for the additional care associated with eight hospital-acquired conditions (HACs), including serious fall-related injury, which were believed to be “reasonably preventable.”8,9 Before this change, hospitals recovered the costs of these “never events” by assigning a higher level MS-DRG (Medicare Severity Diagnosis-Related Group) code for patients experiencing such an event. This is no longer allowed under the revised CMS Prospective Payment System rules.
Although the financial penalty for iatrogenic injury was modest, the payment change placed pressure on hospital staff to decrease falls, and some nurses reported changing practice to be more restrictive of patient mobility.10 Increased use of physical restraints is a potential unintended consequence of this rule change.11 Restraints are known to cause agitation, delirium, decubiti, deconditioning, strangulation, and death.12 Not surprisingly, use of restraints is discouraged in hospitals and is a CMS quality of care indicator.13,14 Although there is no evidence that restraint use prevents patients from falling,15,16 there is a perception among both health professionals and patients that restraints reduce the risk of falling, and they are often used as a “last resort” method of fall prevention.17-19
The aim of this longitudinal study was to determine whether this payment change was associated with changes in short-, intermediate-, and long-term rates of falls, injurious falls, and physical restraint use in acute care hospitals. The CMS has included fall-related hip fracture in newer value-based purchasing programs by adding Patient Safety Indictor (PSI) 90 to both the HACs Reduction Program (HACRP)20 and the Hospital Value-Based Purchasing (VBP)21 in FY2015. However, the HACs Initiative remains the only Medicare value program that directly penalizes all injurious inpatient falls.
METHODS
Study Units
As previously described,22 the National Database of Nursing Quality Indicators (NDNQI) is a data collection project initiated by the American Nurses Association (ANA). The NDNQI provides national comparative data at the unit and facility levels on nursing-sensitive indicators endorsed by the National Quality Forum. More than 2,000 hospitals voluntarily participate in the NDNQI, including virtually all ANA Magnet-recognized hospitals, and more than 90% of nursing units participate in the fall measures (NDNQI, personal communication). At the start of study data collection, the project was administered by the School of Nursing at the University of Kansas Medical Center. In 2014, the ownership of the NDNQI was transferred from the ANA to Press Ganey Associates, Inc. In addition to standardized data on unit, facility, and staffing characteristics, the NDNQI member hospitals can elect to submit monthly data on falls and quarterly data on physical restraint use prevalence.
We examined the data collected from adult medical, medical-surgical, and surgical units in United States acute care hospitals that elected to participate in the fall and physical restraint use data collection within the NDNQI for the 27 months before and the 87 months after the implementation of the CMS rule change. Eligible units contributed at least one fall and physical restraint use data point during both the 27 months preceding October 1, 2008, and the 87 months immediately after. The Institutional Review Board at the University of Kansas Medical Center reviewed and approved the study before its implementation.
Endpoints
Fall Events
The NDNQI defines a patient fall as an unplanned descent to the floor, regardless of whether the fall results in injury and regardless of whether the patient was assisted to the floor by a member of the hospital staff. Events in which a patient lands on a surface where one would not expect to find a patient (eg, on a mat next to a low bed) are also counted as falls.
Using internal data sources (eg, medical records, incident reports), participating hospitals report the number of inpatient falls each month to the NDNQI. We analyzed the falls data for the period July 1, 2006, through December 31, 2015. Thus, each unit could contribute 114 months (27 months before the rule change and 87 months after the rule change) of falls data.
Hospitals classify the injury level of each fall as none, minor (resulting in bruise, pain, abrasion, wound cleaning, or limb elevation, or in the use of ice, dressing, or topical medication), moderate (resulting in suturing, splinting, muscle or joint strain, or application of steri-strips or skin glue), major (resulting in surgery, casting, traction, any type of fracture, consultation for neurological or internal injury, or receipt of blood products for patients with coagulopathy), or death (resulting from injuries sustained from falling). For this study, a fall resulting in any injury (including minor) was considered as an injurious fall. The NDNQI data have been validated for falls and fall injury.23,24
Based on patient counts from unit censuses and/or internal data on actual patient hours on the unit, hospitals also report to the NDNQI the monthly number of patient days for each unit for which falls data are reported. The NDNQI uses these data to calculate each unit’s total and injurious fall rate per 1,000 patient days.
Physical Restraint Use
The NDNQI follows the CMS definition of restraint, which is “any manual method, physical or mechanical device, material, or equipment that immobilizes or reduces the ability of a patient to move his or her arms, legs, body, or head freely”.13 The NDNQI restraint use data are collected quarterly. Participating hospitals choose one day each quarter to conduct a restraint use prevalence survey on participating units. On the selected day, designated RNs within these hospitals visually assess each patient on the unit for restraint use. Based on this survey, hospitals report to the NDNQI the total count of patients surveyed and whether each was restrained. For restrained patients, hospitals also report the type of restraint as limb, vest, or other (eg, four side rails, net beds, mitts not attached to the bed).
We analyzed the restraint use data for the period October 1, 2006, through December 31, 2015. Thus, 37 quarters of data (eight pre- and 29 postrule change) were available. For this study, we computed for each unit the quarterly proportion of surveyed patients who were physically restrained by dividing the total count of restrained patients (regardless of the type of restraint) on the day of the survey by the total count of surveyed patients.
Covariates
Unit- and facility-level covariates were included in several model specifications to determine whether patient or facility characteristics affected the results. The unit-level covariates included the type of nursing unit (medical, medical and surgical, or surgical), monthly rates of total nursing hours per patient day, and nursing skill mix (percent registered nurses/total nursing personnel). The three facility-level variables included urban–rural location (defined as metropolitan [located in an area containing an urban core with a population of at least 50,000], micropolitan [located in an area containing an urban core with a population of 10,000-49,999], or neither), bed size (<300 beds or ≥300 beds), and teaching status (academic health center, major teaching hospital, or nonteaching hospital).
Because larger, academically affiliated hospitals are overrepresented in the NDNQI, we conducted stratified analyses of these variables to explore how change in the rates of falls and restraint use in the entire sample might differ between hospitals according to bed size (<300 beds, ≥300 beds) and teaching status (nonteaching versus teaching and academic health center).
Statistical Methods
We compared the mean annual rates of change in falls, injurious falls, and physical restraint use prevalence during the two years before the HACs Initiative went into effect (October 2006-September 2008) with the mean annual rates of change following the implementation of the payment rule. Short-term (one-year) change was the slope from October 2008 to September 2009, intermediate-term (four-year) change was the slope from October 2008 to September 2012, and long-term (seven-year) change was the slope from October 2008 to September 2015.
Monthly rates of falls and injurious falls over the 114-month period were modeled using negative binomial models with a random intercept to account for heterogeneity between units. Each base mean model included the preimplementation intercept and slope (over time), the postimplementation intercept, and slope (both linear and quadratic). We also fit the models that included the terms in the base model and facility-level covariates, unit-level covariates, both individually and combined. All models included terms for seasonality.
Quarterly prevalence rates of restraint use over the 37 quarters were modeled using beta-binomial models with a random intercept to account for heterogeneity between units. Each base mean model included the preimplementation intercept and slope (over time), the postimplementation intercept, and slope (both linear and quadratic). Similar to the one specified for falls, models were also fitted that included facility- and unit-level covariates as described above.
To adjust for multiple comparisons of the three postimplementation slopes, all confidence intervals were Bonferroni corrected.
RESULTS
Nursing Units
We included nursing units with one or more months of falls data and one or more quarters of restraint use data before and after the rule change. Of the 11,117 nursing units that submitted data to the NDNQI, 2,862 units (983 medical, 1,219 medical-surgical, and 660 surgical) with the requisite demographic, falls, and restraint use data were considered for inclusion in the study. The characteristics of the nursing units (ie, the type of unit, total nursing hours per patient day, and nursing skill mix) and hospitals (ie, location, bed size, teaching status) included in the study were similar to those of the overall NDNQI member units.
Baseline Characteristics
In the first study month (July 2006), 1,941 sample nursing units reported 5,101 falls during 1,401,652 patient-days of observation. Of these, 1,502 (29%) resulted in injury (1,281 minor, 144 moderate, 75 major, and two deaths). Across falls, the median (interquartile range [IQR]) patient age was 70 (55-80) years, with males accounting for 51% of falls. Most of the falls, 4,328 (85%), were documented as unassisted. A total of 209 (4%) falls occurred while physical restraints were in use.
In the first quarterly restraint use prevalence survey (October 2006), the 829 participating nursing units surveyed 19,979 patients (median [IQR] = 23 [20-23] patients per nursing unit). The median (IQR) age was 66 (51-78) years, and 54% of them were females. At the time of the survey, restraints were in use for 326 (1.6%) patients. Restrained patients were older than unrestrained patients (median age: 78 vs 65 years) and more likely to be male (56% vs 46%). Limb restraints were used for 139 patients, vest restraints for 66, both limb and vest restraints for 24, and other restraint types were used for 113 patients (including 11 in limb restraints and 5 in limb and vest restraints).
Change in Endpoints after Implementation of the HACs Initiative
Stratified Analysis
At baseline, fall rates and restraint use prevalence were slightly higher, whereas the rate of injurious falls was slightly lower, among teaching and academic medical centers compared to those in nonteaching hospitals. Declines in falls rate and restraint use prevalence were higher in teaching hospitals than in nonteaching hospitals (data not included).
CONCLUSIONS
We examined the rates of falls and fall injuries among 2,862 hospital units before and after the implementation of the HACs Initiative. Implementation of the CMS payment change was associated with a modest improvement in the rate of decrease for falls; a statistically significant effect on the rate of decrease for injurious falls was detectable only at seven years postchange. Fall reductions were the greatest among teaching and larger hospitals. These findings are consistent with our previous analysis of NDNQI data that found no short-term effect of the rule change on the rate of injurious falls.25
We found no evidence indicating that restraint use prevalence increased because of this payment change. Physical -restraint use prevalence showed a rapidly decreasing trend before 2008, and although the rate of decline was attenuated seven years after the rule change, the overall physical restraint use prevalence in these units in 2015 was less than half of that in 2006. Unlike falls, the steepest declines in restraint use prevalence occurred in smaller hospitals.
The CMS decision to include falls with injury among the “reasonably preventable” HACs was controversial.11 Inpatient falls are largely attributable to individual patient risk factors and are unusual among HACs in the extent to which patient behavior plays a role in their occurrence. Although hospital fall prevention guidelines have been published, only a few controlled trials have been conducted, with little evidence supporting the recommendations.1,26 A quantitative review found no evidence of benefit in published hospital fall prevention studies using concurrent controls (internal rate of return = 0.92; 95% CI: 0.65-1.30),26 and a recent, well-executed, cluster randomized trial of multifactorial fall prevention interventions found no change in fall rates compared with controls.27 Current hospital fall prevention guidelines are limited to unproven and time-consuming nursing-level (eg, toileting schedules and use of alarms) or organizational-level strategies (eg, changing staff attitudes regarding the inevitability of falls or “leadership support”).1,28
Despite the large sample size and the use of nurse-reported data that include patient falls from all age groups and not subject to bias due to the regulation itself (eg, ICD coding changes), our findings should be interpreted taking into account several limitations.
First, hospitals participating in the NDNQI self-select to participate and are larger and disproportionately urban compared with nonparticipating hospitals.29 Although our findings were unchanged when hospital-level covariates were included in modeling, analyses stratified by teaching status and bed size demonstrated important differences. Larger teaching hospitals experienced greater fall reductions, whereas restraint use prevalence decreased more rapidly in smaller hospitals.
Second, the absence of a control group prevents us from conclusively attributing changes in falls rate and restraint use prevalence to the 2008 CMS payment change.30 Our findings may have been influenced by other policy changes. For example, in October 2014, the CMS implemented the Hospital-Acquired Condition Reduction Program (HACRP)20 and the Hospital Value-Based Purchasing (VBP)21 Program. Under these programs, falls with hip fractures were an indicator that could alter hospital payment.
Third, we did not ascertain the use of all available fall prevention measures such as companions, bed rails, very low beds, bed alarms, and restricted activity.31 Nor could the study address changes in patient functional status or discharge location. In a before- and after-study of four hospitals in a single hospital system, we found that bed alarm use increased, restraint orders decreased, and the use of room change or sitters remained stable after the implementation of the CMS payment.32
Nevertheless, we believe that these findings are consistent with the hypothesis that the HACs Initiative increased the cost of patient falls to hospitals, and, in response, some hospitals were able to modestly reduce the rate of falls. We found no evidence that physical restraint use prevalence increased.
In summary, our findings suggest modest impact of the HACs Initiative on falls and injurious falls, but no unintended impact on restraint use. These results highlight the importance of ensuring that pay-for-performance initiatives target outcomes where there are evidence-based approaches to prevention. The creation or identification of prevention tools and guidelines does not make an outcome preventable. Despite interval improvement in these self-selected hospital units in fall rates and physical restraint use prevalence, falls remain a difficult patient safety problem for hospitals, and further research is required to develop cost-effective, generalizable strategies for their prevention.
Accidental falls are among the most common incidents reported in hospitals, complicating approximately 2% of hospital stays.1-3 Approximately 25% of falls in hospitalized patients result in injury, and 2% involve fractures.4 Substantial costs are associated with falls, including patient care costs associated with increased length of stay and liability.5-7
Beginning October 1, 2008, the Centers for Medicare & Medicaid Services (CMS) stopped reimbursing hospitals for the additional care associated with eight hospital-acquired conditions (HACs), including serious fall-related injury, which were believed to be “reasonably preventable.”8,9 Before this change, hospitals recovered the costs of these “never events” by assigning a higher level MS-DRG (Medicare Severity Diagnosis-Related Group) code for patients experiencing such an event. This is no longer allowed under the revised CMS Prospective Payment System rules.
Although the financial penalty for iatrogenic injury was modest, the payment change placed pressure on hospital staff to decrease falls, and some nurses reported changing practice to be more restrictive of patient mobility.10 Increased use of physical restraints is a potential unintended consequence of this rule change.11 Restraints are known to cause agitation, delirium, decubiti, deconditioning, strangulation, and death.12 Not surprisingly, use of restraints is discouraged in hospitals and is a CMS quality of care indicator.13,14 Although there is no evidence that restraint use prevents patients from falling,15,16 there is a perception among both health professionals and patients that restraints reduce the risk of falling, and they are often used as a “last resort” method of fall prevention.17-19
The aim of this longitudinal study was to determine whether this payment change was associated with changes in short-, intermediate-, and long-term rates of falls, injurious falls, and physical restraint use in acute care hospitals. The CMS has included fall-related hip fracture in newer value-based purchasing programs by adding Patient Safety Indictor (PSI) 90 to both the HACs Reduction Program (HACRP)20 and the Hospital Value-Based Purchasing (VBP)21 in FY2015. However, the HACs Initiative remains the only Medicare value program that directly penalizes all injurious inpatient falls.
METHODS
Study Units
As previously described,22 the National Database of Nursing Quality Indicators (NDNQI) is a data collection project initiated by the American Nurses Association (ANA). The NDNQI provides national comparative data at the unit and facility levels on nursing-sensitive indicators endorsed by the National Quality Forum. More than 2,000 hospitals voluntarily participate in the NDNQI, including virtually all ANA Magnet-recognized hospitals, and more than 90% of nursing units participate in the fall measures (NDNQI, personal communication). At the start of study data collection, the project was administered by the School of Nursing at the University of Kansas Medical Center. In 2014, the ownership of the NDNQI was transferred from the ANA to Press Ganey Associates, Inc. In addition to standardized data on unit, facility, and staffing characteristics, the NDNQI member hospitals can elect to submit monthly data on falls and quarterly data on physical restraint use prevalence.
We examined the data collected from adult medical, medical-surgical, and surgical units in United States acute care hospitals that elected to participate in the fall and physical restraint use data collection within the NDNQI for the 27 months before and the 87 months after the implementation of the CMS rule change. Eligible units contributed at least one fall and physical restraint use data point during both the 27 months preceding October 1, 2008, and the 87 months immediately after. The Institutional Review Board at the University of Kansas Medical Center reviewed and approved the study before its implementation.
Endpoints
Fall Events
The NDNQI defines a patient fall as an unplanned descent to the floor, regardless of whether the fall results in injury and regardless of whether the patient was assisted to the floor by a member of the hospital staff. Events in which a patient lands on a surface where one would not expect to find a patient (eg, on a mat next to a low bed) are also counted as falls.
Using internal data sources (eg, medical records, incident reports), participating hospitals report the number of inpatient falls each month to the NDNQI. We analyzed the falls data for the period July 1, 2006, through December 31, 2015. Thus, each unit could contribute 114 months (27 months before the rule change and 87 months after the rule change) of falls data.
Hospitals classify the injury level of each fall as none, minor (resulting in bruise, pain, abrasion, wound cleaning, or limb elevation, or in the use of ice, dressing, or topical medication), moderate (resulting in suturing, splinting, muscle or joint strain, or application of steri-strips or skin glue), major (resulting in surgery, casting, traction, any type of fracture, consultation for neurological or internal injury, or receipt of blood products for patients with coagulopathy), or death (resulting from injuries sustained from falling). For this study, a fall resulting in any injury (including minor) was considered as an injurious fall. The NDNQI data have been validated for falls and fall injury.23,24
Based on patient counts from unit censuses and/or internal data on actual patient hours on the unit, hospitals also report to the NDNQI the monthly number of patient days for each unit for which falls data are reported. The NDNQI uses these data to calculate each unit’s total and injurious fall rate per 1,000 patient days.
Physical Restraint Use
The NDNQI follows the CMS definition of restraint, which is “any manual method, physical or mechanical device, material, or equipment that immobilizes or reduces the ability of a patient to move his or her arms, legs, body, or head freely”.13 The NDNQI restraint use data are collected quarterly. Participating hospitals choose one day each quarter to conduct a restraint use prevalence survey on participating units. On the selected day, designated RNs within these hospitals visually assess each patient on the unit for restraint use. Based on this survey, hospitals report to the NDNQI the total count of patients surveyed and whether each was restrained. For restrained patients, hospitals also report the type of restraint as limb, vest, or other (eg, four side rails, net beds, mitts not attached to the bed).
We analyzed the restraint use data for the period October 1, 2006, through December 31, 2015. Thus, 37 quarters of data (eight pre- and 29 postrule change) were available. For this study, we computed for each unit the quarterly proportion of surveyed patients who were physically restrained by dividing the total count of restrained patients (regardless of the type of restraint) on the day of the survey by the total count of surveyed patients.
Covariates
Unit- and facility-level covariates were included in several model specifications to determine whether patient or facility characteristics affected the results. The unit-level covariates included the type of nursing unit (medical, medical and surgical, or surgical), monthly rates of total nursing hours per patient day, and nursing skill mix (percent registered nurses/total nursing personnel). The three facility-level variables included urban–rural location (defined as metropolitan [located in an area containing an urban core with a population of at least 50,000], micropolitan [located in an area containing an urban core with a population of 10,000-49,999], or neither), bed size (<300 beds or ≥300 beds), and teaching status (academic health center, major teaching hospital, or nonteaching hospital).
Because larger, academically affiliated hospitals are overrepresented in the NDNQI, we conducted stratified analyses of these variables to explore how change in the rates of falls and restraint use in the entire sample might differ between hospitals according to bed size (<300 beds, ≥300 beds) and teaching status (nonteaching versus teaching and academic health center).
Statistical Methods
We compared the mean annual rates of change in falls, injurious falls, and physical restraint use prevalence during the two years before the HACs Initiative went into effect (October 2006-September 2008) with the mean annual rates of change following the implementation of the payment rule. Short-term (one-year) change was the slope from October 2008 to September 2009, intermediate-term (four-year) change was the slope from October 2008 to September 2012, and long-term (seven-year) change was the slope from October 2008 to September 2015.
Monthly rates of falls and injurious falls over the 114-month period were modeled using negative binomial models with a random intercept to account for heterogeneity between units. Each base mean model included the preimplementation intercept and slope (over time), the postimplementation intercept, and slope (both linear and quadratic). We also fit the models that included the terms in the base model and facility-level covariates, unit-level covariates, both individually and combined. All models included terms for seasonality.
Quarterly prevalence rates of restraint use over the 37 quarters were modeled using beta-binomial models with a random intercept to account for heterogeneity between units. Each base mean model included the preimplementation intercept and slope (over time), the postimplementation intercept, and slope (both linear and quadratic). Similar to the one specified for falls, models were also fitted that included facility- and unit-level covariates as described above.
To adjust for multiple comparisons of the three postimplementation slopes, all confidence intervals were Bonferroni corrected.
RESULTS
Nursing Units
We included nursing units with one or more months of falls data and one or more quarters of restraint use data before and after the rule change. Of the 11,117 nursing units that submitted data to the NDNQI, 2,862 units (983 medical, 1,219 medical-surgical, and 660 surgical) with the requisite demographic, falls, and restraint use data were considered for inclusion in the study. The characteristics of the nursing units (ie, the type of unit, total nursing hours per patient day, and nursing skill mix) and hospitals (ie, location, bed size, teaching status) included in the study were similar to those of the overall NDNQI member units.
Baseline Characteristics
In the first study month (July 2006), 1,941 sample nursing units reported 5,101 falls during 1,401,652 patient-days of observation. Of these, 1,502 (29%) resulted in injury (1,281 minor, 144 moderate, 75 major, and two deaths). Across falls, the median (interquartile range [IQR]) patient age was 70 (55-80) years, with males accounting for 51% of falls. Most of the falls, 4,328 (85%), were documented as unassisted. A total of 209 (4%) falls occurred while physical restraints were in use.
In the first quarterly restraint use prevalence survey (October 2006), the 829 participating nursing units surveyed 19,979 patients (median [IQR] = 23 [20-23] patients per nursing unit). The median (IQR) age was 66 (51-78) years, and 54% of them were females. At the time of the survey, restraints were in use for 326 (1.6%) patients. Restrained patients were older than unrestrained patients (median age: 78 vs 65 years) and more likely to be male (56% vs 46%). Limb restraints were used for 139 patients, vest restraints for 66, both limb and vest restraints for 24, and other restraint types were used for 113 patients (including 11 in limb restraints and 5 in limb and vest restraints).
Change in Endpoints after Implementation of the HACs Initiative
Stratified Analysis
At baseline, fall rates and restraint use prevalence were slightly higher, whereas the rate of injurious falls was slightly lower, among teaching and academic medical centers compared to those in nonteaching hospitals. Declines in falls rate and restraint use prevalence were higher in teaching hospitals than in nonteaching hospitals (data not included).
CONCLUSIONS
We examined the rates of falls and fall injuries among 2,862 hospital units before and after the implementation of the HACs Initiative. Implementation of the CMS payment change was associated with a modest improvement in the rate of decrease for falls; a statistically significant effect on the rate of decrease for injurious falls was detectable only at seven years postchange. Fall reductions were the greatest among teaching and larger hospitals. These findings are consistent with our previous analysis of NDNQI data that found no short-term effect of the rule change on the rate of injurious falls.25
We found no evidence indicating that restraint use prevalence increased because of this payment change. Physical -restraint use prevalence showed a rapidly decreasing trend before 2008, and although the rate of decline was attenuated seven years after the rule change, the overall physical restraint use prevalence in these units in 2015 was less than half of that in 2006. Unlike falls, the steepest declines in restraint use prevalence occurred in smaller hospitals.
The CMS decision to include falls with injury among the “reasonably preventable” HACs was controversial.11 Inpatient falls are largely attributable to individual patient risk factors and are unusual among HACs in the extent to which patient behavior plays a role in their occurrence. Although hospital fall prevention guidelines have been published, only a few controlled trials have been conducted, with little evidence supporting the recommendations.1,26 A quantitative review found no evidence of benefit in published hospital fall prevention studies using concurrent controls (internal rate of return = 0.92; 95% CI: 0.65-1.30),26 and a recent, well-executed, cluster randomized trial of multifactorial fall prevention interventions found no change in fall rates compared with controls.27 Current hospital fall prevention guidelines are limited to unproven and time-consuming nursing-level (eg, toileting schedules and use of alarms) or organizational-level strategies (eg, changing staff attitudes regarding the inevitability of falls or “leadership support”).1,28
Despite the large sample size and the use of nurse-reported data that include patient falls from all age groups and not subject to bias due to the regulation itself (eg, ICD coding changes), our findings should be interpreted taking into account several limitations.
First, hospitals participating in the NDNQI self-select to participate and are larger and disproportionately urban compared with nonparticipating hospitals.29 Although our findings were unchanged when hospital-level covariates were included in modeling, analyses stratified by teaching status and bed size demonstrated important differences. Larger teaching hospitals experienced greater fall reductions, whereas restraint use prevalence decreased more rapidly in smaller hospitals.
Second, the absence of a control group prevents us from conclusively attributing changes in falls rate and restraint use prevalence to the 2008 CMS payment change.30 Our findings may have been influenced by other policy changes. For example, in October 2014, the CMS implemented the Hospital-Acquired Condition Reduction Program (HACRP)20 and the Hospital Value-Based Purchasing (VBP)21 Program. Under these programs, falls with hip fractures were an indicator that could alter hospital payment.
Third, we did not ascertain the use of all available fall prevention measures such as companions, bed rails, very low beds, bed alarms, and restricted activity.31 Nor could the study address changes in patient functional status or discharge location. In a before- and after-study of four hospitals in a single hospital system, we found that bed alarm use increased, restraint orders decreased, and the use of room change or sitters remained stable after the implementation of the CMS payment.32
Nevertheless, we believe that these findings are consistent with the hypothesis that the HACs Initiative increased the cost of patient falls to hospitals, and, in response, some hospitals were able to modestly reduce the rate of falls. We found no evidence that physical restraint use prevalence increased.
In summary, our findings suggest modest impact of the HACs Initiative on falls and injurious falls, but no unintended impact on restraint use. These results highlight the importance of ensuring that pay-for-performance initiatives target outcomes where there are evidence-based approaches to prevention. The creation or identification of prevention tools and guidelines does not make an outcome preventable. Despite interval improvement in these self-selected hospital units in fall rates and physical restraint use prevalence, falls remain a difficult patient safety problem for hospitals, and further research is required to develop cost-effective, generalizable strategies for their prevention.
1. Miake-Lye IM, Hempel S, Ganz DA, Shekelle PG. Inpatient fall prevention programs as a patient safety strategy: a systematic review. Ann Intern Med. 2013;158(5):390-396. https://doi.org/10.7326/0003-4819-158-5-201303051-00005
2. Healey F, Darowski A. Older patients and falls in hospital. Clin Risk. 2012;18(5):170-176. https://doi.org/10.1258/cr.2012.012020.
3. Oliver D, Healey F, Haines TP. Preventing falls and fall-related injuries in hospitals. Clin Geriatr Med. 2010;26(4):645-692. https://doi.org/10.1016/j.cger.2010.06.005.
4. Currie L. Fall and Injury Prevention. In: Hughes RG, ed. Patient safety and quality: an evidence-based handbook for nurses (Prepared with support from the Robert Wood Johnson Foundation). AHRQ Publication NO.08-0043. Rockville, MD: Agency for Healthcare Research and Quality; 2008.
5. Wong CA, Recktenwald AJ, Jones ML, Waterman BM, Bollini ML, Dunagan WC. The cost of serious fall-related injuries at three Midwestern hospitals. Jt Comm J Qual Patient Saf. 2011;37(2):81-87. https://doi.org/10.1016/S1553-7250(11)37010-9.
6. Bates DW, Pruess K, Souney P, Platt R. Serious falls in hospitalized patients: correlates and resource utilization. Am J Med. 1995;99(2):137-143. https://doi.org/10.1016/s0002-9343(99)80133-8.
7. Fiesta J. Liability for falls. Nurs Manage. 1998;29(3):24-26. https://doi.org/10.1097/00006247-199803000-00007.
8. Rosenthal MB. Nonpayment for performance? Medicare’s new reimbursement rule. N Engl J Med. 2007;357(16):1573-1575. https://doi.org/10.1056/NEJMp078184.
9. Department of Health and Human Services, Centers for Medicare and Medicaid Services. 42 CFR Parts 411, 412, 413, and 489. Medicare program; proposed changes to the hospital inpatient prospective payment systems and fiscal year. 2008 rates; final rule. Federal Register. 2007;72(62):47130-47178.
10. King B, Pecanac K, Krupp A, Liebzeit D, Mahoney J. Impact of fall prevention on nurses and care of fall risk patients. Gerontologist. 2018;58(2):331-340. https://doi.org/10.1093/geront/gnw156.
11. Inouye SK, Brown CJ, Tinetti ME. Medicare nonpayment, hospital falls, and unintended consequences. N Engl J Med. 2009;360(23):2390-2393. https://doi.org/10.1056/NEJMp0900963.
12. Rakhmatullina M, Taub A, Jacob T. Morbidity and mortality associated with the utilization of restraints : a review of literature. Psychiatr Q. 2013;84(4):499-512. https://doi.org/10.1007/s11126-013-9262-6.
13. State Operations Manual Appendix A - Survey Protocol, Regulations and Interpretive Guidelines for Hospitals. (Revision 116, 06-06-14). http://cms.hhs.gov/Regulations-and-Guidance/Guidance/Manuals/downloads/som107ap_a_hospitals.pdf. Accessed October 26, 2014.
14. Nursing Sensitive Measures. NQF # 0203, Restraint prevalence (vest and limb only). Status: Endorsed on: August 05, 2009; Steward(s): The Joint Commission. Washington, D.C.: National Quality Forum; 2009.
15. Kopke S, Muhlhauser I, Gerlach A, et al. Effect of a guideline-based multicomponent intervention on use of physical restraints in nursing homes: a randomized controlled trial. JAMA. 2012;307(20):2177-2184. https://doi.org/10.1001/jama.2012.4517.
16. Enns E, Rhemtulla R, Ewa V, Fruetel K, Holroyd-Leduc JM. A controlled quality improvement trial to reduce the use of physical restraints in older hospitalized adults. J Am Geriatr Soc. 2014;62(3):541-545. https://doi.org/10.1111/jgs.12710.
17. Heinze C, Dassen T, Grittner U. Use of physical restraints in nursing homes and hospitals and related factors: a cross-sectional study. J Clin Nurs. 2012;21(7-8):1033-1040. https://doi.org/10.1111/j.1365-2702.2011.03931.x.
18. Minnick AF, Fogg L, Mion LC, Catrambone C, Johnson ME. Resource clusters and variation in physical restraint use. J Nurs Scholarsh. 2007;39(4):363-370. https://doi.org/10.1111/j.1547-5069.2007.00194.x.
19. Vassallo M, Wilkinson C, Stockdale R, Malik N, Baker R, Allen S. Attitudes to restraint for the prevention of falls in hospital. Gerontology. 2005;51(1):66-70. https://doi.org/10.1159/000081438.
20. Centers for Medicare & Medicaid Services. Hospital-Acquired Condition Reduction Program (HACRP). https://www.cms.gov/Medicare/Medicare-Fee-for-Service-Payment/AcuteInpatientPPS/HAC-Reduction-Program.html. Accessed September 9. 2018.
21. Centers for Medicare & Medicaid Services. The Hospital Value-Based Purchasing (VBP) Program. https://www.cms.gov/Medicare/Quality-Initiatives-Patient-Assessment-Instruments/Value-Based-Programs/HVBP/Hospital-Value-Based-Purchasing.html. Accessed September 9, 2018.
22. Dunton NE. Take a cue from the NDNQI. Nurs Manage. 2008;39(4):20, 22-23. https://doi.org/10.1097/01.NUMA.0000316054.35317.bf.
23. Garrard L, Boyle DK, Simon M, Dunton N, Gajewski B. Reliability and Validity of the NDNQI(R) Injury Falls Measure. West J Nurs Res. 2016;38(1):111-128. https://doi.org/10.1177/0193945914542851
24. Garrard L, Boyle DK, Simon M, Dunton N, Gajewski B. Reliability and validity of the NDNQI(R) injury falls measure. West J Nurs Res. 2016;38(1):111-128. https://doi.org/10.1177/0193945914542851.
25. Waters TM, Daniels MJ, Bazzoli GJ, et al. Effect of Medicare’s nonpayment for hospital-acquired conditions: lessons for future policy. JAMA Intern Med. 2015;175(3):347-354.
26. Hempel S, Newberry S, Wang Z, et al. Hospital fall prevention: a systematic review of implementation, components, adherence, and effectiveness. J Am Geriatr Soc. 2013;61(4):483-494. https://doi.org/10.1001/jamainternmed.2014.5486.
27. Barker AL, Morello RT, Wolfe R, et al. 6-PACK programme to decrease fall injuries in acute hospitals: cluster randomised controlled trial. BMJ. 2016;352:h6781. https://doi.org/10.1136/bmj.h6781.
28. Goldsack J, Bergey M, Mascioli S, Cunningham J. Hourly rounding and patient falls: what factors boost success? Nursing. 2015;45(2):25-30. https://doi.org/10.1097/01.NURSE.0000459798.79840.95.
29. Montalvo I. The National Database of Nursing Quality Indicators (NDNQI). Online Journal of Issues in Nursing. 2007;12(3).
30. Soumerai SB, Ceccarelli R, Koppel R. False dichotomies and health policy research designs: randomized trials are not always the answer. J Gen Intern Med. 2017;32(2):204-209. https://doi.org/10.1007/s11606-016-3841-9.
31. Growdon ME, Shorr RI, Inouye SK. The tension between promoting mobility and preventing falls in the hospital. JAMA Intern Med. 2017;177(6):759-760. https://doi.org/10.1001/jamainternmed.2017.0840.
32. Fehlberg EA, Lucero RJ, Weaver MT, et al. Impact of the CMS no-pay policy on hospital-acquired fall prevention related practice patterns. Innov Aging. 2017;1(3):igx036-igx036. https://doi.org/10.1093/geroni/igx036.
1. Miake-Lye IM, Hempel S, Ganz DA, Shekelle PG. Inpatient fall prevention programs as a patient safety strategy: a systematic review. Ann Intern Med. 2013;158(5):390-396. https://doi.org/10.7326/0003-4819-158-5-201303051-00005
2. Healey F, Darowski A. Older patients and falls in hospital. Clin Risk. 2012;18(5):170-176. https://doi.org/10.1258/cr.2012.012020.
3. Oliver D, Healey F, Haines TP. Preventing falls and fall-related injuries in hospitals. Clin Geriatr Med. 2010;26(4):645-692. https://doi.org/10.1016/j.cger.2010.06.005.
4. Currie L. Fall and Injury Prevention. In: Hughes RG, ed. Patient safety and quality: an evidence-based handbook for nurses (Prepared with support from the Robert Wood Johnson Foundation). AHRQ Publication NO.08-0043. Rockville, MD: Agency for Healthcare Research and Quality; 2008.
5. Wong CA, Recktenwald AJ, Jones ML, Waterman BM, Bollini ML, Dunagan WC. The cost of serious fall-related injuries at three Midwestern hospitals. Jt Comm J Qual Patient Saf. 2011;37(2):81-87. https://doi.org/10.1016/S1553-7250(11)37010-9.
6. Bates DW, Pruess K, Souney P, Platt R. Serious falls in hospitalized patients: correlates and resource utilization. Am J Med. 1995;99(2):137-143. https://doi.org/10.1016/s0002-9343(99)80133-8.
7. Fiesta J. Liability for falls. Nurs Manage. 1998;29(3):24-26. https://doi.org/10.1097/00006247-199803000-00007.
8. Rosenthal MB. Nonpayment for performance? Medicare’s new reimbursement rule. N Engl J Med. 2007;357(16):1573-1575. https://doi.org/10.1056/NEJMp078184.
9. Department of Health and Human Services, Centers for Medicare and Medicaid Services. 42 CFR Parts 411, 412, 413, and 489. Medicare program; proposed changes to the hospital inpatient prospective payment systems and fiscal year. 2008 rates; final rule. Federal Register. 2007;72(62):47130-47178.
10. King B, Pecanac K, Krupp A, Liebzeit D, Mahoney J. Impact of fall prevention on nurses and care of fall risk patients. Gerontologist. 2018;58(2):331-340. https://doi.org/10.1093/geront/gnw156.
11. Inouye SK, Brown CJ, Tinetti ME. Medicare nonpayment, hospital falls, and unintended consequences. N Engl J Med. 2009;360(23):2390-2393. https://doi.org/10.1056/NEJMp0900963.
12. Rakhmatullina M, Taub A, Jacob T. Morbidity and mortality associated with the utilization of restraints : a review of literature. Psychiatr Q. 2013;84(4):499-512. https://doi.org/10.1007/s11126-013-9262-6.
13. State Operations Manual Appendix A - Survey Protocol, Regulations and Interpretive Guidelines for Hospitals. (Revision 116, 06-06-14). http://cms.hhs.gov/Regulations-and-Guidance/Guidance/Manuals/downloads/som107ap_a_hospitals.pdf. Accessed October 26, 2014.
14. Nursing Sensitive Measures. NQF # 0203, Restraint prevalence (vest and limb only). Status: Endorsed on: August 05, 2009; Steward(s): The Joint Commission. Washington, D.C.: National Quality Forum; 2009.
15. Kopke S, Muhlhauser I, Gerlach A, et al. Effect of a guideline-based multicomponent intervention on use of physical restraints in nursing homes: a randomized controlled trial. JAMA. 2012;307(20):2177-2184. https://doi.org/10.1001/jama.2012.4517.
16. Enns E, Rhemtulla R, Ewa V, Fruetel K, Holroyd-Leduc JM. A controlled quality improvement trial to reduce the use of physical restraints in older hospitalized adults. J Am Geriatr Soc. 2014;62(3):541-545. https://doi.org/10.1111/jgs.12710.
17. Heinze C, Dassen T, Grittner U. Use of physical restraints in nursing homes and hospitals and related factors: a cross-sectional study. J Clin Nurs. 2012;21(7-8):1033-1040. https://doi.org/10.1111/j.1365-2702.2011.03931.x.
18. Minnick AF, Fogg L, Mion LC, Catrambone C, Johnson ME. Resource clusters and variation in physical restraint use. J Nurs Scholarsh. 2007;39(4):363-370. https://doi.org/10.1111/j.1547-5069.2007.00194.x.
19. Vassallo M, Wilkinson C, Stockdale R, Malik N, Baker R, Allen S. Attitudes to restraint for the prevention of falls in hospital. Gerontology. 2005;51(1):66-70. https://doi.org/10.1159/000081438.
20. Centers for Medicare & Medicaid Services. Hospital-Acquired Condition Reduction Program (HACRP). https://www.cms.gov/Medicare/Medicare-Fee-for-Service-Payment/AcuteInpatientPPS/HAC-Reduction-Program.html. Accessed September 9. 2018.
21. Centers for Medicare & Medicaid Services. The Hospital Value-Based Purchasing (VBP) Program. https://www.cms.gov/Medicare/Quality-Initiatives-Patient-Assessment-Instruments/Value-Based-Programs/HVBP/Hospital-Value-Based-Purchasing.html. Accessed September 9, 2018.
22. Dunton NE. Take a cue from the NDNQI. Nurs Manage. 2008;39(4):20, 22-23. https://doi.org/10.1097/01.NUMA.0000316054.35317.bf.
23. Garrard L, Boyle DK, Simon M, Dunton N, Gajewski B. Reliability and Validity of the NDNQI(R) Injury Falls Measure. West J Nurs Res. 2016;38(1):111-128. https://doi.org/10.1177/0193945914542851
24. Garrard L, Boyle DK, Simon M, Dunton N, Gajewski B. Reliability and validity of the NDNQI(R) injury falls measure. West J Nurs Res. 2016;38(1):111-128. https://doi.org/10.1177/0193945914542851.
25. Waters TM, Daniels MJ, Bazzoli GJ, et al. Effect of Medicare’s nonpayment for hospital-acquired conditions: lessons for future policy. JAMA Intern Med. 2015;175(3):347-354.
26. Hempel S, Newberry S, Wang Z, et al. Hospital fall prevention: a systematic review of implementation, components, adherence, and effectiveness. J Am Geriatr Soc. 2013;61(4):483-494. https://doi.org/10.1001/jamainternmed.2014.5486.
27. Barker AL, Morello RT, Wolfe R, et al. 6-PACK programme to decrease fall injuries in acute hospitals: cluster randomised controlled trial. BMJ. 2016;352:h6781. https://doi.org/10.1136/bmj.h6781.
28. Goldsack J, Bergey M, Mascioli S, Cunningham J. Hourly rounding and patient falls: what factors boost success? Nursing. 2015;45(2):25-30. https://doi.org/10.1097/01.NURSE.0000459798.79840.95.
29. Montalvo I. The National Database of Nursing Quality Indicators (NDNQI). Online Journal of Issues in Nursing. 2007;12(3).
30. Soumerai SB, Ceccarelli R, Koppel R. False dichotomies and health policy research designs: randomized trials are not always the answer. J Gen Intern Med. 2017;32(2):204-209. https://doi.org/10.1007/s11606-016-3841-9.
31. Growdon ME, Shorr RI, Inouye SK. The tension between promoting mobility and preventing falls in the hospital. JAMA Intern Med. 2017;177(6):759-760. https://doi.org/10.1001/jamainternmed.2017.0840.
32. Fehlberg EA, Lucero RJ, Weaver MT, et al. Impact of the CMS no-pay policy on hospital-acquired fall prevention related practice patterns. Innov Aging. 2017;1(3):igx036-igx036. https://doi.org/10.1093/geroni/igx036.
© 2019 Society of Hospital Medicine
Effect of Hospital Readmission Reduction Program on Hospital Readmissions and Mortality Rates
Chronic obstructive pulmonary disease (COPD) is recognized as the third leading cause of death nationally. Globally, it has been estimated that 10% of the population has COPD; in the United States, approximately 15 million people are affected.1,2 The annual estimated cost of COPD management in the United States is approximately $50 billion, one-third of which is directly related to inpatient hospitalization for COPD exacerbation.3,4,5 The 30-day readmission rate after hospitalization for acute exacerbation of COPD (AECOPD) is approximately 21% with an approximate cost of $13 billion per year.6,7 To reduce the cost and to improve patient outcomes, the Centers for Medicare and Medicaid Services (CMS) has designed several interventions with little effect.8
In October 2012, the Affordable Care Act added section 1886(q) to the Social Security Act and established the Hospital Readmission Reduction Program (HRRP), an initiative to decrease hospitalization costs by penalizing hospitals with high 30-day readmission rates. Under this program, hospitals received up to 3% penalty for excess readmissions after the index hospitalization with acute myocardial infarction (AMI), heart failure (HF), and pneumonia.9-11 Hospitals are penalized if their annual readmission rates are significantly above the average national readmission rate. In 2014, the HRRP was extended to include AECOPD for the FY 2015.
Since the implementation of readmission penalties, data have shown a significant decrease in the 30-day readmission rates for all conditions.12,13 On the other hand, studies have suggested that, at least for some conditions, the decrease in the 30-day readmission rate is associated with higher adverse patients outcomes, including higher mortality.14,15 However, whether a decrease in readmission rates after an AECOPD hospitalization is associated with a concomitant increase in mortality has not been examined. Therefore, our objective was to examine the association of the 30-day risk-adjusted hospital readmission rate with the 30-day risk-adjusted hospital mortality rate for patients discharged with a diagnosis of AECOPD.
METHOD
Data Sources
Publicly available data from three sources were used. The all-cause 30-day risk-standardized readmission rate (RSRR) and the 30-day risk-standardized mortality rate (RSMR) of each hospital for patients with AECOPD were obtained from the Hospital Compare database; a database maintained by the CMS.16,17 In 2014, the CMS started reporting three-year running average of 30-day mortality and readmission rate data on hospitals for AECOPD hospitalizations; the data start date was July 2010.18-22 We examined data from the FY 2010-2013 to 2014-2017 cycles on readmission and mortality reported by the CMS; this included data before and after the implementation of penalties.
Hospital characteristics were also obtained from the CMS website. Hospital ownership was defined as government (owned by Federal or state), for-profit (owned by physicians or another proprietary), or nonprofit (owned by a nonprofit organization such as a church). A hospital was considered as a teaching hospital if it obtained graduate medical education funding from the CMS.
Data on local population characteristics according to ZIP codes were obtained from the 2010 decennial census and the American Community Survey five-year (2009-2013) data files available at the United States Census Bureau website.23 For each ZIP code, we obtained data on the total population, percentage of African Americans in the population, median income, poverty level, and insurance status.
We used Hospital service area (HSA) information obtained from the Dartmouth Atlas of Health Care crosswalk files to link local population characteristics to hospitals. The Dartmouth Atlas defined 3,436 HSAs by assigning the ZIP codes to the hospital area where the greatest proportion of their Medicare residents was hospitalized.24,25
Hospital Compare data and Census Bureau population data were matched to the HSAs from the Dartmouth Atlas of Healthcare data at the ZIP code level. First, the ZIP code-level data from the Census Bureau were pooled by the HSAs obtained from the Dartmouth Atlas of Healthcare, followed by matching these data by the HSAs to the Hospital Compare data. Merging data from these three sources generated a dataset that contained information about readmission and mortality rates from a particular hospital and the population characteristics of the local healthcare market or neighborhood. Our final dataset included hospitals that had readmission and mortality information available at the Hospital Compare website and were included in the crosswalk files of the Dartmouth Atlas of Healthcare.
Statistical Analysis
Data are summarized as mean and standard deviation (SD), median with interquartile range, or frequencies as appropriate. To model the dependence of observations from the same hospital over time, we used mixed linear models with random intercept and slope. A strength of this modeling approach is that it incorporates information from all hospitals even when some hospitals are missing data for some time periods. We reached our final model through stages with increasing model complexity at each stage. In the first stage, we developed an empty model without any covariates to determine the unconditional variance components so that we can partition mortality variance into between- and within-hospital components. In the second stage, we developed an unconditional growth curve model to determine the shape of time trend in mortality over time using linear and quadratic (by including squared time in the model) growth curves. In the third stage, we added baseline readmission rates (from 2010 to 2013) to the model to determine the effect of baseline readmission rate on mortality trends and also examined its interaction with time and squared time. We generated a change in the readmission rate variable by subtracting the last readmission rate from the baseline readmission rate (readmission rate in 2010-2013 − readmission rate in 2014-2017). In the fourth stage, we included this change in readmission rate into the third-stage model to examine how changes in the readmission rate affected the time trends of mortality and also examined its interaction with time and squared time. In the final model, we included the following potential confounding variables to the fourth stage model: African American percentage in the HSA, HSA median income, percentage of people living in poverty in the HSA, median age, ownership of hospital (government, for profit), teaching status (teaching vs nonteaching), and acute care hospital beds in the HSA. Within each stage, the models were compared using the Akaike information criterion (AIC) and the Bayesian information criterion (BIC), and the model with the lowest value of each was moved to the next stage of model development. All analyses were performed in Stata 14.1 for Windows (College Station, Texas).
RESULTS
Of the 3,685 acute care hospitals analyzed in the 2010-2013 data cycle for COPD, the 30-day RSRR was 20.7% (1.28), which decreased to 19.6% (1.11) in 2014-2017 (Table 1). During the same period, the 30-day all-cause RSMR increased from 7.8% (1.03) in 2010-2013 to 8.4% (1.11) in 2014-2017. The partitioning of variance showed that 57% of variation in the mortality rate over the study period was due to between-hospital differences.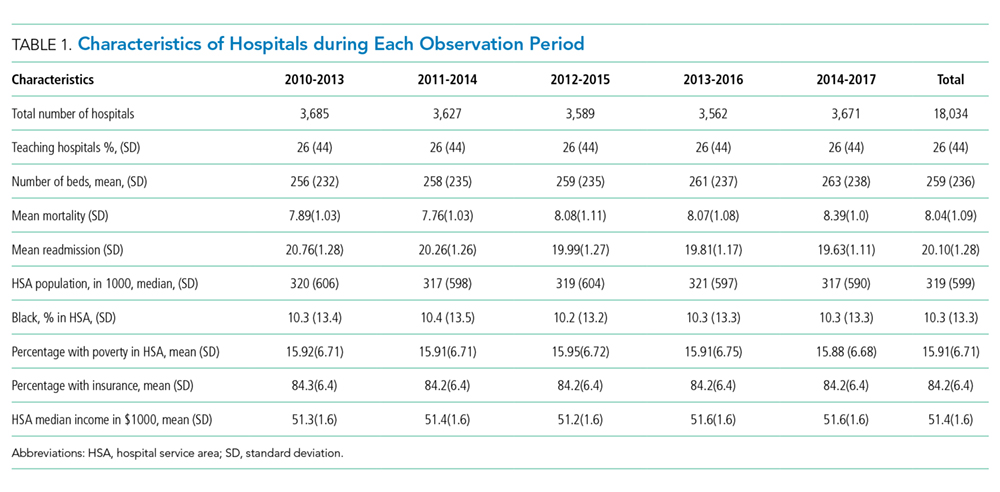
The unconditional growth model examining the linear time trend revealed a 0.13% per year (95% CI = 0.12 to 0.14; P < .0001) increase in mortality rate over the five data cycles. When the squared time variable was added to the model to examine a quadratic trend, both time and squared trend were statistically significant (Table 2) and the AIC and BIC were lower for the quadratic model. Thus, the unconditional growth curve model suggested that the mortality trend was nonlinear and the coefficients demonstrated that not only the mortality rate increased, but the rate of change in the mortality rate was also increasing during the study period.
When we added the baseline readmission rate to the abovementioned quadratic growth model, we found an inverse association; each 1% increase in baseline readmission rate was associated with 0.03% (95% CI = −0.05 to −0.005; P = .02) decrease in mortality rate. These findings suggest that hospitals with higher baseline readmission rates also had lower mortality rates. To examine whether the effect of baseline readmission rate on mortality varied over time, we included the interaction term with time in the model and then added the interaction term with squared time. As the AIC and BIC were the lowest for the model with interaction between time and baseline readmission (and not when interaction between squared time and baseline readmission were included), we accepted this model. In this model, although there was no difference in mortality according to readmissions at baseline, each 1% increase in baseline readmission rate was associated with a smaller increase in mortality rate by 0.015% (95% CI = −0.02 to −0.01; P < .0001; Table 2 and Figure 1). These findings suggest that hospitals with higher readmission rates at baseline had a smaller increase in mortality rate during the study period than those with lower readmission rates.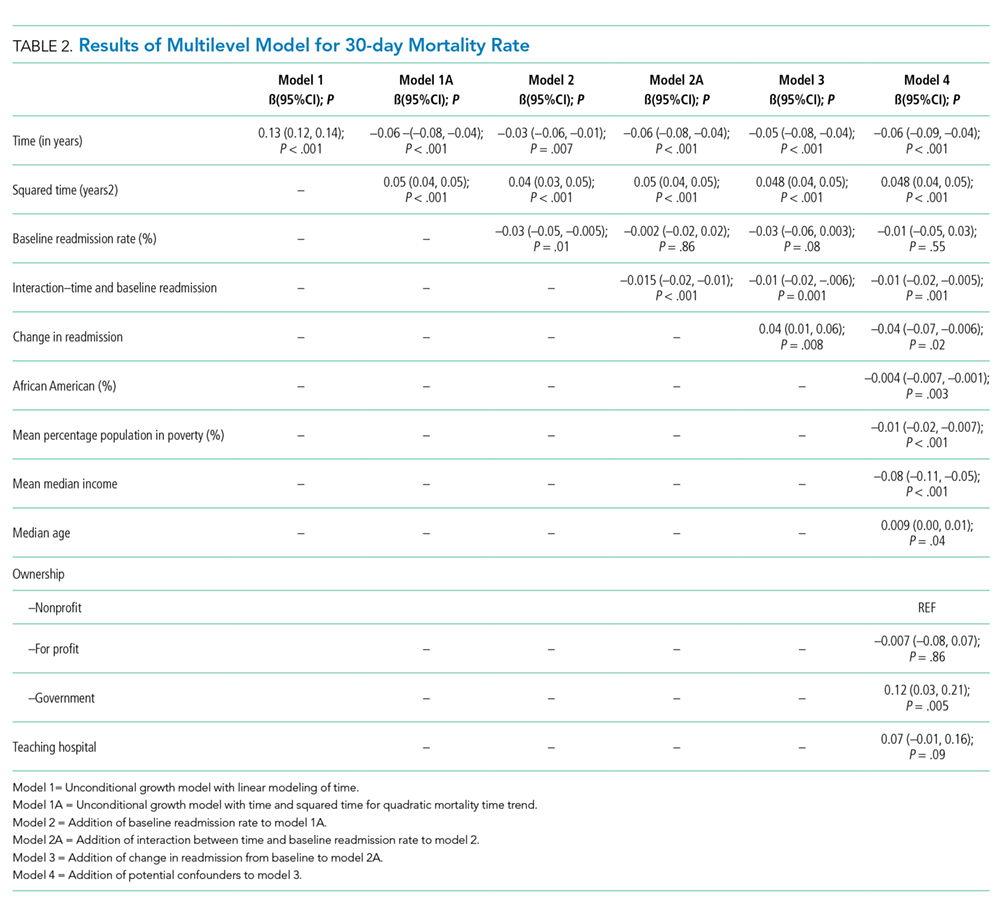
Inclusion of change in the readmissions variable in the model showed that each 1% decrease in readmission rate during the study period was associated with 0.04% (95% CI = 0.01 to 0.06; P = .008) increase in mortality. However, the interaction between change in readmission and time was not significant and the AIC and BIC of the model were higher than the model without interaction. Therefore, we retained the model without the interaction term and included other potential confounding variables to build our final model. Thus, although hospitals with different baseline readmission rates had different rates of change in mortality rate, the change in readmission rate had a consistent effect on the mortality rate. Including potential confounders in the model did not change the results; the mortality rate and the change in the mortality rate increased during the study period, a high baseline readmission rate was associated with a lower yearly increase in mortality, and a larger decrease in readmission rate was associated with a higher mortality rate (Table 2).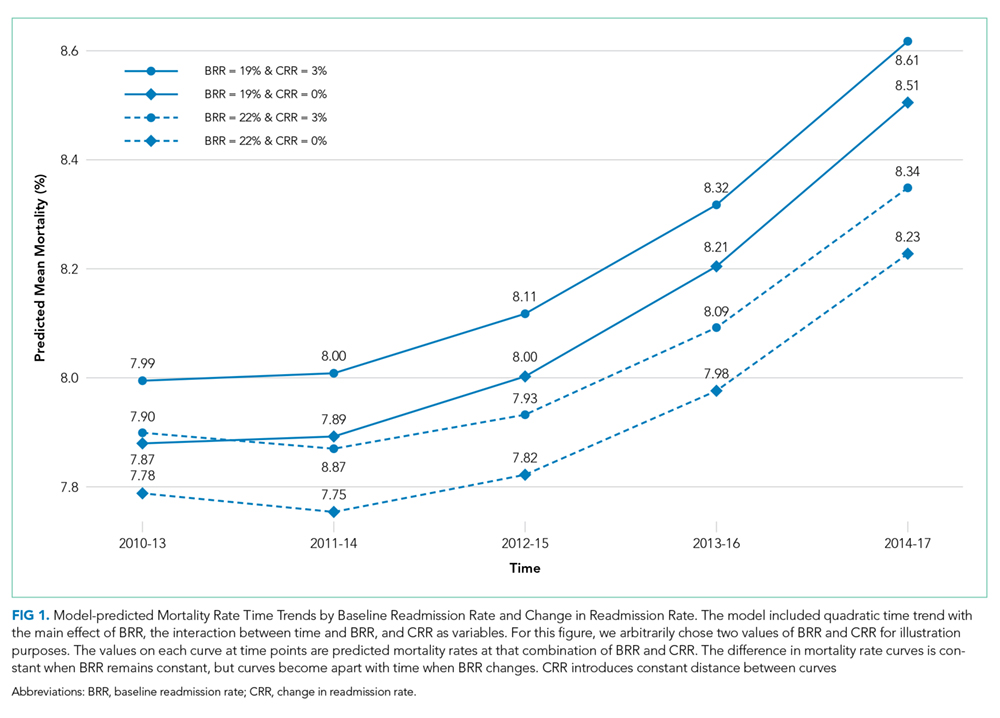
DISCUSSION
As efforts to decrease readmission rates continue as a part of the HRRP implementation by the CMS, our study shows that among hospitals that discharged patients with AECOPD during 2010-2017, the all-cause 30-day RSRR was decreased, whereas the all-cause 30-day RSMR was increased. Of particular concern is that the rate of increase in mortality also increased. We also found that hospitals with higher readmission rates in 2010-2013 had a lower rate of increase in mortality than hospitals with lower readmission rates. In addition, hospitals that had a larger decrease in readmission rates during the study period had a larger rate of increase in mortality than hospitals with a smaller decrease in readmission rates. Our findings were robust to potential confounders such as hospital characteristics and local population characteristics in which hospitals operate.
Our study findings raise the question whether the implementation of the HRRP resulted in unintentional patient harm by forcing hospitals to make changes that may affect overall patient care. This question is particularly important as other studies on hospitalized patients with HF have found similar results.13,14 On the other hand, a similar association between readmission and mortality rates has not been observed in patients with pneumonia or AMI.14 Several possible explanations can be given for the observed discrepancy between the diseases and their effect on the relationship between readmission rate and mortality rate. Both COPD and HF are chronic diseases and characterized by exacerbations, whereas AMI and pneumonia are episodic diseases that are treatable. As the number of patients hospitalized with AECOPD and HF is much larger, hospitals may have a greater focus on reducing the 30-day readmission rates and may attempt to game the process, such as by delaying admissions through the emergency department within the 30-day period or by admitting patients for observation. In fact, a study found a 3% reduction in the within-hospital readmission rate with a concurrent 0.8% increase in observation unit use since the implementation of the HRRP.26 Such approaches to patient care may lead to adverse outcomes.
It is possible that readmissions and mortality act as competing risks and hence hospitals with higher mortality rates are left with fewer patients and thus have fewer readmissions, whereas those with lower mortality rates have more patients and a higher readmission rate.27 Such studies are not possible with hospital-level data, and patient-level studies will be required to examine this competing risk hypothesis. Our study results provide some support to the competing risk hypothesis (hospitals with lower baseline readmission rates had a steeper increase in mortality); however, it is not possible to draw any conclusions due to the high risk of ecological fallacy bias.
This study has important potential implications for healthcare policy, public health, and research. We found that an important national intervention aimed at decreasing readmission rates and improving the quality of care for patients with AECOPD may be associated with higher mortality rates in these patients. There may be a need to redefine measures for determining the performance of an institution. Our study supports research into the underlying mechanisms resulting in an inverse association between readmissions and mortality. In particular, health policy researchers may need to examine how incentives and penalties affect the allocation of resources within hospitals.
This study has several strengths and some potential weaknesses. We used a national dataset to examine readmission and mortality rates that include the majority of hospitals in the United States. We also included data from the local population for each hospital, thus allowing us to examine hospital performance within the context of its target population. One potential limitation is that we used hospital-level data and not patient-level data; however, the readmission penalties are designed for hospitals, which justifies our use of hospital-level data. Furthermore, data were not available for shorter time intervals; data from shorter time intervals may be associated with greater variability. Being an observational study, it is difficult to establish a causal relationship; the longitudinal nature of the study does establish temporality, an important factor in establishing causality.
In conclusion, we found that although the readmission rates decreased, there was an increase in the mortality rate within the 30 days of discharge from the hospital in patients with AECOPD. The rate of increase in mortality was higher in hospitals with lower readmission rates than in hospitals with higher readmission rates. Further research for determining the mechanism responsible for this association is needed. Future health policy interventions may need to consider the potential for adverse outcomes.
1. Murphy SL, Xu J, Kochanek KD. Deaths: final data for 2010. Natl Vital Stat Rep. 2013;61(4):1-117.
2. Halbert RJ, Natoli JL, Gano A, et al. Global burden of copd: systematic review and meta-analysis. Eur Respir J. 2006;28(3):523-532. https://doi.org/10.1183/09031936.06.00124605.
3. Toy EL, Gallagher KF, Stanley EL, Swensen AR, Duh MS. The economic impact of exacerbations of chronic obstructive pulmonary disease and exacerbation definition: a review. COPD. 2010;7(3):214-228. https://doi.org/10.3109/15412555.2010.481697.
4. Shah T, Churpek MM, Coca Perraillon M, Konetzka RT. Understanding why patients with COPD get readmitted: a large national study to delineate the Medicare population for the readmissions penalty expansion. Chest. 2015;147(5):1219-1226. https://doi.org/10.1378/chest.14-2181.
5. Jencks SF, Williams MV, Coleman EA. Rehospitalizations among patients in the Medicare fee-for-service program. N Engl J Med. 2009;360(14):1418-1428. https://doi.org/10.1056/NEJMsa0803563.
6. Stein BD, Charbeneau JT, Lee TA, et al. Hospitalizations for acute exacerbations of chronic obstructive pulmonary disease: how you count matters. COPD. 2010;7(3):164-171. https://doi.org/10.3109/15412555.2010.481696.
7. Stein, B. D., Charbeneau, J. T., Lee, T. A., Schumock, G. T., Lindenauer, P. K., Bautista, A., . . . Krishnan, J. A. (2010). Hospitalizations for acute exacerbations of chronic obstructive pulmonary disease: how you count matters. COPD, 7(3), 164-171. doi:10.3109/15412555.2010.481696
8. McIlvennan CK, Eapen ZJ, Allen LA. Hospital readmissions reduction program. Circulation. 2015;131(20):1796-1803. https://doi.org/10.1161/CIRCULATIONAHA.114.010270.
9. McIlvennan CK, Eapen ZJ, Allen LA. Hospital readmissions reduction program. Circulation. 2015;131(20):179-1803. https://doi.org/10.1161/CIRCULATIONAHA.114.010270.
10. Centers for Medicare and Medicaid Services (CMS), HHS. Medicare Program; hospital inpatient prospective payment systems for acute care hospitals and the long-term care hospital prospective payment system and FY 2012 rates; Hospitals’ FTE Resident Caps for Graduate Medical Education Payment. Final Rules. Fed Regist. 2011;76(160):51476-51846.
11. Centers for Medicare and Medicaid Services (CMS). Medicare program; hospital inpatient prospective payment systems for acute care hospitals and the long-term care hospital prospective payment system and fiscal year 2014 rates; quality reporting requirements for specific providers; hospital conditions of participation; payment policies related to patient status. Final rules. Fed Regist. 2013;78(160):50495-51040.
12. Casillas G. Published: Mar 10 and 2017, “aiming for fewer hospital U-turns: the Medicare Hospital readmission reduction program,” [blog]. https://www.kff.org/medicare/issue-brief/aiming-for-fewer-hospital-u-turns-the-medicare-hospital-readmission-reduction-program/; Accessed March 10, 2017. The Henry J. Kaiser Family Foundation.
13. Desai NR, Ross JS, Kwon JY, et al. Association Between hospital penalty status Under the hospital readmission reduction program and readmission rates for target and nontarget conditions. JAMA. 2016;316(24): 2647-2656. https://doi.org/10.1001/jama.2016.18533.
14. Gupta A, Allen LA, Bhatt DL, et al. Association of the hospital readmissions reduction program implementation with readmission and mortality outcomes in heart failure. JAMA Cardiol. 2018;3(1):44-53. https://doi.org/10.1001/jamacardio.2017.4265.
15. Krumholz HM, Lin Z, Keenan PS, et al. Relationship between hospital readmission and mortality rates for patients hospitalized with acute myocardial infarction, heart failure, or pneumonia. JAMA. 2013;309(6):587-593. https://doi.org/10.1001/jama.2013.333.
16. Medicare Hospital compare overview,” https://www.medicare.gov/hospitalcompare/About/What-Is-HOS.html; Accessed April 17, 2019.
17. Archived datasets. Data.Medicare.Gov. Data.Medicare.Gov. Accessed April 17, 2019. https://data.medicare.gov/data/archives/hospital-compare.
18. Krumholz HM, Lin Z, Drye EE, et al. An administrative claims measure suitable for profiling hospital performance based on 30-day all-cause readmission rates among patients with acute myocardial infarction. Circ Cardiovasc Qual Outcomes. 2011;4(2):243-252. https://doi.org/10.1161/CIRCOUTCOMES.110.957498.
19. Bratzler DW, Normand SL, Wang Y, et al. An administrative claims model for profiling hospital 30-day mortality rates for pneumonia patients. PLOS ONE. 2011;6(4):e17401. https://doi.org/10.1371/journal.pone.0017401.
20. Centers for Medicare, Medicaid Services. Security Boulevard Baltimore, and Md21244 USA, “OutcomeMeasures,”. https://www.cms.gov/Medicare/Quality-Initiatives-Patient-Assessment-Instruments/HospitalQualityInits/OutcomeMeasures.html 7500; Accessed October 13, 2017.
21. Centers for Medicare and Medicaid Services (CMS), HHS. Medicare Program; Hospital Inpatient Prospective Payment Systems for Acute Care Hospitals and the Long-Term Care Hospital Prospective Payment System and Fiscal Year 2014 Rates; Quality Reporting Requirements for Specific Providers; Hospital Conditions of Participation; Payment Policies Related to Patient Status. Final Rules.”
22. Feemster LC, Au DH. Penalizing hospitals for chronic obstructive pulmonary disease readmissions. Am J Respir Crit Care Med. 2014;189(6):634-639. https://doi.org/10.1164/rccm.201308-1541PP.
23. United States Census Bureau. Census.Gov. Accessed April 17, 2019. https://www.census.gov/en.html.
24. Dartmouth atlas data,”. https://atlasdata.dartmouth.edu/. Aaccessed April 17, 2019.
25. Home. Dartmouth Atlas Healthc. https://www.dartmouthatlas.org/. Accessed April 17, 2019.
26. Zuckerman RB, Sheingold SH, Orav EJ, Ruhter J, Epstein AM. Readmissions, observation, and the hospital readmissions reduction program. N Engl J Med. 2016;374(16):1543-1551. https://doi.org/10.1056/NEJMsa1513024.
27. Gorodeski EZ, Starling RC, Blackstone EH. Are All Readmissions Bad Readmissions?, letter. World. 2010. https://doi.org/10.1056/NEJMc1001882.
Chronic obstructive pulmonary disease (COPD) is recognized as the third leading cause of death nationally. Globally, it has been estimated that 10% of the population has COPD; in the United States, approximately 15 million people are affected.1,2 The annual estimated cost of COPD management in the United States is approximately $50 billion, one-third of which is directly related to inpatient hospitalization for COPD exacerbation.3,4,5 The 30-day readmission rate after hospitalization for acute exacerbation of COPD (AECOPD) is approximately 21% with an approximate cost of $13 billion per year.6,7 To reduce the cost and to improve patient outcomes, the Centers for Medicare and Medicaid Services (CMS) has designed several interventions with little effect.8
In October 2012, the Affordable Care Act added section 1886(q) to the Social Security Act and established the Hospital Readmission Reduction Program (HRRP), an initiative to decrease hospitalization costs by penalizing hospitals with high 30-day readmission rates. Under this program, hospitals received up to 3% penalty for excess readmissions after the index hospitalization with acute myocardial infarction (AMI), heart failure (HF), and pneumonia.9-11 Hospitals are penalized if their annual readmission rates are significantly above the average national readmission rate. In 2014, the HRRP was extended to include AECOPD for the FY 2015.
Since the implementation of readmission penalties, data have shown a significant decrease in the 30-day readmission rates for all conditions.12,13 On the other hand, studies have suggested that, at least for some conditions, the decrease in the 30-day readmission rate is associated with higher adverse patients outcomes, including higher mortality.14,15 However, whether a decrease in readmission rates after an AECOPD hospitalization is associated with a concomitant increase in mortality has not been examined. Therefore, our objective was to examine the association of the 30-day risk-adjusted hospital readmission rate with the 30-day risk-adjusted hospital mortality rate for patients discharged with a diagnosis of AECOPD.
METHOD
Data Sources
Publicly available data from three sources were used. The all-cause 30-day risk-standardized readmission rate (RSRR) and the 30-day risk-standardized mortality rate (RSMR) of each hospital for patients with AECOPD were obtained from the Hospital Compare database; a database maintained by the CMS.16,17 In 2014, the CMS started reporting three-year running average of 30-day mortality and readmission rate data on hospitals for AECOPD hospitalizations; the data start date was July 2010.18-22 We examined data from the FY 2010-2013 to 2014-2017 cycles on readmission and mortality reported by the CMS; this included data before and after the implementation of penalties.
Hospital characteristics were also obtained from the CMS website. Hospital ownership was defined as government (owned by Federal or state), for-profit (owned by physicians or another proprietary), or nonprofit (owned by a nonprofit organization such as a church). A hospital was considered as a teaching hospital if it obtained graduate medical education funding from the CMS.
Data on local population characteristics according to ZIP codes were obtained from the 2010 decennial census and the American Community Survey five-year (2009-2013) data files available at the United States Census Bureau website.23 For each ZIP code, we obtained data on the total population, percentage of African Americans in the population, median income, poverty level, and insurance status.
We used Hospital service area (HSA) information obtained from the Dartmouth Atlas of Health Care crosswalk files to link local population characteristics to hospitals. The Dartmouth Atlas defined 3,436 HSAs by assigning the ZIP codes to the hospital area where the greatest proportion of their Medicare residents was hospitalized.24,25
Hospital Compare data and Census Bureau population data were matched to the HSAs from the Dartmouth Atlas of Healthcare data at the ZIP code level. First, the ZIP code-level data from the Census Bureau were pooled by the HSAs obtained from the Dartmouth Atlas of Healthcare, followed by matching these data by the HSAs to the Hospital Compare data. Merging data from these three sources generated a dataset that contained information about readmission and mortality rates from a particular hospital and the population characteristics of the local healthcare market or neighborhood. Our final dataset included hospitals that had readmission and mortality information available at the Hospital Compare website and were included in the crosswalk files of the Dartmouth Atlas of Healthcare.
Statistical Analysis
Data are summarized as mean and standard deviation (SD), median with interquartile range, or frequencies as appropriate. To model the dependence of observations from the same hospital over time, we used mixed linear models with random intercept and slope. A strength of this modeling approach is that it incorporates information from all hospitals even when some hospitals are missing data for some time periods. We reached our final model through stages with increasing model complexity at each stage. In the first stage, we developed an empty model without any covariates to determine the unconditional variance components so that we can partition mortality variance into between- and within-hospital components. In the second stage, we developed an unconditional growth curve model to determine the shape of time trend in mortality over time using linear and quadratic (by including squared time in the model) growth curves. In the third stage, we added baseline readmission rates (from 2010 to 2013) to the model to determine the effect of baseline readmission rate on mortality trends and also examined its interaction with time and squared time. We generated a change in the readmission rate variable by subtracting the last readmission rate from the baseline readmission rate (readmission rate in 2010-2013 − readmission rate in 2014-2017). In the fourth stage, we included this change in readmission rate into the third-stage model to examine how changes in the readmission rate affected the time trends of mortality and also examined its interaction with time and squared time. In the final model, we included the following potential confounding variables to the fourth stage model: African American percentage in the HSA, HSA median income, percentage of people living in poverty in the HSA, median age, ownership of hospital (government, for profit), teaching status (teaching vs nonteaching), and acute care hospital beds in the HSA. Within each stage, the models were compared using the Akaike information criterion (AIC) and the Bayesian information criterion (BIC), and the model with the lowest value of each was moved to the next stage of model development. All analyses were performed in Stata 14.1 for Windows (College Station, Texas).
RESULTS
Of the 3,685 acute care hospitals analyzed in the 2010-2013 data cycle for COPD, the 30-day RSRR was 20.7% (1.28), which decreased to 19.6% (1.11) in 2014-2017 (Table 1). During the same period, the 30-day all-cause RSMR increased from 7.8% (1.03) in 2010-2013 to 8.4% (1.11) in 2014-2017. The partitioning of variance showed that 57% of variation in the mortality rate over the study period was due to between-hospital differences.
The unconditional growth model examining the linear time trend revealed a 0.13% per year (95% CI = 0.12 to 0.14; P < .0001) increase in mortality rate over the five data cycles. When the squared time variable was added to the model to examine a quadratic trend, both time and squared trend were statistically significant (Table 2) and the AIC and BIC were lower for the quadratic model. Thus, the unconditional growth curve model suggested that the mortality trend was nonlinear and the coefficients demonstrated that not only the mortality rate increased, but the rate of change in the mortality rate was also increasing during the study period.
When we added the baseline readmission rate to the abovementioned quadratic growth model, we found an inverse association; each 1% increase in baseline readmission rate was associated with 0.03% (95% CI = −0.05 to −0.005; P = .02) decrease in mortality rate. These findings suggest that hospitals with higher baseline readmission rates also had lower mortality rates. To examine whether the effect of baseline readmission rate on mortality varied over time, we included the interaction term with time in the model and then added the interaction term with squared time. As the AIC and BIC were the lowest for the model with interaction between time and baseline readmission (and not when interaction between squared time and baseline readmission were included), we accepted this model. In this model, although there was no difference in mortality according to readmissions at baseline, each 1% increase in baseline readmission rate was associated with a smaller increase in mortality rate by 0.015% (95% CI = −0.02 to −0.01; P < .0001; Table 2 and Figure 1). These findings suggest that hospitals with higher readmission rates at baseline had a smaller increase in mortality rate during the study period than those with lower readmission rates.
Inclusion of change in the readmissions variable in the model showed that each 1% decrease in readmission rate during the study period was associated with 0.04% (95% CI = 0.01 to 0.06; P = .008) increase in mortality. However, the interaction between change in readmission and time was not significant and the AIC and BIC of the model were higher than the model without interaction. Therefore, we retained the model without the interaction term and included other potential confounding variables to build our final model. Thus, although hospitals with different baseline readmission rates had different rates of change in mortality rate, the change in readmission rate had a consistent effect on the mortality rate. Including potential confounders in the model did not change the results; the mortality rate and the change in the mortality rate increased during the study period, a high baseline readmission rate was associated with a lower yearly increase in mortality, and a larger decrease in readmission rate was associated with a higher mortality rate (Table 2).
DISCUSSION
As efforts to decrease readmission rates continue as a part of the HRRP implementation by the CMS, our study shows that among hospitals that discharged patients with AECOPD during 2010-2017, the all-cause 30-day RSRR was decreased, whereas the all-cause 30-day RSMR was increased. Of particular concern is that the rate of increase in mortality also increased. We also found that hospitals with higher readmission rates in 2010-2013 had a lower rate of increase in mortality than hospitals with lower readmission rates. In addition, hospitals that had a larger decrease in readmission rates during the study period had a larger rate of increase in mortality than hospitals with a smaller decrease in readmission rates. Our findings were robust to potential confounders such as hospital characteristics and local population characteristics in which hospitals operate.
Our study findings raise the question whether the implementation of the HRRP resulted in unintentional patient harm by forcing hospitals to make changes that may affect overall patient care. This question is particularly important as other studies on hospitalized patients with HF have found similar results.13,14 On the other hand, a similar association between readmission and mortality rates has not been observed in patients with pneumonia or AMI.14 Several possible explanations can be given for the observed discrepancy between the diseases and their effect on the relationship between readmission rate and mortality rate. Both COPD and HF are chronic diseases and characterized by exacerbations, whereas AMI and pneumonia are episodic diseases that are treatable. As the number of patients hospitalized with AECOPD and HF is much larger, hospitals may have a greater focus on reducing the 30-day readmission rates and may attempt to game the process, such as by delaying admissions through the emergency department within the 30-day period or by admitting patients for observation. In fact, a study found a 3% reduction in the within-hospital readmission rate with a concurrent 0.8% increase in observation unit use since the implementation of the HRRP.26 Such approaches to patient care may lead to adverse outcomes.
It is possible that readmissions and mortality act as competing risks and hence hospitals with higher mortality rates are left with fewer patients and thus have fewer readmissions, whereas those with lower mortality rates have more patients and a higher readmission rate.27 Such studies are not possible with hospital-level data, and patient-level studies will be required to examine this competing risk hypothesis. Our study results provide some support to the competing risk hypothesis (hospitals with lower baseline readmission rates had a steeper increase in mortality); however, it is not possible to draw any conclusions due to the high risk of ecological fallacy bias.
This study has important potential implications for healthcare policy, public health, and research. We found that an important national intervention aimed at decreasing readmission rates and improving the quality of care for patients with AECOPD may be associated with higher mortality rates in these patients. There may be a need to redefine measures for determining the performance of an institution. Our study supports research into the underlying mechanisms resulting in an inverse association between readmissions and mortality. In particular, health policy researchers may need to examine how incentives and penalties affect the allocation of resources within hospitals.
This study has several strengths and some potential weaknesses. We used a national dataset to examine readmission and mortality rates that include the majority of hospitals in the United States. We also included data from the local population for each hospital, thus allowing us to examine hospital performance within the context of its target population. One potential limitation is that we used hospital-level data and not patient-level data; however, the readmission penalties are designed for hospitals, which justifies our use of hospital-level data. Furthermore, data were not available for shorter time intervals; data from shorter time intervals may be associated with greater variability. Being an observational study, it is difficult to establish a causal relationship; the longitudinal nature of the study does establish temporality, an important factor in establishing causality.
In conclusion, we found that although the readmission rates decreased, there was an increase in the mortality rate within the 30 days of discharge from the hospital in patients with AECOPD. The rate of increase in mortality was higher in hospitals with lower readmission rates than in hospitals with higher readmission rates. Further research for determining the mechanism responsible for this association is needed. Future health policy interventions may need to consider the potential for adverse outcomes.
Chronic obstructive pulmonary disease (COPD) is recognized as the third leading cause of death nationally. Globally, it has been estimated that 10% of the population has COPD; in the United States, approximately 15 million people are affected.1,2 The annual estimated cost of COPD management in the United States is approximately $50 billion, one-third of which is directly related to inpatient hospitalization for COPD exacerbation.3,4,5 The 30-day readmission rate after hospitalization for acute exacerbation of COPD (AECOPD) is approximately 21% with an approximate cost of $13 billion per year.6,7 To reduce the cost and to improve patient outcomes, the Centers for Medicare and Medicaid Services (CMS) has designed several interventions with little effect.8
In October 2012, the Affordable Care Act added section 1886(q) to the Social Security Act and established the Hospital Readmission Reduction Program (HRRP), an initiative to decrease hospitalization costs by penalizing hospitals with high 30-day readmission rates. Under this program, hospitals received up to 3% penalty for excess readmissions after the index hospitalization with acute myocardial infarction (AMI), heart failure (HF), and pneumonia.9-11 Hospitals are penalized if their annual readmission rates are significantly above the average national readmission rate. In 2014, the HRRP was extended to include AECOPD for the FY 2015.
Since the implementation of readmission penalties, data have shown a significant decrease in the 30-day readmission rates for all conditions.12,13 On the other hand, studies have suggested that, at least for some conditions, the decrease in the 30-day readmission rate is associated with higher adverse patients outcomes, including higher mortality.14,15 However, whether a decrease in readmission rates after an AECOPD hospitalization is associated with a concomitant increase in mortality has not been examined. Therefore, our objective was to examine the association of the 30-day risk-adjusted hospital readmission rate with the 30-day risk-adjusted hospital mortality rate for patients discharged with a diagnosis of AECOPD.
METHOD
Data Sources
Publicly available data from three sources were used. The all-cause 30-day risk-standardized readmission rate (RSRR) and the 30-day risk-standardized mortality rate (RSMR) of each hospital for patients with AECOPD were obtained from the Hospital Compare database; a database maintained by the CMS.16,17 In 2014, the CMS started reporting three-year running average of 30-day mortality and readmission rate data on hospitals for AECOPD hospitalizations; the data start date was July 2010.18-22 We examined data from the FY 2010-2013 to 2014-2017 cycles on readmission and mortality reported by the CMS; this included data before and after the implementation of penalties.
Hospital characteristics were also obtained from the CMS website. Hospital ownership was defined as government (owned by Federal or state), for-profit (owned by physicians or another proprietary), or nonprofit (owned by a nonprofit organization such as a church). A hospital was considered as a teaching hospital if it obtained graduate medical education funding from the CMS.
Data on local population characteristics according to ZIP codes were obtained from the 2010 decennial census and the American Community Survey five-year (2009-2013) data files available at the United States Census Bureau website.23 For each ZIP code, we obtained data on the total population, percentage of African Americans in the population, median income, poverty level, and insurance status.
We used Hospital service area (HSA) information obtained from the Dartmouth Atlas of Health Care crosswalk files to link local population characteristics to hospitals. The Dartmouth Atlas defined 3,436 HSAs by assigning the ZIP codes to the hospital area where the greatest proportion of their Medicare residents was hospitalized.24,25
Hospital Compare data and Census Bureau population data were matched to the HSAs from the Dartmouth Atlas of Healthcare data at the ZIP code level. First, the ZIP code-level data from the Census Bureau were pooled by the HSAs obtained from the Dartmouth Atlas of Healthcare, followed by matching these data by the HSAs to the Hospital Compare data. Merging data from these three sources generated a dataset that contained information about readmission and mortality rates from a particular hospital and the population characteristics of the local healthcare market or neighborhood. Our final dataset included hospitals that had readmission and mortality information available at the Hospital Compare website and were included in the crosswalk files of the Dartmouth Atlas of Healthcare.
Statistical Analysis
Data are summarized as mean and standard deviation (SD), median with interquartile range, or frequencies as appropriate. To model the dependence of observations from the same hospital over time, we used mixed linear models with random intercept and slope. A strength of this modeling approach is that it incorporates information from all hospitals even when some hospitals are missing data for some time periods. We reached our final model through stages with increasing model complexity at each stage. In the first stage, we developed an empty model without any covariates to determine the unconditional variance components so that we can partition mortality variance into between- and within-hospital components. In the second stage, we developed an unconditional growth curve model to determine the shape of time trend in mortality over time using linear and quadratic (by including squared time in the model) growth curves. In the third stage, we added baseline readmission rates (from 2010 to 2013) to the model to determine the effect of baseline readmission rate on mortality trends and also examined its interaction with time and squared time. We generated a change in the readmission rate variable by subtracting the last readmission rate from the baseline readmission rate (readmission rate in 2010-2013 − readmission rate in 2014-2017). In the fourth stage, we included this change in readmission rate into the third-stage model to examine how changes in the readmission rate affected the time trends of mortality and also examined its interaction with time and squared time. In the final model, we included the following potential confounding variables to the fourth stage model: African American percentage in the HSA, HSA median income, percentage of people living in poverty in the HSA, median age, ownership of hospital (government, for profit), teaching status (teaching vs nonteaching), and acute care hospital beds in the HSA. Within each stage, the models were compared using the Akaike information criterion (AIC) and the Bayesian information criterion (BIC), and the model with the lowest value of each was moved to the next stage of model development. All analyses were performed in Stata 14.1 for Windows (College Station, Texas).
RESULTS
Of the 3,685 acute care hospitals analyzed in the 2010-2013 data cycle for COPD, the 30-day RSRR was 20.7% (1.28), which decreased to 19.6% (1.11) in 2014-2017 (Table 1). During the same period, the 30-day all-cause RSMR increased from 7.8% (1.03) in 2010-2013 to 8.4% (1.11) in 2014-2017. The partitioning of variance showed that 57% of variation in the mortality rate over the study period was due to between-hospital differences.
The unconditional growth model examining the linear time trend revealed a 0.13% per year (95% CI = 0.12 to 0.14; P < .0001) increase in mortality rate over the five data cycles. When the squared time variable was added to the model to examine a quadratic trend, both time and squared trend were statistically significant (Table 2) and the AIC and BIC were lower for the quadratic model. Thus, the unconditional growth curve model suggested that the mortality trend was nonlinear and the coefficients demonstrated that not only the mortality rate increased, but the rate of change in the mortality rate was also increasing during the study period.
When we added the baseline readmission rate to the abovementioned quadratic growth model, we found an inverse association; each 1% increase in baseline readmission rate was associated with 0.03% (95% CI = −0.05 to −0.005; P = .02) decrease in mortality rate. These findings suggest that hospitals with higher baseline readmission rates also had lower mortality rates. To examine whether the effect of baseline readmission rate on mortality varied over time, we included the interaction term with time in the model and then added the interaction term with squared time. As the AIC and BIC were the lowest for the model with interaction between time and baseline readmission (and not when interaction between squared time and baseline readmission were included), we accepted this model. In this model, although there was no difference in mortality according to readmissions at baseline, each 1% increase in baseline readmission rate was associated with a smaller increase in mortality rate by 0.015% (95% CI = −0.02 to −0.01; P < .0001; Table 2 and Figure 1). These findings suggest that hospitals with higher readmission rates at baseline had a smaller increase in mortality rate during the study period than those with lower readmission rates.
Inclusion of change in the readmissions variable in the model showed that each 1% decrease in readmission rate during the study period was associated with 0.04% (95% CI = 0.01 to 0.06; P = .008) increase in mortality. However, the interaction between change in readmission and time was not significant and the AIC and BIC of the model were higher than the model without interaction. Therefore, we retained the model without the interaction term and included other potential confounding variables to build our final model. Thus, although hospitals with different baseline readmission rates had different rates of change in mortality rate, the change in readmission rate had a consistent effect on the mortality rate. Including potential confounders in the model did not change the results; the mortality rate and the change in the mortality rate increased during the study period, a high baseline readmission rate was associated with a lower yearly increase in mortality, and a larger decrease in readmission rate was associated with a higher mortality rate (Table 2).
DISCUSSION
As efforts to decrease readmission rates continue as a part of the HRRP implementation by the CMS, our study shows that among hospitals that discharged patients with AECOPD during 2010-2017, the all-cause 30-day RSRR was decreased, whereas the all-cause 30-day RSMR was increased. Of particular concern is that the rate of increase in mortality also increased. We also found that hospitals with higher readmission rates in 2010-2013 had a lower rate of increase in mortality than hospitals with lower readmission rates. In addition, hospitals that had a larger decrease in readmission rates during the study period had a larger rate of increase in mortality than hospitals with a smaller decrease in readmission rates. Our findings were robust to potential confounders such as hospital characteristics and local population characteristics in which hospitals operate.
Our study findings raise the question whether the implementation of the HRRP resulted in unintentional patient harm by forcing hospitals to make changes that may affect overall patient care. This question is particularly important as other studies on hospitalized patients with HF have found similar results.13,14 On the other hand, a similar association between readmission and mortality rates has not been observed in patients with pneumonia or AMI.14 Several possible explanations can be given for the observed discrepancy between the diseases and their effect on the relationship between readmission rate and mortality rate. Both COPD and HF are chronic diseases and characterized by exacerbations, whereas AMI and pneumonia are episodic diseases that are treatable. As the number of patients hospitalized with AECOPD and HF is much larger, hospitals may have a greater focus on reducing the 30-day readmission rates and may attempt to game the process, such as by delaying admissions through the emergency department within the 30-day period or by admitting patients for observation. In fact, a study found a 3% reduction in the within-hospital readmission rate with a concurrent 0.8% increase in observation unit use since the implementation of the HRRP.26 Such approaches to patient care may lead to adverse outcomes.
It is possible that readmissions and mortality act as competing risks and hence hospitals with higher mortality rates are left with fewer patients and thus have fewer readmissions, whereas those with lower mortality rates have more patients and a higher readmission rate.27 Such studies are not possible with hospital-level data, and patient-level studies will be required to examine this competing risk hypothesis. Our study results provide some support to the competing risk hypothesis (hospitals with lower baseline readmission rates had a steeper increase in mortality); however, it is not possible to draw any conclusions due to the high risk of ecological fallacy bias.
This study has important potential implications for healthcare policy, public health, and research. We found that an important national intervention aimed at decreasing readmission rates and improving the quality of care for patients with AECOPD may be associated with higher mortality rates in these patients. There may be a need to redefine measures for determining the performance of an institution. Our study supports research into the underlying mechanisms resulting in an inverse association between readmissions and mortality. In particular, health policy researchers may need to examine how incentives and penalties affect the allocation of resources within hospitals.
This study has several strengths and some potential weaknesses. We used a national dataset to examine readmission and mortality rates that include the majority of hospitals in the United States. We also included data from the local population for each hospital, thus allowing us to examine hospital performance within the context of its target population. One potential limitation is that we used hospital-level data and not patient-level data; however, the readmission penalties are designed for hospitals, which justifies our use of hospital-level data. Furthermore, data were not available for shorter time intervals; data from shorter time intervals may be associated with greater variability. Being an observational study, it is difficult to establish a causal relationship; the longitudinal nature of the study does establish temporality, an important factor in establishing causality.
In conclusion, we found that although the readmission rates decreased, there was an increase in the mortality rate within the 30 days of discharge from the hospital in patients with AECOPD. The rate of increase in mortality was higher in hospitals with lower readmission rates than in hospitals with higher readmission rates. Further research for determining the mechanism responsible for this association is needed. Future health policy interventions may need to consider the potential for adverse outcomes.
1. Murphy SL, Xu J, Kochanek KD. Deaths: final data for 2010. Natl Vital Stat Rep. 2013;61(4):1-117.
2. Halbert RJ, Natoli JL, Gano A, et al. Global burden of copd: systematic review and meta-analysis. Eur Respir J. 2006;28(3):523-532. https://doi.org/10.1183/09031936.06.00124605.
3. Toy EL, Gallagher KF, Stanley EL, Swensen AR, Duh MS. The economic impact of exacerbations of chronic obstructive pulmonary disease and exacerbation definition: a review. COPD. 2010;7(3):214-228. https://doi.org/10.3109/15412555.2010.481697.
4. Shah T, Churpek MM, Coca Perraillon M, Konetzka RT. Understanding why patients with COPD get readmitted: a large national study to delineate the Medicare population for the readmissions penalty expansion. Chest. 2015;147(5):1219-1226. https://doi.org/10.1378/chest.14-2181.
5. Jencks SF, Williams MV, Coleman EA. Rehospitalizations among patients in the Medicare fee-for-service program. N Engl J Med. 2009;360(14):1418-1428. https://doi.org/10.1056/NEJMsa0803563.
6. Stein BD, Charbeneau JT, Lee TA, et al. Hospitalizations for acute exacerbations of chronic obstructive pulmonary disease: how you count matters. COPD. 2010;7(3):164-171. https://doi.org/10.3109/15412555.2010.481696.
7. Stein, B. D., Charbeneau, J. T., Lee, T. A., Schumock, G. T., Lindenauer, P. K., Bautista, A., . . . Krishnan, J. A. (2010). Hospitalizations for acute exacerbations of chronic obstructive pulmonary disease: how you count matters. COPD, 7(3), 164-171. doi:10.3109/15412555.2010.481696
8. McIlvennan CK, Eapen ZJ, Allen LA. Hospital readmissions reduction program. Circulation. 2015;131(20):1796-1803. https://doi.org/10.1161/CIRCULATIONAHA.114.010270.
9. McIlvennan CK, Eapen ZJ, Allen LA. Hospital readmissions reduction program. Circulation. 2015;131(20):179-1803. https://doi.org/10.1161/CIRCULATIONAHA.114.010270.
10. Centers for Medicare and Medicaid Services (CMS), HHS. Medicare Program; hospital inpatient prospective payment systems for acute care hospitals and the long-term care hospital prospective payment system and FY 2012 rates; Hospitals’ FTE Resident Caps for Graduate Medical Education Payment. Final Rules. Fed Regist. 2011;76(160):51476-51846.
11. Centers for Medicare and Medicaid Services (CMS). Medicare program; hospital inpatient prospective payment systems for acute care hospitals and the long-term care hospital prospective payment system and fiscal year 2014 rates; quality reporting requirements for specific providers; hospital conditions of participation; payment policies related to patient status. Final rules. Fed Regist. 2013;78(160):50495-51040.
12. Casillas G. Published: Mar 10 and 2017, “aiming for fewer hospital U-turns: the Medicare Hospital readmission reduction program,” [blog]. https://www.kff.org/medicare/issue-brief/aiming-for-fewer-hospital-u-turns-the-medicare-hospital-readmission-reduction-program/; Accessed March 10, 2017. The Henry J. Kaiser Family Foundation.
13. Desai NR, Ross JS, Kwon JY, et al. Association Between hospital penalty status Under the hospital readmission reduction program and readmission rates for target and nontarget conditions. JAMA. 2016;316(24): 2647-2656. https://doi.org/10.1001/jama.2016.18533.
14. Gupta A, Allen LA, Bhatt DL, et al. Association of the hospital readmissions reduction program implementation with readmission and mortality outcomes in heart failure. JAMA Cardiol. 2018;3(1):44-53. https://doi.org/10.1001/jamacardio.2017.4265.
15. Krumholz HM, Lin Z, Keenan PS, et al. Relationship between hospital readmission and mortality rates for patients hospitalized with acute myocardial infarction, heart failure, or pneumonia. JAMA. 2013;309(6):587-593. https://doi.org/10.1001/jama.2013.333.
16. Medicare Hospital compare overview,” https://www.medicare.gov/hospitalcompare/About/What-Is-HOS.html; Accessed April 17, 2019.
17. Archived datasets. Data.Medicare.Gov. Data.Medicare.Gov. Accessed April 17, 2019. https://data.medicare.gov/data/archives/hospital-compare.
18. Krumholz HM, Lin Z, Drye EE, et al. An administrative claims measure suitable for profiling hospital performance based on 30-day all-cause readmission rates among patients with acute myocardial infarction. Circ Cardiovasc Qual Outcomes. 2011;4(2):243-252. https://doi.org/10.1161/CIRCOUTCOMES.110.957498.
19. Bratzler DW, Normand SL, Wang Y, et al. An administrative claims model for profiling hospital 30-day mortality rates for pneumonia patients. PLOS ONE. 2011;6(4):e17401. https://doi.org/10.1371/journal.pone.0017401.
20. Centers for Medicare, Medicaid Services. Security Boulevard Baltimore, and Md21244 USA, “OutcomeMeasures,”. https://www.cms.gov/Medicare/Quality-Initiatives-Patient-Assessment-Instruments/HospitalQualityInits/OutcomeMeasures.html 7500; Accessed October 13, 2017.
21. Centers for Medicare and Medicaid Services (CMS), HHS. Medicare Program; Hospital Inpatient Prospective Payment Systems for Acute Care Hospitals and the Long-Term Care Hospital Prospective Payment System and Fiscal Year 2014 Rates; Quality Reporting Requirements for Specific Providers; Hospital Conditions of Participation; Payment Policies Related to Patient Status. Final Rules.”
22. Feemster LC, Au DH. Penalizing hospitals for chronic obstructive pulmonary disease readmissions. Am J Respir Crit Care Med. 2014;189(6):634-639. https://doi.org/10.1164/rccm.201308-1541PP.
23. United States Census Bureau. Census.Gov. Accessed April 17, 2019. https://www.census.gov/en.html.
24. Dartmouth atlas data,”. https://atlasdata.dartmouth.edu/. Aaccessed April 17, 2019.
25. Home. Dartmouth Atlas Healthc. https://www.dartmouthatlas.org/. Accessed April 17, 2019.
26. Zuckerman RB, Sheingold SH, Orav EJ, Ruhter J, Epstein AM. Readmissions, observation, and the hospital readmissions reduction program. N Engl J Med. 2016;374(16):1543-1551. https://doi.org/10.1056/NEJMsa1513024.
27. Gorodeski EZ, Starling RC, Blackstone EH. Are All Readmissions Bad Readmissions?, letter. World. 2010. https://doi.org/10.1056/NEJMc1001882.
1. Murphy SL, Xu J, Kochanek KD. Deaths: final data for 2010. Natl Vital Stat Rep. 2013;61(4):1-117.
2. Halbert RJ, Natoli JL, Gano A, et al. Global burden of copd: systematic review and meta-analysis. Eur Respir J. 2006;28(3):523-532. https://doi.org/10.1183/09031936.06.00124605.
3. Toy EL, Gallagher KF, Stanley EL, Swensen AR, Duh MS. The economic impact of exacerbations of chronic obstructive pulmonary disease and exacerbation definition: a review. COPD. 2010;7(3):214-228. https://doi.org/10.3109/15412555.2010.481697.
4. Shah T, Churpek MM, Coca Perraillon M, Konetzka RT. Understanding why patients with COPD get readmitted: a large national study to delineate the Medicare population for the readmissions penalty expansion. Chest. 2015;147(5):1219-1226. https://doi.org/10.1378/chest.14-2181.
5. Jencks SF, Williams MV, Coleman EA. Rehospitalizations among patients in the Medicare fee-for-service program. N Engl J Med. 2009;360(14):1418-1428. https://doi.org/10.1056/NEJMsa0803563.
6. Stein BD, Charbeneau JT, Lee TA, et al. Hospitalizations for acute exacerbations of chronic obstructive pulmonary disease: how you count matters. COPD. 2010;7(3):164-171. https://doi.org/10.3109/15412555.2010.481696.
7. Stein, B. D., Charbeneau, J. T., Lee, T. A., Schumock, G. T., Lindenauer, P. K., Bautista, A., . . . Krishnan, J. A. (2010). Hospitalizations for acute exacerbations of chronic obstructive pulmonary disease: how you count matters. COPD, 7(3), 164-171. doi:10.3109/15412555.2010.481696
8. McIlvennan CK, Eapen ZJ, Allen LA. Hospital readmissions reduction program. Circulation. 2015;131(20):1796-1803. https://doi.org/10.1161/CIRCULATIONAHA.114.010270.
9. McIlvennan CK, Eapen ZJ, Allen LA. Hospital readmissions reduction program. Circulation. 2015;131(20):179-1803. https://doi.org/10.1161/CIRCULATIONAHA.114.010270.
10. Centers for Medicare and Medicaid Services (CMS), HHS. Medicare Program; hospital inpatient prospective payment systems for acute care hospitals and the long-term care hospital prospective payment system and FY 2012 rates; Hospitals’ FTE Resident Caps for Graduate Medical Education Payment. Final Rules. Fed Regist. 2011;76(160):51476-51846.
11. Centers for Medicare and Medicaid Services (CMS). Medicare program; hospital inpatient prospective payment systems for acute care hospitals and the long-term care hospital prospective payment system and fiscal year 2014 rates; quality reporting requirements for specific providers; hospital conditions of participation; payment policies related to patient status. Final rules. Fed Regist. 2013;78(160):50495-51040.
12. Casillas G. Published: Mar 10 and 2017, “aiming for fewer hospital U-turns: the Medicare Hospital readmission reduction program,” [blog]. https://www.kff.org/medicare/issue-brief/aiming-for-fewer-hospital-u-turns-the-medicare-hospital-readmission-reduction-program/; Accessed March 10, 2017. The Henry J. Kaiser Family Foundation.
13. Desai NR, Ross JS, Kwon JY, et al. Association Between hospital penalty status Under the hospital readmission reduction program and readmission rates for target and nontarget conditions. JAMA. 2016;316(24): 2647-2656. https://doi.org/10.1001/jama.2016.18533.
14. Gupta A, Allen LA, Bhatt DL, et al. Association of the hospital readmissions reduction program implementation with readmission and mortality outcomes in heart failure. JAMA Cardiol. 2018;3(1):44-53. https://doi.org/10.1001/jamacardio.2017.4265.
15. Krumholz HM, Lin Z, Keenan PS, et al. Relationship between hospital readmission and mortality rates for patients hospitalized with acute myocardial infarction, heart failure, or pneumonia. JAMA. 2013;309(6):587-593. https://doi.org/10.1001/jama.2013.333.
16. Medicare Hospital compare overview,” https://www.medicare.gov/hospitalcompare/About/What-Is-HOS.html; Accessed April 17, 2019.
17. Archived datasets. Data.Medicare.Gov. Data.Medicare.Gov. Accessed April 17, 2019. https://data.medicare.gov/data/archives/hospital-compare.
18. Krumholz HM, Lin Z, Drye EE, et al. An administrative claims measure suitable for profiling hospital performance based on 30-day all-cause readmission rates among patients with acute myocardial infarction. Circ Cardiovasc Qual Outcomes. 2011;4(2):243-252. https://doi.org/10.1161/CIRCOUTCOMES.110.957498.
19. Bratzler DW, Normand SL, Wang Y, et al. An administrative claims model for profiling hospital 30-day mortality rates for pneumonia patients. PLOS ONE. 2011;6(4):e17401. https://doi.org/10.1371/journal.pone.0017401.
20. Centers for Medicare, Medicaid Services. Security Boulevard Baltimore, and Md21244 USA, “OutcomeMeasures,”. https://www.cms.gov/Medicare/Quality-Initiatives-Patient-Assessment-Instruments/HospitalQualityInits/OutcomeMeasures.html 7500; Accessed October 13, 2017.
21. Centers for Medicare and Medicaid Services (CMS), HHS. Medicare Program; Hospital Inpatient Prospective Payment Systems for Acute Care Hospitals and the Long-Term Care Hospital Prospective Payment System and Fiscal Year 2014 Rates; Quality Reporting Requirements for Specific Providers; Hospital Conditions of Participation; Payment Policies Related to Patient Status. Final Rules.”
22. Feemster LC, Au DH. Penalizing hospitals for chronic obstructive pulmonary disease readmissions. Am J Respir Crit Care Med. 2014;189(6):634-639. https://doi.org/10.1164/rccm.201308-1541PP.
23. United States Census Bureau. Census.Gov. Accessed April 17, 2019. https://www.census.gov/en.html.
24. Dartmouth atlas data,”. https://atlasdata.dartmouth.edu/. Aaccessed April 17, 2019.
25. Home. Dartmouth Atlas Healthc. https://www.dartmouthatlas.org/. Accessed April 17, 2019.
26. Zuckerman RB, Sheingold SH, Orav EJ, Ruhter J, Epstein AM. Readmissions, observation, and the hospital readmissions reduction program. N Engl J Med. 2016;374(16):1543-1551. https://doi.org/10.1056/NEJMsa1513024.
27. Gorodeski EZ, Starling RC, Blackstone EH. Are All Readmissions Bad Readmissions?, letter. World. 2010. https://doi.org/10.1056/NEJMc1001882.
© 2019 Society of Hospital Medicine
Choosing Wisely® in Pediatric Hospital Medicine: Time to Celebrate?
The Choosing Wisely® campaign, launched in 2012 by the American Board of Internal Medicine, aims to reduce overuse of tests and treatments that do not add value for patients. The campaign has caught the attention of the medical profession and spread internationally. Over the last seven years, most specialty societies have published specific recommendations on what tests and treatments clinicians should stop doing. However, has this campaign actually had an impact on the testing and treating behaviors of clinicians?
In this issue of the Journal of Hospital Medicine, Reyes and colleagues examine changes in five overuse metrics linked with the 2013 Choosing Wisely® Pediatric Hospital Medicine recommendations at 37 children’s hospitals from 2008 to 2017, five years before and after the recommendations were published.1,2 The tests and treatments targeted by these recommendations are not individually costly, but given the high prevalence of the conditions, the cumulative cost is not insignificant. More importantly, reducing the potentially harmful long-term effects of unnecessary radiation and adverse effects from exposure to inappropriate systemic steroids and antacids is a laudable goal. Results from unnecessary tests may also lead to a further cascade of unnecessary testing and/or treatment.3
The authors used an administrative data source, the Pediatric Health Information System (PHIS), to measure billing charges for the tests and medications linked with the overuse measures in over 278,000 hospitalizations. The good news is that overuse declined over the 10-year study period. After adjusting for differences in patient characteristics over time, they observed a substantial absolute reduction in bronchiolitis bronchodilator use (36.6%, from 64% in 2008 to 27.4% in 2017) and chest x-ray (CXR) use (31.5%, from 58.4% to 26.9%). There were also reductions for the other metrics: acid-suppressing medications for gastroesophageal reflux (24.1%, from 63% to 48.9%), asthma CXR use (20.8%, from 52.8% to 32%), and steroids for lower respiratory tract infections (2.9%, from 15.1% to 12.2%). We would not expect the goal for these overuse metrics to be zero percent given the diagnostic uncertainties in real-world clinical decision-making.
The Choosing Wisely® Pediatric Hospital Medicine recommendations, however, were associated with only a modest impact on the overuse decline. A before-and-after interrupted time series analysis showed that the overuse measures were on the downturn prior to the recommendations being published. Then after publication, only the rate of CXR use in asthma decreased immediately. The rate of bronchodilator use for bronchiolitis declined in the following five-year period. There were no changes in the rate of decline in overuse for the other tests and treatments associated with the recommendations.
With such a widespread national campaign, a control group of hospitals to better understand the specific influence of the Choosing Wisely® recommendations was not possible. The decline in overuse over the 10-year period reported by Reyes et al. is likely due to a combination of efforts at multiple levels—including national society guidelines, local hospital guidelines and pathways, increased awareness by clinicians of the problem of overuse, and focused quality improvement efforts.
The use of the PHIS database provided Reyes et al. a powerful data source to evaluate overuse across a large number of patients and hospitals efficiently. However, there are limitations with administrative data that are important to consider. Detailed clinical data, such as patient disease characteristics and test and treatment indications, are not available, which limits the specificity of these measures. For example, one of the recommendations suggests that gastroesophageal reflux should not be routinely treated with acid suppression therapy. Using administrative data, it is impossible to know whether the use of antacids in hospitalized children with a primary discharge diagnosis code of gastroesophageal reflux was inappropriate or because they failed other treatments in the outpatient setting and/or had complicated disease appropriately warranting treatment. This misclassification would result in an overestimation of overuse. The authors did attempt to minimize the possibility of misclassification by excluding children with comorbidities, those who had longer hospital stays, those admitted to the intensive care unit, and those with greater severity of illness where some of these tests and treatments would be indicated.
While the report by Reyes et al. focuses on Pediatric Hospital Medicine Choosing Wisely® recommendations, it is important to recognize that tests and treatments for conditions like asthma, bronchiolitis, and lower respiratory tract infections are initially performed in the emergency department (ED). Collaboration between the ED and the Hospital Medicine Unit is essential to tackle the issue of overuse.4
The study by Reyes et al. provides a nice description of the trends in the Choosing Wisely® overuse metrics at a group of children’s hospitals and is one of few such reports. The NIH funded, Eliminating Monitor Overuse: pulse oximetry (EMO: SpO2) study is focusing on the 5th Choosing Wisely® Pediatric Hospital Medicine recommendation that was not studied by Reyes.5
So then, with the decline in overuse reported in this study over 10 years, is it time to celebrate? Not yet. There is much work to do in the pursuit of Choosing Wisely®: developing a host of valid measures of overuse in pediatric hospital care, expanding the examination of overuse to community hospitals where the majority of children are hospitalized, and using implementation science theory to de-implement the ingrained practices.
1. Reyes M, Etigner B, Hall M, et al. Impact of the choosing wisely campaign recommendations for hospitalized children on clinical practice: trends from 2008 to 2017 [published online ahead of print September 18, 2019]. J Hosp Medicine. 2020;15(2):124-125. https://doi.org/10.12788/jhm.3291
2. Quinonez RA, Garber MD, Schroeder AR, et al. Choosing wisely in pediatric hospital medicine: five opportunities from improved healthcare value. J Hosp Med. 2013;8(9):479-495. https://doi.org/10.1002/jhm.2064.
3. Schuh S, Lalani A, Allen U, et al. Evaluation of the utility of radiography in acute bronchiolitis. J Pediatr. 2007;150(4):429-433. https://doi.org/16/j.jpeds.2007.01.005.
4. Mussman GM, Lossius M, Wasif F, et al. Multisite emergency department inpatient collaborative to reduce unnecessary bronchiolitis care. Pediatrics. 2018;141(2):e20170830. https://doi.org/10.1542/peds.2017-0830.
5. Rasooly IR, Beidas RS, Wolk CB, Barg F, et al. Measuring overuse of continuous pulse oximetry in bronchiolitis and developing strategies for large-scale deimplementation: study protocol for a feasibility trial. Pilot Feasibility Stud. 2019;5(1):68. https://doi.org/10.1186/s40814-019-0453-2.
The Choosing Wisely® campaign, launched in 2012 by the American Board of Internal Medicine, aims to reduce overuse of tests and treatments that do not add value for patients. The campaign has caught the attention of the medical profession and spread internationally. Over the last seven years, most specialty societies have published specific recommendations on what tests and treatments clinicians should stop doing. However, has this campaign actually had an impact on the testing and treating behaviors of clinicians?
In this issue of the Journal of Hospital Medicine, Reyes and colleagues examine changes in five overuse metrics linked with the 2013 Choosing Wisely® Pediatric Hospital Medicine recommendations at 37 children’s hospitals from 2008 to 2017, five years before and after the recommendations were published.1,2 The tests and treatments targeted by these recommendations are not individually costly, but given the high prevalence of the conditions, the cumulative cost is not insignificant. More importantly, reducing the potentially harmful long-term effects of unnecessary radiation and adverse effects from exposure to inappropriate systemic steroids and antacids is a laudable goal. Results from unnecessary tests may also lead to a further cascade of unnecessary testing and/or treatment.3
The authors used an administrative data source, the Pediatric Health Information System (PHIS), to measure billing charges for the tests and medications linked with the overuse measures in over 278,000 hospitalizations. The good news is that overuse declined over the 10-year study period. After adjusting for differences in patient characteristics over time, they observed a substantial absolute reduction in bronchiolitis bronchodilator use (36.6%, from 64% in 2008 to 27.4% in 2017) and chest x-ray (CXR) use (31.5%, from 58.4% to 26.9%). There were also reductions for the other metrics: acid-suppressing medications for gastroesophageal reflux (24.1%, from 63% to 48.9%), asthma CXR use (20.8%, from 52.8% to 32%), and steroids for lower respiratory tract infections (2.9%, from 15.1% to 12.2%). We would not expect the goal for these overuse metrics to be zero percent given the diagnostic uncertainties in real-world clinical decision-making.
The Choosing Wisely® Pediatric Hospital Medicine recommendations, however, were associated with only a modest impact on the overuse decline. A before-and-after interrupted time series analysis showed that the overuse measures were on the downturn prior to the recommendations being published. Then after publication, only the rate of CXR use in asthma decreased immediately. The rate of bronchodilator use for bronchiolitis declined in the following five-year period. There were no changes in the rate of decline in overuse for the other tests and treatments associated with the recommendations.
With such a widespread national campaign, a control group of hospitals to better understand the specific influence of the Choosing Wisely® recommendations was not possible. The decline in overuse over the 10-year period reported by Reyes et al. is likely due to a combination of efforts at multiple levels—including national society guidelines, local hospital guidelines and pathways, increased awareness by clinicians of the problem of overuse, and focused quality improvement efforts.
The use of the PHIS database provided Reyes et al. a powerful data source to evaluate overuse across a large number of patients and hospitals efficiently. However, there are limitations with administrative data that are important to consider. Detailed clinical data, such as patient disease characteristics and test and treatment indications, are not available, which limits the specificity of these measures. For example, one of the recommendations suggests that gastroesophageal reflux should not be routinely treated with acid suppression therapy. Using administrative data, it is impossible to know whether the use of antacids in hospitalized children with a primary discharge diagnosis code of gastroesophageal reflux was inappropriate or because they failed other treatments in the outpatient setting and/or had complicated disease appropriately warranting treatment. This misclassification would result in an overestimation of overuse. The authors did attempt to minimize the possibility of misclassification by excluding children with comorbidities, those who had longer hospital stays, those admitted to the intensive care unit, and those with greater severity of illness where some of these tests and treatments would be indicated.
While the report by Reyes et al. focuses on Pediatric Hospital Medicine Choosing Wisely® recommendations, it is important to recognize that tests and treatments for conditions like asthma, bronchiolitis, and lower respiratory tract infections are initially performed in the emergency department (ED). Collaboration between the ED and the Hospital Medicine Unit is essential to tackle the issue of overuse.4
The study by Reyes et al. provides a nice description of the trends in the Choosing Wisely® overuse metrics at a group of children’s hospitals and is one of few such reports. The NIH funded, Eliminating Monitor Overuse: pulse oximetry (EMO: SpO2) study is focusing on the 5th Choosing Wisely® Pediatric Hospital Medicine recommendation that was not studied by Reyes.5
So then, with the decline in overuse reported in this study over 10 years, is it time to celebrate? Not yet. There is much work to do in the pursuit of Choosing Wisely®: developing a host of valid measures of overuse in pediatric hospital care, expanding the examination of overuse to community hospitals where the majority of children are hospitalized, and using implementation science theory to de-implement the ingrained practices.
The Choosing Wisely® campaign, launched in 2012 by the American Board of Internal Medicine, aims to reduce overuse of tests and treatments that do not add value for patients. The campaign has caught the attention of the medical profession and spread internationally. Over the last seven years, most specialty societies have published specific recommendations on what tests and treatments clinicians should stop doing. However, has this campaign actually had an impact on the testing and treating behaviors of clinicians?
In this issue of the Journal of Hospital Medicine, Reyes and colleagues examine changes in five overuse metrics linked with the 2013 Choosing Wisely® Pediatric Hospital Medicine recommendations at 37 children’s hospitals from 2008 to 2017, five years before and after the recommendations were published.1,2 The tests and treatments targeted by these recommendations are not individually costly, but given the high prevalence of the conditions, the cumulative cost is not insignificant. More importantly, reducing the potentially harmful long-term effects of unnecessary radiation and adverse effects from exposure to inappropriate systemic steroids and antacids is a laudable goal. Results from unnecessary tests may also lead to a further cascade of unnecessary testing and/or treatment.3
The authors used an administrative data source, the Pediatric Health Information System (PHIS), to measure billing charges for the tests and medications linked with the overuse measures in over 278,000 hospitalizations. The good news is that overuse declined over the 10-year study period. After adjusting for differences in patient characteristics over time, they observed a substantial absolute reduction in bronchiolitis bronchodilator use (36.6%, from 64% in 2008 to 27.4% in 2017) and chest x-ray (CXR) use (31.5%, from 58.4% to 26.9%). There were also reductions for the other metrics: acid-suppressing medications for gastroesophageal reflux (24.1%, from 63% to 48.9%), asthma CXR use (20.8%, from 52.8% to 32%), and steroids for lower respiratory tract infections (2.9%, from 15.1% to 12.2%). We would not expect the goal for these overuse metrics to be zero percent given the diagnostic uncertainties in real-world clinical decision-making.
The Choosing Wisely® Pediatric Hospital Medicine recommendations, however, were associated with only a modest impact on the overuse decline. A before-and-after interrupted time series analysis showed that the overuse measures were on the downturn prior to the recommendations being published. Then after publication, only the rate of CXR use in asthma decreased immediately. The rate of bronchodilator use for bronchiolitis declined in the following five-year period. There were no changes in the rate of decline in overuse for the other tests and treatments associated with the recommendations.
With such a widespread national campaign, a control group of hospitals to better understand the specific influence of the Choosing Wisely® recommendations was not possible. The decline in overuse over the 10-year period reported by Reyes et al. is likely due to a combination of efforts at multiple levels—including national society guidelines, local hospital guidelines and pathways, increased awareness by clinicians of the problem of overuse, and focused quality improvement efforts.
The use of the PHIS database provided Reyes et al. a powerful data source to evaluate overuse across a large number of patients and hospitals efficiently. However, there are limitations with administrative data that are important to consider. Detailed clinical data, such as patient disease characteristics and test and treatment indications, are not available, which limits the specificity of these measures. For example, one of the recommendations suggests that gastroesophageal reflux should not be routinely treated with acid suppression therapy. Using administrative data, it is impossible to know whether the use of antacids in hospitalized children with a primary discharge diagnosis code of gastroesophageal reflux was inappropriate or because they failed other treatments in the outpatient setting and/or had complicated disease appropriately warranting treatment. This misclassification would result in an overestimation of overuse. The authors did attempt to minimize the possibility of misclassification by excluding children with comorbidities, those who had longer hospital stays, those admitted to the intensive care unit, and those with greater severity of illness where some of these tests and treatments would be indicated.
While the report by Reyes et al. focuses on Pediatric Hospital Medicine Choosing Wisely® recommendations, it is important to recognize that tests and treatments for conditions like asthma, bronchiolitis, and lower respiratory tract infections are initially performed in the emergency department (ED). Collaboration between the ED and the Hospital Medicine Unit is essential to tackle the issue of overuse.4
The study by Reyes et al. provides a nice description of the trends in the Choosing Wisely® overuse metrics at a group of children’s hospitals and is one of few such reports. The NIH funded, Eliminating Monitor Overuse: pulse oximetry (EMO: SpO2) study is focusing on the 5th Choosing Wisely® Pediatric Hospital Medicine recommendation that was not studied by Reyes.5
So then, with the decline in overuse reported in this study over 10 years, is it time to celebrate? Not yet. There is much work to do in the pursuit of Choosing Wisely®: developing a host of valid measures of overuse in pediatric hospital care, expanding the examination of overuse to community hospitals where the majority of children are hospitalized, and using implementation science theory to de-implement the ingrained practices.
1. Reyes M, Etigner B, Hall M, et al. Impact of the choosing wisely campaign recommendations for hospitalized children on clinical practice: trends from 2008 to 2017 [published online ahead of print September 18, 2019]. J Hosp Medicine. 2020;15(2):124-125. https://doi.org/10.12788/jhm.3291
2. Quinonez RA, Garber MD, Schroeder AR, et al. Choosing wisely in pediatric hospital medicine: five opportunities from improved healthcare value. J Hosp Med. 2013;8(9):479-495. https://doi.org/10.1002/jhm.2064.
3. Schuh S, Lalani A, Allen U, et al. Evaluation of the utility of radiography in acute bronchiolitis. J Pediatr. 2007;150(4):429-433. https://doi.org/16/j.jpeds.2007.01.005.
4. Mussman GM, Lossius M, Wasif F, et al. Multisite emergency department inpatient collaborative to reduce unnecessary bronchiolitis care. Pediatrics. 2018;141(2):e20170830. https://doi.org/10.1542/peds.2017-0830.
5. Rasooly IR, Beidas RS, Wolk CB, Barg F, et al. Measuring overuse of continuous pulse oximetry in bronchiolitis and developing strategies for large-scale deimplementation: study protocol for a feasibility trial. Pilot Feasibility Stud. 2019;5(1):68. https://doi.org/10.1186/s40814-019-0453-2.
1. Reyes M, Etigner B, Hall M, et al. Impact of the choosing wisely campaign recommendations for hospitalized children on clinical practice: trends from 2008 to 2017 [published online ahead of print September 18, 2019]. J Hosp Medicine. 2020;15(2):124-125. https://doi.org/10.12788/jhm.3291
2. Quinonez RA, Garber MD, Schroeder AR, et al. Choosing wisely in pediatric hospital medicine: five opportunities from improved healthcare value. J Hosp Med. 2013;8(9):479-495. https://doi.org/10.1002/jhm.2064.
3. Schuh S, Lalani A, Allen U, et al. Evaluation of the utility of radiography in acute bronchiolitis. J Pediatr. 2007;150(4):429-433. https://doi.org/16/j.jpeds.2007.01.005.
4. Mussman GM, Lossius M, Wasif F, et al. Multisite emergency department inpatient collaborative to reduce unnecessary bronchiolitis care. Pediatrics. 2018;141(2):e20170830. https://doi.org/10.1542/peds.2017-0830.
5. Rasooly IR, Beidas RS, Wolk CB, Barg F, et al. Measuring overuse of continuous pulse oximetry in bronchiolitis and developing strategies for large-scale deimplementation: study protocol for a feasibility trial. Pilot Feasibility Stud. 2019;5(1):68. https://doi.org/10.1186/s40814-019-0453-2.
© 2019 Society of Hospital Medicine
Quality and Safety of Pediatric Inpatient Care in Community Hospitals: A Scoping Review
Despite efforts to provide high-quality healthcare, Americans die from medical errors each year and many patients do not receive recommended medical care. Risk is particularly acute during times of hospitalization.1-4 In response, the Institute of Medicine (IOM, now the Academy of Medicine) has released “Crossing the Quality Chasm: A New Health System for the 21st Century,” providing a framework to guide delivery and measurement of high-quality healthcare.5
Although the IOM framework has motivated the development of quality improvement (QI) and quality measurement initiatives, relatively few resources have been allocated to improving the quality of pediatric inpatient care.6,7 The resultant gap in our knowledge of quality and safety of pediatric hospital-based care is further widened by the variability of settings in which children are hospitalized. These settings include freestanding children’s hospitals, children’s hospitals nested within larger hospitals, and community hospitals, defined as general, nonuniversity, and nonchildren’s hospitals.8
Although almost three-quarters of children needing hospitalization are cared for outside of freestanding children’s hospitals, we know particularly little about the quality and safety of pediatric hospital-based care outside of these settings.6,9 Therefore, our scoping review aims to summarize literature regarding the quality and safety of pediatric inpatient care within community hospitals.
METHODS
We used a scoping review approach because this methodology, by design, is utilized to synthesize evidence and map existing literature and is particularly useful when a body of literature is heterogeneous, rendering a more targeted systematic review approach infeasible.10 This methodology thereby provided an organized approach to answer our broad research question, “What evidence exists regarding the quality and safety of pediatric inpatient care in United States community hospitals?“ We followed the scoping review guidelines put forth by the Joanna Briggs Institute and the Preferred Reporting Items for Systematic Reviews and Meta-Analyses (PRISMA) reporting guideline Extension for Scoping Reviews.10,11
Data Sources and Search Strategies
We searched Medline, Medline-In-Process, Embase, the Cochrane Database of Systematic Reviews, the Cumulative Index to Nursing and Allied Health Literature (CINAHL), PsycINFO, and Scopus for studies that reported at least one outcome related to healthcare quality or patient safety and involved pediatric patients (aged <18 years) receiving inpatient care at a community hospital. Outcomes included measures from the IOM-defined aims of quality healthcare: (1) safety, (2) effectiveness, (3) efficiency, (4) timeliness, (5) patient-centeredness, and (6) equity (Appendix Table 1). Terms were searched as controlled vocabulary in applicable databases (Medline, Embase, CINAHL, PsycINFO) and as keywords in all databases. Search strategies tailored to each database were developed, tested, and refined in collaboration with a reference librarian. Date parameters for retrieval were set from 1989 to the search date, with the start date chosen to correspond with the establishment of the Agency for Health Care Policy and Research, currently known as the Agency for Healthcare Research and Quality (AHRQ), targeting literature produced in the wake of the AHRQ emphasis on quality in healthcare. Results were limited to articles published in English. Searches were conducted on October 24 and 25, 2016. Complete search strategies can be found in Appendix Methods.
Independent authors performed handsearches of Academic Pediatrics, BMJ Quality & Safety, Hospital Pediatrics, JAMA Pediatrics, and Pediatrics Quality Reports for the five years preceding the search date (July 2011-October 2016).
Study Selection and Definitions
To identify studies conducted in community hospitals, we operationalized the definition of community hospital proposed by Percelay.8 We used “community”, “general”, “nonuniversity”, and “nonchildren’s” as search terms and operationalized these through the addition of qualifying descriptors (Table 1).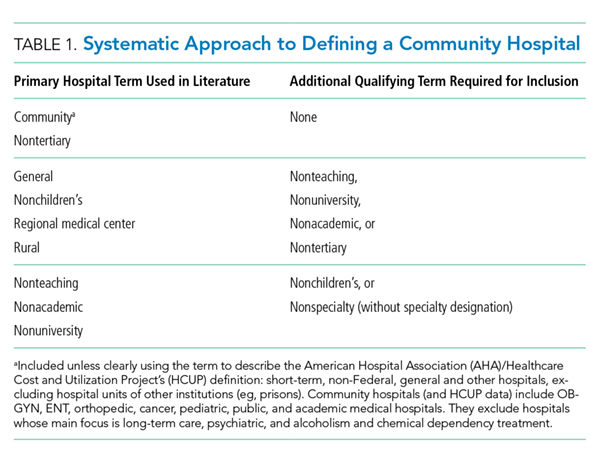
Studies were excluded if they (1) were performed outside of the United States, as community hospital definitions may differ by country; (2) included participants aged >18 years and did not report any pediatric-specific results; (3) were performed exclusively in tertiary hospitals; (4) evaluated only outpatient or emergency department care; (5) did not report any results specific to community hospitals; (6) did not report any data-driven or parent/patient-reported measures of safety, effectiveness, efficiency, timeliness, patient-centeredness, or equity in their results; and (7) were case reports, case series, editorials, or abstracts without an associated full-text article. We read commentaries and literature reviews related to our objectives and reviewed their references to identify additional articles, but did not include these manuscripts.
Two authors independently reviewed each abstract, and full-text articles were reviewed if one or more authors determined that the abstract met the inclusion criteria. Two authors then independently reviewed each full-text article to determine whether the article met the criteria for the final review. Disagreements were resolved through consensus after discussion and review with the entire research team, and reasons for exclusion were recorded.
Charting the Results and Data Synthesis
We used a standardized charting form to collect information regarding study design, community hospital terms, population descriptors, IOM aims of quality healthcare, and outcome measures. To minimize bias in data collection, information from each full-text article was extracted independently by two authors, and differences in extraction were resolved through discussion and re-review among the same two authors. To evaluate the quality of included evidence, two authors (JCL and JKL) independently assessed the risk of bias for each study using modified Newcastle-Ottawa Quality Assessment Scales (NOS), with disagreements resolved through discussion and re-review among the same two authors. For cohort studies, five of the eight NOS domains were relevant and applied to all included studies (maximum score 6). Using the NOS adapted for cross-sectional studies, six of the seven domains were relevant and applied (maximum score 9). For cross-sectional studies, we defined the risk of bias to be low for scores ≥8, moderate for scores 5-7, and high for scores ≤4, consistent with previous work.12 For cohort studies, we similarly defined these strata by scores ≥5, 3-4, and ≤2, given the lower maximum score for this study type.
We categorized studies as either observational, defined as cohort or cross-sectional studies of usual healthcare delivery, or interventional, defined as studies evaluating the development and/or implementation of an intervention designed to improve healthcare quality. We further categorized the studies into the following four overarching medical domains: (1) neonatal, (2) pediatric medicine, (3) surgery, or (4) radiology.
RESULTS
After removal of duplicates, our search identified 2,068 abstracts for screening (Figure). Of these, 1,777 did not meet the inclusion criteria, leaving 291 articles for full-text review. Of these, 43 articles met all the inclusion criteria, and one additional article was included from search of references, resulting in a total of 44 articles.
Study designs, patient populations, and quality outcome measures were heterogeneous. We identified only one randomized controlled trial (RCT). A total of 30 articles were observational studies, 27 of which used retrospective cohort or cross-sectional designs; the remaining three used prospective cohort designs (Table 2). Of these studies, 20 involved multiple hospitals, whereas 10 were conducted at a single community hospital. Sample sizes ranged from 29 (single-site) to 107,727 (multisite) patients. Twenty-two studies aimed to compare quality outcomes at community hospitals with other hospital types, of which 16 performed risk-adjusted analyses (detailed findings of observational studies are summarized in Appendix Table 2). The remaining 14 articles were interventional studies (Table 2). Of these, 12 (86%) reported improvement in quality outcomes after implementation (detailed findings of interventional studies are summarized in Appendix Table 3).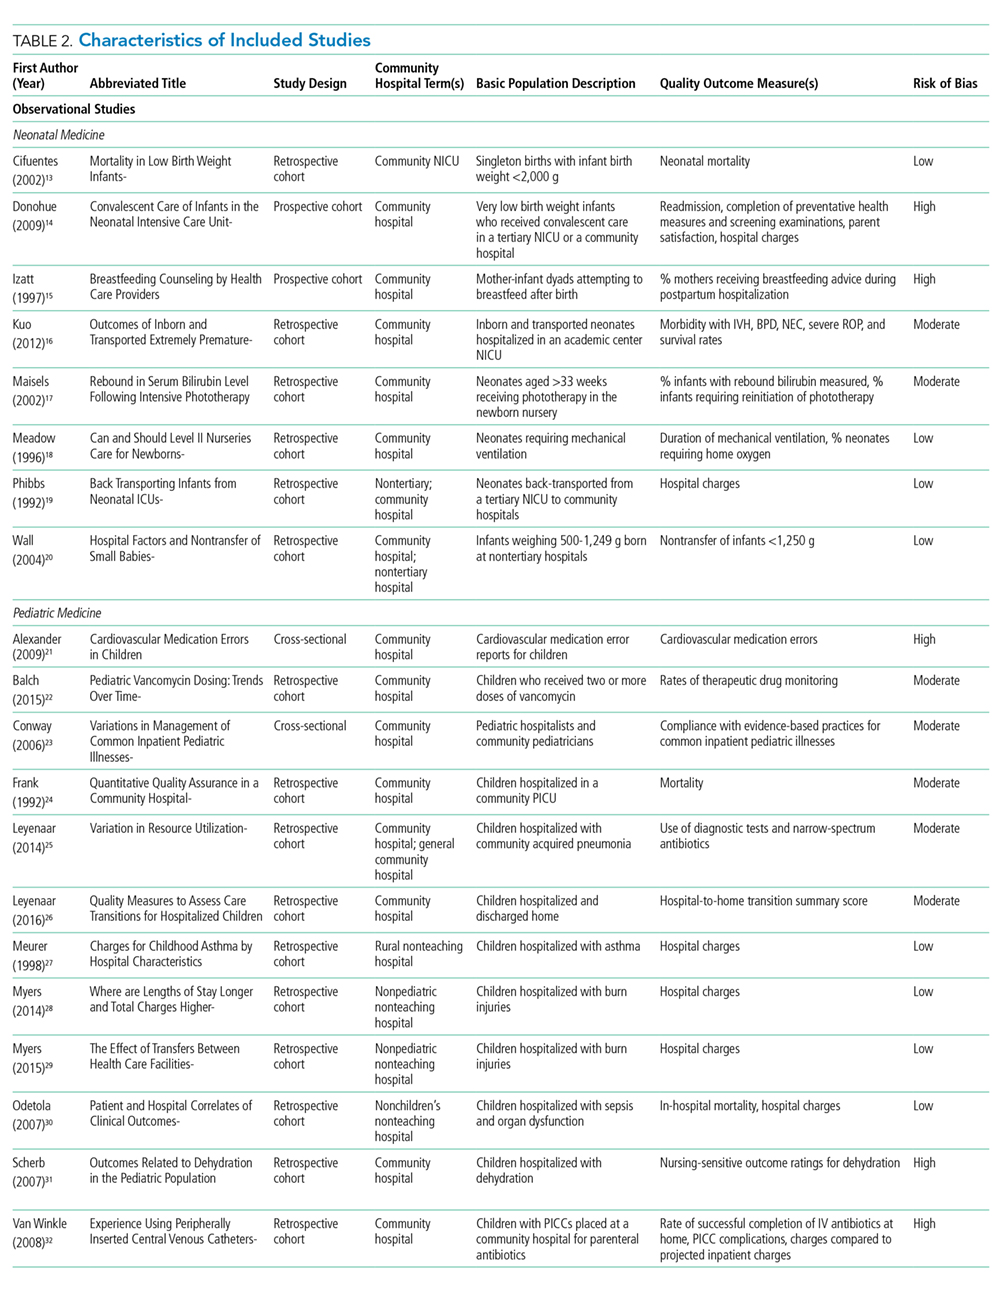
The included studies evaluated quality outcomes addressing all six of the IOM aims of quality healthcare, with safety, effectiveness, and efficiency being the most predominant (Table 3). Patient-centeredness and timeliness were infrequently addressed, and only one study assessed equity.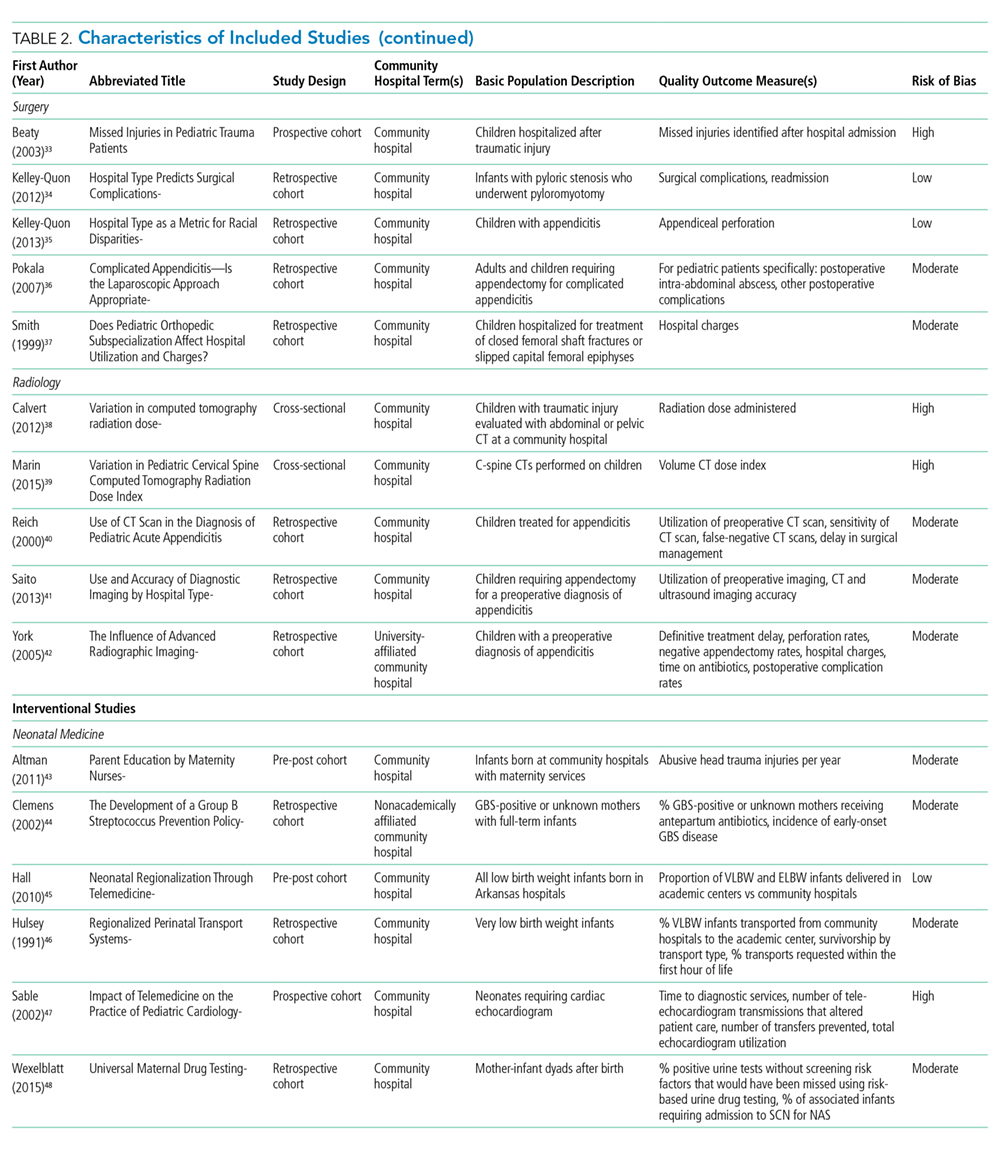
Risk of bias was moderate or high for 27 (69%) of the observational and interventional cohort studies and four (100%) of the included cross-sectional studies (Table 2), with the median NOS score being 4 (range: 0-6) for cohort studies (Appendix Table 4) and 4 (range: 3-6) for cross-sectional studies (Appendix Table 5). The higher risk of bias was largely driven by low comparability scores due to inadequate risk adjustment or statistical reporting. Of the 12 studies with low risk of bias, 11 (92%) were multisite, 9 (75%) used large regional or national databases, and half reported quality outcomes limited to hospital charges and/or mortality.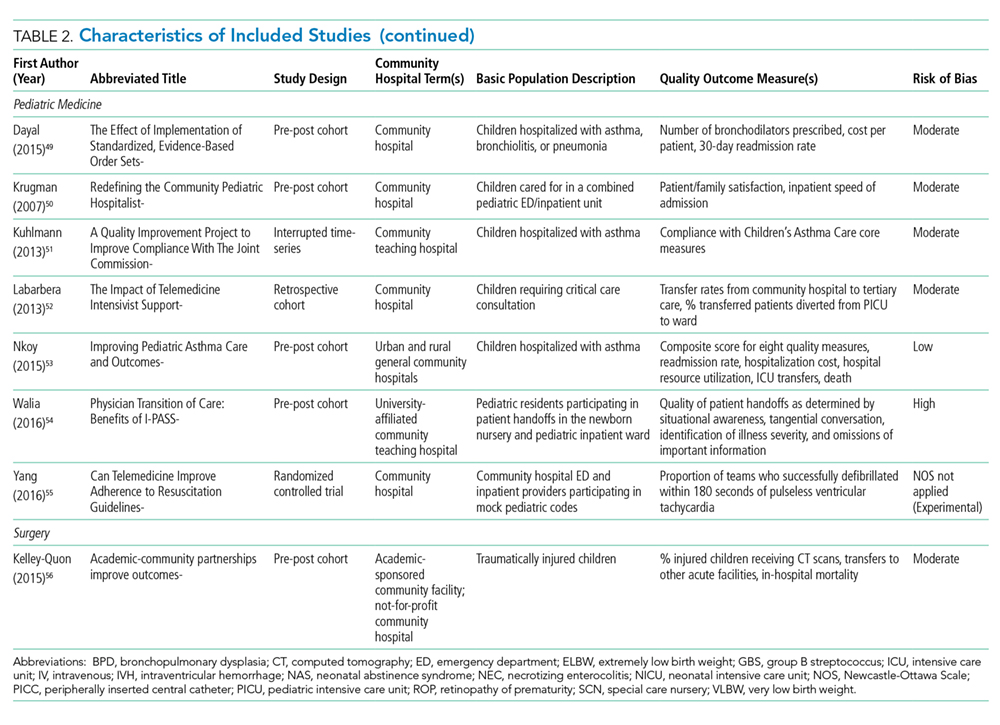
Observational Studies
Neonatal Medicine
Five multisite studies focused on neonatal care,13,14,16,19,20 of which four examined outcomes associated with the transfer of neonates to or from community hospitals to tertiary care hospitals, such as neonatal morbidity, readmission, completion of preventative health measures and screening, parent satisfaction, and hospital charges.14,16,19,20 For example, in a study of extremely premature very low birth weight infants born in Hawaii, Kuo et al. demonstrated that the odds of retinopathy of prematurity was 2.9 times higher for infants born at a community hospital and transported to their tertiary center compared with those inborn at the tertiary center (P = .02).16 The fifth study examined neonatal mortality by site of birth, demonstrating that, among infants with birth weights less than 2,000 g, birth at a hospital with a community neonatal intensive care unit (NICU) was associated with 1.4 times higher odds of risk-adjusted mortality compared with birth at a regional NICU (P < .001).13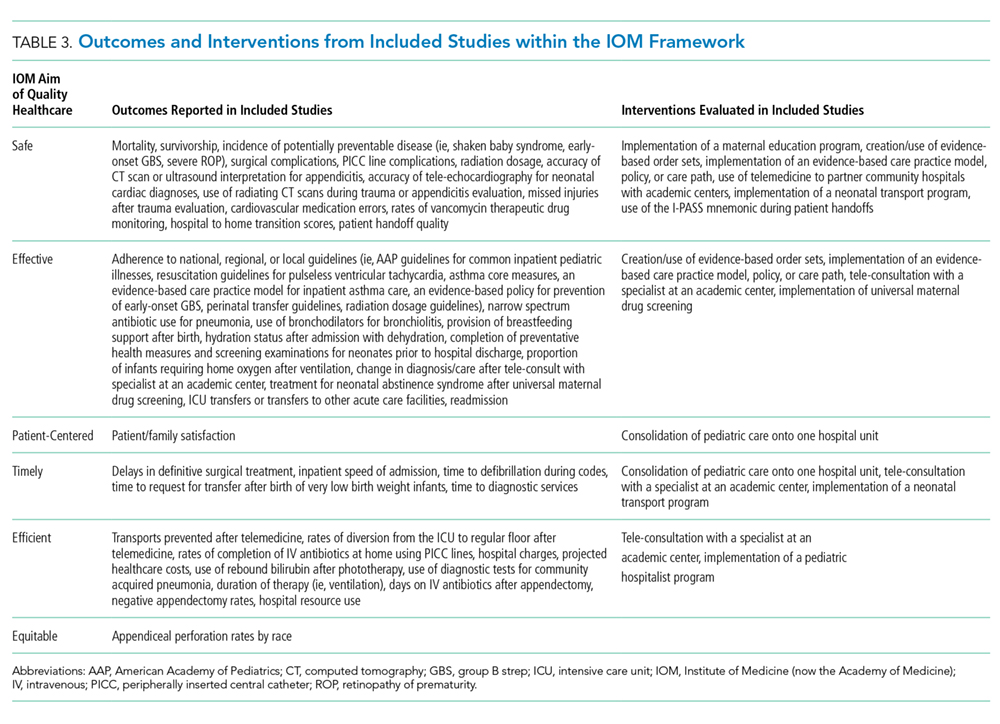
Three studies evaluated the quality of neonatal care at a single community hospital.15,17,18 Quality outcomes were heterogeneous, including utility of rebound bilirubin levels for infants with jaundice, morbidity of neonates requiring mechanical ventilation, and provision of breastfeeding advice to mothers of breastfeeding infants. For instance, Meadow et al. attempted to determine the quality of care for ventilated neonates at one community NICU compared with a tertiary hospital.18 They found no difference in days on ventilation or need for home oxygen therapy between the community hospital and the tertiary center, although P values and effect sizes were not reported for these outcomes and analyses were not adjusted beyond matching on birthdate and birth weight.
Pediatric Medicine
Nine multisite studies explored the quality and safety of pediatric medical care across hospital types.21-23,25-30 Of these, four were conducted using the Kids’ Inpatient Database (KID)28-30 or the National Inpatient Sample (NIS),27 two were conducted using other national databases,21,25 and two were conducted using electronic medical record data.22,26 All of the KID and NIS studies examined hospital charges, either alone or in conjunction with mortality. Two of these studies found no differences in risk-adjusted hospital charges between children’s hospitals and community hospitals (for burn injuries),28,29 whereas two found that hospitalization at community hospitals was associated with lower risk-adjusted charges (for asthma and sepsis).27,30 The remaining five studies evaluated diverse quality outcomes such as medication errors, therapeutic drug monitoring, practice guideline compliance, antibiotic prescribing, or hospital-to-home transition summary scores.21-23,25,26
Three single-site studies examined quality outcomes for pediatric medical patients, including mortality, outcome ratings for dehydration, and measures of peripherally inserted central catheter (PICC) safety and effectiveness.24,31,32 For example, Frank et al. evaluated safety of care in one community hospital pediatric intensive care unit (PICU) compared with a tertiary hospital using the Pediatric Risk of Mortality (PRISM) score.24 They reported that the observed number of deaths in their community PICU did not differ significantly from the number of deaths predicted in a tertiary center (23 vs 33, respectively, P > .2).
Surgery
Three multisite studies examined quality outcomes among children with surgical conditions, including surgical complications, readmission, and hospital charges.34,35,37 For example, Kelley-Quon et al. examined outcomes following surgery in infants with hypertrophic pyloric stenosis and found that infants who received their surgery at community hospitals had twice the odds of a surgical complication compared with those at children’s hospitals (P = .027).34 They also examined how the risk of appendiceal perforation differed by hospital type, finding that black children who received their surgery at children’s hospitals had twice the odds of appendiceal perforation compared with those who received care at community hospitals.35
In addition, two studies evaluated quality and safety outcomes for pediatric surgical care in a single community hospital.33,36 For example, Beaty et al. prospectively evaluated the incidence of missed injuries in hospitalized pediatric trauma patients, reporting that the incidence of missed injury was 33% when admission evaluation was performed by a trauma surgeon alone compared to 11% when performed by a pediatric doctor or a trauma surgeon and a pediatric doctor together (P < .001).33
Radiology
Three multisite studies examined quality and safety outcomes associated with radiographic imaging in community hospitals, including radiation dosing and frequency of preoperative imaging modalities and accuracy.38,39,41 For instance, Marin et al. found substantial variation in radiation dose across hospital types, with children’s hospitals delivering lower median radiation doses than academic and community hospitals.39 Similarly, Saito et al. demonstrated increased use of radiating modalities when evaluation was performed at community hospitals, with four times higher odds of computed tomography (CT) and five times lower odds of ultrasound use compared to a children’s hospital.41
Two single-site studies also evaluated quality and safety outcomes associated with the use of radiographic imaging for pediatric appendicitis in a community hospital.40,42 For example, York et al. demonstrated that, compared with nonimaged patients, patients who underwent diagnostic imaging for appendicitis experienced a significant time delay from initial evaluation to surgery and incurred significantly higher hospital charges, whereas there were no significant differences in intraoperative findings, antibiotic requirements, and surgical complications between the groups.42
Interventional Studies
Neonatal Medicine
We identified six studies that evaluated interventions to improve healthcare quality for neonates in community hospitals; two involved telemedicine.43-48 Hall et al. described “Telenursery,” a program linking regional perinatal centers with a large academic neonatal practice through real-time teleconferencing, in addition to providing weekly educational conferences.45 After its implementation, there was an increase in the state-recommended delivery of very low birth weight infants at the regional perinatal center from 24% to 33% (P < .05); clinical outcomes were not discussed. In a similar study, Sable et al. found that a videoconferencing system for cardiologists from an academic center to guide care in a community setting provided diagnostic services more quickly (28 minutes vs 12 hours) and had high diagnostic accuracy.47 The remaining four studies evaluated heterogeneous interventions such as a maternal education program to reduce shaking injuries to infants or implementation of evidence-based order sets to reduce early onset group B streptococcal disease in neonates.43,44,46,48 Five of the six neonatal studies demonstrated improved quality outcomes after intervention.43-47
Pediatric Medicine
Seven studies evaluated QI interventions for children at community hospitals,49-55 three of which described interventions to improve quality of management of respiratory diseases.49,51,53 Dayal et al. evaluated the implementation of respiratory illness order sets and an asthma pathway, demonstrating a 41% reduction in asthma hospitalization cost per patient (P < .05), reduced bronchodilator use for all respiratory illnesses, and no change in readmission rates.49 Similarly, Nkoy et al. evaluated an asthma “Evidence-Based Care Practice Model” implemented at seven community hospitals and demonstrated a nonsignificant reduction in readmissions (P = .12), as well as lower hospitalization costs (P = .05).53 Using QI methods, Kuhlmann et al. demonstrated improved compliance from 43% to 97% with the Asthma Home Management Plan of Care measure.51 The remaining four studies evaluated heterogeneous interventions, including telemedicine critical care consultations, use of I-PASS, and consolidation of pediatric care onto one hospital unit.50,52,54,55 Six of the seven pediatric studies (86%) demonstrated improved inpatient quality outcomes after intervention,49,51-55 but only one study was multisite.53
Surgery
We identified only one study evaluating a surgical intervention aimed at improving the quality of pediatric care.56 Kelley-Quon evaluated the impact of a community hospital partnering with an Academic Medical Pediatric Trauma Center to become a Level II Pediatric Trauma Center (PTC). After achieving Level II PTC designation, they reported that children treated at the community hospital had reduced rates of CT use, transfers, and in-hospital mortality (from 81% to 51%, 8.5% to 2.5%, and 2% to 0.4%, respectively, P < .05 for all) compared to those treated predesignation.
Radiology
Within the domain of radiology, our review identified no interventional studies.
DISCUSSION
In this scoping review of the quality and safety of pediatric inpatient care in community hospitals, we identified 44 studies applying heterogeneous study designs and evaluating diverse patient populations and quality outcomes. We identified only one RCT in our search; all the remaining studies applied observational designs.
We found only three clinical areas that were explored in multiple studies, with consistent directionality of results: (1) perinatal regionalization, (2) telemedicine, and (3) imaging radiation. The limited evidence identified in our review suggests that delivery of early premature infants at community hospitals, rather than at tertiary hospitals, may increase risk of neonatal morbidity and/or mortality,13,16,46 that use of telemedicine may improve the effectiveness and efficiency of intensive or specialized care in community settings,45,47,52,55 and that CT use and radiation doses may be higher in community hospitals compared with other settings.38,39,41 However, even within these clinical domains, the literature was limited in amount and heterogeneous; additional research is needed to systematically review the effect of individual interventions or particular community hospital quality outcomes compared with other hospital types.
Our search identified only 14 studies evaluating QI interventions within community hospitals over the almost 30-year review period. Although limited in number, 86% of these demonstrated improvements in healthcare quality and safety, providing a positive “proof of concept” that pediatric care in community hospitals can be improved by multidisciplinary efforts and be sustained over time.43-47,49,51-56 As pediatric departments within community hospitals may have limited resources, aligning pediatric QI efforts with adult initiatives within the same hospitals could prove advantageous. However, we did not identify any studies meeting our inclusion criteria that took this approach. Alternatively, QI collaboratives across structurally diverse hospitals may provide valuable infrastructure for QI in community hospitals. For example, the Value in Inpatient Pediatrics Network has conducted several multisite QI initiatives that have engaged both children’s and community hospitals.57-60 However, none of these studies have reported community hospital-specific quality outcomes, resulting in their exclusion from this review. In future study, researchers may consider separating community hospital results from those of pediatric hospitals to highlight the effect of community hospital-specific QI efforts and to allow valuable direct comparisons between hospital types.
Many studies identified in our scoping review were conducted at single hospitals. Sample sizes were often very small and power calculations were rarely reported, raising questions about the validity of the “nonsignificant” differences reported by some. Although such single-center studies provide valuable information for local improvement of inpatient care, by design the findings from these studies are unlikely generalizable to other community hospital systems. Without inclusion of another hospital type and/or quality measures with clear national benchmark for comparison, the additional conclusions that can be drawn from these studies are limited. In comparison, many of the multicenter studies had large study samples, but more than half used data registries with limited data to evaluate outcomes, clinical context, or important covariates.13,20,21,25,27-30,34,35,37,39 The most frequently reported outcomes in these data sets—hospital charges and lengths of stay—are of limited utility in understanding healthcare quality without clear benchmarks. As a result, the evidence-base from which to draw conclusions about quality and safety in community hospitals is very limited.
Therefore, our review highlights a great need for additional research in community hospital medicine and the need for high-quality evidence generation. Risk of bias was moderate or high for the majority of included studies because of inadequate risk adjustment or statistical analysis. In the future, multicenter collaborations may help to connect research methodologists with community hospital teams to aid in the application of robust study designs and analytic techniques. Multisite collaboration may also overcome the limitation of small sample sizes that are a reality at many community hospitals.
Our study findings must be considered in the setting of several methodological limitations. The lack of a standard definition for a community hospital has led to inconsistent terms and hospital definitions used in the literature. It is possible that, while following our systematic approach to define a community hospital, we inadvertently missed relevant studies that used different terms. We also excluded unpublished articles. Given that publication bias tends to favor studies with significant associations, it is possible that some studies with insignificant changes in quality outcomes were missed. Finally, in our exclusion of all non-US studies, we may have unknowingly missed literature from countries with community hospital definitions similar to those in the United States.
CONCLUSIONS
Recognizing that more than half of all children admitted to hospitals in the US receive their care at community hospitals, understanding healthcare quality in community hospitals is important. This scoping review underscores the need for additional research and higher quality evidence to determine the quality of pediatric inpatient care in these settings and identifies some particularly wide gaps that could be targeted in future research. Acknowledging that further research is necessary to address all aims of quality healthcare, markedly few studies have examined timeliness, equity, or patient-centeredness. Collaborations between academic medical centers and community hospitals may be an effective means to connect researchers with community hospital clinical teams to facilitate the application of robust study designs and analytic approaches and to facilitate multisite investigations. Research in this field would benefit from a standardized definition of a community hospital that could be consistently applied in research and QI endeavors.
Disclosures
The authors have no potential conflicts of interest to disclose.
Funding
Jana Leary was supported by the National Center for Advancing Translational Sciences, National Institutes of Health, Grant Number 5TL1TR0001062-03. JoAnna Leyenaar was supported by the Agency for Healthcare Research and Quality (K08HS024133).
Disclaimer
The content is solely the responsibility of the authors and does not necessarily represent the official views of the NIH or the AHRQ.
1. McGlynn EA, Asch SM, Adams J, et al. The quality of health care delivered to adults in the United States. N Engl J Med. 2003;348(26):2635-2645. https://doi.org/10.1056/NEJMsa022615.
2. Richardson WC, Berwick DM, Bisgard C, et al. To err is human: building a safer health system-Institute of Medicine. Medscape. http://www.iom.edu/Reports/1999/To-Err-is-Human-Building-A-Safer-Health-System.aspx; 2000. Accessed October 7, 2016.
3. Classen DC, Resar R, Griffin F, et al. ‘Global Trigger Tool’ shows that adverse events in hospitals may be ten times greater than previously measured. Health Aff. 2011;30(4):581-589. https://doi.org/10.1377/hlthaff.2011.0190.
4. Stockwell DC, Landrigan CP, Schuster MA, et al. Using a pediatric trigger tool to estimate total harm burden hospital-acquired conditions represent. Pediatr Qual Saf. 2018;3(3):e081. https://doi.org/10.1097/pq9.0000000000000081.
5. Institute of Medicine (US) Committee on Quality of Health Care in America. Crossing the Quality Chasm. Washington (DC): National Academies Press (US); 2001. https://doi.org/10.17226/10027.
6. Rauch DA, Lye PS, Carlson D, et al. Pediatric hospital medicine: a strategic planning roundtable to chart the future. J Hosp Med. 2012;7(4):329-334. https://doi.org/10.1002/jhm.950.
7. Simpson L, Fairbrother G, Hale S et al. Reauthorizing SCHIP: Opportunities for Promoting Effective Health Coverage and HighQuality Care for Children and Adolescents. (Publication 1051). Commonw Fund; 2007.
8. Percelay JM. Pediatric hospitalists working in community hospitals. Pediatr Clin North Am. 2014;61(4):681-691. https://doi.org/10.1016/j.pcl.2014.04.005.
9. Leyenaar JK, Ralston SL, Shieh MS et al. Epidemiology of pediatric hospitalizations at general hospitals and freestanding children’s hospitals in the United States. J Hosp Med. 2016;11(11):743-749. https://doi.org/10.1002/jhm.2624.
10. Peters MDJ, Godfrey CM, Khalil H et al. Guidance for conducting systematic scoping reviews. Int J Evid Based Healthc. 2015;13(3):141-146. https://doi.org/10.1097/XEB.0000000000000050.
11. Tricco AC, Lillie E, Zarin W, et al. PRISMA extension for scoping reviews (PRISMA-ScR): checklist and explanation. Ann Intern Med. 2018;169(7):467-473. https://doi.org/10.7326/M18-0850.
12. Alobaidi R, Morgan C, Basu RK, et al. Association between fluid balance and outcomes in critically ill children: a systematic review and meta-analysis. JAMA Pediatr. 2018;172(3):257-268. https://doi.org/10.1001/jamapediatrics.2017.4540.
13. Cifuentes J, Bronstein J, Phibbs CS et al. Mortality in low birth weight infants according to level of neonatal care at hospital of birth. Pediatrics. 2002;109(5):745-751. https://doi.org/10.1542/peds.109.5.745.
14. Donohue PK, Hussey-Gardner B, Sulpar LJ, Fox R, Aucott SW. Convalescent care of infants in the neonatal intensive care unit in community hospitals: risk or benefit? Pediatrics. 2009;124(1):105-111. https://doi.org/10.1542/peds.2008-0880.
15. Izatt SD. Breastfeeding counseling by health care providers. J Hum Lact. 1997;13(2):109-113. https://doi.org/10.1177/089033449701300210.
16. Kuo S, Kimata C, Akamine K, Young B, Balaraman V. Outcomes of inborn and transported extremely premature very-low-birthweight infants in Hawai’i. Pediatr Int. 2012;54(3):365-369. https://doi.org/10.1111/j.1442-200X.2012.03561.x.
17. Maisels MJ, Kring E. Rebound in serum bilirubin level following intensive phototherapy. Arch Pediatr Adolesc Med. 2002;156(7):669-672. https://doi.org/10.1001/archpedi.156.7.669.
18. Meadow W, Mendez D, Makela J et al. Can and should level II nurseries care for newborns who require mechanical ventilation? Clin Perinatol. 1996;23(3):551-561. https://doi.org/10.1016/S0095-5108(18)30227-6.
19. Phibbs CS, Mortensen L. Back transporting infants from neonatal intensive care units to community hospitals for recovery care: effect on total hospital charges. Pediatrics. 1992;90(1):22-26.
20. Wall SN, Handler AS, Park CG. Hospital factors and nontransfer of small babies: A marker of deregionalized perinatal care? J Perinatol. 2004;24(6):351-359. https://doi.org/10.1038/sj.jp.7211101.
21. Alexander DC, Bundy DG, Shore AD et al. Cardiovascular medication errors in children. Pediatrics. 2009;124(1):324-332. https://doi.org/10.1542/peds.2008-2073.
22. Balch AH, Constance JE, Thorell EA, et al. Pediatric vancomycin dosing: trends over time and the impact of therapeutic drug monitoring. J Clin Pharmacol. 2015;55(2):212-220. https://doi.org/10.1002/jcph.402.
23. Conway PH, Edwards S, Stucky ER et al. Variations in management of common inpatient pediatric illnesses: hospitalists and community pediatricians. Pediatrics. 2006;118(2):441-447. https://doi.org/10.1542/peds.2006-0484.
24. Frank BS, Pollack MM. Quantitative quality assurance in a community hospital pediatric intensive care unit. West J Med. 1992;157(2):149-151.
25. Leyenaar JK, Lagu T, Shieh MS, Pekow PS, Lindenauer PK. Variation in resource utilization for the management of uncomplicated community-acquired pneumonia across community and children’s hospitals. J Pediatr. 2014;165(3):585-591. https://doi.org/10.1016/j.jpeds.2014.04.062.
26. Leyenaar JK, Desai AD, Burkhart Q, et al. Quality measures to assess care transitions for hospitalized children. Pediatrics. 2016;138(2):e20160906. https://doi.org/10.1542/peds.2016-0906.
27. Meurer JR, Kuhn EM, George V, Yauck JS, Layde PM. Charges for childhood asthma by hospital characteristics. Pediatrics. 1998;102(6):E70. https://doi.org/10.1542/peds.102.6.e70.
28. Myers J, Lehna C. Where are lengths of stay longer and total charges higher for pediatric burn patients? J Burn Care Res. 2014;35(5):382-387. https://doi.org/10.1097/BCR.0000000000000012.
29. Myers J, Smith M, Woods C, Espinosa C, Lehna C. The effect of transfers between health care facilities on costs and length of stay for pediatric burn patients. J Burn Care Res. 2015;36(1):178-183. https://doi.org/10.1097/BCR.0000000000000206.
30. Odetola FO, Gebremariam A, Freed GL. Patient and hospital correlates of clinical outcomes and resource utilization in severe pediatric sepsis. Pediatrics. 2007;119(3):487-494. https://doi.org/10.1542/peds.2006-2353.
31. Scherb CA, Stevens MS, Busman C. Outcomes related to dehydration in the pediatric population. J Pediatr Nurs. 2007;22(5):376-382. https://doi.org/10.1016/j.pedn.2006.10.004.
32. Van Winkle P, Whiffen T, Liu IL. Experience using peripherally inserted central venous catheters for outpatient parenteral antibiotic therapy in children at a community hospital. ediatr Infect Dis J. 2008;27(12):1069-1072. https://doi.org/10.1097/INF.0b013e31817d32f2.
33. Beaty JS, Chendrasekhar A, Hopkins J, Gruelke L. Missed injuries in pediatric trauma patients. J Appl Res. 2003;3(1):84-88. https://jrnlappliedresearch.com/articles/Vol3Iss1/CHENDRASEKHAR.htm. Accessed July 8, 2019.
34. Kelley-Quon LI, Tseng CH, Jen HC, Shew SB. Hospital type predicts surgical complications for infants with hypertrophic pyloric stenosis. Am Surg. 2012;78(10):1079-1082.
35. Kelley-Quon LI, Tseng CH, Jen HC, Lee SL, Shew SB. Hospital type as a metric for racial disparities in pediatric appendicitis. J Am Coll Surg. 2013;216(1):74-82. https://doi.org/10.1016/j.jamcollsurg.2012.09.018.
36. Pokala N, Sadhasivam S, Kiran RP, Parithivel V. Complicated appendicitis—is the laparoscopic approach appropriate? A comparative study with the open approach: outcome in a community hospital setting. Am Surg. 2007;73(8):732-737.
37. Smith JT, Price C, Stevens PM, Masters KS, Young M. Does pediatric orthopedic subspecialization affect hospital utilization and charges? J Pediatr Orthop. 1999;19(4):553-555. https://doi.org/10.1097/01241398-199907000-00027.
38. Calvert C, Strauss KJ, Mooney DP. Variation in computed tomography radiation dose in community hospitals. J Pediatr Surg. 2012;47(6):1167-1169. https://doi.org/10.1016/j.jpedsurg.2012.03.021.
39. Marin JR, Sengupta D, Bhargavan-Chatfield M et al. Variation in pediatric cervical spine computed tomography radiation dose index. Acad Emerg Med. 2015;22(12):1499-1505. https://doi.org/10.1111/acem.12822.
40. Reich JD, Brogdon B, Ray WE, Eckert J, Gorell H. Use of CT scan in the diagnosis of pediatric acute appendicitis. Pediatr Emerg Care. 2000;16(4):241-243. https://doi.org/10.1097/00006565-200008000-00006.
41. Saito JM, Yan Y, Evashwick TW, Warner BW, Tarr PI. Use and accuracy of diagnostic imaging by hospital type in pediatric appendicitis. Pediatrics. 2013;131(1):e37-e44. https://doi.org/10.1542/peds.2012-1665.
42. York D, Smith A, Phillips JD, Von Allmen D. The influence of advanced radiographic imaging on the treatment of pediatric appendicitis. J Pediatr Surg. 2005;40(12):1908-1911. https://doi.org/10.1016/j.jpedsurg.2005.08.004.
43. Altman RL, Canter J, Patrick PA et al. Parent education by maternity nurses and prevention of abusive head trauma. Pediatrics. 2011;128(5):e1164-e1172. https://doi.org/10.1542/peds.2010-3260.
44. Clemens CJ, Gable EK. The development of a group B streptococcus prevention policy at a community hospital. J Perinatol. 2002;22(7):523-525. https://doi.org/10.1038/sj.jp.7210794.
45. Hall RW, Hall-Barrow J, Garcia-Rill E. Neonatal regionalization through telemedicine using a community-based research and education core facility. Ethn Dis. 2010;20(1 Suppl 1):S136-S140.
46. Hulsey TC, Pittard WB 3rd, Ebeling M. Regionalized perinatal transport systems: association with changes in location of birth, neonatal transport, and survival of very low birth weight deliveries. J S C Med Assoc. 1991;87(12):581-584.
47. Sable CA, Cummings SD, Pearson GD, et al. Impact of telemedicine on the practice of pediatric cardiology in community hospitals. Pediatrics. 2002;109(1):E3. https://doi.org/10.1542/peds.109.1.e3.
48. Wexelblatt SL, Ward LP, Torok K et al. Universal maternal drug testing in a high-prevalence region of prescription opiate abuse. J Pediatr. 2015;166(3):582-586. https://doi.org/10.1016/j.jpeds.2014.10.004.
49. Dayal A, Alvarez F. The effect of implementation of standardized, evidence-based order sets on efficiency and quality measures for pediatric respiratory illnesses in a community hospital. Hosp Pediatr. 2015;5(12):624-629. https://doi.org/10.1542/hpeds.2015-0140.
50. Krugman SD, Suggs A, Photowala HY, Beck A. Redefining the community pediatric hospitalist: the combined Pediatric ED/Inpatient Unit. Pediatr Emerg Care. 2007;23(1):33-37. https://doi.org/10.1097/01.pec.0000248685.94647.01.
51. Kuhlmann S, Mason B, Ahlers-Schmidt CR. A quality improvement project to improve compliance with the joint commission children’s asthma care-3 measure. Hosp Pediatr. 2013;3(1):45-51. https://doi.org/10.1542/hpeds.2012-0015.
52. Labarbera JM, Ellenby MS, Bouressa P et al. The impact of telemedicine intensivist support and a pediatric hospitalist program on a community hospital. Telemed J E Health. 2013;19(10):760-766. https://doi.org/10.1089/tmj.2012.0303.
53. Nkoy F, Fassl B, Stone B, et al. Improving pediatric asthma care and outcomes Across multiple hospitals. Pediatrics. 2015;136(6):e1602-e1610. https://doi.org/10.1542/peds.2015-0285.
54. Walia J, Qayumi Z, Khawar N, et al. Physician transition of care: benefits of I-PASS and an electronic handoff system in a community pediatric residency program. Acad Pediatr. 2016;16(6):519-523. https://doi.org/10.1016/j.acap.2016.04.001.
55. Yang CP, Hunt EA, Shilkofski N et al. Can telemedicine improve adherence to resuscitation guidelines for critically ill children at community hospitals? A randomized controlled trial using high-fidelity simulation. Pediatr Emerg Care. 2017;33(7):474-479. https://doi.org/10.1097/PEC.0000000000000653.
56. Kelley-Quon LI, Crowley MA, Applebaum H, et al. Academic-community partnerships improve outcomes in pediatric trauma care. J Pediatr Surg. 2015;50(6):1032-1036. https://doi.org/10.1016/j.jpedsurg.2015.03.033.
57. Ralston S, Garber M, Narang S, et al. Decreasing unnecessary utilization in acute bronchiolitis care: results from the value in inpatient pediatrics network. J Hosp Med. 2013;8(1):25-30. https://doi.org/10.1002/jhm.1982.
58. Ralston SL, Garber MD, Rice-Conboy E, et al. A multicenter collaborative to reduce unnecessary care in inpatient bronchiolitis. Pediatrics. 2016;137(1):e20150851. https://doi.org/10.1542/peds.2015-0851.
59. Parikh K, Biondi E, Nazif J, et al. A multicenter collaborative to improve care of community acquired pneumonia in hospitalized children. Pediatrics. 2017;139(3):e20161411. https://doi.org/10.1542/peds.2016-1411.
60. Leyenaar JK, Bergert L, Mallory LA, et al. Pediatric primary care providers’ perspectives regarding hospital discharge communication: a mixed methods analysis. Acad Pediatr. 2015;15(1):61-68. https://doi.org/10.1016/j.acap.2014.07.004.
Despite efforts to provide high-quality healthcare, Americans die from medical errors each year and many patients do not receive recommended medical care. Risk is particularly acute during times of hospitalization.1-4 In response, the Institute of Medicine (IOM, now the Academy of Medicine) has released “Crossing the Quality Chasm: A New Health System for the 21st Century,” providing a framework to guide delivery and measurement of high-quality healthcare.5
Although the IOM framework has motivated the development of quality improvement (QI) and quality measurement initiatives, relatively few resources have been allocated to improving the quality of pediatric inpatient care.6,7 The resultant gap in our knowledge of quality and safety of pediatric hospital-based care is further widened by the variability of settings in which children are hospitalized. These settings include freestanding children’s hospitals, children’s hospitals nested within larger hospitals, and community hospitals, defined as general, nonuniversity, and nonchildren’s hospitals.8
Although almost three-quarters of children needing hospitalization are cared for outside of freestanding children’s hospitals, we know particularly little about the quality and safety of pediatric hospital-based care outside of these settings.6,9 Therefore, our scoping review aims to summarize literature regarding the quality and safety of pediatric inpatient care within community hospitals.
METHODS
We used a scoping review approach because this methodology, by design, is utilized to synthesize evidence and map existing literature and is particularly useful when a body of literature is heterogeneous, rendering a more targeted systematic review approach infeasible.10 This methodology thereby provided an organized approach to answer our broad research question, “What evidence exists regarding the quality and safety of pediatric inpatient care in United States community hospitals?“ We followed the scoping review guidelines put forth by the Joanna Briggs Institute and the Preferred Reporting Items for Systematic Reviews and Meta-Analyses (PRISMA) reporting guideline Extension for Scoping Reviews.10,11
Data Sources and Search Strategies
We searched Medline, Medline-In-Process, Embase, the Cochrane Database of Systematic Reviews, the Cumulative Index to Nursing and Allied Health Literature (CINAHL), PsycINFO, and Scopus for studies that reported at least one outcome related to healthcare quality or patient safety and involved pediatric patients (aged <18 years) receiving inpatient care at a community hospital. Outcomes included measures from the IOM-defined aims of quality healthcare: (1) safety, (2) effectiveness, (3) efficiency, (4) timeliness, (5) patient-centeredness, and (6) equity (Appendix Table 1). Terms were searched as controlled vocabulary in applicable databases (Medline, Embase, CINAHL, PsycINFO) and as keywords in all databases. Search strategies tailored to each database were developed, tested, and refined in collaboration with a reference librarian. Date parameters for retrieval were set from 1989 to the search date, with the start date chosen to correspond with the establishment of the Agency for Health Care Policy and Research, currently known as the Agency for Healthcare Research and Quality (AHRQ), targeting literature produced in the wake of the AHRQ emphasis on quality in healthcare. Results were limited to articles published in English. Searches were conducted on October 24 and 25, 2016. Complete search strategies can be found in Appendix Methods.
Independent authors performed handsearches of Academic Pediatrics, BMJ Quality & Safety, Hospital Pediatrics, JAMA Pediatrics, and Pediatrics Quality Reports for the five years preceding the search date (July 2011-October 2016).
Study Selection and Definitions
To identify studies conducted in community hospitals, we operationalized the definition of community hospital proposed by Percelay.8 We used “community”, “general”, “nonuniversity”, and “nonchildren’s” as search terms and operationalized these through the addition of qualifying descriptors (Table 1).
Studies were excluded if they (1) were performed outside of the United States, as community hospital definitions may differ by country; (2) included participants aged >18 years and did not report any pediatric-specific results; (3) were performed exclusively in tertiary hospitals; (4) evaluated only outpatient or emergency department care; (5) did not report any results specific to community hospitals; (6) did not report any data-driven or parent/patient-reported measures of safety, effectiveness, efficiency, timeliness, patient-centeredness, or equity in their results; and (7) were case reports, case series, editorials, or abstracts without an associated full-text article. We read commentaries and literature reviews related to our objectives and reviewed their references to identify additional articles, but did not include these manuscripts.
Two authors independently reviewed each abstract, and full-text articles were reviewed if one or more authors determined that the abstract met the inclusion criteria. Two authors then independently reviewed each full-text article to determine whether the article met the criteria for the final review. Disagreements were resolved through consensus after discussion and review with the entire research team, and reasons for exclusion were recorded.
Charting the Results and Data Synthesis
We used a standardized charting form to collect information regarding study design, community hospital terms, population descriptors, IOM aims of quality healthcare, and outcome measures. To minimize bias in data collection, information from each full-text article was extracted independently by two authors, and differences in extraction were resolved through discussion and re-review among the same two authors. To evaluate the quality of included evidence, two authors (JCL and JKL) independently assessed the risk of bias for each study using modified Newcastle-Ottawa Quality Assessment Scales (NOS), with disagreements resolved through discussion and re-review among the same two authors. For cohort studies, five of the eight NOS domains were relevant and applied to all included studies (maximum score 6). Using the NOS adapted for cross-sectional studies, six of the seven domains were relevant and applied (maximum score 9). For cross-sectional studies, we defined the risk of bias to be low for scores ≥8, moderate for scores 5-7, and high for scores ≤4, consistent with previous work.12 For cohort studies, we similarly defined these strata by scores ≥5, 3-4, and ≤2, given the lower maximum score for this study type.
We categorized studies as either observational, defined as cohort or cross-sectional studies of usual healthcare delivery, or interventional, defined as studies evaluating the development and/or implementation of an intervention designed to improve healthcare quality. We further categorized the studies into the following four overarching medical domains: (1) neonatal, (2) pediatric medicine, (3) surgery, or (4) radiology.
RESULTS
After removal of duplicates, our search identified 2,068 abstracts for screening (Figure). Of these, 1,777 did not meet the inclusion criteria, leaving 291 articles for full-text review. Of these, 43 articles met all the inclusion criteria, and one additional article was included from search of references, resulting in a total of 44 articles.
Study designs, patient populations, and quality outcome measures were heterogeneous. We identified only one randomized controlled trial (RCT). A total of 30 articles were observational studies, 27 of which used retrospective cohort or cross-sectional designs; the remaining three used prospective cohort designs (Table 2). Of these studies, 20 involved multiple hospitals, whereas 10 were conducted at a single community hospital. Sample sizes ranged from 29 (single-site) to 107,727 (multisite) patients. Twenty-two studies aimed to compare quality outcomes at community hospitals with other hospital types, of which 16 performed risk-adjusted analyses (detailed findings of observational studies are summarized in Appendix Table 2). The remaining 14 articles were interventional studies (Table 2). Of these, 12 (86%) reported improvement in quality outcomes after implementation (detailed findings of interventional studies are summarized in Appendix Table 3).
The included studies evaluated quality outcomes addressing all six of the IOM aims of quality healthcare, with safety, effectiveness, and efficiency being the most predominant (Table 3). Patient-centeredness and timeliness were infrequently addressed, and only one study assessed equity.
Risk of bias was moderate or high for 27 (69%) of the observational and interventional cohort studies and four (100%) of the included cross-sectional studies (Table 2), with the median NOS score being 4 (range: 0-6) for cohort studies (Appendix Table 4) and 4 (range: 3-6) for cross-sectional studies (Appendix Table 5). The higher risk of bias was largely driven by low comparability scores due to inadequate risk adjustment or statistical reporting. Of the 12 studies with low risk of bias, 11 (92%) were multisite, 9 (75%) used large regional or national databases, and half reported quality outcomes limited to hospital charges and/or mortality.
Observational Studies
Neonatal Medicine
Five multisite studies focused on neonatal care,13,14,16,19,20 of which four examined outcomes associated with the transfer of neonates to or from community hospitals to tertiary care hospitals, such as neonatal morbidity, readmission, completion of preventative health measures and screening, parent satisfaction, and hospital charges.14,16,19,20 For example, in a study of extremely premature very low birth weight infants born in Hawaii, Kuo et al. demonstrated that the odds of retinopathy of prematurity was 2.9 times higher for infants born at a community hospital and transported to their tertiary center compared with those inborn at the tertiary center (P = .02).16 The fifth study examined neonatal mortality by site of birth, demonstrating that, among infants with birth weights less than 2,000 g, birth at a hospital with a community neonatal intensive care unit (NICU) was associated with 1.4 times higher odds of risk-adjusted mortality compared with birth at a regional NICU (P < .001).13
Three studies evaluated the quality of neonatal care at a single community hospital.15,17,18 Quality outcomes were heterogeneous, including utility of rebound bilirubin levels for infants with jaundice, morbidity of neonates requiring mechanical ventilation, and provision of breastfeeding advice to mothers of breastfeeding infants. For instance, Meadow et al. attempted to determine the quality of care for ventilated neonates at one community NICU compared with a tertiary hospital.18 They found no difference in days on ventilation or need for home oxygen therapy between the community hospital and the tertiary center, although P values and effect sizes were not reported for these outcomes and analyses were not adjusted beyond matching on birthdate and birth weight.
Pediatric Medicine
Nine multisite studies explored the quality and safety of pediatric medical care across hospital types.21-23,25-30 Of these, four were conducted using the Kids’ Inpatient Database (KID)28-30 or the National Inpatient Sample (NIS),27 two were conducted using other national databases,21,25 and two were conducted using electronic medical record data.22,26 All of the KID and NIS studies examined hospital charges, either alone or in conjunction with mortality. Two of these studies found no differences in risk-adjusted hospital charges between children’s hospitals and community hospitals (for burn injuries),28,29 whereas two found that hospitalization at community hospitals was associated with lower risk-adjusted charges (for asthma and sepsis).27,30 The remaining five studies evaluated diverse quality outcomes such as medication errors, therapeutic drug monitoring, practice guideline compliance, antibiotic prescribing, or hospital-to-home transition summary scores.21-23,25,26
Three single-site studies examined quality outcomes for pediatric medical patients, including mortality, outcome ratings for dehydration, and measures of peripherally inserted central catheter (PICC) safety and effectiveness.24,31,32 For example, Frank et al. evaluated safety of care in one community hospital pediatric intensive care unit (PICU) compared with a tertiary hospital using the Pediatric Risk of Mortality (PRISM) score.24 They reported that the observed number of deaths in their community PICU did not differ significantly from the number of deaths predicted in a tertiary center (23 vs 33, respectively, P > .2).
Surgery
Three multisite studies examined quality outcomes among children with surgical conditions, including surgical complications, readmission, and hospital charges.34,35,37 For example, Kelley-Quon et al. examined outcomes following surgery in infants with hypertrophic pyloric stenosis and found that infants who received their surgery at community hospitals had twice the odds of a surgical complication compared with those at children’s hospitals (P = .027).34 They also examined how the risk of appendiceal perforation differed by hospital type, finding that black children who received their surgery at children’s hospitals had twice the odds of appendiceal perforation compared with those who received care at community hospitals.35
In addition, two studies evaluated quality and safety outcomes for pediatric surgical care in a single community hospital.33,36 For example, Beaty et al. prospectively evaluated the incidence of missed injuries in hospitalized pediatric trauma patients, reporting that the incidence of missed injury was 33% when admission evaluation was performed by a trauma surgeon alone compared to 11% when performed by a pediatric doctor or a trauma surgeon and a pediatric doctor together (P < .001).33
Radiology
Three multisite studies examined quality and safety outcomes associated with radiographic imaging in community hospitals, including radiation dosing and frequency of preoperative imaging modalities and accuracy.38,39,41 For instance, Marin et al. found substantial variation in radiation dose across hospital types, with children’s hospitals delivering lower median radiation doses than academic and community hospitals.39 Similarly, Saito et al. demonstrated increased use of radiating modalities when evaluation was performed at community hospitals, with four times higher odds of computed tomography (CT) and five times lower odds of ultrasound use compared to a children’s hospital.41
Two single-site studies also evaluated quality and safety outcomes associated with the use of radiographic imaging for pediatric appendicitis in a community hospital.40,42 For example, York et al. demonstrated that, compared with nonimaged patients, patients who underwent diagnostic imaging for appendicitis experienced a significant time delay from initial evaluation to surgery and incurred significantly higher hospital charges, whereas there were no significant differences in intraoperative findings, antibiotic requirements, and surgical complications between the groups.42
Interventional Studies
Neonatal Medicine
We identified six studies that evaluated interventions to improve healthcare quality for neonates in community hospitals; two involved telemedicine.43-48 Hall et al. described “Telenursery,” a program linking regional perinatal centers with a large academic neonatal practice through real-time teleconferencing, in addition to providing weekly educational conferences.45 After its implementation, there was an increase in the state-recommended delivery of very low birth weight infants at the regional perinatal center from 24% to 33% (P < .05); clinical outcomes were not discussed. In a similar study, Sable et al. found that a videoconferencing system for cardiologists from an academic center to guide care in a community setting provided diagnostic services more quickly (28 minutes vs 12 hours) and had high diagnostic accuracy.47 The remaining four studies evaluated heterogeneous interventions such as a maternal education program to reduce shaking injuries to infants or implementation of evidence-based order sets to reduce early onset group B streptococcal disease in neonates.43,44,46,48 Five of the six neonatal studies demonstrated improved quality outcomes after intervention.43-47
Pediatric Medicine
Seven studies evaluated QI interventions for children at community hospitals,49-55 three of which described interventions to improve quality of management of respiratory diseases.49,51,53 Dayal et al. evaluated the implementation of respiratory illness order sets and an asthma pathway, demonstrating a 41% reduction in asthma hospitalization cost per patient (P < .05), reduced bronchodilator use for all respiratory illnesses, and no change in readmission rates.49 Similarly, Nkoy et al. evaluated an asthma “Evidence-Based Care Practice Model” implemented at seven community hospitals and demonstrated a nonsignificant reduction in readmissions (P = .12), as well as lower hospitalization costs (P = .05).53 Using QI methods, Kuhlmann et al. demonstrated improved compliance from 43% to 97% with the Asthma Home Management Plan of Care measure.51 The remaining four studies evaluated heterogeneous interventions, including telemedicine critical care consultations, use of I-PASS, and consolidation of pediatric care onto one hospital unit.50,52,54,55 Six of the seven pediatric studies (86%) demonstrated improved inpatient quality outcomes after intervention,49,51-55 but only one study was multisite.53
Surgery
We identified only one study evaluating a surgical intervention aimed at improving the quality of pediatric care.56 Kelley-Quon evaluated the impact of a community hospital partnering with an Academic Medical Pediatric Trauma Center to become a Level II Pediatric Trauma Center (PTC). After achieving Level II PTC designation, they reported that children treated at the community hospital had reduced rates of CT use, transfers, and in-hospital mortality (from 81% to 51%, 8.5% to 2.5%, and 2% to 0.4%, respectively, P < .05 for all) compared to those treated predesignation.
Radiology
Within the domain of radiology, our review identified no interventional studies.
DISCUSSION
In this scoping review of the quality and safety of pediatric inpatient care in community hospitals, we identified 44 studies applying heterogeneous study designs and evaluating diverse patient populations and quality outcomes. We identified only one RCT in our search; all the remaining studies applied observational designs.
We found only three clinical areas that were explored in multiple studies, with consistent directionality of results: (1) perinatal regionalization, (2) telemedicine, and (3) imaging radiation. The limited evidence identified in our review suggests that delivery of early premature infants at community hospitals, rather than at tertiary hospitals, may increase risk of neonatal morbidity and/or mortality,13,16,46 that use of telemedicine may improve the effectiveness and efficiency of intensive or specialized care in community settings,45,47,52,55 and that CT use and radiation doses may be higher in community hospitals compared with other settings.38,39,41 However, even within these clinical domains, the literature was limited in amount and heterogeneous; additional research is needed to systematically review the effect of individual interventions or particular community hospital quality outcomes compared with other hospital types.
Our search identified only 14 studies evaluating QI interventions within community hospitals over the almost 30-year review period. Although limited in number, 86% of these demonstrated improvements in healthcare quality and safety, providing a positive “proof of concept” that pediatric care in community hospitals can be improved by multidisciplinary efforts and be sustained over time.43-47,49,51-56 As pediatric departments within community hospitals may have limited resources, aligning pediatric QI efforts with adult initiatives within the same hospitals could prove advantageous. However, we did not identify any studies meeting our inclusion criteria that took this approach. Alternatively, QI collaboratives across structurally diverse hospitals may provide valuable infrastructure for QI in community hospitals. For example, the Value in Inpatient Pediatrics Network has conducted several multisite QI initiatives that have engaged both children’s and community hospitals.57-60 However, none of these studies have reported community hospital-specific quality outcomes, resulting in their exclusion from this review. In future study, researchers may consider separating community hospital results from those of pediatric hospitals to highlight the effect of community hospital-specific QI efforts and to allow valuable direct comparisons between hospital types.
Many studies identified in our scoping review were conducted at single hospitals. Sample sizes were often very small and power calculations were rarely reported, raising questions about the validity of the “nonsignificant” differences reported by some. Although such single-center studies provide valuable information for local improvement of inpatient care, by design the findings from these studies are unlikely generalizable to other community hospital systems. Without inclusion of another hospital type and/or quality measures with clear national benchmark for comparison, the additional conclusions that can be drawn from these studies are limited. In comparison, many of the multicenter studies had large study samples, but more than half used data registries with limited data to evaluate outcomes, clinical context, or important covariates.13,20,21,25,27-30,34,35,37,39 The most frequently reported outcomes in these data sets—hospital charges and lengths of stay—are of limited utility in understanding healthcare quality without clear benchmarks. As a result, the evidence-base from which to draw conclusions about quality and safety in community hospitals is very limited.
Therefore, our review highlights a great need for additional research in community hospital medicine and the need for high-quality evidence generation. Risk of bias was moderate or high for the majority of included studies because of inadequate risk adjustment or statistical analysis. In the future, multicenter collaborations may help to connect research methodologists with community hospital teams to aid in the application of robust study designs and analytic techniques. Multisite collaboration may also overcome the limitation of small sample sizes that are a reality at many community hospitals.
Our study findings must be considered in the setting of several methodological limitations. The lack of a standard definition for a community hospital has led to inconsistent terms and hospital definitions used in the literature. It is possible that, while following our systematic approach to define a community hospital, we inadvertently missed relevant studies that used different terms. We also excluded unpublished articles. Given that publication bias tends to favor studies with significant associations, it is possible that some studies with insignificant changes in quality outcomes were missed. Finally, in our exclusion of all non-US studies, we may have unknowingly missed literature from countries with community hospital definitions similar to those in the United States.
CONCLUSIONS
Recognizing that more than half of all children admitted to hospitals in the US receive their care at community hospitals, understanding healthcare quality in community hospitals is important. This scoping review underscores the need for additional research and higher quality evidence to determine the quality of pediatric inpatient care in these settings and identifies some particularly wide gaps that could be targeted in future research. Acknowledging that further research is necessary to address all aims of quality healthcare, markedly few studies have examined timeliness, equity, or patient-centeredness. Collaborations between academic medical centers and community hospitals may be an effective means to connect researchers with community hospital clinical teams to facilitate the application of robust study designs and analytic approaches and to facilitate multisite investigations. Research in this field would benefit from a standardized definition of a community hospital that could be consistently applied in research and QI endeavors.
Disclosures
The authors have no potential conflicts of interest to disclose.
Funding
Jana Leary was supported by the National Center for Advancing Translational Sciences, National Institutes of Health, Grant Number 5TL1TR0001062-03. JoAnna Leyenaar was supported by the Agency for Healthcare Research and Quality (K08HS024133).
Disclaimer
The content is solely the responsibility of the authors and does not necessarily represent the official views of the NIH or the AHRQ.
Despite efforts to provide high-quality healthcare, Americans die from medical errors each year and many patients do not receive recommended medical care. Risk is particularly acute during times of hospitalization.1-4 In response, the Institute of Medicine (IOM, now the Academy of Medicine) has released “Crossing the Quality Chasm: A New Health System for the 21st Century,” providing a framework to guide delivery and measurement of high-quality healthcare.5
Although the IOM framework has motivated the development of quality improvement (QI) and quality measurement initiatives, relatively few resources have been allocated to improving the quality of pediatric inpatient care.6,7 The resultant gap in our knowledge of quality and safety of pediatric hospital-based care is further widened by the variability of settings in which children are hospitalized. These settings include freestanding children’s hospitals, children’s hospitals nested within larger hospitals, and community hospitals, defined as general, nonuniversity, and nonchildren’s hospitals.8
Although almost three-quarters of children needing hospitalization are cared for outside of freestanding children’s hospitals, we know particularly little about the quality and safety of pediatric hospital-based care outside of these settings.6,9 Therefore, our scoping review aims to summarize literature regarding the quality and safety of pediatric inpatient care within community hospitals.
METHODS
We used a scoping review approach because this methodology, by design, is utilized to synthesize evidence and map existing literature and is particularly useful when a body of literature is heterogeneous, rendering a more targeted systematic review approach infeasible.10 This methodology thereby provided an organized approach to answer our broad research question, “What evidence exists regarding the quality and safety of pediatric inpatient care in United States community hospitals?“ We followed the scoping review guidelines put forth by the Joanna Briggs Institute and the Preferred Reporting Items for Systematic Reviews and Meta-Analyses (PRISMA) reporting guideline Extension for Scoping Reviews.10,11
Data Sources and Search Strategies
We searched Medline, Medline-In-Process, Embase, the Cochrane Database of Systematic Reviews, the Cumulative Index to Nursing and Allied Health Literature (CINAHL), PsycINFO, and Scopus for studies that reported at least one outcome related to healthcare quality or patient safety and involved pediatric patients (aged <18 years) receiving inpatient care at a community hospital. Outcomes included measures from the IOM-defined aims of quality healthcare: (1) safety, (2) effectiveness, (3) efficiency, (4) timeliness, (5) patient-centeredness, and (6) equity (Appendix Table 1). Terms were searched as controlled vocabulary in applicable databases (Medline, Embase, CINAHL, PsycINFO) and as keywords in all databases. Search strategies tailored to each database were developed, tested, and refined in collaboration with a reference librarian. Date parameters for retrieval were set from 1989 to the search date, with the start date chosen to correspond with the establishment of the Agency for Health Care Policy and Research, currently known as the Agency for Healthcare Research and Quality (AHRQ), targeting literature produced in the wake of the AHRQ emphasis on quality in healthcare. Results were limited to articles published in English. Searches were conducted on October 24 and 25, 2016. Complete search strategies can be found in Appendix Methods.
Independent authors performed handsearches of Academic Pediatrics, BMJ Quality & Safety, Hospital Pediatrics, JAMA Pediatrics, and Pediatrics Quality Reports for the five years preceding the search date (July 2011-October 2016).
Study Selection and Definitions
To identify studies conducted in community hospitals, we operationalized the definition of community hospital proposed by Percelay.8 We used “community”, “general”, “nonuniversity”, and “nonchildren’s” as search terms and operationalized these through the addition of qualifying descriptors (Table 1).
Studies were excluded if they (1) were performed outside of the United States, as community hospital definitions may differ by country; (2) included participants aged >18 years and did not report any pediatric-specific results; (3) were performed exclusively in tertiary hospitals; (4) evaluated only outpatient or emergency department care; (5) did not report any results specific to community hospitals; (6) did not report any data-driven or parent/patient-reported measures of safety, effectiveness, efficiency, timeliness, patient-centeredness, or equity in their results; and (7) were case reports, case series, editorials, or abstracts without an associated full-text article. We read commentaries and literature reviews related to our objectives and reviewed their references to identify additional articles, but did not include these manuscripts.
Two authors independently reviewed each abstract, and full-text articles were reviewed if one or more authors determined that the abstract met the inclusion criteria. Two authors then independently reviewed each full-text article to determine whether the article met the criteria for the final review. Disagreements were resolved through consensus after discussion and review with the entire research team, and reasons for exclusion were recorded.
Charting the Results and Data Synthesis
We used a standardized charting form to collect information regarding study design, community hospital terms, population descriptors, IOM aims of quality healthcare, and outcome measures. To minimize bias in data collection, information from each full-text article was extracted independently by two authors, and differences in extraction were resolved through discussion and re-review among the same two authors. To evaluate the quality of included evidence, two authors (JCL and JKL) independently assessed the risk of bias for each study using modified Newcastle-Ottawa Quality Assessment Scales (NOS), with disagreements resolved through discussion and re-review among the same two authors. For cohort studies, five of the eight NOS domains were relevant and applied to all included studies (maximum score 6). Using the NOS adapted for cross-sectional studies, six of the seven domains were relevant and applied (maximum score 9). For cross-sectional studies, we defined the risk of bias to be low for scores ≥8, moderate for scores 5-7, and high for scores ≤4, consistent with previous work.12 For cohort studies, we similarly defined these strata by scores ≥5, 3-4, and ≤2, given the lower maximum score for this study type.
We categorized studies as either observational, defined as cohort or cross-sectional studies of usual healthcare delivery, or interventional, defined as studies evaluating the development and/or implementation of an intervention designed to improve healthcare quality. We further categorized the studies into the following four overarching medical domains: (1) neonatal, (2) pediatric medicine, (3) surgery, or (4) radiology.
RESULTS
After removal of duplicates, our search identified 2,068 abstracts for screening (Figure). Of these, 1,777 did not meet the inclusion criteria, leaving 291 articles for full-text review. Of these, 43 articles met all the inclusion criteria, and one additional article was included from search of references, resulting in a total of 44 articles.
Study designs, patient populations, and quality outcome measures were heterogeneous. We identified only one randomized controlled trial (RCT). A total of 30 articles were observational studies, 27 of which used retrospective cohort or cross-sectional designs; the remaining three used prospective cohort designs (Table 2). Of these studies, 20 involved multiple hospitals, whereas 10 were conducted at a single community hospital. Sample sizes ranged from 29 (single-site) to 107,727 (multisite) patients. Twenty-two studies aimed to compare quality outcomes at community hospitals with other hospital types, of which 16 performed risk-adjusted analyses (detailed findings of observational studies are summarized in Appendix Table 2). The remaining 14 articles were interventional studies (Table 2). Of these, 12 (86%) reported improvement in quality outcomes after implementation (detailed findings of interventional studies are summarized in Appendix Table 3).
The included studies evaluated quality outcomes addressing all six of the IOM aims of quality healthcare, with safety, effectiveness, and efficiency being the most predominant (Table 3). Patient-centeredness and timeliness were infrequently addressed, and only one study assessed equity.
Risk of bias was moderate or high for 27 (69%) of the observational and interventional cohort studies and four (100%) of the included cross-sectional studies (Table 2), with the median NOS score being 4 (range: 0-6) for cohort studies (Appendix Table 4) and 4 (range: 3-6) for cross-sectional studies (Appendix Table 5). The higher risk of bias was largely driven by low comparability scores due to inadequate risk adjustment or statistical reporting. Of the 12 studies with low risk of bias, 11 (92%) were multisite, 9 (75%) used large regional or national databases, and half reported quality outcomes limited to hospital charges and/or mortality.
Observational Studies
Neonatal Medicine
Five multisite studies focused on neonatal care,13,14,16,19,20 of which four examined outcomes associated with the transfer of neonates to or from community hospitals to tertiary care hospitals, such as neonatal morbidity, readmission, completion of preventative health measures and screening, parent satisfaction, and hospital charges.14,16,19,20 For example, in a study of extremely premature very low birth weight infants born in Hawaii, Kuo et al. demonstrated that the odds of retinopathy of prematurity was 2.9 times higher for infants born at a community hospital and transported to their tertiary center compared with those inborn at the tertiary center (P = .02).16 The fifth study examined neonatal mortality by site of birth, demonstrating that, among infants with birth weights less than 2,000 g, birth at a hospital with a community neonatal intensive care unit (NICU) was associated with 1.4 times higher odds of risk-adjusted mortality compared with birth at a regional NICU (P < .001).13
Three studies evaluated the quality of neonatal care at a single community hospital.15,17,18 Quality outcomes were heterogeneous, including utility of rebound bilirubin levels for infants with jaundice, morbidity of neonates requiring mechanical ventilation, and provision of breastfeeding advice to mothers of breastfeeding infants. For instance, Meadow et al. attempted to determine the quality of care for ventilated neonates at one community NICU compared with a tertiary hospital.18 They found no difference in days on ventilation or need for home oxygen therapy between the community hospital and the tertiary center, although P values and effect sizes were not reported for these outcomes and analyses were not adjusted beyond matching on birthdate and birth weight.
Pediatric Medicine
Nine multisite studies explored the quality and safety of pediatric medical care across hospital types.21-23,25-30 Of these, four were conducted using the Kids’ Inpatient Database (KID)28-30 or the National Inpatient Sample (NIS),27 two were conducted using other national databases,21,25 and two were conducted using electronic medical record data.22,26 All of the KID and NIS studies examined hospital charges, either alone or in conjunction with mortality. Two of these studies found no differences in risk-adjusted hospital charges between children’s hospitals and community hospitals (for burn injuries),28,29 whereas two found that hospitalization at community hospitals was associated with lower risk-adjusted charges (for asthma and sepsis).27,30 The remaining five studies evaluated diverse quality outcomes such as medication errors, therapeutic drug monitoring, practice guideline compliance, antibiotic prescribing, or hospital-to-home transition summary scores.21-23,25,26
Three single-site studies examined quality outcomes for pediatric medical patients, including mortality, outcome ratings for dehydration, and measures of peripherally inserted central catheter (PICC) safety and effectiveness.24,31,32 For example, Frank et al. evaluated safety of care in one community hospital pediatric intensive care unit (PICU) compared with a tertiary hospital using the Pediatric Risk of Mortality (PRISM) score.24 They reported that the observed number of deaths in their community PICU did not differ significantly from the number of deaths predicted in a tertiary center (23 vs 33, respectively, P > .2).
Surgery
Three multisite studies examined quality outcomes among children with surgical conditions, including surgical complications, readmission, and hospital charges.34,35,37 For example, Kelley-Quon et al. examined outcomes following surgery in infants with hypertrophic pyloric stenosis and found that infants who received their surgery at community hospitals had twice the odds of a surgical complication compared with those at children’s hospitals (P = .027).34 They also examined how the risk of appendiceal perforation differed by hospital type, finding that black children who received their surgery at children’s hospitals had twice the odds of appendiceal perforation compared with those who received care at community hospitals.35
In addition, two studies evaluated quality and safety outcomes for pediatric surgical care in a single community hospital.33,36 For example, Beaty et al. prospectively evaluated the incidence of missed injuries in hospitalized pediatric trauma patients, reporting that the incidence of missed injury was 33% when admission evaluation was performed by a trauma surgeon alone compared to 11% when performed by a pediatric doctor or a trauma surgeon and a pediatric doctor together (P < .001).33
Radiology
Three multisite studies examined quality and safety outcomes associated with radiographic imaging in community hospitals, including radiation dosing and frequency of preoperative imaging modalities and accuracy.38,39,41 For instance, Marin et al. found substantial variation in radiation dose across hospital types, with children’s hospitals delivering lower median radiation doses than academic and community hospitals.39 Similarly, Saito et al. demonstrated increased use of radiating modalities when evaluation was performed at community hospitals, with four times higher odds of computed tomography (CT) and five times lower odds of ultrasound use compared to a children’s hospital.41
Two single-site studies also evaluated quality and safety outcomes associated with the use of radiographic imaging for pediatric appendicitis in a community hospital.40,42 For example, York et al. demonstrated that, compared with nonimaged patients, patients who underwent diagnostic imaging for appendicitis experienced a significant time delay from initial evaluation to surgery and incurred significantly higher hospital charges, whereas there were no significant differences in intraoperative findings, antibiotic requirements, and surgical complications between the groups.42
Interventional Studies
Neonatal Medicine
We identified six studies that evaluated interventions to improve healthcare quality for neonates in community hospitals; two involved telemedicine.43-48 Hall et al. described “Telenursery,” a program linking regional perinatal centers with a large academic neonatal practice through real-time teleconferencing, in addition to providing weekly educational conferences.45 After its implementation, there was an increase in the state-recommended delivery of very low birth weight infants at the regional perinatal center from 24% to 33% (P < .05); clinical outcomes were not discussed. In a similar study, Sable et al. found that a videoconferencing system for cardiologists from an academic center to guide care in a community setting provided diagnostic services more quickly (28 minutes vs 12 hours) and had high diagnostic accuracy.47 The remaining four studies evaluated heterogeneous interventions such as a maternal education program to reduce shaking injuries to infants or implementation of evidence-based order sets to reduce early onset group B streptococcal disease in neonates.43,44,46,48 Five of the six neonatal studies demonstrated improved quality outcomes after intervention.43-47
Pediatric Medicine
Seven studies evaluated QI interventions for children at community hospitals,49-55 three of which described interventions to improve quality of management of respiratory diseases.49,51,53 Dayal et al. evaluated the implementation of respiratory illness order sets and an asthma pathway, demonstrating a 41% reduction in asthma hospitalization cost per patient (P < .05), reduced bronchodilator use for all respiratory illnesses, and no change in readmission rates.49 Similarly, Nkoy et al. evaluated an asthma “Evidence-Based Care Practice Model” implemented at seven community hospitals and demonstrated a nonsignificant reduction in readmissions (P = .12), as well as lower hospitalization costs (P = .05).53 Using QI methods, Kuhlmann et al. demonstrated improved compliance from 43% to 97% with the Asthma Home Management Plan of Care measure.51 The remaining four studies evaluated heterogeneous interventions, including telemedicine critical care consultations, use of I-PASS, and consolidation of pediatric care onto one hospital unit.50,52,54,55 Six of the seven pediatric studies (86%) demonstrated improved inpatient quality outcomes after intervention,49,51-55 but only one study was multisite.53
Surgery
We identified only one study evaluating a surgical intervention aimed at improving the quality of pediatric care.56 Kelley-Quon evaluated the impact of a community hospital partnering with an Academic Medical Pediatric Trauma Center to become a Level II Pediatric Trauma Center (PTC). After achieving Level II PTC designation, they reported that children treated at the community hospital had reduced rates of CT use, transfers, and in-hospital mortality (from 81% to 51%, 8.5% to 2.5%, and 2% to 0.4%, respectively, P < .05 for all) compared to those treated predesignation.
Radiology
Within the domain of radiology, our review identified no interventional studies.
DISCUSSION
In this scoping review of the quality and safety of pediatric inpatient care in community hospitals, we identified 44 studies applying heterogeneous study designs and evaluating diverse patient populations and quality outcomes. We identified only one RCT in our search; all the remaining studies applied observational designs.
We found only three clinical areas that were explored in multiple studies, with consistent directionality of results: (1) perinatal regionalization, (2) telemedicine, and (3) imaging radiation. The limited evidence identified in our review suggests that delivery of early premature infants at community hospitals, rather than at tertiary hospitals, may increase risk of neonatal morbidity and/or mortality,13,16,46 that use of telemedicine may improve the effectiveness and efficiency of intensive or specialized care in community settings,45,47,52,55 and that CT use and radiation doses may be higher in community hospitals compared with other settings.38,39,41 However, even within these clinical domains, the literature was limited in amount and heterogeneous; additional research is needed to systematically review the effect of individual interventions or particular community hospital quality outcomes compared with other hospital types.
Our search identified only 14 studies evaluating QI interventions within community hospitals over the almost 30-year review period. Although limited in number, 86% of these demonstrated improvements in healthcare quality and safety, providing a positive “proof of concept” that pediatric care in community hospitals can be improved by multidisciplinary efforts and be sustained over time.43-47,49,51-56 As pediatric departments within community hospitals may have limited resources, aligning pediatric QI efforts with adult initiatives within the same hospitals could prove advantageous. However, we did not identify any studies meeting our inclusion criteria that took this approach. Alternatively, QI collaboratives across structurally diverse hospitals may provide valuable infrastructure for QI in community hospitals. For example, the Value in Inpatient Pediatrics Network has conducted several multisite QI initiatives that have engaged both children’s and community hospitals.57-60 However, none of these studies have reported community hospital-specific quality outcomes, resulting in their exclusion from this review. In future study, researchers may consider separating community hospital results from those of pediatric hospitals to highlight the effect of community hospital-specific QI efforts and to allow valuable direct comparisons between hospital types.
Many studies identified in our scoping review were conducted at single hospitals. Sample sizes were often very small and power calculations were rarely reported, raising questions about the validity of the “nonsignificant” differences reported by some. Although such single-center studies provide valuable information for local improvement of inpatient care, by design the findings from these studies are unlikely generalizable to other community hospital systems. Without inclusion of another hospital type and/or quality measures with clear national benchmark for comparison, the additional conclusions that can be drawn from these studies are limited. In comparison, many of the multicenter studies had large study samples, but more than half used data registries with limited data to evaluate outcomes, clinical context, or important covariates.13,20,21,25,27-30,34,35,37,39 The most frequently reported outcomes in these data sets—hospital charges and lengths of stay—are of limited utility in understanding healthcare quality without clear benchmarks. As a result, the evidence-base from which to draw conclusions about quality and safety in community hospitals is very limited.
Therefore, our review highlights a great need for additional research in community hospital medicine and the need for high-quality evidence generation. Risk of bias was moderate or high for the majority of included studies because of inadequate risk adjustment or statistical analysis. In the future, multicenter collaborations may help to connect research methodologists with community hospital teams to aid in the application of robust study designs and analytic techniques. Multisite collaboration may also overcome the limitation of small sample sizes that are a reality at many community hospitals.
Our study findings must be considered in the setting of several methodological limitations. The lack of a standard definition for a community hospital has led to inconsistent terms and hospital definitions used in the literature. It is possible that, while following our systematic approach to define a community hospital, we inadvertently missed relevant studies that used different terms. We also excluded unpublished articles. Given that publication bias tends to favor studies with significant associations, it is possible that some studies with insignificant changes in quality outcomes were missed. Finally, in our exclusion of all non-US studies, we may have unknowingly missed literature from countries with community hospital definitions similar to those in the United States.
CONCLUSIONS
Recognizing that more than half of all children admitted to hospitals in the US receive their care at community hospitals, understanding healthcare quality in community hospitals is important. This scoping review underscores the need for additional research and higher quality evidence to determine the quality of pediatric inpatient care in these settings and identifies some particularly wide gaps that could be targeted in future research. Acknowledging that further research is necessary to address all aims of quality healthcare, markedly few studies have examined timeliness, equity, or patient-centeredness. Collaborations between academic medical centers and community hospitals may be an effective means to connect researchers with community hospital clinical teams to facilitate the application of robust study designs and analytic approaches and to facilitate multisite investigations. Research in this field would benefit from a standardized definition of a community hospital that could be consistently applied in research and QI endeavors.
Disclosures
The authors have no potential conflicts of interest to disclose.
Funding
Jana Leary was supported by the National Center for Advancing Translational Sciences, National Institutes of Health, Grant Number 5TL1TR0001062-03. JoAnna Leyenaar was supported by the Agency for Healthcare Research and Quality (K08HS024133).
Disclaimer
The content is solely the responsibility of the authors and does not necessarily represent the official views of the NIH or the AHRQ.
1. McGlynn EA, Asch SM, Adams J, et al. The quality of health care delivered to adults in the United States. N Engl J Med. 2003;348(26):2635-2645. https://doi.org/10.1056/NEJMsa022615.
2. Richardson WC, Berwick DM, Bisgard C, et al. To err is human: building a safer health system-Institute of Medicine. Medscape. http://www.iom.edu/Reports/1999/To-Err-is-Human-Building-A-Safer-Health-System.aspx; 2000. Accessed October 7, 2016.
3. Classen DC, Resar R, Griffin F, et al. ‘Global Trigger Tool’ shows that adverse events in hospitals may be ten times greater than previously measured. Health Aff. 2011;30(4):581-589. https://doi.org/10.1377/hlthaff.2011.0190.
4. Stockwell DC, Landrigan CP, Schuster MA, et al. Using a pediatric trigger tool to estimate total harm burden hospital-acquired conditions represent. Pediatr Qual Saf. 2018;3(3):e081. https://doi.org/10.1097/pq9.0000000000000081.
5. Institute of Medicine (US) Committee on Quality of Health Care in America. Crossing the Quality Chasm. Washington (DC): National Academies Press (US); 2001. https://doi.org/10.17226/10027.
6. Rauch DA, Lye PS, Carlson D, et al. Pediatric hospital medicine: a strategic planning roundtable to chart the future. J Hosp Med. 2012;7(4):329-334. https://doi.org/10.1002/jhm.950.
7. Simpson L, Fairbrother G, Hale S et al. Reauthorizing SCHIP: Opportunities for Promoting Effective Health Coverage and HighQuality Care for Children and Adolescents. (Publication 1051). Commonw Fund; 2007.
8. Percelay JM. Pediatric hospitalists working in community hospitals. Pediatr Clin North Am. 2014;61(4):681-691. https://doi.org/10.1016/j.pcl.2014.04.005.
9. Leyenaar JK, Ralston SL, Shieh MS et al. Epidemiology of pediatric hospitalizations at general hospitals and freestanding children’s hospitals in the United States. J Hosp Med. 2016;11(11):743-749. https://doi.org/10.1002/jhm.2624.
10. Peters MDJ, Godfrey CM, Khalil H et al. Guidance for conducting systematic scoping reviews. Int J Evid Based Healthc. 2015;13(3):141-146. https://doi.org/10.1097/XEB.0000000000000050.
11. Tricco AC, Lillie E, Zarin W, et al. PRISMA extension for scoping reviews (PRISMA-ScR): checklist and explanation. Ann Intern Med. 2018;169(7):467-473. https://doi.org/10.7326/M18-0850.
12. Alobaidi R, Morgan C, Basu RK, et al. Association between fluid balance and outcomes in critically ill children: a systematic review and meta-analysis. JAMA Pediatr. 2018;172(3):257-268. https://doi.org/10.1001/jamapediatrics.2017.4540.
13. Cifuentes J, Bronstein J, Phibbs CS et al. Mortality in low birth weight infants according to level of neonatal care at hospital of birth. Pediatrics. 2002;109(5):745-751. https://doi.org/10.1542/peds.109.5.745.
14. Donohue PK, Hussey-Gardner B, Sulpar LJ, Fox R, Aucott SW. Convalescent care of infants in the neonatal intensive care unit in community hospitals: risk or benefit? Pediatrics. 2009;124(1):105-111. https://doi.org/10.1542/peds.2008-0880.
15. Izatt SD. Breastfeeding counseling by health care providers. J Hum Lact. 1997;13(2):109-113. https://doi.org/10.1177/089033449701300210.
16. Kuo S, Kimata C, Akamine K, Young B, Balaraman V. Outcomes of inborn and transported extremely premature very-low-birthweight infants in Hawai’i. Pediatr Int. 2012;54(3):365-369. https://doi.org/10.1111/j.1442-200X.2012.03561.x.
17. Maisels MJ, Kring E. Rebound in serum bilirubin level following intensive phototherapy. Arch Pediatr Adolesc Med. 2002;156(7):669-672. https://doi.org/10.1001/archpedi.156.7.669.
18. Meadow W, Mendez D, Makela J et al. Can and should level II nurseries care for newborns who require mechanical ventilation? Clin Perinatol. 1996;23(3):551-561. https://doi.org/10.1016/S0095-5108(18)30227-6.
19. Phibbs CS, Mortensen L. Back transporting infants from neonatal intensive care units to community hospitals for recovery care: effect on total hospital charges. Pediatrics. 1992;90(1):22-26.
20. Wall SN, Handler AS, Park CG. Hospital factors and nontransfer of small babies: A marker of deregionalized perinatal care? J Perinatol. 2004;24(6):351-359. https://doi.org/10.1038/sj.jp.7211101.
21. Alexander DC, Bundy DG, Shore AD et al. Cardiovascular medication errors in children. Pediatrics. 2009;124(1):324-332. https://doi.org/10.1542/peds.2008-2073.
22. Balch AH, Constance JE, Thorell EA, et al. Pediatric vancomycin dosing: trends over time and the impact of therapeutic drug monitoring. J Clin Pharmacol. 2015;55(2):212-220. https://doi.org/10.1002/jcph.402.
23. Conway PH, Edwards S, Stucky ER et al. Variations in management of common inpatient pediatric illnesses: hospitalists and community pediatricians. Pediatrics. 2006;118(2):441-447. https://doi.org/10.1542/peds.2006-0484.
24. Frank BS, Pollack MM. Quantitative quality assurance in a community hospital pediatric intensive care unit. West J Med. 1992;157(2):149-151.
25. Leyenaar JK, Lagu T, Shieh MS, Pekow PS, Lindenauer PK. Variation in resource utilization for the management of uncomplicated community-acquired pneumonia across community and children’s hospitals. J Pediatr. 2014;165(3):585-591. https://doi.org/10.1016/j.jpeds.2014.04.062.
26. Leyenaar JK, Desai AD, Burkhart Q, et al. Quality measures to assess care transitions for hospitalized children. Pediatrics. 2016;138(2):e20160906. https://doi.org/10.1542/peds.2016-0906.
27. Meurer JR, Kuhn EM, George V, Yauck JS, Layde PM. Charges for childhood asthma by hospital characteristics. Pediatrics. 1998;102(6):E70. https://doi.org/10.1542/peds.102.6.e70.
28. Myers J, Lehna C. Where are lengths of stay longer and total charges higher for pediatric burn patients? J Burn Care Res. 2014;35(5):382-387. https://doi.org/10.1097/BCR.0000000000000012.
29. Myers J, Smith M, Woods C, Espinosa C, Lehna C. The effect of transfers between health care facilities on costs and length of stay for pediatric burn patients. J Burn Care Res. 2015;36(1):178-183. https://doi.org/10.1097/BCR.0000000000000206.
30. Odetola FO, Gebremariam A, Freed GL. Patient and hospital correlates of clinical outcomes and resource utilization in severe pediatric sepsis. Pediatrics. 2007;119(3):487-494. https://doi.org/10.1542/peds.2006-2353.
31. Scherb CA, Stevens MS, Busman C. Outcomes related to dehydration in the pediatric population. J Pediatr Nurs. 2007;22(5):376-382. https://doi.org/10.1016/j.pedn.2006.10.004.
32. Van Winkle P, Whiffen T, Liu IL. Experience using peripherally inserted central venous catheters for outpatient parenteral antibiotic therapy in children at a community hospital. ediatr Infect Dis J. 2008;27(12):1069-1072. https://doi.org/10.1097/INF.0b013e31817d32f2.
33. Beaty JS, Chendrasekhar A, Hopkins J, Gruelke L. Missed injuries in pediatric trauma patients. J Appl Res. 2003;3(1):84-88. https://jrnlappliedresearch.com/articles/Vol3Iss1/CHENDRASEKHAR.htm. Accessed July 8, 2019.
34. Kelley-Quon LI, Tseng CH, Jen HC, Shew SB. Hospital type predicts surgical complications for infants with hypertrophic pyloric stenosis. Am Surg. 2012;78(10):1079-1082.
35. Kelley-Quon LI, Tseng CH, Jen HC, Lee SL, Shew SB. Hospital type as a metric for racial disparities in pediatric appendicitis. J Am Coll Surg. 2013;216(1):74-82. https://doi.org/10.1016/j.jamcollsurg.2012.09.018.
36. Pokala N, Sadhasivam S, Kiran RP, Parithivel V. Complicated appendicitis—is the laparoscopic approach appropriate? A comparative study with the open approach: outcome in a community hospital setting. Am Surg. 2007;73(8):732-737.
37. Smith JT, Price C, Stevens PM, Masters KS, Young M. Does pediatric orthopedic subspecialization affect hospital utilization and charges? J Pediatr Orthop. 1999;19(4):553-555. https://doi.org/10.1097/01241398-199907000-00027.
38. Calvert C, Strauss KJ, Mooney DP. Variation in computed tomography radiation dose in community hospitals. J Pediatr Surg. 2012;47(6):1167-1169. https://doi.org/10.1016/j.jpedsurg.2012.03.021.
39. Marin JR, Sengupta D, Bhargavan-Chatfield M et al. Variation in pediatric cervical spine computed tomography radiation dose index. Acad Emerg Med. 2015;22(12):1499-1505. https://doi.org/10.1111/acem.12822.
40. Reich JD, Brogdon B, Ray WE, Eckert J, Gorell H. Use of CT scan in the diagnosis of pediatric acute appendicitis. Pediatr Emerg Care. 2000;16(4):241-243. https://doi.org/10.1097/00006565-200008000-00006.
41. Saito JM, Yan Y, Evashwick TW, Warner BW, Tarr PI. Use and accuracy of diagnostic imaging by hospital type in pediatric appendicitis. Pediatrics. 2013;131(1):e37-e44. https://doi.org/10.1542/peds.2012-1665.
42. York D, Smith A, Phillips JD, Von Allmen D. The influence of advanced radiographic imaging on the treatment of pediatric appendicitis. J Pediatr Surg. 2005;40(12):1908-1911. https://doi.org/10.1016/j.jpedsurg.2005.08.004.
43. Altman RL, Canter J, Patrick PA et al. Parent education by maternity nurses and prevention of abusive head trauma. Pediatrics. 2011;128(5):e1164-e1172. https://doi.org/10.1542/peds.2010-3260.
44. Clemens CJ, Gable EK. The development of a group B streptococcus prevention policy at a community hospital. J Perinatol. 2002;22(7):523-525. https://doi.org/10.1038/sj.jp.7210794.
45. Hall RW, Hall-Barrow J, Garcia-Rill E. Neonatal regionalization through telemedicine using a community-based research and education core facility. Ethn Dis. 2010;20(1 Suppl 1):S136-S140.
46. Hulsey TC, Pittard WB 3rd, Ebeling M. Regionalized perinatal transport systems: association with changes in location of birth, neonatal transport, and survival of very low birth weight deliveries. J S C Med Assoc. 1991;87(12):581-584.
47. Sable CA, Cummings SD, Pearson GD, et al. Impact of telemedicine on the practice of pediatric cardiology in community hospitals. Pediatrics. 2002;109(1):E3. https://doi.org/10.1542/peds.109.1.e3.
48. Wexelblatt SL, Ward LP, Torok K et al. Universal maternal drug testing in a high-prevalence region of prescription opiate abuse. J Pediatr. 2015;166(3):582-586. https://doi.org/10.1016/j.jpeds.2014.10.004.
49. Dayal A, Alvarez F. The effect of implementation of standardized, evidence-based order sets on efficiency and quality measures for pediatric respiratory illnesses in a community hospital. Hosp Pediatr. 2015;5(12):624-629. https://doi.org/10.1542/hpeds.2015-0140.
50. Krugman SD, Suggs A, Photowala HY, Beck A. Redefining the community pediatric hospitalist: the combined Pediatric ED/Inpatient Unit. Pediatr Emerg Care. 2007;23(1):33-37. https://doi.org/10.1097/01.pec.0000248685.94647.01.
51. Kuhlmann S, Mason B, Ahlers-Schmidt CR. A quality improvement project to improve compliance with the joint commission children’s asthma care-3 measure. Hosp Pediatr. 2013;3(1):45-51. https://doi.org/10.1542/hpeds.2012-0015.
52. Labarbera JM, Ellenby MS, Bouressa P et al. The impact of telemedicine intensivist support and a pediatric hospitalist program on a community hospital. Telemed J E Health. 2013;19(10):760-766. https://doi.org/10.1089/tmj.2012.0303.
53. Nkoy F, Fassl B, Stone B, et al. Improving pediatric asthma care and outcomes Across multiple hospitals. Pediatrics. 2015;136(6):e1602-e1610. https://doi.org/10.1542/peds.2015-0285.
54. Walia J, Qayumi Z, Khawar N, et al. Physician transition of care: benefits of I-PASS and an electronic handoff system in a community pediatric residency program. Acad Pediatr. 2016;16(6):519-523. https://doi.org/10.1016/j.acap.2016.04.001.
55. Yang CP, Hunt EA, Shilkofski N et al. Can telemedicine improve adherence to resuscitation guidelines for critically ill children at community hospitals? A randomized controlled trial using high-fidelity simulation. Pediatr Emerg Care. 2017;33(7):474-479. https://doi.org/10.1097/PEC.0000000000000653.
56. Kelley-Quon LI, Crowley MA, Applebaum H, et al. Academic-community partnerships improve outcomes in pediatric trauma care. J Pediatr Surg. 2015;50(6):1032-1036. https://doi.org/10.1016/j.jpedsurg.2015.03.033.
57. Ralston S, Garber M, Narang S, et al. Decreasing unnecessary utilization in acute bronchiolitis care: results from the value in inpatient pediatrics network. J Hosp Med. 2013;8(1):25-30. https://doi.org/10.1002/jhm.1982.
58. Ralston SL, Garber MD, Rice-Conboy E, et al. A multicenter collaborative to reduce unnecessary care in inpatient bronchiolitis. Pediatrics. 2016;137(1):e20150851. https://doi.org/10.1542/peds.2015-0851.
59. Parikh K, Biondi E, Nazif J, et al. A multicenter collaborative to improve care of community acquired pneumonia in hospitalized children. Pediatrics. 2017;139(3):e20161411. https://doi.org/10.1542/peds.2016-1411.
60. Leyenaar JK, Bergert L, Mallory LA, et al. Pediatric primary care providers’ perspectives regarding hospital discharge communication: a mixed methods analysis. Acad Pediatr. 2015;15(1):61-68. https://doi.org/10.1016/j.acap.2014.07.004.
1. McGlynn EA, Asch SM, Adams J, et al. The quality of health care delivered to adults in the United States. N Engl J Med. 2003;348(26):2635-2645. https://doi.org/10.1056/NEJMsa022615.
2. Richardson WC, Berwick DM, Bisgard C, et al. To err is human: building a safer health system-Institute of Medicine. Medscape. http://www.iom.edu/Reports/1999/To-Err-is-Human-Building-A-Safer-Health-System.aspx; 2000. Accessed October 7, 2016.
3. Classen DC, Resar R, Griffin F, et al. ‘Global Trigger Tool’ shows that adverse events in hospitals may be ten times greater than previously measured. Health Aff. 2011;30(4):581-589. https://doi.org/10.1377/hlthaff.2011.0190.
4. Stockwell DC, Landrigan CP, Schuster MA, et al. Using a pediatric trigger tool to estimate total harm burden hospital-acquired conditions represent. Pediatr Qual Saf. 2018;3(3):e081. https://doi.org/10.1097/pq9.0000000000000081.
5. Institute of Medicine (US) Committee on Quality of Health Care in America. Crossing the Quality Chasm. Washington (DC): National Academies Press (US); 2001. https://doi.org/10.17226/10027.
6. Rauch DA, Lye PS, Carlson D, et al. Pediatric hospital medicine: a strategic planning roundtable to chart the future. J Hosp Med. 2012;7(4):329-334. https://doi.org/10.1002/jhm.950.
7. Simpson L, Fairbrother G, Hale S et al. Reauthorizing SCHIP: Opportunities for Promoting Effective Health Coverage and HighQuality Care for Children and Adolescents. (Publication 1051). Commonw Fund; 2007.
8. Percelay JM. Pediatric hospitalists working in community hospitals. Pediatr Clin North Am. 2014;61(4):681-691. https://doi.org/10.1016/j.pcl.2014.04.005.
9. Leyenaar JK, Ralston SL, Shieh MS et al. Epidemiology of pediatric hospitalizations at general hospitals and freestanding children’s hospitals in the United States. J Hosp Med. 2016;11(11):743-749. https://doi.org/10.1002/jhm.2624.
10. Peters MDJ, Godfrey CM, Khalil H et al. Guidance for conducting systematic scoping reviews. Int J Evid Based Healthc. 2015;13(3):141-146. https://doi.org/10.1097/XEB.0000000000000050.
11. Tricco AC, Lillie E, Zarin W, et al. PRISMA extension for scoping reviews (PRISMA-ScR): checklist and explanation. Ann Intern Med. 2018;169(7):467-473. https://doi.org/10.7326/M18-0850.
12. Alobaidi R, Morgan C, Basu RK, et al. Association between fluid balance and outcomes in critically ill children: a systematic review and meta-analysis. JAMA Pediatr. 2018;172(3):257-268. https://doi.org/10.1001/jamapediatrics.2017.4540.
13. Cifuentes J, Bronstein J, Phibbs CS et al. Mortality in low birth weight infants according to level of neonatal care at hospital of birth. Pediatrics. 2002;109(5):745-751. https://doi.org/10.1542/peds.109.5.745.
14. Donohue PK, Hussey-Gardner B, Sulpar LJ, Fox R, Aucott SW. Convalescent care of infants in the neonatal intensive care unit in community hospitals: risk or benefit? Pediatrics. 2009;124(1):105-111. https://doi.org/10.1542/peds.2008-0880.
15. Izatt SD. Breastfeeding counseling by health care providers. J Hum Lact. 1997;13(2):109-113. https://doi.org/10.1177/089033449701300210.
16. Kuo S, Kimata C, Akamine K, Young B, Balaraman V. Outcomes of inborn and transported extremely premature very-low-birthweight infants in Hawai’i. Pediatr Int. 2012;54(3):365-369. https://doi.org/10.1111/j.1442-200X.2012.03561.x.
17. Maisels MJ, Kring E. Rebound in serum bilirubin level following intensive phototherapy. Arch Pediatr Adolesc Med. 2002;156(7):669-672. https://doi.org/10.1001/archpedi.156.7.669.
18. Meadow W, Mendez D, Makela J et al. Can and should level II nurseries care for newborns who require mechanical ventilation? Clin Perinatol. 1996;23(3):551-561. https://doi.org/10.1016/S0095-5108(18)30227-6.
19. Phibbs CS, Mortensen L. Back transporting infants from neonatal intensive care units to community hospitals for recovery care: effect on total hospital charges. Pediatrics. 1992;90(1):22-26.
20. Wall SN, Handler AS, Park CG. Hospital factors and nontransfer of small babies: A marker of deregionalized perinatal care? J Perinatol. 2004;24(6):351-359. https://doi.org/10.1038/sj.jp.7211101.
21. Alexander DC, Bundy DG, Shore AD et al. Cardiovascular medication errors in children. Pediatrics. 2009;124(1):324-332. https://doi.org/10.1542/peds.2008-2073.
22. Balch AH, Constance JE, Thorell EA, et al. Pediatric vancomycin dosing: trends over time and the impact of therapeutic drug monitoring. J Clin Pharmacol. 2015;55(2):212-220. https://doi.org/10.1002/jcph.402.
23. Conway PH, Edwards S, Stucky ER et al. Variations in management of common inpatient pediatric illnesses: hospitalists and community pediatricians. Pediatrics. 2006;118(2):441-447. https://doi.org/10.1542/peds.2006-0484.
24. Frank BS, Pollack MM. Quantitative quality assurance in a community hospital pediatric intensive care unit. West J Med. 1992;157(2):149-151.
25. Leyenaar JK, Lagu T, Shieh MS, Pekow PS, Lindenauer PK. Variation in resource utilization for the management of uncomplicated community-acquired pneumonia across community and children’s hospitals. J Pediatr. 2014;165(3):585-591. https://doi.org/10.1016/j.jpeds.2014.04.062.
26. Leyenaar JK, Desai AD, Burkhart Q, et al. Quality measures to assess care transitions for hospitalized children. Pediatrics. 2016;138(2):e20160906. https://doi.org/10.1542/peds.2016-0906.
27. Meurer JR, Kuhn EM, George V, Yauck JS, Layde PM. Charges for childhood asthma by hospital characteristics. Pediatrics. 1998;102(6):E70. https://doi.org/10.1542/peds.102.6.e70.
28. Myers J, Lehna C. Where are lengths of stay longer and total charges higher for pediatric burn patients? J Burn Care Res. 2014;35(5):382-387. https://doi.org/10.1097/BCR.0000000000000012.
29. Myers J, Smith M, Woods C, Espinosa C, Lehna C. The effect of transfers between health care facilities on costs and length of stay for pediatric burn patients. J Burn Care Res. 2015;36(1):178-183. https://doi.org/10.1097/BCR.0000000000000206.
30. Odetola FO, Gebremariam A, Freed GL. Patient and hospital correlates of clinical outcomes and resource utilization in severe pediatric sepsis. Pediatrics. 2007;119(3):487-494. https://doi.org/10.1542/peds.2006-2353.
31. Scherb CA, Stevens MS, Busman C. Outcomes related to dehydration in the pediatric population. J Pediatr Nurs. 2007;22(5):376-382. https://doi.org/10.1016/j.pedn.2006.10.004.
32. Van Winkle P, Whiffen T, Liu IL. Experience using peripherally inserted central venous catheters for outpatient parenteral antibiotic therapy in children at a community hospital. ediatr Infect Dis J. 2008;27(12):1069-1072. https://doi.org/10.1097/INF.0b013e31817d32f2.
33. Beaty JS, Chendrasekhar A, Hopkins J, Gruelke L. Missed injuries in pediatric trauma patients. J Appl Res. 2003;3(1):84-88. https://jrnlappliedresearch.com/articles/Vol3Iss1/CHENDRASEKHAR.htm. Accessed July 8, 2019.
34. Kelley-Quon LI, Tseng CH, Jen HC, Shew SB. Hospital type predicts surgical complications for infants with hypertrophic pyloric stenosis. Am Surg. 2012;78(10):1079-1082.
35. Kelley-Quon LI, Tseng CH, Jen HC, Lee SL, Shew SB. Hospital type as a metric for racial disparities in pediatric appendicitis. J Am Coll Surg. 2013;216(1):74-82. https://doi.org/10.1016/j.jamcollsurg.2012.09.018.
36. Pokala N, Sadhasivam S, Kiran RP, Parithivel V. Complicated appendicitis—is the laparoscopic approach appropriate? A comparative study with the open approach: outcome in a community hospital setting. Am Surg. 2007;73(8):732-737.
37. Smith JT, Price C, Stevens PM, Masters KS, Young M. Does pediatric orthopedic subspecialization affect hospital utilization and charges? J Pediatr Orthop. 1999;19(4):553-555. https://doi.org/10.1097/01241398-199907000-00027.
38. Calvert C, Strauss KJ, Mooney DP. Variation in computed tomography radiation dose in community hospitals. J Pediatr Surg. 2012;47(6):1167-1169. https://doi.org/10.1016/j.jpedsurg.2012.03.021.
39. Marin JR, Sengupta D, Bhargavan-Chatfield M et al. Variation in pediatric cervical spine computed tomography radiation dose index. Acad Emerg Med. 2015;22(12):1499-1505. https://doi.org/10.1111/acem.12822.
40. Reich JD, Brogdon B, Ray WE, Eckert J, Gorell H. Use of CT scan in the diagnosis of pediatric acute appendicitis. Pediatr Emerg Care. 2000;16(4):241-243. https://doi.org/10.1097/00006565-200008000-00006.
41. Saito JM, Yan Y, Evashwick TW, Warner BW, Tarr PI. Use and accuracy of diagnostic imaging by hospital type in pediatric appendicitis. Pediatrics. 2013;131(1):e37-e44. https://doi.org/10.1542/peds.2012-1665.
42. York D, Smith A, Phillips JD, Von Allmen D. The influence of advanced radiographic imaging on the treatment of pediatric appendicitis. J Pediatr Surg. 2005;40(12):1908-1911. https://doi.org/10.1016/j.jpedsurg.2005.08.004.
43. Altman RL, Canter J, Patrick PA et al. Parent education by maternity nurses and prevention of abusive head trauma. Pediatrics. 2011;128(5):e1164-e1172. https://doi.org/10.1542/peds.2010-3260.
44. Clemens CJ, Gable EK. The development of a group B streptococcus prevention policy at a community hospital. J Perinatol. 2002;22(7):523-525. https://doi.org/10.1038/sj.jp.7210794.
45. Hall RW, Hall-Barrow J, Garcia-Rill E. Neonatal regionalization through telemedicine using a community-based research and education core facility. Ethn Dis. 2010;20(1 Suppl 1):S136-S140.
46. Hulsey TC, Pittard WB 3rd, Ebeling M. Regionalized perinatal transport systems: association with changes in location of birth, neonatal transport, and survival of very low birth weight deliveries. J S C Med Assoc. 1991;87(12):581-584.
47. Sable CA, Cummings SD, Pearson GD, et al. Impact of telemedicine on the practice of pediatric cardiology in community hospitals. Pediatrics. 2002;109(1):E3. https://doi.org/10.1542/peds.109.1.e3.
48. Wexelblatt SL, Ward LP, Torok K et al. Universal maternal drug testing in a high-prevalence region of prescription opiate abuse. J Pediatr. 2015;166(3):582-586. https://doi.org/10.1016/j.jpeds.2014.10.004.
49. Dayal A, Alvarez F. The effect of implementation of standardized, evidence-based order sets on efficiency and quality measures for pediatric respiratory illnesses in a community hospital. Hosp Pediatr. 2015;5(12):624-629. https://doi.org/10.1542/hpeds.2015-0140.
50. Krugman SD, Suggs A, Photowala HY, Beck A. Redefining the community pediatric hospitalist: the combined Pediatric ED/Inpatient Unit. Pediatr Emerg Care. 2007;23(1):33-37. https://doi.org/10.1097/01.pec.0000248685.94647.01.
51. Kuhlmann S, Mason B, Ahlers-Schmidt CR. A quality improvement project to improve compliance with the joint commission children’s asthma care-3 measure. Hosp Pediatr. 2013;3(1):45-51. https://doi.org/10.1542/hpeds.2012-0015.
52. Labarbera JM, Ellenby MS, Bouressa P et al. The impact of telemedicine intensivist support and a pediatric hospitalist program on a community hospital. Telemed J E Health. 2013;19(10):760-766. https://doi.org/10.1089/tmj.2012.0303.
53. Nkoy F, Fassl B, Stone B, et al. Improving pediatric asthma care and outcomes Across multiple hospitals. Pediatrics. 2015;136(6):e1602-e1610. https://doi.org/10.1542/peds.2015-0285.
54. Walia J, Qayumi Z, Khawar N, et al. Physician transition of care: benefits of I-PASS and an electronic handoff system in a community pediatric residency program. Acad Pediatr. 2016;16(6):519-523. https://doi.org/10.1016/j.acap.2016.04.001.
55. Yang CP, Hunt EA, Shilkofski N et al. Can telemedicine improve adherence to resuscitation guidelines for critically ill children at community hospitals? A randomized controlled trial using high-fidelity simulation. Pediatr Emerg Care. 2017;33(7):474-479. https://doi.org/10.1097/PEC.0000000000000653.
56. Kelley-Quon LI, Crowley MA, Applebaum H, et al. Academic-community partnerships improve outcomes in pediatric trauma care. J Pediatr Surg. 2015;50(6):1032-1036. https://doi.org/10.1016/j.jpedsurg.2015.03.033.
57. Ralston S, Garber M, Narang S, et al. Decreasing unnecessary utilization in acute bronchiolitis care: results from the value in inpatient pediatrics network. J Hosp Med. 2013;8(1):25-30. https://doi.org/10.1002/jhm.1982.
58. Ralston SL, Garber MD, Rice-Conboy E, et al. A multicenter collaborative to reduce unnecessary care in inpatient bronchiolitis. Pediatrics. 2016;137(1):e20150851. https://doi.org/10.1542/peds.2015-0851.
59. Parikh K, Biondi E, Nazif J, et al. A multicenter collaborative to improve care of community acquired pneumonia in hospitalized children. Pediatrics. 2017;139(3):e20161411. https://doi.org/10.1542/peds.2016-1411.
60. Leyenaar JK, Bergert L, Mallory LA, et al. Pediatric primary care providers’ perspectives regarding hospital discharge communication: a mixed methods analysis. Acad Pediatr. 2015;15(1):61-68. https://doi.org/10.1016/j.acap.2014.07.004.
© 2019 Society of Hospital Medicine
Catheter-Associated Urinary Tract Infections in Adults: Diagnosis, Treatment, and Prevention
Every day in the United States, approximately 4% of patients in acute care hospitals have at least one hospital-acquired infection (HAI).1,2 Among the top 10 causes of death in the United States, HAIs are associated with increased morbidity, mortality, and hospital length of stay (LOS).2 The direct medical cost of treating HAIs is substantial for both hospitals and patients.3,4 Urinary tract infections (UTIs) are a leading cause of HAI, and 70%-80% of these are catheter-associated urinary tract infections (CAUTIs).5,6 In 2016, 26,983 CAUTIs occurred in acute care hospitals.7 The high incidence of CAUTI can substantially contribute to morbidity, length of stay, and mortality.8-11
The recognition that a substantial proportion of HAIs may be preventable, including 55%-70% of CAUTIs,12 has resulted in implementing multiple strategies to reduce CAUTI rates.13-17 These include simple prevention interventions such as avoiding placement of unnecessary indwelling urinary catheters and early removal of urinary catheters when they are no longer clinically indicated. Hospitalists are responsible for the care of many, if not most, inpatients with indwelling urinary catheters and are integral in antimicrobial stewardship efforts surrounding CAUTIs.18 Diagnostic stewardship, including appropriate urine specimen ordering, collection, processing, and reporting, works synergistically with antimicrobial stewardship and allows for appropriate antibiotic prescribing in symptomatic patients.19
DEFINITIONS
CAUTIs can be defined using either clinical or surveillance definitions. Clinical definitions are used at the bedside and take individual clinical characteristics into consideration, but vary among clinicians since there is no gold standard. Abnormal laboratory urinary findings in the absence of symptoms are not sufficient for the diagnosis of UTI, including CAUTI. Surveillance definitions, such as those used by the Centers for Disease Control and Prevention,20 are designed to be simple, easily applicable in any healthcare setting, and standardized to all patients. Surveillance definitions generally include at least one systemic or local symptom (such as fever or dysuria) and positive urine culture in a patient with an indwelling urinary catheter (or within 48 hours after its removal).
Pyuria is leukocytes or white blood cells (WBCs) in a urine specimen, with a threshold of >10 WBCs/high-power field using urine microscopy. The predictive value of different thresholds of pyuria for UTI is unclear.
Bacteriuria denotes the presence (on microscopy or culture) of bacteria in the urine. In a patient without signs or symptoms of a UTI, this is termed asymptomatic bacteriuria (ASB). A full discussion of bacteriuria, a major reason for inappropriate antibiotic use, is beyond the scope of this article but is discussed in a recent guideline.21
Urinary tract infections are usually characterized by a clinical syndrome along with evidence of pyuria and/or bacteriuria. The two major clinical syndromes that are observed are lower UTI (cystitis or bladder infections) and upper UTI (pyelonephritis or kidney infections). Rarely, patients may develop asymptomatic bacteremic UTI, where blood and urine cultures grow the same pathogen in the absence of clinical symptoms. (Table 1 summarizes the key points for these definitions).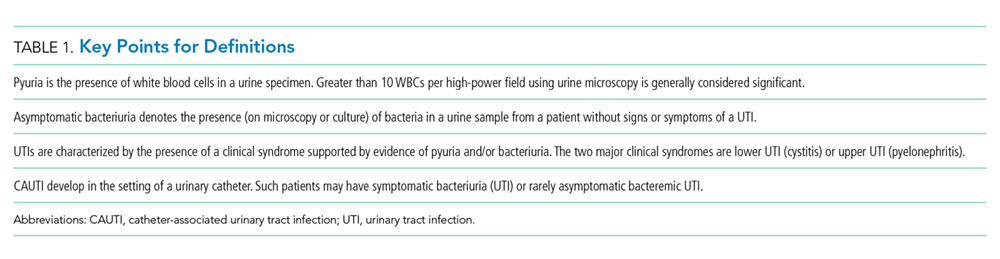
CAUSES AND RISK FACTORS FOR CAUTI
Bacterial biofilm can form on the inner and outer surfaces of an indwelling urinary catheter following its insertion and can be associated with bacteriuria and CAUTI.22,23 The biofilm comprises bacteria from the periurethral area that migrate upwards from a colonized drainage system. Bacteria present in the biofilm tend to exhibit slow growth, are protected from antibiotic exposure, and have less susceptibility to these agents.22-24 When a mature biofilm has formed, catheter removal may be necessary for source control and to facilitate effective antimicrobial treatment. The pathogens that most commonly cause CAUTIs are Escherichia coli (23.9%), Pseudomonas aeruginosa (10.3%), and Klebsiella pneumoniae/oxytoca (10.1%).25 Although urine cultures often grow yeast, particularly Candida spp., nonbacterial pathogens rarely cause UTI.
The risk of developing a CAUTI is directly related to catheter dwell time.26,27 For catheterized patients, the rate of development of catheter-associated bacteriuria is approximately 3% to 7% per day14,28 and is more common in the elderly and females. The likelihood of bacteriuria approaches 100% if a patient has an indwelling urinary catheter for ≥30 days,27,29,30 which is part of the rationale for why a urine culture alone is not sufficient to diagnose a CAUTI. While bacteriuria is a risk factor for UTI, the frequency of progression from bacteriuria to CAUTI is low and treating ASB does not decrease the risk of future CAUTI. Other risk factors for the development of CAUTI include urinary tract instrumentation, diabetes mellitus, and malnutrition.31,32
The two most important factors that lead to the development of CAUTIs and have been the main focus of quality improvement areas are unnecessary urinary catheter placement and inappropriate delay in removing a catheter when it is no longer needed.26,33 Unfortunately, 38% of attending physicians are unaware that their patients have a urinary catheter in place.34 Furthermore, in 20% to 50% of cases, there is no clear indication for catheter placement.2,34
DIAGNOSIS OF CAUTI
A CAUTI diagnosis is typically one of exclusion, as most patients present with fever and no apparent alternative source.14,29 Since catheterized patients may not exhibit common cystitis symptoms,29 most who develop CAUTI present with fever alone. However, most fevers in patients with bacteriuria and catheters are not CAUTIs and can be attributed to other sources. If a patient with an indwelling urinary catheter develops a fever and there is a suspicion of a CAUTI, careful evaluation is warranted for alternative sources of infection. This particularly applies to patients with severe systemic illness, such as hypotension or systemic inflammatory response syndrome, since these are unusual manifestations of CAUTI. The presence of either cloudy or malodorous urine does not indicate a UTI, and should not be the sole rationale for obtaining a urine culture.
Diagnostic workup of fever should include a clinical assessment of the patient. Indeed, professional guidelines recommend against obtaining a urine culture routinely for fever, unless invasive UTI risk is elevated, such as in patients with neutropenia, history of renal transplantation, or recent genitourinary surgery.35 Diagnostic stewardship, focusing on the appropriate use of urine cultures, can reduce CAUTI rates.36 For catheterized patients, hospitals are increasingly adopting reflex urine culture, where urine is simultaneously collected for a urinalysis and urine culture, but a urine culture is performed only if the urinalysis is positive for a predetermined threshold for pyuria, leukocyte esterase, or both. However, the use of reflex urine cultures remains an area of debate.37 In addition, the Infectious Diseases Society of America recommends against screening for or treating ASB in patients with either short-term (<30 days) or long-term indwelling urethral catheters.21
Ideally, a urine culture should be obtained by collecting a midstream sample. In catheterized patients, a sample should be obtained after removal of the catheter; or, in patients with a clinical indication for ongoing catheterization, a sample should be obtained after a new catheter has been placed.14 If an indwelling urinary catheter must be continued, the recommendation is to disinfect the drainage system’s aspiration port and then obtain a urine culture. Urine should never be obtained from a catheter collection bag. (Table 2 summarizes best practices for diagnosis of CAUTI).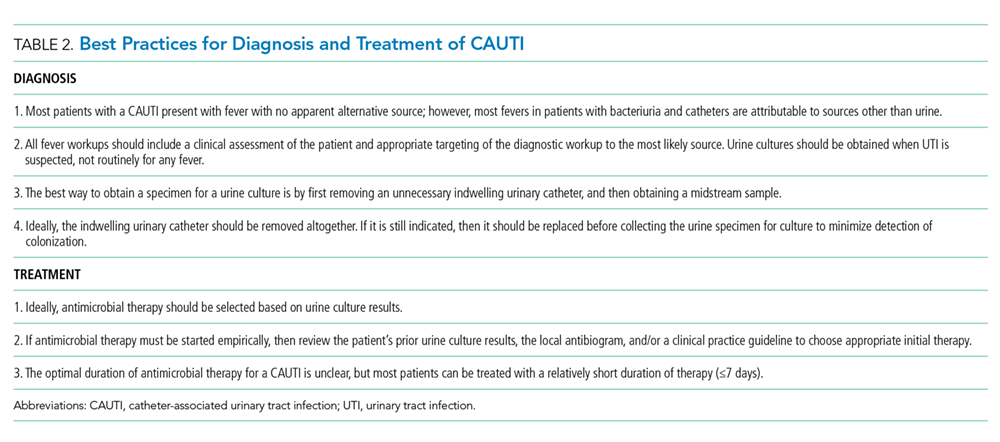
TREATMENT OF CAUTI
For all CAUTIs, an indwelling urinary catheter should be removed as soon as possible. If an indwelling urinary catheter remains necessary, but the existing catheter has been in place longer than two weeks, a new catheter should be placed before initiating antibiotic therapy14 to accelerate symptom resolution and reduce the likelihood of relapse or recurrence.32
Urinary tract agents such as fosfomycin and nitrofurantoin are recommended as first-line agents for simple cystitis in women and can be used in patients with lower UTI and sufficient renal function to achieve adequate drug concentration in urine. Upper UTIs require antibiotics with good penetration into renal parenchyma such as ceftriaxone. If empiric antimicrobial therapy is needed before culture results are available, then previous urine culture results, local antibiograms, or practice guidelines can guide selection. Definitive antimicrobial therapy should be based on urine culture results. It is important to narrow empiric therapy14 to reduce risk of Clostridioides difficile infection and emergence of other resistant bacteria. Fluoroquinolones should be avoided for lower UTIs because of these risks and multiple United States Food and Drug Administration warnings.38-40
The optimal duration of antimicrobial therapy for a CAUTI is unclear;14 however, most patients can be treated with a relatively short duration of therapy (≤7 days) if they respond promptly to therapy. Patients with a slow response to therapy may require 10-14 days of treatment.14 (Table 2 summarizes best practices for the treatment of CAUTI).
STRATEGIES FOR CAUTI PREVENTION
Since CAUTI is predicated on the presence of an indwelling urinary catheter, the simplest way to reduce CAUTI is to avoid placing or retaining unnecessary catheters. Some examples of appropriate indications9 for placement and maintenance of an indwelling urinary catheter are listed below:
1. Accurate measurement of urinary output in severely ill patients;
2. Improved comfort for patients receiving end-of-life care;
3. Acute urinary retention or bladder outlet obstruction;
4. Need for a period of prolonged immobilization (eg, potentially unstable lumbar or thoracic spine, or has multiple traumatic injuries);
5. Selected surgical procedures, such as urologic procedures and those that are expected to have a prolonged duration, require intraoperative monitoring of urine output, require the administration of either large volumes of intravenous infusions or diuretics;
6. To promote healing of open perineal or sacral wounds in patients with incontinence;
7. Neurogenic bladder; and
8. Hematuria with clots.
To increase the timely removal of urinary catheters that are no longer indicated, daily assessment of catheter necessity must be an integral part of clinicians’ workflow.32,33 Alternatives, such as external catheters or intermittent catheterization, should be considered before indwelling urinary catheter placement since both options are associated with a reduced CAUTI risk.41-44 Although indwelling urinary catheters can be seen as being more convenient for both patients and healthcare providers, many patients have expressed a preference for the use of intermittent catheterization compared with indwelling urinary catheterization.43
For urinary retention, bladder scanning can noninvasively assess the amount of residual urine in a patient’s bladder and can avoid unnecessary insertion of an indwelling urinary catheter. However, if indwelling urinary catheters are ultimately needed, they must be inserted and maintained appropriately. Of note, the use of antibiotic-impregnated catheters has not been shown to reduce CAUTI rates significantly.45
CAUTI prevention requires a multidisciplinary collaborative approach. Nurse-driven protocols and checklists to remove indwelling urinary catheters that are no longer indicated can be very effective.46,47 Automatic stop orders and catheter removal reminders are useful for reducing the duration of catheter placement.26,48 Both of these approaches require appropriate, consistent documentation with input from bedside nurses, physicians, advanced practice providers, and information technology. (Table 3 summarizes best practices for the prevention of CAUTI).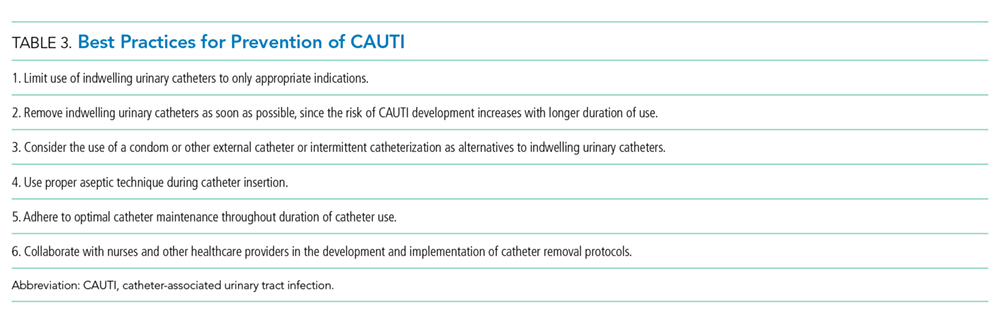
Importantly, CAUTI prevention supports broader antimicrobial stewardship. Over 55% of inpatients receive at least one dose of an antibiotic during their hospital stay.48,49 In 2015, the White House released the National Action Plan for Combating Antibiotic-Resistant Bacteria with the goals of slowing the emergence of resistant bacteria, preventing the spread of antibiotic-resistant infections, and setting a target of a 20% reduction in the inappropriate use of antibiotics for hospitalized patients.50 Hospitalists care for a substantial number of inpatients and, in turn, can drive actions to decrease CAUTIs, and promote stewardship efforts. Through actions to decrease CAUTIs, hospitalists can promote these stewardship efforts.
CONCLUSIONS
CAUTI is one of the most common types of HAI and is associated with increased morbidity, hospital length of stay, and patient costs. Most CAUTIs are preventable by limiting the placement of unnecessary catheters to instances of true necessity and removing catheters when they are no longer clinically indicated. Proper technique for the insertion and maintenance of catheters is also important for reducing CAUTI rates. Hospitalists care for a substantial number of inpatients and can make major contributions to the appropriate diagnosis, treatment, and prevention of CAUTIs.
1. Centers for Disease Control and Prevention. Estimates of healthcare-associated infections. http://www.cdc.gov/ncidod/dhqp/hai.html. Accessed September 27, 2018.
2. Calfee D. Crisis in hospital-acquired, healthcare-associated infections. Annu Rev Med. 2012;63(1):359-371. https://doi.org/10.1146/annurev-med-081210-144458.
3. Scott R. 2009. The direct medical costs of healthcare-associated infections in U.S. hospitals and the benefits of prevention. Centers for Disease Control and Prevention, Atlanta. http://www.cdc.gov/ncidod/dhqp/pdf/Scott_CostPaper.pdf. Accessed September 27, 2018.
4. Zimlachman E, Henderson D, Tamir O, et al. Health care associated infections. A meta-analysis of costs and financial impact on the US health care system. JAMA Intern Med. 2013;173(22):2039-2046. https://doi.org/10.1001/jamainternmed.2013.9763.
5. Nicolle LE. Catheter-acquired urinary tract infection: the once and future guidelines. Infect Control Hosp Epidemiol. 2010;31(4):327-329. https://doi.org/10.1086/651092.
6. Weber DJ, Sickbert-Bennett EE, Gould CV, et al. Incidence of catheter-associated and noncatheter-associated urinary tract infections in a healthcare system. Infect Control Hosp Epidemiol. 2011;32(8):822-823. https://doi.org/10.1086/661107.
7. Healthcare-associated infections. National and state HAI progress reports or SIR reports. https://www.cdc.gov/hai/data/archive/archive.html. Accessed May 6, 2019.
8. Saint S. Clinical and economic consequences of nosocomial catheter-related bacteriuria. Am J Infect Control. 2000;28(1):68-75. https://doi.org/10.1016/S0196-6553(00)90015-4.
9. Platt R, Polk BF, Murdock B, Rosner B. Mortality associated with nosocomial urinary-tract infection. N Engl J Med. 1982;307(11):637-642. https://doi.org/10.1056/NEJM198209093071101.
10. Tambyah PA, Knasinski V, Maki DG. The direct costs of nosocomial catheter-associated urinary tract infection in the era of managed care. Infect Control Hosp Epidemiol. 2002;23(1):27-31.
11. Chant C, Smith OM, Marshall JC, Friedrich JO. Relationship of catheter-associated urinary tract infection to mortality and length of stay in critically ill patients: a systematic review and meta-analysis of observational studies. Crit Care Med. 2011;39(5):1167-1173. https://doi.org/10.1097/CCM.0b013e31820a8581.
12. Umscheid CA, Mitchell MD, Doshi JA, et al. Estimating the proportion of healthcare-associated infections that are reasonably preventable and the related mortality and costs. Infect Control Hosp Epidemiol. 2011;32(2):101-114. https://doi.org/10.1086/657912.
13. Gould C, Umscheid C, Agarwal R, et al. Healthcare Infection Control Practices Advisory Committee (HICPAC): guideline for the prevention of catheter-associated urinary tract infections, 2009. http://www.cdc.gov/hicpac/pdf/CAUTI/CAUTIguideline2009final.pdf. Accessed November 1, 2018.
14. Hooton TM, Bradley SF, Cardenas DD, et al. Diagnosis, prevention, and treatment of catheter-associated urinary tract infection in adults: 2009 International Clinical Practice Guidelines from the Infectious Diseases Society of America. Clin Infect Dis. 2010;50(5):625-663. https://doi.org/10.1086/650482.
15. Conway LJ, Larson EL. Guidelines to prevent catheter-associated urinary tract infection: 1980 to 2010. Heart Lung. 2011;41(3):271-283. https://doi.org/10.1016/j.hrtlng.2011.08.001.
16. Greene L, Marx J, Oriola S. APIC elimination guide: guide to the elimination of catheter-associated urinary tract infections (CAUTIs). http://www.apic.org/Content/NavigationMenu/PracticeGuidance/APICEliminationGuides/CAUTI_Guide_0609.pdf. Accessed October 15, 2018.
17. Yokoe DS, Mermel LA, Anderson DJ, et al. A compendium of strategies to prevent healthcare-associated infections in acute care hospitals. Infect Control Hosp Epidemiol. 2008;29(S1):S12-S21.
18. Wiley Z, Kobaidze K, Sexton ME, Jacob JT. Hospitalists as integral stakeholders in antimicrobial stewardship. Curr Treat Options Infect Dis. 2018;10(2):240-248. https://doi.org/10.1007/s40506-018-0162-z.
19. Claeys KC, Blanco N, Morgan DJ, Leekha S, Sullivan KV. Advances and challenges in the diagnosis and treatment of urinary tract infections: the need for diagnostic stewardship. Curr Infect Dis Rep. 2019;21(4):11. https://doi.org/10.1007/s11908-019-0668-7.
20. Horan T, Andrus M, Dudeck M. CDC/NHSN surveillance definition of health care-associated infection and criteria for specific types of infections in the acute care setting. Am J Infect Control. 2008;36(5):309-332. https://doi.org/10.1016/j.ajic.2008.03.002.
21. Nicolle LE, Gupta K, Bradley S, et al. Clinical practice guideline for the management of asymptomatic bacteriuria: 2019 Update by the Infectious Diseases Society of America. Clin Infect Dis. 2019;68(10):e83-e110.
22. Donlan R. Biofilms and device-associated infections. Emerg Infect Dis. 2001;7(2):277-281. https://doi.org/10.3201/eid0702.010226.
23. Choe HS, Son SW, Choi HA, et al. Analysis of the distribution of bacteria within urinary catheter biofilms using four different molecular techniques. Am J Infect Control. 2012;40(9):e249-e254. https://doi.org/10.1016/j.ajic.2012.05.010.
24. Mohajer M, Darouiche R. Prevention and treatment of urinary catheter-associated infections. Curr Infect Dis Rep. 2013;15(2):116-123. https://doi.org/10.1007/s11908-013-0316-6.
25. Weiner LM, Webb AK, Limbago B, et al. Antimicrobial-resistant pathogens associated with healthcare-associated infections: summary of data reported to the National Healthcare Safety Network at the Centers for Disease Control and Prevention, 2011-2014. Infect Control Hosp Epidemiol. 2016;37(11):1288-1301. https://doi.org/10.1017/ice.2016.174.
26. Tambyah PA, Oon J. Catheter-associated urinary tract infection. Curr Opin Infect Dis. 2012;25(4):365-370. https://doi.org/10.1097/QCO.0b013e32835565cc.
27. Warren JW, Tenney JH, Hoopes JM, Muncie HL, Anthony WC. A prospective microbiologic study of bacteriuria in patients with chronic indwelling urethral catheters. J Infect Dis. 1982;146(6):719-723. https://doi.org/10.1093/infdis/146.6.719.
28. Lo E, Nicolle L, Coffin S, et al. Strategies to prevent catheter-associated urinary tract infections in acute care hospitals: 2014 update. Infect Control Hosp Epidemiol. 2014;35(5):464-479. https://doi.org/10.1086/675718.
29. Nicolle LE. Urinary catheter-associated infections. Infect Dis Clin N Am. 2012;26(1):13-27. https://doi.org/10.1016/j.idc.2011.09.009.
30. Titsworth WL, Hester J, Correia T, et al. Reduction of catheter-associated urinary tract infections among patients in a neurological intensive care unit: a single institution’s success. J Neurosurg. 2012;116(4):911-920. https://doi.org/10.3171/2011.11.JNS11974.
31. Lobdell KW, Stamou S, Sanchez JA. Hospital-acquired infections. Surg Clin N Am. 2012;92(1):65-77. https://doi.org/10.1016/j.suc.2011.11.003.
32. Gray M. Reducing catheter-associated urinary tract infection in the critical care unit. AACN Adv Crit Care. 2010;21(3):247-257. 33. Fakih MG, Watson SR, Greene T, et al. Reducing inappropriate urinary catheter use. Arch Intern Med. 2012;172(3):255-260. https://doi.org/10.1001/archinternmed.2011.627.
34. Saint S, Wiese J, Amory JK, Bernstein ML, et al. Are physicians aware of which of their patients have an indwelling urinary catheters? Am J Med. 2000;109(6):476-480. https://doi.org/10.1016/s0002-9343(00)00531-3.
35. O’Grady NP, Barie PS, Bartlett JG, et al. Guidelines for evaluation of new fever in critically ill adult patients: 2008 update from the American College of Critical Care Medicine and the Infectious Diseases Society of America. Crit Care Med. 2008;36(4):1330-1349. https://doi.org/10.1097/CCM.0b013e318169eda9.
36. Mullin K, Kovacs C, Fatica C, et al. A multifaceted approach to reduction of catheter-associated urinary tract infections in the intensive care unit with an emphasis on “stewardship of culturing.” Infect Control Hosp Epidemiol. 2017;38(2):186-188. https://doi.org/10.1017/ice.2016.266.
37. Humphries R, Bard J. Point-counterpoint: reflex cultures reduce laboratory workload and improve antimicrobial stewardship in patients suspected of having urinary tract infections. J Clin Microbiol. 2016;54(2):254-258. https://doi.org/10.1128/JCM.03021-15.
38. Voelker R. New fluoroquinolone warning. JAMA. 2016;315(23):2514. https://doi.org/10.1001/jama.2016.7290.
39. Tillotson S. FDA and the safe and appropriate antibiotic use of fluoroquinolones. Lancet Infect Dis. 2016;16(3):PE11-E12.
40. Tanne J. FDA adds “black box” warning label to fluoroquinolone antibiotics. BMJ 2008;337:a816. https://doi.org/10.1136/bmj.a816.
41. Wyndaele JJ, Brauner A, Geerlings SE, et al. Clean intermittent catheterization and urinary tract infection: review and guide for future research. BJU Intern. 2012;110(11c):E910-E917. https://doi.org/10.1111/j.1464-410X.2012.11549.x.
42. Hakwoort RA, Thijs SD, Bouwmeester FW, et al. Comparing clean intermittent catheterization and transurethral indwelling catheterization for incomplete voiding after vaginal prolapse surgery: a multicenter randomized trial. BJOG. 2011;118(9):1055-1060. https://doi.org/10.1111/j.1471-0528.2011.02935.x.
43. Hakvoort RA, Nieuwkerk PT, Burger MP, et al. Patient preferences for clean intermittent catheterization and transurethral indwelling catheterization for treatment of abnormal post-void residual bladder volume after vaginal prolapsed surgery. BJOG. 2011;118(11):1324-1328. https://doi.org/10.1111/j.1471-0528.2011.03056.x.
44. Saint S, Kaufman SR, Roger M, et al. Condom versus indwelling urinary catheters: a randomized trial. JAGS. 2006;54(7):1055-1061. https://doi.org/10.1111/j.1532-5415.2006.00785.x.
45. Pickard R, Lam T, MacLennan G, et al. Antimicrobial catheters for reduction of symptomatic urinary tract infection in adults requiring short-term catheterization in hospital: a multicenter randomized controlled trial. Lancet. 2012;380(9857):1927-1935. https://doi.org/10.1016/S0140-6736(12)61380-4.
46. Parry M, Grant B, Sestovic M. Successful reduction in catheter-associated urinary tract infections: focus on nurse-directed catheter removal. Am J Infect Control. 2013;41(12):1178-1181. https://doi.org/10.1016/j.ajic.2013.03.296.
47. Fuchs MA, Sexton DJ, Thornlow DK, Champagne MT. Evaluation of an evidence-based, nurse-driven checklist to prevent hospital-acquired catheter-associated urinary tract infections in intensive care units. J Nurs Care Qual. 2011;26(2):101-109. https://doi.org/10.1097/NCQ.0b013e3181fb7847.
48. Meddings J, Rogers MA, Macy M, Saint S. Systematic review and meta-analysis: reminder systems to reduce catheter-associated urinary tract infections and urinary catheter use in hospitalized patients. Clin Infect Dis. 2010;51(5):550-560. https://doi.org/10.1086/655133.
49. Baggs J, Fridkin SK, Pollack LA, Srinivasan A, Jernigan JA. Estimating national trends in inpatient antibiotic use among US hospitals from 2006 to 2012. JAMA Intern Med. 2016;176(11):1639-1648. https://doi.org/10.1001/jamainternmed.2016.5651.
50. National Action Plan for Combating Antibiotic-resistant Bacteria. 2015. https://obamawhitehouse.archives.gov/sites/default/files/docs/national_action_plan_for_combatin
Every day in the United States, approximately 4% of patients in acute care hospitals have at least one hospital-acquired infection (HAI).1,2 Among the top 10 causes of death in the United States, HAIs are associated with increased morbidity, mortality, and hospital length of stay (LOS).2 The direct medical cost of treating HAIs is substantial for both hospitals and patients.3,4 Urinary tract infections (UTIs) are a leading cause of HAI, and 70%-80% of these are catheter-associated urinary tract infections (CAUTIs).5,6 In 2016, 26,983 CAUTIs occurred in acute care hospitals.7 The high incidence of CAUTI can substantially contribute to morbidity, length of stay, and mortality.8-11
The recognition that a substantial proportion of HAIs may be preventable, including 55%-70% of CAUTIs,12 has resulted in implementing multiple strategies to reduce CAUTI rates.13-17 These include simple prevention interventions such as avoiding placement of unnecessary indwelling urinary catheters and early removal of urinary catheters when they are no longer clinically indicated. Hospitalists are responsible for the care of many, if not most, inpatients with indwelling urinary catheters and are integral in antimicrobial stewardship efforts surrounding CAUTIs.18 Diagnostic stewardship, including appropriate urine specimen ordering, collection, processing, and reporting, works synergistically with antimicrobial stewardship and allows for appropriate antibiotic prescribing in symptomatic patients.19
DEFINITIONS
CAUTIs can be defined using either clinical or surveillance definitions. Clinical definitions are used at the bedside and take individual clinical characteristics into consideration, but vary among clinicians since there is no gold standard. Abnormal laboratory urinary findings in the absence of symptoms are not sufficient for the diagnosis of UTI, including CAUTI. Surveillance definitions, such as those used by the Centers for Disease Control and Prevention,20 are designed to be simple, easily applicable in any healthcare setting, and standardized to all patients. Surveillance definitions generally include at least one systemic or local symptom (such as fever or dysuria) and positive urine culture in a patient with an indwelling urinary catheter (or within 48 hours after its removal).
Pyuria is leukocytes or white blood cells (WBCs) in a urine specimen, with a threshold of >10 WBCs/high-power field using urine microscopy. The predictive value of different thresholds of pyuria for UTI is unclear.
Bacteriuria denotes the presence (on microscopy or culture) of bacteria in the urine. In a patient without signs or symptoms of a UTI, this is termed asymptomatic bacteriuria (ASB). A full discussion of bacteriuria, a major reason for inappropriate antibiotic use, is beyond the scope of this article but is discussed in a recent guideline.21
Urinary tract infections are usually characterized by a clinical syndrome along with evidence of pyuria and/or bacteriuria. The two major clinical syndromes that are observed are lower UTI (cystitis or bladder infections) and upper UTI (pyelonephritis or kidney infections). Rarely, patients may develop asymptomatic bacteremic UTI, where blood and urine cultures grow the same pathogen in the absence of clinical symptoms. (Table 1 summarizes the key points for these definitions).
CAUSES AND RISK FACTORS FOR CAUTI
Bacterial biofilm can form on the inner and outer surfaces of an indwelling urinary catheter following its insertion and can be associated with bacteriuria and CAUTI.22,23 The biofilm comprises bacteria from the periurethral area that migrate upwards from a colonized drainage system. Bacteria present in the biofilm tend to exhibit slow growth, are protected from antibiotic exposure, and have less susceptibility to these agents.22-24 When a mature biofilm has formed, catheter removal may be necessary for source control and to facilitate effective antimicrobial treatment. The pathogens that most commonly cause CAUTIs are Escherichia coli (23.9%), Pseudomonas aeruginosa (10.3%), and Klebsiella pneumoniae/oxytoca (10.1%).25 Although urine cultures often grow yeast, particularly Candida spp., nonbacterial pathogens rarely cause UTI.
The risk of developing a CAUTI is directly related to catheter dwell time.26,27 For catheterized patients, the rate of development of catheter-associated bacteriuria is approximately 3% to 7% per day14,28 and is more common in the elderly and females. The likelihood of bacteriuria approaches 100% if a patient has an indwelling urinary catheter for ≥30 days,27,29,30 which is part of the rationale for why a urine culture alone is not sufficient to diagnose a CAUTI. While bacteriuria is a risk factor for UTI, the frequency of progression from bacteriuria to CAUTI is low and treating ASB does not decrease the risk of future CAUTI. Other risk factors for the development of CAUTI include urinary tract instrumentation, diabetes mellitus, and malnutrition.31,32
The two most important factors that lead to the development of CAUTIs and have been the main focus of quality improvement areas are unnecessary urinary catheter placement and inappropriate delay in removing a catheter when it is no longer needed.26,33 Unfortunately, 38% of attending physicians are unaware that their patients have a urinary catheter in place.34 Furthermore, in 20% to 50% of cases, there is no clear indication for catheter placement.2,34
DIAGNOSIS OF CAUTI
A CAUTI diagnosis is typically one of exclusion, as most patients present with fever and no apparent alternative source.14,29 Since catheterized patients may not exhibit common cystitis symptoms,29 most who develop CAUTI present with fever alone. However, most fevers in patients with bacteriuria and catheters are not CAUTIs and can be attributed to other sources. If a patient with an indwelling urinary catheter develops a fever and there is a suspicion of a CAUTI, careful evaluation is warranted for alternative sources of infection. This particularly applies to patients with severe systemic illness, such as hypotension or systemic inflammatory response syndrome, since these are unusual manifestations of CAUTI. The presence of either cloudy or malodorous urine does not indicate a UTI, and should not be the sole rationale for obtaining a urine culture.
Diagnostic workup of fever should include a clinical assessment of the patient. Indeed, professional guidelines recommend against obtaining a urine culture routinely for fever, unless invasive UTI risk is elevated, such as in patients with neutropenia, history of renal transplantation, or recent genitourinary surgery.35 Diagnostic stewardship, focusing on the appropriate use of urine cultures, can reduce CAUTI rates.36 For catheterized patients, hospitals are increasingly adopting reflex urine culture, where urine is simultaneously collected for a urinalysis and urine culture, but a urine culture is performed only if the urinalysis is positive for a predetermined threshold for pyuria, leukocyte esterase, or both. However, the use of reflex urine cultures remains an area of debate.37 In addition, the Infectious Diseases Society of America recommends against screening for or treating ASB in patients with either short-term (<30 days) or long-term indwelling urethral catheters.21
Ideally, a urine culture should be obtained by collecting a midstream sample. In catheterized patients, a sample should be obtained after removal of the catheter; or, in patients with a clinical indication for ongoing catheterization, a sample should be obtained after a new catheter has been placed.14 If an indwelling urinary catheter must be continued, the recommendation is to disinfect the drainage system’s aspiration port and then obtain a urine culture. Urine should never be obtained from a catheter collection bag. (Table 2 summarizes best practices for diagnosis of CAUTI).
TREATMENT OF CAUTI
For all CAUTIs, an indwelling urinary catheter should be removed as soon as possible. If an indwelling urinary catheter remains necessary, but the existing catheter has been in place longer than two weeks, a new catheter should be placed before initiating antibiotic therapy14 to accelerate symptom resolution and reduce the likelihood of relapse or recurrence.32
Urinary tract agents such as fosfomycin and nitrofurantoin are recommended as first-line agents for simple cystitis in women and can be used in patients with lower UTI and sufficient renal function to achieve adequate drug concentration in urine. Upper UTIs require antibiotics with good penetration into renal parenchyma such as ceftriaxone. If empiric antimicrobial therapy is needed before culture results are available, then previous urine culture results, local antibiograms, or practice guidelines can guide selection. Definitive antimicrobial therapy should be based on urine culture results. It is important to narrow empiric therapy14 to reduce risk of Clostridioides difficile infection and emergence of other resistant bacteria. Fluoroquinolones should be avoided for lower UTIs because of these risks and multiple United States Food and Drug Administration warnings.38-40
The optimal duration of antimicrobial therapy for a CAUTI is unclear;14 however, most patients can be treated with a relatively short duration of therapy (≤7 days) if they respond promptly to therapy. Patients with a slow response to therapy may require 10-14 days of treatment.14 (Table 2 summarizes best practices for the treatment of CAUTI).
STRATEGIES FOR CAUTI PREVENTION
Since CAUTI is predicated on the presence of an indwelling urinary catheter, the simplest way to reduce CAUTI is to avoid placing or retaining unnecessary catheters. Some examples of appropriate indications9 for placement and maintenance of an indwelling urinary catheter are listed below:
1. Accurate measurement of urinary output in severely ill patients;
2. Improved comfort for patients receiving end-of-life care;
3. Acute urinary retention or bladder outlet obstruction;
4. Need for a period of prolonged immobilization (eg, potentially unstable lumbar or thoracic spine, or has multiple traumatic injuries);
5. Selected surgical procedures, such as urologic procedures and those that are expected to have a prolonged duration, require intraoperative monitoring of urine output, require the administration of either large volumes of intravenous infusions or diuretics;
6. To promote healing of open perineal or sacral wounds in patients with incontinence;
7. Neurogenic bladder; and
8. Hematuria with clots.
To increase the timely removal of urinary catheters that are no longer indicated, daily assessment of catheter necessity must be an integral part of clinicians’ workflow.32,33 Alternatives, such as external catheters or intermittent catheterization, should be considered before indwelling urinary catheter placement since both options are associated with a reduced CAUTI risk.41-44 Although indwelling urinary catheters can be seen as being more convenient for both patients and healthcare providers, many patients have expressed a preference for the use of intermittent catheterization compared with indwelling urinary catheterization.43
For urinary retention, bladder scanning can noninvasively assess the amount of residual urine in a patient’s bladder and can avoid unnecessary insertion of an indwelling urinary catheter. However, if indwelling urinary catheters are ultimately needed, they must be inserted and maintained appropriately. Of note, the use of antibiotic-impregnated catheters has not been shown to reduce CAUTI rates significantly.45
CAUTI prevention requires a multidisciplinary collaborative approach. Nurse-driven protocols and checklists to remove indwelling urinary catheters that are no longer indicated can be very effective.46,47 Automatic stop orders and catheter removal reminders are useful for reducing the duration of catheter placement.26,48 Both of these approaches require appropriate, consistent documentation with input from bedside nurses, physicians, advanced practice providers, and information technology. (Table 3 summarizes best practices for the prevention of CAUTI).
Importantly, CAUTI prevention supports broader antimicrobial stewardship. Over 55% of inpatients receive at least one dose of an antibiotic during their hospital stay.48,49 In 2015, the White House released the National Action Plan for Combating Antibiotic-Resistant Bacteria with the goals of slowing the emergence of resistant bacteria, preventing the spread of antibiotic-resistant infections, and setting a target of a 20% reduction in the inappropriate use of antibiotics for hospitalized patients.50 Hospitalists care for a substantial number of inpatients and, in turn, can drive actions to decrease CAUTIs, and promote stewardship efforts. Through actions to decrease CAUTIs, hospitalists can promote these stewardship efforts.
CONCLUSIONS
CAUTI is one of the most common types of HAI and is associated with increased morbidity, hospital length of stay, and patient costs. Most CAUTIs are preventable by limiting the placement of unnecessary catheters to instances of true necessity and removing catheters when they are no longer clinically indicated. Proper technique for the insertion and maintenance of catheters is also important for reducing CAUTI rates. Hospitalists care for a substantial number of inpatients and can make major contributions to the appropriate diagnosis, treatment, and prevention of CAUTIs.
Every day in the United States, approximately 4% of patients in acute care hospitals have at least one hospital-acquired infection (HAI).1,2 Among the top 10 causes of death in the United States, HAIs are associated with increased morbidity, mortality, and hospital length of stay (LOS).2 The direct medical cost of treating HAIs is substantial for both hospitals and patients.3,4 Urinary tract infections (UTIs) are a leading cause of HAI, and 70%-80% of these are catheter-associated urinary tract infections (CAUTIs).5,6 In 2016, 26,983 CAUTIs occurred in acute care hospitals.7 The high incidence of CAUTI can substantially contribute to morbidity, length of stay, and mortality.8-11
The recognition that a substantial proportion of HAIs may be preventable, including 55%-70% of CAUTIs,12 has resulted in implementing multiple strategies to reduce CAUTI rates.13-17 These include simple prevention interventions such as avoiding placement of unnecessary indwelling urinary catheters and early removal of urinary catheters when they are no longer clinically indicated. Hospitalists are responsible for the care of many, if not most, inpatients with indwelling urinary catheters and are integral in antimicrobial stewardship efforts surrounding CAUTIs.18 Diagnostic stewardship, including appropriate urine specimen ordering, collection, processing, and reporting, works synergistically with antimicrobial stewardship and allows for appropriate antibiotic prescribing in symptomatic patients.19
DEFINITIONS
CAUTIs can be defined using either clinical or surveillance definitions. Clinical definitions are used at the bedside and take individual clinical characteristics into consideration, but vary among clinicians since there is no gold standard. Abnormal laboratory urinary findings in the absence of symptoms are not sufficient for the diagnosis of UTI, including CAUTI. Surveillance definitions, such as those used by the Centers for Disease Control and Prevention,20 are designed to be simple, easily applicable in any healthcare setting, and standardized to all patients. Surveillance definitions generally include at least one systemic or local symptom (such as fever or dysuria) and positive urine culture in a patient with an indwelling urinary catheter (or within 48 hours after its removal).
Pyuria is leukocytes or white blood cells (WBCs) in a urine specimen, with a threshold of >10 WBCs/high-power field using urine microscopy. The predictive value of different thresholds of pyuria for UTI is unclear.
Bacteriuria denotes the presence (on microscopy or culture) of bacteria in the urine. In a patient without signs or symptoms of a UTI, this is termed asymptomatic bacteriuria (ASB). A full discussion of bacteriuria, a major reason for inappropriate antibiotic use, is beyond the scope of this article but is discussed in a recent guideline.21
Urinary tract infections are usually characterized by a clinical syndrome along with evidence of pyuria and/or bacteriuria. The two major clinical syndromes that are observed are lower UTI (cystitis or bladder infections) and upper UTI (pyelonephritis or kidney infections). Rarely, patients may develop asymptomatic bacteremic UTI, where blood and urine cultures grow the same pathogen in the absence of clinical symptoms. (Table 1 summarizes the key points for these definitions).
CAUSES AND RISK FACTORS FOR CAUTI
Bacterial biofilm can form on the inner and outer surfaces of an indwelling urinary catheter following its insertion and can be associated with bacteriuria and CAUTI.22,23 The biofilm comprises bacteria from the periurethral area that migrate upwards from a colonized drainage system. Bacteria present in the biofilm tend to exhibit slow growth, are protected from antibiotic exposure, and have less susceptibility to these agents.22-24 When a mature biofilm has formed, catheter removal may be necessary for source control and to facilitate effective antimicrobial treatment. The pathogens that most commonly cause CAUTIs are Escherichia coli (23.9%), Pseudomonas aeruginosa (10.3%), and Klebsiella pneumoniae/oxytoca (10.1%).25 Although urine cultures often grow yeast, particularly Candida spp., nonbacterial pathogens rarely cause UTI.
The risk of developing a CAUTI is directly related to catheter dwell time.26,27 For catheterized patients, the rate of development of catheter-associated bacteriuria is approximately 3% to 7% per day14,28 and is more common in the elderly and females. The likelihood of bacteriuria approaches 100% if a patient has an indwelling urinary catheter for ≥30 days,27,29,30 which is part of the rationale for why a urine culture alone is not sufficient to diagnose a CAUTI. While bacteriuria is a risk factor for UTI, the frequency of progression from bacteriuria to CAUTI is low and treating ASB does not decrease the risk of future CAUTI. Other risk factors for the development of CAUTI include urinary tract instrumentation, diabetes mellitus, and malnutrition.31,32
The two most important factors that lead to the development of CAUTIs and have been the main focus of quality improvement areas are unnecessary urinary catheter placement and inappropriate delay in removing a catheter when it is no longer needed.26,33 Unfortunately, 38% of attending physicians are unaware that their patients have a urinary catheter in place.34 Furthermore, in 20% to 50% of cases, there is no clear indication for catheter placement.2,34
DIAGNOSIS OF CAUTI
A CAUTI diagnosis is typically one of exclusion, as most patients present with fever and no apparent alternative source.14,29 Since catheterized patients may not exhibit common cystitis symptoms,29 most who develop CAUTI present with fever alone. However, most fevers in patients with bacteriuria and catheters are not CAUTIs and can be attributed to other sources. If a patient with an indwelling urinary catheter develops a fever and there is a suspicion of a CAUTI, careful evaluation is warranted for alternative sources of infection. This particularly applies to patients with severe systemic illness, such as hypotension or systemic inflammatory response syndrome, since these are unusual manifestations of CAUTI. The presence of either cloudy or malodorous urine does not indicate a UTI, and should not be the sole rationale for obtaining a urine culture.
Diagnostic workup of fever should include a clinical assessment of the patient. Indeed, professional guidelines recommend against obtaining a urine culture routinely for fever, unless invasive UTI risk is elevated, such as in patients with neutropenia, history of renal transplantation, or recent genitourinary surgery.35 Diagnostic stewardship, focusing on the appropriate use of urine cultures, can reduce CAUTI rates.36 For catheterized patients, hospitals are increasingly adopting reflex urine culture, where urine is simultaneously collected for a urinalysis and urine culture, but a urine culture is performed only if the urinalysis is positive for a predetermined threshold for pyuria, leukocyte esterase, or both. However, the use of reflex urine cultures remains an area of debate.37 In addition, the Infectious Diseases Society of America recommends against screening for or treating ASB in patients with either short-term (<30 days) or long-term indwelling urethral catheters.21
Ideally, a urine culture should be obtained by collecting a midstream sample. In catheterized patients, a sample should be obtained after removal of the catheter; or, in patients with a clinical indication for ongoing catheterization, a sample should be obtained after a new catheter has been placed.14 If an indwelling urinary catheter must be continued, the recommendation is to disinfect the drainage system’s aspiration port and then obtain a urine culture. Urine should never be obtained from a catheter collection bag. (Table 2 summarizes best practices for diagnosis of CAUTI).
TREATMENT OF CAUTI
For all CAUTIs, an indwelling urinary catheter should be removed as soon as possible. If an indwelling urinary catheter remains necessary, but the existing catheter has been in place longer than two weeks, a new catheter should be placed before initiating antibiotic therapy14 to accelerate symptom resolution and reduce the likelihood of relapse or recurrence.32
Urinary tract agents such as fosfomycin and nitrofurantoin are recommended as first-line agents for simple cystitis in women and can be used in patients with lower UTI and sufficient renal function to achieve adequate drug concentration in urine. Upper UTIs require antibiotics with good penetration into renal parenchyma such as ceftriaxone. If empiric antimicrobial therapy is needed before culture results are available, then previous urine culture results, local antibiograms, or practice guidelines can guide selection. Definitive antimicrobial therapy should be based on urine culture results. It is important to narrow empiric therapy14 to reduce risk of Clostridioides difficile infection and emergence of other resistant bacteria. Fluoroquinolones should be avoided for lower UTIs because of these risks and multiple United States Food and Drug Administration warnings.38-40
The optimal duration of antimicrobial therapy for a CAUTI is unclear;14 however, most patients can be treated with a relatively short duration of therapy (≤7 days) if they respond promptly to therapy. Patients with a slow response to therapy may require 10-14 days of treatment.14 (Table 2 summarizes best practices for the treatment of CAUTI).
STRATEGIES FOR CAUTI PREVENTION
Since CAUTI is predicated on the presence of an indwelling urinary catheter, the simplest way to reduce CAUTI is to avoid placing or retaining unnecessary catheters. Some examples of appropriate indications9 for placement and maintenance of an indwelling urinary catheter are listed below:
1. Accurate measurement of urinary output in severely ill patients;
2. Improved comfort for patients receiving end-of-life care;
3. Acute urinary retention or bladder outlet obstruction;
4. Need for a period of prolonged immobilization (eg, potentially unstable lumbar or thoracic spine, or has multiple traumatic injuries);
5. Selected surgical procedures, such as urologic procedures and those that are expected to have a prolonged duration, require intraoperative monitoring of urine output, require the administration of either large volumes of intravenous infusions or diuretics;
6. To promote healing of open perineal or sacral wounds in patients with incontinence;
7. Neurogenic bladder; and
8. Hematuria with clots.
To increase the timely removal of urinary catheters that are no longer indicated, daily assessment of catheter necessity must be an integral part of clinicians’ workflow.32,33 Alternatives, such as external catheters or intermittent catheterization, should be considered before indwelling urinary catheter placement since both options are associated with a reduced CAUTI risk.41-44 Although indwelling urinary catheters can be seen as being more convenient for both patients and healthcare providers, many patients have expressed a preference for the use of intermittent catheterization compared with indwelling urinary catheterization.43
For urinary retention, bladder scanning can noninvasively assess the amount of residual urine in a patient’s bladder and can avoid unnecessary insertion of an indwelling urinary catheter. However, if indwelling urinary catheters are ultimately needed, they must be inserted and maintained appropriately. Of note, the use of antibiotic-impregnated catheters has not been shown to reduce CAUTI rates significantly.45
CAUTI prevention requires a multidisciplinary collaborative approach. Nurse-driven protocols and checklists to remove indwelling urinary catheters that are no longer indicated can be very effective.46,47 Automatic stop orders and catheter removal reminders are useful for reducing the duration of catheter placement.26,48 Both of these approaches require appropriate, consistent documentation with input from bedside nurses, physicians, advanced practice providers, and information technology. (Table 3 summarizes best practices for the prevention of CAUTI).
Importantly, CAUTI prevention supports broader antimicrobial stewardship. Over 55% of inpatients receive at least one dose of an antibiotic during their hospital stay.48,49 In 2015, the White House released the National Action Plan for Combating Antibiotic-Resistant Bacteria with the goals of slowing the emergence of resistant bacteria, preventing the spread of antibiotic-resistant infections, and setting a target of a 20% reduction in the inappropriate use of antibiotics for hospitalized patients.50 Hospitalists care for a substantial number of inpatients and, in turn, can drive actions to decrease CAUTIs, and promote stewardship efforts. Through actions to decrease CAUTIs, hospitalists can promote these stewardship efforts.
CONCLUSIONS
CAUTI is one of the most common types of HAI and is associated with increased morbidity, hospital length of stay, and patient costs. Most CAUTIs are preventable by limiting the placement of unnecessary catheters to instances of true necessity and removing catheters when they are no longer clinically indicated. Proper technique for the insertion and maintenance of catheters is also important for reducing CAUTI rates. Hospitalists care for a substantial number of inpatients and can make major contributions to the appropriate diagnosis, treatment, and prevention of CAUTIs.
1. Centers for Disease Control and Prevention. Estimates of healthcare-associated infections. http://www.cdc.gov/ncidod/dhqp/hai.html. Accessed September 27, 2018.
2. Calfee D. Crisis in hospital-acquired, healthcare-associated infections. Annu Rev Med. 2012;63(1):359-371. https://doi.org/10.1146/annurev-med-081210-144458.
3. Scott R. 2009. The direct medical costs of healthcare-associated infections in U.S. hospitals and the benefits of prevention. Centers for Disease Control and Prevention, Atlanta. http://www.cdc.gov/ncidod/dhqp/pdf/Scott_CostPaper.pdf. Accessed September 27, 2018.
4. Zimlachman E, Henderson D, Tamir O, et al. Health care associated infections. A meta-analysis of costs and financial impact on the US health care system. JAMA Intern Med. 2013;173(22):2039-2046. https://doi.org/10.1001/jamainternmed.2013.9763.
5. Nicolle LE. Catheter-acquired urinary tract infection: the once and future guidelines. Infect Control Hosp Epidemiol. 2010;31(4):327-329. https://doi.org/10.1086/651092.
6. Weber DJ, Sickbert-Bennett EE, Gould CV, et al. Incidence of catheter-associated and noncatheter-associated urinary tract infections in a healthcare system. Infect Control Hosp Epidemiol. 2011;32(8):822-823. https://doi.org/10.1086/661107.
7. Healthcare-associated infections. National and state HAI progress reports or SIR reports. https://www.cdc.gov/hai/data/archive/archive.html. Accessed May 6, 2019.
8. Saint S. Clinical and economic consequences of nosocomial catheter-related bacteriuria. Am J Infect Control. 2000;28(1):68-75. https://doi.org/10.1016/S0196-6553(00)90015-4.
9. Platt R, Polk BF, Murdock B, Rosner B. Mortality associated with nosocomial urinary-tract infection. N Engl J Med. 1982;307(11):637-642. https://doi.org/10.1056/NEJM198209093071101.
10. Tambyah PA, Knasinski V, Maki DG. The direct costs of nosocomial catheter-associated urinary tract infection in the era of managed care. Infect Control Hosp Epidemiol. 2002;23(1):27-31.
11. Chant C, Smith OM, Marshall JC, Friedrich JO. Relationship of catheter-associated urinary tract infection to mortality and length of stay in critically ill patients: a systematic review and meta-analysis of observational studies. Crit Care Med. 2011;39(5):1167-1173. https://doi.org/10.1097/CCM.0b013e31820a8581.
12. Umscheid CA, Mitchell MD, Doshi JA, et al. Estimating the proportion of healthcare-associated infections that are reasonably preventable and the related mortality and costs. Infect Control Hosp Epidemiol. 2011;32(2):101-114. https://doi.org/10.1086/657912.
13. Gould C, Umscheid C, Agarwal R, et al. Healthcare Infection Control Practices Advisory Committee (HICPAC): guideline for the prevention of catheter-associated urinary tract infections, 2009. http://www.cdc.gov/hicpac/pdf/CAUTI/CAUTIguideline2009final.pdf. Accessed November 1, 2018.
14. Hooton TM, Bradley SF, Cardenas DD, et al. Diagnosis, prevention, and treatment of catheter-associated urinary tract infection in adults: 2009 International Clinical Practice Guidelines from the Infectious Diseases Society of America. Clin Infect Dis. 2010;50(5):625-663. https://doi.org/10.1086/650482.
15. Conway LJ, Larson EL. Guidelines to prevent catheter-associated urinary tract infection: 1980 to 2010. Heart Lung. 2011;41(3):271-283. https://doi.org/10.1016/j.hrtlng.2011.08.001.
16. Greene L, Marx J, Oriola S. APIC elimination guide: guide to the elimination of catheter-associated urinary tract infections (CAUTIs). http://www.apic.org/Content/NavigationMenu/PracticeGuidance/APICEliminationGuides/CAUTI_Guide_0609.pdf. Accessed October 15, 2018.
17. Yokoe DS, Mermel LA, Anderson DJ, et al. A compendium of strategies to prevent healthcare-associated infections in acute care hospitals. Infect Control Hosp Epidemiol. 2008;29(S1):S12-S21.
18. Wiley Z, Kobaidze K, Sexton ME, Jacob JT. Hospitalists as integral stakeholders in antimicrobial stewardship. Curr Treat Options Infect Dis. 2018;10(2):240-248. https://doi.org/10.1007/s40506-018-0162-z.
19. Claeys KC, Blanco N, Morgan DJ, Leekha S, Sullivan KV. Advances and challenges in the diagnosis and treatment of urinary tract infections: the need for diagnostic stewardship. Curr Infect Dis Rep. 2019;21(4):11. https://doi.org/10.1007/s11908-019-0668-7.
20. Horan T, Andrus M, Dudeck M. CDC/NHSN surveillance definition of health care-associated infection and criteria for specific types of infections in the acute care setting. Am J Infect Control. 2008;36(5):309-332. https://doi.org/10.1016/j.ajic.2008.03.002.
21. Nicolle LE, Gupta K, Bradley S, et al. Clinical practice guideline for the management of asymptomatic bacteriuria: 2019 Update by the Infectious Diseases Society of America. Clin Infect Dis. 2019;68(10):e83-e110.
22. Donlan R. Biofilms and device-associated infections. Emerg Infect Dis. 2001;7(2):277-281. https://doi.org/10.3201/eid0702.010226.
23. Choe HS, Son SW, Choi HA, et al. Analysis of the distribution of bacteria within urinary catheter biofilms using four different molecular techniques. Am J Infect Control. 2012;40(9):e249-e254. https://doi.org/10.1016/j.ajic.2012.05.010.
24. Mohajer M, Darouiche R. Prevention and treatment of urinary catheter-associated infections. Curr Infect Dis Rep. 2013;15(2):116-123. https://doi.org/10.1007/s11908-013-0316-6.
25. Weiner LM, Webb AK, Limbago B, et al. Antimicrobial-resistant pathogens associated with healthcare-associated infections: summary of data reported to the National Healthcare Safety Network at the Centers for Disease Control and Prevention, 2011-2014. Infect Control Hosp Epidemiol. 2016;37(11):1288-1301. https://doi.org/10.1017/ice.2016.174.
26. Tambyah PA, Oon J. Catheter-associated urinary tract infection. Curr Opin Infect Dis. 2012;25(4):365-370. https://doi.org/10.1097/QCO.0b013e32835565cc.
27. Warren JW, Tenney JH, Hoopes JM, Muncie HL, Anthony WC. A prospective microbiologic study of bacteriuria in patients with chronic indwelling urethral catheters. J Infect Dis. 1982;146(6):719-723. https://doi.org/10.1093/infdis/146.6.719.
28. Lo E, Nicolle L, Coffin S, et al. Strategies to prevent catheter-associated urinary tract infections in acute care hospitals: 2014 update. Infect Control Hosp Epidemiol. 2014;35(5):464-479. https://doi.org/10.1086/675718.
29. Nicolle LE. Urinary catheter-associated infections. Infect Dis Clin N Am. 2012;26(1):13-27. https://doi.org/10.1016/j.idc.2011.09.009.
30. Titsworth WL, Hester J, Correia T, et al. Reduction of catheter-associated urinary tract infections among patients in a neurological intensive care unit: a single institution’s success. J Neurosurg. 2012;116(4):911-920. https://doi.org/10.3171/2011.11.JNS11974.
31. Lobdell KW, Stamou S, Sanchez JA. Hospital-acquired infections. Surg Clin N Am. 2012;92(1):65-77. https://doi.org/10.1016/j.suc.2011.11.003.
32. Gray M. Reducing catheter-associated urinary tract infection in the critical care unit. AACN Adv Crit Care. 2010;21(3):247-257.33. Fakih MG, Watson SR, Greene T, et al. Reducing inappropriate urinary catheter use. Arch Intern Med. 2012;172(3):255-260. https://doi.org/10.1001/archinternmed.2011.627.
34. Saint S, Wiese J, Amory JK, Bernstein ML, et al. Are physicians aware of which of their patients have an indwelling urinary catheters? Am J Med. 2000;109(6):476-480. https://doi.org/10.1016/s0002-9343(00)00531-3.
35. O’Grady NP, Barie PS, Bartlett JG, et al. Guidelines for evaluation of new fever in critically ill adult patients: 2008 update from the American College of Critical Care Medicine and the Infectious Diseases Society of America. Crit Care Med. 2008;36(4):1330-1349. https://doi.org/10.1097/CCM.0b013e318169eda9.
36. Mullin K, Kovacs C, Fatica C, et al. A multifaceted approach to reduction of catheter-associated urinary tract infections in the intensive care unit with an emphasis on “stewardship of culturing.” Infect Control Hosp Epidemiol. 2017;38(2):186-188. https://doi.org/10.1017/ice.2016.266.
37. Humphries R, Bard J. Point-counterpoint: reflex cultures reduce laboratory workload and improve antimicrobial stewardship in patients suspected of having urinary tract infections. J Clin Microbiol. 2016;54(2):254-258. https://doi.org/10.1128/JCM.03021-15.
38. Voelker R. New fluoroquinolone warning. JAMA. 2016;315(23):2514. https://doi.org/10.1001/jama.2016.7290.
39. Tillotson S. FDA and the safe and appropriate antibiotic use of fluoroquinolones. Lancet Infect Dis. 2016;16(3):PE11-E12.
40. Tanne J. FDA adds “black box” warning label to fluoroquinolone antibiotics. BMJ 2008;337:a816. https://doi.org/10.1136/bmj.a816.
41. Wyndaele JJ, Brauner A, Geerlings SE, et al. Clean intermittent catheterization and urinary tract infection: review and guide for future research. BJU Intern. 2012;110(11c):E910-E917. https://doi.org/10.1111/j.1464-410X.2012.11549.x.
42. Hakwoort RA, Thijs SD, Bouwmeester FW, et al. Comparing clean intermittent catheterization and transurethral indwelling catheterization for incomplete voiding after vaginal prolapse surgery: a multicenter randomized trial. BJOG. 2011;118(9):1055-1060. https://doi.org/10.1111/j.1471-0528.2011.02935.x.
43. Hakvoort RA, Nieuwkerk PT, Burger MP, et al. Patient preferences for clean intermittent catheterization and transurethral indwelling catheterization for treatment of abnormal post-void residual bladder volume after vaginal prolapsed surgery. BJOG. 2011;118(11):1324-1328. https://doi.org/10.1111/j.1471-0528.2011.03056.x.
44. Saint S, Kaufman SR, Roger M, et al. Condom versus indwelling urinary catheters: a randomized trial. JAGS. 2006;54(7):1055-1061. https://doi.org/10.1111/j.1532-5415.2006.00785.x.
45. Pickard R, Lam T, MacLennan G, et al. Antimicrobial catheters for reduction of symptomatic urinary tract infection in adults requiring short-term catheterization in hospital: a multicenter randomized controlled trial. Lancet. 2012;380(9857):1927-1935. https://doi.org/10.1016/S0140-6736(12)61380-4.
46. Parry M, Grant B, Sestovic M. Successful reduction in catheter-associated urinary tract infections: focus on nurse-directed catheter removal. Am J Infect Control. 2013;41(12):1178-1181. https://doi.org/10.1016/j.ajic.2013.03.296.
47. Fuchs MA, Sexton DJ, Thornlow DK, Champagne MT. Evaluation of an evidence-based, nurse-driven checklist to prevent hospital-acquired catheter-associated urinary tract infections in intensive care units. J Nurs Care Qual. 2011;26(2):101-109. https://doi.org/10.1097/NCQ.0b013e3181fb7847.
48. Meddings J, Rogers MA, Macy M, Saint S. Systematic review and meta-analysis: reminder systems to reduce catheter-associated urinary tract infections and urinary catheter use in hospitalized patients. Clin Infect Dis. 2010;51(5):550-560. https://doi.org/10.1086/655133.
49. Baggs J, Fridkin SK, Pollack LA, Srinivasan A, Jernigan JA. Estimating national trends in inpatient antibiotic use among US hospitals from 2006 to 2012. JAMA Intern Med. 2016;176(11):1639-1648. https://doi.org/10.1001/jamainternmed.2016.5651.
50. National Action Plan for Combating Antibiotic-resistant Bacteria. 2015. https://obamawhitehouse.archives.gov/sites/default/files/docs/national_action_plan_for_combatin
1. Centers for Disease Control and Prevention. Estimates of healthcare-associated infections. http://www.cdc.gov/ncidod/dhqp/hai.html. Accessed September 27, 2018.
2. Calfee D. Crisis in hospital-acquired, healthcare-associated infections. Annu Rev Med. 2012;63(1):359-371. https://doi.org/10.1146/annurev-med-081210-144458.
3. Scott R. 2009. The direct medical costs of healthcare-associated infections in U.S. hospitals and the benefits of prevention. Centers for Disease Control and Prevention, Atlanta. http://www.cdc.gov/ncidod/dhqp/pdf/Scott_CostPaper.pdf. Accessed September 27, 2018.
4. Zimlachman E, Henderson D, Tamir O, et al. Health care associated infections. A meta-analysis of costs and financial impact on the US health care system. JAMA Intern Med. 2013;173(22):2039-2046. https://doi.org/10.1001/jamainternmed.2013.9763.
5. Nicolle LE. Catheter-acquired urinary tract infection: the once and future guidelines. Infect Control Hosp Epidemiol. 2010;31(4):327-329. https://doi.org/10.1086/651092.
6. Weber DJ, Sickbert-Bennett EE, Gould CV, et al. Incidence of catheter-associated and noncatheter-associated urinary tract infections in a healthcare system. Infect Control Hosp Epidemiol. 2011;32(8):822-823. https://doi.org/10.1086/661107.
7. Healthcare-associated infections. National and state HAI progress reports or SIR reports. https://www.cdc.gov/hai/data/archive/archive.html. Accessed May 6, 2019.
8. Saint S. Clinical and economic consequences of nosocomial catheter-related bacteriuria. Am J Infect Control. 2000;28(1):68-75. https://doi.org/10.1016/S0196-6553(00)90015-4.
9. Platt R, Polk BF, Murdock B, Rosner B. Mortality associated with nosocomial urinary-tract infection. N Engl J Med. 1982;307(11):637-642. https://doi.org/10.1056/NEJM198209093071101.
10. Tambyah PA, Knasinski V, Maki DG. The direct costs of nosocomial catheter-associated urinary tract infection in the era of managed care. Infect Control Hosp Epidemiol. 2002;23(1):27-31.
11. Chant C, Smith OM, Marshall JC, Friedrich JO. Relationship of catheter-associated urinary tract infection to mortality and length of stay in critically ill patients: a systematic review and meta-analysis of observational studies. Crit Care Med. 2011;39(5):1167-1173. https://doi.org/10.1097/CCM.0b013e31820a8581.
12. Umscheid CA, Mitchell MD, Doshi JA, et al. Estimating the proportion of healthcare-associated infections that are reasonably preventable and the related mortality and costs. Infect Control Hosp Epidemiol. 2011;32(2):101-114. https://doi.org/10.1086/657912.
13. Gould C, Umscheid C, Agarwal R, et al. Healthcare Infection Control Practices Advisory Committee (HICPAC): guideline for the prevention of catheter-associated urinary tract infections, 2009. http://www.cdc.gov/hicpac/pdf/CAUTI/CAUTIguideline2009final.pdf. Accessed November 1, 2018.
14. Hooton TM, Bradley SF, Cardenas DD, et al. Diagnosis, prevention, and treatment of catheter-associated urinary tract infection in adults: 2009 International Clinical Practice Guidelines from the Infectious Diseases Society of America. Clin Infect Dis. 2010;50(5):625-663. https://doi.org/10.1086/650482.
15. Conway LJ, Larson EL. Guidelines to prevent catheter-associated urinary tract infection: 1980 to 2010. Heart Lung. 2011;41(3):271-283. https://doi.org/10.1016/j.hrtlng.2011.08.001.
16. Greene L, Marx J, Oriola S. APIC elimination guide: guide to the elimination of catheter-associated urinary tract infections (CAUTIs). http://www.apic.org/Content/NavigationMenu/PracticeGuidance/APICEliminationGuides/CAUTI_Guide_0609.pdf. Accessed October 15, 2018.
17. Yokoe DS, Mermel LA, Anderson DJ, et al. A compendium of strategies to prevent healthcare-associated infections in acute care hospitals. Infect Control Hosp Epidemiol. 2008;29(S1):S12-S21.
18. Wiley Z, Kobaidze K, Sexton ME, Jacob JT. Hospitalists as integral stakeholders in antimicrobial stewardship. Curr Treat Options Infect Dis. 2018;10(2):240-248. https://doi.org/10.1007/s40506-018-0162-z.
19. Claeys KC, Blanco N, Morgan DJ, Leekha S, Sullivan KV. Advances and challenges in the diagnosis and treatment of urinary tract infections: the need for diagnostic stewardship. Curr Infect Dis Rep. 2019;21(4):11. https://doi.org/10.1007/s11908-019-0668-7.
20. Horan T, Andrus M, Dudeck M. CDC/NHSN surveillance definition of health care-associated infection and criteria for specific types of infections in the acute care setting. Am J Infect Control. 2008;36(5):309-332. https://doi.org/10.1016/j.ajic.2008.03.002.
21. Nicolle LE, Gupta K, Bradley S, et al. Clinical practice guideline for the management of asymptomatic bacteriuria: 2019 Update by the Infectious Diseases Society of America. Clin Infect Dis. 2019;68(10):e83-e110.
22. Donlan R. Biofilms and device-associated infections. Emerg Infect Dis. 2001;7(2):277-281. https://doi.org/10.3201/eid0702.010226.
23. Choe HS, Son SW, Choi HA, et al. Analysis of the distribution of bacteria within urinary catheter biofilms using four different molecular techniques. Am J Infect Control. 2012;40(9):e249-e254. https://doi.org/10.1016/j.ajic.2012.05.010.
24. Mohajer M, Darouiche R. Prevention and treatment of urinary catheter-associated infections. Curr Infect Dis Rep. 2013;15(2):116-123. https://doi.org/10.1007/s11908-013-0316-6.
25. Weiner LM, Webb AK, Limbago B, et al. Antimicrobial-resistant pathogens associated with healthcare-associated infections: summary of data reported to the National Healthcare Safety Network at the Centers for Disease Control and Prevention, 2011-2014. Infect Control Hosp Epidemiol. 2016;37(11):1288-1301. https://doi.org/10.1017/ice.2016.174.
26. Tambyah PA, Oon J. Catheter-associated urinary tract infection. Curr Opin Infect Dis. 2012;25(4):365-370. https://doi.org/10.1097/QCO.0b013e32835565cc.
27. Warren JW, Tenney JH, Hoopes JM, Muncie HL, Anthony WC. A prospective microbiologic study of bacteriuria in patients with chronic indwelling urethral catheters. J Infect Dis. 1982;146(6):719-723. https://doi.org/10.1093/infdis/146.6.719.
28. Lo E, Nicolle L, Coffin S, et al. Strategies to prevent catheter-associated urinary tract infections in acute care hospitals: 2014 update. Infect Control Hosp Epidemiol. 2014;35(5):464-479. https://doi.org/10.1086/675718.
29. Nicolle LE. Urinary catheter-associated infections. Infect Dis Clin N Am. 2012;26(1):13-27. https://doi.org/10.1016/j.idc.2011.09.009.
30. Titsworth WL, Hester J, Correia T, et al. Reduction of catheter-associated urinary tract infections among patients in a neurological intensive care unit: a single institution’s success. J Neurosurg. 2012;116(4):911-920. https://doi.org/10.3171/2011.11.JNS11974.
31. Lobdell KW, Stamou S, Sanchez JA. Hospital-acquired infections. Surg Clin N Am. 2012;92(1):65-77. https://doi.org/10.1016/j.suc.2011.11.003.
32. Gray M. Reducing catheter-associated urinary tract infection in the critical care unit. AACN Adv Crit Care. 2010;21(3):247-257.33. Fakih MG, Watson SR, Greene T, et al. Reducing inappropriate urinary catheter use. Arch Intern Med. 2012;172(3):255-260. https://doi.org/10.1001/archinternmed.2011.627.
34. Saint S, Wiese J, Amory JK, Bernstein ML, et al. Are physicians aware of which of their patients have an indwelling urinary catheters? Am J Med. 2000;109(6):476-480. https://doi.org/10.1016/s0002-9343(00)00531-3.
35. O’Grady NP, Barie PS, Bartlett JG, et al. Guidelines for evaluation of new fever in critically ill adult patients: 2008 update from the American College of Critical Care Medicine and the Infectious Diseases Society of America. Crit Care Med. 2008;36(4):1330-1349. https://doi.org/10.1097/CCM.0b013e318169eda9.
36. Mullin K, Kovacs C, Fatica C, et al. A multifaceted approach to reduction of catheter-associated urinary tract infections in the intensive care unit with an emphasis on “stewardship of culturing.” Infect Control Hosp Epidemiol. 2017;38(2):186-188. https://doi.org/10.1017/ice.2016.266.
37. Humphries R, Bard J. Point-counterpoint: reflex cultures reduce laboratory workload and improve antimicrobial stewardship in patients suspected of having urinary tract infections. J Clin Microbiol. 2016;54(2):254-258. https://doi.org/10.1128/JCM.03021-15.
38. Voelker R. New fluoroquinolone warning. JAMA. 2016;315(23):2514. https://doi.org/10.1001/jama.2016.7290.
39. Tillotson S. FDA and the safe and appropriate antibiotic use of fluoroquinolones. Lancet Infect Dis. 2016;16(3):PE11-E12.
40. Tanne J. FDA adds “black box” warning label to fluoroquinolone antibiotics. BMJ 2008;337:a816. https://doi.org/10.1136/bmj.a816.
41. Wyndaele JJ, Brauner A, Geerlings SE, et al. Clean intermittent catheterization and urinary tract infection: review and guide for future research. BJU Intern. 2012;110(11c):E910-E917. https://doi.org/10.1111/j.1464-410X.2012.11549.x.
42. Hakwoort RA, Thijs SD, Bouwmeester FW, et al. Comparing clean intermittent catheterization and transurethral indwelling catheterization for incomplete voiding after vaginal prolapse surgery: a multicenter randomized trial. BJOG. 2011;118(9):1055-1060. https://doi.org/10.1111/j.1471-0528.2011.02935.x.
43. Hakvoort RA, Nieuwkerk PT, Burger MP, et al. Patient preferences for clean intermittent catheterization and transurethral indwelling catheterization for treatment of abnormal post-void residual bladder volume after vaginal prolapsed surgery. BJOG. 2011;118(11):1324-1328. https://doi.org/10.1111/j.1471-0528.2011.03056.x.
44. Saint S, Kaufman SR, Roger M, et al. Condom versus indwelling urinary catheters: a randomized trial. JAGS. 2006;54(7):1055-1061. https://doi.org/10.1111/j.1532-5415.2006.00785.x.
45. Pickard R, Lam T, MacLennan G, et al. Antimicrobial catheters for reduction of symptomatic urinary tract infection in adults requiring short-term catheterization in hospital: a multicenter randomized controlled trial. Lancet. 2012;380(9857):1927-1935. https://doi.org/10.1016/S0140-6736(12)61380-4.
46. Parry M, Grant B, Sestovic M. Successful reduction in catheter-associated urinary tract infections: focus on nurse-directed catheter removal. Am J Infect Control. 2013;41(12):1178-1181. https://doi.org/10.1016/j.ajic.2013.03.296.
47. Fuchs MA, Sexton DJ, Thornlow DK, Champagne MT. Evaluation of an evidence-based, nurse-driven checklist to prevent hospital-acquired catheter-associated urinary tract infections in intensive care units. J Nurs Care Qual. 2011;26(2):101-109. https://doi.org/10.1097/NCQ.0b013e3181fb7847.
48. Meddings J, Rogers MA, Macy M, Saint S. Systematic review and meta-analysis: reminder systems to reduce catheter-associated urinary tract infections and urinary catheter use in hospitalized patients. Clin Infect Dis. 2010;51(5):550-560. https://doi.org/10.1086/655133.
49. Baggs J, Fridkin SK, Pollack LA, Srinivasan A, Jernigan JA. Estimating national trends in inpatient antibiotic use among US hospitals from 2006 to 2012. JAMA Intern Med. 2016;176(11):1639-1648. https://doi.org/10.1001/jamainternmed.2016.5651.
50. National Action Plan for Combating Antibiotic-resistant Bacteria. 2015. https://obamawhitehouse.archives.gov/sites/default/files/docs/national_action_plan_for_combatin
© 2019 Society of Hospital Medicine
Clinical Progress Note: Procalcitonin in the Management of Pediatric Lower Respiratory Tract Infection
Procalcitonin (PCT) is a biomarker that has shown promise to identify bacterial etiology in acute infections, including bacterial lower respiratory tract infection (LRTI). In 2017, the United States Food and Drug Administration (FDA) approved the use of PCT as a diagnostic aid to guide the decisions around antibiotic therapy in acute LRTI.1 Although most of the data supporting the use of PCT for LRTI stems from adult studies, the high disease burden, predominance of viral etiologies, and frequent diagnostic uncertainty resulting in antibiotic overuse make pediatric LRTI an ideal target for the use of PCT as a diagnostic aid. This review evaluates and summarizes the current evidence regarding the role of PCT in the clinical care of pediatric LRTI, including its use in guiding antibiotic use and prognosticating disease severity.
THE ROLE OF PROCALCITONIN IN GUIDING INITIATION OF ANTIBIOTICS
The commonly used PCT cut points for withholding or stopping antibiotics in adults and children are 0.1 µg/L (very low risk of bacterial etiology) or 0.25 µg/L (low risk of bacterial etiology).2-4 Among the 532 children enrolled in the multicenter study of Etiology of Pneumonia in the Community (EPIC), a PCT threshold of 0.25 µg/L demonstrated an approximate sensitivity of 85%, specificity of 45%, positive likelihood ratio of 1.55, and negative likelihood ratio of 0.33 for community acquired pneumonia (CAP) caused by typical bacterial pathogens.5 Lowering the cutoff to <0.1 µg/L increased PCT sensitivity to 100%, decreased specificity, positive likelihood ratio, and negative likelihood ratio to 20%, 1.26, and 0, respectively. Although the EPIC study obtained culture and performed PCR testing on any blood sample, pleural fluid specimen, endotracheal aspirate, or bronchoalveolar–lavage specimens obtained during the study period, currently available laboratory methods show poor sensitivity for defining bacterial LRTI. Thus, bacterial etiologies may have been underestimated. The highly negative predictive value demonstrated in this study highlights the potential of PCT as a biomarker for ruling out bacterial diseases, including LRTI.
Multiple studies have evaluated the potential utility of PCT in guiding antibiotic initiation in adults with LRTI, but data on pediatric patients are sparse.4 In a randomized, single-center Italian study comparing a PCT-guided algorithm (withholding antibiotics when PCT < 0.25 µg/L) versus usual care among 319 hospitalized children with pneumonia, the PCT group experienced fewer antibiotic initiations (15.5% vs 100%, P < .05) without significant differences in recurrence of respiratory symptoms or new antibiotic prescriptions in the month following enrollment.2
A similar randomized trial using a PCT-guided algorithm for the initiation of antibiotics conducted among 337 Swiss children presented to the emergency department (ED) with pneumonia and other LRTIs failed to demonstrate decreases in antibiotic initiation.3 This study used an algorithm that categorized the likelihood of requiring antibiotic treatment for bacterial LRTI as “definitely” if PCT was >0.5 µg/L, “probably” if PCT was 0.26–0.5 µg/L, “probably not” if PCT was 0.1–0.25 µg/L, and “definitely not” if PCT was <0.1 µg/L. In the PCT group, 104 out of 168 (62%) patients received antibiotics within 14 days compared with 93 out of 165 (56%) patients in the control group (odds ratio [OR]: 1.26, 95% CI: 0.81, 1.95). In the subgroup analyses, the odds of administering antibiotics to those with nonpneumonia LRTI was significantly higher than those of the PCT group and control group (OR: 4.09, 95% CI: 1.8, 9.93); the odds of receiving antibiotics also showed no difference in the subgroup of children with pneumonia (OR: 0.66, 95% CI: 0.35, 1.23).
The benefit of PCT for informing decisions around the initiation of antibiotics likely varies based on perceived risk of bacterial diseases. When the pretest probability of bacterial disease is extremely high, the use of PCT is unlikely to alter treatment decisions. Similarly, PCT should not be used in situations where the pretest probability for bacterial pneumonia is very low—in these instances, an elevated PCT may lead to unnecessary antibiotic use among children presenting to the ED. However, the risk of bacterial pneumonia is often equivocal, and in these situations, PCT may provide clinicians with useful insights, primarily for ruling out bacterial disease.
THE ROLE OF PROCALCITONIN IN GUIDING DISCONTINUATION OF ANTIBIOTICS
In the study by Esposito et al., the PCT levels were additionally measured every two days until discharge and during two scheduled follow-up visits; the antibiotics were discontinued when PCT < 0.25 µg/L.2 The PCT-guided group experienced shorter antibiotic duration (mean 5.4 vs 11.0 days, P < .05), shorter length of hospital stay (mean 4.7 vs 5.61 days for mild LRTI and 5.01 vs 5.93 for severe LRTI), and fewer antibiotic-related adverse events (3.9% vs 25.2%, P < .05). Similarly, in the study by Baer et al., the PCT-guided group had PCT levels repeated on days three and five after enrollment, and the antibiotics were discontinued when PCT was less than 0.25 µg/L. The duration of antibiotic administration was significantly lower in the PCT-guided group (mean difference: 1.8 days, 95% CI: −3.1, −0.).3 The rates of hospitalization, duration of hospital stay, and mean impairment of daily activities attributable to LRTI were similar between groups.
Considering the adult studies and the small number of pediatric LRTI research published to date, the use of PCT to safely reduce antibiotic treatment duration is encouraging.4 Although the studies on the kinetics of PCT are limited, the biomarker has been shown to rise two to four hours after a bacterial stimulus, peak in 24-48 hours and achieve a half-life of 24-36 hours.6,7 As such, serial PCT measurements at 24-hour intervals for three to five days may be more beneficial than stand-alone PCT tests. Nonetheless, additional studies are needed to better define groups of patients who will most likely benefit from PCT testing and to understand how to best integrate testing into clinical practice.
PROCALCITONIN FOR SEVERITY PREDICTION OF LRTI
PCT has also been explored as a marker of LRTI disease severity. In a 2008 multicenter cohort encompassing 1,651 adults with pneumonia, PCT < 0.1 µg/L was associated with a decreased 30-day mortality, shorter length of stay, and decreased admission to the intensive care unit (ICU) compared with those with PCT>0.1 µg/L.8 In a 2017 study of 317 adults hospitalized with pneumonia, the PCT level was significantly higher in those with bacteremia and in those admitted to intensive care.9 When used in combination with the pneumonia severity index (PSI), the addition of PCT resulted in improved prognostic performance compared with the PSI alone for both outcomes, increasing the area under the receiver operating characteristic curve from 0.67 to 0.85 for bacteremia and from 0.58 to 0.64 for intensive care. Similarly, in the adult EPIC cohort, the addition of PCT contributed significant prognostic information beyond existing severity scores for predicting the need for invasive respiratory or vasopressor support; each 1 µg/L increase in PCT was associated with a 1% to 2% absolute increase in the need for this outcome.10
A European study of 100 children with pneumonia also demonstrated higher PCT values among hospitalized children (n = 26, median PCT 17.8 µg/L) compared with outpatient children (n = 73, median PCT 0.72 µg/L, P < .01).11 Among the 532 children from the EPIC study, a PCT < 0.25 µg/L was associated with the reduced odds of ICU admission (adjusted OR: 0.48; 95% CI: 0.30, 0.78) and a 2.3-day (95% CI: 1.4, 3.2) decrease in the average length of stay compared with those with higher PCT concentrations.5 Of the 34 children with empyema requiring drainage, 28 (82%) showed a PCT concentration ≥0.5 µg/L. Additional pediatric studies are needed, but the limited data to date suggest that PCT may play a role in predicting pediatric LRTI disease severity, including the need for mechanical ventilatory support and ICU-level care.
LIMITATIONS TO CLINICAL APPLICATION
Although PCT shows promise as a biomarker to reliably rule out bacterial infection, several potential limitations exist in assessing its role in pediatric LRTI. Atypical bacterial infections (ie, Mycoplasma pneumoniae) and localized bacterial infection may not induce significant PCT production, as has been shown in adults and children with tonsillitis, localized skin infections, endocarditis, or empyema (Table).12 The majority of clinical trials in LRTI have been conducted in the adult population,4 with the number of pediatric trials remaining small.2,3 Given the predominance of viral LRTI in children compared with adults, the utility of PCT may differ in these populations.13,14 Furthermore, existing studies demonstrate mixed results regarding the magnitude of benefits that PCT may provide in terms of limiting antibiotic use. Another concern is the potential of PCT to increase unnecessary antibiotic use in those with viral LRTI,3 as PCT may also be increased in populations with systemic inflammation from nonbacterial causes.12,15
CONCLUSIONS AND CLINICAL APPLICATION
The misuse of antibiotics is a public health crisis resulting in the emergence of antibiotic-resistant pathogens and adverse outcomes, including Clostridioides difficile infection, drug toxicities, and increased healthcare costs.16 Pneumonia is responsible for more days of antibiotics than any other disease in children’s hospitals and is an important target for stewardship efforts.17 PCT is a promising biomarker for distinguishing bacterial from viral infection, and its use may help in making informed antibiotic decisions and predicting disease outcomes in pediatric LRTI. Although PCT has been cleared by the FDA for assisting with antibiotic decisions in pediatric LRTI, the majority of evidence supporting this indication is drawn from adults. Additional studies are needed prior to the widespread implementation in the pediatric population, but the results of available pediatric studies show promise. The clinical context and severity of patient presentation are important when considering whether or not to use PCT and how to best interpret PCT levels when making clinical management decisions. The utility of PCT for antibiotic initiation in the pediatric population is encouraging given the predominance of viral etiologies in pediatric LRTI. Currently available data demonstrate the value of serial PCT measurements in antibiotic de-escalation and promoting antibiotic stewardship for children and adults.2-4 As with all new diagnostic modalities, provider education is paramount to ensure a safe and value-driven implementation.
Disclosures
Dr. Katz received investigator-initiated grant funding from Roche and bioMérieux to conduct research involving procalcitonin in the past three years. Dr. Sartori has nothing to disclose. Dr. Williams received investigator-initiated grant funding from bioMérieux to conduct research involving procalcitonin in the past three years.
Funding
This work was supported by the National Institute of Health (1T32AI095202-07).
Disclaimer
This content is solely the responsibility of the authors and does not necessarily represent the official views of the National Institutes of Health, Roche, or bioMérieux.
1. FDA clears test to help manage antibiotic treatment for lower respiratory tract infections and sepsis. US Food and Drug Administration. [Press Release]. Silver Spring, MD, February 23 2017.
2. Esposito S, Tagliabue C, Picciolli I, et al. Procalcitonin measurements for guiding antibiotic treatment in pediatric pneumonia. Respir Med. 2011;105(12):1939-1945. https://doi.org/10.1016/j.rmed.2011.09.003.
3. Baer G, Baumann P, Buettcher M, et al. Procalcitonin guidance to reduce antibiotic treatment of lower respiratory tract infection in children and adolescents (ProPAED): a randomized controlled trial. PLoS One. 2013;8(8):e68419. https://doi.org/10.1371/journal.pone.0068419.
4. Choi JJ MM, Simon MS, Evans AT, Self WH, Glesby MJ. Procalcitonin in the diagnosis and management of community-acquired pneumonia in hospitalized adults. J Hosp Med. 2019;18(X);XXX-XXX. https://doi.org/10.12788/jhm.3272.
5. Stockmann C, Ampofo K, Killpack J, et al. Procalcitonin accurately identifies hospitalized children with low risk of bacterial community-acquired pneumonia. J Pediatric Infect Dis Soc. 2017;7(1): 46-53. https://doi.org/10.1093/jpids/piw091.
6. Dandona P, Nix D, Wilson MF, et al. Procalcitonin increase after endotoxin injection in normal subjects. J Clin Endocrinol Metab. 1994;79(6):1605-1608. https://doi.org/10.1210/jcem.79.6.7989463.
7. Brunkhorst FM, Heinz U, Forycki ZF. Kinetics of procalcitonin in iatrogenic sepsis. Intensive Care Med. 1998;24(8):888-889.
8. Huang DT, Weissfeld LA, Kellum JA, et al; GenIMS Investigators. Risk prediction with procalcitonin and clinical rules in community-acquired pneumonia. Ann Emerg Med. 2008;52(1):48-58 e42. https://doi.org/10.1016/j.annemergmed.2008.01.003.
9. McCluskey SM, Schuetz P, Abers MS, et al. Serial procalcitonin as a predictor of pacteremia and peed for intensive care unit care in adults with pneumonia, including those with highest severity: A Prospective Cohort Study. Open Forum Infect Dis. 2017;4(1):ofw238. https://doi.org/10.1093/ofid/ofw238.
10. Self WH, Grijalva CG, Williams DJ, et al. Procalcitonin as an early marker of the need for invasive respiratory or vasopressor support in adults with community-acquired pneumonia. Chest. 2016;150(4):819-828. https://doi.org/10.1016/j.chest.2016.04.010.
11. Don M, Valent F, Korppi M, et al. Efficacy of serum procalcitonin in evaluating severity of community-acquired pneumonia in childhood. Scand J Infect Dis. 2007;39(2):129-137. https://doi.org/10.1080/00365540600951283.
12. Meisner M. Update on procalcitonin measurements. Ann Lab Med. 2014;34(4):263-273. https://doi.org/10.3343/alm.2014.34.4.263.
13. Jain S, Williams DJ, Arnold SR, et al; CDC EPIC Study Team. Community-acquired pneumonia requiring hospitalization among U.S. children. N Engl J Med. 2015;372(9):835-845. https://doi.org/10.1056/NEJMoa1405870.
14. Jain S, Self WH, Wunderink RG, et al; CDC EPIC Study Team. Community-Acquired Pneumonia Requiring Hospitalization among U.S. adults. N Engl J Med. 2015;373(5):415-427. https://doi.org/10.1056/NEJMoa1500245.
15. Aloisio E, Dolci A, Panteghini M. Procalcitonin: Between evidence and critical issues. Clin Chim Acta. 2019;496:7-12. https://doi.org/10.1016/j.cca.2019.06.010.
16. Society for Healthcare Epidemiology of A, Infectious Diseases Society of A, Pediatric Infectious Diseases S. Policy statement on antimicrobial stewardship by the Society for Healthcare Epidemiology of America (SHEA), the Infectious Diseases Society of America (IDSA), and the Pediatric Infectious Diseases Society (PIDS). Infect Control Hosp Epidemiol. 2012;33(4):322-327. https://doi.org/10.1086/665010.
17. Gerber JS, Kronman MP, Ross RK, et al. Identifying targets for antimicrobial stewardship in children’s hospitals. Infect Control Hosp Epidemiol. 2013;34(12):1252-1258. https://doi.org/10.1086/673982.
Procalcitonin (PCT) is a biomarker that has shown promise to identify bacterial etiology in acute infections, including bacterial lower respiratory tract infection (LRTI). In 2017, the United States Food and Drug Administration (FDA) approved the use of PCT as a diagnostic aid to guide the decisions around antibiotic therapy in acute LRTI.1 Although most of the data supporting the use of PCT for LRTI stems from adult studies, the high disease burden, predominance of viral etiologies, and frequent diagnostic uncertainty resulting in antibiotic overuse make pediatric LRTI an ideal target for the use of PCT as a diagnostic aid. This review evaluates and summarizes the current evidence regarding the role of PCT in the clinical care of pediatric LRTI, including its use in guiding antibiotic use and prognosticating disease severity.
THE ROLE OF PROCALCITONIN IN GUIDING INITIATION OF ANTIBIOTICS
The commonly used PCT cut points for withholding or stopping antibiotics in adults and children are 0.1 µg/L (very low risk of bacterial etiology) or 0.25 µg/L (low risk of bacterial etiology).2-4 Among the 532 children enrolled in the multicenter study of Etiology of Pneumonia in the Community (EPIC), a PCT threshold of 0.25 µg/L demonstrated an approximate sensitivity of 85%, specificity of 45%, positive likelihood ratio of 1.55, and negative likelihood ratio of 0.33 for community acquired pneumonia (CAP) caused by typical bacterial pathogens.5 Lowering the cutoff to <0.1 µg/L increased PCT sensitivity to 100%, decreased specificity, positive likelihood ratio, and negative likelihood ratio to 20%, 1.26, and 0, respectively. Although the EPIC study obtained culture and performed PCR testing on any blood sample, pleural fluid specimen, endotracheal aspirate, or bronchoalveolar–lavage specimens obtained during the study period, currently available laboratory methods show poor sensitivity for defining bacterial LRTI. Thus, bacterial etiologies may have been underestimated. The highly negative predictive value demonstrated in this study highlights the potential of PCT as a biomarker for ruling out bacterial diseases, including LRTI.
Multiple studies have evaluated the potential utility of PCT in guiding antibiotic initiation in adults with LRTI, but data on pediatric patients are sparse.4 In a randomized, single-center Italian study comparing a PCT-guided algorithm (withholding antibiotics when PCT < 0.25 µg/L) versus usual care among 319 hospitalized children with pneumonia, the PCT group experienced fewer antibiotic initiations (15.5% vs 100%, P < .05) without significant differences in recurrence of respiratory symptoms or new antibiotic prescriptions in the month following enrollment.2
A similar randomized trial using a PCT-guided algorithm for the initiation of antibiotics conducted among 337 Swiss children presented to the emergency department (ED) with pneumonia and other LRTIs failed to demonstrate decreases in antibiotic initiation.3 This study used an algorithm that categorized the likelihood of requiring antibiotic treatment for bacterial LRTI as “definitely” if PCT was >0.5 µg/L, “probably” if PCT was 0.26–0.5 µg/L, “probably not” if PCT was 0.1–0.25 µg/L, and “definitely not” if PCT was <0.1 µg/L. In the PCT group, 104 out of 168 (62%) patients received antibiotics within 14 days compared with 93 out of 165 (56%) patients in the control group (odds ratio [OR]: 1.26, 95% CI: 0.81, 1.95). In the subgroup analyses, the odds of administering antibiotics to those with nonpneumonia LRTI was significantly higher than those of the PCT group and control group (OR: 4.09, 95% CI: 1.8, 9.93); the odds of receiving antibiotics also showed no difference in the subgroup of children with pneumonia (OR: 0.66, 95% CI: 0.35, 1.23).
The benefit of PCT for informing decisions around the initiation of antibiotics likely varies based on perceived risk of bacterial diseases. When the pretest probability of bacterial disease is extremely high, the use of PCT is unlikely to alter treatment decisions. Similarly, PCT should not be used in situations where the pretest probability for bacterial pneumonia is very low—in these instances, an elevated PCT may lead to unnecessary antibiotic use among children presenting to the ED. However, the risk of bacterial pneumonia is often equivocal, and in these situations, PCT may provide clinicians with useful insights, primarily for ruling out bacterial disease.
THE ROLE OF PROCALCITONIN IN GUIDING DISCONTINUATION OF ANTIBIOTICS
In the study by Esposito et al., the PCT levels were additionally measured every two days until discharge and during two scheduled follow-up visits; the antibiotics were discontinued when PCT < 0.25 µg/L.2 The PCT-guided group experienced shorter antibiotic duration (mean 5.4 vs 11.0 days, P < .05), shorter length of hospital stay (mean 4.7 vs 5.61 days for mild LRTI and 5.01 vs 5.93 for severe LRTI), and fewer antibiotic-related adverse events (3.9% vs 25.2%, P < .05). Similarly, in the study by Baer et al., the PCT-guided group had PCT levels repeated on days three and five after enrollment, and the antibiotics were discontinued when PCT was less than 0.25 µg/L. The duration of antibiotic administration was significantly lower in the PCT-guided group (mean difference: 1.8 days, 95% CI: −3.1, −0.).3 The rates of hospitalization, duration of hospital stay, and mean impairment of daily activities attributable to LRTI were similar between groups.
Considering the adult studies and the small number of pediatric LRTI research published to date, the use of PCT to safely reduce antibiotic treatment duration is encouraging.4 Although the studies on the kinetics of PCT are limited, the biomarker has been shown to rise two to four hours after a bacterial stimulus, peak in 24-48 hours and achieve a half-life of 24-36 hours.6,7 As such, serial PCT measurements at 24-hour intervals for three to five days may be more beneficial than stand-alone PCT tests. Nonetheless, additional studies are needed to better define groups of patients who will most likely benefit from PCT testing and to understand how to best integrate testing into clinical practice.
PROCALCITONIN FOR SEVERITY PREDICTION OF LRTI
PCT has also been explored as a marker of LRTI disease severity. In a 2008 multicenter cohort encompassing 1,651 adults with pneumonia, PCT < 0.1 µg/L was associated with a decreased 30-day mortality, shorter length of stay, and decreased admission to the intensive care unit (ICU) compared with those with PCT>0.1 µg/L.8 In a 2017 study of 317 adults hospitalized with pneumonia, the PCT level was significantly higher in those with bacteremia and in those admitted to intensive care.9 When used in combination with the pneumonia severity index (PSI), the addition of PCT resulted in improved prognostic performance compared with the PSI alone for both outcomes, increasing the area under the receiver operating characteristic curve from 0.67 to 0.85 for bacteremia and from 0.58 to 0.64 for intensive care. Similarly, in the adult EPIC cohort, the addition of PCT contributed significant prognostic information beyond existing severity scores for predicting the need for invasive respiratory or vasopressor support; each 1 µg/L increase in PCT was associated with a 1% to 2% absolute increase in the need for this outcome.10
A European study of 100 children with pneumonia also demonstrated higher PCT values among hospitalized children (n = 26, median PCT 17.8 µg/L) compared with outpatient children (n = 73, median PCT 0.72 µg/L, P < .01).11 Among the 532 children from the EPIC study, a PCT < 0.25 µg/L was associated with the reduced odds of ICU admission (adjusted OR: 0.48; 95% CI: 0.30, 0.78) and a 2.3-day (95% CI: 1.4, 3.2) decrease in the average length of stay compared with those with higher PCT concentrations.5 Of the 34 children with empyema requiring drainage, 28 (82%) showed a PCT concentration ≥0.5 µg/L. Additional pediatric studies are needed, but the limited data to date suggest that PCT may play a role in predicting pediatric LRTI disease severity, including the need for mechanical ventilatory support and ICU-level care.
LIMITATIONS TO CLINICAL APPLICATION
Although PCT shows promise as a biomarker to reliably rule out bacterial infection, several potential limitations exist in assessing its role in pediatric LRTI. Atypical bacterial infections (ie, Mycoplasma pneumoniae) and localized bacterial infection may not induce significant PCT production, as has been shown in adults and children with tonsillitis, localized skin infections, endocarditis, or empyema (Table).12 The majority of clinical trials in LRTI have been conducted in the adult population,4 with the number of pediatric trials remaining small.2,3 Given the predominance of viral LRTI in children compared with adults, the utility of PCT may differ in these populations.13,14 Furthermore, existing studies demonstrate mixed results regarding the magnitude of benefits that PCT may provide in terms of limiting antibiotic use. Another concern is the potential of PCT to increase unnecessary antibiotic use in those with viral LRTI,3 as PCT may also be increased in populations with systemic inflammation from nonbacterial causes.12,15
CONCLUSIONS AND CLINICAL APPLICATION
The misuse of antibiotics is a public health crisis resulting in the emergence of antibiotic-resistant pathogens and adverse outcomes, including Clostridioides difficile infection, drug toxicities, and increased healthcare costs.16 Pneumonia is responsible for more days of antibiotics than any other disease in children’s hospitals and is an important target for stewardship efforts.17 PCT is a promising biomarker for distinguishing bacterial from viral infection, and its use may help in making informed antibiotic decisions and predicting disease outcomes in pediatric LRTI. Although PCT has been cleared by the FDA for assisting with antibiotic decisions in pediatric LRTI, the majority of evidence supporting this indication is drawn from adults. Additional studies are needed prior to the widespread implementation in the pediatric population, but the results of available pediatric studies show promise. The clinical context and severity of patient presentation are important when considering whether or not to use PCT and how to best interpret PCT levels when making clinical management decisions. The utility of PCT for antibiotic initiation in the pediatric population is encouraging given the predominance of viral etiologies in pediatric LRTI. Currently available data demonstrate the value of serial PCT measurements in antibiotic de-escalation and promoting antibiotic stewardship for children and adults.2-4 As with all new diagnostic modalities, provider education is paramount to ensure a safe and value-driven implementation.
Disclosures
Dr. Katz received investigator-initiated grant funding from Roche and bioMérieux to conduct research involving procalcitonin in the past three years. Dr. Sartori has nothing to disclose. Dr. Williams received investigator-initiated grant funding from bioMérieux to conduct research involving procalcitonin in the past three years.
Funding
This work was supported by the National Institute of Health (1T32AI095202-07).
Disclaimer
This content is solely the responsibility of the authors and does not necessarily represent the official views of the National Institutes of Health, Roche, or bioMérieux.
Procalcitonin (PCT) is a biomarker that has shown promise to identify bacterial etiology in acute infections, including bacterial lower respiratory tract infection (LRTI). In 2017, the United States Food and Drug Administration (FDA) approved the use of PCT as a diagnostic aid to guide the decisions around antibiotic therapy in acute LRTI.1 Although most of the data supporting the use of PCT for LRTI stems from adult studies, the high disease burden, predominance of viral etiologies, and frequent diagnostic uncertainty resulting in antibiotic overuse make pediatric LRTI an ideal target for the use of PCT as a diagnostic aid. This review evaluates and summarizes the current evidence regarding the role of PCT in the clinical care of pediatric LRTI, including its use in guiding antibiotic use and prognosticating disease severity.
THE ROLE OF PROCALCITONIN IN GUIDING INITIATION OF ANTIBIOTICS
The commonly used PCT cut points for withholding or stopping antibiotics in adults and children are 0.1 µg/L (very low risk of bacterial etiology) or 0.25 µg/L (low risk of bacterial etiology).2-4 Among the 532 children enrolled in the multicenter study of Etiology of Pneumonia in the Community (EPIC), a PCT threshold of 0.25 µg/L demonstrated an approximate sensitivity of 85%, specificity of 45%, positive likelihood ratio of 1.55, and negative likelihood ratio of 0.33 for community acquired pneumonia (CAP) caused by typical bacterial pathogens.5 Lowering the cutoff to <0.1 µg/L increased PCT sensitivity to 100%, decreased specificity, positive likelihood ratio, and negative likelihood ratio to 20%, 1.26, and 0, respectively. Although the EPIC study obtained culture and performed PCR testing on any blood sample, pleural fluid specimen, endotracheal aspirate, or bronchoalveolar–lavage specimens obtained during the study period, currently available laboratory methods show poor sensitivity for defining bacterial LRTI. Thus, bacterial etiologies may have been underestimated. The highly negative predictive value demonstrated in this study highlights the potential of PCT as a biomarker for ruling out bacterial diseases, including LRTI.
Multiple studies have evaluated the potential utility of PCT in guiding antibiotic initiation in adults with LRTI, but data on pediatric patients are sparse.4 In a randomized, single-center Italian study comparing a PCT-guided algorithm (withholding antibiotics when PCT < 0.25 µg/L) versus usual care among 319 hospitalized children with pneumonia, the PCT group experienced fewer antibiotic initiations (15.5% vs 100%, P < .05) without significant differences in recurrence of respiratory symptoms or new antibiotic prescriptions in the month following enrollment.2
A similar randomized trial using a PCT-guided algorithm for the initiation of antibiotics conducted among 337 Swiss children presented to the emergency department (ED) with pneumonia and other LRTIs failed to demonstrate decreases in antibiotic initiation.3 This study used an algorithm that categorized the likelihood of requiring antibiotic treatment for bacterial LRTI as “definitely” if PCT was >0.5 µg/L, “probably” if PCT was 0.26–0.5 µg/L, “probably not” if PCT was 0.1–0.25 µg/L, and “definitely not” if PCT was <0.1 µg/L. In the PCT group, 104 out of 168 (62%) patients received antibiotics within 14 days compared with 93 out of 165 (56%) patients in the control group (odds ratio [OR]: 1.26, 95% CI: 0.81, 1.95). In the subgroup analyses, the odds of administering antibiotics to those with nonpneumonia LRTI was significantly higher than those of the PCT group and control group (OR: 4.09, 95% CI: 1.8, 9.93); the odds of receiving antibiotics also showed no difference in the subgroup of children with pneumonia (OR: 0.66, 95% CI: 0.35, 1.23).
The benefit of PCT for informing decisions around the initiation of antibiotics likely varies based on perceived risk of bacterial diseases. When the pretest probability of bacterial disease is extremely high, the use of PCT is unlikely to alter treatment decisions. Similarly, PCT should not be used in situations where the pretest probability for bacterial pneumonia is very low—in these instances, an elevated PCT may lead to unnecessary antibiotic use among children presenting to the ED. However, the risk of bacterial pneumonia is often equivocal, and in these situations, PCT may provide clinicians with useful insights, primarily for ruling out bacterial disease.
THE ROLE OF PROCALCITONIN IN GUIDING DISCONTINUATION OF ANTIBIOTICS
In the study by Esposito et al., the PCT levels were additionally measured every two days until discharge and during two scheduled follow-up visits; the antibiotics were discontinued when PCT < 0.25 µg/L.2 The PCT-guided group experienced shorter antibiotic duration (mean 5.4 vs 11.0 days, P < .05), shorter length of hospital stay (mean 4.7 vs 5.61 days for mild LRTI and 5.01 vs 5.93 for severe LRTI), and fewer antibiotic-related adverse events (3.9% vs 25.2%, P < .05). Similarly, in the study by Baer et al., the PCT-guided group had PCT levels repeated on days three and five after enrollment, and the antibiotics were discontinued when PCT was less than 0.25 µg/L. The duration of antibiotic administration was significantly lower in the PCT-guided group (mean difference: 1.8 days, 95% CI: −3.1, −0.).3 The rates of hospitalization, duration of hospital stay, and mean impairment of daily activities attributable to LRTI were similar between groups.
Considering the adult studies and the small number of pediatric LRTI research published to date, the use of PCT to safely reduce antibiotic treatment duration is encouraging.4 Although the studies on the kinetics of PCT are limited, the biomarker has been shown to rise two to four hours after a bacterial stimulus, peak in 24-48 hours and achieve a half-life of 24-36 hours.6,7 As such, serial PCT measurements at 24-hour intervals for three to five days may be more beneficial than stand-alone PCT tests. Nonetheless, additional studies are needed to better define groups of patients who will most likely benefit from PCT testing and to understand how to best integrate testing into clinical practice.
PROCALCITONIN FOR SEVERITY PREDICTION OF LRTI
PCT has also been explored as a marker of LRTI disease severity. In a 2008 multicenter cohort encompassing 1,651 adults with pneumonia, PCT < 0.1 µg/L was associated with a decreased 30-day mortality, shorter length of stay, and decreased admission to the intensive care unit (ICU) compared with those with PCT>0.1 µg/L.8 In a 2017 study of 317 adults hospitalized with pneumonia, the PCT level was significantly higher in those with bacteremia and in those admitted to intensive care.9 When used in combination with the pneumonia severity index (PSI), the addition of PCT resulted in improved prognostic performance compared with the PSI alone for both outcomes, increasing the area under the receiver operating characteristic curve from 0.67 to 0.85 for bacteremia and from 0.58 to 0.64 for intensive care. Similarly, in the adult EPIC cohort, the addition of PCT contributed significant prognostic information beyond existing severity scores for predicting the need for invasive respiratory or vasopressor support; each 1 µg/L increase in PCT was associated with a 1% to 2% absolute increase in the need for this outcome.10
A European study of 100 children with pneumonia also demonstrated higher PCT values among hospitalized children (n = 26, median PCT 17.8 µg/L) compared with outpatient children (n = 73, median PCT 0.72 µg/L, P < .01).11 Among the 532 children from the EPIC study, a PCT < 0.25 µg/L was associated with the reduced odds of ICU admission (adjusted OR: 0.48; 95% CI: 0.30, 0.78) and a 2.3-day (95% CI: 1.4, 3.2) decrease in the average length of stay compared with those with higher PCT concentrations.5 Of the 34 children with empyema requiring drainage, 28 (82%) showed a PCT concentration ≥0.5 µg/L. Additional pediatric studies are needed, but the limited data to date suggest that PCT may play a role in predicting pediatric LRTI disease severity, including the need for mechanical ventilatory support and ICU-level care.
LIMITATIONS TO CLINICAL APPLICATION
Although PCT shows promise as a biomarker to reliably rule out bacterial infection, several potential limitations exist in assessing its role in pediatric LRTI. Atypical bacterial infections (ie, Mycoplasma pneumoniae) and localized bacterial infection may not induce significant PCT production, as has been shown in adults and children with tonsillitis, localized skin infections, endocarditis, or empyema (Table).12 The majority of clinical trials in LRTI have been conducted in the adult population,4 with the number of pediatric trials remaining small.2,3 Given the predominance of viral LRTI in children compared with adults, the utility of PCT may differ in these populations.13,14 Furthermore, existing studies demonstrate mixed results regarding the magnitude of benefits that PCT may provide in terms of limiting antibiotic use. Another concern is the potential of PCT to increase unnecessary antibiotic use in those with viral LRTI,3 as PCT may also be increased in populations with systemic inflammation from nonbacterial causes.12,15
CONCLUSIONS AND CLINICAL APPLICATION
The misuse of antibiotics is a public health crisis resulting in the emergence of antibiotic-resistant pathogens and adverse outcomes, including Clostridioides difficile infection, drug toxicities, and increased healthcare costs.16 Pneumonia is responsible for more days of antibiotics than any other disease in children’s hospitals and is an important target for stewardship efforts.17 PCT is a promising biomarker for distinguishing bacterial from viral infection, and its use may help in making informed antibiotic decisions and predicting disease outcomes in pediatric LRTI. Although PCT has been cleared by the FDA for assisting with antibiotic decisions in pediatric LRTI, the majority of evidence supporting this indication is drawn from adults. Additional studies are needed prior to the widespread implementation in the pediatric population, but the results of available pediatric studies show promise. The clinical context and severity of patient presentation are important when considering whether or not to use PCT and how to best interpret PCT levels when making clinical management decisions. The utility of PCT for antibiotic initiation in the pediatric population is encouraging given the predominance of viral etiologies in pediatric LRTI. Currently available data demonstrate the value of serial PCT measurements in antibiotic de-escalation and promoting antibiotic stewardship for children and adults.2-4 As with all new diagnostic modalities, provider education is paramount to ensure a safe and value-driven implementation.
Disclosures
Dr. Katz received investigator-initiated grant funding from Roche and bioMérieux to conduct research involving procalcitonin in the past three years. Dr. Sartori has nothing to disclose. Dr. Williams received investigator-initiated grant funding from bioMérieux to conduct research involving procalcitonin in the past three years.
Funding
This work was supported by the National Institute of Health (1T32AI095202-07).
Disclaimer
This content is solely the responsibility of the authors and does not necessarily represent the official views of the National Institutes of Health, Roche, or bioMérieux.
1. FDA clears test to help manage antibiotic treatment for lower respiratory tract infections and sepsis. US Food and Drug Administration. [Press Release]. Silver Spring, MD, February 23 2017.
2. Esposito S, Tagliabue C, Picciolli I, et al. Procalcitonin measurements for guiding antibiotic treatment in pediatric pneumonia. Respir Med. 2011;105(12):1939-1945. https://doi.org/10.1016/j.rmed.2011.09.003.
3. Baer G, Baumann P, Buettcher M, et al. Procalcitonin guidance to reduce antibiotic treatment of lower respiratory tract infection in children and adolescents (ProPAED): a randomized controlled trial. PLoS One. 2013;8(8):e68419. https://doi.org/10.1371/journal.pone.0068419.
4. Choi JJ MM, Simon MS, Evans AT, Self WH, Glesby MJ. Procalcitonin in the diagnosis and management of community-acquired pneumonia in hospitalized adults. J Hosp Med. 2019;18(X);XXX-XXX. https://doi.org/10.12788/jhm.3272.
5. Stockmann C, Ampofo K, Killpack J, et al. Procalcitonin accurately identifies hospitalized children with low risk of bacterial community-acquired pneumonia. J Pediatric Infect Dis Soc. 2017;7(1): 46-53. https://doi.org/10.1093/jpids/piw091.
6. Dandona P, Nix D, Wilson MF, et al. Procalcitonin increase after endotoxin injection in normal subjects. J Clin Endocrinol Metab. 1994;79(6):1605-1608. https://doi.org/10.1210/jcem.79.6.7989463.
7. Brunkhorst FM, Heinz U, Forycki ZF. Kinetics of procalcitonin in iatrogenic sepsis. Intensive Care Med. 1998;24(8):888-889.
8. Huang DT, Weissfeld LA, Kellum JA, et al; GenIMS Investigators. Risk prediction with procalcitonin and clinical rules in community-acquired pneumonia. Ann Emerg Med. 2008;52(1):48-58 e42. https://doi.org/10.1016/j.annemergmed.2008.01.003.
9. McCluskey SM, Schuetz P, Abers MS, et al. Serial procalcitonin as a predictor of pacteremia and peed for intensive care unit care in adults with pneumonia, including those with highest severity: A Prospective Cohort Study. Open Forum Infect Dis. 2017;4(1):ofw238. https://doi.org/10.1093/ofid/ofw238.
10. Self WH, Grijalva CG, Williams DJ, et al. Procalcitonin as an early marker of the need for invasive respiratory or vasopressor support in adults with community-acquired pneumonia. Chest. 2016;150(4):819-828. https://doi.org/10.1016/j.chest.2016.04.010.
11. Don M, Valent F, Korppi M, et al. Efficacy of serum procalcitonin in evaluating severity of community-acquired pneumonia in childhood. Scand J Infect Dis. 2007;39(2):129-137. https://doi.org/10.1080/00365540600951283.
12. Meisner M. Update on procalcitonin measurements. Ann Lab Med. 2014;34(4):263-273. https://doi.org/10.3343/alm.2014.34.4.263.
13. Jain S, Williams DJ, Arnold SR, et al; CDC EPIC Study Team. Community-acquired pneumonia requiring hospitalization among U.S. children. N Engl J Med. 2015;372(9):835-845. https://doi.org/10.1056/NEJMoa1405870.
14. Jain S, Self WH, Wunderink RG, et al; CDC EPIC Study Team. Community-Acquired Pneumonia Requiring Hospitalization among U.S. adults. N Engl J Med. 2015;373(5):415-427. https://doi.org/10.1056/NEJMoa1500245.
15. Aloisio E, Dolci A, Panteghini M. Procalcitonin: Between evidence and critical issues. Clin Chim Acta. 2019;496:7-12. https://doi.org/10.1016/j.cca.2019.06.010.
16. Society for Healthcare Epidemiology of A, Infectious Diseases Society of A, Pediatric Infectious Diseases S. Policy statement on antimicrobial stewardship by the Society for Healthcare Epidemiology of America (SHEA), the Infectious Diseases Society of America (IDSA), and the Pediatric Infectious Diseases Society (PIDS). Infect Control Hosp Epidemiol. 2012;33(4):322-327. https://doi.org/10.1086/665010.
17. Gerber JS, Kronman MP, Ross RK, et al. Identifying targets for antimicrobial stewardship in children’s hospitals. Infect Control Hosp Epidemiol. 2013;34(12):1252-1258. https://doi.org/10.1086/673982.
1. FDA clears test to help manage antibiotic treatment for lower respiratory tract infections and sepsis. US Food and Drug Administration. [Press Release]. Silver Spring, MD, February 23 2017.
2. Esposito S, Tagliabue C, Picciolli I, et al. Procalcitonin measurements for guiding antibiotic treatment in pediatric pneumonia. Respir Med. 2011;105(12):1939-1945. https://doi.org/10.1016/j.rmed.2011.09.003.
3. Baer G, Baumann P, Buettcher M, et al. Procalcitonin guidance to reduce antibiotic treatment of lower respiratory tract infection in children and adolescents (ProPAED): a randomized controlled trial. PLoS One. 2013;8(8):e68419. https://doi.org/10.1371/journal.pone.0068419.
4. Choi JJ MM, Simon MS, Evans AT, Self WH, Glesby MJ. Procalcitonin in the diagnosis and management of community-acquired pneumonia in hospitalized adults. J Hosp Med. 2019;18(X);XXX-XXX. https://doi.org/10.12788/jhm.3272.
5. Stockmann C, Ampofo K, Killpack J, et al. Procalcitonin accurately identifies hospitalized children with low risk of bacterial community-acquired pneumonia. J Pediatric Infect Dis Soc. 2017;7(1): 46-53. https://doi.org/10.1093/jpids/piw091.
6. Dandona P, Nix D, Wilson MF, et al. Procalcitonin increase after endotoxin injection in normal subjects. J Clin Endocrinol Metab. 1994;79(6):1605-1608. https://doi.org/10.1210/jcem.79.6.7989463.
7. Brunkhorst FM, Heinz U, Forycki ZF. Kinetics of procalcitonin in iatrogenic sepsis. Intensive Care Med. 1998;24(8):888-889.
8. Huang DT, Weissfeld LA, Kellum JA, et al; GenIMS Investigators. Risk prediction with procalcitonin and clinical rules in community-acquired pneumonia. Ann Emerg Med. 2008;52(1):48-58 e42. https://doi.org/10.1016/j.annemergmed.2008.01.003.
9. McCluskey SM, Schuetz P, Abers MS, et al. Serial procalcitonin as a predictor of pacteremia and peed for intensive care unit care in adults with pneumonia, including those with highest severity: A Prospective Cohort Study. Open Forum Infect Dis. 2017;4(1):ofw238. https://doi.org/10.1093/ofid/ofw238.
10. Self WH, Grijalva CG, Williams DJ, et al. Procalcitonin as an early marker of the need for invasive respiratory or vasopressor support in adults with community-acquired pneumonia. Chest. 2016;150(4):819-828. https://doi.org/10.1016/j.chest.2016.04.010.
11. Don M, Valent F, Korppi M, et al. Efficacy of serum procalcitonin in evaluating severity of community-acquired pneumonia in childhood. Scand J Infect Dis. 2007;39(2):129-137. https://doi.org/10.1080/00365540600951283.
12. Meisner M. Update on procalcitonin measurements. Ann Lab Med. 2014;34(4):263-273. https://doi.org/10.3343/alm.2014.34.4.263.
13. Jain S, Williams DJ, Arnold SR, et al; CDC EPIC Study Team. Community-acquired pneumonia requiring hospitalization among U.S. children. N Engl J Med. 2015;372(9):835-845. https://doi.org/10.1056/NEJMoa1405870.
14. Jain S, Self WH, Wunderink RG, et al; CDC EPIC Study Team. Community-Acquired Pneumonia Requiring Hospitalization among U.S. adults. N Engl J Med. 2015;373(5):415-427. https://doi.org/10.1056/NEJMoa1500245.
15. Aloisio E, Dolci A, Panteghini M. Procalcitonin: Between evidence and critical issues. Clin Chim Acta. 2019;496:7-12. https://doi.org/10.1016/j.cca.2019.06.010.
16. Society for Healthcare Epidemiology of A, Infectious Diseases Society of A, Pediatric Infectious Diseases S. Policy statement on antimicrobial stewardship by the Society for Healthcare Epidemiology of America (SHEA), the Infectious Diseases Society of America (IDSA), and the Pediatric Infectious Diseases Society (PIDS). Infect Control Hosp Epidemiol. 2012;33(4):322-327. https://doi.org/10.1086/665010.
17. Gerber JS, Kronman MP, Ross RK, et al. Identifying targets for antimicrobial stewardship in children’s hospitals. Infect Control Hosp Epidemiol. 2013;34(12):1252-1258. https://doi.org/10.1086/673982.
© 2019 Society of Hospital Medicine
Impact of the Choosing Wisely® Campaign Recommendations for Hospitalized Children on Clinical Practice: Trends from 2008 to 2017
The Choosing Wisely® Campaign (CWC) was launched in 2012. This ongoing national initiative encourages conversations among patients and clinicians about the need —or the lack thereof—for frequent tests, treatments, and procedures in healthcare. More than 80 professional societies have developed short lists of evidence-based recommendations aimed at avoiding unnecessary, “low-value” care. More than 550 recommendations are currently available.1 The Society of Hospital Medicine (SHM) Pediatric Committee published a list of five recommendations for the CWC in 2013.2
After seven years, the campaign has posted several success stories highlighting the increase in clinicians’ awareness about the recommendations. Several local, regional, and national initiatives and quality improvement (QI) projects have been inspired by the CWC and its tenants.1,3 However, limited research has been performed on the true impact of these recommendations on avoiding “low-value” services. A more comprehensive approach is required to “measure wisely” the impact of the campaign on bedside clinical practice.4 Stakeholders in healthcare value have been challenged to collaborate in creating high-impact lists of “low-value” interventions and designing effective tools to measure their impact on clinical practice and costs.5
We initially developed a report card with five metrics derived from the CWC-SHM pediatric recommendations to help individual institutions and group practices to measure their performance and benchmark their results with peers.6 The report card is available for hospital members of the Children’s Hospital Association (CHA).7
The current study analyzes the frequency of utilization and trends of five metrics included in the CHA/Pediatric Health Information System® (PHIS) CWC report card in tertiary children’s hospitals in the United States. We analyzed data from five years before and five years after the CWC-PHM recommendations were published in 2013. We hypothesize that the publication and dissemination of the CWC-PHM recommendations—the intervention—will result in either an immediate decrease in the use of the “low-value” services studied and/or a change in the trend of utilization over time.
METHODS
Study Design
We conducted an observational, longitudinal retrospective study aimed at evaluating the impact of the CWC-PHM recommendations on clinical practice in tertiary children’s hospitals in the US.
Study Population
The population included inpatient and observation stays for children aged 0-18 years admitted to the 36 children’s hospitals consistently providing data from 2008 to 2017 to the PHIS administrative database (CHA, Lenexa, Kansas). This database contains inpatient, emergency department, ambulatory, and observation encounter–level data from more than 50 not-for-profit, tertiary care pediatric hospitals and accounts for ~20% of all pediatric hospitalizations in the US every year.
A joint effort between the CHA and the participating hospitals ensures the quality of the data submitted, as previously described.8 These data are subjected to a routine quality check with each submission and within each report. Data were fully deidentified for this study. In total, 36 PHIS hospitals met the strict quality standards for inclusion of submitted data. The remaining hospitals were excluded because they did not have complete data or had incomplete billing information.
For external benchmarking purposes, PHIS participating hospitals provide encounter data, including demographics, diagnoses, and procedures (International Classification of Diseases versions 9 and 10).9,10 The transition from ICD-9 to ICD-10 in the US took place during the study period. However, the CHA completed a process of translating and mapping all ICD-9 codes to every possible equivalent ICD-10 code in the PHIS database. Thus, the change from ICD-9 to ICD-10 should not have had any significant effect on population definition and data analytics, including trend analysis.
For each condition, the study population was divided into the following two cohorts for comparison of the trends: all admissions from January 1, 2008 to December 31, 2012 (before) and all admissions from January 1, 2013 to December 31, 2017 (after) the CWC-PHM recommendations were published.
This study was determined to be nonhuman subject research and was therefore exempted by Nicklaus Children’s Hospital Human Research Protection Program.
Outcomes
The outcomes for this study were the percentages of patients receiving the not-recommended “low-value” services targeted by the CWC-PHM recommendations. For this purpose, four of the five recommendations were translated into the following five metrics, operationalized in the PHIS database and displayed in the “Choosing Wisely” report card:6
1. Percentage of patients with uncomplicated asthma receiving chest radiograph (CXR).
2. Percentage of patients with uncomplicated bronchiolitis receiving CXR.
3. Percentage of patients with uncomplicated bronchiolitis receiving bronchodilators.
4. Percentage of patients with lower respiratory tract infection (LRTI) receiving systemic corticosteroids (relievers).
5. Percentage of patients with uncomplicated gastroesophageal reflux (GER) receiving acid suppressor therapy.
The fifth recommendation—limiting the use of continuous pulse oximetry unless the patient is receiving supplemental oxygen—could not be operationalized in the PHIS database because of inconsistent reporting of these resources.6
The resulting percentages represent nonadherence to the recommendations, suggesting overuse of the specific “low-value” intervention. As such, a decreasing trend over time is the desired direction of improvement.
The definition of “uncomplicated” conditions and the metrics are presented in Table 1. A complete list of the inclusion and exclusion criteria to define “uncomplicated” conditions and the complete list of the clinical translation codes used in PHIS to identify the “low-value” services are presented as an electronic supplement.
Statistical Analyses
We compared the demographic and clinical characteristics of the various cohorts before and after the release of the CWC-PHM recommendations—the intervention—using chi-square statistics. To assess the individual hospital-level trends over time for each measure, we modeled the patient-level data of each hospital using generalized linear mixed effects models with a binomial distribution. These models were adjusted for patient demographic and clinical factors that were found to be significantly different (P < .01) before and after the intervention on bivariate analyses. From these models, we generated adjusted estimates for the quarterly percentages for each hospital. We then conducted an interrupted time series (ITS) using these estimates to compare trends in the five years before (2008-2012) and five years after (2013-2017) the publication of the CWC-PHM recommendations. For the ITS analysis, we used a generalized linear mixed effects model with the quarterly adjusted hospital-level utilization rates of “low-value” services for each cohort as the unit of analysis and a random intercept for each hospital. The model used an autoregressive(1) covariance structure to account for autocorrelation. The ITS allowed us to test our hypothesis by assessing the following two important features: (a) if a significant decrease occurred right after the CWC-PHM recommendations were published (level-change) and/or (b) if the intervention altered the secular trend (slope-change). All statistical analyses were performed using SAS v. 9.4 (SAS Institute, Cary, North Carolina), and P values <.01 were considered to be statistically significant.
RESULTS
Table 2 presents the demographic characteristics of the cohorts before (2008-2012) and after (2013-2017) the publication of the CWC-PHM recommendations. Hospitalizations due to asthma represented the largest cohort with 142,067 cases, followed by hospitalizations due to bronchiolitis with 94,253 cases. Hospitalizations due to GER comprised the smallest cohort with 13,635 cases. Most of the children had government insurance and had “minor” severity according to the All Patient Revised Diagnosis Related Group (APR-DRG) system.
We found statistically significant differences in most of the demographic characteristics for the cohorts when comparing cases before and after the introduction of the CWC-PHM recommendations.
After adjusting for demographic characteristics, we estimated the percentages of the utilization of the “low-value” services from 2008 to 2017. We observed a steady decrease in overutilization of all services over time. The absolute percentage decrease was more evident in the reduction of the utilization of relievers by 36.6% and that of CXR by 31.5% for bronchiolitis. We also observed a 20.8% absolute reduction in the use of CXR for asthma.
The use of systemic steroids in LRTI revealed the lowest utilization among the “low-value” services studied, with 15.1% in 2008 and 12.2% in 2017, a 2.9% absolute reduction. However, the prescription of acid suppressors for GER showed the highest utilization among all the overuse metrics studied, ie, 63% in 2008 and 48.9% in 2017, with an absolute decrease of 24.1%. The yearly adjusted estimated percentages of utilization for each “low-value” service are presented in Appendix Table A.
Table 3 and the Figure (attached as supplemental online graphic) respectively present the risk-adjusted ITS parameter estimates and the graphic representation before and after the inception of the CWC-PHM recommendations for the trend analysis.
During the five years preceding the intervention (2008-2012), a statistically significant decrease (P < .01) was already noted in the trend of utilization of relievers and CXR in bronchiolitis and CXR in asthma. However, we found no significant change in the trend of the use of systemic corticosteroids in cases with LRTI or the use of acid suppression therapy for GER.
The immediate effect of the intervention is represented by the level change. We found a statistically significant (P < .01) reduction according to the CWC-PHM recommendations only for the use of CXR in hospitalized children with uncomplicated asthma.
During the five years after the CWC-PHM recommendations were published (2013-2017), a sustained, significant decrease in the trend of the use of CXR in asthma and bronchiolitis and the use of relievers in bronchiolitis (P < .01) was observed. However, there was no significant change in the trend of the use of systemic corticosteroids in cases with LRTI or in the use of acid suppression therapy for GER during this period.
Comparison of the trends before and after the publication of the CWC-PHM recommendations revealed that only the decreasing trend in the use of relievers for bronchiolitis over time significantly correlated with the campaign (P < .01).
DISCUSSION
We found a steady reduction in the frequency of overutilization of five “low-value” services described in the CWC-PHM recommendations from 2008 to 2017 in 36 tertiary children’s hospitals in the US. This trend was more evident in the utilization of relievers and CXR for bronchiolitis. The ITS analysis demonstrated that immediately after the publication of the CWC-PHM recommendations, only the use of CXR for asthma decreased significantly. Then, only the use of relievers for bronchiolitis decreased significantly over time in comparison with the secular trend.
These results support our hypothesis for two of the five metrics studied, suggesting that the publication of the CWC-PHM recommendations had a modest impact in clinical practices related to those services in tertiary children’s hospitals.
These findings align with a limited number of published studies that have consistently found a modest decrease in the use of “low-value” services before 201211-13 and a limited impact of the CWC in clinical practices on the use of “low-value” services after the inception of the campaign.14-17
For instance, in a cross-sectional analysis of the 1999 and 2009 samples of ambulatory care practices in the US, only two of 11 overuse quality indicators showed improvement.11 The authors recognized that reducing inappropriate care will require the same attention to guideline development and performance measurement that was directed at reducing the underuse of needed therapies. However, determining whether a patient received inappropriate care generally requires a much more detailed analysis of clinical information than what is required for assessments of underuse.11
Another study designed claims-based algorithms to measure the prevalence of 11 Choosing Wisely-identified “low-value” services in fee-for-service Medicare patients aged >65 years from 2006 to 2011.12 The annual prevalence of selected CWC “low-value” services ranged from 1.2% (upper urinary tract imaging in men with benign prostatic hyperplasia) to 46.5% (preoperative cardiac testing for low-risk, noncardiac procedures). The study concluded that identifying and measuring “low-value” health services is a prerequisite for improving quality and eliminating waste.12
In pediatric medicine, the authors investigated a large cohort of infants aged one to 24 months hospitalized with bronchiolitis to 41 tertiary children’s hospitals reporting data to the PHIS database from 2004 to 2012.13 The trend analysis revealed a decrease in the utilization of diagnostics and treatment interventions before the publication of the American Academy of Pediatrics 2006 Bronchiolitis Guidelines.18 There was an additional reduction in the use of CXR, steroids, and bronchodilators after the publication of the guidelines.13
After the CWC was launched in 2012, several surveys have demonstrated a tangible increase in awareness of the CWC and its goals, mostly among primary care physicians and subspecialists. Clinicians who were aware of the campaign found the recommendations to be useful as a legitimate source of guidance and were more likely to reduce the indication of unnecessary care and “low-value” clinical services included in the CWC.1,3,19,20
Few studies in adults have focused on measuring the trends in overuse metrics derived from the CWC recommendations.14-16 The initial studies have found limited reduction on the use of “low-value” care after the inception of the CWC. They suggest that clinician education, awareness, and public promotion alone do not appear to be sufficient to achieve widespread changes in clinical practice. Additional interventions are necessary for the wider implementation and success of the CWC recommendations.11,14,15,19,21,22
However, a more recent study was conducted in 91 academic centers from 2013 through 2016, before and after the publication of a CWC recommendation on the use of troponin-only testing for the diagnosis of acute myocardial infarction. Hospitals with low rates of troponin-only testing before the publication of the recommendation demonstrated a statistically significant increase over time in the rate of adherence. The authors postulated that the impact of the CWC might have been significant because of the increase in the institutional and provider attention to “high-value” care as a result of the campaign.16
In pediatrics, a cross-sectional study defined 20 “low-value” services from a list of more than 400 items from the CWC and other sources of highly regarded, evidence-based pediatrics healthcare recommendations. The list included six diagnostic tests, five imaging tests, and nine prescription drugs ordered in a robust cohort of 4.4 million children nationwide in 2014. The study concluded that approximately one in 10 children received a “low-value” service. The majority (59.4%) were related to prescription drugs, specifically the inappropriate use of antibiotics for a variety of conditions. The estimated combined cost of these unnecessary services was approximately $27 million, with one-third of the cost being paid out of pocket, arguing for significant financial harm. However, this study did not perform a trend analysis.17
Our results are comparable with these studies, reporting an initial increase in awareness and beliefs, followed by progressive changes in clinical practice among pediatric hospital-based clinicians in delivering evidence-based, high-value care after the CWC.
The attribution of the steady reduction in the absolute percentages of overuse/waste in the five metrics related to the CWC observed in this study, including the significant changes noted in two of the overuse indicators after the publication of the CWC-PHM recommendations, should be interpreted with caution. For example, the significant decrease in the use of “low-value” services in bronchiolitis could be attributed to multiple factors such as national guidelines released in 2014 after the campaign,23 national multicenter QI collaborative projects,24,25 and multiple local QI efforts.26,27 The increase in the awareness and impact of the CWC recommendations among pediatric providers could also be a contributing factor, but this association cannot be established in the light of our findings.
On the other hand, despite extensive evidence for the lack of efficacy and the potential harm associated with the use of acid suppressors for uncomplicated GER in infants,28-30 the frequency of this “low-value” therapeutic intervention remains high (~50%). The trend in utilization was not impacted by the CWC-PHM recommendations. This finding could be explained by several factors, including the possibility that several hospitalized patients may suffer from GER disease requiring acid suppressors. Another possibility is that acid suppressors are generally prescribed as an outpatient medication, and physicians treating inpatients may be reluctant to discontinue it during hospitalization. Nevertheless, this recommendation represents a target for review, update, and QI interventions in the near future.
The delivery of inappropriate “low-value” care represents the most significant dimension of waste in healthcare.31 The development of quality measures of “low-value” services representing overuse and waste is the most needed step toward assessing the magnitude of the problem. Overuse metrics could be incorporated into QI interventions to decrease the provision of such services. However, systematic efforts aimed at developing quality indicators of overuse based on the CWC recommendations have been limited. To our knowledge, this is the first study on the trends of metrics derived from the CWC recommendations in pediatric medicine.
Future research is needed to develop overuse metrics further to assess the specific outcomes related to the implementation of the CWC. How much has clinical practice changed as a result of the campaign? What are the outcomes and savings attributable to these efforts? These are critical questions for the immediate future that should be answered to sustain the ongoing efforts and results and to validate that the efforts are worthwhile.
This study has several limitations. First, this is a retrospective and observational study. It cannot prove a direct causal relationship between the publication of the CWC-PHM and the observed trends, as other potential factors may have contributed to the outcomes. Second, in administrative databases, the data quality is dependent on proper documentation and coding that may vary among reporting institutions. These data lack clinical information, and a fair assessment of “appropriateness” could be questioned. In addition, the study included only 36 academic, tertiary children’s hospitals. Because approximately two-thirds of all pediatric hospitalizations in the US occur in community settings,32 this study may not fully represent clinical practice in the majority of pediatric hospitalizations in the US. Finally, the validity of the ITS analysis has inherent limitations due to the variability of the data in some metrics that may affect the power of the analysis. This fact could lead to inaccurate conclusions regarding intervention effectiveness due to the data-driven model applied, as well as the lack of control for other time-varying confounders.33
CONCLUSIONS
After seven years, the CWC faces important challenges. Critical to the success of the campaign is to “measure wisely” by developing quality indicators of overuse and operationalizing them into administrative and clinical data sources to assess the impact on clinical practice. Our study highlights some limited but steady reduction in the use of some “low-value” services before the campaign. It also demonstrates a modest impact of the campaign on clinical practices in tertiary care children’s hospitals in the US. Clinicians and institutions still have a long way to go in reducing the use of “low-value” interventions in pediatric medicine. These observations challenge us to step up our efforts to implement QI interventions aimed at incorporating these professional, society-endorsed recommendations into our clinical practice.
Acknowledgments
The authors thank Dr. Kristine De La Torre and Dr. Jennifer McCafferty-Fernandez and the Research Institute of Nicklaus Children’s Hospital for medical writing assistance. They also acknowledge Tatiana Consuegra, library technician, for her clerical assistance in the preparation and submission of this article.
1. Choosing Wisely. Choosing Wisely Campaign Official Site. http://www.choosingwisely.org/. Accessed May 2019.
2. Quinonez RA, Garber MD, Schroeder AR, et al. Choosing wisely in pediatric hospital medicine: five opportunities for improved healthcare value. J Hosp Med. 2013;8(9):479-485. https://doi.org/10.1002/jhm.2064.
3. ABIM Foundation CR. Choosing Wisely: A Special Report on the First Five Years. http://www.choosingwisely.org/choosing-wisely-a-special-report-on-the-first-five-years/. Updated 2017. Accessed May 2019.
4. Wolfson D, Santa J, Slass L. Engaging physicians and consumers in conversations about treatment overuse and waste: a short history of the choosing wisely campaign. Acad Med. 2014;89(7):990-995. https://doi.org/10.1097/ACM.0000000000000270.
5. Morden NE, Colla CH, Sequist TD, Rosenthal MB. Choosing wisely—the politics and economics of labeling low-value services. N Engl J Med. 2014;370(7):589-592. https://doi.org/10.1056/NEJMp1314965.
6. Reyes M, Paulus E, Hronek C, et al. Choosing wisely campaign: Report card and achievable benchmarks of care for children’s hospitals. Hosp Pediatr. 2017;7(11):633-641. https://doi.org/10.1542/hpeds.2017-0029.
7. Report Cards. Choosing Wisely Measures - Pediatric Hospital Medicine Detail Reports. Children’s Hospital Association Web site. https://www.childrenshospitals.org/. Accessed May 2019.
8. Mongelluzzo J, Mohamad Z, Ten Have TR, Shah SS. Corticosteroids and mortality in children with bacterial meningitis. JAMA. 2008;299(17):2048-2055. https://doi.org/10.1001/jama.299.17.2048.
9. Buck CJ. 2013 ICD 9 CM for Physicians, Volumes 1 & 2. Chicago, IL: American Medical Association; 2013.
10. Buck CJ. 2018 ICD-10-CM for Physicians. Chicago, IL: American Medical Association; 2018.
11. Kale MS, Bishop TF, Federman AD, Keyhani S. Trends in the overuse of ambulatory health care services in the United States. JAMA Inter Med. 2013;173(2):142-148. https://doi.org/10.1001/2013.jamainternmed.1022.
12. Colla CH, Morden NE, Sequist TD, Schpero WL, Rosenthal MB. Choosing wisely: Prevalence and correlates of low-value health care services in the United States. J Gen Intern Med. 2015;30(2):221-228. https://doi.org/10.1007/s11606-014-3070-z
13. Parikh K, Hall M, Teach SJ. Bronchiolitis management before and after the AAP guidelines. Pediatrics. 2014;133(1): e1-7. https://doi.org/10.1542/peds.2013-2005.
14. Rosenberg A, Agiro A, Gottlieb M, et al. Early trends among seven recommendations from the Choosing Wisely campaign. JAMA Inter Med. 2015;175(12):1913-1920. https://doi.org/10.1001/jamainternmed.2015.5441.
15. Reid RO, Rabideau B, Sood N. Low-value health care services in a commercially insured population. JAMA Inter Med. 2016;176(10):1567-1571. https://doi.org/10.1001/jamainternmed.2016.5031.
16. Prochaska MT, Hohmann SF, Modes M, Arora VM. Trends in troponin-only testing for AMI in academic teaching hospitals and the impact of choosing wisely(R). J Hosp Med. 2017;12(12):957-962. https://doi.org/10.12788/jhm.2846.
17. Chua KP, Schwartz AL, Volerman A, Conti RM, Huang ES. Use of low-value pediatric services among the commercially insured. Pediatrics. 2016;138(6):e20161809. https://doi.org/10.1542/peds.2016-1809.
18. American Academy of Pediatrics Subcommittee on Diagnosis and Management of Bronchiolitis. Diagnosis and management of bronchiolitis. Pediatrics. 2006;118(4):1774-1793.
19. Colla CH, Kinsella EA, Morden NE, Meyers DJ, Rosenthal MB, Sequist TD. Physician perceptions of Choosing Wisely and drivers of overuse. Am J Manag Care. 2016;22(5):337-343.
20. PerryUndem Research/Communication AF. DataBrief: Findings from a National Survey of Physicians. http://www.choosingwisely.org/wp-content/uploads/2017/10/Summary-Research-Report-Survey-2017.pdf. Updated 2017.
21. Wolfson D. Choosing wisely recommendations using administrative claims data. JAMA Inter Med. 2016;176(4):565. https://doi.org/10.1001/jamainternmed.2016.0357.
22. Heekin AM, Kontor J, Sax HC, Keller M, Wellington A, Weingarten S. Choosing wisely clinical decision support adherence and associated patient outcomes. Am J Manag Care. 2018;24(8):361-366.
23. Ralston SL, Lieberthal AS, Meissner HC, et al. Clinical practice guideline: the diagnosis, management, and prevention of bronchiolitis. Pediatrics. 2014;134(5):e1474-e502. https://doi.org/10.1542/peds.2014-2742.
24. Ralston SL, Garber MD, Rice-Conboy E, et al. A multicenter collaborative to reduce unnecessary care in inpatient bronchiolitis. Pediatrics. 2016;137(1):e20150851. https://doi.org/10.1542/peds.2015-0851.
25. Mussman GM, Lossius M, Wasif F, et al. Multisite emergency department inpatient collaborative to reduce unnecessary bronchiolitis care. Pediatrics. 2018;141(2):e20170830. https://doi.org/10.1542/peds.2017-0830.
26. Mittal V, Hall M, Morse R, et al. Impact of inpatient bronchiolitis clinical practice guideline implementation on testing and treatment. J Pediatr. 2014;165(3):570-576. https://doi.org/10.1016/j.jpeds.2014.05.021.
27. Tyler A, Krack P, Bakel LA, et al. Interventions to reduce over-utilized tests and treatments in bronchiolitis. Pediatrics. 2018;141(6):e20170485. https://doi.org/10.1542/peds.2017-0485.
28. Rosen R, Vandenplas Y, Singendonk M, et al. Pediatric gastroesophageal reflux clinical practice guidelines: joint recommendations of the North American Society for Pediatric Gastroenterology, Hepatology, and Nutrition and the European Society for Pediatric Gastroenterology, Hepatology, and Nutrition. J Pediatr Gastroenterol Nutr. 2018;66(3):516-554. https://doi.org/10.1097/MPG.0b013e3181b7f563.
29. Eichenwald EC, COMMITTEE ON FETUS AND NEWBORN. Diagnosis and management of gastroesophageal reflux in preterm infants. Pediatrics. 2018;142(1):e20181061. https://doi.org/10.1542/peds.2018-1061
30. van der Pol RJ, Smits MJ, van Wijk MP, Omari TI, Tabbers MM, Benninga MA. Efficacy of proton-pump inhibitors in children with gastroesophageal reflux disease: a systematic review. Pediatrics. 2011;127(5):925-935. https://doi.org/10.1542/peds.2010-2719.
31. IOM Report: Estimated $750B Wasted Annually In Health Care System. Kaiser Health News Web site. https://khn.org/morning-breakout/iom-report/. Updated 2012. Accessed May 2019.
32. Leyenaar JK, Ralston SL, Shieh M, Pekow PS, Mangione‐Smith R, Lindenauer PK. Epidemiology of pediatric hospitalizations at general hospitals and freestanding children’s hospitals in the United States. J Hosp Med. 2016;11(11):743-749. https://doi.org/10.1002/jhm.2624.
33. Bernal JL, Cummins S, Gasparrini A. Interrupted time series regression for the evaluation of public health interventions: a tutorial. Int J Epidemiol. 2017;46(1):348-355. https://doi.org/10.1093/ije/dyw098.
The Choosing Wisely® Campaign (CWC) was launched in 2012. This ongoing national initiative encourages conversations among patients and clinicians about the need —or the lack thereof—for frequent tests, treatments, and procedures in healthcare. More than 80 professional societies have developed short lists of evidence-based recommendations aimed at avoiding unnecessary, “low-value” care. More than 550 recommendations are currently available.1 The Society of Hospital Medicine (SHM) Pediatric Committee published a list of five recommendations for the CWC in 2013.2
After seven years, the campaign has posted several success stories highlighting the increase in clinicians’ awareness about the recommendations. Several local, regional, and national initiatives and quality improvement (QI) projects have been inspired by the CWC and its tenants.1,3 However, limited research has been performed on the true impact of these recommendations on avoiding “low-value” services. A more comprehensive approach is required to “measure wisely” the impact of the campaign on bedside clinical practice.4 Stakeholders in healthcare value have been challenged to collaborate in creating high-impact lists of “low-value” interventions and designing effective tools to measure their impact on clinical practice and costs.5
We initially developed a report card with five metrics derived from the CWC-SHM pediatric recommendations to help individual institutions and group practices to measure their performance and benchmark their results with peers.6 The report card is available for hospital members of the Children’s Hospital Association (CHA).7
The current study analyzes the frequency of utilization and trends of five metrics included in the CHA/Pediatric Health Information System® (PHIS) CWC report card in tertiary children’s hospitals in the United States. We analyzed data from five years before and five years after the CWC-PHM recommendations were published in 2013. We hypothesize that the publication and dissemination of the CWC-PHM recommendations—the intervention—will result in either an immediate decrease in the use of the “low-value” services studied and/or a change in the trend of utilization over time.
METHODS
Study Design
We conducted an observational, longitudinal retrospective study aimed at evaluating the impact of the CWC-PHM recommendations on clinical practice in tertiary children’s hospitals in the US.
Study Population
The population included inpatient and observation stays for children aged 0-18 years admitted to the 36 children’s hospitals consistently providing data from 2008 to 2017 to the PHIS administrative database (CHA, Lenexa, Kansas). This database contains inpatient, emergency department, ambulatory, and observation encounter–level data from more than 50 not-for-profit, tertiary care pediatric hospitals and accounts for ~20% of all pediatric hospitalizations in the US every year.
A joint effort between the CHA and the participating hospitals ensures the quality of the data submitted, as previously described.8 These data are subjected to a routine quality check with each submission and within each report. Data were fully deidentified for this study. In total, 36 PHIS hospitals met the strict quality standards for inclusion of submitted data. The remaining hospitals were excluded because they did not have complete data or had incomplete billing information.
For external benchmarking purposes, PHIS participating hospitals provide encounter data, including demographics, diagnoses, and procedures (International Classification of Diseases versions 9 and 10).9,10 The transition from ICD-9 to ICD-10 in the US took place during the study period. However, the CHA completed a process of translating and mapping all ICD-9 codes to every possible equivalent ICD-10 code in the PHIS database. Thus, the change from ICD-9 to ICD-10 should not have had any significant effect on population definition and data analytics, including trend analysis.
For each condition, the study population was divided into the following two cohorts for comparison of the trends: all admissions from January 1, 2008 to December 31, 2012 (before) and all admissions from January 1, 2013 to December 31, 2017 (after) the CWC-PHM recommendations were published.
This study was determined to be nonhuman subject research and was therefore exempted by Nicklaus Children’s Hospital Human Research Protection Program.
Outcomes
The outcomes for this study were the percentages of patients receiving the not-recommended “low-value” services targeted by the CWC-PHM recommendations. For this purpose, four of the five recommendations were translated into the following five metrics, operationalized in the PHIS database and displayed in the “Choosing Wisely” report card:6
1. Percentage of patients with uncomplicated asthma receiving chest radiograph (CXR).
2. Percentage of patients with uncomplicated bronchiolitis receiving CXR.
3. Percentage of patients with uncomplicated bronchiolitis receiving bronchodilators.
4. Percentage of patients with lower respiratory tract infection (LRTI) receiving systemic corticosteroids (relievers).
5. Percentage of patients with uncomplicated gastroesophageal reflux (GER) receiving acid suppressor therapy.
The fifth recommendation—limiting the use of continuous pulse oximetry unless the patient is receiving supplemental oxygen—could not be operationalized in the PHIS database because of inconsistent reporting of these resources.6
The resulting percentages represent nonadherence to the recommendations, suggesting overuse of the specific “low-value” intervention. As such, a decreasing trend over time is the desired direction of improvement.
The definition of “uncomplicated” conditions and the metrics are presented in Table 1. A complete list of the inclusion and exclusion criteria to define “uncomplicated” conditions and the complete list of the clinical translation codes used in PHIS to identify the “low-value” services are presented as an electronic supplement.
Statistical Analyses
We compared the demographic and clinical characteristics of the various cohorts before and after the release of the CWC-PHM recommendations—the intervention—using chi-square statistics. To assess the individual hospital-level trends over time for each measure, we modeled the patient-level data of each hospital using generalized linear mixed effects models with a binomial distribution. These models were adjusted for patient demographic and clinical factors that were found to be significantly different (P < .01) before and after the intervention on bivariate analyses. From these models, we generated adjusted estimates for the quarterly percentages for each hospital. We then conducted an interrupted time series (ITS) using these estimates to compare trends in the five years before (2008-2012) and five years after (2013-2017) the publication of the CWC-PHM recommendations. For the ITS analysis, we used a generalized linear mixed effects model with the quarterly adjusted hospital-level utilization rates of “low-value” services for each cohort as the unit of analysis and a random intercept for each hospital. The model used an autoregressive(1) covariance structure to account for autocorrelation. The ITS allowed us to test our hypothesis by assessing the following two important features: (a) if a significant decrease occurred right after the CWC-PHM recommendations were published (level-change) and/or (b) if the intervention altered the secular trend (slope-change). All statistical analyses were performed using SAS v. 9.4 (SAS Institute, Cary, North Carolina), and P values <.01 were considered to be statistically significant.
RESULTS
Table 2 presents the demographic characteristics of the cohorts before (2008-2012) and after (2013-2017) the publication of the CWC-PHM recommendations. Hospitalizations due to asthma represented the largest cohort with 142,067 cases, followed by hospitalizations due to bronchiolitis with 94,253 cases. Hospitalizations due to GER comprised the smallest cohort with 13,635 cases. Most of the children had government insurance and had “minor” severity according to the All Patient Revised Diagnosis Related Group (APR-DRG) system.
We found statistically significant differences in most of the demographic characteristics for the cohorts when comparing cases before and after the introduction of the CWC-PHM recommendations.
After adjusting for demographic characteristics, we estimated the percentages of the utilization of the “low-value” services from 2008 to 2017. We observed a steady decrease in overutilization of all services over time. The absolute percentage decrease was more evident in the reduction of the utilization of relievers by 36.6% and that of CXR by 31.5% for bronchiolitis. We also observed a 20.8% absolute reduction in the use of CXR for asthma.
The use of systemic steroids in LRTI revealed the lowest utilization among the “low-value” services studied, with 15.1% in 2008 and 12.2% in 2017, a 2.9% absolute reduction. However, the prescription of acid suppressors for GER showed the highest utilization among all the overuse metrics studied, ie, 63% in 2008 and 48.9% in 2017, with an absolute decrease of 24.1%. The yearly adjusted estimated percentages of utilization for each “low-value” service are presented in Appendix Table A.
Table 3 and the Figure (attached as supplemental online graphic) respectively present the risk-adjusted ITS parameter estimates and the graphic representation before and after the inception of the CWC-PHM recommendations for the trend analysis.
During the five years preceding the intervention (2008-2012), a statistically significant decrease (P < .01) was already noted in the trend of utilization of relievers and CXR in bronchiolitis and CXR in asthma. However, we found no significant change in the trend of the use of systemic corticosteroids in cases with LRTI or the use of acid suppression therapy for GER.
The immediate effect of the intervention is represented by the level change. We found a statistically significant (P < .01) reduction according to the CWC-PHM recommendations only for the use of CXR in hospitalized children with uncomplicated asthma.
During the five years after the CWC-PHM recommendations were published (2013-2017), a sustained, significant decrease in the trend of the use of CXR in asthma and bronchiolitis and the use of relievers in bronchiolitis (P < .01) was observed. However, there was no significant change in the trend of the use of systemic corticosteroids in cases with LRTI or in the use of acid suppression therapy for GER during this period.
Comparison of the trends before and after the publication of the CWC-PHM recommendations revealed that only the decreasing trend in the use of relievers for bronchiolitis over time significantly correlated with the campaign (P < .01).
DISCUSSION
We found a steady reduction in the frequency of overutilization of five “low-value” services described in the CWC-PHM recommendations from 2008 to 2017 in 36 tertiary children’s hospitals in the US. This trend was more evident in the utilization of relievers and CXR for bronchiolitis. The ITS analysis demonstrated that immediately after the publication of the CWC-PHM recommendations, only the use of CXR for asthma decreased significantly. Then, only the use of relievers for bronchiolitis decreased significantly over time in comparison with the secular trend.
These results support our hypothesis for two of the five metrics studied, suggesting that the publication of the CWC-PHM recommendations had a modest impact in clinical practices related to those services in tertiary children’s hospitals.
These findings align with a limited number of published studies that have consistently found a modest decrease in the use of “low-value” services before 201211-13 and a limited impact of the CWC in clinical practices on the use of “low-value” services after the inception of the campaign.14-17
For instance, in a cross-sectional analysis of the 1999 and 2009 samples of ambulatory care practices in the US, only two of 11 overuse quality indicators showed improvement.11 The authors recognized that reducing inappropriate care will require the same attention to guideline development and performance measurement that was directed at reducing the underuse of needed therapies. However, determining whether a patient received inappropriate care generally requires a much more detailed analysis of clinical information than what is required for assessments of underuse.11
Another study designed claims-based algorithms to measure the prevalence of 11 Choosing Wisely-identified “low-value” services in fee-for-service Medicare patients aged >65 years from 2006 to 2011.12 The annual prevalence of selected CWC “low-value” services ranged from 1.2% (upper urinary tract imaging in men with benign prostatic hyperplasia) to 46.5% (preoperative cardiac testing for low-risk, noncardiac procedures). The study concluded that identifying and measuring “low-value” health services is a prerequisite for improving quality and eliminating waste.12
In pediatric medicine, the authors investigated a large cohort of infants aged one to 24 months hospitalized with bronchiolitis to 41 tertiary children’s hospitals reporting data to the PHIS database from 2004 to 2012.13 The trend analysis revealed a decrease in the utilization of diagnostics and treatment interventions before the publication of the American Academy of Pediatrics 2006 Bronchiolitis Guidelines.18 There was an additional reduction in the use of CXR, steroids, and bronchodilators after the publication of the guidelines.13
After the CWC was launched in 2012, several surveys have demonstrated a tangible increase in awareness of the CWC and its goals, mostly among primary care physicians and subspecialists. Clinicians who were aware of the campaign found the recommendations to be useful as a legitimate source of guidance and were more likely to reduce the indication of unnecessary care and “low-value” clinical services included in the CWC.1,3,19,20
Few studies in adults have focused on measuring the trends in overuse metrics derived from the CWC recommendations.14-16 The initial studies have found limited reduction on the use of “low-value” care after the inception of the CWC. They suggest that clinician education, awareness, and public promotion alone do not appear to be sufficient to achieve widespread changes in clinical practice. Additional interventions are necessary for the wider implementation and success of the CWC recommendations.11,14,15,19,21,22
However, a more recent study was conducted in 91 academic centers from 2013 through 2016, before and after the publication of a CWC recommendation on the use of troponin-only testing for the diagnosis of acute myocardial infarction. Hospitals with low rates of troponin-only testing before the publication of the recommendation demonstrated a statistically significant increase over time in the rate of adherence. The authors postulated that the impact of the CWC might have been significant because of the increase in the institutional and provider attention to “high-value” care as a result of the campaign.16
In pediatrics, a cross-sectional study defined 20 “low-value” services from a list of more than 400 items from the CWC and other sources of highly regarded, evidence-based pediatrics healthcare recommendations. The list included six diagnostic tests, five imaging tests, and nine prescription drugs ordered in a robust cohort of 4.4 million children nationwide in 2014. The study concluded that approximately one in 10 children received a “low-value” service. The majority (59.4%) were related to prescription drugs, specifically the inappropriate use of antibiotics for a variety of conditions. The estimated combined cost of these unnecessary services was approximately $27 million, with one-third of the cost being paid out of pocket, arguing for significant financial harm. However, this study did not perform a trend analysis.17
Our results are comparable with these studies, reporting an initial increase in awareness and beliefs, followed by progressive changes in clinical practice among pediatric hospital-based clinicians in delivering evidence-based, high-value care after the CWC.
The attribution of the steady reduction in the absolute percentages of overuse/waste in the five metrics related to the CWC observed in this study, including the significant changes noted in two of the overuse indicators after the publication of the CWC-PHM recommendations, should be interpreted with caution. For example, the significant decrease in the use of “low-value” services in bronchiolitis could be attributed to multiple factors such as national guidelines released in 2014 after the campaign,23 national multicenter QI collaborative projects,24,25 and multiple local QI efforts.26,27 The increase in the awareness and impact of the CWC recommendations among pediatric providers could also be a contributing factor, but this association cannot be established in the light of our findings.
On the other hand, despite extensive evidence for the lack of efficacy and the potential harm associated with the use of acid suppressors for uncomplicated GER in infants,28-30 the frequency of this “low-value” therapeutic intervention remains high (~50%). The trend in utilization was not impacted by the CWC-PHM recommendations. This finding could be explained by several factors, including the possibility that several hospitalized patients may suffer from GER disease requiring acid suppressors. Another possibility is that acid suppressors are generally prescribed as an outpatient medication, and physicians treating inpatients may be reluctant to discontinue it during hospitalization. Nevertheless, this recommendation represents a target for review, update, and QI interventions in the near future.
The delivery of inappropriate “low-value” care represents the most significant dimension of waste in healthcare.31 The development of quality measures of “low-value” services representing overuse and waste is the most needed step toward assessing the magnitude of the problem. Overuse metrics could be incorporated into QI interventions to decrease the provision of such services. However, systematic efforts aimed at developing quality indicators of overuse based on the CWC recommendations have been limited. To our knowledge, this is the first study on the trends of metrics derived from the CWC recommendations in pediatric medicine.
Future research is needed to develop overuse metrics further to assess the specific outcomes related to the implementation of the CWC. How much has clinical practice changed as a result of the campaign? What are the outcomes and savings attributable to these efforts? These are critical questions for the immediate future that should be answered to sustain the ongoing efforts and results and to validate that the efforts are worthwhile.
This study has several limitations. First, this is a retrospective and observational study. It cannot prove a direct causal relationship between the publication of the CWC-PHM and the observed trends, as other potential factors may have contributed to the outcomes. Second, in administrative databases, the data quality is dependent on proper documentation and coding that may vary among reporting institutions. These data lack clinical information, and a fair assessment of “appropriateness” could be questioned. In addition, the study included only 36 academic, tertiary children’s hospitals. Because approximately two-thirds of all pediatric hospitalizations in the US occur in community settings,32 this study may not fully represent clinical practice in the majority of pediatric hospitalizations in the US. Finally, the validity of the ITS analysis has inherent limitations due to the variability of the data in some metrics that may affect the power of the analysis. This fact could lead to inaccurate conclusions regarding intervention effectiveness due to the data-driven model applied, as well as the lack of control for other time-varying confounders.33
CONCLUSIONS
After seven years, the CWC faces important challenges. Critical to the success of the campaign is to “measure wisely” by developing quality indicators of overuse and operationalizing them into administrative and clinical data sources to assess the impact on clinical practice. Our study highlights some limited but steady reduction in the use of some “low-value” services before the campaign. It also demonstrates a modest impact of the campaign on clinical practices in tertiary care children’s hospitals in the US. Clinicians and institutions still have a long way to go in reducing the use of “low-value” interventions in pediatric medicine. These observations challenge us to step up our efforts to implement QI interventions aimed at incorporating these professional, society-endorsed recommendations into our clinical practice.
Acknowledgments
The authors thank Dr. Kristine De La Torre and Dr. Jennifer McCafferty-Fernandez and the Research Institute of Nicklaus Children’s Hospital for medical writing assistance. They also acknowledge Tatiana Consuegra, library technician, for her clerical assistance in the preparation and submission of this article.
The Choosing Wisely® Campaign (CWC) was launched in 2012. This ongoing national initiative encourages conversations among patients and clinicians about the need —or the lack thereof—for frequent tests, treatments, and procedures in healthcare. More than 80 professional societies have developed short lists of evidence-based recommendations aimed at avoiding unnecessary, “low-value” care. More than 550 recommendations are currently available.1 The Society of Hospital Medicine (SHM) Pediatric Committee published a list of five recommendations for the CWC in 2013.2
After seven years, the campaign has posted several success stories highlighting the increase in clinicians’ awareness about the recommendations. Several local, regional, and national initiatives and quality improvement (QI) projects have been inspired by the CWC and its tenants.1,3 However, limited research has been performed on the true impact of these recommendations on avoiding “low-value” services. A more comprehensive approach is required to “measure wisely” the impact of the campaign on bedside clinical practice.4 Stakeholders in healthcare value have been challenged to collaborate in creating high-impact lists of “low-value” interventions and designing effective tools to measure their impact on clinical practice and costs.5
We initially developed a report card with five metrics derived from the CWC-SHM pediatric recommendations to help individual institutions and group practices to measure their performance and benchmark their results with peers.6 The report card is available for hospital members of the Children’s Hospital Association (CHA).7
The current study analyzes the frequency of utilization and trends of five metrics included in the CHA/Pediatric Health Information System® (PHIS) CWC report card in tertiary children’s hospitals in the United States. We analyzed data from five years before and five years after the CWC-PHM recommendations were published in 2013. We hypothesize that the publication and dissemination of the CWC-PHM recommendations—the intervention—will result in either an immediate decrease in the use of the “low-value” services studied and/or a change in the trend of utilization over time.
METHODS
Study Design
We conducted an observational, longitudinal retrospective study aimed at evaluating the impact of the CWC-PHM recommendations on clinical practice in tertiary children’s hospitals in the US.
Study Population
The population included inpatient and observation stays for children aged 0-18 years admitted to the 36 children’s hospitals consistently providing data from 2008 to 2017 to the PHIS administrative database (CHA, Lenexa, Kansas). This database contains inpatient, emergency department, ambulatory, and observation encounter–level data from more than 50 not-for-profit, tertiary care pediatric hospitals and accounts for ~20% of all pediatric hospitalizations in the US every year.
A joint effort between the CHA and the participating hospitals ensures the quality of the data submitted, as previously described.8 These data are subjected to a routine quality check with each submission and within each report. Data were fully deidentified for this study. In total, 36 PHIS hospitals met the strict quality standards for inclusion of submitted data. The remaining hospitals were excluded because they did not have complete data or had incomplete billing information.
For external benchmarking purposes, PHIS participating hospitals provide encounter data, including demographics, diagnoses, and procedures (International Classification of Diseases versions 9 and 10).9,10 The transition from ICD-9 to ICD-10 in the US took place during the study period. However, the CHA completed a process of translating and mapping all ICD-9 codes to every possible equivalent ICD-10 code in the PHIS database. Thus, the change from ICD-9 to ICD-10 should not have had any significant effect on population definition and data analytics, including trend analysis.
For each condition, the study population was divided into the following two cohorts for comparison of the trends: all admissions from January 1, 2008 to December 31, 2012 (before) and all admissions from January 1, 2013 to December 31, 2017 (after) the CWC-PHM recommendations were published.
This study was determined to be nonhuman subject research and was therefore exempted by Nicklaus Children’s Hospital Human Research Protection Program.
Outcomes
The outcomes for this study were the percentages of patients receiving the not-recommended “low-value” services targeted by the CWC-PHM recommendations. For this purpose, four of the five recommendations were translated into the following five metrics, operationalized in the PHIS database and displayed in the “Choosing Wisely” report card:6
1. Percentage of patients with uncomplicated asthma receiving chest radiograph (CXR).
2. Percentage of patients with uncomplicated bronchiolitis receiving CXR.
3. Percentage of patients with uncomplicated bronchiolitis receiving bronchodilators.
4. Percentage of patients with lower respiratory tract infection (LRTI) receiving systemic corticosteroids (relievers).
5. Percentage of patients with uncomplicated gastroesophageal reflux (GER) receiving acid suppressor therapy.
The fifth recommendation—limiting the use of continuous pulse oximetry unless the patient is receiving supplemental oxygen—could not be operationalized in the PHIS database because of inconsistent reporting of these resources.6
The resulting percentages represent nonadherence to the recommendations, suggesting overuse of the specific “low-value” intervention. As such, a decreasing trend over time is the desired direction of improvement.
The definition of “uncomplicated” conditions and the metrics are presented in Table 1. A complete list of the inclusion and exclusion criteria to define “uncomplicated” conditions and the complete list of the clinical translation codes used in PHIS to identify the “low-value” services are presented as an electronic supplement.
Statistical Analyses
We compared the demographic and clinical characteristics of the various cohorts before and after the release of the CWC-PHM recommendations—the intervention—using chi-square statistics. To assess the individual hospital-level trends over time for each measure, we modeled the patient-level data of each hospital using generalized linear mixed effects models with a binomial distribution. These models were adjusted for patient demographic and clinical factors that were found to be significantly different (P < .01) before and after the intervention on bivariate analyses. From these models, we generated adjusted estimates for the quarterly percentages for each hospital. We then conducted an interrupted time series (ITS) using these estimates to compare trends in the five years before (2008-2012) and five years after (2013-2017) the publication of the CWC-PHM recommendations. For the ITS analysis, we used a generalized linear mixed effects model with the quarterly adjusted hospital-level utilization rates of “low-value” services for each cohort as the unit of analysis and a random intercept for each hospital. The model used an autoregressive(1) covariance structure to account for autocorrelation. The ITS allowed us to test our hypothesis by assessing the following two important features: (a) if a significant decrease occurred right after the CWC-PHM recommendations were published (level-change) and/or (b) if the intervention altered the secular trend (slope-change). All statistical analyses were performed using SAS v. 9.4 (SAS Institute, Cary, North Carolina), and P values <.01 were considered to be statistically significant.
RESULTS
Table 2 presents the demographic characteristics of the cohorts before (2008-2012) and after (2013-2017) the publication of the CWC-PHM recommendations. Hospitalizations due to asthma represented the largest cohort with 142,067 cases, followed by hospitalizations due to bronchiolitis with 94,253 cases. Hospitalizations due to GER comprised the smallest cohort with 13,635 cases. Most of the children had government insurance and had “minor” severity according to the All Patient Revised Diagnosis Related Group (APR-DRG) system.
We found statistically significant differences in most of the demographic characteristics for the cohorts when comparing cases before and after the introduction of the CWC-PHM recommendations.
After adjusting for demographic characteristics, we estimated the percentages of the utilization of the “low-value” services from 2008 to 2017. We observed a steady decrease in overutilization of all services over time. The absolute percentage decrease was more evident in the reduction of the utilization of relievers by 36.6% and that of CXR by 31.5% for bronchiolitis. We also observed a 20.8% absolute reduction in the use of CXR for asthma.
The use of systemic steroids in LRTI revealed the lowest utilization among the “low-value” services studied, with 15.1% in 2008 and 12.2% in 2017, a 2.9% absolute reduction. However, the prescription of acid suppressors for GER showed the highest utilization among all the overuse metrics studied, ie, 63% in 2008 and 48.9% in 2017, with an absolute decrease of 24.1%. The yearly adjusted estimated percentages of utilization for each “low-value” service are presented in Appendix Table A.
Table 3 and the Figure (attached as supplemental online graphic) respectively present the risk-adjusted ITS parameter estimates and the graphic representation before and after the inception of the CWC-PHM recommendations for the trend analysis.
During the five years preceding the intervention (2008-2012), a statistically significant decrease (P < .01) was already noted in the trend of utilization of relievers and CXR in bronchiolitis and CXR in asthma. However, we found no significant change in the trend of the use of systemic corticosteroids in cases with LRTI or the use of acid suppression therapy for GER.
The immediate effect of the intervention is represented by the level change. We found a statistically significant (P < .01) reduction according to the CWC-PHM recommendations only for the use of CXR in hospitalized children with uncomplicated asthma.
During the five years after the CWC-PHM recommendations were published (2013-2017), a sustained, significant decrease in the trend of the use of CXR in asthma and bronchiolitis and the use of relievers in bronchiolitis (P < .01) was observed. However, there was no significant change in the trend of the use of systemic corticosteroids in cases with LRTI or in the use of acid suppression therapy for GER during this period.
Comparison of the trends before and after the publication of the CWC-PHM recommendations revealed that only the decreasing trend in the use of relievers for bronchiolitis over time significantly correlated with the campaign (P < .01).
DISCUSSION
We found a steady reduction in the frequency of overutilization of five “low-value” services described in the CWC-PHM recommendations from 2008 to 2017 in 36 tertiary children’s hospitals in the US. This trend was more evident in the utilization of relievers and CXR for bronchiolitis. The ITS analysis demonstrated that immediately after the publication of the CWC-PHM recommendations, only the use of CXR for asthma decreased significantly. Then, only the use of relievers for bronchiolitis decreased significantly over time in comparison with the secular trend.
These results support our hypothesis for two of the five metrics studied, suggesting that the publication of the CWC-PHM recommendations had a modest impact in clinical practices related to those services in tertiary children’s hospitals.
These findings align with a limited number of published studies that have consistently found a modest decrease in the use of “low-value” services before 201211-13 and a limited impact of the CWC in clinical practices on the use of “low-value” services after the inception of the campaign.14-17
For instance, in a cross-sectional analysis of the 1999 and 2009 samples of ambulatory care practices in the US, only two of 11 overuse quality indicators showed improvement.11 The authors recognized that reducing inappropriate care will require the same attention to guideline development and performance measurement that was directed at reducing the underuse of needed therapies. However, determining whether a patient received inappropriate care generally requires a much more detailed analysis of clinical information than what is required for assessments of underuse.11
Another study designed claims-based algorithms to measure the prevalence of 11 Choosing Wisely-identified “low-value” services in fee-for-service Medicare patients aged >65 years from 2006 to 2011.12 The annual prevalence of selected CWC “low-value” services ranged from 1.2% (upper urinary tract imaging in men with benign prostatic hyperplasia) to 46.5% (preoperative cardiac testing for low-risk, noncardiac procedures). The study concluded that identifying and measuring “low-value” health services is a prerequisite for improving quality and eliminating waste.12
In pediatric medicine, the authors investigated a large cohort of infants aged one to 24 months hospitalized with bronchiolitis to 41 tertiary children’s hospitals reporting data to the PHIS database from 2004 to 2012.13 The trend analysis revealed a decrease in the utilization of diagnostics and treatment interventions before the publication of the American Academy of Pediatrics 2006 Bronchiolitis Guidelines.18 There was an additional reduction in the use of CXR, steroids, and bronchodilators after the publication of the guidelines.13
After the CWC was launched in 2012, several surveys have demonstrated a tangible increase in awareness of the CWC and its goals, mostly among primary care physicians and subspecialists. Clinicians who were aware of the campaign found the recommendations to be useful as a legitimate source of guidance and were more likely to reduce the indication of unnecessary care and “low-value” clinical services included in the CWC.1,3,19,20
Few studies in adults have focused on measuring the trends in overuse metrics derived from the CWC recommendations.14-16 The initial studies have found limited reduction on the use of “low-value” care after the inception of the CWC. They suggest that clinician education, awareness, and public promotion alone do not appear to be sufficient to achieve widespread changes in clinical practice. Additional interventions are necessary for the wider implementation and success of the CWC recommendations.11,14,15,19,21,22
However, a more recent study was conducted in 91 academic centers from 2013 through 2016, before and after the publication of a CWC recommendation on the use of troponin-only testing for the diagnosis of acute myocardial infarction. Hospitals with low rates of troponin-only testing before the publication of the recommendation demonstrated a statistically significant increase over time in the rate of adherence. The authors postulated that the impact of the CWC might have been significant because of the increase in the institutional and provider attention to “high-value” care as a result of the campaign.16
In pediatrics, a cross-sectional study defined 20 “low-value” services from a list of more than 400 items from the CWC and other sources of highly regarded, evidence-based pediatrics healthcare recommendations. The list included six diagnostic tests, five imaging tests, and nine prescription drugs ordered in a robust cohort of 4.4 million children nationwide in 2014. The study concluded that approximately one in 10 children received a “low-value” service. The majority (59.4%) were related to prescription drugs, specifically the inappropriate use of antibiotics for a variety of conditions. The estimated combined cost of these unnecessary services was approximately $27 million, with one-third of the cost being paid out of pocket, arguing for significant financial harm. However, this study did not perform a trend analysis.17
Our results are comparable with these studies, reporting an initial increase in awareness and beliefs, followed by progressive changes in clinical practice among pediatric hospital-based clinicians in delivering evidence-based, high-value care after the CWC.
The attribution of the steady reduction in the absolute percentages of overuse/waste in the five metrics related to the CWC observed in this study, including the significant changes noted in two of the overuse indicators after the publication of the CWC-PHM recommendations, should be interpreted with caution. For example, the significant decrease in the use of “low-value” services in bronchiolitis could be attributed to multiple factors such as national guidelines released in 2014 after the campaign,23 national multicenter QI collaborative projects,24,25 and multiple local QI efforts.26,27 The increase in the awareness and impact of the CWC recommendations among pediatric providers could also be a contributing factor, but this association cannot be established in the light of our findings.
On the other hand, despite extensive evidence for the lack of efficacy and the potential harm associated with the use of acid suppressors for uncomplicated GER in infants,28-30 the frequency of this “low-value” therapeutic intervention remains high (~50%). The trend in utilization was not impacted by the CWC-PHM recommendations. This finding could be explained by several factors, including the possibility that several hospitalized patients may suffer from GER disease requiring acid suppressors. Another possibility is that acid suppressors are generally prescribed as an outpatient medication, and physicians treating inpatients may be reluctant to discontinue it during hospitalization. Nevertheless, this recommendation represents a target for review, update, and QI interventions in the near future.
The delivery of inappropriate “low-value” care represents the most significant dimension of waste in healthcare.31 The development of quality measures of “low-value” services representing overuse and waste is the most needed step toward assessing the magnitude of the problem. Overuse metrics could be incorporated into QI interventions to decrease the provision of such services. However, systematic efforts aimed at developing quality indicators of overuse based on the CWC recommendations have been limited. To our knowledge, this is the first study on the trends of metrics derived from the CWC recommendations in pediatric medicine.
Future research is needed to develop overuse metrics further to assess the specific outcomes related to the implementation of the CWC. How much has clinical practice changed as a result of the campaign? What are the outcomes and savings attributable to these efforts? These are critical questions for the immediate future that should be answered to sustain the ongoing efforts and results and to validate that the efforts are worthwhile.
This study has several limitations. First, this is a retrospective and observational study. It cannot prove a direct causal relationship between the publication of the CWC-PHM and the observed trends, as other potential factors may have contributed to the outcomes. Second, in administrative databases, the data quality is dependent on proper documentation and coding that may vary among reporting institutions. These data lack clinical information, and a fair assessment of “appropriateness” could be questioned. In addition, the study included only 36 academic, tertiary children’s hospitals. Because approximately two-thirds of all pediatric hospitalizations in the US occur in community settings,32 this study may not fully represent clinical practice in the majority of pediatric hospitalizations in the US. Finally, the validity of the ITS analysis has inherent limitations due to the variability of the data in some metrics that may affect the power of the analysis. This fact could lead to inaccurate conclusions regarding intervention effectiveness due to the data-driven model applied, as well as the lack of control for other time-varying confounders.33
CONCLUSIONS
After seven years, the CWC faces important challenges. Critical to the success of the campaign is to “measure wisely” by developing quality indicators of overuse and operationalizing them into administrative and clinical data sources to assess the impact on clinical practice. Our study highlights some limited but steady reduction in the use of some “low-value” services before the campaign. It also demonstrates a modest impact of the campaign on clinical practices in tertiary care children’s hospitals in the US. Clinicians and institutions still have a long way to go in reducing the use of “low-value” interventions in pediatric medicine. These observations challenge us to step up our efforts to implement QI interventions aimed at incorporating these professional, society-endorsed recommendations into our clinical practice.
Acknowledgments
The authors thank Dr. Kristine De La Torre and Dr. Jennifer McCafferty-Fernandez and the Research Institute of Nicklaus Children’s Hospital for medical writing assistance. They also acknowledge Tatiana Consuegra, library technician, for her clerical assistance in the preparation and submission of this article.
1. Choosing Wisely. Choosing Wisely Campaign Official Site. http://www.choosingwisely.org/. Accessed May 2019.
2. Quinonez RA, Garber MD, Schroeder AR, et al. Choosing wisely in pediatric hospital medicine: five opportunities for improved healthcare value. J Hosp Med. 2013;8(9):479-485. https://doi.org/10.1002/jhm.2064.
3. ABIM Foundation CR. Choosing Wisely: A Special Report on the First Five Years. http://www.choosingwisely.org/choosing-wisely-a-special-report-on-the-first-five-years/. Updated 2017. Accessed May 2019.
4. Wolfson D, Santa J, Slass L. Engaging physicians and consumers in conversations about treatment overuse and waste: a short history of the choosing wisely campaign. Acad Med. 2014;89(7):990-995. https://doi.org/10.1097/ACM.0000000000000270.
5. Morden NE, Colla CH, Sequist TD, Rosenthal MB. Choosing wisely—the politics and economics of labeling low-value services. N Engl J Med. 2014;370(7):589-592. https://doi.org/10.1056/NEJMp1314965.
6. Reyes M, Paulus E, Hronek C, et al. Choosing wisely campaign: Report card and achievable benchmarks of care for children’s hospitals. Hosp Pediatr. 2017;7(11):633-641. https://doi.org/10.1542/hpeds.2017-0029.
7. Report Cards. Choosing Wisely Measures - Pediatric Hospital Medicine Detail Reports. Children’s Hospital Association Web site. https://www.childrenshospitals.org/. Accessed May 2019.
8. Mongelluzzo J, Mohamad Z, Ten Have TR, Shah SS. Corticosteroids and mortality in children with bacterial meningitis. JAMA. 2008;299(17):2048-2055. https://doi.org/10.1001/jama.299.17.2048.
9. Buck CJ. 2013 ICD 9 CM for Physicians, Volumes 1 & 2. Chicago, IL: American Medical Association; 2013.
10. Buck CJ. 2018 ICD-10-CM for Physicians. Chicago, IL: American Medical Association; 2018.
11. Kale MS, Bishop TF, Federman AD, Keyhani S. Trends in the overuse of ambulatory health care services in the United States. JAMA Inter Med. 2013;173(2):142-148. https://doi.org/10.1001/2013.jamainternmed.1022.
12. Colla CH, Morden NE, Sequist TD, Schpero WL, Rosenthal MB. Choosing wisely: Prevalence and correlates of low-value health care services in the United States. J Gen Intern Med. 2015;30(2):221-228. https://doi.org/10.1007/s11606-014-3070-z
13. Parikh K, Hall M, Teach SJ. Bronchiolitis management before and after the AAP guidelines. Pediatrics. 2014;133(1): e1-7. https://doi.org/10.1542/peds.2013-2005.
14. Rosenberg A, Agiro A, Gottlieb M, et al. Early trends among seven recommendations from the Choosing Wisely campaign. JAMA Inter Med. 2015;175(12):1913-1920. https://doi.org/10.1001/jamainternmed.2015.5441.
15. Reid RO, Rabideau B, Sood N. Low-value health care services in a commercially insured population. JAMA Inter Med. 2016;176(10):1567-1571. https://doi.org/10.1001/jamainternmed.2016.5031.
16. Prochaska MT, Hohmann SF, Modes M, Arora VM. Trends in troponin-only testing for AMI in academic teaching hospitals and the impact of choosing wisely(R). J Hosp Med. 2017;12(12):957-962. https://doi.org/10.12788/jhm.2846.
17. Chua KP, Schwartz AL, Volerman A, Conti RM, Huang ES. Use of low-value pediatric services among the commercially insured. Pediatrics. 2016;138(6):e20161809. https://doi.org/10.1542/peds.2016-1809.
18. American Academy of Pediatrics Subcommittee on Diagnosis and Management of Bronchiolitis. Diagnosis and management of bronchiolitis. Pediatrics. 2006;118(4):1774-1793.
19. Colla CH, Kinsella EA, Morden NE, Meyers DJ, Rosenthal MB, Sequist TD. Physician perceptions of Choosing Wisely and drivers of overuse. Am J Manag Care. 2016;22(5):337-343.
20. PerryUndem Research/Communication AF. DataBrief: Findings from a National Survey of Physicians. http://www.choosingwisely.org/wp-content/uploads/2017/10/Summary-Research-Report-Survey-2017.pdf. Updated 2017.
21. Wolfson D. Choosing wisely recommendations using administrative claims data. JAMA Inter Med. 2016;176(4):565. https://doi.org/10.1001/jamainternmed.2016.0357.
22. Heekin AM, Kontor J, Sax HC, Keller M, Wellington A, Weingarten S. Choosing wisely clinical decision support adherence and associated patient outcomes. Am J Manag Care. 2018;24(8):361-366.
23. Ralston SL, Lieberthal AS, Meissner HC, et al. Clinical practice guideline: the diagnosis, management, and prevention of bronchiolitis. Pediatrics. 2014;134(5):e1474-e502. https://doi.org/10.1542/peds.2014-2742.
24. Ralston SL, Garber MD, Rice-Conboy E, et al. A multicenter collaborative to reduce unnecessary care in inpatient bronchiolitis. Pediatrics. 2016;137(1):e20150851. https://doi.org/10.1542/peds.2015-0851.
25. Mussman GM, Lossius M, Wasif F, et al. Multisite emergency department inpatient collaborative to reduce unnecessary bronchiolitis care. Pediatrics. 2018;141(2):e20170830. https://doi.org/10.1542/peds.2017-0830.
26. Mittal V, Hall M, Morse R, et al. Impact of inpatient bronchiolitis clinical practice guideline implementation on testing and treatment. J Pediatr. 2014;165(3):570-576. https://doi.org/10.1016/j.jpeds.2014.05.021.
27. Tyler A, Krack P, Bakel LA, et al. Interventions to reduce over-utilized tests and treatments in bronchiolitis. Pediatrics. 2018;141(6):e20170485. https://doi.org/10.1542/peds.2017-0485.
28. Rosen R, Vandenplas Y, Singendonk M, et al. Pediatric gastroesophageal reflux clinical practice guidelines: joint recommendations of the North American Society for Pediatric Gastroenterology, Hepatology, and Nutrition and the European Society for Pediatric Gastroenterology, Hepatology, and Nutrition. J Pediatr Gastroenterol Nutr. 2018;66(3):516-554. https://doi.org/10.1097/MPG.0b013e3181b7f563.
29. Eichenwald EC, COMMITTEE ON FETUS AND NEWBORN. Diagnosis and management of gastroesophageal reflux in preterm infants. Pediatrics. 2018;142(1):e20181061. https://doi.org/10.1542/peds.2018-1061
30. van der Pol RJ, Smits MJ, van Wijk MP, Omari TI, Tabbers MM, Benninga MA. Efficacy of proton-pump inhibitors in children with gastroesophageal reflux disease: a systematic review. Pediatrics. 2011;127(5):925-935. https://doi.org/10.1542/peds.2010-2719.
31. IOM Report: Estimated $750B Wasted Annually In Health Care System. Kaiser Health News Web site. https://khn.org/morning-breakout/iom-report/. Updated 2012. Accessed May 2019.
32. Leyenaar JK, Ralston SL, Shieh M, Pekow PS, Mangione‐Smith R, Lindenauer PK. Epidemiology of pediatric hospitalizations at general hospitals and freestanding children’s hospitals in the United States. J Hosp Med. 2016;11(11):743-749. https://doi.org/10.1002/jhm.2624.
33. Bernal JL, Cummins S, Gasparrini A. Interrupted time series regression for the evaluation of public health interventions: a tutorial. Int J Epidemiol. 2017;46(1):348-355. https://doi.org/10.1093/ije/dyw098.
1. Choosing Wisely. Choosing Wisely Campaign Official Site. http://www.choosingwisely.org/. Accessed May 2019.
2. Quinonez RA, Garber MD, Schroeder AR, et al. Choosing wisely in pediatric hospital medicine: five opportunities for improved healthcare value. J Hosp Med. 2013;8(9):479-485. https://doi.org/10.1002/jhm.2064.
3. ABIM Foundation CR. Choosing Wisely: A Special Report on the First Five Years. http://www.choosingwisely.org/choosing-wisely-a-special-report-on-the-first-five-years/. Updated 2017. Accessed May 2019.
4. Wolfson D, Santa J, Slass L. Engaging physicians and consumers in conversations about treatment overuse and waste: a short history of the choosing wisely campaign. Acad Med. 2014;89(7):990-995. https://doi.org/10.1097/ACM.0000000000000270.
5. Morden NE, Colla CH, Sequist TD, Rosenthal MB. Choosing wisely—the politics and economics of labeling low-value services. N Engl J Med. 2014;370(7):589-592. https://doi.org/10.1056/NEJMp1314965.
6. Reyes M, Paulus E, Hronek C, et al. Choosing wisely campaign: Report card and achievable benchmarks of care for children’s hospitals. Hosp Pediatr. 2017;7(11):633-641. https://doi.org/10.1542/hpeds.2017-0029.
7. Report Cards. Choosing Wisely Measures - Pediatric Hospital Medicine Detail Reports. Children’s Hospital Association Web site. https://www.childrenshospitals.org/. Accessed May 2019.
8. Mongelluzzo J, Mohamad Z, Ten Have TR, Shah SS. Corticosteroids and mortality in children with bacterial meningitis. JAMA. 2008;299(17):2048-2055. https://doi.org/10.1001/jama.299.17.2048.
9. Buck CJ. 2013 ICD 9 CM for Physicians, Volumes 1 & 2. Chicago, IL: American Medical Association; 2013.
10. Buck CJ. 2018 ICD-10-CM for Physicians. Chicago, IL: American Medical Association; 2018.
11. Kale MS, Bishop TF, Federman AD, Keyhani S. Trends in the overuse of ambulatory health care services in the United States. JAMA Inter Med. 2013;173(2):142-148. https://doi.org/10.1001/2013.jamainternmed.1022.
12. Colla CH, Morden NE, Sequist TD, Schpero WL, Rosenthal MB. Choosing wisely: Prevalence and correlates of low-value health care services in the United States. J Gen Intern Med. 2015;30(2):221-228. https://doi.org/10.1007/s11606-014-3070-z
13. Parikh K, Hall M, Teach SJ. Bronchiolitis management before and after the AAP guidelines. Pediatrics. 2014;133(1): e1-7. https://doi.org/10.1542/peds.2013-2005.
14. Rosenberg A, Agiro A, Gottlieb M, et al. Early trends among seven recommendations from the Choosing Wisely campaign. JAMA Inter Med. 2015;175(12):1913-1920. https://doi.org/10.1001/jamainternmed.2015.5441.
15. Reid RO, Rabideau B, Sood N. Low-value health care services in a commercially insured population. JAMA Inter Med. 2016;176(10):1567-1571. https://doi.org/10.1001/jamainternmed.2016.5031.
16. Prochaska MT, Hohmann SF, Modes M, Arora VM. Trends in troponin-only testing for AMI in academic teaching hospitals and the impact of choosing wisely(R). J Hosp Med. 2017;12(12):957-962. https://doi.org/10.12788/jhm.2846.
17. Chua KP, Schwartz AL, Volerman A, Conti RM, Huang ES. Use of low-value pediatric services among the commercially insured. Pediatrics. 2016;138(6):e20161809. https://doi.org/10.1542/peds.2016-1809.
18. American Academy of Pediatrics Subcommittee on Diagnosis and Management of Bronchiolitis. Diagnosis and management of bronchiolitis. Pediatrics. 2006;118(4):1774-1793.
19. Colla CH, Kinsella EA, Morden NE, Meyers DJ, Rosenthal MB, Sequist TD. Physician perceptions of Choosing Wisely and drivers of overuse. Am J Manag Care. 2016;22(5):337-343.
20. PerryUndem Research/Communication AF. DataBrief: Findings from a National Survey of Physicians. http://www.choosingwisely.org/wp-content/uploads/2017/10/Summary-Research-Report-Survey-2017.pdf. Updated 2017.
21. Wolfson D. Choosing wisely recommendations using administrative claims data. JAMA Inter Med. 2016;176(4):565. https://doi.org/10.1001/jamainternmed.2016.0357.
22. Heekin AM, Kontor J, Sax HC, Keller M, Wellington A, Weingarten S. Choosing wisely clinical decision support adherence and associated patient outcomes. Am J Manag Care. 2018;24(8):361-366.
23. Ralston SL, Lieberthal AS, Meissner HC, et al. Clinical practice guideline: the diagnosis, management, and prevention of bronchiolitis. Pediatrics. 2014;134(5):e1474-e502. https://doi.org/10.1542/peds.2014-2742.
24. Ralston SL, Garber MD, Rice-Conboy E, et al. A multicenter collaborative to reduce unnecessary care in inpatient bronchiolitis. Pediatrics. 2016;137(1):e20150851. https://doi.org/10.1542/peds.2015-0851.
25. Mussman GM, Lossius M, Wasif F, et al. Multisite emergency department inpatient collaborative to reduce unnecessary bronchiolitis care. Pediatrics. 2018;141(2):e20170830. https://doi.org/10.1542/peds.2017-0830.
26. Mittal V, Hall M, Morse R, et al. Impact of inpatient bronchiolitis clinical practice guideline implementation on testing and treatment. J Pediatr. 2014;165(3):570-576. https://doi.org/10.1016/j.jpeds.2014.05.021.
27. Tyler A, Krack P, Bakel LA, et al. Interventions to reduce over-utilized tests and treatments in bronchiolitis. Pediatrics. 2018;141(6):e20170485. https://doi.org/10.1542/peds.2017-0485.
28. Rosen R, Vandenplas Y, Singendonk M, et al. Pediatric gastroesophageal reflux clinical practice guidelines: joint recommendations of the North American Society for Pediatric Gastroenterology, Hepatology, and Nutrition and the European Society for Pediatric Gastroenterology, Hepatology, and Nutrition. J Pediatr Gastroenterol Nutr. 2018;66(3):516-554. https://doi.org/10.1097/MPG.0b013e3181b7f563.
29. Eichenwald EC, COMMITTEE ON FETUS AND NEWBORN. Diagnosis and management of gastroesophageal reflux in preterm infants. Pediatrics. 2018;142(1):e20181061. https://doi.org/10.1542/peds.2018-1061
30. van der Pol RJ, Smits MJ, van Wijk MP, Omari TI, Tabbers MM, Benninga MA. Efficacy of proton-pump inhibitors in children with gastroesophageal reflux disease: a systematic review. Pediatrics. 2011;127(5):925-935. https://doi.org/10.1542/peds.2010-2719.
31. IOM Report: Estimated $750B Wasted Annually In Health Care System. Kaiser Health News Web site. https://khn.org/morning-breakout/iom-report/. Updated 2012. Accessed May 2019.
32. Leyenaar JK, Ralston SL, Shieh M, Pekow PS, Mangione‐Smith R, Lindenauer PK. Epidemiology of pediatric hospitalizations at general hospitals and freestanding children’s hospitals in the United States. J Hosp Med. 2016;11(11):743-749. https://doi.org/10.1002/jhm.2624.
33. Bernal JL, Cummins S, Gasparrini A. Interrupted time series regression for the evaluation of public health interventions: a tutorial. Int J Epidemiol. 2017;46(1):348-355. https://doi.org/10.1093/ije/dyw098.
© 2019 Society of Hospital Medicine
Implementing Pediatric Asthma Pathways in Community Hospitals: A National Qualitative Study
Despite the widespread availability of evidence-based guidelines,1 there is inappropriate variation in the care and outcomes for children with asthma in both the emergency department (ED) and the inpatient setting.2-6 Operational versions of evidence-based guidelines known as “pathways” have been shown to improve adoption of evidence-based guidelines, quality of care, and health outcomes for children with asthma.7-14 However, little is known about how to successfully implement pathways outside of free-standing children’s hospitals.15-19
The majority of children with asthma in the United States are cared for in community hospitals, which provide services for both adults and children.20 However, prior studies of pediatric asthma pathways have largely excluded community hospitals. These studies primarily focused on determining clinical effectiveness, rather than detailing the implementation process. These approaches have left critical gaps that hinder our ability to implement pathways and improve care in community hospitals, which have unique barriers and less resources.21,22 Therefore, understanding the process of pathway implementation in community hospitals is critical to improving care for children.22 Our objective was to identify the key determinants of successful pediatric asthma pathway implementation using a national sample of community hospitals. This knowledge can guide hospital leaders and healthcare providers in efforts to improve pediatric care and outcomes in these settings.
METHODS
Study Setting, Design, and Population
In Fall 2017, the Value in Inpatient Pediatrics (VIP) network launched PIPA, Pathways to Improving Pediatric Asthma care.23 The VIP network, a part of the American Academy of Pediatrics (AAP), aims to improve the value of care delivered to any pediatric patient in a hospital bed, from rural to free-standing children’s hospitals.24 PIPA used a learning collaborative model25 and recruited local project leaders (physicians, nurses, respiratory therapists (RT), and pharmacists) from 89 hospitals around the country. PIPA provided these hospital teams with asthma pathways and several resources for implementation support, including educational meetings, quality improvement (QI) training, audit and feedback, and facilitation. Facilitation is a process of interactive problem-solving and support that occurs in the context of a supportive interpersonal relationship and a recognized need for improvement.26 A facilitator, or a “coach”, is an external expert who provides project mentorship and assists the process of making meaningful changes to improve patient care.26 Facilitation was provided by external consultants with QI expertise.
For this qualitative study, facilitators conducted semi-structured interviews with a convenience sample of project leaders from community hospitals participating in PIPA, with some interviews including multiple project leaders (eg, nursing, inpatient, and Emergency Department [ED] leaders). Verbal consent was obtained from all participants. No incentives were provided. This study was approved by the AAP institutional review board.
Data Collection
We used the constructs described in the Consolidated Framework for Implementation Research (CFIR)27 and adapted those salient to pediatric asthma pathways to develop an interview guide that was used with all participants (Appendix 1). The CFIR offers an overarching typology to understand what works where and why across five major domains that influence implementation: intervention characteristics, inner setting (hospital), outer setting (economic, political, and social context of the hospital), characteristics of the individuals involved, and the process of implementation. Data were collected across these domains to inform our analysis of the key determinants of pediatric asthma pathway implementation in community hospitals.
Interviews were conducted by phone from December 2017 to April 2018 (first four months of pathway implementation). Interviews lasted 30-60 minutes and were recorded and transcribed verbatim. Transcripts were edited for accuracy using the audio recordings. As data collection occurred concurrently with analysis, the interview guide was iteratively revised to reflect new insights and patterns that emerged from our analysis. All sites were anonymized in the data analysis. New interviews were coded until thematic saturation was reached.
Analysis
We conducted an inductive thematic analysis using the CFIR as our conceptual framework.28,29 Four investigators (CM, MJ, ES, and SK) performed the initial open coding of the data. Investigators met twice during the open coding process to develop and then finalize a codebook of standard definitions for codes. This codebook facilitated coding consistency through the remainder of the analytic process. Two investigators (CM and MJ) then independently read and coded all data to ensure intercoder reliability. During this process, CM and MJ met every two weeks to compare coding consistency, resolve discrepancies, and discuss preliminary findings. When the coding was complete, all investigators met to explore and develop themes that encompassed related common codes.
The CFIR was used at two stages of the study: (1) developing the interview guide and (2) cross-checking for any potentially important codes that were missing/needed to be explored further. Thus, the investigators maintained an inductive approach grounded in the data. To assure study rigor, we employed investigator triangulation (use of multiple investigators and participants from multiple clinical roles) and reflexivity (ongoing critique and critical reflection of the individual biases of the investigators).30 Coding was performed using Dedoose (version 7.0.23; Los Angeles, California).
RESULTS
A total of 34 community hospitals completed the PIPA project, of which the project leaders of 25 hospitals connected with the facilitators and were approached to participate; 18 (72%) hospitals’ project leaders participated in the study. We analyzed 18 interviews conducted between facilitators and project leaders, which included a total of 32 project leaders (one to five leaders per interview). The hospitals represented were diverse in geographic location and size (range 4-50 pediatric beds per hospital), and the majority of sites (78%) supported the trainees (Table 1).
We identified four overarching themes that described the key determinants of pathway implementation in community hospitals. These themes are presented in order of their frequency of occurrence in the data. They included (1) building an implementation infrastructure, (2) engaging and motivating providers, (3) addressing organizational and resource limitations, and (4) devising implementation solutions with facilitators. Descriptions and exemplary quotations for each theme are provided in Table 2 and Appendix Figure 1.
Building an Implementation Infrastructure
“So, I’m going to sit down with the primary nursing staff and the other four physicians in the group to go over the expectations…We’re not going to have the actual EMR [changes] and we’re not going to have the nursing documentation field built right away but [we want to] make sure that people are documenting the respiratory score in their generic nursing note so that the information is easily accessible.” (Physician leader, Hospital G)
Participants also described the need to deliver education on the evidence supporting changes in practice and skills training specific to pediatric asthma care:
“Once we realized that we were going to be doing this pathway, we started training our nurses on the inpatient side on [pediatric respiratory scoring].” (Nursing leader, Hospital P)
In addition, pathway implementation required modification of clinical workflows via changes to hospital policies or guidelines, electronic medical records (EMR), and/or the physical environment (eg, placing supplies in proximity to care delivery):
“I think it can help if we could get an order set or a nursing protocol where asthmatics over a certain severity can just get steroids in triage.” (Physician leader, Hospital A)
Engaging and Motivating Providers
Another crucial step in pathway implementation was engaging and motivating providers. This included overcoming inertia to practice change, facilitating multidisciplinary collaboration, and handling conflicts regarding practice changes. Participants discussed the excitement of participating in a national collaborative as especially motivating to help drive engagement and overcome barriers to change, particularly the ability to compare local hospital performance to national peers.
“I think everyone is a little competitive. So I think that when we see how we compare to other institutions—both our group and the ER—I think it also adds a little oomph…I think for our nurses too; we’re able to say, ‘[look how we compare to] most of the other hospitals.’ I think that helps.” (Physician leader, Hospital B)
Multidisciplinary collaboration across a wide variety of frontline pediatric and nonpediatric providers was key to understanding current workflows and identifying needed modifications for pathway implementation:
“I do think clearly our biggest obstacles are the fact that we have adult ED providers. We have the opportunity on the inpatient side [with nursing and respiratory therapy], who really do awesome with pediatric changes, to take our wins where we can and make the changes with the ED. In the ED we have an RN educator. She’s very on board with doing the respiratory scoring and getting this whole thing started.” (Physician leader, Hospital L)
Intentional communication and leadership skills also played key roles in engaging hesitant providers and handling conflict:
“Just sitting and talking with our respiratory therapist about the ability to provide this type of service or support and seeing what their reservations have been, at least it’s open to conversation so that we could provide these types of therapies in the future and we’re able to see like what people’s concerns are. I think just basically increasing familiarity with not only these processes, but different types of therapy will hopefully in the future help us provide better care to our patients.” (Physician leader, Hospital Q)
Addressing Organizational and Resource Limitations
Participants recognized organizational and resource limitations, some of which may be unique to community hospitals that prioritize resources for adult care. The limitations described included EMR staff support, healthcare provider staffing/capacity, navigating IRBs, and addressing administrative processes. Competing demands for information technology staff support and lack of prioritization of pediatric-specific initiatives often hindered efforts to modify the EMR.
“Resource wise, we are hoping to implement an order set in our Epic EMR, [but] finding the availability from the Epic team may be a challenge.” (Physician Leader, Hospital A)
Participants also reported that limited staff capacity (eg, nursing, RT) hindered pathway implementation efforts. This limited capacity hindered workflow changes and limited the time available for education and training on pathways:
“[Respiratory scoring for asthma is] an added responsibility for the [nursing] staff and we don’t have patient technicians. So they’re doing everything from changing the sheets to bringing water to all of the medical patients. So, that I think may be a barrier.” (Physician leader, Hospital B)
Across sites, navigating the IRB posed various challenges. Some sites were required to obtain approval from regional IRBs, which did not have resources to devote to pediatric projects. Other sites did not have IRBs at all, but instead required separate approvals for the project from hospital leadership or other entities:
“On the IRB, I contacted the manager of the IRB and she’s said, ‘No, it’s not an IRB project,’ but she sent it to another director for review, and it took forever to be able to get a data agreement with [the local university hospital] so that we can pull the data. I just couldn’t believe it took months to get done.” (Physician Leader, Hospital K)
Finally, administrative barriers such as addressing formulary changes in the context of adult-focused settings were challenging. For example, at one hospital, metered dose inhalers (MDIs) were not used for adult patients, and the hospital administration was resistant to incorporate their use into practice for pediatric patients due to the cost of such changes.
“The [general hospital] didn’t have MDI’s anymore because of cost reasons, and when we started the pediatric work, we really made it a point to get the MDI’s for pediatric patients back in the formulary.” (Physician leader, Hospital A)
Devising Implementation Solutions with Practice Facilitators
Participants often devised pathway implementation solutions with facilitators in-the-moment during meetings. This problem-solving included figuring out work-arounds, proactive coaching by external facilitators, and just-in-time solution building. Furthermore, in meetings that included more than one project leader, leaders would often work with each other to devise solutions. Meetings provided forums that stimulated identification of implementation barriers, brainstorming, and subsequently solution building.
Physician leader: I’m wondering if we could, as an interim solution, try out an algorithm on paper, I don’t know if that’s allowed, until we get Epic approval. Do you know?
Nurse Leader: You mean having an algorithm posted in triage? Yeah, I don’t see why not. (Hospital A)
Next, problem solving was often driven by the facilitator’s experience and knowledge, drawn from their interactions with other collaborative sites or their own prior experiences with asthma, QI, or pathway implementation. The facilitators brought an outside perspective, not bound by that particular hospital’s local culture or structural intricacies. This proactive coaching spurred the identification of creative, yet practical solutions:
Project Leader: We’re still trying to get all our templates [for the EMR]…because [currently they are] all adult templates.
Facilitator: If you’re making templates right now, could you also add the three asterisks? Like smoking or exposure to second hand tobacco smoke or marijuana…then have the three asterisks there and then “Referral made?***”. That would force people to document in a certain place in the template as well.Project Leader: That’s definitely something we could add right now. (Hospital O)
Check-in meetings with facilitators offered an opportunity to trouble shoot, brainstorm work-arounds, devise in-the-moment site-specific solutions to enable successful pathway implementation, and provide ongoing support throughout implementation.
DISCUSSION
Pathways can improve the quality of care for children with asthma.31 However, there is little evidence-based guidance on how to implement pathways and improve pediatric care in community hospitals,17-20 where the majority of children are cared for nationally. This is the first study to our knowledge that details the key determinants of pediatric asthma pathway implementation in community hospital settings. We identified four key determinants of implementation that can help guide others in similar settings. These include building an implementation infrastructure, engaging and motivating multidisciplinary providers, addressing organizational and resource limitations, and using external facilitators to devise implementation solutions.
Existing frameworks such as the CFIR outline the potential determinants of implementation success but do not provide population- or setting-specific guidance.27 There have been prior studies detailing pathway implementation for pediatric populations, but these studies did not focus on community hospitals.32,33 Our findings align with these prior studies, which highlight the importance of identifying implementation champions, engaging and motivating multidisciplinary providers, establishing a QI infrastructure, and addressing organizational and resource limitations, such as EMR integration.32,33 However, our study provides unique insights into issues that are important to successful pathway implementation in community hospitals, including engagement of adult-focused healthcare providers, reprioritization of resources toward the care of children, and the potentially critical role of external facilitators.
Our findings indicate that community hospitals seeking to improve care for children may particularly benefit from using external facilitators and/or partnering with external organizations. We found that external facilitators played a significant and proactive role in community hospitals’ efforts to improve care for children. Facilitators helped devise work-arounds and engaged in just-in-time solution building with local project leaders. For instance, facilitators helped develop strategies for training healthcare providers in performing new clinical tasks, building reminders of pathway recommendations into clinical workflows, and overcoming resource barriers. Thus, community hospitals may uniquely benefit from participation in national learning collaboratives, which often provide avenues for external facilitation.25,34,35 National networks, such as the VIP network, lead national learning collaboratives that provide external facilitation as well as other resources (eg, educational materials, data analysis support) to community hospitals seeking to improve pediatric care.24 Previous work by McDaniel et al. identified that intentional partnerships between children’s and community hospitals can also potentially provide access to resources for education and training in pediatric care and support in navigating organizational and resource challenges.22
Our results characterize the key determinants of pediatric asthma pathway implementation using a national sample of community hospitals that were diverse in geography, size, and structure. This imparts greater transferability of our findings. We also used strategies to promote the rigor of our findings, including triangulation and reflexivity. However, our study has several limitations. First, we analyzed only the meetings that occurred during the early months of pathway implementation. As such, we did not capture any key determinants that may have arisen later in implementation. However, process analyses of implementation indicate that the majority of implementation efforts occurred within these first three to four months.36 Second, we did not elicit input from hospital administration or leadership. The lack of administrative/leadership input probably affected the CFIR themes we found, as no themes from the outer setting were elicited. However, the goal of our study was to characterize the experiences of those leading implementation efforts, and focusing on these leaders allows our work to better guide those doing similar work in the future. Third, we used CFIR to guide the development of our interview guide and as a reference during analysis, which may have skewed our findings to preferentially reflect CFIR constructs. However, our overall analysis was grounded in the primary data and we employed reflexivity during all stages of our analysis. In addition, having the facilitators conduct the qualitative interviews may have biased our findings toward the perspectives of the facilitators; however, the facilitators represented quite diverse clinical and QI backgrounds. Finally, our findings do not necessarily correlate with improvements in clinical outcomes. As such, they are not meant to serve as explicit recommendations for improving patient outcomes, but rather as a characterization of the context, processes, and experiences of implementing pathways in the community setting to inform others doing this important work.
CONCLUSIONS
We identified the key determinants of pediatric asthma pathway implementation in community hospitals, which may help inform QI efforts in these settings. We also identified organizational and resource limitations that are probably unique to these adult-focused hospitals. Participating in national learning collaboratives and/or working with facilitators may support pathway implementation and improved quality of care for children with asthma in community hospitals.
Future work should seek to correlate these and other determinants of pathway implementation with health outcomes for hospitalized children, as well as integrate broader and more diverse samples of community hospitals.
1. National Asthma E, Prevention P. Expert Panel Report 3 (EPR-3): Guidelines for the diagnosis and management of asthma-summary report 2007. J Allergy Clin Immunol. 2007;120(5):S94-S138. https://doi.org/10.1016/j.jaci.2007.09.043.
2. Bekmezian A, Hersh AL, Maselli JH, Cabana MD. Pediatric emergency departments are more likely than general emergency departments to treat asthma exacerbation with systemic corticosteroids. J Asthma. 2011;48(1):69-74. https://doi.org/10.3109/02770903.2010.535884.
3. Biagini Myers JM, Simmons JM, Kercsmar CM, et al. Heterogeneity in asthma care in a statewide collaborative: the Ohio Pediatric Asthma Repository. Pediatrics. 2015;135(2):271-279. https://doi.org/10.1542/peds.2014-2230.
4. Kharbanda AB, Hall M, Shah SS, et al. Variation in resource utilization across a national sample of pediatric emergency departments. J Pediatr. 2013;163(1):230-236. https://doi.org/10.1016/j.jpeds.2012.12.013.
5. O’Con
6. Lougheed MD, Garvey N, Chapman KR, et al. Variations and gaps in management of acute asthma in Ontario emergency departments. Chest. 2009;135(3):724-736. https://doi.org/10.1378/chest.08-0371.
7. Bekmezian A, Fee C, Weber E. Clinical pathway improves pediatrics asthma management in the emergency department and reduces admissions. J Asthma. 2015;52(8):806-814. https://doi.org/10.3109/02770903.2015.1019086.
8. Chen KH, Chen CC, Liu HE, Tzeng PC, Glasziou PP. Effectiveness of paediatric asthma clinical pathways: a narrative systematic review. J Asthma. 2014;51(5):480-492. https://doi.org/10.3109/02770903.2014.887728.
9. Johnson KB, Blaisdell CJ, Walker A, Eggleston P. Effectiveness of a clinical pathway for inpatient asthma management. Pediatrics. 2000;106(5):1006-1012. https://doi.org/10.1542/peds.106.5.1006.
10. Kelly CS, Andersen CL, Pestian JP, et al. Improved outcomes for hospitalized asthmatic children using a clinical pathway. Ann Allergy Asthma Immunol. 2000;84(5):509-516. https://doi.org/10.1016/S1081-1206(10)62514-8.
11. McDowell KM, Chatburn RL, Myers TR, O’Riordan MA, Kercsmar CM. A cost-saving algorithm for children hospitalized for status asthmaticus. Arch Pediatr Adolesc Med. 1998;152(10):977-984. https://doi.org/10.1001/archpedi.152.10.977.
12. Miller AG, Breslin ME, Pineda LC, Fox JW. An asthma protocol improved adherence to evidence-based guidelines for pediatric subjects with status asthmaticus in the emergency department. Respir Care. 2015;60(12):1759-1764. https://doi.org/10.4187/respcare.04011.
13. Nkoy F, Fassl B, Stone B, et al. Improving pediatric asthma care and outcomes across multiple hospitals. Pediatrics. 2015;136(6):e1602-e1610. https://doi.org/10.1542/peds.2015-0285.
14. Rutman L, Atkins RC, Migita R, et al. Modification of an established pediatric asthma pathway improves evidence-based, efficient care. Pediatrics. 2016;138(6). https://doi.org/10.1542/peds.2016-1248.
15. Glauber JH, Farber HJ, Homer CJ. Asthma clinical pathways: toward what end? Pediatrics. 2001;107(3):590-592. https://doi.org/10.1542/peds.107.3.590.
16. Grimshaw J, Eccles M, Thomas R, et al. Toward evidence-based quality improvement. Evidence (and its limitations) of the effectiveness of guideline dissemination and implementation strategies 1966-1998. J Gen Intern Med. 2006;21(2):S14-S20. https://doi.org/10.1111/j.1525-1497.2006.00357.x.
17. Scott SD, Grimshaw J, Klassen TP, Nettel-Aguirre A, Johnson DW. Understanding implementation processes of clinical pathways and clinical practice guidelines in pediatric contexts: a study protocol. Implement Sci. 2011;6:133. https://doi.org/10.1186/1748-5908-6-133.
18. Walls TA, Hughes NT, Mullan PC, Chamberlain JM, Brown K. Improving pediatric asthma outcomes in a community emergency department. Pediatrics. 2017;139(1). https://doi.org/10.1542/peds.2016-0088.
19. Kaiser SV, Lam R, Cabana MD, et al. Best practices in implementing inpatient pediatric asthma pathways: a qualitative study. J Asthma. 2019:1-11. https://doi.org/10.1080/02770903.2019.1606237.
20. Leyenaar JK, Ralston SL, Shieh MS, Pekow PS, Mangione-Smith R, Lindenauer PK. Epidemiology of pediatric hospitalizations at general hospitals and freestanding children’s hospitals in the United States. J Hosp Med. 2016;11(11):743-749. https://doi.org/10.1002/jhm.2624.
21. Franca UL, McManus ML. Availability of definitive hospital care for children. JAMA Pediatr. 2017;171(9):e171096. https://doi.org/10.1001/jamapediatrics.2017.1096.
22. McDaniel CE, Jennings R, Schroeder AR, Paciorkowski N, Hofmann M, Leyenaar J. Aligning inpatient pediatric research with settings of care: a call to action. Pediatrics. 2019;143(5). https://doi.org/10.1542/peds.2018-2648.
23. Kaiser SV JB. Value in inpatient pediatrics network launches National Asthma Project. In: AAP Quality Connections 2018; 26:8-9. Retrieved from: https://www.aap.org/en-us/Documents/coqips_newsletter_2018_winter_26.pdf
24. Value in Inpatient Pediatrics. https://www.aap.org/en-us/professional-resources/quality-improvement/Pages/Value-in-Inpatient-Pediatrics.aspx. Accessed December 1, 2017.
25. The Breakthrough Series: IHI’s Collaborative Model for Achieving Breakthrough Improvement. IHI Innovation Series white paper. Boston: Institute for Healthcare Improvement; 2003. Retrieved from: www.IHI.org
26. Powell BJ, Waltz TJ, Chinman MJ, et al. A refined compilation of implementation strategies: results from the Expert Recommendations for Implementing Change (ERIC) project. Implement Sci. 2015;10:21. https://doi.org/10.1186/s13012-015-0209-1.
27. Damschroder LJ, Aron DC, Keith RE, Kirsh SR, Alexander JA, Lowery JC. Fostering implementation of health services research findings into practice: a consolidated framework for advancing implementation science. Implement Sci. 2009;4:50. https://doi.org/10.1186/1748-5908-4-50.
28. Braun VaC, V. Thematic analysis. In: H. Cooper PC, Long DL, Panter AT, Rindskopf E, Sher KJ, eds. APA handbook of research methods in psychology, Vol 2. Research designs: Quantitative, qualitative, neuropsychologial, and biological. Washington, DC, US: American Psychological Association; 2012. https://doi.org/10.1037/13620-000.
29. Charmaz K. Grounded Theory. 2nd ed. Thousand Oaks, CA: SAGE Publications; 2014.
30. Creswell JW, Poth CNCN CJaP. Qualitative Inquiry and Research Design: Choosing Among Five Approaches. Thousand Oaks, CA: Sage; 2017.
31. Kaiser SV, Rodean J, Bekmezian A, et al. Effectiveness of pediatric asthma pathways for hospitalized children: a multicenter, national analysis. J. Pediatr. 2018;197:165-171. https://doi.org/10.1016/j.jpeds.2018.01.084.
32. Leyenaar JK, Andrews CB, Tyksinski ER, Biondi E, Parikh K, Ralston S. Facilitators of interdepartmental quality improvement: a mixed-methods analysis of a collaborative to improve pediatric community-acquired pneumonia management. BMJ Qual Saf. 2019;28(3):215-222. https://doi.org/10.1136/bmjqs-2018-008065.33. Ralston SL, Atwood EC, Garber MD, Holmes AV. What works to reduce unnecessary care for bronchiolitis? A qualitative analysis of a national collaborative. Acad Pediatr. 2017;17(2):198-204. https://doi.org/10.1016/j.acap.2016.07.001.
34. Parikh K, Biondi E, Nazif J, et al. A multicenter collaborative to improve care of community acquired pneumonia in hospitalized children. Pediatrics. 2017;139(2). https://doi.org/10.1542/peds.2016-1411.
35. Ralston S, Garber M, Narang S, et al. Decreasing unnecessary utilization in acute bronchiolitis care: results from the value in inpatient pediatrics network. J Hosp Med. 2013;8(1):25-30. https://doi.org/10.1002/jhm.1982.
36. Gupta N CA, Cabana MD, Jennings B, Parikh K, Kaiser SV. PIPA (Pathways for Improving Pediatric Asthma Care): Process Evaluation of a National Collaborative to Implement Pathways. Platform presented at Pediatric Academic Society National Meeting. Baltimore, Maryland; 2019.
Despite the widespread availability of evidence-based guidelines,1 there is inappropriate variation in the care and outcomes for children with asthma in both the emergency department (ED) and the inpatient setting.2-6 Operational versions of evidence-based guidelines known as “pathways” have been shown to improve adoption of evidence-based guidelines, quality of care, and health outcomes for children with asthma.7-14 However, little is known about how to successfully implement pathways outside of free-standing children’s hospitals.15-19
The majority of children with asthma in the United States are cared for in community hospitals, which provide services for both adults and children.20 However, prior studies of pediatric asthma pathways have largely excluded community hospitals. These studies primarily focused on determining clinical effectiveness, rather than detailing the implementation process. These approaches have left critical gaps that hinder our ability to implement pathways and improve care in community hospitals, which have unique barriers and less resources.21,22 Therefore, understanding the process of pathway implementation in community hospitals is critical to improving care for children.22 Our objective was to identify the key determinants of successful pediatric asthma pathway implementation using a national sample of community hospitals. This knowledge can guide hospital leaders and healthcare providers in efforts to improve pediatric care and outcomes in these settings.
METHODS
Study Setting, Design, and Population
In Fall 2017, the Value in Inpatient Pediatrics (VIP) network launched PIPA, Pathways to Improving Pediatric Asthma care.23 The VIP network, a part of the American Academy of Pediatrics (AAP), aims to improve the value of care delivered to any pediatric patient in a hospital bed, from rural to free-standing children’s hospitals.24 PIPA used a learning collaborative model25 and recruited local project leaders (physicians, nurses, respiratory therapists (RT), and pharmacists) from 89 hospitals around the country. PIPA provided these hospital teams with asthma pathways and several resources for implementation support, including educational meetings, quality improvement (QI) training, audit and feedback, and facilitation. Facilitation is a process of interactive problem-solving and support that occurs in the context of a supportive interpersonal relationship and a recognized need for improvement.26 A facilitator, or a “coach”, is an external expert who provides project mentorship and assists the process of making meaningful changes to improve patient care.26 Facilitation was provided by external consultants with QI expertise.
For this qualitative study, facilitators conducted semi-structured interviews with a convenience sample of project leaders from community hospitals participating in PIPA, with some interviews including multiple project leaders (eg, nursing, inpatient, and Emergency Department [ED] leaders). Verbal consent was obtained from all participants. No incentives were provided. This study was approved by the AAP institutional review board.
Data Collection
We used the constructs described in the Consolidated Framework for Implementation Research (CFIR)27 and adapted those salient to pediatric asthma pathways to develop an interview guide that was used with all participants (Appendix 1). The CFIR offers an overarching typology to understand what works where and why across five major domains that influence implementation: intervention characteristics, inner setting (hospital), outer setting (economic, political, and social context of the hospital), characteristics of the individuals involved, and the process of implementation. Data were collected across these domains to inform our analysis of the key determinants of pediatric asthma pathway implementation in community hospitals.
Interviews were conducted by phone from December 2017 to April 2018 (first four months of pathway implementation). Interviews lasted 30-60 minutes and were recorded and transcribed verbatim. Transcripts were edited for accuracy using the audio recordings. As data collection occurred concurrently with analysis, the interview guide was iteratively revised to reflect new insights and patterns that emerged from our analysis. All sites were anonymized in the data analysis. New interviews were coded until thematic saturation was reached.
Analysis
We conducted an inductive thematic analysis using the CFIR as our conceptual framework.28,29 Four investigators (CM, MJ, ES, and SK) performed the initial open coding of the data. Investigators met twice during the open coding process to develop and then finalize a codebook of standard definitions for codes. This codebook facilitated coding consistency through the remainder of the analytic process. Two investigators (CM and MJ) then independently read and coded all data to ensure intercoder reliability. During this process, CM and MJ met every two weeks to compare coding consistency, resolve discrepancies, and discuss preliminary findings. When the coding was complete, all investigators met to explore and develop themes that encompassed related common codes.
The CFIR was used at two stages of the study: (1) developing the interview guide and (2) cross-checking for any potentially important codes that were missing/needed to be explored further. Thus, the investigators maintained an inductive approach grounded in the data. To assure study rigor, we employed investigator triangulation (use of multiple investigators and participants from multiple clinical roles) and reflexivity (ongoing critique and critical reflection of the individual biases of the investigators).30 Coding was performed using Dedoose (version 7.0.23; Los Angeles, California).
RESULTS
A total of 34 community hospitals completed the PIPA project, of which the project leaders of 25 hospitals connected with the facilitators and were approached to participate; 18 (72%) hospitals’ project leaders participated in the study. We analyzed 18 interviews conducted between facilitators and project leaders, which included a total of 32 project leaders (one to five leaders per interview). The hospitals represented were diverse in geographic location and size (range 4-50 pediatric beds per hospital), and the majority of sites (78%) supported the trainees (Table 1).
We identified four overarching themes that described the key determinants of pathway implementation in community hospitals. These themes are presented in order of their frequency of occurrence in the data. They included (1) building an implementation infrastructure, (2) engaging and motivating providers, (3) addressing organizational and resource limitations, and (4) devising implementation solutions with facilitators. Descriptions and exemplary quotations for each theme are provided in Table 2 and Appendix Figure 1.
Building an Implementation Infrastructure
“So, I’m going to sit down with the primary nursing staff and the other four physicians in the group to go over the expectations…We’re not going to have the actual EMR [changes] and we’re not going to have the nursing documentation field built right away but [we want to] make sure that people are documenting the respiratory score in their generic nursing note so that the information is easily accessible.” (Physician leader, Hospital G)
Participants also described the need to deliver education on the evidence supporting changes in practice and skills training specific to pediatric asthma care:
“Once we realized that we were going to be doing this pathway, we started training our nurses on the inpatient side on [pediatric respiratory scoring].” (Nursing leader, Hospital P)
In addition, pathway implementation required modification of clinical workflows via changes to hospital policies or guidelines, electronic medical records (EMR), and/or the physical environment (eg, placing supplies in proximity to care delivery):
“I think it can help if we could get an order set or a nursing protocol where asthmatics over a certain severity can just get steroids in triage.” (Physician leader, Hospital A)
Engaging and Motivating Providers
Another crucial step in pathway implementation was engaging and motivating providers. This included overcoming inertia to practice change, facilitating multidisciplinary collaboration, and handling conflicts regarding practice changes. Participants discussed the excitement of participating in a national collaborative as especially motivating to help drive engagement and overcome barriers to change, particularly the ability to compare local hospital performance to national peers.
“I think everyone is a little competitive. So I think that when we see how we compare to other institutions—both our group and the ER—I think it also adds a little oomph…I think for our nurses too; we’re able to say, ‘[look how we compare to] most of the other hospitals.’ I think that helps.” (Physician leader, Hospital B)
Multidisciplinary collaboration across a wide variety of frontline pediatric and nonpediatric providers was key to understanding current workflows and identifying needed modifications for pathway implementation:
“I do think clearly our biggest obstacles are the fact that we have adult ED providers. We have the opportunity on the inpatient side [with nursing and respiratory therapy], who really do awesome with pediatric changes, to take our wins where we can and make the changes with the ED. In the ED we have an RN educator. She’s very on board with doing the respiratory scoring and getting this whole thing started.” (Physician leader, Hospital L)
Intentional communication and leadership skills also played key roles in engaging hesitant providers and handling conflict:
“Just sitting and talking with our respiratory therapist about the ability to provide this type of service or support and seeing what their reservations have been, at least it’s open to conversation so that we could provide these types of therapies in the future and we’re able to see like what people’s concerns are. I think just basically increasing familiarity with not only these processes, but different types of therapy will hopefully in the future help us provide better care to our patients.” (Physician leader, Hospital Q)
Addressing Organizational and Resource Limitations
Participants recognized organizational and resource limitations, some of which may be unique to community hospitals that prioritize resources for adult care. The limitations described included EMR staff support, healthcare provider staffing/capacity, navigating IRBs, and addressing administrative processes. Competing demands for information technology staff support and lack of prioritization of pediatric-specific initiatives often hindered efforts to modify the EMR.
“Resource wise, we are hoping to implement an order set in our Epic EMR, [but] finding the availability from the Epic team may be a challenge.” (Physician Leader, Hospital A)
Participants also reported that limited staff capacity (eg, nursing, RT) hindered pathway implementation efforts. This limited capacity hindered workflow changes and limited the time available for education and training on pathways:
“[Respiratory scoring for asthma is] an added responsibility for the [nursing] staff and we don’t have patient technicians. So they’re doing everything from changing the sheets to bringing water to all of the medical patients. So, that I think may be a barrier.” (Physician leader, Hospital B)
Across sites, navigating the IRB posed various challenges. Some sites were required to obtain approval from regional IRBs, which did not have resources to devote to pediatric projects. Other sites did not have IRBs at all, but instead required separate approvals for the project from hospital leadership or other entities:
“On the IRB, I contacted the manager of the IRB and she’s said, ‘No, it’s not an IRB project,’ but she sent it to another director for review, and it took forever to be able to get a data agreement with [the local university hospital] so that we can pull the data. I just couldn’t believe it took months to get done.” (Physician Leader, Hospital K)
Finally, administrative barriers such as addressing formulary changes in the context of adult-focused settings were challenging. For example, at one hospital, metered dose inhalers (MDIs) were not used for adult patients, and the hospital administration was resistant to incorporate their use into practice for pediatric patients due to the cost of such changes.
“The [general hospital] didn’t have MDI’s anymore because of cost reasons, and when we started the pediatric work, we really made it a point to get the MDI’s for pediatric patients back in the formulary.” (Physician leader, Hospital A)
Devising Implementation Solutions with Practice Facilitators
Participants often devised pathway implementation solutions with facilitators in-the-moment during meetings. This problem-solving included figuring out work-arounds, proactive coaching by external facilitators, and just-in-time solution building. Furthermore, in meetings that included more than one project leader, leaders would often work with each other to devise solutions. Meetings provided forums that stimulated identification of implementation barriers, brainstorming, and subsequently solution building.
Physician leader: I’m wondering if we could, as an interim solution, try out an algorithm on paper, I don’t know if that’s allowed, until we get Epic approval. Do you know?
Nurse Leader: You mean having an algorithm posted in triage? Yeah, I don’t see why not. (Hospital A)
Next, problem solving was often driven by the facilitator’s experience and knowledge, drawn from their interactions with other collaborative sites or their own prior experiences with asthma, QI, or pathway implementation. The facilitators brought an outside perspective, not bound by that particular hospital’s local culture or structural intricacies. This proactive coaching spurred the identification of creative, yet practical solutions:
Project Leader: We’re still trying to get all our templates [for the EMR]…because [currently they are] all adult templates.
Facilitator: If you’re making templates right now, could you also add the three asterisks? Like smoking or exposure to second hand tobacco smoke or marijuana…then have the three asterisks there and then “Referral made?***”. That would force people to document in a certain place in the template as well.Project Leader: That’s definitely something we could add right now. (Hospital O)
Check-in meetings with facilitators offered an opportunity to trouble shoot, brainstorm work-arounds, devise in-the-moment site-specific solutions to enable successful pathway implementation, and provide ongoing support throughout implementation.
DISCUSSION
Pathways can improve the quality of care for children with asthma.31 However, there is little evidence-based guidance on how to implement pathways and improve pediatric care in community hospitals,17-20 where the majority of children are cared for nationally. This is the first study to our knowledge that details the key determinants of pediatric asthma pathway implementation in community hospital settings. We identified four key determinants of implementation that can help guide others in similar settings. These include building an implementation infrastructure, engaging and motivating multidisciplinary providers, addressing organizational and resource limitations, and using external facilitators to devise implementation solutions.
Existing frameworks such as the CFIR outline the potential determinants of implementation success but do not provide population- or setting-specific guidance.27 There have been prior studies detailing pathway implementation for pediatric populations, but these studies did not focus on community hospitals.32,33 Our findings align with these prior studies, which highlight the importance of identifying implementation champions, engaging and motivating multidisciplinary providers, establishing a QI infrastructure, and addressing organizational and resource limitations, such as EMR integration.32,33 However, our study provides unique insights into issues that are important to successful pathway implementation in community hospitals, including engagement of adult-focused healthcare providers, reprioritization of resources toward the care of children, and the potentially critical role of external facilitators.
Our findings indicate that community hospitals seeking to improve care for children may particularly benefit from using external facilitators and/or partnering with external organizations. We found that external facilitators played a significant and proactive role in community hospitals’ efforts to improve care for children. Facilitators helped devise work-arounds and engaged in just-in-time solution building with local project leaders. For instance, facilitators helped develop strategies for training healthcare providers in performing new clinical tasks, building reminders of pathway recommendations into clinical workflows, and overcoming resource barriers. Thus, community hospitals may uniquely benefit from participation in national learning collaboratives, which often provide avenues for external facilitation.25,34,35 National networks, such as the VIP network, lead national learning collaboratives that provide external facilitation as well as other resources (eg, educational materials, data analysis support) to community hospitals seeking to improve pediatric care.24 Previous work by McDaniel et al. identified that intentional partnerships between children’s and community hospitals can also potentially provide access to resources for education and training in pediatric care and support in navigating organizational and resource challenges.22
Our results characterize the key determinants of pediatric asthma pathway implementation using a national sample of community hospitals that were diverse in geography, size, and structure. This imparts greater transferability of our findings. We also used strategies to promote the rigor of our findings, including triangulation and reflexivity. However, our study has several limitations. First, we analyzed only the meetings that occurred during the early months of pathway implementation. As such, we did not capture any key determinants that may have arisen later in implementation. However, process analyses of implementation indicate that the majority of implementation efforts occurred within these first three to four months.36 Second, we did not elicit input from hospital administration or leadership. The lack of administrative/leadership input probably affected the CFIR themes we found, as no themes from the outer setting were elicited. However, the goal of our study was to characterize the experiences of those leading implementation efforts, and focusing on these leaders allows our work to better guide those doing similar work in the future. Third, we used CFIR to guide the development of our interview guide and as a reference during analysis, which may have skewed our findings to preferentially reflect CFIR constructs. However, our overall analysis was grounded in the primary data and we employed reflexivity during all stages of our analysis. In addition, having the facilitators conduct the qualitative interviews may have biased our findings toward the perspectives of the facilitators; however, the facilitators represented quite diverse clinical and QI backgrounds. Finally, our findings do not necessarily correlate with improvements in clinical outcomes. As such, they are not meant to serve as explicit recommendations for improving patient outcomes, but rather as a characterization of the context, processes, and experiences of implementing pathways in the community setting to inform others doing this important work.
CONCLUSIONS
We identified the key determinants of pediatric asthma pathway implementation in community hospitals, which may help inform QI efforts in these settings. We also identified organizational and resource limitations that are probably unique to these adult-focused hospitals. Participating in national learning collaboratives and/or working with facilitators may support pathway implementation and improved quality of care for children with asthma in community hospitals.
Future work should seek to correlate these and other determinants of pathway implementation with health outcomes for hospitalized children, as well as integrate broader and more diverse samples of community hospitals.
Despite the widespread availability of evidence-based guidelines,1 there is inappropriate variation in the care and outcomes for children with asthma in both the emergency department (ED) and the inpatient setting.2-6 Operational versions of evidence-based guidelines known as “pathways” have been shown to improve adoption of evidence-based guidelines, quality of care, and health outcomes for children with asthma.7-14 However, little is known about how to successfully implement pathways outside of free-standing children’s hospitals.15-19
The majority of children with asthma in the United States are cared for in community hospitals, which provide services for both adults and children.20 However, prior studies of pediatric asthma pathways have largely excluded community hospitals. These studies primarily focused on determining clinical effectiveness, rather than detailing the implementation process. These approaches have left critical gaps that hinder our ability to implement pathways and improve care in community hospitals, which have unique barriers and less resources.21,22 Therefore, understanding the process of pathway implementation in community hospitals is critical to improving care for children.22 Our objective was to identify the key determinants of successful pediatric asthma pathway implementation using a national sample of community hospitals. This knowledge can guide hospital leaders and healthcare providers in efforts to improve pediatric care and outcomes in these settings.
METHODS
Study Setting, Design, and Population
In Fall 2017, the Value in Inpatient Pediatrics (VIP) network launched PIPA, Pathways to Improving Pediatric Asthma care.23 The VIP network, a part of the American Academy of Pediatrics (AAP), aims to improve the value of care delivered to any pediatric patient in a hospital bed, from rural to free-standing children’s hospitals.24 PIPA used a learning collaborative model25 and recruited local project leaders (physicians, nurses, respiratory therapists (RT), and pharmacists) from 89 hospitals around the country. PIPA provided these hospital teams with asthma pathways and several resources for implementation support, including educational meetings, quality improvement (QI) training, audit and feedback, and facilitation. Facilitation is a process of interactive problem-solving and support that occurs in the context of a supportive interpersonal relationship and a recognized need for improvement.26 A facilitator, or a “coach”, is an external expert who provides project mentorship and assists the process of making meaningful changes to improve patient care.26 Facilitation was provided by external consultants with QI expertise.
For this qualitative study, facilitators conducted semi-structured interviews with a convenience sample of project leaders from community hospitals participating in PIPA, with some interviews including multiple project leaders (eg, nursing, inpatient, and Emergency Department [ED] leaders). Verbal consent was obtained from all participants. No incentives were provided. This study was approved by the AAP institutional review board.
Data Collection
We used the constructs described in the Consolidated Framework for Implementation Research (CFIR)27 and adapted those salient to pediatric asthma pathways to develop an interview guide that was used with all participants (Appendix 1). The CFIR offers an overarching typology to understand what works where and why across five major domains that influence implementation: intervention characteristics, inner setting (hospital), outer setting (economic, political, and social context of the hospital), characteristics of the individuals involved, and the process of implementation. Data were collected across these domains to inform our analysis of the key determinants of pediatric asthma pathway implementation in community hospitals.
Interviews were conducted by phone from December 2017 to April 2018 (first four months of pathway implementation). Interviews lasted 30-60 minutes and were recorded and transcribed verbatim. Transcripts were edited for accuracy using the audio recordings. As data collection occurred concurrently with analysis, the interview guide was iteratively revised to reflect new insights and patterns that emerged from our analysis. All sites were anonymized in the data analysis. New interviews were coded until thematic saturation was reached.
Analysis
We conducted an inductive thematic analysis using the CFIR as our conceptual framework.28,29 Four investigators (CM, MJ, ES, and SK) performed the initial open coding of the data. Investigators met twice during the open coding process to develop and then finalize a codebook of standard definitions for codes. This codebook facilitated coding consistency through the remainder of the analytic process. Two investigators (CM and MJ) then independently read and coded all data to ensure intercoder reliability. During this process, CM and MJ met every two weeks to compare coding consistency, resolve discrepancies, and discuss preliminary findings. When the coding was complete, all investigators met to explore and develop themes that encompassed related common codes.
The CFIR was used at two stages of the study: (1) developing the interview guide and (2) cross-checking for any potentially important codes that were missing/needed to be explored further. Thus, the investigators maintained an inductive approach grounded in the data. To assure study rigor, we employed investigator triangulation (use of multiple investigators and participants from multiple clinical roles) and reflexivity (ongoing critique and critical reflection of the individual biases of the investigators).30 Coding was performed using Dedoose (version 7.0.23; Los Angeles, California).
RESULTS
A total of 34 community hospitals completed the PIPA project, of which the project leaders of 25 hospitals connected with the facilitators and were approached to participate; 18 (72%) hospitals’ project leaders participated in the study. We analyzed 18 interviews conducted between facilitators and project leaders, which included a total of 32 project leaders (one to five leaders per interview). The hospitals represented were diverse in geographic location and size (range 4-50 pediatric beds per hospital), and the majority of sites (78%) supported the trainees (Table 1).
We identified four overarching themes that described the key determinants of pathway implementation in community hospitals. These themes are presented in order of their frequency of occurrence in the data. They included (1) building an implementation infrastructure, (2) engaging and motivating providers, (3) addressing organizational and resource limitations, and (4) devising implementation solutions with facilitators. Descriptions and exemplary quotations for each theme are provided in Table 2 and Appendix Figure 1.
Building an Implementation Infrastructure
“So, I’m going to sit down with the primary nursing staff and the other four physicians in the group to go over the expectations…We’re not going to have the actual EMR [changes] and we’re not going to have the nursing documentation field built right away but [we want to] make sure that people are documenting the respiratory score in their generic nursing note so that the information is easily accessible.” (Physician leader, Hospital G)
Participants also described the need to deliver education on the evidence supporting changes in practice and skills training specific to pediatric asthma care:
“Once we realized that we were going to be doing this pathway, we started training our nurses on the inpatient side on [pediatric respiratory scoring].” (Nursing leader, Hospital P)
In addition, pathway implementation required modification of clinical workflows via changes to hospital policies or guidelines, electronic medical records (EMR), and/or the physical environment (eg, placing supplies in proximity to care delivery):
“I think it can help if we could get an order set or a nursing protocol where asthmatics over a certain severity can just get steroids in triage.” (Physician leader, Hospital A)
Engaging and Motivating Providers
Another crucial step in pathway implementation was engaging and motivating providers. This included overcoming inertia to practice change, facilitating multidisciplinary collaboration, and handling conflicts regarding practice changes. Participants discussed the excitement of participating in a national collaborative as especially motivating to help drive engagement and overcome barriers to change, particularly the ability to compare local hospital performance to national peers.
“I think everyone is a little competitive. So I think that when we see how we compare to other institutions—both our group and the ER—I think it also adds a little oomph…I think for our nurses too; we’re able to say, ‘[look how we compare to] most of the other hospitals.’ I think that helps.” (Physician leader, Hospital B)
Multidisciplinary collaboration across a wide variety of frontline pediatric and nonpediatric providers was key to understanding current workflows and identifying needed modifications for pathway implementation:
“I do think clearly our biggest obstacles are the fact that we have adult ED providers. We have the opportunity on the inpatient side [with nursing and respiratory therapy], who really do awesome with pediatric changes, to take our wins where we can and make the changes with the ED. In the ED we have an RN educator. She’s very on board with doing the respiratory scoring and getting this whole thing started.” (Physician leader, Hospital L)
Intentional communication and leadership skills also played key roles in engaging hesitant providers and handling conflict:
“Just sitting and talking with our respiratory therapist about the ability to provide this type of service or support and seeing what their reservations have been, at least it’s open to conversation so that we could provide these types of therapies in the future and we’re able to see like what people’s concerns are. I think just basically increasing familiarity with not only these processes, but different types of therapy will hopefully in the future help us provide better care to our patients.” (Physician leader, Hospital Q)
Addressing Organizational and Resource Limitations
Participants recognized organizational and resource limitations, some of which may be unique to community hospitals that prioritize resources for adult care. The limitations described included EMR staff support, healthcare provider staffing/capacity, navigating IRBs, and addressing administrative processes. Competing demands for information technology staff support and lack of prioritization of pediatric-specific initiatives often hindered efforts to modify the EMR.
“Resource wise, we are hoping to implement an order set in our Epic EMR, [but] finding the availability from the Epic team may be a challenge.” (Physician Leader, Hospital A)
Participants also reported that limited staff capacity (eg, nursing, RT) hindered pathway implementation efforts. This limited capacity hindered workflow changes and limited the time available for education and training on pathways:
“[Respiratory scoring for asthma is] an added responsibility for the [nursing] staff and we don’t have patient technicians. So they’re doing everything from changing the sheets to bringing water to all of the medical patients. So, that I think may be a barrier.” (Physician leader, Hospital B)
Across sites, navigating the IRB posed various challenges. Some sites were required to obtain approval from regional IRBs, which did not have resources to devote to pediatric projects. Other sites did not have IRBs at all, but instead required separate approvals for the project from hospital leadership or other entities:
“On the IRB, I contacted the manager of the IRB and she’s said, ‘No, it’s not an IRB project,’ but she sent it to another director for review, and it took forever to be able to get a data agreement with [the local university hospital] so that we can pull the data. I just couldn’t believe it took months to get done.” (Physician Leader, Hospital K)
Finally, administrative barriers such as addressing formulary changes in the context of adult-focused settings were challenging. For example, at one hospital, metered dose inhalers (MDIs) were not used for adult patients, and the hospital administration was resistant to incorporate their use into practice for pediatric patients due to the cost of such changes.
“The [general hospital] didn’t have MDI’s anymore because of cost reasons, and when we started the pediatric work, we really made it a point to get the MDI’s for pediatric patients back in the formulary.” (Physician leader, Hospital A)
Devising Implementation Solutions with Practice Facilitators
Participants often devised pathway implementation solutions with facilitators in-the-moment during meetings. This problem-solving included figuring out work-arounds, proactive coaching by external facilitators, and just-in-time solution building. Furthermore, in meetings that included more than one project leader, leaders would often work with each other to devise solutions. Meetings provided forums that stimulated identification of implementation barriers, brainstorming, and subsequently solution building.
Physician leader: I’m wondering if we could, as an interim solution, try out an algorithm on paper, I don’t know if that’s allowed, until we get Epic approval. Do you know?
Nurse Leader: You mean having an algorithm posted in triage? Yeah, I don’t see why not. (Hospital A)
Next, problem solving was often driven by the facilitator’s experience and knowledge, drawn from their interactions with other collaborative sites or their own prior experiences with asthma, QI, or pathway implementation. The facilitators brought an outside perspective, not bound by that particular hospital’s local culture or structural intricacies. This proactive coaching spurred the identification of creative, yet practical solutions:
Project Leader: We’re still trying to get all our templates [for the EMR]…because [currently they are] all adult templates.
Facilitator: If you’re making templates right now, could you also add the three asterisks? Like smoking or exposure to second hand tobacco smoke or marijuana…then have the three asterisks there and then “Referral made?***”. That would force people to document in a certain place in the template as well.Project Leader: That’s definitely something we could add right now. (Hospital O)
Check-in meetings with facilitators offered an opportunity to trouble shoot, brainstorm work-arounds, devise in-the-moment site-specific solutions to enable successful pathway implementation, and provide ongoing support throughout implementation.
DISCUSSION
Pathways can improve the quality of care for children with asthma.31 However, there is little evidence-based guidance on how to implement pathways and improve pediatric care in community hospitals,17-20 where the majority of children are cared for nationally. This is the first study to our knowledge that details the key determinants of pediatric asthma pathway implementation in community hospital settings. We identified four key determinants of implementation that can help guide others in similar settings. These include building an implementation infrastructure, engaging and motivating multidisciplinary providers, addressing organizational and resource limitations, and using external facilitators to devise implementation solutions.
Existing frameworks such as the CFIR outline the potential determinants of implementation success but do not provide population- or setting-specific guidance.27 There have been prior studies detailing pathway implementation for pediatric populations, but these studies did not focus on community hospitals.32,33 Our findings align with these prior studies, which highlight the importance of identifying implementation champions, engaging and motivating multidisciplinary providers, establishing a QI infrastructure, and addressing organizational and resource limitations, such as EMR integration.32,33 However, our study provides unique insights into issues that are important to successful pathway implementation in community hospitals, including engagement of adult-focused healthcare providers, reprioritization of resources toward the care of children, and the potentially critical role of external facilitators.
Our findings indicate that community hospitals seeking to improve care for children may particularly benefit from using external facilitators and/or partnering with external organizations. We found that external facilitators played a significant and proactive role in community hospitals’ efforts to improve care for children. Facilitators helped devise work-arounds and engaged in just-in-time solution building with local project leaders. For instance, facilitators helped develop strategies for training healthcare providers in performing new clinical tasks, building reminders of pathway recommendations into clinical workflows, and overcoming resource barriers. Thus, community hospitals may uniquely benefit from participation in national learning collaboratives, which often provide avenues for external facilitation.25,34,35 National networks, such as the VIP network, lead national learning collaboratives that provide external facilitation as well as other resources (eg, educational materials, data analysis support) to community hospitals seeking to improve pediatric care.24 Previous work by McDaniel et al. identified that intentional partnerships between children’s and community hospitals can also potentially provide access to resources for education and training in pediatric care and support in navigating organizational and resource challenges.22
Our results characterize the key determinants of pediatric asthma pathway implementation using a national sample of community hospitals that were diverse in geography, size, and structure. This imparts greater transferability of our findings. We also used strategies to promote the rigor of our findings, including triangulation and reflexivity. However, our study has several limitations. First, we analyzed only the meetings that occurred during the early months of pathway implementation. As such, we did not capture any key determinants that may have arisen later in implementation. However, process analyses of implementation indicate that the majority of implementation efforts occurred within these first three to four months.36 Second, we did not elicit input from hospital administration or leadership. The lack of administrative/leadership input probably affected the CFIR themes we found, as no themes from the outer setting were elicited. However, the goal of our study was to characterize the experiences of those leading implementation efforts, and focusing on these leaders allows our work to better guide those doing similar work in the future. Third, we used CFIR to guide the development of our interview guide and as a reference during analysis, which may have skewed our findings to preferentially reflect CFIR constructs. However, our overall analysis was grounded in the primary data and we employed reflexivity during all stages of our analysis. In addition, having the facilitators conduct the qualitative interviews may have biased our findings toward the perspectives of the facilitators; however, the facilitators represented quite diverse clinical and QI backgrounds. Finally, our findings do not necessarily correlate with improvements in clinical outcomes. As such, they are not meant to serve as explicit recommendations for improving patient outcomes, but rather as a characterization of the context, processes, and experiences of implementing pathways in the community setting to inform others doing this important work.
CONCLUSIONS
We identified the key determinants of pediatric asthma pathway implementation in community hospitals, which may help inform QI efforts in these settings. We also identified organizational and resource limitations that are probably unique to these adult-focused hospitals. Participating in national learning collaboratives and/or working with facilitators may support pathway implementation and improved quality of care for children with asthma in community hospitals.
Future work should seek to correlate these and other determinants of pathway implementation with health outcomes for hospitalized children, as well as integrate broader and more diverse samples of community hospitals.
1. National Asthma E, Prevention P. Expert Panel Report 3 (EPR-3): Guidelines for the diagnosis and management of asthma-summary report 2007. J Allergy Clin Immunol. 2007;120(5):S94-S138. https://doi.org/10.1016/j.jaci.2007.09.043.
2. Bekmezian A, Hersh AL, Maselli JH, Cabana MD. Pediatric emergency departments are more likely than general emergency departments to treat asthma exacerbation with systemic corticosteroids. J Asthma. 2011;48(1):69-74. https://doi.org/10.3109/02770903.2010.535884.
3. Biagini Myers JM, Simmons JM, Kercsmar CM, et al. Heterogeneity in asthma care in a statewide collaborative: the Ohio Pediatric Asthma Repository. Pediatrics. 2015;135(2):271-279. https://doi.org/10.1542/peds.2014-2230.
4. Kharbanda AB, Hall M, Shah SS, et al. Variation in resource utilization across a national sample of pediatric emergency departments. J Pediatr. 2013;163(1):230-236. https://doi.org/10.1016/j.jpeds.2012.12.013.
5. O’Con
6. Lougheed MD, Garvey N, Chapman KR, et al. Variations and gaps in management of acute asthma in Ontario emergency departments. Chest. 2009;135(3):724-736. https://doi.org/10.1378/chest.08-0371.
7. Bekmezian A, Fee C, Weber E. Clinical pathway improves pediatrics asthma management in the emergency department and reduces admissions. J Asthma. 2015;52(8):806-814. https://doi.org/10.3109/02770903.2015.1019086.
8. Chen KH, Chen CC, Liu HE, Tzeng PC, Glasziou PP. Effectiveness of paediatric asthma clinical pathways: a narrative systematic review. J Asthma. 2014;51(5):480-492. https://doi.org/10.3109/02770903.2014.887728.
9. Johnson KB, Blaisdell CJ, Walker A, Eggleston P. Effectiveness of a clinical pathway for inpatient asthma management. Pediatrics. 2000;106(5):1006-1012. https://doi.org/10.1542/peds.106.5.1006.
10. Kelly CS, Andersen CL, Pestian JP, et al. Improved outcomes for hospitalized asthmatic children using a clinical pathway. Ann Allergy Asthma Immunol. 2000;84(5):509-516. https://doi.org/10.1016/S1081-1206(10)62514-8.
11. McDowell KM, Chatburn RL, Myers TR, O’Riordan MA, Kercsmar CM. A cost-saving algorithm for children hospitalized for status asthmaticus. Arch Pediatr Adolesc Med. 1998;152(10):977-984. https://doi.org/10.1001/archpedi.152.10.977.
12. Miller AG, Breslin ME, Pineda LC, Fox JW. An asthma protocol improved adherence to evidence-based guidelines for pediatric subjects with status asthmaticus in the emergency department. Respir Care. 2015;60(12):1759-1764. https://doi.org/10.4187/respcare.04011.
13. Nkoy F, Fassl B, Stone B, et al. Improving pediatric asthma care and outcomes across multiple hospitals. Pediatrics. 2015;136(6):e1602-e1610. https://doi.org/10.1542/peds.2015-0285.
14. Rutman L, Atkins RC, Migita R, et al. Modification of an established pediatric asthma pathway improves evidence-based, efficient care. Pediatrics. 2016;138(6). https://doi.org/10.1542/peds.2016-1248.
15. Glauber JH, Farber HJ, Homer CJ. Asthma clinical pathways: toward what end? Pediatrics. 2001;107(3):590-592. https://doi.org/10.1542/peds.107.3.590.
16. Grimshaw J, Eccles M, Thomas R, et al. Toward evidence-based quality improvement. Evidence (and its limitations) of the effectiveness of guideline dissemination and implementation strategies 1966-1998. J Gen Intern Med. 2006;21(2):S14-S20. https://doi.org/10.1111/j.1525-1497.2006.00357.x.
17. Scott SD, Grimshaw J, Klassen TP, Nettel-Aguirre A, Johnson DW. Understanding implementation processes of clinical pathways and clinical practice guidelines in pediatric contexts: a study protocol. Implement Sci. 2011;6:133. https://doi.org/10.1186/1748-5908-6-133.
18. Walls TA, Hughes NT, Mullan PC, Chamberlain JM, Brown K. Improving pediatric asthma outcomes in a community emergency department. Pediatrics. 2017;139(1). https://doi.org/10.1542/peds.2016-0088.
19. Kaiser SV, Lam R, Cabana MD, et al. Best practices in implementing inpatient pediatric asthma pathways: a qualitative study. J Asthma. 2019:1-11. https://doi.org/10.1080/02770903.2019.1606237.
20. Leyenaar JK, Ralston SL, Shieh MS, Pekow PS, Mangione-Smith R, Lindenauer PK. Epidemiology of pediatric hospitalizations at general hospitals and freestanding children’s hospitals in the United States. J Hosp Med. 2016;11(11):743-749. https://doi.org/10.1002/jhm.2624.
21. Franca UL, McManus ML. Availability of definitive hospital care for children. JAMA Pediatr. 2017;171(9):e171096. https://doi.org/10.1001/jamapediatrics.2017.1096.
22. McDaniel CE, Jennings R, Schroeder AR, Paciorkowski N, Hofmann M, Leyenaar J. Aligning inpatient pediatric research with settings of care: a call to action. Pediatrics. 2019;143(5). https://doi.org/10.1542/peds.2018-2648.
23. Kaiser SV JB. Value in inpatient pediatrics network launches National Asthma Project. In: AAP Quality Connections 2018; 26:8-9. Retrieved from: https://www.aap.org/en-us/Documents/coqips_newsletter_2018_winter_26.pdf
24. Value in Inpatient Pediatrics. https://www.aap.org/en-us/professional-resources/quality-improvement/Pages/Value-in-Inpatient-Pediatrics.aspx. Accessed December 1, 2017.
25. The Breakthrough Series: IHI’s Collaborative Model for Achieving Breakthrough Improvement. IHI Innovation Series white paper. Boston: Institute for Healthcare Improvement; 2003. Retrieved from: www.IHI.org
26. Powell BJ, Waltz TJ, Chinman MJ, et al. A refined compilation of implementation strategies: results from the Expert Recommendations for Implementing Change (ERIC) project. Implement Sci. 2015;10:21. https://doi.org/10.1186/s13012-015-0209-1.
27. Damschroder LJ, Aron DC, Keith RE, Kirsh SR, Alexander JA, Lowery JC. Fostering implementation of health services research findings into practice: a consolidated framework for advancing implementation science. Implement Sci. 2009;4:50. https://doi.org/10.1186/1748-5908-4-50.
28. Braun VaC, V. Thematic analysis. In: H. Cooper PC, Long DL, Panter AT, Rindskopf E, Sher KJ, eds. APA handbook of research methods in psychology, Vol 2. Research designs: Quantitative, qualitative, neuropsychologial, and biological. Washington, DC, US: American Psychological Association; 2012. https://doi.org/10.1037/13620-000.
29. Charmaz K. Grounded Theory. 2nd ed. Thousand Oaks, CA: SAGE Publications; 2014.
30. Creswell JW, Poth CNCN CJaP. Qualitative Inquiry and Research Design: Choosing Among Five Approaches. Thousand Oaks, CA: Sage; 2017.
31. Kaiser SV, Rodean J, Bekmezian A, et al. Effectiveness of pediatric asthma pathways for hospitalized children: a multicenter, national analysis. J. Pediatr. 2018;197:165-171. https://doi.org/10.1016/j.jpeds.2018.01.084.
32. Leyenaar JK, Andrews CB, Tyksinski ER, Biondi E, Parikh K, Ralston S. Facilitators of interdepartmental quality improvement: a mixed-methods analysis of a collaborative to improve pediatric community-acquired pneumonia management. BMJ Qual Saf. 2019;28(3):215-222. https://doi.org/10.1136/bmjqs-2018-008065.33. Ralston SL, Atwood EC, Garber MD, Holmes AV. What works to reduce unnecessary care for bronchiolitis? A qualitative analysis of a national collaborative. Acad Pediatr. 2017;17(2):198-204. https://doi.org/10.1016/j.acap.2016.07.001.
34. Parikh K, Biondi E, Nazif J, et al. A multicenter collaborative to improve care of community acquired pneumonia in hospitalized children. Pediatrics. 2017;139(2). https://doi.org/10.1542/peds.2016-1411.
35. Ralston S, Garber M, Narang S, et al. Decreasing unnecessary utilization in acute bronchiolitis care: results from the value in inpatient pediatrics network. J Hosp Med. 2013;8(1):25-30. https://doi.org/10.1002/jhm.1982.
36. Gupta N CA, Cabana MD, Jennings B, Parikh K, Kaiser SV. PIPA (Pathways for Improving Pediatric Asthma Care): Process Evaluation of a National Collaborative to Implement Pathways. Platform presented at Pediatric Academic Society National Meeting. Baltimore, Maryland; 2019.
1. National Asthma E, Prevention P. Expert Panel Report 3 (EPR-3): Guidelines for the diagnosis and management of asthma-summary report 2007. J Allergy Clin Immunol. 2007;120(5):S94-S138. https://doi.org/10.1016/j.jaci.2007.09.043.
2. Bekmezian A, Hersh AL, Maselli JH, Cabana MD. Pediatric emergency departments are more likely than general emergency departments to treat asthma exacerbation with systemic corticosteroids. J Asthma. 2011;48(1):69-74. https://doi.org/10.3109/02770903.2010.535884.
3. Biagini Myers JM, Simmons JM, Kercsmar CM, et al. Heterogeneity in asthma care in a statewide collaborative: the Ohio Pediatric Asthma Repository. Pediatrics. 2015;135(2):271-279. https://doi.org/10.1542/peds.2014-2230.
4. Kharbanda AB, Hall M, Shah SS, et al. Variation in resource utilization across a national sample of pediatric emergency departments. J Pediatr. 2013;163(1):230-236. https://doi.org/10.1016/j.jpeds.2012.12.013.
5. O’Con
6. Lougheed MD, Garvey N, Chapman KR, et al. Variations and gaps in management of acute asthma in Ontario emergency departments. Chest. 2009;135(3):724-736. https://doi.org/10.1378/chest.08-0371.
7. Bekmezian A, Fee C, Weber E. Clinical pathway improves pediatrics asthma management in the emergency department and reduces admissions. J Asthma. 2015;52(8):806-814. https://doi.org/10.3109/02770903.2015.1019086.
8. Chen KH, Chen CC, Liu HE, Tzeng PC, Glasziou PP. Effectiveness of paediatric asthma clinical pathways: a narrative systematic review. J Asthma. 2014;51(5):480-492. https://doi.org/10.3109/02770903.2014.887728.
9. Johnson KB, Blaisdell CJ, Walker A, Eggleston P. Effectiveness of a clinical pathway for inpatient asthma management. Pediatrics. 2000;106(5):1006-1012. https://doi.org/10.1542/peds.106.5.1006.
10. Kelly CS, Andersen CL, Pestian JP, et al. Improved outcomes for hospitalized asthmatic children using a clinical pathway. Ann Allergy Asthma Immunol. 2000;84(5):509-516. https://doi.org/10.1016/S1081-1206(10)62514-8.
11. McDowell KM, Chatburn RL, Myers TR, O’Riordan MA, Kercsmar CM. A cost-saving algorithm for children hospitalized for status asthmaticus. Arch Pediatr Adolesc Med. 1998;152(10):977-984. https://doi.org/10.1001/archpedi.152.10.977.
12. Miller AG, Breslin ME, Pineda LC, Fox JW. An asthma protocol improved adherence to evidence-based guidelines for pediatric subjects with status asthmaticus in the emergency department. Respir Care. 2015;60(12):1759-1764. https://doi.org/10.4187/respcare.04011.
13. Nkoy F, Fassl B, Stone B, et al. Improving pediatric asthma care and outcomes across multiple hospitals. Pediatrics. 2015;136(6):e1602-e1610. https://doi.org/10.1542/peds.2015-0285.
14. Rutman L, Atkins RC, Migita R, et al. Modification of an established pediatric asthma pathway improves evidence-based, efficient care. Pediatrics. 2016;138(6). https://doi.org/10.1542/peds.2016-1248.
15. Glauber JH, Farber HJ, Homer CJ. Asthma clinical pathways: toward what end? Pediatrics. 2001;107(3):590-592. https://doi.org/10.1542/peds.107.3.590.
16. Grimshaw J, Eccles M, Thomas R, et al. Toward evidence-based quality improvement. Evidence (and its limitations) of the effectiveness of guideline dissemination and implementation strategies 1966-1998. J Gen Intern Med. 2006;21(2):S14-S20. https://doi.org/10.1111/j.1525-1497.2006.00357.x.
17. Scott SD, Grimshaw J, Klassen TP, Nettel-Aguirre A, Johnson DW. Understanding implementation processes of clinical pathways and clinical practice guidelines in pediatric contexts: a study protocol. Implement Sci. 2011;6:133. https://doi.org/10.1186/1748-5908-6-133.
18. Walls TA, Hughes NT, Mullan PC, Chamberlain JM, Brown K. Improving pediatric asthma outcomes in a community emergency department. Pediatrics. 2017;139(1). https://doi.org/10.1542/peds.2016-0088.
19. Kaiser SV, Lam R, Cabana MD, et al. Best practices in implementing inpatient pediatric asthma pathways: a qualitative study. J Asthma. 2019:1-11. https://doi.org/10.1080/02770903.2019.1606237.
20. Leyenaar JK, Ralston SL, Shieh MS, Pekow PS, Mangione-Smith R, Lindenauer PK. Epidemiology of pediatric hospitalizations at general hospitals and freestanding children’s hospitals in the United States. J Hosp Med. 2016;11(11):743-749. https://doi.org/10.1002/jhm.2624.
21. Franca UL, McManus ML. Availability of definitive hospital care for children. JAMA Pediatr. 2017;171(9):e171096. https://doi.org/10.1001/jamapediatrics.2017.1096.
22. McDaniel CE, Jennings R, Schroeder AR, Paciorkowski N, Hofmann M, Leyenaar J. Aligning inpatient pediatric research with settings of care: a call to action. Pediatrics. 2019;143(5). https://doi.org/10.1542/peds.2018-2648.
23. Kaiser SV JB. Value in inpatient pediatrics network launches National Asthma Project. In: AAP Quality Connections 2018; 26:8-9. Retrieved from: https://www.aap.org/en-us/Documents/coqips_newsletter_2018_winter_26.pdf
24. Value in Inpatient Pediatrics. https://www.aap.org/en-us/professional-resources/quality-improvement/Pages/Value-in-Inpatient-Pediatrics.aspx. Accessed December 1, 2017.
25. The Breakthrough Series: IHI’s Collaborative Model for Achieving Breakthrough Improvement. IHI Innovation Series white paper. Boston: Institute for Healthcare Improvement; 2003. Retrieved from: www.IHI.org
26. Powell BJ, Waltz TJ, Chinman MJ, et al. A refined compilation of implementation strategies: results from the Expert Recommendations for Implementing Change (ERIC) project. Implement Sci. 2015;10:21. https://doi.org/10.1186/s13012-015-0209-1.
27. Damschroder LJ, Aron DC, Keith RE, Kirsh SR, Alexander JA, Lowery JC. Fostering implementation of health services research findings into practice: a consolidated framework for advancing implementation science. Implement Sci. 2009;4:50. https://doi.org/10.1186/1748-5908-4-50.
28. Braun VaC, V. Thematic analysis. In: H. Cooper PC, Long DL, Panter AT, Rindskopf E, Sher KJ, eds. APA handbook of research methods in psychology, Vol 2. Research designs: Quantitative, qualitative, neuropsychologial, and biological. Washington, DC, US: American Psychological Association; 2012. https://doi.org/10.1037/13620-000.
29. Charmaz K. Grounded Theory. 2nd ed. Thousand Oaks, CA: SAGE Publications; 2014.
30. Creswell JW, Poth CNCN CJaP. Qualitative Inquiry and Research Design: Choosing Among Five Approaches. Thousand Oaks, CA: Sage; 2017.
31. Kaiser SV, Rodean J, Bekmezian A, et al. Effectiveness of pediatric asthma pathways for hospitalized children: a multicenter, national analysis. J. Pediatr. 2018;197:165-171. https://doi.org/10.1016/j.jpeds.2018.01.084.
32. Leyenaar JK, Andrews CB, Tyksinski ER, Biondi E, Parikh K, Ralston S. Facilitators of interdepartmental quality improvement: a mixed-methods analysis of a collaborative to improve pediatric community-acquired pneumonia management. BMJ Qual Saf. 2019;28(3):215-222. https://doi.org/10.1136/bmjqs-2018-008065.33. Ralston SL, Atwood EC, Garber MD, Holmes AV. What works to reduce unnecessary care for bronchiolitis? A qualitative analysis of a national collaborative. Acad Pediatr. 2017;17(2):198-204. https://doi.org/10.1016/j.acap.2016.07.001.
34. Parikh K, Biondi E, Nazif J, et al. A multicenter collaborative to improve care of community acquired pneumonia in hospitalized children. Pediatrics. 2017;139(2). https://doi.org/10.1542/peds.2016-1411.
35. Ralston S, Garber M, Narang S, et al. Decreasing unnecessary utilization in acute bronchiolitis care: results from the value in inpatient pediatrics network. J Hosp Med. 2013;8(1):25-30. https://doi.org/10.1002/jhm.1982.
36. Gupta N CA, Cabana MD, Jennings B, Parikh K, Kaiser SV. PIPA (Pathways for Improving Pediatric Asthma Care): Process Evaluation of a National Collaborative to Implement Pathways. Platform presented at Pediatric Academic Society National Meeting. Baltimore, Maryland; 2019.
© 2020 Society of Hospital Medicine