User login
Frailty Evaluation in the Hospital
Frailty is a state of vulnerability that encompasses a heterogeneous group of people.[1] Because it lacks a precise definition, multiple tools have been developed to identify frailty in both clinical and research settings.[2, 3, 4] Prevalence of frailty depends on the frailty assessment tool used and the population studied, ranging from 4% to 17% when the Fried score[5, 6, 7] is used and from 5% to 44%[5, 7, 8] when cumulative deficit models like the Frailty Index are utilized, with the lower prevalences being in younger community‐dwelling elderly populations and the higher proportions being in older institutionalized populations.
The Frailty Index, also called the Burden or Cumulative Deficit Model, comprises 70 domains that include mobility, mood, function, cognitive impairment, and disease states. It is multidimensional and allows for patients to be categorized on a continuum of frailty, but it is extremely difficult to apply in clinical practice. Recognizing this, Rockwood et al.[9] developed and validated the Clinical Frailty Scale (CFS) in the Canadian Study of Health and Aging. The CFS classifies patients into 1 of 9 categories: very fit, well, managing well, vulnerable, mildly frail (needs help with at least 1 instrumental activity of daily living such as shopping, finances, meal preparation, or housework), moderately frail (needs help with 1 or 2 activities of daily living such as bathing and dressing), severely frail (dependent for personal care), very severely frail (bedbound), and terminally ill. Although this tool is easy to use in clinical practice, it reflects a gestalt impression and requires some clinical judgement.
The Fried score[6] is a prototypical phenotype tool based on 5 criteria that include weight loss, self‐reported exhaustion, low energy expenditure, slowness of gait, and weakness. Recent evidence has suggested that slow gait (or dysmobility) alone may also be a potential screening test for frailty.[10] A recent systematic review[11] demonstrated an association between slow gait (dysmobility) and increased mortality. Dysmobility negatively impacts quality of life and has a strong association with disability resulting in the need for an increased level of care.[12] The Timed Up and Go Test (TUGT) is one method of assessing mobility which is relatively easy to perform, does not require special equipment, and is feasible to use in clinical settings.[13] However, whether impaired mobility predicts outcomes within the first 30 days after hospital discharge (a timeframe highlighted in the Affordable Care Act and used by the Centers for Medicare and Medicaid Services as an important hospital quality indicator) is still uncertain.
The aim of this study was to compare frailty assessments using the CFS and 2 of the most commonly used phenotypic tools (a modified Fried score and the TUGT as a proxy for mobility assessment) to determine which tools best predict postdischarge outcomes.
METHODS
Study Design and Population
As described in detail elsewhere,[14] this was a prospective cohort study that enrolled adult patients (any age older than 18 years) at the time of discharge back to the community from 7 general internal medicine wards in 2 teaching hospitals in Edmonton, Alberta between October 2013 and November 2014. We excluded patients admitted from, or being discharged back to, long‐term care facilities or other acute care hospitals, or from out of the province; patients who were unable to communicate in English; patients with moderate or severe cognitive impairment (scoring 5 or more on the Short Portable Mental Status Questionnaire); or patients with projected life expectancy of less than 3 months. All patients provided written consent, and the study was approved by the Health Research Ethics board of the University of Alberta (project ID Pro00036880).
We assessed the degree of frailty within 24 hours of discharge in 3 ways. First, we used the CFS[9, 15] with patients being asked to rate their best functional status in the week prior to admission. As per the CFS validations studies, scores 5 were defined as frail.[9, 15] Second, we used the TUGT as a proxy for slow gait speed/dysmobility (with >20 seconds defined as abnormal).[13] The TUGT was recorded as the shortest recorded time of the 2 timed trials to get up from a seated position, walk 10 feet and back, and then sit in the chair again. Third, we also determined their Fried score[6] (using the modifications outlined below) and categorized the patients as frail if they scored 3 or more. Of the 5 Fried categories, we assessed weakness by grip strength in their dominant hand using a Jamar handheld dynamometer and weight loss of 10 lb or more in the past year based on patient self‐report; these are identical to the original Fried scale description. Grip strength in the lowest quintile for sex and body mass index was defined as weak grip strength as per convention in the literature, which corresponded to less than 28.5 kg for men and less than 18.5 kg for women.[16, 17] We assessed the other 3 Fried categories in modified fashion as follows. For slow gait, rather than assessing time to walk 15 feet as in the original study and assigning a point to those testing in the lowest quintile for their age/sex, we used the TUGT, because our research personnel were already trained in this test, and we were doing it already as part of the discharge package for all patients.[13] For the Fried category of low activity, we based this on patient self‐report using the relevant questions in the EuroQoL Questionnaire (EQ‐5D); the Fried score used self‐report with a different questionnaire. Finally, for self‐reported exhaustion we used the questions in the Patient Health Questionnaire 9 (PHQ‐9)[18] analogous to those used from the Center for Epidemiological Studies depression scale in the original Fried description. We did this as we were evaluating the PHQ‐9 in our cohort already, and did not want to increase responder burden by presenting them with 2 depression questionnaires.
We followed all patients until 30 days after discharge, and outcome data (all‐cause mortality or all‐cause readmission) were collected by research personnel blinded to the patient's frailty status at discharge using patient/caregiver self‐report and analysis of the provincial electronic health record. We included deaths in or out of the hospital, and all readmissions were unplanned.
We examined the correlation between the CFS score (5 vs <5) and (1) the modified Fried score (3 vs <3) and (2) TUGT (20 seconds vs >20 seconds) using chance corrected kappa coefficients. In our previous article[14] we reported the association between the CFS and readmissions/hospitalizations within 30 days of discharge. In this article we examine whether either the Fried score or TUGT accurately and independently predict postdischarge readmissions/deaths, and whether they add additional prognostic information to the CFS assessment by comparing models with/without each definition using the C statistic and the Integrated Discrimination Improvement index. All analyses were performed using SAS version 9.4 (SAS Institute, Cary, NC), with P values of <0.05 considered statistically significant. Subgroup analysis was done in patients older than 65 years.
RESULTS
Of 1124 potentially eligible patients, 626 were excluded because of patient refusal (n = 227); transfer to/from another hospital, long‐term care facility, or out of province (n = 189); moderate to severe cognitive impairment (n = 88); language barriers (n = 71); or foreshortened life expectancy (n = 51). Another 3 patients withdrew consent prior to outcome assessment. The 495 patients we recruited and had outcome data for had a mean age of 64 years, 19.6% were older than 80 years, 50% were women, and the patients had a mean of 4.2 comorbidities and mean Charlson score of 2.4. The 4 most common reasons for hospital admission were heart failure, pneumonia, chronic obstructive pulmonary disease, and urinary tract infection, and the median length of stay was 5 days (interquartile range: 49 days).
Prevalence of Frailty According to Different Definitions
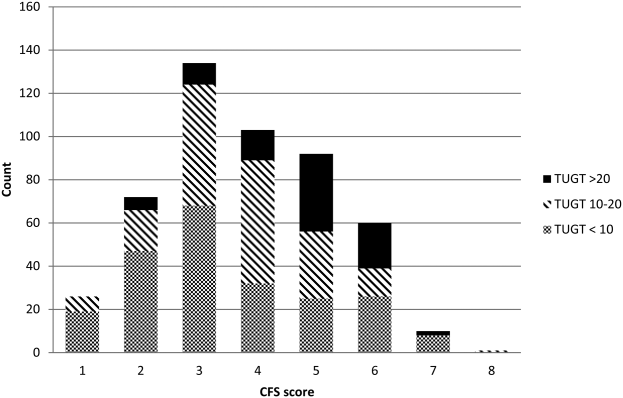
Although the CFS assessment resulted in 162 (33%) patients being deemed frail, only 82 (51%) of those patients also met the phenotype frailty definition using either the Fried model or the TUGT, and 49 (10%) patients who were not classified as frail on the CFS met either of the phenotypic definitions of frailty (Figure 1). Overall, 211 (43%) patients were frail according to at least 1 assessment, and 46 (9%) met all 3 frailty definitions. In the subgroup of 245 patients older than 65 years, 137 (56%) were frail according to at least 1 assessment, 38 (16%) met all 3 frailty definitions, and 27 (11%) of those patients classified as not frail on the CFS met either phenotypic definition of frailty. Agreement between TUGT and CFS or CFS and Fried was relatively poor with kappas of 0.31 (95% confidence interval [CI]: 0.23‐0.40) and 0.33 (95% CI: 0.25‐0.42), respectively. It is noteworthy that some patients deemed nonfrail on the CFS had slow gait speeds, and most CFS‐frail patients had gait speeds in the nonfrail range (Figure 2).

Characteristics According to Frailty Status
Although frail patients were generally similar across definitions (Table 1) in that they were older, had more comorbidities, more hospitalizations in the prior year, and longer index hospitalization lengths of stay than nonfrail patients, patients meeting phenotypic definitions of frailty but not classified as frail on the CFS were younger, had lower Charlson scores, higher EQ‐5D scores, and were discharged with less medications (Table 1).
| Not Frail on Any of the 3 Models, n = 284 | Frail on the CFS Only, n = 80 | Frail on the Fried and/or TUGT but Not the CFS, n = 49 | Frail on CFS and Either Phenotype Model, n = 82 | P Value Comparing the 3 Frailty Columns | |
|---|---|---|---|---|---|
| |||||
| Age, y, mean (95% CI) | 57.3 (55.259.5) | 69.1 (65.872.3) | 63.1 (57.968.3) | 75.8 (72.679.0) | <0.001 |
| Sex, female, no (%) | 118 (41.6) | 49 (61.3) | 27 (55.1) | 56 (68.3) | 0.3 |
| No. of comorbidities, mean (95% CI) | 4.2 (3.84.5) | 6.0 (5.56.6) | 4.0 (3.14.9) | 6.5 (5.87.2) | <0.001 |
| Charlson comorbidity score, mean (95% CI) | 2.4 (2.12.6) | 3.4 (3.03.9) | 2.6 (2.03.2) | 3.8 (3.34.2) | 0.01 |
| No. of patients hospitalized in prior 12 months, no (%) | 93 (32.8) | 44 (55.0) | 27 (55.1) | 54 (65.9) | 0.3 |
| Preadmission living situation, no (%) | 0.01 | ||||
| Living at home independently | 221 (77.8) | 26 (32.5) | 25 (51.0) | 17 (20.7) | |
| Living at home with help | 59 (20.8) | 43 (53.8) | 19 (38.8) | 48 (58.5) | |
| Assisted living or lodge | 4 (1.4) | 11 (13.8) | 5 (10.2) | 17 (20.7) | |
| EQ‐5D overall score, /100, mean (95% CI) | 66.9 (65.068.9) | 62.0 (57.666.4) | 56.6 (51.361.8) | 58.3 (53.962.7) | 0.28 |
| Goals of care in the hospital, no (%) | <0.0001 | ||||
| Resuscitation/ICU | 228 (83.5) | 41 (54.7) | 39 (84.8) | 29 (39.7) | |
| ICU but no resuscitation | 21(7.7) | 17 (22.7) | 1 (2.2) | 16 (21.9) | |
| No ICU, no resuscitation | 23 (8.4) | 17(22.7) | 6 (13.0) | 28 (37.8) | |
| Comfort care | 1 (0.4) | 0 | 0 | 0 | |
| Timed Up and Go Test, s, mean (95% CI) | 10.9 (10.411.3) | 13.9 (12.914.9) | 26.3 (19.033.6) | 30.3 (26.833.7) | <0.0001 |
| Grip strength, kg, mean (95% CI) | 32.1 (30.733.5) | 24.3 (22.3‐ 26.3) | 22.1 (19.924.2) | 17.7 (16.219.1) | <0.0001 |
| Serum albumin, g/L, mean (95% CI) | 34.2 (32.835.5) | 35.0 (33.037.0) | 31.1 (27.934.4) | 33.1 (31.434.9) | 0.07 |
| No. of prescription medications at discharge, mean (95% CI) | 5.2 (4.85.6) | 8.8 (7.99.6) | 6.1 (5.17.1) | 8.2 (7.58.9) | <0.0001 |
| Length of stay, d, median, [IQR] | 5 [37] | 6 [411] | 7 [3.512] | 7 [59] | 0.02 |
Outcomes According to Frailty Status
The overall rate of 30‐day death or hospital readmission was 17.1% (85 patients), primarily as a result of hospital readmissions (81, 16.4%) (Table 2). Although patients classified as frail on the CFS exhibited significantly higher 30‐day readmission/death rates (24.1% vs 13.8% for not frail, P = 0.005) even after adjusting for age and sex (adjusted odds ratio [aOR]: 2.02, 95% CI: 1.19‐3.41) (Table 3), patients meeting either of the phenotypic definitions for frailty but not the CFS definition were not at higher risk for 30‐day readmission/death (aOR: 0.87, 95% CI: 0.34‐2.19) (Table 3). The group at highest risk for 30‐day readmissions/death were those meeting both the CFS and either phenotypic definition of frailty (25.6% vs 13.8% for those not frail, aOR: 2.15, 95% CI: 1.10‐4.19) (Tables 2 and 3). None of the Integrated Discrimination Improvement indices (for modified Fried added to CFS or TUGT added to CFS) were statistically significant, suggesting no net new information was added to predictive models, and there were no appreciable changes in C statistics (Table 3). Neither the modified Fried score nor the TUGT on their own added independent prognostic information to age/sex alone as predictors of postdischarge outcomes. It is noteworthy that the areas under the curve for models using any combination of the frailty definitions plus age and sex were not high (all ranged between 0.55 and 0.60 for the overall cohort and from 0.52 and 0.65 in the elderly). If the frailty definitions were examined as continuous variables rather than dichotomized into frail/not frail, the C statistics were not appreciably better: 0.65 for CFS, 0.58 for TUGT, and 0.60 for modified Fried. Of note, the CFS score with the published cutoff of 5 demonstrated the highest kappa, sensitivity, specificity, and positive predictive value in relation to outcomes.
| Outcomes (Not Mutually Exclusive) | Not Frail on Any of the 3 Models | Frail on the CFS Only | Frail on the Fried and/or TUGT | Frail on CFS and Either Phenotype Model | P Value Comparing the 3 Frailty Columns |
|---|---|---|---|---|---|
| |||||
| Entire cohort | n = 284 | n = 80 | n = 49 | n = 82 | |
| Discharge disposition | <0.002 | ||||
| Live at home independently | 203 (71.5) | 16 (20.0) | 19 (38.8) | 10 (12.2) | |
| Live at home with help | 77 (27.1) | 52 (65.0) | 25 (51.0) | 50 (61.0) | |
| Assisted living or lodge | 4 (9.3) | 12 (15.0) | 5 (10.2) | 22 (26.8) | |
| 30‐day readmission or death | 40 (14.1) | 18 (22.5) | 6 (12.2) | 21 (25.6) | 0.2 |
| 30‐day hospital readmission | 39 (13.8) | 18 (22.5) | 6 (12.2) | 18 (22.0) | 0.31 |
| Death | 5 (1.8) | 3 (3.8) | 1 (2.0) | 4 (4.9) | 0.9 |
| 30‐day ER visit | 66 (23.2) | 30 (37.5) | 12 (24.5) | 23 (17.6) | 0.25 |
| Patients aged 65 years or older | n = 108 | n = 47 | n = 27 | n = 63 | |
| Discharge disposition | 0.03 | ||||
| Live at home independently | 69 (63.9) | 9 (19.2) | 10 (37.0) | 6 (9.5) | |
| Live at home with help | 36 (33.3) | 30 (63.8) | 13 (48.2) | 39(61.9) | |
| Assisted living or lodge | 3 (3.8) | 8 (17.0) | 4 (14.8) | 18 (28.6) | |
| 30‐day readmission or death | 13 (12.0) | 13 (27.7) | 3 (11.1) | 17 (27.0) | 0.22 |
| 30‐day hospital readmission | 12 (11.1) | 13 (27.7) | 3 (11.1) | 14 (22.2) | 0.26 |
| Death | 2 (1.9) | 3 (6.4) | 1 (3.7) | 3 (4.8) | 0.87 |
| 30‐day ER visit | 20 (18.5) | 17 (36.2) | 6 (22.2) | 18 (28.6) | 0.45 |
| Frailty Definition | Adjusted Odds Ratio for 30‐Day Readmission/Death | 95% CI | C Statistic for Model Predicting 30‐Day Readmission/Death Including Age, Sex, and Frailty Definition (95% CI) |
|---|---|---|---|
| |||
| Entire cohort | |||
| CFS (overall) | 2.02 | 1.193.41 | 0.60 (0.530.65) |
| CFS (plus either phenotype model) | 2.15 | 1.104.19 | 0.60 (0.520.64) |
| CFS (but neither phenotype model) | 1.81 | 0.943.48 | 0.60 (0.520.64) |
| Fried | 1.32 | 0.752.30 | 0.55 (0.560.58) |
| TUGT | 1.34 | 0.732.44 | 0.55 (0.460.58) |
| Fried and/or TUGT | 0.87 | 0.342.19 | 0.55 (0.470.58) |
| Patients aged 65 years or older | |||
| CFS (overall) | 3.20 | 1.556.60 | 0.65 (0.560.73) |
| CFS (plus either phenotype model) | 3.20 | 1.337.68 | 0.65 (0.550.72) |
| CFS (but neither phenotype model) | 3.08 | 1.267.47 | 0.65 (0.550.72) |
| Fried | 1.28 | 0.642.56 | 0.52 (0.390.53) |
| TUGT | 1.44 | 0.702.97 | 0.52 (0.390.53) |
| Fried and/or TUGT | 1.41 | 0.722.78 | 0.54 (0.420.56) |
Outcomes According to Frailty Status in the Elderly Subgroup
Although absolute risks of readmission or death were higher in elderly patients than younger patients, the excess risk was largely seen in those elderly patients classified as frail on the CFS. In fact, all of the associations reported above for the entire cohort were in the same direction in the elderly subgroup (Tables 2 and 3).
DISCUSSION
In summary, we found that of patients being discharged from general medical wards who were frail according to at least 1 of the 3 tools we used, only 22% met all 3 frailty case definitions (including only 28% of elderly patients deemed frail by at least 1 definition). There was surprisingly poor correlation between phenotypic markers of frailty such as poor mobility (slow TUGT) or the modified Fried Index and the CFS, even amongt elderly patients. The most clinically useful of the frailty assessment tools (both overall and in those patients who are elderly) appears to be the CFS, because it more accurately identifies those at higher risk of adverse outcomes after discharge, does not require special equipment to conduct, and is faster to do than the phenotypic assessment models we tested. We have also previously demonstrated that the CFS, after a brief training period identical to that used in this study, is reproducible between observers[19] and remains an independent predictor of adverse 30‐day outcomes even after adjusting for age, sex, comorbidities, and the LACE (length of stay, acuity of the admission, comorbidity, emergency room visits during the previous 6 months) score.[14]
Although some[10] have advocated for the use of mobility assessments (such as gait speed) as a frailty marker due to its ease of measurement and objectivity, we found that slow TUGT (which is a marker for mobility and not just slow gait speed) was not an independent prognostic marker for postdischarge outcomes. We hypothesize that the phenotypic models of frailty performed less well than the CFS as they focus on the measurement of particular physical attributes and do not take into account cognitive or psychosocial characteristics or comorbidity burden that also influence postdischarge outcomes. As well, the CFS captures the patients' baseline status prior to acute illness, whereas the phenotypic measures were assessed just prior to discharge and thus may provide less information about eventual recovery potential. Some have suggested that repeating phenotype measures postdischarge might be more informative,[20] but this would reduce clinical applicability a great deal. Certainly, an analysis[21] of the Cardiovascular Health Study cohort demonstrated that cumulative deficit models of frailty (for which the CFS is an accurate proxy[9, 15]) better predicted risk of death than phenotypic models.
Although a number of published studies have shown similar results to ours in that frail patients are at greater risk for death and/or hospitalization,[22, 23, 24] there is surprisingly little literature on the comparative predictive performance of the different frailty instruments and the extent to which they overlap. Cigolle et al.[25] compared 3 frailty scales (the Functional Domain Model, the Burden Model, and the Fried score) in the Health and Retirement Study and, similarly to us, found that although 30.2% were frail on at least 1 of these scales, only 3.1% were deemed frail by all 3. The Conselice Study of Brain Aging[5] also reported that a deficit accumulation model defined a much higher prevalence of frailty (37.6%) than the 11.6% identified using the phenotypic Study of Osteoporotic Fractures (SOF) index based on weight loss, mobility, and level of energy. Another study[26] reported that risk models incorporating either the SOF index or the Fried score exhibited C statistics of only 0.61 for predicting falls in elderly females. A cohort study[27] from 2 English general medical units also found that none of the 5 frailty models was particularly accurate at predicting risk of readmission at 3 months, with C statistics ranging between 0.52 and 0.57. Although frailty assessment at time of hospital admission predicted in‐hospital mortality and length of stay in another English study, it was not independently associated with 30‐day outcomes after adjusting for age, sex, and comorbidities including dementia.[27] To our knowledge, these latter 2 are the only other studies reported to date performed in hospitalized patients to assess whether frailty assessment helps predict postdischarge outcomes. Thus, the poor C statistics we found for all of our frailty tools confirms prior literature that frailty assessment alone is inadequate to accurately identify those patients at highest risk for poor outcomes in the first 30 days after discharge. However, frailty assessment together with consideration of each individual's comorbidities, cognitive status, psychosocial circumstances, and environment can be useful to flag those individuals who may need extra attention postdischarge to optimize outcomes.
Strengths and Limitations
Although this was a prospective cohort study with blinded ascertainment of endpoints (30‐day outcome data were collected by observers who were unaware of the patients' CFS or phenotypic model scores), it is not without limitations. First, the only postdischarge outcomes we assessed were readmission and death, and it would be interesting to evaluate which frailty tools best predict those who are most likely to benefit from home‐care services in the community. Second, as we were interested in 30‐day readmission rates, we excluded long‐term care residents from our study and patients who had foreshortened life expectancy, in essence, the frailest of the frail. Although this reduced the size of any association between frailty and adverse outcomes, we focused this study on the situations where there is clinical equipoise and there is rarely a diagnostic dilemma around the identification of frailty and need for increased services in palliative or long‐term care patients. Third, we did not use exactly the same questionnaires or gait speed assessments as used in the original Fried score description, but as outlined in the Methods section, we used analogous questions on closely related questionnaires to extract the same information. Fourth, some might consider our comparisons biased toward the CFS, as it reflects gestalt clinical impressions (informed by patients and proxies) of frailty status before hospital admission while the Fried score and TUGT were based on patient status just prior to discharge, it may be that the former is a better measure of eventual recovery (and ongoing risk) than the latter measures. If this is the case, for the purposes of targeting interventions to prevent postdischarge complications, it would suggest to us that the CFS is better suited, whereas phenotype tools can be reserved for the postdischarge phase of recovery. By the same token, perhaps serial measures of the CFS and phenotypic tools are more important, as the trajectory of recovery may be most informative for risk prediction.[7] Certainly, if one were interested in changes in functional status during hospitalization,[29] then objective phenotypic measures such as grip strength or TUGT times would seem more appropriate choices. Fifth, some may perceive it as a weakness that we did not restrict our cohort to elderly patients; however, we actually view this as a strength, because frailty is not exclusive to older patients. Sixth, although we restricted this study to patients being discharged from general internal medicine wards, it is worth mentioning that previous studies have shown similar associations between frailty and outcomes in nonmedical hospitalized patients.[19, 22, 23, 24]
In conclusion, we looked at 3 different ways of screening for frailty, 1 being a subjective but well‐validated tool (the CFS) and the other 2 being objective assessments that look at specific phenotypic characteristics. There is a compelling need to find a standardized assessment to determine frailty in both research and clinical settings, and our study provides support for use of the CFS over the Fried or TUGT as screening tools. Standardized frailty assessments should be part of the discharge planning for all medical patients so that extra resources can be properly targeted at those patients at greatest risk for suboptimal transition back to community living.
Acknowledgements
The authors acknowledge Miriam Fradette and Debbie Boyko for their important contributions in data acquisition, as well as all the physicians rotating through the general internal medicine wards for their help in identifying the patients.
Disclosures: Author contributions are as follows: study concept and design: Finlay A. McAlister, Sumit R. Majumdar, and Raj Padwal; acquisition of patients and data: Sara Belga, Darren Lau, Jenelle Pederson, and Sharry Kahlon; analysis of data: Jeff Bakal, Sara Belga, Finlay A. McAlister; first draft of manuscript: Sara Belga and Finlay A. McAlister; critical revision of manuscript: all authors. Funding for this study was provided by an operating grant from Alberta InnovatesHealth Solutions. Alberta InnovatesHealth Solutions had no role in role in the design, methods, subject recruitment, data collections, analysis, or preparation of the article. Finlay A. McAlister and Sumit R. Majumdar hold career salary support from Alberta InnovatesHealth Solutions. Finlay A. McAlister holds the Chair in Cardiovascular Outcomes Research at the Mazankowski Heart Institute, University of Alberta. Sumit R. Majumdar holds the Endowed Chair in Patient Health Management from the Faculty of Medicine and Dentistry, and the Faculty of Pharmacy and Pharmaceutical Sciences, University of Alberta. The authors have no affiliations or financial interests with any organization or entity with a financial interest in the contents of this article. All authors had access to the data and played a role in writing and revising this article. The authors declare no conflicts of interest.
- , , , , . Untangling the concepts of disability, frailty, and comorbidity: implications for improved targeting and care. J Gerontol A Biol Sci Med Sci. 2004;59:255–263.
- , , , , . The identification of frailty: a systematic literature review. J Am Geriatr Soc. 2011;59:2129–2138.
- , , , , . Frailty in elderly people. Lancet. 2013;381:752–762.
- , , , , , . Outcome instruments to measure frailty: a systematic review. Ageing Res Rev. 2011;10:104–114.
- , , , , , . A comparison of frailty indexes for prediction of adverse health outcomes in a elderly cohort. Arch Gerontol Geriatr. 2012;54:16–20.
- , , , et al. Frailty in older adults: evidence for a phenotype. J Gerontol A Biol Sci Med Sci. 2001;56:M146–M156.
- , , , . Prevalence of frailty in community‐dwelling older persons: a systematic review. J Am Geriatr Soc. 2012;60:1487–1492.
- , , . Sex differences in the risk of frailty for mortality independent of disability of chronic diseases. J Am Geriatr Soc. 2005;53:40–47.
- , , . A comparison of two approaches to measuring frailty in elderly people. J Gerontol. 2007;62:738–743.
- , , . A diagnosis of dismobility—giving mobility clinical visibility: a mobility working group recommendation. JAMA. 2014;311:2061–2062.
- , , , et al. Gait speed and survival in older adults. JAMA. 2011;301:50–58.
- , , , et al. Frailty assessment in the cardiovascular care of older adults. J Am Coll Cardiol. 2014;63:747–762.
- , . The timed “Up and Go” test: a test of basic functional mobility for frail elderly persons. J Am Geriatr Soc. 1991;39:142–148.
- , , , et al. Association between frailty and 30‐day outcomes after discharge from hospital. CMAJ. 2015;187:799–804.
- , , , et al. A global clinical measure of fitness and frailty in elderly people. CMAJ. 2005;173:489–495.
- , , , et al. Do muscle mass, muscle density, strength, and physical function similarly influence risk of hospitalization in older adults? J Am Geriatr Soc. 2009;57:1411–1419.
- , . Grip strength in older adults: test‐retest reliability and cutoff for subjective weakness of using the hands in heavy tasks. Arch Phys Med Rehabil. 2010;91:1747–1751.
- , . The PHQ‐9: a new depression measure. Psychiatr Ann. 2002;32:509–515.
- , , , et al. Association between frailty and short‐ and long‐term outcomes among critically ill patients: a multicenter prospective cohort study. CMAJ. 2013;186:e95–e102.
- , . Risk after hospitalization: we have a lot to learn. J Hosp Med. 2015;10:135–136.
- , , , , , . Cumulative deficits better characterize susceptibility to death in elderly people than phenotypic frailty: lessons from the Cardiovascular Health Study. J Am Geriatr Soc. 2008;56:898–903.
- , , . Unplanned hospital readmission and its predictors in patients with chronic conditions. J Formos Med Assoc. 2002;101:779–785.
- , , , et al. Frailty and early hospital readmission after kidney transplant. Am J Transplant. 2013;13:2091–2095.
- , , , , , . Simple frailty score predicts postoperative complications across surgical specialities. Am J Surg. 2013;206:544–550.
- , , , . Comparing models of frailty: the Health and Retirement Study. J Am Geriatr Soc. 2009;57:830–839.
- , , , et al. Comparison of 2 frailty indexes for prediction of falls, disability, fractures, and death in older women. Arch Int Med. 2008;168:382–389.
- , , , , , . The predictive properties of frailty‐rating scales in the acute medical unit. Age Ageing. 2013;42:776–781.
- , , , . Association of the clinical frailty scale with hospital outcomes. QJM. 2015;108:943–949.
- , , . Hospitalization‐associated disability: she was probably able to ambulate, but I'm not sure. JAMA. 2011;306:1782–1793.
Frailty is a state of vulnerability that encompasses a heterogeneous group of people.[1] Because it lacks a precise definition, multiple tools have been developed to identify frailty in both clinical and research settings.[2, 3, 4] Prevalence of frailty depends on the frailty assessment tool used and the population studied, ranging from 4% to 17% when the Fried score[5, 6, 7] is used and from 5% to 44%[5, 7, 8] when cumulative deficit models like the Frailty Index are utilized, with the lower prevalences being in younger community‐dwelling elderly populations and the higher proportions being in older institutionalized populations.
The Frailty Index, also called the Burden or Cumulative Deficit Model, comprises 70 domains that include mobility, mood, function, cognitive impairment, and disease states. It is multidimensional and allows for patients to be categorized on a continuum of frailty, but it is extremely difficult to apply in clinical practice. Recognizing this, Rockwood et al.[9] developed and validated the Clinical Frailty Scale (CFS) in the Canadian Study of Health and Aging. The CFS classifies patients into 1 of 9 categories: very fit, well, managing well, vulnerable, mildly frail (needs help with at least 1 instrumental activity of daily living such as shopping, finances, meal preparation, or housework), moderately frail (needs help with 1 or 2 activities of daily living such as bathing and dressing), severely frail (dependent for personal care), very severely frail (bedbound), and terminally ill. Although this tool is easy to use in clinical practice, it reflects a gestalt impression and requires some clinical judgement.
The Fried score[6] is a prototypical phenotype tool based on 5 criteria that include weight loss, self‐reported exhaustion, low energy expenditure, slowness of gait, and weakness. Recent evidence has suggested that slow gait (or dysmobility) alone may also be a potential screening test for frailty.[10] A recent systematic review[11] demonstrated an association between slow gait (dysmobility) and increased mortality. Dysmobility negatively impacts quality of life and has a strong association with disability resulting in the need for an increased level of care.[12] The Timed Up and Go Test (TUGT) is one method of assessing mobility which is relatively easy to perform, does not require special equipment, and is feasible to use in clinical settings.[13] However, whether impaired mobility predicts outcomes within the first 30 days after hospital discharge (a timeframe highlighted in the Affordable Care Act and used by the Centers for Medicare and Medicaid Services as an important hospital quality indicator) is still uncertain.
The aim of this study was to compare frailty assessments using the CFS and 2 of the most commonly used phenotypic tools (a modified Fried score and the TUGT as a proxy for mobility assessment) to determine which tools best predict postdischarge outcomes.
METHODS
Study Design and Population
As described in detail elsewhere,[14] this was a prospective cohort study that enrolled adult patients (any age older than 18 years) at the time of discharge back to the community from 7 general internal medicine wards in 2 teaching hospitals in Edmonton, Alberta between October 2013 and November 2014. We excluded patients admitted from, or being discharged back to, long‐term care facilities or other acute care hospitals, or from out of the province; patients who were unable to communicate in English; patients with moderate or severe cognitive impairment (scoring 5 or more on the Short Portable Mental Status Questionnaire); or patients with projected life expectancy of less than 3 months. All patients provided written consent, and the study was approved by the Health Research Ethics board of the University of Alberta (project ID Pro00036880).
We assessed the degree of frailty within 24 hours of discharge in 3 ways. First, we used the CFS[9, 15] with patients being asked to rate their best functional status in the week prior to admission. As per the CFS validations studies, scores 5 were defined as frail.[9, 15] Second, we used the TUGT as a proxy for slow gait speed/dysmobility (with >20 seconds defined as abnormal).[13] The TUGT was recorded as the shortest recorded time of the 2 timed trials to get up from a seated position, walk 10 feet and back, and then sit in the chair again. Third, we also determined their Fried score[6] (using the modifications outlined below) and categorized the patients as frail if they scored 3 or more. Of the 5 Fried categories, we assessed weakness by grip strength in their dominant hand using a Jamar handheld dynamometer and weight loss of 10 lb or more in the past year based on patient self‐report; these are identical to the original Fried scale description. Grip strength in the lowest quintile for sex and body mass index was defined as weak grip strength as per convention in the literature, which corresponded to less than 28.5 kg for men and less than 18.5 kg for women.[16, 17] We assessed the other 3 Fried categories in modified fashion as follows. For slow gait, rather than assessing time to walk 15 feet as in the original study and assigning a point to those testing in the lowest quintile for their age/sex, we used the TUGT, because our research personnel were already trained in this test, and we were doing it already as part of the discharge package for all patients.[13] For the Fried category of low activity, we based this on patient self‐report using the relevant questions in the EuroQoL Questionnaire (EQ‐5D); the Fried score used self‐report with a different questionnaire. Finally, for self‐reported exhaustion we used the questions in the Patient Health Questionnaire 9 (PHQ‐9)[18] analogous to those used from the Center for Epidemiological Studies depression scale in the original Fried description. We did this as we were evaluating the PHQ‐9 in our cohort already, and did not want to increase responder burden by presenting them with 2 depression questionnaires.
We followed all patients until 30 days after discharge, and outcome data (all‐cause mortality or all‐cause readmission) were collected by research personnel blinded to the patient's frailty status at discharge using patient/caregiver self‐report and analysis of the provincial electronic health record. We included deaths in or out of the hospital, and all readmissions were unplanned.
We examined the correlation between the CFS score (5 vs <5) and (1) the modified Fried score (3 vs <3) and (2) TUGT (20 seconds vs >20 seconds) using chance corrected kappa coefficients. In our previous article[14] we reported the association between the CFS and readmissions/hospitalizations within 30 days of discharge. In this article we examine whether either the Fried score or TUGT accurately and independently predict postdischarge readmissions/deaths, and whether they add additional prognostic information to the CFS assessment by comparing models with/without each definition using the C statistic and the Integrated Discrimination Improvement index. All analyses were performed using SAS version 9.4 (SAS Institute, Cary, NC), with P values of <0.05 considered statistically significant. Subgroup analysis was done in patients older than 65 years.
RESULTS
Of 1124 potentially eligible patients, 626 were excluded because of patient refusal (n = 227); transfer to/from another hospital, long‐term care facility, or out of province (n = 189); moderate to severe cognitive impairment (n = 88); language barriers (n = 71); or foreshortened life expectancy (n = 51). Another 3 patients withdrew consent prior to outcome assessment. The 495 patients we recruited and had outcome data for had a mean age of 64 years, 19.6% were older than 80 years, 50% were women, and the patients had a mean of 4.2 comorbidities and mean Charlson score of 2.4. The 4 most common reasons for hospital admission were heart failure, pneumonia, chronic obstructive pulmonary disease, and urinary tract infection, and the median length of stay was 5 days (interquartile range: 49 days).
Prevalence of Frailty According to Different Definitions
Although the CFS assessment resulted in 162 (33%) patients being deemed frail, only 82 (51%) of those patients also met the phenotype frailty definition using either the Fried model or the TUGT, and 49 (10%) patients who were not classified as frail on the CFS met either of the phenotypic definitions of frailty (Figure 1). Overall, 211 (43%) patients were frail according to at least 1 assessment, and 46 (9%) met all 3 frailty definitions. In the subgroup of 245 patients older than 65 years, 137 (56%) were frail according to at least 1 assessment, 38 (16%) met all 3 frailty definitions, and 27 (11%) of those patients classified as not frail on the CFS met either phenotypic definition of frailty. Agreement between TUGT and CFS or CFS and Fried was relatively poor with kappas of 0.31 (95% confidence interval [CI]: 0.23‐0.40) and 0.33 (95% CI: 0.25‐0.42), respectively. It is noteworthy that some patients deemed nonfrail on the CFS had slow gait speeds, and most CFS‐frail patients had gait speeds in the nonfrail range (Figure 2).
Characteristics According to Frailty Status
Although frail patients were generally similar across definitions (Table 1) in that they were older, had more comorbidities, more hospitalizations in the prior year, and longer index hospitalization lengths of stay than nonfrail patients, patients meeting phenotypic definitions of frailty but not classified as frail on the CFS were younger, had lower Charlson scores, higher EQ‐5D scores, and were discharged with less medications (Table 1).
| Not Frail on Any of the 3 Models, n = 284 | Frail on the CFS Only, n = 80 | Frail on the Fried and/or TUGT but Not the CFS, n = 49 | Frail on CFS and Either Phenotype Model, n = 82 | P Value Comparing the 3 Frailty Columns | |
|---|---|---|---|---|---|
| |||||
| Age, y, mean (95% CI) | 57.3 (55.259.5) | 69.1 (65.872.3) | 63.1 (57.968.3) | 75.8 (72.679.0) | <0.001 |
| Sex, female, no (%) | 118 (41.6) | 49 (61.3) | 27 (55.1) | 56 (68.3) | 0.3 |
| No. of comorbidities, mean (95% CI) | 4.2 (3.84.5) | 6.0 (5.56.6) | 4.0 (3.14.9) | 6.5 (5.87.2) | <0.001 |
| Charlson comorbidity score, mean (95% CI) | 2.4 (2.12.6) | 3.4 (3.03.9) | 2.6 (2.03.2) | 3.8 (3.34.2) | 0.01 |
| No. of patients hospitalized in prior 12 months, no (%) | 93 (32.8) | 44 (55.0) | 27 (55.1) | 54 (65.9) | 0.3 |
| Preadmission living situation, no (%) | 0.01 | ||||
| Living at home independently | 221 (77.8) | 26 (32.5) | 25 (51.0) | 17 (20.7) | |
| Living at home with help | 59 (20.8) | 43 (53.8) | 19 (38.8) | 48 (58.5) | |
| Assisted living or lodge | 4 (1.4) | 11 (13.8) | 5 (10.2) | 17 (20.7) | |
| EQ‐5D overall score, /100, mean (95% CI) | 66.9 (65.068.9) | 62.0 (57.666.4) | 56.6 (51.361.8) | 58.3 (53.962.7) | 0.28 |
| Goals of care in the hospital, no (%) | <0.0001 | ||||
| Resuscitation/ICU | 228 (83.5) | 41 (54.7) | 39 (84.8) | 29 (39.7) | |
| ICU but no resuscitation | 21(7.7) | 17 (22.7) | 1 (2.2) | 16 (21.9) | |
| No ICU, no resuscitation | 23 (8.4) | 17(22.7) | 6 (13.0) | 28 (37.8) | |
| Comfort care | 1 (0.4) | 0 | 0 | 0 | |
| Timed Up and Go Test, s, mean (95% CI) | 10.9 (10.411.3) | 13.9 (12.914.9) | 26.3 (19.033.6) | 30.3 (26.833.7) | <0.0001 |
| Grip strength, kg, mean (95% CI) | 32.1 (30.733.5) | 24.3 (22.3‐ 26.3) | 22.1 (19.924.2) | 17.7 (16.219.1) | <0.0001 |
| Serum albumin, g/L, mean (95% CI) | 34.2 (32.835.5) | 35.0 (33.037.0) | 31.1 (27.934.4) | 33.1 (31.434.9) | 0.07 |
| No. of prescription medications at discharge, mean (95% CI) | 5.2 (4.85.6) | 8.8 (7.99.6) | 6.1 (5.17.1) | 8.2 (7.58.9) | <0.0001 |
| Length of stay, d, median, [IQR] | 5 [37] | 6 [411] | 7 [3.512] | 7 [59] | 0.02 |
Outcomes According to Frailty Status
The overall rate of 30‐day death or hospital readmission was 17.1% (85 patients), primarily as a result of hospital readmissions (81, 16.4%) (Table 2). Although patients classified as frail on the CFS exhibited significantly higher 30‐day readmission/death rates (24.1% vs 13.8% for not frail, P = 0.005) even after adjusting for age and sex (adjusted odds ratio [aOR]: 2.02, 95% CI: 1.19‐3.41) (Table 3), patients meeting either of the phenotypic definitions for frailty but not the CFS definition were not at higher risk for 30‐day readmission/death (aOR: 0.87, 95% CI: 0.34‐2.19) (Table 3). The group at highest risk for 30‐day readmissions/death were those meeting both the CFS and either phenotypic definition of frailty (25.6% vs 13.8% for those not frail, aOR: 2.15, 95% CI: 1.10‐4.19) (Tables 2 and 3). None of the Integrated Discrimination Improvement indices (for modified Fried added to CFS or TUGT added to CFS) were statistically significant, suggesting no net new information was added to predictive models, and there were no appreciable changes in C statistics (Table 3). Neither the modified Fried score nor the TUGT on their own added independent prognostic information to age/sex alone as predictors of postdischarge outcomes. It is noteworthy that the areas under the curve for models using any combination of the frailty definitions plus age and sex were not high (all ranged between 0.55 and 0.60 for the overall cohort and from 0.52 and 0.65 in the elderly). If the frailty definitions were examined as continuous variables rather than dichotomized into frail/not frail, the C statistics were not appreciably better: 0.65 for CFS, 0.58 for TUGT, and 0.60 for modified Fried. Of note, the CFS score with the published cutoff of 5 demonstrated the highest kappa, sensitivity, specificity, and positive predictive value in relation to outcomes.
| Outcomes (Not Mutually Exclusive) | Not Frail on Any of the 3 Models | Frail on the CFS Only | Frail on the Fried and/or TUGT | Frail on CFS and Either Phenotype Model | P Value Comparing the 3 Frailty Columns |
|---|---|---|---|---|---|
| |||||
| Entire cohort | n = 284 | n = 80 | n = 49 | n = 82 | |
| Discharge disposition | <0.002 | ||||
| Live at home independently | 203 (71.5) | 16 (20.0) | 19 (38.8) | 10 (12.2) | |
| Live at home with help | 77 (27.1) | 52 (65.0) | 25 (51.0) | 50 (61.0) | |
| Assisted living or lodge | 4 (9.3) | 12 (15.0) | 5 (10.2) | 22 (26.8) | |
| 30‐day readmission or death | 40 (14.1) | 18 (22.5) | 6 (12.2) | 21 (25.6) | 0.2 |
| 30‐day hospital readmission | 39 (13.8) | 18 (22.5) | 6 (12.2) | 18 (22.0) | 0.31 |
| Death | 5 (1.8) | 3 (3.8) | 1 (2.0) | 4 (4.9) | 0.9 |
| 30‐day ER visit | 66 (23.2) | 30 (37.5) | 12 (24.5) | 23 (17.6) | 0.25 |
| Patients aged 65 years or older | n = 108 | n = 47 | n = 27 | n = 63 | |
| Discharge disposition | 0.03 | ||||
| Live at home independently | 69 (63.9) | 9 (19.2) | 10 (37.0) | 6 (9.5) | |
| Live at home with help | 36 (33.3) | 30 (63.8) | 13 (48.2) | 39(61.9) | |
| Assisted living or lodge | 3 (3.8) | 8 (17.0) | 4 (14.8) | 18 (28.6) | |
| 30‐day readmission or death | 13 (12.0) | 13 (27.7) | 3 (11.1) | 17 (27.0) | 0.22 |
| 30‐day hospital readmission | 12 (11.1) | 13 (27.7) | 3 (11.1) | 14 (22.2) | 0.26 |
| Death | 2 (1.9) | 3 (6.4) | 1 (3.7) | 3 (4.8) | 0.87 |
| 30‐day ER visit | 20 (18.5) | 17 (36.2) | 6 (22.2) | 18 (28.6) | 0.45 |
| Frailty Definition | Adjusted Odds Ratio for 30‐Day Readmission/Death | 95% CI | C Statistic for Model Predicting 30‐Day Readmission/Death Including Age, Sex, and Frailty Definition (95% CI) |
|---|---|---|---|
| |||
| Entire cohort | |||
| CFS (overall) | 2.02 | 1.193.41 | 0.60 (0.530.65) |
| CFS (plus either phenotype model) | 2.15 | 1.104.19 | 0.60 (0.520.64) |
| CFS (but neither phenotype model) | 1.81 | 0.943.48 | 0.60 (0.520.64) |
| Fried | 1.32 | 0.752.30 | 0.55 (0.560.58) |
| TUGT | 1.34 | 0.732.44 | 0.55 (0.460.58) |
| Fried and/or TUGT | 0.87 | 0.342.19 | 0.55 (0.470.58) |
| Patients aged 65 years or older | |||
| CFS (overall) | 3.20 | 1.556.60 | 0.65 (0.560.73) |
| CFS (plus either phenotype model) | 3.20 | 1.337.68 | 0.65 (0.550.72) |
| CFS (but neither phenotype model) | 3.08 | 1.267.47 | 0.65 (0.550.72) |
| Fried | 1.28 | 0.642.56 | 0.52 (0.390.53) |
| TUGT | 1.44 | 0.702.97 | 0.52 (0.390.53) |
| Fried and/or TUGT | 1.41 | 0.722.78 | 0.54 (0.420.56) |
Outcomes According to Frailty Status in the Elderly Subgroup
Although absolute risks of readmission or death were higher in elderly patients than younger patients, the excess risk was largely seen in those elderly patients classified as frail on the CFS. In fact, all of the associations reported above for the entire cohort were in the same direction in the elderly subgroup (Tables 2 and 3).
DISCUSSION
In summary, we found that of patients being discharged from general medical wards who were frail according to at least 1 of the 3 tools we used, only 22% met all 3 frailty case definitions (including only 28% of elderly patients deemed frail by at least 1 definition). There was surprisingly poor correlation between phenotypic markers of frailty such as poor mobility (slow TUGT) or the modified Fried Index and the CFS, even amongt elderly patients. The most clinically useful of the frailty assessment tools (both overall and in those patients who are elderly) appears to be the CFS, because it more accurately identifies those at higher risk of adverse outcomes after discharge, does not require special equipment to conduct, and is faster to do than the phenotypic assessment models we tested. We have also previously demonstrated that the CFS, after a brief training period identical to that used in this study, is reproducible between observers[19] and remains an independent predictor of adverse 30‐day outcomes even after adjusting for age, sex, comorbidities, and the LACE (length of stay, acuity of the admission, comorbidity, emergency room visits during the previous 6 months) score.[14]
Although some[10] have advocated for the use of mobility assessments (such as gait speed) as a frailty marker due to its ease of measurement and objectivity, we found that slow TUGT (which is a marker for mobility and not just slow gait speed) was not an independent prognostic marker for postdischarge outcomes. We hypothesize that the phenotypic models of frailty performed less well than the CFS as they focus on the measurement of particular physical attributes and do not take into account cognitive or psychosocial characteristics or comorbidity burden that also influence postdischarge outcomes. As well, the CFS captures the patients' baseline status prior to acute illness, whereas the phenotypic measures were assessed just prior to discharge and thus may provide less information about eventual recovery potential. Some have suggested that repeating phenotype measures postdischarge might be more informative,[20] but this would reduce clinical applicability a great deal. Certainly, an analysis[21] of the Cardiovascular Health Study cohort demonstrated that cumulative deficit models of frailty (for which the CFS is an accurate proxy[9, 15]) better predicted risk of death than phenotypic models.
Although a number of published studies have shown similar results to ours in that frail patients are at greater risk for death and/or hospitalization,[22, 23, 24] there is surprisingly little literature on the comparative predictive performance of the different frailty instruments and the extent to which they overlap. Cigolle et al.[25] compared 3 frailty scales (the Functional Domain Model, the Burden Model, and the Fried score) in the Health and Retirement Study and, similarly to us, found that although 30.2% were frail on at least 1 of these scales, only 3.1% were deemed frail by all 3. The Conselice Study of Brain Aging[5] also reported that a deficit accumulation model defined a much higher prevalence of frailty (37.6%) than the 11.6% identified using the phenotypic Study of Osteoporotic Fractures (SOF) index based on weight loss, mobility, and level of energy. Another study[26] reported that risk models incorporating either the SOF index or the Fried score exhibited C statistics of only 0.61 for predicting falls in elderly females. A cohort study[27] from 2 English general medical units also found that none of the 5 frailty models was particularly accurate at predicting risk of readmission at 3 months, with C statistics ranging between 0.52 and 0.57. Although frailty assessment at time of hospital admission predicted in‐hospital mortality and length of stay in another English study, it was not independently associated with 30‐day outcomes after adjusting for age, sex, and comorbidities including dementia.[27] To our knowledge, these latter 2 are the only other studies reported to date performed in hospitalized patients to assess whether frailty assessment helps predict postdischarge outcomes. Thus, the poor C statistics we found for all of our frailty tools confirms prior literature that frailty assessment alone is inadequate to accurately identify those patients at highest risk for poor outcomes in the first 30 days after discharge. However, frailty assessment together with consideration of each individual's comorbidities, cognitive status, psychosocial circumstances, and environment can be useful to flag those individuals who may need extra attention postdischarge to optimize outcomes.
Strengths and Limitations
Although this was a prospective cohort study with blinded ascertainment of endpoints (30‐day outcome data were collected by observers who were unaware of the patients' CFS or phenotypic model scores), it is not without limitations. First, the only postdischarge outcomes we assessed were readmission and death, and it would be interesting to evaluate which frailty tools best predict those who are most likely to benefit from home‐care services in the community. Second, as we were interested in 30‐day readmission rates, we excluded long‐term care residents from our study and patients who had foreshortened life expectancy, in essence, the frailest of the frail. Although this reduced the size of any association between frailty and adverse outcomes, we focused this study on the situations where there is clinical equipoise and there is rarely a diagnostic dilemma around the identification of frailty and need for increased services in palliative or long‐term care patients. Third, we did not use exactly the same questionnaires or gait speed assessments as used in the original Fried score description, but as outlined in the Methods section, we used analogous questions on closely related questionnaires to extract the same information. Fourth, some might consider our comparisons biased toward the CFS, as it reflects gestalt clinical impressions (informed by patients and proxies) of frailty status before hospital admission while the Fried score and TUGT were based on patient status just prior to discharge, it may be that the former is a better measure of eventual recovery (and ongoing risk) than the latter measures. If this is the case, for the purposes of targeting interventions to prevent postdischarge complications, it would suggest to us that the CFS is better suited, whereas phenotype tools can be reserved for the postdischarge phase of recovery. By the same token, perhaps serial measures of the CFS and phenotypic tools are more important, as the trajectory of recovery may be most informative for risk prediction.[7] Certainly, if one were interested in changes in functional status during hospitalization,[29] then objective phenotypic measures such as grip strength or TUGT times would seem more appropriate choices. Fifth, some may perceive it as a weakness that we did not restrict our cohort to elderly patients; however, we actually view this as a strength, because frailty is not exclusive to older patients. Sixth, although we restricted this study to patients being discharged from general internal medicine wards, it is worth mentioning that previous studies have shown similar associations between frailty and outcomes in nonmedical hospitalized patients.[19, 22, 23, 24]
In conclusion, we looked at 3 different ways of screening for frailty, 1 being a subjective but well‐validated tool (the CFS) and the other 2 being objective assessments that look at specific phenotypic characteristics. There is a compelling need to find a standardized assessment to determine frailty in both research and clinical settings, and our study provides support for use of the CFS over the Fried or TUGT as screening tools. Standardized frailty assessments should be part of the discharge planning for all medical patients so that extra resources can be properly targeted at those patients at greatest risk for suboptimal transition back to community living.
Acknowledgements
The authors acknowledge Miriam Fradette and Debbie Boyko for their important contributions in data acquisition, as well as all the physicians rotating through the general internal medicine wards for their help in identifying the patients.
Disclosures: Author contributions are as follows: study concept and design: Finlay A. McAlister, Sumit R. Majumdar, and Raj Padwal; acquisition of patients and data: Sara Belga, Darren Lau, Jenelle Pederson, and Sharry Kahlon; analysis of data: Jeff Bakal, Sara Belga, Finlay A. McAlister; first draft of manuscript: Sara Belga and Finlay A. McAlister; critical revision of manuscript: all authors. Funding for this study was provided by an operating grant from Alberta InnovatesHealth Solutions. Alberta InnovatesHealth Solutions had no role in role in the design, methods, subject recruitment, data collections, analysis, or preparation of the article. Finlay A. McAlister and Sumit R. Majumdar hold career salary support from Alberta InnovatesHealth Solutions. Finlay A. McAlister holds the Chair in Cardiovascular Outcomes Research at the Mazankowski Heart Institute, University of Alberta. Sumit R. Majumdar holds the Endowed Chair in Patient Health Management from the Faculty of Medicine and Dentistry, and the Faculty of Pharmacy and Pharmaceutical Sciences, University of Alberta. The authors have no affiliations or financial interests with any organization or entity with a financial interest in the contents of this article. All authors had access to the data and played a role in writing and revising this article. The authors declare no conflicts of interest.
- , , , , . Untangling the concepts of disability, frailty, and comorbidity: implications for improved targeting and care. J Gerontol A Biol Sci Med Sci. 2004;59:255–263.
- , , , , . The identification of frailty: a systematic literature review. J Am Geriatr Soc. 2011;59:2129–2138.
- , , , , . Frailty in elderly people. Lancet. 2013;381:752–762.
- , , , , , . Outcome instruments to measure frailty: a systematic review. Ageing Res Rev. 2011;10:104–114.
- , , , , , . A comparison of frailty indexes for prediction of adverse health outcomes in a elderly cohort. Arch Gerontol Geriatr. 2012;54:16–20.
- , , , et al. Frailty in older adults: evidence for a phenotype. J Gerontol A Biol Sci Med Sci. 2001;56:M146–M156.
- , , , . Prevalence of frailty in community‐dwelling older persons: a systematic review. J Am Geriatr Soc. 2012;60:1487–1492.
- , , . Sex differences in the risk of frailty for mortality independent of disability of chronic diseases. J Am Geriatr Soc. 2005;53:40–47.
- , , . A comparison of two approaches to measuring frailty in elderly people. J Gerontol. 2007;62:738–743.
- , , . A diagnosis of dismobility—giving mobility clinical visibility: a mobility working group recommendation. JAMA. 2014;311:2061–2062.
- , , , et al. Gait speed and survival in older adults. JAMA. 2011;301:50–58.
- , , , et al. Frailty assessment in the cardiovascular care of older adults. J Am Coll Cardiol. 2014;63:747–762.
- , . The timed “Up and Go” test: a test of basic functional mobility for frail elderly persons. J Am Geriatr Soc. 1991;39:142–148.
- , , , et al. Association between frailty and 30‐day outcomes after discharge from hospital. CMAJ. 2015;187:799–804.
- , , , et al. A global clinical measure of fitness and frailty in elderly people. CMAJ. 2005;173:489–495.
- , , , et al. Do muscle mass, muscle density, strength, and physical function similarly influence risk of hospitalization in older adults? J Am Geriatr Soc. 2009;57:1411–1419.
- , . Grip strength in older adults: test‐retest reliability and cutoff for subjective weakness of using the hands in heavy tasks. Arch Phys Med Rehabil. 2010;91:1747–1751.
- , . The PHQ‐9: a new depression measure. Psychiatr Ann. 2002;32:509–515.
- , , , et al. Association between frailty and short‐ and long‐term outcomes among critically ill patients: a multicenter prospective cohort study. CMAJ. 2013;186:e95–e102.
- , . Risk after hospitalization: we have a lot to learn. J Hosp Med. 2015;10:135–136.
- , , , , , . Cumulative deficits better characterize susceptibility to death in elderly people than phenotypic frailty: lessons from the Cardiovascular Health Study. J Am Geriatr Soc. 2008;56:898–903.
- , , . Unplanned hospital readmission and its predictors in patients with chronic conditions. J Formos Med Assoc. 2002;101:779–785.
- , , , et al. Frailty and early hospital readmission after kidney transplant. Am J Transplant. 2013;13:2091–2095.
- , , , , , . Simple frailty score predicts postoperative complications across surgical specialities. Am J Surg. 2013;206:544–550.
- , , , . Comparing models of frailty: the Health and Retirement Study. J Am Geriatr Soc. 2009;57:830–839.
- , , , et al. Comparison of 2 frailty indexes for prediction of falls, disability, fractures, and death in older women. Arch Int Med. 2008;168:382–389.
- , , , , , . The predictive properties of frailty‐rating scales in the acute medical unit. Age Ageing. 2013;42:776–781.
- , , , . Association of the clinical frailty scale with hospital outcomes. QJM. 2015;108:943–949.
- , , . Hospitalization‐associated disability: she was probably able to ambulate, but I'm not sure. JAMA. 2011;306:1782–1793.
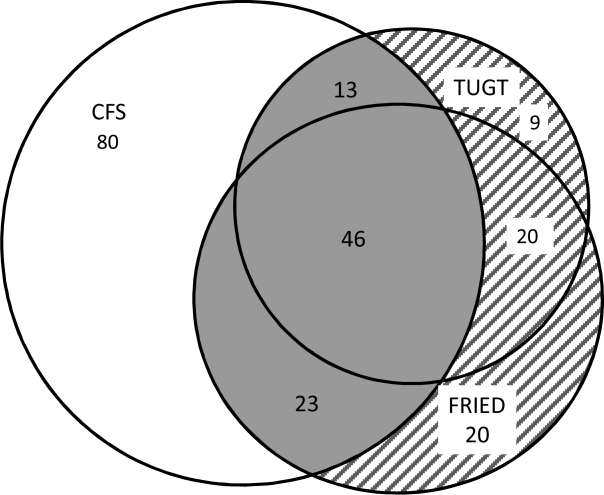
Hospital‐Wide Readmission Rates
The hospital‐wide all‐cause 30‐day readmission rate is a key quality measure associated with patient outcomes, cost of care, and wasted hospital resources.[1] The estimated 20% readmission rate of Medicare patients and the associated $17 billion annual cost of readmissions led the Centers for Medicare and Medicaid Services (CMS) to implement policies that limit reimbursement for 30‐day unplanned readmissions and thus place hospitals with high readmission rates at financial risk.[1, 2]
The variation in readmission rates between hospitals is well documented in the literature.[3, 4] Singh et al. found that 9.3% of the variation in readmissions can be explained by hospital characteristics.[4] Hospital factors associated with lower readmission rates include not‐for‐profit ownership, hospital size, and nursing staffing levels.[5, 6, 7] Other studies found an association between environmental factors such as the percent of patients living under the poverty line and higher readmission rates.[7] The recent publicly available CMS data on readmission rates allows us to further our understanding of hospital characteristics that explain the variation in readmission rates. In this article, we are specifically interested in hospitalist staffing levels and hospital‐physician arrangements such as physician integration level and physician ownership. Moreover, we are interested in novel organizational variables, specifically, the adoption of a medical home model, which has been ignored by previous research. Medical homes are associated with better quality[8]; hospitals that already adopted the medical home model might be better equipped to coordinate care after the patients are discharged.
In recent years, the number of hospitals relying on hospitalists to provide inpatient care has been on the rise. As more hospitals employ hospitalists, it is important to understand how hospitalist staffing levels are associated with quality. Previous studies have linked hospitalists with lower hospital mortality rates,[7] lower cost of care,[9, 10] and lower readmission rates.[10, 11] Goodrich et al., on the other hand, did not find a significant relationship between the presence of hospitalists and mortality or readmission rates.[12] In a recent study, hospitalists indicated that heavy workloads limited the time they had available to communicate with patients, which negatively influenced quality and patient satisfaction, and resulted in delayed admissions and discharges.[13]
The main objective of this article was therefore to study the association between hospitalist staffing levels and hospital‐wide all‐cause readmission rates. Most empirical studies examining the relationship between hospitalist staffing and quality of inpatient care have predominantly focused on whether the presence of hospitalists who provided care at a hospital influenced mortality or readmissions.[11, 12] In this article, we contribute to the literature by examining how staffing levels measured by the ratio of hospitalists to general medical and surgical beds is associated with 30‐day readmission rates. We predict that there is a positive association between readmission rates and hospitalists per bed.
Hospitals have a broad range of contractual arrangements or integration levels with physicians, with employment being the highest level. A hospital can rely on physicians who have admitting privileges but are not salaried employees of the hospital to treat a large portion of its inpatient population. In the past few years, with the passage of the Patient Protection and Affordable Care Act (2010) and the shift in reimbursement towards Value Based Purchasing (VBP), more hospitals are choosing to ensure that physicians are strongly integrated within the hospital by adopting an employment‐based model. Moreover, hospitals view physician employment as a strategic move that will help ensure or expand their market share.[14] For instance, the number of surgeons who identified as self‐employed dropped from 48% in 2001 to 28% in 2011, and this reduction is attributed to the shift toward hospital employment of physicians.[15] Despite the evolving models of hospital‐physician arrangements, little is understood on how the adoption of the integrated salary model, in addition to the equity and foundation models, which are classified by Baker et al. as the highest level of integration, influence quality.[16] Therefore, another objective of this article was to examine the association between hospital‐physician arrangements and all‐cause unplanned readmission rates.
METHODS
Data Source and Sample
Data from the American Hospital Association (AHA) Annual Survey (2013), CMS Hospital Compare (October 2013), and Area Health Resource File (2013) were merged to analyze the association between readmission rates with hospital characteristics and environmental factors. We limited the analysis to private (nonpublic) hospitals with no missing data. Our final sample consisted of 1756 hospitals. Of the hospitals in our sample, 14% were for profit, 70% were nonteaching, 23% were minor teaching, 7% were major teaching hospitals, 73% belonged to a system, and 31% were classified as small hospitals. Table 1 provides descriptive statistics for all the variables included in the analysis.
| Variable | Value | Data Source |
|---|---|---|
| ||
| 30‐day all‐cause readmissions, median (IQR) | 15.8% (15.2%16.5%) | Centers for Medicare and Medicaid Services |
| Hospitalists per general medicine and surgical beds, median (IQR) | 0.09 (0.060.15) | American Hospital Association |
| RNs per 100 inpatient days, median (IQR) | 0.84 (0.6610.10) | American Hospital Association |
| Medicare admissions, median (IQR) | 48.45% (40.84%55.14%) | American Hospital Association |
| Medicaid admissions, median (IQR) | 16.45% (11.06%22.76%) | American Hospital Association |
| Competition, median (IQR) | 0.56 (0.230.83) | American Hospital Association |
| Unemployment, median (IQR) | 2.9% (2.54%3.37%) | Area Resource File |
| Fully integrated | American Hospital Association | |
| Yes | 51% | |
| No | 49% | |
| Physician ownership | American Hospital Association | |
| Physician partial or complete ownership | 5% | |
| No physician ownership | 95% | |
| Established medical home program | American Hospital Association | |
| Yes | 29% | |
| No | 71% | |
| High technology | American Hospital Association | |
| Yes | 40% | |
| No | 60% | |
| Teaching level | American Hospital Association | |
| Nonteaching | 70% | |
| Minor teaching | 23% | |
| Major teaching | 7% | |
| Size | American Hospital Association | |
| Small | 31% | |
| Medium | 34% | |
| Large | 35% | |
| Ownership | American Hospital Association | |
| For profit | 14% | |
| Not for profit | 86% | |
| Critical access hospital | American Hospital Association | |
| Yes | 11% | |
| No | 89% | |
| System membership | American Hospital Association | |
| Yes | 73% | |
| No | 27% | |
Variables
Dependent Variable
Risk standardized 30‐day hospital‐wide all‐cause readmission rates (HWR) were obtained from CMS. This measure was publicly reported in October 2013. The HWR is estimated using standardized risk ratios at the hospital level for the following 5 discharge diagnosis groups: surgery/gynecology, neurology, cardiorespiratory, cardiovascular, and general medicine.[17] The measure adjusts, in addition to a hospital's case mix, for patients' ages, principal discharge diagnoses, and comorbidities.[17] HWR is calculated as a predicted‐to‐expected readmissions ratio. Predicted and expected readmissions were calculated for each of the 5 groups for each hospital using each hospital's patient mix and a hospital random effects estimate. A standardized readmission ratio was then derived by dividing predicted readmissions by expected readmissions for each group for each hospital. A single hospital score was obtained by multiplying the volume‐weighted logarithmic average of the 5 diagnostic groups by the average national readmission rate.[18]
Independent Variables
The primary independent variable of interest to this study is hospitalist staffing levels. We calculate the staffing levels of hospitalists by dividing the full‐time equivalent (FTE) of hospitalists by the number of general medical and surgical beds. FTE hospitalists are calculated by the AHA Annual Survey database (2013) as the sum of full‐time hospitalists and 0.5*number of part‐time hospitalists. In addition to hospitalist staffing levels, a main predictors is whether the hospital fully integrates physicians or not. We follow Baker et al. in our classification of full integration. Baker et al. define fully integrated hospitals as those that adopted 1 of the following models with their physicians: integrated salary, foundation or equity model.[16] We predict that fully integrated hospitals are more likely to have better readmission rates. Another key physician variable that is likely to influence outcomes is physician partial or full ownership of the hospital. Ownership aligns physicians' incentives with hospital performance[19] and is therefore likely to be associated with better readmission rates. We also include a dichotomous variable that indicates whether a hospital has an established medical home program or not. Medical homes indicate an organizational culture that is patient centered and committed to continuity and coordination of care; all of which are important for better quality. We predict that the presence of a medical home model will be associated with better readmission rates.
Control Variables
We control for registered nurses per 100 inpatient days ratio, critical access designation, Medicare share of hospital admissions, Medicaid share of hospital admissions, teaching status, size, and technology level. Previous research indicates that these variables are associated with patient outcomes.[20, 21] We follow the Aiken et al. characterization of teaching status: hospitals with no residency programs (nonteaching), hospitals with a resident‐to‐bed ratio of 1 to 4 or less (minor teaching), and hospitals with a resident‐to‐bed ratio of more than 1 to 4 (major teaching).[20] We also classify hospitals as small if they have less than 100 beds, medium if they have 101 to 250 beds, and large if they have more than 250 beds. We modify the Aiken et al. classification of technology level and control for the level of technology adopted at a hospital by classifying hospitals as high technology if they offer any of the following services: any major organ transplant, computer‐assisted orthopedic surgery, or electron beam computed tomography.[21] We also control for 2 market level variables: (1) competition estimated by the county level Herfindahl‐Hirschman Index (HHI) and (2) the percentage of individuals in the county who are unemployed. Unemployment rates are derived from the Area Health Resource File (2013). HHI is calculated by summing the squares of market shares of admissions. For ease of interpretation, competition is coded as 1‐HHI.
Statistical Analysis
We ran a multivariate ordinary least squares (OLS) regression on Stata 12 (StataCorp, College Station, TX) to assess the relationship between 30‐day all‐cause readmissions and hospitalist staffing levels, physician integration, physician ownership, and other organizational characteristics. We checked for multicollinearity by using a variance inflation factor (VIF). The VIF of all independent variables was less than 10, and therefore multicollinearity was not of concern to this analysis.
RESULTS
Among our sample of 1756 hospitals, the median 30‐day all‐cause readmission rate was 16%, with the middle 50% of hospitals with readmission rates between 15.2% and 16.5%. All of the hospitals in this study reported that hospitalists provide care at the hospitals. The median Medicare share of hospital admissions was 48.46%, and the median Medicaid share of hospital admissions was 16.4%. Fifty‐one percent of the hospitals in our sample were fully integrated. Fifty percent of hospitals had 9 or fewer hospitalists per 100 general medical and surgical beds. Only 5% of the hospitals had partial or full physician ownership. Twenty‐nine percent of hospitals had an established medical home program. Table 1 provides summary statistics and the data sources of all the variables included in the study.
To compare readmission rates, we created a dummy variable that divided the sample into 2 categories: hospitals with low hospitalist staffing levels (hospitalists per general medical and surgical beds is less than the median) and high hospitalist staffing (hospitalists per general medical and surgical bed ratio is more than the median). We then used t tests to compare all‐cause readmission rates between hospitals with low and high hospitalist staffing levels, physician owned versus nonphysician owned, and fully integrated versus not fully integrated. We also used single‐factor analysis of variance (ANOVA) to compare readmission rates between nonteaching, minor teaching, and major teaching hospitals. Results are displayed in Table 2. There was a significant difference in the mean readmission rates between hospitals with low hospitalist staffing levels (mean readmission rate = 16.06%) versus high staffing levels (mean readmission rate = 15.72%). The mean readmission rate for physician‐owned hospitals was significantly lower than for nonphysician‐owned hospitals (15.46% vs 15.9%). Also, fully integrated hospitals had a lower readmission rate than hospitals where physicians were not fully integrated (15.93% vs 15.86%). Based on the ANOVA results, there was a significant difference between teaching levels. According to a Tukey honest significant difference post hoc test, there was no significant difference between nonteaching and minor teaching hospitals, but the readmission rate was significantly higher in major teaching hospitals (nonteaching = 15.83%, minor teaching = 15.76%, major teaching = 16.9%).
| Variable | Readmission Rates | P Value |
|---|---|---|
| Hospitalist staffing levels | ||
| Low | 16.06% | 0.00 |
| High | 15.72% | |
| Physician ownership | ||
| Fully or partially physician‐owned hospitals | 15.46% | 0.00 |
| Nonphysician‐owned hospitals | 15.9 % | |
| Physician integration | ||
| Fully integrated hospitals | 15.86% | 0.00 |
| Nonintegrated hospitals | 15.93% | |
| Teaching status | ||
| Nonteaching hospitals | 15.83% | 0.00 |
| Minor teaching hospitals | 15.76% | |
| Major teaching hospitals | 16.9% |
The OLS regression model was significant and explained 16% of the variability in readmission rates (Table 3). Higher hospitalists staffing levels were associated with lower 30‐day all cause readmission rates (P = 0.00). The addition of 1 hospitalist per general and surgical bed was associated with a 0.77 percentage points decrease in adjusted readmission rates. In terms of hospital‐physician arrangements, fully integrated hospitals had adjusted 30‐day all‐cause readmission rates 0.09 percentage points lower than nonfully integrated hospitals (P = 0.08). Physician partial or full ownership was significantly associated with lower readmission rates (P = 0.00); hospitals partially or fully owned by physicians had adjusted readmission rates 0.36 percentage points lower than nonphysician‐owned hospitals.
| Variable | Coefficient | Standard Error | P Value |
|---|---|---|---|
| |||
| Hospitalists per general and surgical beds | 0.77 | 0.172 | 0.00 |
| Full integration | 0.086 | 0.049 | 0.08 |
| Physician ownership | 0.355 | 0.119 | 0.00 |
| RNs per 100 inpatient days | 0.174 | 0.050 | 0.00 |
| Established medical home program | 0.132 | 0.057 | 0.02 |
| Medicare admissions | 0.063 | 0.002 | 0.21 |
| Medicaid admissions | 0.015 | 0.003 | 0.00 |
| Competition | 0.115 | 0.08 | 0.17 |
| Unemployment | 0.244 | 0.037 | 0.00 |
| System membership | 0.041 | 0.055 | 0.45 |
| Teaching level | |||
| Minor teaching | 0.007 | 0.066 | 0.92 |
| Major teaching | 1.032 | 0.106 | 0.00 |
| Size | |||
| Medium | 0.032 | 0.071 | 0.66 |
| Large | 0.066 | 0.085 | 0.44 |
| For‐profit ownership | 0.206 | 0.078 | 0.01 |
| High technology | 0.077 | 0.055 | 0.17 |
| Critical access hospital | 0.202 | 0.092 | 0.03 |
Based on the regression analysis, major teaching hospitals on average had adjusted readmission rates 1.03 percentage point higher than nonteaching hospitals (P = 0.000), whereas there was no significant difference between minor and nonteaching hospitals (P > 0.1). As the number of registered nurses (RNs) per 100 inpatient days increased by 1, readmission rates dropped by 0.17 (P = 0.00). Hospitals with higher Medicaid shares of admission had significantly higher readmission rates (P < 0.05). Hospitals located in counties with higher unemployment rates also had higher readmission rates (P = 0.000), whereas market competition had no significant association with readmissions. For‐profit hospitals had adjusted readmission rates 0.21 percentage points higher than not‐for‐profit hospitals (P = 0.01). Finally, hospitals that have adopted a medical home model had significantly lower readmission rates (P = 0.02); hospitals with an established medical home model had adjusted readmission rates 0.17 percentage points lower than their counterparts.
DISCUSSION
In the era of VBP and mounting pressures on hospitals to improve quality and lower cost, it is important to understand the association between modifiable hospital characteristics, such as hospitalist staffing levels, and unmodifiable characteristics, such as teaching status and size, with quality of care. There are many factors that can contribute to higher readmission rates. Some of these factors are hospital related and others are patient related, such as the environment in which a patient resides. Benbassat and Taragin argue that 9% to 48% of hospital readmissions are avoidable and are related to factors such as inadequate resolution of the problem the patient was admitted for and poor discharge care.[22] In this article, we have focused on hospital and market factors. Our main variables of interest were hospitalist staffing level, physician full integration, physician ownership, and the adoption of the medical home model at the hospital. Moreover, we examined the association between the hospital environment, specifically, market competition, and the patient environment, specifically, unemployment rates, with readmission rates.
Hospitalists' provision of inpatient care has been on the rise. From 1997 to 2006, the likelihood of receiving inpatient care from a hospitalist grew by 29.2% per year.[23] Based on AHA (2013) data, 65% of hospitals reported that hospitalists provided care at the hospital. The main driver behind the adoption of the hospitalists' model is the positive role hospitalists play in improving hospital efficiency and their familiarity and specialization in hospital care.[24] However, concerns exist that hospitalists might negatively influence patient outcomes given the discontinuity of care that occurs once the patient is discharged from the hospital and back to the care of their primary care physician.[25] Based on our analysis though, higher hospitalist staffing levels were associated with lower readmission rates. Therefore, to better understand the relationship between hospitalists and quality, it is important to account for staffing levels, not merely whether hospitalists provide care at the hospital or not. Higher patient load per hospitalist might still improve hospital efficiency by lowering costs, but is it likely to impede the quality of care provided by hospitalists. This is not surprising given similar findings, including in this article, which document a similar positive relationship between nursing staffing levels and quality.
Hospitals utilize various arrangements with physicians that range from employment to more relaxed arrangements such as physicians with privileges who are neither employed by the hospital nor under individual or group contracts. Historically, the main incentive for hospitals to integrate physicians was referrals to hospital services and specialties.[16, 26] The Affordable Care Act, however, provided further incentives, such as ease of care coordination, physicians' involvement, and commitment to quality improvement and cost‐containment efforts. Based on this study, hospitals that were classified as fully integrated had lower readmission rates. Also, hospitals partially or fully owned by physicians had better readmission rates. These findings indicate that hospital‐physician arrangements play a significant role not only in influencing efficiency and market share but also patient outcomes. Physician integration and physician ownership align physicians' financial incentives with those of the hospital. For instance, given the recent changes in reimbursement and the shift toward VBP, physician income in physician‐owned hospitals is at risk if the hospital has poor patient outcomes.
Other significant predictors of readmission rates included the adoption of the medical home model and RN staffing levels. Hospitals that adopted a medical home model and had a higher registered nurse‐to‐inpatient days ratio had significantly better readmission rates. The finding on the adoption of the medical home model is especially important. Previous research indicates that patient‐centered medical homes are associated with lower emergency room visits but not necessarily lower admissions.[27] Our findings indicate that medical homes might play a role in lowering readmission rates, and therefore this outcome needs to be included in studies examining the performance of medical homes. Critical access hospitals and those with higher admissions share of Medicaid patients had worst readmission rates. Finally, hospitals located in counties with higher unemployment rates also had the worst readmission rates. This finding is not surprising and is consistent with previous research, which indicates that the patients' environment and social risk factors play a significant role.
This article contributes to our understanding of readmission rates despite its several limitations, which include the measurement of hospitalist staffing levels based on general medical and surgical beds rather than general medicine admissions. Moreover, some hospitals had missing data on key variables, which warranted their exclusion from this study. In conclusion, many structural, operational and market‐level factors influence all‐cause readmission rates. However, some of these variables are modifiable and can thus be adjusted by a hospital to improve readmission rates. These variables include hospitalists and registered nurse staffing levels; physician integration through the salaried, equity, or foundation model; and the adoption of a medical home model.
Disclosure
Nothing to report.
- , , . Medicare's readmissions‐reduction program—a positive alternative. N Engl J Med. 2012;366:1364–1366.
- , , , et al. Impact of hospital population case‐mix, including poverty, on hospital all‐cause and infection‐related 30‐day readmission rates. Clin Infect Dis. 2015;31(2):1235–1243.
- , , , et al. Patterns of hospital performance in acute myocardial infarction and heart failure 30‐day mortality and readmission. Circ Cardiovasc Qual Outcomes. 2009;2:407–413.
- , , , , . Variation in the risk of readmission among hospitals: the relative contribution of patient, hospital and inpatient provider characteristics. J Gen Intern Med. 2014;29:572–578.
- , . A path forward on Medicare readmissions. N Engl J Med. 2013;368:1175–1177.
- , , . Hospitals with higher nurse staffing had lower odds of readmissions penalties than hospitals with lower staffing. Health Aff (Millwood). 2013;32:1740–1747.
- , , , , . Variation in surgical‐readmission rates and quality of hospital care. N Engl J Med. 2013;369:1134–1142.
- , , , et al. Value and the medical home: effects of transformed primary care. Am J Manag Care. 2010;16.8:607–614.
- , , , , , . Effects of hospitalists on cost, outcomes, and patient satisfaction in a rural health system. Am J Med. 2000;108:621–626.
- , , , , . Effect of hospitalist workload on the quality and efficiency of care. JAMA Intern Med. 2014;174:786–793.
- , , . Association of hospitalist presence and hospital‐level outcome measures among Medicare patients. J Hosp Med. 2014;9:1–6.
- , , , , . Hospitalist utilization and hospital performance on 6 publicly reported patient outcomes. J Hosp Med. 2012;7:482–488.
- , , , . Impact of attending physician workload on patient care: a survey of hospitalists. JAMA Intern Med. 2013;173:375–377.
- , , . Rising hospital employment of physicians: better quality, higher costs. Issue Brief Cent Stud Health Syst Change. 2011;136:1–4.
- , , , et al. The employed surgeon: a changing professional paradigm. JAMA Surg. 2013;148:323–328.
- , , . Vertical integration: hospital ownership of physician practices is associated with higher prices and spending. Health Aff (Millwood). 2014;33:756–763.
- , , , et al. Hospital‐wide (all‐condition) 30‐day risk‐standardized readmission measure: Yale New Haven Health Services Corporation. Center for Outcomes Research 161(10 suppl):S66–S75.
- , . Hospital‐physician collaboration: landscape of economic integration and impact on clinical integration. Milbank Q. 2008;86(3):375–434.
- , , , , . Effects of hospital care environment on patient mortality and nurse outcomes. J Nurs Adm. 2008;38:223–229.
- , , , , , . The effects of nurse staffing and nurse education on patient deaths in hospitals with different nurse work environments. Med Care. 2011;49(12):1047–1053.
- , . Hospital readmissions as a measure of quality of health care: advantages and limitations. Arch Intern Med. 2000;160:1074–1081.
- , , , . Growth in the care of older patients by hospitalists in the United States. N Engl J Med. 2009;360:1102–1112.
- . Reflections: the hospitalist movement a decade later. J Hosp Med. 2006;1:248–252.
- , , , . Variation in length of stay and outcomes among hospitalized patients attributable to hospitals and hospitalists. J Gen Intern Med. 2013;28:370–376.
- , , , . Regulatory neutrality is essential to establishing a level playing field for accountable care organizations. Health Aff (Millwood). 2013;32:1426–1432.
- , . The patient‐centered medical home: will it stand the test of health reform? JAMA. 2009;301:2038–2040.
- , . Who has higher readmission rates for heart failure, and why?: implications for efforts to improve care using financial incentives. Circ Cardiovasc Qual Outcomes. 2011;4:53–59.
The hospital‐wide all‐cause 30‐day readmission rate is a key quality measure associated with patient outcomes, cost of care, and wasted hospital resources.[1] The estimated 20% readmission rate of Medicare patients and the associated $17 billion annual cost of readmissions led the Centers for Medicare and Medicaid Services (CMS) to implement policies that limit reimbursement for 30‐day unplanned readmissions and thus place hospitals with high readmission rates at financial risk.[1, 2]
The variation in readmission rates between hospitals is well documented in the literature.[3, 4] Singh et al. found that 9.3% of the variation in readmissions can be explained by hospital characteristics.[4] Hospital factors associated with lower readmission rates include not‐for‐profit ownership, hospital size, and nursing staffing levels.[5, 6, 7] Other studies found an association between environmental factors such as the percent of patients living under the poverty line and higher readmission rates.[7] The recent publicly available CMS data on readmission rates allows us to further our understanding of hospital characteristics that explain the variation in readmission rates. In this article, we are specifically interested in hospitalist staffing levels and hospital‐physician arrangements such as physician integration level and physician ownership. Moreover, we are interested in novel organizational variables, specifically, the adoption of a medical home model, which has been ignored by previous research. Medical homes are associated with better quality[8]; hospitals that already adopted the medical home model might be better equipped to coordinate care after the patients are discharged.
In recent years, the number of hospitals relying on hospitalists to provide inpatient care has been on the rise. As more hospitals employ hospitalists, it is important to understand how hospitalist staffing levels are associated with quality. Previous studies have linked hospitalists with lower hospital mortality rates,[7] lower cost of care,[9, 10] and lower readmission rates.[10, 11] Goodrich et al., on the other hand, did not find a significant relationship between the presence of hospitalists and mortality or readmission rates.[12] In a recent study, hospitalists indicated that heavy workloads limited the time they had available to communicate with patients, which negatively influenced quality and patient satisfaction, and resulted in delayed admissions and discharges.[13]
The main objective of this article was therefore to study the association between hospitalist staffing levels and hospital‐wide all‐cause readmission rates. Most empirical studies examining the relationship between hospitalist staffing and quality of inpatient care have predominantly focused on whether the presence of hospitalists who provided care at a hospital influenced mortality or readmissions.[11, 12] In this article, we contribute to the literature by examining how staffing levels measured by the ratio of hospitalists to general medical and surgical beds is associated with 30‐day readmission rates. We predict that there is a positive association between readmission rates and hospitalists per bed.
Hospitals have a broad range of contractual arrangements or integration levels with physicians, with employment being the highest level. A hospital can rely on physicians who have admitting privileges but are not salaried employees of the hospital to treat a large portion of its inpatient population. In the past few years, with the passage of the Patient Protection and Affordable Care Act (2010) and the shift in reimbursement towards Value Based Purchasing (VBP), more hospitals are choosing to ensure that physicians are strongly integrated within the hospital by adopting an employment‐based model. Moreover, hospitals view physician employment as a strategic move that will help ensure or expand their market share.[14] For instance, the number of surgeons who identified as self‐employed dropped from 48% in 2001 to 28% in 2011, and this reduction is attributed to the shift toward hospital employment of physicians.[15] Despite the evolving models of hospital‐physician arrangements, little is understood on how the adoption of the integrated salary model, in addition to the equity and foundation models, which are classified by Baker et al. as the highest level of integration, influence quality.[16] Therefore, another objective of this article was to examine the association between hospital‐physician arrangements and all‐cause unplanned readmission rates.
METHODS
Data Source and Sample
Data from the American Hospital Association (AHA) Annual Survey (2013), CMS Hospital Compare (October 2013), and Area Health Resource File (2013) were merged to analyze the association between readmission rates with hospital characteristics and environmental factors. We limited the analysis to private (nonpublic) hospitals with no missing data. Our final sample consisted of 1756 hospitals. Of the hospitals in our sample, 14% were for profit, 70% were nonteaching, 23% were minor teaching, 7% were major teaching hospitals, 73% belonged to a system, and 31% were classified as small hospitals. Table 1 provides descriptive statistics for all the variables included in the analysis.
| Variable | Value | Data Source |
|---|---|---|
| ||
| 30‐day all‐cause readmissions, median (IQR) | 15.8% (15.2%16.5%) | Centers for Medicare and Medicaid Services |
| Hospitalists per general medicine and surgical beds, median (IQR) | 0.09 (0.060.15) | American Hospital Association |
| RNs per 100 inpatient days, median (IQR) | 0.84 (0.6610.10) | American Hospital Association |
| Medicare admissions, median (IQR) | 48.45% (40.84%55.14%) | American Hospital Association |
| Medicaid admissions, median (IQR) | 16.45% (11.06%22.76%) | American Hospital Association |
| Competition, median (IQR) | 0.56 (0.230.83) | American Hospital Association |
| Unemployment, median (IQR) | 2.9% (2.54%3.37%) | Area Resource File |
| Fully integrated | American Hospital Association | |
| Yes | 51% | |
| No | 49% | |
| Physician ownership | American Hospital Association | |
| Physician partial or complete ownership | 5% | |
| No physician ownership | 95% | |
| Established medical home program | American Hospital Association | |
| Yes | 29% | |
| No | 71% | |
| High technology | American Hospital Association | |
| Yes | 40% | |
| No | 60% | |
| Teaching level | American Hospital Association | |
| Nonteaching | 70% | |
| Minor teaching | 23% | |
| Major teaching | 7% | |
| Size | American Hospital Association | |
| Small | 31% | |
| Medium | 34% | |
| Large | 35% | |
| Ownership | American Hospital Association | |
| For profit | 14% | |
| Not for profit | 86% | |
| Critical access hospital | American Hospital Association | |
| Yes | 11% | |
| No | 89% | |
| System membership | American Hospital Association | |
| Yes | 73% | |
| No | 27% | |
Variables
Dependent Variable
Risk standardized 30‐day hospital‐wide all‐cause readmission rates (HWR) were obtained from CMS. This measure was publicly reported in October 2013. The HWR is estimated using standardized risk ratios at the hospital level for the following 5 discharge diagnosis groups: surgery/gynecology, neurology, cardiorespiratory, cardiovascular, and general medicine.[17] The measure adjusts, in addition to a hospital's case mix, for patients' ages, principal discharge diagnoses, and comorbidities.[17] HWR is calculated as a predicted‐to‐expected readmissions ratio. Predicted and expected readmissions were calculated for each of the 5 groups for each hospital using each hospital's patient mix and a hospital random effects estimate. A standardized readmission ratio was then derived by dividing predicted readmissions by expected readmissions for each group for each hospital. A single hospital score was obtained by multiplying the volume‐weighted logarithmic average of the 5 diagnostic groups by the average national readmission rate.[18]
Independent Variables
The primary independent variable of interest to this study is hospitalist staffing levels. We calculate the staffing levels of hospitalists by dividing the full‐time equivalent (FTE) of hospitalists by the number of general medical and surgical beds. FTE hospitalists are calculated by the AHA Annual Survey database (2013) as the sum of full‐time hospitalists and 0.5*number of part‐time hospitalists. In addition to hospitalist staffing levels, a main predictors is whether the hospital fully integrates physicians or not. We follow Baker et al. in our classification of full integration. Baker et al. define fully integrated hospitals as those that adopted 1 of the following models with their physicians: integrated salary, foundation or equity model.[16] We predict that fully integrated hospitals are more likely to have better readmission rates. Another key physician variable that is likely to influence outcomes is physician partial or full ownership of the hospital. Ownership aligns physicians' incentives with hospital performance[19] and is therefore likely to be associated with better readmission rates. We also include a dichotomous variable that indicates whether a hospital has an established medical home program or not. Medical homes indicate an organizational culture that is patient centered and committed to continuity and coordination of care; all of which are important for better quality. We predict that the presence of a medical home model will be associated with better readmission rates.
Control Variables
We control for registered nurses per 100 inpatient days ratio, critical access designation, Medicare share of hospital admissions, Medicaid share of hospital admissions, teaching status, size, and technology level. Previous research indicates that these variables are associated with patient outcomes.[20, 21] We follow the Aiken et al. characterization of teaching status: hospitals with no residency programs (nonteaching), hospitals with a resident‐to‐bed ratio of 1 to 4 or less (minor teaching), and hospitals with a resident‐to‐bed ratio of more than 1 to 4 (major teaching).[20] We also classify hospitals as small if they have less than 100 beds, medium if they have 101 to 250 beds, and large if they have more than 250 beds. We modify the Aiken et al. classification of technology level and control for the level of technology adopted at a hospital by classifying hospitals as high technology if they offer any of the following services: any major organ transplant, computer‐assisted orthopedic surgery, or electron beam computed tomography.[21] We also control for 2 market level variables: (1) competition estimated by the county level Herfindahl‐Hirschman Index (HHI) and (2) the percentage of individuals in the county who are unemployed. Unemployment rates are derived from the Area Health Resource File (2013). HHI is calculated by summing the squares of market shares of admissions. For ease of interpretation, competition is coded as 1‐HHI.
Statistical Analysis
We ran a multivariate ordinary least squares (OLS) regression on Stata 12 (StataCorp, College Station, TX) to assess the relationship between 30‐day all‐cause readmissions and hospitalist staffing levels, physician integration, physician ownership, and other organizational characteristics. We checked for multicollinearity by using a variance inflation factor (VIF). The VIF of all independent variables was less than 10, and therefore multicollinearity was not of concern to this analysis.
RESULTS
Among our sample of 1756 hospitals, the median 30‐day all‐cause readmission rate was 16%, with the middle 50% of hospitals with readmission rates between 15.2% and 16.5%. All of the hospitals in this study reported that hospitalists provide care at the hospitals. The median Medicare share of hospital admissions was 48.46%, and the median Medicaid share of hospital admissions was 16.4%. Fifty‐one percent of the hospitals in our sample were fully integrated. Fifty percent of hospitals had 9 or fewer hospitalists per 100 general medical and surgical beds. Only 5% of the hospitals had partial or full physician ownership. Twenty‐nine percent of hospitals had an established medical home program. Table 1 provides summary statistics and the data sources of all the variables included in the study.
To compare readmission rates, we created a dummy variable that divided the sample into 2 categories: hospitals with low hospitalist staffing levels (hospitalists per general medical and surgical beds is less than the median) and high hospitalist staffing (hospitalists per general medical and surgical bed ratio is more than the median). We then used t tests to compare all‐cause readmission rates between hospitals with low and high hospitalist staffing levels, physician owned versus nonphysician owned, and fully integrated versus not fully integrated. We also used single‐factor analysis of variance (ANOVA) to compare readmission rates between nonteaching, minor teaching, and major teaching hospitals. Results are displayed in Table 2. There was a significant difference in the mean readmission rates between hospitals with low hospitalist staffing levels (mean readmission rate = 16.06%) versus high staffing levels (mean readmission rate = 15.72%). The mean readmission rate for physician‐owned hospitals was significantly lower than for nonphysician‐owned hospitals (15.46% vs 15.9%). Also, fully integrated hospitals had a lower readmission rate than hospitals where physicians were not fully integrated (15.93% vs 15.86%). Based on the ANOVA results, there was a significant difference between teaching levels. According to a Tukey honest significant difference post hoc test, there was no significant difference between nonteaching and minor teaching hospitals, but the readmission rate was significantly higher in major teaching hospitals (nonteaching = 15.83%, minor teaching = 15.76%, major teaching = 16.9%).
| Variable | Readmission Rates | P Value |
|---|---|---|
| Hospitalist staffing levels | ||
| Low | 16.06% | 0.00 |
| High | 15.72% | |
| Physician ownership | ||
| Fully or partially physician‐owned hospitals | 15.46% | 0.00 |
| Nonphysician‐owned hospitals | 15.9 % | |
| Physician integration | ||
| Fully integrated hospitals | 15.86% | 0.00 |
| Nonintegrated hospitals | 15.93% | |
| Teaching status | ||
| Nonteaching hospitals | 15.83% | 0.00 |
| Minor teaching hospitals | 15.76% | |
| Major teaching hospitals | 16.9% |
The OLS regression model was significant and explained 16% of the variability in readmission rates (Table 3). Higher hospitalists staffing levels were associated with lower 30‐day all cause readmission rates (P = 0.00). The addition of 1 hospitalist per general and surgical bed was associated with a 0.77 percentage points decrease in adjusted readmission rates. In terms of hospital‐physician arrangements, fully integrated hospitals had adjusted 30‐day all‐cause readmission rates 0.09 percentage points lower than nonfully integrated hospitals (P = 0.08). Physician partial or full ownership was significantly associated with lower readmission rates (P = 0.00); hospitals partially or fully owned by physicians had adjusted readmission rates 0.36 percentage points lower than nonphysician‐owned hospitals.
| Variable | Coefficient | Standard Error | P Value |
|---|---|---|---|
| |||
| Hospitalists per general and surgical beds | 0.77 | 0.172 | 0.00 |
| Full integration | 0.086 | 0.049 | 0.08 |
| Physician ownership | 0.355 | 0.119 | 0.00 |
| RNs per 100 inpatient days | 0.174 | 0.050 | 0.00 |
| Established medical home program | 0.132 | 0.057 | 0.02 |
| Medicare admissions | 0.063 | 0.002 | 0.21 |
| Medicaid admissions | 0.015 | 0.003 | 0.00 |
| Competition | 0.115 | 0.08 | 0.17 |
| Unemployment | 0.244 | 0.037 | 0.00 |
| System membership | 0.041 | 0.055 | 0.45 |
| Teaching level | |||
| Minor teaching | 0.007 | 0.066 | 0.92 |
| Major teaching | 1.032 | 0.106 | 0.00 |
| Size | |||
| Medium | 0.032 | 0.071 | 0.66 |
| Large | 0.066 | 0.085 | 0.44 |
| For‐profit ownership | 0.206 | 0.078 | 0.01 |
| High technology | 0.077 | 0.055 | 0.17 |
| Critical access hospital | 0.202 | 0.092 | 0.03 |
Based on the regression analysis, major teaching hospitals on average had adjusted readmission rates 1.03 percentage point higher than nonteaching hospitals (P = 0.000), whereas there was no significant difference between minor and nonteaching hospitals (P > 0.1). As the number of registered nurses (RNs) per 100 inpatient days increased by 1, readmission rates dropped by 0.17 (P = 0.00). Hospitals with higher Medicaid shares of admission had significantly higher readmission rates (P < 0.05). Hospitals located in counties with higher unemployment rates also had higher readmission rates (P = 0.000), whereas market competition had no significant association with readmissions. For‐profit hospitals had adjusted readmission rates 0.21 percentage points higher than not‐for‐profit hospitals (P = 0.01). Finally, hospitals that have adopted a medical home model had significantly lower readmission rates (P = 0.02); hospitals with an established medical home model had adjusted readmission rates 0.17 percentage points lower than their counterparts.
DISCUSSION
In the era of VBP and mounting pressures on hospitals to improve quality and lower cost, it is important to understand the association between modifiable hospital characteristics, such as hospitalist staffing levels, and unmodifiable characteristics, such as teaching status and size, with quality of care. There are many factors that can contribute to higher readmission rates. Some of these factors are hospital related and others are patient related, such as the environment in which a patient resides. Benbassat and Taragin argue that 9% to 48% of hospital readmissions are avoidable and are related to factors such as inadequate resolution of the problem the patient was admitted for and poor discharge care.[22] In this article, we have focused on hospital and market factors. Our main variables of interest were hospitalist staffing level, physician full integration, physician ownership, and the adoption of the medical home model at the hospital. Moreover, we examined the association between the hospital environment, specifically, market competition, and the patient environment, specifically, unemployment rates, with readmission rates.
Hospitalists' provision of inpatient care has been on the rise. From 1997 to 2006, the likelihood of receiving inpatient care from a hospitalist grew by 29.2% per year.[23] Based on AHA (2013) data, 65% of hospitals reported that hospitalists provided care at the hospital. The main driver behind the adoption of the hospitalists' model is the positive role hospitalists play in improving hospital efficiency and their familiarity and specialization in hospital care.[24] However, concerns exist that hospitalists might negatively influence patient outcomes given the discontinuity of care that occurs once the patient is discharged from the hospital and back to the care of their primary care physician.[25] Based on our analysis though, higher hospitalist staffing levels were associated with lower readmission rates. Therefore, to better understand the relationship between hospitalists and quality, it is important to account for staffing levels, not merely whether hospitalists provide care at the hospital or not. Higher patient load per hospitalist might still improve hospital efficiency by lowering costs, but is it likely to impede the quality of care provided by hospitalists. This is not surprising given similar findings, including in this article, which document a similar positive relationship between nursing staffing levels and quality.
Hospitals utilize various arrangements with physicians that range from employment to more relaxed arrangements such as physicians with privileges who are neither employed by the hospital nor under individual or group contracts. Historically, the main incentive for hospitals to integrate physicians was referrals to hospital services and specialties.[16, 26] The Affordable Care Act, however, provided further incentives, such as ease of care coordination, physicians' involvement, and commitment to quality improvement and cost‐containment efforts. Based on this study, hospitals that were classified as fully integrated had lower readmission rates. Also, hospitals partially or fully owned by physicians had better readmission rates. These findings indicate that hospital‐physician arrangements play a significant role not only in influencing efficiency and market share but also patient outcomes. Physician integration and physician ownership align physicians' financial incentives with those of the hospital. For instance, given the recent changes in reimbursement and the shift toward VBP, physician income in physician‐owned hospitals is at risk if the hospital has poor patient outcomes.
Other significant predictors of readmission rates included the adoption of the medical home model and RN staffing levels. Hospitals that adopted a medical home model and had a higher registered nurse‐to‐inpatient days ratio had significantly better readmission rates. The finding on the adoption of the medical home model is especially important. Previous research indicates that patient‐centered medical homes are associated with lower emergency room visits but not necessarily lower admissions.[27] Our findings indicate that medical homes might play a role in lowering readmission rates, and therefore this outcome needs to be included in studies examining the performance of medical homes. Critical access hospitals and those with higher admissions share of Medicaid patients had worst readmission rates. Finally, hospitals located in counties with higher unemployment rates also had the worst readmission rates. This finding is not surprising and is consistent with previous research, which indicates that the patients' environment and social risk factors play a significant role.
This article contributes to our understanding of readmission rates despite its several limitations, which include the measurement of hospitalist staffing levels based on general medical and surgical beds rather than general medicine admissions. Moreover, some hospitals had missing data on key variables, which warranted their exclusion from this study. In conclusion, many structural, operational and market‐level factors influence all‐cause readmission rates. However, some of these variables are modifiable and can thus be adjusted by a hospital to improve readmission rates. These variables include hospitalists and registered nurse staffing levels; physician integration through the salaried, equity, or foundation model; and the adoption of a medical home model.
Disclosure
Nothing to report.
- , , . Medicare's readmissions‐reduction program—a positive alternative. N Engl J Med. 2012;366:1364–1366.
- , , , et al. Impact of hospital population case‐mix, including poverty, on hospital all‐cause and infection‐related 30‐day readmission rates. Clin Infect Dis. 2015;31(2):1235–1243.
- , , , et al. Patterns of hospital performance in acute myocardial infarction and heart failure 30‐day mortality and readmission. Circ Cardiovasc Qual Outcomes. 2009;2:407–413.
- , , , , . Variation in the risk of readmission among hospitals: the relative contribution of patient, hospital and inpatient provider characteristics. J Gen Intern Med. 2014;29:572–578.
- , . A path forward on Medicare readmissions. N Engl J Med. 2013;368:1175–1177.
- , , . Hospitals with higher nurse staffing had lower odds of readmissions penalties than hospitals with lower staffing. Health Aff (Millwood). 2013;32:1740–1747.
- , , , , . Variation in surgical‐readmission rates and quality of hospital care. N Engl J Med. 2013;369:1134–1142.
- , , , et al. Value and the medical home: effects of transformed primary care. Am J Manag Care. 2010;16.8:607–614.
- , , , , , . Effects of hospitalists on cost, outcomes, and patient satisfaction in a rural health system. Am J Med. 2000;108:621–626.
- , , , , . Effect of hospitalist workload on the quality and efficiency of care. JAMA Intern Med. 2014;174:786–793.
- , , . Association of hospitalist presence and hospital‐level outcome measures among Medicare patients. J Hosp Med. 2014;9:1–6.
- , , , , . Hospitalist utilization and hospital performance on 6 publicly reported patient outcomes. J Hosp Med. 2012;7:482–488.
- , , , . Impact of attending physician workload on patient care: a survey of hospitalists. JAMA Intern Med. 2013;173:375–377.
- , , . Rising hospital employment of physicians: better quality, higher costs. Issue Brief Cent Stud Health Syst Change. 2011;136:1–4.
- , , , et al. The employed surgeon: a changing professional paradigm. JAMA Surg. 2013;148:323–328.
- , , . Vertical integration: hospital ownership of physician practices is associated with higher prices and spending. Health Aff (Millwood). 2014;33:756–763.
- , , , et al. Hospital‐wide (all‐condition) 30‐day risk‐standardized readmission measure: Yale New Haven Health Services Corporation. Center for Outcomes Research 161(10 suppl):S66–S75.
- , . Hospital‐physician collaboration: landscape of economic integration and impact on clinical integration. Milbank Q. 2008;86(3):375–434.
- , , , , . Effects of hospital care environment on patient mortality and nurse outcomes. J Nurs Adm. 2008;38:223–229.
- , , , , , . The effects of nurse staffing and nurse education on patient deaths in hospitals with different nurse work environments. Med Care. 2011;49(12):1047–1053.
- , . Hospital readmissions as a measure of quality of health care: advantages and limitations. Arch Intern Med. 2000;160:1074–1081.
- , , , . Growth in the care of older patients by hospitalists in the United States. N Engl J Med. 2009;360:1102–1112.
- . Reflections: the hospitalist movement a decade later. J Hosp Med. 2006;1:248–252.
- , , , . Variation in length of stay and outcomes among hospitalized patients attributable to hospitals and hospitalists. J Gen Intern Med. 2013;28:370–376.
- , , , . Regulatory neutrality is essential to establishing a level playing field for accountable care organizations. Health Aff (Millwood). 2013;32:1426–1432.
- , . The patient‐centered medical home: will it stand the test of health reform? JAMA. 2009;301:2038–2040.
- , . Who has higher readmission rates for heart failure, and why?: implications for efforts to improve care using financial incentives. Circ Cardiovasc Qual Outcomes. 2011;4:53–59.
From the Washington Office: Brave new world of acronyms
Just over a year ago, Congress passed and the President signed into law the MACRA legislation, which will serve as the basis for Medicare physician payment beginning in 2019. At the recent Leadership and Advocacy Summit, it became apparent to me that a “refresher” on seven key acronyms would be useful for surgeons as they gear up to understand and effectively participate in this “brave new world” which is rapidly approaching.
Accordingly, let us start at the beginning. MACRA stands for the Medicare Access and CHIP (Children’s Health Insurance Program) Reauthorization Act of 2015. As noted above, this legislation, signed into law by President Obama on April 16, 2015, replaces the flawed sustainable growth rate formula and will be the template utilized to determine Medicare physician payment beginning in 2019. However, it is important to note that it is anticipated that the data to be utilized as the basis for payment in 2019 will likely be collected sometime in 2017.
MACRA provides modest but stable positive updates of 0.5 percent/year for the 5-year period of 2015-2019. Fellows may remember that this provision was included in the legislation as a direct result of objections made by the leadership of the ACS to the original draft legislation, which contained no provision for a positive update. In addition, MACRA provides for the elimination, after 2018, of the current-law penalties associated with the existing Medicare quality programs, including the PQRS (Physician Quality Reporting System), the VBM (Value-Based Modifier) program and the EHR-MU (Electronic Health Record–Meaningful Use) program. That said, and as outlined below, we will not be saying goodbye to these programs completely. Accordingly, surgeons need to remain, or become, familiar with those acronyms and the programs they represent.
MACRA has two payment pathways. Physicians will choose to participate in one or the other. Those choices are: 1) MIPS (Merit-based Incentive Payment System) and 2) APMs (Alternative Payment Models).
Beginning in 2019, the PQRS (Physician Quality Reporting System), the VBM (Value-Based Modifier) program and the EHR-MU (Electronic Health Record–Meaningful Use) program will be combined into MIPS (Merit-based Incentive Payment System). In this program, it is possible for all surgeons to receive an annual positive update based on their individual performance in the four categories of Quality, Resource Use, Electronic Health Record–Meaningful Use, and lastly the newly created category of Clinical Practice Improvement Activities (CPIA).
Individual surgeons’ performance in the four categories will be combined into a composite score. Each individual composite score will then be compared with a performance threshold. The threshold will be set as either the mean or median of the composite performance scores for all MIPS-eligible professionals from a prior performance period. The threshold will reset every year. Those with an individual composite performance score above the threshold will receive a positive payment adjustment while those with an individual composite performance score below the threshold will receive a negative payment adjustment.
The Quality component of the MIPS will consist of quality measures currently used in existing quality performance programs namely, the PQRS (Physician Quality Reporting System), the VBM (Value-Based Modifier program), and EHR-MU (Electronic Health Record–Meaningful Use), as well as measures developed by stakeholders to meet the needs of specialties lacking meaningful measures in the current programs. The RESOURCE USE component of MIPS will include the cost measures used in the current VBM (Value-Based Modifier) program. With regard to the Electronic Health Record–Meaningful Use (EHR-MU) component of MIPS, current EHR-MU requirements will continue to apply but are expected to be modified significantly. ACS continues to advocate for changes to the EHR-MU program to make it easier for surgeons to comply with requirements. Evidence of the effectiveness of our advocacy in this area is found in the success achieved in obtaining a blanket exception for the 2015 reporting period, Stage 2 Meaningful Use rule about which I wrote in the December 2015 and January 2016 editions of this column.
The CPIA (Clinical Practice Improvement Activities) are designed to assess surgeons’ effort toward improving their clinical practice and/or their preparation toward participating in APMs (Alternative Payment Models). The menu of specific, approved activities has yet to be firmly established. ACS provided significant input on the CPIA component of MIPS in our November 2015 response to the request for information issued by the Centers for Medicare & Medicaid Services (CMS) last fall. The MACRA legislation specifies that the CPIA be applicable to all specialties and be attainable for small practices and professionals in rural and underserved areas.
Those Fellows interested in knowing specifically the areas on which CMS requested input in the process of drafting the first proposed rule on MACRA and how ACS responded to same may find the letter sent in response to CMS at https://www.facs.org/~/media/files/advocacy/medicare/cms%20mips%20apm%20rfi%20final.ashx.
The new law takes concerted steps to incentivize and encourage providers to develop and participate in APMs (Alternative Payment Models). As with the CPIA discussed above, the details of APMs are not yet fully clear and are currently being developed. ACS is actively working on behalf of surgeons to develop APMs as part of the policy efforts of the Division of Advocacy and Health Policy. In general, these programs will require quality measures, the inclusion of elements of upside and downside financial risk for providers and use of certified electronic health record technology. For those surgeons who receive a significant share of their revenue from an APM, an annual 5% bonus will be available for each of the years 2019-2024. To qualify for that bonus, surgeons must receive 25% of their Medicare revenue from an APM in the years 2019 and 2020. That threshold requirement subsequently increases to 50% in 2021 and ultimately to 75% beginning in 2023.
As MACRA specifies that providers participate in either MIPS or APMs, surgeons who meet the aforementioned threshold of payment from a qualified APM will be exempted from many of the MIPS reporting requirements and receive the 5% bonus in lieu of the previously described MIPS payment adjustment. Those who participate in APMs but fail to meet the threshold necessary to receive the 5% bonus will receive credit for their participation in the CPIA component of their MIPS composite score but will not receive the 5% incentive.
While it is completely understandable that acronyms add to surgeons’ collective frustration, I am confident that all Fellows can, with relative ease, master the seven acronyms above and thus be well on their way to both understanding and successfully participating in the new Medicare physician payment system.
Until next month …
Dr. Patrick V. Bailey is an ACS Fellow, a pediatric surgeon, and Medical Director, Advocacy, for the Division of Advocacy and Health Policy, in the ACS offices in Washington, D.C.

2016 Leadership Summit Focuses on Communication and Team Building
The American College of Surgeons (ACS) hosted the fifth annual Leadership & Advocacy Summit, April 9–12, at the JW Marriott in Washington, DC. More than 445 College leaders, residents, and medical students participated in the Leadership portion of the Summit, which featured a full day of sessions on effective leadership building communication and strategic thinking skills for effective leadership in and out of the operating room. The Leadership Summit also provided attendees with ample networking opportunities.
The Leadership Summit began with a well-attended Welcome Reception on Saturday evening. Sunday’s program featured nine presentations on such topics as preparing for difficult conversations, best practices for social networking, improving team emotional intelligence, leading teams through conflict situations, and sharpening strategic thinking skills. Leaders from the Georgia, North Texas, and West Virginia Chapters of the ACS presented their chapter’s success stories from the past year. Leadership Summit attendees also convened over lunch by state/region to identify new areas for collaboration in the coming year.
Details regarding the Leadership Summit will be published in the July Bulletin of the American College of Surgeons at http://bulletin.facs.org/. The sixth annual Leadership & Advocacy Summit will take place May 6−9, 2017 at the Renaissance Washington, DC Downtown Hotel. For more information on the Leadership Summit, contact Donna Tieberg, ACS International Chapter Services Manager, at dtieberg@facs.org.
Survey: Civilians support wider access to education on how to help victims of mass casualty events
Many civilians have expressed interest in taking a bleeding control training course that would empower them to immediately assist victims of active shooter and other intentional mass casualty events at the point of wounding, according to the results of a national poll published in the Journal of the American College of Surgeons (JACS). Furthermore, most civilians support training and equipping police officers to perform severe bleeding control on victims as soon as possible, rather than wait for emergency medical services (EMS) personnel to arrive on the scene. Survey respondents also supported the placement of bleeding control kits in public places where large crowds gather, similar to the way that automatic external defibrillators are now found in airports and shopping malls.
Working to save lives
The Joint Committee to Create a National Policy to Enhance Survivability from Intentional Mass Casualty and Active Shooter Events, convened by the American College of Surgeons, recommends careful consideration of these study results. The committee’s deliberations are known as the Hartford Consensus™. The Hartford Consensus reports have been published in the Bulletin and JACS since the group’s formation in 2013 and promote the group’s core principle that “no one should die from uncontrolled bleeding.”
To that end, the Hartford Consensus calls for providing law enforcement officers with the training and equipment needed to act before EMS personnel arrive, providing EMS professionals with quicker access to the wounded, and training civilian bystanders to act as immediate responders. This element from the Hartford Consensus is at the heart of the “Stop the Bleed” campaign launched by the U.S. Department of Homeland Security through the National Security Council.
“We know that to save life and limb, you need to stop the bleeding very early—within five to 10 minutes—or victims can lose their lives,” said ACS Regent Lenworth M. Jacobs, Jr., MD, MPH, FACS, Chair of the Hartford Consensus and director of the Trauma Institute at Hartford Hospital, CT. “However, until now, there has been no clear indication of how well trained the general public is in bleeding control and how willing they might be to participate as immediate responders until professionals arrive on the scene.”
Public ready and willing to act
Langer Research Associates, New York, NY, conducted a national telephone survey of the general public, November 6−11, 2015, concluding just two days before the terrorist attacks in Paris. A total of 1,051 telephone interviews were conducted—528 via cellphone and 523 via landline. Respondents were asked whether they had ever participated in first aid training, and, if so, when and whether it included bleeding control instruction. Nearly half of all respondents (47 percent) said that they had received first aid training at some point. Of that number, 13 percent had trained in first aid in the last two years and 52 percent had first aid training in the last five years.
Respondents also were asked about their willingness to provide aid to bleeding victims in two different scenarios: a car crash and a mass shooting.
Within the context of the two scenarios, the study authors reported that:
Of the 941 respondents able to provide first aid, 98 percent indicated they would be “very likely” or “somewhat likely” to attempt bleeding control on a family member with a leg wound. Within this subgroup, 62 percent indicated they would apply pressure or compression to the wound, 36 percent would apply a tourniquet, 6 percent would cover or wrap the wound in a bandage, and 2 percent would elevate the injured leg.
When presented with a scenario of trying to stop severe bleeding in a car crash victim who is unknown to them, 92 percent of a random half sample of respondents indicated they would be very likely (61 percent) or somewhat likely (31 percent) to act.
In a mass shooting scenario, 75 percent of the other random half sample responded that they would attempt to give first aid if it seemed safe to act, 16 percent responded that they would wait to see what happens, and 8 percent said they would leave the area. In terms of assisting if the situation seemed safe, 94 percent responded that they would be very likely (62 percent) or somewhat likely (32 percent) to try to help a stranger.
Many respondents reported having major or some concern about several issues related to trying to stop severe bleeding in someone whom they did not know. Specifically, respondents expressed concern about seeing someone bleeding heavily (30 percent), becoming contaminated with a disease (61 percent), endangering personal safety (43 percent), causing a victim additional pain or injury (65 percent), and being responsible for a bad outcome (61 percent). Within the context of rendering assistance in the shooting scenario, 71 percent expressed concern about “putting themselves in physical danger from additional violence.”
Respondents also were asked about their interest in taking a bleeding control class and their support for requiring bleeding control kits in public places. Among the respondents who were physically able to provide first aid, 82 percent said they would be “very interested” or “somewhat interested” in attending a two-hour bleeding control course.
In addition, 93 percent supported the public placement of bleeding control kits (containing gloves, tourniquets, and compression dressings).
The authors also noted strong public approval (91 percent of all surveyed) for training and equipping police officers for severe bleeding control to act as soon as possible before the arrival of EMS personnel, with 65 percent also supporting “faster access of EMS to victims in areas that may not be totally secure.”
“It takes internal fortitude to want to get involved as an immediate responder. We were overwhelmed to learn that the public is prepared to accept this responsibility,” Dr. Jacobs said. “Moving forward, we plan to use these new insights to develop a training program for the public, not just health care professionals, so civilians can learn how to act as immediate responders. We want to steer interested people toward getting the right training and to understand when victims are experiencing the signs of massive bleeding so they can ‘stop the bleed’ and save lives.”
Surgeons Voice Legislative Priorities at Advocacy Summit 2016
Approximately 300 surgeons and surgical residents participated in the advocacy portion of the 2016 American College of Surgeons (ACS) Leadership & Advocacy Summit. The event provided participants with an opportunity to develop their advocacy skills, learn about legislative and health policy priorities, and advocate in meetings with members of Congress and their staffs.
Surgeons asked lawmakers to use their oversight authority to encourage the Centers for Medicare & Medicaid Services to adopt meaningful quality measures, and physician-developed Alternative Payment Models. ACS members also asked their elected officials to support the Responsible Data Transparency Act, legislation that is being developed by Rep. Bill Flores (R-Tex.). The College is committed to maintaining transparency in the Medicare system to promote high-quality patient care. At issue, however, are third-party groups that are evading established, accurate, valid, and transparent pathways to sensitive Medicare data by using Freedom of Information Act requests to obtain raw physician claims data. This legislation would prevent groups from using questionable, non–risk-adjusted methodologies to conduct performance analyses and publish potentially misleading physician performance ratings on public websites.
Other issues discussed at the Capitol Hill meetings include promotion of the Ensuring Access to General Surgery Act of 2016, legislation being developed that would require that a study be conducted to designate general surgery Health Professional Shortage Areas (HPSAs); cancer-related concerns, including education on the importance of Commission on Cancer accreditation; and improved access to trauma care. Details about the ACS Leadership & Advocacy Summit will be published in the May SurgeonsVoice Monthly and the July issue of the Bulletin at http://bulletin.facs.org/.
No benefit from added trabectedin for STS patients
When trabectedin was administered to soft tissue sarcoma (STS) patients receiving doxorubicin, neither progression-free nor overall survival significantly improved, investigators found.
In addition, patients who received both drugs were significantly more likely to experience adverse events.
“The combination of trabectedin plus doxorubicin did not show superiority over doxorubicin alone as first-line treatment of advanced STS patients, at least under this schedule. Moreover, the experimental arm was significantly more toxic than the control arm, especially regarding thrombocytopenia, vomiting, liver toxicity, and asthenia,” wrote Dr. Javier Martin-Broto of the Virgen del Rocio Hospital and Biomedicine Institute, Seville (Spain) and his associates (J Clin Oncol. 2016. doi: 10.1200/JCO.2015.65.3329).
Of 115 adult patients with advanced nonresectable or metastatic STS, 59 received doxorubicin only, 55 received both doxorubicin and trabectedin, and one patient was not treated. In the experimental group, doxorubicin was administered before trabectedin. Both the experimental and control groups underwent six cycles of their respective drug regime unless disease progression or unacceptable toxicity was observed.
A Cox proportional hazard regression model revealed that the progression-free survival was not significantly higher among patients receiving trabectedin and doxorubicin compared to patients only receiving doxorubicin (5.7 months vs. 5.5 months; hazard ratio, 1.16; 95% confidence interval, 0.79-1.71; P = .45). Overall survival was also not significantly different between the groups (13.3 months vs. 13.7 months; HR, 1.21; 95% CI, .77-1.92, P = .41).
However, compared with patients who only received doxorubicin, patients who received both trabectedin and doxorubicin experienced significantly more adverse events such as grade 3 or 4 thrombocytopenia (2% vs. 18%, P = .016), grade 3 or 4 liver toxicity (12% vs. 29%, P = .002), AST (0% vs. 8%, P = .007), ALT (0% vs. 19%, P less than .001), and grade 3 or 4 asthenia (4% vs. 25%, P = .002).
On Twitter @jess_craig94
FROM JOURNAL OF CLINICAL ONCOLOGY
Key clinical point: When trabectedin was administered to soft tissue sarcoma (STS) patients receiving doxorubicin, neither progression-free nor overall survival significantly improved. However, patients who received both drugs were significantly more likely to experience adverse events.
Major finding: Progression-free survival was not significantly higher among patients receiving trabectedin and doxorubicin, compared with patients only receiving doxorubicin (5.7 months vs. 5.5 months; HR, 1.16; 95% CI, 0.79-1.71; P = .45). Compared with patients who only received doxorubicin, patients who received both drugs experienced significantly more adverse events such as thrombocytopenia, liver toxicity, AST, ALT, and asthenia (all P values less than .05).
Data source: Randomized phase II trial of 115 adult patients with advanced nonresectable soft tissue sarcoma.
Disclosures: This study was supported by the Spanish Group for Research on Sarcoma. Ten investigators reported serving in advisory roles or receiving financial compensation or honoraria from several companies. The other 14 investigators reported having no disclosures.
MRI Results May Help Pinpoint PNEEs
A recent study suggests that brain MRI abnormalities are more common in patients with psychogenic nonepileptic events, when compared to the findings in normal persons. When investigators analyzed MRI data from 339 patients discharged from their epilepsy monitoring units, they found brain MRI abnormalities in 33.8% of patients with PNEEs and 57.7% in patients with epilepsy, much higher than would be found in a normal population. The researchers also discovered that the brain MRI anomalies during epileptic seizures were more likely to occur in the temporal region of the brain, while PNEE anomalies were more frequently multifocal.
Bolen RD, Koontz EH, Pritchard PB. Prevalence and distribution of MRI abnormalities in patients with psychogenic nonepileptic events. Epilepsy Behav. 2016;59:73-76.
Texting on a Smartphone Generates Unique EEG Readings
Using a smartphone or other personal electronic device (PED) to send text messages produces a “reproducible texting rhythm” that can be detected during video-EEG monitoring, according to Mayo Clinic researchers. In a cohort of 129 patients, this texting rhythm was detected in 27 (20.9%) patients. The rhythm existed in 28% of patients with epilepsy and 16% of those with non-epileptic seizures. The unique pattern was not present in patients when they performed independent tasks or when using a cellphone to make audio calls. The investigators concluded that the reproducible text rhythm “represents a novel technology-specific neurophysiological alteration of brain networks” and proposed that “cortical processing in the contemporary brain is uniquely activated by the use of PEDs.”
Tatum WO, DiCiaccio B, Yelvington KH. Cortical processing during smartphone text messaging. Epilepsy Behav. 2016;59:117-121.
Most Women With Epilepsy Seem to Favor Effective Contraceptive Methods
A cross-sectional data analysis derived from the Epilepsy Birth Control Registry recently found that among nearly 800 patients who were at risk for unintended pregnancy, 69.7% were using effective contraceptive methods, which included hormonal contraceptives, intrauterine devices, tubal ligation, and vasectomy. Despite the high number of patients with epilepsy using what are generally considered highly effective forms of birth control, the efficacy of these methods in this population "remains to be proven" according to researchers from Columbia University and Beth Israel Deaconess Medical Center. The analysis suggests that there is a need for evidence-based guidelines that demonstrate the efficacy and safety of various contraceptive methods in this special population.
Herzog AG, Mandle HB, Cahill KE, Fowler KM, Hauser WA, Davis AR. Contraceptive practices of women with epilepsy: Findings of the epilepsy birth control registry. Epilepsia. 2016;57(4):630-637.