User login
Early Detection of Melanoma in Men
Men do not know as much about skin cancer prevention and detection techniques as women, according to a recent survey conducted by the American Academy of Dermatology (AAD). This lack of knowledge may delay or prevent early diagnosis and treatment of melanoma and other nonmelanoma skin cancers in this patient population.
The survey results showed that only 56% of men versus 76% of women know there is no such thing as a healthy tan, and only 54% of men versus 70% of women know that getting a base tan is not a healthy way to protect skin from the sun. Furthermore, only 56% of men surveyed were aware that skin cancer could occur on areas of the skin not typically exposed to the sun compared to 65% of women.
“While our survey results indicate that men don’t know as much about skin cancer prevention and detection as women, men over 50 have a higher risk of developing melanoma, so it’s especially important for them to be vigilant about protecting and monitoring their skin,” said AAD President Abel Torres, MD, JD.
May is skin cancer awareness month and the AAD is encouraging patients to make sure their skin is “Looking Good in 2016” by using sun protection and regularly examining skin for signs of skin cancer. The campaign features a public service announcement encouraging men to check their skin for signs of skin cancer and find a partner to help. The AAD also released a new infographic with tips on performing a skin cancer self-examination that dermatologists can share with patients to promote early detection of skin cancer.
Dermatologist intervention in catching skin cancers when they are easier to treat also is key. At the 74th Annual Meeting of the American Academy of Dermatology in Washington, DC, Dr. Orit Markowitz discussed noninvasive imaging tools that can help dermatologists diagnose skin cancers earlier. She noted that even when a lesion looks very small, tools such as dermoscopy can reveal features that indicate it already has depth and therefore may progress to a more serious malignancy. Early detection is particularly crucial in cases of rare aggressive tumors such as amelanotic melanoma. “If something is very pink clinically and then suddenly has pigmentation dermoscopically, you really have to be considering biopsying that lesion because you may be looking at an early amelanotic melanoma,” Dr. Markowitz explained. By the time the lesion develops more obvious clinical features suggesting malignancy, the tumor progression may be far more advanced.

Law & Medicine: Locality rule
Question: An injured patient alleges that her eye doctor was negligent in failing to adhere to national treatment guidelines and in not using modern medical equipment. The encounter took place in a rural setting, with the nearest hospital 100 miles away.
In her malpractice lawsuit, which of the following choices is incorrect?
A. One of the doctor’s defenses may be the locality rule.
B. The plaintiff’s strongest argument is that community standards should parallel national standards for a specialist doctor such as an ophthalmologist.
C. Her expert witness must be a practicing ophthalmologist from the area.
D. The expert must be familiar with the local standards but does not have to practice there.
E. It all depends on what the state statute says, because the locality rule is not uniform settled law.
Answer: C. In traditional medical tort law, courts would rely on the standard of the particular locale where the tortious act took place, the so-called locality rule. This was based on the belief that different standards of care were applicable in different areas of the country, e.g., urban vs. rural. The rule can be traced to Small v. Howard,1 an 1880 Massachusetts opinion, which was subsequently overruled in 1968.

Factors favoring the trend away from a local standard toward a national standard include conformity in medical school and residency curricula, and prescribed board certification requirements. Internet access and telemedicine have further propagated this uniformity. Finally, two additional facets of modern medicine – continuing medical education and published clinical practice guidelines – are at odds with a rule geared toward local standards.
One argument against the locality rule is that undue reliance on an outdated mode of practice will perpetuate substandard care. In an older New York malpractice case where a newborn became blind, the pediatrician cited local custom to defend the prolonged use of oxygen to treat preterm infants, despite evidence that this practice might have serious consequences. However, the court of appeals held that the pediatrician’s superior knowledge of the increased risk of hyperoxygenation should have enabled him to use his best judgment instead of relying on the indefensible local custom.
Under a strict version of the locality rule, otherwise qualified expert witnesses may be excluded if they are not practitioners in the locale in question. Still, some courts may allow out-of-state experts to offer their opinions. This has been especially helpful to plaintiffs who are far less likely to be able to secure willing local experts, given the reluctance of many physicians to testify against a fellow doctor in their community.
Take Tennessee as an example. It once excluded the expert testimony of an orthopedic surgeon from Johnson City because the expert witness testified about the national standard and did not have actual knowledge of the standard of care in Nashville, the community where the alleged malpractice occurred.
The Tennessee Court of Appeals later ruled that expert witnesses had to have “personal” or “firsthand knowledge” of the community standard of care, and that interviewing other physicians in the area did not suffice. It subsequently clarified that an expert witness need not actually practice in the same or similar locale, and that professional contact with physicians from comparable communities, such as through referrals, would be acceptable.
Two well-known cases touching on the locality rule bear summarizing: In Swink v. Weintraub,2 Mrs. Swink bled into her pericardium during repair of a defective pacemaker electric lead. She died as a result, and her family pursued a wrongful death action, alleging negligence including delayed pericardiocentesis and surgical intervention.
The jury returned a verdict for the plaintiff, awarding damages in the amount of $1,047,732.20. On appeal, the defendants argued that North Carolina’s locality rule extended to all aspects of a negligence action, and that the trial court erred in admitting expert opinions without regard to whether those opinions reflected the “same or similar community” standard of care.
But the court of appeals disagreed, emphasizing that compliance with the “same or similar community” standard does not necessarily exonerate a defendant from an allegation of medical negligence. The court said liability can be established if the defendant did not exercise his “best judgment” in the treatment of the patient or if the defendant failed to use “reasonable care and diligence” in his efforts to render medical assistance.
In McClure v. Inova Medical Group, a Virginia jury found that a family practice resident had failed to meet the Virginia community standard of care when he did not order the prostate-specific antigen (PSA) test in a 53-year-old patient who was subsequently diagnosed with prostate cancer. The doctor had discussed the risks and benefits of PSA testing, but the patient declined taking the test. Jurors sided with the plaintiff’s argument that according to the local or statewide standard, Virginia doctors simply ordered the test as a matter of routine for men older than 50 years without necessarily discussing risks and benefits. The court awarded $1 million to the patient.3
Although the majority of jurisdictions have abandoned the locality rule, several continue to adhere to either a strict or modified version.4 Examples are Arizona, Idaho, New York, Tennessee, Virginia, and Washington. A modified rule exists in Louisiana, which holds general practitioners to a community standard and specialists to a national standard.
Finally, many authors have recommended a narrowly constructed rule based not on geographic boundaries, but on the availability of local resources. Courts would then look at the totality of circumstances, but remember that there is always the duty to refer or transfer to an available specialist/facility – and that the failure to do so may form the basis of liability.
As one physician put it: Location should not come into play with respect to the knowledge or skill of the treating physician; and even if a physician may not have the facilities to perform an emergency cesarean section, he or she should still know when it’s called for.
References
1. Small v. Howard, 128 Mass 131 (1880).
2. Swink v. Weintraub, 672 S.E.2d 53 (N.C. Court of Appeals 2009).
3. JAMA. 2004 Jan 7;291(1):15-6.
4. JAMA. 2007 Jun 20;297(23):2633-7.
Dr. Tan is professor emeritus of medicine and former adjunct professor of law at the University of Hawaii, and currently directs the St. Francis International Center for Healthcare Ethics in Honolulu. This article is meant to be educational and does not constitute medical, ethical, or legal advice. Some of the articles in this series are adapted from the author’s 2006 book, “Medical Malpractice: Understanding the Law, Managing the Risk,” and his 2012 Halsbury treatise, “Medical Negligence and Professional Misconduct.” For additional information, readers may contact the author at siang@hawaii.edu.
Question: An injured patient alleges that her eye doctor was negligent in failing to adhere to national treatment guidelines and in not using modern medical equipment. The encounter took place in a rural setting, with the nearest hospital 100 miles away.
In her malpractice lawsuit, which of the following choices is incorrect?
A. One of the doctor’s defenses may be the locality rule.
B. The plaintiff’s strongest argument is that community standards should parallel national standards for a specialist doctor such as an ophthalmologist.
C. Her expert witness must be a practicing ophthalmologist from the area.
D. The expert must be familiar with the local standards but does not have to practice there.
E. It all depends on what the state statute says, because the locality rule is not uniform settled law.
Answer: C. In traditional medical tort law, courts would rely on the standard of the particular locale where the tortious act took place, the so-called locality rule. This was based on the belief that different standards of care were applicable in different areas of the country, e.g., urban vs. rural. The rule can be traced to Small v. Howard,1 an 1880 Massachusetts opinion, which was subsequently overruled in 1968.
Factors favoring the trend away from a local standard toward a national standard include conformity in medical school and residency curricula, and prescribed board certification requirements. Internet access and telemedicine have further propagated this uniformity. Finally, two additional facets of modern medicine – continuing medical education and published clinical practice guidelines – are at odds with a rule geared toward local standards.
One argument against the locality rule is that undue reliance on an outdated mode of practice will perpetuate substandard care. In an older New York malpractice case where a newborn became blind, the pediatrician cited local custom to defend the prolonged use of oxygen to treat preterm infants, despite evidence that this practice might have serious consequences. However, the court of appeals held that the pediatrician’s superior knowledge of the increased risk of hyperoxygenation should have enabled him to use his best judgment instead of relying on the indefensible local custom.
Under a strict version of the locality rule, otherwise qualified expert witnesses may be excluded if they are not practitioners in the locale in question. Still, some courts may allow out-of-state experts to offer their opinions. This has been especially helpful to plaintiffs who are far less likely to be able to secure willing local experts, given the reluctance of many physicians to testify against a fellow doctor in their community.
Take Tennessee as an example. It once excluded the expert testimony of an orthopedic surgeon from Johnson City because the expert witness testified about the national standard and did not have actual knowledge of the standard of care in Nashville, the community where the alleged malpractice occurred.
The Tennessee Court of Appeals later ruled that expert witnesses had to have “personal” or “firsthand knowledge” of the community standard of care, and that interviewing other physicians in the area did not suffice. It subsequently clarified that an expert witness need not actually practice in the same or similar locale, and that professional contact with physicians from comparable communities, such as through referrals, would be acceptable.
Two well-known cases touching on the locality rule bear summarizing: In Swink v. Weintraub,2 Mrs. Swink bled into her pericardium during repair of a defective pacemaker electric lead. She died as a result, and her family pursued a wrongful death action, alleging negligence including delayed pericardiocentesis and surgical intervention.
The jury returned a verdict for the plaintiff, awarding damages in the amount of $1,047,732.20. On appeal, the defendants argued that North Carolina’s locality rule extended to all aspects of a negligence action, and that the trial court erred in admitting expert opinions without regard to whether those opinions reflected the “same or similar community” standard of care.
But the court of appeals disagreed, emphasizing that compliance with the “same or similar community” standard does not necessarily exonerate a defendant from an allegation of medical negligence. The court said liability can be established if the defendant did not exercise his “best judgment” in the treatment of the patient or if the defendant failed to use “reasonable care and diligence” in his efforts to render medical assistance.
In McClure v. Inova Medical Group, a Virginia jury found that a family practice resident had failed to meet the Virginia community standard of care when he did not order the prostate-specific antigen (PSA) test in a 53-year-old patient who was subsequently diagnosed with prostate cancer. The doctor had discussed the risks and benefits of PSA testing, but the patient declined taking the test. Jurors sided with the plaintiff’s argument that according to the local or statewide standard, Virginia doctors simply ordered the test as a matter of routine for men older than 50 years without necessarily discussing risks and benefits. The court awarded $1 million to the patient.3
Although the majority of jurisdictions have abandoned the locality rule, several continue to adhere to either a strict or modified version.4 Examples are Arizona, Idaho, New York, Tennessee, Virginia, and Washington. A modified rule exists in Louisiana, which holds general practitioners to a community standard and specialists to a national standard.
Finally, many authors have recommended a narrowly constructed rule based not on geographic boundaries, but on the availability of local resources. Courts would then look at the totality of circumstances, but remember that there is always the duty to refer or transfer to an available specialist/facility – and that the failure to do so may form the basis of liability.
As one physician put it: Location should not come into play with respect to the knowledge or skill of the treating physician; and even if a physician may not have the facilities to perform an emergency cesarean section, he or she should still know when it’s called for.
References
1. Small v. Howard, 128 Mass 131 (1880).
2. Swink v. Weintraub, 672 S.E.2d 53 (N.C. Court of Appeals 2009).
3. JAMA. 2004 Jan 7;291(1):15-6.
4. JAMA. 2007 Jun 20;297(23):2633-7.
Dr. Tan is professor emeritus of medicine and former adjunct professor of law at the University of Hawaii, and currently directs the St. Francis International Center for Healthcare Ethics in Honolulu. This article is meant to be educational and does not constitute medical, ethical, or legal advice. Some of the articles in this series are adapted from the author’s 2006 book, “Medical Malpractice: Understanding the Law, Managing the Risk,” and his 2012 Halsbury treatise, “Medical Negligence and Professional Misconduct.” For additional information, readers may contact the author at siang@hawaii.edu.

Ultrasound improves early diagnosis of ventilator-associated pneumonia
The use of lung ultrasound, both alone and in combination with clinical and microbiologic data, can improve the early diagnosis of ventilator-associated pneumonia (VAP), according to the results of a study published in Chest.
The early diagnosis of VAP is challenging, and leaves intensivists with two options. The first is waiting for positive results from patients’ specimens, which delays treatment and increases mortality risk. The other is to administer antibiotics to all patients suspected of having VAP, which may be inappropriate and can lead to the development of multiresistant bacteria. “A pressing need therefore exists for reliable diagnostic tools to diagnose VAP early so that antibiotics can be promptly initiated, avoiding two extreme approaches,” wrote Dr. Silvia Mongodi of the Fondazione IRCCS Policlinico San Matteo in Pavia, Italy, and her colleagues.
Based on the results of previous research, the investigators hypothesized that lung ultrasound (LUS) could be used to diagnose VAP early and help to avoid treatment delays or mistakes. To test this hypothesis, the diagnostic performance of LUS alone and in combination with clinical and microbiologic data was evaluated prospectively in 99 patients with suspected VAP in ICUs at Saint Joseph Hospital (Paris), Fondazione IRCCS Policlinico San Matteo, and Centre Hospitalier de l’Université de Montréal (Chest. 2016 Apr;149[4]:969-80. doi: 10.1016/j.chest.2015.12.012).
The study results showed that subpleural consolidations and dynamic linear/arborescent air bronchograms were the principal LUS signs of VAP, and that the presence of both in the same individual made the diagnosis highly specific (88%), with a high positive predictive value (86%) and a positive likelihood ratio of 2.9. Furthermore, the addition of data from either of two different endotracheal aspirate assessment techniques (EAgram [direct Gram stain examination] or EAquant [direct Gram stain culture]) to the data from the principal LUS signs showed 97% specificity with each technique and positive likelihood ratios of 6.6 and 7.1, respectively, Dr. Mongodi and her associates reported.
Dr. Mongodi and her colleagues said that their results were encouraging but would need to be validated in larger clinical trials.
No funding was received for this study. The authors reported no conflicts of interest.
Dr. Daniel Ouellette, FCCP comments: Ultrasound techniques are increasingly being used in the intensive care unit to direct physician decisions. A report by Mongodi and colleagues suggests that ultrasound may be employed to diagnose ventilator-associated pneumonia in critically ill patients. While promising, this study is limited by small patient numbers and by the fact that reliable criteria to diagnose VAP are lacking. Further research is needed before this technique can be used reliably in the ICU.
Dr. Daniel Ouellette, FCCP comments: Ultrasound techniques are increasingly being used in the intensive care unit to direct physician decisions. A report by Mongodi and colleagues suggests that ultrasound may be employed to diagnose ventilator-associated pneumonia in critically ill patients. While promising, this study is limited by small patient numbers and by the fact that reliable criteria to diagnose VAP are lacking. Further research is needed before this technique can be used reliably in the ICU.
Dr. Daniel Ouellette, FCCP comments: Ultrasound techniques are increasingly being used in the intensive care unit to direct physician decisions. A report by Mongodi and colleagues suggests that ultrasound may be employed to diagnose ventilator-associated pneumonia in critically ill patients. While promising, this study is limited by small patient numbers and by the fact that reliable criteria to diagnose VAP are lacking. Further research is needed before this technique can be used reliably in the ICU.
The use of lung ultrasound, both alone and in combination with clinical and microbiologic data, can improve the early diagnosis of ventilator-associated pneumonia (VAP), according to the results of a study published in Chest.
The early diagnosis of VAP is challenging, and leaves intensivists with two options. The first is waiting for positive results from patients’ specimens, which delays treatment and increases mortality risk. The other is to administer antibiotics to all patients suspected of having VAP, which may be inappropriate and can lead to the development of multiresistant bacteria. “A pressing need therefore exists for reliable diagnostic tools to diagnose VAP early so that antibiotics can be promptly initiated, avoiding two extreme approaches,” wrote Dr. Silvia Mongodi of the Fondazione IRCCS Policlinico San Matteo in Pavia, Italy, and her colleagues.
Based on the results of previous research, the investigators hypothesized that lung ultrasound (LUS) could be used to diagnose VAP early and help to avoid treatment delays or mistakes. To test this hypothesis, the diagnostic performance of LUS alone and in combination with clinical and microbiologic data was evaluated prospectively in 99 patients with suspected VAP in ICUs at Saint Joseph Hospital (Paris), Fondazione IRCCS Policlinico San Matteo, and Centre Hospitalier de l’Université de Montréal (Chest. 2016 Apr;149[4]:969-80. doi: 10.1016/j.chest.2015.12.012).
The study results showed that subpleural consolidations and dynamic linear/arborescent air bronchograms were the principal LUS signs of VAP, and that the presence of both in the same individual made the diagnosis highly specific (88%), with a high positive predictive value (86%) and a positive likelihood ratio of 2.9. Furthermore, the addition of data from either of two different endotracheal aspirate assessment techniques (EAgram [direct Gram stain examination] or EAquant [direct Gram stain culture]) to the data from the principal LUS signs showed 97% specificity with each technique and positive likelihood ratios of 6.6 and 7.1, respectively, Dr. Mongodi and her associates reported.
Dr. Mongodi and her colleagues said that their results were encouraging but would need to be validated in larger clinical trials.
No funding was received for this study. The authors reported no conflicts of interest.
Key clinical point: The specificity of the examination for ventilator-associated pneumonia diagnosis could be increased with daily lung-ultrasound monitoring of ICU patients.
Major finding: Lung ultrasound reliably improved the diagnosis of ventilator-associated pneumonia with high specificity (88%), high positive predictive value (86%), and a positive likelihood ratio of 2.9.
Data sources: Patients with suspected ventilator-associated pneumonia in ICUs in France, Italy, and Canada.
Disclosures: No funding was received for this study. The authors reported no conflicts of interest.
VIDEO: SCOTUS decision sends contraception mandate to lower courts
WASHINGTON – It will be up to the lower courts to decide how to work out religious exemptions under the Affordable Care Act’s contraception mandate, following the Supreme Court’s decision to remand Zubik v. Burwell back to the U.S. Court of Appeals for the 3rd, 5th, 10th, and District of Columbia Circuits.
In an unusual move, on May 16 the Supreme Court vacated the lower court rulings related to Zubik v. Burwell and has remanded the case back to the four appeals courts that had originally ruled on the issue.
At issue in the case is the implementation of the Affordable Care Act’s contraception mandate and specifically how nonprofit religious employers can opt out of directly paying for their employees’ contraception. The federal government had created a workaround that required employers to submit a form stating that they have religious objections, but the plaintiffs asserted that the process itself was a violation of their religious freedom.
The video associated with this article is no longer available on this site. Please view all of our videos on the MDedge YouTube channel
In March, the high court asked all parties in the case to submit additional briefs outlining how contraception could be provided without requiring notice on the part of the employers. After reviewing the briefs, the Supreme Court justices concluded that “such an option is feasible.”
“Given the gravity of the dispute and the substantial clarification and refinement in the positions of the parties, the parties on remand should be afforded an opportunity to arrive at an approach going forward that accommodates petitioners’ religious exercise while at the same time ensuring that women covered by petitioners’ health plans ‘receive full and equal health coverage, including contraceptive coverage,’ ” the justices wrote in the decision. “We anticipate that the Courts of Appeals will allow the parties sufficient time to resolve any outstanding issues between them.”
The Supreme Court made no decision about the merits of Zubik v. Burwell.
Dr. Sara Imershein, a clinical professor at George Washington University and an ob.gyn. at Planned Parenthood in Washington, said the decision was a disappointment because it requires the courts to sort out a workaround to the contraception mandate when the government has already put one in place. Dr. Imershein, who is a reproductive rights advocate, commented on the news in a video interview while attending the annual meeting of the American College of Obstetricians and Gynecologists.
Dr. Mark S. DeFrancesco, ACOG president, expressed the college’s disappointment in the Supreme Court’s decision.
“ACOG strongly believes that contraception is an essential part of women’s preventive care, and that any accommodation to employers’ beliefs must not impose barriers to women’s ability to access contraception,” Dr. DeFrancesco said in a statement. “We encourage the lower courts to adopt a solution that ensures that coverage is provided seamlessly ‘through petitioner’s insurance companies.’”
mschneider@frontlinemedcom.com
On Twitter @maryellenny
AT ACOG 2016

Team describes new approach to cancer immunotherapy

Image by Kathryn T. Iacono
A new approach to cancer immunotherapy may avoid some of the shortcomings associated with other methods, according to researchers.
The group found that eliminating a key protein in regulatory T cells (Tregs) makes them so unstable that they become effector T cells (Teff) and begin to attack the cancer.
And this conversion from Treg to Teff occurs only in the inflammatory conditions that prevail within many tumors.
As a result, Tregs embedded in normal tissue throughout the body continue to have a restraining effect on their local Teffs, protecting healthy organs and tissues from attack.
The researchers said this raises the prospect of therapies that concentrate the immune system’s firepower on tumors without producing residual damage and harmful side effects.
“Many current approaches to immunotherapy involve depleting or blocking Tregs in order to shift the balance toward Teff cells,” said Harvey Cantor, MD, of the Dana-Farber Cancer Institute in Boston, Massachusetts.
“This, however, runs the risk of triggering an autoimmune response in which the Teff cells attack normal as well as malignant tissue. The key to our approach is that it singles out the Tregs inside a tumor for conversion, leaving Tregs elsewhere in the body unchanged.”
Dr Cantor and his colleagues described the approach in PNAS.
The study builds on research published last year in Science. That study showed that Tregs maintain their immune-suppressive properties under inflammatory conditions as long as they have high enough levels of a protein called Helios. Depriving Tregs of sufficient Helios caused them to lose that stability and turn into Teff cells.
The new study explored whether this convertibility could be harnessed for therapeutic purposes in cancers.
The first set of experiments involved mice engineered to lack Helios in their Tregs. When the animals were injected with melanoma or colon cancer cells, they developed tumors far more slowly than animals with normal Tregs.
“Inspection of the animals’ tumor tissue showed an unstable set of T regulatory cells, many of which had converted into Teffs,” said Hye-Jung Kim, PhD, also of the Dana-Farber Cancer Institute.
The researchers then explored whether stanching Helios production in tumor-dwelling Tregs could have the same effect. They tested several antibodies that bind to key receptors on Tregs and cause a downturn in Helios production.
The team chose an antibody that worked well, DTA-1, and tested it in mice with Treg-laden tumors. When they analyzed the tumor tissue, it was clear that DTA-1 had triggered conversion of Tregs to Teffs.
“This represents a next stage in cancer immunotherapy,” Dr Cantor said. “We now have a very specific, targeted way of inducing a T-effector-cell attack on cancer while lowering the risk of adverse effects on healthy tissue. The next step will be to organize a clinical trial using this approach in patients.” ![]()
Physical activity may lower risk of some cancers
Photo by K. Johansson
Being physically active during leisure time may lower a person’s risk of certain cancers, according to a new study.
A high level of physical activity was associated with a 20% lower risk of myeloid leukemia, a 17% lower risk of myeloma, a 9% lower risk of non-Hodgkin lymphoma, and a 7% lower risk of cancer in general.
On the other hand, a high level of physical activity was also associated with a higher risk of malignant melanoma and prostate cancer.
Steven C. Moore, PhD, of the National Cancer Institute in Bethesda, Maryland, and his colleagues reported these findings in JAMA Internal Medicine.
The researchers pooled data from 12 US and European study cohorts with self-reported physical activity (1987-2004). And they analyzed associations between physical activity and 26 types of cancer.
The study included 1.4 million participants, and 186,932 cancers were identified during a median of 11 years of follow-up.
Compared with the lowest level of leisure-time physical activity (10th percentile), the highest level of activity (90th percentile) had strong inverse associations (a 20% or greater reduction in risk) for 7 cancer types:
- Myeloid leukemia (hazard ratio [HR]=0.80 [95% CI, 0.70-0.92])
- Esophageal adenocarcinoma (HR=0.58 [95% CI, 0.37-0.89])
- Liver cancer (HR=0.73 [95% CI, 0.55-0.98])
- Lung cancer (HR=0.74 [95% CI, 0.71-0.77])
- Kidney cancer (HR=0.77 [95% CI, 0.70-0.85])
- Gastric cardia (HR=0.78 [95% CI, 0.64-0.95])
- Endometrial cancer (HR=0.79 [95% CI, 0.68-0.92]).
There were moderate inverse associations (a 10% to 20% reduction in risk) between the highest level of activity and 6 cancers:
- Myeloma (HR=0.83 [95% CI, 0.72-0.95])
- Colon cancer (HR=0.84 [95% CI, 0.77-0.91])
- Head and neck cancer (HR=0.85 [95% CI, 0.78-0.93])
- Rectal cancer (HR=0.87 [95% CI, 0.80-0.95])
- Bladder cancer (HR=0.87 [95% CI, 0.82-0.92])
- Breast cancer (HR=0.90 [95% CI, 0.87-0.93]).
And there were suggestive inverse associations between the highest level of activity and 3 cancers:
- Non-Hodgkin lymphoma (HR=0.91 [95% CI, 0.83-1.00])
- Gallbladder cancer (HR=0.72 [95% CI, 0.51-1.01])
- Small intestine cancer (HR=0.78 [95% CI, 0.60-1.00]).
However, the highest level of activity was also associated with an increased risk of prostate cancer (HR=1.05 [95% CI, 1.03-1.08]) and malignant melanoma (HR=1.27 [95% CI, 1.16-1.40]).
The researchers said the main limitation of this study is that they cannot fully exclude the possibility that diet, smoking, and other factors may have affected these results. Also, the study used self-reported physical activity, which can mean errors in recall.
Still, the team said these findings support promoting physical activity as a key component of population-wide cancer prevention and control efforts. ![]()
Reversal agent granted conditional approval in Canada

to prevent thrombosis after
knee replacement surgery
© Boehringer Ingelheim
Health Canada has granted conditional approval for idarucizumab (Praxbind), a humanized antibody fragment designed to reverse the anticoagulant effects of dabigatran etexilate (Pradaxa) in cases of emergency surgery/urgent procedures or in situations of life-threatening or uncontrolled bleeding.
The conditional approval of idarucizumab reflects the promising nature of the available clinical evidence.
For the drug to gain full approval, Boehringer Ingelheim—the company that markets both idarucizumab and dabigatran—must provide Health Canada with data confirming that idarucizumab provides a clinical benefit.
To date, study results have demonstrated that 5g of idarucizumab provides immediate, complete, and sustained reversal of the anticoagulant effects of dabigatran in most patients.
In the ongoing phase 3 RE-VERSE AD trial, researchers are evaluating idarucizumab in emergency settings.
Interim results from this trial showed that idarucizumab normalized diluted thrombin time and ecarin clotting time in a majority of dabigatran-treated patients with uncontrolled or life-threatening bleeding complications and most patients who required emergency surgery or an invasive procedure.
Researchers said there were no safety concerns related to idarucizumab. However, 23% of patients in this trial experienced serious adverse events, 20% of patients died, and several patients had thrombotic or bleeding events. ![]()
Improving NK cell therapy

Image by Joshua Stokes
New findings published in PNAS may help scientists improve the efficacy of natural killer (NK) cell therapy for patients with leukemia.
The preclinical research revealed a tolerance mechanism that restrains the activity of NK cells, as well as a potential way to overcome this problem.
Investigators found that a transcription factor, Kruppel-like factor 2 (KFL2), is critical for NK cell expansion and survival.
Specifically, KLF2 limits immature NK cell proliferation and instructs mature NK cells to home to niches rich in interleukin 15 (IL-15), which is necessary for their continued survival.
“This is the same process likely used by cancer cells to avoid destruction by NK cells,” said study author Eric Sebzda, PhD, of Vanderbilt University Medical Center in Nashville, Tennessee.
In particular, tumors may avoid immune clearance by promoting KLF2 destruction within the NK cell population, thereby starving these cells of IL-15.
Dr Sebzda and his colleagues noted that increased expression of IL-15 can improve immune responses against tumors. Unfortunately, it’s not easy to introduce the cytokine only within a tumor microenvironment, and high systemic levels of IL-15 can be toxic.
Recruiting cells that transpresent IL-15 to the tumor microenvironment may overcome this barrier and therefore improve NK cell-mediated cancer therapy, the investigators said. However, the methodology hasn’t been worked out yet.
“Our paper should encourage this line of inquiry,” Dr Sebzda concluded. ![]()
Physician Predictions of Length of Stay
Heart failure is a frequent cause of hospital admission in the United States, with an estimated cost of $31 billion dollars per year.[1] Discharging a patient with heart failure requires a multidisciplinary approach that includes anticipating a discharge date, scheduling follow‐up, reconciling medications, assessing home‐care or placement needs, and delivering patient education.[2, 3] Comprehensive transitional care interventions reduce readmissions and mortality.[2] Individually tailored and structured discharge plans decrease length of stay and readmissions.[3] The Centers for Medicare and Medicaid Services recently proposed that discharge planning begin within 24 hours of inpatient admissions,[4] despite inadequate data surrounding the optimal time to begin discharge planning.[3] In addition to enabling transitional care, identifying patients vulnerable to extended hospitalization aids in risk stratification, as prolonged length of stay is associated with increased risk of readmission and mortality.[5, 6]
Physicians are not able to accurately prognosticate whether patients will experience short‐term outcomes such as readmissions or mortality.[7, 8] Likewise, physicians do not predict length of stay accurately for heterogeneous patient populations,[9, 10, 11] even on the morning prior to anticipated discharge.[12] Prediction accuracy for patients admitted with heart failure, however, has not been adequately studied. The objectives of this study were to measure the accuracy of inpatient physicians' early predictions of length of stay for patients admitted with heart failure and to determine whether level of experience improved accuracy.
METHODS
In this prospective, observational study, we measured physicians' predictions of length of stay for patients admitted to a heart failure teaching service at an academic tertiary care hospital. Three resident/emntern teams rotate admitting responsibilities every 3 days, supervised by 1 attending cardiologist. Patients admitted overnight may be admitted independently by the on‐call resident without intern collaboration.
All physicians staffing our center's heart failure teaching service between August 1, 2013 and November 19, 2013 were recruited, and consecutively admitted adult patients were included. Patients were excluded if they did not have any cardiac diagnosis or if still admitted at study completion in February 2014. Deceased patients' time of death was counted as discharge.
Interns, residents, and attending cardiologists were interviewed independently within 24 hours of admission and asked to predict length of stay. Interns and residents were interviewed prior to rounds, and attendings thereafter. Electronic medical records were reviewed to determine date and time of admission and discharge, demographics, clinical variables, and discharge diagnoses.
The primary outcome was accuracy of predictions of length of stay stratified by level of experience. Based on prior pilot data, at 80% power and significance level () of 0.05, we estimated that predictions were needed on 100 patients to detect a 2‐day difference between actual and predicted length of stay.
Student t tests were used to compare the difference between predicted and actual length of stay for each level of training. Analysis of variance (ANOVA) was used to compare accuracy of prediction by training level. Generalized estimating equation (GEE) modeling was applied to compare predictions among interns, residents, and attending cardiologists, accounting for clustering by individual physician. GEE models were adjusted for study week in a sensitivity analysis to determine if predictions improved over time.
Analysis was performed using SAS 9.3 (SAS Institute Inc., Cary, NC) and R 2.14 (The R Foundation for Statistical Computing, Vienna, Austria). Institutional review board approval was granted, and physicians provided informed consent. All authors had access to primary data devoid of protected health information.
RESULTS
In total, 22 interns (<6 months experience), 25 residents (13 years experience), and 8 attending cardiologists (mean 19 9.7 years experience) were studied. Predictions were performed on 171 consecutively admitted patients. Five patients had noncardiac diagnoses and 1 patient remained admitted, leaving 165 patients for analysis. Predictions were made by all 3 physician levels on 98 patients. There were 67 patients with incomplete predictions as a result of 63 intern, 13 attending, and 4 resident predictions that were unobtainable. Absent intern data predominantly resulted from night shift admissions. Remaining missing data were due to time‐sensitive physician tasks that interfered with physician interviews.
Patient characteristics are described in Table 1. Physicians provided 415 predictions on 165 patients, 157 (95%) of whom survived to hospital discharge. Mean and median lengths of stay were 10.9 and 8 days (interquartile range [IQR], 4 to 13). Mean intern (N = 102), resident (N = 161), and attending (N = 152) predictions were 5.4 days (95% confidence interval [CI]: 4.6 to 6.2), 6.6 days (95% CI: 5.8 to 7.4) and 7.2 days (95% CI: 6.4 to 7.9), respectively. Median intern, resident, and attending predictions were 5 days (IQR, 3 to 7), 5 days (IQR, 3 to 7), and 6 days (IQR, 4 to 10). Mean differences between predicted and actual length of stay for interns, residents and attendings were 9 days (95% CI: 8.2 to 3.6), 4.3 days (95% C: 6.0 to 2.7), and 3.5 days (95% CI: 5.1 to 2.0). The mean difference between predicted and actual length of stay was statistically significant for all groups (P < 0.0001). Median intern, resident, and attending differences between predicted and actual were 2 days (IQR, 7 to 0), 2 days (IQR, 7 to 0), and 1 day (IQR, 5 to 1), respectively. Predictions correlated poorly with actual length of stay (R2 = 0.11).
| Patients, N = 165 (%) | |
|---|---|
| |
| Male | 105 (63%) |
| Age | 57 16 years |
| White | 99 (60%) |
| Black | 52 (31%) |
| Asian, Hispanic, other, unknown | 16 (9%) |
| HF classification | |
| HF with a reduced EF (EF 40%) | 106(64%) |
| HF mixed/undefined (EF 41%49%) | 14 (8%) |
| HF with a preserved EF (EF 50%) | 20 (12%) |
| Right heart failure only | 5 (3%) |
| Heart transplant cardiac complications | 20 (12%) |
| Severity of illness on admission | |
| NYHA class I | 9 (5%) |
| NYHA class II | 25 (15%) |
| NYHA class III | 67 (41%) |
| NYHA class IV | 32 (19%) |
| NYHA class unknown* | 32 (19%) |
| Mean no. of home medications prior to admission | 13 6 |
| On intravenous inotropes prior to admission | 18 (11%) |
| On mechanical circulatory support prior to admission | 15 (9%) |
| Status postheart transplant | 20 (12%) |
| Invasive hemodynamic monitoring within 24 hours | 94 (57%) |
| Type of admission | |
| Admitted through emergency department | 71 (43%) |
| Admitted from clinic | 35 (21%) |
| Transferred from other acute care hospitals | 56 (34%) |
| Admitted from skilled nursing or rehabilitation facility | 3 (2%) |
| Social history | |
| Lived alone prior to admission | 32 (19%) |
| Prison/homeless/facility/unknown living situation | 8 (5%) |
| Required assistance for IADLS/ADLS prior to admission | 29 (17%) |
| Home health services initiated prior to admission | 42 (25%) |
| Prior admission history | |
| No known admissions in the prior year | 70 (42%) |
| 1 admission in the prior year | 37 (22%) |
| 2 admissions in the prior year | 21 (13%) |
| 310 admissions in the prior year | 36 (22%) |
| Unknown readmission status | 1 (1%) |
| Readmitted patients | |
| Readmitted within 30 days | 38 (23%) |
| Readmitted within 7 days | 13 (8%) |
Ninety‐eight patients (59%) received predictions from physicians at all 3 experience levels. Mean and median lengths of stay were 11.3 days and 7.5 days (IQR, 4 to 13). Concordant with the entire cohort, median intern, resident, and attending predictions for these patients were 5 days (IQR, 3 to 7), 5 days (IQR, 3 to 7), and 6 days (IQR, 4 to 10), respectively. Differences between predicted and actual length of stay were statistically significant for all groups: the mean difference for interns, residents, and attendings was 5.8 days (95% CI: 8.2 to 3.4, P < 0.0001), 4.6 days (95% CI: 7.1 to 2.0, P = 0.0001), and 4.3 days (95% CI: 6.5 to 2.1, P = 0.0003), respectively (Figure 1).

There are differences among providers with improved prediction as level of experience increased, but this is not statistically significant as determined by ANOVA (p=0.64) or by GEE modeling to account for clustering of predictions by physician (P = 0.61). Analysis that adjusted for study week yielded similar results. Thus, experience did not improve accuracy.
DISCUSSION
We prospectively measured accuracy of physicians' length of stay predictions of heart failure patients and compared accuracy by experience level. All physicians underestimated length of stay, with average differences between 3.5 and 6 days. Most notably, level of experience did not improve accuracy. Although we anticipated that experience would improve prediction, our findings are not compatible with this hypothesis. Future studies of factors affecting length of stay predictions would help to better understand our findings.
Our results are consistent with small, single‐center studies of different patient and physician cohorts. Hulter Asberg found that internists at a hospital were unable to predict whether a patient would remain admitted 10 days or more, with poor interobserver reliability.[9] Mak et al. demonstrated that emergency physicians underestimated length of stay by an average of 2 days when predicting length of stay on a broad spectrum of patients in an emergency department.[10] Physician predictions of length of stay have been found to be inaccurate in a center's oncologic intensive care unit population.[11] Sullivan et al. found that academic general medicine physicians predicted discharge with 27% sensitivity the morning prior to next‐day discharge, which improved significantly to 67% by the afternoon, concluding that physicians can provide meaningful discharge predictions the afternoon prior to next‐day discharge.[12] By focusing on patients with heart failure, a major driver of hospitalization and readmission, and comparing providers by level of experience, we augment this existing body of work.
In addition to identifying patients at risk for readmission and mortality,[5, 6] accurate discharge prediction may improve safety of weekend discharges and patient satisfaction. Heart failure patients discharged on weekends receive less complete discharge instructions,[13] suffer higher mortality, and are readmitted more frequently than those discharged on weekdays.[14] Early and accurate predictions may enhance interventions targeting patients with anticipated weekend discharges. Furthermore, inadequate communication regarding anticipated discharge timing is a source of patient dissatisfaction,[15] and accurate prediction of discharge, if shared with patients, may improve patient satisfaction.
Limitations of our study include that it was a single‐center study at a large academic tertiary care hospital with predictions assessed on a teaching service. Severity of illness of this cohort may be a barrier to generalizability, and physicians may predict prognosis of healthier patients more accurately. We recorded predictions at the time of admission, and did not assess whether accuracy improved closer to discharge. We did not collect predictions from non‐physician team members. Sample size and absent data regarding the causes of prolonged hospitalization prohibited an analyses of variables associated with prediction inaccuracy.
CONCLUSIONS
Physicians do not accurately forecast heart failure patients' length of stay at the time of admission, and level of experience does not improve accuracy. Future studies are warranted to determine whether predictions closer to discharge, by an interdisciplinary team, or with assistance of risk‐prediction models are more accurate than physician predictions at admission, and whether early identification of patients at risk for prolonged hospitalization improves outcomes. Ultimately, early and accurate length of stay forecasts may improve risk stratification, patient satisfaction, and discharge planning, and reduce adverse outcomes related to at‐risk discharges.
Acknowledgements
The authors acknowledge Katherine R Courtright, MD, for her gracious assistance with statistical analysis.
Disclosure: Nothing to report
- , , , et al. Forecasting the impact of heart failure in the United States: a policy statement from the American Heart Association. Circ Heart Fail. 2013;6:606–619.
- , , , et al. So many options, where do we start? An overview of the care transitions literature. J Hosp Med. 2016;;11(3):221–230.
- , , , , . Discharge planning from hospital. Cochrane Database Syst Rev. 2016;1:CD000313.
- Department of Health and Human Services. Centers for Medicare and Medicaid Services. 42 CFR Parts 482, 484, 485 Medicare and Medicaid programs; revisions to requirements for discharge planning for hospitals, critical access hospitals, and home health agencies; proposed rule. Fed Regist. 2015:80(212): 68126–68155.
- , , , , , . Predicting the risk of unplanned readmission or death within 30 days of discharge after a heart failure hospitalization. Am Heart J. 2012;164:365–372.
- , , , et al. Predictors and associations with outcomes of length of hospital stay in patients with acute heart failure: results from VERITAS20 [published online December 22, 2015]. J Card Fail. doi: 10.1016/j.cardfail.2015.12.017.
- , , , , . Inability of providers to predict unplanned readmissions. J Gen Intern Med. 2011;26(7):771–776.
- , , , et al. Prediction of rehospitalization and death in severe heart failure by physicians and nurses of the ESCAPE trial. J Card Fail. 2007;13(1):8–13.
- . Physicians' outcome predictions for elderly patients. Survival, hospital discharge, and length of stay in a department of internal medicine. Scand J Soc Med. 1986;14(3):127–132.
- , , , . Physicians' ability to predict hospital length of stay for patients admitted to the hospital from the emergency department. Emerg Med Int. 2012;2012:824674.
- , . ICU physicians are unable to accurately predict length of stay at admission: a prospective study. Int J Qual Health Care. 2016;28(1):99–103.
- , , , et al. An evaluation of physician predictions of discharge on a general medicine service. J Hosp Med. 2015;10(12) 808–810.
- , , , et al. Weekend hospital admission and discharge for heart failure: association with quality of care and clinical outcomes. Am Heart J. 2009;158(3):451–458.
- , , , , . Postdischarge outcomes in heart failure are better for teaching hospitals and weekday discharges. Circ Heart Fail. 2013;6(5):922–929.
- , , , et al. In‐room display of day and time patient is anticipated to leave hospital: a “discharge appointment.” J Hosp Med. 2007;2(1):13–16.
Heart failure is a frequent cause of hospital admission in the United States, with an estimated cost of $31 billion dollars per year.[1] Discharging a patient with heart failure requires a multidisciplinary approach that includes anticipating a discharge date, scheduling follow‐up, reconciling medications, assessing home‐care or placement needs, and delivering patient education.[2, 3] Comprehensive transitional care interventions reduce readmissions and mortality.[2] Individually tailored and structured discharge plans decrease length of stay and readmissions.[3] The Centers for Medicare and Medicaid Services recently proposed that discharge planning begin within 24 hours of inpatient admissions,[4] despite inadequate data surrounding the optimal time to begin discharge planning.[3] In addition to enabling transitional care, identifying patients vulnerable to extended hospitalization aids in risk stratification, as prolonged length of stay is associated with increased risk of readmission and mortality.[5, 6]
Physicians are not able to accurately prognosticate whether patients will experience short‐term outcomes such as readmissions or mortality.[7, 8] Likewise, physicians do not predict length of stay accurately for heterogeneous patient populations,[9, 10, 11] even on the morning prior to anticipated discharge.[12] Prediction accuracy for patients admitted with heart failure, however, has not been adequately studied. The objectives of this study were to measure the accuracy of inpatient physicians' early predictions of length of stay for patients admitted with heart failure and to determine whether level of experience improved accuracy.
METHODS
In this prospective, observational study, we measured physicians' predictions of length of stay for patients admitted to a heart failure teaching service at an academic tertiary care hospital. Three resident/emntern teams rotate admitting responsibilities every 3 days, supervised by 1 attending cardiologist. Patients admitted overnight may be admitted independently by the on‐call resident without intern collaboration.
All physicians staffing our center's heart failure teaching service between August 1, 2013 and November 19, 2013 were recruited, and consecutively admitted adult patients were included. Patients were excluded if they did not have any cardiac diagnosis or if still admitted at study completion in February 2014. Deceased patients' time of death was counted as discharge.
Interns, residents, and attending cardiologists were interviewed independently within 24 hours of admission and asked to predict length of stay. Interns and residents were interviewed prior to rounds, and attendings thereafter. Electronic medical records were reviewed to determine date and time of admission and discharge, demographics, clinical variables, and discharge diagnoses.
The primary outcome was accuracy of predictions of length of stay stratified by level of experience. Based on prior pilot data, at 80% power and significance level () of 0.05, we estimated that predictions were needed on 100 patients to detect a 2‐day difference between actual and predicted length of stay.
Student t tests were used to compare the difference between predicted and actual length of stay for each level of training. Analysis of variance (ANOVA) was used to compare accuracy of prediction by training level. Generalized estimating equation (GEE) modeling was applied to compare predictions among interns, residents, and attending cardiologists, accounting for clustering by individual physician. GEE models were adjusted for study week in a sensitivity analysis to determine if predictions improved over time.
Analysis was performed using SAS 9.3 (SAS Institute Inc., Cary, NC) and R 2.14 (The R Foundation for Statistical Computing, Vienna, Austria). Institutional review board approval was granted, and physicians provided informed consent. All authors had access to primary data devoid of protected health information.
RESULTS
In total, 22 interns (<6 months experience), 25 residents (13 years experience), and 8 attending cardiologists (mean 19 9.7 years experience) were studied. Predictions were performed on 171 consecutively admitted patients. Five patients had noncardiac diagnoses and 1 patient remained admitted, leaving 165 patients for analysis. Predictions were made by all 3 physician levels on 98 patients. There were 67 patients with incomplete predictions as a result of 63 intern, 13 attending, and 4 resident predictions that were unobtainable. Absent intern data predominantly resulted from night shift admissions. Remaining missing data were due to time‐sensitive physician tasks that interfered with physician interviews.
Patient characteristics are described in Table 1. Physicians provided 415 predictions on 165 patients, 157 (95%) of whom survived to hospital discharge. Mean and median lengths of stay were 10.9 and 8 days (interquartile range [IQR], 4 to 13). Mean intern (N = 102), resident (N = 161), and attending (N = 152) predictions were 5.4 days (95% confidence interval [CI]: 4.6 to 6.2), 6.6 days (95% CI: 5.8 to 7.4) and 7.2 days (95% CI: 6.4 to 7.9), respectively. Median intern, resident, and attending predictions were 5 days (IQR, 3 to 7), 5 days (IQR, 3 to 7), and 6 days (IQR, 4 to 10). Mean differences between predicted and actual length of stay for interns, residents and attendings were 9 days (95% CI: 8.2 to 3.6), 4.3 days (95% C: 6.0 to 2.7), and 3.5 days (95% CI: 5.1 to 2.0). The mean difference between predicted and actual length of stay was statistically significant for all groups (P < 0.0001). Median intern, resident, and attending differences between predicted and actual were 2 days (IQR, 7 to 0), 2 days (IQR, 7 to 0), and 1 day (IQR, 5 to 1), respectively. Predictions correlated poorly with actual length of stay (R2 = 0.11).
| Patients, N = 165 (%) | |
|---|---|
| |
| Male | 105 (63%) |
| Age | 57 16 years |
| White | 99 (60%) |
| Black | 52 (31%) |
| Asian, Hispanic, other, unknown | 16 (9%) |
| HF classification | |
| HF with a reduced EF (EF 40%) | 106(64%) |
| HF mixed/undefined (EF 41%49%) | 14 (8%) |
| HF with a preserved EF (EF 50%) | 20 (12%) |
| Right heart failure only | 5 (3%) |
| Heart transplant cardiac complications | 20 (12%) |
| Severity of illness on admission | |
| NYHA class I | 9 (5%) |
| NYHA class II | 25 (15%) |
| NYHA class III | 67 (41%) |
| NYHA class IV | 32 (19%) |
| NYHA class unknown* | 32 (19%) |
| Mean no. of home medications prior to admission | 13 6 |
| On intravenous inotropes prior to admission | 18 (11%) |
| On mechanical circulatory support prior to admission | 15 (9%) |
| Status postheart transplant | 20 (12%) |
| Invasive hemodynamic monitoring within 24 hours | 94 (57%) |
| Type of admission | |
| Admitted through emergency department | 71 (43%) |
| Admitted from clinic | 35 (21%) |
| Transferred from other acute care hospitals | 56 (34%) |
| Admitted from skilled nursing or rehabilitation facility | 3 (2%) |
| Social history | |
| Lived alone prior to admission | 32 (19%) |
| Prison/homeless/facility/unknown living situation | 8 (5%) |
| Required assistance for IADLS/ADLS prior to admission | 29 (17%) |
| Home health services initiated prior to admission | 42 (25%) |
| Prior admission history | |
| No known admissions in the prior year | 70 (42%) |
| 1 admission in the prior year | 37 (22%) |
| 2 admissions in the prior year | 21 (13%) |
| 310 admissions in the prior year | 36 (22%) |
| Unknown readmission status | 1 (1%) |
| Readmitted patients | |
| Readmitted within 30 days | 38 (23%) |
| Readmitted within 7 days | 13 (8%) |
Ninety‐eight patients (59%) received predictions from physicians at all 3 experience levels. Mean and median lengths of stay were 11.3 days and 7.5 days (IQR, 4 to 13). Concordant with the entire cohort, median intern, resident, and attending predictions for these patients were 5 days (IQR, 3 to 7), 5 days (IQR, 3 to 7), and 6 days (IQR, 4 to 10), respectively. Differences between predicted and actual length of stay were statistically significant for all groups: the mean difference for interns, residents, and attendings was 5.8 days (95% CI: 8.2 to 3.4, P < 0.0001), 4.6 days (95% CI: 7.1 to 2.0, P = 0.0001), and 4.3 days (95% CI: 6.5 to 2.1, P = 0.0003), respectively (Figure 1).
There are differences among providers with improved prediction as level of experience increased, but this is not statistically significant as determined by ANOVA (p=0.64) or by GEE modeling to account for clustering of predictions by physician (P = 0.61). Analysis that adjusted for study week yielded similar results. Thus, experience did not improve accuracy.
DISCUSSION
We prospectively measured accuracy of physicians' length of stay predictions of heart failure patients and compared accuracy by experience level. All physicians underestimated length of stay, with average differences between 3.5 and 6 days. Most notably, level of experience did not improve accuracy. Although we anticipated that experience would improve prediction, our findings are not compatible with this hypothesis. Future studies of factors affecting length of stay predictions would help to better understand our findings.
Our results are consistent with small, single‐center studies of different patient and physician cohorts. Hulter Asberg found that internists at a hospital were unable to predict whether a patient would remain admitted 10 days or more, with poor interobserver reliability.[9] Mak et al. demonstrated that emergency physicians underestimated length of stay by an average of 2 days when predicting length of stay on a broad spectrum of patients in an emergency department.[10] Physician predictions of length of stay have been found to be inaccurate in a center's oncologic intensive care unit population.[11] Sullivan et al. found that academic general medicine physicians predicted discharge with 27% sensitivity the morning prior to next‐day discharge, which improved significantly to 67% by the afternoon, concluding that physicians can provide meaningful discharge predictions the afternoon prior to next‐day discharge.[12] By focusing on patients with heart failure, a major driver of hospitalization and readmission, and comparing providers by level of experience, we augment this existing body of work.
In addition to identifying patients at risk for readmission and mortality,[5, 6] accurate discharge prediction may improve safety of weekend discharges and patient satisfaction. Heart failure patients discharged on weekends receive less complete discharge instructions,[13] suffer higher mortality, and are readmitted more frequently than those discharged on weekdays.[14] Early and accurate predictions may enhance interventions targeting patients with anticipated weekend discharges. Furthermore, inadequate communication regarding anticipated discharge timing is a source of patient dissatisfaction,[15] and accurate prediction of discharge, if shared with patients, may improve patient satisfaction.
Limitations of our study include that it was a single‐center study at a large academic tertiary care hospital with predictions assessed on a teaching service. Severity of illness of this cohort may be a barrier to generalizability, and physicians may predict prognosis of healthier patients more accurately. We recorded predictions at the time of admission, and did not assess whether accuracy improved closer to discharge. We did not collect predictions from non‐physician team members. Sample size and absent data regarding the causes of prolonged hospitalization prohibited an analyses of variables associated with prediction inaccuracy.
CONCLUSIONS
Physicians do not accurately forecast heart failure patients' length of stay at the time of admission, and level of experience does not improve accuracy. Future studies are warranted to determine whether predictions closer to discharge, by an interdisciplinary team, or with assistance of risk‐prediction models are more accurate than physician predictions at admission, and whether early identification of patients at risk for prolonged hospitalization improves outcomes. Ultimately, early and accurate length of stay forecasts may improve risk stratification, patient satisfaction, and discharge planning, and reduce adverse outcomes related to at‐risk discharges.
Acknowledgements
The authors acknowledge Katherine R Courtright, MD, for her gracious assistance with statistical analysis.
Disclosure: Nothing to report
- , , , et al. Forecasting the impact of heart failure in the United States: a policy statement from the American Heart Association. Circ Heart Fail. 2013;6:606–619.
- , , , et al. So many options, where do we start? An overview of the care transitions literature. J Hosp Med. 2016;;11(3):221–230.
- , , , , . Discharge planning from hospital. Cochrane Database Syst Rev. 2016;1:CD000313.
- Department of Health and Human Services. Centers for Medicare and Medicaid Services. 42 CFR Parts 482, 484, 485 Medicare and Medicaid programs; revisions to requirements for discharge planning for hospitals, critical access hospitals, and home health agencies; proposed rule. Fed Regist. 2015:80(212): 68126–68155.
- , , , , , . Predicting the risk of unplanned readmission or death within 30 days of discharge after a heart failure hospitalization. Am Heart J. 2012;164:365–372.
- , , , et al. Predictors and associations with outcomes of length of hospital stay in patients with acute heart failure: results from VERITAS20 [published online December 22, 2015]. J Card Fail. doi: 10.1016/j.cardfail.2015.12.017.
- , , , , . Inability of providers to predict unplanned readmissions. J Gen Intern Med. 2011;26(7):771–776.
- , , , et al. Prediction of rehospitalization and death in severe heart failure by physicians and nurses of the ESCAPE trial. J Card Fail. 2007;13(1):8–13.
- . Physicians' outcome predictions for elderly patients. Survival, hospital discharge, and length of stay in a department of internal medicine. Scand J Soc Med. 1986;14(3):127–132.
- , , , . Physicians' ability to predict hospital length of stay for patients admitted to the hospital from the emergency department. Emerg Med Int. 2012;2012:824674.
- , . ICU physicians are unable to accurately predict length of stay at admission: a prospective study. Int J Qual Health Care. 2016;28(1):99–103.
- , , , et al. An evaluation of physician predictions of discharge on a general medicine service. J Hosp Med. 2015;10(12) 808–810.
- , , , et al. Weekend hospital admission and discharge for heart failure: association with quality of care and clinical outcomes. Am Heart J. 2009;158(3):451–458.
- , , , , . Postdischarge outcomes in heart failure are better for teaching hospitals and weekday discharges. Circ Heart Fail. 2013;6(5):922–929.
- , , , et al. In‐room display of day and time patient is anticipated to leave hospital: a “discharge appointment.” J Hosp Med. 2007;2(1):13–16.
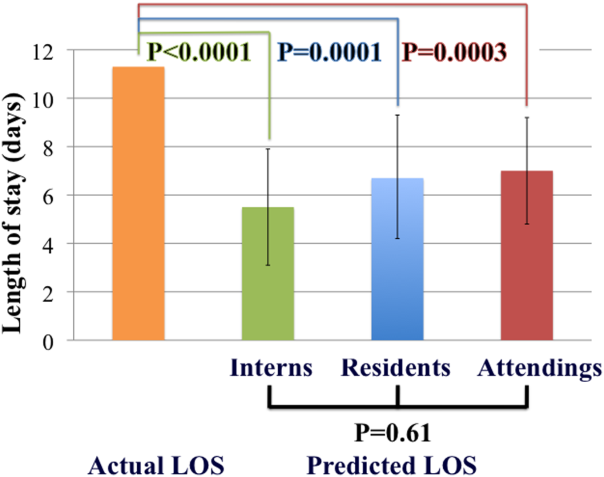
Use of RUS in the Evaluation of AKI
According to the American College of Radiology Appropriateness Criteria, renal ultrasound (RUS) is the most appropriate imaging examination for evaluating patients with acute kidney injury (AKI), with a rating score of 9, representing the strongest level of recommendation.[1, 2] However, recent studies suggest that RUS may be performed in patients with certain risk factors for ureteral obstruction,[1] which would lead to important reductions in the use of medical imaging. Licurse developed a risk stratification framework to help clinicians identify patients in whom RUS was most likely to be beneficial.[2] The model was built based on clinical predictors that included race, recent exposure to inpatient nephrotoxic medications, history of hydronephrosis, recurrent urinary tract infections, benign prostatic hyperplasia, abdominal or pelvic cancer, neurogenic bladder, single functional kidney, previous pelvic surgery, congestive heart failure, and prerenal AKI. It was found, using a cross‐sectional study design that included derivation and validation samples, that a low‐risk population could be identified based on demographic and clinical risk factors; in this population, the prevalence of hydronephrosis, as well as the rate of hydronephrosis requiring an intervention, was only <1%.
However, due to several study limitations, including that it was performed at a single center,[3] the stratification prediction rule has yet to be adopted broadly. Although at least 1 other study has similarly found that RUS may not be efficacious in patients with no suggestive history and with other more likely causes for renal failure,[1] to the best of our knowledge, no large, external, prospective trial to validate the selective use of RUS in patients with AKI has been reported. Therefore, the aim of this study was to evaluate the accuracy and usefulness of the Licurse renal ultrasonography risk stratification model for hospitalized patients with AKI.
METHODS
Study Setting
The study site was a 793‐bed academic, quaternary care, adult hospital with an affiliated cancer center. The requirement to obtain informed consent was waived by the institutional review board for this Health Insurance Portability and Accountability Actcompliant, prospective cohort study.
Study Population
The study cohort included all adult hospitalized patients who underwent an RUS for the indication of AKI over a 23‐month study period, from January 2013 to November 2014. AKI was defined as having a peak rise in serum creatinine level of at least 0.3 mg/dL from baseline, based on data within the electronic health record (EHR). To ensure that the imaging study was not ordered for the purpose of follow‐up or other reasons, patients who were renal transplant recipients, those who had ureteral stent or nephrostomy in place, patients who were recently diagnosed with hydronephrosis on prior imaging, and women who were pregnant were excluded based on retrospective chart review. In patients with multiple renal ultrasounds during the study period, only the first examination was considered.
Data Collection
We collected patient demographics in the study cohort from the EHR. Imaging data were identified using the radiology information system and computerized physician order entry (CPOE) system. For each eligible patient, we collected relevant clinical attributes including: (1) race, (2) history of hydronephrosis, (3) history of recurrent urinary tract infections, (4) history of benign prostatic hyperplasia, (5) history of abdominal or pelvic cancer, (6) history of neurogenic bladder, (7) history of single functional kidney, (8) history of previous pelvic surgery, (9) recent exposure to inpatient nephrotoxic medications, (10) history of congestive heart failure, and (11) history of prerenal AKI. Information was collected from ordering clinicians at the time of imaging order entry using a computerized data capture tool integrated with the CPOE system. The data capture screen is shown in Supporting Figure 1 in the online version of this article. To validate the accuracy and completeness of this data entry, we manually reviewed objective clinical data from a random sample of 80 medical records for 480 clinical attributes. This number was selected based on a calculation of 80% power, 0.05 , and a 0.1 proportion difference.
Patients received +1 point for the presence/absence of each clinical attribute. The sum of points was used to classify the patient's pretest probability of AKI as low (<2), medium (3), or high (>3). Both ordering and interpreting clinicians were blinded to the patient's prediction score.
Each RUS report was manually classified (by an internal medicine attending physician and a radiology trainee) as positive or negative for hydronephrosis, defined as any dilatation of the renal pelvis or the calyces. Subsequent use of urologic intervention was determined by full chart review of the sonographic positive cases. We defined these urologic interventions to include stent placement and nephrostomy tube placement. Only interventions performed during the same hospitalization as the index ultrasound were counted.
Outcomes
Our primary outcome was hydronephrosis (HN) diagnosed on ultrasound. Secondary outcome was hydronephrosis resulting in intervention (HNRI), defined as the need for urologic interventions of stent placement or nephrostomy tube placement.
Statistical Analysis
Analyses were performed using Microsoft Excel 2003 (Microsoft Corp., Redmond, WA) and JMP 10 (SAS Institute, Cary, NC). We used 2 to assess for differences in the rates of HN and HNRI across the 3 pretest probability risk groups. Sensitivity, specificity, negative predictive value, efficiency, and the number needed to screen to find 1 case of HN or HNRI for each risk group were calculated. The high and medium risk groups were merged for the purpose of calculating sensitivity and specificity. Efficiency was defined as the percentage of ultrasounds that could have been avoided based on applying the risk stratification model. We additionally performed a sensitivity analysis to evaluate how different cutoff thresholds for classifying low risk patients would affect the accuracy of the Licurse model. A 2‐tailed P value of <0.05 was defined as statistically significant.
RESULTS
During the 23‐month study period, a total of 961 RUS studies were completed for inpatients with AKI; 778 unique studies met our inclusion criteria (Figure 1).

Based on the manual review of objective clinical data from the random sample of 80 medical records for 480 clinical attributes, overall, there was 90.2% (433/480) concordance rate between the structured data entry and that captured in free text in the clinical notes. There were some variations in the concordance rates for each clinical attribute, ranging from 78.8% (63/80) for exposure to nephrotoxic drugs to 95% for history of congestive heart failure.
On univariate analysis, patients with past medical history of hydronephrosis had a 5‐fold higher likelihood of developing a recurrence of hydronephrosis (45.9% [50/109] vs 8.4% [56/669], P < 0.001). Similarly, they also had a 9.5‐fold higher likelihood of requiring urologic interventions related to the hydronephrosis (12.8% [14/109] vs 1.4% [9/669], P < 0.001). Having diagnoses predisposing the patient for urinary obstruction (benign prostate hyperplasia, abdominal/pelvic cancer, neurogenic bladder, single functional kidney, and history of pelvic surgery) was correlated with the likelihood of both hydronephrosis and the need for urologic intervention. Of the patients with a diagnosis predisposing the patient for urinary obstructions, 22.1% (59/267) had hydronephrosis on imaging, whereas 9.2% (47/511) of patients without such a diagnosis had hydronephrosis (P < 0.001).
Conversely, having a recent exposure to nephrotoxic medications was negatively correlated with the likelihood of both hydronephrosis and the need for urologic intervention. Of the patients with recent exposure to nephrotoxic medications, 7.1% (20/280) had hydronephrosis on imaging, whereas the prevalence of hydronephrosis was 17.3% (86/498) in patients without such an exposure (P < 0.001) (Table 1).
| Patient Characteristic | With HN, n = 106 | Without HN, n = 672 | P Value |
|---|---|---|---|
| |||
| Demographics | |||
| Age, y, mean SD | 60.5 17.1 | 64.1 16.0 | 0.035* |
| Nonblack | 97 (91.5) | 573 (85.3) | 0.084 |
| Male | 59 (55.7) | 368 (54.8) | 0.863 |
| Past medical history | |||
| Hydronephrosis | 50 (47.2) | 59 (8.8) | <0.001* |
| Recurrent urinary tract infections | 22 (20.75) | 101 (15.0) | 0.133 |
| Congestive heart failure | 9 (5.5) | 155 (23.1) | <0.001* |
| Prerenal status | 36 (34.0) | 272 (40.5) | 0.203 |
| Exposure to nephrotoxic medication | 20 (18.9) | 260 (38.7) | <0.001* |
| Diagnosis consistent with obstruction | 59 (22.1) | 208 (31.0) | <0.001* |
| Benign prostate hyperplasia | 9 (8.5) | 63 (9.4) | 0.770 |
| Abdominal or pelvic cancer | 42 (39.6) | 97 (14.4) | <0.001* |
| Neurogenic bladder | 5 (4.7) | 12 (1.8) | 0.055 |
| Single functional kidney | 6 (18.8) | 26 (81.3) | 0.388 |
| Pelvic surgery | 14 (13.2) | 61 (9.1) | 0.181 |
Adjusted for other covariates, the multiple variable model showed that a diagnosis predisposing patients for obstruction (odds ratio [OR]: 2.0, P = 0.004), history of hydronephrosis (OR: 7.4, P < 0.001), absence of a history of congestive heart failure (OR: 2.7, P = 0.009), and lack of exposure to nephrotoxic medications (OR: 1.9, P = 0.022) were statistically significant predictors for hydronephrosis (Table 2).
| Patient Characteristic | Adjusted Odds Ratio (95% Confidence Interval) | P Value |
|---|---|---|
| ||
| Race | ||
| Nonblack (reference = black) | 1.4 (0.73.1) | 0.414 |
| History of recurrent urinary tract infections | ||
| Yes (reference = no) | 0.75 (0.41.3) | 0.346 |
| Diagnosis consistent with possible obstruction* | ||
| Yes (reference = no) | 2.0 (1.23.1) | 0.004 |
| History of HN | ||
| Yes (reference = no) | 7.4 (4.512.3) | <0.001 |
| History of CHF | ||
| No (reference = yes) | 2.7 (1.36.1) | 0.009 |
| History of prerenal AKI, use of pressors, or sepsis | ||
| No (reference = 1) | 1.0 (0.61.7) | 0.846 |
| Exposure to nephrotoxic medications prior to AKI | ||
| No (reference = yes) | 1.9 (1.13.3) | 0.022 |
After applying the Licurse renal ultrasonography risk stratification model, 176 (22.6%), 190 (24.4%), and 412 (53.0%) patients were classified as low risk, medium risk, and high risk for hydronephrosis, respectively. The incidence rates for hydronephrosis in the pretest probability risk groups were 4.0%, 6.8%, and 20.9% for low‐, medium‐, and high‐risk patients, respectively (P < 0.0001). The rates for urologic interventions were 1.1%, 0.5%, and 4.9% in the risk groups from low to high (P < 0.0001) (Figure 2).
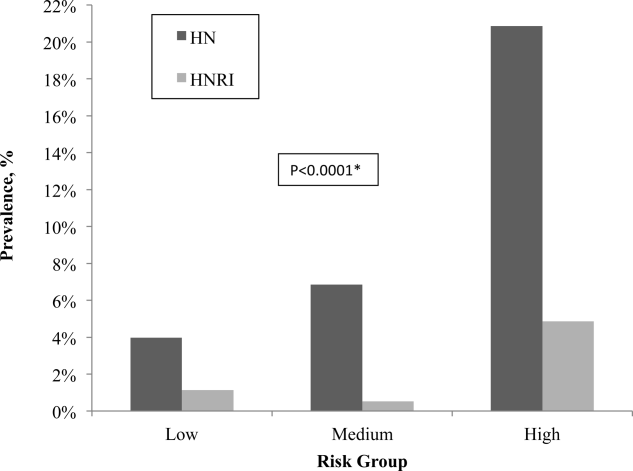
Overall, the Licurse model, using a cutoff between low‐risk and medium/high‐risk patients, had sensitivity of 91.3% (95% confidence interval [CI]: 73.2%‐97.6%) for HNRI and 93.4% (95% CI: 87.0%‐96.8%) for presence of HN. Specificity was low for both HNRI (23.0% [95% CI: 20.2%‐26.2%]) and HN (25.1% [95% CI: 22.0%‐28.6%]). The estimated potential reduction in renal ultrasound for hospitalized patients with AKI, defined as the rate of imaging performed in the low‐risk group, was 22.6%. In the low‐risk group, the number needed to screen to find 1 case of HN was 25, and to find 1 case of HNRI it was 88. The negative predictive value for hydronephrosis was 96.0% (95% CI: 92.0%‐98.1%) and 98.9% for HNRI (95% CI: 96.0%‐99.7%) (Table 3).
| Our External Validation Set | Licurse Internal Validation Set | |||
|---|---|---|---|---|
| HN an Outcome | With HN | Without HN | With HN | Without HN |
| ||||
| Low risk, no. of patients* | 7 | 169 | 7 | 216 |
| Medium/high risk, no. of patients | 99 | 503 | 78 | 496 |
| Test performance, % (95% CI) | ||||
| Sensitivity | 93.4 (87.096.8) | 91.8 (89.993.7) | ||
| Specificity | 25.1 (22.028.6) | 30.3 (27.233.5) | ||
| Negative predictive value | 96.0 (92.098.1) | 96.9 (95.798.1) | ||
| HNRI an outcome | ||||
| Low risk, no. of patients | 2 | 174 | 1 | 222 |
| Medium/high risk, no. of patients | 21 | 581 | 26 | 548 |
| Test performance, % (95% CI) | ||||
| Sensitivity | 91.3 (73.297.6) | 96.3 (94.997.6) | ||
| Specificity | 23.0 (20.226.2) | 28.8 (25.732.0) | ||
| Negative predictive value | 98.9 (96.099.7) | 99.6 (99.1100.0) | ||
Supporting Table 1, in the online version of this article, shows a sensitivity analysis using different cutoff thresholds in the Licurse model for classifying low‐risk patients. A lower threshold cutoff (ie, a cutoff of <1) significantly increases the sensitivity (98.1% [95% CI: 93.4%‐99.5%] for HN; 100% [95% CI: 85.7%‐100%]) for HNRI, but at the cost of a lower specificity (7.6% [95% CI: 5.8%‐9.8%] for HN and 7.0% [95% CI: 5.4%‐9.1%] for HNRI). The estimated potential reduction in renal ultrasound for hospitalized patients with AKI would be 6.0%, the number needed to screen to find 1 case of HN would be 26, and 1 case of HNRI would be infinity.
DISCUSSION
In this prospective observational study, we found that the Licurse risk stratification model, using a cutoff between low‐ risk and medium/high‐risk patients, had 91.3% (95% CI: 73.2%‐97.6%) sensitivity for predicting patients who would require urologic intervention and 93.4% (95% CI: 87.0%‐96.8%) sensitivity for identifying patients with hydronephrosis. These findings were comparable to those found in the original validation cohort of the model, which showed sensitivity rates of 96.3% and 91.8%, respectively.[2] The negative predictive value for hydronephrosis and HNRI were sufficiently high, at 96.0% (95% CI: 92.0‐98.1) and 98.9% (95% CI: 96.0‐99.7), respectively.
Our results suggest that the Licurse model may be sufficient to rule out HN in the inpatient setting at our institution. The slight differences between the findings of our and the original studies may be due to differences in data extraction methodologies. In the original study, all data were retrospectively abstracted from medical records (discharge summaries and clinical notes) by 4 trained reviewers. However, such methodology is dependent on the quality of unstructured EHR data, which as noted in previous research, can be highly variable. Hogan and Wagner found that the correctness of EHR data can range from 44% to 100% and completeness from 1.1% to 100%, depending on the clinical concepts being studied.[4] Similarly, Thiru et al. found that the sensitivity of different types of EHR data ranged from 0.25 to 1.0.[5] Medical chart review can be labor intensive and time consuming. The lack of standardized methods for structured data capture has been a major limitation in decreasing research costs and speeding the rate of new medical discoveries through the secondary use of EHR data. By modifying our institutional clinical decision support (CDS) system to enable the necessary granular clinical data collection, we were able to obviate the need for resource intensive retrospective chart reviews. To our knowledge, this is the second example of a CDS tool specifically designed for capture of discrete data to validate a decision rule.[6] A similar process may also be useful to accelerate generation of new decision rules. With secondary use of EHR data becoming an increasingly important topic,[7] CDS may serve as an alternative method in the context of data reuse for clinical research. Based on a randomly selected chart review, it was noted that clinicians, overall, do try to communicate to the interpreting radiologists the clinical picture as accurately as they can, and rarely do providers drop their orders due to data entry.
Despite our data confirming Licurse's initial findings, it is important to note that as with any clinical prediction rules, there is a trade‐off between cost savings and potential missed diagnoses. Even the most accepted clinical decision rules, such as the Well's criteria for pulmonary embolism and deep vein thrombosis, has their inherent acceptable rates of false negative. What is considered to be acceptable may differ among providers and patients. Thus, a shared decision‐making model, in which the patient and provider actively engage in sharing of information regarding risks and benefits of both performing and bypassing the diagnostic testing, is preferred. For providers/patients who are more risk‐adverse, one could consider using a more sensitive cutoff (for example, using the <1 threshold), essentially increasing the sensitivity from 91.3% to 100% for HNRI and from 93.4% to 98.1% for HN.
Although one would not want to miss a hydronephrosis in a patient, a too aggressive imaging strategy is not without economic and downstream risks. At an estimated cost of $200 per renal ultrasonography,[2] a 22.6% reduction would result in an annual savings of nearly $20,000 at our institution. The financial costs of forgoing ultrasound studies at the risk of missing 1 case of HN or 1 case of HNRI would be $5000 and $17,600, respectively.
Data‐driven decision rules are becoming more commonly used in the current environment of increased emphasis on evidence‐based medicine.[8, 9, 10, 11, 12, 13] When applied appropriately, such prediction models can result in more efficient use of medical imaging while increasing value of care.[14, 15] However, prior to implementation in clinical practice, these models need to be externally validated across multiple institutions and in various practice settings. This is the largest study of which we are aware to validate the utility of a prediction model for AKI in the inpatient setting. Although we did find slightly smaller differences in hydronephrosis in inpatients across the low, moderate, and high pretest probability groups, this may be explained by the differences in methodology.
Our study has several limitations. First, it was performed at a single academic medical center, a similar setting as that of the original work. Thus, the generalizability of our findings in other settings is unclear. Second, it is possible that our ordering providers did not thoroughly and accurately enter data into the structured CPOE form. However, we randomly selected a sample for chart review and found 90% concordance between data captured and those in the EHR. Due to selection of our cohort that included only patients with AKI who underwent RUS, it is possible that some patients who were not imaged or imaged with other cross‐sectional modalities were excluded, resulting in differential test ordering bias. Finally, we did not include the potential benefits of RUS in affecting nonsurgical interventions of hydronephrosis (eg, Foley catheter insertion).
CONCLUSION
We found that the Licurse renal ultrasonography risk stratification model was sufficiently accurate in classifying patients at risk for ureteral obstruction among hospitalized patients with AKI.
Acknowledgements
The authors thank Laura E. Peterson, BSN, SM, for her assistance in editing this manuscript.
- , , , , . Renal sonography: can it be used more selectively in the setting of an elevated serum creatinine level? Am J Kidney Dis. 1997;29(3):362–367.
- . Renal ultrasonography in the evaluation of acute kidney injury: developing a Risk stratification framework. Arch Intern Med. 2010;170(21):1900.
- , . Curbing the use of ultrasonography in the diagnosis of acute kidney injury: Penny wise or pound foolish?: comment on “Renal ultrasonography in the evaluation of acute kidney injury.” Arch Intern Med. 2010;170(21):1907–1908.
- , . Accuracy of data in computer‐based patient records. J Am Med Inform Assoc 1997;4(5):342–355.
- , , . Systematic review of scope and quality of electronic patient record data in primary care. BMJ. 2003;326(7398):1070.
- , , , , , . Performance of Wells score for deep vein thrombosis in the inpatient setting. JAMA Intern Med. 2015;175(7):1112–1117.
- , , , , . Public preferences about secondary uses of electronic health information. JAMA Intern Med. 2013;173(19):1798–1806.
- , , , et al. The Canadian CT Head Rule for patients with minor head injury. Lancet. 2001;357(9266):1391–1396.
- , , , et al. Value of assessment of pretest probability of deep‐vein thrombosis in clinical management. Lancet. 1997;350(9094):1795–1798.
- , , , , , . Derivation of the children's head injury algorithm for the prediction of important clinical events decision rule for head injury in children. Arch Dis Child. 2006;91(11):885–891.
- , , , et al. Clinical decision rules to rule out subarachnoid hemorrhage for acute headache. JAMA. 2013;310(12):1248–1255.
- , , , et al. Excluding pulmonary embolism at the bedside without diagnostic imaging: management of patients with suspected pulmonary embolism presenting to the emergency department by using a simple clinical model and d‐dimer. Ann Intern Med. 2001;135(2):98–107.
- , , , et al. Implementation of the Ottawa knee rule for the use of radiography in acute knee injuries. JAMA. 1997;278(23):2075–2079.
- , , , et al. Impact of provider‐led, technology‐enabled radiology management program on imaging. Am J Med. 2013;126(8):687–692.
- , , , et al. Effect of computerized clinical decision support on the use and yield of CT pulmonary angiography in the emergency department. Radiology. 2012;262(2):468–474.
According to the American College of Radiology Appropriateness Criteria, renal ultrasound (RUS) is the most appropriate imaging examination for evaluating patients with acute kidney injury (AKI), with a rating score of 9, representing the strongest level of recommendation.[1, 2] However, recent studies suggest that RUS may be performed in patients with certain risk factors for ureteral obstruction,[1] which would lead to important reductions in the use of medical imaging. Licurse developed a risk stratification framework to help clinicians identify patients in whom RUS was most likely to be beneficial.[2] The model was built based on clinical predictors that included race, recent exposure to inpatient nephrotoxic medications, history of hydronephrosis, recurrent urinary tract infections, benign prostatic hyperplasia, abdominal or pelvic cancer, neurogenic bladder, single functional kidney, previous pelvic surgery, congestive heart failure, and prerenal AKI. It was found, using a cross‐sectional study design that included derivation and validation samples, that a low‐risk population could be identified based on demographic and clinical risk factors; in this population, the prevalence of hydronephrosis, as well as the rate of hydronephrosis requiring an intervention, was only <1%.
However, due to several study limitations, including that it was performed at a single center,[3] the stratification prediction rule has yet to be adopted broadly. Although at least 1 other study has similarly found that RUS may not be efficacious in patients with no suggestive history and with other more likely causes for renal failure,[1] to the best of our knowledge, no large, external, prospective trial to validate the selective use of RUS in patients with AKI has been reported. Therefore, the aim of this study was to evaluate the accuracy and usefulness of the Licurse renal ultrasonography risk stratification model for hospitalized patients with AKI.
METHODS
Study Setting
The study site was a 793‐bed academic, quaternary care, adult hospital with an affiliated cancer center. The requirement to obtain informed consent was waived by the institutional review board for this Health Insurance Portability and Accountability Actcompliant, prospective cohort study.
Study Population
The study cohort included all adult hospitalized patients who underwent an RUS for the indication of AKI over a 23‐month study period, from January 2013 to November 2014. AKI was defined as having a peak rise in serum creatinine level of at least 0.3 mg/dL from baseline, based on data within the electronic health record (EHR). To ensure that the imaging study was not ordered for the purpose of follow‐up or other reasons, patients who were renal transplant recipients, those who had ureteral stent or nephrostomy in place, patients who were recently diagnosed with hydronephrosis on prior imaging, and women who were pregnant were excluded based on retrospective chart review. In patients with multiple renal ultrasounds during the study period, only the first examination was considered.
Data Collection
We collected patient demographics in the study cohort from the EHR. Imaging data were identified using the radiology information system and computerized physician order entry (CPOE) system. For each eligible patient, we collected relevant clinical attributes including: (1) race, (2) history of hydronephrosis, (3) history of recurrent urinary tract infections, (4) history of benign prostatic hyperplasia, (5) history of abdominal or pelvic cancer, (6) history of neurogenic bladder, (7) history of single functional kidney, (8) history of previous pelvic surgery, (9) recent exposure to inpatient nephrotoxic medications, (10) history of congestive heart failure, and (11) history of prerenal AKI. Information was collected from ordering clinicians at the time of imaging order entry using a computerized data capture tool integrated with the CPOE system. The data capture screen is shown in Supporting Figure 1 in the online version of this article. To validate the accuracy and completeness of this data entry, we manually reviewed objective clinical data from a random sample of 80 medical records for 480 clinical attributes. This number was selected based on a calculation of 80% power, 0.05 , and a 0.1 proportion difference.
Patients received +1 point for the presence/absence of each clinical attribute. The sum of points was used to classify the patient's pretest probability of AKI as low (<2), medium (3), or high (>3). Both ordering and interpreting clinicians were blinded to the patient's prediction score.
Each RUS report was manually classified (by an internal medicine attending physician and a radiology trainee) as positive or negative for hydronephrosis, defined as any dilatation of the renal pelvis or the calyces. Subsequent use of urologic intervention was determined by full chart review of the sonographic positive cases. We defined these urologic interventions to include stent placement and nephrostomy tube placement. Only interventions performed during the same hospitalization as the index ultrasound were counted.
Outcomes
Our primary outcome was hydronephrosis (HN) diagnosed on ultrasound. Secondary outcome was hydronephrosis resulting in intervention (HNRI), defined as the need for urologic interventions of stent placement or nephrostomy tube placement.
Statistical Analysis
Analyses were performed using Microsoft Excel 2003 (Microsoft Corp., Redmond, WA) and JMP 10 (SAS Institute, Cary, NC). We used 2 to assess for differences in the rates of HN and HNRI across the 3 pretest probability risk groups. Sensitivity, specificity, negative predictive value, efficiency, and the number needed to screen to find 1 case of HN or HNRI for each risk group were calculated. The high and medium risk groups were merged for the purpose of calculating sensitivity and specificity. Efficiency was defined as the percentage of ultrasounds that could have been avoided based on applying the risk stratification model. We additionally performed a sensitivity analysis to evaluate how different cutoff thresholds for classifying low risk patients would affect the accuracy of the Licurse model. A 2‐tailed P value of <0.05 was defined as statistically significant.
RESULTS
During the 23‐month study period, a total of 961 RUS studies were completed for inpatients with AKI; 778 unique studies met our inclusion criteria (Figure 1).
Based on the manual review of objective clinical data from the random sample of 80 medical records for 480 clinical attributes, overall, there was 90.2% (433/480) concordance rate between the structured data entry and that captured in free text in the clinical notes. There were some variations in the concordance rates for each clinical attribute, ranging from 78.8% (63/80) for exposure to nephrotoxic drugs to 95% for history of congestive heart failure.
On univariate analysis, patients with past medical history of hydronephrosis had a 5‐fold higher likelihood of developing a recurrence of hydronephrosis (45.9% [50/109] vs 8.4% [56/669], P < 0.001). Similarly, they also had a 9.5‐fold higher likelihood of requiring urologic interventions related to the hydronephrosis (12.8% [14/109] vs 1.4% [9/669], P < 0.001). Having diagnoses predisposing the patient for urinary obstruction (benign prostate hyperplasia, abdominal/pelvic cancer, neurogenic bladder, single functional kidney, and history of pelvic surgery) was correlated with the likelihood of both hydronephrosis and the need for urologic intervention. Of the patients with a diagnosis predisposing the patient for urinary obstructions, 22.1% (59/267) had hydronephrosis on imaging, whereas 9.2% (47/511) of patients without such a diagnosis had hydronephrosis (P < 0.001).
Conversely, having a recent exposure to nephrotoxic medications was negatively correlated with the likelihood of both hydronephrosis and the need for urologic intervention. Of the patients with recent exposure to nephrotoxic medications, 7.1% (20/280) had hydronephrosis on imaging, whereas the prevalence of hydronephrosis was 17.3% (86/498) in patients without such an exposure (P < 0.001) (Table 1).
| Patient Characteristic | With HN, n = 106 | Without HN, n = 672 | P Value |
|---|---|---|---|
| |||
| Demographics | |||
| Age, y, mean SD | 60.5 17.1 | 64.1 16.0 | 0.035* |
| Nonblack | 97 (91.5) | 573 (85.3) | 0.084 |
| Male | 59 (55.7) | 368 (54.8) | 0.863 |
| Past medical history | |||
| Hydronephrosis | 50 (47.2) | 59 (8.8) | <0.001* |
| Recurrent urinary tract infections | 22 (20.75) | 101 (15.0) | 0.133 |
| Congestive heart failure | 9 (5.5) | 155 (23.1) | <0.001* |
| Prerenal status | 36 (34.0) | 272 (40.5) | 0.203 |
| Exposure to nephrotoxic medication | 20 (18.9) | 260 (38.7) | <0.001* |
| Diagnosis consistent with obstruction | 59 (22.1) | 208 (31.0) | <0.001* |
| Benign prostate hyperplasia | 9 (8.5) | 63 (9.4) | 0.770 |
| Abdominal or pelvic cancer | 42 (39.6) | 97 (14.4) | <0.001* |
| Neurogenic bladder | 5 (4.7) | 12 (1.8) | 0.055 |
| Single functional kidney | 6 (18.8) | 26 (81.3) | 0.388 |
| Pelvic surgery | 14 (13.2) | 61 (9.1) | 0.181 |
Adjusted for other covariates, the multiple variable model showed that a diagnosis predisposing patients for obstruction (odds ratio [OR]: 2.0, P = 0.004), history of hydronephrosis (OR: 7.4, P < 0.001), absence of a history of congestive heart failure (OR: 2.7, P = 0.009), and lack of exposure to nephrotoxic medications (OR: 1.9, P = 0.022) were statistically significant predictors for hydronephrosis (Table 2).
| Patient Characteristic | Adjusted Odds Ratio (95% Confidence Interval) | P Value |
|---|---|---|
| ||
| Race | ||
| Nonblack (reference = black) | 1.4 (0.73.1) | 0.414 |
| History of recurrent urinary tract infections | ||
| Yes (reference = no) | 0.75 (0.41.3) | 0.346 |
| Diagnosis consistent with possible obstruction* | ||
| Yes (reference = no) | 2.0 (1.23.1) | 0.004 |
| History of HN | ||
| Yes (reference = no) | 7.4 (4.512.3) | <0.001 |
| History of CHF | ||
| No (reference = yes) | 2.7 (1.36.1) | 0.009 |
| History of prerenal AKI, use of pressors, or sepsis | ||
| No (reference = 1) | 1.0 (0.61.7) | 0.846 |
| Exposure to nephrotoxic medications prior to AKI | ||
| No (reference = yes) | 1.9 (1.13.3) | 0.022 |
After applying the Licurse renal ultrasonography risk stratification model, 176 (22.6%), 190 (24.4%), and 412 (53.0%) patients were classified as low risk, medium risk, and high risk for hydronephrosis, respectively. The incidence rates for hydronephrosis in the pretest probability risk groups were 4.0%, 6.8%, and 20.9% for low‐, medium‐, and high‐risk patients, respectively (P < 0.0001). The rates for urologic interventions were 1.1%, 0.5%, and 4.9% in the risk groups from low to high (P < 0.0001) (Figure 2).
Overall, the Licurse model, using a cutoff between low‐risk and medium/high‐risk patients, had sensitivity of 91.3% (95% confidence interval [CI]: 73.2%‐97.6%) for HNRI and 93.4% (95% CI: 87.0%‐96.8%) for presence of HN. Specificity was low for both HNRI (23.0% [95% CI: 20.2%‐26.2%]) and HN (25.1% [95% CI: 22.0%‐28.6%]). The estimated potential reduction in renal ultrasound for hospitalized patients with AKI, defined as the rate of imaging performed in the low‐risk group, was 22.6%. In the low‐risk group, the number needed to screen to find 1 case of HN was 25, and to find 1 case of HNRI it was 88. The negative predictive value for hydronephrosis was 96.0% (95% CI: 92.0%‐98.1%) and 98.9% for HNRI (95% CI: 96.0%‐99.7%) (Table 3).
| Our External Validation Set | Licurse Internal Validation Set | |||
|---|---|---|---|---|
| HN an Outcome | With HN | Without HN | With HN | Without HN |
| ||||
| Low risk, no. of patients* | 7 | 169 | 7 | 216 |
| Medium/high risk, no. of patients | 99 | 503 | 78 | 496 |
| Test performance, % (95% CI) | ||||
| Sensitivity | 93.4 (87.096.8) | 91.8 (89.993.7) | ||
| Specificity | 25.1 (22.028.6) | 30.3 (27.233.5) | ||
| Negative predictive value | 96.0 (92.098.1) | 96.9 (95.798.1) | ||
| HNRI an outcome | ||||
| Low risk, no. of patients | 2 | 174 | 1 | 222 |
| Medium/high risk, no. of patients | 21 | 581 | 26 | 548 |
| Test performance, % (95% CI) | ||||
| Sensitivity | 91.3 (73.297.6) | 96.3 (94.997.6) | ||
| Specificity | 23.0 (20.226.2) | 28.8 (25.732.0) | ||
| Negative predictive value | 98.9 (96.099.7) | 99.6 (99.1100.0) | ||
Supporting Table 1, in the online version of this article, shows a sensitivity analysis using different cutoff thresholds in the Licurse model for classifying low‐risk patients. A lower threshold cutoff (ie, a cutoff of <1) significantly increases the sensitivity (98.1% [95% CI: 93.4%‐99.5%] for HN; 100% [95% CI: 85.7%‐100%]) for HNRI, but at the cost of a lower specificity (7.6% [95% CI: 5.8%‐9.8%] for HN and 7.0% [95% CI: 5.4%‐9.1%] for HNRI). The estimated potential reduction in renal ultrasound for hospitalized patients with AKI would be 6.0%, the number needed to screen to find 1 case of HN would be 26, and 1 case of HNRI would be infinity.
DISCUSSION
In this prospective observational study, we found that the Licurse risk stratification model, using a cutoff between low‐ risk and medium/high‐risk patients, had 91.3% (95% CI: 73.2%‐97.6%) sensitivity for predicting patients who would require urologic intervention and 93.4% (95% CI: 87.0%‐96.8%) sensitivity for identifying patients with hydronephrosis. These findings were comparable to those found in the original validation cohort of the model, which showed sensitivity rates of 96.3% and 91.8%, respectively.[2] The negative predictive value for hydronephrosis and HNRI were sufficiently high, at 96.0% (95% CI: 92.0‐98.1) and 98.9% (95% CI: 96.0‐99.7), respectively.
Our results suggest that the Licurse model may be sufficient to rule out HN in the inpatient setting at our institution. The slight differences between the findings of our and the original studies may be due to differences in data extraction methodologies. In the original study, all data were retrospectively abstracted from medical records (discharge summaries and clinical notes) by 4 trained reviewers. However, such methodology is dependent on the quality of unstructured EHR data, which as noted in previous research, can be highly variable. Hogan and Wagner found that the correctness of EHR data can range from 44% to 100% and completeness from 1.1% to 100%, depending on the clinical concepts being studied.[4] Similarly, Thiru et al. found that the sensitivity of different types of EHR data ranged from 0.25 to 1.0.[5] Medical chart review can be labor intensive and time consuming. The lack of standardized methods for structured data capture has been a major limitation in decreasing research costs and speeding the rate of new medical discoveries through the secondary use of EHR data. By modifying our institutional clinical decision support (CDS) system to enable the necessary granular clinical data collection, we were able to obviate the need for resource intensive retrospective chart reviews. To our knowledge, this is the second example of a CDS tool specifically designed for capture of discrete data to validate a decision rule.[6] A similar process may also be useful to accelerate generation of new decision rules. With secondary use of EHR data becoming an increasingly important topic,[7] CDS may serve as an alternative method in the context of data reuse for clinical research. Based on a randomly selected chart review, it was noted that clinicians, overall, do try to communicate to the interpreting radiologists the clinical picture as accurately as they can, and rarely do providers drop their orders due to data entry.
Despite our data confirming Licurse's initial findings, it is important to note that as with any clinical prediction rules, there is a trade‐off between cost savings and potential missed diagnoses. Even the most accepted clinical decision rules, such as the Well's criteria for pulmonary embolism and deep vein thrombosis, has their inherent acceptable rates of false negative. What is considered to be acceptable may differ among providers and patients. Thus, a shared decision‐making model, in which the patient and provider actively engage in sharing of information regarding risks and benefits of both performing and bypassing the diagnostic testing, is preferred. For providers/patients who are more risk‐adverse, one could consider using a more sensitive cutoff (for example, using the <1 threshold), essentially increasing the sensitivity from 91.3% to 100% for HNRI and from 93.4% to 98.1% for HN.
Although one would not want to miss a hydronephrosis in a patient, a too aggressive imaging strategy is not without economic and downstream risks. At an estimated cost of $200 per renal ultrasonography,[2] a 22.6% reduction would result in an annual savings of nearly $20,000 at our institution. The financial costs of forgoing ultrasound studies at the risk of missing 1 case of HN or 1 case of HNRI would be $5000 and $17,600, respectively.
Data‐driven decision rules are becoming more commonly used in the current environment of increased emphasis on evidence‐based medicine.[8, 9, 10, 11, 12, 13] When applied appropriately, such prediction models can result in more efficient use of medical imaging while increasing value of care.[14, 15] However, prior to implementation in clinical practice, these models need to be externally validated across multiple institutions and in various practice settings. This is the largest study of which we are aware to validate the utility of a prediction model for AKI in the inpatient setting. Although we did find slightly smaller differences in hydronephrosis in inpatients across the low, moderate, and high pretest probability groups, this may be explained by the differences in methodology.
Our study has several limitations. First, it was performed at a single academic medical center, a similar setting as that of the original work. Thus, the generalizability of our findings in other settings is unclear. Second, it is possible that our ordering providers did not thoroughly and accurately enter data into the structured CPOE form. However, we randomly selected a sample for chart review and found 90% concordance between data captured and those in the EHR. Due to selection of our cohort that included only patients with AKI who underwent RUS, it is possible that some patients who were not imaged or imaged with other cross‐sectional modalities were excluded, resulting in differential test ordering bias. Finally, we did not include the potential benefits of RUS in affecting nonsurgical interventions of hydronephrosis (eg, Foley catheter insertion).
CONCLUSION
We found that the Licurse renal ultrasonography risk stratification model was sufficiently accurate in classifying patients at risk for ureteral obstruction among hospitalized patients with AKI.
Acknowledgements
The authors thank Laura E. Peterson, BSN, SM, for her assistance in editing this manuscript.
- , , , , . Renal sonography: can it be used more selectively in the setting of an elevated serum creatinine level? Am J Kidney Dis. 1997;29(3):362–367.
- . Renal ultrasonography in the evaluation of acute kidney injury: developing a Risk stratification framework. Arch Intern Med. 2010;170(21):1900.
- , . Curbing the use of ultrasonography in the diagnosis of acute kidney injury: Penny wise or pound foolish?: comment on “Renal ultrasonography in the evaluation of acute kidney injury.” Arch Intern Med. 2010;170(21):1907–1908.
- , . Accuracy of data in computer‐based patient records. J Am Med Inform Assoc 1997;4(5):342–355.
- , , . Systematic review of scope and quality of electronic patient record data in primary care. BMJ. 2003;326(7398):1070.
- , , , , , . Performance of Wells score for deep vein thrombosis in the inpatient setting. JAMA Intern Med. 2015;175(7):1112–1117.
- , , , , . Public preferences about secondary uses of electronic health information. JAMA Intern Med. 2013;173(19):1798–1806.
- , , , et al. The Canadian CT Head Rule for patients with minor head injury. Lancet. 2001;357(9266):1391–1396.
- , , , et al. Value of assessment of pretest probability of deep‐vein thrombosis in clinical management. Lancet. 1997;350(9094):1795–1798.
- , , , , , . Derivation of the children's head injury algorithm for the prediction of important clinical events decision rule for head injury in children. Arch Dis Child. 2006;91(11):885–891.
- , , , et al. Clinical decision rules to rule out subarachnoid hemorrhage for acute headache. JAMA. 2013;310(12):1248–1255.
- , , , et al. Excluding pulmonary embolism at the bedside without diagnostic imaging: management of patients with suspected pulmonary embolism presenting to the emergency department by using a simple clinical model and d‐dimer. Ann Intern Med. 2001;135(2):98–107.
- , , , et al. Implementation of the Ottawa knee rule for the use of radiography in acute knee injuries. JAMA. 1997;278(23):2075–2079.
- , , , et al. Impact of provider‐led, technology‐enabled radiology management program on imaging. Am J Med. 2013;126(8):687–692.
- , , , et al. Effect of computerized clinical decision support on the use and yield of CT pulmonary angiography in the emergency department. Radiology. 2012;262(2):468–474.