User login
February 2016 Quiz 1
Q1: ANSWER: C
Critique
The diagnosis of H. pylori may be made using either invasive or noninvasive methods. Invasive diagnostic methods either detect organisms directly (i.e., histological identification with appropriate stains or bacterial culture) or indirectly (i.e., rapid urease testing of biopsy specimens). Noninvasive methods include serum antibody, stool antigen, and detecting the metabolites of the bacterial enzyme urease (i.e., urea breath testing). It should be noted that serology should not be used to test for eradication as the antibodies may remain elevated for years after successful eradication therapy.
Treatment of H. pylori infection has become problematic recently primarily due to increasing antibiotic resistance. The eradication rate of standard triple therapy consisting of a proton pump inhibitor combined with clarithromycin (500 mg) and amoxicillin (1 g) (or metronidazole (500 mg), all given b.i.d. for 7-14 days has now declined to unacceptable levels, averaging 70%-80% but reported as low as 55%. It is currently recommended that a noninvasive method be used (other than serology) to confirm eradication in patients in whom eradication is deemed necessary.
References
- Malfertheiner P., Megraud F., O’Morain C.A., et al. European Helicobacter Study Group. Management of Helicobacter pylori infection – the Maastricht IV/ Florence Consensus Report. Gut 2012;61:646-64.
- De F., Giorgio F., Hassan C., et al. Worldwide H. pylori antibiotic resistance: a systematic review. J Gastrointestin Liver Dis. 2010;19:409-14.
- Kearney D.J., Brousal A.. Treatment of Helicobacter pylori infection in clinical practice in the United States – Results from 224 patients. Dig Dis Sci. 2000;45:265-71.
Making Sense of Hospitalists and Quality Reporting Programs
The diversity of hospitalist practice—from the variety of settings (such as inpatient acute, observation, post-discharge clinics, and post-acute-care facilities) to the differences in relationships with their facilities—is a strength of the specialty. It reflects the ability of the specialty to adapt to the unique needs of its local patients and institutions.
At the same time, it presents some unique challenges to developing strategies for identifying and assessing hospitalists. As the Medicare physician payment system moves toward value-based payment, hospitalists must report quality measures in the Physician Quality Reporting System (PQRS) or face ever-increasing penalties.
Many hospitalists are part of multispecialty groups aligned with a range of physicians employed by the same facility, including many academic hospitalists and those in integrated healthcare systems. Frequently for hospitalists in these groups, the group reports via a group-practice reporting option that uses measures for outpatient providers, capitalizing on the performances of those outpatient primary care providers in the group and making it generally unnecessary for these hospitalists to independently worry about PQRS reporting. Due to their employment model, they might also be somewhat insulated from seeing firsthand any value-based reimbursement adjustments from Medicare.
Hospitalists commonly are employed by single-specialty groups, medium or large in number of HM-focused providers, or increasingly a mix of hospitalists, emergency physicians, and hospitalists focused on skilled nursing facility (SNF) care. Still others are in small hospitalist groups or independent practitioners of hospital medicine. For these hospitalists, successful reporting of PQRS is important; they cannot rely on broad-based primary care group reporting options, and penalties can have an immediate impact on revenue streams.
PQRS, just like its hospital counterpart, the Inpatient Quality Reporting (IQR) system, was designed for use in an isolated healthcare delivery silo: PQRS was meant for physicians; IQR, for hospitals. This explicit design makes the measuring of hospitalists difficult within the current value-based payment programs because while the patient-care goals of hospitalists and their hospitals overlap, hospitalists are forced to report on physician-level metrics. Following this silo logic, the Centers for Medicare & Medicaid Services (CMS) has been removing physician-level PQRS measures that it views as redundant with facility-level IQR metrics, which has contributed to the detrimental reduction of relevant PQRS metrics for hospitalists over the years.
However, in large part due to the significant advocacy efforts of SHM around last year’s Medicare Access and CHIP Reauthorization Act (MACRA), CMS now has the ability to reverse this trend and include metrics from other programs, such as IQR metrics, as part of the quality or cost component of physician value-based payment. This would help to eliminate the artificial misalignment of quality goals and metrics for hospitalists and their facilities. Including hospital IQR metrics in the mandatory Medicare physician reporting programs would help to ensure hospitalists receive credit for the care they are providing for hospitalized patients and for the measures they are commonly held accountable for as part of their jobs.
As SHM advocates for hospitalists as the new Merit-Based Incentive Payment System (MIPS) reporting program unrolls as part of MACRA, we will keep these principles in mind: reduce administrative and reporting burdens, make metrics and their resulting data as actionable and useful as possible, and account for the important work hospitalists are doing in their facilities. As we are looking ahead at the future, we encourage you to make sure you are reporting in PQRS for 2016.
For more information about 2016 PQRS reporting, visit www.hospitalmedicine.org/pqrs. TH
Joshua Lapps is SHM’s government relations manager.
Appalachia has higher cancer incidence than rest of US
receiving chemotherapy
Photo by Rhoda Baer
New research suggests that people living in the Appalachian region of the US are more likely to develop cancer than people in the rest of the country.
The study showed that Appalachians had a significantly higher incidence of cancer overall and higher rates of many solid tumor malignancies.
However, lymphoma rates were similar between Appalachians and non-Appalachians, and Appalachians had a significantly lower rate of myeloma.
This research was published in Cancer Epidemiology, Biomarkers & Prevention.
“The Appalachian region, which extends from parts of New York to Mississippi, spans 420 counties in 13 US states, and about 25 million people reside in this area,” said study author Reda Wilson, MPH, of the Centers for Disease Control and Prevention (CDC) in Atlanta, Georgia.
“This region is primarily made up of rural areas, with persistent poverty levels that are at least 20%, which is higher than the national average.”
In 2007, the CDC’s National Program of Cancer Registries (NPCR) published a comprehensive evaluation of cancer incidence rates in Appalachia between 2001 and 2003.
The data showed higher cancer rates in Appalachia than in the rest of the US. However, this publication had some shortcomings, including data that were not available for analysis.
“The current analyses reported here were performed to update the earlier evaluation by expanding the diagnosis years from 2004 to 2011 and including data on 100% of the Appalachian and non-Appalachian populations,” Wilson said.
For this study, Wilson and her colleagues used data from the NPCR and the National Cancer Institute’s Surveillance, Epidemiology, and End Results (SEER) program. Together, NPCR and SEER cover 100% of the US population.
The researchers analyzed the Appalachian population by region (north, central, and south Appalachia), gender, race (black and white only), and Appalachian Regional Commission-designated economic status (distressed, at-risk, transitional, competitive, and attainment). And the team compared these data with data on the non-Appalachian population.
The results showed that cancer incidence rates (IRs) were elevated among Appalachians regardless of how they were categorized. The IRs were per 100,000 people, age-adjusted to the 2000 US standard population.
The IR for all cancers was 565.8 for males in Appalachia and 543.0 for non-Appalachian males (P<0.05). And the cancer IRs for females were 428.7 in Appalachia and 418.2 outside the region (P<0.05).
There was no significant difference between the regions in IRs for lymphomas. The Hodgkin lymphoma IRs were 3.1 in Appalachian males, 3.2 in non-Appalachian males, and 2.5 for females in both regions.
The non-Hodgkin lymphoma IRs were 23.3 in Appalachian males, 23.4 in non-Appalachian males, 16.4 in Appalachian females, and 16.3 in non-Appalachian females.
Myeloma IRs were significantly lower in Appalachia (P<0.05). The myeloma IRs were 7.3 in Appalachian males, 7.5 in non-Appalachian males, 4.7 in Appalachian females, and 4.9 in non-Appalachian females.
There was no significant difference in leukemia IRs among males, but females in Appalachia had a significantly higher leukemia IR (P<0.05). The leukemia IRs were 16.9 in Appalachian males, 16.7 in non-Appalachian males, 10.4 in Appalachian females, and 10.2 in non-Appalachian females.
“Appalachia continues to have higher cancer incidence rates than the rest of the country,” Wilson said. “But a promising finding is that we’re seeing the gap narrow in the incidence rates between Appalachia and non-Appalachia since the 2007 analysis, with the exception of cancers of the oral cavity and pharynx, larynx, lung and bronchus, and thyroid.”
“This study helps identify types of cancer in the Appalachian region that could be reduced through more evidence-based screening and detection. Our study also emphasizes the importance of lifestyle changes needed to prevent and reduce cancer burden.”
The researchers noted that this study did not differentiate urban versus rural areas within each county, and data on screening and risk factors were based on self-reported responses.
Furthermore, cancer IRs were calculated for all ages combined and were not evaluated by age groups. Future analyses will be targeted toward capturing these finer details, Wilson said. ![]()
NICE recommends panobinostat for multiple myeloma
Photo courtesy of Novartis
The National Institute for Health and Care Excellence (NICE) has issued a final guidance recommending panobinostat (Farydak) be made available on the National Health Service.
In the European Union, panobinostat is approved for use in combination with bortezomib and dexamethasone to treat adults with relapsed and/or refractory multiple myeloma who have received at least 2 prior treatment regimens, including bortezomib and an immunomodulatory agent.
NICE’s recommendation of panobinostat is contingent upon the drug being provided with the discount agreed upon in the patient access scheme.
NICE previously issued a guidance in which it did not recommend panobinostat, but the drug’s manufacturer, Novartis, submitted a revised economic analysis that allowed NICE to recommend the drug.
Novartis has agreed to a patient access scheme with the Department of Health. This scheme provides a discount to the list price of panobinostat, with the discount applied at the point of purchase or invoice.
The level of the discount is commercial in confidence, but the Department of Health said this patient access scheme does not constitute an excessive administrative burden on the National Health Service.
Panobinostat costs £776 per 20 mg tablet. The recommended starting dose is 20 mg, taken orally once a day, on days 1, 3, 5, 8, 10, and 12 of a 21-day cycle. Patients should receive panobinostat for 8 cycles. If they show clinical benefit, they should continue the treatment for 4 additional cycles of 6 weeks each. ![]()
Method makes gene editing more efficient, team says

Image by Spencer Phillips
Researchers say they have made an improvement in CRISPR-Cas9 technology that enables a success rate of 60% when replacing a short stretch of DNA
with another.
They say this technique could be especially useful when trying to repair genetic mutations that cause hereditary diseases, such as sickle cell disease.
The technique allows researchers to patch an abnormal section of DNA with the normal sequence and potentially correct the defect.
“The exciting thing about CRISPR-Cas9 is the promise of fixing genes in place in our genome, but the efficiency for that can be very low,” said Jacob Corn, PhD, of the University of California, Berkeley.
“If you think of gene editing as a word processor, we know how to cut, but we need a more efficient way to paste and glue a new piece of DNA where we make the cut.”
Dr Corn and his colleagues described their more efficient technique in Nature Biotechnology.
“In cases where you want to change very small regions of DNA, up to 30 base pairs, this technique would be extremely effective,” said study author Christopher Richardson, PhD, of the University of California, Berkeley.
Dr Richardson invented the new approach after finding that the Cas9 protein, which does the actual DNA cutting, remains attached to the chromosome for up to 6 hours, long after it has sliced through the double-stranded DNA.
Dr Richardson looked closely at the Cas9 protein bound to the 2 strands of DNA and discovered that while the protein hangs onto 3 of the cut ends, 1 of the ends remains free.
When Cas9 cuts DNA, repair systems in the cell can grab a piece of complementary DNA, called a template, to repair the cut. Researchers can add templates containing changes that alter existing sequences in the genome.
Dr Richardson reasoned that bringing the substitute template directly to the site of the cut would improve the patching efficiency. So he constructed a piece of DNA that matches the free DNA end and carries the genetic sequence to be inserted at the other end.
The technique allowed successful repair of a mutation with up to 60% efficiency.
“Our data indicate that Cas9 breaks could be different, at a molecular level, from breaks generated by other targeted nucleases, such as TALENS and zinc-finger nucleases, which suggests that strategies like the ones we are using can give you more efficient repair of Cas9 breaks,” Dr Richardson said.
The researchers also showed that variants of the Cas9 protein that bind DNA but do not cut can also paste a new DNA sequence at the binding site, possibly by forming a “bubble” structure on the target DNA that also acts to attract the repair template.
Gene editing using Cas9 without genome cutting could be safer than typical gene editing by removing the danger of off-target cutting in the genome, Dr Corn said. ![]()
Generic drugs often out of reach, experts say

Photo courtesy of the CDC
An article published in Blood suggests pharmaceutical companies use several strategies to keep affordable generic drugs from the US market.
“The timely availability of affordable generic drugs is the difference between life or death for patients with cancer and other diseases who cannot afford brand-name pharmaceuticals, the majority of which are priced at monopoly levels and protected by 20-year patents,” said lead author Hagop Kantarjian, MD, of The University of Texas MD Anderson Cancer Center in Houston.
“Unfortunately, these sorely needed generics are increasingly out of reach. As we sought to understand what keeps these affordable drugs from the market, we identified several specific strategies that pharmaceutical companies use to extend their patents and eliminate competition.”
Dr Kantarjian and his colleagues assert that pharmaceutical companies use a variety of strategies to delay, prevent, and suppress the timely availability of affordable generic drugs.
Among them, the authors detail “pay-for-delay,” in which the company that owns the patent pays a generic company to delay entry into the market. The Federal Trade Commission estimates that the pay-for-delay settlements cost taxpayers, insurance companies, and consumers approximately $3.5 billion per year.
In other cases detailed in the article, the patent-holder deters competition by creating its own version of drugs at generic prices.
While this practice may reduce costs for consumers by 4% to 8% in the short-term, the authors suggest that companies often use the authorized generics as a bargaining chip in “pay-for-delay” deals, pledging not to release their own drugs in return for the true generic company promising to delay market entry.
Other strategies the authors discuss include investing heavily in advertising the brand-name drug (often spending more on marketing than on research and development) and lobbying for laws that prevent patients from importing cheaper generics from other countries, which the authors write can cost as little as 20% to 50% of US prices.
The authors also say some drug companies buy out competitors and then increase the price of a newly acquired generic drug by several fold overnight.
In addition, the authors describe a strategy they call “product hopping,” which involves switching the market for a drug to a reformulated “new and improved” version with a slightly different tablet or capsule dose that offers no therapeutic advantage over the original but has a later-expiring patent.
The company then heavily advertises the new brand-name drug in an effort to convince patients and physicians to switch.
As a result, when the generic version of the original becomes available, pharmacists cannot substitute it for the new branded version because state laws allow substitution only if certain characteristics, such as dosing, remain the same.
In recognition of the harm and expense the authors suggest these strategies impart on both patients and the economy, they propose several solutions that would support timely access to affordable generic drugs.
These include allowing Medicare to negotiate drug prices, monitoring and penalizing pay-for-delay deals, allowing transportation of pharmaceuticals across borders for individual use, and challenging weak patents.
“Each day, in my clinic, I see leukemia patients who are harmed because they cannot afford their treatment, some risking death because they cannot pay for the medicine keeping them alive,” Dr Kantarjian said.
“Overall, these strategies demonstrate that the trend of high brand-name drug prices has recently infected generic drugs, as companies value profit at the expense of long-term utility to society. We must be vigilant in recognizing these strategies and advocating for solutions that will allow companies to accomplish their dual mission: make reasonable profits and help save and/or improve patients’ lives.” ![]()
Older Inpatients' Views on Group PT
There is uncertainty regarding older adults' attitudes toward participating in group exercise. Although some evidence suggests that in the community, older adults prefer to exercise alone with some instruction,[1, 2] others support the preference of group exercise with peers.[3] Little is known about the attitudes of hospitalized older adults toward group physiotherapy (GPT). Providing physiotherapy (also known as physical therapy) in a group setting has been shown to be effective in a variety of populations,[4, 5, 6, 7] and as a consequence of simultaneously treating multiple patients, therapist[8] and cost[9] efficiency are enhanced. Description of the patient experience is increasingly being recognized as a crucial element in the delivery of patient‐centered care and performance evaluation of health professionals and services.[10] Therefore, the purpose of this investigation was to explore older inpatients' experiences of GPT to assist with planning and designing future inpatient programs to maximize patient participation, satisfaction, and clinical outcomes.
METHODS
Recruitment
A subset of participants enrolled in a randomized controlled trial investigating the effects of a GPT and individual physiotherapy program on clinical outcomes in hospitalized older adults (ANZCTR number: 12608000580370) were asked during the initial consenting procedure if they would also consent to participating in an interview about their experiences of physiotherapy. Ethics approval was provided by hospital and university ethics committees, and all participants provided written informed consent prior to commencement.
Participants
Inclusion criteria were inpatients on aged care wards at a metropolitan rehabilitation hospital, aged 65 years or older, and willing to take part in GPT. Exclusion criteria were Mini‐Mental State Examination[11] scores <10, physically unable or behaviorally unsuitable for GPT, insufficient proficiency in English, and significant memory loss. The latter 2 criteria were to allow for in‐depth interviews. Sixteen participants consented to take part.
Group Physiotherapy Intervention
Participants attended exercise classes 3 times per week, with a maximum of 6 participants, and were led by a trained physiotherapist or allied health assistant (group instructor). In addition, all participants also received individual physiotherapy; the treating therapist determined the type, intensity, and duration of the treatment with input from their patient.
Data Collection
After undertaking at least 3 group classes, individual interviews were undertaken in a quiet room with an independent researcher (MR). Interviews were conducted and audio‐recorded using a digital voice recorder, and were transcribed verbatim by MR within 24 hours. An interview guide with open‐ended questions, created specifically for this study, was modified after preliminary analysis of the first interview (Table 1). Interviews continued until no new themes arose in the last 3 interviews; saturation point[12] was decided by reviewer consensus and reached at 12 interviews. The key outcome of interest was themes relating to participants' experiences of GPT. Interviews lasted between 5 and 45 minutes.
|
| Questions |
| How do you feel about attending the group PT sessions? |
| What aspects of the group PT sessions do you enjoy? |
| What aspects of the group PT sessions do you dislike? |
| What do you think about the level of supervision and support you receive in the group sessions? |
| What do you think about the amount of PT you receive in these group sessions? |
| What are the main differences between the exercise group and the individual sessions? |
| What did you expect to occur in the group sessions? |
| How do you feel when you see other people doing better than you in the group? |
| How do you feel when you see other people doing worse than you in the group? |
| In the future, what things could be changed to make group PT more enjoyable for you? |
| What other comments or feedback do you have? |
Data Analysis
Two reviewers independently completed line‐by‐line thematic analysis.[13] One reviewer used NVivo to support analysis,[14] and the other reviewer analyzed interviews manually. Text was coded,[15] and constant comparison was utilized to ensure later emerging codes were identified in earlier interviews.[15] Researchers then met to compare and discuss coding definitions and their results; similar codes that arose in multiple interviews were compared and grouped together to develop themes and subthemes, which were refined until consensus was reached. Interviews and themes were reviewed by a third researcher (AH) as part of a peer review process to minimize researcher bias.[16]
RESULTS
Eight females and 4 males aged 73 to 93 years (mean = 82.5 years, standard deviation = 7.1 years) participated in the interviews. After initially consenting to participate, 1 participant declined due to fatigue. Three participants were discharged prior to scheduling an interview. Analysis revealed 6 major themes and 10 subthemes (Table 2).
| Major Theme | Subtheme | Supporting Extracts |
|---|---|---|
| ||
| Participation and satisfaction | Happy to participate in group PT | It's been terrific. It's the best thing I've done since being here. I've been very happyyou should continue it, that's for sure. It's best for everybody. (Participant 1) |
| Group PT was a satisfactory alternative to individual PT | I rather enjoy it. I'm looking forward to it today. I can't see much difference [between the group and individual PT]. Couldn't be better. (Participant 3) | |
| Exercise and physical benefits | Happy with the content | I didn't find any of the exercises beyond my limits. I didn't realize how weak I was. After exercising, I found the muscles in my neck were tightandgetting a bit sore initially, but the more I did, the lesser it gotwith the arthritis, it is good to get it moving. (Participant 12) |
| Described physical benefits | Whatever I'm doing is helping with my balance and helping with general muscle things. I'm getting a little bit bettermy balance has improved. (Participant 4) | |
| Camaraderie and support | Enjoyment of the social aspects of group PT, feeling like they're in it together | The group is nice because we smile at each other and we grimacewe feel the same thingsit hurts or I'm tired. We sometimes have a bit of a laugh and sometimes have a bit of a moan. I think you enjoy it more if you've got others doing the same thing as you. [We] egg everybody on to do their best. (Participant 4) |
| Celebration of others' successes | One of the other ladies went home and I was really pleased for her. She'd been here for quite some time and I wished her well. (Participant 4) | |
| I just clap like mad for somebody who has done a better job next time I see them. [It] shows that they're trying harder. (Participant 3) | ||
| Self‐satisfaction and self‐awareness | Feeling good about their performance | I can walk to the toilet and walk around the ward. A few of them just can't. It made me think about life and how fortunate I've been. When I look around, there's a lot more that's worse off than me. (Participant 2) |
| I feel lucky. I'm better than the other ones.My legs are very bad but there's one who can hardly lift her legs. I'm very lucky. (Participant 8) | ||
| Motivation and drive for improvement | Self‐determination plays an important role in recovery, with physical benefits as an extrinsic motivator | I try pretty much as hard as I canI do the best I can and that's about all I can do, really. (Participant 4) |
| Part of the reason I'm here is just to try and improve my balance so that I don't fall over. (Participant 7) | ||
| Competition as extrinsic motivation | It's a bit of a challenge. I've only done 8 and they've done 10. Incentiveit becomes a bit like competition. (Participant 1) | |
| I try and do better than what they're doing. (Participant 5). | ||
| It's good to be together to do it, I think it gives you an incentive to work at it, push yourself a little bit. Competitiveness comes out[you have] got to push yourself a bit harder. (Participant 12) | ||
| Qualities of the group instructor | Knowledge and attentiveness of the group instructor | She knows I've got a bad back and I've got a bad arm so she says, You don't do that one, Don't forget, you mustn't do it if it hurts. (Participant 3) |
Themes
Attendance and Satisfaction
Participants were happy to attend GPT. Participants saw it as an opportunity to get out of the room (participant 4) and they valued the socialization.
Participants found GPT to be a satisfactory alternative to individual sessions. Participants described no difference in the level or type of physiotherapy in group and individual settings; both were valued for exercise content.
Exercise and Physical Benefits
Participants were happy with the content of GPT. Despite being high intensity, exercises were reported to be appropriate.
Perceived physical benefits were described. Reduced pain and stiffness, and improved balance and strength were described with GPT, which contributed to satisfaction.
Qualities of the Group Instructor
Knowledge and Attentiveness of the Group Instructor
These supportive qualities were described as important factors by participants. Some participants acknowledged the number of other participants in GPT; however, they perceived that the instructor was monitoring each person individually, constantly, and equally. Participants reported that group instructors modified or ceased exercises where appropriate, engendering trust (participant 5) and perceived that GPT was individualized and not inferior to individual PT.
Social AspectsCamaraderie and Support
Enjoyment of the Social Aspects of GPT: Feeling Like They're in It Together
Participants reported enjoying the company and support of their peers. They described camaraderie and did not feel alone in their experiences. Exercising with peers encouraged them to push themselves more than during individual physiotherapy.
Celebration of Others' Successes
Some participants expressed awareness of their support to others; seeing others improve and return home gave them encouragement.
Self‐Satisfaction and Self‐Awareness
Feel Good About Their Mobility and Health in the Group Setting
Participants made downward comparisons with others less mobile, which resulted in a realization, gratitude, and acceptance of their own health and physical abilities/limitations.
Self‐Determination and Extrinsic Motivators
Self‐Determination Plays an Important Role in Recovery, With Physical Benefits as an Extrinsic Motivator
Participants described self‐determination to exercise, some without peer influence. Physical benefits of exercise were an extrinsic motivator; participants felt that they were doing as best they could to achieve their goals.
Competition as an Extrinsic Motivator
Upward social comparisons were made with peers who participants perceived were performing better than them, which increased motivation to work harder. Self‐determination and competition were not mutually exclusive.
DISCUSSION
Participants were positive about GPT and reported experiencing physical benefits. Motivation was reported as an important factor in recovery, with improving mobility and competition as commonly described extrinsic motivators. Social comparisons made between participants were motivating and reassuring.
Group physiotherapy sessions are often a replacement for individual physiotherapy; therefore, it is important that participants feel they are receiving a suitable alternative. Individual physiotherapy has advantages over GPT including affording a more individualized assessment and treatment; a combination of both may be appropriate for many older inpatients. Although there is conflicting evidence of the exercise preferences of community‐dwelling older adults,[1] the results of this study are consistent with evidence supporting exercising with peers.[3, 17]
Self‐determination theory describes motivation existing along a continuum, from intrinsic motivation to extrinsic motivation then amotivation.[18] Participants described valuing the physical benefits of exercise (extrinsic motivation), similarly noted by survivors of stroke.[19, 20] For those who do not value exercise, group instructors may consider discussing its benefits during GPT. Competition may be stimulated through exercising with peers; therefore, group instructors should utilize this advantage of GPT over individual physiotherapy.
Participants feeling socially supported in GPT were similar to those reported by hospitalized older adults[21] as well as those undertaking exercise groups for cardiac rehabilitation,[22] terminal cancer,[23] and following lung transplantation.[24] Fostering a supportive environment may enhance the patient experience; therefore, physiotherapists should encourage GPT attendance and socialization (as appropriate) and actively acknowledge physical improvements.
The Social Comparison Theory suggests that people evaluate their abilities by comparing themselves to their peers.[25, 26] Participants who made upward comparisons, with those who they perceived were better than them[26] resulted in motivation to attain the level of their more mobile peers. Downward comparisons were also made with those who they felt were less mobile; these engendered feelings of gratitude and appreciation for their own health and promoted self‐esteem,[26] and have also been reported in other populations including those with spinal cord injury[27] and breast cancer.[28]
Study Limitations
Interviews were not conducted with those who received individual physiotherapy alone, and therefore no comparisons can be drawn regarding their experiences and satisfaction. Those who participated in interviews had already consented to participating in GPT; those who declined GPT were not part of the trial and therefore responses may have some bias. To minimize this bias, the interview guide included questions into positive and negative aspects of group and individual physiotherapy. Although community‐dwelling older adults perceive boredom, intimidation, and potential for injury to be barriers to participation in exercise,[29] future research should investigate why older inpatients decline GPT and methods for improving participation.
CONCLUSION
This study provides new evidence to support GPT for hospitalized older adults. Participants in this study enjoyed GPT and were motivated and supported by their peers. As GPT was valued by hospitalized older adults who participated in this study for its physical and social benefits, clinicians could consider replacing several individual treatment sessions with GPT as part of a weekly treatment schedule.
Acknowledgements
The principle investigator thanks E. Harris, C. Chenneaux, A. Shapiro, D. Kronemberg, R. Roose and B. Doyle‐Jones for running the exercise groups, and also extends her thanks and gratitude to all of the patients interviewed for their time and honesty.
Disclosures: Melissa J. Raymond was supported by an Australian Postgraduate Award scholarship and a Caulfield Hospital Research Trust Projects Grant 2008/2009.
- , , , , , . Personal and environmental factors associated with physical inactivity among different racial‐ethnic groups of U.S. middle‐aged and older‐aged women. Health Psychol. 2000;19(4):354–364.
- , , , . Physical activity preferences of middle‐aged and older adults: a community analysis. J Aging Phys Act. 1999;7(4):386–399.
- , , , . Older adults' preferences for exercising alone versus in groups: considering contextual congruence. Ann Behav Med. 2007;33(2):200–206.
- , , , , . Group versus individual approach? A meta‐analysis of the effectiveness of interventions to promote physical activity. Sport Exerc Psychol Rev. 2006;2(1):19–35.
- , , , , , . A high‐intensity functional weight‐bearing exercise program for older people dependent in activities of daily living and living in residential care facilities: evaluation of the applicability with focus on cognitive function. Phys Ther. 2006;86(4):489–498.
- , , , , , . The value of individual or collective group exercise programs for knee or hip osteoarthritis. Clinical practice recommendations. Ann Readapt Med Phys. 2007;50(9):741–746, 734–740.
- , , , . Circuit class therapy versus individual physiotherapy sessions during inpatient stroke rehabilitation: a controlled trial. Arch Phys Med Rehabil. 2007;88(8):955–963.
- , , , . A descriptive analysis of physical therapy group intervention in five midwestern inpatient rehabilitation facilities. J Phys Ther Educ. 2000;14:13–20.
- , , , et al. Group treatments for sensitive health care problems: a randomised controlled trial of group versus individual physiotherapy sessions for female urinary incontinence. BMC Womens Health. 2009;9:26.
- . Service improvement and patient experience. Int Emerg Nurs. 2010;18(4):175–176.
- , , . “Mini‐mental state”. A practical method for grading the cognitive state of patients for the clinician. J Psychiatr Res. 1975;12:189–198.
- , . The Discovery of Grounded Theory: Strategies for Qualitative Research. Mill Valley, CA: Sociology Press; 1967.
- , . Using thematic analysis in psychology. Qual Res Psychol 2006;3(2):77–101.
- , . The NVivo Qualitative Project Book. London, United Kingdom: Sage; 2000.
- . A purposeful approach to the constant comparative method in the analysis of qualitative interviews. Qual Quant. 2002;36(4):391–409.
- , . Rigour and qualitative research. BMJ. 1995;311(6997):109–112.
- , , . How, where and with whom? Physical activity context preferences of three adult groups at risk of inactivity. Br J Sports Med. 2012;46(16):1125–1131.
- , , . Older adults' intrinsic and extrinsic motivation toward physical activity. Am J Health Behav. 2008;32(6):570–582.
- , , , . Qualitative analysis of stroke patients' motivation for rehabilitation. BMJ. 2000;321(7268):1051–1054.
- , , . Exercise perceptions among people with stroke: barriers and facilitators to participation. Int J Ther Rehabil. 2011;18(9):520–530.
- , , , . Interaction between clients and physiotherapists in group exercise classes in geriatric rehabilitation. Adv Physiother. 2009;11(3):145–153.
- , , , . Patients' experience of home and hospital based cardiac rehabilitation: a focus group study. Eur J Cardiovasc Nurs. 2009;8(1):9–17.
- , , , , . Exercise and relaxation intervention for patients with advanced lung cancer: a qualitative feasibility study. Scand J Med Sci Sports. 2012;22(6):804–815.
- , , , et al. Patients' expectations and experiences of rehabilitation following lung transplantation. Clin Transplant. 2014;28(2):252–258.
- . A theory of social comparison processes. Hum Relat. 1954;7(2):117–140.
- . Theory and research concerning social comparisons of personal attributes. Psychol Bull. 1989;106(2):231–248.
- , . Long‐term adjustment to physical disability: the role of social support, perceived control, and self‐blame. J Pers Soc Psychol. 1985;48:1162–1172.
- , , . It could be worse: selective evaluation as a response to victimization. J Soc Issues. 1983;39:19–40.
- , , , . Motivators, barriers, and beliefs regarding physical activity in an older adult population. J Geriatr Phys Ther. 2011;34(3):138–147.
There is uncertainty regarding older adults' attitudes toward participating in group exercise. Although some evidence suggests that in the community, older adults prefer to exercise alone with some instruction,[1, 2] others support the preference of group exercise with peers.[3] Little is known about the attitudes of hospitalized older adults toward group physiotherapy (GPT). Providing physiotherapy (also known as physical therapy) in a group setting has been shown to be effective in a variety of populations,[4, 5, 6, 7] and as a consequence of simultaneously treating multiple patients, therapist[8] and cost[9] efficiency are enhanced. Description of the patient experience is increasingly being recognized as a crucial element in the delivery of patient‐centered care and performance evaluation of health professionals and services.[10] Therefore, the purpose of this investigation was to explore older inpatients' experiences of GPT to assist with planning and designing future inpatient programs to maximize patient participation, satisfaction, and clinical outcomes.
METHODS
Recruitment
A subset of participants enrolled in a randomized controlled trial investigating the effects of a GPT and individual physiotherapy program on clinical outcomes in hospitalized older adults (ANZCTR number: 12608000580370) were asked during the initial consenting procedure if they would also consent to participating in an interview about their experiences of physiotherapy. Ethics approval was provided by hospital and university ethics committees, and all participants provided written informed consent prior to commencement.
Participants
Inclusion criteria were inpatients on aged care wards at a metropolitan rehabilitation hospital, aged 65 years or older, and willing to take part in GPT. Exclusion criteria were Mini‐Mental State Examination[11] scores <10, physically unable or behaviorally unsuitable for GPT, insufficient proficiency in English, and significant memory loss. The latter 2 criteria were to allow for in‐depth interviews. Sixteen participants consented to take part.
Group Physiotherapy Intervention
Participants attended exercise classes 3 times per week, with a maximum of 6 participants, and were led by a trained physiotherapist or allied health assistant (group instructor). In addition, all participants also received individual physiotherapy; the treating therapist determined the type, intensity, and duration of the treatment with input from their patient.
Data Collection
After undertaking at least 3 group classes, individual interviews were undertaken in a quiet room with an independent researcher (MR). Interviews were conducted and audio‐recorded using a digital voice recorder, and were transcribed verbatim by MR within 24 hours. An interview guide with open‐ended questions, created specifically for this study, was modified after preliminary analysis of the first interview (Table 1). Interviews continued until no new themes arose in the last 3 interviews; saturation point[12] was decided by reviewer consensus and reached at 12 interviews. The key outcome of interest was themes relating to participants' experiences of GPT. Interviews lasted between 5 and 45 minutes.
|
| Questions |
| How do you feel about attending the group PT sessions? |
| What aspects of the group PT sessions do you enjoy? |
| What aspects of the group PT sessions do you dislike? |
| What do you think about the level of supervision and support you receive in the group sessions? |
| What do you think about the amount of PT you receive in these group sessions? |
| What are the main differences between the exercise group and the individual sessions? |
| What did you expect to occur in the group sessions? |
| How do you feel when you see other people doing better than you in the group? |
| How do you feel when you see other people doing worse than you in the group? |
| In the future, what things could be changed to make group PT more enjoyable for you? |
| What other comments or feedback do you have? |
Data Analysis
Two reviewers independently completed line‐by‐line thematic analysis.[13] One reviewer used NVivo to support analysis,[14] and the other reviewer analyzed interviews manually. Text was coded,[15] and constant comparison was utilized to ensure later emerging codes were identified in earlier interviews.[15] Researchers then met to compare and discuss coding definitions and their results; similar codes that arose in multiple interviews were compared and grouped together to develop themes and subthemes, which were refined until consensus was reached. Interviews and themes were reviewed by a third researcher (AH) as part of a peer review process to minimize researcher bias.[16]
RESULTS
Eight females and 4 males aged 73 to 93 years (mean = 82.5 years, standard deviation = 7.1 years) participated in the interviews. After initially consenting to participate, 1 participant declined due to fatigue. Three participants were discharged prior to scheduling an interview. Analysis revealed 6 major themes and 10 subthemes (Table 2).
| Major Theme | Subtheme | Supporting Extracts |
|---|---|---|
| ||
| Participation and satisfaction | Happy to participate in group PT | It's been terrific. It's the best thing I've done since being here. I've been very happyyou should continue it, that's for sure. It's best for everybody. (Participant 1) |
| Group PT was a satisfactory alternative to individual PT | I rather enjoy it. I'm looking forward to it today. I can't see much difference [between the group and individual PT]. Couldn't be better. (Participant 3) | |
| Exercise and physical benefits | Happy with the content | I didn't find any of the exercises beyond my limits. I didn't realize how weak I was. After exercising, I found the muscles in my neck were tightandgetting a bit sore initially, but the more I did, the lesser it gotwith the arthritis, it is good to get it moving. (Participant 12) |
| Described physical benefits | Whatever I'm doing is helping with my balance and helping with general muscle things. I'm getting a little bit bettermy balance has improved. (Participant 4) | |
| Camaraderie and support | Enjoyment of the social aspects of group PT, feeling like they're in it together | The group is nice because we smile at each other and we grimacewe feel the same thingsit hurts or I'm tired. We sometimes have a bit of a laugh and sometimes have a bit of a moan. I think you enjoy it more if you've got others doing the same thing as you. [We] egg everybody on to do their best. (Participant 4) |
| Celebration of others' successes | One of the other ladies went home and I was really pleased for her. She'd been here for quite some time and I wished her well. (Participant 4) | |
| I just clap like mad for somebody who has done a better job next time I see them. [It] shows that they're trying harder. (Participant 3) | ||
| Self‐satisfaction and self‐awareness | Feeling good about their performance | I can walk to the toilet and walk around the ward. A few of them just can't. It made me think about life and how fortunate I've been. When I look around, there's a lot more that's worse off than me. (Participant 2) |
| I feel lucky. I'm better than the other ones.My legs are very bad but there's one who can hardly lift her legs. I'm very lucky. (Participant 8) | ||
| Motivation and drive for improvement | Self‐determination plays an important role in recovery, with physical benefits as an extrinsic motivator | I try pretty much as hard as I canI do the best I can and that's about all I can do, really. (Participant 4) |
| Part of the reason I'm here is just to try and improve my balance so that I don't fall over. (Participant 7) | ||
| Competition as extrinsic motivation | It's a bit of a challenge. I've only done 8 and they've done 10. Incentiveit becomes a bit like competition. (Participant 1) | |
| I try and do better than what they're doing. (Participant 5). | ||
| It's good to be together to do it, I think it gives you an incentive to work at it, push yourself a little bit. Competitiveness comes out[you have] got to push yourself a bit harder. (Participant 12) | ||
| Qualities of the group instructor | Knowledge and attentiveness of the group instructor | She knows I've got a bad back and I've got a bad arm so she says, You don't do that one, Don't forget, you mustn't do it if it hurts. (Participant 3) |
Themes
Attendance and Satisfaction
Participants were happy to attend GPT. Participants saw it as an opportunity to get out of the room (participant 4) and they valued the socialization.
Participants found GPT to be a satisfactory alternative to individual sessions. Participants described no difference in the level or type of physiotherapy in group and individual settings; both were valued for exercise content.
Exercise and Physical Benefits
Participants were happy with the content of GPT. Despite being high intensity, exercises were reported to be appropriate.
Perceived physical benefits were described. Reduced pain and stiffness, and improved balance and strength were described with GPT, which contributed to satisfaction.
Qualities of the Group Instructor
Knowledge and Attentiveness of the Group Instructor
These supportive qualities were described as important factors by participants. Some participants acknowledged the number of other participants in GPT; however, they perceived that the instructor was monitoring each person individually, constantly, and equally. Participants reported that group instructors modified or ceased exercises where appropriate, engendering trust (participant 5) and perceived that GPT was individualized and not inferior to individual PT.
Social AspectsCamaraderie and Support
Enjoyment of the Social Aspects of GPT: Feeling Like They're in It Together
Participants reported enjoying the company and support of their peers. They described camaraderie and did not feel alone in their experiences. Exercising with peers encouraged them to push themselves more than during individual physiotherapy.
Celebration of Others' Successes
Some participants expressed awareness of their support to others; seeing others improve and return home gave them encouragement.
Self‐Satisfaction and Self‐Awareness
Feel Good About Their Mobility and Health in the Group Setting
Participants made downward comparisons with others less mobile, which resulted in a realization, gratitude, and acceptance of their own health and physical abilities/limitations.
Self‐Determination and Extrinsic Motivators
Self‐Determination Plays an Important Role in Recovery, With Physical Benefits as an Extrinsic Motivator
Participants described self‐determination to exercise, some without peer influence. Physical benefits of exercise were an extrinsic motivator; participants felt that they were doing as best they could to achieve their goals.
Competition as an Extrinsic Motivator
Upward social comparisons were made with peers who participants perceived were performing better than them, which increased motivation to work harder. Self‐determination and competition were not mutually exclusive.
DISCUSSION
Participants were positive about GPT and reported experiencing physical benefits. Motivation was reported as an important factor in recovery, with improving mobility and competition as commonly described extrinsic motivators. Social comparisons made between participants were motivating and reassuring.
Group physiotherapy sessions are often a replacement for individual physiotherapy; therefore, it is important that participants feel they are receiving a suitable alternative. Individual physiotherapy has advantages over GPT including affording a more individualized assessment and treatment; a combination of both may be appropriate for many older inpatients. Although there is conflicting evidence of the exercise preferences of community‐dwelling older adults,[1] the results of this study are consistent with evidence supporting exercising with peers.[3, 17]
Self‐determination theory describes motivation existing along a continuum, from intrinsic motivation to extrinsic motivation then amotivation.[18] Participants described valuing the physical benefits of exercise (extrinsic motivation), similarly noted by survivors of stroke.[19, 20] For those who do not value exercise, group instructors may consider discussing its benefits during GPT. Competition may be stimulated through exercising with peers; therefore, group instructors should utilize this advantage of GPT over individual physiotherapy.
Participants feeling socially supported in GPT were similar to those reported by hospitalized older adults[21] as well as those undertaking exercise groups for cardiac rehabilitation,[22] terminal cancer,[23] and following lung transplantation.[24] Fostering a supportive environment may enhance the patient experience; therefore, physiotherapists should encourage GPT attendance and socialization (as appropriate) and actively acknowledge physical improvements.
The Social Comparison Theory suggests that people evaluate their abilities by comparing themselves to their peers.[25, 26] Participants who made upward comparisons, with those who they perceived were better than them[26] resulted in motivation to attain the level of their more mobile peers. Downward comparisons were also made with those who they felt were less mobile; these engendered feelings of gratitude and appreciation for their own health and promoted self‐esteem,[26] and have also been reported in other populations including those with spinal cord injury[27] and breast cancer.[28]
Study Limitations
Interviews were not conducted with those who received individual physiotherapy alone, and therefore no comparisons can be drawn regarding their experiences and satisfaction. Those who participated in interviews had already consented to participating in GPT; those who declined GPT were not part of the trial and therefore responses may have some bias. To minimize this bias, the interview guide included questions into positive and negative aspects of group and individual physiotherapy. Although community‐dwelling older adults perceive boredom, intimidation, and potential for injury to be barriers to participation in exercise,[29] future research should investigate why older inpatients decline GPT and methods for improving participation.
CONCLUSION
This study provides new evidence to support GPT for hospitalized older adults. Participants in this study enjoyed GPT and were motivated and supported by their peers. As GPT was valued by hospitalized older adults who participated in this study for its physical and social benefits, clinicians could consider replacing several individual treatment sessions with GPT as part of a weekly treatment schedule.
Acknowledgements
The principle investigator thanks E. Harris, C. Chenneaux, A. Shapiro, D. Kronemberg, R. Roose and B. Doyle‐Jones for running the exercise groups, and also extends her thanks and gratitude to all of the patients interviewed for their time and honesty.
Disclosures: Melissa J. Raymond was supported by an Australian Postgraduate Award scholarship and a Caulfield Hospital Research Trust Projects Grant 2008/2009.
- , , , , , . Personal and environmental factors associated with physical inactivity among different racial‐ethnic groups of U.S. middle‐aged and older‐aged women. Health Psychol. 2000;19(4):354–364.
- , , , . Physical activity preferences of middle‐aged and older adults: a community analysis. J Aging Phys Act. 1999;7(4):386–399.
- , , , . Older adults' preferences for exercising alone versus in groups: considering contextual congruence. Ann Behav Med. 2007;33(2):200–206.
- , , , , . Group versus individual approach? A meta‐analysis of the effectiveness of interventions to promote physical activity. Sport Exerc Psychol Rev. 2006;2(1):19–35.
- , , , , , . A high‐intensity functional weight‐bearing exercise program for older people dependent in activities of daily living and living in residential care facilities: evaluation of the applicability with focus on cognitive function. Phys Ther. 2006;86(4):489–498.
- , , , , , . The value of individual or collective group exercise programs for knee or hip osteoarthritis. Clinical practice recommendations. Ann Readapt Med Phys. 2007;50(9):741–746, 734–740.
- , , , . Circuit class therapy versus individual physiotherapy sessions during inpatient stroke rehabilitation: a controlled trial. Arch Phys Med Rehabil. 2007;88(8):955–963.
- , , , . A descriptive analysis of physical therapy group intervention in five midwestern inpatient rehabilitation facilities. J Phys Ther Educ. 2000;14:13–20.
- , , , et al. Group treatments for sensitive health care problems: a randomised controlled trial of group versus individual physiotherapy sessions for female urinary incontinence. BMC Womens Health. 2009;9:26.
- . Service improvement and patient experience. Int Emerg Nurs. 2010;18(4):175–176.
- , , . “Mini‐mental state”. A practical method for grading the cognitive state of patients for the clinician. J Psychiatr Res. 1975;12:189–198.
- , . The Discovery of Grounded Theory: Strategies for Qualitative Research. Mill Valley, CA: Sociology Press; 1967.
- , . Using thematic analysis in psychology. Qual Res Psychol 2006;3(2):77–101.
- , . The NVivo Qualitative Project Book. London, United Kingdom: Sage; 2000.
- . A purposeful approach to the constant comparative method in the analysis of qualitative interviews. Qual Quant. 2002;36(4):391–409.
- , . Rigour and qualitative research. BMJ. 1995;311(6997):109–112.
- , , . How, where and with whom? Physical activity context preferences of three adult groups at risk of inactivity. Br J Sports Med. 2012;46(16):1125–1131.
- , , . Older adults' intrinsic and extrinsic motivation toward physical activity. Am J Health Behav. 2008;32(6):570–582.
- , , , . Qualitative analysis of stroke patients' motivation for rehabilitation. BMJ. 2000;321(7268):1051–1054.
- , , . Exercise perceptions among people with stroke: barriers and facilitators to participation. Int J Ther Rehabil. 2011;18(9):520–530.
- , , , . Interaction between clients and physiotherapists in group exercise classes in geriatric rehabilitation. Adv Physiother. 2009;11(3):145–153.
- , , , . Patients' experience of home and hospital based cardiac rehabilitation: a focus group study. Eur J Cardiovasc Nurs. 2009;8(1):9–17.
- , , , , . Exercise and relaxation intervention for patients with advanced lung cancer: a qualitative feasibility study. Scand J Med Sci Sports. 2012;22(6):804–815.
- , , , et al. Patients' expectations and experiences of rehabilitation following lung transplantation. Clin Transplant. 2014;28(2):252–258.
- . A theory of social comparison processes. Hum Relat. 1954;7(2):117–140.
- . Theory and research concerning social comparisons of personal attributes. Psychol Bull. 1989;106(2):231–248.
- , . Long‐term adjustment to physical disability: the role of social support, perceived control, and self‐blame. J Pers Soc Psychol. 1985;48:1162–1172.
- , , . It could be worse: selective evaluation as a response to victimization. J Soc Issues. 1983;39:19–40.
- , , , . Motivators, barriers, and beliefs regarding physical activity in an older adult population. J Geriatr Phys Ther. 2011;34(3):138–147.
PCT Value to Distinguish IPE From NIPE
Epidemiological studies estimate that 40% to 50% of patients with pneumonia develop a parapneumonic effusion (PPE), and up to 35% of these have empyema. Approximately 15% of patients require surgical drainage, which has a high mortality rate.[1] Although early intervention is important in patients with suspected PPE, diagnosing a PPE is challenging, as cultures and Gram stain are frequently negative.[1] Clinicians have to rely on tests, such as pleural fluid pH, lactate dehydrogenase (LDH), and glucose, which have low sensitivity and specificity in diagnosing a PPE.
Procalcitonin (PCT) is a distinct biomarker and mediator of sepsis, emanating from parenchymal cells ubiquitously (eg, lung, liver, kidney) due to reduced conversion to mature calcitonin.[2] Besides sepsis, PCT has been used as a biomarker of pneumonia based on its ability to differentiate bacterial versus viral infections.[3, 4, 5] PCT has been shown to be a biomarker in extravascular fluids such as saliva, wound effusions, and pleural fluid.[6, 7, 8, 9] In this study we investigate the diagnostic accuracy of pleural fluid PCT in distinguishing infectious and noninfectious etiologies of pleural effusion in veterans with lung infiltrates.
METHOD
The study protocol was approved by the institution review board at the Veterans Affairs Medical Center, Washington, DC. Patients were identified using a computerized patient record system after searching the procedure code for thoracentesis. A retrospective chart review was conducted on veterans who underwent a thoracentesis from February 2011 through January 2012.
Inclusion Criteria
The inclusion criteria comprised all adults who underwent a thoracentesis and had pleural fluid collected for LDH, total protein, albumin, cell count with differential, cytology, Gram stain, culture, pH, triglycerides, cholesterol, and PCT.
Exclusion Criteria
The exclusion criteria comprised all patients with a known etiology of pleural effusion or those without pleural PCT data.
Data Collection
Pleural fluid data collected included LDH, protein, albumin, cell count and differential, pH, Gram stain and culture, cytology, triglyceride, cholesterol, amylase, and PCT. Serum chemistry data collected included LDH, protein, albumin, prothrombin time, international normalized ratio, and blood culture. PCT was measured in a 200‐L pleural fluid sample using Kryptor technology (Thermo Fisher Scientific, Freemont, CA). The Kryptor assay is based on a monoclonal mouse anti‐catacalcin antibody conjugated with colloidal gold (tracer) and a polyclonal sheep anti‐calcitonin antibody (solid phase). It has a detection limit of 0.06 ng/mL (or 0.06 g/L).[2]
Classification of Groups
Pleural fluid was classified as a transudate or an exudate by Light's criteria.[10] An exudative effusion had a pleural fluid to serum ratio of LDH > 0.6, pleural fluid to serum protein ratio >0.5, or LDH great than the upper two‐thirds of the reference value or serum value.
Patient's clinical diagnosis for the cause of pleural effusion was documented from chart review. Effusions were classified as infectious pleural effusions (IPE) or noninfectious pleural effusions (NIPE).
An effusion was considered infectious if pleural fluid Gram stain or culture were positive for bacteria, if pus was present, or if the effusion was accompanied by a lung infiltrate in a patient with evidence at least 2 of the following: temperature >38C (100.4F) or <36C (96.8F), heart rate >90 beats per minute, respiratory rate >20 breaths per minute or arterial carbon dioxide tension (PaCO2) of <32 mm Hg, and white blood cell count >12,000/L or <4000/L or >10% immature (band) forms.
An effusion not meeting the above criteria was classified as a NIPE. A malignant effusion was diagnosed by the presence of cancer cells on cytology. Paramalignant effusion was an effusion that was devoid of cancer cells on cytology and/or histology, in a patient with a malignancy.
Data Analysis
Statistical computations were performed using Graph Pad Instat version 3 and version 5 statistical software (Graph Pad Software, Inc. La Jolla, CA). Median PCT with standard deviation (SD) was calculated for IPE and NIPE. A 95% confidence interval (CI) for the median PCT was calculated for each group. A comparison of the median PCT between the IPE and NIPE was performed by calculating the SD difference and standard error difference. A 95% CI of the difference in medians was calculated. A P value was calculated using Mann‐Whitney U Test, and a P value of <0.05 was considered significant. The diagnostic performance of different cutoff values of PCT was evaluated using the area under the receiver operating characteristic curve (mean, 95% CI).
RESULTS
A total of 75 patients were included in the study. There were 73 (97.4%) males, with mean age of 70.8 years (range, 4293 years). There were 18 patients with IPE and 57 with NIPE.
Patient characteristics are detailed in Table 1. In the infectious group, 2 patients had empyema. There were no cases of tuberculosis. Of the 57 effusions in the noninfectious group there were 42 exudative effusions, 23 of which were malignant, 3 each were due to a trapped lung and pulmonary embolism. The remaining NIPEs were due to nonpulmonary processes such as chylothorax, liver disease, and renal disease.
| Infectious, n = 18 | Noninfectious, n = 57 | P Value | |
|---|---|---|---|
| |||
| Mean age, y | 73.1 | 70.1 | 0.349 |
| Male | 18 (100%) | 55 (96.6%) | 0.428 |
| Exudative effusion | 13 (72.2%) | 43 (74.1%) | 0.873 |
| Right side | 7 (38.9%) | 32 (55.2%) | 0.2268 |
| Effusion less than one‐third hemithorax | 11 (61.1%) | 28 (48.3%) | 0.3425 |
| Effusion one‐third to two‐thirds hemithorax | 6 (33.3%) | 20 (34.5%) | 0.9253 |
| Effusion greater then two‐thirds hemithorax | 1 (5.6%) | 9 (15.5%) | 0.2777 |
| Median PCT, ng/mL | 1.088 (0.3122.940) | 0.123 (0.050.263) | <0.0001* |
| Median LDH, IU/L | 178.5 (105.5346.25) | 135.5 (94255.2) | 0.629 |
| Median protein, mg/dL | 3.1 (2.33.2) | 3.7 (2.384.48) | 0.046* |
| Median pH | 7.37 (7.317.44) | 7.40 (7.367.44) | 0.111 |
| Median glucose, mg/dL | 126 (97169) | 106 (92135) | 0.226 |
| Median pleural WBC, cells/L | 778 (3237038) | 498 (2001380) | 0.154 |
| Median pleural neutrophils, cells/L | 542 (544743) | 54 (18192) | 0.005* |
The pleural fluid characteristics and biomarkers are detailed in Table 1. Median pleural fluid PCT in IPE was 1.088 ng/mL (0.3122.940 ng/mL) and 0.123 ng/mL (0.050.263 ng/mL) in NIPE, with a P value <0.0001. Pleural fluid PCT >0.25 ng/mL had a sensitivity of 77.78% and specificity of 74.14% for diagnosing an IPE (Figure 1).

A subgroup analysis comparing 13 exudative effusions in the infectious group with the 23 exudative malignant and paramalignant effusions in the noninfectious group was also performed. The median pleural PCT value in the infectious group was 0.9743 ng/mL (0.454.117 ng/mL) and 0.1222 ng/mL (0.054650.1972 ng/mL) in the noninfectious group, with a P value <0.0009
DISCUSSION
Clinicians frequently face the dilemma of differentiating IPE from NIPE. In this study, pleural fluid PCT was significantly elevated in IPE. A pleural fluid PCT >0.25 ng/mL had a sensitivity of 77.78% and specificity of 74.14% for diagnosing an IPE (Figure 1). Our subgroup analysis also showed a higher PCT in exudative effusions of the infectious group as compared to exudative effusions of malignant/paramalignant etiology in the noninfectious group. PCT may have a role as a biomarker in diagnosing an infected malignant/paramalignant effusion. Further studies are needed to confirm the same.
Our study is one of the few using the more sensitive technology (eg, Kryptor) to measure PCT levels in pleural fluid, utilizing the current method of choice for serum PCT based on assay performance.[2] PCT is produced during bacterial infections by several tissues sources, and its role in differentiating IPE and NIPE has been investigated by several authors. A prior study reported on 233 patients, 28 of whom had PPEs, 49 had tubercular effusion, and 166 had NIPE.[1] The cutoff point in this study of PCT was >0.145 ng/mL, with a sensitivity of 51.6% and specificity of 66.5%.[1] Another study evaluated 82 patients with pleural effusions, 45 of whom were infectious (bacterial, nontubercular) and used a PCT cutoff value of 0.18 ng/mL to discriminate between IPE and NIPE. They reported a sensitivity of 66.7% and specificity of 77.4%. There was no significant difference in the serum and pleural fluid PCT values within IPE and NIPE subgroups. In fact, there was a significant positive correlation between serum and pleural fluid PCT. However, on comparing evolution of pleural and serum PCT between day 1 and day 3, the authors noted that unlike pleural fluid PCT, serum PCT values were lower on day 3 as compared to day 1.[8] A study on 12 forensic autopsy cases, to establish the usefulness of pericardial and pleural fluids for the postmortem diagnosis of sepsis, also reported significantly higher and similar PCT levels in the sepsis group in both serum and pleural fluid (using an immunoassay by Roche Diagnostic, Mannheim, Germany). The authors suggested that pleural fluid PCT can be used in lieu of serum PCT values to determine the etiology of an effusion.[11]
PCT has a role in the decision to initiate or discontinue antibiotics in the management of community‐acquired pneumonia.[12] In this era of multidrug resistance, appropriate use of antibiotics is of paramount importance, and PCT could play an important role in this regard. The gold standard test to diagnose an infectious pleural effusion is present in a small percentage of patients.[13] Larger randomized studies designed to evaluate the role of serial serum and pleural fluid PCT, with appropriate cutoff values, are needed to define the role of PCT in guiding antibiotic therapy.[14]
The limitations of this study include its retrospective nature and lack of serum PCT data. The gold standard methods to diagnose pleural effusion were not available in this study.
CONCLUSION
PCT is a novel biomarker for diagnosing infectious pleural effusion, and it would be worthwhile to investigate the role of pleural PCT in assessing severity of illness, risk stratification, and antibiotic stewardship in hospitalized patients with pleural effusions.
Disclosure: Nothing to report.
- , , , et al. Procalcitonin, C‐reactive protein, and cell counts in the diagnosis of parapneumonic pleural effusions. J Investig Med. 2010;58:971–976.
- , , . Procalcitonin assay in systemic inflammation, infection, and sepsis: clinical utility and limitations. Crit Care Med. 2008;36:941–952.
- , , , , . Pneumonitis‐associated hyperprocalcitoninemia. Am J Med Sci. 1996;312:12–18.
- , , , et al. Bacterial complications of respiratory tract viral illness: a comprehensive evaluation. J Infect Dis. 2013;208:432–441.
- , , , et al. Procalcitonin guidance of antibiotic therapy in community‐acquired pneumonia: a randomized trial. Am J Respir Crit Care Med. 2006;174:84–93.
- , , , et al. Correlation of procalcitonin and cytokine expression with dehiscence of wartime extremity wounds. J Bone Joint Surg Am. 2008;90:580–588.
- , , , , . Salivary procalcitonin and periodontitis in diabetes. J Dent Res. 2008;87:630–634.
- , , , , . Diagnostic and prognostic values of pleural fluid procalcitonin in parapneumonic pleural effusions. Chest. 2009;136:205–211.
- , , , , , . Serum and pleural fluid procalcitonin in predicting bacterial infection in patients with parapneumonic effusion. J Korean Med Sci. 2009;24:398–402.
- , . Textbook of Pleural Diseases. 2nd ed. London, United Kingdom: Arnold Press; 2008.
- , . Usefulness of pericardial and pleural fluids for the postmortem diagnosis of sepsis. J Forensic Leg Med. 2014;28:15–18.
- , , , et al. Procalcitonin to initiate or discontinue antibiotics in acute respiratory tract infections. Evid Based Child Health. 2013;8:1297–1371.
- , , , , , . Routine use of pleural fluid cultures. Are they indicated? Limited yield, minimal impact on treatment decisions. Respir Med. 2006;100:2048–2052.
- , , , et al. Effect of procalcitonin‐guided treatment on antibiotic use and outcome in lower respiratory tract infections: cluster‐randomised, single‐blinded intervention trial. Lancet. 2004;363:600–607.
Epidemiological studies estimate that 40% to 50% of patients with pneumonia develop a parapneumonic effusion (PPE), and up to 35% of these have empyema. Approximately 15% of patients require surgical drainage, which has a high mortality rate.[1] Although early intervention is important in patients with suspected PPE, diagnosing a PPE is challenging, as cultures and Gram stain are frequently negative.[1] Clinicians have to rely on tests, such as pleural fluid pH, lactate dehydrogenase (LDH), and glucose, which have low sensitivity and specificity in diagnosing a PPE.
Procalcitonin (PCT) is a distinct biomarker and mediator of sepsis, emanating from parenchymal cells ubiquitously (eg, lung, liver, kidney) due to reduced conversion to mature calcitonin.[2] Besides sepsis, PCT has been used as a biomarker of pneumonia based on its ability to differentiate bacterial versus viral infections.[3, 4, 5] PCT has been shown to be a biomarker in extravascular fluids such as saliva, wound effusions, and pleural fluid.[6, 7, 8, 9] In this study we investigate the diagnostic accuracy of pleural fluid PCT in distinguishing infectious and noninfectious etiologies of pleural effusion in veterans with lung infiltrates.
METHOD
The study protocol was approved by the institution review board at the Veterans Affairs Medical Center, Washington, DC. Patients were identified using a computerized patient record system after searching the procedure code for thoracentesis. A retrospective chart review was conducted on veterans who underwent a thoracentesis from February 2011 through January 2012.
Inclusion Criteria
The inclusion criteria comprised all adults who underwent a thoracentesis and had pleural fluid collected for LDH, total protein, albumin, cell count with differential, cytology, Gram stain, culture, pH, triglycerides, cholesterol, and PCT.
Exclusion Criteria
The exclusion criteria comprised all patients with a known etiology of pleural effusion or those without pleural PCT data.
Data Collection
Pleural fluid data collected included LDH, protein, albumin, cell count and differential, pH, Gram stain and culture, cytology, triglyceride, cholesterol, amylase, and PCT. Serum chemistry data collected included LDH, protein, albumin, prothrombin time, international normalized ratio, and blood culture. PCT was measured in a 200‐L pleural fluid sample using Kryptor technology (Thermo Fisher Scientific, Freemont, CA). The Kryptor assay is based on a monoclonal mouse anti‐catacalcin antibody conjugated with colloidal gold (tracer) and a polyclonal sheep anti‐calcitonin antibody (solid phase). It has a detection limit of 0.06 ng/mL (or 0.06 g/L).[2]
Classification of Groups
Pleural fluid was classified as a transudate or an exudate by Light's criteria.[10] An exudative effusion had a pleural fluid to serum ratio of LDH > 0.6, pleural fluid to serum protein ratio >0.5, or LDH great than the upper two‐thirds of the reference value or serum value.
Patient's clinical diagnosis for the cause of pleural effusion was documented from chart review. Effusions were classified as infectious pleural effusions (IPE) or noninfectious pleural effusions (NIPE).
An effusion was considered infectious if pleural fluid Gram stain or culture were positive for bacteria, if pus was present, or if the effusion was accompanied by a lung infiltrate in a patient with evidence at least 2 of the following: temperature >38C (100.4F) or <36C (96.8F), heart rate >90 beats per minute, respiratory rate >20 breaths per minute or arterial carbon dioxide tension (PaCO2) of <32 mm Hg, and white blood cell count >12,000/L or <4000/L or >10% immature (band) forms.
An effusion not meeting the above criteria was classified as a NIPE. A malignant effusion was diagnosed by the presence of cancer cells on cytology. Paramalignant effusion was an effusion that was devoid of cancer cells on cytology and/or histology, in a patient with a malignancy.
Data Analysis
Statistical computations were performed using Graph Pad Instat version 3 and version 5 statistical software (Graph Pad Software, Inc. La Jolla, CA). Median PCT with standard deviation (SD) was calculated for IPE and NIPE. A 95% confidence interval (CI) for the median PCT was calculated for each group. A comparison of the median PCT between the IPE and NIPE was performed by calculating the SD difference and standard error difference. A 95% CI of the difference in medians was calculated. A P value was calculated using Mann‐Whitney U Test, and a P value of <0.05 was considered significant. The diagnostic performance of different cutoff values of PCT was evaluated using the area under the receiver operating characteristic curve (mean, 95% CI).
RESULTS
A total of 75 patients were included in the study. There were 73 (97.4%) males, with mean age of 70.8 years (range, 4293 years). There were 18 patients with IPE and 57 with NIPE.
Patient characteristics are detailed in Table 1. In the infectious group, 2 patients had empyema. There were no cases of tuberculosis. Of the 57 effusions in the noninfectious group there were 42 exudative effusions, 23 of which were malignant, 3 each were due to a trapped lung and pulmonary embolism. The remaining NIPEs were due to nonpulmonary processes such as chylothorax, liver disease, and renal disease.
| Infectious, n = 18 | Noninfectious, n = 57 | P Value | |
|---|---|---|---|
| |||
| Mean age, y | 73.1 | 70.1 | 0.349 |
| Male | 18 (100%) | 55 (96.6%) | 0.428 |
| Exudative effusion | 13 (72.2%) | 43 (74.1%) | 0.873 |
| Right side | 7 (38.9%) | 32 (55.2%) | 0.2268 |
| Effusion less than one‐third hemithorax | 11 (61.1%) | 28 (48.3%) | 0.3425 |
| Effusion one‐third to two‐thirds hemithorax | 6 (33.3%) | 20 (34.5%) | 0.9253 |
| Effusion greater then two‐thirds hemithorax | 1 (5.6%) | 9 (15.5%) | 0.2777 |
| Median PCT, ng/mL | 1.088 (0.3122.940) | 0.123 (0.050.263) | <0.0001* |
| Median LDH, IU/L | 178.5 (105.5346.25) | 135.5 (94255.2) | 0.629 |
| Median protein, mg/dL | 3.1 (2.33.2) | 3.7 (2.384.48) | 0.046* |
| Median pH | 7.37 (7.317.44) | 7.40 (7.367.44) | 0.111 |
| Median glucose, mg/dL | 126 (97169) | 106 (92135) | 0.226 |
| Median pleural WBC, cells/L | 778 (3237038) | 498 (2001380) | 0.154 |
| Median pleural neutrophils, cells/L | 542 (544743) | 54 (18192) | 0.005* |
The pleural fluid characteristics and biomarkers are detailed in Table 1. Median pleural fluid PCT in IPE was 1.088 ng/mL (0.3122.940 ng/mL) and 0.123 ng/mL (0.050.263 ng/mL) in NIPE, with a P value <0.0001. Pleural fluid PCT >0.25 ng/mL had a sensitivity of 77.78% and specificity of 74.14% for diagnosing an IPE (Figure 1).
A subgroup analysis comparing 13 exudative effusions in the infectious group with the 23 exudative malignant and paramalignant effusions in the noninfectious group was also performed. The median pleural PCT value in the infectious group was 0.9743 ng/mL (0.454.117 ng/mL) and 0.1222 ng/mL (0.054650.1972 ng/mL) in the noninfectious group, with a P value <0.0009
DISCUSSION
Clinicians frequently face the dilemma of differentiating IPE from NIPE. In this study, pleural fluid PCT was significantly elevated in IPE. A pleural fluid PCT >0.25 ng/mL had a sensitivity of 77.78% and specificity of 74.14% for diagnosing an IPE (Figure 1). Our subgroup analysis also showed a higher PCT in exudative effusions of the infectious group as compared to exudative effusions of malignant/paramalignant etiology in the noninfectious group. PCT may have a role as a biomarker in diagnosing an infected malignant/paramalignant effusion. Further studies are needed to confirm the same.
Our study is one of the few using the more sensitive technology (eg, Kryptor) to measure PCT levels in pleural fluid, utilizing the current method of choice for serum PCT based on assay performance.[2] PCT is produced during bacterial infections by several tissues sources, and its role in differentiating IPE and NIPE has been investigated by several authors. A prior study reported on 233 patients, 28 of whom had PPEs, 49 had tubercular effusion, and 166 had NIPE.[1] The cutoff point in this study of PCT was >0.145 ng/mL, with a sensitivity of 51.6% and specificity of 66.5%.[1] Another study evaluated 82 patients with pleural effusions, 45 of whom were infectious (bacterial, nontubercular) and used a PCT cutoff value of 0.18 ng/mL to discriminate between IPE and NIPE. They reported a sensitivity of 66.7% and specificity of 77.4%. There was no significant difference in the serum and pleural fluid PCT values within IPE and NIPE subgroups. In fact, there was a significant positive correlation between serum and pleural fluid PCT. However, on comparing evolution of pleural and serum PCT between day 1 and day 3, the authors noted that unlike pleural fluid PCT, serum PCT values were lower on day 3 as compared to day 1.[8] A study on 12 forensic autopsy cases, to establish the usefulness of pericardial and pleural fluids for the postmortem diagnosis of sepsis, also reported significantly higher and similar PCT levels in the sepsis group in both serum and pleural fluid (using an immunoassay by Roche Diagnostic, Mannheim, Germany). The authors suggested that pleural fluid PCT can be used in lieu of serum PCT values to determine the etiology of an effusion.[11]
PCT has a role in the decision to initiate or discontinue antibiotics in the management of community‐acquired pneumonia.[12] In this era of multidrug resistance, appropriate use of antibiotics is of paramount importance, and PCT could play an important role in this regard. The gold standard test to diagnose an infectious pleural effusion is present in a small percentage of patients.[13] Larger randomized studies designed to evaluate the role of serial serum and pleural fluid PCT, with appropriate cutoff values, are needed to define the role of PCT in guiding antibiotic therapy.[14]
The limitations of this study include its retrospective nature and lack of serum PCT data. The gold standard methods to diagnose pleural effusion were not available in this study.
CONCLUSION
PCT is a novel biomarker for diagnosing infectious pleural effusion, and it would be worthwhile to investigate the role of pleural PCT in assessing severity of illness, risk stratification, and antibiotic stewardship in hospitalized patients with pleural effusions.
Disclosure: Nothing to report.
- , , , et al. Procalcitonin, C‐reactive protein, and cell counts in the diagnosis of parapneumonic pleural effusions. J Investig Med. 2010;58:971–976.
- , , . Procalcitonin assay in systemic inflammation, infection, and sepsis: clinical utility and limitations. Crit Care Med. 2008;36:941–952.
- , , , , . Pneumonitis‐associated hyperprocalcitoninemia. Am J Med Sci. 1996;312:12–18.
- , , , et al. Bacterial complications of respiratory tract viral illness: a comprehensive evaluation. J Infect Dis. 2013;208:432–441.
- , , , et al. Procalcitonin guidance of antibiotic therapy in community‐acquired pneumonia: a randomized trial. Am J Respir Crit Care Med. 2006;174:84–93.
- , , , et al. Correlation of procalcitonin and cytokine expression with dehiscence of wartime extremity wounds. J Bone Joint Surg Am. 2008;90:580–588.
- , , , , . Salivary procalcitonin and periodontitis in diabetes. J Dent Res. 2008;87:630–634.
- , , , , . Diagnostic and prognostic values of pleural fluid procalcitonin in parapneumonic pleural effusions. Chest. 2009;136:205–211.
- , , , , , . Serum and pleural fluid procalcitonin in predicting bacterial infection in patients with parapneumonic effusion. J Korean Med Sci. 2009;24:398–402.
- , . Textbook of Pleural Diseases. 2nd ed. London, United Kingdom: Arnold Press; 2008.
- , . Usefulness of pericardial and pleural fluids for the postmortem diagnosis of sepsis. J Forensic Leg Med. 2014;28:15–18.
- , , , et al. Procalcitonin to initiate or discontinue antibiotics in acute respiratory tract infections. Evid Based Child Health. 2013;8:1297–1371.
- , , , , , . Routine use of pleural fluid cultures. Are they indicated? Limited yield, minimal impact on treatment decisions. Respir Med. 2006;100:2048–2052.
- , , , et al. Effect of procalcitonin‐guided treatment on antibiotic use and outcome in lower respiratory tract infections: cluster‐randomised, single‐blinded intervention trial. Lancet. 2004;363:600–607.
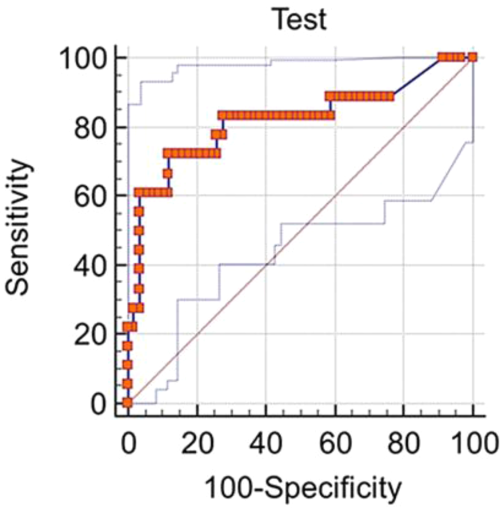
Acalabrutinib yields 95% overall response in relapsed CLL
Acalabrutinib, an oral drug that is a more specific Bruton tyrosine kinase (BTK) inhibitor related to ibrutinib, produced a high response rate and durable remissions at a median 14 months of follow-up in an uncontrolled phase I/II trial of 61 adults with relapsed chronic lymphocytic leukemia, according to a report published online Jan. 28 in the New England Journal of Medicine.
The study patients had received a median of three previous therapies for CLL; 31% had chromosome 17p13.1 deletions, and 75% had unmutated immunoglobulin heavy-chain variable genes.
At the analysis, one patient had died from pneumonia at 13 months and CLL had progressed at 16 months in another patient. The overall response rate among the 60 evaluable patients was 95%, with a partial response in 85% and a partial response with lymphocytosis in 10%. The rate of stable disease was 5%. Adverse events were mostly mild and self-limiting; eight patients (13%) discontinued treatment, said Dr. John C. Byrd of the division of hematology, Ohio State University, Columbus, and his associates.
All 18 patients with chromosome 17p13.1 deletions responded to acalabrutinib, with a partial response in 89% and a partial response with lymphocytosis in 11%. One patient with a chromosome 17p13.1 deletion had disease progression, and this patient had a C481S (major clone) mutation in BTK and an L845F (minor clone) mutation in PLCγ2.
No cases of Richter’s transformation occurred.
Patients were treated at six sites in the United States and the United Kingdom. Four different doses of oral acalabrutinib were used in the first phase of the study; the drug’s low toxicity permitted a twice-daily 100-mg dose in phase II of the study. Twice-daily dosing promoted continuous levels of drug binding to BTK, according to the researchers. It is hoped that this approach will decrease drug resistance and will perhaps lower the rate of transformation into large-cell lymphoma.
Among patients who had cytopenia at entry into the study, platelet count improved in 62%, hemoglobin levels improved in 76%, and absolute neutrophil count improved in 80%. Among patients who had B symptoms (weight loss, night sweats, and fever) at study entry, those symptoms resolved in 88% by the third cycle of treatment and in 100% by the ninth cycle, Dr. Byrd and his associates said (N Engl J Med. 2016 Jan 28. doi: 10.1056/NEJMoa1509981). The most common adverse events were headache (43% of patients), diarrhea (39%), weight gain (26%), pyrexia (23%), and upper respiratory tract infection (23%). Fewer than 2% of patients developed severe diarrhea, rash, arthralgia, myalgia, bruising, or bleeding.
These findings offered strong justification to further investigate the efficacy and safety of acalabrutinib for relapsed CLL, and a phase III trial is now underway, the investigators added.
FROM THE NEW ENGLAND JOURNAL OF MEDICINE
Key clinical point: Acalabrutinib, a more selective and therefore less-toxic relative of ibrutinib, produced a high response rate and durable remission in relapsed CLL.
Major finding: Acalabrutinib showed robust clinical activity, with an overall response rate of 95%, only one patient death, and only one case of CLL progression.
Data source: A multicenter phase I/II industry-sponsored clinical trial involving 61 patients followed for 14 months.
Disclosures: This trial was supported by Acerta Pharma, which was involved in study design and data analysis; it was also supported by the National Cancer Institute, the Leukemia and Lymphoma Society, the Four Winds Foundation, the Sullivan Chronic Lymphocytic Leukemia Research Fund, Mr. and Mrs. Michael Thomas, Al and Midge Lipkin, and the D. Warren Brown Foundation. Dr. Byrd reported receiving research grants from Acerta and serving as an unpaid consultant for Acerta, AbbVie, Genentech, Janssen, and Pharmacyclics; his associates reported ties to numerous industry sources.
Stop blaming ‘demons’ for bizarre delusions or behavior!
That expression is a residue of the absurd belief during the Middle Ages that mental illness is caused by evil spirits—that justified burning the afflicted person at the stake. (Remember Joan of Arc?)
This ignorant, even maliciously unscientific, portrayal of psychiatric symptoms is an appalling disservice to all our patients who struggle with a potentially disabling neuropsychiatric disorder. Regrettably, some religious entities still propagate the fallacy of possession by an evil spirit and call for exorcism of bizarre behaviors sometimes associated with psychosis.1 What is really needed is an exorcism of unscientific and harmful misconceptions that mental illness is the nefarious work of Beelzebub or Lucifer.
Strange manifestations beget weird explanations
I can understand how ignorance about the neurologic basis of unusual delusions and behavior can trigger absurd religious explanations for their cause. Sometimes, brain pathology can have strange clinical manifestations that are beyond the ken of the average layperson, which invites metaphysical, religious, or philosophical explanation. Here are examples of neuropsychiatric symptoms in the category of “very unusual” that might summon a demonic malfeasance.
Delusion of possession or alien control. Some people complain of being possessed2; delusional people who have a strong religious background might believe they are possessed by Satan himself. Some of my patients with psychotic depression believe this, expressing great guilt and anguish about being doomed to go to Hell.
Alternately, patients with schizophrenia often think they are under the control of an “alien force” that shapes their behavior, feelings, and thoughts (a Schneiderian first-rank symptom). In a 2012 editorial, I proposed that this “alien intruder” is the unintegrated right hemispheric consciousness,3 and that disintegration of the 200 million inter-hemispheric white matter fibers of the corpus callosum might be the cause of the loss of integration of the right hemisphere into the dominant left hemisphere.
Some people attribute external control on their lives to a government agency, a foreign country, or a spiteful neighbor; others believe it is the work of evil spirits. Whereas the foundation of the delusion is brain pathology, the content of the delusion is colored by the affected person’s cultural and religious background.
Apotemnophilia. A neurologic disorder that manifests in a bizarre clinical symptom that invites faulty explanation: A person demands amputation of a leg because “it doesn’t belong to my body.”4 The cause of this strange and confusing disorder has been misinterpreted as a paraphilia, a desire by the affected person to achieve greater sexual satisfaction by having a stump. It was first reported in the September/October 1972 issue of the magazine Penthouse, where it was described as the motivation to heighten one’s sexual appeal because stumps can be sexually exciting to their partners.
It took many years of neurologic research to demonstrate that apotemnophilia is caused by pathology in the parietal lobe, where the physical representation of the body is located. Incomplete neurodevelopment of the parietal lobe can cause a person to fail to recognize a leg as a “legitimate” part of his body, and he (she) then desperately seeks amputation of the so-called alien limb (see the description of xenomelia below) that is attached to his body.
When an affected person is asked to delineate the borders of an alien limb, he draws a line on the skin at the precise border between the alien limb and the rest of his body—where the amputation should take place. Requests for surgical amputation were adamantly denied when the disorder was thought to be a weird sexual practice, but elective amputation in the context of neuropsychopathology is seriously debated now—and has, in fact, been reported.5 The term “body impaired integrity disorder” has been proposed, but neurologists consider the disorder an example of xenomelia.
Xenomelia (‘alien limb syndrome’). An odd neurologic disorder produced by brain pathology, in which a person has a sense of estrangement about 1 or more limbs.5 The disorder can be caused by a neurologic lesion such as tumor, Creutzfeldt-Jakob disease, hereditary diffuse leukoencephalopathy, demyelinating disease, progressive dementia, corpus callosotomy, intracerebral hemorrhage, or thalamic degeneration.6
So-called “alien hand syndrome,” or asomatognosia, is a widely recognized example of xenomelia, and is associated with medial frontal lobe damage.
Another variant of xenomelia is somatoparaphrenia, unawareness of a part of one’s body.7
Cotard syndrome. A nihilistic delusion of the nonexistence or dissolution of a body part; in extreme form, the delusion of being dead or nonexistent.8 The syndrome sometimes occurs in the setting of severe depression. Research has shown an association with atrophy of the insula,9 which is responsible for internal proprioception (interoception).
Delusional misidentification syndrome. A set of neuropsychiatric conditions in which a person misidentifies people, places, objects, or events10:
- Capgras syndrome (one perceives a familiar person as an imposter)
- Fregoli syndrome (one perceives that a familiar person is repeatedly disguised to change appearance)
- intermetamorphosis (one perceives that a person changes his external appearance and personality or identity)
- lycanthropy (one delusionally misidentifies one’s self as an animal—eg, a wolf, rabbit, or snake, and behaves accordingly)
- Ekbom syndrome (delusional belief of being infested with parasites )
- delusion of hermaphroditism (one has merged in the same body with another person of the opposite sex)
- delusion of sexual transformation (one has changed to the opposite sex)
- delusion of being the Antichrist.
Delusional misidentification syndrome can develop after the onset of focal or diffuse brain pathology, such as right hemispheric stroke, multiple sclerosis, hyperparathyroidism, traumatic brain injury, dementia, and schizophrenia. In several studies, researchers have reported an increased risk of violence in delusional misidentification syndromes.11
Neurological, not diabolical!
A disruption in brain anatomy, neurodevelopment, or circuitry/interconnectivity can produce odd beliefs and bizarre behavior that might prompt a lay observer to believe that a demon or an evil spirt is responsible for the incomprehensible symptoms. I have one response to the “blame-the-devil” proponents: It’s the brain pathology, stupid!
1. Irmak MK. Schizophrenia or possession? J Relig Health. 2014;53(3):773-777.
2. Goff DC, Brotman AW, Kindlon D, et al. The delusion of possession in chronically psychotic patients. J Nerv Ment Dis. 1991;179(9):567-571.
3. Nasrallah HA. Impaired mental proprioception in schizophrenia. Current Psychiatry. 2012;11(8):4-5.
4. Brang D, McGeoch PD, Ramachandran VS. Apotemnophilia: a neurological disorder. Neuroreport. 2008;19(13):1305-1306.
5. McGeoch PD, Brang D, Song T, et al. Xenomelia: a new right parietal lobe syndrome. J Neurol Neurosurg Psychiatry. 2011;82(12):1314-1319.
6. Graff-Radford J, Rubin MN, Jones DT, et al. The alien limb phenomenon. J Neurol. 2013;260(7):1880-1888.
7. Feinberg TE, Venneri A, Simone AM, et al. The neuroanatomy of asomatognosia and somatoparaphrenia. J Neurol Neurosurg Psychiatry. 2010;81(3):276-281.
8. Ramirez-Bermudez J, Aguilar-Venegas LC, Crail- Melendez D, et al. Cotard syndrome in neurological and psychiatric patients. J Neuropsychiatry Clin Neurosci. 2010;22(4):409-416.
9. Chatterjee SS, Mitra S. “I do not exist”-Cotard syndrome in insular cortex atrophy. Biol Psychiatry. 2015;77(11):e52-e53.
10. Cipriani G, Vedovello M, Ulivi M, et al. Delusional misidentification syndromes and dementia: a border zone between neurology and psychiatry. Am J Alzheimers Dis Other Demen. 2013;28(7):671-678.
11. Klein CA, Hirachan S. The masks of identities: who’s who? Delusional misidentification syndromes. J Am Acad Psychiatry Law. 2014;42(3):369-378.
That expression is a residue of the absurd belief during the Middle Ages that mental illness is caused by evil spirits—that justified burning the afflicted person at the stake. (Remember Joan of Arc?)
This ignorant, even maliciously unscientific, portrayal of psychiatric symptoms is an appalling disservice to all our patients who struggle with a potentially disabling neuropsychiatric disorder. Regrettably, some religious entities still propagate the fallacy of possession by an evil spirit and call for exorcism of bizarre behaviors sometimes associated with psychosis.1 What is really needed is an exorcism of unscientific and harmful misconceptions that mental illness is the nefarious work of Beelzebub or Lucifer.
Strange manifestations beget weird explanations
I can understand how ignorance about the neurologic basis of unusual delusions and behavior can trigger absurd religious explanations for their cause. Sometimes, brain pathology can have strange clinical manifestations that are beyond the ken of the average layperson, which invites metaphysical, religious, or philosophical explanation. Here are examples of neuropsychiatric symptoms in the category of “very unusual” that might summon a demonic malfeasance.
Delusion of possession or alien control. Some people complain of being possessed2; delusional people who have a strong religious background might believe they are possessed by Satan himself. Some of my patients with psychotic depression believe this, expressing great guilt and anguish about being doomed to go to Hell.
Alternately, patients with schizophrenia often think they are under the control of an “alien force” that shapes their behavior, feelings, and thoughts (a Schneiderian first-rank symptom). In a 2012 editorial, I proposed that this “alien intruder” is the unintegrated right hemispheric consciousness,3 and that disintegration of the 200 million inter-hemispheric white matter fibers of the corpus callosum might be the cause of the loss of integration of the right hemisphere into the dominant left hemisphere.
Some people attribute external control on their lives to a government agency, a foreign country, or a spiteful neighbor; others believe it is the work of evil spirits. Whereas the foundation of the delusion is brain pathology, the content of the delusion is colored by the affected person’s cultural and religious background.
Apotemnophilia. A neurologic disorder that manifests in a bizarre clinical symptom that invites faulty explanation: A person demands amputation of a leg because “it doesn’t belong to my body.”4 The cause of this strange and confusing disorder has been misinterpreted as a paraphilia, a desire by the affected person to achieve greater sexual satisfaction by having a stump. It was first reported in the September/October 1972 issue of the magazine Penthouse, where it was described as the motivation to heighten one’s sexual appeal because stumps can be sexually exciting to their partners.
It took many years of neurologic research to demonstrate that apotemnophilia is caused by pathology in the parietal lobe, where the physical representation of the body is located. Incomplete neurodevelopment of the parietal lobe can cause a person to fail to recognize a leg as a “legitimate” part of his body, and he (she) then desperately seeks amputation of the so-called alien limb (see the description of xenomelia below) that is attached to his body.
When an affected person is asked to delineate the borders of an alien limb, he draws a line on the skin at the precise border between the alien limb and the rest of his body—where the amputation should take place. Requests for surgical amputation were adamantly denied when the disorder was thought to be a weird sexual practice, but elective amputation in the context of neuropsychopathology is seriously debated now—and has, in fact, been reported.5 The term “body impaired integrity disorder” has been proposed, but neurologists consider the disorder an example of xenomelia.
Xenomelia (‘alien limb syndrome’). An odd neurologic disorder produced by brain pathology, in which a person has a sense of estrangement about 1 or more limbs.5 The disorder can be caused by a neurologic lesion such as tumor, Creutzfeldt-Jakob disease, hereditary diffuse leukoencephalopathy, demyelinating disease, progressive dementia, corpus callosotomy, intracerebral hemorrhage, or thalamic degeneration.6
So-called “alien hand syndrome,” or asomatognosia, is a widely recognized example of xenomelia, and is associated with medial frontal lobe damage.
Another variant of xenomelia is somatoparaphrenia, unawareness of a part of one’s body.7
Cotard syndrome. A nihilistic delusion of the nonexistence or dissolution of a body part; in extreme form, the delusion of being dead or nonexistent.8 The syndrome sometimes occurs in the setting of severe depression. Research has shown an association with atrophy of the insula,9 which is responsible for internal proprioception (interoception).
Delusional misidentification syndrome. A set of neuropsychiatric conditions in which a person misidentifies people, places, objects, or events10:
- Capgras syndrome (one perceives a familiar person as an imposter)
- Fregoli syndrome (one perceives that a familiar person is repeatedly disguised to change appearance)
- intermetamorphosis (one perceives that a person changes his external appearance and personality or identity)
- lycanthropy (one delusionally misidentifies one’s self as an animal—eg, a wolf, rabbit, or snake, and behaves accordingly)
- Ekbom syndrome (delusional belief of being infested with parasites )
- delusion of hermaphroditism (one has merged in the same body with another person of the opposite sex)
- delusion of sexual transformation (one has changed to the opposite sex)
- delusion of being the Antichrist.
Delusional misidentification syndrome can develop after the onset of focal or diffuse brain pathology, such as right hemispheric stroke, multiple sclerosis, hyperparathyroidism, traumatic brain injury, dementia, and schizophrenia. In several studies, researchers have reported an increased risk of violence in delusional misidentification syndromes.11
Neurological, not diabolical!
A disruption in brain anatomy, neurodevelopment, or circuitry/interconnectivity can produce odd beliefs and bizarre behavior that might prompt a lay observer to believe that a demon or an evil spirt is responsible for the incomprehensible symptoms. I have one response to the “blame-the-devil” proponents: It’s the brain pathology, stupid!
1. Irmak MK. Schizophrenia or possession? J Relig Health. 2014;53(3):773-777.
2. Goff DC, Brotman AW, Kindlon D, et al. The delusion of possession in chronically psychotic patients. J Nerv Ment Dis. 1991;179(9):567-571.
3. Nasrallah HA. Impaired mental proprioception in schizophrenia. Current Psychiatry. 2012;11(8):4-5.
4. Brang D, McGeoch PD, Ramachandran VS. Apotemnophilia: a neurological disorder. Neuroreport. 2008;19(13):1305-1306.
5. McGeoch PD, Brang D, Song T, et al. Xenomelia: a new right parietal lobe syndrome. J Neurol Neurosurg Psychiatry. 2011;82(12):1314-1319.
6. Graff-Radford J, Rubin MN, Jones DT, et al. The alien limb phenomenon. J Neurol. 2013;260(7):1880-1888.
7. Feinberg TE, Venneri A, Simone AM, et al. The neuroanatomy of asomatognosia and somatoparaphrenia. J Neurol Neurosurg Psychiatry. 2010;81(3):276-281.
8. Ramirez-Bermudez J, Aguilar-Venegas LC, Crail- Melendez D, et al. Cotard syndrome in neurological and psychiatric patients. J Neuropsychiatry Clin Neurosci. 2010;22(4):409-416.
9. Chatterjee SS, Mitra S. “I do not exist”-Cotard syndrome in insular cortex atrophy. Biol Psychiatry. 2015;77(11):e52-e53.
10. Cipriani G, Vedovello M, Ulivi M, et al. Delusional misidentification syndromes and dementia: a border zone between neurology and psychiatry. Am J Alzheimers Dis Other Demen. 2013;28(7):671-678.
11. Klein CA, Hirachan S. The masks of identities: who’s who? Delusional misidentification syndromes. J Am Acad Psychiatry Law. 2014;42(3):369-378.