User login
FDA approves product for hemophilia A

The US Food and Drug Administration (FDA) has approved the recombinant factor VIII product simoctocog alfa (Nuwiq) for adults and children with hemophilia A.
The approval includes on-demand treatment and control of bleeding episodes, routine prophylaxis to reduce the frequency of bleeding episodes, and perioperative management of bleeding.
Simoctocog alfa is the first B-domain-deleted recombinant factor VIII product derived from a human cell line—not chemically modified or fused with another protein—designed to treat hemophilia A.
Simoctocog alfa is already approved for use in the European Union, Argentina, Australia, and Canada.
In the US, simoctocog alfa is being developed by Octapharma USA, a subsidiary of Octapharma AG.
According to Octapharma USA, simoctocog alfa should be available in the US by early 2016. The company plans to offer hemophilia A patients educational and support services in connection with the product.
Trials of simoctocog alfa
Simoctocog alfa has been evaluated for safety in 5 prospective trials and for efficacy in 3 prospective studies.
A total of 135 previously treated patients with severe hemophilia A have received simoctocog alfa across all the studies. This includes 74 adults, 3 adolescents between ages 12 and 17, and 58 pediatric patients between ages 2 and 11.
The patients were treated with a total of 16,134 infusions over 15,950 exposure days.
In a study of adults, the overall prophylactic efficacy of simoctocog alfa for spontaneous bleeds was rated “excellent” or “good” in 92% of patients. In a study of children, prophylactic efficacy for spontaneous bleeds was rated “excellent” or “good” in 97% of patients.
The mean annualized bleeding rates for spontaneous bleeds during prophylaxis were approximately 1.5 in children and 1.2 in adults.
For hemophilia A patients receiving simoctocog alfa prophylaxis compared to on-demand treatment, the annualized bleeding rates were reduced 96% for adults and 93% for children.
Treatment of breakthrough bleeds during simoctocog alfa prophylaxis was rated as “excellent” or “good” in 100% of bleeds (30/30) in adults and 82% of bleeds (89/108) in children.
For on-demand treatment with simoctocog alfa in 20 adults and 2 adolescents, efficacy for the treatment of bleeds was considered “excellent” or “good” in 94% of bleeds (931/986).
The overall efficacy in surgical prophylaxis was rated “excellent” or “good” in 97% of procedures using simoctocog alfa (32/33).
For all the trials of simoctocog alfa, there were 7 adverse events reported. Each of these events occurred once, with a rate of 0.7% across all 135 patients. The events were paresthesia, headache, injection site inflammation, injection site pain, back pain, vertigo, and dry mouth.
Non-neutralizing anti-factor VIII antibodies (without inhibitory activity as measured by the modified Bethesda assay) were reported in 4 patients (3%). Three of the 4 patients had pre-existing non-neutralizing antibodies prior to simoctocog alfa exposure.
For more details on simoctocog alfa, see the full prescribing information, available at www.octapharmausa.com. ![]()
Acne and Melanoma: What to Do With the Reported Connection?
Dermatologists have become accustomed to reading about the associations of dermatologic disease with extracutaneous comorbidities (psoriasis certainly takes the lead). One may see the headline “Study finds increased risk for melanoma in female acne patients” and say “Sure, why not?” However, before we all jump on the association bandwagon, let’s better appreciate this finding.
A study published online January 8 in Cancer by Zhang et al followed 99,128 female nurses in the Nurses’ Health Study II cohort for 20 years. This cohort has been utilized for numerous prospective studies over the year. Even after adjusting for known risk factors, investigators discovered that women with a history of severe cystic teenage acne had a hazard ratio of 1.44 for melanoma. The authors replicated the association with an independent melanoma case-control study of 930 cases and 1026 controls, finding an odds ratio of 1.27. They also found that individuals with teenage acne were more likely to have nevi (52.7% vs 50.1% in the cohort study; 55.2% vs 45.1% in the control study).
These data points ultimately led the team to conclude that acne may serve as an independent risk factor for melanoma, attributing androgens in female acne as a possible and plausible explanation due to their known effect on telomere elongation; melanocytes with longer telomere lengths have more opportunity to develop mutations, which could lead to malignant transformation, as the extended length ultimately delays initiation of cellular senescence. The longer these cells are “awake,” more moles can form, which means more room for trouble.
What’s the issue?
The size of this cohort certainly gives credibility to the data and statistics presented. Although the study is powered very well by the numbers, it is a unique cohort because all participants were nurses, narrowing down the demographics to some degree given general patterns, behaviors, and backgrounds when it comes to this group, an issue that has been previously raised with using this cohort. That said, more research is certainly warranted to elucidate the proposed mechanism and further clarify the association.
From a purely clinical standpoint, this paper is powerful ammo that can be used in our war against skin cancer. This very large cohort probably does not follow the American Academy of Dermatology guidelines for sun protection, skin cancer prevention, and surveillance. It could be a nice tidbit for patients at the end of your spiel on acne and then work in the photoprotection discussion, something we haven’t been the best at according to a recent study published in JAMA Dermatology (JAMA Dermatol. 2014;150:51-55)! Would it be such a bad thing if this paper helped us encourage all women with moderate to severe acne to undertake more effective sun-safe behaviors and to visit their dermatologist every year for total-body skin examinations?

Coating on Endovascular Devices Could Cause Stroke or Death
NEW YORK - Coating on endovascular devices is associated with embolization and microvascular occlusion leading to purpura or livedo racemosa, according to a new report.
Dr. Alina Bridges, of the Department of Dermatology at Mayo Clinic in Rochester, Minnesota, said by email that the study was conducted "to make clinicians and pathologists aware of this underrecognized phenomenon of iatrogenic hydrophilic polymer gel embolization that can involve the skin and present with purpura."
The phenomenon "has distinctive microscopic morphology and potential for internal organ involvement," she added.
Endovascular devices commonly are coated with hydrophilic polymer gels to improve maneuverability and prevent vasospasm. However, there are reports of the coating embolizing, resulting
in severe reactions such as stroke, pulmonary infarction, and death.
Dr. Bridges and colleagues presented a case study of eight patients with livedo racemosa and purpura after an endovascular procedure. The patients had punch biopsies obtained with hematoxylin-eosin-stained sections.
The study subjects were between 58 and 81 years old, most were men and most had previous endovascular procedures and multiple comorbidities, according to an article online August 11 in the Journal of the American Academy of Dermatology.
In all but one patient, the cutaneous lesions were unilateral and all but two were asymptomatic. Six patients presented with livedo racemosa and two with purpura.
All cases demonstrated pauci-inflammatory occlusion in the mid-dermal and small superficial vessels. Likewise, histopathologic evidence was consistent with previously reported cases of emboli secondary to hydrophilic gel polymer.
There was no evidence of embolic sequela to the organs in three patients. However, one patient died of unknown reasons and four patients experienced postoperative complications including spinal cord ischemia, acute kidney injury, and cerebral infarction. In all cases, the cutaneous manifestations resolved without intervention.
The authors say they suspect the incidence of this type of embolization is underrecognized, especially with the common use of hydrophilic polymer gel coatings.
"This report highlights the importance of awareness of this rare iatrogenic complication and the importance of investigating a patient's clinical history to determine if there had been recent exposure to an intravascular device with a hydrophilic coating," Dr. Bridges said.
"While the use of polymer-coated devices offers several advantages, clinicians must be aware of their potential complications, including stroke, myocardial and pulmonary infarction, gangrene, and/or death," she said.
The authors reported no funding or conflicts of interest.
Sunscreens with DNA repair enzymes might lessen AK progression
Patients with actinic keratosis who used UPF 50 sunscreen containing DNA repair enzymes improved significantly more on two measures of malignant progression than did those who used sunscreen alone, according to research published in the Journal of Drugs in Dermatology.
At 6 months, improvements in field cancerization and levels of cyclobutane pyrimidine dimers were significantly greater (P less than .001) for the sunscreen-plus-enzymes group compared with sunscreen-only patients, wrote Dr. Mauro Carducci of Centro Ortopedico di Quadrante in Omegna, Italy, and his associates.
The study is the first of its type to directly compare the clinical effects of two such topicals, the investigators wrote. The findings set the stage for longer, larger trials that are powered to assess the risk of progression to squamous cell carcinoma, they added.

For the study, 28 patients with AK were randomly assigned to use SPF 50 sunscreen alone or a formula that contained 1% photolyase from Anacystis nidulans and 1% endonuclease from Micrococcus luteus. Patients applied 2 mg/cm2 of sunscreen to treatment areas that contained 4-10 AKs. They were not allowed to use other topicals during the trial or for 2 weeks beforehand.
All of the patients were white and aged older than 65 years; three-quarters were men. The investigators used fluorescence diagnostics with methylaminolaevulinate to measure field cancerization, and analyzed skin biopsies to quantify CPD levels (J Drugs Dermatol. 2015;14[9]:986-90.).
Hyperkeratosis improved the same amount in both groups at month 6, according to the researchers. But field cancerizations dropped 29% from baseline in the sunscreen-plus-enzymes group, compared with a 10% decrease with sunscreen alone (P less than .0001). Likewise, CPD levels fell 61% from baseline in the sunscreen-plus-enzymes group compared with a 35% drop with sunscreen alone (P less than .0001).
Despite those significant differences, the study was not powered to detect differences in the risk of transformation to SCC, the researchers cautioned.
Biodue S.p.A. provided the methyl aminolevulinate used in the study. Dr. Enzo Emanuele, the study’s senior author, is a major shareholder of Living Research S.A.S., a privately held biomedical research organization that provided funding for the work. The other researchers reported no conflicts of interest.
Patients with actinic keratosis who used UPF 50 sunscreen containing DNA repair enzymes improved significantly more on two measures of malignant progression than did those who used sunscreen alone, according to research published in the Journal of Drugs in Dermatology.
At 6 months, improvements in field cancerization and levels of cyclobutane pyrimidine dimers were significantly greater (P less than .001) for the sunscreen-plus-enzymes group compared with sunscreen-only patients, wrote Dr. Mauro Carducci of Centro Ortopedico di Quadrante in Omegna, Italy, and his associates.
The study is the first of its type to directly compare the clinical effects of two such topicals, the investigators wrote. The findings set the stage for longer, larger trials that are powered to assess the risk of progression to squamous cell carcinoma, they added.
For the study, 28 patients with AK were randomly assigned to use SPF 50 sunscreen alone or a formula that contained 1% photolyase from Anacystis nidulans and 1% endonuclease from Micrococcus luteus. Patients applied 2 mg/cm2 of sunscreen to treatment areas that contained 4-10 AKs. They were not allowed to use other topicals during the trial or for 2 weeks beforehand.
All of the patients were white and aged older than 65 years; three-quarters were men. The investigators used fluorescence diagnostics with methylaminolaevulinate to measure field cancerization, and analyzed skin biopsies to quantify CPD levels (J Drugs Dermatol. 2015;14[9]:986-90.).
Hyperkeratosis improved the same amount in both groups at month 6, according to the researchers. But field cancerizations dropped 29% from baseline in the sunscreen-plus-enzymes group, compared with a 10% decrease with sunscreen alone (P less than .0001). Likewise, CPD levels fell 61% from baseline in the sunscreen-plus-enzymes group compared with a 35% drop with sunscreen alone (P less than .0001).
Despite those significant differences, the study was not powered to detect differences in the risk of transformation to SCC, the researchers cautioned.
Biodue S.p.A. provided the methyl aminolevulinate used in the study. Dr. Enzo Emanuele, the study’s senior author, is a major shareholder of Living Research S.A.S., a privately held biomedical research organization that provided funding for the work. The other researchers reported no conflicts of interest.
FROM THE JOURNAL OF DRUGS IN DERMATOLOGY
Key clinical point:Sunscreen containing DNA repair enzymes might prevent malignant progression of actinic keratosis better than sunscreen alone.
Major finding: Field cancerization and cyclobutane pyrimidine dimer levels improved significantly more with sunscreen plus enzymes than with sunscreen only (P less than .0001 for each).
Data source: Six-month randomized trial of 28 patients with actinic keratosis.
Disclosures: Biodue S.p.A. provided the methyl aminolevulinate used in the study. Dr. Enzo Emanuele, the study’s senior author, is a major shareholder of Living Research S.A.S., a privately held biomedical research organization that provided funding for the work. The other researchers reported no conflicts of interest.

Studies help explain resistance to BET inhibitors

Image by Robert Paulson
Two groups of researchers have reported results that help explain how leukemia resists treatment with BET inhibitors.
One group was able to grow and maintain leukemia stem cells (LSCs) in vitro, and their subsequent experiments showed how LSCs react to BET inhibition.
The other group found evidence to suggest that by measuring Wnt signaling markers, we might be able to predict which patients will respond to BET inhibition.
Both groups described their research in letters to Nature.
“[T]he risk of resistance developing is common in any cancer treatment,” said Mark Dawson, PhD, a researcher at Peter MacCallum Cancer Centre in East Melbourne, Victoria, Australia and an author of the LSC study.
“Knowing precisely how that happens in advance puts us one step ahead in outmaneuvering the disease. Being able to grow and maintain leukemia
stem cells in vitro also gives us unprecedented access and insight into how they work so we can find new and better ways to target and destroy them.”
In their study, Dr Dawson and his colleagues assessed BET inhibitor resistance in a model of acute myeloid leukemia.
The team transduced murine hematopoietic stem and progenitor cells with MLL–AF9 and treated the cells with the BET inhibitor I-BET or dimethylsulfoxide (vehicle). They then isolated individual blast colonies to generate 4 vehicle-treated and 5 I-BET-resistant cell lines.
The researchers found that resistance to I-BET also conferred resistance to the chemically distinct BET inhibitor JQ1 and to genetic knockdown of BET proteins.
Further investigation revealed that resistance to BET inhibitors emerges from LSCs, both ex vivo and in vivo. And that resistance is, in part, a result of increased Wnt/β-catenin signaling.
The researchers noted that not all LSCs are intrinsically resistant to BET inhibition, but a small proportion of them are either transcriptionally primed or display rapid transcriptional plasticity to survive the initial BET inhibitor challenge. The team said these cells then thrive and become the dominant population.
These findings are consistent with results of the other study, conducted by Johannes Zuber, MD, of the Research Institute of Molecular Pathology in Vienna, Austria, and his colleagues.
With this study, the researchers set out to determine why only certain leukemia subtypes are sensitive to BET inhibitors. Their experiments revealed that loss of the PRC2 complex, which is known to inactivate genes during normal development, can render leukemia cells resistant to BET inhibitors.
By further characterizing these resistant cells, the team found that MYC and other BRD4-regulated genes (which are turned off by BET inhibitors) were back on again. So the leukemia cells had found a way to activate these genes in the absence of BRD4.
The researchers then compared leukemia cells that had acquired resistance during BET inhibitor treatment to leukemia cells that were resistant in the first place.
In both cases, the cells used similar pathways to turn critical genes such as MYC back on and thereby escape the effects of BET inhibition. A pathway that proved particularly important was the Wnt signaling pathway, which is known to activate MYC in cancers.
To determine whether this knowledge could be used to predict which patients will respond to BET inhibitors, the researchers measured Wnt signaling markers in samples from leukemia patients.
The team found that cells with low Wnt activity were sensitive to BET inhibitors, while high Wnt activity was associated with resistance.
Specifically, the researchers quantified 9 Wnt-associated transcripts in sensitive and resistant samples. Three of these transcripts—TCF4, CCND2, and HOXB4—were significantly overexpressed in resistant samples.
So the team used these 3 transcripts to establish a “resistance index” that, they believe, may provide a first step toward developing a predictive biomarker.
The researchers said, collectively, their study reveals that leukemia cells can become resistant to BET inhibitors by rewiring the regulation of critical BRD4 target genes. This transcriptional plasticity highlights an emerging mode of drug resistance that is distinct from established resistance mechanisms such as mutations in binding pockets or drug elimination through efflux pumps.
Dr Zuber and his colleagues believe that a better understanding of these adaptation mechanisms will lead to combination therapies that will ultimately “outsmart” cancer cells.
“We now have learned that cancer cells can adapt to targeted therapies, but their repertoire of escape routes is quite limited,” Dr Zuber said. “A better understanding of the common escape routes will allow us to predict the next effective targeted therapy so that we are always one step ahead of the cancer cell.” ![]()
Plant-derived compound shows activity against NHL

The active compound in a plant extract has shown promise for treating non-Hodgkin lymphomas (NHLs), according to researchers.
The compound, withaferin A, is a steroidal lactone isolated from the Ayruvedic medicinal plant Ashwagandha (Withania somnifera).
Withaferin A has previously exhibited activity against a range of solid tumor malignancies, but its effects in NHLs and other hematologic malignancies have not been well-studied.
So Subbarao Bondada, PhD, of the University of Kentucky in Lexington, and his colleagues tested withaferin A in NHLs and reported their results in Cancer Biology and Therapy.
Withaferin A exhibited activity in several human B-cell lymphoma cell lines—the diffuse large B-cell lymphoma (DLBCL) cell lines LY-3, LY-10, and SudHL-6; the Burkitt lymphoma cell lines Raji and Ramos; and the mantle cell lymphoma cell line MINO.
Ramos was the most sensitive to withaferin A, and the mantle cell lymphoma cell line JEKO was the most resistant. The researchers said they are still investigating this resistance.
Withaferin A also inhibited the growth of the murine immature B-cell lymphoma cell line BKS-2 and the germinal center lymphoma cell line A20-Luc/YFP.
Further investigation revealed that withaferin A induces cell-cycle arrest, prompts apoptosis, inhibits NF-kB nuclear translocation, and reduces the expression of pro-survival signals in B-cell lymphomas.
The researchers also found evidence to suggest that withaferin A inhibits the activity of Hsp90. Although Hsp90 levels were unaltered in withaferin-A-treated lymphoma cells, the team observed a “robust” increase in Hsp70 expression levels (which suggests a decrease in Hsp90 function).
Finally, the researchers tested withaferin A in mice injected with the murine DLBCL line A20-Luc. The treatment proved active against A20-Luc cells but did not affect other proliferating cells.
Mice treated with withaferin A had a significant reduction in tumor size, compared to placebo-treated mice, on days 10 and 13 (P<0.05).
Based on these results, the researchers concluded that withaferin A may hold promise for treating NHL, particularly DLBCL.
“It may be possible to develop orally administered versions of withaferin A that could be used in lymphoma patients with fewer side effects than current chemotherapy regimens,” Dr Bondada said.
He and his colleagues are now testing withaferin A in chronic lymphocytic leukemia. ![]()
Tool can guide allocation of research resources

Photo by Bill Branson
Scientists say they have developed a tool that can guide the allocation of resources for biomedical research in an unbiased way.
The tool, called the Research Opportunity Index (ROI), measures disparities between resources dedicated to a disease and its relative burden on society.
This reveals diseases that receive a disproportionate share of resources and opportunities for high-impact investment or the realignment of existing resources.
The ROI was designed to provide an unbiased, data-driven framework to help scientific and political communities assess resource investment and identify unmet medical needs.
The tool is described in a letter to Nature Biotechnology.
“The misalignment of resources in biomedical research could be likened to poor budgeting of household finances,” said Andrey Rzhetsky, PhD, of the University of Chicago in Illinois.
“It would be bad to spend all your money on food, for example, and have nothing for rent. Resources are finite, and attention to each problem, ideally, should be proportional to the need.”
With this in mind, Dr Rzhetsky and his colleagues created the ROI. They used it to estimate the societal burden of 1400 medical conditions in the US over a 12-year timespan, based on frequency of diagnosis and healthcare insurance costs, as well as research publications, awarded grants, and clinical trials for each condition.
The tool revealed misalignments, which allowed the scientists to create an “investment portfolio” of the resources dedicated to each disease, relative to its burden on the US healthcare system.
The team found that breast cancer, for example, stands out as a disease with higher dedicated resources than its relative societal burden. On the opposite end of the spectrum, Hashimoto’s thyroiditis is among the conditions with the most investment potential.
While Hashimoto’s disease has nearly the same incidence among women as breast cancer, there were only 16 open clinical trials for Hashimoto’s disease as of August 2015, according to a list on clinicaltrials.gov. Breast cancer had 2205 open trials.
Dr Rzhetsky and his colleagues acknowledge that the question of what makes a condition more deserving of funding than any other ailment is complex and multifaceted. But the team hopes this new tool can aid decisions on how best to allocate funds and other resources.
By providing a framework based on unbiased quantitative analytics and big data, they hope to identify diseases that are high-impact and rewarding targets for additional investment.
“Some diseases stick in the public’s attention,” Dr Rzhetsky said. “We have a distorted map of the frequency and importance of events from media and articles, and, without special efforts to reconcile the reality, we are inherently biased.”
The team is now working to incorporate other models of funding distribution into their tool to account for additional variables.
For example, the “trendy model,” which supports investment for diseases with large emotional impact, suggests that even though this reduces funding for other diseases, there may still be benefits as basic science discoveries are added to the scientific and medical community. ![]()
Wabi-sabi
Recently, I was amazed to see a small walk-in booth with a webcam, a monitor, and a curtain, offering telemedicine consults from the comfort of a service station on I-95. Pandora’s Box, I thought.
The robots are coming! Take a dip into popular science fiction if you don’t believe me. From Asimov to “Star Wars,” there are innumerable examples of aseptic, polite automatons providing prompt, unbiased, unfatigued medical care. People have always been enamored by such visions of the future. And booths like this are the gateway to that vision. As excited as I am about this tremendous advance and the potential it holds, I can’t help but feel that when this new frontier of medicine reaches fruition, we will have lost something, too.

Medical education is exacting, exciting, and at times, excruciating. But above all, the privileged experience of learning about the inner workings of the body is an innately human process. Looking back, it’s not syndromes, numbers, or dosages I remember, but the colorful spectrum of characters I encountered along the way. We’ve all met them – the funny, the quirky, the warm, the gentle, the stern, the phlegmatic, the intermittently explosive, the socially inept, the obliviously savant, and occasionally, the frankly sociopathic. They are the ones who teach us how the science of medicine connects with the art of healing. Our bedside manners and critical thinking processes are molded by the intercourse between the different types of personalities we encounter in our education.
Until the first Medibot 3000 is rolled out, doctors will be flawed, biased, and stressed humans. We deal with the same roller coaster journey through life as do our patients, but we accept a responsibility to be the caretakers of their health. Perhaps we do so not in spite of our faults, but all the better because of them. The human experience provides us with empathy. It ingrains within us unique insights and perspectives. It allows us to read between the lines of a patient’s statements. It pushes us to go beyond protocols when we need to, and it helps us create the trust that is the heart of the doctor-patient relationship.
Kintsugi is the Japanese art of fixing cracks along broken pottery with rare metals, thus creating unique and beautiful patterns which accentuate the character of the pot. It is part of a philosophy called wabi-sabi, which is all about embracing imperfection. I think they’re on to something there.
Patients are not vignettes. There is no peer-reviewed algorithm for being a good doctor. Not to say that these things are not important. They are crucial tools in our endeavor to improve our medical skills and knowledge – the bedrock upon which a career in medicine must be founded. But I hope that in our quest to improve outcomes, to remove suffering, and move toward the beckoning future, we still will have a place in medicine for human characteristics that define the act of healing, and for the philosophy of wabi-sabi. Bring the robots on, I say.
Dr. Behere was a pediatric resident at the Children’s Hospital at Dartmouth, Lebanon, New Hampshire, when he wrote this article. He is currently a first-year fellow in pediatric cardiology at the Nemours Cardiac Center at the Nemours/Alfred I. duPont Hospital for Children, Wilmington, Del. E-mail him at pdnews@frontlinemedcom.com.
Recently, I was amazed to see a small walk-in booth with a webcam, a monitor, and a curtain, offering telemedicine consults from the comfort of a service station on I-95. Pandora’s Box, I thought.
The robots are coming! Take a dip into popular science fiction if you don’t believe me. From Asimov to “Star Wars,” there are innumerable examples of aseptic, polite automatons providing prompt, unbiased, unfatigued medical care. People have always been enamored by such visions of the future. And booths like this are the gateway to that vision. As excited as I am about this tremendous advance and the potential it holds, I can’t help but feel that when this new frontier of medicine reaches fruition, we will have lost something, too.
Medical education is exacting, exciting, and at times, excruciating. But above all, the privileged experience of learning about the inner workings of the body is an innately human process. Looking back, it’s not syndromes, numbers, or dosages I remember, but the colorful spectrum of characters I encountered along the way. We’ve all met them – the funny, the quirky, the warm, the gentle, the stern, the phlegmatic, the intermittently explosive, the socially inept, the obliviously savant, and occasionally, the frankly sociopathic. They are the ones who teach us how the science of medicine connects with the art of healing. Our bedside manners and critical thinking processes are molded by the intercourse between the different types of personalities we encounter in our education.
Until the first Medibot 3000 is rolled out, doctors will be flawed, biased, and stressed humans. We deal with the same roller coaster journey through life as do our patients, but we accept a responsibility to be the caretakers of their health. Perhaps we do so not in spite of our faults, but all the better because of them. The human experience provides us with empathy. It ingrains within us unique insights and perspectives. It allows us to read between the lines of a patient’s statements. It pushes us to go beyond protocols when we need to, and it helps us create the trust that is the heart of the doctor-patient relationship.
Kintsugi is the Japanese art of fixing cracks along broken pottery with rare metals, thus creating unique and beautiful patterns which accentuate the character of the pot. It is part of a philosophy called wabi-sabi, which is all about embracing imperfection. I think they’re on to something there.
Patients are not vignettes. There is no peer-reviewed algorithm for being a good doctor. Not to say that these things are not important. They are crucial tools in our endeavor to improve our medical skills and knowledge – the bedrock upon which a career in medicine must be founded. But I hope that in our quest to improve outcomes, to remove suffering, and move toward the beckoning future, we still will have a place in medicine for human characteristics that define the act of healing, and for the philosophy of wabi-sabi. Bring the robots on, I say.
Dr. Behere was a pediatric resident at the Children’s Hospital at Dartmouth, Lebanon, New Hampshire, when he wrote this article. He is currently a first-year fellow in pediatric cardiology at the Nemours Cardiac Center at the Nemours/Alfred I. duPont Hospital for Children, Wilmington, Del. E-mail him at pdnews@frontlinemedcom.com.

Ultrabrief Cognitive Screening Outcomes
Hospitalization is a critical time for older patients with cognitive impairment. Past research has found that hospitalized older adults with cognitive dysfunction have more rapid cognitive decline, increased morbidity and mortality, and higher costs of healthcare utilization.[1, 2, 3] Those with preexisting cognitive dysfunction, such as dementia, are most susceptible to the negative impacts of hospitalization.[4, 5, 6, 7, 8] Identification of cognitive deficits upon admission is important for risk stratification of patients and prevention of negative hospital health events.
Frontline healthcare providers are underequipped to detect acute cognitive dysfunction.[9, 10] Current practice and research for the detection of cognitive dysfunction in the acute care setting utilizes instruments that require training[11] and are relatively lengthy (>5 minutes).[12] Although these cognitive screening tests are accurate and reliable, the time requirement is not feasible in a fast‐paced clinical setting. A possible alternative is the use of ultra‐brief cognitive screening instruments (<1 minute) that have the potential to identify those individuals requiring additional evaluation and follow‐up. These brief instruments are composed of screening tools that emphasize core features of acute cognitive dysfunction such as level of arousal or attention.[13, 14, 15, 16] Arousal, the ability to respond to or interact with the environment,[15] is an important component of cognition because it is generally preserved in chronic cognitive disorders (eg, dementia). Thus, an alteration in arousal may be a harbinger of more acute impairment[17] in need of evaluation, and in these lowered states of arousal it may be difficult to test for attention.[18] Attention is a broadly defined cognitive domain indicating focus.[19] Older adults, regardless of preexisting cognitive dysfunction, warrant additional cognitive testing if levels of arousal or attention are altered[20, 21] due to the significant relationship to delirium, which is associated with adverse events in this population. Recent research has demonstrated that these brief cognitive screening instruments provide information about the risk for delirium and are a strong test for clinical characteristics of delirium.[16, 21]
The purpose of this analysis was to demonstrate the clinical outcomes of poor performance on ultrabrief assessments arousal and attention by frontline staff using a quality improvement database. Specific objectives include determining (1) the association of poor performance on brief cognitive assessments and hospital outcomes and (2) the inter‐relationship between alterations in the levels of arousal and attention on in‐hospital and discharge outcomes.
METHODS
Setting and Study Design
This is a secondary analysis of data collected from a quality improvement program for delirium risk modification.[22] This program collected data from October 2010 until September 2012 at a Veterans Affairs (VA) tertiary referral center for the New England region. Patients aged 60 years or older and admitted to medical wards were screened upon admission or transfer to VA Boston Healthcare System and provided appropriate interventions to modify delirium risk. Excluded were individuals admitted as observational status, or those readmitted within 30 days of initial screening, and those screened more than 72 hours after admission. Age and sex were abstracted from the medical record. Outcome data were collected from the medical record for the purpose of operating and sustaining the program. In a previous article, the length of stay (LOS) outcome was reported in a subset of this population.[23] The analysis presented here includes the full cohort, presents the interaction with month of the year backward (MOYB), and provides additional outcomes not included in the other article. The VA institutional review board (IRB) reviewed and approved the secondary data analysis of the quality improvement project.
Measures
Brief Cognitive Screening
The baseline assessments of levels of arousal and attention were collected within 72 hours of admission to identify delirium risk. Trained study staff, not involved in the clinical care of patients, administered these assessments as part of the quality improvement project. It is estimated that these assessments took less than 1 minute to complete per individual, but actual administration time was not measured. Assessments were documented within the electronic health record as part of a delirium risk stratification system.
Arousal
The arousal level assessment was the modified Richmond Agitation and Sedation Scale (mRASS). The mRASS is a brief, reliable, observational tool used to determine arousal level.[15, 17] It is a text modification of the RASS[17] for less acutely ill patients, capturing hyperactive and hypoactive altered levels of arousal. The mRASS asks an open‐ended question followed by observation for 10 seconds and completion of a 5 to+4 rating scale. Alert and calm (score=0) is considered normal, with positive numbers related to an increased level of arousal and attention, whereas negative numbers denote decreased levels. For the analyses, an mRASS of 0 is utilized as the reference. Categories were collapsed into 2 and 2 due to few patients on the extremes of the mRASS.
Attention
The MOYB is a brief measure of attention that is included in several instruments for delirium.[19, 24, 25] For this study, the patient was asked to recite the 12 months backward beginning with December. A correct score was given if the individual was able to recite all 12 months to January without any error. An incorrect score was given if any mistake was made. Scoring for the MOYB is not standardized by age, preexisting medical diagnosis, or any other rational.[26] Others have used July or June as a cutoff for a correct score on the MOYB,[21, 25] but a more conservative score of correct to January was used in this study, which has been previously used.[26, 27, 28, 29, 30] A score of not completed was given when the patient was unable to participate or declined to complete the assessment. For the analysis, a correct score on the MOYB is the referent group.
Outcomes
In‐hospital outcomes included (1) restraint use and (2) in‐hospital mortality. Physical restraint use was identified by focused medical record review and identification of required restraint documentation, which, by center policy requires daily review and documentation. Any restraint use during the hospitalization was included.
Discharge outcomes included (1) LOS, (2) discharge other than a location to home, and (3) variable direct costs. LOS was calculated from date of admission until date of discharge. Discharge disposition was identified in the electronic medical record discharge documentation and categorized into discharge to the prehospital residence (home) or not. Hospital variable direct costs were collected from the VA decision support system,[31] a centrally maintained administrative database. The VA decision support system is challenged with accounting for costs of a single‐day admission and patients who are hospitalized from VA long‐term care. To address the missing data from these cases, multiple imputations (n=20) of the missing data were performed.[32] Sensitivity analyses were performed to determine the impact of the imputation and the cost analysis strategy (see Supporting Information, Appendix 1, in the online version of this article).
Statistical Analyses
For this analysis, outcomes are reported at each level of performance on the mRASS (1 to1) and MOYB (correct, incorrect, not completed). For each analysis, the performance with a mean and standard deviation (SD) are reported for continuous outcomes and a percentage for dichotomous outcomes. For dichotomous outcomes, including restraint use, in‐hospital mortality, and discharge disposition, a risk ratio (RR) with 95% confidence interval (CI) is presented. The median is presented for the cost data because variable direct cost is highly skewed. For LOS and cost outcomes, unadjusted incident rate ratio (IRR) from a Poisson regression relative to the referent is presented to compare the categories. A Poisson regression was selected because LOS (a count of days) and variable direct costs (a count of dollars) are highly skewed. The output of Poisson regression produces an IRR and 95% CI relative to the referent group. The Poisson regression could not be adjusted because the quality improvement nature of these data limited the number of covariates collected. Sensitivity analyses did not identify significant interactions of age and sex (results not shown).
MOYB was also compared by level of arousal (mRASS=0 vs all others). Due to the relatively few patients with positive mRASS, it was compressed into a category of abnormal mRASS relative to alert and calm. Similar to the previous analyses, Poisson regression was performed to calculate the IRR (95% CI) relative to correct MOYB for the continuous variables. An RR was calculated for the dichotomous variables. All statistical analyses were performed using Stata version 11.0 (StataCorp, College Station, TX).
RESULTS
Population Description
Over the 2‐year project timeline, a total of 3232 unique individual records were analyzed (Table 1). Patients admitted and screened within the prior 30 days (n=501) and patients screened more than 3 days after admission (n=664) were not included in the analysis. Older adults were on average 74.7 years old (SD=9.8), and 98.2% were male, consistent with the veteran population. Altered level of arousal, as defined by an abnormal mRASS score, was found in 15.3% of the population. Average LOS was 5.2 days (SD=5.6), restraint use occurred in 5.5% during the hospital stay, patients were likely to be discharged home (71.7%), and a small portion died during hospitalization (1.3%). Mean variable direct costs were $11,084 with expected variability (SD=$15,682, median $6,614). Patients who died during the hospital stay had significantly longer LOS (mean 16.8 [SD=12.5] vs 5.1 [SD=5.4] days, P<0.001) and higher variable direct costs ($43,879 [SD=$37,334] vs $12,544 [SD=$16,802], P<0.001), justifying their removal from these analyses.
| Characteristic | Result, N=3,232, Mean (SD) or % (n) |
|---|---|
| |
| Age, y | 74.7 (9.8) |
| Male | 98.2 (3,174) |
| mRASS | |
| 2 | 2.0% (64) |
| 1 | 8.5% (273) |
| 0 | 84.7% (2,737) |
| 1 | 4.0% (131) |
| 2 | 0.8% (27) |
| MOYB | |
| Correct | 48.8% (1,578) |
| Incorrect | 45.1% (1,457) |
| Not completed | 6.1% (197) |
| Restraint use | 5.5% (177) |
| In‐hospital mortality | 1.3% (41) |
| Length of stay, da | 5.1 (5.4) |
| Discharge other than homea | 71.7% (2,292) |
| Variable direct hospital cost, $a | 11,084 (15,682) |
| Median cost, $ | 6,614 |
Impact of Altered Level of Arousal on Outcomes
There is an association between a deviation from a normal level of arousal (mRASS not equal to 0) and worsening outcomes (Table 2). Relative to a normal level of arousal (4.9SD 5.2 days), decreased level of arousal (negative mRASS), and increased arousal (positive mRASS) resulted in longer LOS (6.0SD 5.6 days, 5.7SD 6.8 days, respectively). Similarly, increased or decreased arousal was associated with heightened risk of restraints and less frequent discharge to home. In‐hospital mortality and hospital variable direct costs were significantly higher in those with decreased levels of arousal (IRR: 2.8, 95% CI: 1.36.0; IRR: 1.10, 95% CI: 0.951.26, respectively). The pattern does not hold for increased arousal with respect to in‐hospital mortality and variable direct hospital cost outcomes. The unadjusted analysis found that, relative to normal arousal, there is a significant change in outcomes with decreased levels of arousal. Increased arousal is associated with worsened IRR in LOS, restraint use, and discharge home, but not in‐hospital mortality and variable direct cost.
| mRASS Alert and Calm, n=2,737 | mRASS Negative, n=337 | mRASS Positive, n=158 | ||||
|---|---|---|---|---|---|---|
| Value | IRR/RR (95%CI) | Value | IRR/RR (95% CI) | Value | IRR/RR (95% CI) | |
| ||||||
| Restraint use % (n) | 4.2% (114) | Referent | 10.4% (35) | 2.49 (1.743.57) | 17.7% (28) | 4.25 (2.916.23) |
| In‐hospital mortality % (n) | 1.0% (26) | Referent | 2.7% (9) | 2.81 (1.335.95) | 1.3% (2) | 1.33 (0.325.56) |
| Length of stay, d (SD)a | 4.9 (5.2) | Referent | 6.0 (5.6) | 1.24 (1.181.30) | 5.7 (6.8) | 1.17 (1.091.25) |
| Discharge other than home, % (n)a | 24.9% (675) | Referent | 46.7% (153) | 1.87 (1.642.14) | 48.1% (75) | 1.93 (1.612.30) |
| Variable direct cost, $ (SD)a, b | 10,581 (14,928) | Referent | 11,604 (13,852) | 1.10 (0.951.26) | 10,640 (10,771) | 1.01 (0.851.19) |
| Median cost, $ | 6,318 | 7,738 | 7,858 | |||
Impact of Altered Attention on Outcomes
Patients who completed the MOYB incorrectly had increased restraint use (RR: 2.11, 95% CI 1.443.11) and LOS (IRR: 1.06, 95% CI: 1.021.10), but no difference in in‐hospital mortality, discharge home (RR: 0.78, 95% CI: 0.750.82), and variable direct costs, relative to those who completed the MOYB correctly (Table 3). Importantly, patients who did not complete the MOYB assessment had a 2‐fold increase in restraint use (RR: 2.05, 95% CI: 0.944.50), in‐hospital mortality was nearly 6‐fold higher (RR: 6.36, 95% CI: 2.1618.69), longer LOS (IRR: 1.12, 95% CI: 1.031.21), and returned home less frequently (RR: 1.77, 95% CI: 1.262.48).
| mRASS Normal | mRASS Abnormal | |||||||||||
|---|---|---|---|---|---|---|---|---|---|---|---|---|
| MOYB Correct (n=1,431) | MOYB Incorrect (n=1,181) | MOYB Incomplete (n=125) | MOYB Correct (n=147) | MOYB Incorrect (n=276) | MOYB Incomplete (n=72) | |||||||
| Value | IRR/RR (95% CI) | Value | IRR/RR (95% CI) | Value | IRR/RR (95% CI) | Value | IRR/RR (95% CI) | Value | IRR/RR (95% CI) | Value | IRR/RR (95% CI) | |
| ||||||||||||
| Restraint use, % (n) | 2.7% (39) | Referent | 5.8% (68) | 2.11 (1.44‐3.11) | 5.6% (7) | 2.05 (0.94‐4.50) | 2.7% (4) | 1.00 (0.36‐2.75) | 13.8% (38) | 5.05 (3.29‐7.75) | 29.2% (21) | 10.70 (6.66‐17.20) |
| In‐hospital mortality, % (n) | 0.6% (9) | Referent | 1.0% (12) | 1.62 (0.68‐ 3.82) | 4.0% (5) | 6.36 (2.16‐18.69) | 1.4% (2) | 2.16 (0.47‐9.92) | 2.2% (6) | 3.46 (1.24‐9.63) | 4.2% (3) | 6.63 (1.83‐23.95) |
| Length of stay, d (SD)a | 4.7 (5.4) | Referent | 5.0 (5.1) | 1.06 (1.02‐1.10) | 5.3 (5.0) | 1.12 (1.03‐1.21) | 5.4 (6.0) | 1.13 (1.05‐1.22) | 5.9 (4.4) | 1.23 (1.17‐1.30) | 7.5 (10.0) | 1.55 (1.44‐1.73) |
| Discharge other than home, % (n)a | 17.9% (255) | Referent | 32.7% (382) | 1.82 (1.56‐ 2.14) | 31.7% (38) | 1.77 (1.26‐2.48) | 29.7% (43) | 1.65 (1.20‐2.28) | 53.3% (144) | 2.97 (2.42‐3.64) | 59.4% (41) | 3.31 (2.38‐4.61) |
| Variable direct cost, $ (SD)a, b | 10,609 (16,154) | Referent | 10,482 (13,495) | 0.99 (0.89‐1.10) | 11,213 (12,994) | 1.06 (0.85‐1.32) | 12,010 (15,636) | 1.13 (0.90‐1.42) | 10,776 (10,680) | 1.02 (0.88‐1.17) | 11,815 (14,604) | 1.11 (0.82‐1.51) |
| Median cost, $ | 6,338 | 6,248 | 6,630 | 7,023 | 8,093 | 8,180 | ||||||
Inter‐relationship of Altered Level of Arousal and Attention on Outcomes
The inter‐relationship of altered level of arousal and attention is presented in Table 3. Of patients with a normal mRASS, 52% had correct MOYB. The percentage of correct MOYB declined with the level of arousal, such that 38% had normal MOYB and a mRASS of 1 and 9% had normal MOYB with mRASS of 2. In general, in‐hospital outcomes (restraints and mortality) are associated with MOYB performance, and discharge outcomes (LOS, discharge location, and variable direct costs) are associated with mRASS. Those patients who did not complete the MOYB demonstrated worse outcomes, regardless of mRASS performance, including a 6‐fold increase in mortality and significant increases in LOS and discharge location.
DISCUSSION
Impaired performance on a one‐time assessment of arousal or attention during hospitalization demonstrated a relationship with in‐hospital and discharge outcomes. Relative to normal levels of arousal and attention, alterations in attention, level of arousal, or both were associated with progressively negative consequences. Combined with the prognostic value, the administration of ultra‐brief cognitive screening measures may have value in the identification of patients who would benefit from additional screening, supporting prior work in this area.[23] The brevity of the assessments enhances clinical utility and implementation potential.
Cognitive function during hospitalization has been associated with many negative outcomes including delirium, falls, pressure ulcers, and functional decline.[3, 33, 34, 35, 36, 37] The findings of this analysis are consistent with previous studies and provide important clinical implications. First, prior work in cognitive screening has focused on more time‐consuming instruments.[12] By focusing on brief instruments, particularly those under 1 minute that do not require paper or props, a user‐friendly tool that is associated with health outcomes is provided.
In addition, this analysis demonstrates that each assessment, when used individually, has some prognostic significance associated with the identification of delirium or other types of cognitive impairment. When used alone, abnormal scores on the mRASS or MOYB may be indicative of individuals requiring further cognitive assessment, supporting previous research.[16, 23] Individuals with abnormal scores on both the mRASS and MOYB identify a high‐risk group in need of further clinical assessment for delirium (Figure 1). Neither of these assessments are meant to be used as the only means to diagnosis delirium, but together they identify key clinical characteristics of delirium (arousal and attention).[16, 18, 21] Considering the significant negative consequences associated with delirium, it is not surprising that tools identifying core features of delirium, such as those presented here, would also be associated with in‐hospital and discharge outcomes.
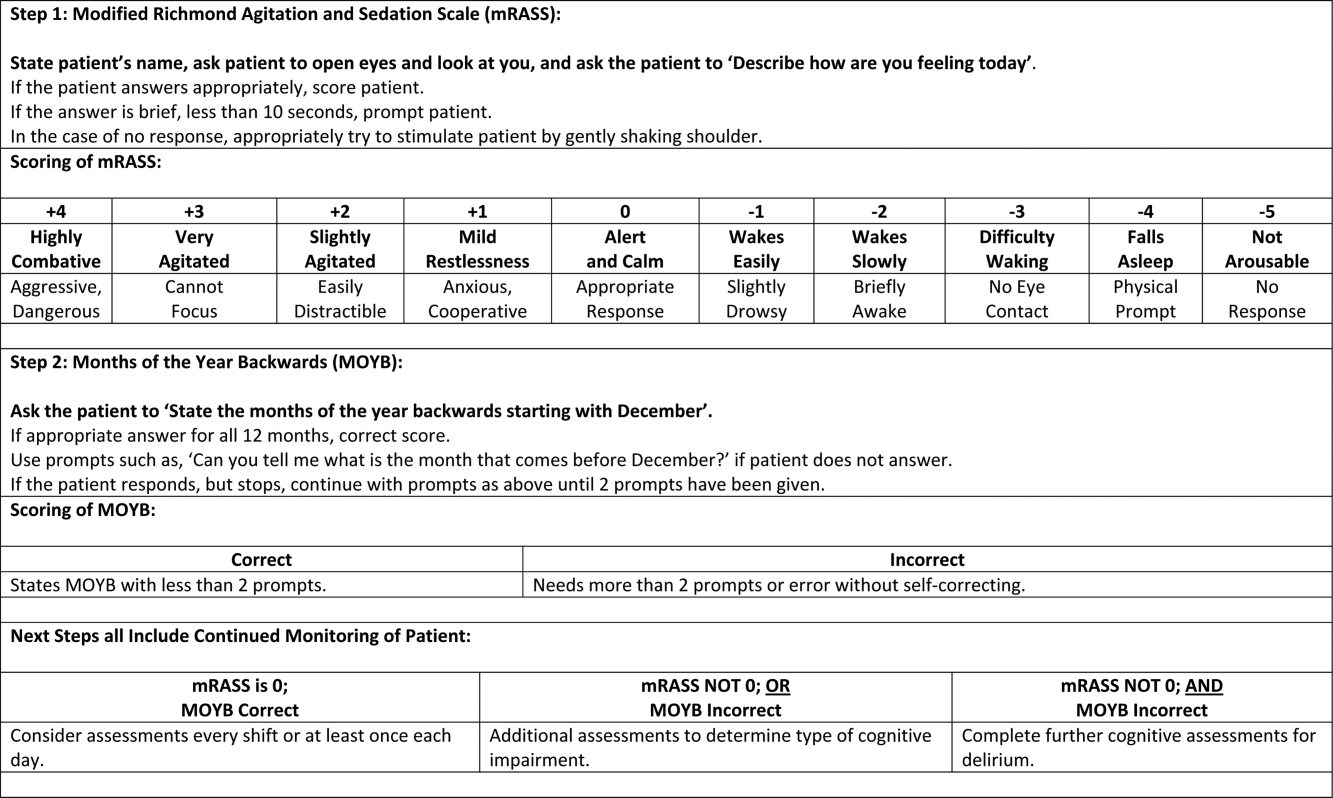
The quality improvement design of this project allowed the recording of outcomes in those who were unable or refused to complete the screening. This may be a potentially high‐risk group who would otherwise go unnoticed. A recent editorial from the American and European Delirium Societies highlights that individuals who are unable or refuse to complete testing due to impaired arousal are neglected in the most recent American Psychiatric Association Diagnostic and Statistical Manual of Mental Disorders, Fifth Edition definition of delirium.[18] Further work to identify and intervene on behalf of individuals who are unable to complete testing will aid in understanding arousal and its relationship to delirium and other disorders.
This analysis provides additional insight in the selection of measures of arousal and attention. Level of arousal is a complex concept that involves components of awareness and alertness, including external stimuli and self‐awareness.[38, 39, 40] As an ultra‐brief measure of arousal level, the mRASS incorporates both external stimuli (asking an open‐ended question) and self‐awareness (describing current state) to determine basic cognitive function. Attention can be defined as the selection of stimuli for further cognitive processing.[40] Attention is an umbrella term referring to many cognitive processes, ranging from sustained attention and working memory to executive function such as set shifting and multitasking. Ultra‐brief measures of attention, such as MOYB, are basic tasks of sustained attention with components of working memory.[19] An alteration in attention may be indicative of a more significant global change in cognition[41] beyond basic cognitive function assessed by administration of the mRASS, such as delirium.[42] The relationship between level of arousal and attention is complex, and arguments have been made that one has to have a certain level of arousal to attend to a stimuli, whereas others have found that one has to have a certain level of attention.[18, 39, 40] Administration of both the mRASS and MOYB is a useful bedside tool for clinicians to examine both basic cognitive function and more complex tasks of attention.
The quality improvement nature of this work has limitations and strengths that deserve mention. The significant strength of this work is the robust sample size. Also, trained staff not involved in the direct clinical care of patients administered the cognitive screens, suggesting that nonclinically trained personnel could be utilized for risk assessment. The major limitation is the restricted amount of covariate data that were collected. Data for this project were collected to operationalize and demonstrate the impact and business case of a delirium risk modification program,[17] limiting the ability to perform adjustment for other covariates such as comorbidity and reason for admission. Also, due to the nature of this project, a diagnosis of delirium was not determined. A limitation of excluding in‐hospital deaths from the cost analysis was that some individuals at high risk died early, thus costing less overall. Generalizability is limited by an over‐representation of males within a single setting. Further use and understanding of mRASS and MOYB in other population is warranted and welcomed. Use of MOYB is also a limitation considering that scores are not standardized across patients or settings.[26] Data regarding administration time of either of these tools were not collected; therefore, determining that these are ultra‐brief assessments (<1 minute) is based on estimates. As such, these measures should not be the sole source of information for clinical evaluation and diagnosis.
CONCLUSION
This work found that impaired performance on brief cognitive assessments of arousal and attention in hospitalized patients were associated with restraint use, in‐hospital mortality, longer LOS, less discharge home, and hospital costs. Routine screening of older patients with brief, user‐friendly cognitive assessments upon admission can identify those who would benefit from additional assessment and intervention to alleviate individual and economic burdens.
Acknowledgements
The authors are indebted to the veterans who participated in their delirium and fall reduction programs. The authors are thankful for the guidance of the VA Boston Healthcare System Delirium Task Force and Patient Safety Officers for continued collaboration to improve outcomes for the veterans they serve.
Disclosures: Dr. Yevchak and Ms. Doherty contributed equally to this article and agreed to share first authorship. This material is based upon work supported by the Department of Veterans Affairs Office of Patient Safety Delirium Patient Safety Center of Inquiry and a Geriatrics and Extended Care T21 Alternative to Non‐institutional Long Term Care award. Archambault, Doherty, Fonda, Kelly, and Rudolph are employees of the US government. Dr. Rudolph also received support from a VA Career Development Award. The views expressed in this article are those of the authors and do not necessarily reflect the position or policy of the Department of Veterans Affairs or the United States Government. The authors report no conflicts of interest.
- , , , , , . Delirium superimposed on dementia predicts 12‐month survival in elderly patients discharged from a postacute rehabilitation facility. J Gerontol A Biol Sci Med Sci. 2007;62(11):1306–1309.
- , , , . Delirium superimposed on dementia is associated with prolonged length of stay and poor outcomes in hospitalized older adults. J Hosp Med. 2013;8(9):500–505.
- , , , et al. Impact and recognition of cognitive impairment among hospitalized elders. J Hosp Med. 2010;5(2):69–75.
- , , , et al. Association between endothelial dysfunction and acute brain dysfunction during critical illness. Anesthesiology. 2013;118(3):631–639.
- , , , et al. Delirium accelerates cognitive decline in Alzheimer disease. Neurology. 2009;72(18):1570–1575.
- , , , et al. Adverse outcomes after hospitalization and delirium in persons with Alzheimer disease. Ann Intern Med. 2012;156(12):848–856.
- , , , et al. Delirium: an independent predictor of functional decline after cardiac surgery. J Am Geriatr Soc. 2010;58(4):643–649.
- , . The importance of delirium: economic and societal costs. J Am Geriatr Soc. 2011;59:S241–S243.
- , , , , , . Managing delirium in the acute care setting: a pilot focus group study. Int J Older People Nurs. 2012;7(2):152–162.
- , , , et al. Barriers and facilitators to implementing delirium rounds in a clinical trial across three diverse hospital settings. Clin Nurs Res. 2014;23(2):201–215.
- , , , , , . Validation of the confusion assessment method in the palliative care setting. Palliat Med. 2009;23(1):40–45.
- , , , . Does this patient have delirium? Value of bedside instruments. JAMA. 2010;304(7):779–786.
- , , , et al. Three core domains of delirium validated using exploratory and confirmatory factor analyses. Psychosomatics. 2013;54(3):227–238.
- , , . A neurologist's approach to delirium: diagnosis and management of toxic metabolic encephalopathies. Eur J Intern Med. 2014;25(2):112–116.
- , , ; the VADWG. Serial administration of a modified Richmond Agitation and Sedation Scale for delirium screening. J Hosp Med. 2012;7(5):450–453.
- . The diagnostic performance of the Richmond Agitation Sedation Scale for detecting delirium in older emergency department patients. Acad Emerg Med. 2015;22(7):878–882.
- , , , et al. The Richmond Agitation Sedation Scale: validity and reliability in adult intensive care unit patients. Am J Respir Crit Care Med. 2002;166(10):1338–1344.
- European Delirium Association, American Delirium Society. The DSM‐5 criteria, level of arousal and delirium diagnosis: inclusiveness is safer. BMC Med. 2014;12:141.
- , , , , , . Pay attention! The critical importance of assessing attention in older adults with dementia. J Gerontol Nurs. 2012;38(11):23–27.
- , , . Delirium: a disorder of consciousness? Med Hypotheses. 2013;80(4):399–404.
- , , , et al. Attention! A good bedside test for delirium? J Neurol Neurosurg Psychiatry. 2014;85(10):1122–1131.
- , , . A delirium risk modification program is associated with hospital outcomes. J Am Med Dir Assoc. 2014;15(12):11.
- , , , et al. Impaired arousal in older adults is associated with prolonged hospital stay and discharge to skilled nursing facility. J Am Med Dir Assoc. 2015;16(7):586–589.
- , , , et al. Validation of the 4AT, a new instrument for rapid delirium screening: a study in 234 hospitalised older people. Age Ageing. 2014;43(4):496–502.
- , , , , , . Reliability of a structured assessment for nonclinicians to detect delirium among new admissions to postacute care. J Am Med Dir Assoc. 2006;7(7):412–415.
- , , , . Reciting the months of the year backwards: what is a ‘normal’ score? Age Ageing. 2015;44(3):537–538.
- , , . A Delirium risk modification program is associated with hospital outcomes. J Am Med Dir Assoc. 2014;15(12):957.e957–957.e911.
- , , , et al. 3D‐CAM: derivation and validation of a 3‐minute diagnostic interview for CAM‐defined delirium: a cross‐sectional diagnostic test study. Ann Intern Med. 2014;161(8):554–561.
- , , , , , . Reliability of a structured assessment for non‐clinicians to detect delirium among new admissions to post‐acute care. J Am Med Dir Assoc. 2006;7:412–415.
- , , , et al. Derivation and validation of a preoperative prediction rule for delirium after cardiac surgery. Circulation. 2009;119(2):229–236.
- , . Use of the Decision Support System for VA cost‐effectiveness research. Med Care. 1999;37(4 suppl Va):AS63–AS70.
- , , , , . Cost analysis in the Department of Veterans Affairs: consensus and future directions. Med Care. 1999;37(4 Suppl Va):AS3‐AS8.
- , , . Delirium: a symptom of how hospital care is failing older persons and a window to improve quality of hospital care. Am J Med. 1999;106(5):565–573.
- , , , et al. A multicomponent intervention to prevent delirium in hospitalized older patients. N Engl J Med. 1999;340(9):669–676.
- , , , . Iatrogenic causes of falls in hospitalised elderly patients: a case‐control study. Postgrad Med J. 2002;78(922):487–489.
- , , , , . A controlled quality improvement trial to reduce the use of physical restraints in older hospitalized adults. J Am Geriatr Soc. 2014;62(3):541–545.
- , , , . Evaluation of the mobile acute care of the elderly (mace) service. JAMA Intern Med. 2013;173(11):990–996.
- , . Conscience and consciousness: a definition. J Med Life. 2014;7(1):104–108.
- , , , et al. Consciousness in humans and non‐human animals: recent advances and future directions. Front Psychol. 2013;4:625.
- . Interdependence of attention and consciousness. In: Rahul B, Bikas KC, eds. Progress in Brain Research. Vol. 168. New York, NY: Elsevier; 2007:65–75.
- , , . Relationship between cognitive and non‐cognitive symptoms of delirium. Asian J Psychiatr. 2013;6(2):106–112.
- , , , , , . Clarifying confusion: the confusion assessment method. A new method for detection of delirium. Ann Intern Med. 1990;113(12):941–948.
Hospitalization is a critical time for older patients with cognitive impairment. Past research has found that hospitalized older adults with cognitive dysfunction have more rapid cognitive decline, increased morbidity and mortality, and higher costs of healthcare utilization.[1, 2, 3] Those with preexisting cognitive dysfunction, such as dementia, are most susceptible to the negative impacts of hospitalization.[4, 5, 6, 7, 8] Identification of cognitive deficits upon admission is important for risk stratification of patients and prevention of negative hospital health events.
Frontline healthcare providers are underequipped to detect acute cognitive dysfunction.[9, 10] Current practice and research for the detection of cognitive dysfunction in the acute care setting utilizes instruments that require training[11] and are relatively lengthy (>5 minutes).[12] Although these cognitive screening tests are accurate and reliable, the time requirement is not feasible in a fast‐paced clinical setting. A possible alternative is the use of ultra‐brief cognitive screening instruments (<1 minute) that have the potential to identify those individuals requiring additional evaluation and follow‐up. These brief instruments are composed of screening tools that emphasize core features of acute cognitive dysfunction such as level of arousal or attention.[13, 14, 15, 16] Arousal, the ability to respond to or interact with the environment,[15] is an important component of cognition because it is generally preserved in chronic cognitive disorders (eg, dementia). Thus, an alteration in arousal may be a harbinger of more acute impairment[17] in need of evaluation, and in these lowered states of arousal it may be difficult to test for attention.[18] Attention is a broadly defined cognitive domain indicating focus.[19] Older adults, regardless of preexisting cognitive dysfunction, warrant additional cognitive testing if levels of arousal or attention are altered[20, 21] due to the significant relationship to delirium, which is associated with adverse events in this population. Recent research has demonstrated that these brief cognitive screening instruments provide information about the risk for delirium and are a strong test for clinical characteristics of delirium.[16, 21]
The purpose of this analysis was to demonstrate the clinical outcomes of poor performance on ultrabrief assessments arousal and attention by frontline staff using a quality improvement database. Specific objectives include determining (1) the association of poor performance on brief cognitive assessments and hospital outcomes and (2) the inter‐relationship between alterations in the levels of arousal and attention on in‐hospital and discharge outcomes.
METHODS
Setting and Study Design
This is a secondary analysis of data collected from a quality improvement program for delirium risk modification.[22] This program collected data from October 2010 until September 2012 at a Veterans Affairs (VA) tertiary referral center for the New England region. Patients aged 60 years or older and admitted to medical wards were screened upon admission or transfer to VA Boston Healthcare System and provided appropriate interventions to modify delirium risk. Excluded were individuals admitted as observational status, or those readmitted within 30 days of initial screening, and those screened more than 72 hours after admission. Age and sex were abstracted from the medical record. Outcome data were collected from the medical record for the purpose of operating and sustaining the program. In a previous article, the length of stay (LOS) outcome was reported in a subset of this population.[23] The analysis presented here includes the full cohort, presents the interaction with month of the year backward (MOYB), and provides additional outcomes not included in the other article. The VA institutional review board (IRB) reviewed and approved the secondary data analysis of the quality improvement project.
Measures
Brief Cognitive Screening
The baseline assessments of levels of arousal and attention were collected within 72 hours of admission to identify delirium risk. Trained study staff, not involved in the clinical care of patients, administered these assessments as part of the quality improvement project. It is estimated that these assessments took less than 1 minute to complete per individual, but actual administration time was not measured. Assessments were documented within the electronic health record as part of a delirium risk stratification system.
Arousal
The arousal level assessment was the modified Richmond Agitation and Sedation Scale (mRASS). The mRASS is a brief, reliable, observational tool used to determine arousal level.[15, 17] It is a text modification of the RASS[17] for less acutely ill patients, capturing hyperactive and hypoactive altered levels of arousal. The mRASS asks an open‐ended question followed by observation for 10 seconds and completion of a 5 to+4 rating scale. Alert and calm (score=0) is considered normal, with positive numbers related to an increased level of arousal and attention, whereas negative numbers denote decreased levels. For the analyses, an mRASS of 0 is utilized as the reference. Categories were collapsed into 2 and 2 due to few patients on the extremes of the mRASS.
Attention
The MOYB is a brief measure of attention that is included in several instruments for delirium.[19, 24, 25] For this study, the patient was asked to recite the 12 months backward beginning with December. A correct score was given if the individual was able to recite all 12 months to January without any error. An incorrect score was given if any mistake was made. Scoring for the MOYB is not standardized by age, preexisting medical diagnosis, or any other rational.[26] Others have used July or June as a cutoff for a correct score on the MOYB,[21, 25] but a more conservative score of correct to January was used in this study, which has been previously used.[26, 27, 28, 29, 30] A score of not completed was given when the patient was unable to participate or declined to complete the assessment. For the analysis, a correct score on the MOYB is the referent group.
Outcomes
In‐hospital outcomes included (1) restraint use and (2) in‐hospital mortality. Physical restraint use was identified by focused medical record review and identification of required restraint documentation, which, by center policy requires daily review and documentation. Any restraint use during the hospitalization was included.
Discharge outcomes included (1) LOS, (2) discharge other than a location to home, and (3) variable direct costs. LOS was calculated from date of admission until date of discharge. Discharge disposition was identified in the electronic medical record discharge documentation and categorized into discharge to the prehospital residence (home) or not. Hospital variable direct costs were collected from the VA decision support system,[31] a centrally maintained administrative database. The VA decision support system is challenged with accounting for costs of a single‐day admission and patients who are hospitalized from VA long‐term care. To address the missing data from these cases, multiple imputations (n=20) of the missing data were performed.[32] Sensitivity analyses were performed to determine the impact of the imputation and the cost analysis strategy (see Supporting Information, Appendix 1, in the online version of this article).
Statistical Analyses
For this analysis, outcomes are reported at each level of performance on the mRASS (1 to1) and MOYB (correct, incorrect, not completed). For each analysis, the performance with a mean and standard deviation (SD) are reported for continuous outcomes and a percentage for dichotomous outcomes. For dichotomous outcomes, including restraint use, in‐hospital mortality, and discharge disposition, a risk ratio (RR) with 95% confidence interval (CI) is presented. The median is presented for the cost data because variable direct cost is highly skewed. For LOS and cost outcomes, unadjusted incident rate ratio (IRR) from a Poisson regression relative to the referent is presented to compare the categories. A Poisson regression was selected because LOS (a count of days) and variable direct costs (a count of dollars) are highly skewed. The output of Poisson regression produces an IRR and 95% CI relative to the referent group. The Poisson regression could not be adjusted because the quality improvement nature of these data limited the number of covariates collected. Sensitivity analyses did not identify significant interactions of age and sex (results not shown).
MOYB was also compared by level of arousal (mRASS=0 vs all others). Due to the relatively few patients with positive mRASS, it was compressed into a category of abnormal mRASS relative to alert and calm. Similar to the previous analyses, Poisson regression was performed to calculate the IRR (95% CI) relative to correct MOYB for the continuous variables. An RR was calculated for the dichotomous variables. All statistical analyses were performed using Stata version 11.0 (StataCorp, College Station, TX).
RESULTS
Population Description
Over the 2‐year project timeline, a total of 3232 unique individual records were analyzed (Table 1). Patients admitted and screened within the prior 30 days (n=501) and patients screened more than 3 days after admission (n=664) were not included in the analysis. Older adults were on average 74.7 years old (SD=9.8), and 98.2% were male, consistent with the veteran population. Altered level of arousal, as defined by an abnormal mRASS score, was found in 15.3% of the population. Average LOS was 5.2 days (SD=5.6), restraint use occurred in 5.5% during the hospital stay, patients were likely to be discharged home (71.7%), and a small portion died during hospitalization (1.3%). Mean variable direct costs were $11,084 with expected variability (SD=$15,682, median $6,614). Patients who died during the hospital stay had significantly longer LOS (mean 16.8 [SD=12.5] vs 5.1 [SD=5.4] days, P<0.001) and higher variable direct costs ($43,879 [SD=$37,334] vs $12,544 [SD=$16,802], P<0.001), justifying their removal from these analyses.
| Characteristic | Result, N=3,232, Mean (SD) or % (n) |
|---|---|
| |
| Age, y | 74.7 (9.8) |
| Male | 98.2 (3,174) |
| mRASS | |
| 2 | 2.0% (64) |
| 1 | 8.5% (273) |
| 0 | 84.7% (2,737) |
| 1 | 4.0% (131) |
| 2 | 0.8% (27) |
| MOYB | |
| Correct | 48.8% (1,578) |
| Incorrect | 45.1% (1,457) |
| Not completed | 6.1% (197) |
| Restraint use | 5.5% (177) |
| In‐hospital mortality | 1.3% (41) |
| Length of stay, da | 5.1 (5.4) |
| Discharge other than homea | 71.7% (2,292) |
| Variable direct hospital cost, $a | 11,084 (15,682) |
| Median cost, $ | 6,614 |
Impact of Altered Level of Arousal on Outcomes
There is an association between a deviation from a normal level of arousal (mRASS not equal to 0) and worsening outcomes (Table 2). Relative to a normal level of arousal (4.9SD 5.2 days), decreased level of arousal (negative mRASS), and increased arousal (positive mRASS) resulted in longer LOS (6.0SD 5.6 days, 5.7SD 6.8 days, respectively). Similarly, increased or decreased arousal was associated with heightened risk of restraints and less frequent discharge to home. In‐hospital mortality and hospital variable direct costs were significantly higher in those with decreased levels of arousal (IRR: 2.8, 95% CI: 1.36.0; IRR: 1.10, 95% CI: 0.951.26, respectively). The pattern does not hold for increased arousal with respect to in‐hospital mortality and variable direct hospital cost outcomes. The unadjusted analysis found that, relative to normal arousal, there is a significant change in outcomes with decreased levels of arousal. Increased arousal is associated with worsened IRR in LOS, restraint use, and discharge home, but not in‐hospital mortality and variable direct cost.
| mRASS Alert and Calm, n=2,737 | mRASS Negative, n=337 | mRASS Positive, n=158 | ||||
|---|---|---|---|---|---|---|
| Value | IRR/RR (95%CI) | Value | IRR/RR (95% CI) | Value | IRR/RR (95% CI) | |
| ||||||
| Restraint use % (n) | 4.2% (114) | Referent | 10.4% (35) | 2.49 (1.743.57) | 17.7% (28) | 4.25 (2.916.23) |
| In‐hospital mortality % (n) | 1.0% (26) | Referent | 2.7% (9) | 2.81 (1.335.95) | 1.3% (2) | 1.33 (0.325.56) |
| Length of stay, d (SD)a | 4.9 (5.2) | Referent | 6.0 (5.6) | 1.24 (1.181.30) | 5.7 (6.8) | 1.17 (1.091.25) |
| Discharge other than home, % (n)a | 24.9% (675) | Referent | 46.7% (153) | 1.87 (1.642.14) | 48.1% (75) | 1.93 (1.612.30) |
| Variable direct cost, $ (SD)a, b | 10,581 (14,928) | Referent | 11,604 (13,852) | 1.10 (0.951.26) | 10,640 (10,771) | 1.01 (0.851.19) |
| Median cost, $ | 6,318 | 7,738 | 7,858 | |||
Impact of Altered Attention on Outcomes
Patients who completed the MOYB incorrectly had increased restraint use (RR: 2.11, 95% CI 1.443.11) and LOS (IRR: 1.06, 95% CI: 1.021.10), but no difference in in‐hospital mortality, discharge home (RR: 0.78, 95% CI: 0.750.82), and variable direct costs, relative to those who completed the MOYB correctly (Table 3). Importantly, patients who did not complete the MOYB assessment had a 2‐fold increase in restraint use (RR: 2.05, 95% CI: 0.944.50), in‐hospital mortality was nearly 6‐fold higher (RR: 6.36, 95% CI: 2.1618.69), longer LOS (IRR: 1.12, 95% CI: 1.031.21), and returned home less frequently (RR: 1.77, 95% CI: 1.262.48).
| mRASS Normal | mRASS Abnormal | |||||||||||
|---|---|---|---|---|---|---|---|---|---|---|---|---|
| MOYB Correct (n=1,431) | MOYB Incorrect (n=1,181) | MOYB Incomplete (n=125) | MOYB Correct (n=147) | MOYB Incorrect (n=276) | MOYB Incomplete (n=72) | |||||||
| Value | IRR/RR (95% CI) | Value | IRR/RR (95% CI) | Value | IRR/RR (95% CI) | Value | IRR/RR (95% CI) | Value | IRR/RR (95% CI) | Value | IRR/RR (95% CI) | |
| ||||||||||||
| Restraint use, % (n) | 2.7% (39) | Referent | 5.8% (68) | 2.11 (1.44‐3.11) | 5.6% (7) | 2.05 (0.94‐4.50) | 2.7% (4) | 1.00 (0.36‐2.75) | 13.8% (38) | 5.05 (3.29‐7.75) | 29.2% (21) | 10.70 (6.66‐17.20) |
| In‐hospital mortality, % (n) | 0.6% (9) | Referent | 1.0% (12) | 1.62 (0.68‐ 3.82) | 4.0% (5) | 6.36 (2.16‐18.69) | 1.4% (2) | 2.16 (0.47‐9.92) | 2.2% (6) | 3.46 (1.24‐9.63) | 4.2% (3) | 6.63 (1.83‐23.95) |
| Length of stay, d (SD)a | 4.7 (5.4) | Referent | 5.0 (5.1) | 1.06 (1.02‐1.10) | 5.3 (5.0) | 1.12 (1.03‐1.21) | 5.4 (6.0) | 1.13 (1.05‐1.22) | 5.9 (4.4) | 1.23 (1.17‐1.30) | 7.5 (10.0) | 1.55 (1.44‐1.73) |
| Discharge other than home, % (n)a | 17.9% (255) | Referent | 32.7% (382) | 1.82 (1.56‐ 2.14) | 31.7% (38) | 1.77 (1.26‐2.48) | 29.7% (43) | 1.65 (1.20‐2.28) | 53.3% (144) | 2.97 (2.42‐3.64) | 59.4% (41) | 3.31 (2.38‐4.61) |
| Variable direct cost, $ (SD)a, b | 10,609 (16,154) | Referent | 10,482 (13,495) | 0.99 (0.89‐1.10) | 11,213 (12,994) | 1.06 (0.85‐1.32) | 12,010 (15,636) | 1.13 (0.90‐1.42) | 10,776 (10,680) | 1.02 (0.88‐1.17) | 11,815 (14,604) | 1.11 (0.82‐1.51) |
| Median cost, $ | 6,338 | 6,248 | 6,630 | 7,023 | 8,093 | 8,180 | ||||||
Inter‐relationship of Altered Level of Arousal and Attention on Outcomes
The inter‐relationship of altered level of arousal and attention is presented in Table 3. Of patients with a normal mRASS, 52% had correct MOYB. The percentage of correct MOYB declined with the level of arousal, such that 38% had normal MOYB and a mRASS of 1 and 9% had normal MOYB with mRASS of 2. In general, in‐hospital outcomes (restraints and mortality) are associated with MOYB performance, and discharge outcomes (LOS, discharge location, and variable direct costs) are associated with mRASS. Those patients who did not complete the MOYB demonstrated worse outcomes, regardless of mRASS performance, including a 6‐fold increase in mortality and significant increases in LOS and discharge location.
DISCUSSION
Impaired performance on a one‐time assessment of arousal or attention during hospitalization demonstrated a relationship with in‐hospital and discharge outcomes. Relative to normal levels of arousal and attention, alterations in attention, level of arousal, or both were associated with progressively negative consequences. Combined with the prognostic value, the administration of ultra‐brief cognitive screening measures may have value in the identification of patients who would benefit from additional screening, supporting prior work in this area.[23] The brevity of the assessments enhances clinical utility and implementation potential.
Cognitive function during hospitalization has been associated with many negative outcomes including delirium, falls, pressure ulcers, and functional decline.[3, 33, 34, 35, 36, 37] The findings of this analysis are consistent with previous studies and provide important clinical implications. First, prior work in cognitive screening has focused on more time‐consuming instruments.[12] By focusing on brief instruments, particularly those under 1 minute that do not require paper or props, a user‐friendly tool that is associated with health outcomes is provided.
In addition, this analysis demonstrates that each assessment, when used individually, has some prognostic significance associated with the identification of delirium or other types of cognitive impairment. When used alone, abnormal scores on the mRASS or MOYB may be indicative of individuals requiring further cognitive assessment, supporting previous research.[16, 23] Individuals with abnormal scores on both the mRASS and MOYB identify a high‐risk group in need of further clinical assessment for delirium (Figure 1). Neither of these assessments are meant to be used as the only means to diagnosis delirium, but together they identify key clinical characteristics of delirium (arousal and attention).[16, 18, 21] Considering the significant negative consequences associated with delirium, it is not surprising that tools identifying core features of delirium, such as those presented here, would also be associated with in‐hospital and discharge outcomes.
The quality improvement design of this project allowed the recording of outcomes in those who were unable or refused to complete the screening. This may be a potentially high‐risk group who would otherwise go unnoticed. A recent editorial from the American and European Delirium Societies highlights that individuals who are unable or refuse to complete testing due to impaired arousal are neglected in the most recent American Psychiatric Association Diagnostic and Statistical Manual of Mental Disorders, Fifth Edition definition of delirium.[18] Further work to identify and intervene on behalf of individuals who are unable to complete testing will aid in understanding arousal and its relationship to delirium and other disorders.
This analysis provides additional insight in the selection of measures of arousal and attention. Level of arousal is a complex concept that involves components of awareness and alertness, including external stimuli and self‐awareness.[38, 39, 40] As an ultra‐brief measure of arousal level, the mRASS incorporates both external stimuli (asking an open‐ended question) and self‐awareness (describing current state) to determine basic cognitive function. Attention can be defined as the selection of stimuli for further cognitive processing.[40] Attention is an umbrella term referring to many cognitive processes, ranging from sustained attention and working memory to executive function such as set shifting and multitasking. Ultra‐brief measures of attention, such as MOYB, are basic tasks of sustained attention with components of working memory.[19] An alteration in attention may be indicative of a more significant global change in cognition[41] beyond basic cognitive function assessed by administration of the mRASS, such as delirium.[42] The relationship between level of arousal and attention is complex, and arguments have been made that one has to have a certain level of arousal to attend to a stimuli, whereas others have found that one has to have a certain level of attention.[18, 39, 40] Administration of both the mRASS and MOYB is a useful bedside tool for clinicians to examine both basic cognitive function and more complex tasks of attention.
The quality improvement nature of this work has limitations and strengths that deserve mention. The significant strength of this work is the robust sample size. Also, trained staff not involved in the direct clinical care of patients administered the cognitive screens, suggesting that nonclinically trained personnel could be utilized for risk assessment. The major limitation is the restricted amount of covariate data that were collected. Data for this project were collected to operationalize and demonstrate the impact and business case of a delirium risk modification program,[17] limiting the ability to perform adjustment for other covariates such as comorbidity and reason for admission. Also, due to the nature of this project, a diagnosis of delirium was not determined. A limitation of excluding in‐hospital deaths from the cost analysis was that some individuals at high risk died early, thus costing less overall. Generalizability is limited by an over‐representation of males within a single setting. Further use and understanding of mRASS and MOYB in other population is warranted and welcomed. Use of MOYB is also a limitation considering that scores are not standardized across patients or settings.[26] Data regarding administration time of either of these tools were not collected; therefore, determining that these are ultra‐brief assessments (<1 minute) is based on estimates. As such, these measures should not be the sole source of information for clinical evaluation and diagnosis.
CONCLUSION
This work found that impaired performance on brief cognitive assessments of arousal and attention in hospitalized patients were associated with restraint use, in‐hospital mortality, longer LOS, less discharge home, and hospital costs. Routine screening of older patients with brief, user‐friendly cognitive assessments upon admission can identify those who would benefit from additional assessment and intervention to alleviate individual and economic burdens.
Acknowledgements
The authors are indebted to the veterans who participated in their delirium and fall reduction programs. The authors are thankful for the guidance of the VA Boston Healthcare System Delirium Task Force and Patient Safety Officers for continued collaboration to improve outcomes for the veterans they serve.
Disclosures: Dr. Yevchak and Ms. Doherty contributed equally to this article and agreed to share first authorship. This material is based upon work supported by the Department of Veterans Affairs Office of Patient Safety Delirium Patient Safety Center of Inquiry and a Geriatrics and Extended Care T21 Alternative to Non‐institutional Long Term Care award. Archambault, Doherty, Fonda, Kelly, and Rudolph are employees of the US government. Dr. Rudolph also received support from a VA Career Development Award. The views expressed in this article are those of the authors and do not necessarily reflect the position or policy of the Department of Veterans Affairs or the United States Government. The authors report no conflicts of interest.
- , , , , , . Delirium superimposed on dementia predicts 12‐month survival in elderly patients discharged from a postacute rehabilitation facility. J Gerontol A Biol Sci Med Sci. 2007;62(11):1306–1309.
- , , , . Delirium superimposed on dementia is associated with prolonged length of stay and poor outcomes in hospitalized older adults. J Hosp Med. 2013;8(9):500–505.
- , , , et al. Impact and recognition of cognitive impairment among hospitalized elders. J Hosp Med. 2010;5(2):69–75.
- , , , et al. Association between endothelial dysfunction and acute brain dysfunction during critical illness. Anesthesiology. 2013;118(3):631–639.
- , , , et al. Delirium accelerates cognitive decline in Alzheimer disease. Neurology. 2009;72(18):1570–1575.
- , , , et al. Adverse outcomes after hospitalization and delirium in persons with Alzheimer disease. Ann Intern Med. 2012;156(12):848–856.
- , , , et al. Delirium: an independent predictor of functional decline after cardiac surgery. J Am Geriatr Soc. 2010;58(4):643–649.
- , . The importance of delirium: economic and societal costs. J Am Geriatr Soc. 2011;59:S241–S243.
- , , , , , . Managing delirium in the acute care setting: a pilot focus group study. Int J Older People Nurs. 2012;7(2):152–162.
- , , , et al. Barriers and facilitators to implementing delirium rounds in a clinical trial across three diverse hospital settings. Clin Nurs Res. 2014;23(2):201–215.
- , , , , , . Validation of the confusion assessment method in the palliative care setting. Palliat Med. 2009;23(1):40–45.
- , , , . Does this patient have delirium? Value of bedside instruments. JAMA. 2010;304(7):779–786.
- , , , et al. Three core domains of delirium validated using exploratory and confirmatory factor analyses. Psychosomatics. 2013;54(3):227–238.
- , , . A neurologist's approach to delirium: diagnosis and management of toxic metabolic encephalopathies. Eur J Intern Med. 2014;25(2):112–116.
- , , ; the VADWG. Serial administration of a modified Richmond Agitation and Sedation Scale for delirium screening. J Hosp Med. 2012;7(5):450–453.
- . The diagnostic performance of the Richmond Agitation Sedation Scale for detecting delirium in older emergency department patients. Acad Emerg Med. 2015;22(7):878–882.
- , , , et al. The Richmond Agitation Sedation Scale: validity and reliability in adult intensive care unit patients. Am J Respir Crit Care Med. 2002;166(10):1338–1344.
- European Delirium Association, American Delirium Society. The DSM‐5 criteria, level of arousal and delirium diagnosis: inclusiveness is safer. BMC Med. 2014;12:141.
- , , , , , . Pay attention! The critical importance of assessing attention in older adults with dementia. J Gerontol Nurs. 2012;38(11):23–27.
- , , . Delirium: a disorder of consciousness? Med Hypotheses. 2013;80(4):399–404.
- , , , et al. Attention! A good bedside test for delirium? J Neurol Neurosurg Psychiatry. 2014;85(10):1122–1131.
- , , . A delirium risk modification program is associated with hospital outcomes. J Am Med Dir Assoc. 2014;15(12):11.
- , , , et al. Impaired arousal in older adults is associated with prolonged hospital stay and discharge to skilled nursing facility. J Am Med Dir Assoc. 2015;16(7):586–589.
- , , , et al. Validation of the 4AT, a new instrument for rapid delirium screening: a study in 234 hospitalised older people. Age Ageing. 2014;43(4):496–502.
- , , , , , . Reliability of a structured assessment for nonclinicians to detect delirium among new admissions to postacute care. J Am Med Dir Assoc. 2006;7(7):412–415.
- , , , . Reciting the months of the year backwards: what is a ‘normal’ score? Age Ageing. 2015;44(3):537–538.
- , , . A Delirium risk modification program is associated with hospital outcomes. J Am Med Dir Assoc. 2014;15(12):957.e957–957.e911.
- , , , et al. 3D‐CAM: derivation and validation of a 3‐minute diagnostic interview for CAM‐defined delirium: a cross‐sectional diagnostic test study. Ann Intern Med. 2014;161(8):554–561.
- , , , , , . Reliability of a structured assessment for non‐clinicians to detect delirium among new admissions to post‐acute care. J Am Med Dir Assoc. 2006;7:412–415.
- , , , et al. Derivation and validation of a preoperative prediction rule for delirium after cardiac surgery. Circulation. 2009;119(2):229–236.
- , . Use of the Decision Support System for VA cost‐effectiveness research. Med Care. 1999;37(4 suppl Va):AS63–AS70.
- , , , , . Cost analysis in the Department of Veterans Affairs: consensus and future directions. Med Care. 1999;37(4 Suppl Va):AS3‐AS8.
- , , . Delirium: a symptom of how hospital care is failing older persons and a window to improve quality of hospital care. Am J Med. 1999;106(5):565–573.
- , , , et al. A multicomponent intervention to prevent delirium in hospitalized older patients. N Engl J Med. 1999;340(9):669–676.
- , , , . Iatrogenic causes of falls in hospitalised elderly patients: a case‐control study. Postgrad Med J. 2002;78(922):487–489.
- , , , , . A controlled quality improvement trial to reduce the use of physical restraints in older hospitalized adults. J Am Geriatr Soc. 2014;62(3):541–545.
- , , , . Evaluation of the mobile acute care of the elderly (mace) service. JAMA Intern Med. 2013;173(11):990–996.
- , . Conscience and consciousness: a definition. J Med Life. 2014;7(1):104–108.
- , , , et al. Consciousness in humans and non‐human animals: recent advances and future directions. Front Psychol. 2013;4:625.
- . Interdependence of attention and consciousness. In: Rahul B, Bikas KC, eds. Progress in Brain Research. Vol. 168. New York, NY: Elsevier; 2007:65–75.
- , , . Relationship between cognitive and non‐cognitive symptoms of delirium. Asian J Psychiatr. 2013;6(2):106–112.
- , , , , , . Clarifying confusion: the confusion assessment method. A new method for detection of delirium. Ann Intern Med. 1990;113(12):941–948.
© 2015 Society of Hospital Medicine

Mental Status to Predict Mortality
Altered mental status (AMS), characterized by abnormal changes in a patient's arousal and/or cognition, is a significant predictor of hospital mortality.[1, 2, 3] Yet despite its prevalence[3, 4, 5] and importance, up to three‐quarters of AMS events go unrecognized by caregivers.[6, 7, 8] Acute changes in mental status, often caused by delirium in the hospitalized patient,[3] can present nonspecifically, making it difficult to detect and distinguish from other diagnoses such as depression or dementia.[7, 9] Further complicating the recognition of AMS, numerous and imprecise qualitative descriptors such as confused and alert and oriented are used in clinical practice to describe the mental status of patients.[10] Thus, more objective measures may result in improved detection of altered mental status and in earlier diagnostic and therapeutic interventions.
In critically ill patients, several scales have been widely adopted for quantifying mental status. The Richmond Agitation and Sedation Scale (RASS) was created to optimize sedation.[11] The Glasgow Coma Scale (GCS) was developed for head‐trauma patients[12] and is now a standardized assessment tool in intensive care units,[13] the emergency department,[14] and the prehospital setting.[15] In addition, a simplified scale, AVPU (Alert, responsive to Verbal stimuli, responsive to Painful stimuli, and Unresponsive) was initially used in the primary survey of trauma patients[16] but is now a common component of early‐warning scores and rapid response activation criteria, such as the Modified Early Warning Score (MEWS).[17, 18] In fact, in a systematic review of 72 distinct early‐warning scores, 89% of the scores used AVPU as the measure of mentation.[17] However, the utility of these 3 scales is not well established in the general‐ward setting. Our aim was therefore to compare the accuracies of AVPU, GCS, and RASS for predicting mortality in hospitalized general‐ward patients to provide insight into the accuracy of these different scores for clinical deterioration.
METHODS
Study Setting and Protocol
We conducted an observational cohort study of consecutive adult general‐ward admissions from July 2011 through January 2013 at a 500‐bed, urban US teaching hospital. During the study period, no early‐warning scoring systems were in place on the hospital wards. Rapid response teams responding to altered mental status would do so without specific thresholds for activation. During this period, nurses on the general floors were expected to record each patient's GCS and RASS score in the electronic health record (EPIC Systems Corp., Verona, WI) as part of the routine patient assessment at least once every 12‐hour shift. AVPU assessments were extracted from the eye component of the GCS. The letter A was assigned to a GCS Eye score of 4 (opens eyes spontaneously), V to a score of 3 (opens eyes in response to voice), P to a score of 2 (opens eyes in response to painful stimuli), and U to a score of 1 (does not open eyes). To avoid comparison of mental‐status scores at different time points, only concurrent GCS and RASS scores, documented within 10 minutes of one another, were included in the analysis.
Location and time‐stamped GCS and RASS scores, demographics, and in‐hospital mortality data were obtained from the hospital's Clinical Research Data Warehouse, which is maintained by the Center for Research Informatics at The University of Chicago. The study protocol and data‐collection mechanisms were approved by The University of Chicago Institutional Review Board (#16995A).
Statistical Analysis
Baseline admission characteristics were described using proportions (%) and measures of central tendency (mean, standard deviations [SD]; median, interquartile ranges [IQR]). Patient severity of illness at first ward observation was calculated using the MEWS.[19] All mental‐status observations during a patient's ward stay were included in the analysis. Odds ratios for 24‐hour mortality following an abnormal mental‐status score were calculated using generalized estimating equations, with an exchangeable correlation structure to account for the correlation of scores within the same patient, as more than 1 abnormal mental‐status score may have been documented within the 24 hours preceding death. Spearman's rank correlation coefficients () were used to estimate the correlation among AVPU, GCS, and RASS scores.
The predictive accuracies of AVPU, GCS, RASS, and the subscales of GCS were compared using the area under the receiver operating characteristic curve (AUC), with mortality within 24 hours of a mental‐status observation as the primary outcome and the mental‐status score as the predictor variable. Although AUCs are typically used as a measure of discriminative ability, this study used AUCs to summarize both sensitivity and specificity across a range of cutoffs, providing an overall measure of predictive accuracies across mental‐status scales. To estimate AUCs, the AVPU, GCS, and GCS subscales were entered into a logistic regression model as ordinal variables, whereas RASS was entered as a nominal variable due to its positive and negative components, and predicted probabilities were calculated. In addition, a combined model was fit where GCS and RASS were classified as categorical independent variables. AUCs were then calculated by utilizing the predicted probabilities from each logistic regression model using the trapezoidal rule.[20] A sensitivity analysis was performed to estimate the internal validity of the RASS model using 10‐fold cross‐validation.
Predefined subgroup analyses were performed that compared the accuracies of AVPU, GCS, and RASS for predicting 24‐hour mortality in patients above and below the median age of the study population, and between patients who underwent surgery during their admission or not (surgical vs medical). All tests of significance used a 2‐sided P value <0.05. All data analysis was performed using Stata version 13.0 (StataCorp, College Station, TX).
RESULTS
During the study period, 313,577 complete GCS and 305,177 RASS scores were recorded in the electronic health record by nursing staff. A total of 26,806 (17,603 GCS and 9203 RASS) observations were excluded due to nonsimultaneous measurement of the other score, resulting in 295,974 paired mental‐status observations. These observations were obtained from 26,873 admissions in 17,660 unique patients, with a median MEWS at ward admission of 1 (IQR 11). The mean patient age was 57 years (SD 17), and 23% were surgical patients (Table 1). Patients spent a median 63.9 hours (IQR 26.7118.6) on the wards per admission and contributed a median of 3 paired observations (IQR 24) per day, with 91% of patients having at least 2 observations per day. A total of 417 (1.6%) general‐ward admissions resulted in death during the hospitalization, with 354 mental‐status observations occurring within 24 hours of a death. In addition, 26,618 (99.9%) admissions had at least 1 paired mental‐status observation within the last 24 hours of their ward stay.
| |
| Total no. of admissions | 26,873 |
| Total no. of unique patients | 17,660 |
| Age, y, mean (SD) | 57 (17) |
| Female sex, n (%) | 14,293 (53) |
| Race, n (%) | |
| White | 10,516 (39) |
| Black | 12,580 (47) |
| Other/unknown | 3,777 (14) |
| Admission MEWS, median (IQR) | 1 (11) |
| Days on ward, median (IQR) | 5 (310) |
| Observations per person, per day, median (IQR) | 3 (24) |
| Underwent surgery during hospitalization, n (%) | 6,141 (23) |
| Deaths, n (%) | 417 (1.6) |
AVPU was moderately correlated with GCS (Spearman's =0.56) (Figure 1a) and weakly correlated with RASS (Spearman's =0.28) (Figure 1b). GCS scores were also weakly correlated to RASS (Spearman's =0.13, P<0.001). Notably, AVPU mapped to distinct levels of GCS, with Alert associated with a median GCS total score of 15, Voice a score of 12, Pain a score of 8, and Unresponsive a score of 5. Abnormal mental‐status scores on any scale were associated with significantly higher odds of death within 24 hours than normal mental‐status scores (Table 2). This association was consistent within the 3 subscales of GCS and for scores in both the sedation (<0) and agitation (>0) ranges of RASS.
| Mental‐status Score | Observations, n (%) | Odds Ratio for Mortality (95% CI) |
|---|---|---|
| ||
| GCS Eye (AVPU) | ||
| 4 (alert) | 289,857 (98) | Reference |
| <4 (not alert) | 6,117 (2) | 33.8 (23.947.9) |
| GCS Verbal | ||
| 5 | 277,862 (94) | Reference |
| 4 | 11,258 (4) | 4.7 (2.87.9) |
| <4 | 6,854 (2) | 52.7 (38.073.2) |
| GCS Motor | ||
| 6 | 287,441 (97) | Reference |
| <6 | 8,533 (3) | 41.8 (30.756.9) |
| GCS total | ||
| 15 | 276,042 (93) | Reference |
| 13, 14 | 12,437 (4) | 5.2 (3.38.3) |
| <13 | 7,495 (3) | 55.5 (40.077.1) |
| RASS | ||
| >0 | 6,867 (2) | 8.5 (5.613.0) |
| 0 | 275,708 (93) | Reference |
| <0 | 13,339 (5) | 25.8 (19.234.6) |
AVPU was the least accurate predictor of mortality (AUC 0.73 [95% confidence interval {CI}: 0.710.76]), whereas simultaneous use of GCS and RASS was the most accurate predictor (AUC 0.85 [95% CI: 0.820.87] (Figure 2). The accuracies of GCS and RASS were not significantly different from one another in the total study population (AUC 0.80 [95% CI: 0.770.83] and 0.82 [0.790.84], respectively, P=0.13). Ten‐fold cross‐validation to estimate the internal validity of the RASS model resulted in a lower AUC (0.78 [95% CI: 0.750.81]) for RASS as a predictor of 24‐hour mortality. Subgroup analysis indicated that RASS was more accurate than GCS in younger patients (<57 years old) and in surgical patients (Figure 3).
Removal of the 255 admissions missing a paired mental‐status observation within the last 24 hours of their ward stay resulted in no change in the AUC values. A sensitivity analysis for prediction of a combined secondary outcome of 24‐hour intensive care unit ICU transfer or cardiac arrest yielded lower AUCs for each mental‐status scale, with no change in the association among scales.
DISCUSSION
To our knowledge, this study is the first to compare the accuracies of AVPU, GCS, and RASS for predicting mortality in the general‐ward setting. Similar to McNarry and Goldhill, we demonstrated that AVPU scores mapped to distinct levels of GCS. Although our study reports the same median GCS scores of 15 and 8 for AVPU levels of Alert and Pain, respectively, we indicate slightly lower corresponding median GCS scores for AVPU scores of Voice (12 vs 13) and Unresponsive (5 vs 6) than their previous work.[21] We found that AVPU was the least accurate predictor of mortality within 24 hours of an observation, and the combination of GCS and RASS was the most accurate. RASS was at least as accurate a predictor for 24‐hour mortality in comparison to GCS total in the overall study population. However, the RASS score was the most accurate individual score in surgical and younger patients. These findings suggest that changing from the commonly used AVPU scale to the RASS and/or GCS would improve the prognostic ability of mental‐status assessments on the general wards.
Buist and colleagues have previously demonstrated altered mental status to be one of the strongest predictors of death on the wards. In that study, a GCS score of 3 and a decrease in GCS score by more than 2 points were independently associated with mortality (odds ratio 6.1 [95% CI: 3.111.8] and 5.5 [95% CI: 2.611.9], respectively).[22] We have also previously shown that after adjusting for vital signs, being unresponsive to pain was associated with a 4.5‐fold increase in the odds of death within 24 hours,[23]whereas Subbe and colleagues showed a relative risk ratio of 5.2 (95% CI: 1.518.1) for the combined endpoint of cardiac arrest, death at 60 days, or admission to the intensive care/high dependency unit.[19] In the current study, the magnitude of these associations was even stronger, with a GCS score <13 correlating with a 55‐fold increase in the odds of death, compared to a normal GCS, and not being alert being associated with a 33.8‐fold increase in the odds of death. This difference in magnitude is likely a product of the univariate nature of the current analysis, compared to both the Buist et al. and Churpek et al. studies, which adjusted for vital signs, thereby lessening the impact of any single predictor. Because this study was designed to compare mental‐status variables to one another for future model inclusion, and all the analyses were paired, confounding by additional predictors of death was not a concern.
One of the potential strengths of RASS over GCS and AVPU is its ability to measure agitation levels, in addition to depressed mentation, a feature that has been shown to be present in up to 60% of delirium episodes.[24] This may also explain why RASS was the most accurate predictor of mortality in our subset of younger patients and surgical patients, because hyperactive delirium is more common in younger and healthier patients, which surgical patients tend to be as compared to medical patients.[25, 26] In this study, we found negative RASS scores portending a worse prognosis than positive ones, which supports previous findings that hypoactive delirium had a higher association with mortality than hyperactive delirium at 6 months (hazard ratio 1.90 vs 1.37) and at 1 year (hazard ratio 1.60 vs 1.30) in elderly patients at postacute‐care facilities in 2 separate studies.[27, 28] However, a study of patients undergoing surgery for hip fracture found that patients with hyperactive delirium were more likely to die or be placed in a nursing home at 1 month follow‐up when compared to patients with purely hypoactive delirium (79% vs 32%, P=0.003).[29]
We found the assessment of RASS and GCS by ward nurses to be highly feasible. During the study period, nurses assessed mental status with the GCS and RASS scales at least once per 12‐hour shift in 91% of patients. GCS has been shown to be reliably and accurately recorded by experienced nurses (reliability coefficient=0.944 with 96.4% agreement with expert ratings).[30] RASS can take <30 seconds to administer, and in previous studies of the ICU setting has been shown to have over 94% nurse compliance for administration,[31] and good inter‐rater reliability (weighted kappa 0.66 and 0.89, respectively).[31, 32] Further, in a prior survey of 55 critical care nurses, 82% agreed that RASS was easy to score and clinically relevant.[31]
This study has several limitations. First, it was conducted in a single academic institution, which may limit generalizability to other hospitals. Second, baseline cognition and comorbidities were not available in the dataset, so we were unable to conduct additional subgroup analyses by these categories. However, we used age and hospital admission type as proxies. Third, the AVPU scores in this study were extracted from the Eye subset of the GCS scale, as AVPU was not directly assessed on our wards during the study period. Clinical assessment of mental status on the AVPU scale notes the presence of any active patient response (eg, eye opening, grunting, moaning, movement) to increasingly noxious stimuli. As such, our adaptation of AVPU using only eye‐opening criteria may underestimate the true number of patients correctly classified as alert, or responding to vocal/painful stimuli. However, a sensitivity analysis comparing directly assessed AVPU during a 3‐year period prior to the study implementation at our institution, and AVPU derived from the GCS Eye subscale for the study period, indicated no difference in predictive value for 24‐hour mortality. Fourth, we did not perform trend analyses for change from baseline mental status or evolution of AMS, which may more accurately predict 24‐hour mortality than discrete mental‐status observations. Finally, the 3 scales we compared differ in length, which may bias the AUC against AVPU, a 4‐point scale with a trapezoidal ROC curve compared to the smoother curve generated by the 15‐point GCS scale, for example. However, the lack of discrimination of the AVPU is the likely source of its lesser accuracy.
CONCLUSION
In the general‐ward setting, routine collection of GCS and RASS is feasible, and both are significantly more accurate for predicting mortality than the more commonly used AVPU scale. In addition, the combination of GCS and RASS has greater accuracy than any of the 3 individual scales. RASS may be particularly beneficial in the assessment of younger and/or surgical patients. Routine documentation and tracking of GCS and/or RASS by nurses may improve the detection of clinical deterioration in general‐ward patients. In addition, future early‐warning scores may benefit from the inclusion of GCS and/or RASS in lieu of AVPU.
Disclosures
Drs. Churpek and Edelson have a patent pending (ARCD. P0535US.P2) for risk stratification algorithms for hospitalized patients. Dr. Churpek is supported by a career development award from the National Heart, Lung, and Blood Institute (K08 HL121080). Dr. Edelson has received research support from the National Heart, Lung, and Blood Institute (K23 HL097157), Philips (Andover, MA), the American Heart Association (Dallas, TX), Laerdal Medical (Stavanger, Norway), and Early Sense (Tel Aviv, Israel). She has ownership interest in Quant HC (Chicago, IL), which is developing products for risk stratification of hospitalized patients. All other authors report no conflicts of interest.
- , , , et al. Delirium as a predictor of mortality in mechanically ventilated patients in the intensive care unit. JAMA. 2004;291(14):1753–1762.
- , , , , , Delirium in hospitalized older persons: outcomes and predictors. J Am Geriatr Soc. 1994;42(8):809–815.
- , , Occurrence and outcome of delirium in medical in‐patients: a systematic literature review. Age Ageing. 2006;35(4):350–364.
- , , , et al. Delirium. The occurrence and persistence of symptoms among elderly hospitalized patients. Arch Intern Med. 1992;152(2):334–340.
- , , Postoperative delirium. A review of 80 primary data‐collection studies. Arch Intern Med. 1995;155(5):461–465.
- , , , , Nurses' recognition of delirium and its symptoms: comparison of nurse and researcher ratings. Arch Intern Med. 2001;161(20):2467–2473.
- , , The misdiagnosis of delirium. Psychosomatics. 1997;38(5):433–439.
- , , , et al. Current opinions regarding the importance, diagnosis, and management of delirium in the intensive care unit: a survey of 912 healthcare professionals. Crit Care Med. 2004;32(1):106–112.
- , Misdiagnosing delirium as depression in medically ill elderly patients. Arch Intern Med. 1995;155(22):2459–2464.
- Doctors and nurses use of the word confused. Br J Psychiatry. 1984;145:441–443.
- , , , et al. The Richmond Agitation‐Sedation Scale: validity and reliability in adult intensive care unit patients. Am J Respir Crit Care Med. 2002;166(10):1338–1344.
- , Assessment and prognosis of coma after head injury. Acta Neurochir (Wien). 1976;34(1–4):45–55.
- , , , , Glasgow Coma Scale score in the evaluation of outcome in the intensive care unit: findings from the Acute Physiology and Chronic Health Evaluation III study. Crit Care Med. 1993;21(10):1459–1465.
- , , Variability in agreement between physicians and nurses when measuring the Glasgow Coma Scale in the emergency department limits its clinical usefulness. Emerg Med Australas. 2006;18(4):379–384.
- , , , Reliability of the Glasgow Coma Scale when used by emergency physicians and paramedics. J Trauma. 1993;34(1):46–48.
- , ; American College of Surgeons. Committee on Trauma. Advanced Trauma Life Support Program For Physicians: ATLS. 5th ed. Chicago, IL: American College of Surgeons; 1993.
- , , , Review and performance evaluation of aggregate weighted 'track and trigger' systems. Resuscitation. 2008;77(2):170–179.
- , , , , A review, and performance evaluation, of single‐parameter “track and trigger” systems. Resuscitation. 2008;79(1):11–21.
- , , , Validation of a modified Early Warning score in medical admissions. QJM. 2001;94(10):521–526.
- , , Comparing the areas under two or more correlated receiver operating characteristic curves: a nonparametric approach. Biometrics. 1988;44(3):837–845.
- , Simple bedside assessment of level of consciousness: comparison of two simple assessment scales with the Glascow Coma Scale. Anaesthesia. 2004;59(1):34–37.
- , , , , Association between clinically abnormal observations and subsequent in‐hospital mortality: a prospective study. Resuscitation. 2004;62(2):137–141.
- , , Predicting clinical deterioration in the hospital: the impact of outcome selection. Resuscitation. 2013;84(5):564–568.
- , , , et al. Delirium and its motoric subtypes: a study of 614 critically ill patients. J Am Geriatr Soc. 2006;54(3):479–484.
- , , , et al. Risk factors for delirium after major trauma. Am J Surg. 2008;196(6):864–869.
- , , , , Relationship between symptoms and motoric subtype of delirium. J Neuropsychiatry Clin Neurosci. 2000;12(1):51–56.
- , , , et al. Phenomenological subtypes of delirium in older persons: patterns, prevalence, and prognosis. Psychosomatics. 2009;50(3):248–254.
- , , , Association between psychomotor activity delirium subtypes and mortality among newly admitted post‐acute facility patients. J Gerontol A Biol Sci Med Sci. 2007;62(2):174–179.
- , , , Delirium severity and psychomotor types: their relationship with outcomes after hip fracture repair. J Am Geriatr Soc. 2002;50(5):850–857.
- , Reliability and accuracy of the Glasgow Coma Scale with experienced and inexperienced users. Lancet. 1991;337(8740):535–538.
- , , , et al. Large‐scale implementation of sedation and delirium monitoring in the intensive care unit: a report from two medical centers. Crit Care Med. 2005;33(6):1199–1205.
- , , , et al. Delirium and sedation recognition using validated instruments: reliability of bedside intensive care unit nursing assessments from 2007 to 2010. J Am Geriatr Soc. 2011;59(suppl 2):S249–S255.
Altered mental status (AMS), characterized by abnormal changes in a patient's arousal and/or cognition, is a significant predictor of hospital mortality.[1, 2, 3] Yet despite its prevalence[3, 4, 5] and importance, up to three‐quarters of AMS events go unrecognized by caregivers.[6, 7, 8] Acute changes in mental status, often caused by delirium in the hospitalized patient,[3] can present nonspecifically, making it difficult to detect and distinguish from other diagnoses such as depression or dementia.[7, 9] Further complicating the recognition of AMS, numerous and imprecise qualitative descriptors such as confused and alert and oriented are used in clinical practice to describe the mental status of patients.[10] Thus, more objective measures may result in improved detection of altered mental status and in earlier diagnostic and therapeutic interventions.
In critically ill patients, several scales have been widely adopted for quantifying mental status. The Richmond Agitation and Sedation Scale (RASS) was created to optimize sedation.[11] The Glasgow Coma Scale (GCS) was developed for head‐trauma patients[12] and is now a standardized assessment tool in intensive care units,[13] the emergency department,[14] and the prehospital setting.[15] In addition, a simplified scale, AVPU (Alert, responsive to Verbal stimuli, responsive to Painful stimuli, and Unresponsive) was initially used in the primary survey of trauma patients[16] but is now a common component of early‐warning scores and rapid response activation criteria, such as the Modified Early Warning Score (MEWS).[17, 18] In fact, in a systematic review of 72 distinct early‐warning scores, 89% of the scores used AVPU as the measure of mentation.[17] However, the utility of these 3 scales is not well established in the general‐ward setting. Our aim was therefore to compare the accuracies of AVPU, GCS, and RASS for predicting mortality in hospitalized general‐ward patients to provide insight into the accuracy of these different scores for clinical deterioration.
METHODS
Study Setting and Protocol
We conducted an observational cohort study of consecutive adult general‐ward admissions from July 2011 through January 2013 at a 500‐bed, urban US teaching hospital. During the study period, no early‐warning scoring systems were in place on the hospital wards. Rapid response teams responding to altered mental status would do so without specific thresholds for activation. During this period, nurses on the general floors were expected to record each patient's GCS and RASS score in the electronic health record (EPIC Systems Corp., Verona, WI) as part of the routine patient assessment at least once every 12‐hour shift. AVPU assessments were extracted from the eye component of the GCS. The letter A was assigned to a GCS Eye score of 4 (opens eyes spontaneously), V to a score of 3 (opens eyes in response to voice), P to a score of 2 (opens eyes in response to painful stimuli), and U to a score of 1 (does not open eyes). To avoid comparison of mental‐status scores at different time points, only concurrent GCS and RASS scores, documented within 10 minutes of one another, were included in the analysis.
Location and time‐stamped GCS and RASS scores, demographics, and in‐hospital mortality data were obtained from the hospital's Clinical Research Data Warehouse, which is maintained by the Center for Research Informatics at The University of Chicago. The study protocol and data‐collection mechanisms were approved by The University of Chicago Institutional Review Board (#16995A).
Statistical Analysis
Baseline admission characteristics were described using proportions (%) and measures of central tendency (mean, standard deviations [SD]; median, interquartile ranges [IQR]). Patient severity of illness at first ward observation was calculated using the MEWS.[19] All mental‐status observations during a patient's ward stay were included in the analysis. Odds ratios for 24‐hour mortality following an abnormal mental‐status score were calculated using generalized estimating equations, with an exchangeable correlation structure to account for the correlation of scores within the same patient, as more than 1 abnormal mental‐status score may have been documented within the 24 hours preceding death. Spearman's rank correlation coefficients () were used to estimate the correlation among AVPU, GCS, and RASS scores.
The predictive accuracies of AVPU, GCS, RASS, and the subscales of GCS were compared using the area under the receiver operating characteristic curve (AUC), with mortality within 24 hours of a mental‐status observation as the primary outcome and the mental‐status score as the predictor variable. Although AUCs are typically used as a measure of discriminative ability, this study used AUCs to summarize both sensitivity and specificity across a range of cutoffs, providing an overall measure of predictive accuracies across mental‐status scales. To estimate AUCs, the AVPU, GCS, and GCS subscales were entered into a logistic regression model as ordinal variables, whereas RASS was entered as a nominal variable due to its positive and negative components, and predicted probabilities were calculated. In addition, a combined model was fit where GCS and RASS were classified as categorical independent variables. AUCs were then calculated by utilizing the predicted probabilities from each logistic regression model using the trapezoidal rule.[20] A sensitivity analysis was performed to estimate the internal validity of the RASS model using 10‐fold cross‐validation.
Predefined subgroup analyses were performed that compared the accuracies of AVPU, GCS, and RASS for predicting 24‐hour mortality in patients above and below the median age of the study population, and between patients who underwent surgery during their admission or not (surgical vs medical). All tests of significance used a 2‐sided P value <0.05. All data analysis was performed using Stata version 13.0 (StataCorp, College Station, TX).
RESULTS
During the study period, 313,577 complete GCS and 305,177 RASS scores were recorded in the electronic health record by nursing staff. A total of 26,806 (17,603 GCS and 9203 RASS) observations were excluded due to nonsimultaneous measurement of the other score, resulting in 295,974 paired mental‐status observations. These observations were obtained from 26,873 admissions in 17,660 unique patients, with a median MEWS at ward admission of 1 (IQR 11). The mean patient age was 57 years (SD 17), and 23% were surgical patients (Table 1). Patients spent a median 63.9 hours (IQR 26.7118.6) on the wards per admission and contributed a median of 3 paired observations (IQR 24) per day, with 91% of patients having at least 2 observations per day. A total of 417 (1.6%) general‐ward admissions resulted in death during the hospitalization, with 354 mental‐status observations occurring within 24 hours of a death. In addition, 26,618 (99.9%) admissions had at least 1 paired mental‐status observation within the last 24 hours of their ward stay.
| |
| Total no. of admissions | 26,873 |
| Total no. of unique patients | 17,660 |
| Age, y, mean (SD) | 57 (17) |
| Female sex, n (%) | 14,293 (53) |
| Race, n (%) | |
| White | 10,516 (39) |
| Black | 12,580 (47) |
| Other/unknown | 3,777 (14) |
| Admission MEWS, median (IQR) | 1 (11) |
| Days on ward, median (IQR) | 5 (310) |
| Observations per person, per day, median (IQR) | 3 (24) |
| Underwent surgery during hospitalization, n (%) | 6,141 (23) |
| Deaths, n (%) | 417 (1.6) |
AVPU was moderately correlated with GCS (Spearman's =0.56) (Figure 1a) and weakly correlated with RASS (Spearman's =0.28) (Figure 1b). GCS scores were also weakly correlated to RASS (Spearman's =0.13, P<0.001). Notably, AVPU mapped to distinct levels of GCS, with Alert associated with a median GCS total score of 15, Voice a score of 12, Pain a score of 8, and Unresponsive a score of 5. Abnormal mental‐status scores on any scale were associated with significantly higher odds of death within 24 hours than normal mental‐status scores (Table 2). This association was consistent within the 3 subscales of GCS and for scores in both the sedation (<0) and agitation (>0) ranges of RASS.
| Mental‐status Score | Observations, n (%) | Odds Ratio for Mortality (95% CI) |
|---|---|---|
| ||
| GCS Eye (AVPU) | ||
| 4 (alert) | 289,857 (98) | Reference |
| <4 (not alert) | 6,117 (2) | 33.8 (23.947.9) |
| GCS Verbal | ||
| 5 | 277,862 (94) | Reference |
| 4 | 11,258 (4) | 4.7 (2.87.9) |
| <4 | 6,854 (2) | 52.7 (38.073.2) |
| GCS Motor | ||
| 6 | 287,441 (97) | Reference |
| <6 | 8,533 (3) | 41.8 (30.756.9) |
| GCS total | ||
| 15 | 276,042 (93) | Reference |
| 13, 14 | 12,437 (4) | 5.2 (3.38.3) |
| <13 | 7,495 (3) | 55.5 (40.077.1) |
| RASS | ||
| >0 | 6,867 (2) | 8.5 (5.613.0) |
| 0 | 275,708 (93) | Reference |
| <0 | 13,339 (5) | 25.8 (19.234.6) |
AVPU was the least accurate predictor of mortality (AUC 0.73 [95% confidence interval {CI}: 0.710.76]), whereas simultaneous use of GCS and RASS was the most accurate predictor (AUC 0.85 [95% CI: 0.820.87] (Figure 2). The accuracies of GCS and RASS were not significantly different from one another in the total study population (AUC 0.80 [95% CI: 0.770.83] and 0.82 [0.790.84], respectively, P=0.13). Ten‐fold cross‐validation to estimate the internal validity of the RASS model resulted in a lower AUC (0.78 [95% CI: 0.750.81]) for RASS as a predictor of 24‐hour mortality. Subgroup analysis indicated that RASS was more accurate than GCS in younger patients (<57 years old) and in surgical patients (Figure 3).
Removal of the 255 admissions missing a paired mental‐status observation within the last 24 hours of their ward stay resulted in no change in the AUC values. A sensitivity analysis for prediction of a combined secondary outcome of 24‐hour intensive care unit ICU transfer or cardiac arrest yielded lower AUCs for each mental‐status scale, with no change in the association among scales.
DISCUSSION
To our knowledge, this study is the first to compare the accuracies of AVPU, GCS, and RASS for predicting mortality in the general‐ward setting. Similar to McNarry and Goldhill, we demonstrated that AVPU scores mapped to distinct levels of GCS. Although our study reports the same median GCS scores of 15 and 8 for AVPU levels of Alert and Pain, respectively, we indicate slightly lower corresponding median GCS scores for AVPU scores of Voice (12 vs 13) and Unresponsive (5 vs 6) than their previous work.[21] We found that AVPU was the least accurate predictor of mortality within 24 hours of an observation, and the combination of GCS and RASS was the most accurate. RASS was at least as accurate a predictor for 24‐hour mortality in comparison to GCS total in the overall study population. However, the RASS score was the most accurate individual score in surgical and younger patients. These findings suggest that changing from the commonly used AVPU scale to the RASS and/or GCS would improve the prognostic ability of mental‐status assessments on the general wards.
Buist and colleagues have previously demonstrated altered mental status to be one of the strongest predictors of death on the wards. In that study, a GCS score of 3 and a decrease in GCS score by more than 2 points were independently associated with mortality (odds ratio 6.1 [95% CI: 3.111.8] and 5.5 [95% CI: 2.611.9], respectively).[22] We have also previously shown that after adjusting for vital signs, being unresponsive to pain was associated with a 4.5‐fold increase in the odds of death within 24 hours,[23]whereas Subbe and colleagues showed a relative risk ratio of 5.2 (95% CI: 1.518.1) for the combined endpoint of cardiac arrest, death at 60 days, or admission to the intensive care/high dependency unit.[19] In the current study, the magnitude of these associations was even stronger, with a GCS score <13 correlating with a 55‐fold increase in the odds of death, compared to a normal GCS, and not being alert being associated with a 33.8‐fold increase in the odds of death. This difference in magnitude is likely a product of the univariate nature of the current analysis, compared to both the Buist et al. and Churpek et al. studies, which adjusted for vital signs, thereby lessening the impact of any single predictor. Because this study was designed to compare mental‐status variables to one another for future model inclusion, and all the analyses were paired, confounding by additional predictors of death was not a concern.
One of the potential strengths of RASS over GCS and AVPU is its ability to measure agitation levels, in addition to depressed mentation, a feature that has been shown to be present in up to 60% of delirium episodes.[24] This may also explain why RASS was the most accurate predictor of mortality in our subset of younger patients and surgical patients, because hyperactive delirium is more common in younger and healthier patients, which surgical patients tend to be as compared to medical patients.[25, 26] In this study, we found negative RASS scores portending a worse prognosis than positive ones, which supports previous findings that hypoactive delirium had a higher association with mortality than hyperactive delirium at 6 months (hazard ratio 1.90 vs 1.37) and at 1 year (hazard ratio 1.60 vs 1.30) in elderly patients at postacute‐care facilities in 2 separate studies.[27, 28] However, a study of patients undergoing surgery for hip fracture found that patients with hyperactive delirium were more likely to die or be placed in a nursing home at 1 month follow‐up when compared to patients with purely hypoactive delirium (79% vs 32%, P=0.003).[29]
We found the assessment of RASS and GCS by ward nurses to be highly feasible. During the study period, nurses assessed mental status with the GCS and RASS scales at least once per 12‐hour shift in 91% of patients. GCS has been shown to be reliably and accurately recorded by experienced nurses (reliability coefficient=0.944 with 96.4% agreement with expert ratings).[30] RASS can take <30 seconds to administer, and in previous studies of the ICU setting has been shown to have over 94% nurse compliance for administration,[31] and good inter‐rater reliability (weighted kappa 0.66 and 0.89, respectively).[31, 32] Further, in a prior survey of 55 critical care nurses, 82% agreed that RASS was easy to score and clinically relevant.[31]
This study has several limitations. First, it was conducted in a single academic institution, which may limit generalizability to other hospitals. Second, baseline cognition and comorbidities were not available in the dataset, so we were unable to conduct additional subgroup analyses by these categories. However, we used age and hospital admission type as proxies. Third, the AVPU scores in this study were extracted from the Eye subset of the GCS scale, as AVPU was not directly assessed on our wards during the study period. Clinical assessment of mental status on the AVPU scale notes the presence of any active patient response (eg, eye opening, grunting, moaning, movement) to increasingly noxious stimuli. As such, our adaptation of AVPU using only eye‐opening criteria may underestimate the true number of patients correctly classified as alert, or responding to vocal/painful stimuli. However, a sensitivity analysis comparing directly assessed AVPU during a 3‐year period prior to the study implementation at our institution, and AVPU derived from the GCS Eye subscale for the study period, indicated no difference in predictive value for 24‐hour mortality. Fourth, we did not perform trend analyses for change from baseline mental status or evolution of AMS, which may more accurately predict 24‐hour mortality than discrete mental‐status observations. Finally, the 3 scales we compared differ in length, which may bias the AUC against AVPU, a 4‐point scale with a trapezoidal ROC curve compared to the smoother curve generated by the 15‐point GCS scale, for example. However, the lack of discrimination of the AVPU is the likely source of its lesser accuracy.
CONCLUSION
In the general‐ward setting, routine collection of GCS and RASS is feasible, and both are significantly more accurate for predicting mortality than the more commonly used AVPU scale. In addition, the combination of GCS and RASS has greater accuracy than any of the 3 individual scales. RASS may be particularly beneficial in the assessment of younger and/or surgical patients. Routine documentation and tracking of GCS and/or RASS by nurses may improve the detection of clinical deterioration in general‐ward patients. In addition, future early‐warning scores may benefit from the inclusion of GCS and/or RASS in lieu of AVPU.
Disclosures
Drs. Churpek and Edelson have a patent pending (ARCD. P0535US.P2) for risk stratification algorithms for hospitalized patients. Dr. Churpek is supported by a career development award from the National Heart, Lung, and Blood Institute (K08 HL121080). Dr. Edelson has received research support from the National Heart, Lung, and Blood Institute (K23 HL097157), Philips (Andover, MA), the American Heart Association (Dallas, TX), Laerdal Medical (Stavanger, Norway), and Early Sense (Tel Aviv, Israel). She has ownership interest in Quant HC (Chicago, IL), which is developing products for risk stratification of hospitalized patients. All other authors report no conflicts of interest.
- , , , et al. Delirium as a predictor of mortality in mechanically ventilated patients in the intensive care unit. JAMA. 2004;291(14):1753–1762.
- , , , , , Delirium in hospitalized older persons: outcomes and predictors. J Am Geriatr Soc. 1994;42(8):809–815.
- , , Occurrence and outcome of delirium in medical in‐patients: a systematic literature review. Age Ageing. 2006;35(4):350–364.
- , , , et al. Delirium. The occurrence and persistence of symptoms among elderly hospitalized patients. Arch Intern Med. 1992;152(2):334–340.
- , , Postoperative delirium. A review of 80 primary data‐collection studies. Arch Intern Med. 1995;155(5):461–465.
- , , , , Nurses' recognition of delirium and its symptoms: comparison of nurse and researcher ratings. Arch Intern Med. 2001;161(20):2467–2473.
- , , The misdiagnosis of delirium. Psychosomatics. 1997;38(5):433–439.
- , , , et al. Current opinions regarding the importance, diagnosis, and management of delirium in the intensive care unit: a survey of 912 healthcare professionals. Crit Care Med. 2004;32(1):106–112.
- , Misdiagnosing delirium as depression in medically ill elderly patients. Arch Intern Med. 1995;155(22):2459–2464.
- Doctors and nurses use of the word confused. Br J Psychiatry. 1984;145:441–443.
- , , , et al. The Richmond Agitation‐Sedation Scale: validity and reliability in adult intensive care unit patients. Am J Respir Crit Care Med. 2002;166(10):1338–1344.
- , Assessment and prognosis of coma after head injury. Acta Neurochir (Wien). 1976;34(1–4):45–55.
- , , , , Glasgow Coma Scale score in the evaluation of outcome in the intensive care unit: findings from the Acute Physiology and Chronic Health Evaluation III study. Crit Care Med. 1993;21(10):1459–1465.
- , , Variability in agreement between physicians and nurses when measuring the Glasgow Coma Scale in the emergency department limits its clinical usefulness. Emerg Med Australas. 2006;18(4):379–384.
- , , , Reliability of the Glasgow Coma Scale when used by emergency physicians and paramedics. J Trauma. 1993;34(1):46–48.
- , ; American College of Surgeons. Committee on Trauma. Advanced Trauma Life Support Program For Physicians: ATLS. 5th ed. Chicago, IL: American College of Surgeons; 1993.
- , , , Review and performance evaluation of aggregate weighted 'track and trigger' systems. Resuscitation. 2008;77(2):170–179.
- , , , , A review, and performance evaluation, of single‐parameter “track and trigger” systems. Resuscitation. 2008;79(1):11–21.
- , , , Validation of a modified Early Warning score in medical admissions. QJM. 2001;94(10):521–526.
- , , Comparing the areas under two or more correlated receiver operating characteristic curves: a nonparametric approach. Biometrics. 1988;44(3):837–845.
- , Simple bedside assessment of level of consciousness: comparison of two simple assessment scales with the Glascow Coma Scale. Anaesthesia. 2004;59(1):34–37.
- , , , , Association between clinically abnormal observations and subsequent in‐hospital mortality: a prospective study. Resuscitation. 2004;62(2):137–141.
- , , Predicting clinical deterioration in the hospital: the impact of outcome selection. Resuscitation. 2013;84(5):564–568.
- , , , et al. Delirium and its motoric subtypes: a study of 614 critically ill patients. J Am Geriatr Soc. 2006;54(3):479–484.
- , , , et al. Risk factors for delirium after major trauma. Am J Surg. 2008;196(6):864–869.
- , , , , Relationship between symptoms and motoric subtype of delirium. J Neuropsychiatry Clin Neurosci. 2000;12(1):51–56.
- , , , et al. Phenomenological subtypes of delirium in older persons: patterns, prevalence, and prognosis. Psychosomatics. 2009;50(3):248–254.
- , , , Association between psychomotor activity delirium subtypes and mortality among newly admitted post‐acute facility patients. J Gerontol A Biol Sci Med Sci. 2007;62(2):174–179.
- , , , Delirium severity and psychomotor types: their relationship with outcomes after hip fracture repair. J Am Geriatr Soc. 2002;50(5):850–857.
- , Reliability and accuracy of the Glasgow Coma Scale with experienced and inexperienced users. Lancet. 1991;337(8740):535–538.
- , , , et al. Large‐scale implementation of sedation and delirium monitoring in the intensive care unit: a report from two medical centers. Crit Care Med. 2005;33(6):1199–1205.
- , , , et al. Delirium and sedation recognition using validated instruments: reliability of bedside intensive care unit nursing assessments from 2007 to 2010. J Am Geriatr Soc. 2011;59(suppl 2):S249–S255.
© 2015 Society of Hospital Medicine
