User login
VZV Meningoencephalitis
Case Report
A 66‐year‐old woman with a history of breast cancer treated with lumpectomy, chemotherapy, and radiation presented to the emergency department with a 1‐week history of left eye pain, progressive fatigue, and numbness and tingling on the left upper face. One week prior to presentation, she experienced dull pain in her left eye, anorexia, vomiting, and numbness and tingling in her upper left face. She was diagnosed with sinusitis by a local physician and prescribed a nasal spray and an unknown antibiotic. She became progressively weaker and fatigued and then 2 days prior to admission she noticed red papules on her forehead. She presented to the emergency department 1 day prior to admission. In the emergency department, she was diagnosed with herpes zoster ophthalmicus, placed on acyclovir, acetaminophen/hydrocodone, ondansetron, and trifluridine eye drops, and discharged. Her symptoms worsened throughout the night and she became progressively more somnolent. She was brought to the emergency department again the following day and was found to be extremely somnolent and oriented only to person. The patient's past medical history was significant for lobular carcinoma in situ of the breast, which was diagnosed 22 years ago and treated with a lumpectomy. She had a recurrence of ductal and lobular carcinoma in‐situ 20 years after her initial diagnosis and was treated with 3 months of chemotherapy, completed 13 months prior to admission, and 6 months of radiation therapy, completed 6 months prior to admission. Her physical examination was remarkable for an erythematous maculopapular rash in the distribution of the ophthalmic division of the trigeminal nerve, swelling of the left orbit such that she could not open her eye without assistance, and white mucus‐like drainage from the left eye. The area around the eyelid was tender and the left sclera was pink. Extraocular movements were intact and the pupils were equal, round, and reactive to light and accommodation. Cranial nerves III to XII were intact bilaterally; cerebellar function, sensation, proprioception, and deep tendon reflexes were also intact. The patient did not have any meningismus.
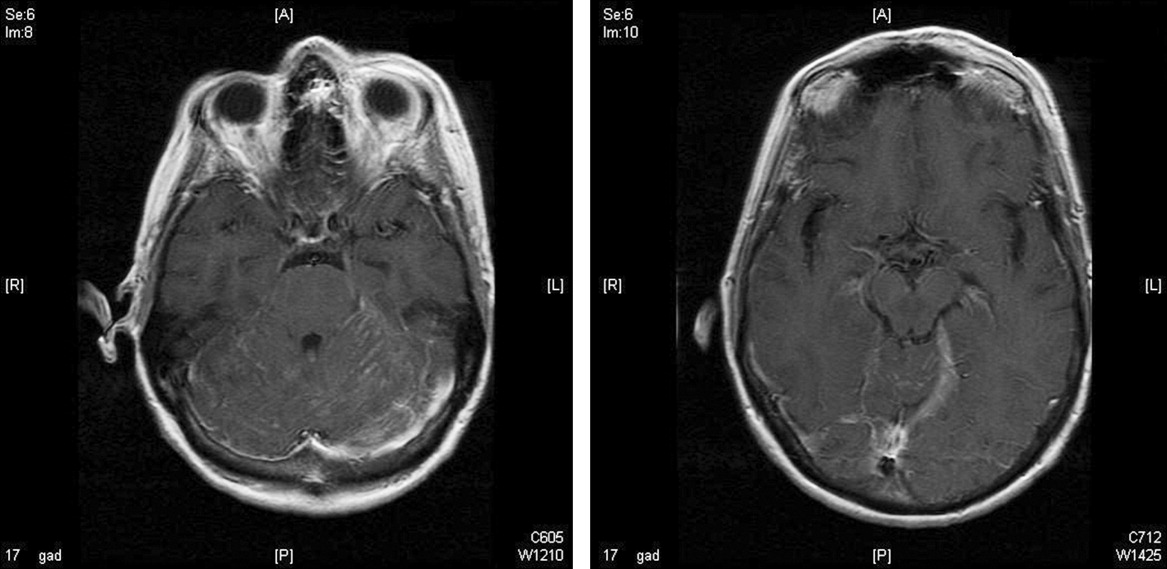
On lumbar puncture in the emergency department (ED), the cerebrospinal fluid (CSF) from tube 4 was found to have a glucose concentration of 52 mg/dL (blood glucose of 111 mg/dL), a protein concentration of 90 mg/dL, a red blood cell (RBC) count of 70 cells/mL, and 16 nucleated cells/mL with 67% lymphocytes and 20% monocytes. Viral cultures and polymerase chain reaction (PCR) for herpes simplex virus (HSV)‐1, HSV‐2, and varicella zoster virus (VZV) were sent to the laboratory. Therapy with acyclovir, vancomycin, and cefotaxime was initiated. Magnetic resonance imaging (MRI) revealed leptomeningeal and dural enhancement involving the posterior fossa, which was read to be consistent with infectious meningitis; temporal lobe involvement was not seen (Figure 1).
Additional results from the lumbar puncture were received the following day. PCR for HSV‐1 and HSV‐2 was found to be negative, while PCR for VZV was found to be positive. Treatment with intravenous (IV) acyclovir was continued. The patient's clinical condition improved significantly by the morning after admission and she was found to be less somnolent and alert and oriented to person, place, and time. Her condition continued to improve and she was discharged 4 days after admission after her mental status returned to baseline; the patient subsequently completed a 21‐day course of 540 mg twice a day IV acyclovir.
In the 9 months following her initial hospitalization, the patient was admitted multiple times to an outside hospital for varicella zoster meningitis and herpes zoster ophthalmicus, with complete resolution of her symptoms after each hospitalization. However, 10 months after her initial hospitalization, the patient presented to our hospital with lethargy and was found to have a recurrence of her breast cancer with metastatic disease. She was subsequently diagnosed with carcinomatous meningitis and passed away shortly after this diagnosis.
Discussion
The development of clinically significant varicella zosterassociated meningoencephalitis after herpes zoster ophthalmicus is rare. Cerebrospinal fluid PCR has been shown to have a sensitivity and specificity >95% for diagnosing VZV encephalitis.3 The interpretation of the MRI was consistent with several case reports in the literature that also described enhancing meningeal lesions on MRI in patients with varicella encephalitis.3
While subclinical invasion of VZV into the central nervous system (CNS) is relatively common, with approximately one‐third of asymptomatic immunocompetent patients having a CSF PCR positive for VZV and 46% of patients demonstrating CSF leukocytosis, it is rare for patients to present with the serious clinical manifestations seen in this case.4 It is hypothesized that herpes zosterassociated meningoencephalitis most likely occurs when the zoster involves the ophthalmic branch of the trigeminal nerve, allowing for the spread of the virus to the tentorium through the recurrent nerve of Arnold, which branches off the ophthalmic division of the trigeminal nerve.5 On review of the literature, there are very few studies and no controlled trials on the optimal treatment of this complication, although an empirical treatment of 15 to 30 mg of acyclovir per kilogram of body weight for 10 days has been suggested.3 There have been several reports of rapid responses to IV acyclovir but, due to the rarity of this complication, to our knowledge, no studies have been conducted to determine the optimal treatment of herpes zosterassociated meningoencephalitis.3, 6 A similar case of meningoencephalitis has been described in a 5‐year‐old boy whose presentation was similar to that of our patient, with periorbital vesicular lesions and mental status changes including somnolence. This child was treated with acyclovir and made a full recovery.7
Several other CNS‐related manifestations of CN zoster have been reported, including development of the syndrome of inappropriate antidiuretic hormone, development of contralateral hemiparesis, and the coexistence of Ramsay‐Hunt syndrome and zoster encephalitis (Table 1). It is hypothesized that stimulation of the ophthalmic division of the trigeminal nerve by the zoster virus leads to excess antidiuretic hormone (ADH) secretion from the posterior pituitary, which results in the development of syndrome of inappropriate secretion of antidiuretic hormone (SIADH). To date, 2 cases of SIADH following a herpes zoster ophthalmicus infection have been reported.8, 9 Several cases of coexisting varicella zoster encephalitis and Ramsay‐Hunt syndrome have been reported. Ramsay‐Hunt syndrome, which is characterized by zoster oticus and peripheral facial nerve involvement, is a known complication of varicella zoster infection; however, coexistence of Ramsay‐Hunt syndrome and varicella encephalitis is rare and has only been reported in 9 patients.3, 10 To our knowledge, the coexistence of these 2 complications has not been reported in a patient with herpes zoster ophthalmicus. Contralateral hemiparesis following herpes zoster infection has been reported in 2 patients, both of whom were treated with acyclovir, resulting in partial recovery. Other CNS complications of herpes zoster include myelitis, large‐vessel encephalitis, and small‐vessel encephalitis.3
| Report (year) | Age (years), Gender | Presenting Symptom | CNS Complication | Treatment | Outcome |
|---|---|---|---|---|---|
| |||||
| This case | 66, female | Vesicles on the left forehead, altered mental status | Varicella zoster meningoencephalitis | IV acyclovir, 540 mg IV q12h, 21‐day course | Resolved without complications |
| Haargaard et al.2 (2008) | 68, female; 82, female; 90, female; 72, male | Unknown | CN III and IV palsies | Systemic acyclovir | Complete recovery in 3 patients, 1 patient with no clinical recovery at 1 month follow‐up |
| 64, female | Unknown | Clinical meningitis (headache, photophobia, neck stiffness) with CSF negative for VZV PCR | IV acyclovir | Complete recovery | |
| 62, female | Unknown | CN III palsy and facial nerve palsy followed by encephalitis | Oral acyclovir 1000 mg Q day followed by IV acyclovir 10 mg/kg TID 10 days | Minimal recovery with severe neurological and cognitive impairment | |
| Kucukardali et al.9 (2007) | 76, female | Vesicles on left side of forehead | Syndrome of inappropriate antidiuretic hormone | IV acyclovir, 10‐12 mg/kg TID for 7 days | Resolved without complications |
| Dhawan8 (2006) | 71, female | Vesicles on left side of forehead | Syndrome of inappropriate antidiuretic hormone | IV acyclovir, dose unknown | Resolved without complications |
| Ofek‐Shlomai et al.7 (2005) | 5, male | Vesicles on right side of forehead, altered mental status | Varicella zoster meningoencephalitis | IV acyclovir, 1500 mg/m2/day for 10 days, followed by 14 days of oral acyclovir | Resolved without complications |
| Ngoueira et al.13 (2002) | 71, male | Recurrent facial rash on right forehead, altered mental status, left hemiparesis | Left hemiparesis, partial palsy of right third CN, complete palsy of left seventh CN with upper motor neuron distribution | IV acyclovir, 21‐day course, prednisone short course | Treatment course complicated by renal failure, partial improvement of symptoms with steroids |
| Hughes et al.11 (1993) | 76, female | Headache, confusion, somnolence, left complete ophthalmoplegia | Meningoencephalitis | Of the 9 patients diagnosed with meningoencephalitis, 5 patients were treated with acyclovir, 3 patients were treated with cytarabine, and 1 patient did not receive any antiviral treatment | 4 of the 5 patients treated with acyclovir and the 1 patient who did not receive any antiviral treatment returned to their baseline mental status within 2 weeks. All 3 patients treated with cytarabine and 1 patient treated with acyclovir remained confused and disoriented at 2 weeks and were discharged to care facilities |
| 74, male | Somnolence, confusion, bilateral Babinski reflexes | Meningoencephalitis | |||
| 69, male | Headache, photophobia, confusion, somnolence | Meningoencephalitis | |||
| 63, female | Headache, blurring of vision, nausea, vomiting, confusion, somnolence | Meningoencephalitis | |||
| McNeil et al.14 (1991) | 51, male | Right hemiparesis, dysphasia | Moderate global dysphasia, right upper motor neuron facial weakness, mild right hemiparesis | Unknown | Progressive improvement of speech, impaired right hand motor function, persistent global weakness |
It has also been shown that patients with compromised immune systems are at a greater risk for recurrence of the herpes zoster infection and for development of zoster encephalitis. It is estimated that mortality rates from zoster encephalitis are as high as 25%, with an average rate of 10%, and are determined by the patient's immune status.3, 4 Our particular patient was immunosuppressed, given that she had been treated for breast cancer with radiation 6 months prior to admission and chemotherapy 13 months prior to admission, putting her at an increased risk of developing encephalitis. There have been reports of herpes‐associated meningoencephalitis in patients with systemic cancers, including adenocarcinoma of the lung, prostate cancer, chronic lymphocytic leukemia, and lymphoma; the response to treatment with acyclovir was favorable in these cases.11 It has also been established that patients with human immunodeficiency virus (HIV) are at increased risk for developing meningoencephalitis after herpes zoster infection as a result of their compromised immune systems.12 In addition to having a higher mortality rate, patients with compromised immune systems are at a greater risk for recurrence of herpes zoster, which leads to an additional increase in mortality, as was seen in the case of this particular patient.
- .Herpes zoster ophthalmicus.Neurology.1995;45(12 Suppl 8):S50–S51.
- ,,.Central Nervous System involvement after herpes zoster ophthalmicus.Acta Ophthalmologica.2008. E‐pub January 2008.
- ,,, et al.Neurologic complications of the reactivation of varicella‐zoster virus.N Engl J Med.2000;342(9):635–645.
- ,,, et al.Recommendations for the management of herpes zoster.Clin Infect Dis.2007;44(suppl 1):S1–S26.
- ,.Herpes zoster encephalitis: 2 case reports and review of literature.Infect Dis Clin Pract.2007;15(4):284–288.
- ,.Rapid response to acyclovir in herpes zoster‐associated encephalitis.Am J Med.1987;82(3):560–562.
- ,,, et al.Varicella zoster virus encephalitis in a previously healthy five‐year‐old child with herpes zoster ophthalmicus.Pediatr Infect Dis J.2005;24(5):476–477.
- .Herpes zoster ophthalmicus and syndrome of inappropriate antidiuretic hormone secretion.Am J Med Sci.2007;333(1):56–57.
- ,,, et al.Herpes zoster ophthalmicus and syndrome of inappropriate antidiuretic hormone secretion.Intern Med.2008;47(5):463–465.
- ,,,.Coexistence of Ramsay‐Hunt syndrome and varicella‐zoster virus encephalitis.Infection.2006;34(6):352–354.
- ,,.Herpes zoster‐associated meningoencephalitis in patients with systemic cancer.Mayo Clin Proc.1993;68(7):652–655.
- ,,, et al.Herpes zoster ophthalmicus in patients with human immunodeficiency virus infection.Am J Ophthalmol.1998;125(3):285–291.
- ,.Images in clinical medicine. Herpes zoster ophthalmicus followed by contralateral hemiparesis.N Engl J Med.2002;346(15):1127.
- ,.Contralateral hemiplegia complicating herpes zoster ophthalmicus.J R Soc Med.1991;84(8):501–502.
Case Report
A 66‐year‐old woman with a history of breast cancer treated with lumpectomy, chemotherapy, and radiation presented to the emergency department with a 1‐week history of left eye pain, progressive fatigue, and numbness and tingling on the left upper face. One week prior to presentation, she experienced dull pain in her left eye, anorexia, vomiting, and numbness and tingling in her upper left face. She was diagnosed with sinusitis by a local physician and prescribed a nasal spray and an unknown antibiotic. She became progressively weaker and fatigued and then 2 days prior to admission she noticed red papules on her forehead. She presented to the emergency department 1 day prior to admission. In the emergency department, she was diagnosed with herpes zoster ophthalmicus, placed on acyclovir, acetaminophen/hydrocodone, ondansetron, and trifluridine eye drops, and discharged. Her symptoms worsened throughout the night and she became progressively more somnolent. She was brought to the emergency department again the following day and was found to be extremely somnolent and oriented only to person. The patient's past medical history was significant for lobular carcinoma in situ of the breast, which was diagnosed 22 years ago and treated with a lumpectomy. She had a recurrence of ductal and lobular carcinoma in‐situ 20 years after her initial diagnosis and was treated with 3 months of chemotherapy, completed 13 months prior to admission, and 6 months of radiation therapy, completed 6 months prior to admission. Her physical examination was remarkable for an erythematous maculopapular rash in the distribution of the ophthalmic division of the trigeminal nerve, swelling of the left orbit such that she could not open her eye without assistance, and white mucus‐like drainage from the left eye. The area around the eyelid was tender and the left sclera was pink. Extraocular movements were intact and the pupils were equal, round, and reactive to light and accommodation. Cranial nerves III to XII were intact bilaterally; cerebellar function, sensation, proprioception, and deep tendon reflexes were also intact. The patient did not have any meningismus.
On lumbar puncture in the emergency department (ED), the cerebrospinal fluid (CSF) from tube 4 was found to have a glucose concentration of 52 mg/dL (blood glucose of 111 mg/dL), a protein concentration of 90 mg/dL, a red blood cell (RBC) count of 70 cells/mL, and 16 nucleated cells/mL with 67% lymphocytes and 20% monocytes. Viral cultures and polymerase chain reaction (PCR) for herpes simplex virus (HSV)‐1, HSV‐2, and varicella zoster virus (VZV) were sent to the laboratory. Therapy with acyclovir, vancomycin, and cefotaxime was initiated. Magnetic resonance imaging (MRI) revealed leptomeningeal and dural enhancement involving the posterior fossa, which was read to be consistent with infectious meningitis; temporal lobe involvement was not seen (Figure 1).
Additional results from the lumbar puncture were received the following day. PCR for HSV‐1 and HSV‐2 was found to be negative, while PCR for VZV was found to be positive. Treatment with intravenous (IV) acyclovir was continued. The patient's clinical condition improved significantly by the morning after admission and she was found to be less somnolent and alert and oriented to person, place, and time. Her condition continued to improve and she was discharged 4 days after admission after her mental status returned to baseline; the patient subsequently completed a 21‐day course of 540 mg twice a day IV acyclovir.
In the 9 months following her initial hospitalization, the patient was admitted multiple times to an outside hospital for varicella zoster meningitis and herpes zoster ophthalmicus, with complete resolution of her symptoms after each hospitalization. However, 10 months after her initial hospitalization, the patient presented to our hospital with lethargy and was found to have a recurrence of her breast cancer with metastatic disease. She was subsequently diagnosed with carcinomatous meningitis and passed away shortly after this diagnosis.
Discussion
The development of clinically significant varicella zosterassociated meningoencephalitis after herpes zoster ophthalmicus is rare. Cerebrospinal fluid PCR has been shown to have a sensitivity and specificity >95% for diagnosing VZV encephalitis.3 The interpretation of the MRI was consistent with several case reports in the literature that also described enhancing meningeal lesions on MRI in patients with varicella encephalitis.3
While subclinical invasion of VZV into the central nervous system (CNS) is relatively common, with approximately one‐third of asymptomatic immunocompetent patients having a CSF PCR positive for VZV and 46% of patients demonstrating CSF leukocytosis, it is rare for patients to present with the serious clinical manifestations seen in this case.4 It is hypothesized that herpes zosterassociated meningoencephalitis most likely occurs when the zoster involves the ophthalmic branch of the trigeminal nerve, allowing for the spread of the virus to the tentorium through the recurrent nerve of Arnold, which branches off the ophthalmic division of the trigeminal nerve.5 On review of the literature, there are very few studies and no controlled trials on the optimal treatment of this complication, although an empirical treatment of 15 to 30 mg of acyclovir per kilogram of body weight for 10 days has been suggested.3 There have been several reports of rapid responses to IV acyclovir but, due to the rarity of this complication, to our knowledge, no studies have been conducted to determine the optimal treatment of herpes zosterassociated meningoencephalitis.3, 6 A similar case of meningoencephalitis has been described in a 5‐year‐old boy whose presentation was similar to that of our patient, with periorbital vesicular lesions and mental status changes including somnolence. This child was treated with acyclovir and made a full recovery.7
Several other CNS‐related manifestations of CN zoster have been reported, including development of the syndrome of inappropriate antidiuretic hormone, development of contralateral hemiparesis, and the coexistence of Ramsay‐Hunt syndrome and zoster encephalitis (Table 1). It is hypothesized that stimulation of the ophthalmic division of the trigeminal nerve by the zoster virus leads to excess antidiuretic hormone (ADH) secretion from the posterior pituitary, which results in the development of syndrome of inappropriate secretion of antidiuretic hormone (SIADH). To date, 2 cases of SIADH following a herpes zoster ophthalmicus infection have been reported.8, 9 Several cases of coexisting varicella zoster encephalitis and Ramsay‐Hunt syndrome have been reported. Ramsay‐Hunt syndrome, which is characterized by zoster oticus and peripheral facial nerve involvement, is a known complication of varicella zoster infection; however, coexistence of Ramsay‐Hunt syndrome and varicella encephalitis is rare and has only been reported in 9 patients.3, 10 To our knowledge, the coexistence of these 2 complications has not been reported in a patient with herpes zoster ophthalmicus. Contralateral hemiparesis following herpes zoster infection has been reported in 2 patients, both of whom were treated with acyclovir, resulting in partial recovery. Other CNS complications of herpes zoster include myelitis, large‐vessel encephalitis, and small‐vessel encephalitis.3
| Report (year) | Age (years), Gender | Presenting Symptom | CNS Complication | Treatment | Outcome |
|---|---|---|---|---|---|
| |||||
| This case | 66, female | Vesicles on the left forehead, altered mental status | Varicella zoster meningoencephalitis | IV acyclovir, 540 mg IV q12h, 21‐day course | Resolved without complications |
| Haargaard et al.2 (2008) | 68, female; 82, female; 90, female; 72, male | Unknown | CN III and IV palsies | Systemic acyclovir | Complete recovery in 3 patients, 1 patient with no clinical recovery at 1 month follow‐up |
| 64, female | Unknown | Clinical meningitis (headache, photophobia, neck stiffness) with CSF negative for VZV PCR | IV acyclovir | Complete recovery | |
| 62, female | Unknown | CN III palsy and facial nerve palsy followed by encephalitis | Oral acyclovir 1000 mg Q day followed by IV acyclovir 10 mg/kg TID 10 days | Minimal recovery with severe neurological and cognitive impairment | |
| Kucukardali et al.9 (2007) | 76, female | Vesicles on left side of forehead | Syndrome of inappropriate antidiuretic hormone | IV acyclovir, 10‐12 mg/kg TID for 7 days | Resolved without complications |
| Dhawan8 (2006) | 71, female | Vesicles on left side of forehead | Syndrome of inappropriate antidiuretic hormone | IV acyclovir, dose unknown | Resolved without complications |
| Ofek‐Shlomai et al.7 (2005) | 5, male | Vesicles on right side of forehead, altered mental status | Varicella zoster meningoencephalitis | IV acyclovir, 1500 mg/m2/day for 10 days, followed by 14 days of oral acyclovir | Resolved without complications |
| Ngoueira et al.13 (2002) | 71, male | Recurrent facial rash on right forehead, altered mental status, left hemiparesis | Left hemiparesis, partial palsy of right third CN, complete palsy of left seventh CN with upper motor neuron distribution | IV acyclovir, 21‐day course, prednisone short course | Treatment course complicated by renal failure, partial improvement of symptoms with steroids |
| Hughes et al.11 (1993) | 76, female | Headache, confusion, somnolence, left complete ophthalmoplegia | Meningoencephalitis | Of the 9 patients diagnosed with meningoencephalitis, 5 patients were treated with acyclovir, 3 patients were treated with cytarabine, and 1 patient did not receive any antiviral treatment | 4 of the 5 patients treated with acyclovir and the 1 patient who did not receive any antiviral treatment returned to their baseline mental status within 2 weeks. All 3 patients treated with cytarabine and 1 patient treated with acyclovir remained confused and disoriented at 2 weeks and were discharged to care facilities |
| 74, male | Somnolence, confusion, bilateral Babinski reflexes | Meningoencephalitis | |||
| 69, male | Headache, photophobia, confusion, somnolence | Meningoencephalitis | |||
| 63, female | Headache, blurring of vision, nausea, vomiting, confusion, somnolence | Meningoencephalitis | |||
| McNeil et al.14 (1991) | 51, male | Right hemiparesis, dysphasia | Moderate global dysphasia, right upper motor neuron facial weakness, mild right hemiparesis | Unknown | Progressive improvement of speech, impaired right hand motor function, persistent global weakness |
It has also been shown that patients with compromised immune systems are at a greater risk for recurrence of the herpes zoster infection and for development of zoster encephalitis. It is estimated that mortality rates from zoster encephalitis are as high as 25%, with an average rate of 10%, and are determined by the patient's immune status.3, 4 Our particular patient was immunosuppressed, given that she had been treated for breast cancer with radiation 6 months prior to admission and chemotherapy 13 months prior to admission, putting her at an increased risk of developing encephalitis. There have been reports of herpes‐associated meningoencephalitis in patients with systemic cancers, including adenocarcinoma of the lung, prostate cancer, chronic lymphocytic leukemia, and lymphoma; the response to treatment with acyclovir was favorable in these cases.11 It has also been established that patients with human immunodeficiency virus (HIV) are at increased risk for developing meningoencephalitis after herpes zoster infection as a result of their compromised immune systems.12 In addition to having a higher mortality rate, patients with compromised immune systems are at a greater risk for recurrence of herpes zoster, which leads to an additional increase in mortality, as was seen in the case of this particular patient.
- .Herpes zoster ophthalmicus.Neurology.1995;45(12 Suppl 8):S50–S51.
- ,,.Central Nervous System involvement after herpes zoster ophthalmicus.Acta Ophthalmologica.2008. E‐pub January 2008.
- ,,, et al.Neurologic complications of the reactivation of varicella‐zoster virus.N Engl J Med.2000;342(9):635–645.
- ,,, et al.Recommendations for the management of herpes zoster.Clin Infect Dis.2007;44(suppl 1):S1–S26.
- ,.Herpes zoster encephalitis: 2 case reports and review of literature.Infect Dis Clin Pract.2007;15(4):284–288.
- ,.Rapid response to acyclovir in herpes zoster‐associated encephalitis.Am J Med.1987;82(3):560–562.
- ,,, et al.Varicella zoster virus encephalitis in a previously healthy five‐year‐old child with herpes zoster ophthalmicus.Pediatr Infect Dis J.2005;24(5):476–477.
- .Herpes zoster ophthalmicus and syndrome of inappropriate antidiuretic hormone secretion.Am J Med Sci.2007;333(1):56–57.
- ,,, et al.Herpes zoster ophthalmicus and syndrome of inappropriate antidiuretic hormone secretion.Intern Med.2008;47(5):463–465.
- ,,,.Coexistence of Ramsay‐Hunt syndrome and varicella‐zoster virus encephalitis.Infection.2006;34(6):352–354.
- ,,.Herpes zoster‐associated meningoencephalitis in patients with systemic cancer.Mayo Clin Proc.1993;68(7):652–655.
- ,,, et al.Herpes zoster ophthalmicus in patients with human immunodeficiency virus infection.Am J Ophthalmol.1998;125(3):285–291.
- ,.Images in clinical medicine. Herpes zoster ophthalmicus followed by contralateral hemiparesis.N Engl J Med.2002;346(15):1127.
- ,.Contralateral hemiplegia complicating herpes zoster ophthalmicus.J R Soc Med.1991;84(8):501–502.

The Devil is in the Details
The approach to clinical conundrums by an expert clinician is revealed through presentation of an actual patient's case in an approach typical of morning report. Similar to patient care, sequential pieces of information are provided to the clinician who is unfamiliar with the case. The focus is on the thought processes of both the clinical team caring for the patient and the discussant.
A 47‐year‐old male presented to a community hospital with 5 weeks of daily fevers, accompanied by headache, myalgias, and malaise. He reported that his symptoms began abruptly 2 days after a weekend of camping in Connecticut.
This patient describes the onset of undifferentiated fever 2 days after a weekend of camping. Few infectious diseases have such short incubation periods, and either the accuracy of the history or the relationship of the camping trip to the present illness is thus questionable. However, more information about the onset and nature of the illness, and details about food, animal, water, mud, cave, wood chopping, and other environmental exposures during his trip is required. The exact dates of the camping trip may be helpful, as there is clear seasonality to vector‐borne diseases such as Lyme disease, babesiosis, ehrlichiosis, and rickettsial infections. Conditions unrelated to his camping trip, such as malignancies, rheumatologic conditions, and other infectious causes of prolonged fever, such as tuberculosis, endocarditis, or osteomyelitis, are more likely, given the duration of fever.
The fevers were accompanied by chills, without rigors, and subjectively worsened over the first 2 days. At that point, the patient began taking his temperature, and noted fevers of 38.5C to 40C occurring once or twice daily, generally in the afternoon or evening. The patient did not recall tick bites but did not carefully examine himself for ticks; he reported numerous mosquito bites during the trip. The patient camped in a tent and grilled meats and other food he had brought in a cooler. No family members or other travelers became ill. He denied spelunking, but had collected wood for camp fires, and acknowledged swimming in a freshwater pond during his trip, which occurred in August.
West Nile fever, St. Louis encephalitis, and eastern equine encephalitis are transmitted by mosquitoes in New England, but are unlikely causes of prolonged fever. Water exposure suggests the possibility of leptospirosis, and wood exposure suggests blastomycosis, but this usually presents with a pulmonary syndrome. Food‐borne illness seems unlikely. While no aspect of the history has pinpointed a specific diagnosis, exploring the progression of symptoms may offer a clue, and if he has undergone any previous evaluation, the results may significantly alter the differential diagnosis. For example, arthritis may develop weeks after fever in adult‐onset Still's disease, negative blood cultures would lower the probability of endocarditis, and common sites of pyrogenic malignancies (eg, liver, kidneys, and especially lymph nodes) may already have been imaged.
During the first 3 weeks of illness, the patient experienced daily fever and a gradual, 10‐pound weight loss. Over the next 10 days, he sought medical attention at 3 emergency departments. At one, a head computed tomography (CT) showed possible sinusitis, and he was prescribed a 7‐day course of clarithromycin, which he took without any improvement. At 2 others, he was told that his laboratory studies, and a CT of the abdomen, were normal, and that he had a viral syndrome. Several days later, and 5 weeks after the onset of symptoms, the development of dull right upper‐quadrant pain and mild nausea without vomiting prompted the current presentation to the community hospital. He reported several years of loose stools, but denied rash, arthritis, diarrhea, neck stiffness, cough, or other complaints.
A detailed past medical, social, and family history is required, with particular attention to ethnicity; immunocompromising conditions such as splenectomy or corticosteroid use; undiagnosed febrile diseases; severe, unusual, or recurrent infections; medication use; diet; sexual history; pet exposures; and any personal or family history of cancer. The development of right upper‐quadrant pain mandates attention to risk factors for viral hepatitis, known biliary pathology, or travel that might predispose the patient to pyogenic or amoebic liver abscess, and hematochezia, which could suggest a malignancy metastatic to the liver. Additionally, chronic diarrhea with new right upper‐quadrant pain may represent inflammatory bowel disease complicated by primary sclerosing cholangitis (PSC).
The patient was a Caucasian male of Mediterranean ancestry with thalassemia minor. He had undergone dilation of a benign esophageal stricture, but no surgical procedures, and he had never experienced unexplained fever or unusual infections. Medication exposure was limited to occasional use of acetaminophen for fever, and he had no known allergies. His diet was unremarkable and included no well water or unpasteurized dairy products. He denied risk factors for tuberculosis. He drank 2 to 10 beers a day, 5 times a week, had last smoked 10 years previously, and had never used illicit drugs. He denied any high‐risk sexual contacts and was monogamous with his wife, with whom he had 2 children. The family owned no pets and no relatives had suffered from malignant, rheumatologic, or febrile illness, with the exception of hand, foot, and mouth infection in an infant son, 1 year previously. The patient had never traveled outside of New England.
The history has uncovered several clues, but their relevance is doubtful. His ethnicity suggests possible familial Mediterranean fever, but recurrent abdominal pain and polyserositis, rather than a single prolonged episode, would be expected with this disease. A transfusion history should be obtained to explore the possibility of viral hepatitis. While iron overload can predispose patients to various infections including liver abscess, thalassemia minor should not require transfusion. Esophageal stricture could conceivably be due to histoplasmosis (complicated by mediastinal fibrosis) or tuberculosis, but is probably unrelated to his present illness. His excessive alcohol intake increases his risk for esophageal cancer and liver disease, but it is unlikely that metastatic disease to the liver would present with fever without preceding dysphagia, or that alcoholic hepatitis could have escaped detection after evaluations by several physicians.
We need to learn the details of the patient's physical examination. Given the development of right upper‐quadrant pain, I would particularly like to know if he had hepatosplenomegaly and if a Murphy's sign was present.
His temperature ranged from 36.9C to 39.8C, his pulse was 76 beats per minute with minimal elevations during fever spikes, and his respirations were 18 per minute. His blood pressure was 105/70 mm Hg. He was a well‐developed, overweight male with scleral icterus. He had good dentition and an oropharynx free of lesions. Cardiac examination demonstrated a regular rhythm with a normal S1 and S2, without murmurs or peripheral stigmata of infectious endocarditis. A smooth, minimally tender liver edge was palpable 2 cm below the costal margin; the spleen was nonpalpable. Murphy's sign was absent. There was no lymphadenopathy or rash. He had multiple, shallow, uninfected lacerations of both hands in various stages of healing. The remainder of his examination was normal.
The patient has obvious liver involvement. The pulse‐temperature dissociation suggests a variety of infections, including salmonellosis, psittacosis, typhoid fever, leptospirosis, tularemia, brucellosis, legionellosis, and mycoplasma pneumoniae infection. The patient should be asked how and when he injured his hands, as fresh water exposure can transmit leptospirosis across broken skin. However, while severe leptospirosis can cause fever and jaundice, the long duration of illness is not typical. The cryptogenic form of tularemiawhich can manifest as a typhoidal illnessshould be considered, given that tularemia is present in the area the patient visited; he should be asked about exposure to rabbits.
At this point, I would like to see a standard biochemical profile, a liver panel, a complete blood count and differential, urinalysis, chest X‐ray, and an electrocardiogram. I would examine thick and thin Wright‐Giemsa‐stained smears for evidence of babesiosis. Blood cultures should be held for at least 2 weeks to recover fastidious organisms like Francisella tularensis and Brucella sp. Bone marrow cultures should be obtained; they are more sensitive for mycobacteria and Brucella, and may also yield fungal pathogens. Serologies for a variety of infectious diseases, such as leptospirosis, typhoid fever, and tularemia, will be required if other diagnostic tests are unrevealing.
His white cell count was 8,100/L, with a normal differential, and his hemoglobin was 10 g/dL (normal range, 1417), with a mean corpuscular hemoglobin of 63 m3 (normal range, 8298). The platelet count was 303,000/L. Serum electrolytes were normal. His aspartate aminotransferase was 58 U/L and his alanine aminotransferase was 60 U/L (normal range for both, 1045). Bilirubin was 2.6 mg/dL (normal, <1.2); direct bilirubin was 0.9 mg/dL. Alkaline phosphatase was 150 U/L. Lactate dehydrogenase was 342 U/L (normal range, 2251). A lipase was 62 U/L. International normalized ratio (INR) was 1.4 with an activated partial thromboplastin time (aPTT) of 52 seconds (normal range, 2533). Erythrocyte sedimentation rate (ESR) was 50 mm/hour (normal range, 015). Iron studies showed a suppressed iron and iron‐binding capacity and elevated haptoglobin and ferritin (1878 ng/L; normal range, 22322). Several blood cultures obtained at admission showed no growth after 48 hours of incubation.
The anemia, low mean cell volume (MCV), and elevated ferritin and ESR are consistent with anemia of chronic disease, superimposed upon thalassemia minor. Transaminase elevations occur in a plethora of infectious processes. The elevated INR and aPTT are concerning, and may indicate a septic or malignant process with disseminated intravascular coagulation (DIC). While there is no mention of clinical DIC, it would be appropriate to obtain D‐dimers, fibrin degradation products, and a fibrinogen level. The platelet count is normal, which is reassuring.
Before initiating any empiric antimicrobials, I would obtain an abdominal ultrasound, and possibly an abdominal CT. Hepatitis (especially B and C), cytomegalovirus, and Epstein‐Barr virus serologies should be obtained. A variety of conditions including leptospirosis, tularemia, and babesiosis are possible; specific laboratory testing is required to guide therapy.
Ultrasound showed a thickened gallbladder; the liver was slightly enlarged with normal echotexture. Magnetic resonance cholangiopancreatography (MRCP) showed diffuse sequential beading and scarring of his extrahepatic biliary ducts.
There is no evidence of biliary stones, intrahepatic tumor, or abscess to explain the fever and hepatitis, although it would be helpful to know what other abdominal structures were imaged. The MRCP finding increases my suspicion of PSC, possibly complicated by infection, although the biliary abnormalities may be incidental, and an unrelated process may be responsible for the clinical presentation.
His physicians considered the possibilities of PSC and cholangiopathy due to as‐yet undiagnosed acquired immunodeficiency syndrome. Ampicillin‐sulbactam, ceftazidime, and gentamicin were administered for possible bacterial cholangitis, and endoscopic retrograde cholangiopancreatography was performed. This procedure showed only slight narrowing of his common bile duct, which was felt to be a normal variant. He felt no better after several days of antibiotic therapy, and was transferred to a tertiary care center for further evaluation. Repeat physical exam and laboratory studies were essentially unchanged. The patient explained that his hand lacerations were sustained during his work as a butcher who worked with lamb, beef, rabbit, and poultry. He rarely wore protective gloves because they induced contact dermatitis.
Tularemia becomes more likely given his history of rabbit butchering. Salmonellosis and leptospirosis also remain possible. Typhoid fever and brucellosis are unlikely unless the patient worked with imported exotic animals. At this point, given the systemic illness, empiric antibacterial therapy is reasonable. Of the chosen antimicrobials, only the gentamicin would reliably treat tularemia. I would stop ampicillin‐sulbactam and ceftazidime and replace gentamicin with ciprofloxacin, an effective and better‐tolerated agent for tularemia. Cultures of blood and bone marrow aspirate should be obtained. Stool should be cultured for Salmonella. Tularemia, leptospirosis, and typhoid serologies should be sent to a reference laboratory. At this point in the patient's illness, high‐titered antibodies should be present. However, it would be ideal to compare titers with those from previous serum sample, if possible.
The patient's antimicrobials were narrowed to doxycycline alone, for suspected zoonotic infection, but his fevers were unchanged after 1 week of treatment. Hepatitis serologies, human immunodeficiency virus (HIV) antibody, and smears for ehrlichiosis and babesiosis were negative. He had a positive immunoglobulin (Ig)G and a negative IgM for Epstein‐Barr virus and cytomegalovirus. Tularemia, ehrlichiosis, leptospirosis, brucellosis, and Query fever (Q fever) serologies were ordered. The elevated aPTT did not correct when his serum was mixed with normal serum. Thrombin was normal; factor VIII, von Willebrand (VW) factor, and VW cofactor were mildly elevated. Lupus anticoagulant was detected. A hepatologist declined to obtain a liver biopsy, citing the elevated aPTT and pending serologies. Given his clinical stability, the patient was discharged on doxycycline to await further results.
My highest suspicion is for tularemia, and I would switch antibiotic treatment to ciprofloxacin, awaiting serological results. Some in vitro studies have suggested that F. tularensis may often be resistant to doxycycline, and recent clinical experience has shown fluoroquinolones are superior to doxycycline in the treatment of tularemia.
His serologic results were as follows: tularemia, 1:32 (positive, 1:128); ehrlichia, 1:128 (granulocytic) and <1:64 (monocytic; normal for both, <1:64); leptospira, agglutinated nonspecifically; Brucella IgG and IgM 1 (negative, <9), Q fever (coxiella) IgG 1 + 2, IgM 1 + 2, all positive at 1:256 (<1:16). A transesophageal echocardiogram showed no evidence of endocarditis. The patient was treated with 10 weeks of doxycycline for Q fever hepatitis. His fever, headache, and laboratory abnormalities resolved, and he remained well after the completion of therapy.
The serologies suggest the patient had Coxiella burnetii hepatitis, and illustrate the value of a precise exposure history. Most butchers work only with muscle tissue and have a negligible risk of Q fever. In retrospect, it became clear that he worked part‐time in a slaughterhouse, where highly infectious reproductive tract fluids can dry and aerosolize.
Commentary
Q fever was proposed as the name for a febrile illness affecting Australian slaughterhouse workers in 1937.1 The etiologic agent, C. burnetii, is a small, gram‐negative, obligate intracellular proteobacterium that exists in 2 distinct phases, specializing either in entering or persisting in macrophage lysosomes.2 Additionally, spores are formed and can persist in soil.
Q fever is an uncommonly recognized disease, in part because most infected persons have no symptoms or mild symptoms.3 In the United States, the estimated annual incidence has been 0.28 per million (about 50 cases per year) since 1999, when Q fever became a reportable disease due to bioterrorism concerns. In France, more frequent farming of goats and sheep may be responsible for the much higher annual incidence of 500 per million.4 Spread is usually occupational, via aerosol contact with the dried reproductive tract secretions of animals (mainly cattle, sheep, and goats), in a slaughterhouse or farm setting. However, wind‐borne dust can carry spores long distances, and spread can occur from household pets, unpasteurized dairy products, laboratory work, and possibly ticks.3 More than 30 cases have been reported in military personnel deployed to Iraq and Afghanistan, several without obvious exposures.5 One review noted a single reported case of intradermal inoculation,3 making this patient's lacerations a possible site of infection, but he was also at risk for inhalational exposurewhen he was later asked about the details of his work, he acknowledged working at a slaughterhouse as well as a supermarket.
Symptomatic patients are male in 77% of cases, can usually identify an occupational exposure, and have a mean age of 50 years.4 Fever, which lasts 5 to 57 days, as well as fatigue and headaches, begin after a 1‐week to 3‐week incubation period. Atypical pneumonia or rash may occur; meningoencephalitis and myocarditis portend a worse prognosis. As with this patient, 45% to 85% of patients suffer from hepatitis, although few have an abnormal bilirubin.3 Liver biopsy usually reveals granulomas, which may have a classic doughnut hole appearance,2, 3 although this patient ultimately received a diagnosis without the procedure. Acute Q fever rarely (5%) requires hospitalization, and fatalities are extremely rare.3
Chronic infection (ie, lasting >6 months) most often occurs as endocarditis, although chronic hepatitis, osteomyelitis, and infections of other sites occur. Interestingly, this patient's lupus anticoagulant may have been related to his underlying illness, as autoantibodies frequently occur in Q fever, especially in patients with hepatitis, many of whom develop smooth muscle antibodies, a positive Coombs test, antiprothrombinase, or other autoantibodies,3 and there is a high incidence of antiphospholipid antibodies, particularly anticardiolipin and lupus anticoagulant antibodies.6
Because C. burnetii is an obligate intracellular pathogen, culture requires either tissue or live animal inoculation, and the diagnosis is usually made serologically. Paired sera demonstrating seroconversion or a 4‐fold increase in titers are most conclusive, but a single sample may be used. Anti‐phase II antibodies are detectable in 90% of patients within 3 weeks of infection3 and peak at 2 months5; this patient's phase II sera (IgG > 1:200, IgM > 1:50) are said to be 100% predictive for acute Q fever.3 High‐titer anti‐phase I antibodies, in contrast, indicate chronic infection, and a titer 1:800 is one of the modified Duke criteria for endocarditis.5
Acute Q fever is generally treated with doxycycline for 14 days, although prolonged therapy may be advisable to prevent endocarditis if preexisting valvular lesions are present.2, 5 Fluoroquinolones are another option and may be especially useful for meningoencephalitis.5 Because acute Q fever is generally self‐limited, demonstrating a clear benefit to antibiotic therapy is difficult. The available evidence, which was largely obtained from Q fever pneumonia patients, suggests that tetracycline therapy shortens fever duration.3 Patients with Q fever hepatitis may have a protracted course. On the basis of anecdotal reports, some experts add prednisone (tapered from 40 mg daily over a week) for patients with Q fever hepatitis who fail to respond to doxycycline promptly.3 While this patient's fever was unchanged after a week of therapy, he was well into his treatment course when his diagnosis was ultimately confirmed. His physicians felt that prednisone would be of uncertain benefit and opted not to administer it.
Treatment of Q fever endocarditis is often delayed by the combination of negative blood cultures and a low (12%) rate of vegetation formation, increasing the risk of morbidity and mortality.3 Tetracycline monotherapy is associated with a greater than 50% risk of death,5 and even 4 years of treatment may fail to sterilize valve tissue.3 However, if hydroxychloroquine is given with doxycycline for at least 18 months to alkalize lysosomes and improve bacterial killing, the mortality rate can be lowered to about 5%.3, 5 Patients should be warned of the risk of photosensitivity, and monitored for retinal toxicity2 and serologic evidence of relapse.5
Before serologic results confirmed the diagnosis of Q fever, both the patient's clinicians and the discussant had to craft an antibiotic regimen for a suspected zoonosis. The patient received doxycycline, a good choice for leptospirosis,7 brucellosis,8 tularemia,9 and Q fever,3 all possible after livestock exposure, as well as ehrlichiosis.10 The discussant, who suspected tularemia, worried about the possibility of doxycycline resistance and selected ciprofloxacin instead. While fluoroquinolones are probably superior to doxycycline for mild to moderate tularemia,11, 12 aminoglycosides would be preferred for severe disease,9 and ciprofloxacin experience in leptospirosis7 and ehrlichiosis10 is limited. Neither selection would be optimal for brucellosis, for which either doxycycline or ciprofloxacin should be combined with another agent such as rifampin.8 The most reasonable empiric regimen is debatable, but in the absence of pathognomonic findings of tularemia, his treating physicians favored the broader activity of doxycycline.
Ultimately, the choice of antibiotics in this case hinged on the details of the patient's occupational exposures. His first 2 courses of antibiotics were based not on his exposure history, but on radiographic findings that were later proven spurious. The regimens selected by the discussant and by physicians at the referral hospital both targeted pathogens suggested by the patient's occupational history instead, but both were missing parts of the puzzle as well. The discussant thought the patient performed commercial butcher‐shop work, which is only rarely13 mentioned in the context of Q fever transmission. Several of the admitting physicians at the referral hospital were unaware of the importance of the butcher/slaughterhouse‐worker distinction. Physicians need a detailed understanding of both the exposure history and the biology of possible pathogens to craft an optimal differential diagnosis and empiric antibiotic regimen.
On the other hand, in most patients with fever of unknown origin (FUO; ie, >3 weeks with temperature >38.3 on multiple occasions, without a diagnosis after a weeklong evaluation),14 empiric antibiotic therapy is rarely a wise intervention. Clinicians should avoid blind administration of antibiotics as a diagnostic tool, given the inability to distinguish clinical responses from spontaneous resolution, or pinpoint a specific cause and thus a precise treatment plan and duration. However, empiric tetracyclines have been employed when intracellular pathogens were a suspected cause of FUO, as in one series of French patients in which Q fever was common.15 In this patient's case, no specific finding pointed to Q fever before the serologies became available, but the rare infections considered in this case can be considered doxycycline‐deficient states, meaning that empiric tetracycline therapy often leads to improvement. Recognizing doxycycline deficiency can guide therapy while definitive results are pending, and empiric doxycycline is particularly important if potentially aggressive zoonoses, such as Rocky Mountain spotted fever, are suspected.
Teaching Points:
-
A detailed and precise exposure history is crucial for the diagnosis of Q fever and other zoonoses and for the individualized evaluation of FUO in general.
-
Q fever is a rare disease that most commonly causes undifferentiated fever, pneumonia, hepatitis, and when chronic, often reflects endovascular infection, which is frequently difficult to eradicate.
-
Doxycycline is effective for many, but not all zoonoses (babesia is a notable exception). Empiric therapy is reasonable if suspicion is high.
- .“Q” fever, new fever entity: clinical features, diagnosis and laboratory investigation.Med J Aust.1937;2:281–299.
- ,,.Q fever.Lancet.2006;367(9511):679–688.
- ,.Q fever.Clin Microbiol Rev.1999;12:518–553.
- ,,, et al.National surveillance and the epidemiology of human Q fever in the United States, 1978–2004.Am J Trop Med Hyg.2006;75:36–40.
- ,,,.Q fever: epidemiology, diagnosis, and treatment.Mayo Clin Proc.2008;83(5):574–579.
- ,,, et al.Prevalence, significance, and specificity of antibodies to phospholipids in Q fever.Clin Infect Dis.1994;18:213–218.
- ,,.Antimicrobial therapy of leptospirosis.Curr Opin Infect Dis.2006;19:533–537.
- ,,, et al.Treatment of human brucellosis with doxycycline plus rifampin or doxycycline plus streptomycin. A randomized, double‐blind study.Ann Intern Med.1992;117:25–30.
- ,,,.Tularemia: current epidemiology and disease management.Infect Dis Clin North Am.2006;20:289–311, ix.
- ,,,.Ehrlichioses in humans: epidemiology, clinical presentation, diagnosis, and treatment.Clin Infect Dis.2007;45(Suppl 1):S45–S51.
- ,.New approaches to diagnosis and therapy of tularemia.Ann NY Acad Sci.2007;1105:378–404.
- ,,, et al.Evaluation of clinical, laboratory, and therapeutic features of 145 tularemia cases: the role of quinolones in oropharyngeal tularemia.APMIS.2008;116:66–73.
- ,.A survey of Q fever antibodies in a high risk population in Panamá.Am J Trop Med Hyg.1980;29(5):1007–1011.
- ,.Fever of unknown origin.Lancet.1997;350:575–580.
- .Fever of unknown origin in adults: evaluation of 144 cases in a non‐university hospital.Scand J Infect Dis.2006;38:632–638.
The approach to clinical conundrums by an expert clinician is revealed through presentation of an actual patient's case in an approach typical of morning report. Similar to patient care, sequential pieces of information are provided to the clinician who is unfamiliar with the case. The focus is on the thought processes of both the clinical team caring for the patient and the discussant.
A 47‐year‐old male presented to a community hospital with 5 weeks of daily fevers, accompanied by headache, myalgias, and malaise. He reported that his symptoms began abruptly 2 days after a weekend of camping in Connecticut.
This patient describes the onset of undifferentiated fever 2 days after a weekend of camping. Few infectious diseases have such short incubation periods, and either the accuracy of the history or the relationship of the camping trip to the present illness is thus questionable. However, more information about the onset and nature of the illness, and details about food, animal, water, mud, cave, wood chopping, and other environmental exposures during his trip is required. The exact dates of the camping trip may be helpful, as there is clear seasonality to vector‐borne diseases such as Lyme disease, babesiosis, ehrlichiosis, and rickettsial infections. Conditions unrelated to his camping trip, such as malignancies, rheumatologic conditions, and other infectious causes of prolonged fever, such as tuberculosis, endocarditis, or osteomyelitis, are more likely, given the duration of fever.
The fevers were accompanied by chills, without rigors, and subjectively worsened over the first 2 days. At that point, the patient began taking his temperature, and noted fevers of 38.5C to 40C occurring once or twice daily, generally in the afternoon or evening. The patient did not recall tick bites but did not carefully examine himself for ticks; he reported numerous mosquito bites during the trip. The patient camped in a tent and grilled meats and other food he had brought in a cooler. No family members or other travelers became ill. He denied spelunking, but had collected wood for camp fires, and acknowledged swimming in a freshwater pond during his trip, which occurred in August.
West Nile fever, St. Louis encephalitis, and eastern equine encephalitis are transmitted by mosquitoes in New England, but are unlikely causes of prolonged fever. Water exposure suggests the possibility of leptospirosis, and wood exposure suggests blastomycosis, but this usually presents with a pulmonary syndrome. Food‐borne illness seems unlikely. While no aspect of the history has pinpointed a specific diagnosis, exploring the progression of symptoms may offer a clue, and if he has undergone any previous evaluation, the results may significantly alter the differential diagnosis. For example, arthritis may develop weeks after fever in adult‐onset Still's disease, negative blood cultures would lower the probability of endocarditis, and common sites of pyrogenic malignancies (eg, liver, kidneys, and especially lymph nodes) may already have been imaged.
During the first 3 weeks of illness, the patient experienced daily fever and a gradual, 10‐pound weight loss. Over the next 10 days, he sought medical attention at 3 emergency departments. At one, a head computed tomography (CT) showed possible sinusitis, and he was prescribed a 7‐day course of clarithromycin, which he took without any improvement. At 2 others, he was told that his laboratory studies, and a CT of the abdomen, were normal, and that he had a viral syndrome. Several days later, and 5 weeks after the onset of symptoms, the development of dull right upper‐quadrant pain and mild nausea without vomiting prompted the current presentation to the community hospital. He reported several years of loose stools, but denied rash, arthritis, diarrhea, neck stiffness, cough, or other complaints.
A detailed past medical, social, and family history is required, with particular attention to ethnicity; immunocompromising conditions such as splenectomy or corticosteroid use; undiagnosed febrile diseases; severe, unusual, or recurrent infections; medication use; diet; sexual history; pet exposures; and any personal or family history of cancer. The development of right upper‐quadrant pain mandates attention to risk factors for viral hepatitis, known biliary pathology, or travel that might predispose the patient to pyogenic or amoebic liver abscess, and hematochezia, which could suggest a malignancy metastatic to the liver. Additionally, chronic diarrhea with new right upper‐quadrant pain may represent inflammatory bowel disease complicated by primary sclerosing cholangitis (PSC).
The patient was a Caucasian male of Mediterranean ancestry with thalassemia minor. He had undergone dilation of a benign esophageal stricture, but no surgical procedures, and he had never experienced unexplained fever or unusual infections. Medication exposure was limited to occasional use of acetaminophen for fever, and he had no known allergies. His diet was unremarkable and included no well water or unpasteurized dairy products. He denied risk factors for tuberculosis. He drank 2 to 10 beers a day, 5 times a week, had last smoked 10 years previously, and had never used illicit drugs. He denied any high‐risk sexual contacts and was monogamous with his wife, with whom he had 2 children. The family owned no pets and no relatives had suffered from malignant, rheumatologic, or febrile illness, with the exception of hand, foot, and mouth infection in an infant son, 1 year previously. The patient had never traveled outside of New England.
The history has uncovered several clues, but their relevance is doubtful. His ethnicity suggests possible familial Mediterranean fever, but recurrent abdominal pain and polyserositis, rather than a single prolonged episode, would be expected with this disease. A transfusion history should be obtained to explore the possibility of viral hepatitis. While iron overload can predispose patients to various infections including liver abscess, thalassemia minor should not require transfusion. Esophageal stricture could conceivably be due to histoplasmosis (complicated by mediastinal fibrosis) or tuberculosis, but is probably unrelated to his present illness. His excessive alcohol intake increases his risk for esophageal cancer and liver disease, but it is unlikely that metastatic disease to the liver would present with fever without preceding dysphagia, or that alcoholic hepatitis could have escaped detection after evaluations by several physicians.
We need to learn the details of the patient's physical examination. Given the development of right upper‐quadrant pain, I would particularly like to know if he had hepatosplenomegaly and if a Murphy's sign was present.
His temperature ranged from 36.9C to 39.8C, his pulse was 76 beats per minute with minimal elevations during fever spikes, and his respirations were 18 per minute. His blood pressure was 105/70 mm Hg. He was a well‐developed, overweight male with scleral icterus. He had good dentition and an oropharynx free of lesions. Cardiac examination demonstrated a regular rhythm with a normal S1 and S2, without murmurs or peripheral stigmata of infectious endocarditis. A smooth, minimally tender liver edge was palpable 2 cm below the costal margin; the spleen was nonpalpable. Murphy's sign was absent. There was no lymphadenopathy or rash. He had multiple, shallow, uninfected lacerations of both hands in various stages of healing. The remainder of his examination was normal.
The patient has obvious liver involvement. The pulse‐temperature dissociation suggests a variety of infections, including salmonellosis, psittacosis, typhoid fever, leptospirosis, tularemia, brucellosis, legionellosis, and mycoplasma pneumoniae infection. The patient should be asked how and when he injured his hands, as fresh water exposure can transmit leptospirosis across broken skin. However, while severe leptospirosis can cause fever and jaundice, the long duration of illness is not typical. The cryptogenic form of tularemiawhich can manifest as a typhoidal illnessshould be considered, given that tularemia is present in the area the patient visited; he should be asked about exposure to rabbits.
At this point, I would like to see a standard biochemical profile, a liver panel, a complete blood count and differential, urinalysis, chest X‐ray, and an electrocardiogram. I would examine thick and thin Wright‐Giemsa‐stained smears for evidence of babesiosis. Blood cultures should be held for at least 2 weeks to recover fastidious organisms like Francisella tularensis and Brucella sp. Bone marrow cultures should be obtained; they are more sensitive for mycobacteria and Brucella, and may also yield fungal pathogens. Serologies for a variety of infectious diseases, such as leptospirosis, typhoid fever, and tularemia, will be required if other diagnostic tests are unrevealing.
His white cell count was 8,100/L, with a normal differential, and his hemoglobin was 10 g/dL (normal range, 1417), with a mean corpuscular hemoglobin of 63 m3 (normal range, 8298). The platelet count was 303,000/L. Serum electrolytes were normal. His aspartate aminotransferase was 58 U/L and his alanine aminotransferase was 60 U/L (normal range for both, 1045). Bilirubin was 2.6 mg/dL (normal, <1.2); direct bilirubin was 0.9 mg/dL. Alkaline phosphatase was 150 U/L. Lactate dehydrogenase was 342 U/L (normal range, 2251). A lipase was 62 U/L. International normalized ratio (INR) was 1.4 with an activated partial thromboplastin time (aPTT) of 52 seconds (normal range, 2533). Erythrocyte sedimentation rate (ESR) was 50 mm/hour (normal range, 015). Iron studies showed a suppressed iron and iron‐binding capacity and elevated haptoglobin and ferritin (1878 ng/L; normal range, 22322). Several blood cultures obtained at admission showed no growth after 48 hours of incubation.
The anemia, low mean cell volume (MCV), and elevated ferritin and ESR are consistent with anemia of chronic disease, superimposed upon thalassemia minor. Transaminase elevations occur in a plethora of infectious processes. The elevated INR and aPTT are concerning, and may indicate a septic or malignant process with disseminated intravascular coagulation (DIC). While there is no mention of clinical DIC, it would be appropriate to obtain D‐dimers, fibrin degradation products, and a fibrinogen level. The platelet count is normal, which is reassuring.
Before initiating any empiric antimicrobials, I would obtain an abdominal ultrasound, and possibly an abdominal CT. Hepatitis (especially B and C), cytomegalovirus, and Epstein‐Barr virus serologies should be obtained. A variety of conditions including leptospirosis, tularemia, and babesiosis are possible; specific laboratory testing is required to guide therapy.
Ultrasound showed a thickened gallbladder; the liver was slightly enlarged with normal echotexture. Magnetic resonance cholangiopancreatography (MRCP) showed diffuse sequential beading and scarring of his extrahepatic biliary ducts.
There is no evidence of biliary stones, intrahepatic tumor, or abscess to explain the fever and hepatitis, although it would be helpful to know what other abdominal structures were imaged. The MRCP finding increases my suspicion of PSC, possibly complicated by infection, although the biliary abnormalities may be incidental, and an unrelated process may be responsible for the clinical presentation.
His physicians considered the possibilities of PSC and cholangiopathy due to as‐yet undiagnosed acquired immunodeficiency syndrome. Ampicillin‐sulbactam, ceftazidime, and gentamicin were administered for possible bacterial cholangitis, and endoscopic retrograde cholangiopancreatography was performed. This procedure showed only slight narrowing of his common bile duct, which was felt to be a normal variant. He felt no better after several days of antibiotic therapy, and was transferred to a tertiary care center for further evaluation. Repeat physical exam and laboratory studies were essentially unchanged. The patient explained that his hand lacerations were sustained during his work as a butcher who worked with lamb, beef, rabbit, and poultry. He rarely wore protective gloves because they induced contact dermatitis.
Tularemia becomes more likely given his history of rabbit butchering. Salmonellosis and leptospirosis also remain possible. Typhoid fever and brucellosis are unlikely unless the patient worked with imported exotic animals. At this point, given the systemic illness, empiric antibacterial therapy is reasonable. Of the chosen antimicrobials, only the gentamicin would reliably treat tularemia. I would stop ampicillin‐sulbactam and ceftazidime and replace gentamicin with ciprofloxacin, an effective and better‐tolerated agent for tularemia. Cultures of blood and bone marrow aspirate should be obtained. Stool should be cultured for Salmonella. Tularemia, leptospirosis, and typhoid serologies should be sent to a reference laboratory. At this point in the patient's illness, high‐titered antibodies should be present. However, it would be ideal to compare titers with those from previous serum sample, if possible.
The patient's antimicrobials were narrowed to doxycycline alone, for suspected zoonotic infection, but his fevers were unchanged after 1 week of treatment. Hepatitis serologies, human immunodeficiency virus (HIV) antibody, and smears for ehrlichiosis and babesiosis were negative. He had a positive immunoglobulin (Ig)G and a negative IgM for Epstein‐Barr virus and cytomegalovirus. Tularemia, ehrlichiosis, leptospirosis, brucellosis, and Query fever (Q fever) serologies were ordered. The elevated aPTT did not correct when his serum was mixed with normal serum. Thrombin was normal; factor VIII, von Willebrand (VW) factor, and VW cofactor were mildly elevated. Lupus anticoagulant was detected. A hepatologist declined to obtain a liver biopsy, citing the elevated aPTT and pending serologies. Given his clinical stability, the patient was discharged on doxycycline to await further results.
My highest suspicion is for tularemia, and I would switch antibiotic treatment to ciprofloxacin, awaiting serological results. Some in vitro studies have suggested that F. tularensis may often be resistant to doxycycline, and recent clinical experience has shown fluoroquinolones are superior to doxycycline in the treatment of tularemia.
His serologic results were as follows: tularemia, 1:32 (positive, 1:128); ehrlichia, 1:128 (granulocytic) and <1:64 (monocytic; normal for both, <1:64); leptospira, agglutinated nonspecifically; Brucella IgG and IgM 1 (negative, <9), Q fever (coxiella) IgG 1 + 2, IgM 1 + 2, all positive at 1:256 (<1:16). A transesophageal echocardiogram showed no evidence of endocarditis. The patient was treated with 10 weeks of doxycycline for Q fever hepatitis. His fever, headache, and laboratory abnormalities resolved, and he remained well after the completion of therapy.
The serologies suggest the patient had Coxiella burnetii hepatitis, and illustrate the value of a precise exposure history. Most butchers work only with muscle tissue and have a negligible risk of Q fever. In retrospect, it became clear that he worked part‐time in a slaughterhouse, where highly infectious reproductive tract fluids can dry and aerosolize.
Commentary
Q fever was proposed as the name for a febrile illness affecting Australian slaughterhouse workers in 1937.1 The etiologic agent, C. burnetii, is a small, gram‐negative, obligate intracellular proteobacterium that exists in 2 distinct phases, specializing either in entering or persisting in macrophage lysosomes.2 Additionally, spores are formed and can persist in soil.
Q fever is an uncommonly recognized disease, in part because most infected persons have no symptoms or mild symptoms.3 In the United States, the estimated annual incidence has been 0.28 per million (about 50 cases per year) since 1999, when Q fever became a reportable disease due to bioterrorism concerns. In France, more frequent farming of goats and sheep may be responsible for the much higher annual incidence of 500 per million.4 Spread is usually occupational, via aerosol contact with the dried reproductive tract secretions of animals (mainly cattle, sheep, and goats), in a slaughterhouse or farm setting. However, wind‐borne dust can carry spores long distances, and spread can occur from household pets, unpasteurized dairy products, laboratory work, and possibly ticks.3 More than 30 cases have been reported in military personnel deployed to Iraq and Afghanistan, several without obvious exposures.5 One review noted a single reported case of intradermal inoculation,3 making this patient's lacerations a possible site of infection, but he was also at risk for inhalational exposurewhen he was later asked about the details of his work, he acknowledged working at a slaughterhouse as well as a supermarket.
Symptomatic patients are male in 77% of cases, can usually identify an occupational exposure, and have a mean age of 50 years.4 Fever, which lasts 5 to 57 days, as well as fatigue and headaches, begin after a 1‐week to 3‐week incubation period. Atypical pneumonia or rash may occur; meningoencephalitis and myocarditis portend a worse prognosis. As with this patient, 45% to 85% of patients suffer from hepatitis, although few have an abnormal bilirubin.3 Liver biopsy usually reveals granulomas, which may have a classic doughnut hole appearance,2, 3 although this patient ultimately received a diagnosis without the procedure. Acute Q fever rarely (5%) requires hospitalization, and fatalities are extremely rare.3
Chronic infection (ie, lasting >6 months) most often occurs as endocarditis, although chronic hepatitis, osteomyelitis, and infections of other sites occur. Interestingly, this patient's lupus anticoagulant may have been related to his underlying illness, as autoantibodies frequently occur in Q fever, especially in patients with hepatitis, many of whom develop smooth muscle antibodies, a positive Coombs test, antiprothrombinase, or other autoantibodies,3 and there is a high incidence of antiphospholipid antibodies, particularly anticardiolipin and lupus anticoagulant antibodies.6
Because C. burnetii is an obligate intracellular pathogen, culture requires either tissue or live animal inoculation, and the diagnosis is usually made serologically. Paired sera demonstrating seroconversion or a 4‐fold increase in titers are most conclusive, but a single sample may be used. Anti‐phase II antibodies are detectable in 90% of patients within 3 weeks of infection3 and peak at 2 months5; this patient's phase II sera (IgG > 1:200, IgM > 1:50) are said to be 100% predictive for acute Q fever.3 High‐titer anti‐phase I antibodies, in contrast, indicate chronic infection, and a titer 1:800 is one of the modified Duke criteria for endocarditis.5
Acute Q fever is generally treated with doxycycline for 14 days, although prolonged therapy may be advisable to prevent endocarditis if preexisting valvular lesions are present.2, 5 Fluoroquinolones are another option and may be especially useful for meningoencephalitis.5 Because acute Q fever is generally self‐limited, demonstrating a clear benefit to antibiotic therapy is difficult. The available evidence, which was largely obtained from Q fever pneumonia patients, suggests that tetracycline therapy shortens fever duration.3 Patients with Q fever hepatitis may have a protracted course. On the basis of anecdotal reports, some experts add prednisone (tapered from 40 mg daily over a week) for patients with Q fever hepatitis who fail to respond to doxycycline promptly.3 While this patient's fever was unchanged after a week of therapy, he was well into his treatment course when his diagnosis was ultimately confirmed. His physicians felt that prednisone would be of uncertain benefit and opted not to administer it.
Treatment of Q fever endocarditis is often delayed by the combination of negative blood cultures and a low (12%) rate of vegetation formation, increasing the risk of morbidity and mortality.3 Tetracycline monotherapy is associated with a greater than 50% risk of death,5 and even 4 years of treatment may fail to sterilize valve tissue.3 However, if hydroxychloroquine is given with doxycycline for at least 18 months to alkalize lysosomes and improve bacterial killing, the mortality rate can be lowered to about 5%.3, 5 Patients should be warned of the risk of photosensitivity, and monitored for retinal toxicity2 and serologic evidence of relapse.5
Before serologic results confirmed the diagnosis of Q fever, both the patient's clinicians and the discussant had to craft an antibiotic regimen for a suspected zoonosis. The patient received doxycycline, a good choice for leptospirosis,7 brucellosis,8 tularemia,9 and Q fever,3 all possible after livestock exposure, as well as ehrlichiosis.10 The discussant, who suspected tularemia, worried about the possibility of doxycycline resistance and selected ciprofloxacin instead. While fluoroquinolones are probably superior to doxycycline for mild to moderate tularemia,11, 12 aminoglycosides would be preferred for severe disease,9 and ciprofloxacin experience in leptospirosis7 and ehrlichiosis10 is limited. Neither selection would be optimal for brucellosis, for which either doxycycline or ciprofloxacin should be combined with another agent such as rifampin.8 The most reasonable empiric regimen is debatable, but in the absence of pathognomonic findings of tularemia, his treating physicians favored the broader activity of doxycycline.
Ultimately, the choice of antibiotics in this case hinged on the details of the patient's occupational exposures. His first 2 courses of antibiotics were based not on his exposure history, but on radiographic findings that were later proven spurious. The regimens selected by the discussant and by physicians at the referral hospital both targeted pathogens suggested by the patient's occupational history instead, but both were missing parts of the puzzle as well. The discussant thought the patient performed commercial butcher‐shop work, which is only rarely13 mentioned in the context of Q fever transmission. Several of the admitting physicians at the referral hospital were unaware of the importance of the butcher/slaughterhouse‐worker distinction. Physicians need a detailed understanding of both the exposure history and the biology of possible pathogens to craft an optimal differential diagnosis and empiric antibiotic regimen.
On the other hand, in most patients with fever of unknown origin (FUO; ie, >3 weeks with temperature >38.3 on multiple occasions, without a diagnosis after a weeklong evaluation),14 empiric antibiotic therapy is rarely a wise intervention. Clinicians should avoid blind administration of antibiotics as a diagnostic tool, given the inability to distinguish clinical responses from spontaneous resolution, or pinpoint a specific cause and thus a precise treatment plan and duration. However, empiric tetracyclines have been employed when intracellular pathogens were a suspected cause of FUO, as in one series of French patients in which Q fever was common.15 In this patient's case, no specific finding pointed to Q fever before the serologies became available, but the rare infections considered in this case can be considered doxycycline‐deficient states, meaning that empiric tetracycline therapy often leads to improvement. Recognizing doxycycline deficiency can guide therapy while definitive results are pending, and empiric doxycycline is particularly important if potentially aggressive zoonoses, such as Rocky Mountain spotted fever, are suspected.
Teaching Points:
-
A detailed and precise exposure history is crucial for the diagnosis of Q fever and other zoonoses and for the individualized evaluation of FUO in general.
-
Q fever is a rare disease that most commonly causes undifferentiated fever, pneumonia, hepatitis, and when chronic, often reflects endovascular infection, which is frequently difficult to eradicate.
-
Doxycycline is effective for many, but not all zoonoses (babesia is a notable exception). Empiric therapy is reasonable if suspicion is high.
- .“Q” fever, new fever entity: clinical features, diagnosis and laboratory investigation.Med J Aust.1937;2:281–299.
- ,,.Q fever.Lancet.2006;367(9511):679–688.
- ,.Q fever.Clin Microbiol Rev.1999;12:518–553.
- ,,, et al.National surveillance and the epidemiology of human Q fever in the United States, 1978–2004.Am J Trop Med Hyg.2006;75:36–40.
- ,,,.Q fever: epidemiology, diagnosis, and treatment.Mayo Clin Proc.2008;83(5):574–579.
- ,,, et al.Prevalence, significance, and specificity of antibodies to phospholipids in Q fever.Clin Infect Dis.1994;18:213–218.
- ,,.Antimicrobial therapy of leptospirosis.Curr Opin Infect Dis.2006;19:533–537.
- ,,, et al.Treatment of human brucellosis with doxycycline plus rifampin or doxycycline plus streptomycin. A randomized, double‐blind study.Ann Intern Med.1992;117:25–30.
- ,,,.Tularemia: current epidemiology and disease management.Infect Dis Clin North Am.2006;20:289–311, ix.
- ,,,.Ehrlichioses in humans: epidemiology, clinical presentation, diagnosis, and treatment.Clin Infect Dis.2007;45(Suppl 1):S45–S51.
- ,.New approaches to diagnosis and therapy of tularemia.Ann NY Acad Sci.2007;1105:378–404.
- ,,, et al.Evaluation of clinical, laboratory, and therapeutic features of 145 tularemia cases: the role of quinolones in oropharyngeal tularemia.APMIS.2008;116:66–73.
- ,.A survey of Q fever antibodies in a high risk population in Panamá.Am J Trop Med Hyg.1980;29(5):1007–1011.
- ,.Fever of unknown origin.Lancet.1997;350:575–580.
- .Fever of unknown origin in adults: evaluation of 144 cases in a non‐university hospital.Scand J Infect Dis.2006;38:632–638.
Inpatient Glycemic Control Outcomes
The concept of improved inpatient diabetes control has been gaining attention in hospitals nationwide as a mechanism for improving patient outcomes, decreasing readmission rates, reducing cost of care, and shortening hospital length of stay.14 The growing recognition that glycemic control is a critical element of inpatient care has prompted several national agencies, including the National Quality Forum (NQF), University Health System Consortium (UHC), Centers for Medicare and Medicaid Services (CMS), and the Joint Commission (JC) to make inpatient diabetes control a focus of quality improvement efforts and outcomes tracking.1 There is a national trend toward the use of intravenous insulin infusion for tight glycemic control of stress‐induced hyperglycemia in postoperative intensive care unit (ICU) and medical ICU patients.5, 6 Consequently, there is a need for the development of a standardized approach for performance evaluation of subcutaneous and intravenous insulin protocols, while ensuring patient safety issues. The analysis of glucose outcomes is based on the systematic analysis of blood glucose (BG) performance metrics known as glucometrics.7, 8 This has provided a means to measure the success of hospital quality improvement programs over time.
The 2008 American Diabetes Association (ADA) Clinical Practice Recommendations endorse BG goals for the critically ill to be maintained as close as possible to 110 mg/dL (6.1 mmol/L) and generally <140 mg/dL (7.8 mmol/L).2 The American Association of Clinical Endocrinologists/The American College of Endocrinology guidelines recommend for ICU care BG in the range of 80110 mg/dL.1, 4 Regarding the non‐critically ill patients, the ADA recommends targets for fasting BG of <126 mg/dL (7.0 mmol/L) and all random BG 180200 mg/dL (1011.1 mmol/L).2 A limitation for these BG goals is hypoglycemia; the ADA endorses that hospitals try to achieve these lower BG values through quality improvement initiatives devised to systematically and safely reduce the BG targets.2
Materials and Methods
The Medical University of South Carolina (MUSC) is a 709‐bed tertiary‐care medical/surgical center located in Charleston, South Carolina. The medical center consists of 6 adult ICUs: medical intensive care unit, coronary care unit, cardiothoracic intensive care unit, neurosurgical intensive care unit, neurosurgical trauma intensive care unit, and surgical trauma intensive care unit. Overall, 14% of patients are in the ICUs, and 86% of patients are on the wards. MUSC has an extensive referral network including neighboring hospitals, rehabilitation centers, outpatient specialty treatment and imaging centers, and doctors' offices.
MUSC Hospital Diabetes Task Force
In 2003, the Medical Executive Committee (MEC) and the Medical Director of the MUSC Medical Center mandated that a Hospital Diabetes Task Force (HDTF) be created to improve the care of patients with diabetes hospitalized at our facility. The initial goal of the HDTF was to develop a multidisciplinary team that would address the barriers to achieving glycemic control in the inpatient setting. Chaired by an endocrinologist, the HDTF currently consists of representatives from medicine (endocrinology and hospital medicine), surgery, nursing, diabetes education, nutrition, hospital administration, pharmacy, house staff, and laboratory medicine. The HDTF has been responsible for developing and overseeing the implementation of standardized nursing flow sheets for diabetic patients, order sets for subcutaneous and intravenous insulin administration, protocols for management of hypoglycemia and hyperglycemia, and systems tracking outcomes for quality improvement. The HDTF has also taken the lead in educating physician and nursing staff in the proper use of the new protocols and procedures.
Development of Hypoglycemia Protocol
The task force began with the hypoglycemia policy that was currently in place at the time. Initially developed in 1993, the policy outlined guidelines for the nursing staff to follow in the treatment of hypoglycemia. Over the course of 6 months, the task force revised the policy as well as the hypoglycemia protocol based on the following principles:
Nurse‐initiated orders for treatment of hypoglycemia throughout the hospital.
Standardized treatment for hypoglycemia based on patient type and degree of hypoglycemia.
Availability of glucose tablets, glucagon, and intravenous 50% dextrose (D50%) in easily accessible areas on all units.
Linkage of the hypoglycemia protocol to all insulin orders.
Extensive education of hypoglycemia symptom recognition and treatment.
Linkage of the hypoglycemia protocol to nursing documentation.
Development of carbohydrate counting in the hospital.
The assumption was that a major revision of the hypoglycemia protocol, based on these principles, would ensure better patient safety against hypoglycemic events, especially in light of the intensive medical management of glycemic control. On October 1, 2004, MUSC instituted a nurse‐initiated order for a hospital‐based hypoglycemia protocol to begin treatment for all BG <70 mg/dL. The hypoglycemia protocol became a part of the online adult insulin prescribing system so that when the physician signed the adult online insulin orders, the hypoglycemia protocol was ordered at the same time. Nursing units were stocked with glucose tablets, intramuscular glucagon, and D50% for consistent treatment of hypoglycemia.
Modifications to the hypoglycemia protocol included the following: in July 2006changing to specific aliquots of D50% for treatment of hypoglycemia to avoid overcorrection of low BG; reinforcing the need with the nursing staff to recheck BG 15 minutes after an episode of hypoglycemia; listing of juice as a last form of treatment for hypoglycemia; and in May 2007instituting a hypoglycemia prevention policy along with a hypoglycemia treatment policy (see Table 1 for hypoglycemia treatment protocol).
| Patient Characteristics | Action To Be Taken |
|---|---|
| |
| The patient is unable to eat or swallow safely | Administer dextrose 50% by intravenous push as follows: |
| The patient is NPO | 15 mL (7.5 g) for BG 6069 mg/dL |
| OR | 20 mL (10 g) for BG 5059 mg/dL |
| The patient is unconscious | 25 mL (12.5 g) for BG 3049 mg/dL |
| AND | 30 mL (15 g) for BG <30 mg/dL |
| The patient has intravenous access | Assess unconscious patient for adequate airway, breathing, and circulation |
| If possible place patient in a lateral recumbent position to decrease aspiration | |
| Place patient on seizure precautions | |
| Recheck BG every 15 minutes and repeat treatment until BG is greater than 70 mg/dL | |
| The patient is unable to eat or swallow safely | Administer 1 mg glucagon intramuscularly |
| The patient is NPO | Assess patient for adequate airway, breathing, and circulation |
| OR | Place patient in a lateral recumbent position to decrease aspiration |
| The patient is unconscious | Place patient on seizure precautions |
| AND | Establish intravenous access |
| The patient does not have intravenous access | Recheck BG and consciousness every 5 minutes and repeat treatment until BG is greater than 70 and patient is awake |
| The patient is able to eat and swallow safely | Feed with 15 grams of carbohydrate in order of preference from the following: |
| OR | Fast Fifteen: 3 glucose tablets |
| The patient has a patent nasogastric tube | 1 tablespoon of sugar (3 packets) |
| 4 oz (120 mL) of regular soda | |
| 4 oz (120 mL) of juice | |
| Recheck BG in 15 minutes and repeat treatment until BG is greater than 70 mg/dL | |
| It will be necessary to give the patient extra food after blood glucose is greater than 70 mg/dL if hypoglycemia occurs greater than 1 hour from meal or occurs during sleeping hours. Feed the | |
| patient 1 of the following: | |
| 8 oz (1 cup) of whole milk | |
| 6 saltine crackers with 2 tablespoons of peanut butter | |
| 6 saltine crackers with 1 oz. cheese | |
Education of Hospital Personnel
In addition to the development of the hypoglycemia protocol and a nursing flow sheet dedicated specifically to the use of insulinthe insulin Medication Administration Record (MAR) (Supporting Figure 1)a key piece in the implementation strategy was the development of an educational program for the nurses, house staff, and medical personnel about policies and procedures. Many in‐service sessions were conducted to outline the protocols and to troubleshoot any difficulties.9 The key champion for training the nurses was a hospital RN Certified Diabetes Educator (CDE) who was instrumental in obtaining in‐hospital nursing support for the protocols. A series of 30‐minute to 60‐minute in‐service sessions were conducted for nursing staff on each unit before the protocols were launched. To ensure that these in‐services were presented to as many staff as possible, the sessions were repeated at least two times for each shift. An important aspect of the education was the understanding of the different types of insulin and the concepts addressing the ways insulin can be used for maintenance of euglycemia: basal, prandial, and correction.14, 10, 11 This education also included information regarding ADA BG targets, characteristics of an insulin‐deficient patient, defining type 1 and type 2 diabetes, a review about insulin requirements during health and illness, treatment of hypoglycemia, information about insulin products, the concept of carbohydrate counting, and proper documentation of patient treatment.2, 1214
Subcutaneous Insulin Protocol
The protocols for subcutaneous (SC) insulin developed by the HDTF targeted a BG range of 70140 mg/dL on the medical surgical floors (Supporting Figure 2). The forms developed were based on scheduled or programmed insulin, which consists of basal and prandial/nutritional insulin with SC correction‐dose insulin.15 Correction or supplemental insulin is used to treat elevated BGs that occur before meals or between meals. If used at bedtime, the correction insulin is lowered to prevent nocturnal hypoglycemia. Correction‐dose insulin is different from sliding‐scale insulin, which is a predetermined amount of insulin used to treat hyperglycemia without regard to prior insulin administration or timing of food intake.15 When patients are hospitalized, scheduled and correction insulin doses are raised to cover the increased insulin needs of basal, prandial, and nutritional dosing in the hospital settting.3 As routine process of care, oral antihyperglycemic agents were recommended to be stopped at the time of hospital admission.
In January 2006, MUSC instituted a surveillance plan with nursing CDEs who reviewed charts for events of hypoglycemia and hyperglycemia: BG < 60 mg/dL and two BGs >200 mg/dL, respectively. In January 2006, all sliding‐scale insulin protocols were eliminated and replaced with basal, prandial, and correction insulin protocols. In July 2006, MUSC eliminated SC regular insulin use and replaced it with SC analog insulin use, except for a rare patient exception.
To reduce insulin errors, our hospital formulary was restricted to the following insulin use: SC glargine, SC neutral protamine hagedorn (NPH), SC aspartame, and intravenous (IV) regular (Table 2 shows the time line for hospital upgrades, with dates).
| Date | Intervention |
|---|---|
| September 2003 | Formation of HDTF |
| October 2004 | Initiation of hypoglycemia protocol: MD standing order for nurse‐driven hypoglycemia protocol |
| January‐May 2005 | Intensive nursing education: how to Rx hypoglycemia, nursing flow sheet (insulin MAR), patient education record, CHO counting, insulin concepts |
| October 2005 | Began using IVIIC in CT Surgery |
| January 2006 | Surveillance plan with CDE chart checks: hypoglycemia <60 mg/dL and hyperglycemia two BGs >200 mg/dL |
| January 2006 | All sliding‐scale insulin protocols eliminated and replaced with preprinted protocols basal dose based on body weight, prandial dose based on body weight, and correction dose based on total daily dose of insulin |
| February 2006 | All adult ICUs using IVIIC with BG checks q 2‐4 hour |
| June 2006 | Stress need to use juice last in Rx hypoglycemia, so not to over treat patients |
| July 2006 | Use aliquots D50 to Rx different severities of hypoglycemia |
| July 2006 | Elimination of SC regular insulin and replace it with SC insulin analog use. Hospital formulary restricted to: SC glargine, SC NPH, SC aspart, and IV regular insulin |
| July 2006 | Increase frequency BG checks while using IVIIC: check BG q1 hour |
| July 2006 | Eliminate SC Novolin 70/30 from hospital formulary and replace with SC Novolog 70/30 |
| September 2006 | Implement insulin pump initiation/orders |
| May 2007 | Institute hypoglycemia prevention policy along with hypoglycemia treatment policy |
| June 2007 | Stress difference between juices: apple/orange juice: 15 g; and prune, cranberry, grape juice: 23 g |
Intravenous Insulin Protocol
The HDTF initially reviewed 15 evidence‐based protocols and identified 5 desirable protocol characteristics. These characteristics included easy physician ordering (requiring only a signature), ability to quickly reach and maintain a BG target range, minimal risk for hypoglycemic events, adaptability for use anywhere in the hospital setting, and acceptance and implementation by nursing staff.16
The IV protocol, a web‐based calculator (Figure 1), was developed based on the concept of the multiplier by White et al.17 For this protocol, the IV infusion (IVI) rate is changed based on a formula that uses a multiplier (a surrogate for insulin sensitivity factor) and the difference between measured BG and target blood glucose (TBG). The calculator uses the following mathematical formula: rate of insulin infusion/hour = (current BG 60 mg/dL) 0.03.18, 19 Additionally, the protocol requires that enough insulin be infused to address severe hyperglycemia at initiation with a rapid reduction in the insulin infusion rate as BG normalizes. The protocol also permits an adjustment of the insulin rate by tenths of a unit per hour to maintain the BG in the center of the target range. The main variant of this protocol is the value of the starting multiplier. The web‐based calculator is currently being used in all 6 adult ICUs and on all of the adult medical‐surgical floors at MUSC.
In early 2006, all adult ICUs were using our in‐house, web‐based intravenous insulin infusion calculator (IVIIC), which prompted more BG readings with intensification of insulin drip use.19 Specifically, initial monitoring for the IVIIC included BG readings every 24 hours. To avoid hypoglycemic events from occurring with the intensification of BG readings for the IVIIC, the BG monitoring frequency was increased to every hour in July 2006. Initial treatment for hypoglycemia was D50% (12.525 g), which tended to overcorrect BG. In July 2006, we revised the protocol using aliquots of D50% specific to the BG reading.19 This action has resulted in decreasing the glycemic excursions observed due to overcorrection of hypoglycemia.
BG target ranges to match the level of care are as follows: intensive care unit (80110 mg/dL); labor and delivery (70110 mg/dL); adult medical/surgical floors (80140 mg/dL); diabetic ketoacidosis (DKA)/hyperosmolar nonketotic coma (HHNK) (150200 mg/dL); neurosurgery ICU (90120 mg/dL); and perioperative patients (140180 mg/dL).20 These BG targets were created to satisfy the clinical requests of specific departments at MUSC. We have restricted starting the multiplier for DKA/HHNK at 0.01, to affect a slower rate of change and the multiplier for all others is set at 0.03.
Transition From Intravenous to Subcutaneous Insulin
At MUSC, IV insulin therapy reverts to an SC insulin therapy protocol when the patient resumes PO feedings, discontinues pressor support, or stops volume resuscitation21 (see Supporting Figure 3 for the IV to SC insulin transition form). While preparing to stop IV insulin, SC insulinparticularly basal insulinshould begin at least 23 hours prior to discontinuing IV insulin. A short‐acting or rapid‐acting insulin may be given 12 hours SC prior to stopping IV insulin. This is particularly true for patients who are at risk for ketoacidosis, such as patients with type 1 diabetes.21 Recommendations for scheduled insulin administration include basal and prandial and correction doses of insulin to cover glycemic excursions. A minority of patients with stress hyperglycemia will not require conversion to SC insulin when discontinuing IV insulin therapy; however, BG monitoring and administration of correction insulin is recommended.
Data Collection
A retrospective chart review was approved by the MUSC Institutional Review Board, and the requirement of patient consent was waived. A database query against the hospital's electronic medical record was used to supply the data for this study. In particular, a complete listing of all finger‐stick BG measurements taken during June 2004 (preimplementation), June 2005 (implementation), and June 2006 and 2007 (postimplementation) was used. The sample included all inpatient stays for patients who had a documented history of diabetes or at least 1 BG reading in excess of 180 during the inpatient stay. Finger‐stick BG measurements taken within 50 minutes of another reading were excluded from the analysis to account for the increased testing frequency that occurs, per protocol, after detection of a hypoglycemic or hyperglycemic event. Finger‐stick BG levels were measured by the Abbott Precision PCX and downloaded directly into the university's electronic medical record.
Statistical Analysis and Considerations
Sample size estimation
A preliminary study of hypoglycemic rates in 2004 and 2005 was used to plan this analysis.22 In this preliminary study, 295 of 13,366 BG readings were mildly hypoglycemic before the glycemic protocol, yielding an estimated rate of 22.1 per 1,000 measurements. During the glycemic protocol implementation period (June 2005), an estimated rate per 1,000 measurements of 18.9 (289/15,324) was obtained. Using the binomial approximation to the Poisson, it was estimated that 30,499 additional BG measurements were needed to detect, with 80% power and a type I error rate of 0.05 (two‐sided), a rate ratio as small as 1.17 (22.1 per 1,000/18.9 per 1,000). Based on the number of BG measurements obtained in the preliminary study (14,000/month), two additional months of postintervention data were deemed necessary. Data from June 2006 and June 2007 were used to test the maintenance effects of the implemented glycemic management protocol.
Primary analysis
Mild, moderate, and severe hypoglycemia were defined as BG readings 5069 mg/dL, 4049 mg/dL, and <40 mg/dL, respectively.23 BG readings 250 mg/dL or higher were considered hyperglycemic. These events were summarized by the methods suggested for an inpatient setting.7 The first method treated each BG as an independent observation (i.e., ward‐level analysis for which the denominator was the total number of BG readings). This analysis represents a census, so statistical comparisons are not warranted (i.e., the population parameters are obtained), but the generalizability of the findings is limited accordingly. For the formal analysis of the prevalence of glycemic events by year, the patient‐day analysis was used. For this analysis, data were aggregated by each unique patient‐day. For each patient‐day, descriptive statistics were tabulated on the raw BG readings. For the determination of patient‐day occurrence of hypoglycemic events, the three hypoglycemic severities (mild, moderate, and severe) were treated as ordinal variables such that if a patient had a severe hypoglycemic episode on a given day, he was considered to have also had moderate and mild hypoglycemia for that day. This strategy was undertaken based on the belief that if a person had a worse outcome, then the less severe outcome also occurred during the same patient day.
The primary hypothesis was that the nurse‐driven hypoglycemia protocol implemented by 2005 would result in tighter BG control (lower rates of hyperglycemia and hypoglycemia) after implementation. To test this hypothesis, the patient‐day summary of BG readings was used to estimate the odds of an event for each year. The odds of developing mild (BG 5069 mg/dL), moderate (BG 4049 mg/dL), and severe (BG < 40 mg/dL) hypoglycemic events were compared using generalized estimating equations for correlated binary data.24 This analysis accounted for the clustering of observations (patient‐day summaries) within patient stay by modeling the correlation of outcomes within a patient stay. In addition to hypoglycemia, the proportion of patient days with a mean BG between 70180 mg/dL and the proportion of patients experiencing hyperglycemia (BG 250 mg/dL) was examined, and these results were analyzed using the same methodology used for the hypoglycemia endpoints. All analyses were conducted using SAS version 9.1.3 using the procedure GENMOD, a generalized linear modeling procedure in SAS/STAT.
Results
The baseline demographic characteristics of the four study groups are shown in Table 3. The four groups were found to be similar for gender distribution, mean age, and racial distribution. There were significant differences observed among hospital stay characteristics, insulin drip use, history of diabetes, ventilator support, kidney failure, dialysis, total parenteral nutrition (TPN), and red blood cell (RBC) transfusions. Overall, insulin drip use tended to increase over time. The percentage of patients with diabetes on admission or diagnosed during admission tended to decrease over time. This was likely due to an increase in the diagnosis and treatment of stress/steroid‐induced hyperglycemia during the hospital stay.
| Variable | All Years Combined (n = 2102)* | 2004 (n = 434) | 2005 (n = 486) | 2006 (n = 609) | 2007 (n = 573) | P value |
|---|---|---|---|---|---|---|
| ||||||
| Sex, male n (%) | 959 (45.6) | 186 (42.9) | 214 (44.0) | 292 (48.0) | 267 (46.6) | 0.34 |
| Age (years), mean (SD) | 56.8 | 57.6 (14.8) | 58.0 (15.8) | 56.7 (16.1) | 55.4 (16.4) | 0.092 |
| Race | ||||||
| Caucasian | 1000 (47.6%) | 202 (46.5%) | 217 (44.7%) | 300 (49.3%) | 281 (49.0%) | 0.64 |
| African American | 1059 (50.4%) | 226 (52.1%) | 255 (52.5%) | 299 (49.1%) | 279 (48.7%) | |
| Hispanic | 26 (1.2%) | 4 (0.9%) | 8 (1.6%) | 5 (0.8%) | 9 (1.6%) | |
| Other | 17 (0.8%) | 2 (0.5%) | 6 (1.2%) | 5 (0.8%) | 4 (0.7%) | |
| Hospital stay characteristics n (%) | ||||||
| Floor only | 1630 (77.6%) | 355 (81.8)% | 389 (80.0%) | 430 (70.6%) | 456 (79.6%) | <0.001 |
| ICU only | 57 (2.7%) | 8 (1.8%) | 6 (1.2%) | 27 (4.4%) | 16 (2.8%) | |
| Floor and ICU | 415 (19.7%) | 71 (16.4%) | 91 (18.7%) | 152 (25.0%) | 101 (17.6%) | |
| Clinical characteristics n (%) | ||||||
| Insulin drip, floor and ICU | 306 (14.6%) | 38 (8.8%) | 52 (10.7%) | 106 (17.4%) | 110 (19.2%) | <0.001 |
| Insulin drip, floor patients only | 70 (4.3%) | 4 (1.1%) | 9 (2.3%) | 22 (5.1%) | 35 (7.7%) | <0.001 |
| History of diabetes | 1677 (79.8%) | 392 (90.3%) | 431 (88.7%) | 442 (72.6%) | 412 (71.9%) | <0.001 |
| Ventilator support | 319 (15.2%) | 44 (10.1%) | 64 (13.2%) | 135 (22.2%) | 76 (13.3%) | <0.001 |
| Kidney failure | 250 (11.9%) | 41 (9.5%) | 52 (10.7%) | 95 (15.6%) | 62 (10.8%) | 0.008 |
| Dialysis | 94 (4.5%) | 21 (4.8%) | 18 (3.7%) | 38 (6.2%) | 17 (3.0%) | 0.040 |
| Total parenteral nutrition | 128 (6.1%) | 27 (6.2%) | 18 (3.7%) | 55 (9.0%) | 28 (4.9%) | 0.001 |
| Red blood cell transfusions | 507 (24.1%) | 96 (22.1%) | 107 (22.0%) | 178 (29.2%) | 126 (22.0%) | 0.007 |
A total of 11,715 patient‐days, consisting of 56,401 individual BG readings obtained from 2,215 unique patients, were distributed across the 4 years. Table 4 presents the year‐specific patient‐day analysis. While the prevalence of mild (BG 5069 mg/dL) hypoglycemia was found to increase over the years studied (P < 0.01), the percentage of patient‐days with a mean BG in the range of 70180 mg/dL increased over the period of study (P < 0.01). The total hypoglycemia events <60 mg/dL are presented as comparative data to other studies.7 The percent of patient days with at least one BG < 70 mg/dL (reported in Table 4 as mild events) ranged from 3.72 in 2005 to as high as 10.71 in 2007; however, approximately one‐half of the hypoglycemic events are attributable to readings from BG 6069 since the proportion of patient days with a BG < 60 mg/dL was approximately one‐half that for BG < 70 mg/dL (Table 4). The prevalence of patient days with at least one moderate (BG 4049 mg/dL) or severe (BG < 40 mg/dL) hypoglycemia event was not found to increase in a linear manner. There was a statistical trend for potentially nonlinear relationship of year with moderate hypoglycemia and hyperglycemia.
| Year (number of patient days) | Tests of significance* | |||||
|---|---|---|---|---|---|---|
| Measure | 2004 (n = 2176) | 2005 (n = 2259) | 2006 (n = 3525) | 2007 (n = 3755) | Linear trend | Type 3 test |
| ||||||
| BG mean (SD) (mg/dL) | 156 (82) | 152 (72) | 154 (51) | 149 (51) | 0.85 | 0.23 |
| BG median [IQR] (mg/dL) | 136 [105, 186] | 136 [105, 181] | 144 [120, 177] | 137 [114, 169] | N/A | N/A |
| BG readings per patient‐day [mean (SD)] | 3.9 (2.4) | 4.2 (2.9) | 4.9 (3.4) | 5.7 (4.6) | N/A | N/A |
| % Patient‐days with mean BG in range (70‐180 mg/dL) | 69.53 | 72.82 | 76.68 | 79.79 | <0.01 | <0.01 |
| % BGs <60 mg/dL | 3.31 | 1.90 | 5.36 | 5.27 | <0.01 | <0.01 |
| % Mild hypoglycemia (50‐69 mg/dL) | 6.20 | 3.72 | 10.24 | 10.71 | <0.01 | <0.01 |
| % Moderate hypoglycemia (40‐49 mg/dL) | 1.88 | 0.84 | 2.75 | 2.08 | 0.15 | <0.01 |
| % Severe hypoglycemia (<40 mg/dL) | 0.69 | 0.44 | 0.96 | 0.75 | 0.49 | 0.37 |
| % Hyperglycemia (250 mg/dL) | 14.71 | 11.73 | 16.85 | 15.15 | 0.23 | 0.02 |
Immediately following the implementation (year 2005), post hoc comparisons suggested that the rate of moderate hypoglycemia was lowest relative to the 3 other years, but no other statistical differences were observed. The year 2005 also had the lowest proportion of patient days with at least 1 hyperglycemic event.
The individual BG readings for the 2215 unique patients were also individually analyzed according to the methods of Goldberg et al.7 Even though no statistical tests were performed at the ward level, the descriptive data presented in Table 5 are consistent with the analysis of the patient‐day data. Several important features of the data are illustrated by Table 5. Most notably, the glycemic control at the hospital level is improved. The percentage of BG readings in the range of 70180 mg/dL increased annually whereas the mean BG values, the coefficient of variation, and the interquartile range (IQR) decreased annually.
| Year (number of blood glucose readings) | ||||
|---|---|---|---|---|
| 2004 (n = 8,504) | 2005 (n = 9,396) | 2006 (n = 17,098) | 2007 (n = 21,403) | |
| ||||
| Number of patients | 434 | 486 | 612 | 683 |
| BG mean (SD) (mg/dL) | 156 (85) | 154 (81) | 149 (61) | 138 (57) |
| Coefficient of variation | 0.55 | 0.53 | 0.41 | 0.41 |
| Median BG [IQR] (mg/dL) | 135 [101‐186] | 134 [103‐183] | 136 [108‐176] | 124 [101‐160] |
| % BGs in range (70‐180 mg/dL) | 68.09 | 71.80 | 73.71 | 80.41 |
| % Mild hypoglycemia (50‐69 mg/dL) | 3.35 | 2.01 | 2.57 | 2.30 |
| % Moderate hypoglycemia (40‐49 mg/dL) | 0.95 | 0.29 | 0.47 | 0.26 |
| % Severe hypoglycemia (<40 mg/dL) | 0.67 | 0.36 | 0.24 | 0.15 |
| % Hyperglycemia (250 mg/dL) | 10.23 | 9.08 | 6.43 | 4.83 |
Conclusions
Collectively, we have shown that implementing standardized insulin order sets including hypoglycemia, SC insulin, IV insulin, and IV to SC insulin transition treatment protocols at MUSC may generate the expected benefits for patient safety for this population of patients. The primary hypothesis that the rate of hypoglycemia and hyperglycemia would be lower after the implementation of these protocols was supported by the data, because the overall blood glucose control was markedly improved as a result of the protocols. However, the effect was strongest in 2005 (immediately following the protocol's implementation) and appeared to diminish some with time.
There were several other quality improvement measures initiated at MUSC that likely contributed to the decreasing rates of hypoglycemia and hyperglycemia. For example, comparing June 2004 with June 2007, the number of patients tested increased from 434 to 683. This increase could be attributed, in part, to a trend on medical/surgical services toward an increased focus on glucose monitoring.
When intensive glycemic control programs are implemented, hospitals should have a standardized, nurse‐driven hypoglycemia protocol.11 The success of such a hypoglycemia treatment protocol is demonstrated by the improvement observed at MUSC since the protocol was first implemented in October 2004.22
There are limitations that warrant consideration. A key limitation is that other procedural changes may have occurred during the years of study. Because the initial focus of the HDTF was to reduce hypoglycemic and hyperglycemic events, a multipronged approach was used, beginning with the treatment protocol but followed by other changes. These changes, while unmeasured in the current study, could have influenced the rate of hypoglycemia and hyperglycemia. Therefore, although the protocol that we developed has sound theoretical underpinnings, the improvement in glycemic control at other hospitals may vary. Second, because this was initially regarded as a quality improvement project for hospitalized patients with hypoglycemia and hyperglycemia, we did not evaluate morbidity, mortality, or other clinical outcome data other than BG targets and incidences of hypoglycemia and hyperglycemia. Third, there was no concurrent control group established for this study, rather the study used a retrospective, nonrandomized design with a historical control. As previously mentioned, we cannot rule out the idea that other changes occurred between the preprotocol and postprotocol interval to influence our results. Finally, there are statistical limitations to the research.
One limitation regarding the analysis of the BG data was the potential for an increased type I error (ie, false‐positive result) due to clustering of BG values within a patient and increased monitoring frequencies when a hypoglycemic or hyperglycemic event was observed. The generalized estimating equations directly addressed the first concern. In particular, the effective sample size for each participant was a function of the number of patient‐days and the correlation of patient‐day summaries. Therefore, patients with several highly‐correlated outcomes would contribute less to the analysis than other patients with the same number of patient‐days that were correlated to a lesser extent. As for the second concern, the patient‐day frequencies alleviate this problem and avoid the length‐of‐stay bias associated with a patient‐level (or patient‐stay) analysis. Power was less than planned due in part to the use of the patient‐day analysis instead of the originally designed ward‐level analysis. The change in the statistical design was a response to emerging evidence in the literature.7
In conclusion, the hypothesis that MUSC patients benefit from the use of standardized insulin order sets, hypoglycemia, and hyperglycemia treatment protocols, is supported by the data collected in this study. Because it has been recommended that a hypoglycemia and hyperglycemia prevention protocol as well as a hypoglycemia and hyperglycemia treatment protocol be in place, the HDTF will be focusing on the actual prevention of the hypoglycemic and hyperglycemic incidents occurring in the first place.2, 25 This may result in further reductions of hypoglycemic and hyperglycemic events. We have recently implemented hypoglycemia and hyperglycemia prevention policies at MUSC.
- Ace ADA Task Force on Inpatient Diabetes.American College of Endocrinology and American Diabetes Association Consensus Statement on Inpatient Diabetes and Glycemic Control.Endocr Pract.2006;12(4):458–468.
- ADA Writing Group.Standards of Medical Care in Diabetes—2008.Diabetes Care.2008;31(suppl 1):S12–S54.
- ,,, et al.Management of diabetes and hyperglycemia in hospitals.Diabetes Care.2004;27(2):553–591.
- ,,, et al.American College of Endocrinology Position Statement on Inpatient Diabetes and Metabolic Control.Endocr Pract.2004;10(suppl 2):4–9.
- ,,, et al.Intensive insulin therapy in the critically ill patients.N Engl J Med.2001;345:1359–1367.
- ,,, et al.Intensive insulin therapy in the medical ICU.N Engl J Med.2006;354(5):449–461.
- ,,, et al.“Glucometrics”: assessing the quality of inpatient glucose management.Diabetes Technol Ther.2006;8(5):560–569.
- .Society of Hospital Medicine Glycemic Control Task Force, Track Performance; Introducing Glucometrics. SHM;2007.
- ,,,.New insulin infusion protocol improves blood glucose control in hospitalized patients without increasing hypoglycemia.Jt Comm J Qual Patient Saf.2005;31(3):141–147.
- ,.The new insulin analogs: using a team approach to implement basal‐bolus insulin therapy.Pract Diabetol.2004; June:28–37.
- ,,.Practical Management of Inpatient Hyperglycemia.Lakeville, CT:Hilliard Publishing, LLC;2005.
- ,,.Hypoglycemia in hospitalized patients. causes and outcomes.N Engl J Med.1986;315(20):1245–1250.
- .Acute hypoglycemia: keeping the bottom from falling out.Nursing.1995;25(2):41–48; quiz 50.
- ,.Myths and facts about diabetic hypoglycemia.Nursing.1994;24(6):67.
- ,.Subcutaneous insulin therapy in the hospital setting: issues, concerns, and implementation.Endocr Pract.2004;10(suppl 2):81–88.
- ,,.Glucommander: a computer‐directed intravenous insulin system shown to be safe, simple, and effective in 120,618 h of operation.Diabetes Care.2005;28(10):2418–2423.
- ,,.Practical closed‐loop insulin delivery. a system for the maintenance of overnight euglycemia and the calculation of basal insulin requirements in insulin‐dependent diabetics.Ann Intern Med.1982;97:210–213.
- .Strategies for controlling glucose in the intensive care unit.Clin Pulmon Med.2006;13(6):332–347.
- ,,, et al.Outcomes of a cardiothoracic intensive care web‐based online intravenous insulin infusion calculator study at a medical university hospital.Diabetes Technol Ther.2007;9(6):523–534.
- ,,,.Outcomes of a nursing in‐service to evaluate acceptance of a web‐based insulin infusion calculator.J Diabetes Sci Technol.2008;2(3):376–383.
- ,,,.Intravenous insulin infusion therapy: indications, methods, and transition to subcutaneous insulin therapy.Endocr Pract.2004;10(suppl 2):71–80.
- ,,, et al.Outcomes of a hypoglycemia treatment protocol in a medical university hospital [Abstract].Diabetes.2006;55:203OR.
- ,,,,.Evolution of a diabetes inpatient safety committee.Endocr Pract.2006;12(suppl 3):91–99.
- ,.Longitudinal data analysis for discrete and continuous outcomes.Biometrics.1986;42(1):121–130.
- ,,, et al.Hospital hypoglycemia: not only treatment but also prevention.Endocr Pract.2004;10(suppl 2):89–99.
The concept of improved inpatient diabetes control has been gaining attention in hospitals nationwide as a mechanism for improving patient outcomes, decreasing readmission rates, reducing cost of care, and shortening hospital length of stay.14 The growing recognition that glycemic control is a critical element of inpatient care has prompted several national agencies, including the National Quality Forum (NQF), University Health System Consortium (UHC), Centers for Medicare and Medicaid Services (CMS), and the Joint Commission (JC) to make inpatient diabetes control a focus of quality improvement efforts and outcomes tracking.1 There is a national trend toward the use of intravenous insulin infusion for tight glycemic control of stress‐induced hyperglycemia in postoperative intensive care unit (ICU) and medical ICU patients.5, 6 Consequently, there is a need for the development of a standardized approach for performance evaluation of subcutaneous and intravenous insulin protocols, while ensuring patient safety issues. The analysis of glucose outcomes is based on the systematic analysis of blood glucose (BG) performance metrics known as glucometrics.7, 8 This has provided a means to measure the success of hospital quality improvement programs over time.
The 2008 American Diabetes Association (ADA) Clinical Practice Recommendations endorse BG goals for the critically ill to be maintained as close as possible to 110 mg/dL (6.1 mmol/L) and generally <140 mg/dL (7.8 mmol/L).2 The American Association of Clinical Endocrinologists/The American College of Endocrinology guidelines recommend for ICU care BG in the range of 80110 mg/dL.1, 4 Regarding the non‐critically ill patients, the ADA recommends targets for fasting BG of <126 mg/dL (7.0 mmol/L) and all random BG 180200 mg/dL (1011.1 mmol/L).2 A limitation for these BG goals is hypoglycemia; the ADA endorses that hospitals try to achieve these lower BG values through quality improvement initiatives devised to systematically and safely reduce the BG targets.2
Materials and Methods
The Medical University of South Carolina (MUSC) is a 709‐bed tertiary‐care medical/surgical center located in Charleston, South Carolina. The medical center consists of 6 adult ICUs: medical intensive care unit, coronary care unit, cardiothoracic intensive care unit, neurosurgical intensive care unit, neurosurgical trauma intensive care unit, and surgical trauma intensive care unit. Overall, 14% of patients are in the ICUs, and 86% of patients are on the wards. MUSC has an extensive referral network including neighboring hospitals, rehabilitation centers, outpatient specialty treatment and imaging centers, and doctors' offices.
MUSC Hospital Diabetes Task Force
In 2003, the Medical Executive Committee (MEC) and the Medical Director of the MUSC Medical Center mandated that a Hospital Diabetes Task Force (HDTF) be created to improve the care of patients with diabetes hospitalized at our facility. The initial goal of the HDTF was to develop a multidisciplinary team that would address the barriers to achieving glycemic control in the inpatient setting. Chaired by an endocrinologist, the HDTF currently consists of representatives from medicine (endocrinology and hospital medicine), surgery, nursing, diabetes education, nutrition, hospital administration, pharmacy, house staff, and laboratory medicine. The HDTF has been responsible for developing and overseeing the implementation of standardized nursing flow sheets for diabetic patients, order sets for subcutaneous and intravenous insulin administration, protocols for management of hypoglycemia and hyperglycemia, and systems tracking outcomes for quality improvement. The HDTF has also taken the lead in educating physician and nursing staff in the proper use of the new protocols and procedures.
Development of Hypoglycemia Protocol
The task force began with the hypoglycemia policy that was currently in place at the time. Initially developed in 1993, the policy outlined guidelines for the nursing staff to follow in the treatment of hypoglycemia. Over the course of 6 months, the task force revised the policy as well as the hypoglycemia protocol based on the following principles:
Nurse‐initiated orders for treatment of hypoglycemia throughout the hospital.
Standardized treatment for hypoglycemia based on patient type and degree of hypoglycemia.
Availability of glucose tablets, glucagon, and intravenous 50% dextrose (D50%) in easily accessible areas on all units.
Linkage of the hypoglycemia protocol to all insulin orders.
Extensive education of hypoglycemia symptom recognition and treatment.
Linkage of the hypoglycemia protocol to nursing documentation.
Development of carbohydrate counting in the hospital.
The assumption was that a major revision of the hypoglycemia protocol, based on these principles, would ensure better patient safety against hypoglycemic events, especially in light of the intensive medical management of glycemic control. On October 1, 2004, MUSC instituted a nurse‐initiated order for a hospital‐based hypoglycemia protocol to begin treatment for all BG <70 mg/dL. The hypoglycemia protocol became a part of the online adult insulin prescribing system so that when the physician signed the adult online insulin orders, the hypoglycemia protocol was ordered at the same time. Nursing units were stocked with glucose tablets, intramuscular glucagon, and D50% for consistent treatment of hypoglycemia.
Modifications to the hypoglycemia protocol included the following: in July 2006changing to specific aliquots of D50% for treatment of hypoglycemia to avoid overcorrection of low BG; reinforcing the need with the nursing staff to recheck BG 15 minutes after an episode of hypoglycemia; listing of juice as a last form of treatment for hypoglycemia; and in May 2007instituting a hypoglycemia prevention policy along with a hypoglycemia treatment policy (see Table 1 for hypoglycemia treatment protocol).
| Patient Characteristics | Action To Be Taken |
|---|---|
| |
| The patient is unable to eat or swallow safely | Administer dextrose 50% by intravenous push as follows: |
| The patient is NPO | 15 mL (7.5 g) for BG 6069 mg/dL |
| OR | 20 mL (10 g) for BG 5059 mg/dL |
| The patient is unconscious | 25 mL (12.5 g) for BG 3049 mg/dL |
| AND | 30 mL (15 g) for BG <30 mg/dL |
| The patient has intravenous access | Assess unconscious patient for adequate airway, breathing, and circulation |
| If possible place patient in a lateral recumbent position to decrease aspiration | |
| Place patient on seizure precautions | |
| Recheck BG every 15 minutes and repeat treatment until BG is greater than 70 mg/dL | |
| The patient is unable to eat or swallow safely | Administer 1 mg glucagon intramuscularly |
| The patient is NPO | Assess patient for adequate airway, breathing, and circulation |
| OR | Place patient in a lateral recumbent position to decrease aspiration |
| The patient is unconscious | Place patient on seizure precautions |
| AND | Establish intravenous access |
| The patient does not have intravenous access | Recheck BG and consciousness every 5 minutes and repeat treatment until BG is greater than 70 and patient is awake |
| The patient is able to eat and swallow safely | Feed with 15 grams of carbohydrate in order of preference from the following: |
| OR | Fast Fifteen: 3 glucose tablets |
| The patient has a patent nasogastric tube | 1 tablespoon of sugar (3 packets) |
| 4 oz (120 mL) of regular soda | |
| 4 oz (120 mL) of juice | |
| Recheck BG in 15 minutes and repeat treatment until BG is greater than 70 mg/dL | |
| It will be necessary to give the patient extra food after blood glucose is greater than 70 mg/dL if hypoglycemia occurs greater than 1 hour from meal or occurs during sleeping hours. Feed the | |
| patient 1 of the following: | |
| 8 oz (1 cup) of whole milk | |
| 6 saltine crackers with 2 tablespoons of peanut butter | |
| 6 saltine crackers with 1 oz. cheese | |
Education of Hospital Personnel
In addition to the development of the hypoglycemia protocol and a nursing flow sheet dedicated specifically to the use of insulinthe insulin Medication Administration Record (MAR) (Supporting Figure 1)a key piece in the implementation strategy was the development of an educational program for the nurses, house staff, and medical personnel about policies and procedures. Many in‐service sessions were conducted to outline the protocols and to troubleshoot any difficulties.9 The key champion for training the nurses was a hospital RN Certified Diabetes Educator (CDE) who was instrumental in obtaining in‐hospital nursing support for the protocols. A series of 30‐minute to 60‐minute in‐service sessions were conducted for nursing staff on each unit before the protocols were launched. To ensure that these in‐services were presented to as many staff as possible, the sessions were repeated at least two times for each shift. An important aspect of the education was the understanding of the different types of insulin and the concepts addressing the ways insulin can be used for maintenance of euglycemia: basal, prandial, and correction.14, 10, 11 This education also included information regarding ADA BG targets, characteristics of an insulin‐deficient patient, defining type 1 and type 2 diabetes, a review about insulin requirements during health and illness, treatment of hypoglycemia, information about insulin products, the concept of carbohydrate counting, and proper documentation of patient treatment.2, 1214
Subcutaneous Insulin Protocol
The protocols for subcutaneous (SC) insulin developed by the HDTF targeted a BG range of 70140 mg/dL on the medical surgical floors (Supporting Figure 2). The forms developed were based on scheduled or programmed insulin, which consists of basal and prandial/nutritional insulin with SC correction‐dose insulin.15 Correction or supplemental insulin is used to treat elevated BGs that occur before meals or between meals. If used at bedtime, the correction insulin is lowered to prevent nocturnal hypoglycemia. Correction‐dose insulin is different from sliding‐scale insulin, which is a predetermined amount of insulin used to treat hyperglycemia without regard to prior insulin administration or timing of food intake.15 When patients are hospitalized, scheduled and correction insulin doses are raised to cover the increased insulin needs of basal, prandial, and nutritional dosing in the hospital settting.3 As routine process of care, oral antihyperglycemic agents were recommended to be stopped at the time of hospital admission.
In January 2006, MUSC instituted a surveillance plan with nursing CDEs who reviewed charts for events of hypoglycemia and hyperglycemia: BG < 60 mg/dL and two BGs >200 mg/dL, respectively. In January 2006, all sliding‐scale insulin protocols were eliminated and replaced with basal, prandial, and correction insulin protocols. In July 2006, MUSC eliminated SC regular insulin use and replaced it with SC analog insulin use, except for a rare patient exception.
To reduce insulin errors, our hospital formulary was restricted to the following insulin use: SC glargine, SC neutral protamine hagedorn (NPH), SC aspartame, and intravenous (IV) regular (Table 2 shows the time line for hospital upgrades, with dates).
| Date | Intervention |
|---|---|
| September 2003 | Formation of HDTF |
| October 2004 | Initiation of hypoglycemia protocol: MD standing order for nurse‐driven hypoglycemia protocol |
| January‐May 2005 | Intensive nursing education: how to Rx hypoglycemia, nursing flow sheet (insulin MAR), patient education record, CHO counting, insulin concepts |
| October 2005 | Began using IVIIC in CT Surgery |
| January 2006 | Surveillance plan with CDE chart checks: hypoglycemia <60 mg/dL and hyperglycemia two BGs >200 mg/dL |
| January 2006 | All sliding‐scale insulin protocols eliminated and replaced with preprinted protocols basal dose based on body weight, prandial dose based on body weight, and correction dose based on total daily dose of insulin |
| February 2006 | All adult ICUs using IVIIC with BG checks q 2‐4 hour |
| June 2006 | Stress need to use juice last in Rx hypoglycemia, so not to over treat patients |
| July 2006 | Use aliquots D50 to Rx different severities of hypoglycemia |
| July 2006 | Elimination of SC regular insulin and replace it with SC insulin analog use. Hospital formulary restricted to: SC glargine, SC NPH, SC aspart, and IV regular insulin |
| July 2006 | Increase frequency BG checks while using IVIIC: check BG q1 hour |
| July 2006 | Eliminate SC Novolin 70/30 from hospital formulary and replace with SC Novolog 70/30 |
| September 2006 | Implement insulin pump initiation/orders |
| May 2007 | Institute hypoglycemia prevention policy along with hypoglycemia treatment policy |
| June 2007 | Stress difference between juices: apple/orange juice: 15 g; and prune, cranberry, grape juice: 23 g |
Intravenous Insulin Protocol
The HDTF initially reviewed 15 evidence‐based protocols and identified 5 desirable protocol characteristics. These characteristics included easy physician ordering (requiring only a signature), ability to quickly reach and maintain a BG target range, minimal risk for hypoglycemic events, adaptability for use anywhere in the hospital setting, and acceptance and implementation by nursing staff.16
The IV protocol, a web‐based calculator (Figure 1), was developed based on the concept of the multiplier by White et al.17 For this protocol, the IV infusion (IVI) rate is changed based on a formula that uses a multiplier (a surrogate for insulin sensitivity factor) and the difference between measured BG and target blood glucose (TBG). The calculator uses the following mathematical formula: rate of insulin infusion/hour = (current BG 60 mg/dL) 0.03.18, 19 Additionally, the protocol requires that enough insulin be infused to address severe hyperglycemia at initiation with a rapid reduction in the insulin infusion rate as BG normalizes. The protocol also permits an adjustment of the insulin rate by tenths of a unit per hour to maintain the BG in the center of the target range. The main variant of this protocol is the value of the starting multiplier. The web‐based calculator is currently being used in all 6 adult ICUs and on all of the adult medical‐surgical floors at MUSC.
In early 2006, all adult ICUs were using our in‐house, web‐based intravenous insulin infusion calculator (IVIIC), which prompted more BG readings with intensification of insulin drip use.19 Specifically, initial monitoring for the IVIIC included BG readings every 24 hours. To avoid hypoglycemic events from occurring with the intensification of BG readings for the IVIIC, the BG monitoring frequency was increased to every hour in July 2006. Initial treatment for hypoglycemia was D50% (12.525 g), which tended to overcorrect BG. In July 2006, we revised the protocol using aliquots of D50% specific to the BG reading.19 This action has resulted in decreasing the glycemic excursions observed due to overcorrection of hypoglycemia.
BG target ranges to match the level of care are as follows: intensive care unit (80110 mg/dL); labor and delivery (70110 mg/dL); adult medical/surgical floors (80140 mg/dL); diabetic ketoacidosis (DKA)/hyperosmolar nonketotic coma (HHNK) (150200 mg/dL); neurosurgery ICU (90120 mg/dL); and perioperative patients (140180 mg/dL).20 These BG targets were created to satisfy the clinical requests of specific departments at MUSC. We have restricted starting the multiplier for DKA/HHNK at 0.01, to affect a slower rate of change and the multiplier for all others is set at 0.03.
Transition From Intravenous to Subcutaneous Insulin
At MUSC, IV insulin therapy reverts to an SC insulin therapy protocol when the patient resumes PO feedings, discontinues pressor support, or stops volume resuscitation21 (see Supporting Figure 3 for the IV to SC insulin transition form). While preparing to stop IV insulin, SC insulinparticularly basal insulinshould begin at least 23 hours prior to discontinuing IV insulin. A short‐acting or rapid‐acting insulin may be given 12 hours SC prior to stopping IV insulin. This is particularly true for patients who are at risk for ketoacidosis, such as patients with type 1 diabetes.21 Recommendations for scheduled insulin administration include basal and prandial and correction doses of insulin to cover glycemic excursions. A minority of patients with stress hyperglycemia will not require conversion to SC insulin when discontinuing IV insulin therapy; however, BG monitoring and administration of correction insulin is recommended.
Data Collection
A retrospective chart review was approved by the MUSC Institutional Review Board, and the requirement of patient consent was waived. A database query against the hospital's electronic medical record was used to supply the data for this study. In particular, a complete listing of all finger‐stick BG measurements taken during June 2004 (preimplementation), June 2005 (implementation), and June 2006 and 2007 (postimplementation) was used. The sample included all inpatient stays for patients who had a documented history of diabetes or at least 1 BG reading in excess of 180 during the inpatient stay. Finger‐stick BG measurements taken within 50 minutes of another reading were excluded from the analysis to account for the increased testing frequency that occurs, per protocol, after detection of a hypoglycemic or hyperglycemic event. Finger‐stick BG levels were measured by the Abbott Precision PCX and downloaded directly into the university's electronic medical record.
Statistical Analysis and Considerations
Sample size estimation
A preliminary study of hypoglycemic rates in 2004 and 2005 was used to plan this analysis.22 In this preliminary study, 295 of 13,366 BG readings were mildly hypoglycemic before the glycemic protocol, yielding an estimated rate of 22.1 per 1,000 measurements. During the glycemic protocol implementation period (June 2005), an estimated rate per 1,000 measurements of 18.9 (289/15,324) was obtained. Using the binomial approximation to the Poisson, it was estimated that 30,499 additional BG measurements were needed to detect, with 80% power and a type I error rate of 0.05 (two‐sided), a rate ratio as small as 1.17 (22.1 per 1,000/18.9 per 1,000). Based on the number of BG measurements obtained in the preliminary study (14,000/month), two additional months of postintervention data were deemed necessary. Data from June 2006 and June 2007 were used to test the maintenance effects of the implemented glycemic management protocol.
Primary analysis
Mild, moderate, and severe hypoglycemia were defined as BG readings 5069 mg/dL, 4049 mg/dL, and <40 mg/dL, respectively.23 BG readings 250 mg/dL or higher were considered hyperglycemic. These events were summarized by the methods suggested for an inpatient setting.7 The first method treated each BG as an independent observation (i.e., ward‐level analysis for which the denominator was the total number of BG readings). This analysis represents a census, so statistical comparisons are not warranted (i.e., the population parameters are obtained), but the generalizability of the findings is limited accordingly. For the formal analysis of the prevalence of glycemic events by year, the patient‐day analysis was used. For this analysis, data were aggregated by each unique patient‐day. For each patient‐day, descriptive statistics were tabulated on the raw BG readings. For the determination of patient‐day occurrence of hypoglycemic events, the three hypoglycemic severities (mild, moderate, and severe) were treated as ordinal variables such that if a patient had a severe hypoglycemic episode on a given day, he was considered to have also had moderate and mild hypoglycemia for that day. This strategy was undertaken based on the belief that if a person had a worse outcome, then the less severe outcome also occurred during the same patient day.
The primary hypothesis was that the nurse‐driven hypoglycemia protocol implemented by 2005 would result in tighter BG control (lower rates of hyperglycemia and hypoglycemia) after implementation. To test this hypothesis, the patient‐day summary of BG readings was used to estimate the odds of an event for each year. The odds of developing mild (BG 5069 mg/dL), moderate (BG 4049 mg/dL), and severe (BG < 40 mg/dL) hypoglycemic events were compared using generalized estimating equations for correlated binary data.24 This analysis accounted for the clustering of observations (patient‐day summaries) within patient stay by modeling the correlation of outcomes within a patient stay. In addition to hypoglycemia, the proportion of patient days with a mean BG between 70180 mg/dL and the proportion of patients experiencing hyperglycemia (BG 250 mg/dL) was examined, and these results were analyzed using the same methodology used for the hypoglycemia endpoints. All analyses were conducted using SAS version 9.1.3 using the procedure GENMOD, a generalized linear modeling procedure in SAS/STAT.
Results
The baseline demographic characteristics of the four study groups are shown in Table 3. The four groups were found to be similar for gender distribution, mean age, and racial distribution. There were significant differences observed among hospital stay characteristics, insulin drip use, history of diabetes, ventilator support, kidney failure, dialysis, total parenteral nutrition (TPN), and red blood cell (RBC) transfusions. Overall, insulin drip use tended to increase over time. The percentage of patients with diabetes on admission or diagnosed during admission tended to decrease over time. This was likely due to an increase in the diagnosis and treatment of stress/steroid‐induced hyperglycemia during the hospital stay.
| Variable | All Years Combined (n = 2102)* | 2004 (n = 434) | 2005 (n = 486) | 2006 (n = 609) | 2007 (n = 573) | P value |
|---|---|---|---|---|---|---|
| ||||||
| Sex, male n (%) | 959 (45.6) | 186 (42.9) | 214 (44.0) | 292 (48.0) | 267 (46.6) | 0.34 |
| Age (years), mean (SD) | 56.8 | 57.6 (14.8) | 58.0 (15.8) | 56.7 (16.1) | 55.4 (16.4) | 0.092 |
| Race | ||||||
| Caucasian | 1000 (47.6%) | 202 (46.5%) | 217 (44.7%) | 300 (49.3%) | 281 (49.0%) | 0.64 |
| African American | 1059 (50.4%) | 226 (52.1%) | 255 (52.5%) | 299 (49.1%) | 279 (48.7%) | |
| Hispanic | 26 (1.2%) | 4 (0.9%) | 8 (1.6%) | 5 (0.8%) | 9 (1.6%) | |
| Other | 17 (0.8%) | 2 (0.5%) | 6 (1.2%) | 5 (0.8%) | 4 (0.7%) | |
| Hospital stay characteristics n (%) | ||||||
| Floor only | 1630 (77.6%) | 355 (81.8)% | 389 (80.0%) | 430 (70.6%) | 456 (79.6%) | <0.001 |
| ICU only | 57 (2.7%) | 8 (1.8%) | 6 (1.2%) | 27 (4.4%) | 16 (2.8%) | |
| Floor and ICU | 415 (19.7%) | 71 (16.4%) | 91 (18.7%) | 152 (25.0%) | 101 (17.6%) | |
| Clinical characteristics n (%) | ||||||
| Insulin drip, floor and ICU | 306 (14.6%) | 38 (8.8%) | 52 (10.7%) | 106 (17.4%) | 110 (19.2%) | <0.001 |
| Insulin drip, floor patients only | 70 (4.3%) | 4 (1.1%) | 9 (2.3%) | 22 (5.1%) | 35 (7.7%) | <0.001 |
| History of diabetes | 1677 (79.8%) | 392 (90.3%) | 431 (88.7%) | 442 (72.6%) | 412 (71.9%) | <0.001 |
| Ventilator support | 319 (15.2%) | 44 (10.1%) | 64 (13.2%) | 135 (22.2%) | 76 (13.3%) | <0.001 |
| Kidney failure | 250 (11.9%) | 41 (9.5%) | 52 (10.7%) | 95 (15.6%) | 62 (10.8%) | 0.008 |
| Dialysis | 94 (4.5%) | 21 (4.8%) | 18 (3.7%) | 38 (6.2%) | 17 (3.0%) | 0.040 |
| Total parenteral nutrition | 128 (6.1%) | 27 (6.2%) | 18 (3.7%) | 55 (9.0%) | 28 (4.9%) | 0.001 |
| Red blood cell transfusions | 507 (24.1%) | 96 (22.1%) | 107 (22.0%) | 178 (29.2%) | 126 (22.0%) | 0.007 |
A total of 11,715 patient‐days, consisting of 56,401 individual BG readings obtained from 2,215 unique patients, were distributed across the 4 years. Table 4 presents the year‐specific patient‐day analysis. While the prevalence of mild (BG 5069 mg/dL) hypoglycemia was found to increase over the years studied (P < 0.01), the percentage of patient‐days with a mean BG in the range of 70180 mg/dL increased over the period of study (P < 0.01). The total hypoglycemia events <60 mg/dL are presented as comparative data to other studies.7 The percent of patient days with at least one BG < 70 mg/dL (reported in Table 4 as mild events) ranged from 3.72 in 2005 to as high as 10.71 in 2007; however, approximately one‐half of the hypoglycemic events are attributable to readings from BG 6069 since the proportion of patient days with a BG < 60 mg/dL was approximately one‐half that for BG < 70 mg/dL (Table 4). The prevalence of patient days with at least one moderate (BG 4049 mg/dL) or severe (BG < 40 mg/dL) hypoglycemia event was not found to increase in a linear manner. There was a statistical trend for potentially nonlinear relationship of year with moderate hypoglycemia and hyperglycemia.
| Year (number of patient days) | Tests of significance* | |||||
|---|---|---|---|---|---|---|
| Measure | 2004 (n = 2176) | 2005 (n = 2259) | 2006 (n = 3525) | 2007 (n = 3755) | Linear trend | Type 3 test |
| ||||||
| BG mean (SD) (mg/dL) | 156 (82) | 152 (72) | 154 (51) | 149 (51) | 0.85 | 0.23 |
| BG median [IQR] (mg/dL) | 136 [105, 186] | 136 [105, 181] | 144 [120, 177] | 137 [114, 169] | N/A | N/A |
| BG readings per patient‐day [mean (SD)] | 3.9 (2.4) | 4.2 (2.9) | 4.9 (3.4) | 5.7 (4.6) | N/A | N/A |
| % Patient‐days with mean BG in range (70‐180 mg/dL) | 69.53 | 72.82 | 76.68 | 79.79 | <0.01 | <0.01 |
| % BGs <60 mg/dL | 3.31 | 1.90 | 5.36 | 5.27 | <0.01 | <0.01 |
| % Mild hypoglycemia (50‐69 mg/dL) | 6.20 | 3.72 | 10.24 | 10.71 | <0.01 | <0.01 |
| % Moderate hypoglycemia (40‐49 mg/dL) | 1.88 | 0.84 | 2.75 | 2.08 | 0.15 | <0.01 |
| % Severe hypoglycemia (<40 mg/dL) | 0.69 | 0.44 | 0.96 | 0.75 | 0.49 | 0.37 |
| % Hyperglycemia (250 mg/dL) | 14.71 | 11.73 | 16.85 | 15.15 | 0.23 | 0.02 |
Immediately following the implementation (year 2005), post hoc comparisons suggested that the rate of moderate hypoglycemia was lowest relative to the 3 other years, but no other statistical differences were observed. The year 2005 also had the lowest proportion of patient days with at least 1 hyperglycemic event.
The individual BG readings for the 2215 unique patients were also individually analyzed according to the methods of Goldberg et al.7 Even though no statistical tests were performed at the ward level, the descriptive data presented in Table 5 are consistent with the analysis of the patient‐day data. Several important features of the data are illustrated by Table 5. Most notably, the glycemic control at the hospital level is improved. The percentage of BG readings in the range of 70180 mg/dL increased annually whereas the mean BG values, the coefficient of variation, and the interquartile range (IQR) decreased annually.
| Year (number of blood glucose readings) | ||||
|---|---|---|---|---|
| 2004 (n = 8,504) | 2005 (n = 9,396) | 2006 (n = 17,098) | 2007 (n = 21,403) | |
| ||||
| Number of patients | 434 | 486 | 612 | 683 |
| BG mean (SD) (mg/dL) | 156 (85) | 154 (81) | 149 (61) | 138 (57) |
| Coefficient of variation | 0.55 | 0.53 | 0.41 | 0.41 |
| Median BG [IQR] (mg/dL) | 135 [101‐186] | 134 [103‐183] | 136 [108‐176] | 124 [101‐160] |
| % BGs in range (70‐180 mg/dL) | 68.09 | 71.80 | 73.71 | 80.41 |
| % Mild hypoglycemia (50‐69 mg/dL) | 3.35 | 2.01 | 2.57 | 2.30 |
| % Moderate hypoglycemia (40‐49 mg/dL) | 0.95 | 0.29 | 0.47 | 0.26 |
| % Severe hypoglycemia (<40 mg/dL) | 0.67 | 0.36 | 0.24 | 0.15 |
| % Hyperglycemia (250 mg/dL) | 10.23 | 9.08 | 6.43 | 4.83 |
Conclusions
Collectively, we have shown that implementing standardized insulin order sets including hypoglycemia, SC insulin, IV insulin, and IV to SC insulin transition treatment protocols at MUSC may generate the expected benefits for patient safety for this population of patients. The primary hypothesis that the rate of hypoglycemia and hyperglycemia would be lower after the implementation of these protocols was supported by the data, because the overall blood glucose control was markedly improved as a result of the protocols. However, the effect was strongest in 2005 (immediately following the protocol's implementation) and appeared to diminish some with time.
There were several other quality improvement measures initiated at MUSC that likely contributed to the decreasing rates of hypoglycemia and hyperglycemia. For example, comparing June 2004 with June 2007, the number of patients tested increased from 434 to 683. This increase could be attributed, in part, to a trend on medical/surgical services toward an increased focus on glucose monitoring.
When intensive glycemic control programs are implemented, hospitals should have a standardized, nurse‐driven hypoglycemia protocol.11 The success of such a hypoglycemia treatment protocol is demonstrated by the improvement observed at MUSC since the protocol was first implemented in October 2004.22
There are limitations that warrant consideration. A key limitation is that other procedural changes may have occurred during the years of study. Because the initial focus of the HDTF was to reduce hypoglycemic and hyperglycemic events, a multipronged approach was used, beginning with the treatment protocol but followed by other changes. These changes, while unmeasured in the current study, could have influenced the rate of hypoglycemia and hyperglycemia. Therefore, although the protocol that we developed has sound theoretical underpinnings, the improvement in glycemic control at other hospitals may vary. Second, because this was initially regarded as a quality improvement project for hospitalized patients with hypoglycemia and hyperglycemia, we did not evaluate morbidity, mortality, or other clinical outcome data other than BG targets and incidences of hypoglycemia and hyperglycemia. Third, there was no concurrent control group established for this study, rather the study used a retrospective, nonrandomized design with a historical control. As previously mentioned, we cannot rule out the idea that other changes occurred between the preprotocol and postprotocol interval to influence our results. Finally, there are statistical limitations to the research.
One limitation regarding the analysis of the BG data was the potential for an increased type I error (ie, false‐positive result) due to clustering of BG values within a patient and increased monitoring frequencies when a hypoglycemic or hyperglycemic event was observed. The generalized estimating equations directly addressed the first concern. In particular, the effective sample size for each participant was a function of the number of patient‐days and the correlation of patient‐day summaries. Therefore, patients with several highly‐correlated outcomes would contribute less to the analysis than other patients with the same number of patient‐days that were correlated to a lesser extent. As for the second concern, the patient‐day frequencies alleviate this problem and avoid the length‐of‐stay bias associated with a patient‐level (or patient‐stay) analysis. Power was less than planned due in part to the use of the patient‐day analysis instead of the originally designed ward‐level analysis. The change in the statistical design was a response to emerging evidence in the literature.7
In conclusion, the hypothesis that MUSC patients benefit from the use of standardized insulin order sets, hypoglycemia, and hyperglycemia treatment protocols, is supported by the data collected in this study. Because it has been recommended that a hypoglycemia and hyperglycemia prevention protocol as well as a hypoglycemia and hyperglycemia treatment protocol be in place, the HDTF will be focusing on the actual prevention of the hypoglycemic and hyperglycemic incidents occurring in the first place.2, 25 This may result in further reductions of hypoglycemic and hyperglycemic events. We have recently implemented hypoglycemia and hyperglycemia prevention policies at MUSC.
- Ace ADA Task Force on Inpatient Diabetes.American College of Endocrinology and American Diabetes Association Consensus Statement on Inpatient Diabetes and Glycemic Control.Endocr Pract.2006;12(4):458–468.
- ADA Writing Group.Standards of Medical Care in Diabetes—2008.Diabetes Care.2008;31(suppl 1):S12–S54.
- ,,, et al.Management of diabetes and hyperglycemia in hospitals.Diabetes Care.2004;27(2):553–591.
- ,,, et al.American College of Endocrinology Position Statement on Inpatient Diabetes and Metabolic Control.Endocr Pract.2004;10(suppl 2):4–9.
- ,,, et al.Intensive insulin therapy in the critically ill patients.N Engl J Med.2001;345:1359–1367.
- ,,, et al.Intensive insulin therapy in the medical ICU.N Engl J Med.2006;354(5):449–461.
- ,,, et al.“Glucometrics”: assessing the quality of inpatient glucose management.Diabetes Technol Ther.2006;8(5):560–569.
- .Society of Hospital Medicine Glycemic Control Task Force, Track Performance; Introducing Glucometrics. SHM;2007.
- ,,,.New insulin infusion protocol improves blood glucose control in hospitalized patients without increasing hypoglycemia.Jt Comm J Qual Patient Saf.2005;31(3):141–147.
- ,.The new insulin analogs: using a team approach to implement basal‐bolus insulin therapy.Pract Diabetol.2004; June:28–37.
- ,,.Practical Management of Inpatient Hyperglycemia.Lakeville, CT:Hilliard Publishing, LLC;2005.
- ,,.Hypoglycemia in hospitalized patients. causes and outcomes.N Engl J Med.1986;315(20):1245–1250.
- .Acute hypoglycemia: keeping the bottom from falling out.Nursing.1995;25(2):41–48; quiz 50.
- ,.Myths and facts about diabetic hypoglycemia.Nursing.1994;24(6):67.
- ,.Subcutaneous insulin therapy in the hospital setting: issues, concerns, and implementation.Endocr Pract.2004;10(suppl 2):81–88.
- ,,.Glucommander: a computer‐directed intravenous insulin system shown to be safe, simple, and effective in 120,618 h of operation.Diabetes Care.2005;28(10):2418–2423.
- ,,.Practical closed‐loop insulin delivery. a system for the maintenance of overnight euglycemia and the calculation of basal insulin requirements in insulin‐dependent diabetics.Ann Intern Med.1982;97:210–213.
- .Strategies for controlling glucose in the intensive care unit.Clin Pulmon Med.2006;13(6):332–347.
- ,,, et al.Outcomes of a cardiothoracic intensive care web‐based online intravenous insulin infusion calculator study at a medical university hospital.Diabetes Technol Ther.2007;9(6):523–534.
- ,,,.Outcomes of a nursing in‐service to evaluate acceptance of a web‐based insulin infusion calculator.J Diabetes Sci Technol.2008;2(3):376–383.
- ,,,.Intravenous insulin infusion therapy: indications, methods, and transition to subcutaneous insulin therapy.Endocr Pract.2004;10(suppl 2):71–80.
- ,,, et al.Outcomes of a hypoglycemia treatment protocol in a medical university hospital [Abstract].Diabetes.2006;55:203OR.
- ,,,,.Evolution of a diabetes inpatient safety committee.Endocr Pract.2006;12(suppl 3):91–99.
- ,.Longitudinal data analysis for discrete and continuous outcomes.Biometrics.1986;42(1):121–130.
- ,,, et al.Hospital hypoglycemia: not only treatment but also prevention.Endocr Pract.2004;10(suppl 2):89–99.
Copyright © 2009 Society of Hospital Medicine


Case of Sudden Desaturation and Cyanosis
A 38‐year‐old Hispanic man was admitted to the telemetry floor with diagnosis of pericarditis. Blood cultures revealed methicillin‐sensitive Staphylococcus aureus and the patient was started on nafcillin. Despite appropriate antibiotic therapy, the patient remained febrile. Transesophageal echocardiogram (TEE) was performed to evaluate for endocarditis. An hour after the TEE, patient started to desaturate and complained of shortness of breath. At this point, the patient was afebrile, with a pulse rate of 110 beats/minute and blood pressure of 97/63 mm Hg. Oxygen saturation by pulse oximetry of 82% on room air progressively declined even with administration of supplemental oxygen to 77%, necessitating intubation. Despite mechanical ventilation with 100% oxygen delivery, the patient remained cyanotic, with pulse oximetry reading of 69%, and with the arterial blood obtained from the patient at this time for laboratory analysis appearing brown in color.
Based on the temporal correlation of benzocaine spray used during TEE and the symptomscyanosis, hypoxia despite 100% fraction of inspired oxygen (FiO2), and chocolate‐brown arterial blooda diagnosis of methemoglobinemia was made. The patient's methemoglobin level was reported at 41% (normal range, 0‐3%). The patient received methylene blue, recovered rapidly, and was extubated the next day. Subsequent methemoglobin level obtained less than 24 hours later was reduced to 0.8%. Two days later the patient was discharged to home.
Discussion
Methemoglobin is the state in which ferrous (Fe2+) ions of heme are oxidized to the ferric state (Fe3+). Because red blood cells are continuously exposed to various oxidative stresses, a methemoglobinemia level of approximately 1% is present in normal individuals at baseline. This low level is maintained through reduction by enzyme systems within the erythrocyte. The most important is the reduced nicotinamide adenine dinucleotide (NADH)‐cytochrome‐b5 reductase system.1 Others, functioning mainly as reserve systems, are ascorbic acid, reduced glutathione, and reduced nicotinamide adenine dinucleotide phosphate (NADPH)‐methemoglobin reductase. The latter requires a natural cofactor or an autooxidizable dye such as methylene blue for activity.
Methemoglobinemia can be congenital or acquired. Congenital methemoglobinemia is very rare and is due to a cytochrome‐b5 reductase deficiency or presence of an abnormal hemoglobin M molecule.2 Acquired methemoglobinemia, the more common type, results from exposure to chemicals that cause more rapid accumulation of methemoglobin than the rate at which methemoglobin can be reduced. Many chemical and environmental agents can cause acquired methemoglobinemia (Table 1). Local anesthetics are the most common hospital‐based pharmacologic agents to cause methemoglobinemia. Prilocaine has been implicated most frequently, especially in newborns. Prilocaine‐induced methemoglobinemia is dose‐dependent and occurs when doses used exceed 600 mg in a 24‐hour period. Lidocaine is a rare cause of methemoglobinemia, but comorbidities like renal failure and use of other local anesthetics like benzocaine will increase the chances of methemoglobinemia. Benzocaine has been reported to cause methemoglobinemia after its use as a lubricant on endotracheal, bronchoscopic, and nasogastric or orogastric tubes, but more commonly after its use as a spray. Benzocaine is lipophilic and may continue to enter the bloodstream from adipose tissue after methylene blue concentrations are no longer therapeutic.
| Name | Key Features |
|---|---|
| Industrial agents | |
| Naphthalene | Coal tar, mothballs. Newborns are at increased risk for methemoglobinemia |
| Inorganic nitrates/nitrites | Meat preservatives; vegetablescarrot juice, spinach. Nitrates are converted to nitrite by the bacteria in the gut. Most commonly acquired from ground water contaminated with pesticides and fertilizers |
| Aniline/aminophenols | Laundry ink. Aniline‐induced methemoglobinemia is less responsive to methylene blue |
| Chlorates | Matches, explosives, pyrotechnics, weed killers. Also cause intravascular hemolysis and toxic nephritis |
| Pharmaceutical agents | |
| Local anesthetics: benzocaine, lidocaine, prilocaine | Benzocaine: It is lipophilic and may continue to enter the blood stream from adipose tissue even after methylene blue concentrations are no longer therapeutic. |
| Lidocaine: Very rarely causes methemoglobinemia alone. Comorbidities like renal failure and use of other local anesthetics will increase the chances of methemoglobinemia. Prilocaine: Dose‐dependent. Occurs when doses used exceed 600 mg. Newborns are at higher risk | |
| Primaquine | Primaquine‐induced methemoglobinemia, although almost universal with clinical doses, seems to be mild, self‐limited, and tolerated without symptoms or signs of cyanosis in otherwise healthy people |
| Dapsone | Can cause methemoglobinemia both in acute intoxication as well as chronic use. May precipitate acute hemolytic anemia. Metabolites that cause methemoglobinemia may last in the circulation for about 35 days |
| Phenacetin | Phenacetin is generally metabolized to acetaminophen. In patients unable to metabolize phenacetin to acetaminophen, alternate metabolites are produced that cause methemoglobinemia |
| Sulfonamides | Does not respond well to methylene blue. Alternative therapies include ascorbic acid, riboflavin, or exchange transfusion |
| Nitrites (amyl and butyl) | Amyl nitrite: Used in treating angina. Butyl nitrite: Used in room deodorizers. Both drugs are used for their alleged sexual enhancing properties |
| Nitroprusside | Methemoglobinemia occurs in patients who have received a dose larger than 10 mg/kg in 1 day. It takes 16 hours of continuous infusion at the maximum rate of 10 g/kg/minute to reach the total accumulated dose |
| Phenazopyridine | Increased incidence of methemoglobinemia in patients with renal failure. Drug also causes hemolytic anemia and turns the urine orange‐yellow in color. One of its metabolites is aniline |
| Metoclopromide | Overdose in infants causes methemoglobinemia |
| Trimethoprim | Methemoglobinemia usually occurs after prolonged periods of administration. Caution when used with dapsone |
Clinical presentation varies based on methemoglobin levels. Early symptoms of methemoglobinemia, when the blood contains 15% to 50% methemoglobin, include nonspecific headache, fatigues, dyspnea, and lethargy. As the amount of methemoglobin in the blood exceeds 50%, the patients develop more serious neurological symptoms, ranging from confusion to seizures, respiratory depression, and death (Table 2). Clinical interpretation of methemoglobin levels must take into account the total hemoglobin value because anemic patients will have proportionately less functional hemoglobin.3 Methemoglobinemia that develops rapidly will be clinically more severe than a similar degree that develops gradually. The acute accumulation of <30% methemoglobinemia is usually well tolerated in the nonanemic patient.
| Level of methemoglobinemia | Symptoms |
|---|---|
| 0‐15% | No signs or symptoms |
| 15‐20% | Cyanosis and chocolate brown blood |
| 20‐50% | Headache, fatigues, dyspnea, and lethargy |
| >50% | Serious neurological symptoms ranging from confusion to seizures; respiratory depression and death |
The suspicion for methemoglobinemia should be raised in the presence of dark or chocolate‐brown arterial blood that does not become red with exposure to air.4 Dark‐colored blood from patients with hypoxia should redden with exposure to air; blood darkened by methemoglobin does not. The suspicion for methemoglobinemia should also be raised in the presence of a saturation gap, when the measured oxygen saturation of blood by pulse oximetry is less than the oxygen saturation calculated by routine blood gas analysis by more than 5%.5 The oxygen saturation on arterial blood gas is calculated from partial pressure of arterial oxygen (PaO2) and pH. Since PaO2 is within normal limits in methemoglobinemia, it leads to a normal, though inaccurate, calculated oxygen saturation. Multiple‐wavelength cooximetry is the accepted standard for confirming and quantifying methemoglobinemia.6 This assay involves measuring methemoglobin at its peak absorbance of 630 nm and requires the addition of cyanide to convert methemoglobin to cyanomethemoglobin, which absorbs at shorter wavelengths, resulting in an absorbance decrease at 630 nm due to the disappearance of methemoglobin. Hyperlipidemia and intravenous administration of methylene blue or other dyes may interfere with cooximetry measurements.
In asymptomatic patients with acute methemoglobinemia, discontinuation of the offending drug and proper monitoring is sufficient. In patients who are symptomatic, in addition to supplemental oxygen, methylene blue should be used to enhance the reducing capacity of erythrocytes. Methylene blue, given intravenously in a dose of 1 mg/kg over 5 minutes, acts as an electron acceptor, enhances the NADPH pathway, and rapidly reduces methemoglobin to hemoglobin.7 However, methylene blue should not be used in patients with glucose‐6‐phosphate dehydrogenase deficiency as it can cause life‐threatening hemolysis. In these patients, ascorbic acid should be used. Hyperbaric oxygen or exchange transfusion can also be used. In patients who are in shock secondary to the methemoglobinemia, blood transfusion or exchange transfusion is helpful.
Summary
Agents that inflict large oxidative stress, such as topical anesthetics, can cause methemoglobinemia. A frequently‐used topical anesthetic agent like benzocaine is a common cause of methemoglobinemia. The most characteristic findings of methemoglobinemia are blue‐gray or brown‐gray cyanosis of the skin, lips, and nail beds, dark brown color of the blood, and saturation gap. Symptomatic patients should be given methylene blue intravenously.
- .Methemoglobin—it's not just blue: a concise review.Am J Hematol.2007;82(2):134–144.
- ,,.Cyanosis.J Emerg Med.2000;18(3):369–371.
- ,,,.Benzocaine‐induced methemoglobinemia based on the Mayo Clinic experience from 28,478 transesophageal echocardiograms: incidence, outcomes, and predisposing factors.Arch Intern Med.2007;167(18):1977–1982.
- ,,.Methemoglobinemia: etiology, pharmacology, and clinical management.Ann Emerg Med.1999;34(5):646–656.
- ,,.Mind the gap.J Emerg Med.2007;33(2):131–132.
- ,.A 74‐year‐old woman with desaturation following surgery. Co‐oximetry is the first step in making the diagnosis of dyshemoglobinemia.Chest.2003;123(2):613–616.
- ,.Methylene blue.Am J Ther.2003;10(4):289–291.
A 38‐year‐old Hispanic man was admitted to the telemetry floor with diagnosis of pericarditis. Blood cultures revealed methicillin‐sensitive Staphylococcus aureus and the patient was started on nafcillin. Despite appropriate antibiotic therapy, the patient remained febrile. Transesophageal echocardiogram (TEE) was performed to evaluate for endocarditis. An hour after the TEE, patient started to desaturate and complained of shortness of breath. At this point, the patient was afebrile, with a pulse rate of 110 beats/minute and blood pressure of 97/63 mm Hg. Oxygen saturation by pulse oximetry of 82% on room air progressively declined even with administration of supplemental oxygen to 77%, necessitating intubation. Despite mechanical ventilation with 100% oxygen delivery, the patient remained cyanotic, with pulse oximetry reading of 69%, and with the arterial blood obtained from the patient at this time for laboratory analysis appearing brown in color.
Based on the temporal correlation of benzocaine spray used during TEE and the symptomscyanosis, hypoxia despite 100% fraction of inspired oxygen (FiO2), and chocolate‐brown arterial blooda diagnosis of methemoglobinemia was made. The patient's methemoglobin level was reported at 41% (normal range, 0‐3%). The patient received methylene blue, recovered rapidly, and was extubated the next day. Subsequent methemoglobin level obtained less than 24 hours later was reduced to 0.8%. Two days later the patient was discharged to home.
Discussion
Methemoglobin is the state in which ferrous (Fe2+) ions of heme are oxidized to the ferric state (Fe3+). Because red blood cells are continuously exposed to various oxidative stresses, a methemoglobinemia level of approximately 1% is present in normal individuals at baseline. This low level is maintained through reduction by enzyme systems within the erythrocyte. The most important is the reduced nicotinamide adenine dinucleotide (NADH)‐cytochrome‐b5 reductase system.1 Others, functioning mainly as reserve systems, are ascorbic acid, reduced glutathione, and reduced nicotinamide adenine dinucleotide phosphate (NADPH)‐methemoglobin reductase. The latter requires a natural cofactor or an autooxidizable dye such as methylene blue for activity.
Methemoglobinemia can be congenital or acquired. Congenital methemoglobinemia is very rare and is due to a cytochrome‐b5 reductase deficiency or presence of an abnormal hemoglobin M molecule.2 Acquired methemoglobinemia, the more common type, results from exposure to chemicals that cause more rapid accumulation of methemoglobin than the rate at which methemoglobin can be reduced. Many chemical and environmental agents can cause acquired methemoglobinemia (Table 1). Local anesthetics are the most common hospital‐based pharmacologic agents to cause methemoglobinemia. Prilocaine has been implicated most frequently, especially in newborns. Prilocaine‐induced methemoglobinemia is dose‐dependent and occurs when doses used exceed 600 mg in a 24‐hour period. Lidocaine is a rare cause of methemoglobinemia, but comorbidities like renal failure and use of other local anesthetics like benzocaine will increase the chances of methemoglobinemia. Benzocaine has been reported to cause methemoglobinemia after its use as a lubricant on endotracheal, bronchoscopic, and nasogastric or orogastric tubes, but more commonly after its use as a spray. Benzocaine is lipophilic and may continue to enter the bloodstream from adipose tissue after methylene blue concentrations are no longer therapeutic.
| Name | Key Features |
|---|---|
| Industrial agents | |
| Naphthalene | Coal tar, mothballs. Newborns are at increased risk for methemoglobinemia |
| Inorganic nitrates/nitrites | Meat preservatives; vegetablescarrot juice, spinach. Nitrates are converted to nitrite by the bacteria in the gut. Most commonly acquired from ground water contaminated with pesticides and fertilizers |
| Aniline/aminophenols | Laundry ink. Aniline‐induced methemoglobinemia is less responsive to methylene blue |
| Chlorates | Matches, explosives, pyrotechnics, weed killers. Also cause intravascular hemolysis and toxic nephritis |
| Pharmaceutical agents | |
| Local anesthetics: benzocaine, lidocaine, prilocaine | Benzocaine: It is lipophilic and may continue to enter the blood stream from adipose tissue even after methylene blue concentrations are no longer therapeutic. |
| Lidocaine: Very rarely causes methemoglobinemia alone. Comorbidities like renal failure and use of other local anesthetics will increase the chances of methemoglobinemia. Prilocaine: Dose‐dependent. Occurs when doses used exceed 600 mg. Newborns are at higher risk | |
| Primaquine | Primaquine‐induced methemoglobinemia, although almost universal with clinical doses, seems to be mild, self‐limited, and tolerated without symptoms or signs of cyanosis in otherwise healthy people |
| Dapsone | Can cause methemoglobinemia both in acute intoxication as well as chronic use. May precipitate acute hemolytic anemia. Metabolites that cause methemoglobinemia may last in the circulation for about 35 days |
| Phenacetin | Phenacetin is generally metabolized to acetaminophen. In patients unable to metabolize phenacetin to acetaminophen, alternate metabolites are produced that cause methemoglobinemia |
| Sulfonamides | Does not respond well to methylene blue. Alternative therapies include ascorbic acid, riboflavin, or exchange transfusion |
| Nitrites (amyl and butyl) | Amyl nitrite: Used in treating angina. Butyl nitrite: Used in room deodorizers. Both drugs are used for their alleged sexual enhancing properties |
| Nitroprusside | Methemoglobinemia occurs in patients who have received a dose larger than 10 mg/kg in 1 day. It takes 16 hours of continuous infusion at the maximum rate of 10 g/kg/minute to reach the total accumulated dose |
| Phenazopyridine | Increased incidence of methemoglobinemia in patients with renal failure. Drug also causes hemolytic anemia and turns the urine orange‐yellow in color. One of its metabolites is aniline |
| Metoclopromide | Overdose in infants causes methemoglobinemia |
| Trimethoprim | Methemoglobinemia usually occurs after prolonged periods of administration. Caution when used with dapsone |
Clinical presentation varies based on methemoglobin levels. Early symptoms of methemoglobinemia, when the blood contains 15% to 50% methemoglobin, include nonspecific headache, fatigues, dyspnea, and lethargy. As the amount of methemoglobin in the blood exceeds 50%, the patients develop more serious neurological symptoms, ranging from confusion to seizures, respiratory depression, and death (Table 2). Clinical interpretation of methemoglobin levels must take into account the total hemoglobin value because anemic patients will have proportionately less functional hemoglobin.3 Methemoglobinemia that develops rapidly will be clinically more severe than a similar degree that develops gradually. The acute accumulation of <30% methemoglobinemia is usually well tolerated in the nonanemic patient.
| Level of methemoglobinemia | Symptoms |
|---|---|
| 0‐15% | No signs or symptoms |
| 15‐20% | Cyanosis and chocolate brown blood |
| 20‐50% | Headache, fatigues, dyspnea, and lethargy |
| >50% | Serious neurological symptoms ranging from confusion to seizures; respiratory depression and death |
The suspicion for methemoglobinemia should be raised in the presence of dark or chocolate‐brown arterial blood that does not become red with exposure to air.4 Dark‐colored blood from patients with hypoxia should redden with exposure to air; blood darkened by methemoglobin does not. The suspicion for methemoglobinemia should also be raised in the presence of a saturation gap, when the measured oxygen saturation of blood by pulse oximetry is less than the oxygen saturation calculated by routine blood gas analysis by more than 5%.5 The oxygen saturation on arterial blood gas is calculated from partial pressure of arterial oxygen (PaO2) and pH. Since PaO2 is within normal limits in methemoglobinemia, it leads to a normal, though inaccurate, calculated oxygen saturation. Multiple‐wavelength cooximetry is the accepted standard for confirming and quantifying methemoglobinemia.6 This assay involves measuring methemoglobin at its peak absorbance of 630 nm and requires the addition of cyanide to convert methemoglobin to cyanomethemoglobin, which absorbs at shorter wavelengths, resulting in an absorbance decrease at 630 nm due to the disappearance of methemoglobin. Hyperlipidemia and intravenous administration of methylene blue or other dyes may interfere with cooximetry measurements.
In asymptomatic patients with acute methemoglobinemia, discontinuation of the offending drug and proper monitoring is sufficient. In patients who are symptomatic, in addition to supplemental oxygen, methylene blue should be used to enhance the reducing capacity of erythrocytes. Methylene blue, given intravenously in a dose of 1 mg/kg over 5 minutes, acts as an electron acceptor, enhances the NADPH pathway, and rapidly reduces methemoglobin to hemoglobin.7 However, methylene blue should not be used in patients with glucose‐6‐phosphate dehydrogenase deficiency as it can cause life‐threatening hemolysis. In these patients, ascorbic acid should be used. Hyperbaric oxygen or exchange transfusion can also be used. In patients who are in shock secondary to the methemoglobinemia, blood transfusion or exchange transfusion is helpful.
Summary
Agents that inflict large oxidative stress, such as topical anesthetics, can cause methemoglobinemia. A frequently‐used topical anesthetic agent like benzocaine is a common cause of methemoglobinemia. The most characteristic findings of methemoglobinemia are blue‐gray or brown‐gray cyanosis of the skin, lips, and nail beds, dark brown color of the blood, and saturation gap. Symptomatic patients should be given methylene blue intravenously.
- .Methemoglobin—it's not just blue: a concise review.Am J Hematol.2007;82(2):134–144.
- ,,.Cyanosis.J Emerg Med.2000;18(3):369–371.
- ,,,.Benzocaine‐induced methemoglobinemia based on the Mayo Clinic experience from 28,478 transesophageal echocardiograms: incidence, outcomes, and predisposing factors.Arch Intern Med.2007;167(18):1977–1982.
- ,,.Methemoglobinemia: etiology, pharmacology, and clinical management.Ann Emerg Med.1999;34(5):646–656.
- ,,.Mind the gap.J Emerg Med.2007;33(2):131–132.
- ,.A 74‐year‐old woman with desaturation following surgery. Co‐oximetry is the first step in making the diagnosis of dyshemoglobinemia.Chest.2003;123(2):613–616.
- ,.Methylene blue.Am J Ther.2003;10(4):289–291.
Hospitalist Role in PICC Use
Peripherally inserted central catheters (PICCs) are being used with greater frequency than ever before for intravenous access in hospitals, and PICCs may offer advantages in safety over traditional central venous catheters (CVCs). Despite these potential advantages, a large number of CVCs are still being placed. In a recent 1‐day survey of 6 large urban teaching hospitals, 29% of all patients had a CVC in place (59.3% of intensive care unit [ICU] patients and 23.7% of non‐ICU patients).1 Most catheters were inserted in the subclavian (55%) or jugular (22%) veins, with femoral (6%) and peripheral (15%) sites less commonly used. Even in the non‐ICU setting, only 20% of all central catheters were PICCs.
PICCs may offer advantages over centrally‐inserted intravenous catheters, such as the reduced risks of pneumothorax,2 arterial puncture, uncontrolled bleeding of large central veins, central lineassociated bloodstream infections (CLAB),3, 4 and lower cost.5 In addition, central venous pressure monitoring can now be performed with the larger‐bore PICCs.6
The low risk of mechanical complications for PICC insertion has been well documented.7, 8 In contrast, femoral or retroperitoneal hematoma occurs in up to 1.3% of cases following femoral catheter insertion,9 and pneumothorax occurs in 1.5% to 2.3% of subclavian catheter insertions.10 However, there are only limited data to suggest that the risk of PICC‐related bacteremia is lower than that of centrally‐placed catheters.11, 12
The benefit of PICCs over centrally‐placed catheters in terms of venous thromboembolism (VTE) is also not as easy to show, and in fact the rate may be greater in PICCs. The reported incidence of PICC‐related VTE has been between 0.3% and 56.0%, and the wide variation in rates is likely related to the method of diagnosis.1315 It is likely that most patients with PICC‐related VTE are asymptomatic, and that its incidence is underestimated.16
In many hospitals PICCs are placed by a certified nurse, or by an interventional radiologist if the nurse is unsuccessful.17 There are few reports of PICCs being placed by nonradiology physicians. In one report of 894 patients referred to a critical care specialist for PICC insertion, venous access was achieved 100% of the time, there were no referrals to interventional radiology, and there were no incidents of pneumothorax or bleeding.8 In a university‐affiliated community hospital, we carried out a retrospective review of our experience with training hospital physicians to place PICCs.
Methods
In July 2006 our community hospital, which is affiliated with the University of Pittsburgh Medical Center, instituted a hospitalist program. Prior to the hospitalist program, 1 house physician was available to place PICCs in the antecubital vein without the aid of ultrasound, and there was no PICC‐certified nurse in the hospital. An interventional radiologist was available to place PICCs that could not be placed by the house physician. After July 2006 under the hospitalist service, 3 of the 5 physicians were trained to place PICCs in the deep veins of the arm with the use of ultrasound guidance.
Training included 1 day with the PICC training nurse at the tertiary hospital, followed by supervised placements in the community hospital until proficiency was obtained. Proficiency was relative and cumulative. Approximately 3 supervised procedures were necessary before the physician was able to place PICCs by him or herself. All PICCs were placed using 5 barrier precautions, with chlorhexidine cleansing, and with a time‐out prior to the procedure.
Retrospective hospital data for central catheter placement were examined for the 18 months prior to and following the start of the hospitalist program. These data were collected routinely by the hospital infection control nurse for purposes of quality improvement and patient safety. The data included central catheters placed by all physicians in the hospital; however, the vast majority of these were placed by the hospitalists. The catheters were placed throughout the hospital, both on the medical floors, cardiac step‐down unit, and the ICU. Information regarding the number of central catheters placed and the specific type of catheter (subclavian, jugular, femoral, or PICC) was available from July 2005 through December 2007. Also available from January 2005 were the numbers of femoral and nonfemoral catheter days (number of catheters multiplied by number of days in place) and the central catheterassociated bacteremia rates (number per 1000 catheter days) for femoral and nonfemoral catheters. The Centers for Disease Control and Prevention (CDC) definition of central lineassociated bacteremia was used, which is any documented bloodstream infection within 48 hours of the presence of a CVC in the absence of an alternate source of infection. Data for other complications such as pneumothorax and major bleeding were not consistently recorded.
Results
Figure 1 shows the number of internal jugular, subclavian, femoral, PICC, and total catheter placements from July 2005 through December 2007. The data are grouped into 3‐month increments for visual convenience. Comparing the periods before and after the inception of the hospitalist PICC service (Figure 1, dotted vertical line), the rate of PICC placements rose 4‐fold and the rate of total catheter placements approximately doubled. The rates of femoral and subclavian catheter placements decreased by approximately 50% and the rate of internal jugular catheter placement was roughly unchanged.
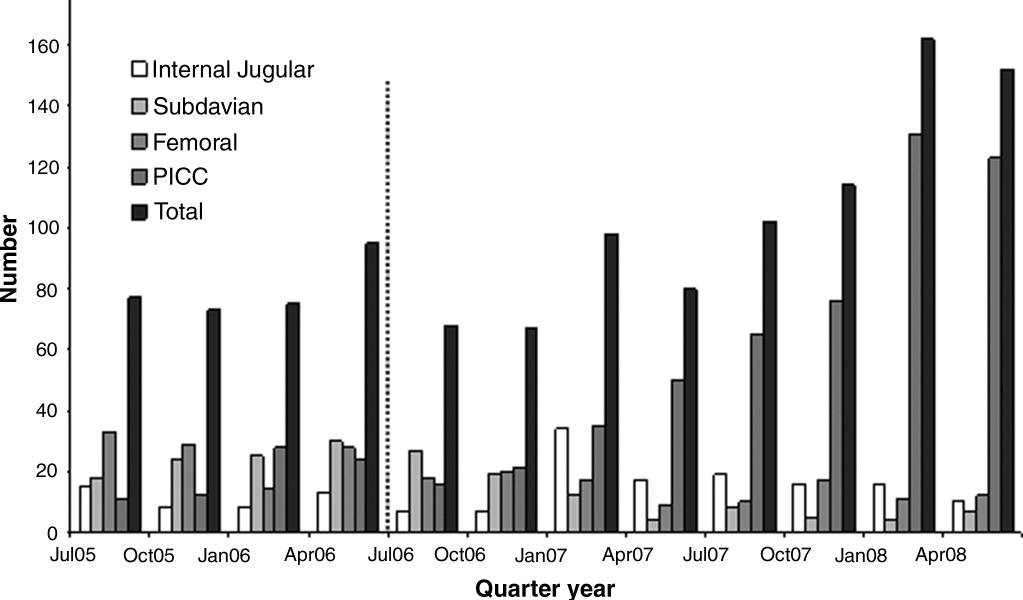
Figure 2 shows the numbers of femoral and nonfemoral catheter days by month for 2005 through 2007. The nonfemoral catheter days began to rise prior to the start of the hospitalist program and continued to rise afterward, showing an approximately 3‐fold increase by the end of the study period. The number of femoral catheters days was highly variable, but seemed to decrease by approximately 50%.
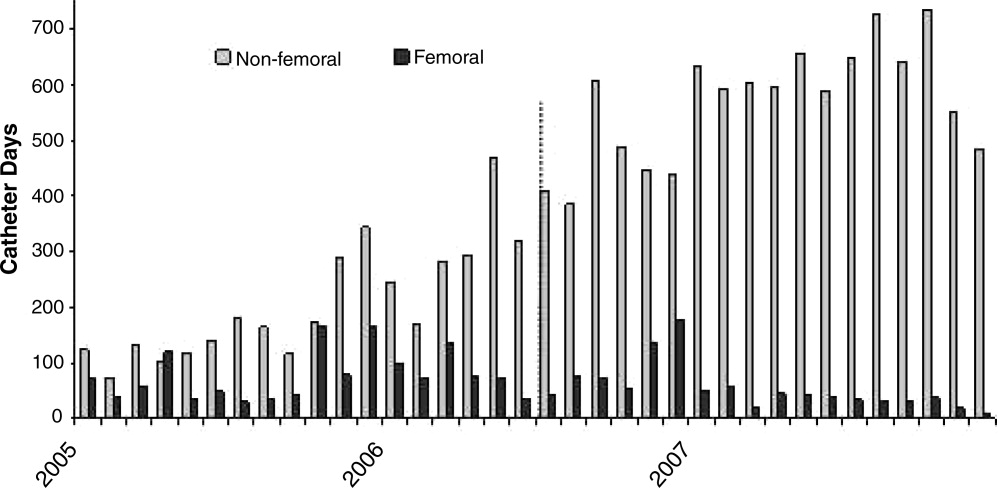
Figure 3 shows the rates of femoral and nonfemoral catheter‐associated bacteremia by month for 2005 through 2007. The absolute number of infections in both periods was low and is shown at the top of each bar in the figure.
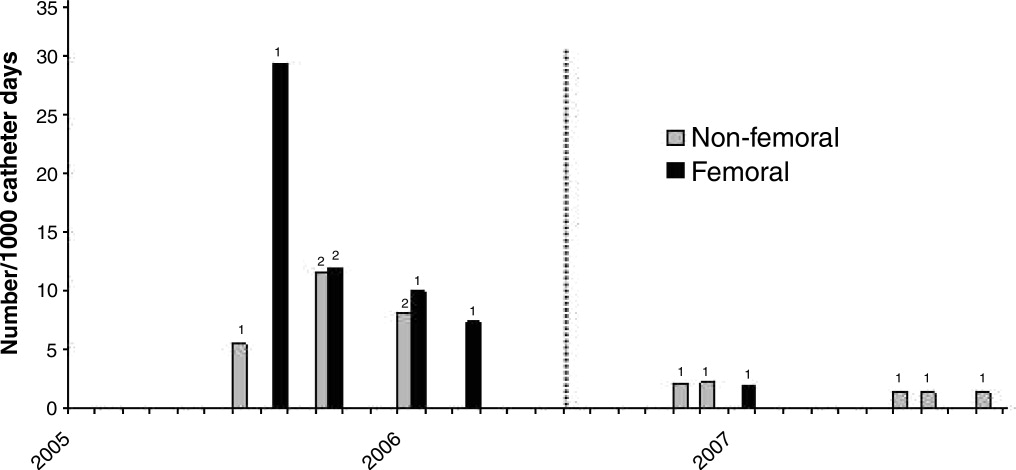
To our knowledge, there were no episodes of pneumothorax or major bleeding with PICC placement. There were 3 inadvertent arterial punctures, each of which was easily controlled with local pressure. There was 1 incident of a coiled guidewire that could not be removed at the bedside and had to be removed in interventional radiology with no significant consequence to the patient.
Discussion
The complications associated with central catheter insertion continue to place the hospitalized patient at risk. PICCs may offer significant advantages over other types of central catheters in terms of decreased rates of mechanical and infectious complications. Despite this, hospital physicians have not traditionally been trained to place PICCs. We have shown in our small, university‐affiliated community hospital that training hospital physicians to place PICCs was associated with a decrease in the placement of centrally‐inserted venous catheters and a reduced rate of femoral catheter days. At the same time, the rate of central catheterrelated bacteremia remained low.
There are many limitations to our study. Since the analysis was retrospective and uncontrolled, it is not possible to attribute the decrease in femoral catheter days and the low infection rates solely to the use of PICCs. There may have been other factors, either related or unrelated to the transition to a hospitalist service, that influenced the results, such as improved hand hygiene, attention to the use of 5 barrier precautions, and the use of chlorhexidine cleansing. Also, since the study was descriptive and outcome measures were either not available or the numbers small, we cannot prove that there was benefit to the patients or that the changes in rates were statistically significant.
Training hospital physicians to place PICCs in our study was associated with a 2‐fold increase in the overall rate of catheter placements. The reason for this increase in the total number of catheter placements is not clear, but it is likely related to the ease of PICC placement and the increasing number of patients with difficult intravenous access. It is unclear if an equivalent number of traditional central catheters would have been placed were the hospitalists not trained in PICC placement. However, this increase in total number of catheters did not appear to result in an increase in catheter‐related bacteremia or in mechanical complications.
We observed no apparent decrease in the insertion rate of internal jugular catheters in our study, despite a decrease in the rates of subclavian and femoral catheter placements. Although the current CDC guideline recommends using the subclavian vein as the preferred site, the UK National Institute for Clinical Excellence (NICE) is now recommending the use of real‐time ultrasound with each placement,18 and we find that this is best done in the internal jugular vein. Also, the rate of placement of femoral catheters remained higher than that of subclavian cathetersmost likely because the femoral vein remained the site of choice for emergently‐placed cathetersas PICC, more so than subclavian, became the preferred site for elective catheters.
Training physicians to place PICCs was not a simple task. In our experience, the availability of trainers at the tertiary care hospital was limited and the distractions of other duties of the hospitalist complicated the learning process. Two of our 5 physicians could not schedule time with the training nurse and were not able to acquire the skill. However, after training, the 3 hospitalists found that there was such a demand for PICCs that with time it was easy to maintain and even refine this skill. Since we only had 3 of 5 hospitalists trained in PICC placement, we could not have a PICC‐trained hospitalist on site 24 hours a day and the remaining 2 physicians had to rely on centrally‐placed catheters for access or have 1 of the trained physicians come to the hospital from home.
In summary, PICCs may be a safe and easy alternative to centrally‐placed catheters for the hospital physician attempting to secure central intravenous access and may lead to a decrease in the need for more risky CVC insertions. More definitive, controlled investigation, with patient outcome data, will be required before this can be advocated as a universal recommendation.
- ,,, et al.Prevalence of the use of central venous access devices within and outside of the intensive care unit: results of a survey among hospitals in the prevention epicenter program of the Centers for Disease Control and Prevention.Infect Control Hosp Epidemiol.2003;24:942–945.
- ,.Peripherally inserted central catheters: development of a hospital‐based program.J Intraven Nurs.1990;13:287–290.
- ,,, et al.Infectious complications among patients receiving home intravenous therapy with peripheral, central, or peripherally placed central venous catheters.Am J Med.1991;91:95S–100S.
- ,,.Peripherally inserted central catheters in patients with AIDS are associated with a low infection rate.Clin Infect Dis.2000;30:949–952.
- ,,,.Peripherally inserted central venous catheters in an acute care hospital.J Intraven Nurs.1990;154:1833–1837.
- ,,.Central venous pressure measurements: peripherally inserted catheters versus centrally inserted catheters.Crit Care Med.2000;28:3833–3836.
- ,,, et al.Survey of the use of peripherally inserted central venous catheters in children.Pediatrics.1997;99:e4.
- .Peripherally inserted central catheter (PICC) is effective in the care of critically ill patients using the basilic and cephalic veins and performed under ultrasound guidance at the patient's bedside by a pulmonary and critical care specialist. [October 23‐28, 2004, Seattle, Washington, USA. Abstracts].Chest.2004;126(4 suppl):705S–1014S.
- ,,, et al.Use of femoral venous catheters in critically ill adults: prospective study.Crit Care Med.1991;19:550–553.
- ,,,,.Complications and failures of subclavian‐vein catheterization.N Engl J Med.1994;331:1735–1738.
- ,.Risk of catheter‐related bloodstream infection with peripherally inserted central venous catheters used in hospitalized patients.Chest.2005;128:489–495.
- ,.The peripherally inserted central catheter (PICC): a prospective study of its natural history after cubital fossa insertion.Anaesth Intensive Care.2002;30:21–24.
- ,,.Venous thrombosis associated with peripherally inserted central catheters: a retrospective analysis of the Cleveland Clinic experience.Clin Infect Dis.2002;34:1179–1183.
- ,,,,.Peripherally inserted central catheters and upper extremity deep vein thrombosis.Australas Radiol.2006;50:451–454.
- ,,, et al.Incidence of upper limb venous thrombosis associated with peripherally inserted central catheters (PICC).Br J Radiol.2005;78:596–600.
- ,,, et al.Upper‐extremity deep vein thrombosis: risk factors, diagnosis, and complications.Arch Intern Med.1997;157:57–62.
- ,,,.Peripherally inserted central catheters: outcome as a function of the operator.J Vasc Interv Radiol.2001;12:723–729.
- ,,, et al.Ultrasonic locating devices for central venous cannulation: meta‐analysis.BMJ.2003;327:361.
Peripherally inserted central catheters (PICCs) are being used with greater frequency than ever before for intravenous access in hospitals, and PICCs may offer advantages in safety over traditional central venous catheters (CVCs). Despite these potential advantages, a large number of CVCs are still being placed. In a recent 1‐day survey of 6 large urban teaching hospitals, 29% of all patients had a CVC in place (59.3% of intensive care unit [ICU] patients and 23.7% of non‐ICU patients).1 Most catheters were inserted in the subclavian (55%) or jugular (22%) veins, with femoral (6%) and peripheral (15%) sites less commonly used. Even in the non‐ICU setting, only 20% of all central catheters were PICCs.
PICCs may offer advantages over centrally‐inserted intravenous catheters, such as the reduced risks of pneumothorax,2 arterial puncture, uncontrolled bleeding of large central veins, central lineassociated bloodstream infections (CLAB),3, 4 and lower cost.5 In addition, central venous pressure monitoring can now be performed with the larger‐bore PICCs.6
The low risk of mechanical complications for PICC insertion has been well documented.7, 8 In contrast, femoral or retroperitoneal hematoma occurs in up to 1.3% of cases following femoral catheter insertion,9 and pneumothorax occurs in 1.5% to 2.3% of subclavian catheter insertions.10 However, there are only limited data to suggest that the risk of PICC‐related bacteremia is lower than that of centrally‐placed catheters.11, 12
The benefit of PICCs over centrally‐placed catheters in terms of venous thromboembolism (VTE) is also not as easy to show, and in fact the rate may be greater in PICCs. The reported incidence of PICC‐related VTE has been between 0.3% and 56.0%, and the wide variation in rates is likely related to the method of diagnosis.1315 It is likely that most patients with PICC‐related VTE are asymptomatic, and that its incidence is underestimated.16
In many hospitals PICCs are placed by a certified nurse, or by an interventional radiologist if the nurse is unsuccessful.17 There are few reports of PICCs being placed by nonradiology physicians. In one report of 894 patients referred to a critical care specialist for PICC insertion, venous access was achieved 100% of the time, there were no referrals to interventional radiology, and there were no incidents of pneumothorax or bleeding.8 In a university‐affiliated community hospital, we carried out a retrospective review of our experience with training hospital physicians to place PICCs.
Methods
In July 2006 our community hospital, which is affiliated with the University of Pittsburgh Medical Center, instituted a hospitalist program. Prior to the hospitalist program, 1 house physician was available to place PICCs in the antecubital vein without the aid of ultrasound, and there was no PICC‐certified nurse in the hospital. An interventional radiologist was available to place PICCs that could not be placed by the house physician. After July 2006 under the hospitalist service, 3 of the 5 physicians were trained to place PICCs in the deep veins of the arm with the use of ultrasound guidance.
Training included 1 day with the PICC training nurse at the tertiary hospital, followed by supervised placements in the community hospital until proficiency was obtained. Proficiency was relative and cumulative. Approximately 3 supervised procedures were necessary before the physician was able to place PICCs by him or herself. All PICCs were placed using 5 barrier precautions, with chlorhexidine cleansing, and with a time‐out prior to the procedure.
Retrospective hospital data for central catheter placement were examined for the 18 months prior to and following the start of the hospitalist program. These data were collected routinely by the hospital infection control nurse for purposes of quality improvement and patient safety. The data included central catheters placed by all physicians in the hospital; however, the vast majority of these were placed by the hospitalists. The catheters were placed throughout the hospital, both on the medical floors, cardiac step‐down unit, and the ICU. Information regarding the number of central catheters placed and the specific type of catheter (subclavian, jugular, femoral, or PICC) was available from July 2005 through December 2007. Also available from January 2005 were the numbers of femoral and nonfemoral catheter days (number of catheters multiplied by number of days in place) and the central catheterassociated bacteremia rates (number per 1000 catheter days) for femoral and nonfemoral catheters. The Centers for Disease Control and Prevention (CDC) definition of central lineassociated bacteremia was used, which is any documented bloodstream infection within 48 hours of the presence of a CVC in the absence of an alternate source of infection. Data for other complications such as pneumothorax and major bleeding were not consistently recorded.
Results
Figure 1 shows the number of internal jugular, subclavian, femoral, PICC, and total catheter placements from July 2005 through December 2007. The data are grouped into 3‐month increments for visual convenience. Comparing the periods before and after the inception of the hospitalist PICC service (Figure 1, dotted vertical line), the rate of PICC placements rose 4‐fold and the rate of total catheter placements approximately doubled. The rates of femoral and subclavian catheter placements decreased by approximately 50% and the rate of internal jugular catheter placement was roughly unchanged.
Figure 2 shows the numbers of femoral and nonfemoral catheter days by month for 2005 through 2007. The nonfemoral catheter days began to rise prior to the start of the hospitalist program and continued to rise afterward, showing an approximately 3‐fold increase by the end of the study period. The number of femoral catheters days was highly variable, but seemed to decrease by approximately 50%.
Figure 3 shows the rates of femoral and nonfemoral catheter‐associated bacteremia by month for 2005 through 2007. The absolute number of infections in both periods was low and is shown at the top of each bar in the figure.
To our knowledge, there were no episodes of pneumothorax or major bleeding with PICC placement. There were 3 inadvertent arterial punctures, each of which was easily controlled with local pressure. There was 1 incident of a coiled guidewire that could not be removed at the bedside and had to be removed in interventional radiology with no significant consequence to the patient.
Discussion
The complications associated with central catheter insertion continue to place the hospitalized patient at risk. PICCs may offer significant advantages over other types of central catheters in terms of decreased rates of mechanical and infectious complications. Despite this, hospital physicians have not traditionally been trained to place PICCs. We have shown in our small, university‐affiliated community hospital that training hospital physicians to place PICCs was associated with a decrease in the placement of centrally‐inserted venous catheters and a reduced rate of femoral catheter days. At the same time, the rate of central catheterrelated bacteremia remained low.
There are many limitations to our study. Since the analysis was retrospective and uncontrolled, it is not possible to attribute the decrease in femoral catheter days and the low infection rates solely to the use of PICCs. There may have been other factors, either related or unrelated to the transition to a hospitalist service, that influenced the results, such as improved hand hygiene, attention to the use of 5 barrier precautions, and the use of chlorhexidine cleansing. Also, since the study was descriptive and outcome measures were either not available or the numbers small, we cannot prove that there was benefit to the patients or that the changes in rates were statistically significant.
Training hospital physicians to place PICCs in our study was associated with a 2‐fold increase in the overall rate of catheter placements. The reason for this increase in the total number of catheter placements is not clear, but it is likely related to the ease of PICC placement and the increasing number of patients with difficult intravenous access. It is unclear if an equivalent number of traditional central catheters would have been placed were the hospitalists not trained in PICC placement. However, this increase in total number of catheters did not appear to result in an increase in catheter‐related bacteremia or in mechanical complications.
We observed no apparent decrease in the insertion rate of internal jugular catheters in our study, despite a decrease in the rates of subclavian and femoral catheter placements. Although the current CDC guideline recommends using the subclavian vein as the preferred site, the UK National Institute for Clinical Excellence (NICE) is now recommending the use of real‐time ultrasound with each placement,18 and we find that this is best done in the internal jugular vein. Also, the rate of placement of femoral catheters remained higher than that of subclavian cathetersmost likely because the femoral vein remained the site of choice for emergently‐placed cathetersas PICC, more so than subclavian, became the preferred site for elective catheters.
Training physicians to place PICCs was not a simple task. In our experience, the availability of trainers at the tertiary care hospital was limited and the distractions of other duties of the hospitalist complicated the learning process. Two of our 5 physicians could not schedule time with the training nurse and were not able to acquire the skill. However, after training, the 3 hospitalists found that there was such a demand for PICCs that with time it was easy to maintain and even refine this skill. Since we only had 3 of 5 hospitalists trained in PICC placement, we could not have a PICC‐trained hospitalist on site 24 hours a day and the remaining 2 physicians had to rely on centrally‐placed catheters for access or have 1 of the trained physicians come to the hospital from home.
In summary, PICCs may be a safe and easy alternative to centrally‐placed catheters for the hospital physician attempting to secure central intravenous access and may lead to a decrease in the need for more risky CVC insertions. More definitive, controlled investigation, with patient outcome data, will be required before this can be advocated as a universal recommendation.
- ,,, et al.Prevalence of the use of central venous access devices within and outside of the intensive care unit: results of a survey among hospitals in the prevention epicenter program of the Centers for Disease Control and Prevention.Infect Control Hosp Epidemiol.2003;24:942–945.
- ,.Peripherally inserted central catheters: development of a hospital‐based program.J Intraven Nurs.1990;13:287–290.
- ,,, et al.Infectious complications among patients receiving home intravenous therapy with peripheral, central, or peripherally placed central venous catheters.Am J Med.1991;91:95S–100S.
- ,,.Peripherally inserted central catheters in patients with AIDS are associated with a low infection rate.Clin Infect Dis.2000;30:949–952.
- ,,,.Peripherally inserted central venous catheters in an acute care hospital.J Intraven Nurs.1990;154:1833–1837.
- ,,.Central venous pressure measurements: peripherally inserted catheters versus centrally inserted catheters.Crit Care Med.2000;28:3833–3836.
- ,,, et al.Survey of the use of peripherally inserted central venous catheters in children.Pediatrics.1997;99:e4.
- .Peripherally inserted central catheter (PICC) is effective in the care of critically ill patients using the basilic and cephalic veins and performed under ultrasound guidance at the patient's bedside by a pulmonary and critical care specialist. [October 23‐28, 2004, Seattle, Washington, USA. Abstracts].Chest.2004;126(4 suppl):705S–1014S.
- ,,, et al.Use of femoral venous catheters in critically ill adults: prospective study.Crit Care Med.1991;19:550–553.
- ,,,,.Complications and failures of subclavian‐vein catheterization.N Engl J Med.1994;331:1735–1738.
- ,.Risk of catheter‐related bloodstream infection with peripherally inserted central venous catheters used in hospitalized patients.Chest.2005;128:489–495.
- ,.The peripherally inserted central catheter (PICC): a prospective study of its natural history after cubital fossa insertion.Anaesth Intensive Care.2002;30:21–24.
- ,,.Venous thrombosis associated with peripherally inserted central catheters: a retrospective analysis of the Cleveland Clinic experience.Clin Infect Dis.2002;34:1179–1183.
- ,,,,.Peripherally inserted central catheters and upper extremity deep vein thrombosis.Australas Radiol.2006;50:451–454.
- ,,, et al.Incidence of upper limb venous thrombosis associated with peripherally inserted central catheters (PICC).Br J Radiol.2005;78:596–600.
- ,,, et al.Upper‐extremity deep vein thrombosis: risk factors, diagnosis, and complications.Arch Intern Med.1997;157:57–62.
- ,,,.Peripherally inserted central catheters: outcome as a function of the operator.J Vasc Interv Radiol.2001;12:723–729.
- ,,, et al.Ultrasonic locating devices for central venous cannulation: meta‐analysis.BMJ.2003;327:361.

Hypoglycemia in ICU
Since publication of the first randomized controlled trial of insulin infusion therapy in surgical intensive care unit (ICU) patients,1 most institutions have implemented insulin infusion protocols (IIP) for tight glycemic control in their ICUs.29 The major problem with tight glycemic control is the risk of hypoglycemia. In the randomized controlled trial involving medical ICU patients, 18.7% patients experienced at least 1 episode of blood glucose (BG) <40 mg/dL.10 Recently, a major insulin infusion trial involving patients with severe sepsis was stopped due to unacceptably high risk of hypoglycemia.11 Potential benefits of BG control may be offset by potential risks of hypoglycemia. While there can be multiple factors that could contribute to the risk of hypoglycemia, suboptimal protocol implementation is relatively amenable to correction.
Most IIPs are nurse driven. Nurses monitor BG levels every 30 to 60 minutes and make adjustments in insulin infusion rates. Each point of care testing and insulin dose adjustment takes about 5 minutes of nursing time.12 Given the numerous other nursing responsibilities for monitoring and documentation in very sick patients, nurses may not always be able check BGs at the recommended times. We investigated whether a delay in BG monitoring during insulin infusion therapy is associated with higher risk of hypoglycemia.
Methods
Data were collected for 50 consecutive patients treated with Brigham and Women's Hospital's insulin infusion protocol (BHIP) between September 27, 2006 and October 13, 2006. The investigation was part of the hospital's ongoing diabetes quality improvement program. Partners‐Health Human Research Committee approved the study. Patient demographics, history of diabetes mellitus, and glycosylated hemoglobin (A1C) were obtained from paper and electronic medical records. Point‐of‐care BG values were obtained from the bedside paper flow sheets. The exact times of individual BG measurements were ascertained from Point of Care Precision Web (QCM3.0; Abbott, Inc.).
Target BG range with BHIP is 80 to 110 mg/dL. BHIP requires BG testing every 60 minutes unless a BG value of <60 mg/dL is obtained; in which case, testing is required every 30 minutes. A time violation was assumed to have occurred if the BG was measured >70 minutes after a previous value of 60 mg/dL or >40 minutes after a previous BG value of <60 mg/dL (ie, >10 minutes after the recommended time for measurement). Although the choice of 10 minutes was arbitrary, we think it is a reasonable and practical time frame for getting a BG measurement. If a measurement was obtained earlier than the recommended time, it was not considered a time violation. However, measurements obtained within 30 minutes of a previous BG value (overwhelmingly drawn for confirmation of a previous BG value) were excluded from analysis.
BG values were divided into 2 categories: values following time violation and values following no time violation. The numbers of values in different BG ranges (<80, 80110, >110 mg/dL) were compared in the 2 categories using a chi square test. Data are presented as mean standard deviation (SD), median and numbers with percentage. Statistical significance was set at P < 0.05.
Results
Mean age of the 50 patients treated with BHIP was 64.0 13.6 years. There were 27 men and 23 women. Eighteen patients had preexisting diabetes (1 had type 1 and 17 had type 2 diabetes, mean A1C 7.1 1.7%) and 32 patients had no previous history of diabetes (mean A1C 5.9 0.9%). Mean serum creatinine was 1.34 1.0 mg/dL. Mean BG at the start of BHIP was 173 69.6 mg/dL; median 167.5 mg/dL. Mean BG during insulin infusion was 117.3 43.1 mg/dL; median 107 mg/dL. Mean BG during insulin infusion was higher in diabetic patients compared to nondiabetic patients (125.2 57.8 versus 113.4 38.8 mg/dL; P < 0.01). Monitoring for BGs was done with similar frequency in all patients. Overall, 40.2% of the total 2,605 BG values were in a range of 80 to 110 mg/dL. A total of 1.5% of values were below 60 mg/dL; only 4 values were <40 mg/dL.
A total of 2,309 values could be studied for time violations. The remaining 296 values were either obtained within 30 minutes of the previous test or the exact time of measurement could not be ascertained. A total of 1,474 (63.9%) measurements had been obtained at the recommended time or earlier than the recommended time; 835 (36.1%) measurements had been obtained >10 minutes after the recommended time for measurement (time violation). The proportion of BG values below the target (<80 mg/dL) was significantly higher following the time violation as compared to no time violation (Table 1). On the other hand, values >110 mg/dL were not more common following a time violation, compared to instances when no time violation occurred.
| Time Violation [n = 835 (100%)] | No Time Violation [n = 1,474 (100%)] | P Value | |
|---|---|---|---|
| |||
| BG values <80 mg/dL | 149 (17.8) | 171 (11.6) | <0.001 |
| BG values 80110 mg/dL | 316 (37.8) | 596 (40.4) | NS |
| BG values >110 mg/dL | 370 (44.3) | 708 (47.8) | NS |
Frequency of time violation was similar in subgroups of patients divided according to gender, presence of diabetes and the type of ICU (Table 2). Comparison among subgroups of admission diagnoses was not possible due to the small number of patients. Overall, the proportion of low BG values was lower in diabetic patients compared to nondiabetic patients (11.9% versus 15.0%, P = 0.03). An increased rate of hypoglycemia following time violations was present in all subgroups except for the diabetic subgroup (Table 3).
| Characteristic | Number of Patients | % of BG Values Associated with Time Violations | P Value |
|---|---|---|---|
| |||
| Gender | NS | ||
| Male | 27 | 36 | |
| Female | 23 | 36 | |
| Diabetes status | NS | ||
| Known diabetes | 18 | 37 | |
| No known diabetes | 32 | 35 | |
| Type of ICU | NS | ||
| Medical | 20 | 38 | |
| Surgical | 30 | 35 | |
| Admission diagnosis | |||
| Cardiovascular disease | 7 | 35 | |
| Gastrointestinal disease | 4 | 43 | |
| Malignant disorder | 8 | 32 | |
| Neurological disease | 7 | 36 | |
| Orthopedic problem | 2 | 51 | |
| Respiratory disease | 13 | 33 | |
| Renal failure | 3 | 46 | |
| Sepsis | 6 | 36 | |
| % BG Values <80 | |||
|---|---|---|---|
| Characteristic | Time Violation | No Time Violation | P Value |
| |||
| Male | 19.1 | 11.9 | <0.001 |
| Female | 16.1 | 11.2 | 0.03 |
| Known diabetes | 13.3 | 11.1 | NS |
| No diabetes | 20 | 11.9 | <0.001 |
| Medical ICU | 19.2 | 11.9 | 0.002 |
| Surgical ICU | 16.8 | 11.3 | 0.004 |
| Cardiovascular diseases | 21.1 | 14.1 | |
| Gastrointestinal diseases | 22.1 | 14.8 | |
| Malignant disorders | 22.0 | 11.7 | |
| Neurological diseases | 7.5 | 5.0 | |
| Orthopedic problems | 6.2 | 6.6 | |
| Respiratory diseases | 11.9 | 10.4 | |
| Renal failure | 35.7 | 15.6 | |
| Sepsis | 19.7 | 13.5 | |
Discussion
Our study shows that a delay in BG testing during BHIP is associated with higher chances of a low BG value. This effect was consistent in multiple subgroups. However, the effect was nonsignificant in diabetic patients, probably due to higher mean BG levels and less frequent low BG values. Over one‐third of all BG measurements were obtained after a time violation. Protocol violations in our study are no different from those reported by others.7, 13, 14 Our patient characteristics of severe hypoglycemic episodes and the overall BG control achieved with BHIP were also similar to those reported by others with similar protocols.5, 7, 1517 While the results of this study may still be specific to BHIP, we think they are applicable to other similar protocols.
Because a delay in testing by itself is unlikely to cause hypoglycemia, a more likely explanation for these results is that hypoglycemia occurred when insulin infusion adjustments were not made in a timely fashion due to prolonged BG monitoring intervals. Insulin infusions are the preferred treatment in rapidly changing clinical settings because changes in insulin doses can be made frequently. Most IIPs are designed with the assumption that insulin dose adjustments will be made regularly and frequently, based on BG measurements. Although there is no gold standard for the optimal BG test frequency, in most protocols BG testing is performed every hour in order to ensure safety as well as efficacy. Our results are consistent with the intuitive assumption that a timely measurement of the BG is important for successful implementation of an IIP.
It was somewhat surprising that high BG values were not more frequent following a time violation. We can only speculate as to the reason for this. It is possible that critically ill patients are near maximally insulin resistant and, once an effective insulin infusion rate is achieved, further increases are not as frequently required. On the other hand, insulin requirements may decrease rapidly as contributors to insulin resistance resolve. Another possibility is that there may be a limit to hepatic glucose production during acute illness making patients more prone to hypoglycemia. It is also possible that the nurses tend to test more promptly when the BG levels are running high. Thus, the insulin doses may be increased at proper times until BG levels are in the target range. However, when BG levels are in the target range, nurses may become less vigilant, leading to a delay in testing. As a result a decrease in insulin dose, when required, does not happen as promptly as an increase in dose.
In our study the absolute risk of hypoglycemia associated with time violation was 6%. Avoiding this hypoglycemia may have an impact on glycemic control in the ICU and may change clinical outcomes. Moreover, this is 1 of the few factors that are potentially amenable to correction. Therefore, measures to improve adherence to protocols, eg, prompts for BG testing and better nurse training regarding importance of timely testing, may reduce the risk of hypoglycemia.
- ,,, et al.Intensive insulin therapy in the surgical intensive care unit.N Engl J Med.2001;345(19):1359–1367.
- .Effect of an intensive glucose management protocol on the mortality of critically ill adult patients.Mayo Clin Proc.2004;79(8):992–1000.
- ,,,,.Implementing intensive insulin therapy: development and audit of the Bath insulin protocol.Anaesth Intensive Care.2004;32(3):311–316.
- ,,,,.Optimizing hospital use of intravenous insulin therapy: improved management of hyperglycemia and error reduction with a new nomogram.Endocr Pract.2005;11(4):240–253.
- ,,, et al.Efficacy and safety of an insulin infusion protocol in a surgical ICU.J Am Coll Surg.2006;202(1):1–9.
- ,,, et al.Implementation of a safe and effective insulin infusion protocol in a medical intensive care unit.Diabetes Care.2004;27(2):461–467.
- ,,, et al.Inpatient management of hyperglycemia: the Northwestern experience.Endocr Pract.2006;12(5):491–505.
- ,,, et al.Implementing an intravenous insulin infusion protocol in the intensive care unit.Am J Health Syst Pharm.2007;64(4):385–395.
- ,,,,.A practical approach to hyperglycemia management in the intensive care unit: evaluation of an intensive insulin infusion protocol.Pharmacotherapy.2006;26(10):1410–1420.
- ,,, et al.Intensive insulin therapy in the medical ICU.N Engl J Med.2006;354(5):449–461.
- ,,, et al.Intensive insulin therapy and pentastarch resuscitation in severe sepsis.N Engl J Med.2008;358(2):125–139.
- .Evaluation of nursing work effort and perceptions about blood glucose testing in tight glycemic control.Am J Crit Care.2006;15(4):370–377.
- ,,,,.Adherence to and efficacy and safety of an insulin protocol in the critically ill: a prospective observational study.Am J Crit Care.2007;16(6):599–608.
- ,,,,.Evaluation of an intensive insulin protocol for septic patients in a medical intensive care unit.Crit Care Med.2006;34(12):2974–2978.
- ,,, et al.The impact of a normoglycemic management protocol on clinical outcomes in the trauma intensive care unit.JPEN J Parenter Enteral Nutr.2005;29(5):353–358.
- ,,,,,.Standardization of intravenous insulin therapy improves the efficiency and safety of blood glucose control in critically ill adults.Intensive Care Med.2004;30(5):804–810.
- ,,, et al.Intensive versus modified conventional control of blood glucose level in medical intensive care patients: a pilot study.Am J Crit Care.2005;14(5):370–376.
Since publication of the first randomized controlled trial of insulin infusion therapy in surgical intensive care unit (ICU) patients,1 most institutions have implemented insulin infusion protocols (IIP) for tight glycemic control in their ICUs.29 The major problem with tight glycemic control is the risk of hypoglycemia. In the randomized controlled trial involving medical ICU patients, 18.7% patients experienced at least 1 episode of blood glucose (BG) <40 mg/dL.10 Recently, a major insulin infusion trial involving patients with severe sepsis was stopped due to unacceptably high risk of hypoglycemia.11 Potential benefits of BG control may be offset by potential risks of hypoglycemia. While there can be multiple factors that could contribute to the risk of hypoglycemia, suboptimal protocol implementation is relatively amenable to correction.
Most IIPs are nurse driven. Nurses monitor BG levels every 30 to 60 minutes and make adjustments in insulin infusion rates. Each point of care testing and insulin dose adjustment takes about 5 minutes of nursing time.12 Given the numerous other nursing responsibilities for monitoring and documentation in very sick patients, nurses may not always be able check BGs at the recommended times. We investigated whether a delay in BG monitoring during insulin infusion therapy is associated with higher risk of hypoglycemia.
Methods
Data were collected for 50 consecutive patients treated with Brigham and Women's Hospital's insulin infusion protocol (BHIP) between September 27, 2006 and October 13, 2006. The investigation was part of the hospital's ongoing diabetes quality improvement program. Partners‐Health Human Research Committee approved the study. Patient demographics, history of diabetes mellitus, and glycosylated hemoglobin (A1C) were obtained from paper and electronic medical records. Point‐of‐care BG values were obtained from the bedside paper flow sheets. The exact times of individual BG measurements were ascertained from Point of Care Precision Web (QCM3.0; Abbott, Inc.).
Target BG range with BHIP is 80 to 110 mg/dL. BHIP requires BG testing every 60 minutes unless a BG value of <60 mg/dL is obtained; in which case, testing is required every 30 minutes. A time violation was assumed to have occurred if the BG was measured >70 minutes after a previous value of 60 mg/dL or >40 minutes after a previous BG value of <60 mg/dL (ie, >10 minutes after the recommended time for measurement). Although the choice of 10 minutes was arbitrary, we think it is a reasonable and practical time frame for getting a BG measurement. If a measurement was obtained earlier than the recommended time, it was not considered a time violation. However, measurements obtained within 30 minutes of a previous BG value (overwhelmingly drawn for confirmation of a previous BG value) were excluded from analysis.
BG values were divided into 2 categories: values following time violation and values following no time violation. The numbers of values in different BG ranges (<80, 80110, >110 mg/dL) were compared in the 2 categories using a chi square test. Data are presented as mean standard deviation (SD), median and numbers with percentage. Statistical significance was set at P < 0.05.
Results
Mean age of the 50 patients treated with BHIP was 64.0 13.6 years. There were 27 men and 23 women. Eighteen patients had preexisting diabetes (1 had type 1 and 17 had type 2 diabetes, mean A1C 7.1 1.7%) and 32 patients had no previous history of diabetes (mean A1C 5.9 0.9%). Mean serum creatinine was 1.34 1.0 mg/dL. Mean BG at the start of BHIP was 173 69.6 mg/dL; median 167.5 mg/dL. Mean BG during insulin infusion was 117.3 43.1 mg/dL; median 107 mg/dL. Mean BG during insulin infusion was higher in diabetic patients compared to nondiabetic patients (125.2 57.8 versus 113.4 38.8 mg/dL; P < 0.01). Monitoring for BGs was done with similar frequency in all patients. Overall, 40.2% of the total 2,605 BG values were in a range of 80 to 110 mg/dL. A total of 1.5% of values were below 60 mg/dL; only 4 values were <40 mg/dL.
A total of 2,309 values could be studied for time violations. The remaining 296 values were either obtained within 30 minutes of the previous test or the exact time of measurement could not be ascertained. A total of 1,474 (63.9%) measurements had been obtained at the recommended time or earlier than the recommended time; 835 (36.1%) measurements had been obtained >10 minutes after the recommended time for measurement (time violation). The proportion of BG values below the target (<80 mg/dL) was significantly higher following the time violation as compared to no time violation (Table 1). On the other hand, values >110 mg/dL were not more common following a time violation, compared to instances when no time violation occurred.
| Time Violation [n = 835 (100%)] | No Time Violation [n = 1,474 (100%)] | P Value | |
|---|---|---|---|
| |||
| BG values <80 mg/dL | 149 (17.8) | 171 (11.6) | <0.001 |
| BG values 80110 mg/dL | 316 (37.8) | 596 (40.4) | NS |
| BG values >110 mg/dL | 370 (44.3) | 708 (47.8) | NS |
Frequency of time violation was similar in subgroups of patients divided according to gender, presence of diabetes and the type of ICU (Table 2). Comparison among subgroups of admission diagnoses was not possible due to the small number of patients. Overall, the proportion of low BG values was lower in diabetic patients compared to nondiabetic patients (11.9% versus 15.0%, P = 0.03). An increased rate of hypoglycemia following time violations was present in all subgroups except for the diabetic subgroup (Table 3).
| Characteristic | Number of Patients | % of BG Values Associated with Time Violations | P Value |
|---|---|---|---|
| |||
| Gender | NS | ||
| Male | 27 | 36 | |
| Female | 23 | 36 | |
| Diabetes status | NS | ||
| Known diabetes | 18 | 37 | |
| No known diabetes | 32 | 35 | |
| Type of ICU | NS | ||
| Medical | 20 | 38 | |
| Surgical | 30 | 35 | |
| Admission diagnosis | |||
| Cardiovascular disease | 7 | 35 | |
| Gastrointestinal disease | 4 | 43 | |
| Malignant disorder | 8 | 32 | |
| Neurological disease | 7 | 36 | |
| Orthopedic problem | 2 | 51 | |
| Respiratory disease | 13 | 33 | |
| Renal failure | 3 | 46 | |
| Sepsis | 6 | 36 | |
| % BG Values <80 | |||
|---|---|---|---|
| Characteristic | Time Violation | No Time Violation | P Value |
| |||
| Male | 19.1 | 11.9 | <0.001 |
| Female | 16.1 | 11.2 | 0.03 |
| Known diabetes | 13.3 | 11.1 | NS |
| No diabetes | 20 | 11.9 | <0.001 |
| Medical ICU | 19.2 | 11.9 | 0.002 |
| Surgical ICU | 16.8 | 11.3 | 0.004 |
| Cardiovascular diseases | 21.1 | 14.1 | |
| Gastrointestinal diseases | 22.1 | 14.8 | |
| Malignant disorders | 22.0 | 11.7 | |
| Neurological diseases | 7.5 | 5.0 | |
| Orthopedic problems | 6.2 | 6.6 | |
| Respiratory diseases | 11.9 | 10.4 | |
| Renal failure | 35.7 | 15.6 | |
| Sepsis | 19.7 | 13.5 | |
Discussion
Our study shows that a delay in BG testing during BHIP is associated with higher chances of a low BG value. This effect was consistent in multiple subgroups. However, the effect was nonsignificant in diabetic patients, probably due to higher mean BG levels and less frequent low BG values. Over one‐third of all BG measurements were obtained after a time violation. Protocol violations in our study are no different from those reported by others.7, 13, 14 Our patient characteristics of severe hypoglycemic episodes and the overall BG control achieved with BHIP were also similar to those reported by others with similar protocols.5, 7, 1517 While the results of this study may still be specific to BHIP, we think they are applicable to other similar protocols.
Because a delay in testing by itself is unlikely to cause hypoglycemia, a more likely explanation for these results is that hypoglycemia occurred when insulin infusion adjustments were not made in a timely fashion due to prolonged BG monitoring intervals. Insulin infusions are the preferred treatment in rapidly changing clinical settings because changes in insulin doses can be made frequently. Most IIPs are designed with the assumption that insulin dose adjustments will be made regularly and frequently, based on BG measurements. Although there is no gold standard for the optimal BG test frequency, in most protocols BG testing is performed every hour in order to ensure safety as well as efficacy. Our results are consistent with the intuitive assumption that a timely measurement of the BG is important for successful implementation of an IIP.
It was somewhat surprising that high BG values were not more frequent following a time violation. We can only speculate as to the reason for this. It is possible that critically ill patients are near maximally insulin resistant and, once an effective insulin infusion rate is achieved, further increases are not as frequently required. On the other hand, insulin requirements may decrease rapidly as contributors to insulin resistance resolve. Another possibility is that there may be a limit to hepatic glucose production during acute illness making patients more prone to hypoglycemia. It is also possible that the nurses tend to test more promptly when the BG levels are running high. Thus, the insulin doses may be increased at proper times until BG levels are in the target range. However, when BG levels are in the target range, nurses may become less vigilant, leading to a delay in testing. As a result a decrease in insulin dose, when required, does not happen as promptly as an increase in dose.
In our study the absolute risk of hypoglycemia associated with time violation was 6%. Avoiding this hypoglycemia may have an impact on glycemic control in the ICU and may change clinical outcomes. Moreover, this is 1 of the few factors that are potentially amenable to correction. Therefore, measures to improve adherence to protocols, eg, prompts for BG testing and better nurse training regarding importance of timely testing, may reduce the risk of hypoglycemia.
- ,,, et al.Intensive insulin therapy in the surgical intensive care unit.N Engl J Med.2001;345(19):1359–1367.
- .Effect of an intensive glucose management protocol on the mortality of critically ill adult patients.Mayo Clin Proc.2004;79(8):992–1000.
- ,,,,.Implementing intensive insulin therapy: development and audit of the Bath insulin protocol.Anaesth Intensive Care.2004;32(3):311–316.
- ,,,,.Optimizing hospital use of intravenous insulin therapy: improved management of hyperglycemia and error reduction with a new nomogram.Endocr Pract.2005;11(4):240–253.
- ,,, et al.Efficacy and safety of an insulin infusion protocol in a surgical ICU.J Am Coll Surg.2006;202(1):1–9.
- ,,, et al.Implementation of a safe and effective insulin infusion protocol in a medical intensive care unit.Diabetes Care.2004;27(2):461–467.
- ,,, et al.Inpatient management of hyperglycemia: the Northwestern experience.Endocr Pract.2006;12(5):491–505.
- ,,, et al.Implementing an intravenous insulin infusion protocol in the intensive care unit.Am J Health Syst Pharm.2007;64(4):385–395.
- ,,,,.A practical approach to hyperglycemia management in the intensive care unit: evaluation of an intensive insulin infusion protocol.Pharmacotherapy.2006;26(10):1410–1420.
- ,,, et al.Intensive insulin therapy in the medical ICU.N Engl J Med.2006;354(5):449–461.
- ,,, et al.Intensive insulin therapy and pentastarch resuscitation in severe sepsis.N Engl J Med.2008;358(2):125–139.
- .Evaluation of nursing work effort and perceptions about blood glucose testing in tight glycemic control.Am J Crit Care.2006;15(4):370–377.
- ,,,,.Adherence to and efficacy and safety of an insulin protocol in the critically ill: a prospective observational study.Am J Crit Care.2007;16(6):599–608.
- ,,,,.Evaluation of an intensive insulin protocol for septic patients in a medical intensive care unit.Crit Care Med.2006;34(12):2974–2978.
- ,,, et al.The impact of a normoglycemic management protocol on clinical outcomes in the trauma intensive care unit.JPEN J Parenter Enteral Nutr.2005;29(5):353–358.
- ,,,,,.Standardization of intravenous insulin therapy improves the efficiency and safety of blood glucose control in critically ill adults.Intensive Care Med.2004;30(5):804–810.
- ,,, et al.Intensive versus modified conventional control of blood glucose level in medical intensive care patients: a pilot study.Am J Crit Care.2005;14(5):370–376.
Approach to Peripheral Neuropathies
Early diagnosis of peripheral neuropathies can lead to life‐saving or limb‐saving intervention. While infrequently a cause for concern in the hospital setting, peripheral neuropathies are commonoccurring in up to 10% of the general population.1 The hospitalist needs to expeditiously identify acute and life‐threatening or limb‐threatening causes among an immense set of differentials. Fortunately, with an informed and careful approach, most neuropathies in need of urgent intervention can be readily identified. A thorough history and examination, with the addition of electrodiagnostic testing, comprise the mainstays of this process. Inpatient neurology consultation should be sought for any rapidly progressing or acute onset neuropathy. The aim of this review is to equip the general hospitalist with a solid framework for efficiently evaluating peripheral neuropathies in urgent cases.
Literature Review
Search Strategy
A PubMed search was conducted using the title word peripheral, the medical subject heading major topic peripheral nervous system diseases/diagnosis, and algorithm or diagnosis, differential or diagnostic techniques, neurological or neurologic examination or evaluation or evaluating. The search was limited to English language review articles published between January 2002 and November 2007. Articles were included in this review if they provided an overview of an approach to the diagnosis of peripheral neuropathies. References listed in these articles were cross‐checked and additional articles meeting these criteria were included. Articles specific to subtypes of neuropathies or diagnostic tools were excluded.
Search Results
No single guideline or algorithm has been widely endorsed for the approach to diagnosing peripheral neuropathies. Several are suggested in the literature, but none are directed at the hospitalist. In general, acute and multifocal neuropathies are characterized as neurologic emergencies requiring immediate evaluation.2, 3
Several articles underscore the importance of pattern recognition in diagnosing peripheral neuropathies.2, 4, 5 Many articles present essential questions in evaluating peripheral neuropathy; some suggest an ordered approach.13, 511 The nature of these questions and recommended order of inquiry varies among authors (Table 1). Three essentials common to all articles include: 1) noting the onset of symptoms; 2) determining the distribution of nerve involvement; and 3) identifying the pathology as axonal, demyelinating, or mixed. All articles underscore the importance of the physical examination in determining and confirming distribution and nerve type. A thorough examination evaluating for systemic signs of etiologic possibilities is strongly recommended. Electrodiagnostic testing provides confirmation of the distribution of nerve involvement and further characterizes a neuropathy as demyelinating, axonal, or mixed.
| Article (Publication Year) | Essentials of Recommended Approach |
|---|---|
| Lunn3 (2007) | Details 6 essential questions in the history, highlighting: 1. Temporal evolution; 2. Autonomic involvement; 3. Nerve involvement (sensory/motor); 4. Cranial nerve involvement; 5. Family history; and 6. Coexistent disease |
| Examination should confirm findings expected from history | |
| Acute and multifocal neuropathies merit urgent evaluation | |
| Electrodiagnostic testing and neurology consultation should ensue if no diagnosis identified from above | |
| Burns et al.6 (2006) | Focuses on evaluation of polyneuropathy |
| Poses 4 questions: 1. Nerve involvement (sensory/motor); 2. Distribution; 3. Onset; 4. Associated factors (family history, exposures, associated systemic symptoms) | |
| Recommends electrodiagnostic testing | |
| Laboratory testing as indicated | |
| Scott and Kothari5 (2005) | Highlights importance of pattern recognition in the history and on examination |
| Ordered approach: 1. Localize site of neuropathic lesion, 2. Perform electrodiagnostic testing to determine pathology | |
| Bromberg1 (2005) | Proposes 7 layers to consider in investigation: 1. Localizing to peripheral nervous system; 2. Distribution; 3. Onset; 4. Nerve involvement (sensory/motor); 5. Pathology (axonal/demyelinating); 6. Other associated features; and 7. Epidemiologic features |
| Kelly4 (2004) | Highlights pattern recognition and features distribution, onset, and pathology in developing the differential diagnosis |
| Younger10 (2004) | Several key elements, including: timing, nerve involvement (sensory/motor/autonomic), distribution, and pathology (axonal/demyelinating) |
| England and Asbury7 (2004) | Details to determine: 1. Distribution; 2. Pathology (axonal/demyelinating); and 3. Timing |
| Smith and Bromberg9 (2003) | Suggest an algorithm: 1. Confirm the localization (history, examination and electrodiagnostic testing); 2. Identify atypical patterns; and 3. Recognize prototypic neuropathy and perform focused laboratory testing |
| Bromberg and Smith11 (2002) | 4 basic steps: 1. Nerve involvement (sensory/motor); 2. Distribution; 3. Timing; and 4. Pathology (axonal/demyelinating) |
| Hughes2 (2002) | Pattern recognition |
| Suggests staged investigation: 1. Basic laboratory tests; 2. Electrodiagnostic testing and further laboratory tests; and 3. Additional laboratory tests, imaging, and specialized testing | |
| Pourmand8 (2002) | Offers 7 key questions/steps highlighting: 1. Onset; 2. Course; 3. Distribution; 4. Nerve involvement (sensory/motor); 5. Nerve fiber type (large/small); 6. Autonomic involvement; and 7. Pathology (axonal/demyelinating) |
A General Approach for the Hospitalist
Pattern recognition and employing the essentials outlined above are key tools in the hospitalist's evaluation of peripheral neuropathy. Pattern recognition relies on a familiarity with the more common acute and severe neuropathies. For circumstances in which the diagnosis is not immediately recognizable, a systematic approach expedites evaluation. Figure 1 presents an algorithm for evaluating peripheral neuropathies in the acutely ill patient.
Pattern Recognition
In general, most acute or subacute and rapidly progressive neuropathies merit urgent neurology consultation. Patterns to be aware of in the acutely ill patient include Guillan‐Barr syndrome, vasculitis, ischemia, toxins, medication exposures, paraneoplastic syndromes, acute intermittent porphyria, diphtheria, and critical illness neuropathy. Any neuropathy presenting with associated respiratory symptoms or signs, such as shortness of breath, rapid shallow breathing, or hypoxia or hypercarbia, should also trigger urgent neurology consultation. As timely diagnosis of concerning entities relies heavily on pattern recognition, the typical presentation of more common etiologies and clues to their diagnosis are reviewed in Table 2.
| Etiology | Typical Presentation | Onset | Distribution | Electrodiagnostic Findings |
|---|---|---|---|---|
| ||||
| Traumatic neuropathy | Weakness and numbness in a limb following injury | Sudden | Asymmetric | Axonal |
| Guillan‐Barr syndrome | Acute inflammatory demyelinating polyneuropathy is most common but several variants exist; often follows URI or GI illness by 1‐3 weeks | Days to weeks | Ascending, symmetric | Usually demyelinating, largely motor |
| Diphtheria | Tonsillopharyngeal pseudomembrane | Days to weeks | Bulbar, descending, symmetric | Mostly demyelinating |
| Vasculitis | Waxing and waning, painful | Days to weeks | Asymmetric | Axonal |
| Acute intermittent porphyria | Can be associated with seizures/encephalopathy, abdominal pain | Days to weeks | Ascending, symmetric | Axonal, largely motor |
| Ischemic neuropathy | May follow vascular procedure by days to months; can be associated with poor peripheral pulses | Days to weeks | Asymmetric | Axonal |
| Toxins/drugs | Temporal association with offending agent: heavy metals: arsenic, lead, thallium; biologic toxins: ciguatera and shellfish poisoning. Medications: chemotherapies (ie, vincristine), colchicine, statins, nitrofurantoin, chloroquine | Days to months | Symmetric | Axonal |
| Critical illness neuropathy | Quadriparesis in the setting of sepsis/corticosteroids/neuromuscular blockade | Weeks | Symmetric | Axonal, largely motor |
| Paraneoplastic | Sensory ataxia most common; symptoms may precede cancer diagnosis; frequently associated tumors: small cell carcinoma of the lung; breast, ovarian, stomach cancers | Weeks | Symmetric | Axonal, largely sensory |
| Proximal diabetic neuropathy | Also known as diabetic lumbosacral plexopathy or Bruns‐Garland; leg pain followed by weakness/wasting | Weeks to months | Asymmetric | Axonal, largely motor |
For example, neuropathy from acute intermittent porphyria classically presents with pain in the back and limbs and progressive limb weakness (often more pronounced in the upper extremities). Respiratory failure may follow. A key to this history is that symptoms frequently follow within days of the colicky abdominal pain and encephalopathy of an attack. Additionally, attacks typically follow a precipitating event or drug exposure. These patients do not have the skin changes seen in other forms of porphyria. Treatment of this condition requires recognition and removal of any offending drug, correction of associated metabolic abnormalities, and the administration of hematin.12
Another, though rare, diagnosis that relies on pattern recognition is Bruns‐Garland syndrome (also known as proximal diabetic neuropathy). This condition is usually self‐limited, yet patients can be referred for unnecessary spinal surgery due to the severity of its symptoms. The clinical triad of severe thigh pain, absent knee jerk, and weakness in the lumbar vertebrae L3‐L4 distribution in a patient with diabetes should raise concern for this syndrome. The contralateral lower extremity can become involved in the following weeks. This syndrome is typified by a combination of injuries to the nerve root, the lumbar plexus, and the peripheral nerve. Electrodiagnostic testing confirms the syndrome, thus avoiding an unwarranted surgery.13
A Systematic Evaluation
When the etiology is not immediately evident, the essential questions identified in the review above are useful, and can be simplified for the hospitalist. First, understand the onset and timing of symptoms. Second, localize the symptoms to and within the peripheral nervous system (including classifying the distribution of nerve involvement). For acute, rapidly progressing or multifocal neuropathies urgent inpatient electrodiagnostic testing and neurology consultation should be obtained. Further testing, including laboratory testing, should be directed by these first steps.
Step 1
Delineating onset, timing and progression is of tremendous utility in establishing the diagnosis. Abrupt onset is typical of trauma, compression, thermal injury, and ischemia (due to vasculitis or other circulatory compromise). Guillan‐Barr syndrome, porphyria, critical illness neuropathy, and diphtheria can also present acutely with profound weakness. Neuropathies developing suddenly or over days to weeks merit urgent inpatient evaluation. Metabolic, paraneoplastic, and toxic causes tend to present with progressive symptoms over weeks to months. Chronic, insidious onset is most characteristic of hereditary neuropathies and some metabolic diseases such as diabetes mellitus. Evaluation of chronic neuropathies can be deferred to the outpatient setting.
Nonneuropathy causes of acute generalized weakness to consider in the differential diagnosis include: 1) muscle disorders such as periodic paralyses, metabolic defects, and myopathies (including acute viral and Lyme disease); 2) disorders of the neuromuscular junction such as myasthenia gravis, Eaton‐Lambert syndrome, organophosphate poisoning, and botulism; 3) central nervous system disorders such as brainstem ischemia, global ischemia, or multiple sclerosis; and 4) electrolyte disturbances such as hyperkalemia or hypercalcemia.14
Step 2
It is important to localize symptoms to the peripheral nervous system. Cortical lesions are unlikely to cause focal or positive sensory symptoms (ie, pain), and more frequently involve the face or upper and lower unilateral limb (ie, in the case of a stroke). Hyperreflexia can accompany cortical lesions. Conversely, peripheral nerve lesions often localize to a discrete region of a single limb or involve the contralateral limb in a symmetric fashion (ie, a stocking‐glove distribution or the ascending symmetric pattern seen in Guillan‐Barr syndrome).
With a thorough history and neurological examination the clinician can localize and classify the neuropathic lesion. Noting a motor or sensory predominance can narrow the diagnosis; for example, motor predominance is seen in Guillan‐Barr syndrome, critical illness neuropathy, and acute intermittent porphyria. Associated symptoms and signs discovered in a thorough review and physical examination of all systems can indicate the specific diagnosis. For example, a careful skin examination may find signs of vasculitis or Mees' lines (transverse white lines across the nails that can indicate heavy metal poisoning).12 Helpful tips for this evaluation are included in Table 3.
| History | Examination |
|---|---|
| |
| Ask the patient to outline the region involved | General findings |
| Dermatome radiculopathy | Screening for malignancy |
| Stocking‐glove polyneuropathy | Evaluate for vascular sufficiency |
| Single peripheral nerve mononeuropathy | Pes cavus suggests inherited disease |
| Asymmetry vasculitic neuropathy or other mononeuropathy multiplex | Skin exam for signs of vasculitis, Mees' lines |
| Associated symptoms | Neurologic findings: For each of the following, noting the distribution of abnormality will help classify the neuropathic lesion |
| Constitutional neoplasm | Decreased sensation (often the earliest sign) |
| Recent respiratory or GI illness GBS | Weakness without atrophy indicates recent axonal neuropathy or isolated demyelinating disease |
| Respiratory difficulties GBS | Marked atrophy indicates severe axonal damage |
| Autonomic symptoms GBS, porphyria | Decreased reflexes often present (except when only small sensory fibers are involved) |
| Colicky abdominal pain, encephalopathy | |
| Porphyria | |
The hospitalist should be able to classify the distribution as a mononeuropathy (involving a single nerve), a polyneuropathy (symmetric involvement of multiple nerves), or a mononeuropathy multiplex (asymmetric involvement of multiple nerves). Multifocal and proximal symmetric neuropathies commonly merit urgent evaluation.
The most devastating polyneuropathy is Guillan‐Barr syndrome, which can be fatal but is often reversible with early plasmapheresis. Vasculitis is another potentially treatable diagnosis that is critical to establish early; it most often presents as a mononeuropathy multiplex. Ischemic and traumatic mononeuropathies may be overshadowed by other illnesses and injuries, but finding these early can result in dramatically improved patient outcomes.
Step 3
Inpatient electrodiagnostic testing and neurology consultation should be ordered for any neuropathy with rapid onset, progression or severe symptoms or any neuropathy following one of the patterns described above. Electrodiagnostic testing characterizes the pathologic cause of the neuropathy as axonal, demyelinating, or mixed. It also assesses severity, chronicity, location, and symmetry of the neuropathy.15 It is imperative to have localized the neuropathy by history and examination prior to electrodiagnostic evaluation to ensure that the involved nerves are tested.
Step 4
Focused, further testing may be ordered more efficiently subsequent to the above data collection. Directed laboratory examination should be performed when indicated rather than cast as an initial broad diagnostic net. Ultrasound, magnetic resonance imaging (MRI), computed tomographypositron emission tomography (CT‐PET), and nerve biopsy are diagnostic modalities available to the clinician. In general, nerve biopsy should be reserved for suspected vasculitis, sarcoidosis, lymphoma, leprosy, or amyloidosis.
In summary, symptoms and signs of multifocal or proximal nerve involvement, acute onset, or rapid progression demand immediate diagnostic attention. Pattern recognition and a systematic approach expedite the diagnostic process, focusing necessary testing and decreasing overall cost. Focused steps in a systematic approach include: (1) delineating timing and onset of symptoms; (2) localizing and classifying the neuropathy; (3) obtaining electrodiagnostic testing and neurology consultation; and (4) further testing as directed by the preceding steps. Early diagnosis of acute peripheral neuropathies can lead to life‐saving or limb‐saving therapy.
- .An approach to the evaluation of peripheral neuropathies.Semin Neurol.2005;25:153–159.
- .Peripheral neuropathy.BMJ.2002;324:466–469.
- .Pinpointing peripheral neuropathies.Practitioner.2007;251:67–68,71–74,6–7 passim.
- .The evaluation of peripheral neuropathy. Part I: Clinical and laboratory evidence.Rev Neurol Dis.2004;1:133–140.
- ,.Evaluating the patient with peripheral nervous system complaints.J Am Osteopath Assoc.2005;105:71–83.
- ,,.An easy approach to evaluating peripheral neuropathy.J Fam Pract.2006;55:853–861.
- ,.Peripheral neuropathy.Lancet.2004;363:2151–2161.
- .Evaluating patients with suspected peripheral neuropathy: do the right thing, not everything.Muscle Nerve.2002;26:288–290.
- ,.A rational diagnostic approach to peripheral neuropathy.J Clin Neuromuscul Dis.2003;4:190–198.
- .Peripheral nerve disorders.Prim Care.2004;31:67–83.
- ,.Toward an efficient method to evaluate peripheral neuropathies.J Clin Neuromuscul Dis.2002;3:172–182.
- .Peripheral neuropathies in clinical practice.Med Clin North Am.2003;87:697–724.
- .The evaluation of peripheral neuropathy. Part II: Identifying common clinical syndromes.Rev Neurol Dis.2004;1:190–201.
- .Acute generalized weakness due to thyrotoxic periodic paralysis.CMAJ.2005;172:471–472.
- ,.Electrodiagnostic testing of nerves and muscles: when, why, and how to order.Cleve Clin J Med.2005;72:37–48.
Early diagnosis of peripheral neuropathies can lead to life‐saving or limb‐saving intervention. While infrequently a cause for concern in the hospital setting, peripheral neuropathies are commonoccurring in up to 10% of the general population.1 The hospitalist needs to expeditiously identify acute and life‐threatening or limb‐threatening causes among an immense set of differentials. Fortunately, with an informed and careful approach, most neuropathies in need of urgent intervention can be readily identified. A thorough history and examination, with the addition of electrodiagnostic testing, comprise the mainstays of this process. Inpatient neurology consultation should be sought for any rapidly progressing or acute onset neuropathy. The aim of this review is to equip the general hospitalist with a solid framework for efficiently evaluating peripheral neuropathies in urgent cases.
Literature Review
Search Strategy
A PubMed search was conducted using the title word peripheral, the medical subject heading major topic peripheral nervous system diseases/diagnosis, and algorithm or diagnosis, differential or diagnostic techniques, neurological or neurologic examination or evaluation or evaluating. The search was limited to English language review articles published between January 2002 and November 2007. Articles were included in this review if they provided an overview of an approach to the diagnosis of peripheral neuropathies. References listed in these articles were cross‐checked and additional articles meeting these criteria were included. Articles specific to subtypes of neuropathies or diagnostic tools were excluded.
Search Results
No single guideline or algorithm has been widely endorsed for the approach to diagnosing peripheral neuropathies. Several are suggested in the literature, but none are directed at the hospitalist. In general, acute and multifocal neuropathies are characterized as neurologic emergencies requiring immediate evaluation.2, 3
Several articles underscore the importance of pattern recognition in diagnosing peripheral neuropathies.2, 4, 5 Many articles present essential questions in evaluating peripheral neuropathy; some suggest an ordered approach.13, 511 The nature of these questions and recommended order of inquiry varies among authors (Table 1). Three essentials common to all articles include: 1) noting the onset of symptoms; 2) determining the distribution of nerve involvement; and 3) identifying the pathology as axonal, demyelinating, or mixed. All articles underscore the importance of the physical examination in determining and confirming distribution and nerve type. A thorough examination evaluating for systemic signs of etiologic possibilities is strongly recommended. Electrodiagnostic testing provides confirmation of the distribution of nerve involvement and further characterizes a neuropathy as demyelinating, axonal, or mixed.
| Article (Publication Year) | Essentials of Recommended Approach |
|---|---|
| Lunn3 (2007) | Details 6 essential questions in the history, highlighting: 1. Temporal evolution; 2. Autonomic involvement; 3. Nerve involvement (sensory/motor); 4. Cranial nerve involvement; 5. Family history; and 6. Coexistent disease |
| Examination should confirm findings expected from history | |
| Acute and multifocal neuropathies merit urgent evaluation | |
| Electrodiagnostic testing and neurology consultation should ensue if no diagnosis identified from above | |
| Burns et al.6 (2006) | Focuses on evaluation of polyneuropathy |
| Poses 4 questions: 1. Nerve involvement (sensory/motor); 2. Distribution; 3. Onset; 4. Associated factors (family history, exposures, associated systemic symptoms) | |
| Recommends electrodiagnostic testing | |
| Laboratory testing as indicated | |
| Scott and Kothari5 (2005) | Highlights importance of pattern recognition in the history and on examination |
| Ordered approach: 1. Localize site of neuropathic lesion, 2. Perform electrodiagnostic testing to determine pathology | |
| Bromberg1 (2005) | Proposes 7 layers to consider in investigation: 1. Localizing to peripheral nervous system; 2. Distribution; 3. Onset; 4. Nerve involvement (sensory/motor); 5. Pathology (axonal/demyelinating); 6. Other associated features; and 7. Epidemiologic features |
| Kelly4 (2004) | Highlights pattern recognition and features distribution, onset, and pathology in developing the differential diagnosis |
| Younger10 (2004) | Several key elements, including: timing, nerve involvement (sensory/motor/autonomic), distribution, and pathology (axonal/demyelinating) |
| England and Asbury7 (2004) | Details to determine: 1. Distribution; 2. Pathology (axonal/demyelinating); and 3. Timing |
| Smith and Bromberg9 (2003) | Suggest an algorithm: 1. Confirm the localization (history, examination and electrodiagnostic testing); 2. Identify atypical patterns; and 3. Recognize prototypic neuropathy and perform focused laboratory testing |
| Bromberg and Smith11 (2002) | 4 basic steps: 1. Nerve involvement (sensory/motor); 2. Distribution; 3. Timing; and 4. Pathology (axonal/demyelinating) |
| Hughes2 (2002) | Pattern recognition |
| Suggests staged investigation: 1. Basic laboratory tests; 2. Electrodiagnostic testing and further laboratory tests; and 3. Additional laboratory tests, imaging, and specialized testing | |
| Pourmand8 (2002) | Offers 7 key questions/steps highlighting: 1. Onset; 2. Course; 3. Distribution; 4. Nerve involvement (sensory/motor); 5. Nerve fiber type (large/small); 6. Autonomic involvement; and 7. Pathology (axonal/demyelinating) |
A General Approach for the Hospitalist
Pattern recognition and employing the essentials outlined above are key tools in the hospitalist's evaluation of peripheral neuropathy. Pattern recognition relies on a familiarity with the more common acute and severe neuropathies. For circumstances in which the diagnosis is not immediately recognizable, a systematic approach expedites evaluation. Figure 1 presents an algorithm for evaluating peripheral neuropathies in the acutely ill patient.
Pattern Recognition
In general, most acute or subacute and rapidly progressive neuropathies merit urgent neurology consultation. Patterns to be aware of in the acutely ill patient include Guillan‐Barr syndrome, vasculitis, ischemia, toxins, medication exposures, paraneoplastic syndromes, acute intermittent porphyria, diphtheria, and critical illness neuropathy. Any neuropathy presenting with associated respiratory symptoms or signs, such as shortness of breath, rapid shallow breathing, or hypoxia or hypercarbia, should also trigger urgent neurology consultation. As timely diagnosis of concerning entities relies heavily on pattern recognition, the typical presentation of more common etiologies and clues to their diagnosis are reviewed in Table 2.
| Etiology | Typical Presentation | Onset | Distribution | Electrodiagnostic Findings |
|---|---|---|---|---|
| ||||
| Traumatic neuropathy | Weakness and numbness in a limb following injury | Sudden | Asymmetric | Axonal |
| Guillan‐Barr syndrome | Acute inflammatory demyelinating polyneuropathy is most common but several variants exist; often follows URI or GI illness by 1‐3 weeks | Days to weeks | Ascending, symmetric | Usually demyelinating, largely motor |
| Diphtheria | Tonsillopharyngeal pseudomembrane | Days to weeks | Bulbar, descending, symmetric | Mostly demyelinating |
| Vasculitis | Waxing and waning, painful | Days to weeks | Asymmetric | Axonal |
| Acute intermittent porphyria | Can be associated with seizures/encephalopathy, abdominal pain | Days to weeks | Ascending, symmetric | Axonal, largely motor |
| Ischemic neuropathy | May follow vascular procedure by days to months; can be associated with poor peripheral pulses | Days to weeks | Asymmetric | Axonal |
| Toxins/drugs | Temporal association with offending agent: heavy metals: arsenic, lead, thallium; biologic toxins: ciguatera and shellfish poisoning. Medications: chemotherapies (ie, vincristine), colchicine, statins, nitrofurantoin, chloroquine | Days to months | Symmetric | Axonal |
| Critical illness neuropathy | Quadriparesis in the setting of sepsis/corticosteroids/neuromuscular blockade | Weeks | Symmetric | Axonal, largely motor |
| Paraneoplastic | Sensory ataxia most common; symptoms may precede cancer diagnosis; frequently associated tumors: small cell carcinoma of the lung; breast, ovarian, stomach cancers | Weeks | Symmetric | Axonal, largely sensory |
| Proximal diabetic neuropathy | Also known as diabetic lumbosacral plexopathy or Bruns‐Garland; leg pain followed by weakness/wasting | Weeks to months | Asymmetric | Axonal, largely motor |
For example, neuropathy from acute intermittent porphyria classically presents with pain in the back and limbs and progressive limb weakness (often more pronounced in the upper extremities). Respiratory failure may follow. A key to this history is that symptoms frequently follow within days of the colicky abdominal pain and encephalopathy of an attack. Additionally, attacks typically follow a precipitating event or drug exposure. These patients do not have the skin changes seen in other forms of porphyria. Treatment of this condition requires recognition and removal of any offending drug, correction of associated metabolic abnormalities, and the administration of hematin.12
Another, though rare, diagnosis that relies on pattern recognition is Bruns‐Garland syndrome (also known as proximal diabetic neuropathy). This condition is usually self‐limited, yet patients can be referred for unnecessary spinal surgery due to the severity of its symptoms. The clinical triad of severe thigh pain, absent knee jerk, and weakness in the lumbar vertebrae L3‐L4 distribution in a patient with diabetes should raise concern for this syndrome. The contralateral lower extremity can become involved in the following weeks. This syndrome is typified by a combination of injuries to the nerve root, the lumbar plexus, and the peripheral nerve. Electrodiagnostic testing confirms the syndrome, thus avoiding an unwarranted surgery.13
A Systematic Evaluation
When the etiology is not immediately evident, the essential questions identified in the review above are useful, and can be simplified for the hospitalist. First, understand the onset and timing of symptoms. Second, localize the symptoms to and within the peripheral nervous system (including classifying the distribution of nerve involvement). For acute, rapidly progressing or multifocal neuropathies urgent inpatient electrodiagnostic testing and neurology consultation should be obtained. Further testing, including laboratory testing, should be directed by these first steps.
Step 1
Delineating onset, timing and progression is of tremendous utility in establishing the diagnosis. Abrupt onset is typical of trauma, compression, thermal injury, and ischemia (due to vasculitis or other circulatory compromise). Guillan‐Barr syndrome, porphyria, critical illness neuropathy, and diphtheria can also present acutely with profound weakness. Neuropathies developing suddenly or over days to weeks merit urgent inpatient evaluation. Metabolic, paraneoplastic, and toxic causes tend to present with progressive symptoms over weeks to months. Chronic, insidious onset is most characteristic of hereditary neuropathies and some metabolic diseases such as diabetes mellitus. Evaluation of chronic neuropathies can be deferred to the outpatient setting.
Nonneuropathy causes of acute generalized weakness to consider in the differential diagnosis include: 1) muscle disorders such as periodic paralyses, metabolic defects, and myopathies (including acute viral and Lyme disease); 2) disorders of the neuromuscular junction such as myasthenia gravis, Eaton‐Lambert syndrome, organophosphate poisoning, and botulism; 3) central nervous system disorders such as brainstem ischemia, global ischemia, or multiple sclerosis; and 4) electrolyte disturbances such as hyperkalemia or hypercalcemia.14
Step 2
It is important to localize symptoms to the peripheral nervous system. Cortical lesions are unlikely to cause focal or positive sensory symptoms (ie, pain), and more frequently involve the face or upper and lower unilateral limb (ie, in the case of a stroke). Hyperreflexia can accompany cortical lesions. Conversely, peripheral nerve lesions often localize to a discrete region of a single limb or involve the contralateral limb in a symmetric fashion (ie, a stocking‐glove distribution or the ascending symmetric pattern seen in Guillan‐Barr syndrome).
With a thorough history and neurological examination the clinician can localize and classify the neuropathic lesion. Noting a motor or sensory predominance can narrow the diagnosis; for example, motor predominance is seen in Guillan‐Barr syndrome, critical illness neuropathy, and acute intermittent porphyria. Associated symptoms and signs discovered in a thorough review and physical examination of all systems can indicate the specific diagnosis. For example, a careful skin examination may find signs of vasculitis or Mees' lines (transverse white lines across the nails that can indicate heavy metal poisoning).12 Helpful tips for this evaluation are included in Table 3.
| History | Examination |
|---|---|
| |
| Ask the patient to outline the region involved | General findings |
| Dermatome radiculopathy | Screening for malignancy |
| Stocking‐glove polyneuropathy | Evaluate for vascular sufficiency |
| Single peripheral nerve mononeuropathy | Pes cavus suggests inherited disease |
| Asymmetry vasculitic neuropathy or other mononeuropathy multiplex | Skin exam for signs of vasculitis, Mees' lines |
| Associated symptoms | Neurologic findings: For each of the following, noting the distribution of abnormality will help classify the neuropathic lesion |
| Constitutional neoplasm | Decreased sensation (often the earliest sign) |
| Recent respiratory or GI illness GBS | Weakness without atrophy indicates recent axonal neuropathy or isolated demyelinating disease |
| Respiratory difficulties GBS | Marked atrophy indicates severe axonal damage |
| Autonomic symptoms GBS, porphyria | Decreased reflexes often present (except when only small sensory fibers are involved) |
| Colicky abdominal pain, encephalopathy | |
| Porphyria | |
The hospitalist should be able to classify the distribution as a mononeuropathy (involving a single nerve), a polyneuropathy (symmetric involvement of multiple nerves), or a mononeuropathy multiplex (asymmetric involvement of multiple nerves). Multifocal and proximal symmetric neuropathies commonly merit urgent evaluation.
The most devastating polyneuropathy is Guillan‐Barr syndrome, which can be fatal but is often reversible with early plasmapheresis. Vasculitis is another potentially treatable diagnosis that is critical to establish early; it most often presents as a mononeuropathy multiplex. Ischemic and traumatic mononeuropathies may be overshadowed by other illnesses and injuries, but finding these early can result in dramatically improved patient outcomes.
Step 3
Inpatient electrodiagnostic testing and neurology consultation should be ordered for any neuropathy with rapid onset, progression or severe symptoms or any neuropathy following one of the patterns described above. Electrodiagnostic testing characterizes the pathologic cause of the neuropathy as axonal, demyelinating, or mixed. It also assesses severity, chronicity, location, and symmetry of the neuropathy.15 It is imperative to have localized the neuropathy by history and examination prior to electrodiagnostic evaluation to ensure that the involved nerves are tested.
Step 4
Focused, further testing may be ordered more efficiently subsequent to the above data collection. Directed laboratory examination should be performed when indicated rather than cast as an initial broad diagnostic net. Ultrasound, magnetic resonance imaging (MRI), computed tomographypositron emission tomography (CT‐PET), and nerve biopsy are diagnostic modalities available to the clinician. In general, nerve biopsy should be reserved for suspected vasculitis, sarcoidosis, lymphoma, leprosy, or amyloidosis.
In summary, symptoms and signs of multifocal or proximal nerve involvement, acute onset, or rapid progression demand immediate diagnostic attention. Pattern recognition and a systematic approach expedite the diagnostic process, focusing necessary testing and decreasing overall cost. Focused steps in a systematic approach include: (1) delineating timing and onset of symptoms; (2) localizing and classifying the neuropathy; (3) obtaining electrodiagnostic testing and neurology consultation; and (4) further testing as directed by the preceding steps. Early diagnosis of acute peripheral neuropathies can lead to life‐saving or limb‐saving therapy.
- .An approach to the evaluation of peripheral neuropathies.Semin Neurol.2005;25:153–159.
- .Peripheral neuropathy.BMJ.2002;324:466–469.
- .Pinpointing peripheral neuropathies.Practitioner.2007;251:67–68,71–74,6–7 passim.
- .The evaluation of peripheral neuropathy. Part I: Clinical and laboratory evidence.Rev Neurol Dis.2004;1:133–140.
- ,.Evaluating the patient with peripheral nervous system complaints.J Am Osteopath Assoc.2005;105:71–83.
- ,,.An easy approach to evaluating peripheral neuropathy.J Fam Pract.2006;55:853–861.
- ,.Peripheral neuropathy.Lancet.2004;363:2151–2161.
- .Evaluating patients with suspected peripheral neuropathy: do the right thing, not everything.Muscle Nerve.2002;26:288–290.
- ,.A rational diagnostic approach to peripheral neuropathy.J Clin Neuromuscul Dis.2003;4:190–198.
- .Peripheral nerve disorders.Prim Care.2004;31:67–83.
- ,.Toward an efficient method to evaluate peripheral neuropathies.J Clin Neuromuscul Dis.2002;3:172–182.
- .Peripheral neuropathies in clinical practice.Med Clin North Am.2003;87:697–724.
- .The evaluation of peripheral neuropathy. Part II: Identifying common clinical syndromes.Rev Neurol Dis.2004;1:190–201.
- .Acute generalized weakness due to thyrotoxic periodic paralysis.CMAJ.2005;172:471–472.
- ,.Electrodiagnostic testing of nerves and muscles: when, why, and how to order.Cleve Clin J Med.2005;72:37–48.

Male with Arthritis and Scaly Skin Rash
A 32‐year‐old male presented to the emergency department complaining of pain and swelling in the right knee and left hand, along with a skin rash on both feet. He denied any fever or recent history of travel. Symptoms started 1 week before presentation. Recent medical history was significant for Chlamydia trachomatis urethritis 10 weeks prior, which had been successfully treated.
Physical examination revealed right knee effusion, dactylitis manifested by both swelling of the digits of the left hand and finger‐tip ulcerations (Figure 1), as well as hyperkeratotic plaques with erythematous bases on the soles of both feet, consistent with keratoderma blenorrhagica (Figure 2). Furthermore, scaly erythematous lesions over the penis and the scrotum were recognized, indicating circinate balanitis (Figure 3).


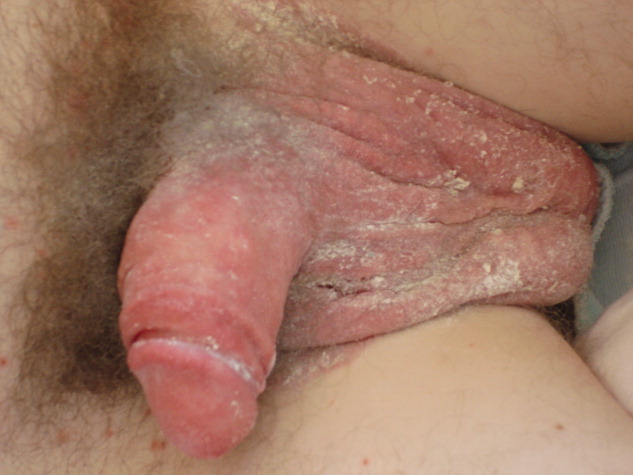
Laboratory tests including human immunodeficiency virus (HIV) were unremarkable aside from an elevated sedimentation rate and positive human leukocyte antigen (HLA)‐B27.
The patient was diagnosed with reactive arthritis (Reiter's syndrome). A treatment regimen was initiated consisting of nonsteroidal antiinflammatory drugs (NSAIDs), prednisone, and sulfasalazine. Close outpatient follow‐up was established. Four months later, the patient remained debilitated by the disease, and etanercept was added resulting in significant improvement.
Reactive arthritis, also known as Reiter's syndrome, is an autoimmune disease that usually develops 2 to 4 weeks after a genitourinary or gastrointestinal infection. The classic triad of arthritis, urethritis, and conjunctivitis does not occur in all patients. Diagnosis is made by medical history and clinical findings. Numerous therapeutic modalities have been used with variable success, including short‐term antibiotics, NSAIDs, systemic corticosteroids, sulfasalazine, methotrexate, cyclosporine, etretinate, and tumor‐necrosis factor (TNF) inhibitors.
A 32‐year‐old male presented to the emergency department complaining of pain and swelling in the right knee and left hand, along with a skin rash on both feet. He denied any fever or recent history of travel. Symptoms started 1 week before presentation. Recent medical history was significant for Chlamydia trachomatis urethritis 10 weeks prior, which had been successfully treated.
Physical examination revealed right knee effusion, dactylitis manifested by both swelling of the digits of the left hand and finger‐tip ulcerations (Figure 1), as well as hyperkeratotic plaques with erythematous bases on the soles of both feet, consistent with keratoderma blenorrhagica (Figure 2). Furthermore, scaly erythematous lesions over the penis and the scrotum were recognized, indicating circinate balanitis (Figure 3).
Laboratory tests including human immunodeficiency virus (HIV) were unremarkable aside from an elevated sedimentation rate and positive human leukocyte antigen (HLA)‐B27.
The patient was diagnosed with reactive arthritis (Reiter's syndrome). A treatment regimen was initiated consisting of nonsteroidal antiinflammatory drugs (NSAIDs), prednisone, and sulfasalazine. Close outpatient follow‐up was established. Four months later, the patient remained debilitated by the disease, and etanercept was added resulting in significant improvement.
Reactive arthritis, also known as Reiter's syndrome, is an autoimmune disease that usually develops 2 to 4 weeks after a genitourinary or gastrointestinal infection. The classic triad of arthritis, urethritis, and conjunctivitis does not occur in all patients. Diagnosis is made by medical history and clinical findings. Numerous therapeutic modalities have been used with variable success, including short‐term antibiotics, NSAIDs, systemic corticosteroids, sulfasalazine, methotrexate, cyclosporine, etretinate, and tumor‐necrosis factor (TNF) inhibitors.
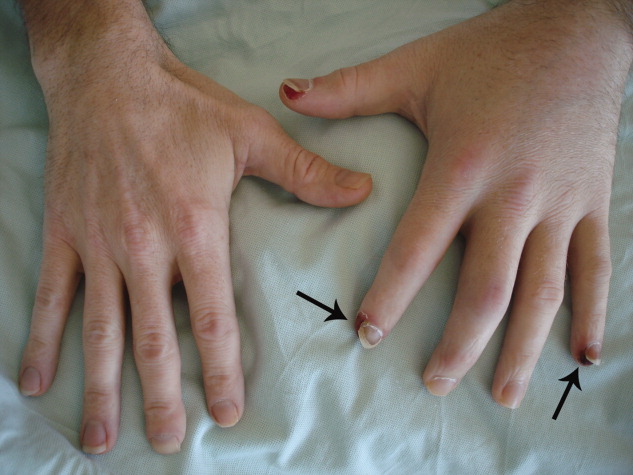
New Initiative: Defibrillator Delays
A new report that hints stress factors like case volume and academic status of a hospital do not explain the wide disparities in defibrillation response times in hospitals has at least one hospitalist convinced HM leaders can help solve the problem.
Traditional hospital pressures do not predict whether patients with cardiac arrest are likely to experience delays in receiving defibrillation, according to a July 27 report in the Archives of Internal Medicine (2009;169(14):1260-1261). Such factors as the number of beds and where the cardiac unit was located were found to have more impact, the study found.
“This is a very simple thing,” says hospitalist Jason Persoff, MD, FHM, assistant professor of medicine at the Mayo Clinic in Jacksonville, Fla. "What are the barriers to shocking the patient? This doesn’t require huge committees. The question is, 'Why isn’t this happening?' … This paper is a call to arms."
According to the study, rates of delayed defibrillation, which were defined as longer than the two-minute standard, ranged from 2.4% to 50.9%. The authors state that standardizing defibrillation times to meet the two-minute standard set by the American Hospital Association could be a quality initiative focus for HM groups.
“Now that we’ve identified the problem, that helps us identify how to move forward,” Dr. Persoff says. “We are in dire need of improving our system when it comes to cardiac care. The hospitalists are in the best position to do that because we are able to work closest with the nurses.”
Jane Kelly-Cummings, RN, CPHQ, SHM's senior director of quality initiatives, agrees there is room for improvement in the survival rate of in-hospital cardiac patients. "In order to make those improvements, hospitals will need to make changes to their cardiac resuscitation processes and procedures," she says. "Hospitalists are integral and central players on cardiac resuscitation teams at a great majority of hospitals with hospital medicine programs. They act as change agents at these and many other facilities."
For more information on HM's role in cardiac resuscitation of hospitalized patients, visit the Emergency Procedures section of the "Core Competencies in Hospital Medicine."a
In the Lit: Research You Need to Know
Clinical question: Does tailoring the duration of anticoagulation based on the persistence of residual thrombus following conventional duration therapy reduce rates of recurrent venous thromboembolism (VTE) in adults with proximal deep-venous thrombosis (DVT)?
Background: The optimal duration of oral anticoagulation therapy in adults with proximal DVT remains uncertain. This study was designed to ascertain if tailoring the duration of therapy based on ultrasonographic findings improves outcomes through a reduction in recurrent VTE.
Study design: Parallel, open-label, randomized trial with independent and blinded assessment of study outcomes.
Setting: Nine university and hospital centers in Italy.
Synopsis: Five hundred thirty-eight patients with proximal DVT who completed three months of anticoagulation were randomly assigned to fixed-duration or flexible-duration therapy. Patients in the fixed-duration group with provoked DVT received no further therapy; those with unprovoked DVT received an additional three months of anticoagulation. Patients in the flexible-duration group had no further therapy if ultrasonography demonstrated recanalized veins, and received further therapy (up to nine to 21 months for provoked and unprovoked DVT, respectively) if persistent thrombi were demonstrated. Patients were followed over three years for the primary outcomes of recurrent VTE and major bleeding events.
Significantly fewer recurrent VTE occurred in the ultrasound guided, flexible-duration treatment group (11.9% vs. 17.2%; HR 0.64; 95% CI 0.39 to 0.99). There was no significant difference in major bleeding events between the two groups.
Limitations of this study include the lack of a double-blind design and the relatively small sample size.
Bottom line: Tailoring the duration of anticoagulation in adults with proximal DVT based on ultrasonographic demonstration of residual thrombi reduces rates of recurrent VTE without increasing major bleeding events.
Citation: Prandoni P, Prins MH, Lensing AW, et al. Residual thrombosis on ultrasonography to guide the duration of anticoagulation in patients with deep venous thrombosis: a randomized trial. Ann Intern Med. 2009;150(9):577-585.
Reviewed for TH eWire by Alexander R. Carbo, MD, FHM; Suzanne Bertisch, MD, MPH; Lauren Doctoroff, MD; John Fani Srour, MD; Caleb Hale, MD; Nancy Torres-Finnerty, MD, FHM, Hospital Medicine Program, Beth Israel Deaconess Medical Center, Boston