User login
The AIDS Divide
This is the second in a two-part series. Part 1 appeared in the July issue, p. 29.
While the HIV/AIDS epidemic rages worldwide—an estimated 40 million people have the virus—the lifespan for many HIV-positive patients in the U.S. continues to improve.
Patients on highly active antiretroviral therapy (HAART) live long enough to develop common age-related illnesses. Those without sufficient resources and/or social supports continue to present with AIDS-defining syndromes seen at the beginning of the epidemic. Hospitalists must face these different populations of HIV/AIDS patients and their unique challenges.
In the second part of our series, we address:
- The ramifications for hospitalists of the Centers for Disease Control and Prevention’s (CDC) revised HIV testing guidelines;
- Challenges specific to managing children with HIV; and
- Ways hospitalists can make a difference with HIV patients through social services collaboration, education, and counseling.
Testing Guidelines Shift
On Sept. 22, 2006, the CDC issued revised recommendations for HIV testing of adults, adolescents, and pregnant women in healthcare settings.1 Testing had previously been recommended only for high-risk individuals, such as injection drug users or those with multiple sex partners. The new recommendations advise testing all individuals 13 through 64 in all healthcare settings. In its rationale for extended testing, the CDC notes that of the 1 million to 1.2 million people thought to be living with HIV in the United States, nearly 25% are unaware of their infected status. Expansion of testing, the CDC argues, would mean earlier access to life-extending treatments and reduced transmission risk.
Expanded testing is a good idea, says Theresa Barton, MD, assistant professor of pediatrics at the University of Texas Southwestern Medical Center in Dallas. Dr. Barton is also a pediatric hospitalist and director of the AIDS Related Medical Services (ARM) Clinic at UT.
“According to the CDC, a large number of newly diagnosed HIV patients have no risk factor at all [other than sexual contact with a partner],” Dr. Barton says. “Many people, particularly heterosexuals, do not perceive having sex as a risk factor. That’s certainly the case for women who are pregnant. They report they have no risk factor when you know they have a risk factor by default because they’re pregnant.”
Testing should be offered to everyone in the hospital, agrees George Mathew, MD, a hospitalist with infectious disease training at Emory University Hospital in Atlanta, and instructor of medicine at Emory University Medical School. However, testing everyone who comes to the hospital may be impractical for two reasons, he believes:
- Hospitalists feel time constraints with other components of diagnosing and admitting patients; and
- Hospitalists will not be impelled to offer patients routine HIV testing unless it is mandated by the Joint Commission on Accreditation of Healthcare Organizations (JCAHO) as a core measure.
“Hospitalists will need help [from their institutions] in the introduction of this recommendation, maybe as an inclusion on a general admission form or as a prompt during computerized physician order entry (CPOE),” Dr. Mathew says.
Until universal testing of all inpatients is instituted, it is still advisable for hospitalists to include HIV testing in the diagnostic workup. Neil Winawer, MD, director of the hospitalist program at Grady Memorial, one of Emory University’s affiliated hospitals in Atlanta, advises that hospitalists “should always keep the diagnosis of HIV and AIDS on their radar screen in this day and age. There can be certain things in a patient’s profile that trigger you to think about testing for HIV, such as lymphopenia, recurrent infections, subtle evidence of weight loss, or alopecia.”

Hospitalists should also heed how they introduce the need for the test. “To be honest, I think in many ways we have made the testing process too scary,” says Dr. Barton. She believes patients and their families may become unduly alarmed because of the emphasis on informed consent, as well as the secrecy of results. Her approach with families in the hospital or at the clinic is to tell parents she wants to do an HIV test to “make sure that every stone is uncovered” in making a diagnosis. “We should all do our best to explain to families what our plan is or what kind of testing we will be doing, whether it’s an HIV test or not,” she says.
Dr. Barton also cautions pediatric hospitalist colleagues to be sensitive to parents’ wishes when a diagnostic work-up includes a CD4 count or HIV test. If the child has been seen in an outpatient setting, it is possible the parents have not yet told their child that he or she is HIV-infected. “Try to be cognizant of the parents’ involvement and wishes,” she advises. “To have a perfect stranger [the hospitalist] tell you that you’re HIV-infected can be shocking.”

HIV in Children
The numbers of children with HIV in the United States tend to be small in comparison with the world’s estimated 2.5 million children under 15 living with the virus. From the start of the epidemic until 2002, 9,300 U.S. children under 13 had been reported to the CDC as living with HIV/AIDS. The majority of those children acquired the virus from their mothers before or during birth or through breast-feeding.
Most cases of HIV infection in infants are diagnosed at birth, according to Dr. Barton. With the advent of AZT (zidovudine) and HAART, only 92 new cases of pediatric AIDS were reported in 2002. The patterns of pediatric HIV/AIDS rates parallel those in adult groups: rates are higher among minority and economically disadvantaged inner-city populations.2
As with adult HIV populations, healthy children with HIV do not often present in the hospital setting because their condition is well controlled. However, Dr. Barton is seeing teenagers with acute retroviral syndrome—which occurs in those recently infected—and immigrant children with HIV-related diseases. The latter group, she says, do not have access to ongoing outpatient care, and their disease has gone undiagnosed until it brings them to the hospital.
The incidence of opportunistic infections differs in children, where pneumoncystis pneumonia (PCP) and cytomegalovirus (CMV) are primary infections. In adults these diseases usually result from the reactivation of latent infections. Lymphocytic interstitial pneumonitis is more common in children than in adults. Severe candidiasis, a yeast infection, can cause constant diaper rash or manifest as oral thrush.
Dr. Barton emphasizes that pediatric hospitalists should keep a low threshold for thinking about HIV when diagnosing children. Possible reasons to test for HIV include:
- Failure to thrive;
- Delayed developmental milestones, such as crawling, walking, and talking;
- Severe presentation of common illnesses, such as diarrhea;
- Chronic appearance of common illnesses, such as colds; and
- Seizures, fever, dehydration, and pneumonia.
Finding appropriate drug regimens for children with HIV can be even more of a challenge than for adult HIV patients. Children with HIV are treated with HAART. Many drugs approved for adults are not available in liquid form for younger children. Even if children can swallow pills, the dose may be too high for them. HAART in the pediatric setting also carries risks of multiple toxicities and drug resistance.
Drug interactions become a factor when, as is common, children develop seizures, says Dr. Barton. “It’s sometimes difficult to find drugs that don’t have a lot of interactions, so obtaining the advice of the pharmacist is really crucial,” she says.
Adolescents are a particularly troublesome subset of growing HIV cases. “By nature of their being adolescents, they do not routinely access care,” notes Dr. Barton. “There is a long window of time—often many years—before a patient becomes symptomatic, so they may not present until they are severely ill.”

Inpatient Management
If and how hospitalists interact with HIV/AIDS patients depends on their institution’s resources, catchment area, and formal affiliations with teaching hospitals. Tomas Villanueva, DO, is a hospitalist at Baptist Hospital of Miami, a 650-bed not-for-profit hospital in South Florida.
“I’m one of those very spoiled hospitalists because I have everything and everybody available to me,” he says. “I have the good fortune to work with infectious disease doctors and with clinical pharmacologists.” Access to these consultants, he says, helps with admitting HIV patients taking antiretrovirals, especially when withdrawing oral nutrition is indicated.
“Atlanta has a large HIV-positive population,” notes Dr. Mathew. As in many U.S. urban centers, patients in Atlanta often present with opportunistic infections and end-stage AIDS. Dr. Mathew advises hospitalists to consult with the infectious disease specialist when HIV/AIDS patients are admitted. “You call the nephrologist when you have an end-stage renal disease patient, so you should call the ID [infectious disease] specialist when you have an HIV patient,” he says. “There are multiple presentations of antiretroviral toxicities, which most hospitalists do not know how to handle. Yet it is also not advisable to take them off their HAART presumptuously.” Dr. Mathew also observes that many HIV patients consider ID specialists their primary care providers, so it is important to respect that bond while patients are in the hospital.

Accessing the expertise of ID specialists who work on the teaching service can help hospitalists stay abreast of treatment trends, notes Dr. Winawer. Because of Grady Memorial’s affiliation with Emory University, house staff can access the expertise of the university’s world-renowned ID program through the teaching service. As a result, house staff are more aware of issues related to treating HIV/AIDS, he says.
Hospitalists likely will not be the lead physicians for managing HIV/AIDS patients once admitted, especially if their institutions are affiliated with university teaching hospitals. However, hospitalists can still have an impact on providing essential public health messages and improving the quality of care. HIV and ID specialist Harry Hollander, MD, program director for the University of California at San Francisco Internal Medicine Residency Program and professor of Clinical Medicine at UCSF, notes that hospitalists can play a reinforcing role by educating patients to modify risk behaviors. For instance, he says, “If patients are admitted with complications of risk behaviors that may be associated with HIV infection—such as sexually transmitted infections, or medical problems related to injection drug use—addressing those issues becomes as important as imparting a smoking cessation message to someone who comes in with pneumonia or pulmonary problems.”
Emphasizing links to care is another key role for hospitalists. At Grady, reports Dr. Winawer, at least 60 inpatients with HIV/AIDS are being treated at any given time by the four immunology service teams run by the Department of Infectious Diseases, as well as 12 ward teams and four ICU teams.
Most indigent patients do not have strong social support, so Dr. Winawer emphasizes how hospitalists can provide compassionate care by collaborating with social workers. For example, HIV patients admitted to the hospital with respiratory illnesses might be placed in isolation to rule out tuberculosis. “Many times these patients do not have good family or other social support, and they are left in their room to dwell on their diagnosis. It can feel very isolating and demoralizing if they do not have knowledge of services that can be offered to them. So it is critical to involve social services at that time.”
Make a Difference at Discharge
Can hospitalists do a better job of acquainting themselves with community resources available to discharged patients? Dr. Mathew believes so but concedes hospitalists may not have the time. He notes that funding for HIV/AIDS outpatient clinics is at an all-time high, and social workers are expert in linking patients with outside resources.
Social workers at [an] ID clinic, he said, “are very, very attentive to the needs of their patients.”
Strong alliances with social workers are critical for hospitalists who see large numbers of indigent HIV/AIDS patients, says Dr. Winawer. “These patients often use the hospital as their primary care center,” he notes. “So the inpatient social workers know them better than their colleagues in the ID clinic do. A lot of the ‘bounce-backs’ we see are related to non-compliance [with therapy regimens], to substance abuse, or to other issues related to housing and environments that are not conducive to taking their medications.
“There are a lot of factors that cause our patients to not receive the best care upon their discharge. From my perspective as a hospitalist, once they no longer have criteria for hospitalization, much depends on patients’ willingness to do the things that you try to promote. Social services can play a big part so that [patients] don’t fall through the cracks due to their inability to afford medication or proper housing. From our experience, a highly functional network of social support is critical.”
Any encounter with the healthcare system is an opportunity for education. Dr. Villanueva includes education as one of his primary roles in dealing with HIV-positive patients. “I’m working now not only on education, but communication,” he says. “We pretty much have to be the physician champions in making sure we communicate with all parties.” TH
References
- Revised recommendations for HIV testing of adults, adolescents and pregnant women in health-care settings. Morbidity and Mortality Weekly Report, September 22, 2006/ 55(RR14); 1-17. Available online at www.cdc.gov/mmwr/preview/mmwrhtml/rr5514a1.htm. Last accessed April 27, 2007.
- HIV infection in infants and children. National Institute of Allergy and Infectious Diseases Fact Sheet, July 2004. Available at www.niaid.nih.gov/factsheets/hivchildren.htm. Last accessed May 22, 2007.
This is the second in a two-part series. Part 1 appeared in the July issue, p. 29.
While the HIV/AIDS epidemic rages worldwide—an estimated 40 million people have the virus—the lifespan for many HIV-positive patients in the U.S. continues to improve.
Patients on highly active antiretroviral therapy (HAART) live long enough to develop common age-related illnesses. Those without sufficient resources and/or social supports continue to present with AIDS-defining syndromes seen at the beginning of the epidemic. Hospitalists must face these different populations of HIV/AIDS patients and their unique challenges.
In the second part of our series, we address:
- The ramifications for hospitalists of the Centers for Disease Control and Prevention’s (CDC) revised HIV testing guidelines;
- Challenges specific to managing children with HIV; and
- Ways hospitalists can make a difference with HIV patients through social services collaboration, education, and counseling.
Testing Guidelines Shift
On Sept. 22, 2006, the CDC issued revised recommendations for HIV testing of adults, adolescents, and pregnant women in healthcare settings.1 Testing had previously been recommended only for high-risk individuals, such as injection drug users or those with multiple sex partners. The new recommendations advise testing all individuals 13 through 64 in all healthcare settings. In its rationale for extended testing, the CDC notes that of the 1 million to 1.2 million people thought to be living with HIV in the United States, nearly 25% are unaware of their infected status. Expansion of testing, the CDC argues, would mean earlier access to life-extending treatments and reduced transmission risk.
Expanded testing is a good idea, says Theresa Barton, MD, assistant professor of pediatrics at the University of Texas Southwestern Medical Center in Dallas. Dr. Barton is also a pediatric hospitalist and director of the AIDS Related Medical Services (ARM) Clinic at UT.
“According to the CDC, a large number of newly diagnosed HIV patients have no risk factor at all [other than sexual contact with a partner],” Dr. Barton says. “Many people, particularly heterosexuals, do not perceive having sex as a risk factor. That’s certainly the case for women who are pregnant. They report they have no risk factor when you know they have a risk factor by default because they’re pregnant.”
Testing should be offered to everyone in the hospital, agrees George Mathew, MD, a hospitalist with infectious disease training at Emory University Hospital in Atlanta, and instructor of medicine at Emory University Medical School. However, testing everyone who comes to the hospital may be impractical for two reasons, he believes:
- Hospitalists feel time constraints with other components of diagnosing and admitting patients; and
- Hospitalists will not be impelled to offer patients routine HIV testing unless it is mandated by the Joint Commission on Accreditation of Healthcare Organizations (JCAHO) as a core measure.
“Hospitalists will need help [from their institutions] in the introduction of this recommendation, maybe as an inclusion on a general admission form or as a prompt during computerized physician order entry (CPOE),” Dr. Mathew says.
Until universal testing of all inpatients is instituted, it is still advisable for hospitalists to include HIV testing in the diagnostic workup. Neil Winawer, MD, director of the hospitalist program at Grady Memorial, one of Emory University’s affiliated hospitals in Atlanta, advises that hospitalists “should always keep the diagnosis of HIV and AIDS on their radar screen in this day and age. There can be certain things in a patient’s profile that trigger you to think about testing for HIV, such as lymphopenia, recurrent infections, subtle evidence of weight loss, or alopecia.”
Hospitalists should also heed how they introduce the need for the test. “To be honest, I think in many ways we have made the testing process too scary,” says Dr. Barton. She believes patients and their families may become unduly alarmed because of the emphasis on informed consent, as well as the secrecy of results. Her approach with families in the hospital or at the clinic is to tell parents she wants to do an HIV test to “make sure that every stone is uncovered” in making a diagnosis. “We should all do our best to explain to families what our plan is or what kind of testing we will be doing, whether it’s an HIV test or not,” she says.
Dr. Barton also cautions pediatric hospitalist colleagues to be sensitive to parents’ wishes when a diagnostic work-up includes a CD4 count or HIV test. If the child has been seen in an outpatient setting, it is possible the parents have not yet told their child that he or she is HIV-infected. “Try to be cognizant of the parents’ involvement and wishes,” she advises. “To have a perfect stranger [the hospitalist] tell you that you’re HIV-infected can be shocking.”
HIV in Children
The numbers of children with HIV in the United States tend to be small in comparison with the world’s estimated 2.5 million children under 15 living with the virus. From the start of the epidemic until 2002, 9,300 U.S. children under 13 had been reported to the CDC as living with HIV/AIDS. The majority of those children acquired the virus from their mothers before or during birth or through breast-feeding.
Most cases of HIV infection in infants are diagnosed at birth, according to Dr. Barton. With the advent of AZT (zidovudine) and HAART, only 92 new cases of pediatric AIDS were reported in 2002. The patterns of pediatric HIV/AIDS rates parallel those in adult groups: rates are higher among minority and economically disadvantaged inner-city populations.2
As with adult HIV populations, healthy children with HIV do not often present in the hospital setting because their condition is well controlled. However, Dr. Barton is seeing teenagers with acute retroviral syndrome—which occurs in those recently infected—and immigrant children with HIV-related diseases. The latter group, she says, do not have access to ongoing outpatient care, and their disease has gone undiagnosed until it brings them to the hospital.
The incidence of opportunistic infections differs in children, where pneumoncystis pneumonia (PCP) and cytomegalovirus (CMV) are primary infections. In adults these diseases usually result from the reactivation of latent infections. Lymphocytic interstitial pneumonitis is more common in children than in adults. Severe candidiasis, a yeast infection, can cause constant diaper rash or manifest as oral thrush.
Dr. Barton emphasizes that pediatric hospitalists should keep a low threshold for thinking about HIV when diagnosing children. Possible reasons to test for HIV include:
- Failure to thrive;
- Delayed developmental milestones, such as crawling, walking, and talking;
- Severe presentation of common illnesses, such as diarrhea;
- Chronic appearance of common illnesses, such as colds; and
- Seizures, fever, dehydration, and pneumonia.
Finding appropriate drug regimens for children with HIV can be even more of a challenge than for adult HIV patients. Children with HIV are treated with HAART. Many drugs approved for adults are not available in liquid form for younger children. Even if children can swallow pills, the dose may be too high for them. HAART in the pediatric setting also carries risks of multiple toxicities and drug resistance.
Drug interactions become a factor when, as is common, children develop seizures, says Dr. Barton. “It’s sometimes difficult to find drugs that don’t have a lot of interactions, so obtaining the advice of the pharmacist is really crucial,” she says.
Adolescents are a particularly troublesome subset of growing HIV cases. “By nature of their being adolescents, they do not routinely access care,” notes Dr. Barton. “There is a long window of time—often many years—before a patient becomes symptomatic, so they may not present until they are severely ill.”
Inpatient Management
If and how hospitalists interact with HIV/AIDS patients depends on their institution’s resources, catchment area, and formal affiliations with teaching hospitals. Tomas Villanueva, DO, is a hospitalist at Baptist Hospital of Miami, a 650-bed not-for-profit hospital in South Florida.
“I’m one of those very spoiled hospitalists because I have everything and everybody available to me,” he says. “I have the good fortune to work with infectious disease doctors and with clinical pharmacologists.” Access to these consultants, he says, helps with admitting HIV patients taking antiretrovirals, especially when withdrawing oral nutrition is indicated.
“Atlanta has a large HIV-positive population,” notes Dr. Mathew. As in many U.S. urban centers, patients in Atlanta often present with opportunistic infections and end-stage AIDS. Dr. Mathew advises hospitalists to consult with the infectious disease specialist when HIV/AIDS patients are admitted. “You call the nephrologist when you have an end-stage renal disease patient, so you should call the ID [infectious disease] specialist when you have an HIV patient,” he says. “There are multiple presentations of antiretroviral toxicities, which most hospitalists do not know how to handle. Yet it is also not advisable to take them off their HAART presumptuously.” Dr. Mathew also observes that many HIV patients consider ID specialists their primary care providers, so it is important to respect that bond while patients are in the hospital.
Accessing the expertise of ID specialists who work on the teaching service can help hospitalists stay abreast of treatment trends, notes Dr. Winawer. Because of Grady Memorial’s affiliation with Emory University, house staff can access the expertise of the university’s world-renowned ID program through the teaching service. As a result, house staff are more aware of issues related to treating HIV/AIDS, he says.
Hospitalists likely will not be the lead physicians for managing HIV/AIDS patients once admitted, especially if their institutions are affiliated with university teaching hospitals. However, hospitalists can still have an impact on providing essential public health messages and improving the quality of care. HIV and ID specialist Harry Hollander, MD, program director for the University of California at San Francisco Internal Medicine Residency Program and professor of Clinical Medicine at UCSF, notes that hospitalists can play a reinforcing role by educating patients to modify risk behaviors. For instance, he says, “If patients are admitted with complications of risk behaviors that may be associated with HIV infection—such as sexually transmitted infections, or medical problems related to injection drug use—addressing those issues becomes as important as imparting a smoking cessation message to someone who comes in with pneumonia or pulmonary problems.”
Emphasizing links to care is another key role for hospitalists. At Grady, reports Dr. Winawer, at least 60 inpatients with HIV/AIDS are being treated at any given time by the four immunology service teams run by the Department of Infectious Diseases, as well as 12 ward teams and four ICU teams.
Most indigent patients do not have strong social support, so Dr. Winawer emphasizes how hospitalists can provide compassionate care by collaborating with social workers. For example, HIV patients admitted to the hospital with respiratory illnesses might be placed in isolation to rule out tuberculosis. “Many times these patients do not have good family or other social support, and they are left in their room to dwell on their diagnosis. It can feel very isolating and demoralizing if they do not have knowledge of services that can be offered to them. So it is critical to involve social services at that time.”
Make a Difference at Discharge
Can hospitalists do a better job of acquainting themselves with community resources available to discharged patients? Dr. Mathew believes so but concedes hospitalists may not have the time. He notes that funding for HIV/AIDS outpatient clinics is at an all-time high, and social workers are expert in linking patients with outside resources.
Social workers at [an] ID clinic, he said, “are very, very attentive to the needs of their patients.”
Strong alliances with social workers are critical for hospitalists who see large numbers of indigent HIV/AIDS patients, says Dr. Winawer. “These patients often use the hospital as their primary care center,” he notes. “So the inpatient social workers know them better than their colleagues in the ID clinic do. A lot of the ‘bounce-backs’ we see are related to non-compliance [with therapy regimens], to substance abuse, or to other issues related to housing and environments that are not conducive to taking their medications.
“There are a lot of factors that cause our patients to not receive the best care upon their discharge. From my perspective as a hospitalist, once they no longer have criteria for hospitalization, much depends on patients’ willingness to do the things that you try to promote. Social services can play a big part so that [patients] don’t fall through the cracks due to their inability to afford medication or proper housing. From our experience, a highly functional network of social support is critical.”
Any encounter with the healthcare system is an opportunity for education. Dr. Villanueva includes education as one of his primary roles in dealing with HIV-positive patients. “I’m working now not only on education, but communication,” he says. “We pretty much have to be the physician champions in making sure we communicate with all parties.” TH
References
- Revised recommendations for HIV testing of adults, adolescents and pregnant women in health-care settings. Morbidity and Mortality Weekly Report, September 22, 2006/ 55(RR14); 1-17. Available online at www.cdc.gov/mmwr/preview/mmwrhtml/rr5514a1.htm. Last accessed April 27, 2007.
- HIV infection in infants and children. National Institute of Allergy and Infectious Diseases Fact Sheet, July 2004. Available at www.niaid.nih.gov/factsheets/hivchildren.htm. Last accessed May 22, 2007.
The Gray Zone
In part 1 of this two-part series (July 2007, p. 16), hospitalists and emergency medicine physicians expressed their views on the relationship between their two specialties. In part 2, we look at how those relationships intersect—and what issues are at stake when they do.
One area where there is a bit of overlap between hospital medicine and emergency medicine is observational medicine,” says James W. Hoekstra, MD, professor and chairman, Department of Emergency Medicine, Wake Forest University Health Sciences Center, Winston-Salem, N.C.
Those patients who require a short stay for observation, he says, are neither in the ED or admitted to the hospital—they are in a zone of their own.
“That’s a gray zone in terms of who takes care of those patients,” he says, “and it depends on the hospital. It will be interesting to see how that works out, or whether that is ever worked out. It may just stay a shared area.”
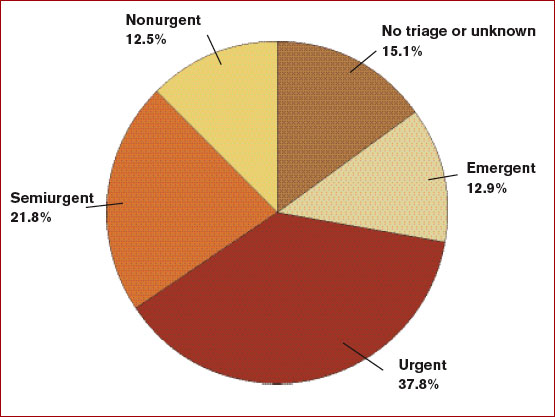
The observation conundrum is complicated by the fact that many people use emergency departments for primary care. (See Figure 1, p. 33) “ True emergencies make up only some of the patient [cases] in the ED,” says Debra L. Burgy, MD, a hospitalist at Abbott Northwestern Hospital in Minneapolis. “We do have a 23-hour observation unit of 10 beds, and, frankly, could use 10 more to [handle unpredictable volumes of patients and insufficient support staff. That unit] has certainly helped to alleviate unnecessary admissions.”
Collaboration between hospitalists and emergency medicine physicians happens a number of ways at the University of Colorado at Denver and Health Sciences Center, where Jeff Glasheen, MD, is director of both the hospital medicine program and inpatient clinical services in the department of medicine.
“One way we work closely with the ED—because we think it is the right thing to do—is by building a much more comprehensive observation unit,” Dr. Glasheen says. “In some settings the observation unit lives in the ED and is run by the ED and in others, it is run by hospitalists. The hospitalists [here] will now run the unit, but we want to help solve some of the ED’s throughput issues.”
When Dr. Glasheen arrived at his institution, the observation unit was limited to patients with chest pain. “I didn’t understand why we would get chest pain patients through efficiently and not all patients,” he says.
A team that began operating in July will be available for all patients under the admission status of observation. The team will be hospitalist-led and aim to reduce length of stay and increase quality of care for those patients.
“Right now those patients are very scattered throughout the system and they may be [covered by] six to eight different teams,” Dr. Glasheen explains. One team of caregivers will be more efficient and reduce length of stay, he says.
By nurturing their working relationship with the emergency department, hospitalists will be able to more easily say: “We understand that that workup’s not complete, but we also understand that they’re going to come into the hospital and let us know what things need to be done. We’ll be happy to take that patient a little earlier than we did in the past to get them out of the ED.”
That’s a tricky thing to do, he says, “because the benefit to us isn’t huge, we’re self-sacrificing to help the ED, and that’s what I want hospitalist groups nationally to be thinking: how we can make the whole system better and not just make our own job better.”
Dr. Glasheen believes the professional structure in his institution is representative of what other hospitals will function like in the next 10 years.
“You have a backbone structure of basically four types of physicians: emergency medicine docs, hospitalists, intensivists, and a surgical team,” Dr. Glasheen says. “Everyone else, more and more, is serving in a consultative role.” Having that backbone allows you to tackle the issues, which are primarily complex, systems-based issues, he says. “It is no longer [a matter of just] the ED trying to deal with capacity issues. Now they have an ally on the inpatient side.”
An excess of patients for the number of beds means some patients spend a disproportionate amount of their stay in the ED, and that challenges communication and efficiency. “The challenges may be simple things, such as it being harder for a hospitalist to get to the ED to see a patient than it is upstairs,” Dr. Glasheen says. “[Or] it’s harder to decide who really has ownership of that patient.” In his hospital, as soon as a patient is assigned to a hospitalist, the primary responsibility for that patient is seen as the hospitalist’s.
But there are other issues. “Even if we are able to get down [to the ED] and write orders, that is problematic for the ED and the hospitalist; as a hospitalist we don’t have the nurses with staffing ratios and skills in the ED that they have on floors and in the ICU,” says Dr. Glasheen. “It is not always possible to get things done as efficiently as they probably could if the patients were in a proper unit. Locally and globally in my experience, the biggest issue is: How do you take care of these patients who now spend their inpatient stay in the ED?”
Collaborations, Models, and Solutions
A number of hospitalists raise the issue of managing internal medicine residents doing rotations in the ED.
“We were approached recently by the ED because most of our admissions are called in directly to the medical residents,” says Jason R. Orlinick, MD, PhD, head of the section of Hospital Medicine at Norwalk Hospital, Conn. “I think the ED would like to talk directly with the medical attending assuming care for the patient. One of the things we haven’t done well is meet on a regular basis to discuss communication issues.”
The hospitalists and emergency medicine group at Dr. Orlinick’s institution have entertained the idea of setting up a direct triage system whereby medical residents are taken out of the picture. “The emergency medicine docs would page us directly—at least during the busiest hours of the day. Eventually, the hope is to make it a 24-hour, seven-days-a-week, 365 [days-a-year process],” says Dr. Orlinick. By bringing this to the emergency medicine physicians, the intent was to send the message that hospitalists recognize ED overcrowding as an institutional issue and want to improve communication with their ED colleagues to improve patient care.
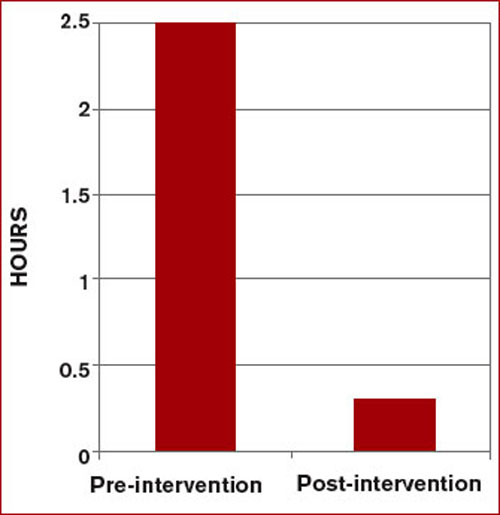
This model, devised at Johns Hopkins Bayview Medical Center in Baltimore, enabled communication between ED doctors and hospitalists, and reduced wait times by more than two hours when a bed was available.2 This triage and direct-admission protocol was not associated with increased mortality and resulted in improved patient and physician satisfaction. (See Figure 2 at right). Once the ED attending decides to admit a patient, direct communication is facilitated with a hospitalist. The approach includes monthly meetings between the department of medicine and the ED to continue to discuss improvements in admissions.
At Norwalk Hospital, the administration asked the hospitalist group to intervene in that throughput process. But Dr. Orlinick, also a clinical instructor of medicine at Yale University in New Haven, Conn., says they’ve hesitated out of sensitivity to their ED colleagues.
“We as a group have really struggled with that concept because [although] we feel like that is something we can do well, this is really within the purview of the emergency medicine docs,” says Dr. Orlinick. Adopting the Johns Hopkins model is a win-win solution where each specialty is providing its best skills to solve mutual issues. “What we can do well is look at the patients … on the floor[s], look at flow through the hospital systems in terms of getting testing; make sure that all that—and consults—happen in a timely manner, and that people leave the hospital when they’ve reached their goals of hospitalization,” he says. “It’s afterload as opposed to preload.”
Hospitalists see committee collaboration as important to solving the complex multidisciplinary systemic issues. Jasen W. Gundersen, MD, participates on a pneumonia task force with several hospitalists, a pulmonologist, and one of the heads of the ED. “We address the whole gamut from when patients come in to when they go through the hospital,” says Dr. Gundersen, head of the Hospital Medicine Division, University of Massachusetts Memorial Medical Center, Worcester. “We can learn from each other as we go through the process.”
Many of the ways hospitalists and ED physicians tackle systems-related issues are new to Dr. Glasheen’s institution because the hospital medicine program was begun in 2004. It is now common to see higher-level leadership from different specialties and areas all in the same room—talking about issues of capacity, for instance. There are also many more instances of hospitalists and ED physicians sitting on the same committees. Further, “It is relatively common for our ED to call our hospitalists to say, ‘Can you help see this patient? I’m not sure what to do,’ or, ‘I’ve got this situation with this patient, this needs to be done and I need help getting that done,’ ” Dr. Glasheen says. Even though he concedes that is more of a workaround as opposed to a solution for a faulty system, it still represents ED physicians and hospitalists co-managing that workaround.
The Future
Because he “sits on both sides of the fence” between emergency medicine and hospital medicine, Dr. Gundersen thinks it is especially important for hospitalists to train in all the different areas—including emergency medicine—when they are medical students and residents.
Emergency medicine physicians Dr. Hoekstra and Benjamin Honigman, MD, professor of surgery and head of the Division of Emergency Medicine at the University of Colorado School of Medicine, Denver, believe hospital medicine will be integral to that training. Dr. Glasheen, also the director of the longest-running internal medicine hospitalist-training program in the U.S., expects greater attention to hospitalist training. “My sense is that many hospitalists groups are in a growth phase and are trying to solve their own problems,” he says. Basically, their primary focus is staffing the hospital with good people and retaining them. He believes that once groups have been around for three to five years, they are more likely to take on bigger issues, such as hospital efficiency and capacity management.
“One of the reasons we started a hospitalist training program is that I didn’t want hospitalists to fall into the same mistakes, barriers, or issues that we’ve had in the past,” Dr. Glasheen says. He fears “this sort of continued balkanization of hospital care, where everyone silos everything out and considers such issues as throughput and ED divert as outside of their [jurisdiction]. I want to get to the place where hospitalists are looking at the whole hospital system and are justly rewarded for that either by financial incentives or time to [work on systemic issues].”
Dr. Glasheen and his team remind themselves of where their commitment resides: “This hospital is where we live—and with everything between the front door to the back door, our primary job is to make this a better place.” TH
Andrea Sattinger is a frequent contributor to The Hospitalist.
References
- Burt CW, McCaig LF. Staffing, capacity, and ambulance diversion in emergency departments: United States, 2003-04. Adv Data; US Department of Health and Human Services, Centers for Disease Control and Prevention, National Center for Health Statistics, Hyattsville, Md. Sept. 27, 2006. Available at: www.cdc.gov/nchs/data/ad/ad376.pdf. Last accessed June 25, 2007.
- Howell EE, Bessman ES, Rubin HR. Hospitalists and an innovative emergency department admission process. J Gen Intern Med. 2004 Mar;19(3):266-268.
In part 1 of this two-part series (July 2007, p. 16), hospitalists and emergency medicine physicians expressed their views on the relationship between their two specialties. In part 2, we look at how those relationships intersect—and what issues are at stake when they do.
One area where there is a bit of overlap between hospital medicine and emergency medicine is observational medicine,” says James W. Hoekstra, MD, professor and chairman, Department of Emergency Medicine, Wake Forest University Health Sciences Center, Winston-Salem, N.C.
Those patients who require a short stay for observation, he says, are neither in the ED or admitted to the hospital—they are in a zone of their own.
“That’s a gray zone in terms of who takes care of those patients,” he says, “and it depends on the hospital. It will be interesting to see how that works out, or whether that is ever worked out. It may just stay a shared area.”
The observation conundrum is complicated by the fact that many people use emergency departments for primary care. (See Figure 1, p. 33) “ True emergencies make up only some of the patient [cases] in the ED,” says Debra L. Burgy, MD, a hospitalist at Abbott Northwestern Hospital in Minneapolis. “We do have a 23-hour observation unit of 10 beds, and, frankly, could use 10 more to [handle unpredictable volumes of patients and insufficient support staff. That unit] has certainly helped to alleviate unnecessary admissions.”
Collaboration between hospitalists and emergency medicine physicians happens a number of ways at the University of Colorado at Denver and Health Sciences Center, where Jeff Glasheen, MD, is director of both the hospital medicine program and inpatient clinical services in the department of medicine.
“One way we work closely with the ED—because we think it is the right thing to do—is by building a much more comprehensive observation unit,” Dr. Glasheen says. “In some settings the observation unit lives in the ED and is run by the ED and in others, it is run by hospitalists. The hospitalists [here] will now run the unit, but we want to help solve some of the ED’s throughput issues.”
When Dr. Glasheen arrived at his institution, the observation unit was limited to patients with chest pain. “I didn’t understand why we would get chest pain patients through efficiently and not all patients,” he says.
A team that began operating in July will be available for all patients under the admission status of observation. The team will be hospitalist-led and aim to reduce length of stay and increase quality of care for those patients.
“Right now those patients are very scattered throughout the system and they may be [covered by] six to eight different teams,” Dr. Glasheen explains. One team of caregivers will be more efficient and reduce length of stay, he says.
By nurturing their working relationship with the emergency department, hospitalists will be able to more easily say: “We understand that that workup’s not complete, but we also understand that they’re going to come into the hospital and let us know what things need to be done. We’ll be happy to take that patient a little earlier than we did in the past to get them out of the ED.”
That’s a tricky thing to do, he says, “because the benefit to us isn’t huge, we’re self-sacrificing to help the ED, and that’s what I want hospitalist groups nationally to be thinking: how we can make the whole system better and not just make our own job better.”
Dr. Glasheen believes the professional structure in his institution is representative of what other hospitals will function like in the next 10 years.
“You have a backbone structure of basically four types of physicians: emergency medicine docs, hospitalists, intensivists, and a surgical team,” Dr. Glasheen says. “Everyone else, more and more, is serving in a consultative role.” Having that backbone allows you to tackle the issues, which are primarily complex, systems-based issues, he says. “It is no longer [a matter of just] the ED trying to deal with capacity issues. Now they have an ally on the inpatient side.”
An excess of patients for the number of beds means some patients spend a disproportionate amount of their stay in the ED, and that challenges communication and efficiency. “The challenges may be simple things, such as it being harder for a hospitalist to get to the ED to see a patient than it is upstairs,” Dr. Glasheen says. “[Or] it’s harder to decide who really has ownership of that patient.” In his hospital, as soon as a patient is assigned to a hospitalist, the primary responsibility for that patient is seen as the hospitalist’s.
But there are other issues. “Even if we are able to get down [to the ED] and write orders, that is problematic for the ED and the hospitalist; as a hospitalist we don’t have the nurses with staffing ratios and skills in the ED that they have on floors and in the ICU,” says Dr. Glasheen. “It is not always possible to get things done as efficiently as they probably could if the patients were in a proper unit. Locally and globally in my experience, the biggest issue is: How do you take care of these patients who now spend their inpatient stay in the ED?”
Collaborations, Models, and Solutions
A number of hospitalists raise the issue of managing internal medicine residents doing rotations in the ED.
“We were approached recently by the ED because most of our admissions are called in directly to the medical residents,” says Jason R. Orlinick, MD, PhD, head of the section of Hospital Medicine at Norwalk Hospital, Conn. “I think the ED would like to talk directly with the medical attending assuming care for the patient. One of the things we haven’t done well is meet on a regular basis to discuss communication issues.”
The hospitalists and emergency medicine group at Dr. Orlinick’s institution have entertained the idea of setting up a direct triage system whereby medical residents are taken out of the picture. “The emergency medicine docs would page us directly—at least during the busiest hours of the day. Eventually, the hope is to make it a 24-hour, seven-days-a-week, 365 [days-a-year process],” says Dr. Orlinick. By bringing this to the emergency medicine physicians, the intent was to send the message that hospitalists recognize ED overcrowding as an institutional issue and want to improve communication with their ED colleagues to improve patient care.
This model, devised at Johns Hopkins Bayview Medical Center in Baltimore, enabled communication between ED doctors and hospitalists, and reduced wait times by more than two hours when a bed was available.2 This triage and direct-admission protocol was not associated with increased mortality and resulted in improved patient and physician satisfaction. (See Figure 2 at right). Once the ED attending decides to admit a patient, direct communication is facilitated with a hospitalist. The approach includes monthly meetings between the department of medicine and the ED to continue to discuss improvements in admissions.
At Norwalk Hospital, the administration asked the hospitalist group to intervene in that throughput process. But Dr. Orlinick, also a clinical instructor of medicine at Yale University in New Haven, Conn., says they’ve hesitated out of sensitivity to their ED colleagues.
“We as a group have really struggled with that concept because [although] we feel like that is something we can do well, this is really within the purview of the emergency medicine docs,” says Dr. Orlinick. Adopting the Johns Hopkins model is a win-win solution where each specialty is providing its best skills to solve mutual issues. “What we can do well is look at the patients … on the floor[s], look at flow through the hospital systems in terms of getting testing; make sure that all that—and consults—happen in a timely manner, and that people leave the hospital when they’ve reached their goals of hospitalization,” he says. “It’s afterload as opposed to preload.”
Hospitalists see committee collaboration as important to solving the complex multidisciplinary systemic issues. Jasen W. Gundersen, MD, participates on a pneumonia task force with several hospitalists, a pulmonologist, and one of the heads of the ED. “We address the whole gamut from when patients come in to when they go through the hospital,” says Dr. Gundersen, head of the Hospital Medicine Division, University of Massachusetts Memorial Medical Center, Worcester. “We can learn from each other as we go through the process.”
Many of the ways hospitalists and ED physicians tackle systems-related issues are new to Dr. Glasheen’s institution because the hospital medicine program was begun in 2004. It is now common to see higher-level leadership from different specialties and areas all in the same room—talking about issues of capacity, for instance. There are also many more instances of hospitalists and ED physicians sitting on the same committees. Further, “It is relatively common for our ED to call our hospitalists to say, ‘Can you help see this patient? I’m not sure what to do,’ or, ‘I’ve got this situation with this patient, this needs to be done and I need help getting that done,’ ” Dr. Glasheen says. Even though he concedes that is more of a workaround as opposed to a solution for a faulty system, it still represents ED physicians and hospitalists co-managing that workaround.
The Future
Because he “sits on both sides of the fence” between emergency medicine and hospital medicine, Dr. Gundersen thinks it is especially important for hospitalists to train in all the different areas—including emergency medicine—when they are medical students and residents.
Emergency medicine physicians Dr. Hoekstra and Benjamin Honigman, MD, professor of surgery and head of the Division of Emergency Medicine at the University of Colorado School of Medicine, Denver, believe hospital medicine will be integral to that training. Dr. Glasheen, also the director of the longest-running internal medicine hospitalist-training program in the U.S., expects greater attention to hospitalist training. “My sense is that many hospitalists groups are in a growth phase and are trying to solve their own problems,” he says. Basically, their primary focus is staffing the hospital with good people and retaining them. He believes that once groups have been around for three to five years, they are more likely to take on bigger issues, such as hospital efficiency and capacity management.
“One of the reasons we started a hospitalist training program is that I didn’t want hospitalists to fall into the same mistakes, barriers, or issues that we’ve had in the past,” Dr. Glasheen says. He fears “this sort of continued balkanization of hospital care, where everyone silos everything out and considers such issues as throughput and ED divert as outside of their [jurisdiction]. I want to get to the place where hospitalists are looking at the whole hospital system and are justly rewarded for that either by financial incentives or time to [work on systemic issues].”
Dr. Glasheen and his team remind themselves of where their commitment resides: “This hospital is where we live—and with everything between the front door to the back door, our primary job is to make this a better place.” TH
Andrea Sattinger is a frequent contributor to The Hospitalist.
References
- Burt CW, McCaig LF. Staffing, capacity, and ambulance diversion in emergency departments: United States, 2003-04. Adv Data; US Department of Health and Human Services, Centers for Disease Control and Prevention, National Center for Health Statistics, Hyattsville, Md. Sept. 27, 2006. Available at: www.cdc.gov/nchs/data/ad/ad376.pdf. Last accessed June 25, 2007.
- Howell EE, Bessman ES, Rubin HR. Hospitalists and an innovative emergency department admission process. J Gen Intern Med. 2004 Mar;19(3):266-268.
QI for Kids
With the current focus in hospital medicine on quality and reporting quality measures, you don’t hear much about pediatric patients. What’s happening with quality and children?
In “Pediatric Hospitalist Quality Forum: Standards, Reporting and Improvement,” Erin Stucky, MD, academic director, Children’s Hospital and Health Center in San Diego, Calif., and Lakshmi Halasyamani, MD, assistant chairperson of the Department of Internal Medicine at St. Joseph Mercy Hospital in Ann Arbor, Mich., provided an overview of what’s happening in pediatric quality of care and strategies for organizational and clinical improvement.

“The pediatric quality landscape is emerging, and you have a tremendous opportunity to help shape that landscape,” Dr. Stucky told the audience of hospitalist-pediatricians.
Dr. Halasyamani provided an overview of national organizations that are implementing quality indicators for hospitalized adult patients, from the Joint Commission on Accreditation of Healthcare Organizations (JCAHO) to the Hospital Quality Alliance to the Institute for Healthcare Improvement. These groups and others have shown some interest in pediatric-specific quality initiatives, but “organizations are trying to coordinate things,” explained Dr. Stucky. “We can’t let the local efforts die while we’re focusing on the national level.”
QI at the Local Level
There are steps a hospitalist can take to improve quality and safety at his or her hospital.
“What can you do?” asked Dr. Halasyamani. The most obvious thing is to continue your education by pursuing CMEs, classes, and workshops in relevant areas. You can improve physician awareness, which forces everyone to look at the bigger picture. But this alone may not change behaviors. At a process and systems level, implementing a multidisciplinary team is a good step. “And you must dispel the myth that to be more effective, it has to be more difficult,” added Dr. Halasyamani.
Elements of success, or sustainability, for a quality improvement (QI) effort include establishing absolute team clarity and unity on goals, ensuring you have the organizational support to eliminate any barriers, and a built-in measurement system for what you’re trying to demonstrate. You’ll need organizational structures for your project to recruit your team, as well as a clear reporting structure. “Make sure the stakeholders are at the table,” advised Dr. Halasyamani.

—Erin Stucky, MD, academic director, Children’s Hospital and Health Center in San Diego
A Case Study
The presenters supplied a local example of a QI initiative hospitalists can follow. Dr. Stucky outlined an asthma QI project her hospitalist-led team had undertaken.
Her team reviews their algorithms every six to 12 months. “Even if review says what we’re doing is good, we still need to look at it and make sure we’re making that decision personally,” explained Dr. Stucky. In looking at the asthma data, the team noticed some pediatric patients were receiving a lot of chest X-rays.
“We looked at our first- and second-quarter data, and compared it to the [Pediatric Health Information System] data,” said Dr. Stucky. “We saw that we ordered chest X-rays at about the national average [on 61% and 62% of eligible patients versus an average of 66%], but is that average a good number?” The team decided to break down the data to see where X-rays were ordered—in the ED and on the ward—and why.
The team mapped a new asthma pathway for the ED based on the end of first-hour events, asthma scores, and medical history. “We decided to involve a respiratory therapist more with decisions on hospital placement” in the ED, said Dr. Stucky. The therapist then drove the protocols for mild, moderate, and severe cases.
The team changed the chest X-ray order set on the ward to read, “Consider ordering CRX if it will affect your treatment plan, and you must check or write the indication if ordering one.”
The result: The percentage of patients with chest X-rays in hospital beds dropped to 55%.
“Performance improvement is here to stay,” pronounced Dr. Stucky. “Leadership in pediatric QI is in our hands.” TH
With the current focus in hospital medicine on quality and reporting quality measures, you don’t hear much about pediatric patients. What’s happening with quality and children?
In “Pediatric Hospitalist Quality Forum: Standards, Reporting and Improvement,” Erin Stucky, MD, academic director, Children’s Hospital and Health Center in San Diego, Calif., and Lakshmi Halasyamani, MD, assistant chairperson of the Department of Internal Medicine at St. Joseph Mercy Hospital in Ann Arbor, Mich., provided an overview of what’s happening in pediatric quality of care and strategies for organizational and clinical improvement.
“The pediatric quality landscape is emerging, and you have a tremendous opportunity to help shape that landscape,” Dr. Stucky told the audience of hospitalist-pediatricians.
Dr. Halasyamani provided an overview of national organizations that are implementing quality indicators for hospitalized adult patients, from the Joint Commission on Accreditation of Healthcare Organizations (JCAHO) to the Hospital Quality Alliance to the Institute for Healthcare Improvement. These groups and others have shown some interest in pediatric-specific quality initiatives, but “organizations are trying to coordinate things,” explained Dr. Stucky. “We can’t let the local efforts die while we’re focusing on the national level.”
QI at the Local Level
There are steps a hospitalist can take to improve quality and safety at his or her hospital.
“What can you do?” asked Dr. Halasyamani. The most obvious thing is to continue your education by pursuing CMEs, classes, and workshops in relevant areas. You can improve physician awareness, which forces everyone to look at the bigger picture. But this alone may not change behaviors. At a process and systems level, implementing a multidisciplinary team is a good step. “And you must dispel the myth that to be more effective, it has to be more difficult,” added Dr. Halasyamani.
Elements of success, or sustainability, for a quality improvement (QI) effort include establishing absolute team clarity and unity on goals, ensuring you have the organizational support to eliminate any barriers, and a built-in measurement system for what you’re trying to demonstrate. You’ll need organizational structures for your project to recruit your team, as well as a clear reporting structure. “Make sure the stakeholders are at the table,” advised Dr. Halasyamani.
—Erin Stucky, MD, academic director, Children’s Hospital and Health Center in San Diego
A Case Study
The presenters supplied a local example of a QI initiative hospitalists can follow. Dr. Stucky outlined an asthma QI project her hospitalist-led team had undertaken.
Her team reviews their algorithms every six to 12 months. “Even if review says what we’re doing is good, we still need to look at it and make sure we’re making that decision personally,” explained Dr. Stucky. In looking at the asthma data, the team noticed some pediatric patients were receiving a lot of chest X-rays.
“We looked at our first- and second-quarter data, and compared it to the [Pediatric Health Information System] data,” said Dr. Stucky. “We saw that we ordered chest X-rays at about the national average [on 61% and 62% of eligible patients versus an average of 66%], but is that average a good number?” The team decided to break down the data to see where X-rays were ordered—in the ED and on the ward—and why.
The team mapped a new asthma pathway for the ED based on the end of first-hour events, asthma scores, and medical history. “We decided to involve a respiratory therapist more with decisions on hospital placement” in the ED, said Dr. Stucky. The therapist then drove the protocols for mild, moderate, and severe cases.
The team changed the chest X-ray order set on the ward to read, “Consider ordering CRX if it will affect your treatment plan, and you must check or write the indication if ordering one.”
The result: The percentage of patients with chest X-rays in hospital beds dropped to 55%.
“Performance improvement is here to stay,” pronounced Dr. Stucky. “Leadership in pediatric QI is in our hands.” TH
Move to the Head of the Class

Moving up the ranks of academic hospital medicine—from instructor to assistant professor, and especially from assistant professor to associate professor—was covered in-depth by professors Scott Flanders, MD, and Sanjay Saint, MD, MPH, of the University of Michigan in Ann Arbor, and Stephan D. Fihn, MD, MPH, head of the Division of General Internal Medicine at the University of Washington, in the session “How to Get Promoted as an Academic Hospitalist.”
Choose a Track
Dr. Flanders said there are several tracks within hospital medicine in academia. They include:
Clinician-Investigator: This is usually a tenure-track position, where 60% to 80% of the hospitalist’s time is protected for research. Usually, you’ll receive at least partial salary support for about three years, after which you’re responsible for finding independent funding to cover most of your salary. Retention and promotion are based on academic productivity including publications, grants, and national recognition.
Clinician-Educator: With approximately 10% to 30% of their time protected for research, these professionals usually get indefinite salary support—although they’re expected to generate most of their salary through clinical work. Retention and promotion are based on teaching accomplishments and clinical skills and, to a lesser extent, academic productivity.
Clinician-Administrator: With anywhere from 10% to 50% of their time protected for administrative work, these experienced hospitalists serve as directors, associate or assistant directors in a hospital medicine group, or in a clerkship role at a university. Retention and promotion are based on administrative skills, teaching prowess, clinical skills, and academic productivity.
Criteria for Promotion
Regardless of which track you’re on, when applying for a promotion you’ll be evaluated in these domains: clinical work, teaching, and administrative and scholarly work.
“These are universal to all institutions,” said Dr. Flanders. “You need to demonstrate excellence in each.” More specifically, you’ll need five to seven letters from impartial faculty outside your institution—preferably leaders in the field who hold at least the rank you are trying to achieve.
“Ask yourself as you get halfway between your associate and assistant professorship,” said Dr. Flanders, “who outside your institution knows you and your work.”
Steps for Promotion
Dr. Flanders offered advice on how to prepare for a successful career in academia.
“It helps if you develop a clinical niche,” he said. “Become the expert in one area in your group or institution.”
He also advised working toward giving clinical lectures to faculty and trainees in other departments, performing grand rounds in other departments, and speaking at neighboring institutions. To establish excellence in teaching, get feedback from students and work on improving your methods. Be innovative in your teaching and document your work in an education portfolio.
When focusing on administrative excellence, if you’re a director or an assistant director of a hospital medicine program, “make substantial contributions,” said Dr. Flanders. “… demonstrate that you’ve done leadership in … QI projects, and that this was important for your institution and more importantly, for other institutions.”
To generate scholarly work, write up your clinical cases as vignettes, case reports, or clinical problem solving; evaluate and disseminate your QI interventions; and establish connections with trained researchers.
“Ultimately, the goal is to have a national reputation,” Dr. Flanders reiterated. “It’s easiest if you’ve got 10 to 12 [articles in] peer-reviewed publications.”
Good Habits
Dr. Saint provided a list of seven habits of highly effective junior faculty members. They include:
- Know the rules. Understand what’s expected of you and the criteria for promotion;
- Develop expertise;
- Learn how to diversify your portfolio. Balance the risk between high-, moderate-, and low-risk projects;
- Find and utilize good mentors and collaborators;
- Quickly demonstrate academic productivity;
- Build a superb team. Hire the right research assistant; and
- Manage your time wisely. Guard your protected time. TH
Say What?
Research—not to mention common sense—shows that good communication between caregivers is essential for patient safety, particularly communication among doctors and nursing staff.
In the session “Nurse-Hospitalist Communication,” presenters Win Whitcomb, MD, Mercy Medical Center in Springfield, Mass., and Sally Szumlas, RN, MS, University of Chicago, each told their side of the story, outlining perceived problems and best practices for clear communications between MDs and RNs.
The RN Perspective
Szumlas began with an overview of the problem. “Nurses, through training, tend to be very descriptive, while MDs want to hear succinct information only,” she said. “This can lead to frustration, missed information, and poor communication.”
At the University of Chicago, a project focused on nurse-physician communications took the following steps to improve communication: The hospital instituted multidisciplinary rounding using the call light—indicating that when the physician reaches the patient’s bedside, he or she pushes the call light and the nurse will join if possible. The hospital also implemented the SBAR form—with sections for the nurse to fill in situation, background, assessment, and recommendations. This form ensures a standardized approach to critical communication, particularly when the nurse phones a physician with questions or patient information.
Szumlas concluded by listing common communication roadblocks, including a misunderstanding of roles, real and perceived power differentials, gender and ethnic differences, and differences in styles of communication.
The Hospitalist’s Viewpoint
Dr. Whitcomb presented the hospitalist’s view of nurse-MD communications, saying, “My sense is that collaborating with nurses is among the most satisfying thing we do.” However, he went on, there are common problems with communications between the two groups. “Interruptions are too frequent,” he pointed out. “We still practice telephone medicine too frequently, and nurses are not always available—they’re busy.”
And the addition of hospitalists has created communication problems that didn’t exist before. These include nurses not knowing which hospitalist to contact, or not being able to reach the hospitalist on duty. Nurses can be stuck bringing a hospitalist who’s starting a new shift up to speed on patients, or placating family members who want to see the unavailable hospitalist immediately.
Dr. Whitcomb offered an action plan hospital medicine programs can implement immediately: He suggested establishing a forum for improving nurse-physician communications, using dialogue, and creating action plans. In addition to this forum, the nurse leader and the hospital medicine director should meet regularly. You should also integrate nursing staff into daily rounds “any way that you can. Interdisciplinary rounds are very difficult,” Dr. Whitcomb admitted. “Everyone is busy.”
Additionally, hospital medicine programs should establish standards for team communication. “Seriously consider a daily goals sheet,” urged Dr. Whitcomb, “one for nurses and hospitalists to use to communicate their plan of care.” Adopt an SBAR tool for critical communications, and create an RN-MD communication log sheet on each patient’s chart. “This can replace the ‘stickies’ I find on the front the chart that aren’t dated or signed,” pointed out Dr. Whitcomb.
Hospitalists can also smooth communication problems by using a concise but detailed patient sign-out at shift changes; and nocturnists should add routine rounds to proactively address issues. Nurses, on the other hand, can help by pooling non-urgent calls during the night and, when appropriate, using text messaging when a quick return call is not critical.
Other basic best practices include distributing the hospitalists’ census to all nursing units by 8 a.m. (as well as to the receptionist), placing the hospitalist schedule at all nursing units, ensuring that day hospitalists leave their beepers on until designated times around the end of their shift, and dedicating a universal pager for rapid responses, codes, emergencies, and coverage questions. TH
Painful Truths
The session “Ethical and Legal Issues around Pain Management in Hospitalized Patients” shed light on issues that many hospitalists are aware of but perhaps not well versed in.
Speaker Vijay Rajput, MD, FACP, associate professor of medicine at the University of Medicine and Dentistry of New Jersey (UMDNJ), Robert Wood Johnson Medical School, and Cooper University Hospital, Camden, N.J., covered the many conflicts surrounding pain management, the law, and your conscience.
Hard Facts
Dr. Rajput shared what he called “hard facts” on pain medication, which include:
- 90% of cancer pain can be controlled with available options;
- 70% of the time chronic, nonmalignant pain is poorly managed, especially in nursing homes;
- 11% of admissions in the emergency department seek treatment for a chronic pain condition;
- 8.2% of, or 19.5 million, Americans use an illicit drug at least once a month; and
- 31.2 million reported non-medical use of pain relievers including hydrocodone (Vicodin), acetaminophen and hydrocodone (Lortab), oxycodone (Percocet), and others.
Dr. Rajput discussed barriers that lead to undertreatment of pain in hospitalized patients.
“There may be prioritization of diagnosis over pain relief by surgical colleagues on hospitalized patients,” he said. “There are also inadequacies in assessing pain, educational deficiencies, and cultural challenges. Some physicians are ruled by regulatory and ethical concerns in prescribing for pain.”
—Vijay Rajput, MD, FACP, associate professor of medicine at University of Medicine and Dentistry of New Jersey (UMDNJ), Robert Wood Johnson Medical School, and Cooper University Hospital, Camden, N.J.
Pain Management and the Law
There are several legal concerns regarding pain management that most physicians are aware of. In addition to liability for repercussions of undermedicating or overmedicating, the failure to refer a patient to a pain management specialist, the use of opioids when caring for end-of-life patients, and failure to get informed consent related to risk of treatment can all mean malpractice suits.
“The general rule for avoiding a malpractice charge is to follow national standards of care and any applicable clinical practice guidelines,” said Dr. Rajput. “There are Web-based databases that serve as national guidelines clearinghouses that you can refer to.”
The Ethical Side of Pain
“There are few common domains of ethical and legal issues in pain relief,” stated Dr. Rajput. These include the pain issues around end-of-life and palliative care of terminally ill patients, a subordination of pain relief to diagnosis, chronic pain issues and substance abuse, pain control in a patient’s transfer to a nursing home, and the risk of discontinuity of pain control after discharge.
“The ethical duty to relieve pain is well established,” Dr. Rajput said. Despite this, it is still common to subordinate pain relief to diagnosis. In 2003, the American Journal of Surgery stated, “Analgesia should be given prior to diagnosis only with the knowledge and consent of the surgeon who assumes the responsibility for decision-making.”
This “decision-making” can affect hospitalists because 86% of ED physicians follow this literature, and 89% of surgeons still prefer to hold the pain medication prior to surgical evaluation.
“Without ongoing education, senior physicians risk providing less, not more, pain control,” Dr. Rajput pointed out. “This will become more critical as we are co-managing more and more surgical patients in hospitals.”
What about End-of-Life Care?
The legal case of Estate of Henry James v. Hilhaven Corp. established that healthcare facilities have a duty to treat pain. However, Dr. Rajput stressed, patients, families, and physicians all remain confused about the role of opioids in caring for dying patients.
Dr. Rajput reviewed two cases where physicians were sued for undertreatment or negligent treatment of pain, and 11 cases where physicians were sued for administering medications that resulted in the deaths of terminally ill patients.
In a criminal prosecution involving the care of the dying, Dr. Rajput explained, the basic elements must be proved: There must be a criminal act, and that act must be intentional. Acts involving terminal pain are not investigated unless a nurse, supervisor, or ethics committee is informed. Nurses are the most common informants.
“Almost all cases are in hospital settings,” said Dr. Rajput. “And there are three major categories: withdrawal of life-sustaining support with accompanying pain meds, the use of opioids and sedations, and terminal care that includes the use of fatal agents such as insulin, potassium chloride, and chloroform.”
In 1997, the Supreme Court endorsed terminal sedation as an alternative to physician-assisted suicide, intensifying the legal debate in the so-called right-to-die controversy.
“Long before the Supreme Court intervention,” said Dr. Rajput, “terminal sedation was a palliative care option to relieve physical or non-physical pain, or to produce an unconscious state before the withdrawal of life support.”
There are clinical safeguards for terminal sedation. These include ensuring the effectiveness of palliative care, obtaining fully informed consent from the patient, maintaining diagnostic and prognostic clarity with respect to the patient’s disease and lifespan, obtaining an independent second opinion, and providing documentation and review.
Double Effect and Futility
In the “rule of double effect” in palliative care (or providing treatment to relieve suffering even though a foreseeable, unintended consequence of that treatment is to hasten death), the difference between permissible and prohibited action relies heavily on the clinician’s intent, Dr. Rajput pointed out.
He quoted the article “The Rule of Double Effect—A Critique of the Rule in End-of-Life Decision-Making,” saying, “A proportionately good effect (relief of suffering) may overcome a foreseeable bad effect (causing death) … as long as the actor does not intend to accomplish the bad effect.”
Another concept—medical futility—leads to three conceptual possibilities at end-of-life care:
- The treatment does not provide positive effects;
- The radical treatment has side effects that outweigh any positive effect; or
- It is futile to treat a disease when the patient is suffering from a more real-time, life-threatening disease.
In the event of physiological futility, a physician can withhold the treatment modality on the basis of having no effect on patient care, Dr. Rajput explained. But the decision needs to meet professional standards, and the physician must inform the patient and his or her family and give them an opportunity to seek a second opinion.
But what if there is no physiological futility?
“If it’s a matter of the appropriateness of sustaining a severely deteriorated life,” said Dr. Rajput, “then the scope of professional judgment is limited. This should not be a unilateral medical judgment.” You must include the patient and their family in decision-making, and you may want to consult with your hospital ethics committee.
“The bottom line is, futility is an elusive concept,” said Dr. Rajput. “The term is used more to make value-laden judgments,” He added, “Avoid the word ‘futility’ in communication and documentation. It can stop conversation.” Rather, communicate your
goals of care and treatments.
To determine those goals, your clinical ethical reasoning should follow these steps:
- State the problem plainly;
- Gather and organize the data;
- Consider the patient’s goals and preferences;
- Ask if this is an ethical problem;
- Ask if more information or dialogue is needed; and
- Determine the best course of action and support your position.
The complete PowerPoint presentation of “Ethical and Legal Issues around Pain Management in Hospitalized Patients” is available on the SHM Web site at www.hospitalmedicine.org/microsite/index.cfm. TH
Senior Syndromes
Attendees at the session “Managing Hospitalized Elders,” presented by Robert Palmer, MD, MPH, head of the section of Geriatric Medicine at Cleveland Clinic in Ohio, gained insights into the unique dangers hospitalization presents to their oldest patients.
“As every hospital-based physician knows, increasingly, hospital care is geriatric care,” said Dr. Palmer. “We’re seeing not only more people over 65, we’re seeing more people over age 85—the most complex and challenging cases. The question is, how do we work our way through the chronic diseases, the acute on top of chronic disease, deal with the psychosocial issues and family issues of the frail elderly person during hospitalization.”
The problem is that simply being hospitalized may trigger or exacerbate a functional decline in an elderly patient. Hospitalization itself can lead to delirium, undernutrition, immobility, pressure ulcers, incontinence, and ultimately placement in a nursing home.
“The process of care, a hostile environment, bed rest, starvation, medications—especially those that are inappropriate for use with older people—and depression all conspire to create a dysfunctional older person,” stressed Dr. Palmer. Common co-morbid conditions in the elderly include dehydration, chronic obstructive pulmonary disease (COPD), hypertension, chronic heart failure, diabetes, and anemia.
“We rarely treat these patients for just one condition,” Dr. Palmer pointed out.
Common Geriatric Syndromes
Common clinical presentations in elderly hospitalized patients include dysfunction, delirium, depression, and dementia.
“Some well-designed cohort studies show that 20% to 32% of these patients lose independent performance of one or more basic activities of daily living [ADL] at discharge,” said Dr. Palmer. Basic ADLs include bathing, dressing, moving from bed to chair, using the toilet, and eating. Why is this important? Patients admitted who were dependent in all six basic ADLs were at greater risk for in-hospital mortality or one-year mortality, 90-day nursing home use, and up to 50% higher DRG hospital costs.
“Not all older patients are at risk,” Dr. Palmer assured his audience. Risk factors for functional decline to watch for include patients over 75, those who are cognitively impaired, those dependent in two or more instrumental ADLs (shopping, housekeeping, taking medications), depression, and pressure ulcers.
—Robert Palmer, MD, MPH, head of the section of Geriatric Medicine at Cleveland Clinic in Ohio
Focus on Delirium
Dr. Palmer paid special attention to delirium.
“This is the most risky syndrome during hospitalization,” he warned. Delirium, or the acute decline of attention and cognition, can be called several things: acute confusional state, acute change in mental state, metabolic encephalopathy, toxic encephalopathy, acute brain syndrome, or acute toxic psychosis.
However it is categorized, delirium is found in 10% to 15% of hospitalized elders upon admission, and 10% to 15% of elderly patients develop it after admission. In ICUs, 70% to 84% of elderly patients suffer from delirium.
What causes delirium during hospitalization? Risk factors include severe illness, dementia, dehydration, sensory impairments (trouble hearing or seeing), and psychoactive medications. Identifiable precipitants of delirium are the use of physical restraints, malnutrition, the addition of three or more new medications, use of a bladder catheter, and any iatrogenic event.
“The major concern with delirium is the increased risk of mortality,” said Dr. Palmer. “But it also leads to prolonged length of stay, increased costs, and potential nursing home placement upon discharge.”
Diagnosing delirium versus dementia is based on four factors:
- The onset of confusion is abrupt with delirium and gradual for the early stages of dementia;
- Consciousness is fluctuating and clouded with delirium; with dementia it’s not affected;
- Attention span will be reduced with delirium but not with dementia; and
- A delirious patient will show hyperactive or hypoactive psychomotor changes, whereas this change will not show in early stages of dementia.
When evaluating for delirium, search for the cause and any possible precipitating factors, advised Dr. Palmer: “Consider multiple etiologies, and remember that fluctuation in the course is the rule.” Eliminating precipitating factors can help. Evaluation should include a targeted history and physical, and lab work to check things like drug levels and neuroimaging.
You may be able to manage delirium with nonpharmacologic changes in environment such as adding orienting stimuli of clocks, TV, and personal items; minimizing abrupt relocations; and sitting the patient in an upright position. You can also increase sensory input, said Dr. Palmer. You may also try a short course of meds: For severe agitation, haloperidol (0.5 to 1 mg every four hours as needed) or for anxiety symptoms use lorazepam (0.5 to 1 mg every four to six hours as needed).
Dr. Palmer offered a partial list of medications to avoid for elderly patients. “These patients are very vulnerable to bad outcomes,” he warned. His list included:
- Diphenhydramine;
- Hydroxyzine;
- Meperidine;
- Propoxyphene;
- Diazepam;
- Chlordiazepoxide;
- Amitriptyline;
- Imipramine;
- Doxepin;
- Promethazine;
- Prochlorperazine;
- Trimethobenzamide; and
- Famotidine (high dose).
Additionally, you should be aware that the following classes of drugs could cause delirium in the elderly:
- Antidepressants;
- Antianxiety medications;
- Antibiotics;
- Antihypertensives;
- Antihistamines;
- Antiarrhythmics;
- Antipsychotics; and
- Anti-inflammatory medications.
“Basically, any pharmacological class that begins with ‘anti’ should be avoided with elderly patients,” said Dr. Palmer.
Assess and Manage Undernutrition
An astonishing 40% to 60% of hospitalized, ill elderly patients suffer from malnutrition.
“This is often not diagnosed or adequately treated,” said Dr. Palmer. “It’s associated with terrible outcomes of hospital care, including length of stay, mortality, and affected ADL activities.”
There is no single blood test for malnutrition, Dr. Palmer continued, but indicators include a body mass index of less than 19, reduced muscle mass, reduced skin fold thickness, and biochemical measures including serum albumin of less than three and low hemoglobin and serum cholesterol.
To guard against dehydration and undernutrition in your elderly patients, Dr. Palmer advised assessing nutritional status at admission, prescribing and monitoring daily calorie and fluid intake for high-risk patients, giving priority to providing calories over restricted diet, and including consultation with a dietitian.
Take off the Restraints
“Why do we order bed rest for the weak and sick?” asked Dr. Palmer. He urged hospitalists to avoid bed-rest orders and instead encourage elderly patients to get out of bed and get physical activity or even physical therapy for transfer-dependent and gait-impaired patients.
Most of all, he said, “Avoid physical restraints.” These limit mobility, obviously, and can lead to pressure ulcers, deconditioning, falls, constipation, and incontinence.
Where to Send the Patient
Plan for discharging an independent elderly patient back home, not to a nursing home if you can, urged Dr. Palmer.
“Comprehensive discharge planning almost always requires an interdisciplinary team,” he said. “Goals of care and advanced directives should be discussed with the patient and family members, and post acute care needs should be considered.”
Following a “functional trajectory” from admission to discharge begins the first day. Dr. Palmer recommends the hospitalist, a nurse, and the case manager all interview the patient and family, establish a baseline and outline the expected hospital course including estimated length of stay and discharge site—nursing home, skilled nursing facility, or home.
“Work with physical or occupational therapy early to mobilize the patient and improve their functioning,” advised Dr. Palmer.
This type of comprehensive discharge planning, along with home follow-up, has reduced readmission rates. TH
A Hands-on Approach to Hand-offs

In “Developing Hand-off Standards for Hospitalists,” members of an SHM task force on hand-offs presented their findings from an extensive literature review and went on to propose basic standards for hospitalist hand-offs. The speakers included task force members Vineet Arora, MD, MA, assistant professor of medicine, University of Chicago; Lakshmi Halasyamani, MD, associate chairperson of the Department of Internal Medicine at St. Joseph Mercy Hospital in Ann Arbor, Mich.; Sunil Kripalani, MD, MSc, an instructor at Emory University, Atlanta, Ga.; and Efren Manjarrez, MD, assistant clinical professor of medicine at the Miller School of Medicine, University of Miami.

Literature Review: Slim Pickings
Although the group hoped to determine best practices based on a literature review of hand-offs, shift changes and handovers (excluding transitions in and out of hospitals) they couldn’t find enough appropriate research to support this goal.
After a PubMed search, and a review of the Agency for Healthcare Research and Quality’s (AHRQ) Patient Safety Net—which is a categorized, reviewed collection of articles and references—the task force reported the following: Of the 334 promising articles they initially identified, only 107 were deemed relevant after a title review. And of those, a significant article review found only 10 met the criteria for inclusion. Three studies of hand-offs appeared in nursing publications and were the only provider-specific studies. The remaining seven were studies of technology solutions for hand-offs—although all articles revealed that any technology fixes were “homegrown,” as nothing specific to hand-offs is widely available commercially.
Those 10 studies included few interventions, with no studies of hospitalist-specific hand-offs. Studies of shift changes predominated, and there were few studies that included patient outcomes.
“A summary of the literature supports the use of supplementing verbal hand-offs with written documentation in some structured format,” said Dr. Manjarrez. “It also showed a technology solution provided added benefits such as reduced rounding time and prep time and increased time with patients.”
The literature summary also suggests involving the patient in the hand-off conversation. “Signing out in front of the patient does wonders for your patient satisfaction rate,” remarked Dr. Manjarrez.
As part of the literature review, the task force found and examined five major expert consensus and policy white papers deemed relevant to hand-offs. Dr. Arora cited these papers from the Australian Council for Safety and Quality in Healthcare, the British Medical Association Junior Doctors Committee, the University Health Consortium, the Department of Defense Patient Safety Program, and the Joint Commission’s (formerly JCAHO’s) National Patient Safety Goal 2006.
Dr. Arora reminded attendees that the Joint Commission’s National Patient Safety Goal states that, “hospitals should implement a standardized approach to hand-off communications. This applies to all staff, not just physicians.”
Common themes found in the five white papers include:
- Frontline providers must be educated about acceptable hand-off practices;
- Adequate time must be made by all parties for hand-offs, and interruptions should be reduced during hand-off communications;
- Information must be up to date;
- Interactive questioning should be facilitated;
- Ill patients must be made a priority; and
- Actions to be undertaken should be clearly delineated.
Recommended Standards for Hand-offs
Based on their literature review, the SHM task force has created basic standards for hospitalists to use for hand-offs.
“Our standards needed to be broad enough to work at all hospital medicine programs, so they’re pretty basic,” said Dr. Arora. “They’re actually minimal standards to be met—they’re fairly simplistic, and we do not consider them to be best practices by any means.”
The standards begin with what seems like an obvious statement, but a necessary one for some hospital medicine groups: “A formally recognized hand-off plan should be instituted at the end of a shift or a change in service.” The standards also state that, “Effective hand-offs will require not only a program policy, but standards for verbal exchange and content exchange,” said Dr. Arora.
To guide hospital medicine groups through this exchange, the speakers offered three mnemonic devices: The 3 T’s, the 4 I’s and the 3 A’s.
The 3 T’s: Your program should have a policy in place that stipulates:
- Time set aside for hand-offs. Ensure that busy hospitalists have adequate time blocked out.
- Template or technology solution. “You need a structured template to help people do their work,” said Dr. Arora. “The program needs to decide what kind of template to adopt—and a move to standardization meets that Joint Commission goal.”
- Train new staff on hand-off expectations. Keep everyone in your practice, including appropriate hospital staff, in the loop.
The 4 I’s of verbal, or face-to-face, exchange include:
- Interruptions are limited. There will always be interruptions, but you can take steps to limit them during hand-offs by designating a time and/or place as “interruption free,” or having someone cover the pagers of the involved hospitalists during hand-offs.
- Interactive process is used. “There should be some interactive dialogue” between the physicians, insisted Dr. Arora.
- Ill patients are given priority. Make sure that you give your sickest patients top priority during hand-offs.
- Insight given to receiver on what to expect or do. What would you do if you were staying on for the next shift? Give the receiver a list of “to-do” items.
The 3 A’s of content exchange standards are:
- All data are up to date. This can be a real problem in healthcare. Make sure all information you turn over, both written and oral, reflects your latest knowledge.
- Anticipated events are emphasized. “What do you anticipate will be a problem?” asked Dr. Arora. Think this through and let the receiver know.
- Action items are highlighted. Again, include a to-do list with the information.
What’s Next?
The task force didn’t stop with these new basic standards. They put together a research agenda, a “wish list” of what’s needed in hospital medicine research to improve hand-offs.
“We need to use research to evaluate these standards rigorously,” said Dr. Arora. “And we must emphasize controlled interventions because only 10 of the articles we found were controlled interventions. We have to urge the research community to do more in this area.”
The group would also like to encourage the development of patient-based outcomes that are sensitive to hand-off quality. “This is talked about a lot, but few people are doing anything about it,” Dr. Arora pointed out.
And finally, they’d like to enable additional funding for further research on hand-offs.
Attendees at the session were polled on their hand-off practices. By a show of hands, approximately 40% indicated they had a standardized hand-off procedure. However, virtually no one thought their procedure was ideal.
The task force encouraged attendees and other hospitalists to share their thoughts and input on hand-off standards. If you have ideas for the task force, you can e-mail them at handoffs@hospitalmedicine.org.
The task force plans to revise their recommendations, with attention to SHM member input. They’d also like to engage an expert panel for an external review of their work before they disseminate it. TH
In “Developing Hand-off Standards for Hospitalists,” members of an SHM task force on hand-offs presented their findings from an extensive literature review and went on to propose basic standards for hospitalist hand-offs. The speakers included task force members Vineet Arora, MD, MA, assistant professor of medicine, University of Chicago; Lakshmi Halasyamani, MD, associate chairperson of the Department of Internal Medicine at St. Joseph Mercy Hospital in Ann Arbor, Mich.; Sunil Kripalani, MD, MSc, an instructor at Emory University, Atlanta, Ga.; and Efren Manjarrez, MD, assistant clinical professor of medicine at the Miller School of Medicine, University of Miami.
Literature Review: Slim Pickings
Although the group hoped to determine best practices based on a literature review of hand-offs, shift changes and handovers (excluding transitions in and out of hospitals) they couldn’t find enough appropriate research to support this goal.
After a PubMed search, and a review of the Agency for Healthcare Research and Quality’s (AHRQ) Patient Safety Net—which is a categorized, reviewed collection of articles and references—the task force reported the following: Of the 334 promising articles they initially identified, only 107 were deemed relevant after a title review. And of those, a significant article review found only 10 met the criteria for inclusion. Three studies of hand-offs appeared in nursing publications and were the only provider-specific studies. The remaining seven were studies of technology solutions for hand-offs—although all articles revealed that any technology fixes were “homegrown,” as nothing specific to hand-offs is widely available commercially.
Those 10 studies included few interventions, with no studies of hospitalist-specific hand-offs. Studies of shift changes predominated, and there were few studies that included patient outcomes.
“A summary of the literature supports the use of supplementing verbal hand-offs with written documentation in some structured format,” said Dr. Manjarrez. “It also showed a technology solution provided added benefits such as reduced rounding time and prep time and increased time with patients.”
The literature summary also suggests involving the patient in the hand-off conversation. “Signing out in front of the patient does wonders for your patient satisfaction rate,” remarked Dr. Manjarrez.
As part of the literature review, the task force found and examined five major expert consensus and policy white papers deemed relevant to hand-offs. Dr. Arora cited these papers from the Australian Council for Safety and Quality in Healthcare, the British Medical Association Junior Doctors Committee, the University Health Consortium, the Department of Defense Patient Safety Program, and the Joint Commission’s (formerly JCAHO’s) National Patient Safety Goal 2006.
Dr. Arora reminded attendees that the Joint Commission’s National Patient Safety Goal states that, “hospitals should implement a standardized approach to hand-off communications. This applies to all staff, not just physicians.”
Common themes found in the five white papers include:
- Frontline providers must be educated about acceptable hand-off practices;
- Adequate time must be made by all parties for hand-offs, and interruptions should be reduced during hand-off communications;
- Information must be up to date;
- Interactive questioning should be facilitated;
- Ill patients must be made a priority; and
- Actions to be undertaken should be clearly delineated.
Recommended Standards for Hand-offs
Based on their literature review, the SHM task force has created basic standards for hospitalists to use for hand-offs.
“Our standards needed to be broad enough to work at all hospital medicine programs, so they’re pretty basic,” said Dr. Arora. “They’re actually minimal standards to be met—they’re fairly simplistic, and we do not consider them to be best practices by any means.”
The standards begin with what seems like an obvious statement, but a necessary one for some hospital medicine groups: “A formally recognized hand-off plan should be instituted at the end of a shift or a change in service.” The standards also state that, “Effective hand-offs will require not only a program policy, but standards for verbal exchange and content exchange,” said Dr. Arora.
To guide hospital medicine groups through this exchange, the speakers offered three mnemonic devices: The 3 T’s, the 4 I’s and the 3 A’s.
The 3 T’s: Your program should have a policy in place that stipulates:
- Time set aside for hand-offs. Ensure that busy hospitalists have adequate time blocked out.
- Template or technology solution. “You need a structured template to help people do their work,” said Dr. Arora. “The program needs to decide what kind of template to adopt—and a move to standardization meets that Joint Commission goal.”
- Train new staff on hand-off expectations. Keep everyone in your practice, including appropriate hospital staff, in the loop.
The 4 I’s of verbal, or face-to-face, exchange include:
- Interruptions are limited. There will always be interruptions, but you can take steps to limit them during hand-offs by designating a time and/or place as “interruption free,” or having someone cover the pagers of the involved hospitalists during hand-offs.
- Interactive process is used. “There should be some interactive dialogue” between the physicians, insisted Dr. Arora.
- Ill patients are given priority. Make sure that you give your sickest patients top priority during hand-offs.
- Insight given to receiver on what to expect or do. What would you do if you were staying on for the next shift? Give the receiver a list of “to-do” items.
The 3 A’s of content exchange standards are:
- All data are up to date. This can be a real problem in healthcare. Make sure all information you turn over, both written and oral, reflects your latest knowledge.
- Anticipated events are emphasized. “What do you anticipate will be a problem?” asked Dr. Arora. Think this through and let the receiver know.
- Action items are highlighted. Again, include a to-do list with the information.
What’s Next?
The task force didn’t stop with these new basic standards. They put together a research agenda, a “wish list” of what’s needed in hospital medicine research to improve hand-offs.
“We need to use research to evaluate these standards rigorously,” said Dr. Arora. “And we must emphasize controlled interventions because only 10 of the articles we found were controlled interventions. We have to urge the research community to do more in this area.”
The group would also like to encourage the development of patient-based outcomes that are sensitive to hand-off quality. “This is talked about a lot, but few people are doing anything about it,” Dr. Arora pointed out.
And finally, they’d like to enable additional funding for further research on hand-offs.
Attendees at the session were polled on their hand-off practices. By a show of hands, approximately 40% indicated they had a standardized hand-off procedure. However, virtually no one thought their procedure was ideal.
The task force encouraged attendees and other hospitalists to share their thoughts and input on hand-off standards. If you have ideas for the task force, you can e-mail them at handoffs@hospitalmedicine.org.
The task force plans to revise their recommendations, with attention to SHM member input. They’d also like to engage an expert panel for an external review of their work before they disseminate it. TH
SHM Honors its Best
SHM recently presented its 2007 Awards of Excellence to four hospitalists whose work and research have contributed significantly to hospital medicine and to the betterment of patient care and quality improvement. The award winners were recognized at “Hospital Medicine 2007” held in Dallas in May:
- Award for Clinical Excellence: Adrienne Green, MD, hospitalist at the University of California, San Francisco (UCSF) Medical Center, associate chief medial officer, associate professor of medicine, and physician lead for the Department of Care Coordination at UCSF.
- Award for Excellence in Research: Vineet Arora, MD, MA, assistant professor for the University of Chicago’s Department of Medicine, associate program director for the Internal Medicine Residency Program and assistant dean for curricular innovation for the Pritzker School of Medicine.
- Award for Excellence in Teaching: Jeffrey Glasheen, MD, assistant professor of medicine, director of the hospital medicine unit and inpatient clinical services, associate program director of the Internal Medicine Residency Training Program and program director for the Hospitalist Training Program at the University of Colorado at Denver Health Sciences Center.
- Award for Outstanding Service in Hospital Medicine: Daniel Rauch, MD, director of the pediatric hospitalist program and assistant residency director of pediatrics for the New York University School of Medicine.
Dr. Green has been a clinically active hospitalist at UCSF Medical Center since 1998. She is engaged in improving systems at USCF, especially in the areas of patient safety, utilization management, compliance, and throughput.
She also enjoys the challenge of working to fix broken systems within the hospital and strives to engage providers across disciplines to work collaboratively to improve the care of hospitalized patients. For this work, she received the UCSF Exceptional Physician Award in 2005.
A graduate of Wesleyan University, Dr. Green received her bachelor’s in molecular biology and chemistry. She earned her medical degree from Hahnemann University School of Medicine and completed her residency at Stanford University (Calif.) in internal medicine.
Dr. Arora’s academic research work on medical education topics such as the effects of sleep deprivation on resident fatigue and patient care, as well as resident interaction with industry, and communication during the handoff process, earned her this year’s Award of Excellence in Research. Her research focuses on measuring and improving quality of care of hospitalized elderly patients. She is the recipient of the Hartford Geriatrics Health Outcomes Research Scholars Award and has also served as a content expert for the development of hospital care quality indicators as part of the ACOVE-3 (Assessing Care for the Vulnerable Elder) Project.
As an active member of SHM, Dr. Arora is the co-founder of the Young Physicians Committee, a member of the SHM Annual Meeting Planning Committee, chair of the Handoff Standards Task Force, and a reviewer for the Research Abstract Committee. She received her bachelor’s from Johns Hopkins University, completed her graduate studies at the University of Chicago Irving B. Harris School of Public Policy, and received her medical degree from Washington University. She completed her residency training in internal medicine and her fellowship in general medicine research at the University of Chicago.
Dr. Glasheen has received many awards recognizing his dedication to hospital medicine and teaching. He is a two-time winner of the Outstanding Clinical Teacher Award given by the students at the University of Colorado School of Medicine, as well as winner of the 7th Annual Elaine Cleary Faculty Teaching Award as the most outstanding educator in the University of Colorado’s Division of General Internal Medicine. As an active member of SHM, Dr. Glasheen participates in the Research, Annual Meeting, and Hospital Medicine Certification committees. He also serves as an SHM delegate to the American Board of Internal Medicine (ABIM) Task Force for Hospitalist Credentialing. Dr. Glasheen also has served as the assistant editor for the Journal of Hospital Medicine since its inception. Most recently, he has been named physician editor for The Hospitalist.
A graduate of Drake University in Des Moines, Iowa, Dr. Glasheen earned his bachelor’s in biology and earned his medical degree from the University of Wisconsin School of Medicine, where he also completed his residency training.
Dr. Rauch is a nationally recognized leader in pediatric hospital medicine. He has done extensive work with the SHRQ Pediatric Quality Indicators Project, resulting in an invitation to serve on the National Quality Forum Pediatric Technical Advisory Panel, as part of the National Voluntary Consensus Standards for Hospital Care: Additional Priorities, 2006-2007. He is an active member of SHM, serving on the Pediatrics and Benchmarks Committees. Additionally, he sits on the executive committee of the hospital medicine section and is a member of the National Committee on Residential Scholarships for the American Academy of Pediatrics.
Dr. Rauch is a graduate of Wesleyan University, where he received his bachelor’s in biology. He earned his medical degree from Wesleyan’s Albert Einstein College of Medicine, where he also completed his residency in pediatrics.
For additional information call (800) 843-3360 or visit www.hospitalmedicine.org. All Award of Excellence recipients receive an all expense-paid trip and complimentary registration to “Hospital Medicine 2008” in San Diego from April 3-5. TH
SHM Behind the Scenes
As I walked around our office during the week after this year’s SHM Annual Meeting, there was a simple question on the minds of many: What’s next?
After the 12-month planning of “Hospital Medicine 2007”—which culminated in a week away from family, getting out of bed before 5 a.m., and falling asleep after midnight—I guess “What’s next?” is a pretty reasonable question. It’s not at all a surprising question considering the “blood, sweat, and tears” so many volunteer leaders and staff gave to put on an event befitting the fastest-growing specialty in modern healthcare.
“What’s next?” is a fair question for our members to ask of us as well. After all, like so many other organizations, much of what SHM does is designed to come on line, or culminate, during the annual meeting.
I wanted to use this month’s column to give you a small glimpse inside our answer to this simple—yet powerful—question.
One of the surprise stories from “Hospital Medicine 2007” was the success of our Annual Meeting Blog. Over the course of three days, several hospital medicine leaders, including Bob Wachter, MD, shared their experiences—in real time—from Dallas. Augmenting the posts from these contributors were audio podcast interviews with notables that included keynote speaker David Brailer, MD, the first national coordinator for health information technology with the Department of Health and Human Services.
More than 1,000 people visited SHM’s first foray into the blogosphere. Even more exciting is that the blog had hits from hospitalists unable to join us in Dallas.
It used to be that we would say that the biggest meeting in hospital medicine took place each year at the site of the SHM Annual Meeting. With the introduction of the blog, we can now say that is no longer the case. The biggest meeting takes place in more than one city, in more than one hospital, with the geographic location of the SHM Annual Meeting just the hub.
The blog is just the beginning of the answer to the question “What’s next?”
During the coming year, we will use our blogging success as a building block to bringing what many call “new media” squarely into the framework of SHM. You are starting to see the first steps of that effort with the redesign of our homepage, www.hospitalmedicine.org.
To us, new media serves several purposes:
- Inform: The blog showed us a powerful way to deliver real-time news without the delay some publications require;
- Educate: We’re working on creating Webinars—audio conferences coupled with Internet presentations—that will bring education directly to you, at your institution, throughout the year;
- Connect: Through online discussions with thought leaders, including authors from The Hospitalist, we want to celebrate the fact that the most powerful connection we can facilitate is from physician to physician; and
- Differentiate: By bringing these elements together, from blogs and podcasts to Webinars and new online resources, we want to make the question “Why SHM?” one of the easiest you’ll ever have to answer.
What’s next? It’s an interesting question. To us, a major part of the answer is the same it’s always been: to continue innovating by building on our successes and being the group committed to blazing new trails that are focused squarely, and solely, on delivering benefit to our members and the hospital medicine movement.