User login
What do the latest data reveal about the safety of home birth in the United States?
Every morning before I leave for work, I kiss my three children goodbye and tell them, “I love you. Make good choices today.”
This has become my mantra—so much so that, on her way out the door to join her friends at the movies recently, my daughter turned to me and said, “I know, Dad. I know. I’ll make good decisions tonight.”
And what decision is more important than where to deliver your child and who to have in attendance at the birth?
It is said that the passage from the uterus to the outside world that each one of us was forced to negotiate at birth is the most treacherous journey we will ever undertake. Any unnecessary delay or complication can have profound, lifelong consequences.
There is no question that the past few centuries have seen a significant “medicalization” of childbirth, including the relocation of deliveries from the community to a hospital setting, the introduction of male obstetricians, the unfortunate marginalization of midwives and support personnel (doulas), the development of uterotonic drugs, and the evolution of operative vaginal (forceps, vacuum) and cesarean deliveries.
Many of the practices initially introduced by obstetric care providers (including multiple vaginal examinations in labor, induction of labor for a large baby, and active management of labor protocols) have since been shown to be unhelpful in improving pregnancy outcomes, and some practices (such as episiotomy) have even been shown to be harmful.
Related article: Difficult fetal extraction at cesarean delivery: What should you do? Robert L. Barbieri, MD (Editorial, January 2012)
In the midst of this confusion, the one voice that has been lost is that of the patient herself.
Whose birth is it anyway?
The American College of Obstetricians and Gynecologists (ACOG), the American Academy of Pediatrics (AAP), and the American College of Nurse-Midwives (ACNM) all agree that patient autonomy is paramount, and that the final decision of where to deliver and who to have in attendance should be made by the patient herself, ideally in conjunction with her family and her obstetric care provider.1–3 But an informed decision is only as good as the available data. Regrettably, the literature on how planned home birth compares with hospital delivery in terms of pregnancy outcomes in the United States are sparse.
Related article: Lay midwives the the ObGyn: Is collaboration risky? Lucia DiVenere, MA (May 2012)
How safe is home birth in the United States?
Cheng and colleagues attempt to answer this question by reviewing newborn and maternal outcomes among planned home births versus hospital deliveries in a contemporary low-risk birth cohort. Their retrospective study included low-risk women at term with a singleton vertex live birth in 2008 in 27 of the 50 states using information from the Vital Statistics Natality Data provided by the Centers for Disease Control and Prevention.
Of these 2,081,753 women, 0.58% (n = 12,039) had planned home births, and the remainder delivered in a hospital setting. Women who had an “accidental” (unintended) home birth or who delivered in a freestanding birthing center were excluded. The primary outcome was the risk of a 5-minute Apgar score less than 4. Secondary outcomes included the risk of a 5-minute Apgar score less than 7, assisted ventilation for more than 6 hours, neonatal seizures, admission to the NICU, and a series of maternal outcome measures.
Besides the outcomes listed previously (top of page 24), women with a planned home birth had fewer obstetric interventions, including operative vaginal delivery and labor induction or augmentation. They also were less likely to be given antibiotics during labor (although the authors did not distinguish between antibiotics administered for prophylaxis against group B strep or surgical-site infection versus antibiotics to treat infections such as urinary tract infections or chorioamnionitis).
Of special interest is the fact that neither a prior vaginal delivery (multiparity) nor the absence of a prior cesarean delivery was protective against these adverse events.
The women at highest risk of an adverse event were those who delivered at home under the supervision of “other midwives.” Although these providers were not well defined, this term typically refers to community-based lay midwives whose only “training” consists of an unofficial apprenticeship of variable length. Despite the absence of formal training, the lack of certification and standardization of care, and the existence of legislation in many states banning their activity, such lay midwives continue to encourage and support home birth for both low- and high-risk women in the United States.
Related article: Update on Obstetrics John T. Repke, MD, and Jaimey M. Pauli, MD (January 2012)
Limitations of the study design
Although this dataset contains more than 2 million births, it includes only low-risk women at term and, therefore, is underpowered to measure outcomes such as fetal or neonatal death or birth injuries.
No data were presented on a number of important variables and outcome measures, such as the rate of or indications for cesarean delivery, the mode and frequency of intrapartum fetal monitoring, birth weight, intrapartum complications (uterine rupture, postpartum hemorrhage), blood transfusions, and infectious morbidity. The study also lacks long-term follow-up data on the infants.
That said, the study was well designed and very well written, and many of the limitations listed above are inherent in all retrospective cohort studies.
Putting these findings in context
These data are not novel, but they are remarkably consistent with other publications that have explored pregnancy outcomes in planned home birth versus hospital delivery from the Netherlands, the United Kingdom, Australia, and the United States, all of which show a higher rate of neonatal complications with planned home birth [see Reference 4 for review].4
Moreover, it is likely that the data in the current report significantly underestimate the risks of planned home birth for two reasons:
- Attempted home births that ended in transfer and, ultimately, delivery in a hospital setting (presumably for some unforeseen event such as excessive hemorrhage or uterine rupture or cord prolapse or nonreassuring fetal testing) were classified as hospital births.
- Apgar scores at 5 minutes are assigned by the attending care provider, and there is no way to independently verify their accuracy. Because of their limited training and/or concern about efforts to limit the scope of their practice, “other midwives” may be inclined to assign more favorable Apgar scores.
Who is choosing to deliver at home?
The proportion of US women who delivered outside the hospital setting increased by 29% between 2004 and 2009,5 although home births still constitute a minority of low-risk births (0.58% in the current study).
Related Article: Why are well-educated women more likely to choose home birth? Errol R. Norwitz, MD, PhD (Audiocast, November 2013)
One of the more interesting questions raised by this publication is the issue of who is choosing to deliver at home. In this cohort, women who planned home birth were more likely to be older, married, multiparous, white, and well educated. These aren’t exactly the women you would expect to gamble with the lives of their unborn offspring. So why are they choosing to deliver at home?
It could be that they are not well informed about the risks. Alternatively, they may have concluded that, although the relative risk of an adverse event is significantly higher with home birth, the absolute risk is low and acceptable to them. Or it could be that they are frustrated by the lack of autonomy afforded to them in the decisions surrounding antenatal care and the birthing process.
In recent years, more women are asking for minimally invasive births that are physically, emotionally, and socially supported. As hospital-based obstetric care providers, we do not always respect or meet these expectations. We can and should do better.
Women should not have to choose between a good birth experience and medical safety, between social support and hospital resources, between a sense of autonomy and access to life-saving interventions. Although every effort should be taken to make the birthing experience a positive one for the mother and her family as a whole, it should not be done at the expense of safety. I have yet to hear an asphyxiated and brain-damaged child thank his mother’s obstetric care provider for allowing a wonderful birth experience.
What this evidence means for practice
Even in countries where home births are integrated fully into the medical care system and attended by trained and certified nurse-midwives, they are associated with increased risks, including a twofold to threefold increase in the odds of neonatal death.4 In the US, where no such integration exists, home births are dangerous.
Maternity care has come a long way since the 17th Century, when a woman had a 1 in 6 chance of dying in childbirth and only one of every five children lived to enjoy a first birthday. It is appropriate in this era of Obamacare and cost containment that we explore alternative methods. The option of a safe home delivery may well be part of the solution, as it is for many European countries--but until we can be assured that such an approach is safe for both mothers and infants, let's keep home delivery where it belongs...for pizza!
--Errol R. Norwitz, MD, PHD
We want to hear from you! Tell us what you think.
- Committee on Obstetric Practice; American College of Obstetricians and Gynecologists. Committee Opinion #476: Planned home birth. Obstet Gynecol. 2011;117(2 Pt 1):425–428.
- American Academy of Pediatrics. Committee on Fetus and Newborn. Planned home birth. Pediatrics. 2013;131(5):1016–1020.
- American College of Nurse-Midwives. Division of Standards and Practice. Position statement: Home birth. Approved by the ACNM Board of Directors, May 2011. http://midwife.org/ACNM/files/ACNMLibraryData/UPLOADFILENAME/000000000251/Home%20Birth%20Aug%202011.pdf. Accessed October 21, 2013
- Wax JR, Lucas FL, Lamont M, et al. Maternal and newborn outcomes in planned home birth vs planned hospital births: A meta-analysis. Am J Obstet Gynecol. 2012;203(3):243.e1–e8.
- Martin JA, Hamilton BE, Ventura SJ, et al; Division of Vital Statistics. Births: Final data for 2009. Natl Vital Stat Rep. 2011;60(1):1–70.
Every morning before I leave for work, I kiss my three children goodbye and tell them, “I love you. Make good choices today.”
This has become my mantra—so much so that, on her way out the door to join her friends at the movies recently, my daughter turned to me and said, “I know, Dad. I know. I’ll make good decisions tonight.”
And what decision is more important than where to deliver your child and who to have in attendance at the birth?
It is said that the passage from the uterus to the outside world that each one of us was forced to negotiate at birth is the most treacherous journey we will ever undertake. Any unnecessary delay or complication can have profound, lifelong consequences.
There is no question that the past few centuries have seen a significant “medicalization” of childbirth, including the relocation of deliveries from the community to a hospital setting, the introduction of male obstetricians, the unfortunate marginalization of midwives and support personnel (doulas), the development of uterotonic drugs, and the evolution of operative vaginal (forceps, vacuum) and cesarean deliveries.
Many of the practices initially introduced by obstetric care providers (including multiple vaginal examinations in labor, induction of labor for a large baby, and active management of labor protocols) have since been shown to be unhelpful in improving pregnancy outcomes, and some practices (such as episiotomy) have even been shown to be harmful.
Related article: Difficult fetal extraction at cesarean delivery: What should you do? Robert L. Barbieri, MD (Editorial, January 2012)
In the midst of this confusion, the one voice that has been lost is that of the patient herself.
Whose birth is it anyway?
The American College of Obstetricians and Gynecologists (ACOG), the American Academy of Pediatrics (AAP), and the American College of Nurse-Midwives (ACNM) all agree that patient autonomy is paramount, and that the final decision of where to deliver and who to have in attendance should be made by the patient herself, ideally in conjunction with her family and her obstetric care provider.1–3 But an informed decision is only as good as the available data. Regrettably, the literature on how planned home birth compares with hospital delivery in terms of pregnancy outcomes in the United States are sparse.
Related article: Lay midwives the the ObGyn: Is collaboration risky? Lucia DiVenere, MA (May 2012)
How safe is home birth in the United States?
Cheng and colleagues attempt to answer this question by reviewing newborn and maternal outcomes among planned home births versus hospital deliveries in a contemporary low-risk birth cohort. Their retrospective study included low-risk women at term with a singleton vertex live birth in 2008 in 27 of the 50 states using information from the Vital Statistics Natality Data provided by the Centers for Disease Control and Prevention.
Of these 2,081,753 women, 0.58% (n = 12,039) had planned home births, and the remainder delivered in a hospital setting. Women who had an “accidental” (unintended) home birth or who delivered in a freestanding birthing center were excluded. The primary outcome was the risk of a 5-minute Apgar score less than 4. Secondary outcomes included the risk of a 5-minute Apgar score less than 7, assisted ventilation for more than 6 hours, neonatal seizures, admission to the NICU, and a series of maternal outcome measures.
Besides the outcomes listed previously (top of page 24), women with a planned home birth had fewer obstetric interventions, including operative vaginal delivery and labor induction or augmentation. They also were less likely to be given antibiotics during labor (although the authors did not distinguish between antibiotics administered for prophylaxis against group B strep or surgical-site infection versus antibiotics to treat infections such as urinary tract infections or chorioamnionitis).
Of special interest is the fact that neither a prior vaginal delivery (multiparity) nor the absence of a prior cesarean delivery was protective against these adverse events.
The women at highest risk of an adverse event were those who delivered at home under the supervision of “other midwives.” Although these providers were not well defined, this term typically refers to community-based lay midwives whose only “training” consists of an unofficial apprenticeship of variable length. Despite the absence of formal training, the lack of certification and standardization of care, and the existence of legislation in many states banning their activity, such lay midwives continue to encourage and support home birth for both low- and high-risk women in the United States.
Related article: Update on Obstetrics John T. Repke, MD, and Jaimey M. Pauli, MD (January 2012)
Limitations of the study design
Although this dataset contains more than 2 million births, it includes only low-risk women at term and, therefore, is underpowered to measure outcomes such as fetal or neonatal death or birth injuries.
No data were presented on a number of important variables and outcome measures, such as the rate of or indications for cesarean delivery, the mode and frequency of intrapartum fetal monitoring, birth weight, intrapartum complications (uterine rupture, postpartum hemorrhage), blood transfusions, and infectious morbidity. The study also lacks long-term follow-up data on the infants.
That said, the study was well designed and very well written, and many of the limitations listed above are inherent in all retrospective cohort studies.
Putting these findings in context
These data are not novel, but they are remarkably consistent with other publications that have explored pregnancy outcomes in planned home birth versus hospital delivery from the Netherlands, the United Kingdom, Australia, and the United States, all of which show a higher rate of neonatal complications with planned home birth [see Reference 4 for review].4
Moreover, it is likely that the data in the current report significantly underestimate the risks of planned home birth for two reasons:
- Attempted home births that ended in transfer and, ultimately, delivery in a hospital setting (presumably for some unforeseen event such as excessive hemorrhage or uterine rupture or cord prolapse or nonreassuring fetal testing) were classified as hospital births.
- Apgar scores at 5 minutes are assigned by the attending care provider, and there is no way to independently verify their accuracy. Because of their limited training and/or concern about efforts to limit the scope of their practice, “other midwives” may be inclined to assign more favorable Apgar scores.
Who is choosing to deliver at home?
The proportion of US women who delivered outside the hospital setting increased by 29% between 2004 and 2009,5 although home births still constitute a minority of low-risk births (0.58% in the current study).
Related Article: Why are well-educated women more likely to choose home birth? Errol R. Norwitz, MD, PhD (Audiocast, November 2013)
One of the more interesting questions raised by this publication is the issue of who is choosing to deliver at home. In this cohort, women who planned home birth were more likely to be older, married, multiparous, white, and well educated. These aren’t exactly the women you would expect to gamble with the lives of their unborn offspring. So why are they choosing to deliver at home?
It could be that they are not well informed about the risks. Alternatively, they may have concluded that, although the relative risk of an adverse event is significantly higher with home birth, the absolute risk is low and acceptable to them. Or it could be that they are frustrated by the lack of autonomy afforded to them in the decisions surrounding antenatal care and the birthing process.
In recent years, more women are asking for minimally invasive births that are physically, emotionally, and socially supported. As hospital-based obstetric care providers, we do not always respect or meet these expectations. We can and should do better.
Women should not have to choose between a good birth experience and medical safety, between social support and hospital resources, between a sense of autonomy and access to life-saving interventions. Although every effort should be taken to make the birthing experience a positive one for the mother and her family as a whole, it should not be done at the expense of safety. I have yet to hear an asphyxiated and brain-damaged child thank his mother’s obstetric care provider for allowing a wonderful birth experience.
What this evidence means for practice
Even in countries where home births are integrated fully into the medical care system and attended by trained and certified nurse-midwives, they are associated with increased risks, including a twofold to threefold increase in the odds of neonatal death.4 In the US, where no such integration exists, home births are dangerous.
Maternity care has come a long way since the 17th Century, when a woman had a 1 in 6 chance of dying in childbirth and only one of every five children lived to enjoy a first birthday. It is appropriate in this era of Obamacare and cost containment that we explore alternative methods. The option of a safe home delivery may well be part of the solution, as it is for many European countries--but until we can be assured that such an approach is safe for both mothers and infants, let's keep home delivery where it belongs...for pizza!
--Errol R. Norwitz, MD, PHD
We want to hear from you! Tell us what you think.
- Committee on Obstetric Practice; American College of Obstetricians and Gynecologists. Committee Opinion #476: Planned home birth. Obstet Gynecol. 2011;117(2 Pt 1):425–428.
- American Academy of Pediatrics. Committee on Fetus and Newborn. Planned home birth. Pediatrics. 2013;131(5):1016–1020.
- American College of Nurse-Midwives. Division of Standards and Practice. Position statement: Home birth. Approved by the ACNM Board of Directors, May 2011. http://midwife.org/ACNM/files/ACNMLibraryData/UPLOADFILENAME/000000000251/Home%20Birth%20Aug%202011.pdf. Accessed October 21, 2013
- Wax JR, Lucas FL, Lamont M, et al. Maternal and newborn outcomes in planned home birth vs planned hospital births: A meta-analysis. Am J Obstet Gynecol. 2012;203(3):243.e1–e8.
- Martin JA, Hamilton BE, Ventura SJ, et al; Division of Vital Statistics. Births: Final data for 2009. Natl Vital Stat Rep. 2011;60(1):1–70.

Errol R. Norwitz, MD, PhD (November 2013)
Is it time to rethink the use of oral contraceptives in premenopausal women with migraine?
Part 1 Data dissection
- Migraine versus migraine with aura versus tension headache
- Baseline risk of stroke in patients with migraine
- What does the literature suggest about the risk of stroke associated with combination oral contraceptives (OCs) in women with migraine?
- What have been the objections in the past to OC use in women with migraine?
![]()
Part 2 Successful interventions for avoiding menstrual headache
- How might women with migraine benefit from OCs?
- Estrogen dose: Does it make a difference in headache avoidance?
- Is low dose or continuous OC use the best option for contraception in women with migraine?
- Should an ObGyn consult with a headache specialist before prescribing combination OCs to women with migraine?
![]()
Download transcript for Part 1

Which perioperative strategies for transvaginal cervical cerclage are backed by data?
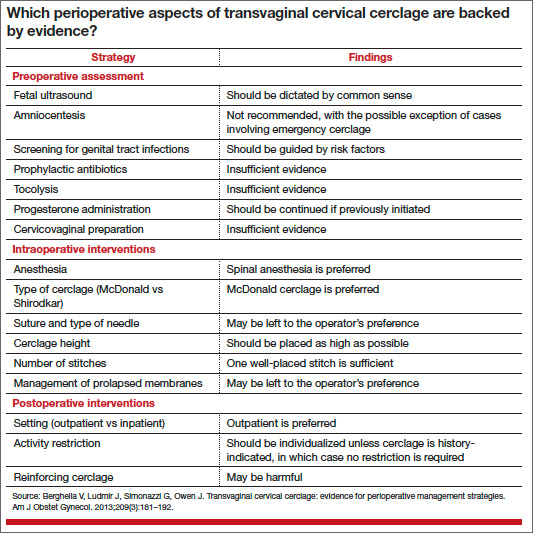
In contemporary medical practice, we expect our clinical actions to reflect the best and most current evidence. In many cases, however, the evidence available to us is weak or irrelevant. In their investigation, Berghella and colleagues set out to assess the quality of evidence in the setting of transvaginal cervical cerclage by reviewing the published data on selected perioperative strategies. They elected to perform a systematic review, as opposed to a narrative review (a simple opinion piece), because this approach follows an explicit process designed to limit bias and random error in the interpretation of scientific research.
The studies they analyzed vary from observational investigations to randomized trials, generating considerable heterogeneity in the data. Therefore, it would not have been feasible or appropriate for them to combine the results in a quantitative review (ie, meta-analysis). Their solution: to limit the analysis to a qualitative systematic review.
The term “systematic review” implies that investigators have an accurate and comprehensive understanding of existent data, with each study representing one contribution to a much larger body of knowledge. Over the years, Berghella and colleagues have contributed extensively to the literature on cervical cerclage and are well qualified to provide an analytic framework for the flood of published information on this practice. Although they focused primarily on how to perform cerclage, a discussion of when to perform cerclage cannot be separated from any consideration of efficacy.
When, exactly, is cerclage indicated?
The original indication for cerclage, established more than 50 years ago, required both a history of second-trimester loss and asymptomatic cervical changes in the current pregnancy. Since then, many cerclages have been performed on the basis of history alone or on current cervical changes regardless of history. However, the most recent professional guidelines reconfirm that any cerclage procedure should be supported by both historical and contemporaneous findings.1,2
Investigators have demonstrated that the measurement of cervical length by transvaginal ultrasound should generally be an integral part of clinical evaluation for asymptomatic cervical changes. Indeed, sonographic assessment has emerged as a tool capable of reducing “overcall” and unnecessary intervention.3 On the other hand, a meta-analysis of four randomized trials of ultrasound-indicated cerclage found it to be beneficial in women with a short cervix only if they also had a history of preterm delivery.4
In addition, randomized trials have documented a benefit for cerclage in two other clinical contexts:
- Results from a secondary analysis of data from a large randomized trial published in 1993 suggest that elective cerclage can be based on history alone in women with three or more second-trimester losses or preterm births.5
- Authors of a randomized trial published in 2003 suggested that women with advanced cervical changes, such as dilatation of the external os with exposure of the fetal membranes, may benefit from “emergency” cerclage even in the absence of a prior preterm delivery.6
How the data were analyzed
The data included in the review were analyzed separately, according to three widely accepted indications for cerclage:
- history-indicated: a history of three or more second-trimester losses and/or preterm births
- ultrasound-indicated: ultrasonographic detection of a cervical length of less than 25 mm, as measured by transvaginal ultrasound, in a woman with a history of second-trimester loss or preterm birth
- physical-examination–indicated: physical examination (manual or with a speculum) that confirms a dilated cervix.
Granted, this terminology can be confusing, as in the case of ultrasound-indicated cerclage, which includes aspects of the patient’s history. Moreover, I doubt that the studies included in this analysis always adhered to these definitions. The heterogeneity of the study population and the ambiguity of these definitions may limit the applicability of findings. In fact, they constitute the major (albeit practically unavoidable) limitation of this review.
The optimal approach to subclinical infection is unclear
Although there is a consensus that overt intra-amniotic infection is an absolute contraindication to cerclage, the implications of subclinical intra-amniotic infection in asymptomatic women are unclear. About 50% of women considered for emergency cerclage are likely to have intra-amniotic infection.7 An ongoing randomized trial is expected to elucidate the benefit of precerclage amniocentesis in such cases.
The sonographic detection of sludge in the amniotic fluid also has been associated with intra-amniotic infection. However, after analyzing the data, Berghella and colleagues did not find adequate justification for amniocentesis in this setting. A more practical question might be whether cerclage is advisable at all when sludge is present. Data from a recently reported abstract suggest that the presence of sludge increases the likelihood of early preterm birth independent of cervical length.8
Other gray areas
Another absolute contraindication to cerclage is the presence of painful uterine contractions in a woman exhibiting cervical change. The study findings seemed to imply that when uterine contractions are detected via tocodynamometric monitoring but are not experienced by the patient, cerclage may be appropriate. In my opinion, this issue represents another open clinical question.
On at least one occasion, I have discovered that the patient scheduled for cerclage has not undergone preoperative screening for genital tract infections. In such a scenario, it is unclear whether it is best to cancel the procedure or to proceed. Berghella and colleagues concluded that evidence is insufficient to support routine, universal screening for genital tract infection prior to cerclage. In the absence of risk factors for infection, it may be appropriate to proceed with cerclage.
The issue of combined use of cerclage and 17α hydroxyprogesterone caproate also was addressed in this review. Berghella and colleagues recommended that progestin supplementation be continued if cerclage is subsequently performed. I, too, follow this approach, although the two interventions (progestin followed by cerclage) have not been studied in this sequence.
Related article: A stepwise approach to cervical cerclage (June 2012)
Data are limited, and conflicting, on the use of 17α hydroxyprogesterone caproate after cerclage. A small randomized trial suggested benefit,9 while a retrospective cohort study10 and a secondary analysis of data from a randomized trial of cerclage11 found no benefit for the addition of 17α hydroxyprogesterone caproate.
Berghella and colleagues advocated against reinforcing (second or repeat) cerclage, an intervention that may be associated with a higher incidence of preterm birth.12 Accordingly, continuing sonographic assessment of cervical length after cerclage may be futile. What this evidence means for practice
Increasing evidence suggests that cervical shortening is not limited to an innate or acquired cervical weakness but represents an early, asymptomatic phase on the pathway to preterm birth. Nevertheless, cerclage continues to be practiced widely and has been shown to be beneficial in selected populations.
We clinicians often face complex cases of presumed cervical insufficiency for which there are no simple or unequivocal recommendations. This appraisal by Berghella and colleagues will help us separate evidence-validated approaches from misconceptions in the technical aspects of cerclage.
--Alex C. Vidaeff, MD, MPH
We want to hear from you! Tell us what you think.
- Royal College of Obstetricians and Gynaecologists. Cervical cerclage [guidelines]. http://www.rcog.org.uk/womens-health/clinical-guidance/cervical-cerclage-green-top-60. Accessed September 18, 2013.
- ACOG Practice Bulletin #130: Prediction and prevention of preterm birth. Obstet Gynecol. 2012;120:964–973.
- Grimes-Dennis J, Berghella V. Cervical length and prediction of preterm delivery. Curr Opin Obstet Gynecol. 2007;19(2):191–195.
- Berghella V, Odibo AO, To MS, et al. Cerclage for short cervix on ultrasound: meta-analysis of trials using individual patient-level data. Obstet Gynecol. 2005;106(1):181–189.
- Working Party on Cervical Cerclage. Final report of the Medical Research Council/Royal College of Obstetricians and Gynaecologists multicenter randomised trial of cervical cerclage. Br J Obstet Gynaecol. 1993;100(6):516–523.
- Althuisius SM, Dekker GA, Hummel P, van Geijin HP. Cervical incompetence prevention randomized cerclage trial: emergency cerclage with bed rest versus bed rest alone. Am J Obstet Gynecol. 2003;189(4):907–910.
- Romero R, Gonzalez R, Sepulveda W, et al. Infection and labor. VIII. Microbial invasion of the amniotic cavity in patients with suspected cervical incompetence: prevalence and clinical significance. Am J Obstet Gynecol. 1992(4 Pt 1);167:1086–1091.
- Saade G. Cervical funneling or intraamniotic debris and preterm birth in nulliparous women with short cervix. Am J Obstet Gynecol. 2013;208(1):S4.
- Yemini M, Borenstein R, Dreazen E, et al. Prevention of premature labor by 17 alpha-hydroxyprogesterone caproate. Am J Obstet Gynecol. 1985;151(5):574–577.
- Rebarber A, Cleary-Goldman J, Istwan NB, et al. The use of 17 alpha-hydroxyprogesterone caproate (17P) in women with cervical cerclage. Am J Perinatol. 2008;25(5):271–275.
- Berghella V, Figueroa D, Szychowski JM, et al. 17 alpha-hydroxyprogesterone caproate for the prevention of preterm birth in women with prior preterm birth and a short cervical length. Am J Obstet Gynecol. 2010;202(4):351.e1–e6.
- Baxter JK, Airoldi J, Berghella V. Short cervical length after history-indicated cerclage: is a reinforcing cerclage beneficial? Am J Obstet Gynecol. 2005;193(3 Pt 2):1204–1207.
In contemporary medical practice, we expect our clinical actions to reflect the best and most current evidence. In many cases, however, the evidence available to us is weak or irrelevant. In their investigation, Berghella and colleagues set out to assess the quality of evidence in the setting of transvaginal cervical cerclage by reviewing the published data on selected perioperative strategies. They elected to perform a systematic review, as opposed to a narrative review (a simple opinion piece), because this approach follows an explicit process designed to limit bias and random error in the interpretation of scientific research.
The studies they analyzed vary from observational investigations to randomized trials, generating considerable heterogeneity in the data. Therefore, it would not have been feasible or appropriate for them to combine the results in a quantitative review (ie, meta-analysis). Their solution: to limit the analysis to a qualitative systematic review.
The term “systematic review” implies that investigators have an accurate and comprehensive understanding of existent data, with each study representing one contribution to a much larger body of knowledge. Over the years, Berghella and colleagues have contributed extensively to the literature on cervical cerclage and are well qualified to provide an analytic framework for the flood of published information on this practice. Although they focused primarily on how to perform cerclage, a discussion of when to perform cerclage cannot be separated from any consideration of efficacy.
When, exactly, is cerclage indicated?
The original indication for cerclage, established more than 50 years ago, required both a history of second-trimester loss and asymptomatic cervical changes in the current pregnancy. Since then, many cerclages have been performed on the basis of history alone or on current cervical changes regardless of history. However, the most recent professional guidelines reconfirm that any cerclage procedure should be supported by both historical and contemporaneous findings.1,2
Investigators have demonstrated that the measurement of cervical length by transvaginal ultrasound should generally be an integral part of clinical evaluation for asymptomatic cervical changes. Indeed, sonographic assessment has emerged as a tool capable of reducing “overcall” and unnecessary intervention.3 On the other hand, a meta-analysis of four randomized trials of ultrasound-indicated cerclage found it to be beneficial in women with a short cervix only if they also had a history of preterm delivery.4
In addition, randomized trials have documented a benefit for cerclage in two other clinical contexts:
- Results from a secondary analysis of data from a large randomized trial published in 1993 suggest that elective cerclage can be based on history alone in women with three or more second-trimester losses or preterm births.5
- Authors of a randomized trial published in 2003 suggested that women with advanced cervical changes, such as dilatation of the external os with exposure of the fetal membranes, may benefit from “emergency” cerclage even in the absence of a prior preterm delivery.6
How the data were analyzed
The data included in the review were analyzed separately, according to three widely accepted indications for cerclage:
- history-indicated: a history of three or more second-trimester losses and/or preterm births
- ultrasound-indicated: ultrasonographic detection of a cervical length of less than 25 mm, as measured by transvaginal ultrasound, in a woman with a history of second-trimester loss or preterm birth
- physical-examination–indicated: physical examination (manual or with a speculum) that confirms a dilated cervix.
Granted, this terminology can be confusing, as in the case of ultrasound-indicated cerclage, which includes aspects of the patient’s history. Moreover, I doubt that the studies included in this analysis always adhered to these definitions. The heterogeneity of the study population and the ambiguity of these definitions may limit the applicability of findings. In fact, they constitute the major (albeit practically unavoidable) limitation of this review.
The optimal approach to subclinical infection is unclear
Although there is a consensus that overt intra-amniotic infection is an absolute contraindication to cerclage, the implications of subclinical intra-amniotic infection in asymptomatic women are unclear. About 50% of women considered for emergency cerclage are likely to have intra-amniotic infection.7 An ongoing randomized trial is expected to elucidate the benefit of precerclage amniocentesis in such cases.
The sonographic detection of sludge in the amniotic fluid also has been associated with intra-amniotic infection. However, after analyzing the data, Berghella and colleagues did not find adequate justification for amniocentesis in this setting. A more practical question might be whether cerclage is advisable at all when sludge is present. Data from a recently reported abstract suggest that the presence of sludge increases the likelihood of early preterm birth independent of cervical length.8
Other gray areas
Another absolute contraindication to cerclage is the presence of painful uterine contractions in a woman exhibiting cervical change. The study findings seemed to imply that when uterine contractions are detected via tocodynamometric monitoring but are not experienced by the patient, cerclage may be appropriate. In my opinion, this issue represents another open clinical question.
On at least one occasion, I have discovered that the patient scheduled for cerclage has not undergone preoperative screening for genital tract infections. In such a scenario, it is unclear whether it is best to cancel the procedure or to proceed. Berghella and colleagues concluded that evidence is insufficient to support routine, universal screening for genital tract infection prior to cerclage. In the absence of risk factors for infection, it may be appropriate to proceed with cerclage.
The issue of combined use of cerclage and 17α hydroxyprogesterone caproate also was addressed in this review. Berghella and colleagues recommended that progestin supplementation be continued if cerclage is subsequently performed. I, too, follow this approach, although the two interventions (progestin followed by cerclage) have not been studied in this sequence.
Related article: A stepwise approach to cervical cerclage (June 2012)
Data are limited, and conflicting, on the use of 17α hydroxyprogesterone caproate after cerclage. A small randomized trial suggested benefit,9 while a retrospective cohort study10 and a secondary analysis of data from a randomized trial of cerclage11 found no benefit for the addition of 17α hydroxyprogesterone caproate.
Berghella and colleagues advocated against reinforcing (second or repeat) cerclage, an intervention that may be associated with a higher incidence of preterm birth.12 Accordingly, continuing sonographic assessment of cervical length after cerclage may be futile. What this evidence means for practice
Increasing evidence suggests that cervical shortening is not limited to an innate or acquired cervical weakness but represents an early, asymptomatic phase on the pathway to preterm birth. Nevertheless, cerclage continues to be practiced widely and has been shown to be beneficial in selected populations.
We clinicians often face complex cases of presumed cervical insufficiency for which there are no simple or unequivocal recommendations. This appraisal by Berghella and colleagues will help us separate evidence-validated approaches from misconceptions in the technical aspects of cerclage.
--Alex C. Vidaeff, MD, MPH
We want to hear from you! Tell us what you think.
- Royal College of Obstetricians and Gynaecologists. Cervical cerclage [guidelines]. http://www.rcog.org.uk/womens-health/clinical-guidance/cervical-cerclage-green-top-60. Accessed September 18, 2013.
- ACOG Practice Bulletin #130: Prediction and prevention of preterm birth. Obstet Gynecol. 2012;120:964–973.
- Grimes-Dennis J, Berghella V. Cervical length and prediction of preterm delivery. Curr Opin Obstet Gynecol. 2007;19(2):191–195.
- Berghella V, Odibo AO, To MS, et al. Cerclage for short cervix on ultrasound: meta-analysis of trials using individual patient-level data. Obstet Gynecol. 2005;106(1):181–189.
- Working Party on Cervical Cerclage. Final report of the Medical Research Council/Royal College of Obstetricians and Gynaecologists multicenter randomised trial of cervical cerclage. Br J Obstet Gynaecol. 1993;100(6):516–523.
- Althuisius SM, Dekker GA, Hummel P, van Geijin HP. Cervical incompetence prevention randomized cerclage trial: emergency cerclage with bed rest versus bed rest alone. Am J Obstet Gynecol. 2003;189(4):907–910.
- Romero R, Gonzalez R, Sepulveda W, et al. Infection and labor. VIII. Microbial invasion of the amniotic cavity in patients with suspected cervical incompetence: prevalence and clinical significance. Am J Obstet Gynecol. 1992(4 Pt 1);167:1086–1091.
- Saade G. Cervical funneling or intraamniotic debris and preterm birth in nulliparous women with short cervix. Am J Obstet Gynecol. 2013;208(1):S4.
- Yemini M, Borenstein R, Dreazen E, et al. Prevention of premature labor by 17 alpha-hydroxyprogesterone caproate. Am J Obstet Gynecol. 1985;151(5):574–577.
- Rebarber A, Cleary-Goldman J, Istwan NB, et al. The use of 17 alpha-hydroxyprogesterone caproate (17P) in women with cervical cerclage. Am J Perinatol. 2008;25(5):271–275.
- Berghella V, Figueroa D, Szychowski JM, et al. 17 alpha-hydroxyprogesterone caproate for the prevention of preterm birth in women with prior preterm birth and a short cervical length. Am J Obstet Gynecol. 2010;202(4):351.e1–e6.
- Baxter JK, Airoldi J, Berghella V. Short cervical length after history-indicated cerclage: is a reinforcing cerclage beneficial? Am J Obstet Gynecol. 2005;193(3 Pt 2):1204–1207.
In young hysterectomized women, does unopposed estrogen therapy increase overall survival?
During the 1990s, more than 90% of hysterectomized women aged 50 to 59 years used ET following the procedure. When the initial findings of the WHI were published in 2002, they prompted many women to refuse or discontinue ET—despite the fact that the initial findings concerned the use of estrogen and progestin in combination in women with an intact uterus. Today, only some 30% of women use ET after hysterectomy.
When findings from the WHI estrogen-only arm were eventually published, they revealed that ET reduces mortality among women 50 to 59 years old, compared with placebo. Although most of the reduction in mortality relates to fewer deaths from coronary heart disease, a decline in deaths from breast cancer also was seen.2,3
Sarrel and colleagues calculated the excess mortality among US women aged 50 to 59 that could have been prevented by ET during the decade from 2002 through 2011. Their estimates ranged from approximately 19,000 deaths to as many as 92,000 deaths.
By calling attention to the negative health consequences of estrogen avoidance in young hysterectomized women, Sarrel and colleagues have performed a valuable public service.
Plethora of WHI data may have contributed to confusion
The WHI clinical trials have produced numerous analyses in various subsets of women. The sheer volume of data may be daunting in some cases, and likely has led to a failure to distinguish between estrogen-only and estrogen-progestin therapy, which have very different safety profiles.
Further, some clinicians and many patients have overlooked the fact that the risk-benefit profile of hormone therapy (both estrogen-only and estrogen-progestin therapy) is more favorable in younger, recently menopausal women than it is in older women.
I encounter evidence of this unwarranted fear of ET in my practice, with highly symptomatic, recently menopausal women who are appropriate candidates for hormone therapy electing to refuse the most effective treatment for menopausal symptoms.
Of course, hormone therapy, like all medications, has risks as well as benefits. For example, oral ET increases the risk of venous thrombosis and stroke, and long-term use of estrogen-progestin therapy increases the risk of breast cancer. However, the overblown fears of estrogen therapy have caused many appropriate candidates to miss out on symptom relief, prevention of osteoporosis, and treatment of symptomatic genital atrophy.
What this evidence means for practice
This provocative report demonstrates that wholesale avoidance of hormone therapy can have important negative public health consequence.
--Andrew M. Kaunitz, MD
We want to hear from you! Tell us what you think.
1. Rossouw JE, Anderson GL, Prentice RL, et al; Writing Group for the Women’s Health Initiative Investigators. Risks and benefits of estrogen plus progestin in healthy postmenopausal women: principal results From the Women’s Health Initiative randomized controlled trial. JAMA. 2002;288(3):321–333.
2. LaCroix AZ, Chlebowski RT, Manson JE, et al; WHI Investigators. Health outcomes after stopping conjugated equine estrogens among postmenopausal women with prior hysterectomy: a randomized controlled trial. JAMA. 2011;305(13):1305–1314.
3. Anderson GL, Chlebowski RI, Aragaki AK, et al. Conjugated equine estrogen and breast cancer incidence and mortality in postmenopausal women with hysterectomy: extended follow-up of the Women’s Health Initiative randomized placebo-controlled trial. Lancet Oncol. 2012; 13(5):476–486.
During the 1990s, more than 90% of hysterectomized women aged 50 to 59 years used ET following the procedure. When the initial findings of the WHI were published in 2002, they prompted many women to refuse or discontinue ET—despite the fact that the initial findings concerned the use of estrogen and progestin in combination in women with an intact uterus. Today, only some 30% of women use ET after hysterectomy.
When findings from the WHI estrogen-only arm were eventually published, they revealed that ET reduces mortality among women 50 to 59 years old, compared with placebo. Although most of the reduction in mortality relates to fewer deaths from coronary heart disease, a decline in deaths from breast cancer also was seen.2,3
Sarrel and colleagues calculated the excess mortality among US women aged 50 to 59 that could have been prevented by ET during the decade from 2002 through 2011. Their estimates ranged from approximately 19,000 deaths to as many as 92,000 deaths.
By calling attention to the negative health consequences of estrogen avoidance in young hysterectomized women, Sarrel and colleagues have performed a valuable public service.
Plethora of WHI data may have contributed to confusion
The WHI clinical trials have produced numerous analyses in various subsets of women. The sheer volume of data may be daunting in some cases, and likely has led to a failure to distinguish between estrogen-only and estrogen-progestin therapy, which have very different safety profiles.
Further, some clinicians and many patients have overlooked the fact that the risk-benefit profile of hormone therapy (both estrogen-only and estrogen-progestin therapy) is more favorable in younger, recently menopausal women than it is in older women.
I encounter evidence of this unwarranted fear of ET in my practice, with highly symptomatic, recently menopausal women who are appropriate candidates for hormone therapy electing to refuse the most effective treatment for menopausal symptoms.
Of course, hormone therapy, like all medications, has risks as well as benefits. For example, oral ET increases the risk of venous thrombosis and stroke, and long-term use of estrogen-progestin therapy increases the risk of breast cancer. However, the overblown fears of estrogen therapy have caused many appropriate candidates to miss out on symptom relief, prevention of osteoporosis, and treatment of symptomatic genital atrophy.
What this evidence means for practice
This provocative report demonstrates that wholesale avoidance of hormone therapy can have important negative public health consequence.
--Andrew M. Kaunitz, MD
We want to hear from you! Tell us what you think.
1. Rossouw JE, Anderson GL, Prentice RL, et al; Writing Group for the Women’s Health Initiative Investigators. Risks and benefits of estrogen plus progestin in healthy postmenopausal women: principal results From the Women’s Health Initiative randomized controlled trial. JAMA. 2002;288(3):321–333.
2. LaCroix AZ, Chlebowski RT, Manson JE, et al; WHI Investigators. Health outcomes after stopping conjugated equine estrogens among postmenopausal women with prior hysterectomy: a randomized controlled trial. JAMA. 2011;305(13):1305–1314.
3. Anderson GL, Chlebowski RI, Aragaki AK, et al. Conjugated equine estrogen and breast cancer incidence and mortality in postmenopausal women with hysterectomy: extended follow-up of the Women’s Health Initiative randomized placebo-controlled trial. Lancet Oncol. 2012; 13(5):476–486.

MGMA Surveys Make Hospitalists' Productivity Hard to Assess


The Medical Group Management Association (MGMA) surveys regard both a doctor who works the standard number of annual shifts their practice defines as full time, and a doctor who works many extra shifts, as one full-time equivalent (FTE). This can cause confusion when assessing productivity per FTE (see “SHM and MGMA Survey History,” right).
For example, consider a hospitalist who generated 4,000 wRVUs while working 182 shifts—the standard number of shifts to be full time in that doctor’s practice—during the survey year. In the same practice, another hospitalist worked 39 extra shifts over the same year for a total of 220 shifts, generating 4,860 wRVUs. If the survey contained only these two doctors, it would show them both as full time, with an average productivity per FTE of 4,430 wRVUs. But that would be misleading because 1.0 FTE worth of work as defined by their practice for both doctors would have come to 4,000 wRVUs generated while working 182 shifts.
In prior columns, I’ve highlighted some other numbers in hospitalist productivity and compensation surveys that can lead to confusion. But the MGMA survey methodology, which assigns a particular FTE to a single doctor, may be the most confusing issue, potentially leading to meaningful misunderstandings.
More Details on FTE Definition
MGMA has been conducting physician compensation and productivity surveys across essentially all medical specialties for decades. Competing organizations conduct similar surveys, but most regard the MGMA survey as the most relevant and valuable.
For a long time, MGMA has regarded as “full time” any doctor working 0.75 FTE or greater, using the respondent practice’s definition of an FTE. No single doctor can ever be counted as more than 1.0 FTE, regardless of how much extra the doctor may have worked. Any doctor working 0.35-0.75 FTE is regarded as part time, and those working less than 0.35 FTE are excluded from the survey report. The fact that each practice might have a different definition of what constitutes an FTE is addressed by having a large number of respondents in most medical specialties.
I’m uncertain how MGMA ended up not counting any single doctor as more than 1.0 FTE, even when they work a lot of extra shifts. But my guess is that for the first years, or even decades, that MGMA conducted its survey, few, if any, medical practices even had a strict definition of what constituted 1.0 FTE and simply didn’t keep track of which doctors worked extra shifts or days. So even if MGMA had wanted to know, for example, when a doctor worked extra shifts and should be counted as more than 1.0 FTE, few if any practices even thought about the precise number of shifts or days worked constituting full time versus what was an “extra” shift. So it probably made sense to simply have two categories: full time and part time.
As more practices began assigning FTE with greater precision, like nearly all hospitalist practices do, then using 0.75 FTE to separate full time and part time seemed practical, though imprecise. But keep in mind it also means that all of the doctors who work from 0.75 to 0.99 FTE (that is, something less than 1.0) offset, at least partially, those who work lots of extra shifts (i.e., above 1.0 FTE).
Data Application
My anecdotal experience is that a large portion of hospitalists, probably around half, work more shifts than what their practice regards as full time. I don’t know of any survey database that quantifies this, but my guess is that 25% to 35% of full-time hospitalists work extra shifts at their own practice, and maybe another 15% to 20% moonlight at a different practice. Let’s consider only those in the first category.
Chronic staffing shortages is one of the reasons hospitalists so commonly work extra shifts at their own practice. Extra shifts are sometimes even required by the practice to make up for open positions. And in some places, the hospitalists choose not to fill positions to preserve their ability to continue working more than the number of shifts required to be full time.
It would be great if we had a precise way to adjust the MGMA survey data for hospitalists who work above 1.0 FTE. For example, let’s make three assumptions so that we can then adjust the reported compensation and productivity data to remove the effect of the many doctors working extra shifts, thereby more clearly matching 1.0 FTE. These numbers are my guesses based on lots of anecdotal experience. But they are only guesses. Don’t make too much of them.
Assume 25% of hospitalists nationally work an average of 20% more than the full-time number of shifts for their practice. That is my best guess and intentionally leaves out those who moonlight for a practice other than their own.
Some portion of those working extra shifts (above 1.0 FTE) is offset by survey respondents working between 0.75 and 1.0 FTE, resulting in a wild guess of a net 20% of hospitalists working extra shifts.
Last, let’s assume that their productivity and compensation on extra shifts is identical to their “normal” shifts. This is not true for many practices, but when aggregating the data, it is probably reasonably close.
Using these assumptions (guesses, really), we can decrease both the reported survey mean and median productivity and compensation by about 5% to more accurately reflect results for hospitalists doing only the number of shifts required by the practice to be full time—no extra shifts. I’ll spare you the simple math showing how I arrived at the approximately 5%, but basically it is removing the 20% additional compensation and productivity generated by the net 20% of hospitalists who work extra shifts above 1.0 FTE.
Does It Really Matter?
The whole issue of hospitalists working many extra shifts yet only counting as 1.0 FTE in the MGMA survey might matter a lot for some, and others might see it as useless hand-wringing. As long as a meaningful number of hospitalists work extra shifts, then survey values for productivity and compensation will always be a little higher than the “average” 1.0 FTE hospitalists working no extra shifts. But it may still be well within the range of error of the survey anyway. And the compensation per unit of work (wRVUs or encounters) probably isn’t much affected by this FTE issue.
Dr. Nelson has been a practicing hospitalist since 1988. He is co-founder and past president of SHM, and principal in Nelson Flores Hospital Medicine Consultants. He is co-director for SHM’s “Best Practices in Managing a Hospital Medicine Program” course. Write to him at john.nelson@nelsonflores.com.
New Rules for Value-Based Purchasing, Readmission Penalties, Admissions


The View from
![]()
Looking for more information to formulate a plan of attack? SHM offers a variety of HVBP resources to orient hospitalists and hospital leaders. The “What Every Hospitalist Should Know About Hospital Value-Based Purchasing” webinar and SHM’s free resource library (www.hospitalmedicine.org/hvbp) offer basic orientation on what to expect on pay-for-performance-related issues. The HVBP resource center also provides multiple case studies from various hospitals across the country, with success stories related to reducing readmissions, increasing evidence-based care focus, and enhancing performance on core measures.
In order to proactively address CMS’ new 30-day readmissions criteria for COPD, SHM’s COPD Resource Center (www.hospitalmedicine.org/copd) provides hospitalists with the most up-to-date guidelines, reviews, and peer-reviewed clinical trials that define evidence-based practice for the care of the COPD patient.
Hospitalists not only are under pressure to help improve hospital-level performance, but also will need to begin reporting physician-level measures. Beginning in 2015, CMS’s Physician Quality Reporting System (PQRS) will apply a penalty to all physicians who do not satisfactorily report data on quality measures for covered professional services.
The time to act is now. Reporting during the 2013 PQRS program year will be used to determine whether a 1.5% penalty applies in 2015. SHM has partnered with CECity to offer discounted access to PQRIwizard, a tool that facilitates PQRS reporting through SHM’s Learning Portal (www.shmlearningportal.org).
October is the beginning of a new year—in this case, fiscal-year 2014 for the Centers for Medicare & Medicaid Services (CMS). It’s a time when the new rules kick in. This month, we’ll look at some highlights, focusing on the new developments affecting your practice. Because you are held accountable for hospital-side performance on programs such as hospital value-based purchasing (HVBP) and the Readmissions Reduction Program, a working knowledge of the 2014 edition of the programs is crucial.
Close the Loop on HVBP
How will your hospital get paid under the 2014 version of HVBP? This past July, your hospital received a report outlining how its Medicare payments will be affected based on your hospital’s performance on process of care (heart failure, pneumonia, myocardial infarction, and surgery), patient experience (HCAHPS), and outcomes (30-day mortality for heart failure, pneumonia, and myocardial infarction).
Here are two hypothetical hospitals and how their performance in the program affects their 2014 payment. As background, in 2014, all hospitals have their base diagnosis related group (DRG) payments reduced by 1.25% for HVBP. They can earn back some, all, or an amount in excess of the 1.25% based on their performance. Payment is based on performance during the April 1 to Dec. 31, 2012, period. Under HVBP, CMS incentive payments occur at the level of individual patients, each of which is assigned a DRG.
Let’s look at two examples:
Hospital 1
- Base DRG payment reduction: 1.25% (all hospitals).
- Portion of base DRG earned back based on performance (process/patient experience/outcome metrics): 1.48%.
- Net change in base DRG payment: +0.23%.
Hospital 2
- Base DRG payment reduction: 1.25% (all hospitals).
- Portion of base DRG earned back based on performance (process/patient experience/outcome metrics): 1.08%.
- Net change in base DRG payment: -0.17%.
Hospital 1 performed relatively well, getting a bump of 0.23% in its base DRG rate. Hospital 2 did not perform so well, so it took a 0.17% hit on its base DRG rate.
In order to determine total dollars made or lost for your hospital, one multiplies the total number of eligible Medicare inpatients for 2014 times the base DRG payment times the percent change in base DRG payment. If Hospital 1 has 10,000 eligible patients in 2014 and a base DRG payment of $5,000, the value is 10,000 x $5,000 x 0.0023 (0.23%) = $115,000 gained. Hospital 2, with the same number of patients and base DRG payment, loses (10,000 x $5,000 x 0.0017 = $85,000).
Readmissions and Penalties
For 2014, CMS is adding 30-day readmissions for COPD to readmissions for heart failure, pneumonia, and myocardial infarction for its penalty program. CMS added COPD because it is the fourth-leading cause of readmissions, according to a recent Medicare Payment Advisory Commission report, and because there is wide variation in the rates (from 18% to 25%) of COPD hospital readmissions.
For 2014, CMS raises the ceiling on readmission penalties to a maximum of 2% of reimbursement for all of a hospital’s Medicare inpatients. (The maximum hit during the first round of readmission penalties, which began in October 2012, was 1%.) More than 2,200 U.S. hospitals will face some financial penalty for excess 30-day readmissions.
Disappointingly, CMS did not add a risk adjustment for socioeconomic status despite being under pressure to do so. There is growing evidence that these factors have a major impact on readmission rates.1,2
New Definition of an Admission
Amidst confusion from many and major blowback from beneficiaries saddled with large out-of-pocket expenses for observation stays and subsequent skilled-nursing-facility stays, CMS is clarifying the definition of an inpatient admission. The agency will define an admission as a hospital stay that spans at least two midnights. If a patient is in the hospital for a shorter period of time, CMS will deem the patient to be on observation status, unless medical record documentation supports a physician’s expectation “that the beneficiary would need care spanning at least two midnights” but unanticipated events led to a shorter stay.
Plan of Attack
For HVBP, make contact with your director of quality to understand your hospital’s performance and payment for 2014. If you have incentive compensation riding on HVBP, make sure you understand how your employer or contracted hospital is calculating the payout (because, for example, the performance period was in 2012!) and that your hospitalist group understands the payout calculation.
For COPD readmissions prevention, ensure patients have a home management plan; appropriate specialist follow-up and that they understand medication use, including inhalers and supplemental oxygen; and that you consider early referral for pulmonary rehabilitation for eligible patients.
For the new definition of inpatient admission, work with your hospital’s physician advisor and case management to ensure your group is getting appropriate guidance on documentation requirements. You are probably being held accountable for your hospital’s total number of observation hours, so remember to track these metrics following implementation of the new rule, as they (hopefully) should decrease. If they do, take some of the credit!
References
- Joynt KE, Orav EJ, Jha AK. Thirty-day readmission rates for Medicare beneficiaries by race and site of care. JAMA. 2011;305(7):675-681.
- Lindenauer PK, Lagu T, Rothberg MB, et al. Income inequality and 30 day outcomes after acute myocardial infarction, heart failure, and pneumonia: retrospective cohort study. BMJ. 2013;346:f521.
Dr. Whitcomb is medical director of healthcare quality at Baystate Medical Center in Springfield, Mass. He is co-founder and past president of SHM. Email him at wfwhit@comcast.net.
MGMA Physician Compensation Survey Raises Questions About Performance Pay

Sorting out whether a hospitalist’s bonus and other compensation elements are in line with survey data often leads to confusion. The 2013 MGMA Physician Compensation and Production Survey report, based on 2012 data, shows median compensation of $240,352 for internal-medicine hospitalists (I’ll round it to $240,000 for the rest of this piece). So is your compensation in line with survey medians if your base pay is $230,000 and you have a performance bonus of up to $20,000?
The problem is that you can’t know in advance how much of the $20,000 performance bonus you will earn. And isn’t a bonus supposed to be on top of typical compensation? To be in line with the survey, shouldn’t your base pay equal the $240,000 median, with any available bonus dollars on top of that? (Base pay means all forms of compensation other than a performance bonus; it could be productivity-based compensation, pay connected to numbers of shifts or hours worked, or a fixed annual salary, etc.)
The short answer is no, and to demonstrate why, I’ll first review some facts about the survey itself, then apply that knowledge to the hospitalist marketplace.
I want to emphasize that in this article, I’m not taking a position on the right amount of workload, compensation, or bonus for any hospitalist practice. And I’m using survey medians just to simplify the discussion, not because they’re optimal for any particular practice.
Survey Data
The most important thing to know about the survey data is that the $240,000 figure takes into account all forms of pay, including extra shift pay and any bonuses that might have been paid to each provider in the data set. Such benefits as health insurance and retirement-plan contribution are not included in this figure.
There are several ways a hospitalist might have earned compensation that matches the survey median. He or she might have a fixed annual salary equal to the median with no bonus available or had a meaningful bonus (e.g. $10,000 to $20,000) available and failed to earn any of it. Or the base might have come to $230,000, and he or she earned half of the available $20,000 performance bonus. Many other permutations of bonus and other salary elements could occur to arrive at the same $240,000 figure.
The important thing to remember is that whatever bonus dollars were paid, they are included in the salary figure from the survey—not added on top of that figure. So if all bonus dollars earned were subtracted from the survey, the total “nonbonus” compensation would be lower than $240,000.
How much lower?
Typical Hospitalist Bonus Amounts
The MGMA survey doesn’t report the portion of compensation tied to a bonus, but SHM’s does. SHM’s 2012 State of Hospital Medicine Report, based on 2011 data (www.hospitalmedicine.org/survey), is based on the most recent data available, and it showed (on page 60) that an average of 7% of pay was tied to performance for nonacademic hospitalist groups serving adults only. This included any payments for good individual or group performance on quality, efficiency, service, satisfaction, and/or other nonproduction measures. In conversation, this often is referred to as a “bonus” rather than “performance compensation.”
One way to estimate the nonbonus compensation would be to reduce the total pay by 7%, which comes to $223,200. Keep in mind that there are all kinds of mathematical and methodological problems in manipulating the reported survey numbers from two separate surveys to derive additional benchmarks. But this seems like a reasonable guess.
An increasing portion of hospitalist groups have some pay tied to performance, and the portion of total pay tied to performance seems to be going up at least a little. It was 5% of pay in 2010 and 4% in 2011, compared with 7% in the 2012 survey.
Keep in mind two things. First, this 7% reflects the performance or bonus dollars actually paid out, not the total amount available. In other words, even if the median total bonus dollars available were 20% of compensation, hospitalists earned less than that. Some hospitalists earned all dollars available, and some earned only a portion of what was available. And second, some hospitalists fail to earn any bonus or don’t have one available at all. So the survey would show for them zero compensation tied to bonus.
Making Sense of the Numbers
If you follow the reasoning above, then you probably agree that if your goal is to match mean compensation from the MGMA survey (I’m not suggesting that is the best goal, merely using it for simplicity), then you would set nonbonus compensation 7% below median—as long as you’re likely to get the same portion of a bonus as the median practice.
In some practices, performance thresholds are set at a level that is very easy to achieve, meaning the hospitalists are almost guaranteed to get all of the bonus compensation available. To be consistent with survey medians, it would be appropriate for them to set nonbonus compensation by subtracting all bonus dollars from the survey median. For example, if a $20,000 bonus is available and all of it is likely to be earned by the hospitalists, then total nonbonus compensation would be $220,000.
However, what if the bonus requires significant improvements in performance by the doctors (which seems most appropriate to me; why have a bonus otherwise?) and it is likely they will earn only 25% of all bonus dollars available? If the total available bonus is $20,000, then something like 25%, or $5,000, should be subtracted from the median to yield a total nonbonus compensation of $235,000.
Simple Thinking
I think it makes most sense to set total nonbonus compensation below the targeted total compensation. Failure to achieve any performance thresholds means no bonus and compensation will be below target that year. Meeting some thresholds (some improvement in performance) should result in matching the target compensation, and truly terrific performance that meets or exceeds all thresholds should result in the doctor being paid above the target.
Dr. Nelson has been a practicing hospitalist since 1988. He is co-founder and past president of SHM, and principal in Nelson Flores Hospital Medicine Consultants. He is co-director for SHM’s “Best Practices in Managing a Hospital Medicine Program” course. Write to him at john.nelson@nelsonflores.com.
Patient Satisfaction Surveys Not Accurate Measure of Hospitalists’ Performance

Feeling frustrated with your group’s patient-satisfaction performance? Wondering why your chief (fill in the blank) officer glazes over when you try to explain why your hospitalist group’s Hospital Consumer Assessment of Healthcare Providers and System (HCAHPS) scores for doctor communication are in a percentile rivaling the numeric age of your children?
It is likely that the C-suite administrator overseeing your hospitalist group has a portion of their pay based on HCAHPS or other patient-satisfaction (also called patient experience) scores. And for good reason: The Centers for Medicare & Medicaid Services (CMS) Hospital Value-Based Purchasing (HVBP) program that started Oct. 1, 2012, has placed your hospital’s Medicare reimbursement at risk based on its HCAHPS scores.
HVBP and Patient Satisfaction
Patient satisfaction will remain an important part of HVBP in the coming years. Table 1 (below) shows the domains that will be included in fiscal years 2014 (which starts Oct. 1, 2013), 2015, and 2016. Table 2 (below) depicts the percent weighting the patient-satisfaction domain will receive through 2016. You may recall that HVBP is a program in which all hospitals place 1% to 2% (2013 through 2017, starting at 1% and increasing each year by 0.25% so that by 2017%, it is 2%) of their CMS inpatient payments in a withhold pool and, based on performance, can make back some, all, or an amount in excess of the amount placed in the withhold pool.
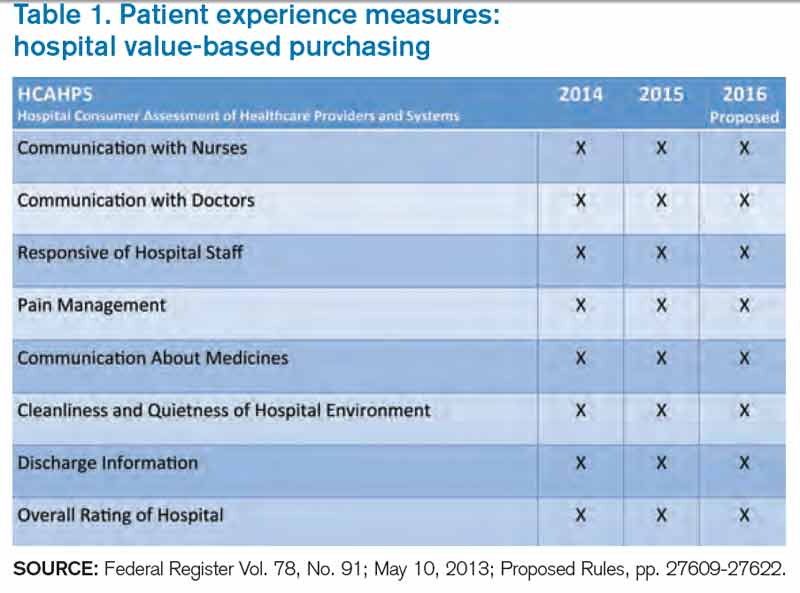
Source: Federal Register Vol. 78, No. 91; May 10, 2013; Proposed Rules, pp. 27609-27622.
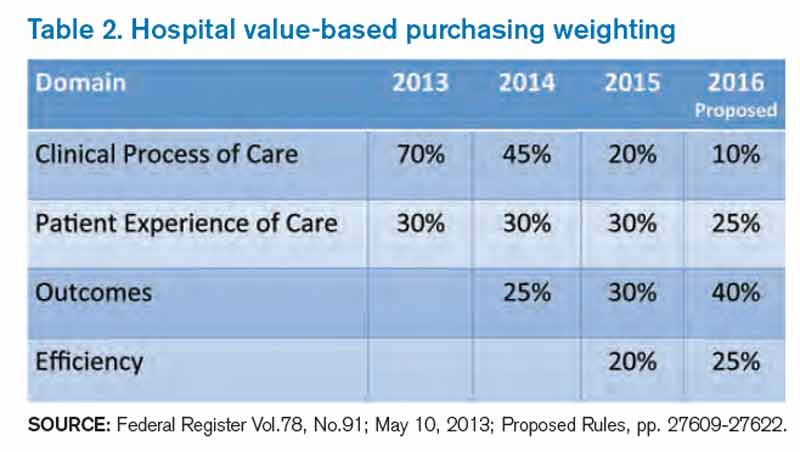
Source: Federal Register Vol.78, No.91; May 10, 2013; Proposed Rules, pp. 27609-27622.
End In Itself
A colleague of mine recently asked, “Is an increase in patient satisfaction associated with higher quality of care and better patient safety?” The point here: It doesn’t matter. Patient satisfaction is an end in itself, and we should strive to maximize it, or at least put ourselves in the place of the patient and design care accordingly.
For Hospitalists: A Starting Point
There is a conundrum for hospitalists vis-à-vis patient satisfaction. Follow this chain of logic: The hospitals at which we work are incented to perform well on the HCAHPS domains. Hospitals pay a lot for hospitalists. Hospitalists can impact many of the HCAHPS domains. So shouldn’t hospitalists be judged according to HCAHPS scores?
Yes and no.
HCAHPS as a survey is intended to measure a patient’s overall experience of receiving care in the hospital. For example, from the “Doctor Communication” domain, we have questions like “how often did doctors treat you with courtesy and respect?” And “how often did doctors explain things in a way you could understand?”
These questions, like all in HCAHPS, are not designed to get at individual doctor performance, or even performance of a group of doctors, such as hospitalists. Instead, they are designed to measure a patient’s overall experience with the hospitalization, and “Doctor Communication” questions are designed to assess satisfaction with “doctors” collectively.
The Need for Hospitalist-Specific Satisfaction Surveys
So while HCAHPS is not designed to measure hospitalist performance with regard to patient satisfaction, it is a reasonable interim step for hospitals to judge hospitalists according to HCAHPS. However, this should be a bridge to a strategy that adopts hospitalist-specific patient-satisfaction questionnaires in the future and not an end in itself.
Why? Perhaps the biggest reason is that HCAHPS scores are neither specific nor timely enough to form the basis of improvement efforts for hospitalists. If a hospitalist receives a low score on the “Doctor Communication” domain, the scores are likely to be three to nine months old. How can we legitimately assign (and then modify) behaviors based on those scores?
Further, because the survey is not built to measure patient satisfaction specifically with hospitalists, the results are unlikely to engender meaningful and sustained behavior change. Hospitalists I talk to are generally bewildered and confused by HCAHPS scores attributed to them or their groups. Even if they understand the scores, I almost never see true quality improvement (plan-do-study-act) based on specific HCAHPS results. Instead, I see hospitalists trying to adhere to “best practices,” with no adjustments made along the way based on performance.
Nearly all the prominent patient satisfaction vendors have developed a survey instrument specifically designed for hospitalists. Each has an approach to appropriately attribute performance to the hospitalist in question, and each has a battery of questions that is designed to capture patient satisfaction with the hospitalist. Although use of these surveys involves an added financial commitment, I submit that because hospitalists have an unparalleled proximity to hospitalized patients, such an investment is worthy of consideration and has an accompanying business case, thanks to HVBP. The results of these surveys may form the basis of legitimate, targeted feedback to hospitalists, who may then adjust their approach to patient interactions. Such performance improvement should result in improved HCAHPS scores.
In sum, hospitalists should pay close attention to patient satisfaction and embrace HCAHPS. However, we should be looking beyond HCAHPS to survey instruments that fairly and accurately measure our performance. Such surveys will be more widely accepted by the hospitalists they are measuring, and will allow hospitalists to perform meaningful quality improvement based on the results. Although hospitalist-specific surveys will require an investment, the increased patient satisfaction that results should be the basis of a favorable return on that investment.
Dr. Whitcomb is medical director of healthcare quality at Baystate Medical Center in Springfield, Mass. He is co-founder and past president of SHM. Email him at wfwhit@comcast.net.
Feeling frustrated with your group’s patient-satisfaction performance? Wondering why your chief (fill in the blank) officer glazes over when you try to explain why your hospitalist group’s Hospital Consumer Assessment of Healthcare Providers and System (HCAHPS) scores for doctor communication are in a percentile rivaling the numeric age of your children?
It is likely that the C-suite administrator overseeing your hospitalist group has a portion of their pay based on HCAHPS or other patient-satisfaction (also called patient experience) scores. And for good reason: The Centers for Medicare & Medicaid Services (CMS) Hospital Value-Based Purchasing (HVBP) program that started Oct. 1, 2012, has placed your hospital’s Medicare reimbursement at risk based on its HCAHPS scores.
HVBP and Patient Satisfaction
Patient satisfaction will remain an important part of HVBP in the coming years. Table 1 (below) shows the domains that will be included in fiscal years 2014 (which starts Oct. 1, 2013), 2015, and 2016. Table 2 (below) depicts the percent weighting the patient-satisfaction domain will receive through 2016. You may recall that HVBP is a program in which all hospitals place 1% to 2% (2013 through 2017, starting at 1% and increasing each year by 0.25% so that by 2017%, it is 2%) of their CMS inpatient payments in a withhold pool and, based on performance, can make back some, all, or an amount in excess of the amount placed in the withhold pool.
Source: Federal Register Vol. 78, No. 91; May 10, 2013; Proposed Rules, pp. 27609-27622.
Source: Federal Register Vol.78, No.91; May 10, 2013; Proposed Rules, pp. 27609-27622.
End In Itself
A colleague of mine recently asked, “Is an increase in patient satisfaction associated with higher quality of care and better patient safety?” The point here: It doesn’t matter. Patient satisfaction is an end in itself, and we should strive to maximize it, or at least put ourselves in the place of the patient and design care accordingly.
For Hospitalists: A Starting Point
There is a conundrum for hospitalists vis-à-vis patient satisfaction. Follow this chain of logic: The hospitals at which we work are incented to perform well on the HCAHPS domains. Hospitals pay a lot for hospitalists. Hospitalists can impact many of the HCAHPS domains. So shouldn’t hospitalists be judged according to HCAHPS scores?
Yes and no.
HCAHPS as a survey is intended to measure a patient’s overall experience of receiving care in the hospital. For example, from the “Doctor Communication” domain, we have questions like “how often did doctors treat you with courtesy and respect?” And “how often did doctors explain things in a way you could understand?”
These questions, like all in HCAHPS, are not designed to get at individual doctor performance, or even performance of a group of doctors, such as hospitalists. Instead, they are designed to measure a patient’s overall experience with the hospitalization, and “Doctor Communication” questions are designed to assess satisfaction with “doctors” collectively.
The Need for Hospitalist-Specific Satisfaction Surveys
So while HCAHPS is not designed to measure hospitalist performance with regard to patient satisfaction, it is a reasonable interim step for hospitals to judge hospitalists according to HCAHPS. However, this should be a bridge to a strategy that adopts hospitalist-specific patient-satisfaction questionnaires in the future and not an end in itself.
Why? Perhaps the biggest reason is that HCAHPS scores are neither specific nor timely enough to form the basis of improvement efforts for hospitalists. If a hospitalist receives a low score on the “Doctor Communication” domain, the scores are likely to be three to nine months old. How can we legitimately assign (and then modify) behaviors based on those scores?
Further, because the survey is not built to measure patient satisfaction specifically with hospitalists, the results are unlikely to engender meaningful and sustained behavior change. Hospitalists I talk to are generally bewildered and confused by HCAHPS scores attributed to them or their groups. Even if they understand the scores, I almost never see true quality improvement (plan-do-study-act) based on specific HCAHPS results. Instead, I see hospitalists trying to adhere to “best practices,” with no adjustments made along the way based on performance.
Nearly all the prominent patient satisfaction vendors have developed a survey instrument specifically designed for hospitalists. Each has an approach to appropriately attribute performance to the hospitalist in question, and each has a battery of questions that is designed to capture patient satisfaction with the hospitalist. Although use of these surveys involves an added financial commitment, I submit that because hospitalists have an unparalleled proximity to hospitalized patients, such an investment is worthy of consideration and has an accompanying business case, thanks to HVBP. The results of these surveys may form the basis of legitimate, targeted feedback to hospitalists, who may then adjust their approach to patient interactions. Such performance improvement should result in improved HCAHPS scores.
In sum, hospitalists should pay close attention to patient satisfaction and embrace HCAHPS. However, we should be looking beyond HCAHPS to survey instruments that fairly and accurately measure our performance. Such surveys will be more widely accepted by the hospitalists they are measuring, and will allow hospitalists to perform meaningful quality improvement based on the results. Although hospitalist-specific surveys will require an investment, the increased patient satisfaction that results should be the basis of a favorable return on that investment.
Dr. Whitcomb is medical director of healthcare quality at Baystate Medical Center in Springfield, Mass. He is co-founder and past president of SHM. Email him at wfwhit@comcast.net.
Which abnormal ovarian findings can be followed by serial TVUS?
Ovarian cancer causes more deaths than any other cancer affecting the female reproductive system.1 One reason it’s so deadly: It usually isn’t detected until it has reached an advanced stage. No clear-cut symptoms point definitively to ovarian malignancy, and no feasible screening strategy has been found to increase detection at an early stage.
Among the strategies that have been utilized to detect ovarian cancer are bimanual examination of the adnexae (primarily in postmenopausal women), measurement of cancer antigen (CA) 125, and transvaginal ultrasonography (TVUS) of the ovaries. The last two strategies sometimes are combined in high-risk women.
TVUS can highlight ovarian abnormalities and provide information about their structure. The question then becomes which abnormalities are likely to resolve without treatment, and which should be scrutinized more closely. In this study, Pavlik and colleagues reviewed TVUS findings from 39,337 women enrolled in the University of Kentucky Ovarian Cancer Screening Program, which involved 221,576 baseline and interval TVUS scans.
Details of the study
Women in this study were screened with annual TVUS scans between 1987 and 2002. The population included:
- asymptomatic women aged 50 or older
- asymptomatic women over age 25 who had a first- or second-degree relative with documented ovarian cancer.
The initial TVUS scan was normal in almost 90% of women, and only about 10% subsequently experienced an abnormal scan. About half (46.7%) of the ovarian abnormalities identified via TVUS were found on the very first scan. Of these, 63.2% resolved during follow-up with no treatment.
Approximately 80% of women had no abnormal TVUS findings at any time during the observation period. This is notable because participants had a high risk for ovarian cancer by virtue of advanced age or family history.
TVUS abnormalities had a higher prevalence in premenopausal women (35%) than in postmenopausal women (17%; P<.001). The incidence of ovarian cysts also was significantly higher among premenopausal women (15.3% vs 8.2%; P<.001). These differences are to be expected, owing to the functional nature of premenopausal ovaries in regard to folliculogenesis, ovulation, and endometriosis.
Positive predictive values ranged from 15.3% to 24.7%
Over the 25 years covered by this study, our understanding of the malignant potential of various ovarian masses has evolved considerably. We have long known that unilocular cysts are extremely unlikely to be malignant, but now we are aware that even septated cysts are unlikely to represent cancer.
As for the success of this ovarian cancer-screening program, which identified 85 true malignancies and 472 nonmalignancies in surgical specimens, it had an overall positive predictive value of 15.3%. After January 1, 2008, however, when serial observation expanded to include septated cysts (because published data confirmed these masses to have low malignant potential), positive predictive value improved to 24.7%.
Pavlik and colleagues also discussed findings from the Prostate, Lung, Colorectal, and Ovarian (PLCO) Cancer Screening Trial, which relied on a single TVUS abnormality to trigger a recommendation for surgery, with a positive predictive value of only 5.1%.2
Most cancers were diagnosed at an early stage
Of the invasive epithelial cancers identified in this study, the stage distribution at diagnosis was:
- Stage 1: 45%
- Stage 2: 23%
- Stage 3: 32%
- Stage 4: None.
This finding is notable, given statistics from the “real world,” where about 80% of ovarian cancers are diagnosed at Stage 3 or Stage 4.
Among benign findings that were managed surgically, 47% were serous cystadenomas, 13% were hemorrhagic cysts, 9% were fibromas, thecomas, or Brenner tumors, and the rest were fairly equally divided between hydrosalpinx or paratubal cysts; endometriomas; and mucinous cystadenomas, leiomyomas, and cystic teratomas.
What this evidence means for practice
In general, unilocular or septate cysts can be followed every 6 months by TVUS. Although more complex tumors may resolve spontaneously, they should be followed with serial TVUS, with caution, at intervals of 6 weeks to 3 months. The findings of each scan should determine the subsequent course of action, which could involve further monitoring or surgical extirpation.
Regrettably, this study did not utilize color flow Doppler imaging. Because malignant tumors are rich in neovascularity, and the vessels laid down by such tumors often lack a normal media layer, they often exhibit very low resistance to flow. Although neovascularity is not a perfect diagnostic indicator of malignancy, the presence of abundant blood flow and low resistance can raise the index of suspicion. In my opinion, color flow Doppler should be incorporated into ultrasonographic evaluation of potential ovarian malignancies.
—Steven R. Goldstein, MD
Tell us what you think, at rbarbieri@frontlinemedcom.com. Please include your name and city and state.
1. American Cancer Society. Cancer Facts and Figures, 2013. http://www.cancer.org/acs/groups/content/@e p i d e m i o l o g y s u r v e i l a n c e / d o c u m e n t s / d o c u m e n t/acspc-036845.pdf. Accessed August 20, 2013.
2. Buys SS, Partridge E, Black A, et al. Effect of screening on ovarian cancer mortality—the Prostate, Lung, Colorectal and Ovarian (PLCO) Cancer Screening Randomized Controlled Trial. JAMA. 2011;305(22):2295–2303.
Ovarian cancer causes more deaths than any other cancer affecting the female reproductive system.1 One reason it’s so deadly: It usually isn’t detected until it has reached an advanced stage. No clear-cut symptoms point definitively to ovarian malignancy, and no feasible screening strategy has been found to increase detection at an early stage.
Among the strategies that have been utilized to detect ovarian cancer are bimanual examination of the adnexae (primarily in postmenopausal women), measurement of cancer antigen (CA) 125, and transvaginal ultrasonography (TVUS) of the ovaries. The last two strategies sometimes are combined in high-risk women.
TVUS can highlight ovarian abnormalities and provide information about their structure. The question then becomes which abnormalities are likely to resolve without treatment, and which should be scrutinized more closely. In this study, Pavlik and colleagues reviewed TVUS findings from 39,337 women enrolled in the University of Kentucky Ovarian Cancer Screening Program, which involved 221,576 baseline and interval TVUS scans.
Details of the study
Women in this study were screened with annual TVUS scans between 1987 and 2002. The population included:
- asymptomatic women aged 50 or older
- asymptomatic women over age 25 who had a first- or second-degree relative with documented ovarian cancer.
The initial TVUS scan was normal in almost 90% of women, and only about 10% subsequently experienced an abnormal scan. About half (46.7%) of the ovarian abnormalities identified via TVUS were found on the very first scan. Of these, 63.2% resolved during follow-up with no treatment.
Approximately 80% of women had no abnormal TVUS findings at any time during the observation period. This is notable because participants had a high risk for ovarian cancer by virtue of advanced age or family history.
TVUS abnormalities had a higher prevalence in premenopausal women (35%) than in postmenopausal women (17%; P<.001). The incidence of ovarian cysts also was significantly higher among premenopausal women (15.3% vs 8.2%; P<.001). These differences are to be expected, owing to the functional nature of premenopausal ovaries in regard to folliculogenesis, ovulation, and endometriosis.
Positive predictive values ranged from 15.3% to 24.7%
Over the 25 years covered by this study, our understanding of the malignant potential of various ovarian masses has evolved considerably. We have long known that unilocular cysts are extremely unlikely to be malignant, but now we are aware that even septated cysts are unlikely to represent cancer.
As for the success of this ovarian cancer-screening program, which identified 85 true malignancies and 472 nonmalignancies in surgical specimens, it had an overall positive predictive value of 15.3%. After January 1, 2008, however, when serial observation expanded to include septated cysts (because published data confirmed these masses to have low malignant potential), positive predictive value improved to 24.7%.
Pavlik and colleagues also discussed findings from the Prostate, Lung, Colorectal, and Ovarian (PLCO) Cancer Screening Trial, which relied on a single TVUS abnormality to trigger a recommendation for surgery, with a positive predictive value of only 5.1%.2
Most cancers were diagnosed at an early stage
Of the invasive epithelial cancers identified in this study, the stage distribution at diagnosis was:
- Stage 1: 45%
- Stage 2: 23%
- Stage 3: 32%
- Stage 4: None.
This finding is notable, given statistics from the “real world,” where about 80% of ovarian cancers are diagnosed at Stage 3 or Stage 4.
Among benign findings that were managed surgically, 47% were serous cystadenomas, 13% were hemorrhagic cysts, 9% were fibromas, thecomas, or Brenner tumors, and the rest were fairly equally divided between hydrosalpinx or paratubal cysts; endometriomas; and mucinous cystadenomas, leiomyomas, and cystic teratomas.
What this evidence means for practice
In general, unilocular or septate cysts can be followed every 6 months by TVUS. Although more complex tumors may resolve spontaneously, they should be followed with serial TVUS, with caution, at intervals of 6 weeks to 3 months. The findings of each scan should determine the subsequent course of action, which could involve further monitoring or surgical extirpation.
Regrettably, this study did not utilize color flow Doppler imaging. Because malignant tumors are rich in neovascularity, and the vessels laid down by such tumors often lack a normal media layer, they often exhibit very low resistance to flow. Although neovascularity is not a perfect diagnostic indicator of malignancy, the presence of abundant blood flow and low resistance can raise the index of suspicion. In my opinion, color flow Doppler should be incorporated into ultrasonographic evaluation of potential ovarian malignancies.
—Steven R. Goldstein, MD
Tell us what you think, at rbarbieri@frontlinemedcom.com. Please include your name and city and state.
1. American Cancer Society. Cancer Facts and Figures, 2013. http://www.cancer.org/acs/groups/content/@e p i d e m i o l o g y s u r v e i l a n c e / d o c u m e n t s / d o c u m e n t/acspc-036845.pdf. Accessed August 20, 2013.
2. Buys SS, Partridge E, Black A, et al. Effect of screening on ovarian cancer mortality—the Prostate, Lung, Colorectal and Ovarian (PLCO) Cancer Screening Randomized Controlled Trial. JAMA. 2011;305(22):2295–2303.
Has the evidence tipped in favor of delayed cord clamping?
In December 2012, the American College of Obstetricians and Gynecologists
(ACOG) published a Committee Opinion on the timing of umbilical cord clamping after birth, but it found insufficient evidence to recommend early or delayed clamping.1
In a Cochrane review published earlier this year, McDonald and colleagues reviewed 15 trials and 3,911 mother-infant pairs, exploring the primary outcomes of severe maternal postpartum hemorrhage (≥1,000 mL), maternal death, and severe maternal morbidity and neonatal death associated with early versus delayed clamping. They also analyzed a number of secondary outcomes. None of the primary outcomes reached statistical significance.
In a statement from the World Health Organization (WHO) included in the Cochrane review, it was recommended that “the cord should not be clamped earlier than necessary”; the WHO graded this as a “weak recommendation”
based on “low-quality” evidence.
With such underwhelming evidence, I would guess that the average clinician does not feel very motivated to change his or her practice, if that practice involves early clamping.
One limitation of the Cochrane findings
In the studies included in the Cochrane review, there was marked heterogeneity in the definition of delayed cord clamping, which ranged
from 1 minute after delivery to the complete cessation of cord pulsation (~5 minutes). Some of the studies even used alternate times (2 minutes, 3 minutes, and so on).
Delayed clamping improved neonatal hemoglobin status
Among the secondary outcomes assessed in this review was an improvement in neonatal hemoglobin concentration and overall iron stores associated with delayed clamping—but this benefit came at the expense of a higher incidence of neonatal jaundice requiring phototherapy. As a result, the investigators
concluded that delayed cord clamping should be performed when there is ready
access to phototherapy.
Should we implement delayed clamping?
At this time, I am reluctant to recommend that we shift to delayed clamping. Here are my reasons:
- Data are lacking as to whether increased hemoglobin levels and iron stores in newborns improve outcomes—or provide any benefit. No long-term developmental outcome data were included in the Cochrane review.
- Although I am not a pediatrician, I am unaware of infant iron deficiency being a significant threat to public health in the developed world.
- The greater need for phototherapy in the delayed-clamping group should not be viewed as inconsequential.
- Iron supplementation is probably more readily available than phototherapy, especially in developing countries.
- In the minority of cases in which delayed clamping might be beneficial (eg, prematurity), it is not always feasible, as these infants may already be compromised. Anxious neonatologists generally want the newborn handed over to them for resuscitation as quickly as possible, generally frowning upon a delay of 3 to 5 minutes for the blood to move from the placenta to the infant.
What this evidence means for practice
I recommend that obstetric care providers continue their current practice until more detailed data emerge on the risks and benefits of delayed clamping. If a patient asks about the issue, we should counsel her about the risks and benefits of early versus delayed clamping and comply with her choice when there are no contraindications.
—John T. Repke, MD
Tell us what you think, at rbarbieri@frontlinemedcom.com. Please include your name and city and state.
Reference
1. American College of Obstetricians and Gynecologists. Committee Opinion #543: Timing of umbilical cord clamping after birth. Obstet Gynecol. 2012:120(6):1522–1526.

John T. Repke, MD
University Professor and Chairman, Department of Obstetrics and Gynecology, Penn State University College of Medicine, and Obstetrician-Gynecologist-in-Chief, Milton S. Hershey Medical Center, Hershey, Pennsylvania. Dr. Repke serves on the OBG Management Board of Editors.
The author reports no financial relationships relevant to this article.
In December 2012, the American College of Obstetricians and Gynecologists
(ACOG) published a Committee Opinion on the timing of umbilical cord clamping after birth, but it found insufficient evidence to recommend early or delayed clamping.1
In a Cochrane review published earlier this year, McDonald and colleagues reviewed 15 trials and 3,911 mother-infant pairs, exploring the primary outcomes of severe maternal postpartum hemorrhage (≥1,000 mL), maternal death, and severe maternal morbidity and neonatal death associated with early versus delayed clamping. They also analyzed a number of secondary outcomes. None of the primary outcomes reached statistical significance.
In a statement from the World Health Organization (WHO) included in the Cochrane review, it was recommended that “the cord should not be clamped earlier than necessary”; the WHO graded this as a “weak recommendation”
based on “low-quality” evidence.
With such underwhelming evidence, I would guess that the average clinician does not feel very motivated to change his or her practice, if that practice involves early clamping.
One limitation of the Cochrane findings
In the studies included in the Cochrane review, there was marked heterogeneity in the definition of delayed cord clamping, which ranged
from 1 minute after delivery to the complete cessation of cord pulsation (~5 minutes). Some of the studies even used alternate times (2 minutes, 3 minutes, and so on).
Delayed clamping improved neonatal hemoglobin status
Among the secondary outcomes assessed in this review was an improvement in neonatal hemoglobin concentration and overall iron stores associated with delayed clamping—but this benefit came at the expense of a higher incidence of neonatal jaundice requiring phototherapy. As a result, the investigators
concluded that delayed cord clamping should be performed when there is ready
access to phototherapy.
Should we implement delayed clamping?
At this time, I am reluctant to recommend that we shift to delayed clamping. Here are my reasons:
- Data are lacking as to whether increased hemoglobin levels and iron stores in newborns improve outcomes—or provide any benefit. No long-term developmental outcome data were included in the Cochrane review.
- Although I am not a pediatrician, I am unaware of infant iron deficiency being a significant threat to public health in the developed world.
- The greater need for phototherapy in the delayed-clamping group should not be viewed as inconsequential.
- Iron supplementation is probably more readily available than phototherapy, especially in developing countries.
- In the minority of cases in which delayed clamping might be beneficial (eg, prematurity), it is not always feasible, as these infants may already be compromised. Anxious neonatologists generally want the newborn handed over to them for resuscitation as quickly as possible, generally frowning upon a delay of 3 to 5 minutes for the blood to move from the placenta to the infant.
What this evidence means for practice
I recommend that obstetric care providers continue their current practice until more detailed data emerge on the risks and benefits of delayed clamping. If a patient asks about the issue, we should counsel her about the risks and benefits of early versus delayed clamping and comply with her choice when there are no contraindications.
—John T. Repke, MD
Tell us what you think, at rbarbieri@frontlinemedcom.com. Please include your name and city and state.
Reference
1. American College of Obstetricians and Gynecologists. Committee Opinion #543: Timing of umbilical cord clamping after birth. Obstet Gynecol. 2012:120(6):1522–1526.
Reference
1. American College of Obstetricians and Gynecologists. Committee Opinion #543: Timing of umbilical cord clamping after birth. Obstet Gynecol. 2012:120(6):1522–1526.