User login
John Nelson, MD: A New Hospitalist

Ben was just accepted to med school!!! Hopefully, more acceptances will be forthcoming. We are very proud of Ben for all his hard work. Another doctor in the family.
I was delighted to find the above message from an old friend in my inbox. It got me thinking: Will Ben become a hospitalist? Will he join his dad’s hospitalist group? Will his dad encourage him to pursue a hospitalist career or something else?
Early Hospitalist Practice
The author of that email was Ben’s dad, Chuck Wilson. Chuck is the reason I’m a hospitalist. He was a year ahead of me in residency, and while still a resident, he somehow connected with a really busy family physician in town who was looking for someone to manage his hospital patients. Not one to be bound by convention, Chuck agreed to what was at the time a nearly unheard-of arrangement. He finished residency, joined the staff of the community hospital across town from our residency, and began caring for the family physician’s hospital patients. Within days, he was fielding calls from other doctors asking him to do the same for them. Within weeks of arriving, he had begun accepting essentially all unassigned medical admissions from the ED. This was in the 1980s; Chuck was among the nation’s first real hospitalists.
I don’t think Chuck spent any time worrying about how his practice was so different from the traditional internists and family physicians in the community. He was confident he was providing a valuable service to his patients and the medical community. The rapid growth in his patient census was an indicator he was on to something, and soon he and I began talking. He was looking for a partner.
In November of my third year of residency, I decided I would put off my endocrinology fellowship for a year or two and join Chuck in his new practice. From our conversations, I anticipated that I would care for exactly the kinds of patients that filled nearly all of my time as a resident. I wouldn’t need to learn the new skills in ambulatory medicine, and wouldn’t need to make the long-term commitment expected to join a traditional primary-care practice. And I would earn a competitive compensation and have a flexible lifestyle. I soon realized that hospitalist practice provided me with all of these advantages, so more than two decades later, I still haven’t gotten around to completing the application for an endocrine fellowship.
A Loose Arrangement
For the first few years, Chuck and I didn’t bother to have any sort of legal agreement with each other. We shook hands and agreed to a “reap what you till” form of compensation, which meant we didn’t have to work exactly the same amount, and never had disagreements about how practice revenue was divided between us.
Because of Chuck’s influence, we had miniscule overhead expenses, most likely less than 10% of revenue. We each bought our own malpractice insurance, paid our biller a percent of collections, and rented a pager. That was about it for overhead.
We had no rigid scheduling algorithm, the only requirement being that at least one of us needed to be working every day. Both of us worked most weekdays, but we took time off whenever it suited us. Our scheduling meetings were usually held when we bumped into one another while rounding and went something like this:
“You OK if I take five days off starting tomorrow?”
“Sure. That’s fine.”
Meeting adjourned.
For years, we had no official name for our practice. This became a bigger issue when our group had grown to four doctors, so we defaulted to referring to the group by the first letter of the last name of each doctor, in order of tenure: The WNKL Group. A more formal name was to follow a few years later when the group was even larger, but I’ve taken delight in hearing that WNKL has persisted in some places and documents around the hospital years later, even though N, K, and L left the group long ago.
In the first few years, we never thought about developing clinical protocols or measuring our efficiency or clinical effectiveness. Chuck was confident that compared to the traditional primary-care model, we were providing higher-quality care at a lower cost. But I wasn’t so sure. After a few years, we began seeing hospital data showing that our cost per case tended to be lower, and what little data we could get regarding our quality of care suggested that it was about the same, and in some cases might be better.
A principal reason the practice has survived more than 25 years is that other than a small “tax” during their first 18 months (mainly to cover the cost of recruiting them), new doctors were regarded as equals in the business. Chuck and subsequent doctors never tried to gain an advantage over newer doctors by trying to claim a greater share of the practice’s revenue or decision-making authority.
Chuck is still in the same group he founded. In 2000, I was lured away by the chance to start a new group and live in a place that both my wife and I love. He and I have enjoyed watching our field grow up, and we take satisfaction in our roles in its evolution.
Lessons Learned
The hospitalist model of practice didn’t have a single inventor or place of origin, and anyone involved in starting a practice in the 1980s or before should be proud to have invented their practice when no blueprint existed. Creative thinking and openness to a new way of doing things were critical in developing the first hospitalist practices. They also are useful traits in trying to improve modern hospitalist practices or other segments of our healthcare system.
Like many new developments in medicine, the economic effects of our practice—lower hospital cost per case—became apparent, especially to Chuck, before data regarding quality surfaced. I wish we had gotten more serious early on about capturing whatever quality data might have been available—clearly less than what is available today—and those in new healthcare endeavors today should try to measure quality at the outset. Unlike the 1980s, the current marketplace will help ensure that happens.
Coda
There is one other really cool thing about Chuck’s email at the beginning of this column: those three exclamation points! Chuck is typically laconic and understated, and not given to such displays of emotion, but there are few things that generate more enthusiasm than a parent sharing news of a child’s success.
So, Ben, as you start med school next year, I wish you the best. You can be sure I’ll be asking for updates about your progress. The most important thing is that you find a life and career that engages you to do good work for others and provides satisfaction. And whatever you choose to do after med school, I know you’ll continue to make your parents proud.
Dr. Nelson has been a practicing hospitalist since 1988. He is co-founder and past president of SHM, and principal in Nelson Flores Hospital Medicine Consultants. He is course co-director for SHM’s “Best Practices in Managing a Hospital Medicine Program” course. Write to him at john.nelson@nelsonflores.com.
STOP performing DXA scans in healthy, perimenopausal women
START counseling all women on lifestyle interventions to avoid fractures
The authors report no financial relationships relevant to this article.
CASE: Premature treatment for osteopenia
A 57-year-old woman presents to establish care and discuss concerns related to menopause and osteoporosis management. She is G2P2, healthy, 5 ft 6 in, and 130 lb. She underwent natural menopause at age 51; her vasomotor symptoms have been mild, and she has not used hormone therapy. Upon annual physical examination at age 52, her former physician referred her for a mammogram, bone-density assessment, and colonoscopy. Osteopenia (femoral neck T-score, –1.8) was noted on dual-energy x-ray absorptiometry (DXA), and alendronate 70 mg per week was started.
EXPERT COMMENTARY

Lisa Larkin, MD
Associate Professor, Department of Obstetrics and Gynecology, and Director, Division of Midlife Women’s Health and Primary Care, University of Cincinnati. Dr. Larkin is also Medical Director of the UC Health Women’s Center, West Chester, Ohio. She is a NAMS certified menopause practitioner.
Andrew M. Kaunitz, MD
Professor and Associate Chairman, Department of Obstetrics and Gynecology, University of Florida College of Medicine–Jacksonville. Dr. Kaunitz serves on the OBG Management Board of Editors.
EXPERT COMMENTARY
Lisa Larkin, MD
Associate Professor, Department of Obstetrics and Gynecology, and Director, Division of Midlife Women’s Health and Primary Care, University of Cincinnati. Dr. Larkin is also Medical Director of the UC Health Women’s Center, West Chester, Ohio. She is a NAMS certified menopause practitioner.
Andrew M. Kaunitz, MD
Professor and Associate Chairman, Department of Obstetrics and Gynecology, University of Florida College of Medicine–Jacksonville. Dr. Kaunitz serves on the OBG Management Board of Editors.
The authors report no financial relationships relevant to this article.
CASE: Premature treatment for osteopenia
A 57-year-old woman presents to establish care and discuss concerns related to menopause and osteoporosis management. She is G2P2, healthy, 5 ft 6 in, and 130 lb. She underwent natural menopause at age 51; her vasomotor symptoms have been mild, and she has not used hormone therapy. Upon annual physical examination at age 52, her former physician referred her for a mammogram, bone-density assessment, and colonoscopy. Osteopenia (femoral neck T-score, –1.8) was noted on dual-energy x-ray absorptiometry (DXA), and alendronate 70 mg per week was started.
Alcohol: An unfortunate teratogen
Medical students learn early in their education that alcohol is a teratogen. Despite this widespread knowledge, many obstetricians counsel patients about the safety of low doses of alcohol in pregnancy.1 Indeed, the Royal College of Obstetricians and Gynaecologists’ position on this is, “while the safest approach may be to avoid any alcohol during pregnancy, it remains the case that there is no evidence of harm from low levels of alcohol consumption, defined as no more than one or two units of alcohol once or twice a week.”2
Like many providers, I was aware of this controversy, but it became truly personal when a beloved family member was diagnosed with fetal alcohol syndrome (FAS). In this paper, I will review some of the controversy regarding alcohol in pregnancy, highlight findings from the literature, provide tools for prevention, and identify new developments regarding this devastating, preventable condition.
Charlie
To know my nephew Charlie is to fall in love with my nephew Charlie. One of the happiest moments of my life was when I learned my brother and sister-in-law had adopted twins from Kazakhstan. When my little niece and nephew started their new life in the United States, certain medical issues seemed to merit additional attention. Although both were very small for their age and required significant nutritional support, Charlie seemed to be a bit more rambunctious and required additional supervision.
The children were fortunate enough to have incredibly loving, dedicated parents, who have access to exceptional medical care as residents of Philadelphia, Pennsylvania. After extensive testing, it became clear what was causing Charlie’s developmental delay; his pediatric team made the diagnosis of FAS. My brother and sister-in-law became incredibly well-read about this challenging disorder, and threw themselves into national advocacy work to help prevent this unnecessary tragedy.
Recent data point to teratogenicity, but media confuse the issue
Some recent media coverage3 of celebrities who apparently drank while pregnant was in response to an article in the Journal of Epidemiology and Community Health.4 The authors of this study concluded that, “at age 5 years, cohort members born to mothers who drank up to one to two drinks per week or per occasion during pregnancy were not at increased risk of clinically relevant behavioral difficulties or cognitive deficits, compared with children of mothers in the not-in-pregnancy group.”
This is certainly not the first occasion the popular press has covered a published study that seems to indicate no ill effects of alcohol use in pregnancy. A 2008 report by Kelly and colleagues,5 and its subsequent media coverage, prompted the Fetal Alcohol Spectrum Disorders Study Group to state that the panel of experts was “alarmed” by recent newspaper reports suggesting that light drinking during pregnancy may be beneficial for an unborn child.6 They noted misleading and irresponsible media reports of the findings, which suggested that 3-year-old children whose mothers drank “lightly” during pregnancy were not at risk for certain behavioral problems.
What the study authors proceeded to note, however (that the media did not mention), was that the light drinkers in their study had socioeconomic advantages, compared with nondrinkers.5 (Advantaged economic status is established to be beneficial for childhood development.) They also noted that the study involved preschool-aged children, stating “Generally the adverse effects of light drinking during pregnancy are subtle and may go undetected in young children. However, other group studies of more moderate or ‘social’ drinking levels during pregnancy have shown an adverse impact on multiple aspects of development through adolescence and young adulthood, even when important environmental factors are taken into account.” A sentence I thought was most compelling in their statement was, “It is an inconvenient fact of life that alcohol is a teratogen.” Now, this fact is well supported in the literature.7
There are animal studies regarding the use of “low-dose” or “moderate” alcohol in pregnancy that demonstrate adverse behavioral outcomes with exposure to even small doses of alcohol.8,9 It is an American tragedy that, according to the Centers for Disease Control and Prevention (CDC), rates of FAS in this country range from 0.2 to 2.0 cases per 1,000 live births. Indeed, the rates of fetal alcohol spectrum disorders (FASD) might be at least three times this rate.10 As is the case with other disorders, there are health disparities regarding the prevalence of this condition as well.11
FAS: A long history of preventable disease
1973: Identified. FAS was first described in a 1973 Lancet report, “Pattern of malformation in offspring of chronic alcoholic mothers.”12
1996: Call for prevention. In 1995, the US Surgeon General issued a statement regarding alcohol use in pregnancy, noting, “We do not know what, if any, amount of alcohol is safe.”13 In 1996, the Institute of Medicine released a paper calling FAS and FASD “completely preventable birth defects and neurodevelopmental abnormalities.”14
2000: The troubling effects gathered. The American Academy of Pediatrics (AAP) published a monograph on FAS in 2000, defining it as a constellation of physical, behavioral, and cognitive abnormalities.15
These features classically define FAS:
- dysmorphic facial features
- prenatal and postnatal growth abnormalities
- mental retardation.
Approximately 80% of children with this condition have:
- microcephaly
- behavioral abnormalities.
As many as 50% of affected children also exhibit:
- poor coordination
- hypotonia
- attention-deficit hyperactivity disorder
- decreased adipose tissue
- identifiable facial anomalies (such as maxillary hypoplasia, cleft palate, and micrognathia).
Also common:
- cardiac defects
- hemangiomas
- eye or ear abnormalities.
The AAP further noted that data current to the time (and still true today) did not support the concept of a safe level of alcohol consumption by pregnant women below which no damage to a fetus will occur.15

Alcohol intake during pregnancy puts the fetus at risk for cognitive and neuropsychological impairment and physical abnormalities, including dysmorphic facial features (such as micrognathia), restricted prenatal growth, cardiac defects, and eye and ear abnormalities. There is no threshold dose of alcohol that is safe during pregnancy, according to the American College of Obstetricians and Gynecologists.
Despite the knowledge we’ve gained, FAS persists
According to a 2006–2010 CDC analysis involving more than 345,000 women of reproductive age from all 50 states, 7.6% of pregnant women reported alcohol use and 1.4% (or 1 in 71) reported binge drinking (defined, respectively, as at least one alcoholic drink and four or more alcoholic drinks on one occasion in the past 30 days).16 The highest prevalence of obstetric alcohol consumption occurs in women who are:
- aged 35 to 44 years
- white
- college graduates
- employed.
The problem may be bigger than reported. The incidences of alcohol and binge drinking found in the CDC report include women’s self-report—but women drink alcohol without knowing they’re pregnant. Only 40% of women realize they’re pregnant at 4 weeks of gestation, a critical time for organogenesis, and approximately half of all births are unplanned.9
When my brother and sister-in law adopted my beautiful niece and nephew, they were very aware of the risk for conditions like FAS. In an evaluation of 71 children adopted from Eastern Europe at 5 years of age, FAS was diagnosed in 30% of children and “partial FAS” in another 9%.17 Birth defects attributed to alcohol were present in 11% of the children.
Are women’s health providers up to date on FAS education?
In recognition of alcohol’s potentially life-altering consequences for the developing fetus, the American College of Obstetricians and Gynecologists (ACOG) produced an FASD prevention tool kit in 2006 and published a 2011 committee opinion on at-risk drinking and alcohol dependence and their implications for obstetrics and gynecology.18,19 Both guidelines direct clinicians to advise patients to abstain from alcohol during pregnancy.
Results from a 2010 survey of 800 ACOG fellows revealed that only 78% of obstetricians advised abstinence from alcohol during pregnancy. Fifty-eight percent of respondents did not use a validated screening tool for alcohol use in their pregnant patients, and only 72% felt prepared to screen for risky or hazardous drinking.19 (Most were unaware of the ACOG tool kit, which had been published several years earlier.)
In a survey of pediatricians, obstetricians, and family physicians, clinicians said that about 67% of their patients asked about alcohol use in pregnancy, with about 2% of those patients specifically mentioning FAS. About 41% of these same physicians erroneously placed the threshold for FAS at one to three drinks per day,20 when in fact there is no threshold of drinking that has been proven to be safe.
A survey of 1,000 actively practicing ACOG fellows revealed that, while 97% of obstetricians routinely asked their patients about alcohol use, only 20% of providers reported to their patients that abstinence was safest, and 4% of providers didn’t believe that consumption of eight or more drinks weekly posed fetal risk.21
How can we educate our patients about the dangers of alcohol in pregnancy?
Fetal death. A recent Danish study of 79,216 pregnant women revealed that 45% had consumed some alcohol during pregnancy. Two percent reported at least four drinks per week, and 25% admitted to binge drinking during pregnancy. Term infants born to women in the latter two groups had increased neonatal mortality, with hazard ratios of 3.56 (95% confidence interval [CI], 1.15–8.43) and 2.69 (95% CI, 1.27–5.69), respectively.22
Decreased cognitive status. A study by Willford and colleagues evaluated the relationship between prenatal alcohol exposure and cognitive status of 1,360 10-year-old children.23 The authors utilized the Stanford-Binet Intelligence Test, including the composite scores and verbal, abstract/visual, quantitative, and short-term memory scores. After controlling for other variables, among African American offspring they found that, for each additional drink, the average composite score decreased by 1.9 points. This difference was more striking for second-trimester use, and was significant even for one drink daily versus abstention from alcohol.
Impaired neuropsychological development. Another study evaluating light to moderate amounts of prenatal alcohol exposure in 10- and 11-year-old children found significantly worse scores regarding a number of neuropsychological developmental assessments.24
No threshold dose of causation. Results of a 2012 prospective study in California, with data collected on 992 subjects from 1978 until 2005, revealed that many physical FAS features, including microcephaly, smooth philtrum, and thin vermillion border; reduced birth length; and reduced birth weight, were associated with alcohol exposure at specific gestational ages, and were dose-related.25 This paper didn’t reveal any evidence of a threshold dose of causation.
Neurobehavioral outcomes of FAS are not always considered
Another recent study that the media recently highlighted as finding “no association between low or moderate prenatal alcohol exposure and birth defects” was by O’Leary and colleagues.26 Like other similarly limited studies, this one involved only children younger than 6 years and didn’t assess any of the important neurobehavioral outcomes of FAS.
FAS encompasses much more than visible birth defects. As the aforementioned ACOG tool kit stated, “For every child born with FAS, many more children are born with neurobehavioral deficits caused by alcohol exposure but without the physical characteristics of FAS.”
The costs of FAS are felt with dollars, too
The financial cost to our nation is extraordinary. In 1991, Abel and Sokol estimated the incremental annual cost of treating FAS at nearly $75 million, with about three-quarters of that cost associated with FAS cases involving mental retardation.27
A 2002 assessment estimated the lifetime cost for each individual with FAS (adjusting for the change in the cost of medical care services, lost productivity, and inflation) at $2 million. This figure consists of $1.6 million for medical treatment, special education, and residential care for persons with mental retardation, and $0.4 million for productivity losses.28
Where human studies fall short, animal studies can help elucidate causation
Unquestionably, there are flaws in the existing literature on the causation of FAS. Many studies rely on self-reporting by pregnant women, and underreporting in these cases is a real concern. There often are other confounders potentially negatively affecting fetal development, making it difficult to differentiate causation. The animal studies that don’t share these limitations do suggest a causal relationship between antenatal alcohol exposure and poor obstetric outcomes, however.29 These studies suggest mechanisms such as altered gene expression, oxidative stress, and apoptosis (programmed cell death).30
Warren, Hewitt, and Thomas describe how intrauterine alcohol exposure interferes with the function of L1CAM, the L1 cell-adhesion molecule.31 They noted that just one drink could interfere with the ability of L1CAM to mediate cell adhesion and axonal growth. Prenatal alcohol exposure is also thought to contribute to interference in neurotransmitter and N-methyl-D-aspartate receptor coupling, which may have potential therapeutic implications.32
Considerations in FAS identification and treatment
There is a potential to identify alcohol exposure in the womb. The majority of ingested alcohol is eventually converted to carbon dioxide and water in both maternal and fetal circulations, which has hampered the identification of biomarkers for clinical use in FAS. Fatty acid ethyl esters (FAEEs), nonoxidative metabolites of ethanol, may prove to be such markers.33 FAEEs have been measured in a variety of tissues, including blood and meconium. FAEEs can be measured in both neonatal and maternal hair samples.
A study evaluating the utility of such testing in 324 at-risk pregnancies revealed 90% sensitivity and 90% specificity for identifying “excessive drinking” using a cutoff of 0.5 ng/mg.34
Research shows potential therapeutic approaches during pregnancy. While the use of biomarkers has the potential to assist with the identification of at-risk newborns, it merely identifies past alcohol use; it doesn’t necessarily permit identification and prevention of the known negative pediatric sequelae. Preliminary animal studies reveal the potential benefit of neuroprotective peptides to prevent brain damage in alcohol-exposed mice.35 Further research is ongoing.
Treatment: The earlier the better
Early diagnosis and a positive environment improve outcomes. It is well established that early intervention improves outcomes. One comprehensive review of 415 patients with FAS noted troubling outcomes in general for adolescents and adults.36 Over their life spans, the prevalence of such outcomes was:
- 61% for disrupted school experiences
- 60% for trouble with the law
- 50% for confinement (in detention, jail, prison, or a psychiatric or alcohol/drug inpatient setting)
- 49% for inappropriate sexual behaviors on repeated occasions
- 35% for alcohol/drug problems.
The odds of escaping these adverse life outcomes are increased up to fourfold when the individual receives a FAS or FASD diagnosis at an earlier age and is reared in a stable environment.36
Barrier to treatment: A mother’s guilt. One of the challenges I’ve learned from my sister-in-law is the stigma mothers face when they bring their child in for services once the diagnosis of FAS is suspected. While adoptive mothers obviously can’t be held accountable for the intrauterine environment to which a fetus is exposed, the same can’t be said of biologic mothers. Therefore, there is a real risk that a mother who is unwilling or unable to face the potentially devastating news that her baby’s issues might be related to choices she made during pregnancy, might not bring her child in for necessary assessment and treatment. Therefore, prevention is a key proponent of treatment.
Prevent FAS: Provide contraception, screen for alcohol use, intervene
While ObGyns aren’t likely to diagnose many children with FAS, we are in an excellent position to try to prevent this tragedy through our counseling of reproductive-aged women. I suspect that most obstetricians spend a considerable amount of time discussing much less frequent obstetric sequelae, such as listeriosis, in the prenatal care setting. Validated alcohol screening tools take moments to administer, and once patients who might have alcohol problems are identified, either a serious discussion about contraception or an honest discussion of FAS may be appropriate. There have been a number of screening tools developed.
The CAGE screen is frequently taught in medical schools, but it isn’t as sensitive for women or minorities.19
The T-ACE (Tolerance, Annoyed, Cut Down, Eye-opener) tool involves four questions that take less than 1 minute to administer (FIGURE 1).39
TWEAK is another potential tool identified by Russell and colleagues (Tolerance, Worry, Eye opener, Amnesia, and Cut down in drinking).39 Other methods utilized include an AUDIT screen and a CRAFFT screen.40 Regardless of which tool is utilized, screening is not time-consuming and is better than merely inquiring about alcohol consumption in general.

FIGURE 1 T-ACE validated alcohol screening tool
Source: American College of Obstetricians and Gynecologists. At risk drinking and illicit drug use: Ethical issues in obstetric and gynecologic practice. Obstet Gynecol. 2008;112(6):1449–1460.
When alcohol use is found, intervene
Once patients with at-risk behavior are identified, obstetric staff should offer brief interventions to influence problem drinking. Miller and Sanchez summarized the key elements that were most successful in these programs with the acronym FRAMES: Feedback, Responsibility, Advice, Menu, Empathy, Self-efficacy (FIGURE 2).41 This approach has been formally evaluated in the CDC’s multisite pilot study entitled Project CHOICES.42
In this motivational intervention, sexually active, fertile women of reproductive age underwent up to four motivational counseling sessions and one visit to a provider. At 6 months, 69% of women reduced their risk for an alcohol-exposed pregnancy—although the women who drank the least amount had the greatest benefit, primarily by choosing effective contraception, but also by reducing alcohol intake.
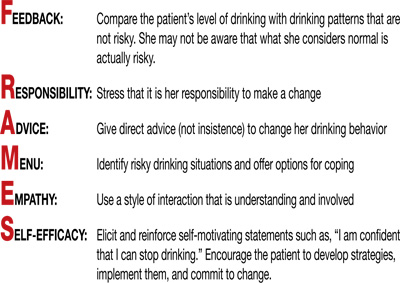
FIGURE 2 FRAMES model to deliver brief interventions
Source: American College of Obstetricians and Gynecologists. Drinking and reproductive health: A fetal alcohol spectrum disorders prevention tool kit. Washington, DC: ACOG; 2006.
A single, brief intervention is effective in already-pregnant women. Chang and colleagues conducted a randomized trial of a single-session brief intervention given to pregnant women with positive T-ACE screens and their partners (FIGURE 3).43 Either the study nurse or physician participated in the intervention, and each single session took 25 minutes on average. The pregnant women with the highest level of alcohol use reduced their drinking the most, and this effect was even larger when their partners participated. Other studies of brief interventions showed similar benefits.44,45
Another study evaluating a brief intervention involving training of health-care providers to improve screening rates revealed improved detection and therapy among at-risk patients.46
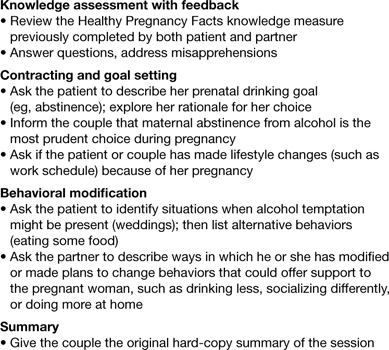
FIGURE 3 Single session, 25-minute intervention for patients and their partners
Source: Chang G, McNamara T, Orav J, et al. Brief intervention for prenatal alcohol use: a randomized trial. Obstet Gynecol. 2005;105(5 Pt 1):991–998.
FAS prevention begins with routine counseling and contraception
Although FAS is often thought of in relation to obstetric populations, appointments for preconception counseling or routine health maintenance among women of reproductive age are an essential tool in FAS prevention. As previously mentioned, since approximately half of all pregnancies in this country are unplanned, long-acting reversible contraception is widely available to facilitate improved family planning.
Other contraceptive options also should be discussed. ACOG has teamed up with the CDC to develop a phone app for providers to use at the patient’s bedside to assist with identification and treatment of women at risk for alcohol use during pregnancy.47
The stakes are high, it’s time to step up
As obstetricians, we are powerless to prevent many conditions—such as vasa previa, acute fatty liver of pregnancy, and amniotic band syndrome. FAS is 100% preventable.
There aren’t that many proven teratogens in our profession, and there are none that involve behavior that is more socially acceptable than alcohol consumption. It is time for our profession to encourage women to appreciate how small a percentage of one’s life is spent pregnant, how many more years there are to enjoy an occasional cocktail, and how very high the stakes are during this important period of their lives. Oh, how I wish someone had been able to communicate all of this to sweet Charlie’s biologic mother. I am so grateful he’s getting the exceptional care he’s getting and very optimistic regarding his future. I only hope others in his situation are given the same opportunities.
Prenatal counseling
Louise Wilkins-Haug, MD, PhD (January 2008)
Prevention of fetal alcohol syndrome requires routine screening of all women of reproductive age
We want to hear from you! Tell us what you think.
1. Baram M. Moms-to-be get mixed messages on drinking. ABC News. http://abcnews.go.com/Health/story?id=2654849&page=1#.UM9l-RyeARY. Published November 15 2006. Accessed December 14, 2012.
2. Royal College of Obstetricians and Gynaecologists. Alcohol consumption and the outcomes of pregnancy (RCOG Statement No. 5). London UK: Royal College of Obstetricians and Gynaecologists. January 3, 2006.
3. Pearson C. Alcohol during pregnancy: How dangerous is it really? The Huffington Post. http://www.huffingtonpost.com/2011/04/06/alcohol-during-pregnancy_n_845103.html. Published April 6 2011. Updated September 16, 2011. Accessed December 14, 2012.
4. Kelly YJ, Sacker A, Gray R, et al. Light drinking during pregnancy: still no increased risk for socioemotional difficulties or cognitive deficits at 5 years of age? J Epidemiol Community Health. 2012;66(1):41-48.Epub Oct 5, 2010.
5. Kelly Y, Sacker A, Gray R, Kelly J, Wolke D, Quigley MA. Light drinking in pregnancy a risk for behavioural problems and cognitive deficits at 3 years of age? Int J Epidemiol. 2009;38(1):129-140.Epub Oct 30, 2008.
6. Zhou F. Fetal Alcohol Spectrum Disorders Study Group (FASDSG). Research Society on Alcoholism. http://rsoa.org/fas.html. Updated September 9 2010. Accessed December 14, 2012.
7. Kelly S, Day N, Streissguth AP. Effects of prenatal alcohol exposure on social behavior in humans and other species. Neurotoxicol Teratol. 2000;22(2):143-149.
8. Vaglenova J, Petkov V. Fetal alcohol effects in rats exposed pre-and postnatally to a low dose of ethanol. Alcohol Clin Exp Res. 1998;22(3):697-703.
9. Schneider M, Moore C, Kraemer G. Moderate alcohol during pregnancy: learning and behavior in adolescent rhesus monkeys. Alcohol Clin Exp Res. 2001;25(9):1383-1392.
10. Centers for Disease Control and Prevention. Fetal alcohol spectrum disorders. Data and statistics in the United States. http://www.cdc.gov/ncbddd/fasd/data.html. Updated August 16 2012. Accessed December 14, 2012.
11. Egeland G, Perham-Hestere KA, Gessner BD, Ingle D, Berner JE, Middaugh J. Fetal alcohol syndrome in Alaska 1977 through 1992: an administrative prevalence derived from multiple data sources. Am J Pub Health. 1998;88(5):781-786.
12. Jones K, Smith D, Ulleland C, Streissguth A. Pattern of malformation in offspring of chronic alcoholic mothers. Lancet. 1973;1(7815):1267-1271.
13. Institute of Medicine. Fetal alcohol syndrome: diagnosis epidemiology, prevention, and treatment (1996). http://www.come-over.to/FAS/IOMsummary.htm. Accessed December 14, 2012.
14. Committee of Substance Abuse and Committee on Children with Disabilities. American Academy of Pediatrics. Fetal alcohol syndrome and alcohol-related neurodevelopmental disorders. Pediatrics. 2000;106(2):358-361.
15. US Department of Health & Human Services. US Surgeon General releases advisory on alcohol use in pregnancy. http://www.surgeongeneral.gov/news/2005/02/sg02222005.html. Published February 21 2005. Accessed December 13, 2012.
16. Centers for Disease Control and Prevention. Alcohol use and binge drinking among women of childbearing age–United States 2006–2010. MMWR. 2012;61(28):534-538.http://www.cdc.gov/mmwr/preview/mmwrhtml/mm6128a4.htm?s_cid=mm6128a4_w. Accessed December 17, 2012.
17. Landgren M, Svensson L, Stromland K, Gronlund M. Prenatal alcohol exposure and neurodvelopmental disorders in children adopted from Eastern Europe. Pediatrics. 2010;125(5):e1178-1185.doi:10.1542/peds.2009-0712.
18. American College of Obstetricians and Gynecologists. Drinking and reproductive health: A fetal alcohol spectrum disorders prevention tool kit. http://www.acog.org/~/media/Departments/Tobacco%20Alcohol%20and%20Substance%20Abuse/FASDToolKit.pdf?dmc=1&ts=20121217T1504384811. Published 2006. Accessed December 14 2012.
19. Anderson B, Dang E, Floyd R, Sokol R, Mahoney J, Schulkin J. Knowledge opinions, and practice patterns of obstetrician-gynecologist regarding their patients’ use of alcohol. J Addiction Med. 2010;4(2):114-121.
20. Abel EL, Kruger M. What do physicians know and say about fetal alcohol syndrome: a survey of obstetricians pediatricians, and family medicine physicians. Alcohol Clin Exp Res. 1998;22(9):1951-1954.
21. Diekman S, Floyd R, Decoufle P, Schulkin J, Ebrahim S, Sokol R. A survey of obstetrician-gynecologists on their patients’ alcohol use during pregnancy. Obstet Gynecol. 2000;95(5):756-763.
22. Strandberg-Larsen K, Gronboek M, Andersen A, Andersen P, Olsen J. Alcohol drinking pattern during pregnancy and risk of infant mortality. Epidemiology. 2009;20(6):884-891.
23. Willford J, Leech S, Day N. Moderate prenatal alcohol exposure and cognitive status of children at age 10. Alcohol Clin Exp Res. 2006;30(6):1051-1059.
24. Richardson G, Ryan C, Willford J, Day N, Goldschmidt. Prenatal alcohol and marijuana exposure: Effects on neuropsychological outcomes at 10 years. Neurotoxicol Teratol. 2002;24(3):309-320.
25. Feldman H, Jones K, Lindsay S, et al. Prenatal alcohol exposure patterns and alcohol-related birth defects and growth deficiencies: a prospective study. Alcohol Clin Exp Res. 2012;36(4):670-676.
26. O’Leary C, Nassar N, Kurinczuk J, et al. Prenatal alcohol exposure and risk of birth defects. Pediatrics. 2010;126(4):e843-850.doi:10.1542/peds.2010-0256.
27. Abel E, Sokol R. A revised conservative estimate of the incidence of FAS and its economic its impact. Alcohol Clin Exp Res. 1991;15(3):514-524.
28. Lupton C. The financial impact of fetal alcohol syndrome. Fetal Alcohol Spectrum Disorders Center for Excellence. www.fasdcenter.samhsa.gov/publications/cost.cfm. Accessed December 14 2012.
29. Bailey B, Sokol R. Prenatal alcohol exposure and miscarriage stillbirth, preterm delivery, and sudden infant death syndrome. Alcohol Res Health. 2011;34(1):86-91.
30. Yelin R, Kot H, Yelin D, Fainsod A. Early molecular effects of ethanol during vertebrate embryogenesis. Differentiation. 2007;75(5):393-403.
31. Warren K, Hewitt B, Thomas J. Fetal alcohol spectrum disorders: research challenges and opportunities. Alcohol Res Health. 2011;34(1):4-15.
32. Ramanathan R, Wilkemeyer M, Mittal B, Perides G, Chamess ME. Alcohol inhibits cell-cell adhesion mediated by human L1. J Cell Biol. 1996;133(2):381-390.
33. Burd L, Hofer R. Biomarkers for detection of prenatal alcohol exposure: a critical review of fatty acid ethyl estsers in meconium. Birth Defects Res A Clin Mol Teratol. 2008;82(7):487-493.
34. Kulaga V, Pragst F, Fulga N, Koren G. Hair análisis of fatty acid esters in the detection of excessive drinking in the context of fetal alcohol spectrum disorders. Ther Drug Monit. 2009;31(2):261-266.
35. Sari Y, Gozes I. Brain deficits associated with fetal alcohol exposure may be protected in part, by peptides derived from activity-dependent neurotrophic factor and activity-dependent neuroprotective protein. Brain Res Rev. 2006;52(1):107-118.
36. Streissguth A, Bookstein F, Barr H, Sampson P, O’malley K, Young J. Risk factors for adverse life outcomes in fetal alcohol syndrome and fetal alcohol effects. J Dev Behav Pediatr. 2004;25(4):228-238.
37. 19. Committee on Health Care for Underserved Women. American College of Obstetricians and Gynecologists. Committee Opinion No. 496: At-risk drinking and alcohol dependence: Obstetric and gynecologic implications. Obstet Gynecol. 2011;118(2 Pt 1):383-388.
38. Sokol R, Martier S, Ager J. The T-ACE questions: practical prenatal detection of risk-drinking. Am J Obstet Gynecol. 1989;160(4):863-868.
39. Chan A, Pristach E, Weite J, Russell M. Use of the TWEAK test in screening for alcoholism/ heavy drinking in three populations. Alcohol Clin Exp Res. 1993;17(6):1188-1192.
40. Floyd R, O’Connor M, Bertrand J, Sokol R. Reducing adverse outcomes from prenatal alcohol exposure: a clinical plan of action. Alcohol Clin Exp Res. 2006;30(8):1271-1275.
41. Miller W, Sanchez V. Motivating young adults for treatment and lifestyle change. In: Howard GS Nathan PE, eds. Alcohol use and misuse by young adults. Notre Dame, IN: University of Notre Dame Press; 1994:55–81.
42. Center for Disease Control and Prevention. Motivational intervention to reduce alcohol-exposed pregnancies—Florida Texas, and Virginia, 1997–2001. MMWR. 2003;52(19):441-444.
43. Chang G, McNamara T, Orav J, et al. Brief intervention for prenatal alcohol use: a randomized trial. Obstet Gynecol. 2005;105(5 Pt 1):991-998.
44. Manwell L, Fleming M, Mundt M, Stauffacher E, Barry K. Treatment of problem alcohol use in women of childbearing age: results of a brief intervention trial. Alcohol Clin Exp Res. 2000;24(10):1517-1524.
45. O’Connor M, Whaley S. Brief intervention for alcohol use by pregnant women. Am J Pub Health. 2007;97(2):252-258.
46. Mwansa-Kambafwile J, Rendall-Mkosi K, Jacobs R, Nel E, London L. Evaluation of a service provider short course for prevention of fetal alcohol syndrome. J Stud Alcohol Drugs. 2011;72(4):530-535.
47. American College of Obstetricians and Gynecologists. At-risk alcohol use screening and intervention. http://198.87.1.43/womenalcohol/index.html. Published 2011. Accessed December 16 2012.

Erin E. Tracy, MD, MPH
Dr. Tracy is Attending Physician, Vincent Department of Obstetrics and Gynecology, Massachusetts General Hospital, and Assistant Professor, Obstetrics, Gynecology, and Reproductive Biology, Harvard Medical School, Boston.
The author reports no financial relationships relevant to this article.
Medical students learn early in their education that alcohol is a teratogen. Despite this widespread knowledge, many obstetricians counsel patients about the safety of low doses of alcohol in pregnancy.1 Indeed, the Royal College of Obstetricians and Gynaecologists’ position on this is, “while the safest approach may be to avoid any alcohol during pregnancy, it remains the case that there is no evidence of harm from low levels of alcohol consumption, defined as no more than one or two units of alcohol once or twice a week.”2
Like many providers, I was aware of this controversy, but it became truly personal when a beloved family member was diagnosed with fetal alcohol syndrome (FAS). In this paper, I will review some of the controversy regarding alcohol in pregnancy, highlight findings from the literature, provide tools for prevention, and identify new developments regarding this devastating, preventable condition.
Charlie
To know my nephew Charlie is to fall in love with my nephew Charlie. One of the happiest moments of my life was when I learned my brother and sister-in-law had adopted twins from Kazakhstan. When my little niece and nephew started their new life in the United States, certain medical issues seemed to merit additional attention. Although both were very small for their age and required significant nutritional support, Charlie seemed to be a bit more rambunctious and required additional supervision.
The children were fortunate enough to have incredibly loving, dedicated parents, who have access to exceptional medical care as residents of Philadelphia, Pennsylvania. After extensive testing, it became clear what was causing Charlie’s developmental delay; his pediatric team made the diagnosis of FAS. My brother and sister-in-law became incredibly well-read about this challenging disorder, and threw themselves into national advocacy work to help prevent this unnecessary tragedy.
Recent data point to teratogenicity, but media confuse the issue
Some recent media coverage3 of celebrities who apparently drank while pregnant was in response to an article in the Journal of Epidemiology and Community Health.4 The authors of this study concluded that, “at age 5 years, cohort members born to mothers who drank up to one to two drinks per week or per occasion during pregnancy were not at increased risk of clinically relevant behavioral difficulties or cognitive deficits, compared with children of mothers in the not-in-pregnancy group.”
This is certainly not the first occasion the popular press has covered a published study that seems to indicate no ill effects of alcohol use in pregnancy. A 2008 report by Kelly and colleagues,5 and its subsequent media coverage, prompted the Fetal Alcohol Spectrum Disorders Study Group to state that the panel of experts was “alarmed” by recent newspaper reports suggesting that light drinking during pregnancy may be beneficial for an unborn child.6 They noted misleading and irresponsible media reports of the findings, which suggested that 3-year-old children whose mothers drank “lightly” during pregnancy were not at risk for certain behavioral problems.
What the study authors proceeded to note, however (that the media did not mention), was that the light drinkers in their study had socioeconomic advantages, compared with nondrinkers.5 (Advantaged economic status is established to be beneficial for childhood development.) They also noted that the study involved preschool-aged children, stating “Generally the adverse effects of light drinking during pregnancy are subtle and may go undetected in young children. However, other group studies of more moderate or ‘social’ drinking levels during pregnancy have shown an adverse impact on multiple aspects of development through adolescence and young adulthood, even when important environmental factors are taken into account.” A sentence I thought was most compelling in their statement was, “It is an inconvenient fact of life that alcohol is a teratogen.” Now, this fact is well supported in the literature.7
There are animal studies regarding the use of “low-dose” or “moderate” alcohol in pregnancy that demonstrate adverse behavioral outcomes with exposure to even small doses of alcohol.8,9 It is an American tragedy that, according to the Centers for Disease Control and Prevention (CDC), rates of FAS in this country range from 0.2 to 2.0 cases per 1,000 live births. Indeed, the rates of fetal alcohol spectrum disorders (FASD) might be at least three times this rate.10 As is the case with other disorders, there are health disparities regarding the prevalence of this condition as well.11
FAS: A long history of preventable disease
1973: Identified. FAS was first described in a 1973 Lancet report, “Pattern of malformation in offspring of chronic alcoholic mothers.”12
1996: Call for prevention. In 1995, the US Surgeon General issued a statement regarding alcohol use in pregnancy, noting, “We do not know what, if any, amount of alcohol is safe.”13 In 1996, the Institute of Medicine released a paper calling FAS and FASD “completely preventable birth defects and neurodevelopmental abnormalities.”14
2000: The troubling effects gathered. The American Academy of Pediatrics (AAP) published a monograph on FAS in 2000, defining it as a constellation of physical, behavioral, and cognitive abnormalities.15
These features classically define FAS:
- dysmorphic facial features
- prenatal and postnatal growth abnormalities
- mental retardation.
Approximately 80% of children with this condition have:
- microcephaly
- behavioral abnormalities.
As many as 50% of affected children also exhibit:
- poor coordination
- hypotonia
- attention-deficit hyperactivity disorder
- decreased adipose tissue
- identifiable facial anomalies (such as maxillary hypoplasia, cleft palate, and micrognathia).
Also common:
- cardiac defects
- hemangiomas
- eye or ear abnormalities.
The AAP further noted that data current to the time (and still true today) did not support the concept of a safe level of alcohol consumption by pregnant women below which no damage to a fetus will occur.15
Alcohol intake during pregnancy puts the fetus at risk for cognitive and neuropsychological impairment and physical abnormalities, including dysmorphic facial features (such as micrognathia), restricted prenatal growth, cardiac defects, and eye and ear abnormalities. There is no threshold dose of alcohol that is safe during pregnancy, according to the American College of Obstetricians and Gynecologists.
Despite the knowledge we’ve gained, FAS persists
According to a 2006–2010 CDC analysis involving more than 345,000 women of reproductive age from all 50 states, 7.6% of pregnant women reported alcohol use and 1.4% (or 1 in 71) reported binge drinking (defined, respectively, as at least one alcoholic drink and four or more alcoholic drinks on one occasion in the past 30 days).16 The highest prevalence of obstetric alcohol consumption occurs in women who are:
- aged 35 to 44 years
- white
- college graduates
- employed.
The problem may be bigger than reported. The incidences of alcohol and binge drinking found in the CDC report include women’s self-report—but women drink alcohol without knowing they’re pregnant. Only 40% of women realize they’re pregnant at 4 weeks of gestation, a critical time for organogenesis, and approximately half of all births are unplanned.9
When my brother and sister-in law adopted my beautiful niece and nephew, they were very aware of the risk for conditions like FAS. In an evaluation of 71 children adopted from Eastern Europe at 5 years of age, FAS was diagnosed in 30% of children and “partial FAS” in another 9%.17 Birth defects attributed to alcohol were present in 11% of the children.
Are women’s health providers up to date on FAS education?
In recognition of alcohol’s potentially life-altering consequences for the developing fetus, the American College of Obstetricians and Gynecologists (ACOG) produced an FASD prevention tool kit in 2006 and published a 2011 committee opinion on at-risk drinking and alcohol dependence and their implications for obstetrics and gynecology.18,19 Both guidelines direct clinicians to advise patients to abstain from alcohol during pregnancy.
Results from a 2010 survey of 800 ACOG fellows revealed that only 78% of obstetricians advised abstinence from alcohol during pregnancy. Fifty-eight percent of respondents did not use a validated screening tool for alcohol use in their pregnant patients, and only 72% felt prepared to screen for risky or hazardous drinking.19 (Most were unaware of the ACOG tool kit, which had been published several years earlier.)
In a survey of pediatricians, obstetricians, and family physicians, clinicians said that about 67% of their patients asked about alcohol use in pregnancy, with about 2% of those patients specifically mentioning FAS. About 41% of these same physicians erroneously placed the threshold for FAS at one to three drinks per day,20 when in fact there is no threshold of drinking that has been proven to be safe.
A survey of 1,000 actively practicing ACOG fellows revealed that, while 97% of obstetricians routinely asked their patients about alcohol use, only 20% of providers reported to their patients that abstinence was safest, and 4% of providers didn’t believe that consumption of eight or more drinks weekly posed fetal risk.21
How can we educate our patients about the dangers of alcohol in pregnancy?
Fetal death. A recent Danish study of 79,216 pregnant women revealed that 45% had consumed some alcohol during pregnancy. Two percent reported at least four drinks per week, and 25% admitted to binge drinking during pregnancy. Term infants born to women in the latter two groups had increased neonatal mortality, with hazard ratios of 3.56 (95% confidence interval [CI], 1.15–8.43) and 2.69 (95% CI, 1.27–5.69), respectively.22
Decreased cognitive status. A study by Willford and colleagues evaluated the relationship between prenatal alcohol exposure and cognitive status of 1,360 10-year-old children.23 The authors utilized the Stanford-Binet Intelligence Test, including the composite scores and verbal, abstract/visual, quantitative, and short-term memory scores. After controlling for other variables, among African American offspring they found that, for each additional drink, the average composite score decreased by 1.9 points. This difference was more striking for second-trimester use, and was significant even for one drink daily versus abstention from alcohol.
Impaired neuropsychological development. Another study evaluating light to moderate amounts of prenatal alcohol exposure in 10- and 11-year-old children found significantly worse scores regarding a number of neuropsychological developmental assessments.24
No threshold dose of causation. Results of a 2012 prospective study in California, with data collected on 992 subjects from 1978 until 2005, revealed that many physical FAS features, including microcephaly, smooth philtrum, and thin vermillion border; reduced birth length; and reduced birth weight, were associated with alcohol exposure at specific gestational ages, and were dose-related.25 This paper didn’t reveal any evidence of a threshold dose of causation.
Neurobehavioral outcomes of FAS are not always considered
Another recent study that the media recently highlighted as finding “no association between low or moderate prenatal alcohol exposure and birth defects” was by O’Leary and colleagues.26 Like other similarly limited studies, this one involved only children younger than 6 years and didn’t assess any of the important neurobehavioral outcomes of FAS.
FAS encompasses much more than visible birth defects. As the aforementioned ACOG tool kit stated, “For every child born with FAS, many more children are born with neurobehavioral deficits caused by alcohol exposure but without the physical characteristics of FAS.”
The costs of FAS are felt with dollars, too
The financial cost to our nation is extraordinary. In 1991, Abel and Sokol estimated the incremental annual cost of treating FAS at nearly $75 million, with about three-quarters of that cost associated with FAS cases involving mental retardation.27
A 2002 assessment estimated the lifetime cost for each individual with FAS (adjusting for the change in the cost of medical care services, lost productivity, and inflation) at $2 million. This figure consists of $1.6 million for medical treatment, special education, and residential care for persons with mental retardation, and $0.4 million for productivity losses.28
Where human studies fall short, animal studies can help elucidate causation
Unquestionably, there are flaws in the existing literature on the causation of FAS. Many studies rely on self-reporting by pregnant women, and underreporting in these cases is a real concern. There often are other confounders potentially negatively affecting fetal development, making it difficult to differentiate causation. The animal studies that don’t share these limitations do suggest a causal relationship between antenatal alcohol exposure and poor obstetric outcomes, however.29 These studies suggest mechanisms such as altered gene expression, oxidative stress, and apoptosis (programmed cell death).30
Warren, Hewitt, and Thomas describe how intrauterine alcohol exposure interferes with the function of L1CAM, the L1 cell-adhesion molecule.31 They noted that just one drink could interfere with the ability of L1CAM to mediate cell adhesion and axonal growth. Prenatal alcohol exposure is also thought to contribute to interference in neurotransmitter and N-methyl-D-aspartate receptor coupling, which may have potential therapeutic implications.32
Considerations in FAS identification and treatment
There is a potential to identify alcohol exposure in the womb. The majority of ingested alcohol is eventually converted to carbon dioxide and water in both maternal and fetal circulations, which has hampered the identification of biomarkers for clinical use in FAS. Fatty acid ethyl esters (FAEEs), nonoxidative metabolites of ethanol, may prove to be such markers.33 FAEEs have been measured in a variety of tissues, including blood and meconium. FAEEs can be measured in both neonatal and maternal hair samples.
A study evaluating the utility of such testing in 324 at-risk pregnancies revealed 90% sensitivity and 90% specificity for identifying “excessive drinking” using a cutoff of 0.5 ng/mg.34
Research shows potential therapeutic approaches during pregnancy. While the use of biomarkers has the potential to assist with the identification of at-risk newborns, it merely identifies past alcohol use; it doesn’t necessarily permit identification and prevention of the known negative pediatric sequelae. Preliminary animal studies reveal the potential benefit of neuroprotective peptides to prevent brain damage in alcohol-exposed mice.35 Further research is ongoing.
Treatment: The earlier the better
Early diagnosis and a positive environment improve outcomes. It is well established that early intervention improves outcomes. One comprehensive review of 415 patients with FAS noted troubling outcomes in general for adolescents and adults.36 Over their life spans, the prevalence of such outcomes was:
- 61% for disrupted school experiences
- 60% for trouble with the law
- 50% for confinement (in detention, jail, prison, or a psychiatric or alcohol/drug inpatient setting)
- 49% for inappropriate sexual behaviors on repeated occasions
- 35% for alcohol/drug problems.
The odds of escaping these adverse life outcomes are increased up to fourfold when the individual receives a FAS or FASD diagnosis at an earlier age and is reared in a stable environment.36
Barrier to treatment: A mother’s guilt. One of the challenges I’ve learned from my sister-in-law is the stigma mothers face when they bring their child in for services once the diagnosis of FAS is suspected. While adoptive mothers obviously can’t be held accountable for the intrauterine environment to which a fetus is exposed, the same can’t be said of biologic mothers. Therefore, there is a real risk that a mother who is unwilling or unable to face the potentially devastating news that her baby’s issues might be related to choices she made during pregnancy, might not bring her child in for necessary assessment and treatment. Therefore, prevention is a key proponent of treatment.
Prevent FAS: Provide contraception, screen for alcohol use, intervene
While ObGyns aren’t likely to diagnose many children with FAS, we are in an excellent position to try to prevent this tragedy through our counseling of reproductive-aged women. I suspect that most obstetricians spend a considerable amount of time discussing much less frequent obstetric sequelae, such as listeriosis, in the prenatal care setting. Validated alcohol screening tools take moments to administer, and once patients who might have alcohol problems are identified, either a serious discussion about contraception or an honest discussion of FAS may be appropriate. There have been a number of screening tools developed.
The CAGE screen is frequently taught in medical schools, but it isn’t as sensitive for women or minorities.19
The T-ACE (Tolerance, Annoyed, Cut Down, Eye-opener) tool involves four questions that take less than 1 minute to administer (FIGURE 1).39
TWEAK is another potential tool identified by Russell and colleagues (Tolerance, Worry, Eye opener, Amnesia, and Cut down in drinking).39 Other methods utilized include an AUDIT screen and a CRAFFT screen.40 Regardless of which tool is utilized, screening is not time-consuming and is better than merely inquiring about alcohol consumption in general.
FIGURE 1 T-ACE validated alcohol screening tool
Source: American College of Obstetricians and Gynecologists. At risk drinking and illicit drug use: Ethical issues in obstetric and gynecologic practice. Obstet Gynecol. 2008;112(6):1449–1460.
When alcohol use is found, intervene
Once patients with at-risk behavior are identified, obstetric staff should offer brief interventions to influence problem drinking. Miller and Sanchez summarized the key elements that were most successful in these programs with the acronym FRAMES: Feedback, Responsibility, Advice, Menu, Empathy, Self-efficacy (FIGURE 2).41 This approach has been formally evaluated in the CDC’s multisite pilot study entitled Project CHOICES.42
In this motivational intervention, sexually active, fertile women of reproductive age underwent up to four motivational counseling sessions and one visit to a provider. At 6 months, 69% of women reduced their risk for an alcohol-exposed pregnancy—although the women who drank the least amount had the greatest benefit, primarily by choosing effective contraception, but also by reducing alcohol intake.
FIGURE 2 FRAMES model to deliver brief interventions
Source: American College of Obstetricians and Gynecologists. Drinking and reproductive health: A fetal alcohol spectrum disorders prevention tool kit. Washington, DC: ACOG; 2006.
A single, brief intervention is effective in already-pregnant women. Chang and colleagues conducted a randomized trial of a single-session brief intervention given to pregnant women with positive T-ACE screens and their partners (FIGURE 3).43 Either the study nurse or physician participated in the intervention, and each single session took 25 minutes on average. The pregnant women with the highest level of alcohol use reduced their drinking the most, and this effect was even larger when their partners participated. Other studies of brief interventions showed similar benefits.44,45
Another study evaluating a brief intervention involving training of health-care providers to improve screening rates revealed improved detection and therapy among at-risk patients.46
FIGURE 3 Single session, 25-minute intervention for patients and their partners
Source: Chang G, McNamara T, Orav J, et al. Brief intervention for prenatal alcohol use: a randomized trial. Obstet Gynecol. 2005;105(5 Pt 1):991–998.
FAS prevention begins with routine counseling and contraception
Although FAS is often thought of in relation to obstetric populations, appointments for preconception counseling or routine health maintenance among women of reproductive age are an essential tool in FAS prevention. As previously mentioned, since approximately half of all pregnancies in this country are unplanned, long-acting reversible contraception is widely available to facilitate improved family planning.
Other contraceptive options also should be discussed. ACOG has teamed up with the CDC to develop a phone app for providers to use at the patient’s bedside to assist with identification and treatment of women at risk for alcohol use during pregnancy.47
The stakes are high, it’s time to step up
As obstetricians, we are powerless to prevent many conditions—such as vasa previa, acute fatty liver of pregnancy, and amniotic band syndrome. FAS is 100% preventable.
There aren’t that many proven teratogens in our profession, and there are none that involve behavior that is more socially acceptable than alcohol consumption. It is time for our profession to encourage women to appreciate how small a percentage of one’s life is spent pregnant, how many more years there are to enjoy an occasional cocktail, and how very high the stakes are during this important period of their lives. Oh, how I wish someone had been able to communicate all of this to sweet Charlie’s biologic mother. I am so grateful he’s getting the exceptional care he’s getting and very optimistic regarding his future. I only hope others in his situation are given the same opportunities.
Prenatal counseling
Louise Wilkins-Haug, MD, PhD (January 2008)
Prevention of fetal alcohol syndrome requires routine screening of all women of reproductive age
We want to hear from you! Tell us what you think.
1. Baram M. Moms-to-be get mixed messages on drinking. ABC News. http://abcnews.go.com/Health/story?id=2654849&page=1#.UM9l-RyeARY. Published November 15 2006. Accessed December 14, 2012.
2. Royal College of Obstetricians and Gynaecologists. Alcohol consumption and the outcomes of pregnancy (RCOG Statement No. 5). London UK: Royal College of Obstetricians and Gynaecologists. January 3, 2006.
3. Pearson C. Alcohol during pregnancy: How dangerous is it really? The Huffington Post. http://www.huffingtonpost.com/2011/04/06/alcohol-during-pregnancy_n_845103.html. Published April 6 2011. Updated September 16, 2011. Accessed December 14, 2012.
4. Kelly YJ, Sacker A, Gray R, et al. Light drinking during pregnancy: still no increased risk for socioemotional difficulties or cognitive deficits at 5 years of age? J Epidemiol Community Health. 2012;66(1):41-48.Epub Oct 5, 2010.
5. Kelly Y, Sacker A, Gray R, Kelly J, Wolke D, Quigley MA. Light drinking in pregnancy a risk for behavioural problems and cognitive deficits at 3 years of age? Int J Epidemiol. 2009;38(1):129-140.Epub Oct 30, 2008.
6. Zhou F. Fetal Alcohol Spectrum Disorders Study Group (FASDSG). Research Society on Alcoholism. http://rsoa.org/fas.html. Updated September 9 2010. Accessed December 14, 2012.
7. Kelly S, Day N, Streissguth AP. Effects of prenatal alcohol exposure on social behavior in humans and other species. Neurotoxicol Teratol. 2000;22(2):143-149.
8. Vaglenova J, Petkov V. Fetal alcohol effects in rats exposed pre-and postnatally to a low dose of ethanol. Alcohol Clin Exp Res. 1998;22(3):697-703.
9. Schneider M, Moore C, Kraemer G. Moderate alcohol during pregnancy: learning and behavior in adolescent rhesus monkeys. Alcohol Clin Exp Res. 2001;25(9):1383-1392.
10. Centers for Disease Control and Prevention. Fetal alcohol spectrum disorders. Data and statistics in the United States. http://www.cdc.gov/ncbddd/fasd/data.html. Updated August 16 2012. Accessed December 14, 2012.
11. Egeland G, Perham-Hestere KA, Gessner BD, Ingle D, Berner JE, Middaugh J. Fetal alcohol syndrome in Alaska 1977 through 1992: an administrative prevalence derived from multiple data sources. Am J Pub Health. 1998;88(5):781-786.
12. Jones K, Smith D, Ulleland C, Streissguth A. Pattern of malformation in offspring of chronic alcoholic mothers. Lancet. 1973;1(7815):1267-1271.
13. Institute of Medicine. Fetal alcohol syndrome: diagnosis epidemiology, prevention, and treatment (1996). http://www.come-over.to/FAS/IOMsummary.htm. Accessed December 14, 2012.
14. Committee of Substance Abuse and Committee on Children with Disabilities. American Academy of Pediatrics. Fetal alcohol syndrome and alcohol-related neurodevelopmental disorders. Pediatrics. 2000;106(2):358-361.
15. US Department of Health & Human Services. US Surgeon General releases advisory on alcohol use in pregnancy. http://www.surgeongeneral.gov/news/2005/02/sg02222005.html. Published February 21 2005. Accessed December 13, 2012.
16. Centers for Disease Control and Prevention. Alcohol use and binge drinking among women of childbearing age–United States 2006–2010. MMWR. 2012;61(28):534-538.http://www.cdc.gov/mmwr/preview/mmwrhtml/mm6128a4.htm?s_cid=mm6128a4_w. Accessed December 17, 2012.
17. Landgren M, Svensson L, Stromland K, Gronlund M. Prenatal alcohol exposure and neurodvelopmental disorders in children adopted from Eastern Europe. Pediatrics. 2010;125(5):e1178-1185.doi:10.1542/peds.2009-0712.
18. American College of Obstetricians and Gynecologists. Drinking and reproductive health: A fetal alcohol spectrum disorders prevention tool kit. http://www.acog.org/~/media/Departments/Tobacco%20Alcohol%20and%20Substance%20Abuse/FASDToolKit.pdf?dmc=1&ts=20121217T1504384811. Published 2006. Accessed December 14 2012.
19. Anderson B, Dang E, Floyd R, Sokol R, Mahoney J, Schulkin J. Knowledge opinions, and practice patterns of obstetrician-gynecologist regarding their patients’ use of alcohol. J Addiction Med. 2010;4(2):114-121.
20. Abel EL, Kruger M. What do physicians know and say about fetal alcohol syndrome: a survey of obstetricians pediatricians, and family medicine physicians. Alcohol Clin Exp Res. 1998;22(9):1951-1954.
21. Diekman S, Floyd R, Decoufle P, Schulkin J, Ebrahim S, Sokol R. A survey of obstetrician-gynecologists on their patients’ alcohol use during pregnancy. Obstet Gynecol. 2000;95(5):756-763.
22. Strandberg-Larsen K, Gronboek M, Andersen A, Andersen P, Olsen J. Alcohol drinking pattern during pregnancy and risk of infant mortality. Epidemiology. 2009;20(6):884-891.
23. Willford J, Leech S, Day N. Moderate prenatal alcohol exposure and cognitive status of children at age 10. Alcohol Clin Exp Res. 2006;30(6):1051-1059.
24. Richardson G, Ryan C, Willford J, Day N, Goldschmidt. Prenatal alcohol and marijuana exposure: Effects on neuropsychological outcomes at 10 years. Neurotoxicol Teratol. 2002;24(3):309-320.
25. Feldman H, Jones K, Lindsay S, et al. Prenatal alcohol exposure patterns and alcohol-related birth defects and growth deficiencies: a prospective study. Alcohol Clin Exp Res. 2012;36(4):670-676.
26. O’Leary C, Nassar N, Kurinczuk J, et al. Prenatal alcohol exposure and risk of birth defects. Pediatrics. 2010;126(4):e843-850.doi:10.1542/peds.2010-0256.
27. Abel E, Sokol R. A revised conservative estimate of the incidence of FAS and its economic its impact. Alcohol Clin Exp Res. 1991;15(3):514-524.
28. Lupton C. The financial impact of fetal alcohol syndrome. Fetal Alcohol Spectrum Disorders Center for Excellence. www.fasdcenter.samhsa.gov/publications/cost.cfm. Accessed December 14 2012.
29. Bailey B, Sokol R. Prenatal alcohol exposure and miscarriage stillbirth, preterm delivery, and sudden infant death syndrome. Alcohol Res Health. 2011;34(1):86-91.
30. Yelin R, Kot H, Yelin D, Fainsod A. Early molecular effects of ethanol during vertebrate embryogenesis. Differentiation. 2007;75(5):393-403.
31. Warren K, Hewitt B, Thomas J. Fetal alcohol spectrum disorders: research challenges and opportunities. Alcohol Res Health. 2011;34(1):4-15.
32. Ramanathan R, Wilkemeyer M, Mittal B, Perides G, Chamess ME. Alcohol inhibits cell-cell adhesion mediated by human L1. J Cell Biol. 1996;133(2):381-390.
33. Burd L, Hofer R. Biomarkers for detection of prenatal alcohol exposure: a critical review of fatty acid ethyl estsers in meconium. Birth Defects Res A Clin Mol Teratol. 2008;82(7):487-493.
34. Kulaga V, Pragst F, Fulga N, Koren G. Hair análisis of fatty acid esters in the detection of excessive drinking in the context of fetal alcohol spectrum disorders. Ther Drug Monit. 2009;31(2):261-266.
35. Sari Y, Gozes I. Brain deficits associated with fetal alcohol exposure may be protected in part, by peptides derived from activity-dependent neurotrophic factor and activity-dependent neuroprotective protein. Brain Res Rev. 2006;52(1):107-118.
36. Streissguth A, Bookstein F, Barr H, Sampson P, O’malley K, Young J. Risk factors for adverse life outcomes in fetal alcohol syndrome and fetal alcohol effects. J Dev Behav Pediatr. 2004;25(4):228-238.
37. 19. Committee on Health Care for Underserved Women. American College of Obstetricians and Gynecologists. Committee Opinion No. 496: At-risk drinking and alcohol dependence: Obstetric and gynecologic implications. Obstet Gynecol. 2011;118(2 Pt 1):383-388.
38. Sokol R, Martier S, Ager J. The T-ACE questions: practical prenatal detection of risk-drinking. Am J Obstet Gynecol. 1989;160(4):863-868.
39. Chan A, Pristach E, Weite J, Russell M. Use of the TWEAK test in screening for alcoholism/ heavy drinking in three populations. Alcohol Clin Exp Res. 1993;17(6):1188-1192.
40. Floyd R, O’Connor M, Bertrand J, Sokol R. Reducing adverse outcomes from prenatal alcohol exposure: a clinical plan of action. Alcohol Clin Exp Res. 2006;30(8):1271-1275.
41. Miller W, Sanchez V. Motivating young adults for treatment and lifestyle change. In: Howard GS Nathan PE, eds. Alcohol use and misuse by young adults. Notre Dame, IN: University of Notre Dame Press; 1994:55–81.
42. Center for Disease Control and Prevention. Motivational intervention to reduce alcohol-exposed pregnancies—Florida Texas, and Virginia, 1997–2001. MMWR. 2003;52(19):441-444.
43. Chang G, McNamara T, Orav J, et al. Brief intervention for prenatal alcohol use: a randomized trial. Obstet Gynecol. 2005;105(5 Pt 1):991-998.
44. Manwell L, Fleming M, Mundt M, Stauffacher E, Barry K. Treatment of problem alcohol use in women of childbearing age: results of a brief intervention trial. Alcohol Clin Exp Res. 2000;24(10):1517-1524.
45. O’Connor M, Whaley S. Brief intervention for alcohol use by pregnant women. Am J Pub Health. 2007;97(2):252-258.
46. Mwansa-Kambafwile J, Rendall-Mkosi K, Jacobs R, Nel E, London L. Evaluation of a service provider short course for prevention of fetal alcohol syndrome. J Stud Alcohol Drugs. 2011;72(4):530-535.
47. American College of Obstetricians and Gynecologists. At-risk alcohol use screening and intervention. http://198.87.1.43/womenalcohol/index.html. Published 2011. Accessed December 16 2012.
STOP performing DXA scans in healthy, perimenopausal women
START counseling all women on lifestyle interventions to avoid fractures
The authors report no financial relationships relevant to this article.
CASE: Premature treatment for osteopenia
A 57-year-old woman presents to establish care and discuss concerns related to menopause and osteoporosis management. She is G2P2, healthy, 5 ft 6 in, and 130 lb. She underwent natural menopause at age 51; her vasomotor symptoms have been mild, and she has not used hormone therapy. Upon annual physical examination at age 52, her former physician referred her for a mammogram, bone-density assessment, and colonoscopy. Osteopenia (femoral neck T-score, –1.8) was noted on dual-energy x-ray absorptiometry (DXA), and alendronate 70 mg per week was started.
Today, she reports 6 months of worsening vaginal dryness. In addition, she mentions concerns about taking alendronate based on recent news reports describing serious potential adverse effects.
This patient is taking osteoporosis medication unnecessarily
BMD screening was not indicated in this patient at age 52. Schnatz and colleagues found that 41% of 612 women who had been referred for and underwent DXA screening did not meet the criteria for such screening, according to the 2006 Osteoporosis Position Statement of The North American Menopause Society.1 In addition, nearly 18% of those women who underwent DXA screening without the proper indications for it were being treated for osteopenia or osteoporosis with a bisphosphonate, raloxifene, or calcitonin therapy.
These groups should be screened for BMD2–4:
- women aged 65 and older
- women younger than age 65 who are at high risk for fracture
- adults with fracture after age 50
- adults with a medical condition or who are taking a medication that is associated with low bone mass.
Bone-health treatment was not indicated in this patient at age 52. The World Health Organization’s fracture risk assessment tool (FRAX) indicated that the patient’s risk of having a major osteoporotic fracture in the next 10 years was 5.4%, and her calculated risk of hip fracture in the next 10 years was 0.5% (FIGURE). Relying on both the patient’s T-score and FRAX results, alendronate therapy should not have been initiated.
These groups meet the criteria for treatment with a prescription medication according to FRAX results4:
- >20% risk of major osteoporotic fracture in next 10 years
- >3% risk of hip fracture in the next 10 years.

FRAX calculation tool
What now?
This patient is at low risk for osteoporosis. With an estimated rate of bone loss of 0.5% per year, over the next 8 years (from age 57 to age 65), she is unlikely to have osteoporosis at age 65. Therefore, her next BMD screening should be when she reaches age 65, according to current screening guidelines.4
Treatment holiday. Although bisphosphonate side effects, including esophageal irritation and osteonecrosis of the jaw and atypical femur fracture, are rare, it makes no sense for this patient to continue her bisphosphonate since its use was not indicated in the first place. Since bisphosphonates have been shown to accumulate in bone, their treatment effect can last up to 2 years after discontinuing therapy. Ceasing treatment for 1 to 2 years, after 3 to 5 years of continuous treatment, is a good option to minimize drug exposure and the risk of complications while preserving bone density and fracture risk reduction in patients at low risk for fracture. In patients at high risk for fracture, the 1- to 2-year drug holiday should occur after 10 years of bisphosphonate treatment.5,6
Your patient’s lifestyle can help her avoid fracture. Tell her.
Counsel your patients to exercise (30 to 45 minutes per day of weight-bearing exercise), limit their alcohol intake, and ensure adequate calcium and vitamin D intake. Food sources, rather than supplement sources, of calcium are better for bone health. The total daily calcium and vitamin D intake for women should be7-10:
- Calcium: Age older than 50 years = 1200 mg/d
- Vitamin D: Until age 70 = 600 IU/d; after age 70 = 800 IU/d.
We want to hear from you! Tell us what you think.
1. Schnatz PF, Marakovitz KA, Dubois M, O’Sullivan DM. Osteoporosis screening and treatment guidelines: are they being followed? Menopause. 2011;18(10):1072-1078.
2. North American Menopause Society. Management of osteoporosis in postmenopausal women: 2010 position statement. Menopause. 2010;17(1):25-54.
3. US Preventive Services Task Force. Screening for osteoporosis: recommendation statement. http://www.uspreventiveservicestaskforce.org/uspstf10/osteoporosis/osteors.htm. Published January 18 2011. Accessed December 6, 2012.
4. National Osteoporosis Foundation. Clinician’s Guide to Prevention and Treatment of Osteoporosis. http://www.nof.org/files/nof/public/content/file/344/upload/159.pdf. Revised January 2010. Accessed December 6 2012.
5. Watts NB, Diab D. Long-term use of bisphosphonates in osteoporosis. J Clin Endocrinol Metab. 2010;95(4):1555-1565.
6. Black DM, Bauer DC, Schwartz AV, Cummings ST, Rosen CJ. Continuing bisphosphonate treatment for osteoporosis—for whom and for how long? N Engl J Med. 2012;366(22):2051-2053.
7. Manson JE, Bassuk SS. NAMS Practice Pearl: Calcium supplements: Do they help or harm? North American Menopause Society. http://www.menopause.org/publications/clinical-practice-materials/practice-pearls. Published September 6 2012. Accessed December 6, 2012.
8. Jackson RD, LaCrois AZ, Gass M, et al. Calcium plus vitamin D supplementation and the risk of fractures. N Engl J Med. 2006;354(7):669-683.
9. Ross AC, Manson JE, Abrams SA, et al. The 2011 report on dietary reference intakes for calcium and vitamin D from the Institute of Medicine: what clinicians need to know. J Clin Endocrinol Metab. 2011;96(1):53-58.
10. Ross AC, Taylor CL, Yaktine AL, Del Valle HB. eds; Committee to Review Dietary Reference Intakes for Vitamin D and Calcium, Institute of Medicine. Dietary Reference Intakes for Calcium and Vitamin D. Washington DC: The National Academies Press; 2011.
EXPERT COMMENTARY

Lisa Larkin, MD
Associate Professor, Department of Obstetrics and Gynecology, and Director, Division of Midlife Women’s Health and Primary Care, University of Cincinnati. Dr. Larkin is also Medical Director of the UC Health Women’s Center, West Chester, Ohio. She is a NAMS certified menopause practitioner.
Andrew M. Kaunitz, MD
Professor and Associate Chairman, Department of Obstetrics and Gynecology, University of Florida College of Medicine–Jacksonville. Dr. Kaunitz serves on the OBG Management Board of Editors.
EXPERT COMMENTARY
Lisa Larkin, MD
Associate Professor, Department of Obstetrics and Gynecology, and Director, Division of Midlife Women’s Health and Primary Care, University of Cincinnati. Dr. Larkin is also Medical Director of the UC Health Women’s Center, West Chester, Ohio. She is a NAMS certified menopause practitioner.
Andrew M. Kaunitz, MD
Professor and Associate Chairman, Department of Obstetrics and Gynecology, University of Florida College of Medicine–Jacksonville. Dr. Kaunitz serves on the OBG Management Board of Editors.
The authors report no financial relationships relevant to this article.
CASE: Premature treatment for osteopenia
A 57-year-old woman presents to establish care and discuss concerns related to menopause and osteoporosis management. She is G2P2, healthy, 5 ft 6 in, and 130 lb. She underwent natural menopause at age 51; her vasomotor symptoms have been mild, and she has not used hormone therapy. Upon annual physical examination at age 52, her former physician referred her for a mammogram, bone-density assessment, and colonoscopy. Osteopenia (femoral neck T-score, –1.8) was noted on dual-energy x-ray absorptiometry (DXA), and alendronate 70 mg per week was started.
Today, she reports 6 months of worsening vaginal dryness. In addition, she mentions concerns about taking alendronate based on recent news reports describing serious potential adverse effects.
This patient is taking osteoporosis medication unnecessarily
BMD screening was not indicated in this patient at age 52. Schnatz and colleagues found that 41% of 612 women who had been referred for and underwent DXA screening did not meet the criteria for such screening, according to the 2006 Osteoporosis Position Statement of The North American Menopause Society.1 In addition, nearly 18% of those women who underwent DXA screening without the proper indications for it were being treated for osteopenia or osteoporosis with a bisphosphonate, raloxifene, or calcitonin therapy.
These groups should be screened for BMD2–4:
- women aged 65 and older
- women younger than age 65 who are at high risk for fracture
- adults with fracture after age 50
- adults with a medical condition or who are taking a medication that is associated with low bone mass.
Bone-health treatment was not indicated in this patient at age 52. The World Health Organization’s fracture risk assessment tool (FRAX) indicated that the patient’s risk of having a major osteoporotic fracture in the next 10 years was 5.4%, and her calculated risk of hip fracture in the next 10 years was 0.5% (FIGURE). Relying on both the patient’s T-score and FRAX results, alendronate therapy should not have been initiated.
These groups meet the criteria for treatment with a prescription medication according to FRAX results4:
- >20% risk of major osteoporotic fracture in next 10 years
- >3% risk of hip fracture in the next 10 years.
FRAX calculation tool
What now?
This patient is at low risk for osteoporosis. With an estimated rate of bone loss of 0.5% per year, over the next 8 years (from age 57 to age 65), she is unlikely to have osteoporosis at age 65. Therefore, her next BMD screening should be when she reaches age 65, according to current screening guidelines.4
Treatment holiday. Although bisphosphonate side effects, including esophageal irritation and osteonecrosis of the jaw and atypical femur fracture, are rare, it makes no sense for this patient to continue her bisphosphonate since its use was not indicated in the first place. Since bisphosphonates have been shown to accumulate in bone, their treatment effect can last up to 2 years after discontinuing therapy. Ceasing treatment for 1 to 2 years, after 3 to 5 years of continuous treatment, is a good option to minimize drug exposure and the risk of complications while preserving bone density and fracture risk reduction in patients at low risk for fracture. In patients at high risk for fracture, the 1- to 2-year drug holiday should occur after 10 years of bisphosphonate treatment.5,6
Your patient’s lifestyle can help her avoid fracture. Tell her.
Counsel your patients to exercise (30 to 45 minutes per day of weight-bearing exercise), limit their alcohol intake, and ensure adequate calcium and vitamin D intake. Food sources, rather than supplement sources, of calcium are better for bone health. The total daily calcium and vitamin D intake for women should be7-10:
- Calcium: Age older than 50 years = 1200 mg/d
- Vitamin D: Until age 70 = 600 IU/d; after age 70 = 800 IU/d.
We want to hear from you! Tell us what you think.
1. Schnatz PF, Marakovitz KA, Dubois M, O’Sullivan DM. Osteoporosis screening and treatment guidelines: are they being followed? Menopause. 2011;18(10):1072-1078.
2. North American Menopause Society. Management of osteoporosis in postmenopausal women: 2010 position statement. Menopause. 2010;17(1):25-54.
3. US Preventive Services Task Force. Screening for osteoporosis: recommendation statement. http://www.uspreventiveservicestaskforce.org/uspstf10/osteoporosis/osteors.htm. Published January 18 2011. Accessed December 6, 2012.
4. National Osteoporosis Foundation. Clinician’s Guide to Prevention and Treatment of Osteoporosis. http://www.nof.org/files/nof/public/content/file/344/upload/159.pdf. Revised January 2010. Accessed December 6 2012.
5. Watts NB, Diab D. Long-term use of bisphosphonates in osteoporosis. J Clin Endocrinol Metab. 2010;95(4):1555-1565.
6. Black DM, Bauer DC, Schwartz AV, Cummings ST, Rosen CJ. Continuing bisphosphonate treatment for osteoporosis—for whom and for how long? N Engl J Med. 2012;366(22):2051-2053.
7. Manson JE, Bassuk SS. NAMS Practice Pearl: Calcium supplements: Do they help or harm? North American Menopause Society. http://www.menopause.org/publications/clinical-practice-materials/practice-pearls. Published September 6 2012. Accessed December 6, 2012.
8. Jackson RD, LaCrois AZ, Gass M, et al. Calcium plus vitamin D supplementation and the risk of fractures. N Engl J Med. 2006;354(7):669-683.
9. Ross AC, Manson JE, Abrams SA, et al. The 2011 report on dietary reference intakes for calcium and vitamin D from the Institute of Medicine: what clinicians need to know. J Clin Endocrinol Metab. 2011;96(1):53-58.
10. Ross AC, Taylor CL, Yaktine AL, Del Valle HB. eds; Committee to Review Dietary Reference Intakes for Vitamin D and Calcium, Institute of Medicine. Dietary Reference Intakes for Calcium and Vitamin D. Washington DC: The National Academies Press; 2011.
Is “overdiagnosis” of breast cancer common among women screened by mammography?
Women with ER-positive breast Ca may soon extend tamoxifen therapy to 10 years
To reduce deaths from cancer, screening should achieve two goals:
- It should lead to earlier detection of tumors likely to be fatal
- It should lead to better outcomes after treatment of these tumors.
In other words, effective screening increases the incidence of cancers identified at an early stage (when they have a better prognosis) as it reduces the incidence of malignancies detected at a late stage.
This study found that although screening does indeed increase the rate of detection of early-stage cancers, it reduces the diagnosis of late-stage malignancies only marginally.
Details of the trial
Using SEER data from 1976 through 2008, Bleyer and Welch looked for trends in the incidence of breast cancer—both early-stage malignancies (ductal carcinoma in situ and localized disease) and late-stage disease (regional and distant cancers)—among women aged 40 years or older. They also calculated the baseline incidence of breast cancer before screening using data from 1973, the first year that the rate of breast cancer was recorded. Because the incidence of breast cancer that year was “almost certainly spuriously low,” they also incorporated data from 1974 and 1975, when the rate of breast cancer was higher than average following the diagnosis of breast cancer in First Lady Betty Ford.
Bleyer and Welch also took measures to adjust for the higher incidence of breast cancer associated with the use of menopausal hormone therapy. To do so, they estimated the current incidence of breast cancer using data from 2006 through 2008, and they adjusted data for each year that the rate of breast cancer exceeded that figure from 1990 through 2005.
From 1976 through 2008, the rate of detection of early-stage disease more than doubled, increasing from 112 to 234 cancers per 100,000 women, while the detection of late-stage disease incrementally decreased, from 102 to 94 cancers per 100,000 women. Assuming a “constant underlying disease burden,” Bleyer and Welch estimated that only eight of the 122 additional early-stage cancers identified through screening were destined to progress to advanced disease. That means that 114 excess cases of breast cancer were detected per 100,000 women.
The number of women affected by overdiagnosis: an estimated 1.3 million, including more than 70,000 women in 2008 alone.
During the 30 years covered by this study, breast cancer deaths declined 28% among women aged 40 years and older (a population in which screening mammography was prevalent); among women younger than age 40 (a population in which screening was not prevalent), breast cancer mortality declined 42%. These declines are thought to be the result, largely, of advances in treatment.
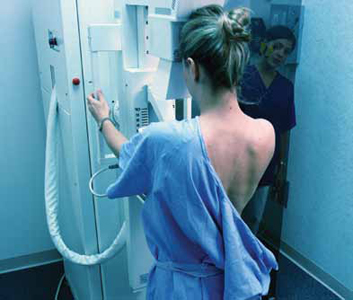
Harms versus benefits of early detection
There is no question that screening mammography saves lives by promoting early diagnosis of breast cancer. However, as I stated above, the decline in breast cancer deaths identified in this study may be attributable more to improvements in treatment than to early diagnosis of breast cancer. This study also suggests that the benefits of screening mammography are overshadowed by the harms (including unnecessary diagnostic imaging, biopsies, surgery, chemotherapy, and radiation therapy) associated with overdiagnosis. From this perspective, a screening strategy for average-risk women in which mammography is initiated later, and is performed less frequently, would appear prudent. Accordingly, rather than adhere to guidelines from ACOG and other groups that recommend that screening be initiated earlier and performed annually, it makes more sense in average-risk women to follow the 2009 guidelines from the US Preventive Services Task Force, which recommend:
- biennial screening mammography for women aged 50 to 74 years
- biennial screening mammography before the age of 50 years only if, after counseling about the potential benefits and risks, the patient chooses this option.1
How these findings compare with other data
Three studies shed light on the efficacy of screening mammography in other populations. In an investigation from Norway, Kalager and colleagues examined the breast cancer mortality rate in four groups of women:
- those who lived in counties where screening mammography was performed during the years 1996 through 2005
- those who lived in counties where screening mammography was not performed (1996–2005)
- two historical comparison groups (1986–1995) that mirrored the first two groups.2
Their analysis of 40,075 women with breast cancer suggested that one-third of the reduction in breast cancer deaths during the time periods studied was the direct result of screening, whereas the bulk of the observed reduction in breast cancer mortality was attributed to greater breast cancer awareness, improved diagnostic (as opposed to screening) techniques, and enhancements in treatment.
In a look at breast cancer mortality within three pairs of European countries, Autier and colleagues concluded that screening did not directly contribute to the observed reduction in mortality.3 The country pairs were:
- Northern Ireland and the Republic of Ireland
- the Netherlands and Belgium/Flanders
- Sweden and Norway.
Each pair of countries offered comparable health-care services, had a similar prevalence of risk factors for breast cancer mortality, and experienced a similar reduction in breast cancer mortality from 1989 to 2006. However, implementation of mammography screening in these paired countries differed by approximately 10 to 15 years.
Last, in a meta-analysis from the United Kingdom, where women 50 to 70 years old are invited to be screened every 3 years, an independent panel concluded that mammography reduced breast cancer deaths but also led to overdiagnosis.4 Although the analysis included studies “with many limitations,” its findings suggest that one breast cancer death would be prevented for every three cases of overdiagnosis.
Improvements are expected
Thanks to a recent analysis of the breast cancer genome, in the future it may become possible to identify which breast tumors are likely to progress. Such an advance would allow clinicians to recommend treatment strategies in a highly selective fashion.5
The findings from this recent study make me that much more comfortable following the USPSTF guidelines for screening mammography. For average-risk women in their 40s, I do not push screening but am happy to arrange it if my patient would feel more comfortable being screened. However, if a woman in her 40s is at increased risk (eg, first-degree relative with breast cancer), I encourage her to undergo annual screens.
As for average-risk women in their 50s and older, I find that most of my patients continue to prefer annual screening, but I am supportive of screening every 18 or 24 months in this population.
Some ObGyns may wonder if they could be exposed to medicolegal risk if they do not follow ACOG guidelines. For example, what would happen if a patient in her 40s who has not been screened were diagnosed with breast cancer? I am not an attorney, but I know that the USPSTF guidelines represent a credible (many would say authoritative) resource for guidance related to mammography screening. Speaking of the USPSTF, it is worth pointing out that this body is made up of 16 primary care and public health physicians (including one ObGyn) who have no stake in regard to breast imaging. (See http://www.uspreventiveservicestaskforce.org/members.htm.)
It’s my view that radiologists who provide screening breast imaging services can play an important role in educating women about the pros and cons of mammography. Looking to the future, perhaps women checking in for a screening mammogram will be asked to review and sign a document that clearly explains benefits (eg, reducing mortality through early diagnosis) as well as risks (eg, the occurrence and consequences of overdiagnosis: finding cancers that are destined not to not to cause advanced disease).
ANDREW M. KAUNITZ, MD
We want to hear from you! Tell us what you think.
1. US Preventive Services Task Force Screening for Breast Cancer. http://www.uspreventiveservicestaskforce.org/uspstf/uspsbrca.htm. Accessed December 18 2012.
2. Kalager M, Zelen M, Langmark F, Adami H-O. Effect of screening mammography on breast-cancer mortality in Norway. N Engl J Med. 2010;363:1203-1210.
3. Autier P, Boniol M, Gavin A, Vatten LJ. Breast cancer mortality in neighboring European countries with different levels of screening but similar access to treatment: trend analysis of WHO mortality database. BMJ. 2011;343:d4411.-
4. Independent UK Panel on Breast Cancer Screening. The benefits and harms of breast cancer screening: an independent review. Lancet. 2012;380(9855):1778-1786.
5. Cancer Genome Atlas Network. Comprehensive molecular portraits of human breast tumours. Nature. 2012;490(7418):61-70.
Yes. This analysis of Surveillance, Epidemiology, and End Results (SEER) data from a 30-year span indicates that nearly one-third of all breast malignancies identified during screening are overdiagnosed—that is, they are unlikely ever to lead to clinical symptoms.
| Dr. Kaunitz offers tips on counseling women about mammography screening |
Bleyer A, Welch HG. Effect of three decades of screening mammography on breast-cancer incidence. N Engl J Med. 2012;367(21):1998–2005.
EXPERT COMMENTARY
Andrew M. Kaunitz, MD
Professor and Associate Chairman, Department of Obstetrics and Gynecology, University of Florida College of Medicine–Jacksonville. Dr. Kaunitz serves on the OBG Management Board of Editors.
Women with ER-positive breast Ca may soon extend tamoxifen therapy to 10 years
To reduce deaths from cancer, screening should achieve two goals:
- It should lead to earlier detection of tumors likely to be fatal
- It should lead to better outcomes after treatment of these tumors.
In other words, effective screening increases the incidence of cancers identified at an early stage (when they have a better prognosis) as it reduces the incidence of malignancies detected at a late stage.
This study found that although screening does indeed increase the rate of detection of early-stage cancers, it reduces the diagnosis of late-stage malignancies only marginally.
Details of the trial
Using SEER data from 1976 through 2008, Bleyer and Welch looked for trends in the incidence of breast cancer—both early-stage malignancies (ductal carcinoma in situ and localized disease) and late-stage disease (regional and distant cancers)—among women aged 40 years or older. They also calculated the baseline incidence of breast cancer before screening using data from 1973, the first year that the rate of breast cancer was recorded. Because the incidence of breast cancer that year was “almost certainly spuriously low,” they also incorporated data from 1974 and 1975, when the rate of breast cancer was higher than average following the diagnosis of breast cancer in First Lady Betty Ford.
Bleyer and Welch also took measures to adjust for the higher incidence of breast cancer associated with the use of menopausal hormone therapy. To do so, they estimated the current incidence of breast cancer using data from 2006 through 2008, and they adjusted data for each year that the rate of breast cancer exceeded that figure from 1990 through 2005.
From 1976 through 2008, the rate of detection of early-stage disease more than doubled, increasing from 112 to 234 cancers per 100,000 women, while the detection of late-stage disease incrementally decreased, from 102 to 94 cancers per 100,000 women. Assuming a “constant underlying disease burden,” Bleyer and Welch estimated that only eight of the 122 additional early-stage cancers identified through screening were destined to progress to advanced disease. That means that 114 excess cases of breast cancer were detected per 100,000 women.
The number of women affected by overdiagnosis: an estimated 1.3 million, including more than 70,000 women in 2008 alone.
During the 30 years covered by this study, breast cancer deaths declined 28% among women aged 40 years and older (a population in which screening mammography was prevalent); among women younger than age 40 (a population in which screening was not prevalent), breast cancer mortality declined 42%. These declines are thought to be the result, largely, of advances in treatment.
Harms versus benefits of early detection
There is no question that screening mammography saves lives by promoting early diagnosis of breast cancer. However, as I stated above, the decline in breast cancer deaths identified in this study may be attributable more to improvements in treatment than to early diagnosis of breast cancer. This study also suggests that the benefits of screening mammography are overshadowed by the harms (including unnecessary diagnostic imaging, biopsies, surgery, chemotherapy, and radiation therapy) associated with overdiagnosis. From this perspective, a screening strategy for average-risk women in which mammography is initiated later, and is performed less frequently, would appear prudent. Accordingly, rather than adhere to guidelines from ACOG and other groups that recommend that screening be initiated earlier and performed annually, it makes more sense in average-risk women to follow the 2009 guidelines from the US Preventive Services Task Force, which recommend:
- biennial screening mammography for women aged 50 to 74 years
- biennial screening mammography before the age of 50 years only if, after counseling about the potential benefits and risks, the patient chooses this option.1
How these findings compare with other data
Three studies shed light on the efficacy of screening mammography in other populations. In an investigation from Norway, Kalager and colleagues examined the breast cancer mortality rate in four groups of women:
- those who lived in counties where screening mammography was performed during the years 1996 through 2005
- those who lived in counties where screening mammography was not performed (1996–2005)
- two historical comparison groups (1986–1995) that mirrored the first two groups.2
Their analysis of 40,075 women with breast cancer suggested that one-third of the reduction in breast cancer deaths during the time periods studied was the direct result of screening, whereas the bulk of the observed reduction in breast cancer mortality was attributed to greater breast cancer awareness, improved diagnostic (as opposed to screening) techniques, and enhancements in treatment.
In a look at breast cancer mortality within three pairs of European countries, Autier and colleagues concluded that screening did not directly contribute to the observed reduction in mortality.3 The country pairs were:
- Northern Ireland and the Republic of Ireland
- the Netherlands and Belgium/Flanders
- Sweden and Norway.
Each pair of countries offered comparable health-care services, had a similar prevalence of risk factors for breast cancer mortality, and experienced a similar reduction in breast cancer mortality from 1989 to 2006. However, implementation of mammography screening in these paired countries differed by approximately 10 to 15 years.
Last, in a meta-analysis from the United Kingdom, where women 50 to 70 years old are invited to be screened every 3 years, an independent panel concluded that mammography reduced breast cancer deaths but also led to overdiagnosis.4 Although the analysis included studies “with many limitations,” its findings suggest that one breast cancer death would be prevented for every three cases of overdiagnosis.
Improvements are expected
Thanks to a recent analysis of the breast cancer genome, in the future it may become possible to identify which breast tumors are likely to progress. Such an advance would allow clinicians to recommend treatment strategies in a highly selective fashion.5
The findings from this recent study make me that much more comfortable following the USPSTF guidelines for screening mammography. For average-risk women in their 40s, I do not push screening but am happy to arrange it if my patient would feel more comfortable being screened. However, if a woman in her 40s is at increased risk (eg, first-degree relative with breast cancer), I encourage her to undergo annual screens.
As for average-risk women in their 50s and older, I find that most of my patients continue to prefer annual screening, but I am supportive of screening every 18 or 24 months in this population.
Some ObGyns may wonder if they could be exposed to medicolegal risk if they do not follow ACOG guidelines. For example, what would happen if a patient in her 40s who has not been screened were diagnosed with breast cancer? I am not an attorney, but I know that the USPSTF guidelines represent a credible (many would say authoritative) resource for guidance related to mammography screening. Speaking of the USPSTF, it is worth pointing out that this body is made up of 16 primary care and public health physicians (including one ObGyn) who have no stake in regard to breast imaging. (See http://www.uspreventiveservicestaskforce.org/members.htm.)
It’s my view that radiologists who provide screening breast imaging services can play an important role in educating women about the pros and cons of mammography. Looking to the future, perhaps women checking in for a screening mammogram will be asked to review and sign a document that clearly explains benefits (eg, reducing mortality through early diagnosis) as well as risks (eg, the occurrence and consequences of overdiagnosis: finding cancers that are destined not to not to cause advanced disease).
ANDREW M. KAUNITZ, MD
We want to hear from you! Tell us what you think.
1. US Preventive Services Task Force Screening for Breast Cancer. http://www.uspreventiveservicestaskforce.org/uspstf/uspsbrca.htm. Accessed December 18 2012.
2. Kalager M, Zelen M, Langmark F, Adami H-O. Effect of screening mammography on breast-cancer mortality in Norway. N Engl J Med. 2010;363:1203-1210.
3. Autier P, Boniol M, Gavin A, Vatten LJ. Breast cancer mortality in neighboring European countries with different levels of screening but similar access to treatment: trend analysis of WHO mortality database. BMJ. 2011;343:d4411.-
4. Independent UK Panel on Breast Cancer Screening. The benefits and harms of breast cancer screening: an independent review. Lancet. 2012;380(9855):1778-1786.
5. Cancer Genome Atlas Network. Comprehensive molecular portraits of human breast tumours. Nature. 2012;490(7418):61-70.
Win Whitcomb: Introducing Neuroquality and Neurosafety

The prefix “neuro” has become quite popular the last couple of years. We have neuroeconomics, neuroplasticity, neuroergonomics, and, of course, neurohospitalist. The explosion of interest in the brain can be seen in the popular press, television, blogs, and the Journal of the American Medical Association.
I predict that recent breakthroughs in brain science and related fields (cognitive psychology, neurobiology, molecular biology, linguistics, and artificial intelligence, among others) will have a profound impact on the fields of quality improvement (QI) and patient safety, and, consequently on HM. To date, the patient safety movement has focused on systems issues in an effort to reduce harm induced by the healthcare system. I submit that for healthcare to be reliable and error-free in the future, we must leverage the innate strengths of the brain. Here I mention four areas where brain science breakthroughs can enable us to improve patient safety practices.
Diagnostic Error
Patrick Croskerry, an emergency physician and researcher, has described errors in diagnosis as stemming in part from cognitive bias. He offers “de-biasing strategies” as an approach to decreasing diagnostic error.
One of the most powerful de-biasing strategies is metacognition, or awareness of one’s own thinking processes. Closely related to metacognition is mindfulness, defined as the “nonjudgmental awareness of the present moment.” A growing body of literature makes the case that enhancing mindfulness might reduce the impact bias has on diagnostic error.1 Table 1 (right) mentions a subset of bias types and how mindfulness might mitigate them. I’m sure you can think of cases you’ve encountered where bias has affected the diagnostic outcome.
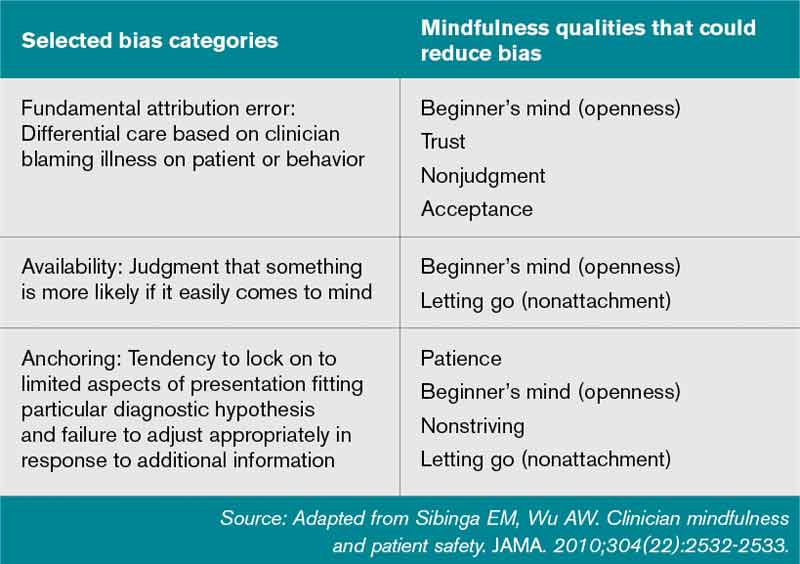
Empathy and Patient Experience
As the focus on patient experience grows, approaches to improving performance on patient satisfaction surveys are proliferating. Whatever technical components you choose to employ, a capacity for caregiver empathy is a crucial underlying factor to a better patient experience. Harvard psychiatrist Helen Riess, MD, points out that we are now beginning to understand the neurobiological basis of empathy. She and others present evidence that we may be able to “up-regulate” empathy through education or cognitive practices.2 Several studies suggest we might be able to realize improved therapeutic relationships between physicians and patients, and they have led to programs, such as the ones at Stanford and Emory universities, that train caregivers to enhance empathy and compassion.
Interruptions and Cognitive Error
It has been customary in high-risk industries to ensure that certain procedures are free of interruptions. There is recognition that disturbances during high-stakes tasks, such as airline takeoff, carry disastrous consequences. We now know that multitasking is a myth and that the brain instead switches between tasks sequentially. But task-switching comes at the high cost of a marked increase in the rate of cognitive error.3 As we learn more, decreasing interruptions or delineating “interruption-free” zones in healthcare could be a way to mitigate an inherent vulnerability in our cognitive abilities.
Fatigue and Medical Error
It is well documented that sleep deprivation correlates with a decline in cognitive
performance in a number of classes of healthcare workers. Fatigue has also increased diagnostic error among residents. A 2011 Sentinel Alert from The Joint Commission creates a standard that healthcare organizations implement a fatigue-management plan to mitigate the potential harm caused by tired professionals.
Most of the approaches to improving outcomes in the hospital have focused on process improvement and systems thinking. But errors also occur due to the thinking process of clinicians. In the book “Brain Rules,” author John Medina argues that schools and businesses create an environment that is less than friendly to the brain, citing current classroom design and cubicles for office workers. As a result, he states, we often have poor educational and business performance. I have little doubt that if Medina spent a few hours in a hospital, he would come to a similar conclusion: We don’t do the brain any favors when it comes to creating a healthy environment for providing safe and reliable care to our patients.
References
- Sibinga EM, Wu AW. Clinician mindfulness and patient safety. JAMA. 2010;304(22):2532-2533.
- Riess H. Empathy in medicine─a neurobiological perspective. JAMA. 2010;304(14):1604-1605.
- Rogers RD, Monsell S. The costs of a predictable switch between simple cognitive tasks. J Exper Psychol. 1995;124(2):207–231.
Dr. Whitcomb is medical director of healthcare quality at Baystate Medical Center in Springfield, Mass. He is a co-founder and past president of SHM. Email him at wfwhit@comcast.net.
The prefix “neuro” has become quite popular the last couple of years. We have neuroeconomics, neuroplasticity, neuroergonomics, and, of course, neurohospitalist. The explosion of interest in the brain can be seen in the popular press, television, blogs, and the Journal of the American Medical Association.
I predict that recent breakthroughs in brain science and related fields (cognitive psychology, neurobiology, molecular biology, linguistics, and artificial intelligence, among others) will have a profound impact on the fields of quality improvement (QI) and patient safety, and, consequently on HM. To date, the patient safety movement has focused on systems issues in an effort to reduce harm induced by the healthcare system. I submit that for healthcare to be reliable and error-free in the future, we must leverage the innate strengths of the brain. Here I mention four areas where brain science breakthroughs can enable us to improve patient safety practices.
Diagnostic Error
Patrick Croskerry, an emergency physician and researcher, has described errors in diagnosis as stemming in part from cognitive bias. He offers “de-biasing strategies” as an approach to decreasing diagnostic error.
One of the most powerful de-biasing strategies is metacognition, or awareness of one’s own thinking processes. Closely related to metacognition is mindfulness, defined as the “nonjudgmental awareness of the present moment.” A growing body of literature makes the case that enhancing mindfulness might reduce the impact bias has on diagnostic error.1 Table 1 (right) mentions a subset of bias types and how mindfulness might mitigate them. I’m sure you can think of cases you’ve encountered where bias has affected the diagnostic outcome.
Empathy and Patient Experience
As the focus on patient experience grows, approaches to improving performance on patient satisfaction surveys are proliferating. Whatever technical components you choose to employ, a capacity for caregiver empathy is a crucial underlying factor to a better patient experience. Harvard psychiatrist Helen Riess, MD, points out that we are now beginning to understand the neurobiological basis of empathy. She and others present evidence that we may be able to “up-regulate” empathy through education or cognitive practices.2 Several studies suggest we might be able to realize improved therapeutic relationships between physicians and patients, and they have led to programs, such as the ones at Stanford and Emory universities, that train caregivers to enhance empathy and compassion.
Interruptions and Cognitive Error
It has been customary in high-risk industries to ensure that certain procedures are free of interruptions. There is recognition that disturbances during high-stakes tasks, such as airline takeoff, carry disastrous consequences. We now know that multitasking is a myth and that the brain instead switches between tasks sequentially. But task-switching comes at the high cost of a marked increase in the rate of cognitive error.3 As we learn more, decreasing interruptions or delineating “interruption-free” zones in healthcare could be a way to mitigate an inherent vulnerability in our cognitive abilities.
Fatigue and Medical Error
It is well documented that sleep deprivation correlates with a decline in cognitive
performance in a number of classes of healthcare workers. Fatigue has also increased diagnostic error among residents. A 2011 Sentinel Alert from The Joint Commission creates a standard that healthcare organizations implement a fatigue-management plan to mitigate the potential harm caused by tired professionals.
Most of the approaches to improving outcomes in the hospital have focused on process improvement and systems thinking. But errors also occur due to the thinking process of clinicians. In the book “Brain Rules,” author John Medina argues that schools and businesses create an environment that is less than friendly to the brain, citing current classroom design and cubicles for office workers. As a result, he states, we often have poor educational and business performance. I have little doubt that if Medina spent a few hours in a hospital, he would come to a similar conclusion: We don’t do the brain any favors when it comes to creating a healthy environment for providing safe and reliable care to our patients.
References
- Sibinga EM, Wu AW. Clinician mindfulness and patient safety. JAMA. 2010;304(22):2532-2533.
- Riess H. Empathy in medicine─a neurobiological perspective. JAMA. 2010;304(14):1604-1605.
- Rogers RD, Monsell S. The costs of a predictable switch between simple cognitive tasks. J Exper Psychol. 1995;124(2):207–231.
Dr. Whitcomb is medical director of healthcare quality at Baystate Medical Center in Springfield, Mass. He is a co-founder and past president of SHM. Email him at wfwhit@comcast.net.
John Nelson: Peformance Key to Federal Value-Based Payment Modifier Plan

For years, your hospital was paid additional money by Medicare to report its performance on such things as core measures. Medicare then shared that information with the public via www.hospitalcompare.hhs.gov. Even if the hospital never gave Pneumovax when indicated, it was paid more simply for reporting that fact. (Fortunately, there were lots of reasons hospitals wanted to perform well.)
The days of hospitals being paid more simply for reporting ended a long time ago. Now performance, e.g., how often Pneumovax was given when indicated, influences payment. That is, things have transitioned from pay-for-reporting to a pay-for-performance program called hospital value-based purchasing (VBP).
I hope that at least one member of your hospitalist group is keeping up with hospital VBP. It got a lot of attention in the fall because it was the first time Medicare Part A payments to hospitals were adjusted based on performance on some core measures and patient satisfaction domains, as well as readmission rates for congestive heart failure (CHF), acute myocardial infarction (AMI), and pneumonia patients. The dollars at stake and performance metrics change will change every year, so plan to pay attention to hospital VBP on an ongoing basis.
Physicians’ Turn
Medicare payment to physicians is evolving along the same trajectory as hospitals. For several years, doctors have had the option to voluntarily participate in the Physician Quality Reporting System (PQRS). As long as a doctor reported quality performance on a sufficient portion of certain patient types, Medicare would provide a “bonus” at the end of the year. From 2012 through 2014, the “bonus” is 0.5% of that doctor’s total allowable Medicare charges. For example, if that doctor generated $150,000 of Medicare allowable charges over the calendar year, the additional payment for successful reporting PQRS would be $750 (0.5% of $150,000).
Although $750 is only a tiny fraction of collections, the right charge-capture system can make it pretty easy to achieve. And an extra payment of $750 sure is better than the 1.5% penalty for not participating; that program starts in 2015 and increases to a 2% penalty in 2016. If you are still not participating successfully in PQRS in 2015, the reimbursement for that $150,000 in charges will be reduced by $2,250 (1.5% of $150,000). So I strongly recommend that you begin reporting in 2013 so that you have time to work out the kinks well ahead of 2015. Don’t delay, but don’t panic, either, because you can still succeed in 2013 even if you don’t start capturing or reporting PQRS data until late winter or early spring.
At some point in the next year or so, data from as early as January 2013 for doctors reporting through PQRS will be made public on the Centers for Medicare & Medicaid’s (CMS) physician compare website: www.medicare.gov/find-a-doctor/provider-search.aspx. For example, should you choose to report the portion of stroke patients for whom you prescribed DVT prophylaxis, the public will be able to see your data.
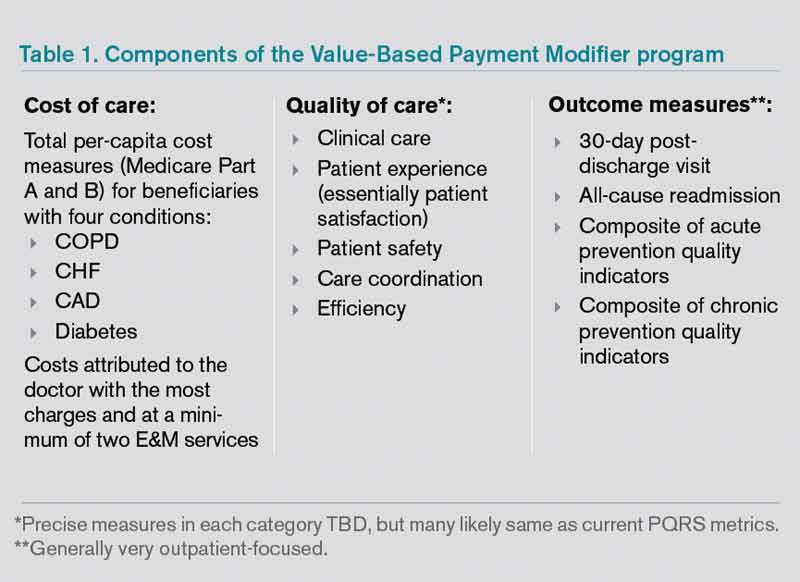
The Next Wave of Physician Pay for Performance
As the name implies, PQRS is a program based on reporting. Now CMS is adding the Value-Based Payment Modifier (VBPM) program, in which performance determines payments (see Table 1). It incorporates quality measures from PQRS, but is for now a separate program. It is very similar in name and structure to the hospital VBP program mentioned above, but incorporates cost of care data as well as quality performance. So it is really about value and not just quality performance (hence the name).
For providers in groups of more than 100 that bill under the same tax ID number (they don’t have to be in the same specialty), VBPM will first influence Part B Medicare reimbursement for physician services in 2015. It will expand to include all providers in 2017.
But don’t think you have until 2015 or 2017 to learn about all of this. There is a two-year lag, so payments in 2015 are based on performance in 2013 and 2017 payments presumably will be based on 2015 performance. In the fall of 2013, CMS plans to provide group-level (not individual) performance reports to all doctors in groups of 100 or more under the same tax ID number. These performance reports are known as quality resource use reports (QRURs). QRURs were trialed on physicians in a few states who received reports in 2012 based on 2011 performance, but in 2013, reports based on 2012 performance will be distributed to all doctors who practice in groups of 100 or more.
The calculation to determine whether a doctor is due additional payment for good performance (more accurately, good value) is awfully complicated. But providers have a choice to make. They can choose to:
- Not report data and accept a 1% penalty (likely to increase in successive years and in addition to the penalty for not reporting PQRS data, for a total penalty of 2.5%);
- Report data but not compete for financial upside or downside; or
- Compete for additional payments (amount to be determined) and risk a penalty of 0.5% or 1% for poor performance.
Look for more details about the VBPM program in future columns and other articles in The Hospitalist. There are a number of good online resources, including a CMS presentation titled “CMS Proposals for the Physician Value-Based Payment Modifier under the Medicare Physician Fee Schedule.” Type “Value-Based Payment Modifier” and “CMS” into any search engine to locate the video.
Parting Recommendations
Just about every hospitalist group should:
- Designate someone in your group to keep up with evolving pay-for-performance programs. It doesn’t have to be an MD, but you do need someone local that can guide your group through it. Consider becoming the most expert physician at your hospital on this topic.
- Start reporting through PQRS in 2013 if you haven’t already.
- Support SHM’s efforts to provide feedback to CMS to ensure that the metrics are meaningful for the type of care we provide.
Dr. Nelson has been a practicing hospitalist since 1988. He is co-founder and past president of SHM, and principal in Nelson Flores Hospital Medicine Consultants. He is course co-director for SHM’s “Best Practices in Managing a Hospital Medicine Program” course. Write to him at john.nelson@nelsonflores.com.
Author’s note: For helping to explain all this pay-for-performance stuff, I once again owe thanks to Dr. Pat Torcson, a hospitalist in Covington, La., and member of SHM’s Public Policy Committee. He does an amazing job of keeping up with the evolving pay-for-performance programs, advocating on behalf of hospitalists and the patients we serve, and graciously answers my tedious questions with thoughtful and informative replies. He is a really pleasant guy and a terrific asset to SHM and hospital medicine.
For years, your hospital was paid additional money by Medicare to report its performance on such things as core measures. Medicare then shared that information with the public via www.hospitalcompare.hhs.gov. Even if the hospital never gave Pneumovax when indicated, it was paid more simply for reporting that fact. (Fortunately, there were lots of reasons hospitals wanted to perform well.)
The days of hospitals being paid more simply for reporting ended a long time ago. Now performance, e.g., how often Pneumovax was given when indicated, influences payment. That is, things have transitioned from pay-for-reporting to a pay-for-performance program called hospital value-based purchasing (VBP).
I hope that at least one member of your hospitalist group is keeping up with hospital VBP. It got a lot of attention in the fall because it was the first time Medicare Part A payments to hospitals were adjusted based on performance on some core measures and patient satisfaction domains, as well as readmission rates for congestive heart failure (CHF), acute myocardial infarction (AMI), and pneumonia patients. The dollars at stake and performance metrics change will change every year, so plan to pay attention to hospital VBP on an ongoing basis.
Physicians’ Turn
Medicare payment to physicians is evolving along the same trajectory as hospitals. For several years, doctors have had the option to voluntarily participate in the Physician Quality Reporting System (PQRS). As long as a doctor reported quality performance on a sufficient portion of certain patient types, Medicare would provide a “bonus” at the end of the year. From 2012 through 2014, the “bonus” is 0.5% of that doctor’s total allowable Medicare charges. For example, if that doctor generated $150,000 of Medicare allowable charges over the calendar year, the additional payment for successful reporting PQRS would be $750 (0.5% of $150,000).
Although $750 is only a tiny fraction of collections, the right charge-capture system can make it pretty easy to achieve. And an extra payment of $750 sure is better than the 1.5% penalty for not participating; that program starts in 2015 and increases to a 2% penalty in 2016. If you are still not participating successfully in PQRS in 2015, the reimbursement for that $150,000 in charges will be reduced by $2,250 (1.5% of $150,000). So I strongly recommend that you begin reporting in 2013 so that you have time to work out the kinks well ahead of 2015. Don’t delay, but don’t panic, either, because you can still succeed in 2013 even if you don’t start capturing or reporting PQRS data until late winter or early spring.
At some point in the next year or so, data from as early as January 2013 for doctors reporting through PQRS will be made public on the Centers for Medicare & Medicaid’s (CMS) physician compare website: www.medicare.gov/find-a-doctor/provider-search.aspx. For example, should you choose to report the portion of stroke patients for whom you prescribed DVT prophylaxis, the public will be able to see your data.
The Next Wave of Physician Pay for Performance
As the name implies, PQRS is a program based on reporting. Now CMS is adding the Value-Based Payment Modifier (VBPM) program, in which performance determines payments (see Table 1). It incorporates quality measures from PQRS, but is for now a separate program. It is very similar in name and structure to the hospital VBP program mentioned above, but incorporates cost of care data as well as quality performance. So it is really about value and not just quality performance (hence the name).
For providers in groups of more than 100 that bill under the same tax ID number (they don’t have to be in the same specialty), VBPM will first influence Part B Medicare reimbursement for physician services in 2015. It will expand to include all providers in 2017.
But don’t think you have until 2015 or 2017 to learn about all of this. There is a two-year lag, so payments in 2015 are based on performance in 2013 and 2017 payments presumably will be based on 2015 performance. In the fall of 2013, CMS plans to provide group-level (not individual) performance reports to all doctors in groups of 100 or more under the same tax ID number. These performance reports are known as quality resource use reports (QRURs). QRURs were trialed on physicians in a few states who received reports in 2012 based on 2011 performance, but in 2013, reports based on 2012 performance will be distributed to all doctors who practice in groups of 100 or more.
The calculation to determine whether a doctor is due additional payment for good performance (more accurately, good value) is awfully complicated. But providers have a choice to make. They can choose to:
- Not report data and accept a 1% penalty (likely to increase in successive years and in addition to the penalty for not reporting PQRS data, for a total penalty of 2.5%);
- Report data but not compete for financial upside or downside; or
- Compete for additional payments (amount to be determined) and risk a penalty of 0.5% or 1% for poor performance.
Look for more details about the VBPM program in future columns and other articles in The Hospitalist. There are a number of good online resources, including a CMS presentation titled “CMS Proposals for the Physician Value-Based Payment Modifier under the Medicare Physician Fee Schedule.” Type “Value-Based Payment Modifier” and “CMS” into any search engine to locate the video.
Parting Recommendations
Just about every hospitalist group should:
- Designate someone in your group to keep up with evolving pay-for-performance programs. It doesn’t have to be an MD, but you do need someone local that can guide your group through it. Consider becoming the most expert physician at your hospital on this topic.
- Start reporting through PQRS in 2013 if you haven’t already.
- Support SHM’s efforts to provide feedback to CMS to ensure that the metrics are meaningful for the type of care we provide.
Dr. Nelson has been a practicing hospitalist since 1988. He is co-founder and past president of SHM, and principal in Nelson Flores Hospital Medicine Consultants. He is course co-director for SHM’s “Best Practices in Managing a Hospital Medicine Program” course. Write to him at john.nelson@nelsonflores.com.
Author’s note: For helping to explain all this pay-for-performance stuff, I once again owe thanks to Dr. Pat Torcson, a hospitalist in Covington, La., and member of SHM’s Public Policy Committee. He does an amazing job of keeping up with the evolving pay-for-performance programs, advocating on behalf of hospitalists and the patients we serve, and graciously answers my tedious questions with thoughtful and informative replies. He is a really pleasant guy and a terrific asset to SHM and hospital medicine.
Does urodynamic testing before surgery for stress incontinence improve outcomes?
URINARY PROBLEMS?
CLICK HERE to access 8 other articles about treating urinary incontinence and urinary tract infections, published in OBG Management in 2012.
Nager and colleagues conducted their trial to determine whether urodynamic testing is necessary before midurethral sling surgery for simple, “garden-variety” stress urinary incontinence (SUI). In their trial, 630 women were randomly assigned to undergo office evaluation with urodynamic tests (n = 315) or office evaluation only (n = 315). Surgical treatment was successful in 76.9% of women in the urodynamic-testing group and in 77.2% of women in the office evaluation-only group (95% confidence interval [CI], –7.5 to 6.9) as long as 1 year after surgery. There were no significant differences between groups in quality of life, patient satisfaction, and other secondary measures of incontinence severity. Investigators concluded that preoperative office evaluation (positive stress test, urethral hypermobility, normal postvoid residual, and negative urinalysis) is not inferior to urodynamic testing.
Should these findings come as a surprise to pelvic surgeons? Retropubic and transobturator slings are associated with very low morbidity and high efficacy. Studies already have demonstrated that, in simple SUI, these slings produce similar outcomes.1 So there is some consensus that urodynamic testing may be unnecessary prior to placement of a midurethral sling for simple SUI. This study lends credence to that notion.
Outcome measures: Focused enough?
The primary outcome measures used in this trial were not designed primarily to assess the severity of SUI. Investigators employed the Urogenital Distress Inventory, which focuses mostly on irritative bladder symptoms and includes only one question about the presence and impact of SUI. They also utilized the Patient Global Impression of Improvement, a global scale related to incontinence in general. Other tests—such as standardized stress tests, pad tests, and bladder diaries—are more specific in the evaluation of SUI severity. Nager and colleagues used these measures themselves in an earlier exploration of the role of urodynamics in predicting sling failure.2
Moreover, in the current study, urodynamic testing did not include a measurement of urethral closure pressure, which has been strongly correlated with success after Burch colposuspension and retropubic and transobturator sling procedures. This test would have added valuable data.
Another shortcoming was the lack of uniformity in the sling procedures that were selected. Most experts believe that retropubic and transobturator slings have unique mechanistic characteristics that do not allow them to be interchangeable. Investigators should have selected a single sling approach.
Is a 77% success rate acceptable to most patients?
SUI represents a continuum of disease severity, and various studies have demonstrated a higher success rate for retropubic slings than for the transobturator approach when sphincteric function is impaired. At our center, we utilize urodynamic parameters to identify women who may achieve a higher continence rate with a retropubic sling.3
Retropubic slings are not appropriate for all patients with SUI. Although the risk of serious complications, such as retropubic hematoma or bowel perforation, is very low, complications sometimes do occur and are related to surgical volumes. For this reason, transobturator slings, which carry minimal associated risks, play a key role in the management of garden-variety SUI.
Indications for multichannel urodynamic testing
|
Don’t throw away your urodynamic equipment just yet. Many patients have complex incontinence symptoms or other indications for urodynamic testing (TABLE). In addition, a clear understanding of urgency symptoms and voiding dysfunction can be very useful during preoperative counseling of patients who are scheduled to undergo sling surgery. Significant urgency is likely to persist postoperatively, and voiding difficulties may worsen after a sling procedure, especially if a retropubic sling is used.
G. WILLY DAVILA, MD
We want to hear from you! Tell us what you think.
Urinary incontinence
Karen L. Noblett, MD, MAS, and Stephanie A. Jacobs, MD (Update, December 2012)
1. Barber MD, Kleeman S, Karram MM, et al. Transobturator tape compared with tension-free vaginal tape for the treatment of stress urinary incontinence. Obstet Gynecol. 2008;111(3):611-621.
2. Nager CW, Siris L, Litman HJ, et al. Baseline urodynamic predictors of treatment failure 1 year after midurethral sling surgery. J Urol. 2011;186:597-603.
3. Guerette NL, Bena JF, Davila GW. Transobturator slings for stress incontinence: using urodynamic parameters to predict outcomes. Int Urogynecol J. 2008;19(1):97-102.
URINARY PROBLEMS?
CLICK HERE to access 8 other articles about treating urinary incontinence and urinary tract infections, published in OBG Management in 2012.
Nager and colleagues conducted their trial to determine whether urodynamic testing is necessary before midurethral sling surgery for simple, “garden-variety” stress urinary incontinence (SUI). In their trial, 630 women were randomly assigned to undergo office evaluation with urodynamic tests (n = 315) or office evaluation only (n = 315). Surgical treatment was successful in 76.9% of women in the urodynamic-testing group and in 77.2% of women in the office evaluation-only group (95% confidence interval [CI], –7.5 to 6.9) as long as 1 year after surgery. There were no significant differences between groups in quality of life, patient satisfaction, and other secondary measures of incontinence severity. Investigators concluded that preoperative office evaluation (positive stress test, urethral hypermobility, normal postvoid residual, and negative urinalysis) is not inferior to urodynamic testing.
Should these findings come as a surprise to pelvic surgeons? Retropubic and transobturator slings are associated with very low morbidity and high efficacy. Studies already have demonstrated that, in simple SUI, these slings produce similar outcomes.1 So there is some consensus that urodynamic testing may be unnecessary prior to placement of a midurethral sling for simple SUI. This study lends credence to that notion.
Outcome measures: Focused enough?
The primary outcome measures used in this trial were not designed primarily to assess the severity of SUI. Investigators employed the Urogenital Distress Inventory, which focuses mostly on irritative bladder symptoms and includes only one question about the presence and impact of SUI. They also utilized the Patient Global Impression of Improvement, a global scale related to incontinence in general. Other tests—such as standardized stress tests, pad tests, and bladder diaries—are more specific in the evaluation of SUI severity. Nager and colleagues used these measures themselves in an earlier exploration of the role of urodynamics in predicting sling failure.2
Moreover, in the current study, urodynamic testing did not include a measurement of urethral closure pressure, which has been strongly correlated with success after Burch colposuspension and retropubic and transobturator sling procedures. This test would have added valuable data.
Another shortcoming was the lack of uniformity in the sling procedures that were selected. Most experts believe that retropubic and transobturator slings have unique mechanistic characteristics that do not allow them to be interchangeable. Investigators should have selected a single sling approach.
Is a 77% success rate acceptable to most patients?
SUI represents a continuum of disease severity, and various studies have demonstrated a higher success rate for retropubic slings than for the transobturator approach when sphincteric function is impaired. At our center, we utilize urodynamic parameters to identify women who may achieve a higher continence rate with a retropubic sling.3
Retropubic slings are not appropriate for all patients with SUI. Although the risk of serious complications, such as retropubic hematoma or bowel perforation, is very low, complications sometimes do occur and are related to surgical volumes. For this reason, transobturator slings, which carry minimal associated risks, play a key role in the management of garden-variety SUI.
Indications for multichannel urodynamic testing
|
Don’t throw away your urodynamic equipment just yet. Many patients have complex incontinence symptoms or other indications for urodynamic testing (TABLE). In addition, a clear understanding of urgency symptoms and voiding dysfunction can be very useful during preoperative counseling of patients who are scheduled to undergo sling surgery. Significant urgency is likely to persist postoperatively, and voiding difficulties may worsen after a sling procedure, especially if a retropubic sling is used.
G. WILLY DAVILA, MD
We want to hear from you! Tell us what you think.
Urinary incontinence
Karen L. Noblett, MD, MAS, and Stephanie A. Jacobs, MD (Update, December 2012)
1. Barber MD, Kleeman S, Karram MM, et al. Transobturator tape compared with tension-free vaginal tape for the treatment of stress urinary incontinence. Obstet Gynecol. 2008;111(3):611-621.
2. Nager CW, Siris L, Litman HJ, et al. Baseline urodynamic predictors of treatment failure 1 year after midurethral sling surgery. J Urol. 2011;186:597-603.
3. Guerette NL, Bena JF, Davila GW. Transobturator slings for stress incontinence: using urodynamic parameters to predict outcomes. Int Urogynecol J. 2008;19(1):97-102.
Does an unfavorable cervix preclude induction of labor at term in women who have gestational hypertension or mild preeclampsia?
The optimal management of gestational hypertension and mild preeclampsia at term has been a subject of great debate over the past decade. The controversy centers on the timing of delivery—induction of labor versus expectant management.
Proponents of immediate induction raise the valid concern that maternal disease may worsen if pregnancy is allowed to continue. Conversely, proponents of expectant management point to the possibility that the rate of cesarean delivery will be increased with immediate induction; they also cite concerns that neonatal morbidity may be increased with an early term delivery.
To shed light on this debate, investigators in the well-known HYPITAT trial randomly assigned 756 women who had gestational hypertension or mild preeclampsia at term to induction of labor (n = 377) or expectant management (n = 379). All women were carrying a singleton fetus that was 36 to 41 weeks old, with cephalic presentation. The main findings of the trial, published in Lancet, were that induction of labor produced fewer “high-risk situations” (relative risk [RR], 0.71; 95% confidence interval [CI], 0.59–0.86), with no increase in the risk of cesarean delivery (RR, 0.75; 95% CI, 0.55–1.04) or adverse neonatal outcomes (RR, 0.75; 95% CI, 0.45–1.26).1
Although these findings are important, one question lingered in the minds of many obstetricians: Should the choice between induction of labor and expectant management hinge on the favorability of the cervix?
That is the question addressed by Tajik and colleagues.
Zooming in on cervical status
In their secondary analysis from the HYPITAT trial, Tajik and colleagues reanalyzed the association between induction of labor and expectant management, focusing on the same outcomes (high-risk situations, cesarean delivery, adverse neonatal outcomes), but they stratified their data by cervical status. As stated above, their findings are surprising and seemingly counterintuitive:
- Among women who underwent immediate induction of labor, cervical length was not associated with a higher probability of high-risk situations
- The beneficial effect of induction of labor—in terms of reducing the rate of cesarean delivery—was greater among women who had an unfavorable cervix.
Strengths and limitations of the trial
Overall, this was a well-conducted secondary analysis that tackled an important issue. It featured 1) a robust dataset, with all variables of interest collected, and 2) a thoughtful approach to data analysis.
However, the analysis also raises a question: Is it possible that some of its negative findings (composite neonatal morbidity) are due to insufficient power? This is a question I ask whenever I encounter a secondary analysis of a randomized, controlled trial. The answer here: Possibly.
This study provides additional evidence that induction of labor is the optimal approach to gestational hypertension or mild preeclampsia in a pregnancy at 36 weeks or beyond—regardless of cervical status. I would expect clinicians to embrace the findings of the HYPITAT trial, including the secondary analysis, and incorporate this management strategy in their practice.
GEORGE MACONES, MD
We want to hear from you! Tell us what you think.
ON OBSTETRICS?
Is the rate of progress the same for induced and spontaneous labors?
William F. Rayburn, MD (November 2012)
Does maternal exposure to magnesium sulfate affect fetal heart-rate patterns?
John M. Thorp, Jr, MD (October 2012)
Is elective delivery at 37 weeks’ gestation safe in uncomplicated twin pregnancies?
Steven T. Chasen, MD (September 2012)
Does mediolateral episiotomy reduce the risk of anal sphincter injury in operative vaginal delivery?
Errol T. Norwitz, MD, PhD (August 2012)
Reference
1. Koopmans CM, Bijlenga D, Groen H, et al. HYPITAT Study Group. Induction of labour versus expectant monitoring for gestational hypertension or mild preeclampsia after 36 weeks’ gestation (HYPITAT): a multicentre, open-label randomised controlled trial. Lancet. 2009;374(9694):979-988.
The optimal management of gestational hypertension and mild preeclampsia at term has been a subject of great debate over the past decade. The controversy centers on the timing of delivery—induction of labor versus expectant management.
Proponents of immediate induction raise the valid concern that maternal disease may worsen if pregnancy is allowed to continue. Conversely, proponents of expectant management point to the possibility that the rate of cesarean delivery will be increased with immediate induction; they also cite concerns that neonatal morbidity may be increased with an early term delivery.
To shed light on this debate, investigators in the well-known HYPITAT trial randomly assigned 756 women who had gestational hypertension or mild preeclampsia at term to induction of labor (n = 377) or expectant management (n = 379). All women were carrying a singleton fetus that was 36 to 41 weeks old, with cephalic presentation. The main findings of the trial, published in Lancet, were that induction of labor produced fewer “high-risk situations” (relative risk [RR], 0.71; 95% confidence interval [CI], 0.59–0.86), with no increase in the risk of cesarean delivery (RR, 0.75; 95% CI, 0.55–1.04) or adverse neonatal outcomes (RR, 0.75; 95% CI, 0.45–1.26).1
Although these findings are important, one question lingered in the minds of many obstetricians: Should the choice between induction of labor and expectant management hinge on the favorability of the cervix?
That is the question addressed by Tajik and colleagues.
Zooming in on cervical status
In their secondary analysis from the HYPITAT trial, Tajik and colleagues reanalyzed the association between induction of labor and expectant management, focusing on the same outcomes (high-risk situations, cesarean delivery, adverse neonatal outcomes), but they stratified their data by cervical status. As stated above, their findings are surprising and seemingly counterintuitive:
- Among women who underwent immediate induction of labor, cervical length was not associated with a higher probability of high-risk situations
- The beneficial effect of induction of labor—in terms of reducing the rate of cesarean delivery—was greater among women who had an unfavorable cervix.
Strengths and limitations of the trial
Overall, this was a well-conducted secondary analysis that tackled an important issue. It featured 1) a robust dataset, with all variables of interest collected, and 2) a thoughtful approach to data analysis.
However, the analysis also raises a question: Is it possible that some of its negative findings (composite neonatal morbidity) are due to insufficient power? This is a question I ask whenever I encounter a secondary analysis of a randomized, controlled trial. The answer here: Possibly.
This study provides additional evidence that induction of labor is the optimal approach to gestational hypertension or mild preeclampsia in a pregnancy at 36 weeks or beyond—regardless of cervical status. I would expect clinicians to embrace the findings of the HYPITAT trial, including the secondary analysis, and incorporate this management strategy in their practice.
GEORGE MACONES, MD
We want to hear from you! Tell us what you think.
ON OBSTETRICS?
Is the rate of progress the same for induced and spontaneous labors?
William F. Rayburn, MD (November 2012)
Does maternal exposure to magnesium sulfate affect fetal heart-rate patterns?
John M. Thorp, Jr, MD (October 2012)
Is elective delivery at 37 weeks’ gestation safe in uncomplicated twin pregnancies?
Steven T. Chasen, MD (September 2012)
Does mediolateral episiotomy reduce the risk of anal sphincter injury in operative vaginal delivery?
Errol T. Norwitz, MD, PhD (August 2012)
Reference
1. Koopmans CM, Bijlenga D, Groen H, et al. HYPITAT Study Group. Induction of labour versus expectant monitoring for gestational hypertension or mild preeclampsia after 36 weeks’ gestation (HYPITAT): a multicentre, open-label randomised controlled trial. Lancet. 2009;374(9694):979-988.
Reference
1. Koopmans CM, Bijlenga D, Groen H, et al. HYPITAT Study Group. Induction of labour versus expectant monitoring for gestational hypertension or mild preeclampsia after 36 weeks’ gestation (HYPITAT): a multicentre, open-label randomised controlled trial. Lancet. 2009;374(9694):979-988.
Why (and how) we must repeal the sustainable growth rate
Imagine this: Your 20-year-old daughter tells you she wants to attend an expensive school for 5 years of intensive postgraduate training, amassing tens of thousands of dollars of debt, to provide expert services to the US population. There is no good substitute for the services she hopes to provide, and they are vitally needed. The services also carry risk. Despite this, she tells you that her salary will not increase every year in tandem with the cost of living; in fact, she expects her salary to be cut by nearly one-third each year. Compensation in her chosen field hasn’t increased in real dollars for many years.
Sound like a good plan?
By now you have recognized this as your own story, at least if you’re among the 92% of ObGyns who participate in Medicare.
ObGyn participation in the Medicare program reflects ObGyn training and commitment to serve as lifelong principal care physicians for women of all ages, including women with disabilities. Fifty-six percent of all Medicare beneficiaries are women. With continuing shortages of primary care physicians and the transitioning of the Baby Boomer generation to Medicare, it is likely that ObGyns will become more involved in delivering health care to this population.
Medicare physician payments matter to ObGyns in other ways, too, because TRICARE and private payers often follow Medicare payment and coverage policies. Clearly, the Medicare program is a pretty big gorilla in every exam room. We all have much at stake in ensuring a stable Medicare system for years to come, starting with an improved physician payment system.
In 2011, Medicare paid $68 billion for physician care provided to nearly 50 million elderly and disabled individuals—about 12% of total Medicare spending—covering just over 1 billion distinct physician services. Physicians received a 10-month reprieve from a 27% cut in Medicare payments that had been scheduled for March 1, 2011, extending current payment rates through the end of this year. The agreement is part of a deal to extend a payroll tax cut and unemployment benefits. It is the 14th short-term patch to the sustainable growth rate (SGR) in the past 10 years. On January 1, 2013, we now face a 26.5% cut that Congress will have to find $245 billion to eliminate altogether.
How did we get here?
In 1997, Congress passed the Balanced Budget Act (BBA), at a time when many members of Congress were frustrated by continued increases in Medicare costs, fueled on the physician side, in part, by increases in the number of visits, tests, and procedures. To control these costs, Congress included in the BBA a complicated formula to peg Medicare physician payments to an economic growth target—the SGR. For the first few years, Medicare expenditures stayed within the target, and doctors received modest pay increases. But in 2002, expenditures rose faster than the SGR, and doctors were slated for a 4.8% pay cut.
Every year since, the SGR has signaled physician pay cuts, and every year, Congress has stopped the cuts from taking effect. But each deferral just made the next cut bigger and increased the price tag of stopping each pay cut. Today, the price of eliminating the SGR is $245 billion over the next 10 years. In these days of sequestration and deficit reduction, $245 billion is hard to find.

What now?
The good news is that support for eliminating the SGR is bicameral and bipartisan, rare in these hyperpartisan political days. Both Republicans and Democrats in the US House and Senate agree: The SGR has got to go. It’s a topic of conversation that wore out its welcome long ago.
The bad news? The $245 billion price tag. Remember, the SGR is in statute, so it requires an Act of Congress, signed by the President, to repeal it—and every Act is scored by the Congressional Budget Office.
The likeliest scenario is one we’ve seen many times before: Congress returns from a difficult election for a short, lame-duck session, during which it will have to address the cut before January 1. A real solution won’t be within reach, so Congress will likely kick that well-dented can a few more yards down the road, delaying the cut for yet another legislative cliffhanger.
In October 2012, the American Congress of Obstetricians and Gynecologists (ACOG) joined the American Medical Association (AMA) and 110 state and national medical societies in providing the US Congress with a clear and definitive document—Driving Principles and Core Elements—that describes a way to transition to a Medicare payment system that will endure and ensure high-quality care for the individuals who rely on that program, and for many millions more whose care is linked to Medicare payment policies.
This document is unique in many ways, perhaps especially in the unity it demonstrates among all physician organizations. It echoes ACOG’s earlier guidance to the US Congress on essential elements for a Medicare payment system that benefits women’s health. Among ACOG’s recommendations:
Make the new system simple, coordinated, and transparent. A new Medicare physician payment system should coordinate closely with other health-care programs; ensure that information technology is interoperable; and guarantee that quality-measurement programs are the same across all payers and rely on high-quality, risk-adjusted data.
Maintain the global obstetric care package. Medicare currently uses this package to reimburse for pregnancy. It works well and may be a model for global payment options for care provided by other physician types. The global obstetric care payment covers 10 months of care, from the first antepartum visit through the final postdelivery office visit.
Global payments allow a physician to manage costs and care for a patient’s course of treatment, rather than for a patient’s individual medical encounters.
Maintain fee for service for women’s health physicians who have small Medicare populations. Depending on the practice mix, type, and area, ObGyns and ObGyn subspecialists could see relatively few Medicare patients; unique Medicare requirements can pose significant administrative challenges and create inefficiencies with participation. Physicians who have small numbers of Medicare patients must be accommodated—and not penalized—in a new payment system.
Ensure that payment fairly and accurately reflects the cost of care. Medicare payments to obstetricians are already well below the cost of maternity care; no further cuts should be allowed for this care.
Support innovative care models, including a women’s medical home. These models should recognize the dual role that ObGyns may play as primary care and specialty care physicians.
Repeal the Independent Medicare Payment Advisory Board. Leaving Medicare payment decisions in the hands of an unelected, unaccountable body with minimal Congressional oversight is just a bad idea.
Pass medical liability reform. Congress must enact meaningful medical liability reform, which the Congressional Budget Office says could save $40 billion—enough for a small downpayment on SGR repeal.
A continuing promise
Rest assured that ACOG’s work to ensure appropriate Medicare payments to physicians, and to ensure that your patients have access to needed care, won’t stop until the job is done.
ACOG, AMA, and 110 state and national medical societies think so, and prescribe driving principles and core elements for the transition
In their letter to Congressional leaders, ACOG, AMA, and other societies acknowledged the “profound change” sweeping through the US health-care system, noting that it offers a “unique opportunity to improve and restructure how we deliver and pay for care.” When it comes to the SGR, however, these organizations conclude that it is “an enormous impediment to successful health-care delivery and payment reforms that can improve the quality of patient care while lowering growth in costs. Physicians facing the constant specter of severe cuts under the SGR cannot invest their time, energy, and resources in care redesign. The first step in moving to a higher-performing Medicare program must be the elimination of the SGR formula,” they write, based on the following principles, values, and key reforms.
Driving principles
- Successful delivery reform is an essential foundation for transitioning to a high-performing Medicare program that provides patient choice and meets the health-care needs of a diverse patient population.
- The Medicare program must invest in and support physician infrastructure that provides the platform for delivery and payment reform.
- Medicare payment updates should reflect the cost of providing services as well as efforts and progress on quality improvements and managing costs.
Core elements of reform
- Reflect the diversity of physician practices and provide opportunities for physicians to choose payment models that work for their patients, practice, specialty, and region.
- Encourage incremental changes with positive incentives and rewards during a defined timetable instead of using penalties to order abrupt changes in the delivery of care.
- Provide a way to measure progress and show policymakers that physicians are taking accountability for quality and costs.
Recommended structural improvements
- Reward physicians for savings achieved across the health-care spectrum.
- Enhance prospects for physicians adopting new models to achieve positive updates.
- Tie incentives to physicians’ own actions, rather than the actions of others or variables beyond their influence.
- Enhance prospects to harmonize measures and alter incentives in current law.
- Encourage systems of care, regional collaborative efforts, and primary care and specialist cooperation while preserving patient choice.
- Allow specialty and state society initiatives to be credited as delivering improvements (deeming authority) and recognize the central role of the profession in determining and measuring quality.
- Provide exemptions and alternative pathways for physicians in practice situations in which making or recovering the investments that may be needed to improve care delivery would constitute a hardship.
We want to hear from you! Tell us what you think.
Women’s health under the Affordable Care Act: What is covered?
(September 2012)
Lay midwives and the ObGyn: Is collaboration risky?
(May 2012)
How state budget crises are putting the squeeze on Medicaid (and you)
(February 2012)
Is private ObGyn practice on its way out?
(October 2011)
14 questions (and answers) about health reform and you
with Janelle Yates, Senior Editor (August 2010)

Lucia DiVenere, MA
Ms. DiVenere is Senior Director of Government Affairs at the American Congress of Obstetricians and Gynecologists in Washington, DC.
Ms. DiVenere reports no financial relationships relevant to this article.
Lucia DiVenere, MA
Ms. DiVenere is Senior Director of Government Affairs at the American Congress of Obstetricians and Gynecologists in Washington, DC.
Ms. DiVenere reports no financial relationships relevant to this article.
Lucia DiVenere, MA
Ms. DiVenere is Senior Director of Government Affairs at the American Congress of Obstetricians and Gynecologists in Washington, DC.
Ms. DiVenere reports no financial relationships relevant to this article.
Imagine this: Your 20-year-old daughter tells you she wants to attend an expensive school for 5 years of intensive postgraduate training, amassing tens of thousands of dollars of debt, to provide expert services to the US population. There is no good substitute for the services she hopes to provide, and they are vitally needed. The services also carry risk. Despite this, she tells you that her salary will not increase every year in tandem with the cost of living; in fact, she expects her salary to be cut by nearly one-third each year. Compensation in her chosen field hasn’t increased in real dollars for many years.
Sound like a good plan?
By now you have recognized this as your own story, at least if you’re among the 92% of ObGyns who participate in Medicare.
ObGyn participation in the Medicare program reflects ObGyn training and commitment to serve as lifelong principal care physicians for women of all ages, including women with disabilities. Fifty-six percent of all Medicare beneficiaries are women. With continuing shortages of primary care physicians and the transitioning of the Baby Boomer generation to Medicare, it is likely that ObGyns will become more involved in delivering health care to this population.
Medicare physician payments matter to ObGyns in other ways, too, because TRICARE and private payers often follow Medicare payment and coverage policies. Clearly, the Medicare program is a pretty big gorilla in every exam room. We all have much at stake in ensuring a stable Medicare system for years to come, starting with an improved physician payment system.
In 2011, Medicare paid $68 billion for physician care provided to nearly 50 million elderly and disabled individuals—about 12% of total Medicare spending—covering just over 1 billion distinct physician services. Physicians received a 10-month reprieve from a 27% cut in Medicare payments that had been scheduled for March 1, 2011, extending current payment rates through the end of this year. The agreement is part of a deal to extend a payroll tax cut and unemployment benefits. It is the 14th short-term patch to the sustainable growth rate (SGR) in the past 10 years. On January 1, 2013, we now face a 26.5% cut that Congress will have to find $245 billion to eliminate altogether.
How did we get here?
In 1997, Congress passed the Balanced Budget Act (BBA), at a time when many members of Congress were frustrated by continued increases in Medicare costs, fueled on the physician side, in part, by increases in the number of visits, tests, and procedures. To control these costs, Congress included in the BBA a complicated formula to peg Medicare physician payments to an economic growth target—the SGR. For the first few years, Medicare expenditures stayed within the target, and doctors received modest pay increases. But in 2002, expenditures rose faster than the SGR, and doctors were slated for a 4.8% pay cut.
Every year since, the SGR has signaled physician pay cuts, and every year, Congress has stopped the cuts from taking effect. But each deferral just made the next cut bigger and increased the price tag of stopping each pay cut. Today, the price of eliminating the SGR is $245 billion over the next 10 years. In these days of sequestration and deficit reduction, $245 billion is hard to find.
What now?
The good news is that support for eliminating the SGR is bicameral and bipartisan, rare in these hyperpartisan political days. Both Republicans and Democrats in the US House and Senate agree: The SGR has got to go. It’s a topic of conversation that wore out its welcome long ago.
The bad news? The $245 billion price tag. Remember, the SGR is in statute, so it requires an Act of Congress, signed by the President, to repeal it—and every Act is scored by the Congressional Budget Office.
The likeliest scenario is one we’ve seen many times before: Congress returns from a difficult election for a short, lame-duck session, during which it will have to address the cut before January 1. A real solution won’t be within reach, so Congress will likely kick that well-dented can a few more yards down the road, delaying the cut for yet another legislative cliffhanger.
In October 2012, the American Congress of Obstetricians and Gynecologists (ACOG) joined the American Medical Association (AMA) and 110 state and national medical societies in providing the US Congress with a clear and definitive document—Driving Principles and Core Elements—that describes a way to transition to a Medicare payment system that will endure and ensure high-quality care for the individuals who rely on that program, and for many millions more whose care is linked to Medicare payment policies.
This document is unique in many ways, perhaps especially in the unity it demonstrates among all physician organizations. It echoes ACOG’s earlier guidance to the US Congress on essential elements for a Medicare payment system that benefits women’s health. Among ACOG’s recommendations:
Make the new system simple, coordinated, and transparent. A new Medicare physician payment system should coordinate closely with other health-care programs; ensure that information technology is interoperable; and guarantee that quality-measurement programs are the same across all payers and rely on high-quality, risk-adjusted data.
Maintain the global obstetric care package. Medicare currently uses this package to reimburse for pregnancy. It works well and may be a model for global payment options for care provided by other physician types. The global obstetric care payment covers 10 months of care, from the first antepartum visit through the final postdelivery office visit.
Global payments allow a physician to manage costs and care for a patient’s course of treatment, rather than for a patient’s individual medical encounters.
Maintain fee for service for women’s health physicians who have small Medicare populations. Depending on the practice mix, type, and area, ObGyns and ObGyn subspecialists could see relatively few Medicare patients; unique Medicare requirements can pose significant administrative challenges and create inefficiencies with participation. Physicians who have small numbers of Medicare patients must be accommodated—and not penalized—in a new payment system.
Ensure that payment fairly and accurately reflects the cost of care. Medicare payments to obstetricians are already well below the cost of maternity care; no further cuts should be allowed for this care.
Support innovative care models, including a women’s medical home. These models should recognize the dual role that ObGyns may play as primary care and specialty care physicians.
Repeal the Independent Medicare Payment Advisory Board. Leaving Medicare payment decisions in the hands of an unelected, unaccountable body with minimal Congressional oversight is just a bad idea.
Pass medical liability reform. Congress must enact meaningful medical liability reform, which the Congressional Budget Office says could save $40 billion—enough for a small downpayment on SGR repeal.
A continuing promise
Rest assured that ACOG’s work to ensure appropriate Medicare payments to physicians, and to ensure that your patients have access to needed care, won’t stop until the job is done.
ACOG, AMA, and 110 state and national medical societies think so, and prescribe driving principles and core elements for the transition
In their letter to Congressional leaders, ACOG, AMA, and other societies acknowledged the “profound change” sweeping through the US health-care system, noting that it offers a “unique opportunity to improve and restructure how we deliver and pay for care.” When it comes to the SGR, however, these organizations conclude that it is “an enormous impediment to successful health-care delivery and payment reforms that can improve the quality of patient care while lowering growth in costs. Physicians facing the constant specter of severe cuts under the SGR cannot invest their time, energy, and resources in care redesign. The first step in moving to a higher-performing Medicare program must be the elimination of the SGR formula,” they write, based on the following principles, values, and key reforms.
Driving principles
- Successful delivery reform is an essential foundation for transitioning to a high-performing Medicare program that provides patient choice and meets the health-care needs of a diverse patient population.
- The Medicare program must invest in and support physician infrastructure that provides the platform for delivery and payment reform.
- Medicare payment updates should reflect the cost of providing services as well as efforts and progress on quality improvements and managing costs.
Core elements of reform
- Reflect the diversity of physician practices and provide opportunities for physicians to choose payment models that work for their patients, practice, specialty, and region.
- Encourage incremental changes with positive incentives and rewards during a defined timetable instead of using penalties to order abrupt changes in the delivery of care.
- Provide a way to measure progress and show policymakers that physicians are taking accountability for quality and costs.
Recommended structural improvements
- Reward physicians for savings achieved across the health-care spectrum.
- Enhance prospects for physicians adopting new models to achieve positive updates.
- Tie incentives to physicians’ own actions, rather than the actions of others or variables beyond their influence.
- Enhance prospects to harmonize measures and alter incentives in current law.
- Encourage systems of care, regional collaborative efforts, and primary care and specialist cooperation while preserving patient choice.
- Allow specialty and state society initiatives to be credited as delivering improvements (deeming authority) and recognize the central role of the profession in determining and measuring quality.
- Provide exemptions and alternative pathways for physicians in practice situations in which making or recovering the investments that may be needed to improve care delivery would constitute a hardship.
We want to hear from you! Tell us what you think.
Women’s health under the Affordable Care Act: What is covered?
(September 2012)
Lay midwives and the ObGyn: Is collaboration risky?
(May 2012)
How state budget crises are putting the squeeze on Medicaid (and you)
(February 2012)
Is private ObGyn practice on its way out?
(October 2011)
14 questions (and answers) about health reform and you
with Janelle Yates, Senior Editor (August 2010)