User login
Baseline QTc and Azithromycin Evaluation
Azithromycin, a macrolide antibiotic, received US Food and Drug Administration (FDA) approval in 1991 and is 1 of the most prescribed antibiotics used for a variety of infections, including community‐acquired pneumonia, bacterial sinusitis, urethritis, and cervicitis. In 2011, it was estimated that 40.3 million outpatients received a prescription for azithromycin.[1] In addition to treating acute bacterial infections, recent literature has pointed to using azithromycin for its unlabeled immunomodulatory and anti‐inflammatory effects, particularly in cystic fibrosis, chronic obstructive pulmonary disease (COPD), and lung transplant recipients.[2, 3, 4] Azithromycin decreases bacterial load and virulence, thus reducing airway secretion, as well as decreasing airway neutrophil accumulation through a reduction in proinflammatory cytokine expression.[4]
Cardiac toxicity can occur with macrolide antibiotics, and prolongation of the QT interval with subsequent Torsades de pointes has been documented with azithromycin.[1, 5, 6] In 2012, Ray et al. published data on a cohort of outpatients receiving azithromycin compared to amoxicillin, ciprofloxacin, or no antibiotics, and showed a small but absolute increase in cardiovascular deaths.[7, 8] Subsequent data, however, have not illustrated increased risk of death from cardiovascular causes. Mortensen et al. showed a lower risk of 90‐day mortality in older patients treated for community acquired pneumonia with azithromycin and ceftriaxone, although there was a nonstatistically significant increased risk of myocardial infarction in this group.[8, 9, 10] In March 2013, the FDA released an official statement regarding increased cardiovascular risk with azithromycin, stating that healthcare professionals should consider the risk of fatal heart rhythms with azithromycin when considering treatment options for patients who are at risk for cardiovascular events.[11]
In recent years, the potential for corrected QT (QTc) prolongation and Torsades de pointes has received increased attention due to its catastrophic nature, and it is thought that hospitalized patients are at a greater risk of drug‐induced Torsades de pointes due to the likelihood of having more risk factors.[12, 13] The American Heart Association released a statement in 2010 to raise awareness among healthcare professionals about risk, electrocardiogram (ECG) monitoring, and management of drug‐induced QT interval prolongation in hospitalized patients, although little data exist regarding quantification of risk in this patient population.[13, 14]
Prescribers currently have no standardized practice guidelines related to cardiovascular safety when prescribing QTc prolonging medications. Given the dramatic increase in azithromycin prescriptions and ongoing concern for cardiovascular risk and QTc prolongation, we investigated the prescribing practices with azithromycin within our institution. Our primary aims were 3‐fold. First, we aimed to describe the frequency azithromycin was prescribed with additional QTc prolonging medications. Second, we assessed the relationship between the number of arrhythmogenic drugs prescribed in addition to azithromycin with ordering telemetry. Finally, we assessed the relationship between baseline ECG abnormalities and telemetry monitoring in patients prescribed azithromycin. The purpose of these objectives was to better understand physician prescribing practices and to determine if patients have a potential risk of developing fatal cardiac arrhythmias
METHODS
Data
For this retrospective review, we utilized data from the University of Alabama at Birmingham Health Care system, a 1157licensed bed hospital. The institutional review board approved this study with a waiver of informed consent. Patients were eligible to be included in this study if they were 19 years of age with an inpatient hospital length of stay 3 days. Patients were considered to be receiving azithromycin and were included only when they were dispensed 1 dose of azithromycin by the pharmacy. Between October 1, 2012 and April 30, 2013, 1610 encounters were identified, of which 100 patient encounters were randomly selected for evaluation via a Microsoft Excel (Microsoft Corp., Redmond, WA) function. One patient was randomly included twice in this study, but had 2 separate admissions in which he received azithromycin.
QTc prolonging medications in our hospital formulary were identified via Micromedex and package inserts (see Supporting Information, Appendix, in the online version of this article for the full list).
Measures
The primary study measures were number of medications associated with QTc prolongation, baseline ECG findings, and telemetry monitoring. Secondary study measures include indication, dose, duration of use, formulation, length of stay, and admitting service (Table 1). Indications, dosage, and duration were defined by the FDA package insert for azithromycin (see Supporting Information, Appendix, in the online version of this article). Indication for use was defined as (1) empiric for a specific infection; (2) anti‐inflammatory for patients with COPD, lung transplant recipients, or cystic fibrosis patients; and (3) culture proven if evidence of a particular pathogen grown on culture. Indications were defined by prescriber notes. Dosage is defined as appropriate if FDA guidelines were followed for the defined indication. If patients were given azithromycin for anti‐inflammatory purposes, dosing was considered appropriate if it followed previous literature dosing of 250mg daily.
| |
| Age, y | |
| Average | 5519.5 |
| Range | 2197 |
| Gender | |
| Female | 61% |
| Male | 39% |
| Length of stay, d | |
| Average | 9.713.1 |
| Range | 3115 |
| Admitting service | |
| Hospitalist | 37% |
| Pulmonary | 23% |
| Obstetrics | 9% |
| General medicine | 8% |
| Hematology/oncology | 6% |
| Othera | 17% |
| Days of therapy | |
| Average | 4.53.9 |
| Range | 128 |
| Median | 4 |
| Indication for use | |
| Empiric | 79% |
| Anti‐inflammatory | 20% |
| Culture proven | 1% |
| Dosage | |
| Appropriate | 67% |
| Inappropriate | 14% |
| Unknown | 19% |
| Duration | |
| Appropriate | 63% |
| Inappropriate | 19% |
| Unknown | 18% |
| Formulation | |
| Intravenous only | 21% |
| Intravenous followed by tablet | 13% |
| Suspension | 2% |
| Tablet | 64% |
| Diagnosis‐related group | |
| Simple pneumonia with pleurisy | 14% |
| Septicemia with sepsis | 8% |
| Respiratory infection with inflammation | 8% |
| Chronic obstructive pulmonary disease | 8% |
| Pulmonary edema with respiratory failure | 6% |
| Vaginal delivery with complications | 6% |
| Respiratory diagnosis with ventilator support | 4% |
| Otherb | 46% |
Patients were divided into drug interaction risk levels based on the number of medications prescribed with the potential for QT prolongation (Table 2). Patients were considered low risk if they received azithromycin alone, medium risk if they received 2 to 3 QT‐prolonging medications including azithromycin, and high risk if they received 4 or more QT‐prolonging medications including azithromycin.
| Medication | % of Patients Receiving Interacting Medication With Azithromycin |
|---|---|
| |
| Ondansetron | 48 |
| Trazodone | 23 |
| Moxifloxacin | 17 |
| Promethazine, haloperidol | 10 |
| Ciprofloxacin, citalopram, fluconazole | 7 |
| Amiodarone, amitriptyline | 5 |
| Quetiapine, methadone | 4 |
| Clarithromycin, octreotide, voriconazole | 2 |
| Erythromycin, granisetron, salmeterol, sotalol, ziprasidone | 1 |
The QT interval was measured from the beginning of the QRS complex to the end of the T wave as it returns to baseline. QTc has been defined by the most universally adopted method known as Bazett's formula ( , where QT is the measured QT interval and RR is the interval in seconds).[15]
Baseline QTc was evaluated through the use of most recent ECG within the past 6 months of admission. Borderline QTc was defined as 431 to 450 ms in males and 451 to 470 ms in females. Abnormal QTc was defined as >450 ms in males and >470 ms in females.[16]
Following admission, inpatient charges for telemetry during hospitalization were included. Telemetry was documented based on telemetry charges at any point in the hospital.
Statistical Analysis
Patient data were initially collected via Excel and analyzed with SAS version 9.4 software (SAS Institute, Cary, NC). Univariate analysis including central tendency and dispersion were utilized for aim 1. P values were calculated using 2 analysis and Fisher exact test for probability if cells with numerical values were <5 for aims 2 and 3.
RESULTS
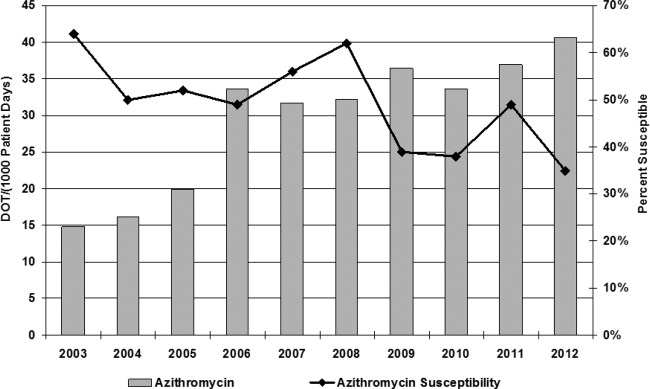
Azithromycin use within our hospital system has increased from 15 days of therapy per 1000 patient days in 2002 to 40 days of therapy per 1000 patient days in 2013 (Figure 1). At the same time, azithromycin susceptibility in Streptococcus pneumoniae isolates has decreased over the past decade from 65% to 35% in our hospital.
The baseline characteristics of patients included in this study are noted in Table 1. The mean age of patients was 55 years, with a range of 21 to 97 years, and 61% were female. Forty‐five percent of patients were admitted to either the general medicine teaching service or hospitalist service, and 23% were admitted to the pulmonary service, which includes intensive care unit admission. The average length of patient stay was 9.7 days (range, 3115 days; median 6 days).
Seventy‐nine percent of azithromycin use was empiric for the treatment of suspected infection. The second most common use was for anti‐inflammatory effects (20%), as documented by prescribers in the medical record for patients with cystic fibrosis, lung transplant, and chronic obstructive pulmonary disease. Azithromycin was dosed appropriately according to the documented indication in 67% of patients, with the most discrepancy in dosing noted for anti‐inflammatory use. The average duration of azithromycin therapy was 4.5 days (range, 128 days). Duration was appropriate in 63% of patients. Twenty‐one percent of patients received intravenous formulation of azithromycin, 13% received intravenous followed by oral formulation, and 64% of patient received tablet formulation alone.
Thirty‐five medications have been identified in our formulary as having a potential major drug‐drug interaction when prescribed with azithromycin (see Supporting Information, Appendix, in the online version of this article), and of these medications, 20 were prescribed with azithromycin, with an average overlap of therapy of 4.5 days (Table 2). Seventy‐six percent of patients were concomitantly prescribed a QT‐prolonging drug in addition to azithromycin. The most commonly prescribed agents were ondansetron (48%), trazodone (22%), and moxifloxacin (17%).
Telemetry monitoring was assessed for each patient based on inpatient charges during their hospitalization (Table 3). Forty‐three percent of patients were placed on telemetry. Twenty‐four (24%) of the patients were prescribed azithromycin alone, of whom 45.8% were placed on telemetry. Fifty‐seven percent of patients were prescribed azithromycin with 1 to 2 additional QT‐prolonging medications (medium‐risk arm); 38.5% of patients in this group were placed on telemetry. In the high‐risk arm, 19% of patients were prescribed at least 3 QT‐prolonging medications in addition to azithromycin, of which only 52.6% of patients were monitored with telemetry. No statistically significant association was observed between risk level and telemetry placement (P=0.07).
| Telemetry (%) | No Telemetry (%) | Total | P Valueb | |
|---|---|---|---|---|
| ||||
| Drug interaction risk levela | ||||
| Low | 11 (45.8) | 13 (54.2) | 24 | |
| Medium | 22 (38.5) | 35 (61.4) | 57 | |
| High | 10 (52.6) | 9 (47.4) | 19 | |
| Total | 43 | 57 | 100 | 0.07 |
| QTc | ||||
| Normal | 14 (50) | 14 (50) | 28 | |
| Borderline | 6 (66.7) | 3 (33.3) | 9 | |
| Abnormal | 15 (51.7) | 14 (48.3) | 29 | |
| Total | 35 | 31 | 66 | 0.22 |
Telemetry charges were further examined by analyzing baseline ECG evaluation within the past 6 months of their hospitalization (Table 3). Sixty‐six patients received baseline ECGs prior to initiation of azithromycin. Telemetry placement was not statistically correlated to abnormal QTc at baseline (P=0.22). Of those who underwent baseline ECG evaluation, 8.3% were noted to have borderline QTc, and 12.5% had abnormal QTc on admission prior to receiving azithromycin in the low‐risk level (Table 4). Within the medium‐risk level, 63.2% had baseline ECG evaluation, with 5.3% with borderline QTc and 35.7% with abnormal QTc. In the high‐risk level, 73.6% received a baseline ECG, with 21% with borderline QTc and 31.6% with abnormal QTc. No statistically significant association was observed between risk level and obtainment of baseline ECG (P=0.7). In 17 out of 66 patients, average repeat ECGs were obtained on day 3 (range, 27 days). Ten of the 17 ECGs showed increase in QTc (range, 397ms; average 27 ms), whereas the other 7 had a decrease in their QTc interval (range, 618 ms; average 13 ms; P=0.17).
| QTcb | Low, n=24 (%) | Medium, n=57 (%) | High, n=19 (%) | Total |
|---|---|---|---|---|
| ||||
| Normal | 11 (45.8%) | 13 (22.8%) | 4 (21.0%) | 28 |
| Borderline | 2 (8.3%) | 3 (5.3%) | 4 (21.0%) | 9 |
| Abnormal | 3 (12.5%) | 20 (35.7%) | 6 (31.6%) | 29 |
| Total | 16 (66.7%) | 36 (63.2%) | 14 (73.6%) | 66 |
| P valuec | 0.03 | 0.11 | ||
As risk level increased, having an abnormal QTc at baseline was statistically different between low‐ and medium‐risk levels (P=0.03), but this association was lost when comparing the low‐risk arm to the high‐risk arm (P=0.11). When the medium‐ and high‐risk categories were combined, there was a noted statistical significance of having an abnormal ECG at baseline (P=0.03).
Of the 9 patients prescribed azithromycin chronically, 3 patients were in the low‐risk category, 4 in the medium‐risk category, and 2 in the high‐risk category. Only 2 had baseline ECGs obtained, 1 of which was noted to have abnormal QTc and was in the high‐risk category. Only 1 patient was placed on telemetry, but was considered low risk based on medications prescribed.
DISCUSSION
In this study, 76% of patients were prescribed azithromycin with 1 or more medications known to affect QT prolongation; 19% received 3 or more QT‐prolonging medications in addition to azithromycin. Of patients who received a baseline ECG, 43% were documented to have borderline or prolonged QTc on admission. Telemetry monitoring was ordered 43% of the time, but there was no significant association between telemetry placement and risk level (P=0.07), suggesting that telemetry was ordered based on symptoms more than risk. Despite more drug‐druginteracting medications prescribed, there was no association to either telemetry orders or baseline ECG evaluation. Furthermore, if an abnormal QTc was documented on admission, there was no relationship to ordering telemetry as an inpatient (P=0.215), suggesting that healthcare providers are not considering risk of QTc medication accumulation. Given increased warnings issued by the FDA for azithromycin, further prospective studies are indicated to fully assess risk of QTc prolongation and arrhythmias in the setting of multiple drug interactions. This study elucidates the potential for drug‐drug interactions and need for increased vigilance and education of providers in the healthcare setting for QTc prolongation and subsequent arrhythmias.
Forty‐eight percent of patients receiving other QTc prolonging medications were prescribed ondansetron, followed by 23% of patients prescribed trazodone. Both of these medications are included on the admission order set in our institution and can be easily ordered for patients. Despite ordering multiple medications that have potential for QTc prolongation, there are no current alerts set up in our electronic medical record. When patients are separated into drug interaction risk levels, there is a trend of having an abnormal QTc on admission, but this is driven by the large number of patients in the medium‐risk category, and the rate does not increase (and is not significant) when comparing high risk to low risk. However, patients who receive any QTc‐prolonging medication are more likely to have an abnormal QTc when compared to azithromycin prescription alone (P=0.03). The small sample size limits the power and generalizability of this study, and further larger studies are indicated to assess if risk of QTc prolongation is additive.
In the 9 patients prescribed azithromycin chronically, dosing was not consistent, and a vast majority of patients were not placed on telemetry nor had baseline ECGs on admission. This further correlates with the idea that risk of arrhythmia is not fully considered in this patient population, as patients prescribed more than 1 QTc‐prolonging medication were not included in prior studies that examined azithromycin for its anti‐inflammatory effects.[2]
Azithromycin was added to our hospital formulary in 1998, and prescription of this agent remained relatively low until 2006, when azithromycin use increased dramatically from 15 days of therapy (DOT) per 1000 patient days to 40 DOT per 1000 patient days. Although numerous factors may have led to this increase, literature was published in 2006 and 2011 citing benefit from the anti‐inflammatory effects of azithromycin.[2, 17] At the same time, azithromycin susceptibility among Streptococcus pneumoniae in patients within our hospital has decreased over the past decade; studies have found a correlation between increasing use of macrolides and the development of resistance in Streptococcus species.[18, 19, 20] In this study, 79% of patients were prescribed azithromycin empirically for treatment of bacterial infections, whereas 20% were given azithromycin for its anti‐inflammatory effects; both dose and frequency varied among patients, raising the concern for development of resistance. Published studies have shown improvement in quality of life and decreased frequency of exacerbation and infection when azithromycin is used as an anti‐inflammatory agent; however, no QTc monitoring was noted.[2] Drug‐induced QTc prolongation>10 ms above baseline suggests the potential for clinical significance, whereas a QTc prolongation >20 milliseconds above baseline has a substantially increased likelihood of being proarrhythmic.[1] Unfortunately, drug‐induced QT prolongation is unpredictable, and additional risk factors play a role in facilitating Torsades de pointes, including female sex, advanced age, electrolyte disturbances, intravenous formulation, and concurrent use of more than 1 drug that can prolong the QT interval.[15] Azithromycin has recently been added to the growing list of medications that can prolong the QT interval, with 12 cases of Torsades de pointes reported in the literature. In March 2013, the FDA released a warning regarding prescribing azithromycin, but there is a lack of guidance for clinicians in identifying risk of cardiovascular events in susceptible patients.
There are some limitations to this study. Given data were acquired retrospectively and telemetry sheets were unable to be reviewed. Some patients were noted to have arrhythmias, but these data were obtained through physician notes and not examined directly from telemetry sheets. Seventeen patients had repeat ECGs, but most were performed serially for chest pain and not QTc monitoring. Four patients died in this study, but cause of death could not be determined through electronic medical records provided for all 4 patients; families pursued withdrawal of care.
Despite the published FDA warning, there are no national guidelines for clinicians in prescribing QTc‐prolonging medications. The American Heart Association published recommendations in 2010 for prescribing these drugs in the inpatient setting, but because hospitals differ in cardiac monitoring, there is no one‐size‐fits‐all strategy in reducing risk of cardiac events.[14] If the benefit of azithromycin outweighs the risk, QTc prolongation should not limit therapy; however, institutional awareness is necessary, whether it be through automatic stop dates on azithromycin, electronic alerts regarding drug‐drug interaction, enhanced prescriber education, or a combination of all of the above.
Disclosure: Nothing to report.
- , , . Azithromycin and the risk of cardiovascular complications. J Pharm Pract. 2014;27(5):496–500.
- , , , et al., Azithromycin for prevention of exacerbations of COPD. N Engl J Med. 2011;365(8):689–698.
- , , , . Macrolide antibiotics for cystic fibrosis. Cochrane Database Syst Rev. 2012;11:CD002203.
- , , . Long‐term macrolide treatment for chronic respiratory disease. Eur Respir J. 2013;42(1):239–251.
- , . Antimicrobial‐associated QT interval prolongation: pointes of interest. Clin Infect Dis. 2006;43(12):1603–1611.
- . Azithromycin‐induced proarrhythmia and cardiovascular death. Ann Pharmacother. 2013;47(11):1547–1551.
- , , , , . Azithromycin and the risk of cardiovascular death. N Engl J Med. 2012;366(20):1881–1890.
- , , , et al. Azithromycin and levofloxacin use and increased risk of cardiac arrhythmia and death. Ann Fam Med. 2014;12(2):121–127.
- , , , et al. Association of azithromycin with mortality and cardiovascular events among older patients hospitalized with pneumonia. JAMA. 2014;311(21):2199–2208.
- , , . Use of azithromycin and death from cardiovascular causes. N Engl J Med. 2013;368(18):1704–1712.
- U.S. Food and Drug Administration Drug Information. FDA drug safety communication: azithromycin (zithromax or zmax) and the risk of potentially fatal heart rhythms. Available at: http://www.fda.gov/Drugs/DrugSafety/ucm341822.htm. Accessed December 1, 2014.
- , , , , . QT interval prolongation and the risk of torsades de pointes: essentials for clinicians. Curr Med Res Opin. 2013;29(12):1719–1726.
- , , , et al., Development and validation of a risk score to predict QT interval prolongation in hospitalized patients. Circ Cardiovasc Qual Outcomes. 2013;6(4):479–487.
- , , , et al.; American Heart Association Acute Cardiac Care Committee of the Council on Clinical Cardiology; Council on Cardiovascular Nursing; American College of Cardiology Foundation. Prevention of torsade de pointes in hospital settings: a scientific statement from the American Heart Association and the American College of Cardiology Foundation. J Am Coll Cardiol. 2010;55(9):934–947.
- , , . Drug‐induced QT interval prolongation: mechanisms and clinical management. Ther Adv Drug Saf. 2012;3(5):241–253.
- , , . QT interval: how to measure it and what is “normal”. J Cardiovasc Electrophysiol. 2006;17(3):333–336.
- , , , , . Anti‐inflammatory effects of azithromycin in cystic fibrosis airway epithelial cells. Biochem Biophys Res Commun. 2006;350(4):977–982.
- , , , , , ; Finnish Study Group for Antimicrobial Resistance (FiRe‐Network). Macrolide‐resistant Streptococcus pneumoniae and use of antimicrobial agents. Clin Infect Dis. 2001;33(4):483–488.
- , , , , , . Community prescribing and resistant Streptococcus pneumoniae. Emerg Infect Dis. 2005;11(6):829–837.
- , , , , ; Finnish Study Group for Antimicrobial Resistance (FiRe Network). Macrolide and azithromycin use are linked to increased macrolide resistance in Streptococcus pneumoniae. Antimicrob Agents Chemother. 2006;50(11):3646–3650.
Azithromycin, a macrolide antibiotic, received US Food and Drug Administration (FDA) approval in 1991 and is 1 of the most prescribed antibiotics used for a variety of infections, including community‐acquired pneumonia, bacterial sinusitis, urethritis, and cervicitis. In 2011, it was estimated that 40.3 million outpatients received a prescription for azithromycin.[1] In addition to treating acute bacterial infections, recent literature has pointed to using azithromycin for its unlabeled immunomodulatory and anti‐inflammatory effects, particularly in cystic fibrosis, chronic obstructive pulmonary disease (COPD), and lung transplant recipients.[2, 3, 4] Azithromycin decreases bacterial load and virulence, thus reducing airway secretion, as well as decreasing airway neutrophil accumulation through a reduction in proinflammatory cytokine expression.[4]
Cardiac toxicity can occur with macrolide antibiotics, and prolongation of the QT interval with subsequent Torsades de pointes has been documented with azithromycin.[1, 5, 6] In 2012, Ray et al. published data on a cohort of outpatients receiving azithromycin compared to amoxicillin, ciprofloxacin, or no antibiotics, and showed a small but absolute increase in cardiovascular deaths.[7, 8] Subsequent data, however, have not illustrated increased risk of death from cardiovascular causes. Mortensen et al. showed a lower risk of 90‐day mortality in older patients treated for community acquired pneumonia with azithromycin and ceftriaxone, although there was a nonstatistically significant increased risk of myocardial infarction in this group.[8, 9, 10] In March 2013, the FDA released an official statement regarding increased cardiovascular risk with azithromycin, stating that healthcare professionals should consider the risk of fatal heart rhythms with azithromycin when considering treatment options for patients who are at risk for cardiovascular events.[11]
In recent years, the potential for corrected QT (QTc) prolongation and Torsades de pointes has received increased attention due to its catastrophic nature, and it is thought that hospitalized patients are at a greater risk of drug‐induced Torsades de pointes due to the likelihood of having more risk factors.[12, 13] The American Heart Association released a statement in 2010 to raise awareness among healthcare professionals about risk, electrocardiogram (ECG) monitoring, and management of drug‐induced QT interval prolongation in hospitalized patients, although little data exist regarding quantification of risk in this patient population.[13, 14]
Prescribers currently have no standardized practice guidelines related to cardiovascular safety when prescribing QTc prolonging medications. Given the dramatic increase in azithromycin prescriptions and ongoing concern for cardiovascular risk and QTc prolongation, we investigated the prescribing practices with azithromycin within our institution. Our primary aims were 3‐fold. First, we aimed to describe the frequency azithromycin was prescribed with additional QTc prolonging medications. Second, we assessed the relationship between the number of arrhythmogenic drugs prescribed in addition to azithromycin with ordering telemetry. Finally, we assessed the relationship between baseline ECG abnormalities and telemetry monitoring in patients prescribed azithromycin. The purpose of these objectives was to better understand physician prescribing practices and to determine if patients have a potential risk of developing fatal cardiac arrhythmias
METHODS
Data
For this retrospective review, we utilized data from the University of Alabama at Birmingham Health Care system, a 1157licensed bed hospital. The institutional review board approved this study with a waiver of informed consent. Patients were eligible to be included in this study if they were 19 years of age with an inpatient hospital length of stay 3 days. Patients were considered to be receiving azithromycin and were included only when they were dispensed 1 dose of azithromycin by the pharmacy. Between October 1, 2012 and April 30, 2013, 1610 encounters were identified, of which 100 patient encounters were randomly selected for evaluation via a Microsoft Excel (Microsoft Corp., Redmond, WA) function. One patient was randomly included twice in this study, but had 2 separate admissions in which he received azithromycin.
QTc prolonging medications in our hospital formulary were identified via Micromedex and package inserts (see Supporting Information, Appendix, in the online version of this article for the full list).
Measures
The primary study measures were number of medications associated with QTc prolongation, baseline ECG findings, and telemetry monitoring. Secondary study measures include indication, dose, duration of use, formulation, length of stay, and admitting service (Table 1). Indications, dosage, and duration were defined by the FDA package insert for azithromycin (see Supporting Information, Appendix, in the online version of this article). Indication for use was defined as (1) empiric for a specific infection; (2) anti‐inflammatory for patients with COPD, lung transplant recipients, or cystic fibrosis patients; and (3) culture proven if evidence of a particular pathogen grown on culture. Indications were defined by prescriber notes. Dosage is defined as appropriate if FDA guidelines were followed for the defined indication. If patients were given azithromycin for anti‐inflammatory purposes, dosing was considered appropriate if it followed previous literature dosing of 250mg daily.
| |
| Age, y | |
| Average | 5519.5 |
| Range | 2197 |
| Gender | |
| Female | 61% |
| Male | 39% |
| Length of stay, d | |
| Average | 9.713.1 |
| Range | 3115 |
| Admitting service | |
| Hospitalist | 37% |
| Pulmonary | 23% |
| Obstetrics | 9% |
| General medicine | 8% |
| Hematology/oncology | 6% |
| Othera | 17% |
| Days of therapy | |
| Average | 4.53.9 |
| Range | 128 |
| Median | 4 |
| Indication for use | |
| Empiric | 79% |
| Anti‐inflammatory | 20% |
| Culture proven | 1% |
| Dosage | |
| Appropriate | 67% |
| Inappropriate | 14% |
| Unknown | 19% |
| Duration | |
| Appropriate | 63% |
| Inappropriate | 19% |
| Unknown | 18% |
| Formulation | |
| Intravenous only | 21% |
| Intravenous followed by tablet | 13% |
| Suspension | 2% |
| Tablet | 64% |
| Diagnosis‐related group | |
| Simple pneumonia with pleurisy | 14% |
| Septicemia with sepsis | 8% |
| Respiratory infection with inflammation | 8% |
| Chronic obstructive pulmonary disease | 8% |
| Pulmonary edema with respiratory failure | 6% |
| Vaginal delivery with complications | 6% |
| Respiratory diagnosis with ventilator support | 4% |
| Otherb | 46% |
Patients were divided into drug interaction risk levels based on the number of medications prescribed with the potential for QT prolongation (Table 2). Patients were considered low risk if they received azithromycin alone, medium risk if they received 2 to 3 QT‐prolonging medications including azithromycin, and high risk if they received 4 or more QT‐prolonging medications including azithromycin.
| Medication | % of Patients Receiving Interacting Medication With Azithromycin |
|---|---|
| |
| Ondansetron | 48 |
| Trazodone | 23 |
| Moxifloxacin | 17 |
| Promethazine, haloperidol | 10 |
| Ciprofloxacin, citalopram, fluconazole | 7 |
| Amiodarone, amitriptyline | 5 |
| Quetiapine, methadone | 4 |
| Clarithromycin, octreotide, voriconazole | 2 |
| Erythromycin, granisetron, salmeterol, sotalol, ziprasidone | 1 |
The QT interval was measured from the beginning of the QRS complex to the end of the T wave as it returns to baseline. QTc has been defined by the most universally adopted method known as Bazett's formula ( , where QT is the measured QT interval and RR is the interval in seconds).[15]
Baseline QTc was evaluated through the use of most recent ECG within the past 6 months of admission. Borderline QTc was defined as 431 to 450 ms in males and 451 to 470 ms in females. Abnormal QTc was defined as >450 ms in males and >470 ms in females.[16]
Following admission, inpatient charges for telemetry during hospitalization were included. Telemetry was documented based on telemetry charges at any point in the hospital.
Statistical Analysis
Patient data were initially collected via Excel and analyzed with SAS version 9.4 software (SAS Institute, Cary, NC). Univariate analysis including central tendency and dispersion were utilized for aim 1. P values were calculated using 2 analysis and Fisher exact test for probability if cells with numerical values were <5 for aims 2 and 3.
RESULTS
Azithromycin use within our hospital system has increased from 15 days of therapy per 1000 patient days in 2002 to 40 days of therapy per 1000 patient days in 2013 (Figure 1). At the same time, azithromycin susceptibility in Streptococcus pneumoniae isolates has decreased over the past decade from 65% to 35% in our hospital.
The baseline characteristics of patients included in this study are noted in Table 1. The mean age of patients was 55 years, with a range of 21 to 97 years, and 61% were female. Forty‐five percent of patients were admitted to either the general medicine teaching service or hospitalist service, and 23% were admitted to the pulmonary service, which includes intensive care unit admission. The average length of patient stay was 9.7 days (range, 3115 days; median 6 days).
Seventy‐nine percent of azithromycin use was empiric for the treatment of suspected infection. The second most common use was for anti‐inflammatory effects (20%), as documented by prescribers in the medical record for patients with cystic fibrosis, lung transplant, and chronic obstructive pulmonary disease. Azithromycin was dosed appropriately according to the documented indication in 67% of patients, with the most discrepancy in dosing noted for anti‐inflammatory use. The average duration of azithromycin therapy was 4.5 days (range, 128 days). Duration was appropriate in 63% of patients. Twenty‐one percent of patients received intravenous formulation of azithromycin, 13% received intravenous followed by oral formulation, and 64% of patient received tablet formulation alone.
Thirty‐five medications have been identified in our formulary as having a potential major drug‐drug interaction when prescribed with azithromycin (see Supporting Information, Appendix, in the online version of this article), and of these medications, 20 were prescribed with azithromycin, with an average overlap of therapy of 4.5 days (Table 2). Seventy‐six percent of patients were concomitantly prescribed a QT‐prolonging drug in addition to azithromycin. The most commonly prescribed agents were ondansetron (48%), trazodone (22%), and moxifloxacin (17%).
Telemetry monitoring was assessed for each patient based on inpatient charges during their hospitalization (Table 3). Forty‐three percent of patients were placed on telemetry. Twenty‐four (24%) of the patients were prescribed azithromycin alone, of whom 45.8% were placed on telemetry. Fifty‐seven percent of patients were prescribed azithromycin with 1 to 2 additional QT‐prolonging medications (medium‐risk arm); 38.5% of patients in this group were placed on telemetry. In the high‐risk arm, 19% of patients were prescribed at least 3 QT‐prolonging medications in addition to azithromycin, of which only 52.6% of patients were monitored with telemetry. No statistically significant association was observed between risk level and telemetry placement (P=0.07).
| Telemetry (%) | No Telemetry (%) | Total | P Valueb | |
|---|---|---|---|---|
| ||||
| Drug interaction risk levela | ||||
| Low | 11 (45.8) | 13 (54.2) | 24 | |
| Medium | 22 (38.5) | 35 (61.4) | 57 | |
| High | 10 (52.6) | 9 (47.4) | 19 | |
| Total | 43 | 57 | 100 | 0.07 |
| QTc | ||||
| Normal | 14 (50) | 14 (50) | 28 | |
| Borderline | 6 (66.7) | 3 (33.3) | 9 | |
| Abnormal | 15 (51.7) | 14 (48.3) | 29 | |
| Total | 35 | 31 | 66 | 0.22 |
Telemetry charges were further examined by analyzing baseline ECG evaluation within the past 6 months of their hospitalization (Table 3). Sixty‐six patients received baseline ECGs prior to initiation of azithromycin. Telemetry placement was not statistically correlated to abnormal QTc at baseline (P=0.22). Of those who underwent baseline ECG evaluation, 8.3% were noted to have borderline QTc, and 12.5% had abnormal QTc on admission prior to receiving azithromycin in the low‐risk level (Table 4). Within the medium‐risk level, 63.2% had baseline ECG evaluation, with 5.3% with borderline QTc and 35.7% with abnormal QTc. In the high‐risk level, 73.6% received a baseline ECG, with 21% with borderline QTc and 31.6% with abnormal QTc. No statistically significant association was observed between risk level and obtainment of baseline ECG (P=0.7). In 17 out of 66 patients, average repeat ECGs were obtained on day 3 (range, 27 days). Ten of the 17 ECGs showed increase in QTc (range, 397ms; average 27 ms), whereas the other 7 had a decrease in their QTc interval (range, 618 ms; average 13 ms; P=0.17).
| QTcb | Low, n=24 (%) | Medium, n=57 (%) | High, n=19 (%) | Total |
|---|---|---|---|---|
| ||||
| Normal | 11 (45.8%) | 13 (22.8%) | 4 (21.0%) | 28 |
| Borderline | 2 (8.3%) | 3 (5.3%) | 4 (21.0%) | 9 |
| Abnormal | 3 (12.5%) | 20 (35.7%) | 6 (31.6%) | 29 |
| Total | 16 (66.7%) | 36 (63.2%) | 14 (73.6%) | 66 |
| P valuec | 0.03 | 0.11 | ||
As risk level increased, having an abnormal QTc at baseline was statistically different between low‐ and medium‐risk levels (P=0.03), but this association was lost when comparing the low‐risk arm to the high‐risk arm (P=0.11). When the medium‐ and high‐risk categories were combined, there was a noted statistical significance of having an abnormal ECG at baseline (P=0.03).
Of the 9 patients prescribed azithromycin chronically, 3 patients were in the low‐risk category, 4 in the medium‐risk category, and 2 in the high‐risk category. Only 2 had baseline ECGs obtained, 1 of which was noted to have abnormal QTc and was in the high‐risk category. Only 1 patient was placed on telemetry, but was considered low risk based on medications prescribed.
DISCUSSION
In this study, 76% of patients were prescribed azithromycin with 1 or more medications known to affect QT prolongation; 19% received 3 or more QT‐prolonging medications in addition to azithromycin. Of patients who received a baseline ECG, 43% were documented to have borderline or prolonged QTc on admission. Telemetry monitoring was ordered 43% of the time, but there was no significant association between telemetry placement and risk level (P=0.07), suggesting that telemetry was ordered based on symptoms more than risk. Despite more drug‐druginteracting medications prescribed, there was no association to either telemetry orders or baseline ECG evaluation. Furthermore, if an abnormal QTc was documented on admission, there was no relationship to ordering telemetry as an inpatient (P=0.215), suggesting that healthcare providers are not considering risk of QTc medication accumulation. Given increased warnings issued by the FDA for azithromycin, further prospective studies are indicated to fully assess risk of QTc prolongation and arrhythmias in the setting of multiple drug interactions. This study elucidates the potential for drug‐drug interactions and need for increased vigilance and education of providers in the healthcare setting for QTc prolongation and subsequent arrhythmias.
Forty‐eight percent of patients receiving other QTc prolonging medications were prescribed ondansetron, followed by 23% of patients prescribed trazodone. Both of these medications are included on the admission order set in our institution and can be easily ordered for patients. Despite ordering multiple medications that have potential for QTc prolongation, there are no current alerts set up in our electronic medical record. When patients are separated into drug interaction risk levels, there is a trend of having an abnormal QTc on admission, but this is driven by the large number of patients in the medium‐risk category, and the rate does not increase (and is not significant) when comparing high risk to low risk. However, patients who receive any QTc‐prolonging medication are more likely to have an abnormal QTc when compared to azithromycin prescription alone (P=0.03). The small sample size limits the power and generalizability of this study, and further larger studies are indicated to assess if risk of QTc prolongation is additive.
In the 9 patients prescribed azithromycin chronically, dosing was not consistent, and a vast majority of patients were not placed on telemetry nor had baseline ECGs on admission. This further correlates with the idea that risk of arrhythmia is not fully considered in this patient population, as patients prescribed more than 1 QTc‐prolonging medication were not included in prior studies that examined azithromycin for its anti‐inflammatory effects.[2]
Azithromycin was added to our hospital formulary in 1998, and prescription of this agent remained relatively low until 2006, when azithromycin use increased dramatically from 15 days of therapy (DOT) per 1000 patient days to 40 DOT per 1000 patient days. Although numerous factors may have led to this increase, literature was published in 2006 and 2011 citing benefit from the anti‐inflammatory effects of azithromycin.[2, 17] At the same time, azithromycin susceptibility among Streptococcus pneumoniae in patients within our hospital has decreased over the past decade; studies have found a correlation between increasing use of macrolides and the development of resistance in Streptococcus species.[18, 19, 20] In this study, 79% of patients were prescribed azithromycin empirically for treatment of bacterial infections, whereas 20% were given azithromycin for its anti‐inflammatory effects; both dose and frequency varied among patients, raising the concern for development of resistance. Published studies have shown improvement in quality of life and decreased frequency of exacerbation and infection when azithromycin is used as an anti‐inflammatory agent; however, no QTc monitoring was noted.[2] Drug‐induced QTc prolongation>10 ms above baseline suggests the potential for clinical significance, whereas a QTc prolongation >20 milliseconds above baseline has a substantially increased likelihood of being proarrhythmic.[1] Unfortunately, drug‐induced QT prolongation is unpredictable, and additional risk factors play a role in facilitating Torsades de pointes, including female sex, advanced age, electrolyte disturbances, intravenous formulation, and concurrent use of more than 1 drug that can prolong the QT interval.[15] Azithromycin has recently been added to the growing list of medications that can prolong the QT interval, with 12 cases of Torsades de pointes reported in the literature. In March 2013, the FDA released a warning regarding prescribing azithromycin, but there is a lack of guidance for clinicians in identifying risk of cardiovascular events in susceptible patients.
There are some limitations to this study. Given data were acquired retrospectively and telemetry sheets were unable to be reviewed. Some patients were noted to have arrhythmias, but these data were obtained through physician notes and not examined directly from telemetry sheets. Seventeen patients had repeat ECGs, but most were performed serially for chest pain and not QTc monitoring. Four patients died in this study, but cause of death could not be determined through electronic medical records provided for all 4 patients; families pursued withdrawal of care.
Despite the published FDA warning, there are no national guidelines for clinicians in prescribing QTc‐prolonging medications. The American Heart Association published recommendations in 2010 for prescribing these drugs in the inpatient setting, but because hospitals differ in cardiac monitoring, there is no one‐size‐fits‐all strategy in reducing risk of cardiac events.[14] If the benefit of azithromycin outweighs the risk, QTc prolongation should not limit therapy; however, institutional awareness is necessary, whether it be through automatic stop dates on azithromycin, electronic alerts regarding drug‐drug interaction, enhanced prescriber education, or a combination of all of the above.
Disclosure: Nothing to report.
- , , . Azithromycin and the risk of cardiovascular complications. J Pharm Pract. 2014;27(5):496–500.
- , , , et al., Azithromycin for prevention of exacerbations of COPD. N Engl J Med. 2011;365(8):689–698.
- , , , . Macrolide antibiotics for cystic fibrosis. Cochrane Database Syst Rev. 2012;11:CD002203.
- , , . Long‐term macrolide treatment for chronic respiratory disease. Eur Respir J. 2013;42(1):239–251.
- , . Antimicrobial‐associated QT interval prolongation: pointes of interest. Clin Infect Dis. 2006;43(12):1603–1611.
- . Azithromycin‐induced proarrhythmia and cardiovascular death. Ann Pharmacother. 2013;47(11):1547–1551.
- , , , , . Azithromycin and the risk of cardiovascular death. N Engl J Med. 2012;366(20):1881–1890.
- , , , et al. Azithromycin and levofloxacin use and increased risk of cardiac arrhythmia and death. Ann Fam Med. 2014;12(2):121–127.
- , , , et al. Association of azithromycin with mortality and cardiovascular events among older patients hospitalized with pneumonia. JAMA. 2014;311(21):2199–2208.
- , , . Use of azithromycin and death from cardiovascular causes. N Engl J Med. 2013;368(18):1704–1712.
- U.S. Food and Drug Administration Drug Information. FDA drug safety communication: azithromycin (zithromax or zmax) and the risk of potentially fatal heart rhythms. Available at: http://www.fda.gov/Drugs/DrugSafety/ucm341822.htm. Accessed December 1, 2014.
- , , , , . QT interval prolongation and the risk of torsades de pointes: essentials for clinicians. Curr Med Res Opin. 2013;29(12):1719–1726.
- , , , et al., Development and validation of a risk score to predict QT interval prolongation in hospitalized patients. Circ Cardiovasc Qual Outcomes. 2013;6(4):479–487.
- , , , et al.; American Heart Association Acute Cardiac Care Committee of the Council on Clinical Cardiology; Council on Cardiovascular Nursing; American College of Cardiology Foundation. Prevention of torsade de pointes in hospital settings: a scientific statement from the American Heart Association and the American College of Cardiology Foundation. J Am Coll Cardiol. 2010;55(9):934–947.
- , , . Drug‐induced QT interval prolongation: mechanisms and clinical management. Ther Adv Drug Saf. 2012;3(5):241–253.
- , , . QT interval: how to measure it and what is “normal”. J Cardiovasc Electrophysiol. 2006;17(3):333–336.
- , , , , . Anti‐inflammatory effects of azithromycin in cystic fibrosis airway epithelial cells. Biochem Biophys Res Commun. 2006;350(4):977–982.
- , , , , , ; Finnish Study Group for Antimicrobial Resistance (FiRe‐Network). Macrolide‐resistant Streptococcus pneumoniae and use of antimicrobial agents. Clin Infect Dis. 2001;33(4):483–488.
- , , , , , . Community prescribing and resistant Streptococcus pneumoniae. Emerg Infect Dis. 2005;11(6):829–837.
- , , , , ; Finnish Study Group for Antimicrobial Resistance (FiRe Network). Macrolide and azithromycin use are linked to increased macrolide resistance in Streptococcus pneumoniae. Antimicrob Agents Chemother. 2006;50(11):3646–3650.
© 2015 Society of Hospital Medicine

Perceived Attitudes and Staff Roles of Disaster Management at CBOCs
Recently, the U.S. Department of Homeland Security redefined disasters into 4 types: natural hazards, societal hazards, technologic hazards, and terrorism. The incidence of manmade and natural disasters is on the rise in intensity and frequency globally. Recent events such as tornadoes and hurricanes in the southeastern U.S., tsunamis in Japan, earthquakes in Haiti, wild fires, heat waves, and terrorist attacks like that of September 11, 2001, underscore the urgency of developing and maintaining solid local public health disaster response plans to minimize mortality and morbidity.
The 2010 BP oil spill in the Gulf of Mexico, the largest in history, hurricane Katrina, and the lingering impact of hurricane Sandy on the East Coast further raise concerns about our communities’ ability to handle disasters, especially in the early hours after events, when federally coordinated help is being organized and not yet fully available locally or from other nations.1 The recent fertilizer plant explosion in West Texas, the 2013 Boston marathon bombing, and the Newtown, Connecticut, massacre remind us of the unpredictable nature of both manmade and natural disasters.

Coordinated Response
Regardless of its origin, residents expect a coordinated local response during an emergency, and it is important that government agencies meet this expectation. Fulfilling these expectations, however, takes many partners, and it is important to have a clear idea of who is involved in emergency preparedness (EP) and the response of each partner’s role.
Role of Government
Federal, state, and local governments have a critical role in emergency management (EM). When state government, local government, or an individual entity is overwhelmed with a disaster, the role of the Federal Emergency Management Agency is to provide assistance and resources to cope with the emergency.2 Private industry and traditional disaster relief agencies, such as the American Red Cross and the Adventist Development and Relief Agency, are also involved in response efforts. Recent examples have shown that these partnerships are often overwhelmed with the needs of large regions experiencing limited resources. Therefore, hospitals and local public health departments frequently must carry much of the immediate burden of stabilizing communities and coordinating response with government agencies and local partners.3
Role of Public Health and the CDC
Federal agencies and local public health departments have been given critical roles in planning and responding to disasters. In particular, the PHS focuses on population care and shapes how public health entities should respond to mass casualty events and pandemics, including local response coordination. The CDC is primarily responsible for assisting state and local governments with disaster response and recovery after a large-scale public health emergency.3 The CDC works closely with local public health departments in decision making; tracking the source, spread, and severity of health threats; assessing impacts; educating the public on how to safeguard their health; and implementing measures to protect the public. During a large-scale health emergency, the CDC also maintains and provides resources through the maintenance and distribution of the nation’s Strategic National Stockpile of medications and supplies that may be needed during events such as the recent 2009 H1N1 influenza outbreak or other public health emergencies.3
Role of Local Businesses and Professional Institutions
Nationally, businesses and professional institutions are coming together and organizing in such a way that places them as part of the solution. More specifically, the National Voluntary Organizations Active in Disaster and Community Organizations Active in Disaster have grown exponentially since September 11, 2001.4 These efforts include but are not limited to development of EP plans and the subsequent sharing of those plans, sharing of key assets critical to response activities, development of a community key asset database, and training/exercise participation.

Role of Hospitals
The Hospital Preparedness Program was developed to prepare the nation’s health care system to respond appropriately to mass casualty incidents, whether due to bioterrorism, natural disaster, or other public health emergencies. Health care systems must be able to develop a disaster medical capability that is rapid, flexible, sustainable, integrated, coordinated, and capable of providing appropriate care in the most ethical manner with the resources and capabilities it has at its disposal.3 Although involved as first responders, traditionally, medical care systems, hospitals, physicians, and pharmacists are faced with the dual task of individual patient care and are thus more limited as partners in an overall local response system.
Also vital to this discussion is the reality that hospital emergency departments (EDs) already routinely operate at or above capacity, limiting their ability to prepare for mass casualties due to a public health disaster. Hospitals continue to divert more than half a million ambulances per year due to ED overcrowding.3 How they could step up in a true emergency situation is questionable at best.
Role of First Responders
Individuals who respond immediately are referred to as first responders. First responders come in 2 archetypes: those who are there purely based on unexpected circumstances and take action and those who are trained first responders, such as firefighters, police officers, and emergency medical technicians (EMTs). These first responders are trained to partner with one another. Firefighters primarily handle fire rescue as well as assessing the extent of potential damage to the area. Law enforcement’s responsibility is to restore order after an emergency, whether it is a natural disaster, community disturbance, or outbreak of hazardous chemicals. An EMT’s role is to attend to the immediate medical care of patients who have been injured or become ill during the emergency.5
Related: Disaster Preparedness for Veterans With Dementia and Their Caregivers
There are occasions where other potential incident responders, such as health care professionals, can play a key role and yet are not integrated into the emergency response. The VHA needs to focus on this facet in order to more effectively respond to events that threaten lives, property, and current infrastructure of the veterans it serves.
Role of CBOCs and Private Physician Practices
Community-based outpatient clinics (CBOCs), including outpatient community health centers and private physician practices (PPPs), maintain and improve routine community health but are rarely involved in routine planning for disasters. They are, therefore, typically not open for business or may have limited hours as they recover from the event. This results in patients who do not have access to their primary care providers (PCPs) turning to EDs, which are already at capacity. As a result, in a disaster the costly and overburdened ED functions as the PCP site for even larger populations affected by a disaster, including those who are uninsured.6,7
Kahan and colleagues reported that two-thirds of patients preferred their family doctor or health care authorities as their first choice for care instead of receiving care in the ED.8 Researchers found that 89% of physicians in private practice felt it was their responsibility to treat, for example, patients infected with anthrax.8 Some argue that if PCPs are included in planning and appropriately trained in disaster preparedness, their attitudes and willingness to participate in emergency services would follow.9
Given the many challenges to disaster preparedness, CBOCs could be a critical partner in EM, and interest continues to grow to explore that role. Health professionals in CBOCs who are trained in disaster management (DM) could become active participants in early intervention to initiate the treatment of patients in rescue efforts during a disaster.10 For instance, a CBOC could triage patients in a postdisaster situation, thus limiting the burden on hospital EDs by evaluating populations at risk and providing them with important information when communication is difficult.
This already existing network of community-based triage stations would offer natural locations to assess the health needs of the population and determine their level of appropriate medical care. Additionally, these clinics can ensure continuation of basic services after initial medical care has been completed in the hospital setting.10 Because clinics have not been included in coordinated DM, there is scant literature that addresses their potential role in disaster response. Community-based outpatient clinics and PPPs are untapped resources; however, it is unknown whether medical staff in these medical clinics have the interest, training, knowledge, skills, and resources in DM or whether barriers to providing safe care can be overcome.10
Case Study
The VHA is the largest integrated health care system in the U.S. It is mandated to serve as a backup to the DoD during disasters, and VHA CBOCs can play an important role.11,12 The CBOCs are staffed with a medical director, nurse manager, and other clinical and support staff. As a study population, CBOCs are well suited to examine and explore staff attitudes and roles in DM. To date, no research reports have been found studying EP in CBOCs.
The purpose of this study was to learn how to best integrate the CBOCs into disaster response. This qualitative study aimed to answer 3 questions: (1) How do VA clinic personnel perceive their personal and their clinic’s risk, level of preparedness, role, and knowledge for an active response in a disaster; (2) What do VA clinic personnel perceive they need in order to function in a disaster; and (3) What resources are necessary for clinic staff to function competently in a disaster?
Methods
In this qualitative study, in-depth semistructured key informant (KI) interviews (N = 3) and focus group discussions (N = 20) guided by risk perception theory and the Andersen Behavioral Model of Health Services Use were conducted and analyzed using grounded theory methods to contextualize the potential of local clinics in disaster response.13-15 To optimize breadth of viewpoints on this issue, participants were selected by theoretical sampling methods to explore perceptions of leadership and line staff.

Study Location
Health care providers and support staff from 3 southern California CBOCs that are contracted by the local VA to provide primary care services (ie, internal medicine, geriatrics, women’s health, mental health, and some specialty care services) to veterans were recruited for this study. The CBOCs are generally connected with a VHA local hospital in their region, offer services 5 days a week, and are closed on weekends and federal holidays. Some VA CBOCs participate in telehealth remote services connected to their regional hospital to help manage their patient populations. The CBOCs are managed by a medical director and a clinic manager and report to their respective VISN, and each VISN reports to the VHA Central Office in Washington, DC.13,15 The CBOC staff includes physicians, nurse practitioners, physician assistants, registered nurses (RNs), licensed vocational nurses (LVNs), medical assistants, front office staff, social workers, case managers, counselors, pharmacists, and nonclinical staff.
In this case, the CBOCs are contracted by Loma Linda University Health to manage care of the veterans and agree to care for nonveterans in a disaster. The CBOCs contracted or not all fall under the criteria as set forth in VHA Handbook 1006.1. This handbook criteria indicate that CBOCs must maintain appropriate emergency response capability. Additionally, VHA Handbook 0320.1 states that the CBOC is responsible for developing, implementing, evaluating, and improving a CBOC Comprehensive Emergency Management Program (CEMP) and for participating in the VAMC Emergency Management Committee. The scope of the VISN-wide CEMP integrates VAMC and VISN EM programs to coordinate and enhance operations during planned and unplanned events.
Study Design and Sample
After receiving institutional review board approval, 3 in-depth semi-structured clinic leadership KI interviews and 3 clinic staff (RNs, LVNs, health technicians, and nursing assistants) focus group discussions (N = 20, 1 per CBOC) to follow up on information gleaned from the analyses of the initial KIs were conducted. To provide continuity, all were conducted by the same trained facilitator who used a semistructured KI outline with questions and probes based on the guiding study framework.
Data Collection and Content Analysis
Interviews and focus group discussions were audio recorded and transcribed verbatim and then analyzed using grounded theory methods. Line-by-line coding was done to develop an initial inductive codebook, which was then organized into final codes. Once the codebook was developed, it was applied to all transcripts.
Related: Pre-Storm Dialysis Saves Lives
Transcripts and resulting codes were reviewed 3 times by independent reviewers to validate data, ensure accuracy, and delete any information that might identify participants. Pseudonyms were used to represent the participants by perspective (eg, nurse, MD) to avoid confusion in data analysis. A 4-stage data analysis approach was used: (1) immersion in the raw data by listening to tapes and reading manuscripts and notes in order to list key ideas and recurrent themes using a constant comparison method; (2) indexing by applying the thematic framework systematically to the data using and seeking new, unanticipated emerging codes; (3) arranging the data in codes and concepts/themes that represent the thematic framework of EP in clinics; (4) identifying a thematic framework for EP using codes that identified key issues, concepts, and themes that can be referenced and derived from the text.
Results
The Table describes the 4 primary emerging themes and corresponding quotes: (1) EP barriers, including lack of direction, training, and tools, which would result in negative outcomes; (2) perceived personal and clinic risk for a disaster, including negative outcomes and personal family safety; (3) perceptions of roles and responsibilities in EP, including intent to participate in DM at various staffing levels as well as patient expectations for care; and (4) existing resources that influence EP and the ability to survive a disaster collectively.
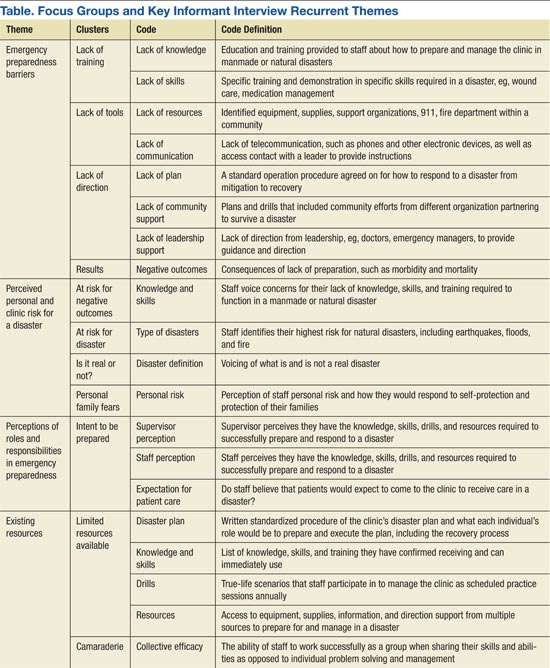
Emergency preparedness barriers. Although most respondents realized their potentially critical role in an emergency, they expressed recurrent barrier themes centered on their perceived lack of training, lack of tools to function, and lack of direction to be effective in a disaster response. Lack of knowledge of EP was identified as a great need by multiple participants. One participant stated, “Lack of information is so destructive. If you don’t know how to keep yourself from those things you don’t know…such as in a situation that’s going to be tragic, it is because of a lack of information or a lack of training. And I see that so many times…Mandate that we do our classes, so we know what we’re doing.” Another stated in reference to lack of skills, “I haven’t experienced any drills or anything like that. So I know what is going to happen here.”
Lack of abilities to communicate with key DM players also were identified. For example, “Downed power lines may result in no telephone connection to communicate next steps for critical issues, such as if evacuation of the clinic is required.” Another respondent indicated, “We need backup communication...devices, wind-up radios, or whatever.”
Lack of a clear disaster plan was also identified. Questions arose centered on details—how to actually implement a clinic response plan, including concerns that there were none, as the respondents “had not seen the plan in a couple of years” and were not sure who really was in charge of giving directions. Lack of community/organizational support voiced included aspects such as interdepartmental, facility, and community resource connectedness. There was acknowledgement that department assets should be clearly identified so that resource sharing might be used as part of the plan.
Last, regarding lack of resources, one participant said, “We don’t have the resources. We don’t have gurneys. We don’t have enough wheel chairs….We don’t have a crash cart. We don’t have the triage tarps or whatever for the triage of people; we don’t have any supplies to supply the energy room for diabetics, like what they have in the ER.”
Perceived personal and clinic risk for a disaster. Participants stated they felt at risk for natural disasters, including fire, floods, and earthquakes, but expressed concerns and even more fears about how they would handle a response to bombings, spills of hazardous materials, airplane accidents, and gunfire, which also qualify as disasters but are much harder to prepare for, because they could be so varied. One participated stated, “They are so unpredictable whether it is an earthquake or a fire…they are unpredictable….We see planes that fly close to our window and we wonder about the possibility of a crash—you never know.”
Many staff members expressed fear of what these disasters would mean to them in the clinic and to their patients. Another comment shared was, “I don’t think anybody really thinks about this kind of stuff until it happens and then it is too late…If we had just done this or that or knew how to do this or that then…” The biggest fear expressed was that of a massive earthquake in which there would be power outages and resulting fires, blocked building exits, and no way to get to evacuation areas. Fears expressed included working with people who are dying and trying to get the patients down the stairs and out of the disaster area.
Personal safety in a disaster was also a concern; a nurse stated, “Your personal safety is a priority. Yourself, that is first, if you are not safe, you can’t do any good to anyone else.” Another shared concern was the safety of family members during a disaster and conflicting obligations between duties at work and protecting family members. Participants felt they would want to be at home with their families.
Perceptions of roles and responsibilities in EP. Supervisors of the clinics shared that their primary responsibility is to the staff and their current patients; ensuring their safety was a top priority. Their knowledge, skills, and available resources were crucial to their duties, including establishing methods of communication outside the clinic for advice and direction, such as notifying the power company and other outside agencies of the condition of the clinic. They felt that their duties included making sure generators were working, ensuring telephones and lighting were available, and advising staff when to leave the building. One manager stated that more EP discussions need to happen in order to determine how to react: “...in event of a disaster it is important to control patient flow, staffing the clinic appropriately and managing the employees.” They felt a need to help empower their staff by making sure staff were trained in EP tasks and that they could complete the tasks they were required to perform.
Staff consistently reported that the doctors were in charge of providing direction concerning activities and care of the patients. However, most were able to identify their own role in helping preserve lives and keeping the patients and other staff safe. One nurse stated, “My job would be to evacuate the physicians’ offices, to make sure they are aware of the disaster, get them out safely, put an X on their door, keep the patients calm and guide them out to the designated area, then look out for medics or other help so that they would be directed to the correct locations.” Another staff nurse stated, “My role is to check the bathrooms and then under the direction of the physician assist in the care of patient injuries.”
When asked about the expectations of patients for care during a disaster, staff consistently stated that patients and their families would want to get care and direction from clinic staff who knew them instead of going to the hospital for care. Staff anticipated that patients would be calling the clinic first to discuss their medical problems. One stated, “The veterans would head to us…. We can’t turn them away.” Some staff indicated that some patients might have to go to the ED for care instead of coming to the clinic, because the clinic may not be equipped to respond, noting that “we have to remind [the patients] that in our clinic we have minimal abilities.”
Existing resources. Consistently, the respondents verbalized the importance of acquiring knowledge and skills and using available resources in their disaster plan. They felt that training was critical and that it needed to be simple and uncomplicated. Many felt that they did not have sufficient drills to maintain their knowledge and skills for all types of events. One nursing assistant stated he had extensive training in the military in DM, but clinics did not have sufficient training and were not prepared to handle multiple casualties. Others stated that it would be important for training to be “second nature” so they would not have to think much about it, with everyone pulling together and performing tasks seamlessly. However, some stated that they did not know what to do in an emergency.
Critical resources noted were access to emergency power sources, transistor radios, telephone and communication, 911 services, backup phone services, computers, and text pagers and cell phones so that connections could be made outside the clinic setting. Other critical resources needed included medical supplies and access to food for 1 week.
Finally, teamwork was identified as a critical factor for success. One example involved the clinic responding to a severe snowstorm; the medical director, lead nurse, and support staff agreed to remain on site to assist with any patients who needed help. “We shared our 4-wheel drive trucks to get around, and others called patients, advising them of storm conditions and what to do to maintain care at home and canceled appointments scheduled for that day.” They were very proud of the way they had pooled their resources to support each other and their patients.
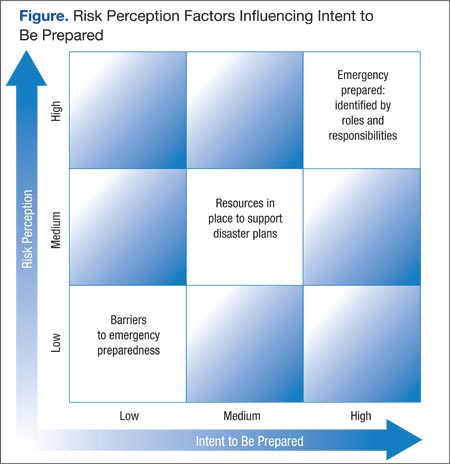
Based on these emerging themes and the inquiry guiding theories, a theoretical framework was proposed on how contributing factors influenced the process by which CBOC staff viewed their roles and the likelihood that they would participate in a disaster plan (Figure). The framework suggests that personal risks and perceived personal and clinic readiness to respond to an emergency were critical barriers to staff willingness to get involved in preparedness, whereas they saw the provision of training and resources as necessary to increase their resilience and ability to function in a disaster.
Clearly addressing barriers through training, planning, ensuring that resources functioned effectively in a disaster, and clarifying roles and responsibilities, combined with promoting personal and clinic readiness facilitated staff EP participation.
Discussion
This qualitative study explored issues surrounding the role of CBOCs in EP and how risk perception and enabling factors contributed to staff intent to participate in DM. As in many qualitative studies, findings were somewhat limited by an overall small sample size (N = 23) across 3 CBOCs in southern California. However, given the lack of available literature, the authors believe that this study helped provide critical insight into CBOC clinic staff’s willingness and readiness to be active in disaster response. The study clearly points to clinic staff’s openness to actively take part in regional disaster response and calls for better and more standardized approaches to EP and DM planning that include local CBOCs. The authors identified factors that contribute to staff intent to participate in DM and the need to reduce barriers that hinder participation.
In general, clinic staff who reported feeling inadequately prepared for disasters (ie, felt more vulnerable) and staff with firsthand disaster experience were more inclined to prepare than were those without experience. Without clearly spelled-out expectations, staff tend to depend and wait on others to lead in a disaster. They noted a desire for better preparation and thus, clarity of roles, need for a reliable method of communication with the outside world during a disaster, and the required equipment and supplies for self-care or care of the patients for ≥ 3 days post disaster. Some indicated that they did not have the resources to provide medical care on the scale that may be required.
Many did not have a clear understanding of an all-hazard approach plan and had not been involved in hazard assessments. Already tightly staffed for personal health care delivery, staff spent minimal time and energy thinking about the risk of a disaster or preparing for one. However, there seemed to be a direct relationship between the attitude of the supervisor and the attitudes of clinic staff to EP. Although these qualitative results are encouraging and point to these clinics as an important undertapped resource for EP, further quantitative studies should expand this inquiry.
Lessons learned from this study include the need to expand qualitative data collection to include a larger sample size to retrieve information that would contribute to a better understanding of how staff view their roles in DM. There are 152 VAMCs and hundreds of associated CBOCs that should be queried as to their EM readiness. Also, replicating this study in non-VHA clinics, such as private CBOCs and PPPs, might bring greater insight into what is needed to involve them in DM plans. Finally, future studies should determine clearer criteria when care can be provided at a clinic and when it would be appropriate for the patient to report at their local ED.
Conclusions and Recommendations
Given the VHA EP mandate, the authors recommend the following steps to address barriers identified in this study: (1) Develop a more structured approach to DM in a CBOC setting to provide staff with a clear understanding of their roles and responsibilities; (2) Conduct a comprehensive assessment of each clinic to determine staff knowledge, skills, and resources required to provide EP and institute a DM training curriculum; (3) Provide clinic leadership with direction on developing a disaster plan as well as how to partner with their primary and local VA health care system, especially onsite physicians, to provide effective DM leadership; (4) Recruit staff into routine drills for natural disasters and expand to an all-hazard approach to manmade disasters to identify gaps in delivering DM in a disaster; (5) Facilitate partnerships and a standardized approach to DM between CBOCs within the VISN by scheduling routine video and teleconferencing, live meetings, and webinars so that procedures and language are clearly understood and communicated between facilities; and (6) Identify key barriers to clinic preparedness by assessing EP elements through mock disaster drills and offer solutions to fill DM gaps.
The authors also recommend that CBOCs should be included in community DM and EP plans in order to understand how to integrate resources in a disaster. Networking, planning, and interdisciplinary staff training between agencies to include CBOCs will bring a wealth of information of what CBOCs require to participate effectively in DM. Lessons learned from these partnerships can provide valuable information to facilitate resource allocation for acute care hospitals, which may be burdened with treating patients with minor medical issues when they should be focusing on providing care to those with catastrophic medical conditions.
Acknowledgments
This study and this material is the result of work supported with resources and the use of facilities at the VA Loma Linda Health Care System. Research in this publication was in part supported by the National Institute on Minority Health and Health Disparities of the National Institutes of Health under award number P20MD006988.
Author disclosures
The authors report no actual or potential conflicts of interest with regard to this article.
Disclaimer
The opinions expressed herein are those of the authors and do not necessarily reflect those of Federal Practitioner, Frontline Medical Communications Inc., the U.S. Government, or any of its agencies. This article may discuss unlabeled or investigational use of certain drugs. Please review complete prescribing information for specific drugs or drug combinations—including indications, contraindications, warnings, and adverse effects—before administering pharmacologic therapy to patients.
1. McNeill JB, Carafano JJ, Mayer MA, Weitz R. Accepting disaster relief from nations: lessons from Katrina and Gulf oil spill. The Heritage Foundation Website. http://www.heritage.org/research/reports/2011/02/accepting-disaster-relief-from-other-nations-lessons-from-katrina-and-the-gulf-oil-spill. Published February 17, 2011. Accessed July 16, 2015.
2. Haddow GD, Bullock JA. Introduction to Emergency Management. 2nd ed. Burlington, MA: Butterworth-Heinemann; 2006.
3. Institute of Medicine. Medical Surge Capacity: Workshop Summary. Washington, DC: The National Academies Press; 2010.
4. National Voluntary Organizations Active in Disasters. Federal Emergency Management Agency Website. http://www.ready.gov/voluntary-organizations-active-disaster. Updated June 19, 2014. Accessed July 10, 2015.
5. What is the role of police, fire and EMS after a natural disaster strikes? Galls Website. http://gallsblog.com/2011/08/29/what-is-the-role-of-police-fire-and-ems-after-a-natural-disaster-strikes. Published August 29, 2011. Accessed July 14, 2015.
6. Hogan DE, Waeckerle JF, Dire DJ, Lillibridge SR. Emergency department impact of the Oklahoma City terrorist bombing. Ann Emerg Med. 1999;34(2):160-167.
7. Carlson JN, Menegazzi JJ, Callaway CW. Magnitude of national ED visits and resource utilization by the uninsured. Am J Emerg Med. 2013;31(4):722-726.
8. Kahan E, Fogelman Y, Kitai E, Vinker S. Patient and family physician p for care and communication in the eventuality of anthrax terrorism. Fam Pract. 2003;20(4):441-442.
9. Chen FM, Hickner J, Fink KS, Galliher JM, Burstin H. On the front lines: family physicians’ preparedness for bioterrorism. J Fam Pract. 2002;51(9):745-750.
10. Wood K. Community health centers: the untapped resource for public health and medical preparedness. Homeland Secur Aff. 2009;5(8):113.
11. Koenig KL. Homeland security and public health: role of the Department of Veterans Affairs, the US Department of Homeland Security, and implications for the public health community. Prehosp Disaster Med. 2003;18(4):327-333.
12. Panangala SV, Mendez BHP. Veterans Health Administration: Community-Based Outpatient Clinics. Washington, DC: Library of Congress, Congressional Research Service; 2010.
13. Tashakkori A, Teddlie C, eds. Handbook of Mixed Methods in Social & Behavioral Research. Thousand Oaks, CA: Sage Publications, Inc.; 2003.
14. Barnett DJ, Balicer RD, Blodgett DW, et al. Applying risk perception theory to public health workforce preparedness training. J Public Health Manag Pract. 2005;Suppl:33-37.
15. Andersen RM. Revisiting the behavioral model and access to medical care: does it matter? J Health Soc Behav. 1995;36(1):1-10.
Recently, the U.S. Department of Homeland Security redefined disasters into 4 types: natural hazards, societal hazards, technologic hazards, and terrorism. The incidence of manmade and natural disasters is on the rise in intensity and frequency globally. Recent events such as tornadoes and hurricanes in the southeastern U.S., tsunamis in Japan, earthquakes in Haiti, wild fires, heat waves, and terrorist attacks like that of September 11, 2001, underscore the urgency of developing and maintaining solid local public health disaster response plans to minimize mortality and morbidity.
The 2010 BP oil spill in the Gulf of Mexico, the largest in history, hurricane Katrina, and the lingering impact of hurricane Sandy on the East Coast further raise concerns about our communities’ ability to handle disasters, especially in the early hours after events, when federally coordinated help is being organized and not yet fully available locally or from other nations.1 The recent fertilizer plant explosion in West Texas, the 2013 Boston marathon bombing, and the Newtown, Connecticut, massacre remind us of the unpredictable nature of both manmade and natural disasters.
Coordinated Response
Regardless of its origin, residents expect a coordinated local response during an emergency, and it is important that government agencies meet this expectation. Fulfilling these expectations, however, takes many partners, and it is important to have a clear idea of who is involved in emergency preparedness (EP) and the response of each partner’s role.
Role of Government
Federal, state, and local governments have a critical role in emergency management (EM). When state government, local government, or an individual entity is overwhelmed with a disaster, the role of the Federal Emergency Management Agency is to provide assistance and resources to cope with the emergency.2 Private industry and traditional disaster relief agencies, such as the American Red Cross and the Adventist Development and Relief Agency, are also involved in response efforts. Recent examples have shown that these partnerships are often overwhelmed with the needs of large regions experiencing limited resources. Therefore, hospitals and local public health departments frequently must carry much of the immediate burden of stabilizing communities and coordinating response with government agencies and local partners.3
Role of Public Health and the CDC
Federal agencies and local public health departments have been given critical roles in planning and responding to disasters. In particular, the PHS focuses on population care and shapes how public health entities should respond to mass casualty events and pandemics, including local response coordination. The CDC is primarily responsible for assisting state and local governments with disaster response and recovery after a large-scale public health emergency.3 The CDC works closely with local public health departments in decision making; tracking the source, spread, and severity of health threats; assessing impacts; educating the public on how to safeguard their health; and implementing measures to protect the public. During a large-scale health emergency, the CDC also maintains and provides resources through the maintenance and distribution of the nation’s Strategic National Stockpile of medications and supplies that may be needed during events such as the recent 2009 H1N1 influenza outbreak or other public health emergencies.3
Role of Local Businesses and Professional Institutions
Nationally, businesses and professional institutions are coming together and organizing in such a way that places them as part of the solution. More specifically, the National Voluntary Organizations Active in Disaster and Community Organizations Active in Disaster have grown exponentially since September 11, 2001.4 These efforts include but are not limited to development of EP plans and the subsequent sharing of those plans, sharing of key assets critical to response activities, development of a community key asset database, and training/exercise participation.
Role of Hospitals
The Hospital Preparedness Program was developed to prepare the nation’s health care system to respond appropriately to mass casualty incidents, whether due to bioterrorism, natural disaster, or other public health emergencies. Health care systems must be able to develop a disaster medical capability that is rapid, flexible, sustainable, integrated, coordinated, and capable of providing appropriate care in the most ethical manner with the resources and capabilities it has at its disposal.3 Although involved as first responders, traditionally, medical care systems, hospitals, physicians, and pharmacists are faced with the dual task of individual patient care and are thus more limited as partners in an overall local response system.
Also vital to this discussion is the reality that hospital emergency departments (EDs) already routinely operate at or above capacity, limiting their ability to prepare for mass casualties due to a public health disaster. Hospitals continue to divert more than half a million ambulances per year due to ED overcrowding.3 How they could step up in a true emergency situation is questionable at best.
Role of First Responders
Individuals who respond immediately are referred to as first responders. First responders come in 2 archetypes: those who are there purely based on unexpected circumstances and take action and those who are trained first responders, such as firefighters, police officers, and emergency medical technicians (EMTs). These first responders are trained to partner with one another. Firefighters primarily handle fire rescue as well as assessing the extent of potential damage to the area. Law enforcement’s responsibility is to restore order after an emergency, whether it is a natural disaster, community disturbance, or outbreak of hazardous chemicals. An EMT’s role is to attend to the immediate medical care of patients who have been injured or become ill during the emergency.5
Related: Disaster Preparedness for Veterans With Dementia and Their Caregivers
There are occasions where other potential incident responders, such as health care professionals, can play a key role and yet are not integrated into the emergency response. The VHA needs to focus on this facet in order to more effectively respond to events that threaten lives, property, and current infrastructure of the veterans it serves.
Role of CBOCs and Private Physician Practices
Community-based outpatient clinics (CBOCs), including outpatient community health centers and private physician practices (PPPs), maintain and improve routine community health but are rarely involved in routine planning for disasters. They are, therefore, typically not open for business or may have limited hours as they recover from the event. This results in patients who do not have access to their primary care providers (PCPs) turning to EDs, which are already at capacity. As a result, in a disaster the costly and overburdened ED functions as the PCP site for even larger populations affected by a disaster, including those who are uninsured.6,7
Kahan and colleagues reported that two-thirds of patients preferred their family doctor or health care authorities as their first choice for care instead of receiving care in the ED.8 Researchers found that 89% of physicians in private practice felt it was their responsibility to treat, for example, patients infected with anthrax.8 Some argue that if PCPs are included in planning and appropriately trained in disaster preparedness, their attitudes and willingness to participate in emergency services would follow.9
Given the many challenges to disaster preparedness, CBOCs could be a critical partner in EM, and interest continues to grow to explore that role. Health professionals in CBOCs who are trained in disaster management (DM) could become active participants in early intervention to initiate the treatment of patients in rescue efforts during a disaster.10 For instance, a CBOC could triage patients in a postdisaster situation, thus limiting the burden on hospital EDs by evaluating populations at risk and providing them with important information when communication is difficult.
This already existing network of community-based triage stations would offer natural locations to assess the health needs of the population and determine their level of appropriate medical care. Additionally, these clinics can ensure continuation of basic services after initial medical care has been completed in the hospital setting.10 Because clinics have not been included in coordinated DM, there is scant literature that addresses their potential role in disaster response. Community-based outpatient clinics and PPPs are untapped resources; however, it is unknown whether medical staff in these medical clinics have the interest, training, knowledge, skills, and resources in DM or whether barriers to providing safe care can be overcome.10
Case Study
The VHA is the largest integrated health care system in the U.S. It is mandated to serve as a backup to the DoD during disasters, and VHA CBOCs can play an important role.11,12 The CBOCs are staffed with a medical director, nurse manager, and other clinical and support staff. As a study population, CBOCs are well suited to examine and explore staff attitudes and roles in DM. To date, no research reports have been found studying EP in CBOCs.
The purpose of this study was to learn how to best integrate the CBOCs into disaster response. This qualitative study aimed to answer 3 questions: (1) How do VA clinic personnel perceive their personal and their clinic’s risk, level of preparedness, role, and knowledge for an active response in a disaster; (2) What do VA clinic personnel perceive they need in order to function in a disaster; and (3) What resources are necessary for clinic staff to function competently in a disaster?
Methods
In this qualitative study, in-depth semistructured key informant (KI) interviews (N = 3) and focus group discussions (N = 20) guided by risk perception theory and the Andersen Behavioral Model of Health Services Use were conducted and analyzed using grounded theory methods to contextualize the potential of local clinics in disaster response.13-15 To optimize breadth of viewpoints on this issue, participants were selected by theoretical sampling methods to explore perceptions of leadership and line staff.
Study Location
Health care providers and support staff from 3 southern California CBOCs that are contracted by the local VA to provide primary care services (ie, internal medicine, geriatrics, women’s health, mental health, and some specialty care services) to veterans were recruited for this study. The CBOCs are generally connected with a VHA local hospital in their region, offer services 5 days a week, and are closed on weekends and federal holidays. Some VA CBOCs participate in telehealth remote services connected to their regional hospital to help manage their patient populations. The CBOCs are managed by a medical director and a clinic manager and report to their respective VISN, and each VISN reports to the VHA Central Office in Washington, DC.13,15 The CBOC staff includes physicians, nurse practitioners, physician assistants, registered nurses (RNs), licensed vocational nurses (LVNs), medical assistants, front office staff, social workers, case managers, counselors, pharmacists, and nonclinical staff.
In this case, the CBOCs are contracted by Loma Linda University Health to manage care of the veterans and agree to care for nonveterans in a disaster. The CBOCs contracted or not all fall under the criteria as set forth in VHA Handbook 1006.1. This handbook criteria indicate that CBOCs must maintain appropriate emergency response capability. Additionally, VHA Handbook 0320.1 states that the CBOC is responsible for developing, implementing, evaluating, and improving a CBOC Comprehensive Emergency Management Program (CEMP) and for participating in the VAMC Emergency Management Committee. The scope of the VISN-wide CEMP integrates VAMC and VISN EM programs to coordinate and enhance operations during planned and unplanned events.
Study Design and Sample
After receiving institutional review board approval, 3 in-depth semi-structured clinic leadership KI interviews and 3 clinic staff (RNs, LVNs, health technicians, and nursing assistants) focus group discussions (N = 20, 1 per CBOC) to follow up on information gleaned from the analyses of the initial KIs were conducted. To provide continuity, all were conducted by the same trained facilitator who used a semistructured KI outline with questions and probes based on the guiding study framework.
Data Collection and Content Analysis
Interviews and focus group discussions were audio recorded and transcribed verbatim and then analyzed using grounded theory methods. Line-by-line coding was done to develop an initial inductive codebook, which was then organized into final codes. Once the codebook was developed, it was applied to all transcripts.
Related: Pre-Storm Dialysis Saves Lives
Transcripts and resulting codes were reviewed 3 times by independent reviewers to validate data, ensure accuracy, and delete any information that might identify participants. Pseudonyms were used to represent the participants by perspective (eg, nurse, MD) to avoid confusion in data analysis. A 4-stage data analysis approach was used: (1) immersion in the raw data by listening to tapes and reading manuscripts and notes in order to list key ideas and recurrent themes using a constant comparison method; (2) indexing by applying the thematic framework systematically to the data using and seeking new, unanticipated emerging codes; (3) arranging the data in codes and concepts/themes that represent the thematic framework of EP in clinics; (4) identifying a thematic framework for EP using codes that identified key issues, concepts, and themes that can be referenced and derived from the text.
Results
The Table describes the 4 primary emerging themes and corresponding quotes: (1) EP barriers, including lack of direction, training, and tools, which would result in negative outcomes; (2) perceived personal and clinic risk for a disaster, including negative outcomes and personal family safety; (3) perceptions of roles and responsibilities in EP, including intent to participate in DM at various staffing levels as well as patient expectations for care; and (4) existing resources that influence EP and the ability to survive a disaster collectively.
Emergency preparedness barriers. Although most respondents realized their potentially critical role in an emergency, they expressed recurrent barrier themes centered on their perceived lack of training, lack of tools to function, and lack of direction to be effective in a disaster response. Lack of knowledge of EP was identified as a great need by multiple participants. One participant stated, “Lack of information is so destructive. If you don’t know how to keep yourself from those things you don’t know…such as in a situation that’s going to be tragic, it is because of a lack of information or a lack of training. And I see that so many times…Mandate that we do our classes, so we know what we’re doing.” Another stated in reference to lack of skills, “I haven’t experienced any drills or anything like that. So I know what is going to happen here.”
Lack of abilities to communicate with key DM players also were identified. For example, “Downed power lines may result in no telephone connection to communicate next steps for critical issues, such as if evacuation of the clinic is required.” Another respondent indicated, “We need backup communication...devices, wind-up radios, or whatever.”
Lack of a clear disaster plan was also identified. Questions arose centered on details—how to actually implement a clinic response plan, including concerns that there were none, as the respondents “had not seen the plan in a couple of years” and were not sure who really was in charge of giving directions. Lack of community/organizational support voiced included aspects such as interdepartmental, facility, and community resource connectedness. There was acknowledgement that department assets should be clearly identified so that resource sharing might be used as part of the plan.
Last, regarding lack of resources, one participant said, “We don’t have the resources. We don’t have gurneys. We don’t have enough wheel chairs….We don’t have a crash cart. We don’t have the triage tarps or whatever for the triage of people; we don’t have any supplies to supply the energy room for diabetics, like what they have in the ER.”
Perceived personal and clinic risk for a disaster. Participants stated they felt at risk for natural disasters, including fire, floods, and earthquakes, but expressed concerns and even more fears about how they would handle a response to bombings, spills of hazardous materials, airplane accidents, and gunfire, which also qualify as disasters but are much harder to prepare for, because they could be so varied. One participated stated, “They are so unpredictable whether it is an earthquake or a fire…they are unpredictable….We see planes that fly close to our window and we wonder about the possibility of a crash—you never know.”
Many staff members expressed fear of what these disasters would mean to them in the clinic and to their patients. Another comment shared was, “I don’t think anybody really thinks about this kind of stuff until it happens and then it is too late…If we had just done this or that or knew how to do this or that then…” The biggest fear expressed was that of a massive earthquake in which there would be power outages and resulting fires, blocked building exits, and no way to get to evacuation areas. Fears expressed included working with people who are dying and trying to get the patients down the stairs and out of the disaster area.
Personal safety in a disaster was also a concern; a nurse stated, “Your personal safety is a priority. Yourself, that is first, if you are not safe, you can’t do any good to anyone else.” Another shared concern was the safety of family members during a disaster and conflicting obligations between duties at work and protecting family members. Participants felt they would want to be at home with their families.
Perceptions of roles and responsibilities in EP. Supervisors of the clinics shared that their primary responsibility is to the staff and their current patients; ensuring their safety was a top priority. Their knowledge, skills, and available resources were crucial to their duties, including establishing methods of communication outside the clinic for advice and direction, such as notifying the power company and other outside agencies of the condition of the clinic. They felt that their duties included making sure generators were working, ensuring telephones and lighting were available, and advising staff when to leave the building. One manager stated that more EP discussions need to happen in order to determine how to react: “...in event of a disaster it is important to control patient flow, staffing the clinic appropriately and managing the employees.” They felt a need to help empower their staff by making sure staff were trained in EP tasks and that they could complete the tasks they were required to perform.
Staff consistently reported that the doctors were in charge of providing direction concerning activities and care of the patients. However, most were able to identify their own role in helping preserve lives and keeping the patients and other staff safe. One nurse stated, “My job would be to evacuate the physicians’ offices, to make sure they are aware of the disaster, get them out safely, put an X on their door, keep the patients calm and guide them out to the designated area, then look out for medics or other help so that they would be directed to the correct locations.” Another staff nurse stated, “My role is to check the bathrooms and then under the direction of the physician assist in the care of patient injuries.”
When asked about the expectations of patients for care during a disaster, staff consistently stated that patients and their families would want to get care and direction from clinic staff who knew them instead of going to the hospital for care. Staff anticipated that patients would be calling the clinic first to discuss their medical problems. One stated, “The veterans would head to us…. We can’t turn them away.” Some staff indicated that some patients might have to go to the ED for care instead of coming to the clinic, because the clinic may not be equipped to respond, noting that “we have to remind [the patients] that in our clinic we have minimal abilities.”
Existing resources. Consistently, the respondents verbalized the importance of acquiring knowledge and skills and using available resources in their disaster plan. They felt that training was critical and that it needed to be simple and uncomplicated. Many felt that they did not have sufficient drills to maintain their knowledge and skills for all types of events. One nursing assistant stated he had extensive training in the military in DM, but clinics did not have sufficient training and were not prepared to handle multiple casualties. Others stated that it would be important for training to be “second nature” so they would not have to think much about it, with everyone pulling together and performing tasks seamlessly. However, some stated that they did not know what to do in an emergency.
Critical resources noted were access to emergency power sources, transistor radios, telephone and communication, 911 services, backup phone services, computers, and text pagers and cell phones so that connections could be made outside the clinic setting. Other critical resources needed included medical supplies and access to food for 1 week.
Finally, teamwork was identified as a critical factor for success. One example involved the clinic responding to a severe snowstorm; the medical director, lead nurse, and support staff agreed to remain on site to assist with any patients who needed help. “We shared our 4-wheel drive trucks to get around, and others called patients, advising them of storm conditions and what to do to maintain care at home and canceled appointments scheduled for that day.” They were very proud of the way they had pooled their resources to support each other and their patients.
Based on these emerging themes and the inquiry guiding theories, a theoretical framework was proposed on how contributing factors influenced the process by which CBOC staff viewed their roles and the likelihood that they would participate in a disaster plan (Figure). The framework suggests that personal risks and perceived personal and clinic readiness to respond to an emergency were critical barriers to staff willingness to get involved in preparedness, whereas they saw the provision of training and resources as necessary to increase their resilience and ability to function in a disaster.
Clearly addressing barriers through training, planning, ensuring that resources functioned effectively in a disaster, and clarifying roles and responsibilities, combined with promoting personal and clinic readiness facilitated staff EP participation.
Discussion
This qualitative study explored issues surrounding the role of CBOCs in EP and how risk perception and enabling factors contributed to staff intent to participate in DM. As in many qualitative studies, findings were somewhat limited by an overall small sample size (N = 23) across 3 CBOCs in southern California. However, given the lack of available literature, the authors believe that this study helped provide critical insight into CBOC clinic staff’s willingness and readiness to be active in disaster response. The study clearly points to clinic staff’s openness to actively take part in regional disaster response and calls for better and more standardized approaches to EP and DM planning that include local CBOCs. The authors identified factors that contribute to staff intent to participate in DM and the need to reduce barriers that hinder participation.
In general, clinic staff who reported feeling inadequately prepared for disasters (ie, felt more vulnerable) and staff with firsthand disaster experience were more inclined to prepare than were those without experience. Without clearly spelled-out expectations, staff tend to depend and wait on others to lead in a disaster. They noted a desire for better preparation and thus, clarity of roles, need for a reliable method of communication with the outside world during a disaster, and the required equipment and supplies for self-care or care of the patients for ≥ 3 days post disaster. Some indicated that they did not have the resources to provide medical care on the scale that may be required.
Many did not have a clear understanding of an all-hazard approach plan and had not been involved in hazard assessments. Already tightly staffed for personal health care delivery, staff spent minimal time and energy thinking about the risk of a disaster or preparing for one. However, there seemed to be a direct relationship between the attitude of the supervisor and the attitudes of clinic staff to EP. Although these qualitative results are encouraging and point to these clinics as an important undertapped resource for EP, further quantitative studies should expand this inquiry.
Lessons learned from this study include the need to expand qualitative data collection to include a larger sample size to retrieve information that would contribute to a better understanding of how staff view their roles in DM. There are 152 VAMCs and hundreds of associated CBOCs that should be queried as to their EM readiness. Also, replicating this study in non-VHA clinics, such as private CBOCs and PPPs, might bring greater insight into what is needed to involve them in DM plans. Finally, future studies should determine clearer criteria when care can be provided at a clinic and when it would be appropriate for the patient to report at their local ED.
Conclusions and Recommendations
Given the VHA EP mandate, the authors recommend the following steps to address barriers identified in this study: (1) Develop a more structured approach to DM in a CBOC setting to provide staff with a clear understanding of their roles and responsibilities; (2) Conduct a comprehensive assessment of each clinic to determine staff knowledge, skills, and resources required to provide EP and institute a DM training curriculum; (3) Provide clinic leadership with direction on developing a disaster plan as well as how to partner with their primary and local VA health care system, especially onsite physicians, to provide effective DM leadership; (4) Recruit staff into routine drills for natural disasters and expand to an all-hazard approach to manmade disasters to identify gaps in delivering DM in a disaster; (5) Facilitate partnerships and a standardized approach to DM between CBOCs within the VISN by scheduling routine video and teleconferencing, live meetings, and webinars so that procedures and language are clearly understood and communicated between facilities; and (6) Identify key barriers to clinic preparedness by assessing EP elements through mock disaster drills and offer solutions to fill DM gaps.
The authors also recommend that CBOCs should be included in community DM and EP plans in order to understand how to integrate resources in a disaster. Networking, planning, and interdisciplinary staff training between agencies to include CBOCs will bring a wealth of information of what CBOCs require to participate effectively in DM. Lessons learned from these partnerships can provide valuable information to facilitate resource allocation for acute care hospitals, which may be burdened with treating patients with minor medical issues when they should be focusing on providing care to those with catastrophic medical conditions.
Acknowledgments
This study and this material is the result of work supported with resources and the use of facilities at the VA Loma Linda Health Care System. Research in this publication was in part supported by the National Institute on Minority Health and Health Disparities of the National Institutes of Health under award number P20MD006988.
Author disclosures
The authors report no actual or potential conflicts of interest with regard to this article.
Disclaimer
The opinions expressed herein are those of the authors and do not necessarily reflect those of Federal Practitioner, Frontline Medical Communications Inc., the U.S. Government, or any of its agencies. This article may discuss unlabeled or investigational use of certain drugs. Please review complete prescribing information for specific drugs or drug combinations—including indications, contraindications, warnings, and adverse effects—before administering pharmacologic therapy to patients.
1. McNeill JB, Carafano JJ, Mayer MA, Weitz R. Accepting disaster relief from nations: lessons from Katrina and Gulf oil spill. The Heritage Foundation Website. http://www.heritage.org/research/reports/2011/02/accepting-disaster-relief-from-other-nations-lessons-from-katrina-and-the-gulf-oil-spill. Published February 17, 2011. Accessed July 16, 2015.
2. Haddow GD, Bullock JA. Introduction to Emergency Management. 2nd ed. Burlington, MA: Butterworth-Heinemann; 2006.
3. Institute of Medicine. Medical Surge Capacity: Workshop Summary. Washington, DC: The National Academies Press; 2010.
4. National Voluntary Organizations Active in Disasters. Federal Emergency Management Agency Website. http://www.ready.gov/voluntary-organizations-active-disaster. Updated June 19, 2014. Accessed July 10, 2015.
5. What is the role of police, fire and EMS after a natural disaster strikes? Galls Website. http://gallsblog.com/2011/08/29/what-is-the-role-of-police-fire-and-ems-after-a-natural-disaster-strikes. Published August 29, 2011. Accessed July 14, 2015.
6. Hogan DE, Waeckerle JF, Dire DJ, Lillibridge SR. Emergency department impact of the Oklahoma City terrorist bombing. Ann Emerg Med. 1999;34(2):160-167.
7. Carlson JN, Menegazzi JJ, Callaway CW. Magnitude of national ED visits and resource utilization by the uninsured. Am J Emerg Med. 2013;31(4):722-726.
8. Kahan E, Fogelman Y, Kitai E, Vinker S. Patient and family physician p for care and communication in the eventuality of anthrax terrorism. Fam Pract. 2003;20(4):441-442.
9. Chen FM, Hickner J, Fink KS, Galliher JM, Burstin H. On the front lines: family physicians’ preparedness for bioterrorism. J Fam Pract. 2002;51(9):745-750.
10. Wood K. Community health centers: the untapped resource for public health and medical preparedness. Homeland Secur Aff. 2009;5(8):113.
11. Koenig KL. Homeland security and public health: role of the Department of Veterans Affairs, the US Department of Homeland Security, and implications for the public health community. Prehosp Disaster Med. 2003;18(4):327-333.
12. Panangala SV, Mendez BHP. Veterans Health Administration: Community-Based Outpatient Clinics. Washington, DC: Library of Congress, Congressional Research Service; 2010.
13. Tashakkori A, Teddlie C, eds. Handbook of Mixed Methods in Social & Behavioral Research. Thousand Oaks, CA: Sage Publications, Inc.; 2003.
14. Barnett DJ, Balicer RD, Blodgett DW, et al. Applying risk perception theory to public health workforce preparedness training. J Public Health Manag Pract. 2005;Suppl:33-37.
15. Andersen RM. Revisiting the behavioral model and access to medical care: does it matter? J Health Soc Behav. 1995;36(1):1-10.

Colonic Dyspnea and the Morgagni Hernia: A Rare Adult Diagnosis
Congenital diaphragmatic hernias (CDHs) occur from a disruption in the muscular formation of the diaphragm, resulting in herniation of abdominal contents into the thoracic cavity. A rare diagnosis, most cases are identified in the pediatric and neonatal populations with an overall historical 50% mortality related to the diagnosis.1 More recent data published in the U.S. and Japan cite an overall survival rate of 67% to 80% secondary to improved understanding of the pathophysiology and subsequent enhancement of neonatal cardiopulmonary support adjuncts.2,3
Bochladek hernias (posterolateral space) are the most common presentation of CDH, accounting for > 90% of cases. First described by the Giovanni Batista Morgagni in On the Seats and Causes of Disease Investigated by Anatomy, the anteromedial sternocostal location is far less common and accounts for only 2% to 3% of cases.4,5 More commonly found on the right side of the diaphragm, despite protection from the liver, the right-sided space has been traditionally referred to as the Morgagni space. A left-sided defect is occasionally called the Larrey gap or space, after Napoleon’s surgeon who described the space as a potential location for pericardial drainage of tamponade.6,7
Related: Colonoscopy Bowel Preparation Instructions
There are a few congenital conditions, such as trisomy 21, Turner syndrome, Prader Willi syndrome, dextrocardia, and Tetralogy of Fallot, that have been associated with Morgagni hernias.7 Pulmonary hypertension and respiratory distress are the most common symptoms for neonatal patients; chest pain, sensations of tightness/fullness, reflux, and transient obstructive symptoms constitute the typical symptoms of adult patients with CDH. In this case study, the authors present a case of adult-onset Morgagni hernia as well as a review of the relevant literature.
Case Report
The patient was a 48-year-old man on active-duty who presented to the Naval Medical Center Portsmouth General Surgery clinic in Virginia with a 4-year history of gastroesophageal reflux-related symptoms. Specifically, he reported epigastric fullness, pyrosis, and discomfort that radiated toward his bilateral lower ribs for the previous 4 years. This discomfort was typically associated with the intake of solid food and was followed a few hours later by a loose bowel movement.
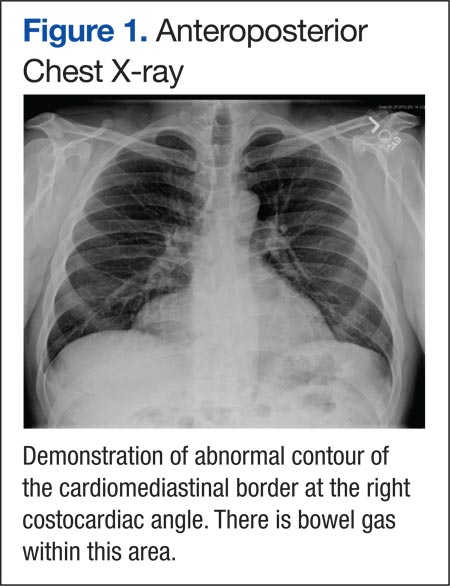
The patient was initially treated with antacids and proton pump inhibitors by his primary care physician, with only minimal relief. He also reported several months of chronic cough as well as intermittent episodes of “gasping air hunger” for about 6 years, which had been incidentally brought up during his separation physical examination. A chest X-ray performed during the workup revealed findings suggesting a right diaphragmatic hernia vs a bronchogenic cyst (Figure 1). A computed tomography (CT) of the thorax demonstrated a 3 x 8-cm hernia through the foramen of Morgagni containing a portion of the transverse colon along with intraperitoneal fat (Figures 2 and 3). 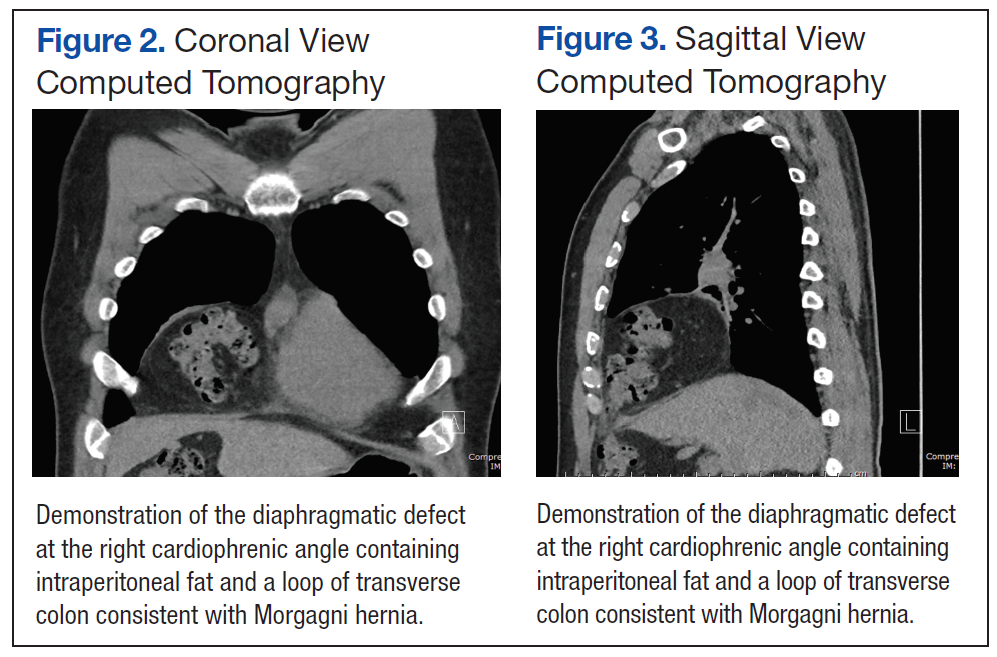
The patient underwent repair of this right Morgagni hernia via a laparoscopic approach. Intraoperative findings confirmed preoperative radiologic studies demonstrating colonic and omental contents within an easily reducible hernia sac (Figures 4 and 5). The hernia sac was left in vivo, and a combined direct hernia repair with mesh reinforcement was performed using Surgimesh XB (BG Medical, Barrington, IL) (Figure 6). The patient remained in the hospital for overnight observation and was discharged on postoperative day 1. The patient has since been seen in follow-up and is doing quite well with complete resolution of his reflux and pulmonary symptoms.

Discussion
A recent review of surgical literature revealed that over a 57-year period, 298 cases of Morgagni hernias have been described in adults.7 Although previous studies have postulated that a majority of adult patients are asymptomatic, more recent retrospective studies have found about a 70% symptomatic rate of patients with Morgagni hernias.7 The natural history of adult presentations lends itself to pulmonary (most common) or chronic upper gastrointestinal symptoms, although an acute presentation with potential volvulus and strangulation of the herniated contents has been described.7
Diagnosis is typically confirmed with a chest X-ray, although the CT scan has become more popular in the era of multimodal imaging.4,7 Multiple methods of repair have been described; however, thoracotomy has been the most widely used approach, and laparoscopy has gained popularity since the early 1990s.7 Mesh has been described in more than 60% of cases, and a laparoscopic repair has proven to have a low (< 5%) complication rate and short hospital stay.8,9 In particular, it has been suggested that a hernia defect larger than 20 to 30 cm2 should be repaired with a prosthetic adjunct, such as polypropylene, polytetrafluoroethylene, and bovine pericardium with a 1.5- to 2.5-cm mesh overlap.7,8
Related: Unusual Congenital Pulmonary Anomaly in an Adult Patient With Dyspnea
There is some controversy about the management of the hernia sac, with about 69% of surgeons choosing not to excise the sac due to concerns of intrathoracic or pericardial injury.7 In a separate study, 36 patients were evaluated retrospectively, and the hernia sac was not resected in any of the patients, with long-term follow-up revealing no evidence of recurrence.6
Conclusion
To allow for early intervention and avoidance of potentially life-threatening volvulus/strangulation, the medical practitioner has to be aware of this rare diagnosis when performing a workup for vague pulmonary and abdominal symptoms as described here. Disagreement exists over the method of repair and management of the hernia sac as well as the need for mesh buttressing of the defect. A well-planned surgical approach individualized to the patient’s anatomy, surgeon’s expertise, and hernia defect size will provide the best possible outcome with a low operative morbidity.
Author disclosures
The authors report no actual or potential conflicts of interest with regard to this article.
Disclaimer
The opinions expressed herein are those of the authors and do not necessarily reflect those of Federal Practitioner, Frontline Medical Communications Inc., the U.S. Government, or any of its agencies. This article may discuss unlabeled or investigational use of certain drugs. Please review the complete prescribing information for specific drugs or drug combinations—including indications, contraindications, warnings, and adverse effects—before administering pharmacologic therapy to patients.
1. Holcomb GW, Murphy JP. Ashcraft’s Pediatric Surgery. 5th ed. Kansas City: Saunders Elsevier; 2010: 319-320.
2. Haroon, J, Chamberlain RS. An evidence-based review of the current treatment of congenital diaphragmatic hernia. Clin Pediatr (Phila). 2013;52(2):115-124.
3. Nagata K, Usui N, Kanamori Y, et al. The current profile and outcome of congenital diaphragmatic hernia: a nationwide survey in Japan. J Pediatr Surg. 2013;48(4):738-744.
4. Abraham V, Myla Y, Verghese S, Chandran BS. Morgagni-larrey hernia—a review of 20 cases. Indian J Surg. 2012;74(5):391-395.
5. Arora S, Haji A, Ng P. Adult Morgagni hernia: the need for clinical awareness, early diagnosis, and prompt surgical intervention. Ann R Coll Surg Engl. 2008;90(8):694-695.
6. Aghajanzadeh M, Khadem S, Khajeh Jahromi S, Gorabi HE, Ebrahimi H, Maafi AA. Clinical presentation and operative repair of Morgagni hernia. Interact Cardiovasc Thorac Surg. 2012;15(4):608-611.
7. Horton JD, Hofmann LJ, Hetz SP. Presentation and management of Morgagni hernias in adults: a review of 298 cases. Surg Endosc. 2008;22(6):1413-1420.
8. Terrosu G, Brizzolari M, Intini S, Cattin F, Bresadola V, De Anna D. Morgagni hernia: technical variation in the laparoscopic treatment. Ann Ital Chir. 2012;83(5):415-420.
9. Durak E, Gur S, Cokmez A, Atahan K, Zahtz E, Tarcan E. Laparoscopic repair of Morgagni hernia. Hernia. 2007;11(3):265-270.
Congenital diaphragmatic hernias (CDHs) occur from a disruption in the muscular formation of the diaphragm, resulting in herniation of abdominal contents into the thoracic cavity. A rare diagnosis, most cases are identified in the pediatric and neonatal populations with an overall historical 50% mortality related to the diagnosis.1 More recent data published in the U.S. and Japan cite an overall survival rate of 67% to 80% secondary to improved understanding of the pathophysiology and subsequent enhancement of neonatal cardiopulmonary support adjuncts.2,3
Bochladek hernias (posterolateral space) are the most common presentation of CDH, accounting for > 90% of cases. First described by the Giovanni Batista Morgagni in On the Seats and Causes of Disease Investigated by Anatomy, the anteromedial sternocostal location is far less common and accounts for only 2% to 3% of cases.4,5 More commonly found on the right side of the diaphragm, despite protection from the liver, the right-sided space has been traditionally referred to as the Morgagni space. A left-sided defect is occasionally called the Larrey gap or space, after Napoleon’s surgeon who described the space as a potential location for pericardial drainage of tamponade.6,7
Related: Colonoscopy Bowel Preparation Instructions
There are a few congenital conditions, such as trisomy 21, Turner syndrome, Prader Willi syndrome, dextrocardia, and Tetralogy of Fallot, that have been associated with Morgagni hernias.7 Pulmonary hypertension and respiratory distress are the most common symptoms for neonatal patients; chest pain, sensations of tightness/fullness, reflux, and transient obstructive symptoms constitute the typical symptoms of adult patients with CDH. In this case study, the authors present a case of adult-onset Morgagni hernia as well as a review of the relevant literature.
Case Report
The patient was a 48-year-old man on active-duty who presented to the Naval Medical Center Portsmouth General Surgery clinic in Virginia with a 4-year history of gastroesophageal reflux-related symptoms. Specifically, he reported epigastric fullness, pyrosis, and discomfort that radiated toward his bilateral lower ribs for the previous 4 years. This discomfort was typically associated with the intake of solid food and was followed a few hours later by a loose bowel movement.
The patient was initially treated with antacids and proton pump inhibitors by his primary care physician, with only minimal relief. He also reported several months of chronic cough as well as intermittent episodes of “gasping air hunger” for about 6 years, which had been incidentally brought up during his separation physical examination. A chest X-ray performed during the workup revealed findings suggesting a right diaphragmatic hernia vs a bronchogenic cyst (Figure 1). A computed tomography (CT) of the thorax demonstrated a 3 x 8-cm hernia through the foramen of Morgagni containing a portion of the transverse colon along with intraperitoneal fat (Figures 2 and 3).
The patient underwent repair of this right Morgagni hernia via a laparoscopic approach. Intraoperative findings confirmed preoperative radiologic studies demonstrating colonic and omental contents within an easily reducible hernia sac (Figures 4 and 5). The hernia sac was left in vivo, and a combined direct hernia repair with mesh reinforcement was performed using Surgimesh XB (BG Medical, Barrington, IL) (Figure 6). The patient remained in the hospital for overnight observation and was discharged on postoperative day 1. The patient has since been seen in follow-up and is doing quite well with complete resolution of his reflux and pulmonary symptoms.
Discussion
A recent review of surgical literature revealed that over a 57-year period, 298 cases of Morgagni hernias have been described in adults.7 Although previous studies have postulated that a majority of adult patients are asymptomatic, more recent retrospective studies have found about a 70% symptomatic rate of patients with Morgagni hernias.7 The natural history of adult presentations lends itself to pulmonary (most common) or chronic upper gastrointestinal symptoms, although an acute presentation with potential volvulus and strangulation of the herniated contents has been described.7
Diagnosis is typically confirmed with a chest X-ray, although the CT scan has become more popular in the era of multimodal imaging.4,7 Multiple methods of repair have been described; however, thoracotomy has been the most widely used approach, and laparoscopy has gained popularity since the early 1990s.7 Mesh has been described in more than 60% of cases, and a laparoscopic repair has proven to have a low (< 5%) complication rate and short hospital stay.8,9 In particular, it has been suggested that a hernia defect larger than 20 to 30 cm2 should be repaired with a prosthetic adjunct, such as polypropylene, polytetrafluoroethylene, and bovine pericardium with a 1.5- to 2.5-cm mesh overlap.7,8
Related: Unusual Congenital Pulmonary Anomaly in an Adult Patient With Dyspnea
There is some controversy about the management of the hernia sac, with about 69% of surgeons choosing not to excise the sac due to concerns of intrathoracic or pericardial injury.7 In a separate study, 36 patients were evaluated retrospectively, and the hernia sac was not resected in any of the patients, with long-term follow-up revealing no evidence of recurrence.6
Conclusion
To allow for early intervention and avoidance of potentially life-threatening volvulus/strangulation, the medical practitioner has to be aware of this rare diagnosis when performing a workup for vague pulmonary and abdominal symptoms as described here. Disagreement exists over the method of repair and management of the hernia sac as well as the need for mesh buttressing of the defect. A well-planned surgical approach individualized to the patient’s anatomy, surgeon’s expertise, and hernia defect size will provide the best possible outcome with a low operative morbidity.
Author disclosures
The authors report no actual or potential conflicts of interest with regard to this article.
Disclaimer
The opinions expressed herein are those of the authors and do not necessarily reflect those of Federal Practitioner, Frontline Medical Communications Inc., the U.S. Government, or any of its agencies. This article may discuss unlabeled or investigational use of certain drugs. Please review the complete prescribing information for specific drugs or drug combinations—including indications, contraindications, warnings, and adverse effects—before administering pharmacologic therapy to patients.
1. Holcomb GW, Murphy JP. Ashcraft’s Pediatric Surgery. 5th ed. Kansas City: Saunders Elsevier; 2010: 319-320.
2. Haroon, J, Chamberlain RS. An evidence-based review of the current treatment of congenital diaphragmatic hernia. Clin Pediatr (Phila). 2013;52(2):115-124.
3. Nagata K, Usui N, Kanamori Y, et al. The current profile and outcome of congenital diaphragmatic hernia: a nationwide survey in Japan. J Pediatr Surg. 2013;48(4):738-744.
4. Abraham V, Myla Y, Verghese S, Chandran BS. Morgagni-larrey hernia—a review of 20 cases. Indian J Surg. 2012;74(5):391-395.
5. Arora S, Haji A, Ng P. Adult Morgagni hernia: the need for clinical awareness, early diagnosis, and prompt surgical intervention. Ann R Coll Surg Engl. 2008;90(8):694-695.
6. Aghajanzadeh M, Khadem S, Khajeh Jahromi S, Gorabi HE, Ebrahimi H, Maafi AA. Clinical presentation and operative repair of Morgagni hernia. Interact Cardiovasc Thorac Surg. 2012;15(4):608-611.
7. Horton JD, Hofmann LJ, Hetz SP. Presentation and management of Morgagni hernias in adults: a review of 298 cases. Surg Endosc. 2008;22(6):1413-1420.
8. Terrosu G, Brizzolari M, Intini S, Cattin F, Bresadola V, De Anna D. Morgagni hernia: technical variation in the laparoscopic treatment. Ann Ital Chir. 2012;83(5):415-420.
9. Durak E, Gur S, Cokmez A, Atahan K, Zahtz E, Tarcan E. Laparoscopic repair of Morgagni hernia. Hernia. 2007;11(3):265-270.
A Multidisciplinary Chronic Pain Management Clinic in an Indian Health Service Facility
The epidemic of opioid abuse, addiction, and overdose deaths across the U.S. has not forgone the reservations of American Indian/Alaska Native (AI/AN) tribes. Indeed, AI/ANs may be at increased risk for abuse of prescription opioids due to higher rates of reported illicit drug use and misuse of opioids. According to the 2012 National Survey on Drug Use and Mental Health, AI/ANs aged ≥ 12 years had the highest rates of illicit drug use (12.7%) with the national average being only 9.5%.1 In 2009, AI/ANs aged 12 to 17 years were found to have the highest rates of marijuana use (13.8%) and nonmedical prescription drug abuse (6.1%) compared with the overall U.S. averages of 6.9% and 3.3%, respectively, putting them at an increased risk for an opioid overdose.1,2
In 2010, the American Pain Society conducted a survey establishing that about 41% of American adults reported having chronic, recurrent, or long-lasting pain.3 People of AI/AN heritage may experience chronic pain at higher rates, as they were identified as having the greatest incidence rates of low back pain (35%), arthritis (25%), and obesity (40%), which are often significant contributing factors to chronic pain.4-6
These conditions suggest a need for intensified management of chronic pain among IHS patients. The authors’ IHS facility is a closed health-system network where pharmacists are integral components of the health care team throughout the ambulatory care, emergency, and inpatient departments.
Related: Pharmacist Pain E-Consults That Result in a Therapy Change
Given that medications play a central role in the treatment of chronic pain, pharmacists are appropriate leaders for chronic pain management teams. Pharmacists can improve patient outcomes by conducting pain assessments, managing adverse events (AEs), identifying optimal medication choices, determining equianalgesic dosing, and managing care through care protocols.7
The primary objective of the multidisciplinary chronic pain management clinic (MCPMC) is to manage complicated and postsurgical patients, using a multimodal approach. Primary care providers (PCPs), which include physicians, nurse practitioners (NPs), physician assistants (PAs), and pharmacist providers collaborate to meet this goal by minimizing disease progression, preserving activities of daily living (ADL), maintaing employment, preventing an increase in pain, using treatment plans that include pharmacologic, interventional, and complementary components, decreasing emergency department (ED) visits for chronic pain issues, improving pain agreement adherence, managing AEs, performing drug abuse and diversion surveillance, and using sustained-release (SR) opioids when appropriate. Sustained release opioids not only ease dosing schedules and increase adherence, but also improve sleep, functionality, and quality of life (QOL) for chronic pain patients.8
Methods
The MCPMC began enrolling patients in January 2011 and has continued to date. Inclusion criterion is the presence of pain lasting 3 months or more. Exclusionary criteria are the presence of malignant pain, aged < 18 years, pregnancy, unmanaged psychiatric disorders, and a referral not approved by a PCP. Referrals are accepted from providers throughout the facility, including the ED, which then require approval by the PCP before enrollment. The PCP continues to manage these patients through consultations with the MCPMC pharmacists following MCPMC appointments and at separate ambulatory care clinic appointments.
Currently, there are 2 pharmacists practicing in the MCPMC clinic in conjunction with other health care providers, including 5 physical therapists, 1 psychiatrist, 2 clinical social workers, and 15 PCPs, including NPs and PAs. Additionally in 2014, the clinic became a yearlong rotation in the PGY-1 pharmacy practice residency.
Related: Evaluation of Methadone-Induced QTc Prolongation in a Veteran Population
After enrollment, a pharmacist reviews patients’ health records for past pain medications, interventional and complementary treatments, adherence to these treatments, recent ED visits and medications received, urine toxicology results, adherence to pain agreements, and the Arizona Controlled Substances Prescription Monitoring Program Database (ACSPMPD).
During the initial MCPMC appointment, a pain assessment questionnaire (PAQ) is completed with a MCPMC pharmacist. The questionnaire, designed specifically for the MCPMC, consists of a comprehensive pain assessment, including functional status and common comorbidities, such as anxiety, depression, obesity, and insomnia. Patients provide feedback on efficacy of past or current medications, and interventional and complementary treatments if applicable. Patients also rate their satisfaction with health care received and develop goals for their treatment and overall health.
A collaborative treatment plan is then developed with the patient’s PCP. Treatment plans often consist of increasing or starting interventional and complementary treatments, SR opioids, and adjuvant medications. Common adjuvant medications include nonsteroidal anti-inflammatory drugs (NSAIDs), antidepressants, antiepileptics, immunosuppressants, disease-modifying antirheumatic drugs (DMARDs), and topical agents. To maximize benefits of the medications, antidepressants are often prescribed for dual purposes among patients with comorbid conditions, such as anxiety, depression, and insomnia. Among obese patients, weight loss is encouraged, and patients may be referred to dietary counseling and exercise programs. Other intentions of the treatment plans are to decrease breakthrough pain and ED visits while attempting to decrease the use of immediate-release (IR) opioids. Treatment plans are executed in a stepwise approach over multiple MCPMC visits and may be modified throughout the course of the program.
To ensure that medication changes and other issues can be addressed when a prescriber is available, all subsequent visits are scheduled when patients are due for a pain medication refill. The MCPMC pharmacists chose not to pursue prescriptive authority but have privileges to order urine toxicology tests, make nonformulary requests, and refer patients for complementary treatments. Subsequent appointments are commonly scheduled 1 to 4 weeks apart or alternate with PCP appointments.
Related: Multidisciplinary Approach to Back Pain
During each appointment, data are collected to record changes in therapy and pain levels. Questions regarding general health and adherence to pharmacologic, interventional, and complementary treatments, exercise regimens, and specialty referrals are asked of all patients. Additionally, follow-up PAQs are completed every 6 months to track progress in therapy, pain control, treatment plan adherence, and patient satisfaction. To determine pain agreement adherence, the ACSPMPD is reviewed monthly, and urine toxicology tests and pill counts are performed randomly at MCPMC visits.
In October 2013, all PCPs who had patients in the clinic completed a survey to assess their perception of the MCPMC. Questions were related to their satisfaction with the clinic as well as their opinion of patients’ satisfaction. Other questions were related to their view of patient care and outcomes compared with those of the general chronic pain patients at the facility.
Results
As of January 2013, 106 patients had been referred to the MCPMC by 17 PCPs. Thirty-six of these patients were still actively participating in the clinic, while 25 were pending review. Of the remaining 45 patients, 30 were denied initial enrollment, and 15 were disenrolled from the clinic over the previous 2 years. Patients were determined to be inappropriate candidates and not enrolled in the clinic for the following reasons: referral not approved by the PCP, patient refused care, patient had not established care with a PCP, mental health issues, pediatric patient, oncology patient, and death prior to the initial review. Patients were disenrolled from the MCPMC clinic before 2013 for the following reasons: not participating in their treatment plan, illicit drug use, seeking care from other PCPs, suspected diversion, death due to a nonpain-related issue, and remained stable on the medication regimen and were released back to the care of their PCP.
In 2013, there were 47 new referrals to the MCPMC, resulting in a total of 153 referrals since the clinic’s 2011 inception. Over the course of 2013, 31 new patients were enrolled, 32 referrals were denied (15 of which remained from 2012), and 36 patients were disenrolled (Figure 1). At the end of 2013, 31 patients remained active, while 9 referrals remained pending review. A total of 67 patients participated in the MCPMC at some point during 2013 and were included in the data collection. Patients by diagnoses are displayed in Figure 2.
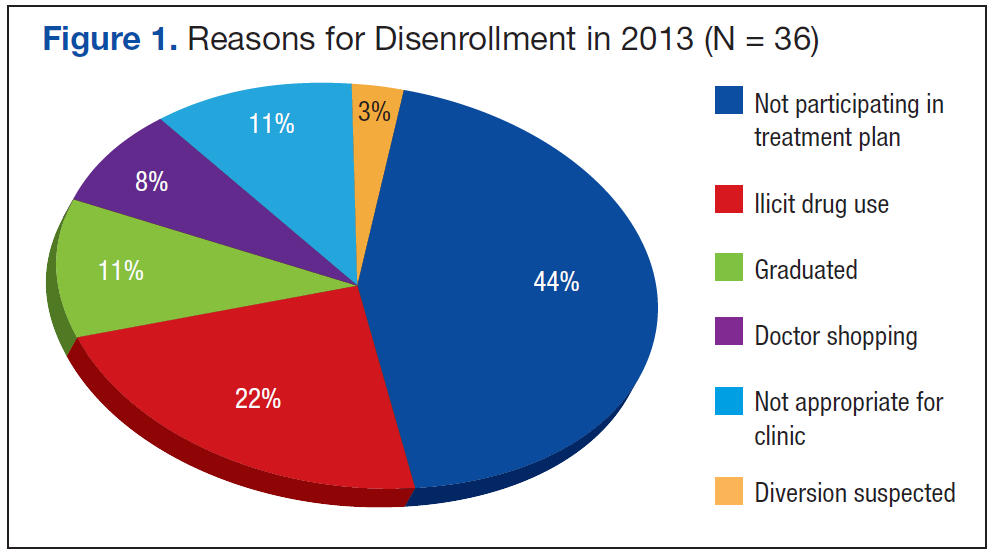
In 2013, patients were scheduled for a total of 337 MCPMC appointments, and 298 (88%) were completed by patients, a 17% increase above 2012. The mean show rate of PCP ambulatory care clinic appointments was about 70%. The completed MCPMC visits for 2013 correlates to about 6.8 MCPMC visits annually per patient. Of the 67 patients included in data collection, the mean total number of months active in the clinic was 12.5. The mean number of months active in the clinic in 2013 was 6.9.
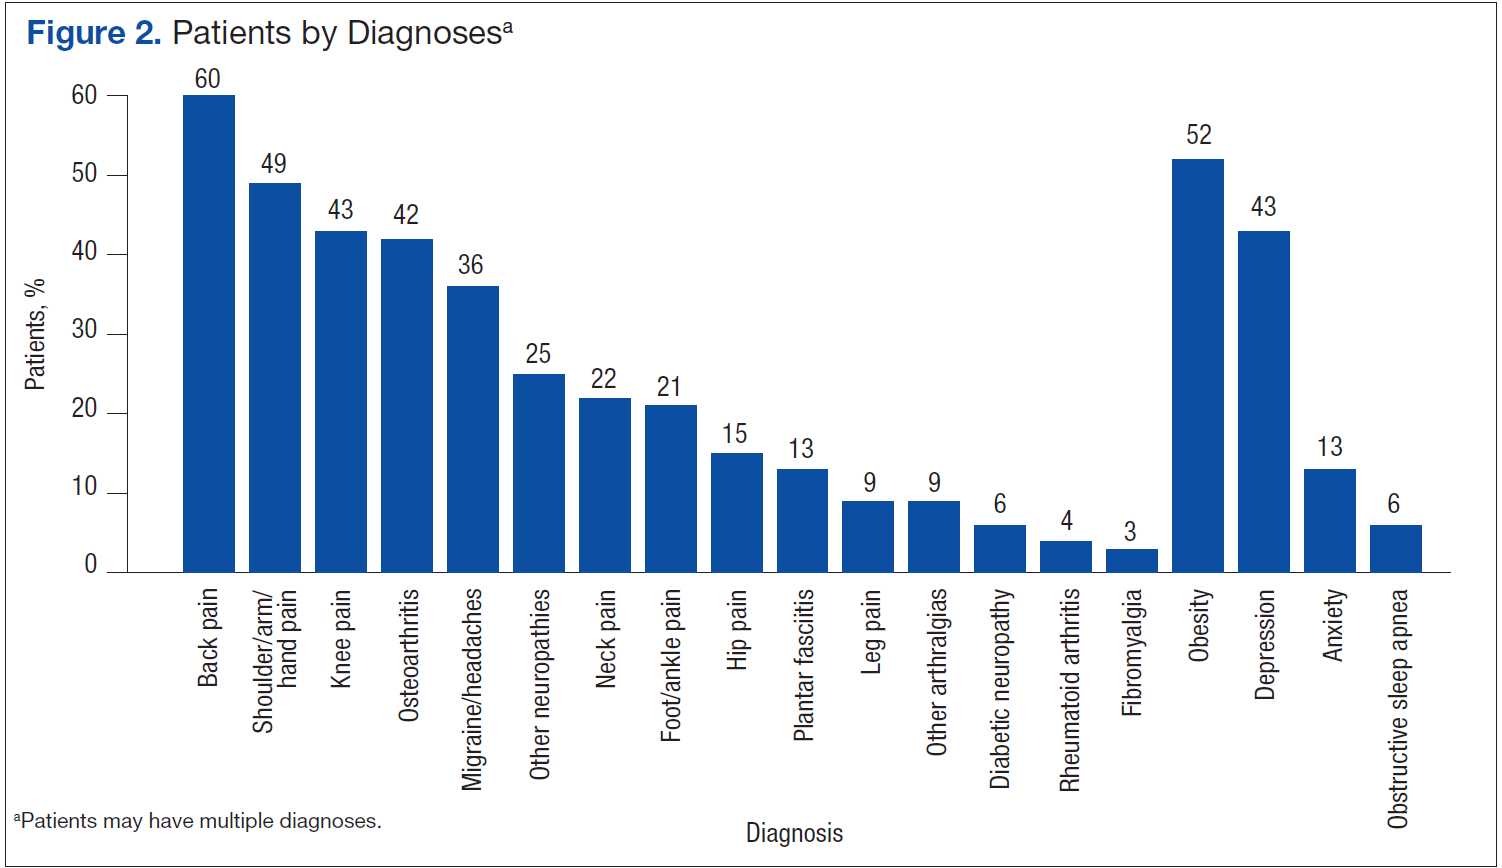
Pain Assessment Questionnaire
In 2013, 27 patients (40%) were enrolled in the clinic for 6 months or more and completed a follow-up PAQ. Throughout 2013, MCPMC patients presented to the ED for care 76 times, which correlates to about 1.8 ED visits annually per patient. MCPMC patients also attended an appointment with their PCP on average 3.7 times per year and provided urine toxicology tests on average 4.3 times per year between MCPMC and PCP visits.
Data collected from follow-up PAQs in January 2014 provided information on the 27 MCPMC patients enrolled in the clinic for 6 months or more. This review indicated alterations in patients’ reported pain levels, functional status, patient satisfaction, and adherence to pain agreements from before and after enrollment in the clinic. Additional information was collected using the electronic health record to reveal the adjustments in treatment plans, including pharmacologic, complementary, and interventional treatments, along with adherence to these treatments.
Patients’ self-reported pain levels at the time of appointment and average pain levels since the previous appointment were documented at each visit for the 27 MCPMC patients. These 2 pain levels were then compared with the levels of the initial assessment and the most recent appointment. Results were inconsistent; however, slight trends were observed with the analysis. The mean change in pain reported at the time of assessment decreased 5.1%. The mean change in average reported pain since the previous appointment also decreased 6.9%. Statistical analysis was performed using the Wilcoxon signed rank test. Both decreases in reported pain were not clinically or statistically significant (P = .21 and P = .17, respectively). Eleven (41%) patients had improvement in average pain, whereas 10 (37%) had no change, and 6 (22%) reported increased average pain levels.
Data on alterations in functional status and ADL were also collected from the 27 MCPMC patients. These patients reported the perceived degree of difficulty, on a scale of 1 to 5, required to complete tasks and get through their day. A rating of 1 represented the ability to complete activities with no difficulty, whereas 5 represented an inability to complete the tasks. For each of the 19 tasks, the differences in scores from the initial to the most recent PAQs were recorded as either a positive or negative alteration for each patient, and the sum of these differences was recorded as an overall positive or negative change in function. A positive change in function indicated an improvement in function, whereas an overall negative change indicated a decrease in ability to complete daily activities.
Twenty-six percent of the 27 pa-tients had a cumulative positive change of up to 5 points, and 19% had a positive change of 6 or more points. Alternatively, 22% of patients had a cumulative negative change of up to 5 points, and 33% of patients had a negative change of 6 points or more. The greatest positive change was 15 points, the greatest negative change was 28 points, and the median change from the initial to the most recent assessments was a negative change of 2 points.
Adjuvant Medications
The pharmacologic component of the treatment plans consisted primarily of optimizing the use of adjuvant medications and SR opioids when appropriate, while minimizing the use of IR opioids and other controlled medications. Of the 67 MCPMC patients in 2013, 55% were on IR opioids alone, a slight increase from 46% in 2012 (Table 1). Eighty-one percent of patients in this group were on ≤ 15 mg of morphine equivalent daily dose (MEDD), which would have required at least a doubling of their dose to initiate the preferred formulary SR opioid, morphine SR tablets. Six percent of patients were on SR opioids alone, also a slight increase from 3% in 2012. Twenty-seven percent of patients were prescribed a combination of IR and SR opioids. Nine percent of patients had been recently transitioned to SR opioids while in the MCPMC, of which 1 patient was prescribed the medication as monotherapy. Twelve percent of patients were not on any opioid therapy throughout 2013.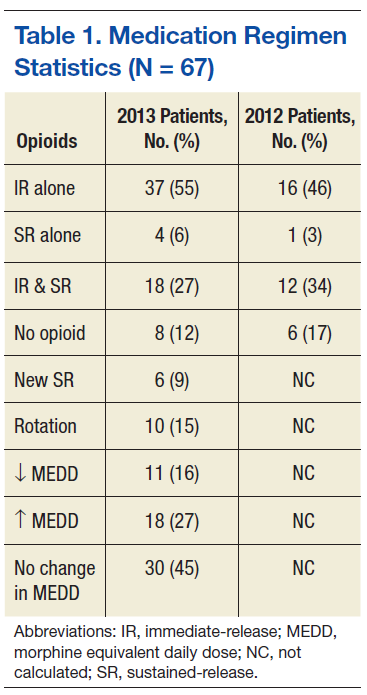
Opioids were switched to an alternative opioid at some point during the year to minimize tolerance in 15% of patients, of which 9% were IR and 6% were SR opioids. Changes in opioid therapy from the beginning to the end of the year were recorded as a decrease, increase, or no change in MEDD. Doses were decreased for 16%, increased for 27%, and not changed for the remaining 45% of patients. The sum of these changes for the 59 patients on opioids was a decrease of 172 mg MEDD or, on average, a decrease of about 3 mg MEDD per patient. Throughout the year, 36 patients were disenrolled from the clinic, and a total of 941 mg MEDD were discontinued by patients’ PCPs. This resulted in a mean of about 26 mg MEDD discontinued per patient. These statistics demonstrate small trends in decreasing overall MEDD in MCPMC patients.
Adjunctive therapies were often used in 67 MCPMC patients in addition to their opioid medications. If possible, therapies for pain management were chosen to maximize the ability to benefit comorbidities, such as depression, anxiety, and insomnia, while also treating chronic pain. The most frequently prescribed class of medications was antidepressants with 63% of patients prescribed one or more: bupropion, serotonin-norepinephrine reuptake inhibitor, selective-serotonin reuptake inhibitor, and tricyclic antidepressants. The next top 3 medication classes after antidepressants were topical medications (54%), antiepileptics (48%), and muscle relaxers (42%). The single most frequently prescribed adjunctive medication was gabapentin (37%), an antiepileptic.
Complementary Treatments
Complementary treatment referrals were followed throughout 2013 and compared with referrals from 2012 (Table 2). Physical therapy (PT) and exercise programs continued to be the most frequently referred treatment programs within the facility. Fifty-two percent of 67 MCPMC patients did not attend any PT appointments as recommended, of which the majority were required to attend as a component of their pain agreement. Of the remaining patients referred to PT, 48% went to their initial visit, 40% attended a second, and 32% attended 3 or more appointments. Of the group that attended 3 or more appointments, patients completed about 70% of the overall scheduled appointments, which was below the facility averages of 75% in 2012 and 80% in 2013. 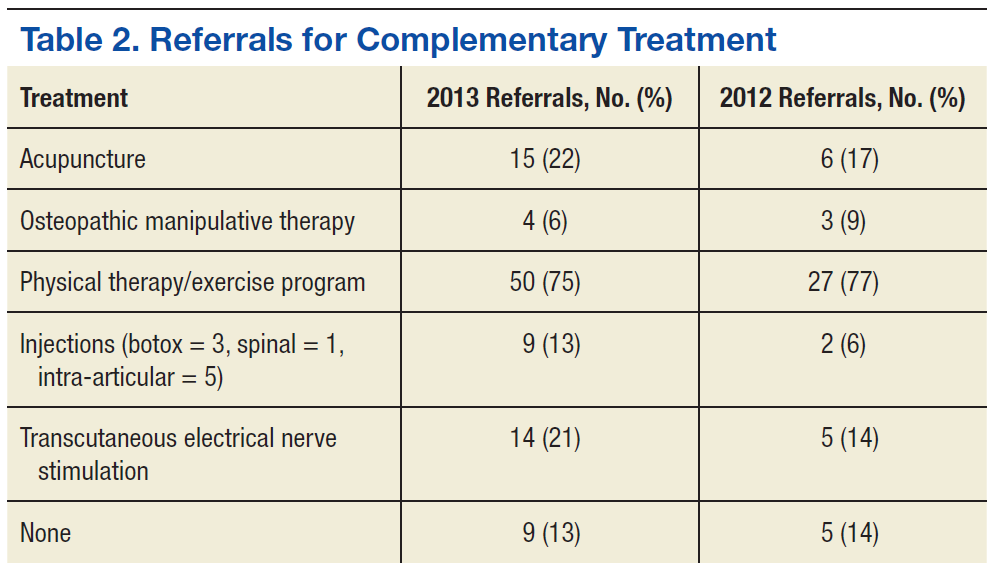
Acupuncture, transcutaneous electrical nerve stimulation, and osteopathic manipulative therapy (OMT) were much less frequently suggested treatments, with percentages of patient referrals of 22%, 21%, and 6%, respectively. Sixty percent of patients referred to acupuncture attended the initial visit, 47% attended a second, and 40% attended 3 or more appointments. Of this group that attended at least 3 appointments, patients completed 75% of scheduled appointments, which was also below the facility averages of 86% in 2012 and 81% in 2013. Only 50% of patients referred to OMT attended the initial visit, of which these patients completed 100% of their scheduled appointments. This rate of attendance was above the facility averages of 60% in 2012 and 68% in 2013. Thirteen percent of patients were referred for interventional pain management and completed 1 of 3 types of injections (onabotulinumtoxinA, spinal, or intra-articular). There was a slight decrease in patients without complementary treatment referrals from 14% in 2012 to 13% in 2013.
Adherence
Pain agreement adherence was determined by assessing ED visits, urine toxicology results, and ACSPMPD search results. Sixty-one percent of the 67 MCPMC patients did not seek care in the ED, whereas 12% had 1 visit in 2013. This decrease in frequency of ED visits was significant compared with these same MCPMC patients from prior to participation in the clinic. The mean ED patient visits per year decreased from 5.1 to 1.8.
Urine toxicology tests were completed on 54 of the 67 MCPMC patients in 2013. Overall, urine toxicology reports were determined to be appropriate at the initial review 51% of the time, with 30% of patients having all of their reports completely appropriate. Of the 54 patients, 35% were disenrolled for inappropriate urine toxicology reports for the following reasons: negative for opioids, positive for opioids without a prescription, positive for amphetamines with additional confirmation testing, and positive for barbiturates without a prescription. Six percent of patients were discovered to have trace amphetamine results that were sent out for confirmation, but these reports were found to be negative, thus confirming an initial false-positive result.
Forty-eight percent of MCPMC patients tested negative for opioids at some point during the year when they were expected to have positive results. Of this group, 31% were prescribed morphine; the remaining patients were prescribed synthetic or semisynthetic opioids that are known to cause false-negative results: fentanyl (4%), hydrocodone (50%), and oxycodone (15%).9 Twenty-two percent of patients were disenrolled from the clinic for testing negative for opioids. The reason for disenrollment was often in conjunction with other behaviors that resulted in violations of their pain agreement. The remaining 78% reported running out of pain medications early and remained in the clinic. Two percent of patients were discovered to have a positive opioid result when it was expected to be negative. This group reported finding previously prescribed medications and subsequent results were appropriate, thus they remained in the clinic. Lastly, 2% of patients tested negative for barbiturates when it was expected to be positive. These patients reported running out of pain medication early as well.
The ACSPMPD was also used to assess pain agreement adherencee for all MCPMC patients. Six percent of patients were identified as seeking care from providers outside the IHS facility and receiving prescriptions for opioid medications, thus violating their pain agreements. Seventy-five percent of these patients were disenrolled from the MCPMC for this reason. PCPs referred the other 25% of patients, and the outside prescribers had performed procedures on them. These patients were reminded of their pain agreements, and no further violations were discovered according to the database. Each patient’s status in the MCPMC was evaluated on a case-by-case basis, and often decisions to disenroll or continue treating patients were based on the PCP’s clinical judgment.
Patient satisfaction was measured in the follow-up PAQ by asking 27 patients how they felt about their care, using a typical 5-point Likert scale. The 2 statements were, “I am pleased with the care that I have received for my pain,” and “I believe that I am receiving the best health care available.” Seventy percent of patients answered “strongly agree” or “agree” to the first statement, and 67% of patients answered the same for the second statement. Nineteen percent of patients answered “not sure” to the first statement, and 22% of patients answered the same for the other statement. Eleven percent of patients responded, “disagree” or “strongly disagree” to both statements.
In October 2013, 12 PCPs who had patients in the MCPMC completed an online survey regarding their perception of patient outcomes, time spent providing care to chronic pain patients, comparisons with general chronic pain patients, and satisfaction with the clinic. Most of the PCPs reported they spent 15 to 30 minutes on MCPMC patients compared with 30 to 60 minutes on general chronic pain patients each month. Most of the PCPs stated that they required ambulatory care clinic visits with chronic pain patients every other month, whereas MCPMC patients needed to be seen only quarterly. PCPs agreed that having their patients participate in the MCPMC resulted in better pain control, improved adherence to treatments, increased diversion and abuse surveillance, and better access to pain medications. Eleven of 12 PCPs stated that they were very satisfied with the MCPMC.
Discussion
The ultimate goal for patients of the MCPMC is to minimize disease progression, prevent an increase in pain, and improve adherence to treatment plans, including pharmacologic, interventional, and complementary components. According to the change in reported pain levels from the initial to the most recent assessment, most patients met the goal of preventing an increase in pain. There was a trend toward a decrease in reported pain, though it was not clinically or statistically significant. The follow-up PAQ measured varying changes in functional status and often demonstrated disease stabilization or progression, not improvement among patients. Forty-five percent of patients showed improvements, and 55% reported more difficulty performing daily activities. The median change between all 27 MCPMC patients was an overall decline in function of 2 points. This worsening in function over time would be expected for most of the chronic pain conditions.
In 2013, 9% of patients were initiated on SR opioids, making a clinic total of 33% of patients on SR medications. More than half the patients were on IR opioids as monotherapy, which is not an ideal treatment for chronic pain management. However, 81% of this group was on 15 mg MEDD or less. The use of SR opioids may or may not reduce abuse potential but can improve patient outcomes. Overall, there was an emphasis on using SR opioids when appropriate while continuing to improve patient outcomes. Over 61% of patients remained on the same opioid doses or were decreased over the course of 2013. There was also a significant use of adjuvant medications, primarily antidepressants, antiepileptics, and topical pain relievers. The most frequently prescribed non-opioid medication, excluding NSAIDs, was gabapentin. This medication has abuse potential and was treated as a controlled medication by the MCPMC during this period.
After enrollment in the MCPMC, patients used complementary and interventional treatments more consistently than prior to enrollment in the clinic. Treatments such as injections, acupuncture, OMT, and PT may reduce opioid medication consumption in the long term or slow the progression of disease for most patients. The improvement in QOL and lack of disease progression in these patients is not objectively measurable; however, the summative progress may be subjectively evaluated through reported pain levels and patient satisfaction.
For MCPMC patients who remained in the clinic, PT and acupuncture attendance was 70% and 75%, respectively. Although these were improvements in adherence for many MCPMC patients, the rates were still below the facility average completion rates of 80% and 81%, respectively. It could be argued that patients with acute pain are typically seen in PT for shorter periods and with fewer possibilities of missing appointments. Conversely, the single active MCPMC patient who attended OMT had a 100% completion rate compared with the average facility OMT attendance of 68%.
Other goals of the MCPMC consist of managing AEs, minimizing ED visits, monitoring for drug abuse and diversion, and improving adherence to pain agreements. The substantial 65% decrease in ED visits can be attributed to the patients’ participation in the MCPMC. Before enrollment, many patients would frequent the ED, because their PCP was not available. The cost savings from minimizing ED visits, provider and staff time, and resources is difficult to measure due to low rates of collections from insurance supplemental to IHS insurance yet is a significant benefit to the IHS facility.
Conclusions
Since the implementation of the MCPMC, patient outcomes have improved due to more consistent drug abuse and diversion surveillance of chronic pain patients rather than performing surveillance because of a suspicion of inappropriate medication use. Frequently using the pain agreement and monitoring parameters constructed a more trusting relationship between the PCP and the patient, and identified patients inappropriate for long-term opioid therapy. Identifying these patients was an unintentional, yet positive outcome.
Additionally, PCPs reported spending half the time with MCPMC patients vs general chronic pain patients. Patients who were not compliant with their pain agreements were discontinued from opioid therapy and were disenrolled from the clinic. Patients who have remained active have become more compliant with their pain agreements and treatment plans than they had been before enrollment. The MCPMC has ultimately relieved a significant burden from primary care and ED providers while improving outcomes and satisfaction of chronic pain patients.
Author disclosures
The authors report no actual or potential conflicts of interest with regard to this article.
Disclaimer
The opinions expressed herein are those of the authors and do not necessarily reflect those of Federal Practitioner, Frontline Medical Communications Inc., the U.S. Government, or any of its agencies. This article may discuss unlabeled or investigational use of certain drugs. Please review the complete prescribing information for specific drugs or drug combinations—including indications, contraindications, warnings, and adverse effects—before administering pharmacologic therapy to patients.
1. Substance Abuse and Mental Health Services Administration. Results from the 2012 National Survey on Drug Use and Health: Summary of National Findings, NSDUH Series H-46, HHS Publication No. (SMA) 13-4795. Rockville, MD: Substance Abuse and Mental Health Services Administration; 2013.
2. Substance Abuse and Mental Health Services Administration. Results from the 2009 National Survey on Drug Use and Health: Summary of National Findings, NSDUH Series H-38, HHS Publication No. (SMA) 10-4586. Rockville, MD: Substance Abuse and Mental Health Services Administration; 2010.
3. Johannes CB, Le TK, Zhou X, Johnston JA, Dworkin RH. The prevalence of chronic pain in United States adults: results of an Internet-based survey.
J Pain. 2010;11(11):1230-1239.
4. Deyo RA, Mirza SK, Martin BI. Back pain prevalence and visit rates: estimates from U.S. national surveys, 2002. Spine (Phila PA 1976). 2006;31(23):
2724-2727.
5. Bolen J, Schieb L, Hootman JM, et al. Differences in the prevalence and impact of arthritis among racial/ethnic groups in the United States, National Health Interview Survey, 2002, 2003, and 2006. Prev Chronic Dis. 2010;7(3):A64.
6. Schiller JS, Lucas JW, Ward BW, Perogoy JA. Summary health statistics U.S. adults: National Health Interview Survey, 2010. National Center for Health Statistics. Vital Health Stat. 2012;10(252). Centers for Disease Control and Prevention Website. http://www.cdc.gov/nchs/data/series/sr_10/sr10_252.pdf. Accessed June 26, 2015.
7. Strickland JM, Huskey A, Brushwood DB. Pharmacist-physician collaboration in pain management practice. J Opioid Manag. 2007;3(6):295-301.
8. Rauck RL. What is the case for prescribing long-acting opioids over short-acting opioids for patients with chronic pain? A critical review. Pain Pract. 2009;9(6):468-479.
9. Pesce A, West C, Egan City K, Strickland J. Interpretation of urine drug testing in pain patients. Pain Med. 2012;13(7):868-885.
The epidemic of opioid abuse, addiction, and overdose deaths across the U.S. has not forgone the reservations of American Indian/Alaska Native (AI/AN) tribes. Indeed, AI/ANs may be at increased risk for abuse of prescription opioids due to higher rates of reported illicit drug use and misuse of opioids. According to the 2012 National Survey on Drug Use and Mental Health, AI/ANs aged ≥ 12 years had the highest rates of illicit drug use (12.7%) with the national average being only 9.5%.1 In 2009, AI/ANs aged 12 to 17 years were found to have the highest rates of marijuana use (13.8%) and nonmedical prescription drug abuse (6.1%) compared with the overall U.S. averages of 6.9% and 3.3%, respectively, putting them at an increased risk for an opioid overdose.1,2
In 2010, the American Pain Society conducted a survey establishing that about 41% of American adults reported having chronic, recurrent, or long-lasting pain.3 People of AI/AN heritage may experience chronic pain at higher rates, as they were identified as having the greatest incidence rates of low back pain (35%), arthritis (25%), and obesity (40%), which are often significant contributing factors to chronic pain.4-6
These conditions suggest a need for intensified management of chronic pain among IHS patients. The authors’ IHS facility is a closed health-system network where pharmacists are integral components of the health care team throughout the ambulatory care, emergency, and inpatient departments.
Related: Pharmacist Pain E-Consults That Result in a Therapy Change
Given that medications play a central role in the treatment of chronic pain, pharmacists are appropriate leaders for chronic pain management teams. Pharmacists can improve patient outcomes by conducting pain assessments, managing adverse events (AEs), identifying optimal medication choices, determining equianalgesic dosing, and managing care through care protocols.7
The primary objective of the multidisciplinary chronic pain management clinic (MCPMC) is to manage complicated and postsurgical patients, using a multimodal approach. Primary care providers (PCPs), which include physicians, nurse practitioners (NPs), physician assistants (PAs), and pharmacist providers collaborate to meet this goal by minimizing disease progression, preserving activities of daily living (ADL), maintaing employment, preventing an increase in pain, using treatment plans that include pharmacologic, interventional, and complementary components, decreasing emergency department (ED) visits for chronic pain issues, improving pain agreement adherence, managing AEs, performing drug abuse and diversion surveillance, and using sustained-release (SR) opioids when appropriate. Sustained release opioids not only ease dosing schedules and increase adherence, but also improve sleep, functionality, and quality of life (QOL) for chronic pain patients.8
Methods
The MCPMC began enrolling patients in January 2011 and has continued to date. Inclusion criterion is the presence of pain lasting 3 months or more. Exclusionary criteria are the presence of malignant pain, aged < 18 years, pregnancy, unmanaged psychiatric disorders, and a referral not approved by a PCP. Referrals are accepted from providers throughout the facility, including the ED, which then require approval by the PCP before enrollment. The PCP continues to manage these patients through consultations with the MCPMC pharmacists following MCPMC appointments and at separate ambulatory care clinic appointments.
Currently, there are 2 pharmacists practicing in the MCPMC clinic in conjunction with other health care providers, including 5 physical therapists, 1 psychiatrist, 2 clinical social workers, and 15 PCPs, including NPs and PAs. Additionally in 2014, the clinic became a yearlong rotation in the PGY-1 pharmacy practice residency.
Related: Evaluation of Methadone-Induced QTc Prolongation in a Veteran Population
After enrollment, a pharmacist reviews patients’ health records for past pain medications, interventional and complementary treatments, adherence to these treatments, recent ED visits and medications received, urine toxicology results, adherence to pain agreements, and the Arizona Controlled Substances Prescription Monitoring Program Database (ACSPMPD).
During the initial MCPMC appointment, a pain assessment questionnaire (PAQ) is completed with a MCPMC pharmacist. The questionnaire, designed specifically for the MCPMC, consists of a comprehensive pain assessment, including functional status and common comorbidities, such as anxiety, depression, obesity, and insomnia. Patients provide feedback on efficacy of past or current medications, and interventional and complementary treatments if applicable. Patients also rate their satisfaction with health care received and develop goals for their treatment and overall health.
A collaborative treatment plan is then developed with the patient’s PCP. Treatment plans often consist of increasing or starting interventional and complementary treatments, SR opioids, and adjuvant medications. Common adjuvant medications include nonsteroidal anti-inflammatory drugs (NSAIDs), antidepressants, antiepileptics, immunosuppressants, disease-modifying antirheumatic drugs (DMARDs), and topical agents. To maximize benefits of the medications, antidepressants are often prescribed for dual purposes among patients with comorbid conditions, such as anxiety, depression, and insomnia. Among obese patients, weight loss is encouraged, and patients may be referred to dietary counseling and exercise programs. Other intentions of the treatment plans are to decrease breakthrough pain and ED visits while attempting to decrease the use of immediate-release (IR) opioids. Treatment plans are executed in a stepwise approach over multiple MCPMC visits and may be modified throughout the course of the program.
To ensure that medication changes and other issues can be addressed when a prescriber is available, all subsequent visits are scheduled when patients are due for a pain medication refill. The MCPMC pharmacists chose not to pursue prescriptive authority but have privileges to order urine toxicology tests, make nonformulary requests, and refer patients for complementary treatments. Subsequent appointments are commonly scheduled 1 to 4 weeks apart or alternate with PCP appointments.
Related: Multidisciplinary Approach to Back Pain
During each appointment, data are collected to record changes in therapy and pain levels. Questions regarding general health and adherence to pharmacologic, interventional, and complementary treatments, exercise regimens, and specialty referrals are asked of all patients. Additionally, follow-up PAQs are completed every 6 months to track progress in therapy, pain control, treatment plan adherence, and patient satisfaction. To determine pain agreement adherence, the ACSPMPD is reviewed monthly, and urine toxicology tests and pill counts are performed randomly at MCPMC visits.
In October 2013, all PCPs who had patients in the clinic completed a survey to assess their perception of the MCPMC. Questions were related to their satisfaction with the clinic as well as their opinion of patients’ satisfaction. Other questions were related to their view of patient care and outcomes compared with those of the general chronic pain patients at the facility.
Results
As of January 2013, 106 patients had been referred to the MCPMC by 17 PCPs. Thirty-six of these patients were still actively participating in the clinic, while 25 were pending review. Of the remaining 45 patients, 30 were denied initial enrollment, and 15 were disenrolled from the clinic over the previous 2 years. Patients were determined to be inappropriate candidates and not enrolled in the clinic for the following reasons: referral not approved by the PCP, patient refused care, patient had not established care with a PCP, mental health issues, pediatric patient, oncology patient, and death prior to the initial review. Patients were disenrolled from the MCPMC clinic before 2013 for the following reasons: not participating in their treatment plan, illicit drug use, seeking care from other PCPs, suspected diversion, death due to a nonpain-related issue, and remained stable on the medication regimen and were released back to the care of their PCP.
In 2013, there were 47 new referrals to the MCPMC, resulting in a total of 153 referrals since the clinic’s 2011 inception. Over the course of 2013, 31 new patients were enrolled, 32 referrals were denied (15 of which remained from 2012), and 36 patients were disenrolled (Figure 1). At the end of 2013, 31 patients remained active, while 9 referrals remained pending review. A total of 67 patients participated in the MCPMC at some point during 2013 and were included in the data collection. Patients by diagnoses are displayed in Figure 2.
In 2013, patients were scheduled for a total of 337 MCPMC appointments, and 298 (88%) were completed by patients, a 17% increase above 2012. The mean show rate of PCP ambulatory care clinic appointments was about 70%. The completed MCPMC visits for 2013 correlates to about 6.8 MCPMC visits annually per patient. Of the 67 patients included in data collection, the mean total number of months active in the clinic was 12.5. The mean number of months active in the clinic in 2013 was 6.9.
Pain Assessment Questionnaire
In 2013, 27 patients (40%) were enrolled in the clinic for 6 months or more and completed a follow-up PAQ. Throughout 2013, MCPMC patients presented to the ED for care 76 times, which correlates to about 1.8 ED visits annually per patient. MCPMC patients also attended an appointment with their PCP on average 3.7 times per year and provided urine toxicology tests on average 4.3 times per year between MCPMC and PCP visits.
Data collected from follow-up PAQs in January 2014 provided information on the 27 MCPMC patients enrolled in the clinic for 6 months or more. This review indicated alterations in patients’ reported pain levels, functional status, patient satisfaction, and adherence to pain agreements from before and after enrollment in the clinic. Additional information was collected using the electronic health record to reveal the adjustments in treatment plans, including pharmacologic, complementary, and interventional treatments, along with adherence to these treatments.
Patients’ self-reported pain levels at the time of appointment and average pain levels since the previous appointment were documented at each visit for the 27 MCPMC patients. These 2 pain levels were then compared with the levels of the initial assessment and the most recent appointment. Results were inconsistent; however, slight trends were observed with the analysis. The mean change in pain reported at the time of assessment decreased 5.1%. The mean change in average reported pain since the previous appointment also decreased 6.9%. Statistical analysis was performed using the Wilcoxon signed rank test. Both decreases in reported pain were not clinically or statistically significant (P = .21 and P = .17, respectively). Eleven (41%) patients had improvement in average pain, whereas 10 (37%) had no change, and 6 (22%) reported increased average pain levels.
Data on alterations in functional status and ADL were also collected from the 27 MCPMC patients. These patients reported the perceived degree of difficulty, on a scale of 1 to 5, required to complete tasks and get through their day. A rating of 1 represented the ability to complete activities with no difficulty, whereas 5 represented an inability to complete the tasks. For each of the 19 tasks, the differences in scores from the initial to the most recent PAQs were recorded as either a positive or negative alteration for each patient, and the sum of these differences was recorded as an overall positive or negative change in function. A positive change in function indicated an improvement in function, whereas an overall negative change indicated a decrease in ability to complete daily activities.
Twenty-six percent of the 27 pa-tients had a cumulative positive change of up to 5 points, and 19% had a positive change of 6 or more points. Alternatively, 22% of patients had a cumulative negative change of up to 5 points, and 33% of patients had a negative change of 6 points or more. The greatest positive change was 15 points, the greatest negative change was 28 points, and the median change from the initial to the most recent assessments was a negative change of 2 points.
Adjuvant Medications
The pharmacologic component of the treatment plans consisted primarily of optimizing the use of adjuvant medications and SR opioids when appropriate, while minimizing the use of IR opioids and other controlled medications. Of the 67 MCPMC patients in 2013, 55% were on IR opioids alone, a slight increase from 46% in 2012 (Table 1). Eighty-one percent of patients in this group were on ≤ 15 mg of morphine equivalent daily dose (MEDD), which would have required at least a doubling of their dose to initiate the preferred formulary SR opioid, morphine SR tablets. Six percent of patients were on SR opioids alone, also a slight increase from 3% in 2012. Twenty-seven percent of patients were prescribed a combination of IR and SR opioids. Nine percent of patients had been recently transitioned to SR opioids while in the MCPMC, of which 1 patient was prescribed the medication as monotherapy. Twelve percent of patients were not on any opioid therapy throughout 2013.
Opioids were switched to an alternative opioid at some point during the year to minimize tolerance in 15% of patients, of which 9% were IR and 6% were SR opioids. Changes in opioid therapy from the beginning to the end of the year were recorded as a decrease, increase, or no change in MEDD. Doses were decreased for 16%, increased for 27%, and not changed for the remaining 45% of patients. The sum of these changes for the 59 patients on opioids was a decrease of 172 mg MEDD or, on average, a decrease of about 3 mg MEDD per patient. Throughout the year, 36 patients were disenrolled from the clinic, and a total of 941 mg MEDD were discontinued by patients’ PCPs. This resulted in a mean of about 26 mg MEDD discontinued per patient. These statistics demonstrate small trends in decreasing overall MEDD in MCPMC patients.
Adjunctive therapies were often used in 67 MCPMC patients in addition to their opioid medications. If possible, therapies for pain management were chosen to maximize the ability to benefit comorbidities, such as depression, anxiety, and insomnia, while also treating chronic pain. The most frequently prescribed class of medications was antidepressants with 63% of patients prescribed one or more: bupropion, serotonin-norepinephrine reuptake inhibitor, selective-serotonin reuptake inhibitor, and tricyclic antidepressants. The next top 3 medication classes after antidepressants were topical medications (54%), antiepileptics (48%), and muscle relaxers (42%). The single most frequently prescribed adjunctive medication was gabapentin (37%), an antiepileptic.
Complementary Treatments
Complementary treatment referrals were followed throughout 2013 and compared with referrals from 2012 (Table 2). Physical therapy (PT) and exercise programs continued to be the most frequently referred treatment programs within the facility. Fifty-two percent of 67 MCPMC patients did not attend any PT appointments as recommended, of which the majority were required to attend as a component of their pain agreement. Of the remaining patients referred to PT, 48% went to their initial visit, 40% attended a second, and 32% attended 3 or more appointments. Of the group that attended 3 or more appointments, patients completed about 70% of the overall scheduled appointments, which was below the facility averages of 75% in 2012 and 80% in 2013.
Acupuncture, transcutaneous electrical nerve stimulation, and osteopathic manipulative therapy (OMT) were much less frequently suggested treatments, with percentages of patient referrals of 22%, 21%, and 6%, respectively. Sixty percent of patients referred to acupuncture attended the initial visit, 47% attended a second, and 40% attended 3 or more appointments. Of this group that attended at least 3 appointments, patients completed 75% of scheduled appointments, which was also below the facility averages of 86% in 2012 and 81% in 2013. Only 50% of patients referred to OMT attended the initial visit, of which these patients completed 100% of their scheduled appointments. This rate of attendance was above the facility averages of 60% in 2012 and 68% in 2013. Thirteen percent of patients were referred for interventional pain management and completed 1 of 3 types of injections (onabotulinumtoxinA, spinal, or intra-articular). There was a slight decrease in patients without complementary treatment referrals from 14% in 2012 to 13% in 2013.
Adherence
Pain agreement adherence was determined by assessing ED visits, urine toxicology results, and ACSPMPD search results. Sixty-one percent of the 67 MCPMC patients did not seek care in the ED, whereas 12% had 1 visit in 2013. This decrease in frequency of ED visits was significant compared with these same MCPMC patients from prior to participation in the clinic. The mean ED patient visits per year decreased from 5.1 to 1.8.
Urine toxicology tests were completed on 54 of the 67 MCPMC patients in 2013. Overall, urine toxicology reports were determined to be appropriate at the initial review 51% of the time, with 30% of patients having all of their reports completely appropriate. Of the 54 patients, 35% were disenrolled for inappropriate urine toxicology reports for the following reasons: negative for opioids, positive for opioids without a prescription, positive for amphetamines with additional confirmation testing, and positive for barbiturates without a prescription. Six percent of patients were discovered to have trace amphetamine results that were sent out for confirmation, but these reports were found to be negative, thus confirming an initial false-positive result.
Forty-eight percent of MCPMC patients tested negative for opioids at some point during the year when they were expected to have positive results. Of this group, 31% were prescribed morphine; the remaining patients were prescribed synthetic or semisynthetic opioids that are known to cause false-negative results: fentanyl (4%), hydrocodone (50%), and oxycodone (15%).9 Twenty-two percent of patients were disenrolled from the clinic for testing negative for opioids. The reason for disenrollment was often in conjunction with other behaviors that resulted in violations of their pain agreement. The remaining 78% reported running out of pain medications early and remained in the clinic. Two percent of patients were discovered to have a positive opioid result when it was expected to be negative. This group reported finding previously prescribed medications and subsequent results were appropriate, thus they remained in the clinic. Lastly, 2% of patients tested negative for barbiturates when it was expected to be positive. These patients reported running out of pain medication early as well.
The ACSPMPD was also used to assess pain agreement adherencee for all MCPMC patients. Six percent of patients were identified as seeking care from providers outside the IHS facility and receiving prescriptions for opioid medications, thus violating their pain agreements. Seventy-five percent of these patients were disenrolled from the MCPMC for this reason. PCPs referred the other 25% of patients, and the outside prescribers had performed procedures on them. These patients were reminded of their pain agreements, and no further violations were discovered according to the database. Each patient’s status in the MCPMC was evaluated on a case-by-case basis, and often decisions to disenroll or continue treating patients were based on the PCP’s clinical judgment.
Patient satisfaction was measured in the follow-up PAQ by asking 27 patients how they felt about their care, using a typical 5-point Likert scale. The 2 statements were, “I am pleased with the care that I have received for my pain,” and “I believe that I am receiving the best health care available.” Seventy percent of patients answered “strongly agree” or “agree” to the first statement, and 67% of patients answered the same for the second statement. Nineteen percent of patients answered “not sure” to the first statement, and 22% of patients answered the same for the other statement. Eleven percent of patients responded, “disagree” or “strongly disagree” to both statements.
In October 2013, 12 PCPs who had patients in the MCPMC completed an online survey regarding their perception of patient outcomes, time spent providing care to chronic pain patients, comparisons with general chronic pain patients, and satisfaction with the clinic. Most of the PCPs reported they spent 15 to 30 minutes on MCPMC patients compared with 30 to 60 minutes on general chronic pain patients each month. Most of the PCPs stated that they required ambulatory care clinic visits with chronic pain patients every other month, whereas MCPMC patients needed to be seen only quarterly. PCPs agreed that having their patients participate in the MCPMC resulted in better pain control, improved adherence to treatments, increased diversion and abuse surveillance, and better access to pain medications. Eleven of 12 PCPs stated that they were very satisfied with the MCPMC.
Discussion
The ultimate goal for patients of the MCPMC is to minimize disease progression, prevent an increase in pain, and improve adherence to treatment plans, including pharmacologic, interventional, and complementary components. According to the change in reported pain levels from the initial to the most recent assessment, most patients met the goal of preventing an increase in pain. There was a trend toward a decrease in reported pain, though it was not clinically or statistically significant. The follow-up PAQ measured varying changes in functional status and often demonstrated disease stabilization or progression, not improvement among patients. Forty-five percent of patients showed improvements, and 55% reported more difficulty performing daily activities. The median change between all 27 MCPMC patients was an overall decline in function of 2 points. This worsening in function over time would be expected for most of the chronic pain conditions.
In 2013, 9% of patients were initiated on SR opioids, making a clinic total of 33% of patients on SR medications. More than half the patients were on IR opioids as monotherapy, which is not an ideal treatment for chronic pain management. However, 81% of this group was on 15 mg MEDD or less. The use of SR opioids may or may not reduce abuse potential but can improve patient outcomes. Overall, there was an emphasis on using SR opioids when appropriate while continuing to improve patient outcomes. Over 61% of patients remained on the same opioid doses or were decreased over the course of 2013. There was also a significant use of adjuvant medications, primarily antidepressants, antiepileptics, and topical pain relievers. The most frequently prescribed non-opioid medication, excluding NSAIDs, was gabapentin. This medication has abuse potential and was treated as a controlled medication by the MCPMC during this period.
After enrollment in the MCPMC, patients used complementary and interventional treatments more consistently than prior to enrollment in the clinic. Treatments such as injections, acupuncture, OMT, and PT may reduce opioid medication consumption in the long term or slow the progression of disease for most patients. The improvement in QOL and lack of disease progression in these patients is not objectively measurable; however, the summative progress may be subjectively evaluated through reported pain levels and patient satisfaction.
For MCPMC patients who remained in the clinic, PT and acupuncture attendance was 70% and 75%, respectively. Although these were improvements in adherence for many MCPMC patients, the rates were still below the facility average completion rates of 80% and 81%, respectively. It could be argued that patients with acute pain are typically seen in PT for shorter periods and with fewer possibilities of missing appointments. Conversely, the single active MCPMC patient who attended OMT had a 100% completion rate compared with the average facility OMT attendance of 68%.
Other goals of the MCPMC consist of managing AEs, minimizing ED visits, monitoring for drug abuse and diversion, and improving adherence to pain agreements. The substantial 65% decrease in ED visits can be attributed to the patients’ participation in the MCPMC. Before enrollment, many patients would frequent the ED, because their PCP was not available. The cost savings from minimizing ED visits, provider and staff time, and resources is difficult to measure due to low rates of collections from insurance supplemental to IHS insurance yet is a significant benefit to the IHS facility.
Conclusions
Since the implementation of the MCPMC, patient outcomes have improved due to more consistent drug abuse and diversion surveillance of chronic pain patients rather than performing surveillance because of a suspicion of inappropriate medication use. Frequently using the pain agreement and monitoring parameters constructed a more trusting relationship between the PCP and the patient, and identified patients inappropriate for long-term opioid therapy. Identifying these patients was an unintentional, yet positive outcome.
Additionally, PCPs reported spending half the time with MCPMC patients vs general chronic pain patients. Patients who were not compliant with their pain agreements were discontinued from opioid therapy and were disenrolled from the clinic. Patients who have remained active have become more compliant with their pain agreements and treatment plans than they had been before enrollment. The MCPMC has ultimately relieved a significant burden from primary care and ED providers while improving outcomes and satisfaction of chronic pain patients.
Author disclosures
The authors report no actual or potential conflicts of interest with regard to this article.
Disclaimer
The opinions expressed herein are those of the authors and do not necessarily reflect those of Federal Practitioner, Frontline Medical Communications Inc., the U.S. Government, or any of its agencies. This article may discuss unlabeled or investigational use of certain drugs. Please review the complete prescribing information for specific drugs or drug combinations—including indications, contraindications, warnings, and adverse effects—before administering pharmacologic therapy to patients.
1. Substance Abuse and Mental Health Services Administration. Results from the 2012 National Survey on Drug Use and Health: Summary of National Findings, NSDUH Series H-46, HHS Publication No. (SMA) 13-4795. Rockville, MD: Substance Abuse and Mental Health Services Administration; 2013.
2. Substance Abuse and Mental Health Services Administration. Results from the 2009 National Survey on Drug Use and Health: Summary of National Findings, NSDUH Series H-38, HHS Publication No. (SMA) 10-4586. Rockville, MD: Substance Abuse and Mental Health Services Administration; 2010.
3. Johannes CB, Le TK, Zhou X, Johnston JA, Dworkin RH. The prevalence of chronic pain in United States adults: results of an Internet-based survey.
J Pain. 2010;11(11):1230-1239.
4. Deyo RA, Mirza SK, Martin BI. Back pain prevalence and visit rates: estimates from U.S. national surveys, 2002. Spine (Phila PA 1976). 2006;31(23):
2724-2727.
5. Bolen J, Schieb L, Hootman JM, et al. Differences in the prevalence and impact of arthritis among racial/ethnic groups in the United States, National Health Interview Survey, 2002, 2003, and 2006. Prev Chronic Dis. 2010;7(3):A64.
6. Schiller JS, Lucas JW, Ward BW, Perogoy JA. Summary health statistics U.S. adults: National Health Interview Survey, 2010. National Center for Health Statistics. Vital Health Stat. 2012;10(252). Centers for Disease Control and Prevention Website. http://www.cdc.gov/nchs/data/series/sr_10/sr10_252.pdf. Accessed June 26, 2015.
7. Strickland JM, Huskey A, Brushwood DB. Pharmacist-physician collaboration in pain management practice. J Opioid Manag. 2007;3(6):295-301.
8. Rauck RL. What is the case for prescribing long-acting opioids over short-acting opioids for patients with chronic pain? A critical review. Pain Pract. 2009;9(6):468-479.
9. Pesce A, West C, Egan City K, Strickland J. Interpretation of urine drug testing in pain patients. Pain Med. 2012;13(7):868-885.
A Qualitative Study of Treating Dual-Use Patients Across Health Care Systems
The VHA assigns all enrolled veterans to a primary care provider (PCP). However, almost 80% of veterans enrolled in VHA have another form of health care coverage, including Medicare, Medicaid, private insurance, and TRICARE for Life program.1 Consequently, veterans may choose to use more than 1 health care system to manage their health care needs.
Studies based on merged VHA and Medicare claims data have demonstrated substantial dual use by VHA enrollees with Medicare. Petersen and colleagues reported that about 80% of VHA enrollees with Medicare chose to use services in both systems and that greater distance to VHA facilities and lower priority level for VHA care predicted lower VHA reliance.2 Among those aged < 65 years who had Medicare due to disability, 58% weredual users. These dual users relied more on private sector care for many health conditions, with the notable exception of substance abuse and mental health disorders, for which reliance on VHA care was greater.2 Another study found that over half of VHA enrollees assigned to a PCP at a community-based outpatient clinic (CBOC) received some or all of their care outside VHA and that reliance on VHA outpatient care declined over the 4-year study period.3
Related: Mutual Alignment Trumps Merger for Joint VA/DoD Health Care Programs
This use of multiple health care providers (HCPs), facilities, and modalities is often described as dual use or comanagement. Dual use in the case of veterans refers to use of both VHA and non-VHA health care, whereas comanagement implies an expectation of shared decision making and open communication between VHA and non-VHA providers. In addition to VHA PCPs, rural veterans frequently receive care from local, non-VHA HCPs in the community where they live. As health care in the U.S. evolves and patients have increasing choices through the Affordable Care Act (ACA), the challenge of comanagement for patients receiving care in multiple systems is likely to increase both within and outside VHA.
This study was part of a qualitative rural health needs assessment designed to ascertain the issues facing rural veterans and their providers in the upper Midwest.4 The objective was to examine VHA primary care clinic staff perspectives on dual users, perceived barriers that inhibit comanagement, and factors that contribute to the need for dual use in rural areas.
Methods
A qualitative study design with in-person interviews was used to elicit the perspective of VHA clinic staff on the current and ideal states of comanagement. Clinics were selected using a stratified purposeful sample of 15 urban and rural primary care clinics at VHA CBOCs and VAMCs in 8 Midwestern states (Illinois, Iowa, Minnesota, Nebraska, North Dakota, South Dakota, Wisconsin, and Wyoming). The stratification criteria included (1) urban and rural; (2) geographic coverage of VISN 23; and (3) VHA-managed and contract clinics, resulting in a purposeful sample of 2 urban VAMC clinics, 3 urban CBOCs, 7 rural VHA-managed CBOCs, and 3 rural contract CBOCs. The distance from the CBOC to the closest VAMC ranged from 32 to 242 miles.
Related: VA Relaxes Rules for Choice Program
Interview guides were developed and tested by the research team for comprehension, length, and timing prior to data collection and iteratively revised as analysis evolved and new topics emerged. Clinic staff were asked about their perceptions of rural veteran use of VHA care; barriers and facilitators to accessing care; and their personal experience working within VHA. Several questions focused on dual use and why rural veterans use multiple health care systems, their perspectives of dual use, their expectations of patients’ role(s) in health care coordination, and the perceived barriers that inhibit comanagement. Interviewers used comanagement and dual use interchangeably to discuss patients with multiple care providers, allowing interviewees to use their preferred terminology; assigned meanings were probed for clarification but not corrected by interviewers.
Between June and October 2009, teams of 2 to 3 researchers visited 15 clinics for 1 to 2 business days each. Researchers conducted interviews with a convenience sample of clinical staff. Consent forms and an explanation of the study were distributed, and those electing to participate voluntarily came to a designated room to complete an interview. All interviews were audio recorded for accuracy.
Interview recordings were transcribed verbatim and reviewed for accuracy. Prior to coding, transcripts were imported into a qualitative data management software program. A codebook, including a priori research hypotheses and de novo themes, was developed based on a systematic review of a randomly selected subset of interview transcripts.5 Four coders were responsible for coding all transcripts and validating coding through tests of agreement at predetermined intervals.
Regular meetings were conducted with coders and the lead qualitative investigator to discuss disagreements, clarify code definitions, or add new codes as needed. As codes were added, previous transcripts were coded/recoded for content related to the new codes. An audit trail was maintained, and iterative mediation of codes continued throughout the process. The final codebook contained 42 thematic codes, which reached saturation or data redundancy.6 Detailed analysis of the codes dual use, distance, and care coordination were used to inform this study.
Results
Among the 15 sites, 64 in-depth individual interviews were conducted, ranging from 5 to 53 minutes (average 26 minutes). Clinic staff demographic characteristics are depicted in the Table. Analysis of data captured in the codes dual use, distance, and care coordination resulted in notable concentration in 4 thematic areas: (1) clinic staff perceptions of the influence of access, convenience, and distance on dual use for rural patients; (2) communication and patient’s role in comanagement; (3) rules and regulations related to comanagement from the VHA perspective; and (4) barriers to comanagement and recommendations for education.
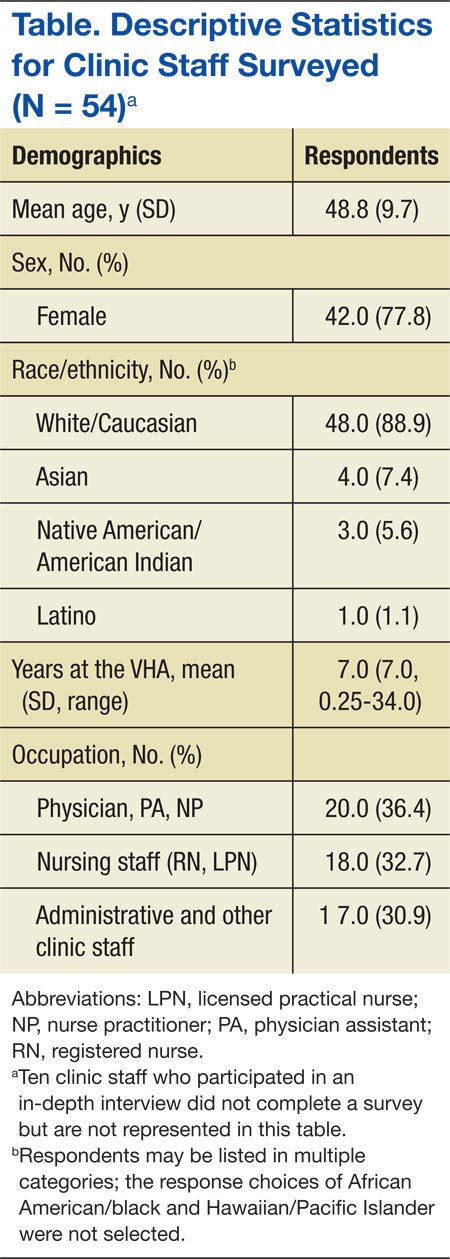
Influence of Access, Convenience, and Distance
Access to health care was central to the discussion of dual use and comanagement by clinic staff. Convenience was identified as the primary reason for rural patients’ use of non-VHA services, as many rural patients must travel outside their local community to access VHA care. Thus, dual use was most often noted for services typically available in patients’ local communities, especially management of chronic conditions.
The CBOCs provide important services for primary care and management of chronic conditions but are not available in all communities and may have limited hours/days that do not fit with patients’ schedules. The CBOCs are often unable to provide needed services, including but not limited to emergency care, diagnostic tests, physical and occupational therapy, and other specialty care services. As one VHA provider put it, “The biggest factor for [dual use] is availability, access, convenience.… It’s a lot more convenient to go to the hospital down the street than it is to go 120 miles to [the VAMC], or for some guys who live 30, 40 minutes the other side of here it becomes 150, 160-mile one-way trip.”
Related to access, distance and transportation barriers were identified by clinic staff as obstacles to care for rural patients. Despite efforts to offset the expense of travel through reimbursement to qualified veterans and coordinated van transport with Veterans Service Organizations, travel costs—both time and money—were seen as significant barriers to accessing VHA care, as was an inability to travel for those who are ill or frail and elderly. “We send people … in the van and for the most part that works, but eventually it gets expensive, or you’ve got somebody with chronic pain that can’t tolerate the van ride for 2 hours,” one interviewee
reported.
According to clinic staff, dual-use patients also rely on non-VHA providers in particular for urgent or emergency care, while relying on VHA primary care for reduced-cost medications, diagnostic testing, chronic disease management, or annual exams. When asked why rural patients may choose to see more than 1 provider, VHA providers responded. “[It’s] more convenient to have a local doctor just in case something went wrong and they need to see a doctor right away. So distance to this clinic would be the number one reason.” Another reported, “If it’s once or twice a year routine appointments they’ll come here, but… they’d rather go to a walk-in clinic nearby than spend so much [money] on gas.”
Communication and Patients’ Role
Communication between VHA and non-VHA providers is a necessary element of comanagement. Although phone calls or faxing patient medical records are available options, clinic staff reported it was more common to encounter patients hand carrying their records between providers. For dual-use patients, clinic staff indicated it was often unclear who was responsible for relaying information between providers. There is often ambiguity about who will (and should) fulfill this role and not enough time to adequately address or clarify how this is done. Some clinic staff believed that acting as the main conduits of information placed an undue burden on the patients, particularly asking them to be able to accurately relay medical information about tests or prescriptions that they may not fully understand. Others said that it was primarily the patients’ responsibility to give relevant information about their care to all their providers, because of VHA regulations and patient privacy laws. “[The] patient should tell the primary doctor to send them [medical records] because we can’t get the medical records without the patient’s permission,” said one provider.
Another provider utilized the nursing staff to call patients after their appointments to remind them to give their medical records to their non-VHA provider. The data suggest that responsibility for maintaining communication between providers ultimately falls on the patient. From the perspective of a nurse practitioner, “We just keep trying to educate the community…. I’ve been told that if the patient wants that privilege of using the VA for a pharmacy for an outside provider that we’re glad to do that. But it is their responsibility to communicate with their [non-VHA] physician. I think we just need to keep educating the patients.”
Rules and Regulations
VHA policies governing prescriptions, hospitalizations at outside facilities, and release of patient information regulate, and in some cases hinder, information flow between VHA and non-VHA providers. Many patients use VHA to obtain medications for lower out-of-pocket costs. This contributes to the number of dual-use patients in VHA and results in several challenges for VHA providers trying to manage patients’ prescriptions. For example, patients will ask to fill a prescription at a VHA pharmacy from their non-VHA providers; however, VHA pharmacies can only fill prescriptions from VHA providers.
Many VHA providers are willing to rewrite these prescriptions, but they may need to see the patient before adding or changing the prescription and require documentation to address contraindications, adverse reactions and/or therapeutic failure, and associated risks before making the authorization. VHA providers noted that because the VHA formulary does not contain all medications, non-VHA providers are often unfamiliar with the VHA National Formulary specifics and will write prescriptions for nonformulary medications, which require a nonformulary request from a VHA provider.
Clinic staff also mentioned difficulty in obtaining records from non-VHA providers. This can be particularly problematic if the patient lives a distance away from a VHA facility and does not have the necessary authorization to share records on file.
Barriers and Education Recommendations
Clinic staff identified coordination of care for dual-use patients as a barrier to providing care. Specifically, providers identified coordination as complicated by communication difficulties, inefficient medical record exchange, short staffing in VHA clinics, duplication of diagnostic services, and non-VHA providers’ lack of understanding regarding the services that VHA provides. Specific to rural clinics, comanagement was reportedly hindered by limitations in technology (eg, consistent Internet access), access to routine diagnostic services, and lack of relationships with non-VHA providers. Providers most frequently reported that the critical piece missing in comanagement is a relationship—and implied communication—between VHA clinics and non-VHA community clinics. The concept of a relationship between providers is evoked as a critical element to comanaging dual-use patients; however, clinic staff had a difficult time articulating what that relationship would actually look like if put into practice.
Related: Patients Benefit From ICU Telemedicine
In spite of the numerous barriers identified by clinic staff, the recommendation for education to improve comanagement was consistent across study sites and clinic staff roles. Education was proposed for patients and non-VHA providers as the best intervention. In response to a question about ideas and recommendations to improve comanagement, clinic staff drew on varied experiences. To illustrate this theme, a provider gave this example of dual-use patients seeking prescription medication from VHA and its impact on comanagement: “I would [recommend] an outreach program to community resources and [non-VHA] providers. To let them know more about how the VA works and the resources that are available, and how specifically to coordinate care through the VA, would be a significant benefit.… If the [non-VHA] providers knew how to—who to—talk to, what information the VA needs, for example, for medication changes, it would help the patients make it work…without having to overburden the patients with having to physically hand carry their blood test results, or their notes, discharge summaries, procedure notes.”
Along with providing outreach and education on working with the VHA, clinic staff addressed the need to educate patients more effectively, because they are seen as central to the information exchange. There is motivation on the part of patients to learn the system. “Just making sure that the patients realize that they need to tell their local providers to send us the records and make sure that there is an exchange going on consistently,” explained a case manager. “If the patient wants to get those medications that are costly, then they figure out pretty quick what they have to have, what they need to send to us.” The need for education is an ongoing process; who is responsible for this continues to be a point of debate.
Discussion
In order to better understand comanagement of dual-use patients, this study focused on the experiences and perceptions of staff at VHA primary care clinics in the upper Midwest. The data indicated that:
- VHA clinical staff perceive the primary reason patients choose to seek non-VHA care is because of access, convenience, and
distance - In order for comanagement to occur, communication and information exchange—currently facilitated largely by patients—needs to improve
- Education of patients and their non-VHA providers is recommended, to increase understanding of rules and regulations tied to exchange of patient information across health care systems
- Education may facilitate communication, develop relationships, and overcome barriers to information exchange
Distance to health care and perceived convenience were clearly seen by clinic staff as the driving factors behind their patients’ dual use. In the authors’ prior work, interviews with veterans and their VA providers supported this assertion as well; however, it was also found that distance must not be understood in isolation of other contingencies, such as urgency of need.4
Clinic staff identified institutional and individual barriers that lead to miscommunication and confusion on the part of patients and reported misunderstandings with non-VHA providers, including 3 potential barriers to comanagement. These included (1) inconsistent communication and flow of information between VHA and non-VHA providers; (2) uncertainty about who will (and should) be responsible for information flow between providers; and (3) VHA and federal regulations over patient privacy. Throughout the interviews, access to less expensive prescription medications in VHA was considered an additional driver of dual use. According to clinic staff interviewed, education of patients and non-VHA providers could facilitate efficient and safe comanagement for dual-use patients.7
This study suggests both advantages and disadvantages for patients choosing to use multiple health care systems from the perspective of the clinic staff. The primary advantage is better overall health care access, especially for rural patients and those with longer travel times to VHA facilities. The primary disadvantage of dual use is discontinuity of care between multiple care sites. Specifically, this study identified concerns regarding poor communication between providers and transfer of patient medical records. An underlying theme was a concern for quality of care and patient safety, which are recognized by others in the literature as potential consequences of inadequate comanagement.8-12
If there is one aspect of co-management for dual-use patients to target, this study’s findings point to developing strategies to improve communication between providers caring for dual-use patients and, more specifically, cultivating relationships that are currently underdeveloped. This will necessitate a clearer articulation of what constitutes a relationship between comanaging providers and is a direction for further research that would have applicability beyond VHA to any comanagement of patients using multiple health care systems.
There are 3 simultaneous, yet unrelated, factors that may contribute to increasing dual use. First is the rise in VHA eligible veterans from Operation Enduring Freedom, Operation Iraqi Freedom, and Operation New Dawn.13,14 All returning veterans who meet minimal requirements are eligible for 5 years of VHA health care. A large proportion of these individuals are in the Reserve and National Guard, most of whom have nonmilitary jobs that may provide employer-based health insurance. Thus, these veterans have a greater opportunity for dual use. Second, with the aging cohort of Vietnam-era veterans, a greater proportion is becoming Medicare eligible. Third, with the recent passing of the ACA, more patients, including veterans, may choose to purchase insurance through ACA health exchanges. Taken individually or collectively, these factors will likely have effects reaching beyond VHA, especially when veterans receiving care in non-VHA health care systems engage in dual use.3,13,15,16
Limitations
This study has a number of limitations. First, it was limited to VHA facilities located in the upper Midwest, which may limit generalizability to other parts of the country. The convenience sample of clinic staff at VHA clinics may not represent the full range of perspectives among HCPs generally. This study did not interview clinic staff in non-VHA clinics, although this has been the focus of other studies.17,18 Although dual use also applies to specialty care and related access issues in rural areas, this was not a focus of this study. Last, the data were collected in 2009, prior to the implementation of the patient-aligned care team (PACT) model and prior to the recently revealed issues regarding patient wait times for VHA care. Thus, perceptions may have changed, and additional study is needed.
Conclusions
The results of this study support prior assumptions of barriers to care, but also introduce previously unreported challenges. Dual use is perceived to have both positive and negative impacts, but for the positives to outweigh the negatives, thoughtful comanagement is critical. This may be particularly so in rural areas where dual use is encouraged as a way to overcome distance and increase convenience in accessing care.
As demonstrated by recent events, there are still VHA health care access issues for veterans. Recently, VA leadership and the U.S. Congress proposed that veterans have greater access to community providers as well as VHA in order to overcome delays in care.19 As this option is explored and put into practice, it is more important than ever to consider the need for care coordination and management of dual-use patients, to ensure good communication and care that is timely, safe, and high quality.
Few models exist in which 2 PCPs coordinate across health care systems, and greater understanding of this dual use is needed. This information is important in designing interventions to improve care coordination across systems to ensure continuity of care, patient safety, and patient satisfaction. Although some work has been done to examine the perspectives of non-VA PCPs, little is known about VHA provider perspectives on rural veteran dual use.17,18 This study explores VHA provider perspectives and identifies areas where interventions to improve care coordination across systems might be targeted.
Next steps for intervention studies would be to improve communication and develop educational tools to aid in the coordination of care between VHA and non-VHA providers. A recent example of this is the Co-Management Toolkit developed by the Veterans Rural Health Resource Center-Central Region, which provides information on VHA policies and targets non-VHA providers.20 Although VHA perceptions of comanageing dual-use patients were the target, a similar study of non-VHA providers is important to understand this complex and multifaceted dynamic. Additional work is needed to measure the impact of dual use on clinical outcomes, patient safety and quality, and efficient use of resources, as these are understudied. As dual use continues and potentially increases with the ACA and changing health care in the U.S., it is important to understand the management of patients using multiple health care systems. This is salient as primary care adopts the PACT model and to inform interventions to improve quality and safety while eliminating duplicative health care and costs.
Acknowledgements
The research reported here was supported by the Department of Veterans Affairs, Veterans Health Administration, Office of Rural Health, Veterans Rural Health Resource Center-Central Region (VRHRC-CR) and the VA Health Services Research and Development (HSR&D) Service, the Comprehensive Access and Delivery Research and Evaluation (CADRE) Center at the Iowa City VA Health Care System, and Center to Improve Veteran Involvement in Care (CIVIC) at VA Portland Health Care System. Dr. Reisinger was supported by a Research Career Development Award from the Health Services Research and Development Service, Department of Veterans Affairs (CD1 08-013-1).
We would like to thank all health care providers who graciously agreed to participate in this study and VRHRC-CR staff, in particular Monica Paez for assistance on this manuscript.
Author disclosures
The authors report no actual or potential conflicts of interest with regard to this article.
Disclaimer
The opinions expressed herein are those of the authors and do not necessarily reflect those of Federal Practitioner, Frontline Medical Communications Inc., the U.S. Government, or any of its agencies. This article may discuss unlabeled or investigational use of certain drugs. Please review complete prescribing information for specific drugs or drug combinations—including indications, contraindications, warnings, and adverse effects—before administering pharmacologic therapy to patients.
1. Department of Veterans Affairs Office of Rural Health, VHA. Veterans Rural Health: Perspectives and Opportunities. Rockville, MD: Booz Allen Hamilton; 2008. http://www.ruralhealth.va.gov/docs/PAO-final-report-0208.pdf. Accessed July 6, 2015.
2. Petersen LA, Byrne MM, Daw CN, Hasche J, Reis B, Pietz K. Relationship between clinical conditions and use of Veterans Affairs health care among Medicare‐enrolled veterans. Health Serv Res. 2010;45(3):762-791.
3. Liu CF, Chapko M, Bryson CL, et al. Use of outpatient care in Veterans Health Administration and Medicare among veterans receiving primary care in community-based and hospital outpatient clinics. Health Serv Res. 2010;45(5 pt 1):1268-1286.
4. Buzza C, Ono SS, Turvey C, et al. Distance is relative: unpacking a principal barrier in rural healthcare. J Gen Intern Med. 2011;26(suppl 2):648-654.
5. Bernard HR, Ryan GW. Analyzing Qualitative Data: Systematic Approaches. Los Angeles, CA: SAGE; 2010.
6. Guest G, Bunce A, Johnson L. How many interviews are enough? An experiment with data saturation and variability. Field Methods. 2006;18(1):59-82.
7. Kramer BJ, Vivrette RL, Satter DE, Jouldjian S, McDonald LR. Dual use of Veterans Health Administration and Indian Health Service: healthcare provider and patient perspectives. J Gen Intern Med. 2009;24(6):758-764.
8. Ajmera M, Wilkins TL, Sambamoorthi U. Dual Medicare and Veteran Health Administration use and ambulatory care sensitive hospitalizations. J Gen Intern Med. 2011;26(suppl 2):669-675.
9. Jia H, Zheng Y, Reker DM, et al. Multiple system utilization and mortality for veterans with stroke. Stroke. 2007;38(2):355-360.
10. Trivedi AN, Grebla RC, Jiang L, Yoon J, Mor V, Kizer KW. Duplicate federal payments for dual enrollees in Medicare Advantage plans and the Veterans Affairs health care system. JAMA. 2012;308(1):67-72.
11. Kaboli PJ, Shivapour DM, Henderson MS, Ishani A, Charlton ME. The impact of primary care dual-management on quality of care. J Prim Care Community Health. 2012;3(1):11-16.
12. Wolinsky FD, Miller TR, An H, Brezinski PR, Vaughn TE, Rosenthal GE. Dual use of Medicare and the Veterans Health Administration: are there adverse health outcomes? BMC Health Serv Res. 2006;6:131.
13. Liu CF, Bryson CL, Burgess JF Jr, Sharp N, Perkins M, Maciejewski ML. Use of outpatient care in VA and Medicare among disability-eligible and age-eligible veteran patients. BMC Health Serv Res. 2012;12:51.
14. Miller EA, Intrator O. Veterans use of non-VHA services: implications for policy and planning. Soc Work Public Health. 2012;27(4):379-391.
15. Bachman SS, Gonyea JG. Improving health care delivery to aging adults with disabilities: social work with dual eligibles in a climate of health care reform. J Gerontol Soc Work. 2012;55(2):191-207.
16. Kizer KW. Veterans and the Affordable Care Act. JAMA. 2012;307(8):789-790.
17. Lampman MA, Mueller KJ. Experiences of rural non-VA providers in treating dual care veterans and the development of electronic health information exchange networks between the two systems. J Rural Soc Sci. 2011;26(3):201-219.
18. Gaglioti A, Cozad A, Wittrock S, et al. Non-VA primary care providers’ perspectives on comanagement for rural veterans. Mil Med. 2014;179(11):1236-1243.
19. U.S. Department of Veterans Affairs. Acting Secretary Gibson outlines problems, actions taken, and budget resources needed to ensure access to care. U.S. Department of Veterans Affairs Website. http://www.va.gov/opa/pressrel/pressrelease.cfm?id=2586. Published July 16, 2014. Accessed July 6, 2015.
20. Office of Rural Health Central Region. Co-managed care toolkit. U.S. Department of Veterans Affairs Website. http://www.ruralhealth.va.gov/resource-centers/central/comanagement-toolkit.asp. Updated June 3, 2015. Accessed July 6, 2015.
The VHA assigns all enrolled veterans to a primary care provider (PCP). However, almost 80% of veterans enrolled in VHA have another form of health care coverage, including Medicare, Medicaid, private insurance, and TRICARE for Life program.1 Consequently, veterans may choose to use more than 1 health care system to manage their health care needs.
Studies based on merged VHA and Medicare claims data have demonstrated substantial dual use by VHA enrollees with Medicare. Petersen and colleagues reported that about 80% of VHA enrollees with Medicare chose to use services in both systems and that greater distance to VHA facilities and lower priority level for VHA care predicted lower VHA reliance.2 Among those aged < 65 years who had Medicare due to disability, 58% weredual users. These dual users relied more on private sector care for many health conditions, with the notable exception of substance abuse and mental health disorders, for which reliance on VHA care was greater.2 Another study found that over half of VHA enrollees assigned to a PCP at a community-based outpatient clinic (CBOC) received some or all of their care outside VHA and that reliance on VHA outpatient care declined over the 4-year study period.3
Related: Mutual Alignment Trumps Merger for Joint VA/DoD Health Care Programs
This use of multiple health care providers (HCPs), facilities, and modalities is often described as dual use or comanagement. Dual use in the case of veterans refers to use of both VHA and non-VHA health care, whereas comanagement implies an expectation of shared decision making and open communication between VHA and non-VHA providers. In addition to VHA PCPs, rural veterans frequently receive care from local, non-VHA HCPs in the community where they live. As health care in the U.S. evolves and patients have increasing choices through the Affordable Care Act (ACA), the challenge of comanagement for patients receiving care in multiple systems is likely to increase both within and outside VHA.
This study was part of a qualitative rural health needs assessment designed to ascertain the issues facing rural veterans and their providers in the upper Midwest.4 The objective was to examine VHA primary care clinic staff perspectives on dual users, perceived barriers that inhibit comanagement, and factors that contribute to the need for dual use in rural areas.
Methods
A qualitative study design with in-person interviews was used to elicit the perspective of VHA clinic staff on the current and ideal states of comanagement. Clinics were selected using a stratified purposeful sample of 15 urban and rural primary care clinics at VHA CBOCs and VAMCs in 8 Midwestern states (Illinois, Iowa, Minnesota, Nebraska, North Dakota, South Dakota, Wisconsin, and Wyoming). The stratification criteria included (1) urban and rural; (2) geographic coverage of VISN 23; and (3) VHA-managed and contract clinics, resulting in a purposeful sample of 2 urban VAMC clinics, 3 urban CBOCs, 7 rural VHA-managed CBOCs, and 3 rural contract CBOCs. The distance from the CBOC to the closest VAMC ranged from 32 to 242 miles.
Related: VA Relaxes Rules for Choice Program
Interview guides were developed and tested by the research team for comprehension, length, and timing prior to data collection and iteratively revised as analysis evolved and new topics emerged. Clinic staff were asked about their perceptions of rural veteran use of VHA care; barriers and facilitators to accessing care; and their personal experience working within VHA. Several questions focused on dual use and why rural veterans use multiple health care systems, their perspectives of dual use, their expectations of patients’ role(s) in health care coordination, and the perceived barriers that inhibit comanagement. Interviewers used comanagement and dual use interchangeably to discuss patients with multiple care providers, allowing interviewees to use their preferred terminology; assigned meanings were probed for clarification but not corrected by interviewers.
Between June and October 2009, teams of 2 to 3 researchers visited 15 clinics for 1 to 2 business days each. Researchers conducted interviews with a convenience sample of clinical staff. Consent forms and an explanation of the study were distributed, and those electing to participate voluntarily came to a designated room to complete an interview. All interviews were audio recorded for accuracy.
Interview recordings were transcribed verbatim and reviewed for accuracy. Prior to coding, transcripts were imported into a qualitative data management software program. A codebook, including a priori research hypotheses and de novo themes, was developed based on a systematic review of a randomly selected subset of interview transcripts.5 Four coders were responsible for coding all transcripts and validating coding through tests of agreement at predetermined intervals.
Regular meetings were conducted with coders and the lead qualitative investigator to discuss disagreements, clarify code definitions, or add new codes as needed. As codes were added, previous transcripts were coded/recoded for content related to the new codes. An audit trail was maintained, and iterative mediation of codes continued throughout the process. The final codebook contained 42 thematic codes, which reached saturation or data redundancy.6 Detailed analysis of the codes dual use, distance, and care coordination were used to inform this study.
Results
Among the 15 sites, 64 in-depth individual interviews were conducted, ranging from 5 to 53 minutes (average 26 minutes). Clinic staff demographic characteristics are depicted in the Table. Analysis of data captured in the codes dual use, distance, and care coordination resulted in notable concentration in 4 thematic areas: (1) clinic staff perceptions of the influence of access, convenience, and distance on dual use for rural patients; (2) communication and patient’s role in comanagement; (3) rules and regulations related to comanagement from the VHA perspective; and (4) barriers to comanagement and recommendations for education.
Influence of Access, Convenience, and Distance
Access to health care was central to the discussion of dual use and comanagement by clinic staff. Convenience was identified as the primary reason for rural patients’ use of non-VHA services, as many rural patients must travel outside their local community to access VHA care. Thus, dual use was most often noted for services typically available in patients’ local communities, especially management of chronic conditions.
The CBOCs provide important services for primary care and management of chronic conditions but are not available in all communities and may have limited hours/days that do not fit with patients’ schedules. The CBOCs are often unable to provide needed services, including but not limited to emergency care, diagnostic tests, physical and occupational therapy, and other specialty care services. As one VHA provider put it, “The biggest factor for [dual use] is availability, access, convenience.… It’s a lot more convenient to go to the hospital down the street than it is to go 120 miles to [the VAMC], or for some guys who live 30, 40 minutes the other side of here it becomes 150, 160-mile one-way trip.”
Related to access, distance and transportation barriers were identified by clinic staff as obstacles to care for rural patients. Despite efforts to offset the expense of travel through reimbursement to qualified veterans and coordinated van transport with Veterans Service Organizations, travel costs—both time and money—were seen as significant barriers to accessing VHA care, as was an inability to travel for those who are ill or frail and elderly. “We send people … in the van and for the most part that works, but eventually it gets expensive, or you’ve got somebody with chronic pain that can’t tolerate the van ride for 2 hours,” one interviewee
reported.
According to clinic staff, dual-use patients also rely on non-VHA providers in particular for urgent or emergency care, while relying on VHA primary care for reduced-cost medications, diagnostic testing, chronic disease management, or annual exams. When asked why rural patients may choose to see more than 1 provider, VHA providers responded. “[It’s] more convenient to have a local doctor just in case something went wrong and they need to see a doctor right away. So distance to this clinic would be the number one reason.” Another reported, “If it’s once or twice a year routine appointments they’ll come here, but… they’d rather go to a walk-in clinic nearby than spend so much [money] on gas.”
Communication and Patients’ Role
Communication between VHA and non-VHA providers is a necessary element of comanagement. Although phone calls or faxing patient medical records are available options, clinic staff reported it was more common to encounter patients hand carrying their records between providers. For dual-use patients, clinic staff indicated it was often unclear who was responsible for relaying information between providers. There is often ambiguity about who will (and should) fulfill this role and not enough time to adequately address or clarify how this is done. Some clinic staff believed that acting as the main conduits of information placed an undue burden on the patients, particularly asking them to be able to accurately relay medical information about tests or prescriptions that they may not fully understand. Others said that it was primarily the patients’ responsibility to give relevant information about their care to all their providers, because of VHA regulations and patient privacy laws. “[The] patient should tell the primary doctor to send them [medical records] because we can’t get the medical records without the patient’s permission,” said one provider.
Another provider utilized the nursing staff to call patients after their appointments to remind them to give their medical records to their non-VHA provider. The data suggest that responsibility for maintaining communication between providers ultimately falls on the patient. From the perspective of a nurse practitioner, “We just keep trying to educate the community…. I’ve been told that if the patient wants that privilege of using the VA for a pharmacy for an outside provider that we’re glad to do that. But it is their responsibility to communicate with their [non-VHA] physician. I think we just need to keep educating the patients.”
Rules and Regulations
VHA policies governing prescriptions, hospitalizations at outside facilities, and release of patient information regulate, and in some cases hinder, information flow between VHA and non-VHA providers. Many patients use VHA to obtain medications for lower out-of-pocket costs. This contributes to the number of dual-use patients in VHA and results in several challenges for VHA providers trying to manage patients’ prescriptions. For example, patients will ask to fill a prescription at a VHA pharmacy from their non-VHA providers; however, VHA pharmacies can only fill prescriptions from VHA providers.
Many VHA providers are willing to rewrite these prescriptions, but they may need to see the patient before adding or changing the prescription and require documentation to address contraindications, adverse reactions and/or therapeutic failure, and associated risks before making the authorization. VHA providers noted that because the VHA formulary does not contain all medications, non-VHA providers are often unfamiliar with the VHA National Formulary specifics and will write prescriptions for nonformulary medications, which require a nonformulary request from a VHA provider.
Clinic staff also mentioned difficulty in obtaining records from non-VHA providers. This can be particularly problematic if the patient lives a distance away from a VHA facility and does not have the necessary authorization to share records on file.
Barriers and Education Recommendations
Clinic staff identified coordination of care for dual-use patients as a barrier to providing care. Specifically, providers identified coordination as complicated by communication difficulties, inefficient medical record exchange, short staffing in VHA clinics, duplication of diagnostic services, and non-VHA providers’ lack of understanding regarding the services that VHA provides. Specific to rural clinics, comanagement was reportedly hindered by limitations in technology (eg, consistent Internet access), access to routine diagnostic services, and lack of relationships with non-VHA providers. Providers most frequently reported that the critical piece missing in comanagement is a relationship—and implied communication—between VHA clinics and non-VHA community clinics. The concept of a relationship between providers is evoked as a critical element to comanaging dual-use patients; however, clinic staff had a difficult time articulating what that relationship would actually look like if put into practice.
Related: Patients Benefit From ICU Telemedicine
In spite of the numerous barriers identified by clinic staff, the recommendation for education to improve comanagement was consistent across study sites and clinic staff roles. Education was proposed for patients and non-VHA providers as the best intervention. In response to a question about ideas and recommendations to improve comanagement, clinic staff drew on varied experiences. To illustrate this theme, a provider gave this example of dual-use patients seeking prescription medication from VHA and its impact on comanagement: “I would [recommend] an outreach program to community resources and [non-VHA] providers. To let them know more about how the VA works and the resources that are available, and how specifically to coordinate care through the VA, would be a significant benefit.… If the [non-VHA] providers knew how to—who to—talk to, what information the VA needs, for example, for medication changes, it would help the patients make it work…without having to overburden the patients with having to physically hand carry their blood test results, or their notes, discharge summaries, procedure notes.”
Along with providing outreach and education on working with the VHA, clinic staff addressed the need to educate patients more effectively, because they are seen as central to the information exchange. There is motivation on the part of patients to learn the system. “Just making sure that the patients realize that they need to tell their local providers to send us the records and make sure that there is an exchange going on consistently,” explained a case manager. “If the patient wants to get those medications that are costly, then they figure out pretty quick what they have to have, what they need to send to us.” The need for education is an ongoing process; who is responsible for this continues to be a point of debate.
Discussion
In order to better understand comanagement of dual-use patients, this study focused on the experiences and perceptions of staff at VHA primary care clinics in the upper Midwest. The data indicated that:
- VHA clinical staff perceive the primary reason patients choose to seek non-VHA care is because of access, convenience, and
distance - In order for comanagement to occur, communication and information exchange—currently facilitated largely by patients—needs to improve
- Education of patients and their non-VHA providers is recommended, to increase understanding of rules and regulations tied to exchange of patient information across health care systems
- Education may facilitate communication, develop relationships, and overcome barriers to information exchange
Distance to health care and perceived convenience were clearly seen by clinic staff as the driving factors behind their patients’ dual use. In the authors’ prior work, interviews with veterans and their VA providers supported this assertion as well; however, it was also found that distance must not be understood in isolation of other contingencies, such as urgency of need.4
Clinic staff identified institutional and individual barriers that lead to miscommunication and confusion on the part of patients and reported misunderstandings with non-VHA providers, including 3 potential barriers to comanagement. These included (1) inconsistent communication and flow of information between VHA and non-VHA providers; (2) uncertainty about who will (and should) be responsible for information flow between providers; and (3) VHA and federal regulations over patient privacy. Throughout the interviews, access to less expensive prescription medications in VHA was considered an additional driver of dual use. According to clinic staff interviewed, education of patients and non-VHA providers could facilitate efficient and safe comanagement for dual-use patients.7
This study suggests both advantages and disadvantages for patients choosing to use multiple health care systems from the perspective of the clinic staff. The primary advantage is better overall health care access, especially for rural patients and those with longer travel times to VHA facilities. The primary disadvantage of dual use is discontinuity of care between multiple care sites. Specifically, this study identified concerns regarding poor communication between providers and transfer of patient medical records. An underlying theme was a concern for quality of care and patient safety, which are recognized by others in the literature as potential consequences of inadequate comanagement.8-12
If there is one aspect of co-management for dual-use patients to target, this study’s findings point to developing strategies to improve communication between providers caring for dual-use patients and, more specifically, cultivating relationships that are currently underdeveloped. This will necessitate a clearer articulation of what constitutes a relationship between comanaging providers and is a direction for further research that would have applicability beyond VHA to any comanagement of patients using multiple health care systems.
There are 3 simultaneous, yet unrelated, factors that may contribute to increasing dual use. First is the rise in VHA eligible veterans from Operation Enduring Freedom, Operation Iraqi Freedom, and Operation New Dawn.13,14 All returning veterans who meet minimal requirements are eligible for 5 years of VHA health care. A large proportion of these individuals are in the Reserve and National Guard, most of whom have nonmilitary jobs that may provide employer-based health insurance. Thus, these veterans have a greater opportunity for dual use. Second, with the aging cohort of Vietnam-era veterans, a greater proportion is becoming Medicare eligible. Third, with the recent passing of the ACA, more patients, including veterans, may choose to purchase insurance through ACA health exchanges. Taken individually or collectively, these factors will likely have effects reaching beyond VHA, especially when veterans receiving care in non-VHA health care systems engage in dual use.3,13,15,16
Limitations
This study has a number of limitations. First, it was limited to VHA facilities located in the upper Midwest, which may limit generalizability to other parts of the country. The convenience sample of clinic staff at VHA clinics may not represent the full range of perspectives among HCPs generally. This study did not interview clinic staff in non-VHA clinics, although this has been the focus of other studies.17,18 Although dual use also applies to specialty care and related access issues in rural areas, this was not a focus of this study. Last, the data were collected in 2009, prior to the implementation of the patient-aligned care team (PACT) model and prior to the recently revealed issues regarding patient wait times for VHA care. Thus, perceptions may have changed, and additional study is needed.
Conclusions
The results of this study support prior assumptions of barriers to care, but also introduce previously unreported challenges. Dual use is perceived to have both positive and negative impacts, but for the positives to outweigh the negatives, thoughtful comanagement is critical. This may be particularly so in rural areas where dual use is encouraged as a way to overcome distance and increase convenience in accessing care.
As demonstrated by recent events, there are still VHA health care access issues for veterans. Recently, VA leadership and the U.S. Congress proposed that veterans have greater access to community providers as well as VHA in order to overcome delays in care.19 As this option is explored and put into practice, it is more important than ever to consider the need for care coordination and management of dual-use patients, to ensure good communication and care that is timely, safe, and high quality.
Few models exist in which 2 PCPs coordinate across health care systems, and greater understanding of this dual use is needed. This information is important in designing interventions to improve care coordination across systems to ensure continuity of care, patient safety, and patient satisfaction. Although some work has been done to examine the perspectives of non-VA PCPs, little is known about VHA provider perspectives on rural veteran dual use.17,18 This study explores VHA provider perspectives and identifies areas where interventions to improve care coordination across systems might be targeted.
Next steps for intervention studies would be to improve communication and develop educational tools to aid in the coordination of care between VHA and non-VHA providers. A recent example of this is the Co-Management Toolkit developed by the Veterans Rural Health Resource Center-Central Region, which provides information on VHA policies and targets non-VHA providers.20 Although VHA perceptions of comanageing dual-use patients were the target, a similar study of non-VHA providers is important to understand this complex and multifaceted dynamic. Additional work is needed to measure the impact of dual use on clinical outcomes, patient safety and quality, and efficient use of resources, as these are understudied. As dual use continues and potentially increases with the ACA and changing health care in the U.S., it is important to understand the management of patients using multiple health care systems. This is salient as primary care adopts the PACT model and to inform interventions to improve quality and safety while eliminating duplicative health care and costs.
Acknowledgements
The research reported here was supported by the Department of Veterans Affairs, Veterans Health Administration, Office of Rural Health, Veterans Rural Health Resource Center-Central Region (VRHRC-CR) and the VA Health Services Research and Development (HSR&D) Service, the Comprehensive Access and Delivery Research and Evaluation (CADRE) Center at the Iowa City VA Health Care System, and Center to Improve Veteran Involvement in Care (CIVIC) at VA Portland Health Care System. Dr. Reisinger was supported by a Research Career Development Award from the Health Services Research and Development Service, Department of Veterans Affairs (CD1 08-013-1).
We would like to thank all health care providers who graciously agreed to participate in this study and VRHRC-CR staff, in particular Monica Paez for assistance on this manuscript.
Author disclosures
The authors report no actual or potential conflicts of interest with regard to this article.
Disclaimer
The opinions expressed herein are those of the authors and do not necessarily reflect those of Federal Practitioner, Frontline Medical Communications Inc., the U.S. Government, or any of its agencies. This article may discuss unlabeled or investigational use of certain drugs. Please review complete prescribing information for specific drugs or drug combinations—including indications, contraindications, warnings, and adverse effects—before administering pharmacologic therapy to patients.
1. Department of Veterans Affairs Office of Rural Health, VHA. Veterans Rural Health: Perspectives and Opportunities. Rockville, MD: Booz Allen Hamilton; 2008. http://www.ruralhealth.va.gov/docs/PAO-final-report-0208.pdf. Accessed July 6, 2015.
2. Petersen LA, Byrne MM, Daw CN, Hasche J, Reis B, Pietz K. Relationship between clinical conditions and use of Veterans Affairs health care among Medicare‐enrolled veterans. Health Serv Res. 2010;45(3):762-791.
3. Liu CF, Chapko M, Bryson CL, et al. Use of outpatient care in Veterans Health Administration and Medicare among veterans receiving primary care in community-based and hospital outpatient clinics. Health Serv Res. 2010;45(5 pt 1):1268-1286.
4. Buzza C, Ono SS, Turvey C, et al. Distance is relative: unpacking a principal barrier in rural healthcare. J Gen Intern Med. 2011;26(suppl 2):648-654.
5. Bernard HR, Ryan GW. Analyzing Qualitative Data: Systematic Approaches. Los Angeles, CA: SAGE; 2010.
6. Guest G, Bunce A, Johnson L. How many interviews are enough? An experiment with data saturation and variability. Field Methods. 2006;18(1):59-82.
7. Kramer BJ, Vivrette RL, Satter DE, Jouldjian S, McDonald LR. Dual use of Veterans Health Administration and Indian Health Service: healthcare provider and patient perspectives. J Gen Intern Med. 2009;24(6):758-764.
8. Ajmera M, Wilkins TL, Sambamoorthi U. Dual Medicare and Veteran Health Administration use and ambulatory care sensitive hospitalizations. J Gen Intern Med. 2011;26(suppl 2):669-675.
9. Jia H, Zheng Y, Reker DM, et al. Multiple system utilization and mortality for veterans with stroke. Stroke. 2007;38(2):355-360.
10. Trivedi AN, Grebla RC, Jiang L, Yoon J, Mor V, Kizer KW. Duplicate federal payments for dual enrollees in Medicare Advantage plans and the Veterans Affairs health care system. JAMA. 2012;308(1):67-72.
11. Kaboli PJ, Shivapour DM, Henderson MS, Ishani A, Charlton ME. The impact of primary care dual-management on quality of care. J Prim Care Community Health. 2012;3(1):11-16.
12. Wolinsky FD, Miller TR, An H, Brezinski PR, Vaughn TE, Rosenthal GE. Dual use of Medicare and the Veterans Health Administration: are there adverse health outcomes? BMC Health Serv Res. 2006;6:131.
13. Liu CF, Bryson CL, Burgess JF Jr, Sharp N, Perkins M, Maciejewski ML. Use of outpatient care in VA and Medicare among disability-eligible and age-eligible veteran patients. BMC Health Serv Res. 2012;12:51.
14. Miller EA, Intrator O. Veterans use of non-VHA services: implications for policy and planning. Soc Work Public Health. 2012;27(4):379-391.
15. Bachman SS, Gonyea JG. Improving health care delivery to aging adults with disabilities: social work with dual eligibles in a climate of health care reform. J Gerontol Soc Work. 2012;55(2):191-207.
16. Kizer KW. Veterans and the Affordable Care Act. JAMA. 2012;307(8):789-790.
17. Lampman MA, Mueller KJ. Experiences of rural non-VA providers in treating dual care veterans and the development of electronic health information exchange networks between the two systems. J Rural Soc Sci. 2011;26(3):201-219.
18. Gaglioti A, Cozad A, Wittrock S, et al. Non-VA primary care providers’ perspectives on comanagement for rural veterans. Mil Med. 2014;179(11):1236-1243.
19. U.S. Department of Veterans Affairs. Acting Secretary Gibson outlines problems, actions taken, and budget resources needed to ensure access to care. U.S. Department of Veterans Affairs Website. http://www.va.gov/opa/pressrel/pressrelease.cfm?id=2586. Published July 16, 2014. Accessed July 6, 2015.
20. Office of Rural Health Central Region. Co-managed care toolkit. U.S. Department of Veterans Affairs Website. http://www.ruralhealth.va.gov/resource-centers/central/comanagement-toolkit.asp. Updated June 3, 2015. Accessed July 6, 2015.
Accelerated Hepatitis A and B Immunization in a Substance Abuse Treatment Program
Homeless individuals and IV drug users are susceptible to hepatitis A, B, and C infections, and co-infection with these diseases may complicate treatment and result in poor medical outcomes.1 Vaccination offers the best protection against hepatitis A and B, particularly among high-risk populations.2,3 Immunization against hepatitis A and B is of even greater importance for patients with hepatitis C, because there is no specific hepatitis C vaccine, and concomitant infections of B with C are damaging to the liver.4
Veterans have a rate of hepatitis C infection that is 3 times that of the general population.5 Some evidence exists that veterans with serious mental illness (SMI) have a higher rate of hepatitis C infection relative to patients without SMI. Co-occurring substance abuse may add another layer of vulnerability to hepatitis C infection, particularly for homeless veterans.5-7
Mental Health and Primary Care Integration
Substance abuse and dual-diagnosis treatment programs (ie, those programs that treat both substance abuse and co-occurring serious mental health problems, such as bipolar disorder, severe major depressive disorder, psychotic disorders, and posttraumatic stress disorder [PTSD]) that have integrated mental health and primary care into their treatment programs may offer a window of opportunity for risk-reducing interventions. These interventions include testing and education of patients regarding infectious diseases, such as viral hepatitis and HIV, and completion of the hepatitis A/B immunization series.
The James A. Haley Veterans’ Hospital (JAHVH) in Tampa, Florida, has demonstrated some limited success in the past with integrating a standard dosing schedule for hepatitis A/B vaccination into its substance abuse treatment program (SATP), though recent evidence points to more promising results using an accelerated regimen as indicated by a high completion rate for hepatitis B vaccination in a methadone clinic.8,9 A relatively low proportion of SATPs in the U.S. provide testing, education, or vaccination for hepatitis A and B, especially considering the public health importance of controlling these diseases in the substance abusing populations.10,11
Related: Combination Pill Approved for HCV
In 1999, a primary care team was added to the alcohol and drug abuse treatment program at JAHVH.In 2005, the nurses in the program began scheduling vaccinations and screening patients for medical and psychiatric issues, pain, hypertension, diabetes, hepatitis C, alcohol use, depression, PTSD, prostate and colorectal cancers.12 Such a multidisciplinary approach provides many treatment advantages for patients and may save lives.13
Even with a multidisciplinary approach, the nurses found it difficult to provide adequate hepatitis A/B immunization within the 3- to 6-week intensive SATP, because standard immunization dosing regimens are spread over 6 months.14 As with all types of immunizations, long dosing schedules may reduce patient adherence and result in inadequate seroprotection.15 Thus, there is a need to provide a completed immunization series in a more expeditious fashion, and an accelerated dosing regimen makes that possible.15,16
Hepatitis A/B Vaccination
Twinrix (GlaxoSmithKline, Brentford, United Kingdom) is a vaccine that provides dual immunization for hepatitis A and B. Whereas the standard vaccination schedule takes 6 months to complete, the accelerated dosing schedule can be used to complete the first 3 doses in less than a month. The accelerated dosing schedule was incorporated into the JAHVH clinic to capture as many patients as possible in the 3- to 6-week time frame: The first dose is administered and followed by a second dose 7 days later. The third dose is administered 21 to 30 days after the first dose. Twelve months after the first dose, a booster dose is given.
After the first 3 accelerated doses, > 98% of patients show a sustained immune response to hepatitis A, and > 63% demonstrate immunity to hepatitis B. If a 12-month booster injection is given, 100% of patients may receive immunity to hepatitis A and > 96% may have immunity to hepatitis B.16 Another study of the combined vaccine showed even greater seroprotection for hepatitis A and B after only 1 month, 100% and 82%, respectively.17
Related: Viral Hepatitis Awareness
This JAHVH retrospective feasibility study describes a risk-reduction program for hepatitis A/B prevention that was implemented within a 3- to 4-week intensive outpatient SATP and a 6-week dual-diagnosis treatment program. The study includes the development and implementation of the program, designed to vaccinate patients using the accelerated Twinrix schedule. To ascertain the feasibility of this vaccination approach, historical medical records were used to describe and examine the vaccination initiation and follow-up rates of the treatment program participants who received the hepatitis A/B immunization series during their intensive SATP.
Study Design
A retrospective review of medical records was conducted for all participants who were admitted to the intensive JAHVH SATP between October 1, 2008, and September 30, 2009. This study was reviewed and approved by the JAHVH research and development committee and its associated University of South Florida institutional review board. Informed consent to participate was not obtained, because the study was retrospective.
Patient Identification and Education
All program participants were offered testing for HIV and hepatitis A, B, and C. Program participants were educated about hepatitis and HIV transmission, as well as about the long-term effects of continued substance abuse on the progression of hepatitis C. Education about hepatitis, HIV, and substance abuse was provided in a group setting by a member of the program’s nursing staff. One-on-one risk education counseling was also provided when requested or otherwise indicated.
Laboratory testing was performed following each participant’s initial physical examination (within 3 to 5 days of program admission), and the nursing staff reviewed the results before vaccination. Explanation of laboratory results and an individualized immunization regimen were provided to each participant. On review of participants’ laboratory results, those with seroconversion of both hepatitis A and B were not given the combined immunization. Participants who had seroconversion of hepatitis A were offered the hepatitis B vaccination series, and vice versa.
Immunization Process
Participants who lacked prior immunization for hepatitis A and B and had no seroconversion of either hepatitis A or B were offered vaccination. Some patients declined vaccination, even though they were eligible. Their reasons were not formally assessed.
Related: Nivolumab Approved for Expanded Indication
Patients who accepted the vaccination were given the accelerated regimen.16 Participants were educated on the importance of compliance with the vaccination series and provided with follow-up immunization dates and a reminder for the 1-year booster vaccine. The immunizations were ordered by the program’s primary care NP and administered by a licensed practical nurse. The nurse who administered the injections took responsibility for scheduling the patients for all their subsequent injections, including the 1-year booster.
Follow-up Care
If the third injection was not completed before discharge, patients were given a follow-up appointment with the nurse if they remained in the JAHVH service area. If they were leaving the area, they were given instructions on how to follow-up at another VA facility to continue their immunization schedule. A note was written in the electronic medical record documenting their abbreviated hepatitis A/B immunization schedule, which could be accessed by other providers at other VA facilities. Patients who did not show up for any follow-up appointments (third injection or the 1-year booster injection) were contacted and reminded about the importance of completing the immunization series and to schedule an appointment.
Statistical Analysis
All data were analyzed using IBM Statistical Package for the Social Sciences (IBM SPSS, Armonk, New York) with a focus on identifying differences between vaccination-eligible patients (n = 269) who did (n = 128) and did not (n = 141) initiate the immunization schedule during the treatment program. Chi-square and Fisher exact tests were used to assess statistical differences in initiation of the immunization schedule related to categoric variables (ie, marital status, race, history of IV drug abuse, cigarette smoking status, housing status, legal status, history of combat, having a psychiatric or medical diagnosis, and program track). Independent sample t tests were used to test for differences between these 2 groups on the continuous variables, including age, number of previous treatment programs, Global Assessment of Functioning score, severity of smoking dependence as measured by the Fagerström Test for Nicotine Dependence, and the Addiction Severity Index scales.18-20
Results
The sample consisted of 284 successive admissions to an intensive outpatient program for veterans with substance use disorders. About one-third of the patients were homeless at the time of admission to the treatment, and 87% required contracted housing while completing treatment for reasons related to lack of housing, transportation, clinical necessity, or a combination of those factors (Table 1). The most common substance problems were alcohol and cocaine dependence, and 21% (n = 59) of the patients acknowledged a history of IV drug use during their initial psychiatric evaluation. Seventy percent were dually diagnosed with some other Axis I disorder, and 40% had a history of serious mental illness. More than one-fourth (n = 77) of the patients admitted to the intensive outpatient SATP were seropositive for hepatitis A, B and/or C, and the most common hepatitis diagnosis was hepatitis C (n = 71).
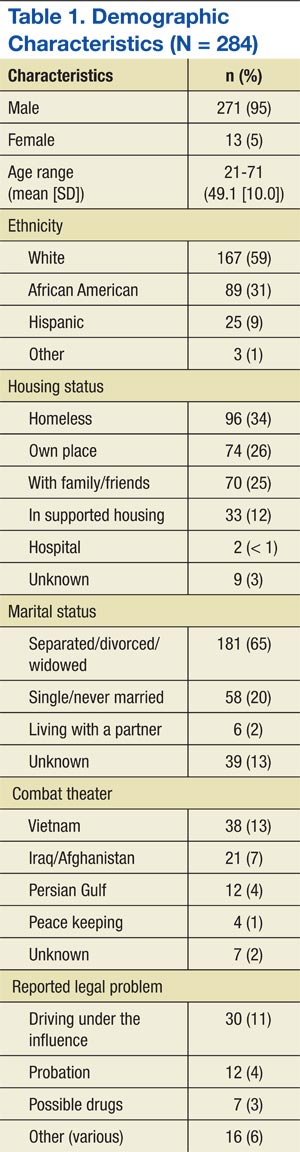
Accelerated Immunization Regimen
Patients were eligible to receive the accelerated vaccination schedule only if they had no prior immunization for hepatitis A or B and if they had no seroconversion for either hepatitis A or B. Six people had hepatitis B alone, 7 had hepatitis B and C, 1 had hepatitis A and C, and 1 had all 3 (Table 2). Thus, 15 participants were ineligible to receive the accelerated hepatitis A/B immunization. Chi-square, Fisher exact, and independent sample t tests showed that among those who were vaccination-eligible (269), there were no significant differences in any of the demographic or clinical characteristics between those who initiated the vaccination schedule and those who did not. Among those who completed the first 3 vaccine injections, those who received the 1-year booster injection (54) did not differ (on any demographic or clinical variables) from those who did not (58).
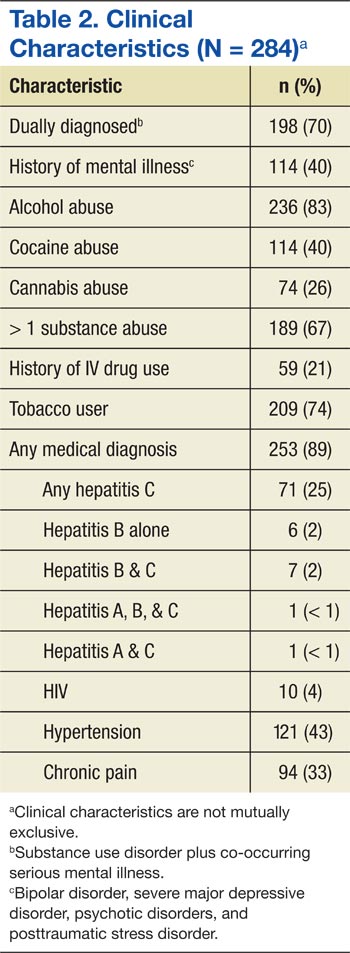
Nearly half (48%) of all the eligible patients admitted to the program began the accelerated immunization schedule for hepatitis A and B. Of those, 88% completed the first 3 injections in the series. Among the patients who received the first 3 injections, 48% received the 1-year booster injection—a 20% completion rate for the vaccination-eligible sample overall (Table 3).
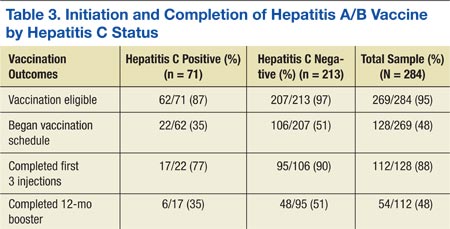
Of the 74 patients who did not complete their vaccinations once initiating the accelerated schedule, the most common reason identified was that the patient moved away (37), or no reason could be identified (33). It was uncommon for a patient not to complete the vaccination schedule because of terminating treatment prematurely (4).
Compared with the vaccine-eligible patients without hepatitis C (207), patients with hepatitis C were less likely to receive any vaccination injections (Table 3). Specifically, 51% of the vaccination-eligible patients who did not have hepatitis C began the vaccination regimen. However, only 22 patients with hepatitis C, or
35% of all vaccination-eligible patients with hepatitis C, began the vaccination regimen. Patients with hepatitis C were also less likely than those without hepatitis C to complete the first 3 injections of the vaccination series once they had initiated it (77%, vs 90%, respectively). This difference continued to be apparent at the time of the 12-month booster injection. Only 35% of vaccine-eligible individuals with hepatitis C received the 12-month booster injection, whereas 51% of vaccination-eligible individuals without hepatitis C received the 12-month booster injection. As with the sample overall, the most common reason patients with hepatitis C did not complete the vaccination regimen was because they moved away (9), followed by no identified reason (5), and premature termination of treatment (2).
Discussion
Individuals abusing alcohol and drugs have an increased vulnerability for infectious diseases, and homeless veterans with substance use disorders may be at a particularly heightened risk.21,22 This study describes a sample of veterans, many were homeless and most were dually diagnosed, in an intensive outpatient SATP that offered an accelerated dosing regimen for hepatitis A and B vaccination. Almost half (48%) of the vaccination-eligible patients began the accelerated regimen for hepatitis A/B vaccination. Moreover, 88% of those who started the vaccination regimen received the first 3 injections of the series, thus possibly conferring substantial immunity to hepatitis A and B and demonstrating the feasibility of an accelerated vaccination schedule in an intensive outpatient SATP.
It is especially important to demonstrate the successful integration of a hepatitis screening and immunization program within a SATP, given that many such programs do not offer screening or immunization for hepatitis, even though substance abusers are disproportionately affected by the disease and contribute greatly to the ongoing hepatitis epidemic.10,11 This study’s results were in line with another study of rapid vaccination for hepatitis B in IV drug users being treated in a methadone clinic, where 83% of the vaccination initiators completed the first 3 injections of the series.9
Unvaccinated Patients
The treatment team in the current study seemed to be less effective at reaching the subset of vaccination-eligible veterans with hepatitis C (almost one-quarter of the sample) in order to administer the accelerated vaccination schedule, as indicated by the lower rate of vaccination initiation as well as a lower rate of completion of the vaccination series among those patients. This replicates a finding from another study that also indicated a low rate of hepatitis A and B vaccination among patients with hepatitis C.23 Only 35% of the vaccination-eligible patients with hepatitis C in the current study initiated the vaccination series, compared with 51% of the patients without hepatitis C. However, the rate of completion of the first 3 injections of the series in the hepatitis C group was respectably high (77%), especially given the high relapse rate and psychosocial instability of individuals with addictive disorders. Initiation seems to be a bigger obstacle than completion of at least the first 3 injections of the vaccination series in both patients with and without hepatitis C.
The study investigators did not formally assess the reasons that more than half the patients in the study did not begin the vaccination series, but anecdotal evidence from the nurses indicated that many patients were afraid of needles. In addition, other patients felt that they simply did not need the vaccination. Some also insisted that they had already had the vaccination despite a blood test showing no evidence for either hepatitis A or B immunization.
Although the nursing team provided group and individual risk-based education as well as information about the effects of continued substance abuse on hepatitis C, it is possible that patients still underestimated their own risk of hepatitis infection and its consequences, or perhaps the information was simply not retained.24
Patient Education
A recent study showed that there is a positive relationship between the amount of hepatitis counseling received and knowledge of hepatitis.25 Possibly, increased intensity of education efforts may make an impact on initiation rates. Encouragingly, there is also evidence that prompting people to predict their future vaccination behavior may increase vaccination initiation rates despite a high-degree of short-term barriers, such as perceived pain or inconvenience.26 A brief intervention to induce people to formulate their future intentions would be relatively easy to incorporate into a vaccination program, and the study team is considering options for this to improve vaccination initiation rates.
Patients can expect to achieve substantial immunity from hepatitis A and, to a lesser degree, hepatitis B after completing the first 3 injections of the series, although the best seroprotection from both is obtained by completing the 12-month booster injection as well.17 Overall, about half of all patients who completed the first 3 injections returned for the booster shot, but only 35% of the patients with hepatitis C did so. The most common known cause of any patient not receiving the booster was movement out of the geographic area. However, much of the time the investigators were unable to determine the reasons patients did not return for the booster shot.
Medication adherence is a difficult problem with vaccination in high-risk samples, although Stitzer and colleagues found a significant improvement in follow-up for a 6-month vaccination protocol by using monetary incentives.27 In addition to ensuring medication adherence, it would also be of value for future immunization efforts to include testing to assess whether seroconversion has occurred once the vaccinations are complete, which is the ultimate measure of the success of a vaccination program. Most patients in the current study did not receive such testing at the completion of their vaccination schedules, and thus, seroconversion rates could not be determined. However, existing studies suggest high rates of seroprotection after the first 3 doses of the combined vaccine.10,17
Limitations
The retrospective nature of the study is its most significant limitation. Any conclusions about the results must be made with caution. However, this design allowed for a naturalistic and potentially generalizable investigation into the application of a vaccination program in a real-world treatment setting. As such, the investigators were able to demonstrate the feasibility of conducting a rapid vaccination program within a 3- to 6-week SATP.
The retrospective nature of the study also limited a full investigation into the reasons behind the lack of vaccination initiation and vaccination noncompletion among the study’s treatment population, especially with regard to the follow-up booster injection. Initial statistical comparisons of initiators and noninitiators and completers and noncompleters showed no significant statistical differences between the groups. Future prospective designs should take into account the need to successfully initiate and complete vaccinations for all eligible patients and include assessment measures to determine the specific reasons that patients did not initiate or complete their vaccinations.
Conclusions
Many patients began and completed the accelerated vaccination schedule for hepatitis A and B in the context of a 3- to 6-week SATP at JAHVH. The overall vaccination rate, including the 12-month booster injection, was one-fifth of the entire vaccination-eligible sample. Additionally, 88% of the vaccination-eligible patients who began the vaccination schedule (or 42% of the whole sample) completed at least the first 3 doses, which may confer substantial immunity from hepatitis A and B. For reasons not entirely clear, a little less than half the vaccination-eligible patients began the vaccination schedule, and only about 50% of those returned to receive their 12-month booster injection. Future prospective studies may be able to determine barriers to both the initiation of and adherence to the vaccination protocol.
The results of this study are also a testament to having primary care nursing staff available and actively involved in the care of patients in a SATP. It seems likely that additional interventions might be needed for outreach to and retention of patients in need of vaccination for hepatitis A and B, and particularly those patients with hepatitis C. It is important to find ways to increase the rates of 12-month booster vaccinations, both for veterans who continue to receive services at JAHVH and for those who transfer care to other VA facilities. Finally, testing to confirm serologic immunity to hepatitis A and hepatitis B would be the next step in the effort to eliminate the risk of hepatitis A and hepatitis B and minimize additional harm for those with hepatitis C in the population receiving treatment for addictive disorders.
Author disclosures
The authors report no actual or potential conflicts of interest with regard to this article.
Disclaimer
The opinions expressed herein are those of the authors and do not necessarily reflect those of Federal Practitioner, Frontline Medical Communications Inc., the U.S. Government, or any of its agencies. This article may discuss unlabeled or investigational use of certain drugs. Please review the complete prescribing information for specific drugs or drug combinations—including indications, contraindications, warnings, and adverse effects—before administering pharmacologic therapy to patients.
1. Nyamathi A, Liu Y, Marfisee M, et al. Effects of a nurse-managed program on hepatitis A and B vaccine completion among homeless adults. Nurs Res. 2009;58(1):13-22.
2. Center for Disease Control and Prevention (CDC). A comprehensive immunization strategy to eliminate transmission of hepatitis B virus infection in the United States. MMWR Morb Mortal Wkly Rep. 2006;55(RR16):1-25.
3. Advisory Committee on Immunization Practices (ACIP), Fiore AE, Wasley A, Bell BP. Prevention of hepatitis A through active or passive immunization: recommendations of the Advisory Committee on Immunization Practices (ACIP). MMWR Morb Mortal Wkly Rep. 2006;55(RR07):1-23.
4. Weltman MD, Brotodihardjo A, Crewe EB, et al. Coinfection with hepatitis B and C or B, C and delta viruses results in severe chronic liver disease and responds poorly to interferon-alpha treatment. J Viral Hepat. 1995;2(1):39-45.
5. Groessl EJ, Weingart KR, Kaplan RM, et al. Living with hepatitis C: qualitative interviews with hepatitis C-infected veterans. J Gen Intern Med. 2008;23(12):1959-1965.
6. Dominitz JA, Boyko EJ, Koepsell TD, et al. Elevated prevalence of hepatitis C infection in users of United States veterans medical centers. Hepatology. 2005;41(1):88-96.
7. Himeloch S, McCarthy JF, Ganoczy D, et al. Understanding associations between serious mental illness and hepatitis C virus among veterans: a national multivariate analysis. Psychosomatics. 2009;50(1):30-37.
8. Hagedorn H, Dieperink E, Dingmann D, et al. Integrating hepatitis prevention services into a substance use disorder clinic. J Subst Abuse Treat. 2007;32(4):391-398.
9. Ramasamy P, Lintzeris N, Sutton Y, Taylor H, Day CA, Haber PS. The outcome of a rapid hepatitis B vaccination programme in a methadone treatment clinic. Addiction. 2010;105(2):329-334.
10. Bini EJ, Kritz S, Brown LS Jr, et al. Hepatitis B virus and hepatitis C virus services offered by substance abuse treatment programs in the United States. J Subst Abuse Treat. 2012;42(4):438-445.
11. Recommendations for prevention and control of hepatitis C virus (HCV) infection and HCV-related chronic disease. Centers for Disease Control and Prevention. MMWR Morb Mortal Wkly Rep. 1998;47(RR-19):1-39.
12. Francis E, Gonzales-Nolas CL, Markowitz J, Phillips S. Integration of preventive health screening into mental health clinics. Fed Pract. 2008;25(2):39-50.
13. Vreeland B. Bridging the gap between mental and physical health: a multidisciplinary approach. J Clin Psychiatry. 2007;68(suppl 4):26-33.
14. Brim N, Zaller N, Taylor LE, Feller E. Twinrix vaccination schedules among injecting drug users. Expert Opin Biol Ther. 2007;7(3):379-389.
15. Zuckerman J. The place of accelerated schedules for hepatitis A and B vaccinations. Drugs. 2003;63(17):1779-1784.
16. Connor BA, Blatter MM, Beran J, Zou B, Trofa AF. Rapid and sustained immune response against hepatitis A and B achieved with combined vaccine using an accelerated administration schedule. J Travel Med. 2007;14(1):9-15.
17. Nothdurft HD, Dietrich M, Zuckerman JN, et al. A new accelerated vaccination schedule for rapid protection against hepatitis A and B. Vaccine. 2002;20(7-8):1157-1162.
18. American Psychiatric Association. Diagnostic and Statistical Manual of Mental Disorders, 4th Edition, Text Revision (DSM-IV-TR). Washington, DC: American Psychiatric Association; 2000.
19. Heatherton TF, Kozlowski LT, Frecker RC, Fagerström KO. The Fagerström Test for Nicotine Dependence: a revision of the Fagerström Tolerance Questionnaire. Br J Addict. 1991;86(9):1119-1127.
20. McLellan AT, Kushner H, Metzger D, et al. The Fifth Edition of the Addiction Severity Index. J Subst Abuse Treat. 1992;9(3):199-213.
21. Batki SL, Nathan KI. HIV/AIDS and Hepatitis C. In: Galanter M, Kleber HD, Brady KT, eds. The American Psychiatric Publishing Textbook of Substance Abuse Treatment. 5th ed. Arlington, VA: American Psychiatric Publishing; 2015.
22. Gelberg L, Robertson MJ, Leake B, et al. Hepatitis B among homeless and other impoverished US military veterans in residential care in Los Angeles. Public Health. 2001;115(4):286-291.
23. Felsen UR, Fishbein DA, Litwin AH. Low rates of hepatitis A and B vaccination in patients with chronic hepatitis C at an urban methadone maintenance program. J Addict Dis. 2010;29(4):461-465.
24. Brewer NT, Chapman GB, Gibbons FX, Gerrard M, McCaul KD, Weinstein ND. Meta-analysis of the relationship between risk perception and health behavior: the example of vaccination. Health Psychol. 2007;26(2):136-145.
25. Soto-Salgado M, Suárez E, Ortiz AP, et al. Knowledge of viral hepatitis among Puerto Rican adults: implications for prevention. J Community Health. 2011;36(4):565-573.
26. Cox AD, Cox D, Cyrier R, Graham-Dotson Y, Zimet GD. Can self-prediction overcome barriers to hepatitis B vaccination? A randomized controlled trial. Health Psychol. 2012;31(1):97-105.
27. Stitzer ML, Polk T, Bowles S, Kosten T. Drug users’ adherence to a 6-month vaccination protocol: effects of motivational incentives. Drug Alcohol Depend. 2010;107(1):76-79.
Homeless individuals and IV drug users are susceptible to hepatitis A, B, and C infections, and co-infection with these diseases may complicate treatment and result in poor medical outcomes.1 Vaccination offers the best protection against hepatitis A and B, particularly among high-risk populations.2,3 Immunization against hepatitis A and B is of even greater importance for patients with hepatitis C, because there is no specific hepatitis C vaccine, and concomitant infections of B with C are damaging to the liver.4
Veterans have a rate of hepatitis C infection that is 3 times that of the general population.5 Some evidence exists that veterans with serious mental illness (SMI) have a higher rate of hepatitis C infection relative to patients without SMI. Co-occurring substance abuse may add another layer of vulnerability to hepatitis C infection, particularly for homeless veterans.5-7
Mental Health and Primary Care Integration
Substance abuse and dual-diagnosis treatment programs (ie, those programs that treat both substance abuse and co-occurring serious mental health problems, such as bipolar disorder, severe major depressive disorder, psychotic disorders, and posttraumatic stress disorder [PTSD]) that have integrated mental health and primary care into their treatment programs may offer a window of opportunity for risk-reducing interventions. These interventions include testing and education of patients regarding infectious diseases, such as viral hepatitis and HIV, and completion of the hepatitis A/B immunization series.
The James A. Haley Veterans’ Hospital (JAHVH) in Tampa, Florida, has demonstrated some limited success in the past with integrating a standard dosing schedule for hepatitis A/B vaccination into its substance abuse treatment program (SATP), though recent evidence points to more promising results using an accelerated regimen as indicated by a high completion rate for hepatitis B vaccination in a methadone clinic.8,9 A relatively low proportion of SATPs in the U.S. provide testing, education, or vaccination for hepatitis A and B, especially considering the public health importance of controlling these diseases in the substance abusing populations.10,11
Related: Combination Pill Approved for HCV
In 1999, a primary care team was added to the alcohol and drug abuse treatment program at JAHVH.In 2005, the nurses in the program began scheduling vaccinations and screening patients for medical and psychiatric issues, pain, hypertension, diabetes, hepatitis C, alcohol use, depression, PTSD, prostate and colorectal cancers.12 Such a multidisciplinary approach provides many treatment advantages for patients and may save lives.13
Even with a multidisciplinary approach, the nurses found it difficult to provide adequate hepatitis A/B immunization within the 3- to 6-week intensive SATP, because standard immunization dosing regimens are spread over 6 months.14 As with all types of immunizations, long dosing schedules may reduce patient adherence and result in inadequate seroprotection.15 Thus, there is a need to provide a completed immunization series in a more expeditious fashion, and an accelerated dosing regimen makes that possible.15,16
Hepatitis A/B Vaccination
Twinrix (GlaxoSmithKline, Brentford, United Kingdom) is a vaccine that provides dual immunization for hepatitis A and B. Whereas the standard vaccination schedule takes 6 months to complete, the accelerated dosing schedule can be used to complete the first 3 doses in less than a month. The accelerated dosing schedule was incorporated into the JAHVH clinic to capture as many patients as possible in the 3- to 6-week time frame: The first dose is administered and followed by a second dose 7 days later. The third dose is administered 21 to 30 days after the first dose. Twelve months after the first dose, a booster dose is given.
After the first 3 accelerated doses, > 98% of patients show a sustained immune response to hepatitis A, and > 63% demonstrate immunity to hepatitis B. If a 12-month booster injection is given, 100% of patients may receive immunity to hepatitis A and > 96% may have immunity to hepatitis B.16 Another study of the combined vaccine showed even greater seroprotection for hepatitis A and B after only 1 month, 100% and 82%, respectively.17
Related: Viral Hepatitis Awareness
This JAHVH retrospective feasibility study describes a risk-reduction program for hepatitis A/B prevention that was implemented within a 3- to 4-week intensive outpatient SATP and a 6-week dual-diagnosis treatment program. The study includes the development and implementation of the program, designed to vaccinate patients using the accelerated Twinrix schedule. To ascertain the feasibility of this vaccination approach, historical medical records were used to describe and examine the vaccination initiation and follow-up rates of the treatment program participants who received the hepatitis A/B immunization series during their intensive SATP.
Study Design
A retrospective review of medical records was conducted for all participants who were admitted to the intensive JAHVH SATP between October 1, 2008, and September 30, 2009. This study was reviewed and approved by the JAHVH research and development committee and its associated University of South Florida institutional review board. Informed consent to participate was not obtained, because the study was retrospective.
Patient Identification and Education
All program participants were offered testing for HIV and hepatitis A, B, and C. Program participants were educated about hepatitis and HIV transmission, as well as about the long-term effects of continued substance abuse on the progression of hepatitis C. Education about hepatitis, HIV, and substance abuse was provided in a group setting by a member of the program’s nursing staff. One-on-one risk education counseling was also provided when requested or otherwise indicated.
Laboratory testing was performed following each participant’s initial physical examination (within 3 to 5 days of program admission), and the nursing staff reviewed the results before vaccination. Explanation of laboratory results and an individualized immunization regimen were provided to each participant. On review of participants’ laboratory results, those with seroconversion of both hepatitis A and B were not given the combined immunization. Participants who had seroconversion of hepatitis A were offered the hepatitis B vaccination series, and vice versa.
Immunization Process
Participants who lacked prior immunization for hepatitis A and B and had no seroconversion of either hepatitis A or B were offered vaccination. Some patients declined vaccination, even though they were eligible. Their reasons were not formally assessed.
Related: Nivolumab Approved for Expanded Indication
Patients who accepted the vaccination were given the accelerated regimen.16 Participants were educated on the importance of compliance with the vaccination series and provided with follow-up immunization dates and a reminder for the 1-year booster vaccine. The immunizations were ordered by the program’s primary care NP and administered by a licensed practical nurse. The nurse who administered the injections took responsibility for scheduling the patients for all their subsequent injections, including the 1-year booster.
Follow-up Care
If the third injection was not completed before discharge, patients were given a follow-up appointment with the nurse if they remained in the JAHVH service area. If they were leaving the area, they were given instructions on how to follow-up at another VA facility to continue their immunization schedule. A note was written in the electronic medical record documenting their abbreviated hepatitis A/B immunization schedule, which could be accessed by other providers at other VA facilities. Patients who did not show up for any follow-up appointments (third injection or the 1-year booster injection) were contacted and reminded about the importance of completing the immunization series and to schedule an appointment.
Statistical Analysis
All data were analyzed using IBM Statistical Package for the Social Sciences (IBM SPSS, Armonk, New York) with a focus on identifying differences between vaccination-eligible patients (n = 269) who did (n = 128) and did not (n = 141) initiate the immunization schedule during the treatment program. Chi-square and Fisher exact tests were used to assess statistical differences in initiation of the immunization schedule related to categoric variables (ie, marital status, race, history of IV drug abuse, cigarette smoking status, housing status, legal status, history of combat, having a psychiatric or medical diagnosis, and program track). Independent sample t tests were used to test for differences between these 2 groups on the continuous variables, including age, number of previous treatment programs, Global Assessment of Functioning score, severity of smoking dependence as measured by the Fagerström Test for Nicotine Dependence, and the Addiction Severity Index scales.18-20
Results
The sample consisted of 284 successive admissions to an intensive outpatient program for veterans with substance use disorders. About one-third of the patients were homeless at the time of admission to the treatment, and 87% required contracted housing while completing treatment for reasons related to lack of housing, transportation, clinical necessity, or a combination of those factors (Table 1). The most common substance problems were alcohol and cocaine dependence, and 21% (n = 59) of the patients acknowledged a history of IV drug use during their initial psychiatric evaluation. Seventy percent were dually diagnosed with some other Axis I disorder, and 40% had a history of serious mental illness. More than one-fourth (n = 77) of the patients admitted to the intensive outpatient SATP were seropositive for hepatitis A, B and/or C, and the most common hepatitis diagnosis was hepatitis C (n = 71).
Accelerated Immunization Regimen
Patients were eligible to receive the accelerated vaccination schedule only if they had no prior immunization for hepatitis A or B and if they had no seroconversion for either hepatitis A or B. Six people had hepatitis B alone, 7 had hepatitis B and C, 1 had hepatitis A and C, and 1 had all 3 (Table 2). Thus, 15 participants were ineligible to receive the accelerated hepatitis A/B immunization. Chi-square, Fisher exact, and independent sample t tests showed that among those who were vaccination-eligible (269), there were no significant differences in any of the demographic or clinical characteristics between those who initiated the vaccination schedule and those who did not. Among those who completed the first 3 vaccine injections, those who received the 1-year booster injection (54) did not differ (on any demographic or clinical variables) from those who did not (58).
Nearly half (48%) of all the eligible patients admitted to the program began the accelerated immunization schedule for hepatitis A and B. Of those, 88% completed the first 3 injections in the series. Among the patients who received the first 3 injections, 48% received the 1-year booster injection—a 20% completion rate for the vaccination-eligible sample overall (Table 3).
Of the 74 patients who did not complete their vaccinations once initiating the accelerated schedule, the most common reason identified was that the patient moved away (37), or no reason could be identified (33). It was uncommon for a patient not to complete the vaccination schedule because of terminating treatment prematurely (4).
Compared with the vaccine-eligible patients without hepatitis C (207), patients with hepatitis C were less likely to receive any vaccination injections (Table 3). Specifically, 51% of the vaccination-eligible patients who did not have hepatitis C began the vaccination regimen. However, only 22 patients with hepatitis C, or
35% of all vaccination-eligible patients with hepatitis C, began the vaccination regimen. Patients with hepatitis C were also less likely than those without hepatitis C to complete the first 3 injections of the vaccination series once they had initiated it (77%, vs 90%, respectively). This difference continued to be apparent at the time of the 12-month booster injection. Only 35% of vaccine-eligible individuals with hepatitis C received the 12-month booster injection, whereas 51% of vaccination-eligible individuals without hepatitis C received the 12-month booster injection. As with the sample overall, the most common reason patients with hepatitis C did not complete the vaccination regimen was because they moved away (9), followed by no identified reason (5), and premature termination of treatment (2).
Discussion
Individuals abusing alcohol and drugs have an increased vulnerability for infectious diseases, and homeless veterans with substance use disorders may be at a particularly heightened risk.21,22 This study describes a sample of veterans, many were homeless and most were dually diagnosed, in an intensive outpatient SATP that offered an accelerated dosing regimen for hepatitis A and B vaccination. Almost half (48%) of the vaccination-eligible patients began the accelerated regimen for hepatitis A/B vaccination. Moreover, 88% of those who started the vaccination regimen received the first 3 injections of the series, thus possibly conferring substantial immunity to hepatitis A and B and demonstrating the feasibility of an accelerated vaccination schedule in an intensive outpatient SATP.
It is especially important to demonstrate the successful integration of a hepatitis screening and immunization program within a SATP, given that many such programs do not offer screening or immunization for hepatitis, even though substance abusers are disproportionately affected by the disease and contribute greatly to the ongoing hepatitis epidemic.10,11 This study’s results were in line with another study of rapid vaccination for hepatitis B in IV drug users being treated in a methadone clinic, where 83% of the vaccination initiators completed the first 3 injections of the series.9
Unvaccinated Patients
The treatment team in the current study seemed to be less effective at reaching the subset of vaccination-eligible veterans with hepatitis C (almost one-quarter of the sample) in order to administer the accelerated vaccination schedule, as indicated by the lower rate of vaccination initiation as well as a lower rate of completion of the vaccination series among those patients. This replicates a finding from another study that also indicated a low rate of hepatitis A and B vaccination among patients with hepatitis C.23 Only 35% of the vaccination-eligible patients with hepatitis C in the current study initiated the vaccination series, compared with 51% of the patients without hepatitis C. However, the rate of completion of the first 3 injections of the series in the hepatitis C group was respectably high (77%), especially given the high relapse rate and psychosocial instability of individuals with addictive disorders. Initiation seems to be a bigger obstacle than completion of at least the first 3 injections of the vaccination series in both patients with and without hepatitis C.
The study investigators did not formally assess the reasons that more than half the patients in the study did not begin the vaccination series, but anecdotal evidence from the nurses indicated that many patients were afraid of needles. In addition, other patients felt that they simply did not need the vaccination. Some also insisted that they had already had the vaccination despite a blood test showing no evidence for either hepatitis A or B immunization.
Although the nursing team provided group and individual risk-based education as well as information about the effects of continued substance abuse on hepatitis C, it is possible that patients still underestimated their own risk of hepatitis infection and its consequences, or perhaps the information was simply not retained.24
Patient Education
A recent study showed that there is a positive relationship between the amount of hepatitis counseling received and knowledge of hepatitis.25 Possibly, increased intensity of education efforts may make an impact on initiation rates. Encouragingly, there is also evidence that prompting people to predict their future vaccination behavior may increase vaccination initiation rates despite a high-degree of short-term barriers, such as perceived pain or inconvenience.26 A brief intervention to induce people to formulate their future intentions would be relatively easy to incorporate into a vaccination program, and the study team is considering options for this to improve vaccination initiation rates.
Patients can expect to achieve substantial immunity from hepatitis A and, to a lesser degree, hepatitis B after completing the first 3 injections of the series, although the best seroprotection from both is obtained by completing the 12-month booster injection as well.17 Overall, about half of all patients who completed the first 3 injections returned for the booster shot, but only 35% of the patients with hepatitis C did so. The most common known cause of any patient not receiving the booster was movement out of the geographic area. However, much of the time the investigators were unable to determine the reasons patients did not return for the booster shot.
Medication adherence is a difficult problem with vaccination in high-risk samples, although Stitzer and colleagues found a significant improvement in follow-up for a 6-month vaccination protocol by using monetary incentives.27 In addition to ensuring medication adherence, it would also be of value for future immunization efforts to include testing to assess whether seroconversion has occurred once the vaccinations are complete, which is the ultimate measure of the success of a vaccination program. Most patients in the current study did not receive such testing at the completion of their vaccination schedules, and thus, seroconversion rates could not be determined. However, existing studies suggest high rates of seroprotection after the first 3 doses of the combined vaccine.10,17
Limitations
The retrospective nature of the study is its most significant limitation. Any conclusions about the results must be made with caution. However, this design allowed for a naturalistic and potentially generalizable investigation into the application of a vaccination program in a real-world treatment setting. As such, the investigators were able to demonstrate the feasibility of conducting a rapid vaccination program within a 3- to 6-week SATP.
The retrospective nature of the study also limited a full investigation into the reasons behind the lack of vaccination initiation and vaccination noncompletion among the study’s treatment population, especially with regard to the follow-up booster injection. Initial statistical comparisons of initiators and noninitiators and completers and noncompleters showed no significant statistical differences between the groups. Future prospective designs should take into account the need to successfully initiate and complete vaccinations for all eligible patients and include assessment measures to determine the specific reasons that patients did not initiate or complete their vaccinations.
Conclusions
Many patients began and completed the accelerated vaccination schedule for hepatitis A and B in the context of a 3- to 6-week SATP at JAHVH. The overall vaccination rate, including the 12-month booster injection, was one-fifth of the entire vaccination-eligible sample. Additionally, 88% of the vaccination-eligible patients who began the vaccination schedule (or 42% of the whole sample) completed at least the first 3 doses, which may confer substantial immunity from hepatitis A and B. For reasons not entirely clear, a little less than half the vaccination-eligible patients began the vaccination schedule, and only about 50% of those returned to receive their 12-month booster injection. Future prospective studies may be able to determine barriers to both the initiation of and adherence to the vaccination protocol.
The results of this study are also a testament to having primary care nursing staff available and actively involved in the care of patients in a SATP. It seems likely that additional interventions might be needed for outreach to and retention of patients in need of vaccination for hepatitis A and B, and particularly those patients with hepatitis C. It is important to find ways to increase the rates of 12-month booster vaccinations, both for veterans who continue to receive services at JAHVH and for those who transfer care to other VA facilities. Finally, testing to confirm serologic immunity to hepatitis A and hepatitis B would be the next step in the effort to eliminate the risk of hepatitis A and hepatitis B and minimize additional harm for those with hepatitis C in the population receiving treatment for addictive disorders.
Author disclosures
The authors report no actual or potential conflicts of interest with regard to this article.
Disclaimer
The opinions expressed herein are those of the authors and do not necessarily reflect those of Federal Practitioner, Frontline Medical Communications Inc., the U.S. Government, or any of its agencies. This article may discuss unlabeled or investigational use of certain drugs. Please review the complete prescribing information for specific drugs or drug combinations—including indications, contraindications, warnings, and adverse effects—before administering pharmacologic therapy to patients.
1. Nyamathi A, Liu Y, Marfisee M, et al. Effects of a nurse-managed program on hepatitis A and B vaccine completion among homeless adults. Nurs Res. 2009;58(1):13-22.
2. Center for Disease Control and Prevention (CDC). A comprehensive immunization strategy to eliminate transmission of hepatitis B virus infection in the United States. MMWR Morb Mortal Wkly Rep. 2006;55(RR16):1-25.
3. Advisory Committee on Immunization Practices (ACIP), Fiore AE, Wasley A, Bell BP. Prevention of hepatitis A through active or passive immunization: recommendations of the Advisory Committee on Immunization Practices (ACIP). MMWR Morb Mortal Wkly Rep. 2006;55(RR07):1-23.
4. Weltman MD, Brotodihardjo A, Crewe EB, et al. Coinfection with hepatitis B and C or B, C and delta viruses results in severe chronic liver disease and responds poorly to interferon-alpha treatment. J Viral Hepat. 1995;2(1):39-45.
5. Groessl EJ, Weingart KR, Kaplan RM, et al. Living with hepatitis C: qualitative interviews with hepatitis C-infected veterans. J Gen Intern Med. 2008;23(12):1959-1965.
6. Dominitz JA, Boyko EJ, Koepsell TD, et al. Elevated prevalence of hepatitis C infection in users of United States veterans medical centers. Hepatology. 2005;41(1):88-96.
7. Himeloch S, McCarthy JF, Ganoczy D, et al. Understanding associations between serious mental illness and hepatitis C virus among veterans: a national multivariate analysis. Psychosomatics. 2009;50(1):30-37.
8. Hagedorn H, Dieperink E, Dingmann D, et al. Integrating hepatitis prevention services into a substance use disorder clinic. J Subst Abuse Treat. 2007;32(4):391-398.
9. Ramasamy P, Lintzeris N, Sutton Y, Taylor H, Day CA, Haber PS. The outcome of a rapid hepatitis B vaccination programme in a methadone treatment clinic. Addiction. 2010;105(2):329-334.
10. Bini EJ, Kritz S, Brown LS Jr, et al. Hepatitis B virus and hepatitis C virus services offered by substance abuse treatment programs in the United States. J Subst Abuse Treat. 2012;42(4):438-445.
11. Recommendations for prevention and control of hepatitis C virus (HCV) infection and HCV-related chronic disease. Centers for Disease Control and Prevention. MMWR Morb Mortal Wkly Rep. 1998;47(RR-19):1-39.
12. Francis E, Gonzales-Nolas CL, Markowitz J, Phillips S. Integration of preventive health screening into mental health clinics. Fed Pract. 2008;25(2):39-50.
13. Vreeland B. Bridging the gap between mental and physical health: a multidisciplinary approach. J Clin Psychiatry. 2007;68(suppl 4):26-33.
14. Brim N, Zaller N, Taylor LE, Feller E. Twinrix vaccination schedules among injecting drug users. Expert Opin Biol Ther. 2007;7(3):379-389.
15. Zuckerman J. The place of accelerated schedules for hepatitis A and B vaccinations. Drugs. 2003;63(17):1779-1784.
16. Connor BA, Blatter MM, Beran J, Zou B, Trofa AF. Rapid and sustained immune response against hepatitis A and B achieved with combined vaccine using an accelerated administration schedule. J Travel Med. 2007;14(1):9-15.
17. Nothdurft HD, Dietrich M, Zuckerman JN, et al. A new accelerated vaccination schedule for rapid protection against hepatitis A and B. Vaccine. 2002;20(7-8):1157-1162.
18. American Psychiatric Association. Diagnostic and Statistical Manual of Mental Disorders, 4th Edition, Text Revision (DSM-IV-TR). Washington, DC: American Psychiatric Association; 2000.
19. Heatherton TF, Kozlowski LT, Frecker RC, Fagerström KO. The Fagerström Test for Nicotine Dependence: a revision of the Fagerström Tolerance Questionnaire. Br J Addict. 1991;86(9):1119-1127.
20. McLellan AT, Kushner H, Metzger D, et al. The Fifth Edition of the Addiction Severity Index. J Subst Abuse Treat. 1992;9(3):199-213.
21. Batki SL, Nathan KI. HIV/AIDS and Hepatitis C. In: Galanter M, Kleber HD, Brady KT, eds. The American Psychiatric Publishing Textbook of Substance Abuse Treatment. 5th ed. Arlington, VA: American Psychiatric Publishing; 2015.
22. Gelberg L, Robertson MJ, Leake B, et al. Hepatitis B among homeless and other impoverished US military veterans in residential care in Los Angeles. Public Health. 2001;115(4):286-291.
23. Felsen UR, Fishbein DA, Litwin AH. Low rates of hepatitis A and B vaccination in patients with chronic hepatitis C at an urban methadone maintenance program. J Addict Dis. 2010;29(4):461-465.
24. Brewer NT, Chapman GB, Gibbons FX, Gerrard M, McCaul KD, Weinstein ND. Meta-analysis of the relationship between risk perception and health behavior: the example of vaccination. Health Psychol. 2007;26(2):136-145.
25. Soto-Salgado M, Suárez E, Ortiz AP, et al. Knowledge of viral hepatitis among Puerto Rican adults: implications for prevention. J Community Health. 2011;36(4):565-573.
26. Cox AD, Cox D, Cyrier R, Graham-Dotson Y, Zimet GD. Can self-prediction overcome barriers to hepatitis B vaccination? A randomized controlled trial. Health Psychol. 2012;31(1):97-105.
27. Stitzer ML, Polk T, Bowles S, Kosten T. Drug users’ adherence to a 6-month vaccination protocol: effects of motivational incentives. Drug Alcohol Depend. 2010;107(1):76-79.
The VA/DoD Chronic Effects of Neurotrauma Consortium: An Overview at Year 1
The Chronic Effects of Neuro-trauma Consortium (CENC) is a federally funded research project devised to address the long-term effects of mild traumatic brain injury (mTBI) in military service members (SMs) and veterans. Announced by President Barack Obama on August 20, 2013, the CENC is one of 2 major initiatives developed in response to injuries incurred by U.S. service personnel during Operation Enduring Freedom (OEF) and Operation Iraqi Freedom (OIF) as part of the National Research Action Plan. The CENC is jointly funded by the DoD and the VA, with a budget of $62.175 million over 5 years.
The consortium funds basic science, clinical, and translational research efforts with a closely integrated supportive infrastructure, including administrative services, regulatory guidance, study design, biostatistical consultation, data management, common data element application, and interdisciplinary communication. In addition, the consortium facilitates and integrates the activities of a diverse group of skilled specialty research teams, allowing them to fully focus their efforts on understanding and clarifying the relationship between combat-related mTBI and chronic neurotrauma effects, including neurodegeneration.
Background
Nearly 20% of the more than 2.6 million U.S. SMs deployed since 2003 to OEF and OIF have sustained at least 1 TBI, predominantly mTBI. Almost 8% of all OEF/OIF veterans demonstrate persistent post-TBI symptoms more than 6 months postinjury. Acute mTBI effects are typically transient, with headache, cognitive, behavioral, balance, and sleep symptoms most often seen, but symptoms may persist and even lead to lifelong disability. In these individuals, additional chronic effects, such as neuroendocrinologic abnormalities, seizures and seizurelike disorders, fatigue, vision and hearing abnormalities, and numerous other somatic symptoms are more common over time. The long-term effects from single or repeated mTBIs on the persistence of these symptoms, on combat and trauma-related comorbidities, and on long-term brain functioning are unknown.
Increasing evidence supports the link between both concussions and combat-related trauma with chronic traumatic encephalopathy (CTE), which results in progressive cognitive and behavioral decline in subpopulations 5 to 50 years out from repeated or cumulative mTBI exposures. The possibility of a link between mTBI, persistent symptoms, and early dementia has widespread implications for SMs and veterans; however, these chronic and late-life effects of mTBI are poorly understood.
Traumatic brain injuries of mixed severity have been linked to a higher incidence of Alzheimer disease (AD) and other dementias and an earlier onset of AD, although negative findings have also been reported. Chronic traumatic encephalopathy has been reported to occur in retired boxers at higher rates and at younger ages compared with dementia in the general population. More recently, brain autopsies of athletes from a variety of sports with confirmed CTE have demonstrated elevated tau proteins, tau-immunoreactive neurofibrillary tangles, and neuropil threads, suggesting that pathologic processes similar to those occurring in AD may be involved. Longitudinal research bridging SMs, veterans, and athletes with neurotrauma has been fragmented and incompletely focused on the strategic needs (eg, troop readiness) and vision of the DoD and VA.
Critical gaps exist in the literature with few prospective, well-controlled, longitudinal studies on late-life outcomes and neurodegeneration after mTBI, as well as in related basic science research. These research gaps are particularly prominent in the potentially unique injuries and difficulties seen in combat-exposed populations. The existing research, although suggestive, is not rigorous or robust enough to allow for a clear understanding of the relationships, risks, and potential effective interventions for mTBI, chronic symptoms, and neurodegeneration.
The CENC was developed to create a road map of existing knowledge gaps, to recruit the top relevant subject matter experts in the country, to develop and establish a cohesive set of rigorously designed studies to address these knowledge voids, and to leverage core consortium resources both efficiently and effectively.
Related: The Right Care at the Right Time and in the Right Place: The Role of Technology in the VHA
Given these gaps in scientific research and knowledge, the DoD and VA jointly issued a request for proposals to fund a project to address these concerns. After a competitive application process, an integrated proposal, led by researchers at Virginia Commonwealth University (VCU) was announced as the recipient of the Presidential award.
Consortium Structure
The CENC, serving as the comprehensive research network for DoD and VA, focuses on (1) identifying and characterizing the anatomic, molecular, and physiologic mechanisms of chronic injury from mTBI and potential neurodegeneration; (2) investigating the relationship of comorbidities (psychological, neurologic, sensory, motor, pain, cognitive, and neuroendocrine) of trauma and combat exposure to TBI with neurodegeneration; and (3) assessing the efficacy of existing and novel treatment and rehabilitation strategies for chronic effects and neurodegeneration following TBI.
The consortium is a collaboration among more than 30 universities, nonprofit research organizations, VAMCs, and military medical centers made up of a leadership core, 5 research infrastructure cores, 8 active studies, a data safety monitoring committee, a consumer advisory board, a scientific advisory board, and an independent granting mechanism to foster additional research in chronic effects after mTBI.
Leadership Core
The principal investigator for CENC is David X. Cifu, MD, chairman and professor of the VCU Department of Physical Medicine and Rehabilitation in Richmond, Virginia. The consortium co-principal investigators are Ramon Diaz-Arrastia, MD, PhD, professor of neurology, Uniformed Services University of the Health Sciences (USUHS) and director of the clinical research at the Center for Neuroscience and Regenerative Medicine in Bethesda, Maryland, and Rick L. Williams, PhD, co-principal investigator for CENC and senior statistician at RTI International in Raleigh, North Carolina.
Research Cores
The CENC operates 5 research infrastructure cores. The Biorepository Core, led by Dr. Diaz-Arrastia at USUHS, manages the storage and processing of biologic (blood and saliva) samples collected through all CENC protocols. The Biostatistics Core, led by Dr. Williams; Nancy Temkin, PhD; and Heather Belanger, PhD at RTI, provides study design guidance and biostatistical analysis to facilitate knowledge translation and dissemination.
The Data and Study Management Core is led by Dr. Williams at RTI. It centrally and securely maintains all collected data; oversees the clinical monitoring of research sites; provides a consortium research manager for each study who interacts with the study leadership, study site leaders, and staff; expedites and guides clinical protocols through regulatory approval processes; coordinates patient accrual and study activities across sites; develops and monitors data acquisition compliance; and facilitates exportation of all data collection to the Federal Interagency Traumatic Brain Injury Research informatics system.
The Neuroimaging Core is led by Elisabeth Wilde, PhD, at Baylor College of Medicine and the Michael E. DeBakey VAMC in Houston, Texas. This core facilitates sequence development and pulse programming; provides training and supervision of technologists and support personnel; ensures acquisition, transfer, and storage of imaging data; oversees quality assurance; performs conventional and advanced imaging analysis; and interprets neuroimaging data.
The Neuropathology Core is led by Dr. Dan Perl and colocated at USUHS and Edith Norse Rogers Memorial Veterans Hospital/VA Boston Healthcare System. Dr. Perl manages the collection of brain specimens from the participants, using an existing national network of dieners and neuropathologists, catalogs and stores tissues, and administers requests for use of these tissues.
Active Research Studies
The Longitudinal Cohort Study addresses a critical research gap by identifying and characterizing the late effects of mTBI and assessing the influence and interaction of the many potential risk factors for early dementia. The study uses a wide array of self-report, laboratory, biophysical, neuropsychologic, and imaging assessment tools to evaluate a cohort (n = 880) of U.S. OEF/OIF combatants who have had at least 1 mTBI and a control group of participants (n = 220) who have experienced combat but have not had a mTBI, and then re-assesses them annually (in person or via telephone), with the goal of following the cohort for as long as resources are available.
Collaborating sites for this study include Hunter Holmes McGuire VAMC in Richmond, Virginia; James A. Haley Veterans’ Hospital in Tampa, Florida; Michael E. DeBakey VAMC in Houston, Texas; Audie L. Murphy Memorial Veterans Hospital in San Antonio, Texas; VA Boston Healthcare System; Minneapolis VA Health Care System in Minnesota; and Fort Belvoir in Virginia. Dr. Cifu and Dr. William Walker lead this study.
Epidemiology of mTBI and Neurosensory Outcomes
This project integrates and analyzes several VA, DoD, and Centers for Medicare and Medicaid Services health care system data sets to study the chronic effects of mTBI on neurodegenerative disease and other comorbidities. The primary aims of the project include evaluating the association between mTBI and short-term clinical outcomes, including factors associated with resilience and effects of treatment; investigating long-term clinical outcomes, including neurosensory disorders and mortality; and identifying factors associated with low- and high-distress trajectories of comorbid burden after mTBI. Dr. Kristine Yaffe, Dr. Mary Jo Pugh, and Dr. Michael McCrea, are the leads of this study.
Tau Modification and Aggregation in TBI
This study aims to develop an animal model of repetitive-mTBI, which will allow the tracking of progressive intraneuronal tau alterations that can be correlated with behavioral dysfunction, neuronal protein, and gene expression signatures that can be used to assess the effects of interventions. The observations made in the animal model will be compared with findings generated from tissue obtained at autopsy from deceased SMs and veterans who sustained repetitive-mTBI. Dr. Fiona Crawford and Dr. Elliott Mufson lead this study.
Otolith Dysfunction
This study is examining the effect of inner ear dysfunction on balance, gait, and quality of life (QOL). Recent evidence suggests that otolith organ dysfunction can occur in patients with mTBI or blast exposure. If the dizziness and imbalance symptoms that occur following head injury or blast exposure are related to injury to the otolith organs rather than to the horizontal semicircular canal, then new treatment approaches may be necessary to focus on otolith organ pathway recovery. Performance on balance tasks while standing and walking and questionnaires on the impact on QOL will be compared in 4 groups of individuals (n = 120) with and without head injury/blast exposure (otolith organ dysfunction, horizontal canal dysfunction, both otolith and horizontal canal dysfunction, and healthy individuals). Dr. Faith Akin leads this study.
ADAPT
The ADAPT study (Assessment and Long-term Outcome and Disability in Active Duty Military Prospectively Examined following Concussive TBI) is investigating the association of early clinical and imaging measures with late (5 year) clinical outcome after blast-related mTBI from combat. The study (n = 100) will use 5-year follow-up advanced magnetic resonance imaging (MRI) and clinical outcome measures of combat mTBI, as a continuation of previous longitudinal research efforts (n = 575). Two groups of subjects will be studied: subjects who sustained a mTBI from blast during deployment and subjects without history of blast exposure and no diagnosis of deployment mTBI. Dr. Christine MacDonald leads this study.
Diffusion Tensor Imaging Phantom Study
This study involves the development and testing of a novel phantom that would be used to enhance accuracy, consistency, and reliability in both isotropic and anisotropic measurements derived from diffusion imaging, as well as other MRI-based measurements, using universal fluid disk chambers in a single phantom. Currently, the acquisition of diffusion data in large studies and clinical trials lacks standardization, and important differences exist in how data are acquired on scanners of different manufacturers, using different hardware or software, or when different acquisition parameters are used. As a result, development of large pools of data and the creation of normative data are hampered by inhomogeneity in the data set, which is difficult to analyze. The study team will perform detailed testing of the phantom materials and phantoms themselves, as well as examine diffusion imaging on 1 to 2 human volunteers at each of the 4 sites. Intra- and interscanner differences will be measured, and based on these findings, a more standardized imaging protocol that will provide optimal uniformity of diffusion imaging will be designed. Dr. Elisabeth Wilde leads this study.
Novel White Matter Imaging to Improve mTBI Diagnosis
This study will use myelin-sensitive novel imaging techniques (McDespot [multi-component driven equilibrium single pulse observation of T1/T2]) to improve correspondence with diagnostic groups after trauma exposure and correlation with cognitive deficits in mTBI. The study will recruit individuals (n = 82) from 4 groups, comorbid mTBI and posttraumatic stress disorder (PTSD), only mTBI, only PTSD, and controls who will be prospectively comprehensively assessed clinically (clinical interview, physical exam, neuropsychological assessment) and with advanced imaging (including McDespot, diffusion tensor imaging, and other forms of imaging). Dr. Amy Jak leads this study.
Peer Review Program
The CENC has an integrated grant program to identify scientifically valid and strategically important research projects. To date, 2 rounds of proposal requests and project support have been completed. Scientific review is conducted under the CENC Peer Review Program. Scientifically meritorious studies are identified by independent peer review and then undergo a Programmatic Review by CENC leadership before being recommended for funding to the Government Steering Committee (GSC). Studies that are recommended must address road map gaps, develop innovative approaches, or provide an avenue for new researchers and novel research approaches to contribute to the consortium mission to advance the science of brain injury treatment and prevention. The CENC grant program is administered by Dr. Steven L. West.
Consumer Advisory Board
The Consumer Advisory Board (CAB) advises and makes nonbinding recommendations to CENC. The responsibilities of the committee members include (1) providing information that helps CENC leadership better appreciate and understand the issues and needs of TBI survivors and their support networks so appropriate research can be designed and implemented; (2) evaluating existing research and making recommendations for additions and/or modifications to project procedures; (3) providing input for the road map for future research based on members’ personal experiences and knowledge; and (4) providing linkages to targeted communities for direct feedback and to assist in forming collaborative partnerships.
The CAB is composed of survivors of TBI, family members of survivors of TBI, providers of TBI services, service organizations with specific ties to SMs and veterans, and clinical and corporate representatives of transportation services for the disabled, the independent living movement, and assistive technology. Persons who are heavily engaged in political activity or who actively endorse a specific device or product are not eligible for membership on the CAB. Membership is composed of persons nominated by CENC leadership and approved by the GSC. The CAB is co-chaired by Charles Gatlin, MS, and General (Ret.) Peter Chiarelli.
Scientific Advisory Board
The members of the Scientific Advisory Board (SAB) advise and make nonbinding recommendations to CENC. Responsibilities of the committee members include (1) providing information that may help the consortium leadership better understand the issues related to TBI; (2) evaluating existing research; (3) recommending additions and/or modifications to project procedures; and (4) assisting CENC by helping leverage relationships with other researchers. The SAB is composed of members of the research community on TBI who are not part of CENC. Persons who may be considered to have positions of authority, such as active or retired flag officers or chief executive officers, may be eligible for general SAB membership but are not be eligible for chair positions. Membership is composed of persons nominated by CENC leadership and approved by the GSC. Col. Jamie Grimes, MD, and Henry Lew, MD, PhD, co-chair the SAB.
Federal Oversight
The GSC oversees CENC. Members of the GSC are DoD and VA appointed and represent both government agencies and nongovernment subject matter experts. The GSC approves all studies to be conducted, recommends new studies, and identifies existing and new requirements. The GSC is the overall main governing and management committee for the project and the committee through which the DoD and VA interact and collaborate with the CENC. The GSC determines all major scientific decisions, and clinical studies proposed by the CENC committee proceed to the implementation stage only with the approval of the GSC.
Acknowledgements
This research is supported by grants 1-I01-RX-001135-01-A2 (PI: F. Aiken), 1-I01-RX-001774-01 (PI: F. Crawford), 1-I01-RX-001880-01 (PI: E. Wilde), 1-I01-CX-001135-01 (PI: S. Cifu), and 1-I01-CX-001246-01 (PI: K. Yaffe) from the U.S. Department of Veterans Affairs and by grant W81XWH-13-2-0095 (PI: D. Cifu) from the U.S. Department of Defense, Congressionally Directed Medical Research Programs. The ideas and opinions expressed in this paper do not necessarily represent the views of the Department of Veterans Affairs, the Department of Defense, or the U.S. Government.
Author disclosures
The authors report no actual or potential conflicts of interest with regard to this article.
Disclaimer
The opinions expressed herein are those of the authors and do not necessarily reflect those of Federal Practitioner, Frontline Medical Communications Inc., the U.S. Government, or any of its agencies.
National Acute Medicine Programme
In 2009, Irish hospitals were experiencing ongoing and increasing overcrowding of emergency departments (EDs). This overcrowding and subsequent assessment delays are both associated with increased morbidity and mortality rates.[1, 2, 3, 4] The prevailing culture in many larger hospitals was to prioritize subspecialty care at the expense of the assessment and management of patients with undifferentiated acute medical presentations with nonspecific symptoms. The National Acute Medicine Programme (NAMP) was set up in 2010 by the Royal College of Physicians in Ireland (RCPI) and the Health Service Executive (HSE) to address this unsatisfactory management of acutely ill medical patients.
The objectives of the NAMP are categorized under 3 quality improvement principles: (1) Quality: to improve quality of care and patient safety by ensuring patients are seen by a nurse within 20 minutes and a senior doctor within 1 hour of arrival. (2) Access: to improve access by ensuring that the patient journey from presentation to decision to admit or discharge does not exceed 6 hours and to eliminate extended waiting periods on gurneys for medical patients. (3) Cost: to reduce cost and increase value by achieving bed savings through reduced overnight admissions and shortened lengths of stay.
The program was implemented by a small national team, which included hospital and public health physicians, nurses, a health and social care professional (HSCP), a general practitioner (GP), and a program manager. RCPI also set up a National Advisory Group of Consultant Physicians, comprised of representative medical consultants from all over the country, and key links were established with each acute hospital. The team aimed to develop a standardized model of care for all acutely ill medical patients and ensure its full implementation nationally.
METHODS
A literature review was undertaken to develop the standardized model of care in agreement with stakeholders and in consultation with patient groups.[5] The model of care required the establishment of acute medical assessment units (AMAUs), whose main function was to assess to discharge rather than admit to assess patients.[6, 7] At that time, only 8 of the 33 acute Irish hospitals that admitted medical patients had an AMAU. However, their function and operation varied greatly. In the remaining hospitals, all medical patients went to the ED, and from there were either admitted or discharged. Delays in access to senior clinicians, diagnostics, and allied health professionals such as, Occupational Therapists, Physiotherapists and Speech and Language Therapists often resulted in delays in assessment and treatment that could lead to overnight admissions.
In the new model, all acute medical patients, except those requiring invasive monitoring, critical care, or special services such as oncology and dialysis, are referred to the AMAU by another doctor (ie. a GP, outpatient department, or ED physician), as shown in Figure 1. A senior physician in the AMAU then reviews the patient and decides to admit or discharge. This doctor can either be a dedicated physician with an interest in acute general medicine, or a specialist consultant rostered to work in the unit on a regular basis. Some patients are discharged the same day thanks to prompt review and treatment. Of those requiring overnight admission, some are streamed directly to specialist pathways (eg. coronary care unit). The remaining patients are admitted to the medical short‐stay unit (MSSU) under the care of an acute physician. Patients in the MSSU are then either discharged within 48 hours or go on to be transferred to a specialist ward.
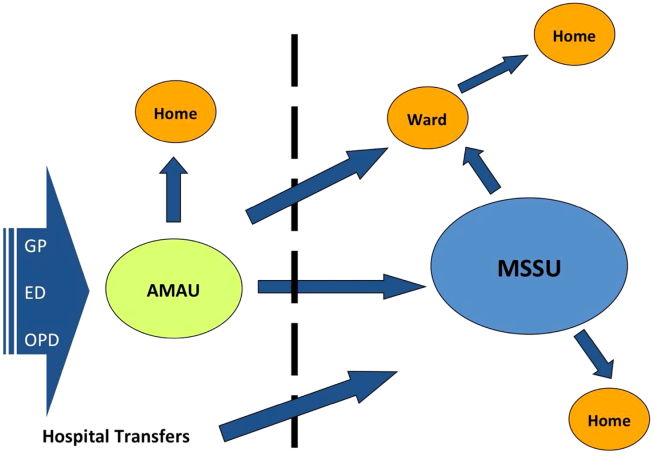
The model of care was therefore divided into 4 care pathways. National Health Service (NHS) admission data for 2008 to 2009 were used to calculate the proportion of patients who flowed through each pathway. The NHS has a wealth of experience in the development and use of AMAUs, having started implementing these units in the early 2000s. Therefore, the NHS estimates calculated above were used to set the national benchmarks for the NAMP. The four pathways are:
1. Ambulatory Care Pathway
Patients receive safe and effective treatment and are discharged on the same day. The NAMP benchmark was that at least 25% of AMAU admissions should follow this pathway of care.
2. Medical Short‐Stay Care Pathway
This pathway was developed for those patients who require inpatient care but are not expected to stay longer than 1 or 2 nights. The program benchmark was that 31% of patients should be discharged within 48 hours.
3. Routine Specialist Inpatient Care Pathway
Approximately 33% of medical admissions are expected to stay more than 2 days and less than 14 days in the hospital and have a straightforward discharge after their acute episode of care. These patients are admitted either directly to specialist medical wards from AMAU or via the MSSU within 2 days of arrival. Care is formally handed over from the AMAU team to the appropriate consultant physician upon transfer.
4. Appropriate Care and Discharge of Complex Patients Care Pathway
Frail older patients have complex care needs that continue following discharge, and their discharge requirements must be identified early during the acute care episode. The NAMP benchmark was that no more than 11% of medical admissions would fall into this pathway and require a length of stay (LoS) exceeding 14 days.
The flow model was used to build system capacity by modeling and predicting the expected demand on each AMAU to assist in forward planning The number of assessment spaces and ward beds required for each hospital were calculated by analyzing respective admission data for 2009 and applying target lengths of stay for medical patients to the flow model. The program team carried out this analysis for each of the 32 hospitals. The model of care also identified a number of practice changes under each pathway that would be required to achieve process changes and the resulting efficiency gains. Table 1 summarizes these.
|
| Ambulatory care pathway |
| Establishment of adequate assessment area |
| National early warning score within 20 minutes |
| Access to senior decision maker within 1 hour |
| Access to rapid diagnostics and HSCP assessment |
| Development of clinical criteria for transfer between ED and AMAU |
| Liaison with discharge planner |
| Clear pathways to specialist wards and community support |
| Close liaison with GP to ensure integrated care |
| Patient experience time in AMAU to be 6 hours or less |
| Medical short‐stay care pathway |
| Establishment of adequate short‐stay unit |
| Access to senior decision maker within 12 hours of transfer from AMAU |
| Twice daily consultant ward rounds |
| Access to prioritized diagnostics and HSCP assessment |
| Integrated discharge planning |
| Routine specialist inpatient care pathway |
| Daily consultant ward rounds |
| Weekend nurse/HSCP‐facilitated discharges |
| Active discharge planning with planned dates of discharge for every patient |
| Liaison with caregivers and community supports |
| Development of clinical criteria to support bidirectional flow to community hospitals within hospital groups |
| Appropriate care and discharge of complex patients care pathway |
| Early assessment and identification of complex patients |
| Streaming to care of the elderly services where appropriate |
| Proactive multidisciplinary discharge planning and liaison with funding agencies for referral to community placements and supports |
Hospitals were also categorized into 4 divisions or models as determined by the complexity of patients they admit. Model 1 hospitals are community units with subacute inpatient beds that can care for patients with rehabilitation, respite, or palliative care needs. Model 2 hospitals are small hospitals that provide inpatient and outpatient care for low‐risk, differentiated medical patients or refer on to associated higher complexity facilities. The majority of hospitals in the country are model 3 general hospitals, admitting 50% of all medical patients. Last, model 4 hospitals are the 8 regional tertiary referral centers in Ireland. A considerable volume of their patient workload remains inpatient admissions for routine specialist inpatient care.
Measuring success in the program's quality and access objectives required the development of a bespoke information technology (IT) system that is not yet operational, and therefore these objectives could not be audited.
A number of outcome measures or key performance indicators (KPIs) were developed to assess performance under each care pathway relative to the cost objectives of the NAMP as shown in Table 2. The available hospital inpatient enquiry (HIPE) data were analyzed by the program team to establish baseline performance metrics for each hospital. Initially, these data were only available to the NAMP 1 year in arrears. However, the NAMP worked with the hospitals and the HIPE system to improve the completeness and timeliness of the HIPE reporting, so that by the third quarter of 2011 monthly data were available. Audit cycles occurred on a continuous monthly basis, with feedback provided to each hospital and follow‐up of results conducted at a local level. This allowed for analysis of performance at a national, hospital group, and individual hospital level. Of note, it was only possible to analyze readmission rates to the same facility in the absence of a national unique patient identifier, and therefore readmission rates observed were of limited use as a quality measure.
| Care Pathway | Metric | National Target | 2010 | 2011 | 2012 | 2013* |
|---|---|---|---|---|---|---|
| ||||||
| Ambulatory care pathway | % of patients with LoS=0 | 25% | 11.5% | 12.9% | 18.8% | 23.2% |
| Medical short‐stay pathway | % of patients with LoS 12 days | 31% | 25.4% | 25.9% | 25.6% | 23.8% |
| Routine specialist inpatient pathway | % of patients with LoS>2 days | 44% | 63.1% | 61.2% | 55.6% | 53.1% |
| Complex care pathway | % of patients with LoS>14 days | 11% | 13.1% | 12.4% | 11.0% | 10.8% |
| % BDU of patients with LoS>30 days | 33% | 36.9% | 36.0% | 35.1% | 34.4% | |
| Routine and complex care pathway | Average LoS for those staying >2 days | 610 days | 12.9 | 12.7 | 12.4 | 12.4 |
| Summary metric | Overall average LoS | 5.8 days | 8.5 | 8.1 | 7.2 | 6.9 |
| No. of medical discharges | 202,567 | 206,250 | 235,167 | 253,083 | ||
RESULTS
The NAMP model of care was officially launched in December 2010.[6] Thirty‐two out of the 33 Irish hospitals that admit acute medical patients had adopted the model of care by the end of 2013. The program team performed an initial diagnostic meeting at each hospital to explain the program, discuss their individual baseline metrics, and collaboratively develop a hospital‐specific implementation plan. A local implementation and unscheduled care governance team, composed of senior management members and local GPs, was established in each hospital to identify ward spaces to be developed as AMAUs, reassign nursing staff to the AMAU from the wards, and organize the recruitment of new consultants with an interest in acute general medicine. The program team performed 2 to 3 visits per year to each hospital to obtain feedback on performance and support local improvement plans using appreciative enquiry. They also organized workshops and training for physicians, nurses, managers, and data managers to improve understanding of and engagement with the program. An acute medicine nurse interest group was convened to support nurses in the transition to clinical practice with a greater focus on ambulatory care. Annual conferences were held to present and discuss annual and cumulative audit results.
Table 2 presents the national KPI results for the cost and value objectives over the 3 years of implementation. The number of medical discharges increased from 202,567 in 2010 to 253,083 in 2013. The proportion of discharges that passed through the AMAU was 29% in 2013, considerably reducing the amount of patients seen through the ED and alleviating some of the overcrowding experienced there.
The proportion of medical patients who avoided admission increased from 11.5% to 23.2% in 2013. When examining the proportion of patients discharged within 48 hours, we combined results for the ambulatory care pathway (LoS=0) and the medical short‐stay pathway (LoS=12) and found a 10% increase nationally from 36.9% to 47% in 2013. In addition, the proportion of total medical bed‐days used (BDU) for patients with LoS over 30 days also improved by 2.5%. The program achieved an overall reduction of 0.5 days in those staying over 2 days nationally, and an overall reduction in average LoS (AvLoS) for all medical inpatients of 1.6 days (from 8.5 days 6.9 days) across the 3 years.
Table 3 shows the average change in KPIs from 2010 to 2013 by hospital model group. Looking at data by hospital group allowed results to be interpreted in a national context and identify any bottlenecks in the health system.
| Care pathway | Metric | National | Model 2 | Model 3 | Model 4 |
|---|---|---|---|---|---|
| |||||
| Ambulatory care pathway | % of patients with LoS=0 | 11.7% | 11.5% | 12% | 11.5% |
| Medical short‐stay pathway | % of patients with LoS 12 days | 1.6% | 5% | 2.3% | 0.3% |
| Routine specialist inpatient pathway | % of patients with LoS>2 days | 10% | 6.4% | 9.8% | 11.2% |
| Complex care pathway | % of patients with LoS>14 days | 2.3% | 0.4% | 1.7% | 4.1% |
| % BDU of patients with LoS>30 days | 2.5% | 1.9% | 0.2% | 4.9% | |
| Routine and complex care pathway | Average LoS for those staying >2 days | 0.5 | 0.7 | 0 | 1.4 |
| Summary metric | Overall average LoS | 1.6 | 0.4 | 1.0 | 2.6 |
During the 3‐year period, the role of model 2 hospitals changed from admitting all medical patients to only admitting differentiated medical patients referred from GPs. This is reflected in their KPI results, with an increasing proportion of patients with LoS greater than 14 days and the proportion of BDU occupied by those with LoS greater than 30 days. Data from the model 2 and 3 hospitals showed a considerable increase in same‐day discharges, with a concurrent decrease in percentage of patients staying in the hospital longer than 2 days. This translated to a national reduction in AvLoS of 1 day in this hospital group. Model 2 hospitals experienced small increases in both the AvLoS for those patients staying over 2 days (0.7%) and the proportion of BDU occupied by patients staying longer than 30 days (1.9%), whereas model 3 had experienced no real change in either of these metrics (0% and 0.2%, respectively). This reflected the limited availability of long‐term care facilities and protracted funding approval process nationally during the implementation period.
Model 4 hospitals experienced improvement across all KPIs. There was an 11.2% increase in the proportion of patients discharged within 48 hours and a 1.4‐day reduction in AvLoS for patients with LoS>2 days. A notable success within this hospital category was the 4.9% reduction in percentage of BDU by patients with LoS>30 days. The AvLoS for all medical admissions in this group remained above the national target at 8.6 days but did decrease considerably by 2.6 days from its baseline.
Data on 28‐day readmission to the same facility were used as a balancing measure but were only available for the latter 2 years. We found rates of 11% and 10% for 2012 and 2013, respectively. Patient experience of these new units should be assessed, but it was not possible to measure this during the implementation period.
DISCUSSION
The implementation of the NAMP has demonstrably streamlined the care of acute medical patients in Ireland. We report the results of this national transformational change brought about by the implementation of an evidence‐based model of care. The development of a flow model for each hospital improved the patient flow from assessment to discharge. Process improvement lies at the core of all the successes achieved by the program. The practice changes highlighted in Table 1 were pivotal in streamlining and improving the care of acutely ill medical patients. The focus on early access to senior decision making, early diagnostics, and a continuous, coordinated, multidisciplinary approach to care and discharge were central to the effective functioning of the AMAU and the resulting increase in avoided admissions.
Shortened lengths of stay are associated with better clinical outcomes and reduced exposure of patients to risk, and result in significant cost efficiencies accrued to the Irish health services.[2, 8] The adoption of ambulatory care and medical short‐stay pathways facilitated the 11.7% increase in avoided admissions and the reduction of 1.6 days in overall AvLoS nationally. This translates to significant cost savings for the Irish health system and likely improves clinical outcomes and reduced morbidity. We estimated these cost savings to be approximately 88.2 million by multiplying the number of bed days saved by the marginal cost of a bed day, which was quoted at 246 in 2012 by our Healthcare Pricing Office.
Thirty‐two of the 33 Irish hospitals that admit acute medical patients are now operating the program and achieving improvements in performance, as evidenced by ongoing audits. The priority given to the program by the RCPI and HSE has enabled the assignment of local implementation teams sustaining the focus on quality improvement at a local level. It also allowed for modest seed funding to be allocated for the appointment of 36 new consultants with an interest in acute general medicine. The cost of these additional consultants is offset by the considerable savings achieved through efficiency gains. An important challenge to implementation was the change in mindset required from local healthcare staff to divert patients away from the ED to the AMAU, and reassign staff and resources from other inpatient wards to the new unit. Visible clinical leadership from clinical directors, acute medicine hospital leads, senior nursing, and HSCP, together with management and local GPs, was essential in effecting this change. The program team also offered considerable support in this regard through advocacy and promotion of the program nationally. The implementation of the 4 care pathways represents a generational change in how medicine is practiced in Ireland. The development of acute medicine as a new specialty was strongly fostered by the program.
A number of disease‐specific clinical programs began operation during the implementation period and achieved reductions in AvLoS for some conditions such as chronic obstructive pulmonary disease and heart failure, contributing to varying degrees (2%6%) to the bed‐days savings achieved by the NAMP. During the 3‐year period, there was a 25% increase in medical discharges. This is partly due to the changing demographics and epidemiology of chronic diseases in the Irish population. This increased demand was absorbed by the system with no increase in acute bed usage. We estimated that approximately 1000 additional acute beds would have been required if the NAMP efficiencies had not been achieved. Concurrent financial constraints compounded the stress on the public health system by limiting the available staff and resources for the new AMAUs and by reducing the number of community and nursing home beds available. This obstructed the flow of older and frailer patients out of the acute setting and impacted negatively on the performance of some hospitals.
An important limitation in auditing success in the quality and access aims of the program was the absence of IT systems within the AMAUs. These have since been specified by the NAMP but have not yet been delivered to the service areas. In addition, a bespoke user interface, which allows hospitals to manipulate and benchmark their own performance, is being developed. This will facilitate more in‐depth auditing within hospitals at the ward and consultant team level. The lack of a unique patient identifier hindered our ability to measure true 28‐day readmission rates, which is a useful quality indicator.
Despite these contextual, cultural, and structural challenges, the NAMP successfully implemented an evidence‐based model of care across the country. Through its implementation, tangible improvements to the Irish health system were observed with expected benefits to the patient. The program successfully instituted an ongoing audit cycle to promote continuous improvement and identified areas for future work to build on the successes achieved.
Disclosure
Nothing to report.
- ,. The effect of emergency department crowding on patient outcomes: a literature review. Adv Emerg Nurs J. 2011;33(1):39–54.
- , , , et al. Effect of emergency department crowding on outcomes of admitted patients. Ann Emerg Med. 2013;61(6):605–611.e6.
- , , . The relationship between emergency department crowding and patient outcomes: a systematic review. J Nurs Scholarsh. 2014;46(2):106–115.
- , , , et al. The effect of emergency department crowding on clinically oriented outcomes. Acad Emerg Med. 2009;16(1):1–10.
- Acute medical assessment units: a literature review. 2012. [Unpublished Manuscript]
- National Acute Medicine Programme Working Group. Report of the National Acute Medicine Programme 2010. Retrieved on Sep 24, 2014 from, http://www.hse.ie/eng/about/Who/clinical/natclinprog/acutemedicineprogramme/report.pdf. [Retrieved]
- Royal College of Physicians. Acute medical care. The right person, in the right setting—first time. October 2007. Retrieved on Sep 24, 2014, from, https://www.rcplondon.ac.uk/sites/default/files/documents/acute_medical_care_final_for_web.pdf.
- . Increase in patient mortality at 10 days associated with emergency department overcrowding. Med J Aust. 2006;184(5):213–216.
In 2009, Irish hospitals were experiencing ongoing and increasing overcrowding of emergency departments (EDs). This overcrowding and subsequent assessment delays are both associated with increased morbidity and mortality rates.[1, 2, 3, 4] The prevailing culture in many larger hospitals was to prioritize subspecialty care at the expense of the assessment and management of patients with undifferentiated acute medical presentations with nonspecific symptoms. The National Acute Medicine Programme (NAMP) was set up in 2010 by the Royal College of Physicians in Ireland (RCPI) and the Health Service Executive (HSE) to address this unsatisfactory management of acutely ill medical patients.
The objectives of the NAMP are categorized under 3 quality improvement principles: (1) Quality: to improve quality of care and patient safety by ensuring patients are seen by a nurse within 20 minutes and a senior doctor within 1 hour of arrival. (2) Access: to improve access by ensuring that the patient journey from presentation to decision to admit or discharge does not exceed 6 hours and to eliminate extended waiting periods on gurneys for medical patients. (3) Cost: to reduce cost and increase value by achieving bed savings through reduced overnight admissions and shortened lengths of stay.
The program was implemented by a small national team, which included hospital and public health physicians, nurses, a health and social care professional (HSCP), a general practitioner (GP), and a program manager. RCPI also set up a National Advisory Group of Consultant Physicians, comprised of representative medical consultants from all over the country, and key links were established with each acute hospital. The team aimed to develop a standardized model of care for all acutely ill medical patients and ensure its full implementation nationally.
METHODS
A literature review was undertaken to develop the standardized model of care in agreement with stakeholders and in consultation with patient groups.[5] The model of care required the establishment of acute medical assessment units (AMAUs), whose main function was to assess to discharge rather than admit to assess patients.[6, 7] At that time, only 8 of the 33 acute Irish hospitals that admitted medical patients had an AMAU. However, their function and operation varied greatly. In the remaining hospitals, all medical patients went to the ED, and from there were either admitted or discharged. Delays in access to senior clinicians, diagnostics, and allied health professionals such as, Occupational Therapists, Physiotherapists and Speech and Language Therapists often resulted in delays in assessment and treatment that could lead to overnight admissions.
In the new model, all acute medical patients, except those requiring invasive monitoring, critical care, or special services such as oncology and dialysis, are referred to the AMAU by another doctor (ie. a GP, outpatient department, or ED physician), as shown in Figure 1. A senior physician in the AMAU then reviews the patient and decides to admit or discharge. This doctor can either be a dedicated physician with an interest in acute general medicine, or a specialist consultant rostered to work in the unit on a regular basis. Some patients are discharged the same day thanks to prompt review and treatment. Of those requiring overnight admission, some are streamed directly to specialist pathways (eg. coronary care unit). The remaining patients are admitted to the medical short‐stay unit (MSSU) under the care of an acute physician. Patients in the MSSU are then either discharged within 48 hours or go on to be transferred to a specialist ward.
The model of care was therefore divided into 4 care pathways. National Health Service (NHS) admission data for 2008 to 2009 were used to calculate the proportion of patients who flowed through each pathway. The NHS has a wealth of experience in the development and use of AMAUs, having started implementing these units in the early 2000s. Therefore, the NHS estimates calculated above were used to set the national benchmarks for the NAMP. The four pathways are:
1. Ambulatory Care Pathway
Patients receive safe and effective treatment and are discharged on the same day. The NAMP benchmark was that at least 25% of AMAU admissions should follow this pathway of care.
2. Medical Short‐Stay Care Pathway
This pathway was developed for those patients who require inpatient care but are not expected to stay longer than 1 or 2 nights. The program benchmark was that 31% of patients should be discharged within 48 hours.
3. Routine Specialist Inpatient Care Pathway
Approximately 33% of medical admissions are expected to stay more than 2 days and less than 14 days in the hospital and have a straightforward discharge after their acute episode of care. These patients are admitted either directly to specialist medical wards from AMAU or via the MSSU within 2 days of arrival. Care is formally handed over from the AMAU team to the appropriate consultant physician upon transfer.
4. Appropriate Care and Discharge of Complex Patients Care Pathway
Frail older patients have complex care needs that continue following discharge, and their discharge requirements must be identified early during the acute care episode. The NAMP benchmark was that no more than 11% of medical admissions would fall into this pathway and require a length of stay (LoS) exceeding 14 days.
The flow model was used to build system capacity by modeling and predicting the expected demand on each AMAU to assist in forward planning The number of assessment spaces and ward beds required for each hospital were calculated by analyzing respective admission data for 2009 and applying target lengths of stay for medical patients to the flow model. The program team carried out this analysis for each of the 32 hospitals. The model of care also identified a number of practice changes under each pathway that would be required to achieve process changes and the resulting efficiency gains. Table 1 summarizes these.
|
| Ambulatory care pathway |
| Establishment of adequate assessment area |
| National early warning score within 20 minutes |
| Access to senior decision maker within 1 hour |
| Access to rapid diagnostics and HSCP assessment |
| Development of clinical criteria for transfer between ED and AMAU |
| Liaison with discharge planner |
| Clear pathways to specialist wards and community support |
| Close liaison with GP to ensure integrated care |
| Patient experience time in AMAU to be 6 hours or less |
| Medical short‐stay care pathway |
| Establishment of adequate short‐stay unit |
| Access to senior decision maker within 12 hours of transfer from AMAU |
| Twice daily consultant ward rounds |
| Access to prioritized diagnostics and HSCP assessment |
| Integrated discharge planning |
| Routine specialist inpatient care pathway |
| Daily consultant ward rounds |
| Weekend nurse/HSCP‐facilitated discharges |
| Active discharge planning with planned dates of discharge for every patient |
| Liaison with caregivers and community supports |
| Development of clinical criteria to support bidirectional flow to community hospitals within hospital groups |
| Appropriate care and discharge of complex patients care pathway |
| Early assessment and identification of complex patients |
| Streaming to care of the elderly services where appropriate |
| Proactive multidisciplinary discharge planning and liaison with funding agencies for referral to community placements and supports |
Hospitals were also categorized into 4 divisions or models as determined by the complexity of patients they admit. Model 1 hospitals are community units with subacute inpatient beds that can care for patients with rehabilitation, respite, or palliative care needs. Model 2 hospitals are small hospitals that provide inpatient and outpatient care for low‐risk, differentiated medical patients or refer on to associated higher complexity facilities. The majority of hospitals in the country are model 3 general hospitals, admitting 50% of all medical patients. Last, model 4 hospitals are the 8 regional tertiary referral centers in Ireland. A considerable volume of their patient workload remains inpatient admissions for routine specialist inpatient care.
Measuring success in the program's quality and access objectives required the development of a bespoke information technology (IT) system that is not yet operational, and therefore these objectives could not be audited.
A number of outcome measures or key performance indicators (KPIs) were developed to assess performance under each care pathway relative to the cost objectives of the NAMP as shown in Table 2. The available hospital inpatient enquiry (HIPE) data were analyzed by the program team to establish baseline performance metrics for each hospital. Initially, these data were only available to the NAMP 1 year in arrears. However, the NAMP worked with the hospitals and the HIPE system to improve the completeness and timeliness of the HIPE reporting, so that by the third quarter of 2011 monthly data were available. Audit cycles occurred on a continuous monthly basis, with feedback provided to each hospital and follow‐up of results conducted at a local level. This allowed for analysis of performance at a national, hospital group, and individual hospital level. Of note, it was only possible to analyze readmission rates to the same facility in the absence of a national unique patient identifier, and therefore readmission rates observed were of limited use as a quality measure.
| Care Pathway | Metric | National Target | 2010 | 2011 | 2012 | 2013* |
|---|---|---|---|---|---|---|
| ||||||
| Ambulatory care pathway | % of patients with LoS=0 | 25% | 11.5% | 12.9% | 18.8% | 23.2% |
| Medical short‐stay pathway | % of patients with LoS 12 days | 31% | 25.4% | 25.9% | 25.6% | 23.8% |
| Routine specialist inpatient pathway | % of patients with LoS>2 days | 44% | 63.1% | 61.2% | 55.6% | 53.1% |
| Complex care pathway | % of patients with LoS>14 days | 11% | 13.1% | 12.4% | 11.0% | 10.8% |
| % BDU of patients with LoS>30 days | 33% | 36.9% | 36.0% | 35.1% | 34.4% | |
| Routine and complex care pathway | Average LoS for those staying >2 days | 610 days | 12.9 | 12.7 | 12.4 | 12.4 |
| Summary metric | Overall average LoS | 5.8 days | 8.5 | 8.1 | 7.2 | 6.9 |
| No. of medical discharges | 202,567 | 206,250 | 235,167 | 253,083 | ||
RESULTS
The NAMP model of care was officially launched in December 2010.[6] Thirty‐two out of the 33 Irish hospitals that admit acute medical patients had adopted the model of care by the end of 2013. The program team performed an initial diagnostic meeting at each hospital to explain the program, discuss their individual baseline metrics, and collaboratively develop a hospital‐specific implementation plan. A local implementation and unscheduled care governance team, composed of senior management members and local GPs, was established in each hospital to identify ward spaces to be developed as AMAUs, reassign nursing staff to the AMAU from the wards, and organize the recruitment of new consultants with an interest in acute general medicine. The program team performed 2 to 3 visits per year to each hospital to obtain feedback on performance and support local improvement plans using appreciative enquiry. They also organized workshops and training for physicians, nurses, managers, and data managers to improve understanding of and engagement with the program. An acute medicine nurse interest group was convened to support nurses in the transition to clinical practice with a greater focus on ambulatory care. Annual conferences were held to present and discuss annual and cumulative audit results.
Table 2 presents the national KPI results for the cost and value objectives over the 3 years of implementation. The number of medical discharges increased from 202,567 in 2010 to 253,083 in 2013. The proportion of discharges that passed through the AMAU was 29% in 2013, considerably reducing the amount of patients seen through the ED and alleviating some of the overcrowding experienced there.
The proportion of medical patients who avoided admission increased from 11.5% to 23.2% in 2013. When examining the proportion of patients discharged within 48 hours, we combined results for the ambulatory care pathway (LoS=0) and the medical short‐stay pathway (LoS=12) and found a 10% increase nationally from 36.9% to 47% in 2013. In addition, the proportion of total medical bed‐days used (BDU) for patients with LoS over 30 days also improved by 2.5%. The program achieved an overall reduction of 0.5 days in those staying over 2 days nationally, and an overall reduction in average LoS (AvLoS) for all medical inpatients of 1.6 days (from 8.5 days 6.9 days) across the 3 years.
Table 3 shows the average change in KPIs from 2010 to 2013 by hospital model group. Looking at data by hospital group allowed results to be interpreted in a national context and identify any bottlenecks in the health system.
| Care pathway | Metric | National | Model 2 | Model 3 | Model 4 |
|---|---|---|---|---|---|
| |||||
| Ambulatory care pathway | % of patients with LoS=0 | 11.7% | 11.5% | 12% | 11.5% |
| Medical short‐stay pathway | % of patients with LoS 12 days | 1.6% | 5% | 2.3% | 0.3% |
| Routine specialist inpatient pathway | % of patients with LoS>2 days | 10% | 6.4% | 9.8% | 11.2% |
| Complex care pathway | % of patients with LoS>14 days | 2.3% | 0.4% | 1.7% | 4.1% |
| % BDU of patients with LoS>30 days | 2.5% | 1.9% | 0.2% | 4.9% | |
| Routine and complex care pathway | Average LoS for those staying >2 days | 0.5 | 0.7 | 0 | 1.4 |
| Summary metric | Overall average LoS | 1.6 | 0.4 | 1.0 | 2.6 |
During the 3‐year period, the role of model 2 hospitals changed from admitting all medical patients to only admitting differentiated medical patients referred from GPs. This is reflected in their KPI results, with an increasing proportion of patients with LoS greater than 14 days and the proportion of BDU occupied by those with LoS greater than 30 days. Data from the model 2 and 3 hospitals showed a considerable increase in same‐day discharges, with a concurrent decrease in percentage of patients staying in the hospital longer than 2 days. This translated to a national reduction in AvLoS of 1 day in this hospital group. Model 2 hospitals experienced small increases in both the AvLoS for those patients staying over 2 days (0.7%) and the proportion of BDU occupied by patients staying longer than 30 days (1.9%), whereas model 3 had experienced no real change in either of these metrics (0% and 0.2%, respectively). This reflected the limited availability of long‐term care facilities and protracted funding approval process nationally during the implementation period.
Model 4 hospitals experienced improvement across all KPIs. There was an 11.2% increase in the proportion of patients discharged within 48 hours and a 1.4‐day reduction in AvLoS for patients with LoS>2 days. A notable success within this hospital category was the 4.9% reduction in percentage of BDU by patients with LoS>30 days. The AvLoS for all medical admissions in this group remained above the national target at 8.6 days but did decrease considerably by 2.6 days from its baseline.
Data on 28‐day readmission to the same facility were used as a balancing measure but were only available for the latter 2 years. We found rates of 11% and 10% for 2012 and 2013, respectively. Patient experience of these new units should be assessed, but it was not possible to measure this during the implementation period.
DISCUSSION
The implementation of the NAMP has demonstrably streamlined the care of acute medical patients in Ireland. We report the results of this national transformational change brought about by the implementation of an evidence‐based model of care. The development of a flow model for each hospital improved the patient flow from assessment to discharge. Process improvement lies at the core of all the successes achieved by the program. The practice changes highlighted in Table 1 were pivotal in streamlining and improving the care of acutely ill medical patients. The focus on early access to senior decision making, early diagnostics, and a continuous, coordinated, multidisciplinary approach to care and discharge were central to the effective functioning of the AMAU and the resulting increase in avoided admissions.
Shortened lengths of stay are associated with better clinical outcomes and reduced exposure of patients to risk, and result in significant cost efficiencies accrued to the Irish health services.[2, 8] The adoption of ambulatory care and medical short‐stay pathways facilitated the 11.7% increase in avoided admissions and the reduction of 1.6 days in overall AvLoS nationally. This translates to significant cost savings for the Irish health system and likely improves clinical outcomes and reduced morbidity. We estimated these cost savings to be approximately 88.2 million by multiplying the number of bed days saved by the marginal cost of a bed day, which was quoted at 246 in 2012 by our Healthcare Pricing Office.
Thirty‐two of the 33 Irish hospitals that admit acute medical patients are now operating the program and achieving improvements in performance, as evidenced by ongoing audits. The priority given to the program by the RCPI and HSE has enabled the assignment of local implementation teams sustaining the focus on quality improvement at a local level. It also allowed for modest seed funding to be allocated for the appointment of 36 new consultants with an interest in acute general medicine. The cost of these additional consultants is offset by the considerable savings achieved through efficiency gains. An important challenge to implementation was the change in mindset required from local healthcare staff to divert patients away from the ED to the AMAU, and reassign staff and resources from other inpatient wards to the new unit. Visible clinical leadership from clinical directors, acute medicine hospital leads, senior nursing, and HSCP, together with management and local GPs, was essential in effecting this change. The program team also offered considerable support in this regard through advocacy and promotion of the program nationally. The implementation of the 4 care pathways represents a generational change in how medicine is practiced in Ireland. The development of acute medicine as a new specialty was strongly fostered by the program.
A number of disease‐specific clinical programs began operation during the implementation period and achieved reductions in AvLoS for some conditions such as chronic obstructive pulmonary disease and heart failure, contributing to varying degrees (2%6%) to the bed‐days savings achieved by the NAMP. During the 3‐year period, there was a 25% increase in medical discharges. This is partly due to the changing demographics and epidemiology of chronic diseases in the Irish population. This increased demand was absorbed by the system with no increase in acute bed usage. We estimated that approximately 1000 additional acute beds would have been required if the NAMP efficiencies had not been achieved. Concurrent financial constraints compounded the stress on the public health system by limiting the available staff and resources for the new AMAUs and by reducing the number of community and nursing home beds available. This obstructed the flow of older and frailer patients out of the acute setting and impacted negatively on the performance of some hospitals.
An important limitation in auditing success in the quality and access aims of the program was the absence of IT systems within the AMAUs. These have since been specified by the NAMP but have not yet been delivered to the service areas. In addition, a bespoke user interface, which allows hospitals to manipulate and benchmark their own performance, is being developed. This will facilitate more in‐depth auditing within hospitals at the ward and consultant team level. The lack of a unique patient identifier hindered our ability to measure true 28‐day readmission rates, which is a useful quality indicator.
Despite these contextual, cultural, and structural challenges, the NAMP successfully implemented an evidence‐based model of care across the country. Through its implementation, tangible improvements to the Irish health system were observed with expected benefits to the patient. The program successfully instituted an ongoing audit cycle to promote continuous improvement and identified areas for future work to build on the successes achieved.
Disclosure
Nothing to report.
- ,. The effect of emergency department crowding on patient outcomes: a literature review. Adv Emerg Nurs J. 2011;33(1):39–54.
- , , , et al. Effect of emergency department crowding on outcomes of admitted patients. Ann Emerg Med. 2013;61(6):605–611.e6.
- , , . The relationship between emergency department crowding and patient outcomes: a systematic review. J Nurs Scholarsh. 2014;46(2):106–115.
- , , , et al. The effect of emergency department crowding on clinically oriented outcomes. Acad Emerg Med. 2009;16(1):1–10.
- Acute medical assessment units: a literature review. 2012. [Unpublished Manuscript]
- National Acute Medicine Programme Working Group. Report of the National Acute Medicine Programme 2010. Retrieved on Sep 24, 2014 from, http://www.hse.ie/eng/about/Who/clinical/natclinprog/acutemedicineprogramme/report.pdf. [Retrieved]
- Royal College of Physicians. Acute medical care. The right person, in the right setting—first time. October 2007. Retrieved on Sep 24, 2014, from, https://www.rcplondon.ac.uk/sites/default/files/documents/acute_medical_care_final_for_web.pdf.
- . Increase in patient mortality at 10 days associated with emergency department overcrowding. Med J Aust. 2006;184(5):213–216.
© 2015 Society of Hospital Medicine

Stratum Corneum Absorption Kinetics of 2 Potent Topical Corticosteroid Formulations: A Pilot Study
The active ingredient of any pharmaceutical product is responsible for the agent’s efficacy and safety profile. This ingredient is extensively studied in clinical trials and evaluated by the US Food and Drug Administration before the product is commercially available. In dermatologic products, especially those for treating dermatoses, the vehicle in which the active ingredient is formulated also plays a role in drug delivery and indirectly impacts therapeutic outcomes, unlike excipients in oral medications. Topical vehicles must be stable, provide a suitable environment that will not degrade the active ingredient or affect its efficacy, and be cosmetically acceptable.1
Topical vehicles are formulated to maintain the stability of the active ingredient and allow it to readily penetrate the skin and reach its target area with minimal absorption into the bloodstream, thus avoiding systemic adverse events. A variety of vehicles can exist for a single active ingredient to accommodate different phases of disease and different anatomical sites where the disease may occur.2 For example, alcohol-based vehicles, sprays, and foams are preferred for the scalp where evaporation of the vehicle is beneficial to prevent greasiness of the hair, while ointments may be preferred due to their occlusive nature for areas with xerotic or thick skin from dermatoses.
Cosmetic acceptability of the vehicle may influence patient adherence to therapy. Housman et al3 assessed a variety of products formulated in different vehicles (ie, solutions, foams, emollients, gels, creams, ointments) for the treatment of psoriasis. Patients with psoriasis applied each test product to a quarter-sized area of normal skin on the forearm using a cotton swab and completed a preference questionnaire. By far, respondents significantly preferred solutions and foams over creams, gels, and ointments (P<.01). Side effects were rated to be the most important characteristics of topical therapy, followed by time needed for application, ease of application, and messiness.3 Presumably, if patients are frustrated with the topical product that they are using, adherence to the prescribed dosage and application instructions will diminish over time, leading to suboptimal steady-state levels of the product. If appropriate levels of the drug are not present at the target site, treatment will not be successful.
Steady-state levels of a topical drug at the site of action also are maintained via appropriate application frequency, most commonly once to 4 times daily for dermatologic products. Fluocinonide and halcinonide are class II (potent) corticosteroids indicated for the relief of inflammatory and pruritic manifestations of corticosteroid-responsive dermatoses and usually are administered at least twice daily. In double-blind clinical studies comparing both products in the treatment of psoriasis, halcinonide resulted in more improved outcomes than fluocinonide.4-6 Sudilovsky and Clewe4 studied 140 patients with moderate to severe psoriasis. After 3 weeks of treatment, 44% showed superior results with halcinonide, 27% showed superior results with fluocinonide, 26% showed equal results with both products, and 3% showed no relief.4 Similarly, Close5 reported that 61% of patients showed superior results with halcinonide, 25% showed superior results with fluocinonide, 10% showed equal results with both products, and 4% showed no relief (N=50). Lynfield and Watsky6 reported that 56% of patients with severe psoriasis who were treated with halcinonide for 2 weeks showed improvement to normal or slight inflammation compared to 44% of patients treated with fluocinonide (N=59). All 3 studies used cream formulations of halcinonide and fluocinonide.
Recently, halcinonide cream was shown to have an immediate release into the stratum corneum that peaked within 1 hour of application and remained elevated for 6 hours before beginning to decline.7 These results support a biphasic release of halcinonide, which is in agreement with its formulation—that halcinonide exists in both a solution phase for immediate release into the skin and in a suspension phase that allows a sustained release after equilibrium is reached between the solution and suspension phases.8 Fluocinonide is not known to be formulated in a similar way. Its vehicle composition and penetration into the skin could explain the superior efficacy of halcinonide versus fluocinonide.
The current pilot study was conducted to compare the release pattern of fluocinonide cream versus halcinonide cream into the stratum corneum using an in vivo, noninvasive method. Results for halcin-onide have been previously published.7
Methods
Participants were sequestered in a controlled environment for the entire day to allow the skin to equilibrate prior to product application. The methodology for the application and quantification of halcinonide cream 0.1% into the stratum corneum of 5 participants using a tape-stripping protocol has been described elsewhere.7 Concordia Clinical Research institutional review board (Cedar Knolls, New Jersey) approved this study, which was conducted at Dermatology Consulting Services (High Point, North Carolina).
A 0.1-g dose of generic fluocinonide cream 0.05% was applied to four 2.5-cm circular sites on the forearm in 5 participants with normal skin until completely absorbed. Circular tape strips were subsequently placed on the application site at 1, 3, 6, and 9 hours posttreatment and were held for 10 seconds with a controlled pressure plunger to ensure adequate and consistent contact between the tape strip and the skin. The tape strip was removed with forceps, rolled with the skin scale inside, and placed in a glass vial. This procedure was repeated 6 times at 1 of 4 sites with a new tape strip at each time point to obtain samples from deeper skin layers. A total of 24 tape strips were collected from each participant.
All vials were frozen at -20°C and were shipped overnight to Robert Kellar, PhD, at the Center for Bioengineering Innovation at Northern Arizona University (Flagstaff, Arizona) for mass spectroscopy evaluation. Once received at the outside facility, the vials were stored at -20°C until analysis. Each sample was spiked with a known quantity of an appropriate reference standard and extracted with 1 mL acetonitrile at room temperature for 1 minute with agitation. New unused tape strips were spiked with a small amount of fluocinonide reference standard for extraction efficiency.
Extracts were evaporated to dryness under nitrogen gas, resuspended in 200 µL chromatography solvent, and quantified using liquid chromatography–mass spectrometry. To remove the skin scale from the tape strips, 10 mL of a solvent solution of 0.1 mg/mL fludrocortisone acetate in acetonitrile was dispensed into a 4 dram vial containing the tape strip. The vials were ultrasonicated and shaken for 10 to 15 minutes, and the samples were further diluted to 100-fold and were inverted several times to ensure complete dissolution of fluocinonide before liquid chromatography–mass spectrometry.
A standard curve ranging from the lower limit of quantification to the upper limit of quantification for the fluocinonide reference was used to determine the quantity of fluocinonide in each of the tape strips. Once the lower limit of quantification was reached in a given set of tape strip samples (1-, 3-, 6-, and 9-hour samples), the next 2 sequential tape strips in that set were analyzed to confirm fluocinonide was not detectable in deeper layers. Standard quality controls were analyzed to ensure run-to-run and sample-to-sample accuracy.
Each sample was analyzed in duplicate; 10 mg fluocinonide was used as a reference standard. The minimum detectable concentration of fluocinonide was 1 ng/mL.
Results
As expected, tape strip 1 from each participant contained the highest concentration of fluocinonide. This strip corresponded to the most superficial layer of skin. Concentrations decreased in deeper skin layers, as detected in strips 2 to 6.
In general, the average concentration of fluocin-onide in strip 1 for all 5 participants was highest at hour 1, with a subsequent decline at hours 3, 6, and 9; however, participant 1 showed a second peak in fluocinonide concentration at hour 6 (Figure 1). When the fluocinonide concentration in strips 1 to 6 was averaged for each participant at each time point, similar results were obtained: a general decline after hour 1, but a second prominent peak at hour 6 in participant 1 only. In participant 1, the average fluocinonide concentration for strips 1 to 6 was 393 ng/mL at hour 1 and declined to 208 ng/mL at hour 3; it increased to 451 ng/mL at hour 6 before declining again to 202 ng/mL at hour 9.
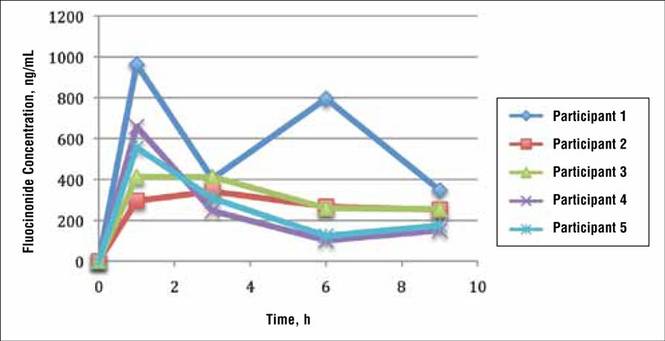
Because participant 1 was the only one to exhibit a second peak of fluocinonide concentration, it appears that measurements obtained from this participant may be outliers. When removing partici-pant 1 from the analysis of fluocinonide concentration in strip 1 at each time point, a clear decline is evident from hour 1 to hour 9 (Figure 2A, red line [partici-pants 2–5] vs blue line [participants 1–5]).
When the average concentration of fluocinonide was calculated in strips 1 to 6 from all participants, there was a general steady decline after hour 1 with a slight increase of 25 ng/mL at hour 6 (Figure 2B, blue line). This increase is due to the measurements obtained from participant 1; however, if partici-pant 1 is removed from the analysis, a constant decline is observed from hour 1 to hour 9 (Figure 2B, red line).
|
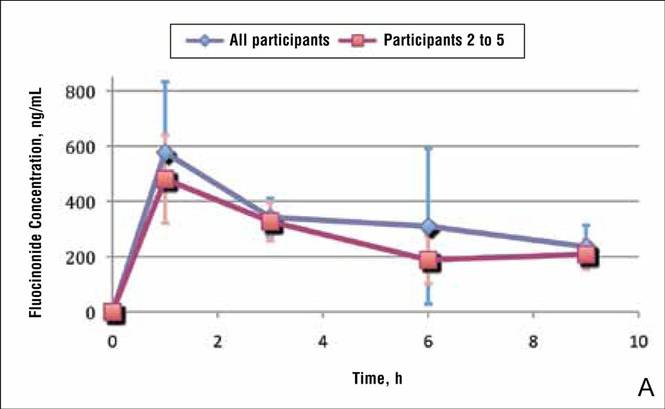
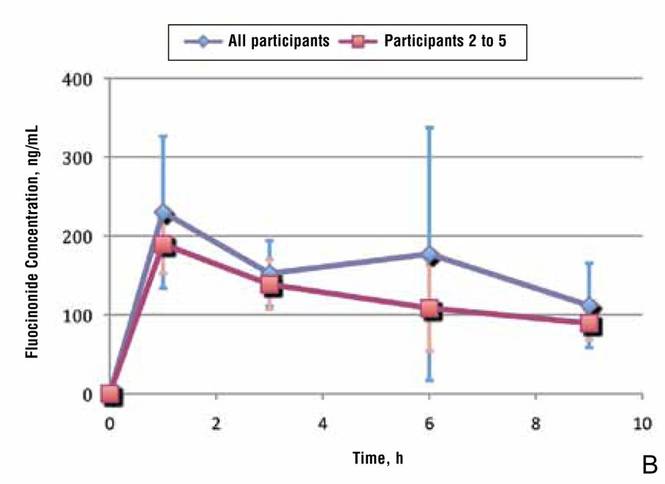
A prior study evaluated the penetration and absorption of halcinonide in the stratum corneum.7 In summary, halcinonide concentration peaked at hour 1 following application and remained elevated to hour 6, before beginning a slow decline. The average concentration of halcinonide from all participants in strips 1 to 6 reached 1350 ng/mL at hour 1, remained within 93% to 97% of this level (1253–1303 ng/mL) for the next 5 hours, and declined only 29% from the peak at hour 1 to hour 9 (958 ng/mL)(Figure 3, blue line).7 In contrast, the fluocinonide concentration in participants 2 to 5 from the current study reached 190 ng/mL at hour 1 and steadily declined 53% to 89 ng/mL by hour 9 (Figure 3, red line).
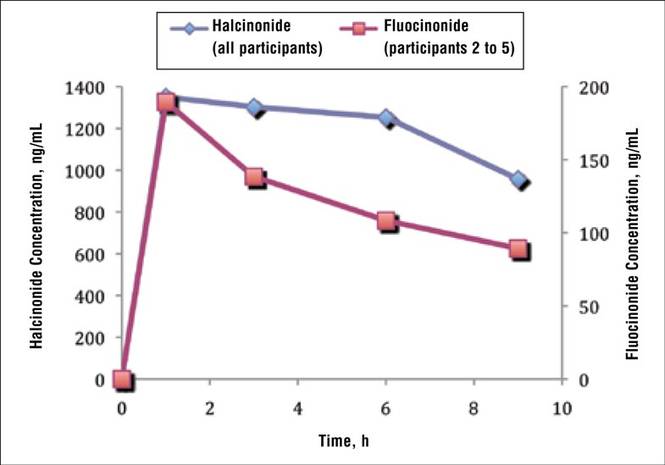
Two participants from the prior halcinonide study also were enrolled in the current fluocinonide study (referred to as participant A and B). In general, halcinonide levels in both participants remained elevated for 6 hours after application and declined 27.5% and 35.5%, respectively, by hour 9 (Figure 4). Participant A experienced a 20.5% dip in halcinonide concentration at hour 3 followed by an increase at hour 6; however, the halcinonide concentration at hour 9 was similar to hour 3.7 In contrast, fluocin-onide concentrations for these participants peaked at 1 hour and clearly declined approximately 60% over the next 8 hours.
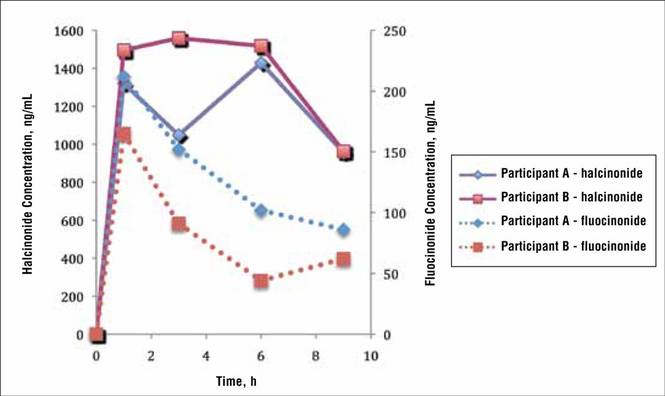
Comment
The release of both fluocinonide and halcinonide into the skin was evaluated using dermal tape stripping on 4 sites on the forearms of healthy individuals. Cream formulations of each corticosteroid were evaluated in 5 participants, with 2 participants receiving both formulations during different study periods. In the prior study with halcinonide, the stratum corneum exhibited the highest concentration of the corticosteroid, with substantial declines beyond strip 6 (ie, strips 7–20).7 For this reason, only strips 1 to 6 were evaluated for corticosteroid penetration and absorption.
Results from strip 1 indicated immediate absorption of corticosteroid (fluocinonide and halcinonide) into the skin. Unlike the release of halcinonide, which demonstrated a clear sustained release over 6 hours before decreasing,7 fluocinonide concentrations began declining immediately after peaking at hour 1 and continued to decline up to hour 9. Only participant 1 exhibited a second peak of fluocinonide concentration at hour 6; the rest of the participants did not. This second peak is most likely an anomaly due to the small number of participants rather than a true elevation.
Given the rapid decline of fluocinonide concentration over the 9 hours compared with the more gradual decline of halcinonide concentration, there appears to be no evidence of a biphasic sustained release of fluocinonide from its vehicle. This difference in release pattern from each corticosteroid’s respective vehicle may explain in part the different clinical outcomes in comparative studies.4-6
It is known that vehicle composition affects corticosteroid diffusion from the vehicle to the skin surface and subsequent penetration into the skin.9 Either process can determine the overall effectiveness of the product. Ayres and Hooper10 evaluated the penetration of 4 topical preparations of cortisol. Product 1 delivered 16 times more cortisol to the skin than product 2, 8 times more than product 3, and 3 times more than product 4. Because all the preparations contained cortisol-free alcohol, these differences were attributed to the vehicle in which the cortisol was formulated. Products 1 and 4 both contained 10% urea, but the urea in product 1 was a powder in a cream base and the urea in product 4 was in a stabilizing emulsified base. Product 2 contained a propylene glycol/water base and product 3 was a water-miscible cream.10
Generic corticosteroid products have been observed in clinical practice and have been shown in vasoconstriction assays to be less and more potent than their brand-name equivalents.2,11 Vasoconstriction assays are the standard for assessing the potency of topical corticosteroids and predicting their clinical efficacy.2 One study reported significant differences in therapeutic effectiveness between generic formulations and their brand-name equivalents.12 Kenalog cream 0.1% (multiple manufacturers) was significantly more potent than any of the generic triamcinolone creams tested (P<.05); in fact, Kenalog cream 0.025% (multiple manufacturers) was statistically superior to all the generic triamcinolone creams 0.1%. Moreover, Artistocort A ointment 0.1% (Lederele Laboratories) and Valisone cream 0.1% (Schering Corporation) also were more potent than their generics at the same concentration in the same vehicle type.12 A second study also observed that 2 of 6 generic formulations had significantly less vasoconstriction than their respective brand-name formulations.11 A brand-name betamethasone valerate cream produced significantly greater vasoconstriction than its generic equivalent, and a brand-name betamethasone dipropionate cream produced greater vasoconstriction than one generic and equal vasoconstriction to another generic. Additionally, the vasoconstriction measured with Diprosone was greater than that measured with Diprolene, another brand-name product of betamethasone dipropionate.11 Diprosone and Diprolene differ in their vehicle content. The latter, a class I corticosteroid, contains a modified vehicle high in propylene glycol, whereas the former contains less propylene glycol and thus is classified as a class III corticosteroid. Propylene glycol allows hydrophobic molecules such as corticosteroids to dissolve more fully in the vehicle.12
Ostrenga et al1 studied the solubility of corticosteroids in different vehicles and, as expected, corticosteroids that fully solubilized in the vehicle exhibited better penetration into the skin on assessment with vasoconstriction assays. Corticosteroids in a suspension, on the other hand, showed slower penetration into the skin.1,13 A balance between the solution and suspension phase would allow a drug to rapidly penetrate the skin upon application, and when this pool of solubilized drug was depleted, additional drug could penetrate into the skin from the suspension phase. Based on the tape strip results from the current study it appears that halcinonide, which is manufactured in a biphasic formulation, follows this pattern of penetration and absorption into the stratum corneum. In contrast, fluocinonide appears to exist in a soluble state without much, if any, amount in a suspension phase because it had no sustained release during the 9 hours after application.
Common belief among dermatologists is that long-term use of corticosteroids leads to tachyphylaxis,14 which can be attributed to poor patient adherence. If patients skip doses, then the steady state of the product at the target site is not maintained. It is interesting to speculate that using agents with more sustained release beyond the time of application (such as halcinonide) may preserve steady-state levels even when patients are neglectful of the next medication application. Corticosteroids that work in 2 phases such as halcinonide may minimize tachyphylaxis experienced with prolonged use of corticosteroids.
Fluocinonide and halcinonide are both class II high-potency corticosteroids as shown on outcomes from vasoconstrictor assays, which assess the extent to which a corticosteroid causes cutaneous vasoconstriction or blanching in normal healthy individuals.15 The assay depends on the molecule diffusing from the vehicle, penetrating the skin, and causing a reaction (blanching) that is then evaluated. The assay cannot effectively evaluate the rate of continued diffusion and skin penetration beyond the appearance of blanching. In contrast, the tape-stripping method provides an inside look at the extent of penetration of the corticosteroid beyond the skin surface and the rate of its clearance from different skin layers. In the current study, the levels of fluocinonide declined after peaking at 1 hour after application, but the levels of halcinonide clearly remained elevated after peaking at the same time point. Most likely, vasoconstrictor studies would not be able to differentiate between the concentrations of the 2 products in the stratum corneum beyond the first hour after application.
Tape stripping, or dermatopharmacokinetics, has advantages over vasoconstriction assays in studying corticosteroid penetration and clearance from the stratum corneum. At one point, the US Food and Drug Administration had included tape stripping in its preliminary guidelines for generic topical bioequivalence studies until data from the same formulation generated from 2 different laboratories produced different results.16 Since that time, much work has been done with tape stripping to ensure its consistency. Weigmann et al17 demonstrated equivalent results with clobetasol using vasoconstriction and tape stripping, and Wiedersberg et al18 demonstrated the same with betamethasone. For the current study, the fluocinonide and halcinonide formulations were weighed prior to application so that the same dose was tested in all participants. A plunger was used to produce consistent pressure at all application sites to control for the amount of skin that was stripped off with the tape. Results for both corticosteroids were consistent between the participants. Variability in the data was detected; however, this observation is most likely due to the small number of participants in the studies.
Conclusion
In summary, this pilot study demonstrated that fluocinonide concentration in the stratum corneum peaks within the first hour of application before beginning a steady general decline. There was no evidence of sustained release. In contrast, halcin-onide demonstrated a sustained release for 6 hours after application. Halcinonide is formulated in a cream base in which the corticosteroid is present in a solution and suspension phase that allows for sustained delivery in skin over time. Fluocinonide does not appear to be formulated in the same way, and its concentrations in the stratum corneum begin to decline 1 hour after application.
Acknowledgement
Thank you to Robert Kellar, PhD, at the Center for Bioengineering Innovation at Northern Arizona University, Flagstaff, for conducting the liquid chromatography–mass spectrometry.
1. Ostrenga J, Haleblian J, Poulsen B, et al. Vehicle design for a new topical steroid, fluocinonide. J Invest Dermatol. 1971;56:392-399.
2. Rathi SK, D’Souza P. Rational and ethical use of topical corticosteroids based on safety and efficacy. Indian J Dermatol. 2012;57:251-259.
3. Housman TS, Mellen BG, Rapp SR, et al. Patients with psoriasis prefer solution and foam vehicles: a quantitative assessment of vehicle preference. Cutis. 2002;70:327-332.
4. Sudilovsky A, Clewe TH. Comparative efficacy of halcin-onide and fluocinonide creams in psoriasis and eczematous dermatoses. J Clin Pharmacol. 1975;15:779-784.
5. Close JE. Double-blind comparison of topical halcinonide and fluocinonide in the treatment of psoriasis. Int J Dermatol. 1976;15:534-537.
6. Lynfield Y, Watsky M. Psoriasis: topical corticosteroid therapy. Cutis. 1976;18:133, 136-137.
7. Draelos ZD. Demonstration of the biphasic release of 0.1% halcinonide cream. J Drugs Dermatol. 2015;14:89-90.
8. Bagatell FK. Halcinonide: a new potent topical anti-inflammatory drug. Cutis. 1974;14:459-462.
9. Ostrenga J, Steinmetz C, Poulsen B. Significance of vehicle composition. I. relationship between topical vehicle composition, skin penetrability, and clinical efficacy. J Pharm Sci. 1971;60:1175-1179.
10. Ayres PJ, Hooper G. Assessment of the skin penetration properties of different carrier vehicles for topically applied cortisol. Br J Dermatol. 1978;99:307-317.
11. Olsen EA. Double-blind controlled comparison of generic and trade-name topical steroids using the vasoconstriction assay. Arch Dermatol. 1991;127:197-201.
12. Stoughton RB. Are generic formulations equivalent to trade name topical glucocorticoids? Arch Dermatol. 1987;123:1312-1314.
13. Poulsen BJ, Young E, Coquilla V, et al. Effect of topical vehicle composition on the in vitro release of fluocinolone acetonide and its acetate ester. J Pharm Sci. 1968;57:928-933.
14. Taheri A, Cantrell J, Feldman SR. Tachyphylaxis to topical glucocorticoids: what is the evidence? Dermatol Online J. 2013;19:18954.
15. Ference JD, Last AR. Choosing topical corticosteroids. Am Fam Physician. 2009;79:135-140.
16. Pershing LK, Nelson JL, Corlett JL, et al. Assessment of dermatopharmacokinetic approach in the bioequivalence determination of topical tretinoin gel products. J Am Acad Dermatol. 2003;48:740-751.
17. Weigmann H, Lademann J, v Pelchrzim R, et al. Bioavailability of clobetasol propionate-quantification of drug concentrations in the stratum corneum by dermatopharmacokinetics using tape stripping. Skin Pharmacol Appl Skin Physiol. 1999;12:46-53.
18. Wiedersberg S, Naik A, Leopold CS, et al. Pharmacodynamics and dermatopharmacokinetics of betamethasone 17-valerate: assessment of topical bioavailability. Br J Dermatol. 2009;160:676-686.
The active ingredient of any pharmaceutical product is responsible for the agent’s efficacy and safety profile. This ingredient is extensively studied in clinical trials and evaluated by the US Food and Drug Administration before the product is commercially available. In dermatologic products, especially those for treating dermatoses, the vehicle in which the active ingredient is formulated also plays a role in drug delivery and indirectly impacts therapeutic outcomes, unlike excipients in oral medications. Topical vehicles must be stable, provide a suitable environment that will not degrade the active ingredient or affect its efficacy, and be cosmetically acceptable.1
Topical vehicles are formulated to maintain the stability of the active ingredient and allow it to readily penetrate the skin and reach its target area with minimal absorption into the bloodstream, thus avoiding systemic adverse events. A variety of vehicles can exist for a single active ingredient to accommodate different phases of disease and different anatomical sites where the disease may occur.2 For example, alcohol-based vehicles, sprays, and foams are preferred for the scalp where evaporation of the vehicle is beneficial to prevent greasiness of the hair, while ointments may be preferred due to their occlusive nature for areas with xerotic or thick skin from dermatoses.
Cosmetic acceptability of the vehicle may influence patient adherence to therapy. Housman et al3 assessed a variety of products formulated in different vehicles (ie, solutions, foams, emollients, gels, creams, ointments) for the treatment of psoriasis. Patients with psoriasis applied each test product to a quarter-sized area of normal skin on the forearm using a cotton swab and completed a preference questionnaire. By far, respondents significantly preferred solutions and foams over creams, gels, and ointments (P<.01). Side effects were rated to be the most important characteristics of topical therapy, followed by time needed for application, ease of application, and messiness.3 Presumably, if patients are frustrated with the topical product that they are using, adherence to the prescribed dosage and application instructions will diminish over time, leading to suboptimal steady-state levels of the product. If appropriate levels of the drug are not present at the target site, treatment will not be successful.
Steady-state levels of a topical drug at the site of action also are maintained via appropriate application frequency, most commonly once to 4 times daily for dermatologic products. Fluocinonide and halcinonide are class II (potent) corticosteroids indicated for the relief of inflammatory and pruritic manifestations of corticosteroid-responsive dermatoses and usually are administered at least twice daily. In double-blind clinical studies comparing both products in the treatment of psoriasis, halcinonide resulted in more improved outcomes than fluocinonide.4-6 Sudilovsky and Clewe4 studied 140 patients with moderate to severe psoriasis. After 3 weeks of treatment, 44% showed superior results with halcinonide, 27% showed superior results with fluocinonide, 26% showed equal results with both products, and 3% showed no relief.4 Similarly, Close5 reported that 61% of patients showed superior results with halcinonide, 25% showed superior results with fluocinonide, 10% showed equal results with both products, and 4% showed no relief (N=50). Lynfield and Watsky6 reported that 56% of patients with severe psoriasis who were treated with halcinonide for 2 weeks showed improvement to normal or slight inflammation compared to 44% of patients treated with fluocinonide (N=59). All 3 studies used cream formulations of halcinonide and fluocinonide.
Recently, halcinonide cream was shown to have an immediate release into the stratum corneum that peaked within 1 hour of application and remained elevated for 6 hours before beginning to decline.7 These results support a biphasic release of halcinonide, which is in agreement with its formulation—that halcinonide exists in both a solution phase for immediate release into the skin and in a suspension phase that allows a sustained release after equilibrium is reached between the solution and suspension phases.8 Fluocinonide is not known to be formulated in a similar way. Its vehicle composition and penetration into the skin could explain the superior efficacy of halcinonide versus fluocinonide.
The current pilot study was conducted to compare the release pattern of fluocinonide cream versus halcinonide cream into the stratum corneum using an in vivo, noninvasive method. Results for halcin-onide have been previously published.7
Methods
Participants were sequestered in a controlled environment for the entire day to allow the skin to equilibrate prior to product application. The methodology for the application and quantification of halcinonide cream 0.1% into the stratum corneum of 5 participants using a tape-stripping protocol has been described elsewhere.7 Concordia Clinical Research institutional review board (Cedar Knolls, New Jersey) approved this study, which was conducted at Dermatology Consulting Services (High Point, North Carolina).
A 0.1-g dose of generic fluocinonide cream 0.05% was applied to four 2.5-cm circular sites on the forearm in 5 participants with normal skin until completely absorbed. Circular tape strips were subsequently placed on the application site at 1, 3, 6, and 9 hours posttreatment and were held for 10 seconds with a controlled pressure plunger to ensure adequate and consistent contact between the tape strip and the skin. The tape strip was removed with forceps, rolled with the skin scale inside, and placed in a glass vial. This procedure was repeated 6 times at 1 of 4 sites with a new tape strip at each time point to obtain samples from deeper skin layers. A total of 24 tape strips were collected from each participant.
All vials were frozen at -20°C and were shipped overnight to Robert Kellar, PhD, at the Center for Bioengineering Innovation at Northern Arizona University (Flagstaff, Arizona) for mass spectroscopy evaluation. Once received at the outside facility, the vials were stored at -20°C until analysis. Each sample was spiked with a known quantity of an appropriate reference standard and extracted with 1 mL acetonitrile at room temperature for 1 minute with agitation. New unused tape strips were spiked with a small amount of fluocinonide reference standard for extraction efficiency.
Extracts were evaporated to dryness under nitrogen gas, resuspended in 200 µL chromatography solvent, and quantified using liquid chromatography–mass spectrometry. To remove the skin scale from the tape strips, 10 mL of a solvent solution of 0.1 mg/mL fludrocortisone acetate in acetonitrile was dispensed into a 4 dram vial containing the tape strip. The vials were ultrasonicated and shaken for 10 to 15 minutes, and the samples were further diluted to 100-fold and were inverted several times to ensure complete dissolution of fluocinonide before liquid chromatography–mass spectrometry.
A standard curve ranging from the lower limit of quantification to the upper limit of quantification for the fluocinonide reference was used to determine the quantity of fluocinonide in each of the tape strips. Once the lower limit of quantification was reached in a given set of tape strip samples (1-, 3-, 6-, and 9-hour samples), the next 2 sequential tape strips in that set were analyzed to confirm fluocinonide was not detectable in deeper layers. Standard quality controls were analyzed to ensure run-to-run and sample-to-sample accuracy.
Each sample was analyzed in duplicate; 10 mg fluocinonide was used as a reference standard. The minimum detectable concentration of fluocinonide was 1 ng/mL.
Results
As expected, tape strip 1 from each participant contained the highest concentration of fluocinonide. This strip corresponded to the most superficial layer of skin. Concentrations decreased in deeper skin layers, as detected in strips 2 to 6.
In general, the average concentration of fluocin-onide in strip 1 for all 5 participants was highest at hour 1, with a subsequent decline at hours 3, 6, and 9; however, participant 1 showed a second peak in fluocinonide concentration at hour 6 (Figure 1). When the fluocinonide concentration in strips 1 to 6 was averaged for each participant at each time point, similar results were obtained: a general decline after hour 1, but a second prominent peak at hour 6 in participant 1 only. In participant 1, the average fluocinonide concentration for strips 1 to 6 was 393 ng/mL at hour 1 and declined to 208 ng/mL at hour 3; it increased to 451 ng/mL at hour 6 before declining again to 202 ng/mL at hour 9.
Because participant 1 was the only one to exhibit a second peak of fluocinonide concentration, it appears that measurements obtained from this participant may be outliers. When removing partici-pant 1 from the analysis of fluocinonide concentration in strip 1 at each time point, a clear decline is evident from hour 1 to hour 9 (Figure 2A, red line [partici-pants 2–5] vs blue line [participants 1–5]).
When the average concentration of fluocinonide was calculated in strips 1 to 6 from all participants, there was a general steady decline after hour 1 with a slight increase of 25 ng/mL at hour 6 (Figure 2B, blue line). This increase is due to the measurements obtained from participant 1; however, if partici-pant 1 is removed from the analysis, a constant decline is observed from hour 1 to hour 9 (Figure 2B, red line).
|
A prior study evaluated the penetration and absorption of halcinonide in the stratum corneum.7 In summary, halcinonide concentration peaked at hour 1 following application and remained elevated to hour 6, before beginning a slow decline. The average concentration of halcinonide from all participants in strips 1 to 6 reached 1350 ng/mL at hour 1, remained within 93% to 97% of this level (1253–1303 ng/mL) for the next 5 hours, and declined only 29% from the peak at hour 1 to hour 9 (958 ng/mL)(Figure 3, blue line).7 In contrast, the fluocinonide concentration in participants 2 to 5 from the current study reached 190 ng/mL at hour 1 and steadily declined 53% to 89 ng/mL by hour 9 (Figure 3, red line).
Two participants from the prior halcinonide study also were enrolled in the current fluocinonide study (referred to as participant A and B). In general, halcinonide levels in both participants remained elevated for 6 hours after application and declined 27.5% and 35.5%, respectively, by hour 9 (Figure 4). Participant A experienced a 20.5% dip in halcinonide concentration at hour 3 followed by an increase at hour 6; however, the halcinonide concentration at hour 9 was similar to hour 3.7 In contrast, fluocin-onide concentrations for these participants peaked at 1 hour and clearly declined approximately 60% over the next 8 hours.
Comment
The release of both fluocinonide and halcinonide into the skin was evaluated using dermal tape stripping on 4 sites on the forearms of healthy individuals. Cream formulations of each corticosteroid were evaluated in 5 participants, with 2 participants receiving both formulations during different study periods. In the prior study with halcinonide, the stratum corneum exhibited the highest concentration of the corticosteroid, with substantial declines beyond strip 6 (ie, strips 7–20).7 For this reason, only strips 1 to 6 were evaluated for corticosteroid penetration and absorption.
Results from strip 1 indicated immediate absorption of corticosteroid (fluocinonide and halcinonide) into the skin. Unlike the release of halcinonide, which demonstrated a clear sustained release over 6 hours before decreasing,7 fluocinonide concentrations began declining immediately after peaking at hour 1 and continued to decline up to hour 9. Only participant 1 exhibited a second peak of fluocinonide concentration at hour 6; the rest of the participants did not. This second peak is most likely an anomaly due to the small number of participants rather than a true elevation.
Given the rapid decline of fluocinonide concentration over the 9 hours compared with the more gradual decline of halcinonide concentration, there appears to be no evidence of a biphasic sustained release of fluocinonide from its vehicle. This difference in release pattern from each corticosteroid’s respective vehicle may explain in part the different clinical outcomes in comparative studies.4-6
It is known that vehicle composition affects corticosteroid diffusion from the vehicle to the skin surface and subsequent penetration into the skin.9 Either process can determine the overall effectiveness of the product. Ayres and Hooper10 evaluated the penetration of 4 topical preparations of cortisol. Product 1 delivered 16 times more cortisol to the skin than product 2, 8 times more than product 3, and 3 times more than product 4. Because all the preparations contained cortisol-free alcohol, these differences were attributed to the vehicle in which the cortisol was formulated. Products 1 and 4 both contained 10% urea, but the urea in product 1 was a powder in a cream base and the urea in product 4 was in a stabilizing emulsified base. Product 2 contained a propylene glycol/water base and product 3 was a water-miscible cream.10
Generic corticosteroid products have been observed in clinical practice and have been shown in vasoconstriction assays to be less and more potent than their brand-name equivalents.2,11 Vasoconstriction assays are the standard for assessing the potency of topical corticosteroids and predicting their clinical efficacy.2 One study reported significant differences in therapeutic effectiveness between generic formulations and their brand-name equivalents.12 Kenalog cream 0.1% (multiple manufacturers) was significantly more potent than any of the generic triamcinolone creams tested (P<.05); in fact, Kenalog cream 0.025% (multiple manufacturers) was statistically superior to all the generic triamcinolone creams 0.1%. Moreover, Artistocort A ointment 0.1% (Lederele Laboratories) and Valisone cream 0.1% (Schering Corporation) also were more potent than their generics at the same concentration in the same vehicle type.12 A second study also observed that 2 of 6 generic formulations had significantly less vasoconstriction than their respective brand-name formulations.11 A brand-name betamethasone valerate cream produced significantly greater vasoconstriction than its generic equivalent, and a brand-name betamethasone dipropionate cream produced greater vasoconstriction than one generic and equal vasoconstriction to another generic. Additionally, the vasoconstriction measured with Diprosone was greater than that measured with Diprolene, another brand-name product of betamethasone dipropionate.11 Diprosone and Diprolene differ in their vehicle content. The latter, a class I corticosteroid, contains a modified vehicle high in propylene glycol, whereas the former contains less propylene glycol and thus is classified as a class III corticosteroid. Propylene glycol allows hydrophobic molecules such as corticosteroids to dissolve more fully in the vehicle.12
Ostrenga et al1 studied the solubility of corticosteroids in different vehicles and, as expected, corticosteroids that fully solubilized in the vehicle exhibited better penetration into the skin on assessment with vasoconstriction assays. Corticosteroids in a suspension, on the other hand, showed slower penetration into the skin.1,13 A balance between the solution and suspension phase would allow a drug to rapidly penetrate the skin upon application, and when this pool of solubilized drug was depleted, additional drug could penetrate into the skin from the suspension phase. Based on the tape strip results from the current study it appears that halcinonide, which is manufactured in a biphasic formulation, follows this pattern of penetration and absorption into the stratum corneum. In contrast, fluocinonide appears to exist in a soluble state without much, if any, amount in a suspension phase because it had no sustained release during the 9 hours after application.
Common belief among dermatologists is that long-term use of corticosteroids leads to tachyphylaxis,14 which can be attributed to poor patient adherence. If patients skip doses, then the steady state of the product at the target site is not maintained. It is interesting to speculate that using agents with more sustained release beyond the time of application (such as halcinonide) may preserve steady-state levels even when patients are neglectful of the next medication application. Corticosteroids that work in 2 phases such as halcinonide may minimize tachyphylaxis experienced with prolonged use of corticosteroids.
Fluocinonide and halcinonide are both class II high-potency corticosteroids as shown on outcomes from vasoconstrictor assays, which assess the extent to which a corticosteroid causes cutaneous vasoconstriction or blanching in normal healthy individuals.15 The assay depends on the molecule diffusing from the vehicle, penetrating the skin, and causing a reaction (blanching) that is then evaluated. The assay cannot effectively evaluate the rate of continued diffusion and skin penetration beyond the appearance of blanching. In contrast, the tape-stripping method provides an inside look at the extent of penetration of the corticosteroid beyond the skin surface and the rate of its clearance from different skin layers. In the current study, the levels of fluocinonide declined after peaking at 1 hour after application, but the levels of halcinonide clearly remained elevated after peaking at the same time point. Most likely, vasoconstrictor studies would not be able to differentiate between the concentrations of the 2 products in the stratum corneum beyond the first hour after application.
Tape stripping, or dermatopharmacokinetics, has advantages over vasoconstriction assays in studying corticosteroid penetration and clearance from the stratum corneum. At one point, the US Food and Drug Administration had included tape stripping in its preliminary guidelines for generic topical bioequivalence studies until data from the same formulation generated from 2 different laboratories produced different results.16 Since that time, much work has been done with tape stripping to ensure its consistency. Weigmann et al17 demonstrated equivalent results with clobetasol using vasoconstriction and tape stripping, and Wiedersberg et al18 demonstrated the same with betamethasone. For the current study, the fluocinonide and halcinonide formulations were weighed prior to application so that the same dose was tested in all participants. A plunger was used to produce consistent pressure at all application sites to control for the amount of skin that was stripped off with the tape. Results for both corticosteroids were consistent between the participants. Variability in the data was detected; however, this observation is most likely due to the small number of participants in the studies.
Conclusion
In summary, this pilot study demonstrated that fluocinonide concentration in the stratum corneum peaks within the first hour of application before beginning a steady general decline. There was no evidence of sustained release. In contrast, halcin-onide demonstrated a sustained release for 6 hours after application. Halcinonide is formulated in a cream base in which the corticosteroid is present in a solution and suspension phase that allows for sustained delivery in skin over time. Fluocinonide does not appear to be formulated in the same way, and its concentrations in the stratum corneum begin to decline 1 hour after application.
Acknowledgement
Thank you to Robert Kellar, PhD, at the Center for Bioengineering Innovation at Northern Arizona University, Flagstaff, for conducting the liquid chromatography–mass spectrometry.
1. Ostrenga J, Haleblian J, Poulsen B, et al. Vehicle design for a new topical steroid, fluocinonide. J Invest Dermatol. 1971;56:392-399.
2. Rathi SK, D’Souza P. Rational and ethical use of topical corticosteroids based on safety and efficacy. Indian J Dermatol. 2012;57:251-259.
3. Housman TS, Mellen BG, Rapp SR, et al. Patients with psoriasis prefer solution and foam vehicles: a quantitative assessment of vehicle preference. Cutis. 2002;70:327-332.
4. Sudilovsky A, Clewe TH. Comparative efficacy of halcin-onide and fluocinonide creams in psoriasis and eczematous dermatoses. J Clin Pharmacol. 1975;15:779-784.
5. Close JE. Double-blind comparison of topical halcinonide and fluocinonide in the treatment of psoriasis. Int J Dermatol. 1976;15:534-537.
6. Lynfield Y, Watsky M. Psoriasis: topical corticosteroid therapy. Cutis. 1976;18:133, 136-137.
7. Draelos ZD. Demonstration of the biphasic release of 0.1% halcinonide cream. J Drugs Dermatol. 2015;14:89-90.
8. Bagatell FK. Halcinonide: a new potent topical anti-inflammatory drug. Cutis. 1974;14:459-462.
9. Ostrenga J, Steinmetz C, Poulsen B. Significance of vehicle composition. I. relationship between topical vehicle composition, skin penetrability, and clinical efficacy. J Pharm Sci. 1971;60:1175-1179.
10. Ayres PJ, Hooper G. Assessment of the skin penetration properties of different carrier vehicles for topically applied cortisol. Br J Dermatol. 1978;99:307-317.
11. Olsen EA. Double-blind controlled comparison of generic and trade-name topical steroids using the vasoconstriction assay. Arch Dermatol. 1991;127:197-201.
12. Stoughton RB. Are generic formulations equivalent to trade name topical glucocorticoids? Arch Dermatol. 1987;123:1312-1314.
13. Poulsen BJ, Young E, Coquilla V, et al. Effect of topical vehicle composition on the in vitro release of fluocinolone acetonide and its acetate ester. J Pharm Sci. 1968;57:928-933.
14. Taheri A, Cantrell J, Feldman SR. Tachyphylaxis to topical glucocorticoids: what is the evidence? Dermatol Online J. 2013;19:18954.
15. Ference JD, Last AR. Choosing topical corticosteroids. Am Fam Physician. 2009;79:135-140.
16. Pershing LK, Nelson JL, Corlett JL, et al. Assessment of dermatopharmacokinetic approach in the bioequivalence determination of topical tretinoin gel products. J Am Acad Dermatol. 2003;48:740-751.
17. Weigmann H, Lademann J, v Pelchrzim R, et al. Bioavailability of clobetasol propionate-quantification of drug concentrations in the stratum corneum by dermatopharmacokinetics using tape stripping. Skin Pharmacol Appl Skin Physiol. 1999;12:46-53.
18. Wiedersberg S, Naik A, Leopold CS, et al. Pharmacodynamics and dermatopharmacokinetics of betamethasone 17-valerate: assessment of topical bioavailability. Br J Dermatol. 2009;160:676-686.
Practice Points
- Fluocinonide concentration in the stratum corneum peaks within the first hour of application and then begins a steady decline.
- Halcinonide concentration also peaks within the first hour of application and remains elevated for 6 hours after application.
- Halcinonide, rather than fluocinonide, may provide clinical benefits in between doses because of its sustained release hours after application.

Impact of an Inpatient PN Program
Inpatient medicine is becoming increasingly complex. A growing number of patients with multiple chronic conditions coupled with mounting care fragmentation leave patients vulnerable to adverse events and readmission to the hospital.[1, 2, 3] Moreover, efforts to minimize hospital length of stay (LOS) have resulted in patients being discharged quicker and sicker than ever before.[4]
A cornerstone of safe and high‐quality healthcare is effective communication.[5] Ineffective communication between and among healthcare providers and patients is a leading cause of medical errors and patient harm. An analysis of sentinel events reported to The Joint Commission revealed that communication failure was the root cause in 59% of these events.[6]
The current climate of increasing healthcare complexity has prompted the need for adaptive innovation.[7] However, there are limited data describing interventions targeting improvements in both communication and transitional care planning. We created a new position, the patient navigator (PN), a dedicated patient‐care facilitator not responsible for clinical care. PNs were integrated into the inpatient multidisciplinary clinical team to facilitate patient and provider navigation through the complexity of a hospital admission by enhancing communication between and among patients and providers. The objective of this study was to determine whether this intervention would reduce hospital LOS and 30‐day unplanned readmissions.
METHODS
Setting
Mount Sinai Hospital is a 446‐bed acute care urban academic health center in Toronto, Ontario, Canada. The general internal medicine service operates as a 90‐bed clinical teaching unit physically distributed over 4 inpatient wards. The service is structurally divided into 4 nongeographically based multidisciplinary care teams (teams A, B, C, and D) comprised of the medical team (attending physician, senior resident physician, 23 junior resident physicians, and 23 medical students), pharmacist, social worker, physiotherapist, occupational therapist, speech and language pathologist, dietician, respiratory therapist, and nursing staff allocated by ward. Each team is on call approximately 1 night in 4 with no night float system. At our institution, attending physicians rotate on a 2‐ or 4‐week schedule, resident physicians rotate on a 1‐ or 2‐month schedule, and medical students rotate on a 2‐month schedule. Preintervention, communication occurred in person and by telephone between members of the medical team. Other members of the multidisciplinary care team communicated with the medical team in person at daily multidisciplinary rounds focused on discharge planning, by pager, or using a Web‐based communication tool.
Intervention
PNs were dedicated patient‐care facilitators not responsible for clinical care. They acted as liaisons between and among providers and patients. Each PN was a fully integrated member of their multidisciplinary care team. With ongoing medical team rotations, the PN was notably the only consistent member on the clinical team. Each patient saw the same PN throughout his or her hospital stay, as both the patient and the PN were team based. The average number of patients for whom each PN was responsible daily was dictated by the patient census for their team. On average, each team had a census between 20 and 30 patients daily. PNs worked during the daytime from Monday to Friday, and did not have any overnight or weekend responsibilities.
A PN's typical day began by reviewing and rounding on overnight admissions as a formal member of the clinical team. This was followed by participating in daily multidisciplinary rounds, then documenting and circulating the resultant action items. Thereafter, they expedited consultations and tests by liaising with departmental staff, and proactively established contact with the patient and their family. They answered simple factual questions related to test scheduling, consultations, diagnosis, medications, and treatments as discussed and outlined by the clinical team, and promptly relayed care questions beyond the scope of their knowledge to the clinical team. They were available to patients, family members, and providers via a dedicated mobile number using phone calls and text messages. If indicated, they assisted in discharge coordination by arranging follow‐up appointments and placing postdischarge phone calls. In addition, they served as primary contact for every patient admitted to their clinical team following discharge to ensure appropriate follow through on discharge plans. There were no set criteria for PNs to disengage from a patient's care. They could always be reached using their dedicated mobile number during business hours, with a voicemail system in place for after‐hours calls.
The role was filled by individuals skilled in communication and/or healthcare, such as registered nurses, a masters degreetrained educator, internationally trained physicians, and professionals from the hospitality and human resources industries. There were no prespecified training or degree requirements. Each PN underwent on‐the‐job training and participated in twice monthly PN meetings for ongoing feedback and education.
Program Implementation
We implemented the PN program on the inpatient general internal medicine service in June 2010 on 2 of 4 multidisciplinary clinical teams. Because a PN became an integrated member of 1 of 4 clinical teams, patient assignment to a PN was determined by the team to which the patient was admitted. On average, each of the 4 teams admitted equally on a daily basis. Initially, there were only sufficient resources to fund 2 PNs. Thus, from June 2010 to May 2011, only teams A and C were assigned PNs. To create fairness between the 4 teams, these 2 PNs moved to teams B and D from June 2011 to November 2011, and then back to teams A and C from December 2011 to April 2012. Following this initial pilot period, the program was allocated further resources, and so expanded to all 4 teams in May 2012. PN salaries were the only program costs. These costs were funded by matching donations from physicians within the Mount Sinai Hospital Department of Medicine and donations to the hospital from community members directed to support the implementation and evaluation of novel care delivery systems.
Study Design
We evaluated the PN program using a retrospective cohort study that included all general medical admissions between July 2010 and March 2014 matched by case mix group, age category, and resource intensity weight (a relative value measuring total patient resource use compared with average typical acute inpatients).[8]
Our primary outcomes were LOS and 30‐day readmission rate. These outcomes were stratified by exposure status to a PN. There were no exclusion criteria for the LOS analysis. Patients who died, were transferred to or from an acute care facility, or signed out against medical advice were excluded from the 30‐day readmission analysis. A secondary analysis restricted the timeframe from July 2010 to April 2011, when only 2 of 4 teams were exposed to PNs.
Average LOS has been observed to be higher in Canadian hospitals as compared to their US counterparts across different admission diagnoses, such as coronary artery bypass graft surgery and heart failure.[9, 10] We hypothesize that these differences are party due to systems‐level differences, including posthospital care. Specifically, the Canadian system does not utilize posthospital acute care, such as skilled nursing facilities, which may in part account for these differences. To help contextualize our data, we standardized LOS using an LOS index called the LOS/expected LOS (ELOS) ratio. It takes the LOS and divides it by the ELOS, a validated estimate of the expected LOS for a given patient generated using a national administrative database for acute hospital care in Canada that takes into account case mix group, age, comorbidity level, and intervention factors.[8]
Additionally, We performed an interrupted time‐series analysis, whereby a log‐linear model was fit on LOS and adjusted for weekly and monthly trends, age category, resource intensity weight, major clinical category (a surrogate for case mix group), admission location, and discharge location. The cohort was divided into 3 groups: before program implementation (July 2009June 2010), after program implementation with PN (July 2010March 2014), and after program implementation without PN (July 2010March 2014).
This study was approved by the research ethics board at Mount Sinai Hospital. No patient consent was deemed necessary. Data were obtained from institutional databases monitored by the hospital's performance measurement office.
Statistical Analysis
In Tables 1, 2, mean values were compared using a 2‐tailed t test, and the relationship between categorical groups was determined using a 2 test. For the interrupted time‐series analysis, 2‐tailed t tests were used to test null hypotheses of no association between the parameter value and the outcome, and 2 tests were used to test for the equivalence of 2 given parameters. P0.05 indicated statistical significance for all comparisons and analyses. All data were analyzed using Stata version 13 (StataCorp, College Station, TX) or R 3.0.2 (R Foundation for Statistical Computing, Vienna, Austria).
| With PN, n = 5,628 | Without PN, n = 2,213 | |
|---|---|---|
| ||
| Age, y, mean (SD)* | 69 (20) | 68 (20) |
| Female sex, n (%) | 3,018 (53.6) | 1,196 (54.0) |
| Most responsible diagnosis, n (%) | ||
| Pneumonia | 374 (6.6) | 135 (6.1) |
| Chronic obstructive pulmonary disease | 271 (4.8) | 88 (4.0) |
| Congestive heart failure | 217 (3.9) | 87 (3.9) |
| Admission location, n (%) | ||
| Home | 4,665 (82.9) | 1,943 (87.8) |
| Long‐term care* | 524 (9.3) | 158 (7.1) |
| Other* | 439 (7.8) | 112 (5.1) |
| Discharge location, n (%) | ||
| Home | 3,824 (67.9) | 1,578 (71.3) |
| Long‐term care | 779 (13.8) | 267 (12.1) |
| Other | 1,025 (18.3) | 368 (16.6) |
RESULTS
Our matched cohort included 7841 admissions (6141 patients), with 5628 admissions (4592 patients) exposed and 2213 admissions (1920 patients) not exposed to PNs. The discrepancy between the total number of patients and the sum of exposed and nonexposed patients is resultant from patients admitted more than once over the study period, as patients admitted to at least 1 team staffed with a PN and another team not staffed with a PN over the study period were counted in both groups. The 2 groups were similar with respect to several characteristics (Table 1). However, the 2 groups were significantly different for age (P = 0.046) and admissions from long‐term care (P < 0.01) and other facilities (P < 0.01).
Admissions with PNs were 1.3 days (21%) shorter than admission without PNs (6.2 vs 7.5 days, P < 0.001). Moreover, admissions with PNs had a smaller mean LOS/ELOS ratio compared to admissions without PNs (0.93 vs 1.05, P < 0.001). The restricted analysis found a 1.2‐day (18%) lower LOS (6.4 vs 7.6 days, P < 0.05) and a smaller mean LOS/ELOS ratio (0.91 vs 1.06, P < 0.001). Thirty‐day readmission rate was not different between the 2 groups (13.1 vs 13.8%, P = 0.48) or in the restricted analysis (12.0 vs 13.5%, P = 0.40) (Table 2).
| With PN | Without PN | P Value | |
|---|---|---|---|
| |||
| July 2010‐March 2014 | |||
| LOS, d (95% confidence interval) [n] | 6.2 (6.06.4) [5,628] | 7.5 (7.17.9) [2,213] | <0.001 |
| LOS/ELOS ratio (95% confidence interval) [n] | 0.93 (0.910.95) [5,628] | 1.05 (1.001.09) [2,213] | <0.001 |
| 30‐day readmission rate, % [n] | 13.1 [5,055] | 13.8 [2,012] | 0.48 |
| July 2010 to April 2011 | |||
| LOS, d (95% confidence interval) [n] | 6.4 (5.87.0) [713] | 7.6 (6.88.3) [753) | <0.05 |
| LOS/ELOS ratio (95% confidence interval) [n] | 0.91 (0.850.96) [713] | 1.06 (1.001.11) [753] | <0.001 |
| 30‐day readmission rate, % [n] | 12.0 [627] | 13.5 [681] | 0.40 |
In the interrupted time‐series analysis, prior to the implementation of the PN program, there was a positive relationship between LOS and time. After the implementation of the program, this relationship became inverse, meaning the curve plotting LOS against time had a negative slope. Furthermore, there was a statistically significant drop in LOS at the time of program implementation (P < 0.05). However, there was no difference in slope between the groups with and without PN after program implementation.
DISCUSSION
We describe an innovative inpatient intervention featuring an integrated patient‐care facilitator not responsible for clinical care charged with enhancing communication between and among patients and providers. Data from the almost 4‐year period demonstrated that implementation was associated with a 21% reduction in hospital LOS, with no difference in 30‐day readmission rates.
The patient navigator was first conceptualized in 1990 to help African American women in Harlem with breast cancer negotiate the complex world of oncology.[11] It was later implemented by the National Cancer Institute as an outpatient intervention spanning the continuum of cancer care. This concept has since expanded to other domains of complex single disease outpatient care, including asthma and fertility.[12, 13] To our knowledge, there has been limited evidence in the literature describing implementation of such programs in the inpatient general medical setting.
This study contributes to the growing literature on interventions targeting improvements in transitional care, such as transition coaches and discharge advocates.[14, 15] Balaban et al. recently described a PN intervention in the safety‐net population.[16] A common theme to these interventions was the prioritization of safe care transitions. However, this goal was achieved using related, yet different approaches: transition coaches focused on encouraging the patient and caregiver to assert a more active role,[14] discharge advocates focused on providing a comprehensive discharge plan for patients,[15] PNs from Balaban's study focused on coaching and assistance in navigating patients through the transition from hospital to home, and our study's PNs focused on enhancing communication between and among patients and providers. Additionally, unlike transition coaches and discharge advocates, who were nurses by training, and PNs from Balaban's study, who were community health workers, our PNs did not have any prespecified training or degree requirements.
Patients are at risk of being inadequately informed about important issues related to their care, such as hospital medications, diagnoses, and treatment plans during their hospital stay.[17, 18] Furthermore, we know that ineffective communication is a common cause of poor patient outcomes in hospital‐based care.[6] This phenomenon can be amplified from external pressures to maximize productivity. For example, Elliott and colleagues found that increasing hospitalist workload is associated with higher hospital LOS and cost.[19] PNs may offload care demands by enhancing communication for providers and patients.
Our study has several strengths. By matching admissions by case mix group, age category, and resource intensity weight, we aimed to reduce potential bias contributed by these covariates. Moreover, a staged rollout of the intervention, whereby over a 10‐month period, 2 of the multidisciplinary care teams were assigned PNs, while the remaining 2 were not, enabled contemporaneous comparison. Our study had few exclusion criteria, thus making it potentially generalizable to other inpatient general medicine settings of a similar nature. The relative simplicity of this intervention makes it amenable to scalability. Of note, the intervention has been deemed to show great promise at our institution, and has currently expanded to the cardiology, gastroenterology, and surgical oncology units.
Our study's limitations include a single‐center design. Moreover, although we demonstrate similarity in the majority of measurable covariates between the groups, we cannot exclude the existence of unmeasured confounders. Of the covariates that were found to be different between the groups, we suspect the difference in admissions from long‐term care and other facilities did not largely influence our study's main findings. Furthermore, though age was found to be statistically different between the groups, we postulate that the 1‐year difference between the groups is not particularly relevant clinically. Additionally, 30‐day readmission rates were only captured for our institution. However, the vast majority of readmissions in our region are to the index facility, and are unlikely to differ between the 2 groups.[20]
There may have been secular trends at play. In the interrupted time‐series analysis, there was a statistically significant drop in LOS at the time of program implementation. There was however, no difference in slope between the groups with and without PNs after program implementation. There are some plausible explanations for this lack of difference in slope. The study may not have been powered to detect such a difference, as this analysis was not prespecified. Furthermore, there may have been a spillover effect of the program, such that PNs may have improved efficiency for the teams to which they were assigned, thereby improving the efficiency of the other members of the multidisciplinary team, many of whom cared for patients assigned and not assigned a PN. Additionally, we measured the LOS in a preintervention control group between July 2009 and June 2010 using the same inclusion criteria as the matched cohort. It was found to be 8.5 days, which suggests a secular trend toward improvement in LOS over time at our institution. We are, however, reassured that our restricted analysis enabling contemporaneous comparison between patients exposed and not exposed to PNs was still found to be significant.
The implementation of this intervention could have implications for policymakers‐at‐large. Establishment of criteria for qualifications and a clear educational curriculum to train future PNs is needed, especially in the context of ongoing program expansion. These initiatives are currently underway at our institution. Furthermore, evaluation of the program's operating cost and calculation of its return on investment should include balanced metrics incorporating patient‐, provider‐, organizational‐, and system‐level measures. The current cost to the hospital per PN is approximately $73,800 CAD ($58,700 USD), which covers 1 PN's annual salary and benefits. Thus, the implementation of 4 PNs for each of the 4 multidisciplinary teams costs the hospital approximately $295,000 CAD ($234,700 USD) per year. Although the details of our preliminary calculations are outside the scope of this report, it suggests that the savings incurred from shorter LOS outweigh program costs.
We found that implementation of this innovative inpatient intervention targeting improvements in communication was associated with a reduction in LOS without an increase in 30‐day readmission. Our experience shows promise and may inform others considering similar interventions. Patient and provider experience and generalizability should be evaluated in future work.
Acknowledgements
The authors thank Dr. Allan Detsky and David Wells for their review of the manuscript. They are also grateful to Chin‐Chin Chua, Ningmei Wang, and Joann Bon in the Office of Quality and Performance Measurement for their help with data collection, and John Matelski for his help with data analysis.
Disclosure: This program was funded by matched donations from physicians in the Mount Sinai Hospital Department of Medicine and donations to Mount Sinai Hospital from community members directed to support the implementation and evaluation of novel care delivery systems. The authors report no conflicts of interest. Preliminary abstracts of this study were presented in the online forum, Leading Health Care Innovation, November 12, 2013 (
- , , , et al. Multiple chronic conditions: prevalence, health consequences, and implications for quality, care management, and costs. J Gen Intern Med. 2007;22(S3):391–395.
- , , , , . The incidence and severity of adverse events affecting patients after discharge from the hospital. Ann Intern Med. 2003;138(3):161–167.
- , , . Rehospitalizations among patients in the Medicare fee‐for‐service program. N Engl J Med. 2009;360(14):1418–1428.
- , , , et al. Prospective payment system and impairment at discharge. The “quicker‐and‐sicker” story revisited. JAMA. 1990;264(15):1980–1983.
- . The human factor: the critical importance of effective teamwork and communication in providing safe care. Qual Saf Health Care. 2004;13(suppl 1):i85–i90.
- The Joint Commission. Sentinel event data root: causes by event type (2004–June 2014). Available at: http://www.jointcommission.org/assets/1/18/Root_Causes_by_Event_Type_2004‐2014.pdf. Accessed March 12, 2014.
- , . Complexity science: the challenge of complexity in health care. BMJ. 2001;323(7313):625–628.
- Canadian Institute for Health Information. Case mix. Available at: http://www.cihi.ca/CIHI‐ext‐portal/internet/EN/TabbedContent/standards+and+data+submission/standards/case+mix/cihi010690. Accessed April 12, 2015.
- , , , , , . Outcomes and cost of coronary artery bypass graft surgery in the United States and Canada. Arch Intern Med. 2005;165(13):1506–1513.
- , , , et al. Differences in treatment, outcomes, and quality of life among patients with heart failure in Canada and the United States. JACC Heart Fail. 2013;1(6):523–530.
- , , . Expanding access to cancer screening and clinical follow‐up among the medically underserved. Cancer Pract. 1995;3(1):19–30.
- , , , et al. Clearing clinical barriers: enhancing social support using a patient navigator for asthma care. J Asthma. 2010;47(8):913–919.
- . The role of a patient navigator in fertility preservation. In: Cancer Treatment and Research. Vol 156. Boston, MA: Springer US; 2010:469–470.
- , , , . The care transitions intervention: results of a randomized controlled trial. Arch Intern Med. 2006;166(17):1822–1828.
- , , , et al. A reengineered hospital discharge program to decrease rehospitalization: a randomized trial. Ann Intern Med. 2009;150(3):178–187.
- , , , , , . A patient navigator intervention to reduce hospital readmissions among high‐risk safety‐net patients: a randomized controlled trial. J Gen Intern Med. 2015;30(7):907–915.
- , , . Lack of patient knowledge regarding hospital medications. J Hosp Med. 2010;5(2):83–86.
- , . Patients' understanding of their treatment plans and diagnosis at discharge. Mayo Clin Proc. 2005;80(8):991–994.
- , , , , . Effect of Hospitalist Workload on the Quality and Efficiency of Care. JAMA Intern Med. 2014;174(5):786.
- , , , et al. Unplanned readmissions after hospital discharge among patients identified as being at high risk for readmission using a validated predictive algorithm. Open Med. 2011;5(2):e104–e111.
Inpatient medicine is becoming increasingly complex. A growing number of patients with multiple chronic conditions coupled with mounting care fragmentation leave patients vulnerable to adverse events and readmission to the hospital.[1, 2, 3] Moreover, efforts to minimize hospital length of stay (LOS) have resulted in patients being discharged quicker and sicker than ever before.[4]
A cornerstone of safe and high‐quality healthcare is effective communication.[5] Ineffective communication between and among healthcare providers and patients is a leading cause of medical errors and patient harm. An analysis of sentinel events reported to The Joint Commission revealed that communication failure was the root cause in 59% of these events.[6]
The current climate of increasing healthcare complexity has prompted the need for adaptive innovation.[7] However, there are limited data describing interventions targeting improvements in both communication and transitional care planning. We created a new position, the patient navigator (PN), a dedicated patient‐care facilitator not responsible for clinical care. PNs were integrated into the inpatient multidisciplinary clinical team to facilitate patient and provider navigation through the complexity of a hospital admission by enhancing communication between and among patients and providers. The objective of this study was to determine whether this intervention would reduce hospital LOS and 30‐day unplanned readmissions.
METHODS
Setting
Mount Sinai Hospital is a 446‐bed acute care urban academic health center in Toronto, Ontario, Canada. The general internal medicine service operates as a 90‐bed clinical teaching unit physically distributed over 4 inpatient wards. The service is structurally divided into 4 nongeographically based multidisciplinary care teams (teams A, B, C, and D) comprised of the medical team (attending physician, senior resident physician, 23 junior resident physicians, and 23 medical students), pharmacist, social worker, physiotherapist, occupational therapist, speech and language pathologist, dietician, respiratory therapist, and nursing staff allocated by ward. Each team is on call approximately 1 night in 4 with no night float system. At our institution, attending physicians rotate on a 2‐ or 4‐week schedule, resident physicians rotate on a 1‐ or 2‐month schedule, and medical students rotate on a 2‐month schedule. Preintervention, communication occurred in person and by telephone between members of the medical team. Other members of the multidisciplinary care team communicated with the medical team in person at daily multidisciplinary rounds focused on discharge planning, by pager, or using a Web‐based communication tool.
Intervention
PNs were dedicated patient‐care facilitators not responsible for clinical care. They acted as liaisons between and among providers and patients. Each PN was a fully integrated member of their multidisciplinary care team. With ongoing medical team rotations, the PN was notably the only consistent member on the clinical team. Each patient saw the same PN throughout his or her hospital stay, as both the patient and the PN were team based. The average number of patients for whom each PN was responsible daily was dictated by the patient census for their team. On average, each team had a census between 20 and 30 patients daily. PNs worked during the daytime from Monday to Friday, and did not have any overnight or weekend responsibilities.
A PN's typical day began by reviewing and rounding on overnight admissions as a formal member of the clinical team. This was followed by participating in daily multidisciplinary rounds, then documenting and circulating the resultant action items. Thereafter, they expedited consultations and tests by liaising with departmental staff, and proactively established contact with the patient and their family. They answered simple factual questions related to test scheduling, consultations, diagnosis, medications, and treatments as discussed and outlined by the clinical team, and promptly relayed care questions beyond the scope of their knowledge to the clinical team. They were available to patients, family members, and providers via a dedicated mobile number using phone calls and text messages. If indicated, they assisted in discharge coordination by arranging follow‐up appointments and placing postdischarge phone calls. In addition, they served as primary contact for every patient admitted to their clinical team following discharge to ensure appropriate follow through on discharge plans. There were no set criteria for PNs to disengage from a patient's care. They could always be reached using their dedicated mobile number during business hours, with a voicemail system in place for after‐hours calls.
The role was filled by individuals skilled in communication and/or healthcare, such as registered nurses, a masters degreetrained educator, internationally trained physicians, and professionals from the hospitality and human resources industries. There were no prespecified training or degree requirements. Each PN underwent on‐the‐job training and participated in twice monthly PN meetings for ongoing feedback and education.
Program Implementation
We implemented the PN program on the inpatient general internal medicine service in June 2010 on 2 of 4 multidisciplinary clinical teams. Because a PN became an integrated member of 1 of 4 clinical teams, patient assignment to a PN was determined by the team to which the patient was admitted. On average, each of the 4 teams admitted equally on a daily basis. Initially, there were only sufficient resources to fund 2 PNs. Thus, from June 2010 to May 2011, only teams A and C were assigned PNs. To create fairness between the 4 teams, these 2 PNs moved to teams B and D from June 2011 to November 2011, and then back to teams A and C from December 2011 to April 2012. Following this initial pilot period, the program was allocated further resources, and so expanded to all 4 teams in May 2012. PN salaries were the only program costs. These costs were funded by matching donations from physicians within the Mount Sinai Hospital Department of Medicine and donations to the hospital from community members directed to support the implementation and evaluation of novel care delivery systems.
Study Design
We evaluated the PN program using a retrospective cohort study that included all general medical admissions between July 2010 and March 2014 matched by case mix group, age category, and resource intensity weight (a relative value measuring total patient resource use compared with average typical acute inpatients).[8]
Our primary outcomes were LOS and 30‐day readmission rate. These outcomes were stratified by exposure status to a PN. There were no exclusion criteria for the LOS analysis. Patients who died, were transferred to or from an acute care facility, or signed out against medical advice were excluded from the 30‐day readmission analysis. A secondary analysis restricted the timeframe from July 2010 to April 2011, when only 2 of 4 teams were exposed to PNs.
Average LOS has been observed to be higher in Canadian hospitals as compared to their US counterparts across different admission diagnoses, such as coronary artery bypass graft surgery and heart failure.[9, 10] We hypothesize that these differences are party due to systems‐level differences, including posthospital care. Specifically, the Canadian system does not utilize posthospital acute care, such as skilled nursing facilities, which may in part account for these differences. To help contextualize our data, we standardized LOS using an LOS index called the LOS/expected LOS (ELOS) ratio. It takes the LOS and divides it by the ELOS, a validated estimate of the expected LOS for a given patient generated using a national administrative database for acute hospital care in Canada that takes into account case mix group, age, comorbidity level, and intervention factors.[8]
Additionally, We performed an interrupted time‐series analysis, whereby a log‐linear model was fit on LOS and adjusted for weekly and monthly trends, age category, resource intensity weight, major clinical category (a surrogate for case mix group), admission location, and discharge location. The cohort was divided into 3 groups: before program implementation (July 2009June 2010), after program implementation with PN (July 2010March 2014), and after program implementation without PN (July 2010March 2014).
This study was approved by the research ethics board at Mount Sinai Hospital. No patient consent was deemed necessary. Data were obtained from institutional databases monitored by the hospital's performance measurement office.
Statistical Analysis
In Tables 1, 2, mean values were compared using a 2‐tailed t test, and the relationship between categorical groups was determined using a 2 test. For the interrupted time‐series analysis, 2‐tailed t tests were used to test null hypotheses of no association between the parameter value and the outcome, and 2 tests were used to test for the equivalence of 2 given parameters. P0.05 indicated statistical significance for all comparisons and analyses. All data were analyzed using Stata version 13 (StataCorp, College Station, TX) or R 3.0.2 (R Foundation for Statistical Computing, Vienna, Austria).
| With PN, n = 5,628 | Without PN, n = 2,213 | |
|---|---|---|
| ||
| Age, y, mean (SD)* | 69 (20) | 68 (20) |
| Female sex, n (%) | 3,018 (53.6) | 1,196 (54.0) |
| Most responsible diagnosis, n (%) | ||
| Pneumonia | 374 (6.6) | 135 (6.1) |
| Chronic obstructive pulmonary disease | 271 (4.8) | 88 (4.0) |
| Congestive heart failure | 217 (3.9) | 87 (3.9) |
| Admission location, n (%) | ||
| Home | 4,665 (82.9) | 1,943 (87.8) |
| Long‐term care* | 524 (9.3) | 158 (7.1) |
| Other* | 439 (7.8) | 112 (5.1) |
| Discharge location, n (%) | ||
| Home | 3,824 (67.9) | 1,578 (71.3) |
| Long‐term care | 779 (13.8) | 267 (12.1) |
| Other | 1,025 (18.3) | 368 (16.6) |
RESULTS
Our matched cohort included 7841 admissions (6141 patients), with 5628 admissions (4592 patients) exposed and 2213 admissions (1920 patients) not exposed to PNs. The discrepancy between the total number of patients and the sum of exposed and nonexposed patients is resultant from patients admitted more than once over the study period, as patients admitted to at least 1 team staffed with a PN and another team not staffed with a PN over the study period were counted in both groups. The 2 groups were similar with respect to several characteristics (Table 1). However, the 2 groups were significantly different for age (P = 0.046) and admissions from long‐term care (P < 0.01) and other facilities (P < 0.01).
Admissions with PNs were 1.3 days (21%) shorter than admission without PNs (6.2 vs 7.5 days, P < 0.001). Moreover, admissions with PNs had a smaller mean LOS/ELOS ratio compared to admissions without PNs (0.93 vs 1.05, P < 0.001). The restricted analysis found a 1.2‐day (18%) lower LOS (6.4 vs 7.6 days, P < 0.05) and a smaller mean LOS/ELOS ratio (0.91 vs 1.06, P < 0.001). Thirty‐day readmission rate was not different between the 2 groups (13.1 vs 13.8%, P = 0.48) or in the restricted analysis (12.0 vs 13.5%, P = 0.40) (Table 2).
| With PN | Without PN | P Value | |
|---|---|---|---|
| |||
| July 2010‐March 2014 | |||
| LOS, d (95% confidence interval) [n] | 6.2 (6.06.4) [5,628] | 7.5 (7.17.9) [2,213] | <0.001 |
| LOS/ELOS ratio (95% confidence interval) [n] | 0.93 (0.910.95) [5,628] | 1.05 (1.001.09) [2,213] | <0.001 |
| 30‐day readmission rate, % [n] | 13.1 [5,055] | 13.8 [2,012] | 0.48 |
| July 2010 to April 2011 | |||
| LOS, d (95% confidence interval) [n] | 6.4 (5.87.0) [713] | 7.6 (6.88.3) [753) | <0.05 |
| LOS/ELOS ratio (95% confidence interval) [n] | 0.91 (0.850.96) [713] | 1.06 (1.001.11) [753] | <0.001 |
| 30‐day readmission rate, % [n] | 12.0 [627] | 13.5 [681] | 0.40 |
In the interrupted time‐series analysis, prior to the implementation of the PN program, there was a positive relationship between LOS and time. After the implementation of the program, this relationship became inverse, meaning the curve plotting LOS against time had a negative slope. Furthermore, there was a statistically significant drop in LOS at the time of program implementation (P < 0.05). However, there was no difference in slope between the groups with and without PN after program implementation.
DISCUSSION
We describe an innovative inpatient intervention featuring an integrated patient‐care facilitator not responsible for clinical care charged with enhancing communication between and among patients and providers. Data from the almost 4‐year period demonstrated that implementation was associated with a 21% reduction in hospital LOS, with no difference in 30‐day readmission rates.
The patient navigator was first conceptualized in 1990 to help African American women in Harlem with breast cancer negotiate the complex world of oncology.[11] It was later implemented by the National Cancer Institute as an outpatient intervention spanning the continuum of cancer care. This concept has since expanded to other domains of complex single disease outpatient care, including asthma and fertility.[12, 13] To our knowledge, there has been limited evidence in the literature describing implementation of such programs in the inpatient general medical setting.
This study contributes to the growing literature on interventions targeting improvements in transitional care, such as transition coaches and discharge advocates.[14, 15] Balaban et al. recently described a PN intervention in the safety‐net population.[16] A common theme to these interventions was the prioritization of safe care transitions. However, this goal was achieved using related, yet different approaches: transition coaches focused on encouraging the patient and caregiver to assert a more active role,[14] discharge advocates focused on providing a comprehensive discharge plan for patients,[15] PNs from Balaban's study focused on coaching and assistance in navigating patients through the transition from hospital to home, and our study's PNs focused on enhancing communication between and among patients and providers. Additionally, unlike transition coaches and discharge advocates, who were nurses by training, and PNs from Balaban's study, who were community health workers, our PNs did not have any prespecified training or degree requirements.
Patients are at risk of being inadequately informed about important issues related to their care, such as hospital medications, diagnoses, and treatment plans during their hospital stay.[17, 18] Furthermore, we know that ineffective communication is a common cause of poor patient outcomes in hospital‐based care.[6] This phenomenon can be amplified from external pressures to maximize productivity. For example, Elliott and colleagues found that increasing hospitalist workload is associated with higher hospital LOS and cost.[19] PNs may offload care demands by enhancing communication for providers and patients.
Our study has several strengths. By matching admissions by case mix group, age category, and resource intensity weight, we aimed to reduce potential bias contributed by these covariates. Moreover, a staged rollout of the intervention, whereby over a 10‐month period, 2 of the multidisciplinary care teams were assigned PNs, while the remaining 2 were not, enabled contemporaneous comparison. Our study had few exclusion criteria, thus making it potentially generalizable to other inpatient general medicine settings of a similar nature. The relative simplicity of this intervention makes it amenable to scalability. Of note, the intervention has been deemed to show great promise at our institution, and has currently expanded to the cardiology, gastroenterology, and surgical oncology units.
Our study's limitations include a single‐center design. Moreover, although we demonstrate similarity in the majority of measurable covariates between the groups, we cannot exclude the existence of unmeasured confounders. Of the covariates that were found to be different between the groups, we suspect the difference in admissions from long‐term care and other facilities did not largely influence our study's main findings. Furthermore, though age was found to be statistically different between the groups, we postulate that the 1‐year difference between the groups is not particularly relevant clinically. Additionally, 30‐day readmission rates were only captured for our institution. However, the vast majority of readmissions in our region are to the index facility, and are unlikely to differ between the 2 groups.[20]
There may have been secular trends at play. In the interrupted time‐series analysis, there was a statistically significant drop in LOS at the time of program implementation. There was however, no difference in slope between the groups with and without PNs after program implementation. There are some plausible explanations for this lack of difference in slope. The study may not have been powered to detect such a difference, as this analysis was not prespecified. Furthermore, there may have been a spillover effect of the program, such that PNs may have improved efficiency for the teams to which they were assigned, thereby improving the efficiency of the other members of the multidisciplinary team, many of whom cared for patients assigned and not assigned a PN. Additionally, we measured the LOS in a preintervention control group between July 2009 and June 2010 using the same inclusion criteria as the matched cohort. It was found to be 8.5 days, which suggests a secular trend toward improvement in LOS over time at our institution. We are, however, reassured that our restricted analysis enabling contemporaneous comparison between patients exposed and not exposed to PNs was still found to be significant.
The implementation of this intervention could have implications for policymakers‐at‐large. Establishment of criteria for qualifications and a clear educational curriculum to train future PNs is needed, especially in the context of ongoing program expansion. These initiatives are currently underway at our institution. Furthermore, evaluation of the program's operating cost and calculation of its return on investment should include balanced metrics incorporating patient‐, provider‐, organizational‐, and system‐level measures. The current cost to the hospital per PN is approximately $73,800 CAD ($58,700 USD), which covers 1 PN's annual salary and benefits. Thus, the implementation of 4 PNs for each of the 4 multidisciplinary teams costs the hospital approximately $295,000 CAD ($234,700 USD) per year. Although the details of our preliminary calculations are outside the scope of this report, it suggests that the savings incurred from shorter LOS outweigh program costs.
We found that implementation of this innovative inpatient intervention targeting improvements in communication was associated with a reduction in LOS without an increase in 30‐day readmission. Our experience shows promise and may inform others considering similar interventions. Patient and provider experience and generalizability should be evaluated in future work.
Acknowledgements
The authors thank Dr. Allan Detsky and David Wells for their review of the manuscript. They are also grateful to Chin‐Chin Chua, Ningmei Wang, and Joann Bon in the Office of Quality and Performance Measurement for their help with data collection, and John Matelski for his help with data analysis.
Disclosure: This program was funded by matched donations from physicians in the Mount Sinai Hospital Department of Medicine and donations to Mount Sinai Hospital from community members directed to support the implementation and evaluation of novel care delivery systems. The authors report no conflicts of interest. Preliminary abstracts of this study were presented in the online forum, Leading Health Care Innovation, November 12, 2013 (
- , , , et al. Multiple chronic conditions: prevalence, health consequences, and implications for quality, care management, and costs. J Gen Intern Med. 2007;22(S3):391–395.
- , , , , . The incidence and severity of adverse events affecting patients after discharge from the hospital. Ann Intern Med. 2003;138(3):161–167.
- , , . Rehospitalizations among patients in the Medicare fee‐for‐service program. N Engl J Med. 2009;360(14):1418–1428.
- , , , et al. Prospective payment system and impairment at discharge. The “quicker‐and‐sicker” story revisited. JAMA. 1990;264(15):1980–1983.
- . The human factor: the critical importance of effective teamwork and communication in providing safe care. Qual Saf Health Care. 2004;13(suppl 1):i85–i90.
- The Joint Commission. Sentinel event data root: causes by event type (2004–June 2014). Available at: http://www.jointcommission.org/assets/1/18/Root_Causes_by_Event_Type_2004‐2014.pdf. Accessed March 12, 2014.
- , . Complexity science: the challenge of complexity in health care. BMJ. 2001;323(7313):625–628.
- Canadian Institute for Health Information. Case mix. Available at: http://www.cihi.ca/CIHI‐ext‐portal/internet/EN/TabbedContent/standards+and+data+submission/standards/case+mix/cihi010690. Accessed April 12, 2015.
- , , , , , . Outcomes and cost of coronary artery bypass graft surgery in the United States and Canada. Arch Intern Med. 2005;165(13):1506–1513.
- , , , et al. Differences in treatment, outcomes, and quality of life among patients with heart failure in Canada and the United States. JACC Heart Fail. 2013;1(6):523–530.
- , , . Expanding access to cancer screening and clinical follow‐up among the medically underserved. Cancer Pract. 1995;3(1):19–30.
- , , , et al. Clearing clinical barriers: enhancing social support using a patient navigator for asthma care. J Asthma. 2010;47(8):913–919.
- . The role of a patient navigator in fertility preservation. In: Cancer Treatment and Research. Vol 156. Boston, MA: Springer US; 2010:469–470.
- , , , . The care transitions intervention: results of a randomized controlled trial. Arch Intern Med. 2006;166(17):1822–1828.
- , , , et al. A reengineered hospital discharge program to decrease rehospitalization: a randomized trial. Ann Intern Med. 2009;150(3):178–187.
- , , , , , . A patient navigator intervention to reduce hospital readmissions among high‐risk safety‐net patients: a randomized controlled trial. J Gen Intern Med. 2015;30(7):907–915.
- , , . Lack of patient knowledge regarding hospital medications. J Hosp Med. 2010;5(2):83–86.
- , . Patients' understanding of their treatment plans and diagnosis at discharge. Mayo Clin Proc. 2005;80(8):991–994.
- , , , , . Effect of Hospitalist Workload on the Quality and Efficiency of Care. JAMA Intern Med. 2014;174(5):786.
- , , , et al. Unplanned readmissions after hospital discharge among patients identified as being at high risk for readmission using a validated predictive algorithm. Open Med. 2011;5(2):e104–e111.
© 2015 Society of Hospital Medicine