User login
Glucose Management and Inpatient Mortality
Patients with diabetes currently comprise over 8% of the US population (over 25 million people) and more than 20% of hospitalized patients.[1, 2] Hospitalizations of patients with diabetes account for 23% of total hospital costs in the United States,[2] and patients with diabetes have worse outcomes after hospitalization for a variety of common medical conditions,[3, 4, 5, 6] as well as in intensive care unit (ICU) settings.[7, 8] Individuals with diabetes have historically experienced higher inpatient mortality than individuals without diabetes.[9] However, we recently reported that patients with diabetes at our large academic medical center have experienced a disproportionate reduction in in‐hospital mortality relative to patients without diabetes over the past decade.[10] This surprising trend begs further inquiry.
Improvement in in‐hospital mortality among patients with diabetes may stem from improved inpatient glycemic management. The landmark 2001 study by van den Berghe et al. demonstrating that intensive insulin therapy reduced postsurgical mortality among ICU patients ushered in an era of intensive inpatient glucose control.[11] However, follow‐up multicenter studies have not been able to replicate these results.[12, 13, 14, 15] In non‐ICU and nonsurgical settings, intensive glucose control has not yet been shown to have any mortality benefit, although it may impact other morbidities, such as postoperative infections.[16] Consequently, less stringent glycemic targets are now recommended.[17] Nonetheless, hospitals are being held accountable for certain aspects of inpatient glucose control. For example, the Centers for Medicare & Medicaid Services (CMS) began asking hospitals to report inpatient glucose control in cardiac surgery patients in 2004.[18] This measure is now publicly reported, and as of 2013 is included in the CMS Value‐Based Purchasing Program, which financially penalizes hospitals that do not meet targets.
Outpatient diabetes standards have also evolved in the past decade. The Diabetes Control and Complications Trial in 1993 and the United Kingdom Prospective Diabetes Study in 1997 demonstrated that better glycemic control in type 1 and newly diagnosed type 2 diabetes patients, respectively, improved clinical outcomes, and prompted guidelines for pharmacologic treatment of diabetic patients.[19, 20] However, subsequent randomized clinical trials have failed to establish a clear beneficial effect of intensive glucose control on primary cardiovascular endpoints among higher‐risk patients with longstanding type 2 diabetes,[21, 22, 23] and clinical practice recommendations now accept a more individualized approach to glycemic control.[24] Nonetheless, clinicians are also being held accountable for outpatient glucose control.[25]
To better understand the disproportionate reduction in mortality among hospitalized patients with diabetes that we observed, we first examined whether it was limited to surgical patients or patients in the ICU, the populations that have been demonstrated to benefit from intensive inpatient glucose control. Furthermore, given recent improvements in inpatient and outpatient glycemic control,[26, 27] we examined whether inpatient or outpatient glucose control explained the mortality trends. Results from this study contribute empirical evidence on real‐world effects of efforts to improve inpatient and outpatient glycemic control.
METHODS
Setting
During the study period, YaleNew Haven Hospital (YNHH) was an urban academic medical center in New Haven, Connecticut, with over 950 beds and an average of approximately 32,000 annual adult nonobstetric admissions. YNHH conducted a variety of inpatient glucose control initiatives during the study period. The surgical ICU began an informal medical teamdirected insulin infusion protocol in 2000 to 2001. In 2002, the medical ICU instituted a formal insulin infusion protocol with a target of 100 to 140 mg/dL, which spread to remaining hospital ICUs by the end of 2003. In 2005, YNHH launched a consultative inpatient diabetes management team to assist clinicians in controlling glucose in non‐ICU patients with diabetes. This team covered approximately 10 to 15 patients at a time and consisted of an advanced‐practice nurse practitioner, a supervising endocrinologist and endocrinology fellow, and a nurse educator to provide diabetic teaching. Additionally, in 2005, basal‐boluscorrection insulin order sets became available. The surgical ICU implemented a stringent insulin infusion protocol with target glucose of 80 to 110 mg/dL in 2006, but relaxed it (goal 80150 mg/dL) in 2007. Similarly, in 2006, YNHH made ICU insulin infusion recommendations more stringent in remaining ICUs (goal 90130 mg/dL), but relaxed them in 2010 (goal 120160 mg/dL), based on emerging data from clinical trials and prevailing national guidelines.
Participants and Data Sources
We included all adult, nonobstetric discharges from YNHH between January 1, 2000 and December 31, 2010. Repeat visits by the same patient were linked by medical record number. We obtained data from YNHH administrative billing, laboratory, and point‐of‐care capillary blood glucose databases. The Yale Human Investigation Committee approved our study design and granted a Health Insurance Portability and Accountability Act waiver and a waiver of patient consent.
Variables
Our primary endpoint was in‐hospital mortality. The primary exposure of interest was whether a patient had diabetes mellitus, defined as the presence of International Classification of Diseases, Ninth Revision codes 249.x, 250.x, V4585, V5391, or V6546 in any of the primary or secondary diagnosis codes in the index admission, or in any hospital encounter in the year prior to the index admission.
We assessed 2 effect‐modifying variables: ICU status (as measured by a charge for at least 1 night in the ICU) and service assignment to surgery (including neurosurgery and orthopedics), compared to medicine (including neurology). Independent explanatory variables included time between the start of the study and patient admission (measured as days/365), diabetes status, inpatient glucose control, and long‐term glucose control (as measured by hemoglobin A1c at any time in the 180 days prior to hospital admission in order to have adequate sample size). We assessed inpatient blood glucose control through point‐of‐care blood glucose meters (OneTouch SureStep; LifeScan, Inc., Milipitas, CA) at YNHH. We used 4 validated measures of inpatient glucose control: the proportion of days in each hospitalization in which there was any hypoglycemic episode (blood glucose value <70 mg/dL), the proportion of days in which there was any severely hyperglycemic episode (blood glucose value >299 mg/dL), the proportion of days in which mean blood glucose was considered to be within adequate control (all blood glucose values between 70 and 179 mg/dL), and the standard deviation of mean glucose during hospitalization as a measure of glycemic variability.[28]
Covariates included gender, age at time of admission, length of stay in days, race (defined by hospital registration), payer, Elixhauser comorbidity dummy variables (revised to exclude diabetes and to use only secondary diagnosis codes),[29] and primary discharge diagnosis grouped using Clinical Classifications Software,[30] based on established associations with in‐hospital mortality.
Statistical Analysis
We summarized demographic characteristics numerically and graphically for patients with and without diabetes and compared them using [2] and t tests. We summarized changes in inpatient and outpatient measures of glucose control over time numerically and graphically, and compared across years using the Wilcoxon rank sum test adjusted for multiple hypothesis testing.
We stratified all analyses first by ICU status and then by service assignment (medicine vs surgery). Statistical analyses within each stratum paralleled our previous approach to the full study cohort.[10] Taking each stratum separately (ie, only ICU patients or only medicine patients), we used a difference‐in‐differences approach comparing changes over time in in‐hospital mortality among patients with diabetes compared to those without diabetes. This approach enabled us to determine whether patients with diabetes had a different time trend in risk of in‐hospital mortality than those without diabetes. That is, for each stratum, we constructed multivariate logistic regression models including time in years, diabetes status, and the interaction between time and diabetes status as well as the aforementioned covariates. We calculated odds of death and confidence intervals for each additional year for patients with diabetes by exponentiating the sum of parameter estimates for time and the diabetes‐time interaction term. We evaluated all 2‐way interactions between year or diabetes status and the covariates in a multiple degree of freedom likelihood ratio test. We investigated nonlinearity of the relation between mortality and time by evaluating first and second‐order polynomials.
Because we found a significant decline in mortality risk for patients with versus without diabetes among ICU patients but not among non‐ICU patients, and because service assignment was not found to be an effect modifier, we then limited our sample to ICU patients with diabetes to better understand the role of inpatient and outpatient glucose control in accounting for observed mortality trends. First, we determined the relation between the measures of inpatient glucose control and changes in mortality over time using logistic regression. Then, we repeated this analysis in the subsets of patients who had inpatient glucose data and both inpatient and outpatient glycemic control data, adding inpatient and outpatient measures sequentially. Given the high level of missing outpatient glycemic control data, we compared demographic characteristics for diabetic ICU patients with and without such data using [2] and t tests, and found that patients with data were younger and less likely to be white and had longer mean length of stay, slightly worse performance on several measures of inpatient glucose control, and lower mortality (see Supporting Table 1 in the online version of this article).
| Characteristic | Overall, N=322,939 | Any ICU Stay, N=54,646 | No ICU Stay, N=268,293 | Medical Service, N=196,325 | Surgical Service, N=126,614 |
|---|---|---|---|---|---|
| |||||
| Died during admission, n (%) | 7,587 (2.3) | 5,439 (10.0) | 2,147 (0.8) | 5,705 (2.9) | 1,883 (1.5) |
| Diabetes, n (%) | 76,758 (23.8) | 14,364 (26.3) | 62,394 (23.2) | 55,453 (28.2) | 21,305 (16.8) |
| Age, y, mean (SD) | 55.5 (20.0) | 61.0 (17.0) | 54.4 (21.7) | 60.3 (18.9) | 48.0 (23.8) |
| Age, full range (interquartile range) | 0118 (4273) | 18112 (4975) | 0118 (4072) | 0118 (4776) | 0111 (3266) |
| Female, n (%) | 159,227 (49.3) | 23,208 (42.5) | 134,296 (50.1) | 99,805 (50.8) | 59,422 (46.9) |
| White race, n (%) | 226,586 (70.2) | 41,982 (76.8) | 184,604 (68.8) | 132,749 (67.6) | 93,838 (74.1) |
| Insurance, n (%) | |||||
| Medicaid | 54,590 (16.9) | 7,222 (13.2) | 47,378 (17.7) | 35,229 (17.9) | 19,361 (15.3) |
| Medicare | 141,638 (43.9) | 27,458 (50.2) | 114,180 (42.6) | 100,615 (51.2) | 41,023 (32.4) |
| Commercial | 113,013 (35.0) | 18,248 (33.4) | 94,765 (35.3) | 53,510 (27.2) | 59,503 (47.0) |
| Uninsured | 13,521 (4.2) | 1,688 (3.1) | 11,833 (4.4) | 6,878 (3.5) | 6,643 (5.2) |
| Length of stay, d, mean (SD) | 5.4 (9.5) | 11.8 (17.8) | 4.2 (6.2) | 5.46 (10.52) | 5.42 (9.75) |
| Service, n (%) | |||||
| Medicine | 184,495 (57.1) | 27,190 (49.8) | 157,305 (58.6) | 184,496 (94.0) | |
| Surgery | 126,614 (39.2) | 25,602 (46.9) | 101,012 (37.7) | 126,614 (100%) | |
| Neurology | 11,829 (3.7) | 1,853 (3.4) | 9,976 (3.7) | 11,829 (6.0) | |
To explore the effects of dependence among observations from patients with multiple encounters, we compared parameter estimates derived from a model with all patient encounters (including repeated admissions for the same patient) with those from a model with a randomly sampled single visit per patient, and observed that there was no difference in parameter estimates between the 2 classes of models. For all analyses, we used a type I error of 5% (2 sided) to test for statistical significance using SAS version 9.3 (SAS Institute, Cary, NC) or R software (
RESULTS
We included 322,938 patient admissions. Of this sample, 54,645 (16.9%) had spent at least 1 night in the ICU. Overall, 76,758 patients (23.8%) had diabetes, representing 26.3% of ICU patients, 23.2% of non‐ICU patients, 28.2% of medical patients, and 16.8% of surgical patients (see Table 1 for demographic characteristics).
Mortality Trends Within Strata
Among ICU patients, the overall mortality rate was 9.9%: 10.5% of patients with diabetes and 9.8% of patients without diabetes. Among non‐ICU patients, the overall mortality rate was 0.8%: 0.9% of patients with diabetes and 0.7% of patients without diabetes.
Among medical patients, the overall mortality rate was 2.9%: 3.1% of patients with diabetes and 2.8% of patients without diabetes. Among surgical patients, the overall mortality rate was 1.4%: 1.8% of patients with diabetes and 1.4% of patients without diabetes. Figure 1 shows quarterly in‐hospital mortality for patients with and without diabetes from 2000 to 2010 stratified by ICU status and by service assignment.

Table 2 describes the difference‐in‐differences regression analyses, stratified by ICU status and service assignment. Among ICU patients (Table 2, model 1), each successive year was associated with a 2.6% relative reduction in the adjusted odds of mortality (odds ratio [OR]: 0.974, 95% confidence interval [CI]: 0.963‐0.985) for patients without diabetes compared to a 7.8% relative reduction for those with diabetes (OR: 0.923, 95% CI: 0.906‐0.940). In other words, patients with diabetes compared to patients without diabetes had a significantly greater decline in odds of adjusted mortality of 5.3% per year (OR: 0.947, 95% CI: 0.927‐0.967). As a result, the adjusted odds of mortality among patients with versus without diabetes decreased from 1.352 in 2000 to 0.772 in 2010.
| Independent Variables | ICU Patients, N=54,646, OR (95% CI) | Non‐ICU Patients, N=268,293, OR (95% CI) | Medical Patients, N=196,325, OR (95% CI) | Surgical Patients, N=126,614, OR (95% CI) |
|---|---|---|---|---|
| Model 1 | Model 2 | Model 3 | Model 4 | |
| ||||
| Year | 0.974 (0.963‐0.985) | 0.925 (0.909‐0.940) | 0.943 (0.933‐0.954) | 0.995 (0.977‐1.103) |
| Diabetes | 1.352 (1.562‐1.171) | 0.958 (0.783‐1.173) | 1.186 (1.037‐1.356) | 1.213 (0.942‐1.563) |
| Diabetes*year | 0.947 (0.927‐0.967) | 0.977 (0.946‐1.008) | 0.961 (0.942‐0.980) | 0.955 (0.918‐0.994) |
| C statistic | 0.812 | 0.907 | 0.880 | 0.919 |
Among non‐ICU patients (Table 2, model 2), each successive year was associated with a 7.5% relative reduction in the adjusted odds of mortality (OR: 0.925, 95% CI: 0.909‐0.940) for patients without diabetes compared to a 9.6% relative reduction for those with diabetes (OR: 0.904, 95% CI: 0.879‐0.929); this greater decline in odds of adjusted mortality of 2.3% per year (OR: 0.977, 95% CI: 0.946‐1.008; P=0.148) was not statistically significant.
We found greater decline in odds of mortality among patients with diabetes than among patients without diabetes over time in both medical patients (3.9% greater decline per year; OR: 0.961, 95% CI: 0.942‐0.980) and surgical patients (4.5% greater decline per year; OR: 0.955, 95% CI: 0.918‐0.994), without a difference between the 2. Detailed results are shown in Table 2, models 3 and 4.
Glycemic Control
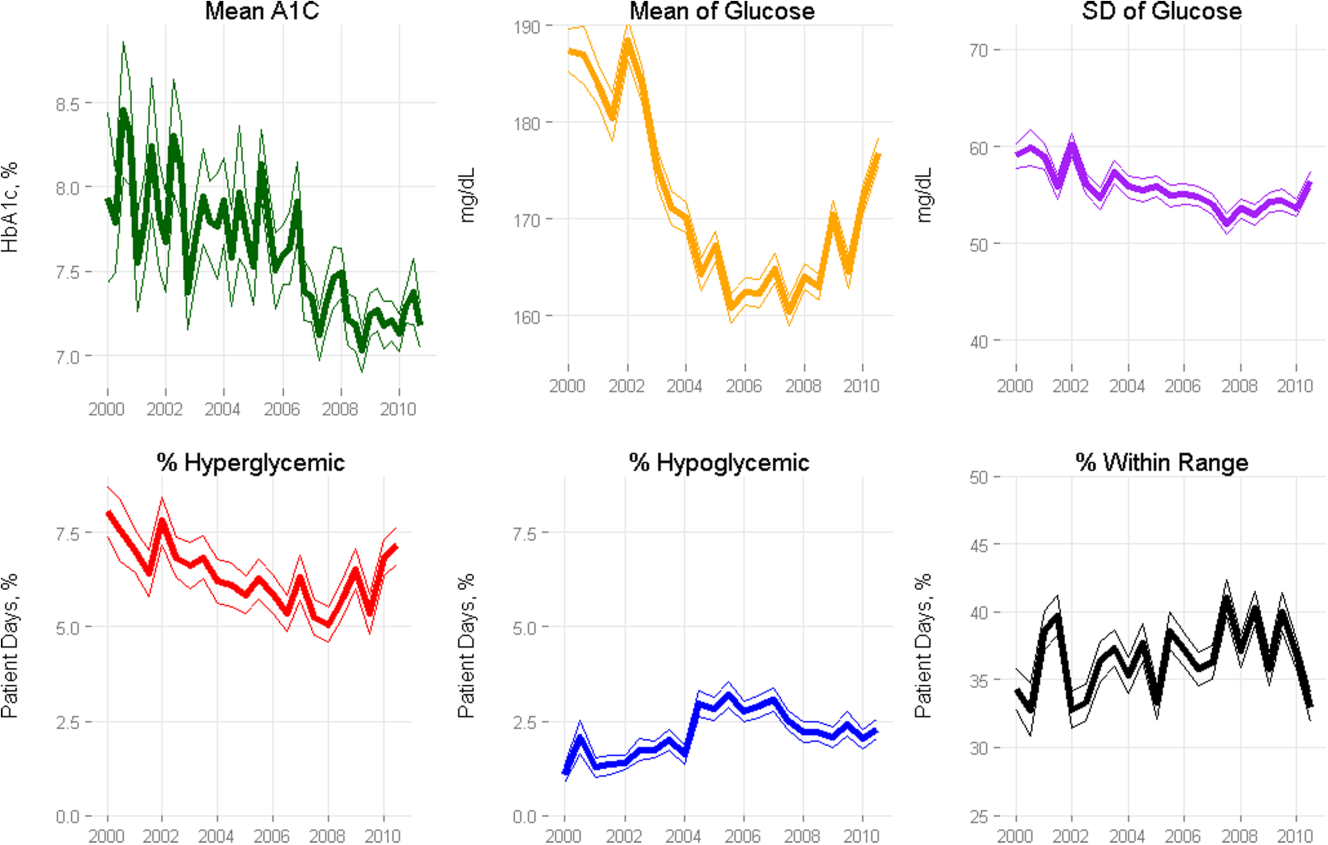
Among ICU patients with diabetes (N=14,364), at least 2 inpatient point‐of‐care glucose readings were available for 13,136 (91.5%), with a mean of 4.67 readings per day, whereas hemoglobin A1c data were available for only 5321 patients (37.0%). Both inpatient glucose data and hemoglobin A1c were available for 4989 patients (34.7%). Figure 2 shows trends in inpatient and outpatient glycemic control measures among ICU patients with diabetes over the study period. Mean hemoglobin A1c decreased from 7.7 in 2000 to 7.3 in 2010. Mean hospitalization glucose began at 187.2, reached a nadir of 162.4 in the third quarter (Q3) of 2007, and rose subsequently to 174.4 with loosened glucose control targets. Standard deviation of mean glucose and percentage of patient‐days with a severe hyperglycemic episode followed a similar pattern, though with nadirs in Q4 2007 and Q2 2008, respectively, whereas percentage of patient‐days with a hypoglycemic episode rose from 1.46% in 2000, peaked at 3.00% in Q3 2005, and returned to 2.15% in 2010. All changes in glucose control are significant with P<0.001.
Mortality Trends and Glycemic Control
To determine whether glucose control explained the excess decline in odds of mortality among patients with diabetes in the ICU, we restricted our sample to ICU patients with diabetes and examined the association of diabetes with mortality after including measures of glucose control.
We first verified that the overall adjusted mortality trend among ICU patients with diabetes for whom we had measures of inpatient glucose control was similar to that of the full sample of ICU patients with diabetes. Similar to the full sample, we found that the adjusted excess odds of death significantly declined by a relative 7.3% each successive year (OR: 0.927, 95% CI: 0.907‐0.947; Table 3, model 1). We then included measures of inpatient glucose control in the model and found, as expected, that a higher percentage of days with severe hyperglycemia and with hypoglycemia was associated with an increased odds of death (P<0.001 for both; Table 3, model 2). Nonetheless, after including measures of inpatient glucose control, we found that the rate of change of excess odds of death for patients with diabetes was unchanged (OR: 0.926, 95% CI: 0.905‐0.947).
| Patients With Inpatient Glucose Control Measures, n=13,136 | Patients With Inpatient and Outpatient Glucose Control Measures, n=4,989 | ||||
|---|---|---|---|---|---|
| Independent Variables | Model 1, OR (95% CI) | Model 2, OR (95% CI) | Model 3, OR (95% CI) | Model 4, OR (95% CI) | Model 5, OR (95% CI) |
| |||||
| Year | 0.927 (0.907‐0.947) | 0.926 (0.905‐0.947) | 0.958 (0.919‐0.998) | 0.956 (0.916‐0.997) | 0.953 (0.914‐0.994) |
| % Severe hyperglycemic days | 1.016 (1.010‐1.021) | 1.009 (0.998‐1.020) | 1.010 (0.999‐1.021) | ||
| % Hypoglycemic days | 1.047 (1.040‐1.055) | 1.051 (1.037‐1.065) | 1.049 (1.036‐1.063) | ||
| % Normoglycemic days | 0.997 (0.994‐1.000) | 0.994 (0.989‐0.999) | 0.993 (0.988‐0.998) | ||
| SD of mean glucose | 0.996 (0.992‐1.000) | 0.993 (0.986‐1.000) | 0.994 (0.987‐1.002) | ||
| Mean HbA1c | 0.892 (0.828‐0.961) | ||||
| C statistic | 0.806 | 0.825 | 0.825 | 0.838 | 0.841 |
We then restricted our sample to patients with diabetes with both inpatient and outpatient glycemic control data and found that, in this subpopulation, the adjusted excess odds of death among patients with diabetes relative to those without significantly declined by a relative 4.2% each progressive year (OR: 0.958, 95% CI: 0.918‐0.998; Table 3, model 3). Including measures of inpatient glucose control in the model did not significantly change the rate of change of excess odds of death (OR: 0.956, 95% CI: 0.916‐0.997; Table 3, model 4), nor did including both measures of inpatient and outpatient glycemic control (OR: 0.953, 95% CI: 0.914‐0.994; Table 3, model 5).
DISCUSSION
We conducted a difference‐in‐difference analysis of in‐hospital mortality rates among adult patients with diabetes compared to patients without diabetes over 10 years, stratifying by ICU status and service assignment. For patients with any ICU stay, we found that the reduction in odds of mortality for patients with diabetes has been 3 times larger than the reduction in odds of mortality for patients without diabetes. For those without an ICU stay, we found no significant difference between patients with and without diabetes in the rate at which in‐hospital mortality declined. We did not find stratification by assignment to a medical or surgical service to be an effect modifier. Finally, despite the fact that our institution achieved better aggregate inpatient glucose control, less severe hyperglycemia, and better long‐term glucose control over the course of the decade, we did not find that either inpatient or outpatient glucose control explained the trend in mortality for patients with diabetes in the ICU. Our study is unique in its inclusion of all hospitalized patients and its ability to simultaneously assess whether both inpatient and outpatient glucose control are explanatory factors in the observed mortality trends.
The fact that improved inpatient glucose control did not explain the trend in mortality for patients with diabetes in the ICU is consistent with the majority of the literature on intensive inpatient glucose control. In randomized trials, intensive glucose control appears to be of greater benefit for patients without diabetes than for patients with diabetes.[31] In fact, in 1 study, patients with diabetes were the only group that did not benefit from intensive glucose control.[32] In our study, it is possible that the rise in hypoglycemia nullified some of the benefits of glucose control. Nationally, hospital admissions for hypoglycemia among Medicare beneficiaries now outnumber admissions for hyperglycemia.[27]
We also do not find that the decline in hemoglobin A1c attenuated the reduction in mortality in the minority of patients for whom these data were available. This is concordant with evidence from 3 randomized clinical trials that have failed to establish a clear beneficial effect of intensive outpatient glucose control on primary cardiovascular endpoints among older, high‐risk patients with type 2 diabetes using glucose‐lowering agents.[21, 22, 23] It is notable, however, that the population for whom we had available hemoglobin A1c results was not representative of the overall population of ICU patients with diabetes. Consequently, there may be an association of outpatient glucose control with inpatient mortality in the overall population of ICU patients with diabetes that we were not able to detect.
The decline in mortality among ICU patients with diabetes in our study may stem from factors other than glycemic control. It is possible that patients were diagnosed earlier in their course of disease in later years of the study period, making the population of patients with diabetes younger or healthier. Of note, however, our risk adjustment models were very robust, with C statistics from 0.82 to 0.92, suggesting that we were able to account for much of the mortality risk attributable to patient clinical and demographic factors. More intensive glucose management may have nonglycemic benefits, such as closer patient observation, which may themselves affect mortality. Alternatively, improved cardiovascular management for patients with diabetes may have decreased the incidence of cardiovascular events. During the study period, evidence from large clinical trials demonstrated the importance of tight blood pressure and lipid management in improving outcomes for patients with diabetes,[33, 34, 35, 36] guidelines for lipid management for patients with diabetes changed,[37] and fewer patients developed cardiovascular complications.[38] Finally, it is possible that our findings can be explained by an improvement in treatment of complications for which patients with diabetes previously have had disproportionately worse outcomes, such as percutaneous coronary intervention.[39]
Our findings may have important implications for both clinicians and policymakers. Changes in inpatient glucose management have required substantial additional resources on the part of hospitals. Our evidence regarding the questionable impact of inpatient glucose control on in‐hospital mortality trends for patients with diabetes is disappointing and highlights the need for multifaceted evaluation of the impact of such quality initiatives. There may, for instance, be benefits from tighter blood glucose control in the hospital beyond mortality, such as reduced infections, costs, or length of stay. On the outpatient side, our more limited data are consistent with recent studies that have not been able to show a mortality benefit in older diabetic patients from more stringent glycemic control. A reassessment of prevailing diabetes‐related quality measures, as recently called for by some,[40, 41] seems reasonable.
Our study must be interpreted in light of its limitations. It is possible that the improvements in glucose management were too small to result in a mortality benefit. The overall reduction of 25 mg dL achieved at our institution is less than the 33 to 50 mg/dL difference between intensive and conventional groups in those randomized clinical trials that have found reductions in mortality.[11, 42] In addition, an increase in mean glucose during the last 1 to 2 years of the observation period (in response to prevailing guidelines) could potentially have attenuated any benefit on mortality. The study does not include other important clinical endpoints, such as infections, complications, length of stay, and hospital costs. Additionally, we did not examine postdischarge mortality, which might have shown a different pattern. The small proportion of patients with hemoglobin A1c results may have hampered our ability to detect an effect of outpatient glucose control. Consequently, our findings regarding outpatient glucose control are only suggestive. Finally, our findings represent the experience of a single, large academic medical center and may not be generalizable to all settings.
Overall, we found that patients with diabetes in the ICU have experienced a disproportionate reduction in in‐hospital mortality over time that does not appear to be explained by improvements in either inpatient or outpatient glucose control. Although improved glycemic control may have other benefits, it does not appear to impact in‐hospital mortality. Our real‐world empirical results contribute to the discourse among clinicians and policymakers with regards to refocusing the approach to managing glucose in‐hospital and readjudication of diabetes‐related quality measures.
Acknowledgments
The authors would like to acknowledge the YaleNew Haven Hospital diabetes management team: Gael Ulisse, APRN, Helen Psarakis, APRN, Anne Kaisen, APRN, and the Yale Endocrine Fellows.
Disclosures: Design and conduct of the study: N. B., J. D., S. I., T. B., L. H. Collection, management, analysis, and interpretation of the data: N. B., B. J., J. D., J. R., J. B., S. I., L. H. Preparation, review, or approval of the manuscript: N. B., B. J., J. D., J. R., S. I., T. B., L. H. Leora Horwitz, MD, had full access to all the data in the study and takes responsibility for the integrity of the data and the accuracy of the data analysis. Dr. Horwitz is supported by the National Institute on Aging (K08 AG038336) and by the American Federation for Aging Research through the Paul B. Beeson Career Development Award Program. This publication was also made possible by CTSA grant number UL1 RR024139 from the National Center for Research Resources and the National Center for Advancing Translational Science, components of the National Institutes of Health (NIH), and NIH roadmap for Medical Research. Its contents are solely the responsibility of the authors and do not necessarily represent the official view of the NIH. No funding source had any role in design and conduct of the study; collection, management, analysis, and interpretation of the data; preparation, review, or approval of the manuscript; or decision to submit the manuscript for publication. Silvio E. Inzucchi, MD, serves on a Data Safety Monitoring Board for Novo Nordisk, a manufacturer of insulin products used in the hospital setting. The remaining authors declare no conflicts of interest.
- National Diabetes Information Clearinghouse. National Diabetes Statistics; 2011. Available at: http://diabetes.niddk.nih.gov/dm/pubs/america/index.aspx. Accessed November 12, 2013.
- Healthcare Cost and Utilization Project. Statistical brief #93; 2010. Available at: http://www.hcup‐us.ahrq.gov/reports/statbriefs/sb93.pdf. Accessed November 12, 2013.
- , , , et al. Association between diabetes mellitus and post‐discharge outcomes in patients hospitalized with heart failure: findings from the EVEREST trial. Eur J Heart Fail. 2013;15(2):194–202.
- , , , et al. Influence of diabetes mellitus on clinical outcome in the thrombolytic era of acute myocardial infarction. GUSTO‐I Investigators. Global Utilization of Streptokinase and Tissue Plasminogen Activator for Occluded Coronary Arteries. J Am Coll Cardiol. 1997;30(1):171–179.
- , , , , , . Type 2 diabetes and pneumonia outcomes: a population‐based cohort study. Diabetes Care. 2007;30(9):2251–2257.
- , , , . Prevalence and outcomes of diabetes, hypertension and cardiovascular disease in COPD. Eur Respir J. 2008;32(4):962–969.
- , , , , . The role of body mass index and diabetes in the development of acute organ failure and subsequent mortality in an observational cohort. Crit Care. 2006;10(5):R137.
- , , , , , . Type 2 diabetes and 1‐year mortality in intensive care unit patients. Eur J Clin Invest. 2013;43(3):238–247.
- , , . Excess mortality during hospital stays among patients with recorded diabetes compared with those without diabetes. Diabet Med. 2013;30(12):1393–1402.
- , , , et al. Decade‐long trends in mortality among patients with and without diabetes mellitus at a major academic medical center. JAMA Intern Med. 2014;174(7):1187–1188.
- , , , et al. Intensive insulin therapy in critically ill patients. N Engl J Med. 2001;345(19):1359–1367.
- , , , et al. Intensive versus conventional glucose control in critically ill patients. N Engl J Med. 2009;360(13):1283–1297.
- , , , et al. A prospective randomised multi‐centre controlled trial on tight glucose control by intensive insulin therapy in adult intensive care units: the Glucontrol study. Intensive Care Med. 2009;35(10):1738–1748.
- , , , et al. Intensive versus conventional insulin therapy: a randomized controlled trial in medical and surgical critically ill patients. Crit Care Med. 2008;36(12):3190–3197.
- , , , et al. Intensive insulin therapy in the medical ICU. N Engl J Med. 2006;354(5):449–461.
- , , , et al. Glycemic control in non‐critically ill hospitalized patients: a systematic review and meta‐analysis. J Clin Endocrinol Metab. 2012;97(1):49–58.
- , , , et al. American Association of Clinical Endocrinologists and American Diabetes Association consensus statement on inpatient glycemic control. Diabetes Care. 2009;32(6):1119–1131.
- Agency for Healthcare Research and Quality National Quality Measures Clearinghouse. Percent of cardiac surgery patients with controlled 6 A.M. postoperative blood glucose; 2012. Available at: http://www.qualitymeasures.ahrq.gov/content.aspx?id=35532. Accessed November 12, 2013.
- The effect of intensive treatment of diabetes on the development and progression of long‐term complications in insulin‐dependent diabetes mellitus. The Diabetes Control and Complications Trial Research Group. N Engl J Med. 1993;329(14):977–986.
- , , , et al. Intensive blood‐glucose control with sulphonylureas or insulin compared with conventional treatment and risk of complications in patients with type 2 diabetes (UKPDS 33). Lancet. 1998;352(9131):837–853.
- Effects of intensive glucose lowering in type 2 diabetes. N Engl J Med. 2008;358(24):2545–2559.
- , , , et al. Glucose control and vascular complications in veterans with type 2 diabetes. N Engl J Med. 2009;360(2):129–139.
- , , , et al. Intensive blood glucose control and vascular outcomes in patients with type 2 diabetes. N Engl J Med. 2008;358(24):2560–2572.
- . Standards of medical care in diabetes—2014. Diabetes Care. 2014;37(suppl 1):S14–S80.
- National Committee for Quality Assurance. HEDIS 2013. Available at: http://www.ncqa.org/HEDISQualityMeasurement.aspx. Accessed November 12, 2013.
- , , , . Is glycemic control improving in US adults? Diabetes Care. 2008;31(1):81–86.
- , , , et al. National trends in US hospital admissions for hyperglycemia and hypoglycemia among medicare beneficiaries, 1999 to 2011. JAMA Intern Med. 2014;174(7):1116–1124.
- , , , et al. "Glucometrics"—assessing the quality of inpatient glucose management. Diabetes Technol Ther. 2006;8(5):560–569.
- , , , , . A modification of the Elixhauser comorbidity measures into a point system for hospital death using administrative data. Med Care. 2009;47(6):626–633.
- Healthcare Cost and Utilization Project. Clinical Classifications Software (CCS) for ICD‐9‐CM; 2013. Available at: http://www.hcup‐us.ahrq.gov/toolssoftware/ccs/ccs.jsp. Accessed November 12, 2013.
- , , , , . The impact of premorbid diabetic status on the relationship between the three domains of glycemic control and mortality in critically ill patients. Curr Opin Clin Nutr Metab Care. 2012;15(2):151–160.
- , , , et al. Intensive insulin therapy in mixed medical/surgical intensive care units: benefit versus harm. Diabetes. 2006;55(11):3151–3159.
- Tight blood pressure control and risk of macrovascular and microvascular complications in type 2 diabetes: UKPDS 38. UK Prospective Diabetes Study Group. BMJ. 1998;317(7160):703–713.
- , , , et al. Effects of a fixed combination of perindopril and indapamide on macrovascular and microvascular outcomes in patients with type 2 diabetes mellitus (the ADVANCE trial): a randomised controlled trial. Lancet. 2007;370(9590):829–840.
- , , , , . MRC/BHF heart protection study of cholesterol‐lowering with simvastatin in 5963 people with diabetes: a randomised placebo‐controlled trial. Lancet. 2003;361(9374):2005–2016.
- , , , et al. Primary prevention of cardiovascular disease with atorvastatin in type 2 diabetes in the Collaborative Atorvastatin Diabetes Study (CARDS): multicentre randomised placebo‐controlled trial. Lancet. 2004;364(9435):685–696.
- , , , . Expert panel on detection, evaluation and treatment of high blood cholesterol in adults. Executive summary of the third report of the national cholesterol education program (NCEP) adult treatment panel (atp III). JAMA. 2001;285(19):2486–2497.
- , , , et al. Changes in diabetes‐related complications in the United States, 1990–2010. N Engl J Med. 2014;370(16):1514–1523.
- , , . Coronary heart disease in patients with diabetes: part II: recent advances in coronary revascularization. J Am Coll Cardiol. 2007;49(6):643–656.
- , , , et al. Management of hyperglycemia in type 2 diabetes: a patient‐centered approach position statement of the American Diabetes Association (ADA) and the European Association for the Study of Diabetes (EASD). Diabetes Care. 2012;35(6):1364–1379.
- , , , , . Assessing potential glycemic overtreatment in persons at hypoglycemic risk. JAMA Intern Med. 2013;174(2):259–268.
- , , , . Glycometabolic state at admission: important risk marker of mortality in conventionally treated patients with diabetes mellitus and acute myocardial infarction: long‐term results from the Diabetes and Insulin‐Glucose Infusion in Acute Myocardial Infarction (DIGAMI) study. Circulation. 1999;99(20):2626–2632.
Patients with diabetes currently comprise over 8% of the US population (over 25 million people) and more than 20% of hospitalized patients.[1, 2] Hospitalizations of patients with diabetes account for 23% of total hospital costs in the United States,[2] and patients with diabetes have worse outcomes after hospitalization for a variety of common medical conditions,[3, 4, 5, 6] as well as in intensive care unit (ICU) settings.[7, 8] Individuals with diabetes have historically experienced higher inpatient mortality than individuals without diabetes.[9] However, we recently reported that patients with diabetes at our large academic medical center have experienced a disproportionate reduction in in‐hospital mortality relative to patients without diabetes over the past decade.[10] This surprising trend begs further inquiry.
Improvement in in‐hospital mortality among patients with diabetes may stem from improved inpatient glycemic management. The landmark 2001 study by van den Berghe et al. demonstrating that intensive insulin therapy reduced postsurgical mortality among ICU patients ushered in an era of intensive inpatient glucose control.[11] However, follow‐up multicenter studies have not been able to replicate these results.[12, 13, 14, 15] In non‐ICU and nonsurgical settings, intensive glucose control has not yet been shown to have any mortality benefit, although it may impact other morbidities, such as postoperative infections.[16] Consequently, less stringent glycemic targets are now recommended.[17] Nonetheless, hospitals are being held accountable for certain aspects of inpatient glucose control. For example, the Centers for Medicare & Medicaid Services (CMS) began asking hospitals to report inpatient glucose control in cardiac surgery patients in 2004.[18] This measure is now publicly reported, and as of 2013 is included in the CMS Value‐Based Purchasing Program, which financially penalizes hospitals that do not meet targets.
Outpatient diabetes standards have also evolved in the past decade. The Diabetes Control and Complications Trial in 1993 and the United Kingdom Prospective Diabetes Study in 1997 demonstrated that better glycemic control in type 1 and newly diagnosed type 2 diabetes patients, respectively, improved clinical outcomes, and prompted guidelines for pharmacologic treatment of diabetic patients.[19, 20] However, subsequent randomized clinical trials have failed to establish a clear beneficial effect of intensive glucose control on primary cardiovascular endpoints among higher‐risk patients with longstanding type 2 diabetes,[21, 22, 23] and clinical practice recommendations now accept a more individualized approach to glycemic control.[24] Nonetheless, clinicians are also being held accountable for outpatient glucose control.[25]
To better understand the disproportionate reduction in mortality among hospitalized patients with diabetes that we observed, we first examined whether it was limited to surgical patients or patients in the ICU, the populations that have been demonstrated to benefit from intensive inpatient glucose control. Furthermore, given recent improvements in inpatient and outpatient glycemic control,[26, 27] we examined whether inpatient or outpatient glucose control explained the mortality trends. Results from this study contribute empirical evidence on real‐world effects of efforts to improve inpatient and outpatient glycemic control.
METHODS
Setting
During the study period, YaleNew Haven Hospital (YNHH) was an urban academic medical center in New Haven, Connecticut, with over 950 beds and an average of approximately 32,000 annual adult nonobstetric admissions. YNHH conducted a variety of inpatient glucose control initiatives during the study period. The surgical ICU began an informal medical teamdirected insulin infusion protocol in 2000 to 2001. In 2002, the medical ICU instituted a formal insulin infusion protocol with a target of 100 to 140 mg/dL, which spread to remaining hospital ICUs by the end of 2003. In 2005, YNHH launched a consultative inpatient diabetes management team to assist clinicians in controlling glucose in non‐ICU patients with diabetes. This team covered approximately 10 to 15 patients at a time and consisted of an advanced‐practice nurse practitioner, a supervising endocrinologist and endocrinology fellow, and a nurse educator to provide diabetic teaching. Additionally, in 2005, basal‐boluscorrection insulin order sets became available. The surgical ICU implemented a stringent insulin infusion protocol with target glucose of 80 to 110 mg/dL in 2006, but relaxed it (goal 80150 mg/dL) in 2007. Similarly, in 2006, YNHH made ICU insulin infusion recommendations more stringent in remaining ICUs (goal 90130 mg/dL), but relaxed them in 2010 (goal 120160 mg/dL), based on emerging data from clinical trials and prevailing national guidelines.
Participants and Data Sources
We included all adult, nonobstetric discharges from YNHH between January 1, 2000 and December 31, 2010. Repeat visits by the same patient were linked by medical record number. We obtained data from YNHH administrative billing, laboratory, and point‐of‐care capillary blood glucose databases. The Yale Human Investigation Committee approved our study design and granted a Health Insurance Portability and Accountability Act waiver and a waiver of patient consent.
Variables
Our primary endpoint was in‐hospital mortality. The primary exposure of interest was whether a patient had diabetes mellitus, defined as the presence of International Classification of Diseases, Ninth Revision codes 249.x, 250.x, V4585, V5391, or V6546 in any of the primary or secondary diagnosis codes in the index admission, or in any hospital encounter in the year prior to the index admission.
We assessed 2 effect‐modifying variables: ICU status (as measured by a charge for at least 1 night in the ICU) and service assignment to surgery (including neurosurgery and orthopedics), compared to medicine (including neurology). Independent explanatory variables included time between the start of the study and patient admission (measured as days/365), diabetes status, inpatient glucose control, and long‐term glucose control (as measured by hemoglobin A1c at any time in the 180 days prior to hospital admission in order to have adequate sample size). We assessed inpatient blood glucose control through point‐of‐care blood glucose meters (OneTouch SureStep; LifeScan, Inc., Milipitas, CA) at YNHH. We used 4 validated measures of inpatient glucose control: the proportion of days in each hospitalization in which there was any hypoglycemic episode (blood glucose value <70 mg/dL), the proportion of days in which there was any severely hyperglycemic episode (blood glucose value >299 mg/dL), the proportion of days in which mean blood glucose was considered to be within adequate control (all blood glucose values between 70 and 179 mg/dL), and the standard deviation of mean glucose during hospitalization as a measure of glycemic variability.[28]
Covariates included gender, age at time of admission, length of stay in days, race (defined by hospital registration), payer, Elixhauser comorbidity dummy variables (revised to exclude diabetes and to use only secondary diagnosis codes),[29] and primary discharge diagnosis grouped using Clinical Classifications Software,[30] based on established associations with in‐hospital mortality.
Statistical Analysis
We summarized demographic characteristics numerically and graphically for patients with and without diabetes and compared them using [2] and t tests. We summarized changes in inpatient and outpatient measures of glucose control over time numerically and graphically, and compared across years using the Wilcoxon rank sum test adjusted for multiple hypothesis testing.
We stratified all analyses first by ICU status and then by service assignment (medicine vs surgery). Statistical analyses within each stratum paralleled our previous approach to the full study cohort.[10] Taking each stratum separately (ie, only ICU patients or only medicine patients), we used a difference‐in‐differences approach comparing changes over time in in‐hospital mortality among patients with diabetes compared to those without diabetes. This approach enabled us to determine whether patients with diabetes had a different time trend in risk of in‐hospital mortality than those without diabetes. That is, for each stratum, we constructed multivariate logistic regression models including time in years, diabetes status, and the interaction between time and diabetes status as well as the aforementioned covariates. We calculated odds of death and confidence intervals for each additional year for patients with diabetes by exponentiating the sum of parameter estimates for time and the diabetes‐time interaction term. We evaluated all 2‐way interactions between year or diabetes status and the covariates in a multiple degree of freedom likelihood ratio test. We investigated nonlinearity of the relation between mortality and time by evaluating first and second‐order polynomials.
Because we found a significant decline in mortality risk for patients with versus without diabetes among ICU patients but not among non‐ICU patients, and because service assignment was not found to be an effect modifier, we then limited our sample to ICU patients with diabetes to better understand the role of inpatient and outpatient glucose control in accounting for observed mortality trends. First, we determined the relation between the measures of inpatient glucose control and changes in mortality over time using logistic regression. Then, we repeated this analysis in the subsets of patients who had inpatient glucose data and both inpatient and outpatient glycemic control data, adding inpatient and outpatient measures sequentially. Given the high level of missing outpatient glycemic control data, we compared demographic characteristics for diabetic ICU patients with and without such data using [2] and t tests, and found that patients with data were younger and less likely to be white and had longer mean length of stay, slightly worse performance on several measures of inpatient glucose control, and lower mortality (see Supporting Table 1 in the online version of this article).
| Characteristic | Overall, N=322,939 | Any ICU Stay, N=54,646 | No ICU Stay, N=268,293 | Medical Service, N=196,325 | Surgical Service, N=126,614 |
|---|---|---|---|---|---|
| |||||
| Died during admission, n (%) | 7,587 (2.3) | 5,439 (10.0) | 2,147 (0.8) | 5,705 (2.9) | 1,883 (1.5) |
| Diabetes, n (%) | 76,758 (23.8) | 14,364 (26.3) | 62,394 (23.2) | 55,453 (28.2) | 21,305 (16.8) |
| Age, y, mean (SD) | 55.5 (20.0) | 61.0 (17.0) | 54.4 (21.7) | 60.3 (18.9) | 48.0 (23.8) |
| Age, full range (interquartile range) | 0118 (4273) | 18112 (4975) | 0118 (4072) | 0118 (4776) | 0111 (3266) |
| Female, n (%) | 159,227 (49.3) | 23,208 (42.5) | 134,296 (50.1) | 99,805 (50.8) | 59,422 (46.9) |
| White race, n (%) | 226,586 (70.2) | 41,982 (76.8) | 184,604 (68.8) | 132,749 (67.6) | 93,838 (74.1) |
| Insurance, n (%) | |||||
| Medicaid | 54,590 (16.9) | 7,222 (13.2) | 47,378 (17.7) | 35,229 (17.9) | 19,361 (15.3) |
| Medicare | 141,638 (43.9) | 27,458 (50.2) | 114,180 (42.6) | 100,615 (51.2) | 41,023 (32.4) |
| Commercial | 113,013 (35.0) | 18,248 (33.4) | 94,765 (35.3) | 53,510 (27.2) | 59,503 (47.0) |
| Uninsured | 13,521 (4.2) | 1,688 (3.1) | 11,833 (4.4) | 6,878 (3.5) | 6,643 (5.2) |
| Length of stay, d, mean (SD) | 5.4 (9.5) | 11.8 (17.8) | 4.2 (6.2) | 5.46 (10.52) | 5.42 (9.75) |
| Service, n (%) | |||||
| Medicine | 184,495 (57.1) | 27,190 (49.8) | 157,305 (58.6) | 184,496 (94.0) | |
| Surgery | 126,614 (39.2) | 25,602 (46.9) | 101,012 (37.7) | 126,614 (100%) | |
| Neurology | 11,829 (3.7) | 1,853 (3.4) | 9,976 (3.7) | 11,829 (6.0) | |
To explore the effects of dependence among observations from patients with multiple encounters, we compared parameter estimates derived from a model with all patient encounters (including repeated admissions for the same patient) with those from a model with a randomly sampled single visit per patient, and observed that there was no difference in parameter estimates between the 2 classes of models. For all analyses, we used a type I error of 5% (2 sided) to test for statistical significance using SAS version 9.3 (SAS Institute, Cary, NC) or R software (
RESULTS
We included 322,938 patient admissions. Of this sample, 54,645 (16.9%) had spent at least 1 night in the ICU. Overall, 76,758 patients (23.8%) had diabetes, representing 26.3% of ICU patients, 23.2% of non‐ICU patients, 28.2% of medical patients, and 16.8% of surgical patients (see Table 1 for demographic characteristics).
Mortality Trends Within Strata
Among ICU patients, the overall mortality rate was 9.9%: 10.5% of patients with diabetes and 9.8% of patients without diabetes. Among non‐ICU patients, the overall mortality rate was 0.8%: 0.9% of patients with diabetes and 0.7% of patients without diabetes.
Among medical patients, the overall mortality rate was 2.9%: 3.1% of patients with diabetes and 2.8% of patients without diabetes. Among surgical patients, the overall mortality rate was 1.4%: 1.8% of patients with diabetes and 1.4% of patients without diabetes. Figure 1 shows quarterly in‐hospital mortality for patients with and without diabetes from 2000 to 2010 stratified by ICU status and by service assignment.
Table 2 describes the difference‐in‐differences regression analyses, stratified by ICU status and service assignment. Among ICU patients (Table 2, model 1), each successive year was associated with a 2.6% relative reduction in the adjusted odds of mortality (odds ratio [OR]: 0.974, 95% confidence interval [CI]: 0.963‐0.985) for patients without diabetes compared to a 7.8% relative reduction for those with diabetes (OR: 0.923, 95% CI: 0.906‐0.940). In other words, patients with diabetes compared to patients without diabetes had a significantly greater decline in odds of adjusted mortality of 5.3% per year (OR: 0.947, 95% CI: 0.927‐0.967). As a result, the adjusted odds of mortality among patients with versus without diabetes decreased from 1.352 in 2000 to 0.772 in 2010.
| Independent Variables | ICU Patients, N=54,646, OR (95% CI) | Non‐ICU Patients, N=268,293, OR (95% CI) | Medical Patients, N=196,325, OR (95% CI) | Surgical Patients, N=126,614, OR (95% CI) |
|---|---|---|---|---|
| Model 1 | Model 2 | Model 3 | Model 4 | |
| ||||
| Year | 0.974 (0.963‐0.985) | 0.925 (0.909‐0.940) | 0.943 (0.933‐0.954) | 0.995 (0.977‐1.103) |
| Diabetes | 1.352 (1.562‐1.171) | 0.958 (0.783‐1.173) | 1.186 (1.037‐1.356) | 1.213 (0.942‐1.563) |
| Diabetes*year | 0.947 (0.927‐0.967) | 0.977 (0.946‐1.008) | 0.961 (0.942‐0.980) | 0.955 (0.918‐0.994) |
| C statistic | 0.812 | 0.907 | 0.880 | 0.919 |
Among non‐ICU patients (Table 2, model 2), each successive year was associated with a 7.5% relative reduction in the adjusted odds of mortality (OR: 0.925, 95% CI: 0.909‐0.940) for patients without diabetes compared to a 9.6% relative reduction for those with diabetes (OR: 0.904, 95% CI: 0.879‐0.929); this greater decline in odds of adjusted mortality of 2.3% per year (OR: 0.977, 95% CI: 0.946‐1.008; P=0.148) was not statistically significant.
We found greater decline in odds of mortality among patients with diabetes than among patients without diabetes over time in both medical patients (3.9% greater decline per year; OR: 0.961, 95% CI: 0.942‐0.980) and surgical patients (4.5% greater decline per year; OR: 0.955, 95% CI: 0.918‐0.994), without a difference between the 2. Detailed results are shown in Table 2, models 3 and 4.
Glycemic Control
Among ICU patients with diabetes (N=14,364), at least 2 inpatient point‐of‐care glucose readings were available for 13,136 (91.5%), with a mean of 4.67 readings per day, whereas hemoglobin A1c data were available for only 5321 patients (37.0%). Both inpatient glucose data and hemoglobin A1c were available for 4989 patients (34.7%). Figure 2 shows trends in inpatient and outpatient glycemic control measures among ICU patients with diabetes over the study period. Mean hemoglobin A1c decreased from 7.7 in 2000 to 7.3 in 2010. Mean hospitalization glucose began at 187.2, reached a nadir of 162.4 in the third quarter (Q3) of 2007, and rose subsequently to 174.4 with loosened glucose control targets. Standard deviation of mean glucose and percentage of patient‐days with a severe hyperglycemic episode followed a similar pattern, though with nadirs in Q4 2007 and Q2 2008, respectively, whereas percentage of patient‐days with a hypoglycemic episode rose from 1.46% in 2000, peaked at 3.00% in Q3 2005, and returned to 2.15% in 2010. All changes in glucose control are significant with P<0.001.
Mortality Trends and Glycemic Control
To determine whether glucose control explained the excess decline in odds of mortality among patients with diabetes in the ICU, we restricted our sample to ICU patients with diabetes and examined the association of diabetes with mortality after including measures of glucose control.
We first verified that the overall adjusted mortality trend among ICU patients with diabetes for whom we had measures of inpatient glucose control was similar to that of the full sample of ICU patients with diabetes. Similar to the full sample, we found that the adjusted excess odds of death significantly declined by a relative 7.3% each successive year (OR: 0.927, 95% CI: 0.907‐0.947; Table 3, model 1). We then included measures of inpatient glucose control in the model and found, as expected, that a higher percentage of days with severe hyperglycemia and with hypoglycemia was associated with an increased odds of death (P<0.001 for both; Table 3, model 2). Nonetheless, after including measures of inpatient glucose control, we found that the rate of change of excess odds of death for patients with diabetes was unchanged (OR: 0.926, 95% CI: 0.905‐0.947).
| Patients With Inpatient Glucose Control Measures, n=13,136 | Patients With Inpatient and Outpatient Glucose Control Measures, n=4,989 | ||||
|---|---|---|---|---|---|
| Independent Variables | Model 1, OR (95% CI) | Model 2, OR (95% CI) | Model 3, OR (95% CI) | Model 4, OR (95% CI) | Model 5, OR (95% CI) |
| |||||
| Year | 0.927 (0.907‐0.947) | 0.926 (0.905‐0.947) | 0.958 (0.919‐0.998) | 0.956 (0.916‐0.997) | 0.953 (0.914‐0.994) |
| % Severe hyperglycemic days | 1.016 (1.010‐1.021) | 1.009 (0.998‐1.020) | 1.010 (0.999‐1.021) | ||
| % Hypoglycemic days | 1.047 (1.040‐1.055) | 1.051 (1.037‐1.065) | 1.049 (1.036‐1.063) | ||
| % Normoglycemic days | 0.997 (0.994‐1.000) | 0.994 (0.989‐0.999) | 0.993 (0.988‐0.998) | ||
| SD of mean glucose | 0.996 (0.992‐1.000) | 0.993 (0.986‐1.000) | 0.994 (0.987‐1.002) | ||
| Mean HbA1c | 0.892 (0.828‐0.961) | ||||
| C statistic | 0.806 | 0.825 | 0.825 | 0.838 | 0.841 |
We then restricted our sample to patients with diabetes with both inpatient and outpatient glycemic control data and found that, in this subpopulation, the adjusted excess odds of death among patients with diabetes relative to those without significantly declined by a relative 4.2% each progressive year (OR: 0.958, 95% CI: 0.918‐0.998; Table 3, model 3). Including measures of inpatient glucose control in the model did not significantly change the rate of change of excess odds of death (OR: 0.956, 95% CI: 0.916‐0.997; Table 3, model 4), nor did including both measures of inpatient and outpatient glycemic control (OR: 0.953, 95% CI: 0.914‐0.994; Table 3, model 5).
DISCUSSION
We conducted a difference‐in‐difference analysis of in‐hospital mortality rates among adult patients with diabetes compared to patients without diabetes over 10 years, stratifying by ICU status and service assignment. For patients with any ICU stay, we found that the reduction in odds of mortality for patients with diabetes has been 3 times larger than the reduction in odds of mortality for patients without diabetes. For those without an ICU stay, we found no significant difference between patients with and without diabetes in the rate at which in‐hospital mortality declined. We did not find stratification by assignment to a medical or surgical service to be an effect modifier. Finally, despite the fact that our institution achieved better aggregate inpatient glucose control, less severe hyperglycemia, and better long‐term glucose control over the course of the decade, we did not find that either inpatient or outpatient glucose control explained the trend in mortality for patients with diabetes in the ICU. Our study is unique in its inclusion of all hospitalized patients and its ability to simultaneously assess whether both inpatient and outpatient glucose control are explanatory factors in the observed mortality trends.
The fact that improved inpatient glucose control did not explain the trend in mortality for patients with diabetes in the ICU is consistent with the majority of the literature on intensive inpatient glucose control. In randomized trials, intensive glucose control appears to be of greater benefit for patients without diabetes than for patients with diabetes.[31] In fact, in 1 study, patients with diabetes were the only group that did not benefit from intensive glucose control.[32] In our study, it is possible that the rise in hypoglycemia nullified some of the benefits of glucose control. Nationally, hospital admissions for hypoglycemia among Medicare beneficiaries now outnumber admissions for hyperglycemia.[27]
We also do not find that the decline in hemoglobin A1c attenuated the reduction in mortality in the minority of patients for whom these data were available. This is concordant with evidence from 3 randomized clinical trials that have failed to establish a clear beneficial effect of intensive outpatient glucose control on primary cardiovascular endpoints among older, high‐risk patients with type 2 diabetes using glucose‐lowering agents.[21, 22, 23] It is notable, however, that the population for whom we had available hemoglobin A1c results was not representative of the overall population of ICU patients with diabetes. Consequently, there may be an association of outpatient glucose control with inpatient mortality in the overall population of ICU patients with diabetes that we were not able to detect.
The decline in mortality among ICU patients with diabetes in our study may stem from factors other than glycemic control. It is possible that patients were diagnosed earlier in their course of disease in later years of the study period, making the population of patients with diabetes younger or healthier. Of note, however, our risk adjustment models were very robust, with C statistics from 0.82 to 0.92, suggesting that we were able to account for much of the mortality risk attributable to patient clinical and demographic factors. More intensive glucose management may have nonglycemic benefits, such as closer patient observation, which may themselves affect mortality. Alternatively, improved cardiovascular management for patients with diabetes may have decreased the incidence of cardiovascular events. During the study period, evidence from large clinical trials demonstrated the importance of tight blood pressure and lipid management in improving outcomes for patients with diabetes,[33, 34, 35, 36] guidelines for lipid management for patients with diabetes changed,[37] and fewer patients developed cardiovascular complications.[38] Finally, it is possible that our findings can be explained by an improvement in treatment of complications for which patients with diabetes previously have had disproportionately worse outcomes, such as percutaneous coronary intervention.[39]
Our findings may have important implications for both clinicians and policymakers. Changes in inpatient glucose management have required substantial additional resources on the part of hospitals. Our evidence regarding the questionable impact of inpatient glucose control on in‐hospital mortality trends for patients with diabetes is disappointing and highlights the need for multifaceted evaluation of the impact of such quality initiatives. There may, for instance, be benefits from tighter blood glucose control in the hospital beyond mortality, such as reduced infections, costs, or length of stay. On the outpatient side, our more limited data are consistent with recent studies that have not been able to show a mortality benefit in older diabetic patients from more stringent glycemic control. A reassessment of prevailing diabetes‐related quality measures, as recently called for by some,[40, 41] seems reasonable.
Our study must be interpreted in light of its limitations. It is possible that the improvements in glucose management were too small to result in a mortality benefit. The overall reduction of 25 mg dL achieved at our institution is less than the 33 to 50 mg/dL difference between intensive and conventional groups in those randomized clinical trials that have found reductions in mortality.[11, 42] In addition, an increase in mean glucose during the last 1 to 2 years of the observation period (in response to prevailing guidelines) could potentially have attenuated any benefit on mortality. The study does not include other important clinical endpoints, such as infections, complications, length of stay, and hospital costs. Additionally, we did not examine postdischarge mortality, which might have shown a different pattern. The small proportion of patients with hemoglobin A1c results may have hampered our ability to detect an effect of outpatient glucose control. Consequently, our findings regarding outpatient glucose control are only suggestive. Finally, our findings represent the experience of a single, large academic medical center and may not be generalizable to all settings.
Overall, we found that patients with diabetes in the ICU have experienced a disproportionate reduction in in‐hospital mortality over time that does not appear to be explained by improvements in either inpatient or outpatient glucose control. Although improved glycemic control may have other benefits, it does not appear to impact in‐hospital mortality. Our real‐world empirical results contribute to the discourse among clinicians and policymakers with regards to refocusing the approach to managing glucose in‐hospital and readjudication of diabetes‐related quality measures.
Acknowledgments
The authors would like to acknowledge the YaleNew Haven Hospital diabetes management team: Gael Ulisse, APRN, Helen Psarakis, APRN, Anne Kaisen, APRN, and the Yale Endocrine Fellows.
Disclosures: Design and conduct of the study: N. B., J. D., S. I., T. B., L. H. Collection, management, analysis, and interpretation of the data: N. B., B. J., J. D., J. R., J. B., S. I., L. H. Preparation, review, or approval of the manuscript: N. B., B. J., J. D., J. R., S. I., T. B., L. H. Leora Horwitz, MD, had full access to all the data in the study and takes responsibility for the integrity of the data and the accuracy of the data analysis. Dr. Horwitz is supported by the National Institute on Aging (K08 AG038336) and by the American Federation for Aging Research through the Paul B. Beeson Career Development Award Program. This publication was also made possible by CTSA grant number UL1 RR024139 from the National Center for Research Resources and the National Center for Advancing Translational Science, components of the National Institutes of Health (NIH), and NIH roadmap for Medical Research. Its contents are solely the responsibility of the authors and do not necessarily represent the official view of the NIH. No funding source had any role in design and conduct of the study; collection, management, analysis, and interpretation of the data; preparation, review, or approval of the manuscript; or decision to submit the manuscript for publication. Silvio E. Inzucchi, MD, serves on a Data Safety Monitoring Board for Novo Nordisk, a manufacturer of insulin products used in the hospital setting. The remaining authors declare no conflicts of interest.
- National Diabetes Information Clearinghouse. National Diabetes Statistics; 2011. Available at: http://diabetes.niddk.nih.gov/dm/pubs/america/index.aspx. Accessed November 12, 2013.
- Healthcare Cost and Utilization Project. Statistical brief #93; 2010. Available at: http://www.hcup‐us.ahrq.gov/reports/statbriefs/sb93.pdf. Accessed November 12, 2013.
- , , , et al. Association between diabetes mellitus and post‐discharge outcomes in patients hospitalized with heart failure: findings from the EVEREST trial. Eur J Heart Fail. 2013;15(2):194–202.
- , , , et al. Influence of diabetes mellitus on clinical outcome in the thrombolytic era of acute myocardial infarction. GUSTO‐I Investigators. Global Utilization of Streptokinase and Tissue Plasminogen Activator for Occluded Coronary Arteries. J Am Coll Cardiol. 1997;30(1):171–179.
- , , , , , . Type 2 diabetes and pneumonia outcomes: a population‐based cohort study. Diabetes Care. 2007;30(9):2251–2257.
- , , , . Prevalence and outcomes of diabetes, hypertension and cardiovascular disease in COPD. Eur Respir J. 2008;32(4):962–969.
- , , , , . The role of body mass index and diabetes in the development of acute organ failure and subsequent mortality in an observational cohort. Crit Care. 2006;10(5):R137.
- , , , , , . Type 2 diabetes and 1‐year mortality in intensive care unit patients. Eur J Clin Invest. 2013;43(3):238–247.
- , , . Excess mortality during hospital stays among patients with recorded diabetes compared with those without diabetes. Diabet Med. 2013;30(12):1393–1402.
- , , , et al. Decade‐long trends in mortality among patients with and without diabetes mellitus at a major academic medical center. JAMA Intern Med. 2014;174(7):1187–1188.
- , , , et al. Intensive insulin therapy in critically ill patients. N Engl J Med. 2001;345(19):1359–1367.
- , , , et al. Intensive versus conventional glucose control in critically ill patients. N Engl J Med. 2009;360(13):1283–1297.
- , , , et al. A prospective randomised multi‐centre controlled trial on tight glucose control by intensive insulin therapy in adult intensive care units: the Glucontrol study. Intensive Care Med. 2009;35(10):1738–1748.
- , , , et al. Intensive versus conventional insulin therapy: a randomized controlled trial in medical and surgical critically ill patients. Crit Care Med. 2008;36(12):3190–3197.
- , , , et al. Intensive insulin therapy in the medical ICU. N Engl J Med. 2006;354(5):449–461.
- , , , et al. Glycemic control in non‐critically ill hospitalized patients: a systematic review and meta‐analysis. J Clin Endocrinol Metab. 2012;97(1):49–58.
- , , , et al. American Association of Clinical Endocrinologists and American Diabetes Association consensus statement on inpatient glycemic control. Diabetes Care. 2009;32(6):1119–1131.
- Agency for Healthcare Research and Quality National Quality Measures Clearinghouse. Percent of cardiac surgery patients with controlled 6 A.M. postoperative blood glucose; 2012. Available at: http://www.qualitymeasures.ahrq.gov/content.aspx?id=35532. Accessed November 12, 2013.
- The effect of intensive treatment of diabetes on the development and progression of long‐term complications in insulin‐dependent diabetes mellitus. The Diabetes Control and Complications Trial Research Group. N Engl J Med. 1993;329(14):977–986.
- , , , et al. Intensive blood‐glucose control with sulphonylureas or insulin compared with conventional treatment and risk of complications in patients with type 2 diabetes (UKPDS 33). Lancet. 1998;352(9131):837–853.
- Effects of intensive glucose lowering in type 2 diabetes. N Engl J Med. 2008;358(24):2545–2559.
- , , , et al. Glucose control and vascular complications in veterans with type 2 diabetes. N Engl J Med. 2009;360(2):129–139.
- , , , et al. Intensive blood glucose control and vascular outcomes in patients with type 2 diabetes. N Engl J Med. 2008;358(24):2560–2572.
- . Standards of medical care in diabetes—2014. Diabetes Care. 2014;37(suppl 1):S14–S80.
- National Committee for Quality Assurance. HEDIS 2013. Available at: http://www.ncqa.org/HEDISQualityMeasurement.aspx. Accessed November 12, 2013.
- , , , . Is glycemic control improving in US adults? Diabetes Care. 2008;31(1):81–86.
- , , , et al. National trends in US hospital admissions for hyperglycemia and hypoglycemia among medicare beneficiaries, 1999 to 2011. JAMA Intern Med. 2014;174(7):1116–1124.
- , , , et al. "Glucometrics"—assessing the quality of inpatient glucose management. Diabetes Technol Ther. 2006;8(5):560–569.
- , , , , . A modification of the Elixhauser comorbidity measures into a point system for hospital death using administrative data. Med Care. 2009;47(6):626–633.
- Healthcare Cost and Utilization Project. Clinical Classifications Software (CCS) for ICD‐9‐CM; 2013. Available at: http://www.hcup‐us.ahrq.gov/toolssoftware/ccs/ccs.jsp. Accessed November 12, 2013.
- , , , , . The impact of premorbid diabetic status on the relationship between the three domains of glycemic control and mortality in critically ill patients. Curr Opin Clin Nutr Metab Care. 2012;15(2):151–160.
- , , , et al. Intensive insulin therapy in mixed medical/surgical intensive care units: benefit versus harm. Diabetes. 2006;55(11):3151–3159.
- Tight blood pressure control and risk of macrovascular and microvascular complications in type 2 diabetes: UKPDS 38. UK Prospective Diabetes Study Group. BMJ. 1998;317(7160):703–713.
- , , , et al. Effects of a fixed combination of perindopril and indapamide on macrovascular and microvascular outcomes in patients with type 2 diabetes mellitus (the ADVANCE trial): a randomised controlled trial. Lancet. 2007;370(9590):829–840.
- , , , , . MRC/BHF heart protection study of cholesterol‐lowering with simvastatin in 5963 people with diabetes: a randomised placebo‐controlled trial. Lancet. 2003;361(9374):2005–2016.
- , , , et al. Primary prevention of cardiovascular disease with atorvastatin in type 2 diabetes in the Collaborative Atorvastatin Diabetes Study (CARDS): multicentre randomised placebo‐controlled trial. Lancet. 2004;364(9435):685–696.
- , , , . Expert panel on detection, evaluation and treatment of high blood cholesterol in adults. Executive summary of the third report of the national cholesterol education program (NCEP) adult treatment panel (atp III). JAMA. 2001;285(19):2486–2497.
- , , , et al. Changes in diabetes‐related complications in the United States, 1990–2010. N Engl J Med. 2014;370(16):1514–1523.
- , , . Coronary heart disease in patients with diabetes: part II: recent advances in coronary revascularization. J Am Coll Cardiol. 2007;49(6):643–656.
- , , , et al. Management of hyperglycemia in type 2 diabetes: a patient‐centered approach position statement of the American Diabetes Association (ADA) and the European Association for the Study of Diabetes (EASD). Diabetes Care. 2012;35(6):1364–1379.
- , , , , . Assessing potential glycemic overtreatment in persons at hypoglycemic risk. JAMA Intern Med. 2013;174(2):259–268.
- , , , . Glycometabolic state at admission: important risk marker of mortality in conventionally treated patients with diabetes mellitus and acute myocardial infarction: long‐term results from the Diabetes and Insulin‐Glucose Infusion in Acute Myocardial Infarction (DIGAMI) study. Circulation. 1999;99(20):2626–2632.
© 2015 Society of Hospital Medicine
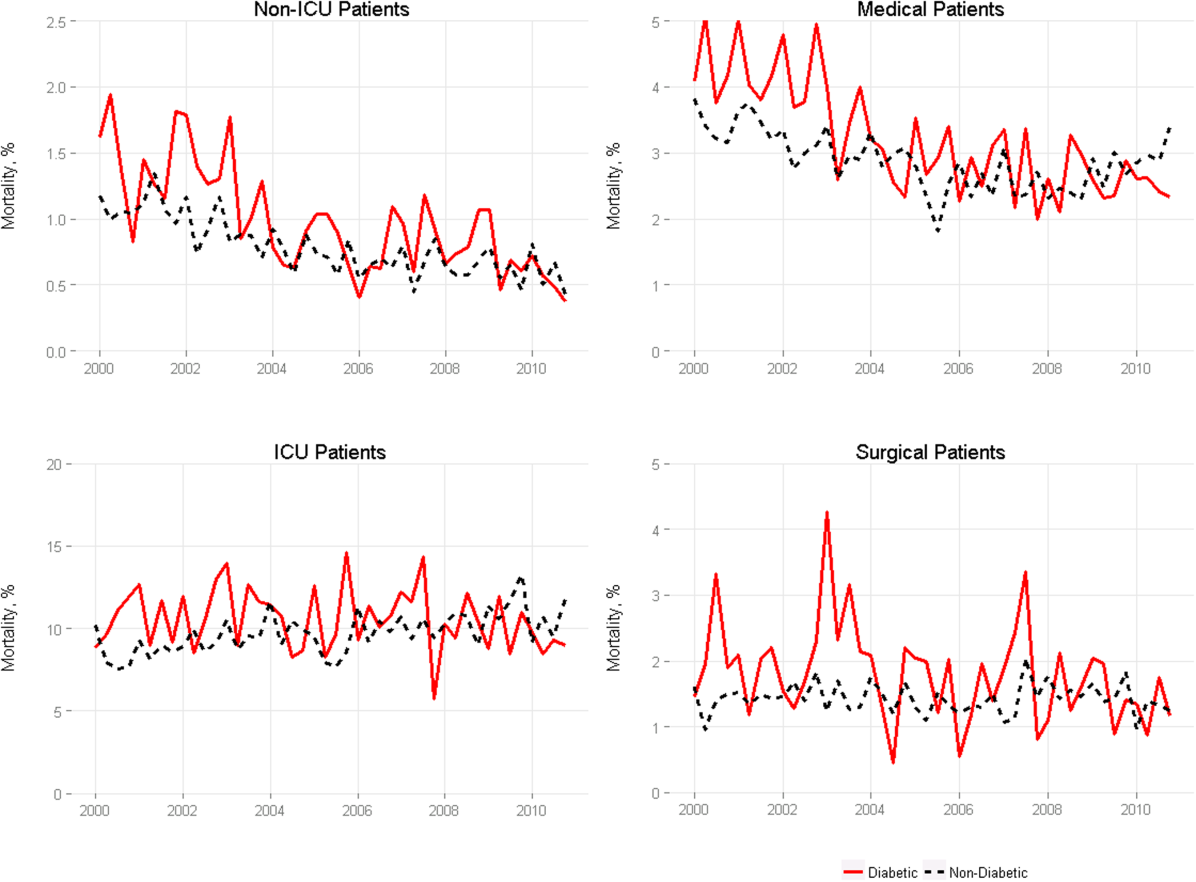
Inpatient Mammography
Testing for breast cancer is traditionally offered in outpatient settings, and screening mammography rates have plateaued since 2000.[1] Current data suggest that the mammography utilization gap by race has narrowed; however, disparity remains among low‐income, uninsured, and underinsured populations.[2, 3] The lowest compliance with screening mammography recommendations have been reported among women with low income (63.2%), uninsured (50.4%), and those without a usual source of healthcare (43.6%).[4] Although socioeconomic status, access to the healthcare system, and awareness about screening benefits can all influence women's willingness to have screening, the most common reason that women report for not having mammograms were that no one recommended the test.[5, 6] These findings support previous reports that physicians' recommendations about the need for screening mammography is an influential factor in determining women's decisions related to compliance.[7] Hence, the role of healthcare providers in all clinical care settings is pivotal in reducing mammography utilization disparities.
A recent study evaluating the breast cancer screening adherence among the hospitalized women aged 50 to 75 years noted that many (60%) were low income (annual household income <$20,000), 39% were nonadherent, and 35% were at high risk of developing breast cancer.[8] Further, a majority of these hospitalized women were amenable to inpatient screening mammography if due and offered during the hospital stay.[8] As a follow‐up, the purpose of the current study was to explore how hospitalists feel about getting involved in breast cancer screening and ordering screening mammograms for hospitalized women. We hypothesized that a greater proportion of hospitalists would order mammography for hospitalized women who were both overdue for screening and at high risk for developing breast cancer if they fundamentally believe that they have a role in breast cancer screening. This study also explored anticipated barriers that may be of concern to hospitalists when ordering inpatient screening mammography.
METHODS
Study Design and Sample
All hospitalist providers within 4 groups affiliated with Johns Hopkins Medical Institution (Johns Hopkins Hospital, Johns Hopkins Bayview Medical Center, Howard County General Hospital, and Suburban Hospital) were approached for participation in this‐cross sectional study. The hospitalists included physicians, nurse practitioners, and physician assistants. All hospitalists were eligible to participate in the study, and there was no monetary incentive attached to the study participation. A total of 110 hospitalists were approached for study participation. Of these, 4 hospitalists (3.5%) declined to participate, leaving a study population of 106 hospitalists.
Data Collection and Measures
Participants were sent the survey via email using SurveyMonkey. The survey included questions regarding demographic information such as age, gender, race, and clinical experience in hospital medicine. To evaluate for potential personal sources of bias related to mammography, study participants were asked if they have had a family member diagnosed with breast cancer.
A central question asked whether respondents agreed with the following: I believe that hospitalists should be involved in breast cancer screening. The questionnaire also evaluated hospitalists' practical approaches to 2 clinical scenarios by soliciting decision about whether they would order an inpatient screening mammogram. These clinical scenarios were designed using the Gail risk prediction score for probability of developing breast cancer within the next 5 years according to the National Cancer Institute Breast Cancer Risk Tool.[9] Study participants were not provided with the Gail scores and had to infer the risk from the clinical information provided in scenarios. One case described a woman at high risk, and the other with a lower‐risk profile. The first question was: Would you order screening mammography for a 65‐year‐old African American female with obesity and family history for breast cancer admitted to the hospital for cellulitis? She has never had a mammogram and is willing to have it while in hospital. Based on the information provided in the scenario, the 5‐year risk prediction for developing breast cancer using the Gail risk model was high (2.1%). The second scenario asked: Would you order a screening mammography for a 62‐year‐old healthy Hispanic female admitted for presyncope? Patient is uninsured and requests a screening mammogram while in hospital [assume that personal and family histories for breast cancer are negative]. Based on the information provided in the scenario, the 5‐year risk prediction for developing breast cancer using the Gail risk model was low (0.6%).
Several questions regarding potential barriers to inpatient screening mammography were also asked. Some of these questions were based on barriers mentioned in our earlier study of patients,[8] whereas others emerged from a review of the literature and during focus group discussions with hospitalist providers. Pilot testing of the survey was conducted on hospitalists outside the study sample to enhance question clarity. This study was approved by our institutional review board.
Statistical Methods
Respondent characteristics are presented as proportions and means. Unpaired t tests and [2] tests were used to look for associations between demographic characteristics and responses to the question about whether they believe that they should be involved in breast cancer screening. The survey data were analyzed using the Stata statistical software package version 12.1 (StataCorp, College Station, TX).
RESULTS
Out of 106 study subjects willing to participate, 8 did not respond, yielding a response rate of 92%. The mean age of the study participants was 37.6 years, and 55% were female. Almost two‐thirds of study participants (59%) were faculty physicians at an academic hospital, and the average clinical experience as a hospitalist was 4.6 years. Study participants were diverse with respect to ethnicity, and only 30% reported having a family member with breast cancer (Table 1). Because breast cancer is a disease that affects primarily women, stratified analysis by gender showed that most of these characteristic were similar across genders, except fewer women were full time (76% vs 93%, P=0.04) and on the faculty (44% vs 77%, P=0.003).
| Characteristics* | All Participants (n=98) |
|---|---|
| |
| Age, y, mean (SD) | 37.6 (5.5) |
| Female, n (%) | 54 (55) |
| Race, n (%) | |
| Caucasian | 35 (36) |
| African American | 12 (12) |
| Asian | 32 (33) |
| Other | 13 (13) |
| Hospitalist experience, y, mean (SD) | 4.6 (3.5) |
| Full time, n (%) | 82 (84) |
| Family history of breast cancer, n (%) | 30 (30) |
| Faculty physician, n (%) | 58 (59) |
| Believe that hospitalists should be involved in breast cancer screening, n (%) | 35 (38) |
Only 38% believed that hospitalists should be involved with breast cancer screening. The most commonly cited concern related to ordering an inpatient screening mammography was follow‐up of the results of the mammography, followed by the test may not be covered by patient's insurance. As shown in Table 2, these concerns were not perceived differently among providers who believed that hospitalists should be involved in breast cancer screening as compared to those who do not. Demographic variables from Table 1 failed to discern any significant associations related to believing that hospitalists should be involved with breast cancer screening or with concerns about the barriers to screening presented in Table 2 (data not shown). As shown in Table 2, overall, 32% hospitalists were willing to order a screening mammography during a hospital stay for the scenario of the woman at high risk for developing breast cancer (5‐year risk prediction using Gail model 2.1%) and 33% for the low‐risk scenario (5‐year risk prediction using Gail model 0.6%).
| Concern About Screening* | Believe That Hospitalists Should Be Involved in Breast Cancer Screening (n=35) | Do Not Believe That Hospitalists Should Be Involved in Breast Cancer Screening (n=58) | P Value |
|---|---|---|---|
| |||
| Result follow‐up, agree/strongly agree, n (%) | 34 (97) | 51 (88) | 0.25 |
| Interference with patient care, agree/strongly agree, n (%) | 23 (67) | 27 (47) | 0.07 |
| Cost, agree/strongly agree, n (%) | 23 (66) | 28 (48) | 0.10 |
| Concern that the test will not be covered by patient's insurance, agree/strongly agree, n (%) | 23 (66) | 34 (59) | 0.50 |
| Not my responsibility to do cancer prevention, agree/strongly agree, n (%) | 7 (20) | 16 (28) | 0.57 |
| Response to clinical scenarios | |||
| Would order a screening mammogram in the hospital for a high‐risk woman [scenario 1: Gail risk model: 2.1%], n (%) | 23 (66) | 6 (10) | 0.0001 |
| Would order a screening mammography in the hospital for a low‐risk woman [scenario 2: Gail risk model: 0.6%], n (%) | 18 (51) | 13 (22) | 0.004 |
DISCUSSION
Our study suggests that most hospitalists do not believe that they should be involved in breast cancer screening for their hospitalized patients. This perspective was not influenced by either the physician gender, family history for breast cancer, or by the patient's level of risk for developing breast cancer. When patients are in the hospital, both the setting and the acute illness are known to promote reflection and consideration of self‐care.[10] With major healthcare system changes on the horizon and the passing of the Affordable Care Act, we are becoming teams of providers who are collectively responsible for optimal care delivery. It may be possible to increase breast cancer screening rates by educating our patients and offering inpatient screening mammography while they are in the hospital, particularly to those who are at high risk of developing breast cancer.
Physician recommendations for preventive health and screening have consistently been found to be among the strongest predictors of screening utilization.[11] This is the first study to our knowledge that has attempted to understand hospitalists' views and concerns about ordering screening tests to detect occult malignancy. Although addressing preventive care during a hospitalization may seem complex and difficult, helping these women understand their personal risk profile (eg, family history of breast cancer, use of estrogen, race, age, and genetic risk factors) may be what is needed for beginning to influence perspective that might ultimately translate into a willingness to undergo screening.[12, 13, 14] Such delivery of patient‐centered care is built on a foundation of shared decision‐making, which takes into account the patient's preferences, values, and wishes.[15]
Ordering screening mammography for hospitalized patients will require a deeper understanding of hospitalists' attitudes, because the way that these physicians feel about the tests utility will dramatically influence the way that this opportunity is presented to patients, and ultimately the patients' preference to have or forego testing. Our study results are consistent with another publication that highlighted incongruence between physicians' views and patients' preferences for screening practices.[8, 11] Concerns cited, such as interference with patient's acute care, deserve attention, because it may be possible to carry out the screening in ways and at times that do not interfere with treatment or prolong length of stay. Exploring this with a feasibility study will be necessary. Such an approach has been advocated by Trimble et al. for inpatient cervical cancer screening as an efficient strategy to target high‐risk, nonadherent women.[16]
The inpatient setting allows for the elimination of major barriers to screening (like transportation and remembering to get to screening appointments),[8] thereby actively facilitating this needed service. Costs associated with inpatient screening mammography may deter both hospitalists and patients from screening; however, some insurers and Medicare pay for the full cost of screening tests, irrespective of the clinical setting.[17] Further, as hospitals or accountable care organizations become responsible for total cost per beneficiary, screening costs will be preferable when compared with the expenses associated with later detection of pathology and caring for advanced disease states.
One might question whether the mortality benefit of screening mammography is comparable among hospitalized women (who are theoretically sicker and with shorter life expectancy) and those cared for in outpatient practices. Unfortunately, we do not yet know the answer to this question, because data for inpatient screening mammography are nonexistent, and currently this is not considered as a standard of care. However, one can expect the benefits to be similar, if not greater, when performed in the outpatient setting, if preliminary efforts are directed at those who are both nonadherent and at high risk for breast cancer. According to 1 study, increasing mammography utilization by 5% in our country would prevent 560 deaths from breast cancer each year.[18]
Several limitations of this study should be considered. First, this cross‐sectional study was conducted at hospitals associated with a single institution and the results may not be generalizable. Second, although physicians' concerns were explored in this study, we did not solicit input about the potential impact of prevention and screening on the nursing staff. Third, there may be concerns about the hypothetical nature of anchoring and possible framing effects with the 2 clinical scenarios. Finally, it is possible that the hospitalists' response may have been subject to social desirability bias. That said, the response to the key question Do you think hospitalists should be involved in breast cancer screening? do not support a socially desirable bias.
Given the current policy emphasis on reducing disparities in cancer screening, it may be reasonable to expand the role of all healthcare providers and healthcare facilities in screening high‐risk populations. Screening tests that may seem difficult to coordinate in hospitals currently may become easier as our hospitals evolve to become more patient centered. Future studies are needed to evaluate the feasibility and potential barriers to inpatient screening mammography.
Disclosure
Disclosures: Dr. Wright is a Miller‐Coulson Family Scholar, and this support comes from Hopkins Center for Innovative Medicine. This work was made possible in part by the Maryland Cigarette Restitution Fund Research Grant at Johns Hopkins. The authors report no conflicts of interest.
- Centers for Disease Control and Prevention (CDC). Vital signs: breast cancer screening among women aged 50–74 years—United States, 2008. MMWR Morb Mortal Wkly Rep. 2010;59(26):813–816.
- American Cancer Society. Breast Cancer Facts 2013.
- , , , et al. Impact of socioeconomic status on cancer incidence and stage at diagnosis: selected findings from the surveillance, epidemiology, and end results: National Longitudinal Mortality Study. Cancer Causes Control. 2009;20:417–435.
- , , , ; Centers for Disease Control and Prevention. Breast cancer screening among adult women—behavioral risk factor surveillance system, United States, 2010. MMWR Morb Mortal Wkly Rep. 2012;61(suppl):46–50.
- , . Disparities in breast cancer. Curr Probl Cancer. 2007;31(3):134–156.
- , , . Factors associated with mammography utilization: a systematic quantitative review of the literature. J Womens Health (Larchmt). 2008;17:1477–1498.
- , , , et al. Processes of care in cervical and breast cancer screening and follow‐up: the importance of communication. Prev Med. 2004;39:81–90.
- , , , . Breast cancer screening preferences among hospitalized women. J Womens Health (Larchmt). 2013;22(7):637–642.
- , , , et al. Projecting individualized probabilities of developing breast cancer for white females who are being examined annually. J Natl Cancer Inst. 1989;8:1879–1886.
- , , , . Expanding the roles of hospitalist physicians to include public health. J Hosp Med. 2007;2:93–101.
- , , , et al. Colorectal cancer screening: conjoint analysis of consumer preferences and physicians' perceived consumer preferences in the US and Canada. Paper presented at: 27th Annual Meeting of the Society for Medical Decision Making; October 21–24, 2005; San Francisco, CA.
- , , . Family history of breast cancer: impact on the disease experience. Cancer Pract. 2000;8:135–142.
- , , , . Breast cancer knowledge and attitudes toward mammography as predictors of breast cancer preventive behavior in Kazakh, Korean, and Russian women in Kazakhstan. Int J Public Health. 2008;53:123–130.
- , , , , . The relation between projected breast cancer risk, perceived cancer risk, and mammography use. Results from the National Health Interview Survey. J Gen Intern Med. 2006;21:158–164.
- , . Patient‐centered communication in cancer care: promoting healing and reducing suffering. NIH publication no. 07‐6225. Bethesda, MD: National Cancer Institute, 2007.
- , , , , , . Effectiveness of screening for cervical cancer in an inpatient hospital setting. Obstet Gynecol. 2004;103(2):310–316.
- Centers for Medicare 38:600–609.
Testing for breast cancer is traditionally offered in outpatient settings, and screening mammography rates have plateaued since 2000.[1] Current data suggest that the mammography utilization gap by race has narrowed; however, disparity remains among low‐income, uninsured, and underinsured populations.[2, 3] The lowest compliance with screening mammography recommendations have been reported among women with low income (63.2%), uninsured (50.4%), and those without a usual source of healthcare (43.6%).[4] Although socioeconomic status, access to the healthcare system, and awareness about screening benefits can all influence women's willingness to have screening, the most common reason that women report for not having mammograms were that no one recommended the test.[5, 6] These findings support previous reports that physicians' recommendations about the need for screening mammography is an influential factor in determining women's decisions related to compliance.[7] Hence, the role of healthcare providers in all clinical care settings is pivotal in reducing mammography utilization disparities.
A recent study evaluating the breast cancer screening adherence among the hospitalized women aged 50 to 75 years noted that many (60%) were low income (annual household income <$20,000), 39% were nonadherent, and 35% were at high risk of developing breast cancer.[8] Further, a majority of these hospitalized women were amenable to inpatient screening mammography if due and offered during the hospital stay.[8] As a follow‐up, the purpose of the current study was to explore how hospitalists feel about getting involved in breast cancer screening and ordering screening mammograms for hospitalized women. We hypothesized that a greater proportion of hospitalists would order mammography for hospitalized women who were both overdue for screening and at high risk for developing breast cancer if they fundamentally believe that they have a role in breast cancer screening. This study also explored anticipated barriers that may be of concern to hospitalists when ordering inpatient screening mammography.
METHODS
Study Design and Sample
All hospitalist providers within 4 groups affiliated with Johns Hopkins Medical Institution (Johns Hopkins Hospital, Johns Hopkins Bayview Medical Center, Howard County General Hospital, and Suburban Hospital) were approached for participation in this‐cross sectional study. The hospitalists included physicians, nurse practitioners, and physician assistants. All hospitalists were eligible to participate in the study, and there was no monetary incentive attached to the study participation. A total of 110 hospitalists were approached for study participation. Of these, 4 hospitalists (3.5%) declined to participate, leaving a study population of 106 hospitalists.
Data Collection and Measures
Participants were sent the survey via email using SurveyMonkey. The survey included questions regarding demographic information such as age, gender, race, and clinical experience in hospital medicine. To evaluate for potential personal sources of bias related to mammography, study participants were asked if they have had a family member diagnosed with breast cancer.
A central question asked whether respondents agreed with the following: I believe that hospitalists should be involved in breast cancer screening. The questionnaire also evaluated hospitalists' practical approaches to 2 clinical scenarios by soliciting decision about whether they would order an inpatient screening mammogram. These clinical scenarios were designed using the Gail risk prediction score for probability of developing breast cancer within the next 5 years according to the National Cancer Institute Breast Cancer Risk Tool.[9] Study participants were not provided with the Gail scores and had to infer the risk from the clinical information provided in scenarios. One case described a woman at high risk, and the other with a lower‐risk profile. The first question was: Would you order screening mammography for a 65‐year‐old African American female with obesity and family history for breast cancer admitted to the hospital for cellulitis? She has never had a mammogram and is willing to have it while in hospital. Based on the information provided in the scenario, the 5‐year risk prediction for developing breast cancer using the Gail risk model was high (2.1%). The second scenario asked: Would you order a screening mammography for a 62‐year‐old healthy Hispanic female admitted for presyncope? Patient is uninsured and requests a screening mammogram while in hospital [assume that personal and family histories for breast cancer are negative]. Based on the information provided in the scenario, the 5‐year risk prediction for developing breast cancer using the Gail risk model was low (0.6%).
Several questions regarding potential barriers to inpatient screening mammography were also asked. Some of these questions were based on barriers mentioned in our earlier study of patients,[8] whereas others emerged from a review of the literature and during focus group discussions with hospitalist providers. Pilot testing of the survey was conducted on hospitalists outside the study sample to enhance question clarity. This study was approved by our institutional review board.
Statistical Methods
Respondent characteristics are presented as proportions and means. Unpaired t tests and [2] tests were used to look for associations between demographic characteristics and responses to the question about whether they believe that they should be involved in breast cancer screening. The survey data were analyzed using the Stata statistical software package version 12.1 (StataCorp, College Station, TX).
RESULTS
Out of 106 study subjects willing to participate, 8 did not respond, yielding a response rate of 92%. The mean age of the study participants was 37.6 years, and 55% were female. Almost two‐thirds of study participants (59%) were faculty physicians at an academic hospital, and the average clinical experience as a hospitalist was 4.6 years. Study participants were diverse with respect to ethnicity, and only 30% reported having a family member with breast cancer (Table 1). Because breast cancer is a disease that affects primarily women, stratified analysis by gender showed that most of these characteristic were similar across genders, except fewer women were full time (76% vs 93%, P=0.04) and on the faculty (44% vs 77%, P=0.003).
| Characteristics* | All Participants (n=98) |
|---|---|
| |
| Age, y, mean (SD) | 37.6 (5.5) |
| Female, n (%) | 54 (55) |
| Race, n (%) | |
| Caucasian | 35 (36) |
| African American | 12 (12) |
| Asian | 32 (33) |
| Other | 13 (13) |
| Hospitalist experience, y, mean (SD) | 4.6 (3.5) |
| Full time, n (%) | 82 (84) |
| Family history of breast cancer, n (%) | 30 (30) |
| Faculty physician, n (%) | 58 (59) |
| Believe that hospitalists should be involved in breast cancer screening, n (%) | 35 (38) |
Only 38% believed that hospitalists should be involved with breast cancer screening. The most commonly cited concern related to ordering an inpatient screening mammography was follow‐up of the results of the mammography, followed by the test may not be covered by patient's insurance. As shown in Table 2, these concerns were not perceived differently among providers who believed that hospitalists should be involved in breast cancer screening as compared to those who do not. Demographic variables from Table 1 failed to discern any significant associations related to believing that hospitalists should be involved with breast cancer screening or with concerns about the barriers to screening presented in Table 2 (data not shown). As shown in Table 2, overall, 32% hospitalists were willing to order a screening mammography during a hospital stay for the scenario of the woman at high risk for developing breast cancer (5‐year risk prediction using Gail model 2.1%) and 33% for the low‐risk scenario (5‐year risk prediction using Gail model 0.6%).
| Concern About Screening* | Believe That Hospitalists Should Be Involved in Breast Cancer Screening (n=35) | Do Not Believe That Hospitalists Should Be Involved in Breast Cancer Screening (n=58) | P Value |
|---|---|---|---|
| |||
| Result follow‐up, agree/strongly agree, n (%) | 34 (97) | 51 (88) | 0.25 |
| Interference with patient care, agree/strongly agree, n (%) | 23 (67) | 27 (47) | 0.07 |
| Cost, agree/strongly agree, n (%) | 23 (66) | 28 (48) | 0.10 |
| Concern that the test will not be covered by patient's insurance, agree/strongly agree, n (%) | 23 (66) | 34 (59) | 0.50 |
| Not my responsibility to do cancer prevention, agree/strongly agree, n (%) | 7 (20) | 16 (28) | 0.57 |
| Response to clinical scenarios | |||
| Would order a screening mammogram in the hospital for a high‐risk woman [scenario 1: Gail risk model: 2.1%], n (%) | 23 (66) | 6 (10) | 0.0001 |
| Would order a screening mammography in the hospital for a low‐risk woman [scenario 2: Gail risk model: 0.6%], n (%) | 18 (51) | 13 (22) | 0.004 |
DISCUSSION
Our study suggests that most hospitalists do not believe that they should be involved in breast cancer screening for their hospitalized patients. This perspective was not influenced by either the physician gender, family history for breast cancer, or by the patient's level of risk for developing breast cancer. When patients are in the hospital, both the setting and the acute illness are known to promote reflection and consideration of self‐care.[10] With major healthcare system changes on the horizon and the passing of the Affordable Care Act, we are becoming teams of providers who are collectively responsible for optimal care delivery. It may be possible to increase breast cancer screening rates by educating our patients and offering inpatient screening mammography while they are in the hospital, particularly to those who are at high risk of developing breast cancer.
Physician recommendations for preventive health and screening have consistently been found to be among the strongest predictors of screening utilization.[11] This is the first study to our knowledge that has attempted to understand hospitalists' views and concerns about ordering screening tests to detect occult malignancy. Although addressing preventive care during a hospitalization may seem complex and difficult, helping these women understand their personal risk profile (eg, family history of breast cancer, use of estrogen, race, age, and genetic risk factors) may be what is needed for beginning to influence perspective that might ultimately translate into a willingness to undergo screening.[12, 13, 14] Such delivery of patient‐centered care is built on a foundation of shared decision‐making, which takes into account the patient's preferences, values, and wishes.[15]
Ordering screening mammography for hospitalized patients will require a deeper understanding of hospitalists' attitudes, because the way that these physicians feel about the tests utility will dramatically influence the way that this opportunity is presented to patients, and ultimately the patients' preference to have or forego testing. Our study results are consistent with another publication that highlighted incongruence between physicians' views and patients' preferences for screening practices.[8, 11] Concerns cited, such as interference with patient's acute care, deserve attention, because it may be possible to carry out the screening in ways and at times that do not interfere with treatment or prolong length of stay. Exploring this with a feasibility study will be necessary. Such an approach has been advocated by Trimble et al. for inpatient cervical cancer screening as an efficient strategy to target high‐risk, nonadherent women.[16]
The inpatient setting allows for the elimination of major barriers to screening (like transportation and remembering to get to screening appointments),[8] thereby actively facilitating this needed service. Costs associated with inpatient screening mammography may deter both hospitalists and patients from screening; however, some insurers and Medicare pay for the full cost of screening tests, irrespective of the clinical setting.[17] Further, as hospitals or accountable care organizations become responsible for total cost per beneficiary, screening costs will be preferable when compared with the expenses associated with later detection of pathology and caring for advanced disease states.
One might question whether the mortality benefit of screening mammography is comparable among hospitalized women (who are theoretically sicker and with shorter life expectancy) and those cared for in outpatient practices. Unfortunately, we do not yet know the answer to this question, because data for inpatient screening mammography are nonexistent, and currently this is not considered as a standard of care. However, one can expect the benefits to be similar, if not greater, when performed in the outpatient setting, if preliminary efforts are directed at those who are both nonadherent and at high risk for breast cancer. According to 1 study, increasing mammography utilization by 5% in our country would prevent 560 deaths from breast cancer each year.[18]
Several limitations of this study should be considered. First, this cross‐sectional study was conducted at hospitals associated with a single institution and the results may not be generalizable. Second, although physicians' concerns were explored in this study, we did not solicit input about the potential impact of prevention and screening on the nursing staff. Third, there may be concerns about the hypothetical nature of anchoring and possible framing effects with the 2 clinical scenarios. Finally, it is possible that the hospitalists' response may have been subject to social desirability bias. That said, the response to the key question Do you think hospitalists should be involved in breast cancer screening? do not support a socially desirable bias.
Given the current policy emphasis on reducing disparities in cancer screening, it may be reasonable to expand the role of all healthcare providers and healthcare facilities in screening high‐risk populations. Screening tests that may seem difficult to coordinate in hospitals currently may become easier as our hospitals evolve to become more patient centered. Future studies are needed to evaluate the feasibility and potential barriers to inpatient screening mammography.
Disclosure
Disclosures: Dr. Wright is a Miller‐Coulson Family Scholar, and this support comes from Hopkins Center for Innovative Medicine. This work was made possible in part by the Maryland Cigarette Restitution Fund Research Grant at Johns Hopkins. The authors report no conflicts of interest.
- Centers for Disease Control and Prevention (CDC). Vital signs: breast cancer screening among women aged 50–74 years—United States, 2008. MMWR Morb Mortal Wkly Rep. 2010;59(26):813–816.
- American Cancer Society. Breast Cancer Facts 2013.
- , , , et al. Impact of socioeconomic status on cancer incidence and stage at diagnosis: selected findings from the surveillance, epidemiology, and end results: National Longitudinal Mortality Study. Cancer Causes Control. 2009;20:417–435.
- , , , ; Centers for Disease Control and Prevention. Breast cancer screening among adult women—behavioral risk factor surveillance system, United States, 2010. MMWR Morb Mortal Wkly Rep. 2012;61(suppl):46–50.
- , . Disparities in breast cancer. Curr Probl Cancer. 2007;31(3):134–156.
- , , . Factors associated with mammography utilization: a systematic quantitative review of the literature. J Womens Health (Larchmt). 2008;17:1477–1498.
- , , , et al. Processes of care in cervical and breast cancer screening and follow‐up: the importance of communication. Prev Med. 2004;39:81–90.
- , , , . Breast cancer screening preferences among hospitalized women. J Womens Health (Larchmt). 2013;22(7):637–642.
- , , , et al. Projecting individualized probabilities of developing breast cancer for white females who are being examined annually. J Natl Cancer Inst. 1989;8:1879–1886.
- , , , . Expanding the roles of hospitalist physicians to include public health. J Hosp Med. 2007;2:93–101.
- , , , et al. Colorectal cancer screening: conjoint analysis of consumer preferences and physicians' perceived consumer preferences in the US and Canada. Paper presented at: 27th Annual Meeting of the Society for Medical Decision Making; October 21–24, 2005; San Francisco, CA.
- , , . Family history of breast cancer: impact on the disease experience. Cancer Pract. 2000;8:135–142.
- , , , . Breast cancer knowledge and attitudes toward mammography as predictors of breast cancer preventive behavior in Kazakh, Korean, and Russian women in Kazakhstan. Int J Public Health. 2008;53:123–130.
- , , , , . The relation between projected breast cancer risk, perceived cancer risk, and mammography use. Results from the National Health Interview Survey. J Gen Intern Med. 2006;21:158–164.
- , . Patient‐centered communication in cancer care: promoting healing and reducing suffering. NIH publication no. 07‐6225. Bethesda, MD: National Cancer Institute, 2007.
- , , , , , . Effectiveness of screening for cervical cancer in an inpatient hospital setting. Obstet Gynecol. 2004;103(2):310–316.
- Centers for Medicare 38:600–609.
© 2015 Society of Hospital Medicine
Bronchiolitis and Discharge Criteria
Although bronchiolitis is the leading cause of hospitalization for US infants,[1] there is a lack of basic prospective data about the expected inpatient clinical course and ongoing uncertainty about when a hospitalized child is ready for discharge to home.[2] This lack of data about children's readiness for discharge may result in variable hospital length‐of‐stay (LOS).[3, 4, 5]
One specific source of variability in discharge readiness and LOS variability may be the lack of consensus about safe threshold oxygen saturation values for discharge in children hospitalized with bronchiolitis.[6, 7] In 2006, the Scottish Intercollegiate Guidelines Network recommended a discharge room air oxygen (RAO2) saturation threshold of 95%.[8] The same year, the American Academy of Pediatrics (AAP) bronchiolitis clinical practice guideline stated that oxygen is not needed for children with RAO2 saturations 90% who are feeding well and have minimal respiratory distress.[9] There is a need for prospective studies to help clinicians make evidenced‐based discharge decisions for this common condition.
We performed a prospective, multicenter, multiyear study[10, 11, 12] to examine the typical inpatient clinical course of and to develop hospital discharge guidelines for children age <2 years hospitalized with bronchiolitis. We hypothesized that children would not worsen clinically and would be safe to discharge home once their respiratory status improved and they were able to remain hydrated.
METHODS
Study Design and Population
We conducted a prospective, multicenter cohort study for 3 consecutive years during the 2007 to 2010 winter seasons, as part of the Multicenter Airway Research Collaboration (MARC), a program of the Emergency Medicine Network (
All patients were treated at the discretion of the treating physician. Inclusion criteria were an attending physician's diagnosis of bronchiolitis, age <2 years, and the ability of the parent/guardian to give informed consent. The exclusion criteria were previous enrollment and transfer to a participating hospital >48 hours after the original admission time. Therefore, children with comorbid conditions were included in this study. All consent and data forms were translated into Spanish. The institutional review board at each of the 16 participating hospitals approved the study.
Of the 2207 enrolled children, we excluded 109 (5%) children with a hospital LOS <1 day due to inadequate time to capture the required data for the present analysis. Among the 2098 remaining children, 1916 (91%) had daily inpatient data on all factors used to define clinical improvement and clinical worsening. Thus, the analytic cohort was comprised of 1916 children hospitalized for bronchiolitis.
Data Collection
Investigators conducted detailed structured interviews. Chart reviews were conducted to obtain preadmission and daily hospital clinical data including respiratory rates, daily respiratory rate trends, degree of retractions, oxygen saturation, daily oxygen saturation trends, medical management, and disposition. These data were manually reviewed, and site investigators were queried about missing data and discrepancies. A follow‐up telephone interview was conducted with families 1 week after discharge to examine relapse events at both 24 hours and 7 days.
We used the question: How long ago did the following symptoms [eg, difficulty breathing] begin [for the] current illness? to estimate the onset of the current illness. Pulse was categorized as low, normal, or high based on age‐related heart rate values.[13] Presence of apnea was recorded daily by site investigators.[14]
Nasopharyngeal Aspirate Collection and Virology Testing
As described previously, site teams used a standardized protocol to collect nasopharyngeal aspirates,[11] which were tested for respiratory syncytial virus (RSV) types A and B; rhinovirus (RV); parainfluenza virus types 1, 2, and 3; influenza virus types A and B; 2009 novel H1N1; human metapneumovirus; coronaviruses NL‐63, HKU1, OC43, and 229E; enterovirus, and adenovirus using polymerase chain reaction.[11, 15, 16, 17]
Defining Clinical Improvement and Worsening
Clinical improvement criteria were based on the 2006 AAP guidelines.[9] For respiratory rate and oxygen saturation, clinicians estimated average daily respiratory rate and oxygen saturation based on the recorded readings from the previous 24 hours. This estimation reflects the process clinicians use when rounding on their hospitalized patients, and thus may be more similar to standard clinical practice than a calculated mean. The respiratory rate criteria are adjusted for age.[18, 19] For daily estimated average oxygen saturation we used the AAP criteria of RAO2 saturation of 90%. Considering that oxygen saturation is the main determinant of LOS,[20] healthy infants age <6 months may have transient oxygen saturations of around 80%,[21] and that errors in estimation may occur, we included a lowest RAO2 of 88% in our improvement criteria. By combining the dichotomized estimated oxygen saturation (90% or not) with the lower limit of 88%, there was little room for erroneous conclusions. A child was considered clinically improved on the earliest date he/she met all of the following criteria: (1) none or mild retractions and improved or stable retractions compared with the previous inpatient day; (2) daily estimated average respiratory rate (RR) <60 breaths per minute for age <6 months, <55 breaths/minute for age 6 to 11 months, and <45 breaths/minute for age 12 months with a decreasing or stable trend over the course of the current day; (3) daily estimated average RAO2 saturation 90%, lowest RAO2 saturation 88%[21]; and (4) not receiving intravenous (IV) fluids or for children receiving IV fluids a clinician report of the child maintaining oral hydration. Children who reached the clinical improvement criteria were considered clinically worse if they required intensive care or had the inverse of 1 of the improvement criteria: moderate/severe retractions that were worse compared with the previous inpatient day, daily average RR 60 with an increasing trend over the current day, need for oxygen, or need for IV fluids.
Statistical Analyses
All analyses were performed using Stata 12.0 (StataCorp, College Station, TX). Data are presented as proportions with 95% confidence intervals (95% CIs), means with standard deviations, and medians with interquartile ranges (IQR). To examine potential factors associated with clinical worsening after reaching clinical improvement, we used 2, Fisher exact, Student t test, and Kruskall‐Wallis tests, as appropriate.
Adjusted analyses used generalized linear mixed models with a logit link to identify independent risk factors for worsening after reaching clinical improvement. Fixed effects for patient‐level factors and a random site effect were used. Factors were tested for inclusion in the multivariable model if they were found to be associated with worsening in unadjusted analyses (P<0.20) or were considered clinically important. Results are reported as odds ratios with 95% CIs.
We performed several sensitivity analyses to evaluate these improvement criteria: (1) we excluded the lowest RAO2 saturation requirement of 88%, (2) we examined a 94% daily estimated average RAO2 saturation threshold,[22] (3) we examined a 95% daily estimated average RAO2 saturation threshold,[8] and (4) we examined children age <12 months with no history of wheeze.
RESULTS
There were 1916 children hospitalized with bronchiolitis with data on all factors used to define clinical improvement and clinical worsening. The median number of days from the beginning of difficulty breathing until admission was 2 days (IQR, 15.5 days; range, 18 days) and from the beginning of difficulty breathing until clinical improvement was 4 days (IQR, 37.5 days; range, 133 days) (Figure 1). The variance for days to admission was significantly less than the variance for days to clinical improvement (P<0.001).

In this observational study, clinicians discharged 214 (11%) of the 1916 children before meeting the definition of clinical improvement. Thus, 1702 (89%; 95% CI: 87%‐90%) children reached the clinical improvement criteria, had a LOS >1 day, and had data on all factors (Figure 2).
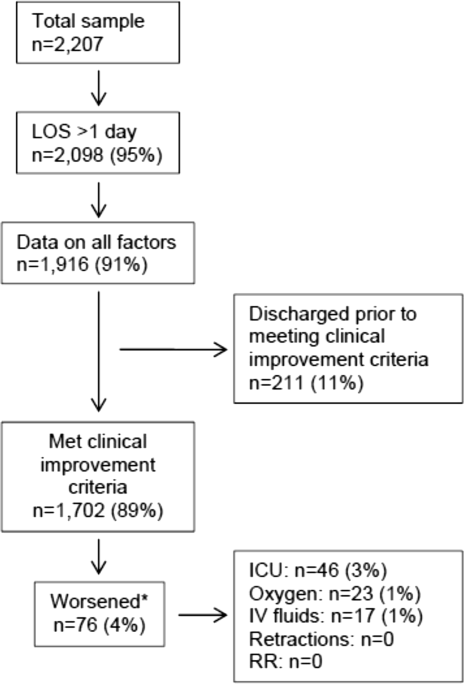
Of the 1702 children who met the clinical improvement criteria, there were 76 children (4%; 95% CI: 3%5%) who worsened (Figure 2). The worsening occurred within a median of 1 day (IQR, 13 days) of clinical improvement. Forty‐six (3%) of the children required transfer to the ICU (1 required intubation, 1 required continuous positive airway pressure, and 4 had apnea), 23 (1%) required oxygen, and 17 (1%) required IV fluids. Eight percent of children met multiple criteria for worsening. A comparison between children who did and did not worsen is shown in Table 1. In general, children who worsened after improvement were younger and born earlier. These children also presented in more severe respiratory distress, had moderate or severe retractions, oxygen saturation <85% at hospitalization, inadequate oral intake, and apnea documented during the hospitalization. Neither viral etiology nor site of care influenced whether the children worsened after improving. However, stratified analysis of children based on initial location of admission (ie, ICU or ward) showed that among the children admitted to the ICU from the emergency department (ED), 89% met the improvement criteria and 19% clinically worsened. In contrast, among children admitted to the ward from the ED, 89% met the improvement criteria, and only 2% clinically worsened. Stratified multivariable models based on the initial location of admission from the ED (ie, ICU or ward) were not possible due to small sample sizes after stratification. None of these children had relapse events requiring rehospitalization within either 24 hours or 7 days of discharge.
| Did Not Worsen, n=1,626 | Worsened, n=76 | P Value | |
|---|---|---|---|
| |||
| Demographic characteristics | |||
| Age <2 months, % | 29 | 57 | <0.001 |
| Month of birth, % | 0.02 | ||
| OctoberMarch | 61 | 75 | |
| AprilSeptember | 39 | 25 | |
| Sex, % | 0.51 | ||
| Male | 59 | 55 | |
| Female | 41 | 45 | |
| Race, % | 0.050 | ||
| White | 63 | 58 | |
| Black | 23 | 34 | |
| Other or missing | 14 | 8 | |
| Hispanic ethnicity, % | 37 | 22 | 0.01 |
| Insurance, % | 0.87 | ||
| Nonprivate | 68 | 67 | |
| Private | 32 | 33 | |
| Medical history | |||
| Gestational age <37 weeks, % | 23 | 39 | 0.002 |
| Birth weight, % | 0.52 | ||
| <5 lbs | 13 | 12 | |
| 5 lbs | 34 | 41 | |
| 7 lbs | 53 | 47 | |
| Mother's age, median (IQR) | 27 (2333) | 27 (2233) | 0.54 |
| Is or was breastfed, % | 61 | 51 | 0.10 |
| Smoked during pregnancy, % | 15 | 20 | 0.22 |
| Exposure to smoke, % | 13 | 20 | 0.11 |
| Family history of asthma, % | 0.89 | ||
| Neither parent | 68 | 64 | |
| Either mother or father | 27 | 30 | |
| Both parents | 4 | 4 | |
| Do not know/missing | 2 | 1 | |
| History of wheezing, % | 23 | 17 | 0.24 |
| History of eczema, % | 16 | 7 | 0.04 |
| History of intubation, % | 9 | 12 | 0.50 |
| Major, relevant, comorbid medical disorder, % | 20 | 24 | 0.46 |
| Current illness | |||
| When difficulty breathing began, preadmission, % | 0.63 | ||
| 1 day | 70 | 75 | |
| <1 day | 28 | 23 | |
| No difficulty preadmission | 2 | 3 | |
| Weight, lbs, median (IQR) | 12.3 (8.817.4) | 9.0 (6.613.2) | 0.001 |
| Temperature, F, median (IQR) | 99.5 (98.6100.6) | 99.4 (98.1100.4) | 0.06 |
| Pulse, beats per minute by age | 0.82 | ||
| Low | 0.3 | 0 | |
| Normal | 48 | 46 | |
| High | 51 | 54 | |
| Respiratory rate, breaths per minute, median (IQR) | 48 (4060) | 48 (3864) | 0.28 |
| Retractions, % | 0.001 | ||
| None | 22 | 25 | |
| Mild | 43 | 24 | |
| Moderate | 26 | 33 | |
| Severe | 4 | 12 | |
| Missing | 5 | 7 | |
| Oxygen saturation by pulse oximetry or ABG, % | 0.001 | ||
| <85 | 4 | 12 | |
| 8587.9 | 3 | 4 | |
| 8889.9 | 5 | 0 | |
| 9093.9 | 18 | 11 | |
| 94 | 72 | 73 | |
| Oral intake, % | <0.001 | ||
| Adequate | 45 | 22 | |
| Inadequate | 42 | 63 | |
| Missing | 13 | 14 | |
| Presence of apnea, % | 7 | 24 | <0.001 |
| RSV‐A, % | 44 | 41 | 0.54 |
| RSV‐B, % | 30 | 25 | 0.36 |
| HRV, % | 24 | 24 | 0.88 |
| Chest x‐ray results during ED/preadmission visit | |||
| Atelectasis | 12 | 13 | 0.77 |
| Infiltrate | 13 | 11 | 0.50 |
| Hyperinflated | 18 | 21 | 0.47 |
| Peribronchial cuffing/thickening | 23 | 17 | 0.32 |
| Normal | 14 | 16 | 0.75 |
| White blood count, median (IQR) | 11.2 (8.714.4) | 11.9 (9.214.4) | 0.60 |
| Platelet count, median (IQR) | 395 (317490) | 430 (299537) | 0.56 |
| Sodium, median (IQR) | 138 (136140) | 137 (135138) | 0.19 |
| Hospital length of stay, median (IQR) | 2 (14) | 4.5 (28) | <0.001 |
| One‐week follow‐up | |||
| Relapse within 24 hours of hospital discharge requiring hospital admission, % | 0.5 | 0 | 0.56 |
| Relapse within 7 days of hospital discharge requiring hospital admission, % | 1 | 0 | 0.35 |
On multivariable analysis (Table 2), independent risk factors for worsening after reaching the clinical improvement criteria were young age, preterm birth, and presenting to care with more severe bronchiolitis represented by severe retractions, inadequate oral intake, or apnea. To further evaluate the improvement criteria in the current analysis, multiple sensitivity analyses were conducted. The frequency of clinical worsening after reaching the improvement criteria was stable when we examined different RA02 criteria in sensitivity analyses: (1) excluding RA02 as a criterion for improvement: 90% met improvement criteria and 4% experienced clinical worsening, (2) changing the average RA02 threshold for clinical improvement to 94%: 62% met improvement criteria and 6% experienced clinical worsening, and (3) changing the average RA02 threshold for clinical improvement to 95%: 47% met improvement criteria and 5% experienced clinical worsening. Furthermore, stratifying by age <2 months and restricting to more stringent definitions of bronchiolitis (ie, age <1 year or age <1 year+no history of wheezing) also did not materially change the results (see Supporting Figure 1 in the online version of this article).
| Odds Ratio | 95% CI | P Value | |
|---|---|---|---|
| |||
| Age <2 months | 3.51 | 2.07‐5.94 | <0.001 |
| Gestational age <37 weeks | 1.94 | 1.13‐3.32 | 0.02 |
| Retractions | |||
| None | 1.30 | 0.80‐3.23 | 0.19 |
| Mild | 1.0 | Reference | |
| Moderate | 1.91 | 0.99‐3.71 | 0.06 |
| Severe | 5.55 | 2.1214.50 | <0.001 |
| Missing | 1.70 | 0.53‐5.42 | 0.37 |
| Oral intake | |||
| Adequate | 1.00 | Reference | |
| Inadequate | 2.54 | 1.39‐4.62 | 0.002 |
| Unknown/missing | 1.88 | 0.79‐4.44 | 0.15 |
| Presence of apnea | 2.87 | 1.45‐5.68 | 0.003 |
We compared the 214 children who were discharged prior to reaching clinical improvement with the 1702 children who reached the clinical improvement criteria. The 214 children were less likely to be age <2 months (22% vs 30%; P=0.02). These 2 groups (214 vs 1702) were similar with respect to severe retractions (2% vs 4%; P=0.13), median respiratory rate (48 vs 48; P=0.42), oxygen saturation <90% (15% vs 11%; P=0.07), inadequate oral intake (50% vs 43%; P=0.13), and rates of relapse events requiring rehospitalization within both 24 hours (0.6% vs 0.6%; P=0.88) and 7 days (1% vs 1%; P=0.90) of discharge.
DISCUSSION
In this large, multicenter, multiyear study of children hospitalized with bronchiolitis, we found that children present to a hospital in a relatively narrow time frame, but their time to recovery in the hospital is highly variable. Nonetheless, 96% of children continued to improve once they had: (1) improving or stable retractions rated as none/mild, (2) a decreasing or stable RR by age, (3) estimated average RAO2 saturation 90% and lowest RAO2 saturation of 88%, and (4) were hydrated. The 4% of children who worsened after clinically improving were more likely to be age <2 months, born <37 weeks, and present with more severe distress (ie, severe retractions, inadequate oral intake, or apnea). Based on the low risk of worsening after clinical improvement, especially among children admitted to the regular ward (2%), we believe these 4 clinical criteria could be used as discharge criteria for this common pediatric illness with a predominantly monophasic clinical course.
Variability in hospital LOS for children with bronchiolitis exists in the United States[3] and internationally.[4, 5] Cheung and colleagues analyzed administrative data from over 75,000 children admitted for bronchiolitis in England between April 2007 and March 2010 and found sixfold variation in LOS between sites. They concluded that this LOS variability was due in part to providers' clinical decision making.[5] Srivastava and colleagues[23] addressed variable clinician decision making in bronchiolitis and 10 other common pediatric conditions by embedding discharge criteria developed by expert consensus into admission order sets. They found that for children with bronchiolitis, the embedded discharge criteria reduced the median LOS from 1.91 to 1.87 days. In contrast to the single‐center data presented by White and colleagues,[24] the prospective, multicenter MARC‐30 data provide a clear understanding of the normal clinical course for children hospitalized with bronchiolitis, determine if children clinically worsen after clinical improvement, and provide data about discharge criteria for children hospitalized with bronchiolitis. Although there is a lack of rigorous published data, the lower tract symptoms of bronchiolitis (eg, cough, retractions) are said to peak on days 5 to 7 of illness and then gradually resolve.[25] In the present study, we found that the time from the onset of difficulty breathing until hospital admission is less variable than the time from the onset of difficulty breathing until either clinical improvement or discharge. Although 75% of children have clinically improved within 7.5 days of difficulty breathing based on the IQR results, the remaining 25% may have a more prolonged recovery in the hospital of up to 3 weeks. Interestingly, prolonged recovery times from bronchiolitis have also been noted in children presenting to the ED[26] and in an outpatient population.[27] It is unclear why 20% to 25% of children at different levels of severity of illness have prolonged recovery from bronchiolitis, but this group of children requires further investigation.
Given the variability of recovery times, clinicians may have difficulty knowing when a child is ready for hospital discharge. One of the main stumbling blocks for discharge readiness in children with bronchiolitis is the interpretation of the oxygen saturation value.[6, 8, 9, 20, 28] However, it should be considered that interpreting the oxygen saturation in a child who is clinically improving in the hospital setting is different than interpreting the oxygen saturation of a child in the ED or the clinic whose clinical course is less certain.[22] In the hospital setting, using the oxygen saturation value in in the AAP guideline,[9] 4% of children clinically worsened after they met the improvement criteria, a clinical pattern observed previously with supplemental oxygen.[28] This unpredictability may explain some of the variation in providers' clinical decision making.[5] The children who worsened, and therefore deserve more cautious discharge planning, were young (<2 months), premature (<37 weeks gestational age), and presented in more severe distress. Those children admitted to the ICU from the ED worsened more commonly than children admitted to the ward (19% vs 2%). Interestingly, the viral etiology of the child's bronchiolitis did not influence whether a child worsened after reaching the improvement criteria. Therefore, although children with RV bronchiolitis have a shorter hospital LOS than children with RSV bronchiolitis,[11] the pattern of recovery did not differ by viral etiology.
In addition to unsafe discharges, clinicians may be concerned about the possibility of readmissions. Although somewhat controversial, hospital readmission is being used as a quality of care metric.[29, 30, 31] One response to minimize readmissions would be for clinicians to observe children for longer than clinically indicated.[32] However, shorter LOS is not necessarily associated with increased readmission rates.[33] Given that the geometric mean of hospital charges per child with bronchiolitis increased from $6380 in 2000 to $8530 in 2009,[34] the potential for safely reducing hospital LOS by using the discharge criteria proposed in the current study instead of other criteria[8] may net substantial cost savings. Furthermore, reducing LOS would decrease the time children expose others to these respiratory viruses and possibly reduce medical errors.[35]
Our study has some potential limitations. Because the study participants were all hospitalized, these data do not inform admission or discharge decisions from either the ED or the clinic; but other data address those clinical scenarios.[22] Also, the 16 sites that participated in this study were large, urban teaching hospitals. Consequently, these results are not necessarily generalizable to smaller community hospitals. Although numerous data points were required to enter the analytic cohort, only 9% of the sample was excluded for missing data. There were 214 children who did not meet our improvement criteria by the time of discharge. Although the inability to include these children in the analysis may be seen as a limitation, this practice variability underscores the need for more data about discharging hospitalized children with bronchiolitis. Last, site teams reviewed medical records daily. More frequent recording of the clinical course would have yielded more granular data, but the current methodology replicates how data are generally presented during patient care rounds, when decisions about suitability for discharge are often considered.
CONCLUSION
We documented in this large multicenter study that most children hospitalized with bronchiolitis had a wide range of time to recovery, but the vast majority continued to improve once they reached the identified clinical criteria that predict a safe discharge to home. The children who worsened after clinical improvement were more likely to be younger, premature infants presenting in more severe distress. Although additional prospective validation of these hospital discharge criteria is warranted, these data may help clinicians make more evidence‐based discharge decisions for a common pediatric illness with high practice variation, both in the United States[3] and in other countries.[4, 5]
Acknowledgements
Collaborators in the MARC‐30 Study: Besh Barcega, MD, Loma Linda University Children's Hospital, Loma Linda, CA; John Cheng, MD, Children's Healthcare of Atlanta at Egleston, Atlanta, GA; Dorothy Damore, MD, New York Presbyterian Hospital‐Cornell, New York, NY; Carlos Delgado, MD, Children's Healthcare of Atlanta at Egleston, Atlanta, GA; Haitham Haddad, MD, Rainbow Babies & Children's Hospital, Cleveland, OH; Paul Hain, MD, Monroe Carell Jr. Children's Hospital at Vanderbilt, Nashville, TN; Frank LoVecchio, DO, Maricopa Medical Center, Phoenix, AZ; Charles Macias, MD MPH, Texas Children's Hospital, Houston, TX; Jonathan Mansbach, MD, MPH, Boston Children's Hospital, Boston, MA; Eugene Mowad, MD, Akron Children's Hospital, Akron, OH; Brian Pate, MD, Children's Mercy Hospital, Kansas City, MO; Mark Riederer, MD, Monroe Carell Jr. Children's Hospital at Vanderbilt, Nashville, TN; M. Jason Sanders, MD, Children's Memorial Hermann Hospital, Houston, TX; Alan R. Schroeder, MD, Santa Clara Valley Medical Center, San Jose, CA; Nikhil Shah, MD, New York Presbyterian Hospital‐Cornell, New York, NY; Michelle Stevenson, MD, MS, Kosair Children's Hospital, Louisville, KY; Erin Stucky Fisher, MD, Rady Children's Hospital, San Diego, CA; Stephen Teach, MD, MPH, Children's National Medical Center, Washington, DC; Lisa Zaoutis, MD, Children's Hospital of Philadelphia, Philadelphia, PA.
Disclosures: This study was supported by grants U01 AI‐67693 and K23 AI‐77801 from the National Institutes of Health (Bethesda, MD). The content of this manuscript is solely the responsibility of the authors and does not necessarily represent the official views of the National Institute of Allergy and Infectious Diseases or the National Institutes of Health. Drs. Mansbach and Piedra have provided consultation to Regeneron Pharmaceuticals. Otherwise, no authors report any potential conflicts of interest, including relevant financial interests, activities, relationships, and affiliations.
- , , , , . Infectious disease hospitalizations among infants in the United States. Pediatrics. 2008;121(2):244–252.
- . “A hospital is no place to be sick” Samuel Goldwyn (1882–1974). Arch Dis Child. 2009;94(8):565–566.
- , , , , , Variation in inpatient diagnostic testing and management of bronchiolitis. Pediatrics. 2005;115(4):878–884.
- , , , International variation in the management of infants hospitalized with respiratory syncytial virus. International RSV Study Group. Eur J Pediatr. 1998;157(3):215–220.
- , , , , . Population variation in admission rates and duration of inpatient stay for bronchiolitis in England. Arch Dis Child. 2013;98(1):57–59.
- , , , . Impact of pulse oximetry and oxygen therapy on length of stay in bronchiolitis hospitalizations. Arch Pediatr Adolesc Med. 2004;158(6):527–530.
- , , . Pulse oximetry in pediatric practice. Pediatrics. 2011;128(4):740–752.
- Scottish Intercollegiate Guidelines Network. Bronchiolitis in children (SIGN 91). In: NHS Quality Improvement Scotland. Edinburgh, Scotland: Scottish Intercollegiate Guidelines Network; 2006.
- , , , et al. Diagnosis and management of bronchiolitis. Pediatrics. 2006;118(4):1774–1793.
- , , , et al. Prospective multicenter study of children with bronchiolitis requiring mechanical ventilation. Pediatrics. 2012;130(3):e492–e500.
- , , , et al. Prospective multicenter study of viral etiology and hospital length of stay in children with severe bronchiolitis. Arch Pediatr Adolesc Med. 2012;166(8):700–706.
- , , , et al. Apnea in children hospitalized with bronchiolitis. Pediatrics. 2013;132(5):e1194–e1201.
- . Evaluation of the cardiovascular system: history and physical evaluation. In: Kliegman RM, Stanton BF, St. Geme JW III, Schor NF, Behrman RF, eds. Nelson Textbook of Pediatrics. Philadelphia, PA: Elsevier Saunders; 2011:1529–1536.
- , , , et al. Apnea in children hospitalized with bronchiolitis. Pediatrics. 2013;132(5):e1194–e1201.
- , , , et al. Respiratory viral infections in patients with chronic, obstructive pulmonary disease. J Infect. 2005;50(4):322–330.
- , , , . Evaluation of real‐time PCR for diagnosis of Bordetella pertussis infection. BMC Infect Dis. 2006;6:62.
- , , , , . Evaluation of three real‐time PCR assays for detection of Mycoplasma pneumoniae in an outbreak investigation. J Clin Microbiol. 2008;46(9):3116–3118.
- , , , et al. Normal ranges of heart rate and respiratory rate in children from birth to 18 years of age: a systematic review of observational studies. Lancet. 2011;377(9770):1011–1018.
- , , , , , . Development of heart and respiratory rate percentile curves for hospitalized children. Pediatrics. 2013;131(4):e1150–e1157.
- , . Effect of oxygen supplementation on length of stay for infants hospitalized with acute viral bronchiolitis. Pediatrics. 2008;121(3):470–475.
- , , , et al. Longitudinal assessment of hemoglobin oxygen saturation in healthy infants during the first 6 months of age. Collaborative Home Infant Monitoring Evaluation (CHIME) Study Group. J Pediatr. 1999;135(5):580–586.
- , , , et al. Prospective multicenter study of bronchiolitis: predicting safe discharges from the emergency department. Pediatrics. 2008;121(4):680–688.
- , , , et al. Delays in discharge in a tertiary care pediatric hospital. J Hosp Med. 2009;4(8):481–485.
- , , , et al. Using quality improvement to optimise paediatric discharge efficiency. BMJ Qual Saf. 2014;23(5):428–436.
- , . Bronchiolitis in infants and children: treatment; outcome; and prevention. In: Torchia M, ed. UpToDate. Alphen aan den Rijn, the Netherlands; Wolters Kluwer Health; 2013.
- , . Duration of illness in infants with bronchiolitis evaluated in the emergency department. Pediatrics. 2010;126(2):285–290.
- , , . Duration of illness in ambulatory children diagnosed with bronchiolitis. Arch Pediatr Adolesc Med. 2000;154(10):997–1000.
- , , , et al. A clinical pathway for bronchiolitis is effective in reducing readmission rates. J Pediatr. 2005;147(5):622–626.
- , , , et al. Measuring hospital quality using pediatric readmission and revisit rates. Pediatrics. 2013;132(3):429–436.
- , , , et al. Pediatric readmission prevalence and variability across hospitals. JAMA. 2013;309(4):372–380.
- , , , , , . Preventability of early readmissions at a children's hospital. Pediatrics. 2013;131(1):e171–e181.
- , . Hospital readmission: quality indicator or statistical inevitability? Pediatrics. 2013;132(3):569–570.
- , , , et al. Children's hospitals with shorter lengths of stay do not have higher readmission rates. J Pediatr. 2013;163(4):1034–1038.e1.
- , , , , . Trends in bronchiolitis hospitalizations in the United States, 2000–2009. Pediatrics. 2013;132(1):28–36.
- , , , . Preventable adverse events in infants hospitalized with bronchiolitis. Pediatrics. 2005;116(3):603–608.
Although bronchiolitis is the leading cause of hospitalization for US infants,[1] there is a lack of basic prospective data about the expected inpatient clinical course and ongoing uncertainty about when a hospitalized child is ready for discharge to home.[2] This lack of data about children's readiness for discharge may result in variable hospital length‐of‐stay (LOS).[3, 4, 5]
One specific source of variability in discharge readiness and LOS variability may be the lack of consensus about safe threshold oxygen saturation values for discharge in children hospitalized with bronchiolitis.[6, 7] In 2006, the Scottish Intercollegiate Guidelines Network recommended a discharge room air oxygen (RAO2) saturation threshold of 95%.[8] The same year, the American Academy of Pediatrics (AAP) bronchiolitis clinical practice guideline stated that oxygen is not needed for children with RAO2 saturations 90% who are feeding well and have minimal respiratory distress.[9] There is a need for prospective studies to help clinicians make evidenced‐based discharge decisions for this common condition.
We performed a prospective, multicenter, multiyear study[10, 11, 12] to examine the typical inpatient clinical course of and to develop hospital discharge guidelines for children age <2 years hospitalized with bronchiolitis. We hypothesized that children would not worsen clinically and would be safe to discharge home once their respiratory status improved and they were able to remain hydrated.
METHODS
Study Design and Population
We conducted a prospective, multicenter cohort study for 3 consecutive years during the 2007 to 2010 winter seasons, as part of the Multicenter Airway Research Collaboration (MARC), a program of the Emergency Medicine Network (
All patients were treated at the discretion of the treating physician. Inclusion criteria were an attending physician's diagnosis of bronchiolitis, age <2 years, and the ability of the parent/guardian to give informed consent. The exclusion criteria were previous enrollment and transfer to a participating hospital >48 hours after the original admission time. Therefore, children with comorbid conditions were included in this study. All consent and data forms were translated into Spanish. The institutional review board at each of the 16 participating hospitals approved the study.
Of the 2207 enrolled children, we excluded 109 (5%) children with a hospital LOS <1 day due to inadequate time to capture the required data for the present analysis. Among the 2098 remaining children, 1916 (91%) had daily inpatient data on all factors used to define clinical improvement and clinical worsening. Thus, the analytic cohort was comprised of 1916 children hospitalized for bronchiolitis.
Data Collection
Investigators conducted detailed structured interviews. Chart reviews were conducted to obtain preadmission and daily hospital clinical data including respiratory rates, daily respiratory rate trends, degree of retractions, oxygen saturation, daily oxygen saturation trends, medical management, and disposition. These data were manually reviewed, and site investigators were queried about missing data and discrepancies. A follow‐up telephone interview was conducted with families 1 week after discharge to examine relapse events at both 24 hours and 7 days.
We used the question: How long ago did the following symptoms [eg, difficulty breathing] begin [for the] current illness? to estimate the onset of the current illness. Pulse was categorized as low, normal, or high based on age‐related heart rate values.[13] Presence of apnea was recorded daily by site investigators.[14]
Nasopharyngeal Aspirate Collection and Virology Testing
As described previously, site teams used a standardized protocol to collect nasopharyngeal aspirates,[11] which were tested for respiratory syncytial virus (RSV) types A and B; rhinovirus (RV); parainfluenza virus types 1, 2, and 3; influenza virus types A and B; 2009 novel H1N1; human metapneumovirus; coronaviruses NL‐63, HKU1, OC43, and 229E; enterovirus, and adenovirus using polymerase chain reaction.[11, 15, 16, 17]
Defining Clinical Improvement and Worsening
Clinical improvement criteria were based on the 2006 AAP guidelines.[9] For respiratory rate and oxygen saturation, clinicians estimated average daily respiratory rate and oxygen saturation based on the recorded readings from the previous 24 hours. This estimation reflects the process clinicians use when rounding on their hospitalized patients, and thus may be more similar to standard clinical practice than a calculated mean. The respiratory rate criteria are adjusted for age.[18, 19] For daily estimated average oxygen saturation we used the AAP criteria of RAO2 saturation of 90%. Considering that oxygen saturation is the main determinant of LOS,[20] healthy infants age <6 months may have transient oxygen saturations of around 80%,[21] and that errors in estimation may occur, we included a lowest RAO2 of 88% in our improvement criteria. By combining the dichotomized estimated oxygen saturation (90% or not) with the lower limit of 88%, there was little room for erroneous conclusions. A child was considered clinically improved on the earliest date he/she met all of the following criteria: (1) none or mild retractions and improved or stable retractions compared with the previous inpatient day; (2) daily estimated average respiratory rate (RR) <60 breaths per minute for age <6 months, <55 breaths/minute for age 6 to 11 months, and <45 breaths/minute for age 12 months with a decreasing or stable trend over the course of the current day; (3) daily estimated average RAO2 saturation 90%, lowest RAO2 saturation 88%[21]; and (4) not receiving intravenous (IV) fluids or for children receiving IV fluids a clinician report of the child maintaining oral hydration. Children who reached the clinical improvement criteria were considered clinically worse if they required intensive care or had the inverse of 1 of the improvement criteria: moderate/severe retractions that were worse compared with the previous inpatient day, daily average RR 60 with an increasing trend over the current day, need for oxygen, or need for IV fluids.
Statistical Analyses
All analyses were performed using Stata 12.0 (StataCorp, College Station, TX). Data are presented as proportions with 95% confidence intervals (95% CIs), means with standard deviations, and medians with interquartile ranges (IQR). To examine potential factors associated with clinical worsening after reaching clinical improvement, we used 2, Fisher exact, Student t test, and Kruskall‐Wallis tests, as appropriate.
Adjusted analyses used generalized linear mixed models with a logit link to identify independent risk factors for worsening after reaching clinical improvement. Fixed effects for patient‐level factors and a random site effect were used. Factors were tested for inclusion in the multivariable model if they were found to be associated with worsening in unadjusted analyses (P<0.20) or were considered clinically important. Results are reported as odds ratios with 95% CIs.
We performed several sensitivity analyses to evaluate these improvement criteria: (1) we excluded the lowest RAO2 saturation requirement of 88%, (2) we examined a 94% daily estimated average RAO2 saturation threshold,[22] (3) we examined a 95% daily estimated average RAO2 saturation threshold,[8] and (4) we examined children age <12 months with no history of wheeze.
RESULTS
There were 1916 children hospitalized with bronchiolitis with data on all factors used to define clinical improvement and clinical worsening. The median number of days from the beginning of difficulty breathing until admission was 2 days (IQR, 15.5 days; range, 18 days) and from the beginning of difficulty breathing until clinical improvement was 4 days (IQR, 37.5 days; range, 133 days) (Figure 1). The variance for days to admission was significantly less than the variance for days to clinical improvement (P<0.001).
In this observational study, clinicians discharged 214 (11%) of the 1916 children before meeting the definition of clinical improvement. Thus, 1702 (89%; 95% CI: 87%‐90%) children reached the clinical improvement criteria, had a LOS >1 day, and had data on all factors (Figure 2).
Of the 1702 children who met the clinical improvement criteria, there were 76 children (4%; 95% CI: 3%5%) who worsened (Figure 2). The worsening occurred within a median of 1 day (IQR, 13 days) of clinical improvement. Forty‐six (3%) of the children required transfer to the ICU (1 required intubation, 1 required continuous positive airway pressure, and 4 had apnea), 23 (1%) required oxygen, and 17 (1%) required IV fluids. Eight percent of children met multiple criteria for worsening. A comparison between children who did and did not worsen is shown in Table 1. In general, children who worsened after improvement were younger and born earlier. These children also presented in more severe respiratory distress, had moderate or severe retractions, oxygen saturation <85% at hospitalization, inadequate oral intake, and apnea documented during the hospitalization. Neither viral etiology nor site of care influenced whether the children worsened after improving. However, stratified analysis of children based on initial location of admission (ie, ICU or ward) showed that among the children admitted to the ICU from the emergency department (ED), 89% met the improvement criteria and 19% clinically worsened. In contrast, among children admitted to the ward from the ED, 89% met the improvement criteria, and only 2% clinically worsened. Stratified multivariable models based on the initial location of admission from the ED (ie, ICU or ward) were not possible due to small sample sizes after stratification. None of these children had relapse events requiring rehospitalization within either 24 hours or 7 days of discharge.
| Did Not Worsen, n=1,626 | Worsened, n=76 | P Value | |
|---|---|---|---|
| |||
| Demographic characteristics | |||
| Age <2 months, % | 29 | 57 | <0.001 |
| Month of birth, % | 0.02 | ||
| OctoberMarch | 61 | 75 | |
| AprilSeptember | 39 | 25 | |
| Sex, % | 0.51 | ||
| Male | 59 | 55 | |
| Female | 41 | 45 | |
| Race, % | 0.050 | ||
| White | 63 | 58 | |
| Black | 23 | 34 | |
| Other or missing | 14 | 8 | |
| Hispanic ethnicity, % | 37 | 22 | 0.01 |
| Insurance, % | 0.87 | ||
| Nonprivate | 68 | 67 | |
| Private | 32 | 33 | |
| Medical history | |||
| Gestational age <37 weeks, % | 23 | 39 | 0.002 |
| Birth weight, % | 0.52 | ||
| <5 lbs | 13 | 12 | |
| 5 lbs | 34 | 41 | |
| 7 lbs | 53 | 47 | |
| Mother's age, median (IQR) | 27 (2333) | 27 (2233) | 0.54 |
| Is or was breastfed, % | 61 | 51 | 0.10 |
| Smoked during pregnancy, % | 15 | 20 | 0.22 |
| Exposure to smoke, % | 13 | 20 | 0.11 |
| Family history of asthma, % | 0.89 | ||
| Neither parent | 68 | 64 | |
| Either mother or father | 27 | 30 | |
| Both parents | 4 | 4 | |
| Do not know/missing | 2 | 1 | |
| History of wheezing, % | 23 | 17 | 0.24 |
| History of eczema, % | 16 | 7 | 0.04 |
| History of intubation, % | 9 | 12 | 0.50 |
| Major, relevant, comorbid medical disorder, % | 20 | 24 | 0.46 |
| Current illness | |||
| When difficulty breathing began, preadmission, % | 0.63 | ||
| 1 day | 70 | 75 | |
| <1 day | 28 | 23 | |
| No difficulty preadmission | 2 | 3 | |
| Weight, lbs, median (IQR) | 12.3 (8.817.4) | 9.0 (6.613.2) | 0.001 |
| Temperature, F, median (IQR) | 99.5 (98.6100.6) | 99.4 (98.1100.4) | 0.06 |
| Pulse, beats per minute by age | 0.82 | ||
| Low | 0.3 | 0 | |
| Normal | 48 | 46 | |
| High | 51 | 54 | |
| Respiratory rate, breaths per minute, median (IQR) | 48 (4060) | 48 (3864) | 0.28 |
| Retractions, % | 0.001 | ||
| None | 22 | 25 | |
| Mild | 43 | 24 | |
| Moderate | 26 | 33 | |
| Severe | 4 | 12 | |
| Missing | 5 | 7 | |
| Oxygen saturation by pulse oximetry or ABG, % | 0.001 | ||
| <85 | 4 | 12 | |
| 8587.9 | 3 | 4 | |
| 8889.9 | 5 | 0 | |
| 9093.9 | 18 | 11 | |
| 94 | 72 | 73 | |
| Oral intake, % | <0.001 | ||
| Adequate | 45 | 22 | |
| Inadequate | 42 | 63 | |
| Missing | 13 | 14 | |
| Presence of apnea, % | 7 | 24 | <0.001 |
| RSV‐A, % | 44 | 41 | 0.54 |
| RSV‐B, % | 30 | 25 | 0.36 |
| HRV, % | 24 | 24 | 0.88 |
| Chest x‐ray results during ED/preadmission visit | |||
| Atelectasis | 12 | 13 | 0.77 |
| Infiltrate | 13 | 11 | 0.50 |
| Hyperinflated | 18 | 21 | 0.47 |
| Peribronchial cuffing/thickening | 23 | 17 | 0.32 |
| Normal | 14 | 16 | 0.75 |
| White blood count, median (IQR) | 11.2 (8.714.4) | 11.9 (9.214.4) | 0.60 |
| Platelet count, median (IQR) | 395 (317490) | 430 (299537) | 0.56 |
| Sodium, median (IQR) | 138 (136140) | 137 (135138) | 0.19 |
| Hospital length of stay, median (IQR) | 2 (14) | 4.5 (28) | <0.001 |
| One‐week follow‐up | |||
| Relapse within 24 hours of hospital discharge requiring hospital admission, % | 0.5 | 0 | 0.56 |
| Relapse within 7 days of hospital discharge requiring hospital admission, % | 1 | 0 | 0.35 |
On multivariable analysis (Table 2), independent risk factors for worsening after reaching the clinical improvement criteria were young age, preterm birth, and presenting to care with more severe bronchiolitis represented by severe retractions, inadequate oral intake, or apnea. To further evaluate the improvement criteria in the current analysis, multiple sensitivity analyses were conducted. The frequency of clinical worsening after reaching the improvement criteria was stable when we examined different RA02 criteria in sensitivity analyses: (1) excluding RA02 as a criterion for improvement: 90% met improvement criteria and 4% experienced clinical worsening, (2) changing the average RA02 threshold for clinical improvement to 94%: 62% met improvement criteria and 6% experienced clinical worsening, and (3) changing the average RA02 threshold for clinical improvement to 95%: 47% met improvement criteria and 5% experienced clinical worsening. Furthermore, stratifying by age <2 months and restricting to more stringent definitions of bronchiolitis (ie, age <1 year or age <1 year+no history of wheezing) also did not materially change the results (see Supporting Figure 1 in the online version of this article).
| Odds Ratio | 95% CI | P Value | |
|---|---|---|---|
| |||
| Age <2 months | 3.51 | 2.07‐5.94 | <0.001 |
| Gestational age <37 weeks | 1.94 | 1.13‐3.32 | 0.02 |
| Retractions | |||
| None | 1.30 | 0.80‐3.23 | 0.19 |
| Mild | 1.0 | Reference | |
| Moderate | 1.91 | 0.99‐3.71 | 0.06 |
| Severe | 5.55 | 2.1214.50 | <0.001 |
| Missing | 1.70 | 0.53‐5.42 | 0.37 |
| Oral intake | |||
| Adequate | 1.00 | Reference | |
| Inadequate | 2.54 | 1.39‐4.62 | 0.002 |
| Unknown/missing | 1.88 | 0.79‐4.44 | 0.15 |
| Presence of apnea | 2.87 | 1.45‐5.68 | 0.003 |
We compared the 214 children who were discharged prior to reaching clinical improvement with the 1702 children who reached the clinical improvement criteria. The 214 children were less likely to be age <2 months (22% vs 30%; P=0.02). These 2 groups (214 vs 1702) were similar with respect to severe retractions (2% vs 4%; P=0.13), median respiratory rate (48 vs 48; P=0.42), oxygen saturation <90% (15% vs 11%; P=0.07), inadequate oral intake (50% vs 43%; P=0.13), and rates of relapse events requiring rehospitalization within both 24 hours (0.6% vs 0.6%; P=0.88) and 7 days (1% vs 1%; P=0.90) of discharge.
DISCUSSION
In this large, multicenter, multiyear study of children hospitalized with bronchiolitis, we found that children present to a hospital in a relatively narrow time frame, but their time to recovery in the hospital is highly variable. Nonetheless, 96% of children continued to improve once they had: (1) improving or stable retractions rated as none/mild, (2) a decreasing or stable RR by age, (3) estimated average RAO2 saturation 90% and lowest RAO2 saturation of 88%, and (4) were hydrated. The 4% of children who worsened after clinically improving were more likely to be age <2 months, born <37 weeks, and present with more severe distress (ie, severe retractions, inadequate oral intake, or apnea). Based on the low risk of worsening after clinical improvement, especially among children admitted to the regular ward (2%), we believe these 4 clinical criteria could be used as discharge criteria for this common pediatric illness with a predominantly monophasic clinical course.
Variability in hospital LOS for children with bronchiolitis exists in the United States[3] and internationally.[4, 5] Cheung and colleagues analyzed administrative data from over 75,000 children admitted for bronchiolitis in England between April 2007 and March 2010 and found sixfold variation in LOS between sites. They concluded that this LOS variability was due in part to providers' clinical decision making.[5] Srivastava and colleagues[23] addressed variable clinician decision making in bronchiolitis and 10 other common pediatric conditions by embedding discharge criteria developed by expert consensus into admission order sets. They found that for children with bronchiolitis, the embedded discharge criteria reduced the median LOS from 1.91 to 1.87 days. In contrast to the single‐center data presented by White and colleagues,[24] the prospective, multicenter MARC‐30 data provide a clear understanding of the normal clinical course for children hospitalized with bronchiolitis, determine if children clinically worsen after clinical improvement, and provide data about discharge criteria for children hospitalized with bronchiolitis. Although there is a lack of rigorous published data, the lower tract symptoms of bronchiolitis (eg, cough, retractions) are said to peak on days 5 to 7 of illness and then gradually resolve.[25] In the present study, we found that the time from the onset of difficulty breathing until hospital admission is less variable than the time from the onset of difficulty breathing until either clinical improvement or discharge. Although 75% of children have clinically improved within 7.5 days of difficulty breathing based on the IQR results, the remaining 25% may have a more prolonged recovery in the hospital of up to 3 weeks. Interestingly, prolonged recovery times from bronchiolitis have also been noted in children presenting to the ED[26] and in an outpatient population.[27] It is unclear why 20% to 25% of children at different levels of severity of illness have prolonged recovery from bronchiolitis, but this group of children requires further investigation.
Given the variability of recovery times, clinicians may have difficulty knowing when a child is ready for hospital discharge. One of the main stumbling blocks for discharge readiness in children with bronchiolitis is the interpretation of the oxygen saturation value.[6, 8, 9, 20, 28] However, it should be considered that interpreting the oxygen saturation in a child who is clinically improving in the hospital setting is different than interpreting the oxygen saturation of a child in the ED or the clinic whose clinical course is less certain.[22] In the hospital setting, using the oxygen saturation value in in the AAP guideline,[9] 4% of children clinically worsened after they met the improvement criteria, a clinical pattern observed previously with supplemental oxygen.[28] This unpredictability may explain some of the variation in providers' clinical decision making.[5] The children who worsened, and therefore deserve more cautious discharge planning, were young (<2 months), premature (<37 weeks gestational age), and presented in more severe distress. Those children admitted to the ICU from the ED worsened more commonly than children admitted to the ward (19% vs 2%). Interestingly, the viral etiology of the child's bronchiolitis did not influence whether a child worsened after reaching the improvement criteria. Therefore, although children with RV bronchiolitis have a shorter hospital LOS than children with RSV bronchiolitis,[11] the pattern of recovery did not differ by viral etiology.
In addition to unsafe discharges, clinicians may be concerned about the possibility of readmissions. Although somewhat controversial, hospital readmission is being used as a quality of care metric.[29, 30, 31] One response to minimize readmissions would be for clinicians to observe children for longer than clinically indicated.[32] However, shorter LOS is not necessarily associated with increased readmission rates.[33] Given that the geometric mean of hospital charges per child with bronchiolitis increased from $6380 in 2000 to $8530 in 2009,[34] the potential for safely reducing hospital LOS by using the discharge criteria proposed in the current study instead of other criteria[8] may net substantial cost savings. Furthermore, reducing LOS would decrease the time children expose others to these respiratory viruses and possibly reduce medical errors.[35]
Our study has some potential limitations. Because the study participants were all hospitalized, these data do not inform admission or discharge decisions from either the ED or the clinic; but other data address those clinical scenarios.[22] Also, the 16 sites that participated in this study were large, urban teaching hospitals. Consequently, these results are not necessarily generalizable to smaller community hospitals. Although numerous data points were required to enter the analytic cohort, only 9% of the sample was excluded for missing data. There were 214 children who did not meet our improvement criteria by the time of discharge. Although the inability to include these children in the analysis may be seen as a limitation, this practice variability underscores the need for more data about discharging hospitalized children with bronchiolitis. Last, site teams reviewed medical records daily. More frequent recording of the clinical course would have yielded more granular data, but the current methodology replicates how data are generally presented during patient care rounds, when decisions about suitability for discharge are often considered.
CONCLUSION
We documented in this large multicenter study that most children hospitalized with bronchiolitis had a wide range of time to recovery, but the vast majority continued to improve once they reached the identified clinical criteria that predict a safe discharge to home. The children who worsened after clinical improvement were more likely to be younger, premature infants presenting in more severe distress. Although additional prospective validation of these hospital discharge criteria is warranted, these data may help clinicians make more evidence‐based discharge decisions for a common pediatric illness with high practice variation, both in the United States[3] and in other countries.[4, 5]
Acknowledgements
Collaborators in the MARC‐30 Study: Besh Barcega, MD, Loma Linda University Children's Hospital, Loma Linda, CA; John Cheng, MD, Children's Healthcare of Atlanta at Egleston, Atlanta, GA; Dorothy Damore, MD, New York Presbyterian Hospital‐Cornell, New York, NY; Carlos Delgado, MD, Children's Healthcare of Atlanta at Egleston, Atlanta, GA; Haitham Haddad, MD, Rainbow Babies & Children's Hospital, Cleveland, OH; Paul Hain, MD, Monroe Carell Jr. Children's Hospital at Vanderbilt, Nashville, TN; Frank LoVecchio, DO, Maricopa Medical Center, Phoenix, AZ; Charles Macias, MD MPH, Texas Children's Hospital, Houston, TX; Jonathan Mansbach, MD, MPH, Boston Children's Hospital, Boston, MA; Eugene Mowad, MD, Akron Children's Hospital, Akron, OH; Brian Pate, MD, Children's Mercy Hospital, Kansas City, MO; Mark Riederer, MD, Monroe Carell Jr. Children's Hospital at Vanderbilt, Nashville, TN; M. Jason Sanders, MD, Children's Memorial Hermann Hospital, Houston, TX; Alan R. Schroeder, MD, Santa Clara Valley Medical Center, San Jose, CA; Nikhil Shah, MD, New York Presbyterian Hospital‐Cornell, New York, NY; Michelle Stevenson, MD, MS, Kosair Children's Hospital, Louisville, KY; Erin Stucky Fisher, MD, Rady Children's Hospital, San Diego, CA; Stephen Teach, MD, MPH, Children's National Medical Center, Washington, DC; Lisa Zaoutis, MD, Children's Hospital of Philadelphia, Philadelphia, PA.
Disclosures: This study was supported by grants U01 AI‐67693 and K23 AI‐77801 from the National Institutes of Health (Bethesda, MD). The content of this manuscript is solely the responsibility of the authors and does not necessarily represent the official views of the National Institute of Allergy and Infectious Diseases or the National Institutes of Health. Drs. Mansbach and Piedra have provided consultation to Regeneron Pharmaceuticals. Otherwise, no authors report any potential conflicts of interest, including relevant financial interests, activities, relationships, and affiliations.
- , , , , . Infectious disease hospitalizations among infants in the United States. Pediatrics. 2008;121(2):244–252.
- . “A hospital is no place to be sick” Samuel Goldwyn (1882–1974). Arch Dis Child. 2009;94(8):565–566.
- , , , , , Variation in inpatient diagnostic testing and management of bronchiolitis. Pediatrics. 2005;115(4):878–884.
- , , , International variation in the management of infants hospitalized with respiratory syncytial virus. International RSV Study Group. Eur J Pediatr. 1998;157(3):215–220.
- , , , , . Population variation in admission rates and duration of inpatient stay for bronchiolitis in England. Arch Dis Child. 2013;98(1):57–59.
- , , , . Impact of pulse oximetry and oxygen therapy on length of stay in bronchiolitis hospitalizations. Arch Pediatr Adolesc Med. 2004;158(6):527–530.
- , , . Pulse oximetry in pediatric practice. Pediatrics. 2011;128(4):740–752.
- Scottish Intercollegiate Guidelines Network. Bronchiolitis in children (SIGN 91). In: NHS Quality Improvement Scotland. Edinburgh, Scotland: Scottish Intercollegiate Guidelines Network; 2006.
- , , , et al. Diagnosis and management of bronchiolitis. Pediatrics. 2006;118(4):1774–1793.
- , , , et al. Prospective multicenter study of children with bronchiolitis requiring mechanical ventilation. Pediatrics. 2012;130(3):e492–e500.
- , , , et al. Prospective multicenter study of viral etiology and hospital length of stay in children with severe bronchiolitis. Arch Pediatr Adolesc Med. 2012;166(8):700–706.
- , , , et al. Apnea in children hospitalized with bronchiolitis. Pediatrics. 2013;132(5):e1194–e1201.
- . Evaluation of the cardiovascular system: history and physical evaluation. In: Kliegman RM, Stanton BF, St. Geme JW III, Schor NF, Behrman RF, eds. Nelson Textbook of Pediatrics. Philadelphia, PA: Elsevier Saunders; 2011:1529–1536.
- , , , et al. Apnea in children hospitalized with bronchiolitis. Pediatrics. 2013;132(5):e1194–e1201.
- , , , et al. Respiratory viral infections in patients with chronic, obstructive pulmonary disease. J Infect. 2005;50(4):322–330.
- , , , . Evaluation of real‐time PCR for diagnosis of Bordetella pertussis infection. BMC Infect Dis. 2006;6:62.
- , , , , . Evaluation of three real‐time PCR assays for detection of Mycoplasma pneumoniae in an outbreak investigation. J Clin Microbiol. 2008;46(9):3116–3118.
- , , , et al. Normal ranges of heart rate and respiratory rate in children from birth to 18 years of age: a systematic review of observational studies. Lancet. 2011;377(9770):1011–1018.
- , , , , , . Development of heart and respiratory rate percentile curves for hospitalized children. Pediatrics. 2013;131(4):e1150–e1157.
- , . Effect of oxygen supplementation on length of stay for infants hospitalized with acute viral bronchiolitis. Pediatrics. 2008;121(3):470–475.
- , , , et al. Longitudinal assessment of hemoglobin oxygen saturation in healthy infants during the first 6 months of age. Collaborative Home Infant Monitoring Evaluation (CHIME) Study Group. J Pediatr. 1999;135(5):580–586.
- , , , et al. Prospective multicenter study of bronchiolitis: predicting safe discharges from the emergency department. Pediatrics. 2008;121(4):680–688.
- , , , et al. Delays in discharge in a tertiary care pediatric hospital. J Hosp Med. 2009;4(8):481–485.
- , , , et al. Using quality improvement to optimise paediatric discharge efficiency. BMJ Qual Saf. 2014;23(5):428–436.
- , . Bronchiolitis in infants and children: treatment; outcome; and prevention. In: Torchia M, ed. UpToDate. Alphen aan den Rijn, the Netherlands; Wolters Kluwer Health; 2013.
- , . Duration of illness in infants with bronchiolitis evaluated in the emergency department. Pediatrics. 2010;126(2):285–290.
- , , . Duration of illness in ambulatory children diagnosed with bronchiolitis. Arch Pediatr Adolesc Med. 2000;154(10):997–1000.
- , , , et al. A clinical pathway for bronchiolitis is effective in reducing readmission rates. J Pediatr. 2005;147(5):622–626.
- , , , et al. Measuring hospital quality using pediatric readmission and revisit rates. Pediatrics. 2013;132(3):429–436.
- , , , et al. Pediatric readmission prevalence and variability across hospitals. JAMA. 2013;309(4):372–380.
- , , , , , . Preventability of early readmissions at a children's hospital. Pediatrics. 2013;131(1):e171–e181.
- , . Hospital readmission: quality indicator or statistical inevitability? Pediatrics. 2013;132(3):569–570.
- , , , et al. Children's hospitals with shorter lengths of stay do not have higher readmission rates. J Pediatr. 2013;163(4):1034–1038.e1.
- , , , , . Trends in bronchiolitis hospitalizations in the United States, 2000–2009. Pediatrics. 2013;132(1):28–36.
- , , , . Preventable adverse events in infants hospitalized with bronchiolitis. Pediatrics. 2005;116(3):603–608.
© 2015 Society of Hospital Medicine
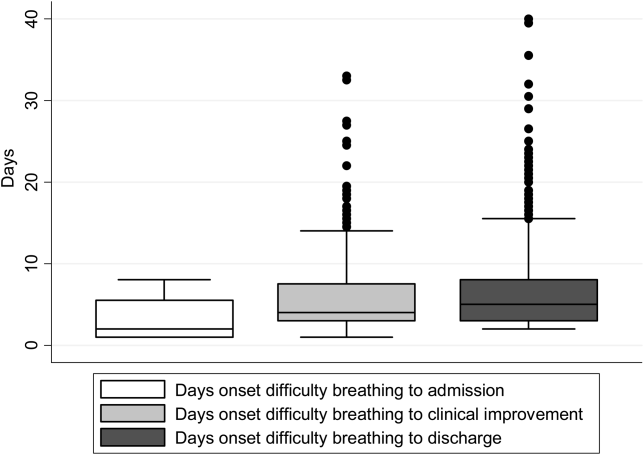
Interobserver Agreement Using Computed Tomography to Assess Radiographic Fusion Criteria With a Unique Titanium Interbody Device
The accuracy of using computed tomography (CT) to assess lumbar interbody fusion with titanium implants has been questioned in the past.1-4 Reports have most often focused on older technologies using paired, threaded, smooth-surface titanium devices. Some authors have reported they could not confidently assess the quality of fusions using CT because of implant artifact.1-3
When pseudarthrosis is suspected clinically, and imaging results are inconclusive, surgical explorations may be performed with mechanical stressing of the segment to assess for motion.2,5-7 However, surgical exploration not only has the morbidity of another surgery but may not be conclusive. Direct exploration of an interbody fusion is problematic. In some cases, there may be residual normal springing motion through posterior elements, even in the presence of a solid interbody fusion, which can be confusing.5 Radiologic confirmation of fusion status is therefore preferred over surgical exploration. CT is the imaging modality used most often to assess spinal fusions.8,9
A new titanium interbody fusion implant (Endoskeleton TA; Titan Spine, Mequon, Wisconsin) preserves the endplate and has an acid-etched titanium surface for osseous integration and a wide central aperture for bone graft (Figure 1). Compared with earlier titanium implants, this design may allow for more accurate CT imaging and fusion assessment. We conducted a study to determine the interobserver reliability of using CT to evaluate bone formation and other radiographic variables with this new titanium interbody device.
Materials and Methods
After receiving institutional review board approval for this study, as well as patient consent, we obtained and analyzed CT scans of patients after they had undergone anterior lumbar interbody fusion (ALIF) at L3–S1 as part of a separate clinical outcomes study.
Each patient received an Endoskeleton TA implant. The fusion cage was packed with 2 sponges (3.0 mg per fusion level) of bone morphogenetic protein, or BMP (InFuse; Medtronic, Minneapolis, Minnesota). In addition, 1 to 3 cm3 of hydroxyapatite/β-tricalcium phosphate (MasterGraft, Medtronic) collagen sponge was used as graft extender to fill any remaining gaps within the cage. Pedicle screw fixation was used in all cases.
Patients were randomly assigned to have fine-cut CT scans with reconstructed images at 6, 9, or 12 months. The scans were reviewed by 2 independent radiologists who were blinded to each other’s interpretations and the clinical results. The radiographic fusion criteria are listed in Tables 1 to 3. Interobserver agreement (κ) was calculated separately for each radiographic criterion and could range from 0.00 (no agreement) to 1.00 (perfect agreement).10,11
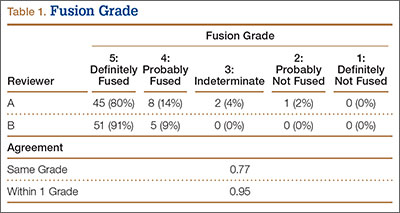
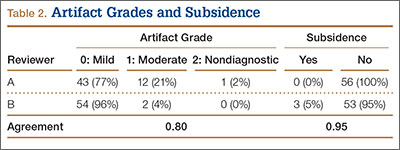
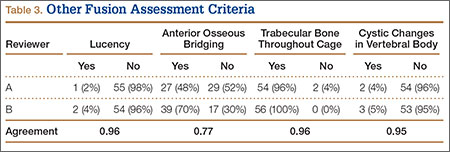
Results
The study involved 33 patients (17 men, 16 women) with 56 lumbar spinal fusion levels. Mean age was 46 years (range, 23-66 years). Six patients (18%) were nicotine users. Seventeen patients were scanned at 6 months, 9 at 9 months, and 7 at 12 months. There were no significant differences in results between men and women, between nicotine users and nonusers, or among patients evaluated at 6, 9, or 12 months.
The radiologists agreed on 345 of the 392 data points reviewed (κ = 0.88). Interobserver agreement results for the fusion criteria are listed in Tables 1 and 3. Interobserver agreement was 0.77 for overall fusion grade, with the radiologists noting definite fusion (grade 5) in 80% and 91% of the levels (Table 1). Other radiographic criteria are listed in Tables 2 and 3. Interobserver agreement was 0.80 for degree of artifact, 0.95 for subsidence, 0.96 for both lucency and trabecular bone, 0.77 for anterior osseous bridging, and 0.95 for cystic vertebral changes.
Discussion
Radiographic analysis of interbody fusions is an important clinical issue. Investigators have shown that CT is the radiographic method of choice for assessing fusion.8,9 Others have reported that assessing fusion with metallic interbody implants is more difficult compared with PEEK (polyether ether ketone) or allograft bone.3,4,5,12
Heithoff and colleagues1,2 reported on difficulties they encountered in assessing interbody fusion with titanium implants, and their research has often been cited. The authors concluded that they could not accurately assess fusion in these cases because of artifact from the small apertures in the cages and metallic scatter. Their study was very small (8 patients, 12 surgical levels) and used paired BAK (Bagby and Kuslich) cages (Zimmer, Warsaw, Indiana).
Recently, a unique surface technology, used to manufacture osseointegrative dental implants, has been adapted for use in the spine.13-15 Acid etching modifies the surface of titanium to create a nano-scale (micron-level) alteration. Compared with PEEK and smooth titanium, acid-etched titanium stimulates a better osteogenic environment.16,17 As this technology is now used clinically in spinal surgery, we thought it important to revisit the issue of CT analysis for fusion assessment with the newer titanium implants.
Artifact
The results of our study support the idea that the design of a titanium interbody fusion implant is important to radiographic analysis. The implant studied has a large open central aperture that appears to generate less artifact than historical controls (paired cylindrical cages) have.1-4 Other investigators have reported fewer problems with artifact in their studies of implants incorporating larger openings for bone graft.6,18 The radiologists in the present study found no significant problems with artifact. Less artifact is clinically important, as the remaining fusion variables can be more clearly visualized (Table 2, Figure 2).

Anterior Osseous Bridging, Subsidence, Lysis
In this study, the bony endplates were preserved. The disc and endplate cartilage was removed without reaming or drilling. Endplate reaming most likely contributes to subsidence and loss of original fixation between implant and bone interface.1,4,12 Some authors have advocated recessing the cages deeply and then packing bone anteriorly to create a “sentinel fusion sign.”1,2,6 Deeply seating interbody implants, instead of resting them more widely on the apophyseal ring of the vertebral endplate, may also lead to subsidence.4,12 The issue of identifying a sentinel fusion sign is relevant only if the surgeon tries to create one. In the present study, the implant used was an impacted cage positioned on the apophyseal perimeter of the disc space, just slightly recessed, so there was no attempt to create a sentinel fusion sign, as reflected in the relatively low scores on anterior osseous bridging (48%, 52%).
Subsidence and peri-implant lysis are pathologic variables associated with motion and bone loss. Sethi and colleagues19 noted a high percentage of endplate resorption and subsidence in cases reviewed using PEEK or allograft spacers paired with BMP-2. Although BMP-2 was used in the present study, we found very low rates of subsidence (0%, 5%) and no significant peri-implant lucencies (2%, 4%) (Figure 2). Interobserver agreement for these variables was high (0.95, 0.96). We hypothesize that the combination of endplate-sparing surgical technique and implant–bone integration contributed to these results.
Trabecular Bone and Fusion Grade
The primary radiographic criterion for solid interbody fusion is trabecular bone throughout the cage, bridging the vertebral bodies. In our study, the success rates for this variable were 96% and 100%, and there was very high interobserver agreement (0.96) (Figure 3). This very high fusion rate may preclude detecting subtle differences in interobserver agreement, but to what degree, if any, is unknown. Other investigators have effectively identified trabecular bone across the interspace and throughout the cages.6,18 The openings for bone formation were larger in the implants they used than in first-generation fusion cages but not as large as the implant openings in the present study. Larger openings may correlate with improved ability to visualize bridging bone on CT.
Radiologists and surgeons must ultimately arrive at a conclusion regarding the likelihood a fusion has occurred. Our radiologists integrated all the separate radiologic variables cited here, as well as their overall impressions of the scans, to arrive at a final grade regarding fusion quality (Figures 3, 4). Although this category provides the most interpretive latitude of all the variables examined, the results demonstrate high interobserver reliability. Agreement to exactly the same fusion grade was 0.77, and agreement to within 1 category grade was 0.95.
This study had several limitations. Surgical explorations were not clinically indicated and were not performed. There were no suspected nonunions or hardware complications, two of the most common indications for exploration. In addition, this study was conducted not to determine specific accuracy of CT (compared with surgery exploration) for fusion assessment but to assess interobserver reliability. The clinical success rates for this population were high, and no patient required revision surgery for suspected pseudarthrosis. To assess the true accuracy of CT for fusion assessment, one would have to subject patients to follow-up exploratory surgery to test fusions mechanically.
Another limitation is the lack of a single industry-accepted radiographic fusion grading system. Fusion criteria are not standardized across all studies. Our radiologists have extensive research experience and limit their practices to neuromuscular radiology with a concentration on the spine. The radiographic criteria cited here are the same criteria they use in clinical practice, when reviewing CT scans for clinicians. Last, there was no control group for direct comparison against other cages. Historical controls were cited. This does not adversely affect the conclusions of this investigation.
Conclusion
Clinicians have been reluctant to rely on CT with titanium devices because of concerns about the accuracy of image interpretations. The interbody device used in this study demonstrated minimal artifact and minimal subsidence, and trabecular bone was easily identified throughout the implant in the majority of cases reviewed. We found high interobserver agreement scores across all fusion criteria. Although surgical exploration remains the gold standard for fusion assessment, surgeons should have confidence in using CT with this titanium implant.
1. Gilbert TJ, Heithoff KB, Mullin WJ. Radiographic assessment of cage-assisted interbody fusions in the lumbar spine. Semin Spine Surg. 2001;13:311-315.
2. Heithoff KB, Mullin WJ, Renfrew DL, Gilbert TJ. The failure of radiographic detection of pseudarthrosis in patients with titanium lumbar interbody fusion cages. In: Proceedings of the 14th Annual Meeting of the North American Spine Society; October 20-23, 1999; Chicago, IL. Abstract 14.
3. Cizek GR, Boyd LM. Imaging pitfalls of interbody implants. Spine. 2000;25(20):2633-2636.
4. Dorchak JD, Burkus JK, Foor BD, Sanders DL. Dual paired proximity and combined BAK/proximity interbody fusion cages: radiographic results. In: Proceedings of the 15th Annual Meeting of the North American Spine Society. New Orleans, LA: North American Spine Society; 2000:83-85.
5. Santos ER, Goss DG, Morcom RK, Fraser RD. Radiologic assessment of interbody fusion using carbon fiber cages. Spine. 2003;28(10):997-1001.
6. Carreon LY, Glassman SD, Schwender JD, Subach BR, Gornet MF, Ohno S. Reliability and accuracy of fine-cut computed tomography scans to determine the status of anterior interbody fusions with metallic cages. Spine J. 2008;8(6):998-1002.
7. Fogel GR, Toohey JS, Neidre A, Brantigan JW. Fusion assessment of posterior lumbar interbody fusion using radiolucent cages: x-ray films and helical computed tomography scans compared with surgical exploration of fusion. Spine J. 2008;8(4):570-577.
8. Selby MD, Clark SR, Hall DJ, Freeman BJ. Radiologic assessment of spinal fusion. J Am Acad Orthop Surg. 2012;20(11):694-703.
9. Chafetz N, Cann CE, Morris JM, Steinbach LS, Goldberg HI, Ax L. Pseudarthrosis following lumbar fusion: detection by direct coronal CT scanning. Radiology. 1987;162(3):803-805.
10. Landis RJ, Koch GG. The measurement of observer agreement for categorical data. Biometrics. 1977;33(1):159-174.
11. Viera AJ, Garrett JM. Understanding interobserver agreement; the kappa statistic. Fam Med. 2005;37(5):360-363.
12. Burkus JK, Foley K, Haid RW, Lehuec JC. Surgical Interbody Research Group—radiographic assessment of interbody fusion devices: fusion criteria for anterior lumbar interbody surgery. Neurosurg Focus. 2001;10(4):E11.
13. Albrektsson T, Zarb G, Worthington P, Eriksson AR. The long-term efficacy of currently used dental implants: a review and proposed criteria of success. Int J Oral Maxillofac Implants. 1986;1(1):11-25.
14. De Leonardis D, Garg AK, Pecora GE. Osseointegration of rough acid-etched titanium implants: 5-year follow-up of 100 Minimatic implants. Int J Oral Maxillofac Implants. 1999;14(3):384-391.
15. Schwartz Z, Raz P, Zhao G, et al. Effect of micrometer-scale roughness on the surface of Ti6Al4V pedicle screws in vitro and in vivo. J Bone Joint Surg Am. 2008;90(11):2485-2498.
16. Olivares-Navarrete R, Gittens RA, Schneider JM, et al. Osteoblasts exhibit a more differentiated phenotype and increased bone morphogenetic protein production on titanium alloy substrates than on poly-ether-ether-ketone. Spine J. 2012;12(3):265-272.
17. Olivares-Navarrete R, Hyzy SL, Gittens RA 1st, et al. Rough titanium alloys regulate osteoblast production of angiogenic factors. Spine J. 2013;13(11):1563-1570.
18. Burkus JK, Dorchak JD, Sanders DL. Radiographic assessment of interbody fusion using recombinant human bone morphogenetic protein type 2. Spine. 2003;28(4):372-377.
19. Sethi A, Craig J, Bartol S, et al. Radiographic and CT evaluation of recombinant human bone morphogenetic protein-2–assisted spinal interbody fusion. AJR Am J Roentgenol. 2011;197(1):W128-W133.
The accuracy of using computed tomography (CT) to assess lumbar interbody fusion with titanium implants has been questioned in the past.1-4 Reports have most often focused on older technologies using paired, threaded, smooth-surface titanium devices. Some authors have reported they could not confidently assess the quality of fusions using CT because of implant artifact.1-3
When pseudarthrosis is suspected clinically, and imaging results are inconclusive, surgical explorations may be performed with mechanical stressing of the segment to assess for motion.2,5-7 However, surgical exploration not only has the morbidity of another surgery but may not be conclusive. Direct exploration of an interbody fusion is problematic. In some cases, there may be residual normal springing motion through posterior elements, even in the presence of a solid interbody fusion, which can be confusing.5 Radiologic confirmation of fusion status is therefore preferred over surgical exploration. CT is the imaging modality used most often to assess spinal fusions.8,9
A new titanium interbody fusion implant (Endoskeleton TA; Titan Spine, Mequon, Wisconsin) preserves the endplate and has an acid-etched titanium surface for osseous integration and a wide central aperture for bone graft (Figure 1). Compared with earlier titanium implants, this design may allow for more accurate CT imaging and fusion assessment. We conducted a study to determine the interobserver reliability of using CT to evaluate bone formation and other radiographic variables with this new titanium interbody device.
Materials and Methods
After receiving institutional review board approval for this study, as well as patient consent, we obtained and analyzed CT scans of patients after they had undergone anterior lumbar interbody fusion (ALIF) at L3–S1 as part of a separate clinical outcomes study.
Each patient received an Endoskeleton TA implant. The fusion cage was packed with 2 sponges (3.0 mg per fusion level) of bone morphogenetic protein, or BMP (InFuse; Medtronic, Minneapolis, Minnesota). In addition, 1 to 3 cm3 of hydroxyapatite/β-tricalcium phosphate (MasterGraft, Medtronic) collagen sponge was used as graft extender to fill any remaining gaps within the cage. Pedicle screw fixation was used in all cases.
Patients were randomly assigned to have fine-cut CT scans with reconstructed images at 6, 9, or 12 months. The scans were reviewed by 2 independent radiologists who were blinded to each other’s interpretations and the clinical results. The radiographic fusion criteria are listed in Tables 1 to 3. Interobserver agreement (κ) was calculated separately for each radiographic criterion and could range from 0.00 (no agreement) to 1.00 (perfect agreement).10,11
Results
The study involved 33 patients (17 men, 16 women) with 56 lumbar spinal fusion levels. Mean age was 46 years (range, 23-66 years). Six patients (18%) were nicotine users. Seventeen patients were scanned at 6 months, 9 at 9 months, and 7 at 12 months. There were no significant differences in results between men and women, between nicotine users and nonusers, or among patients evaluated at 6, 9, or 12 months.
The radiologists agreed on 345 of the 392 data points reviewed (κ = 0.88). Interobserver agreement results for the fusion criteria are listed in Tables 1 and 3. Interobserver agreement was 0.77 for overall fusion grade, with the radiologists noting definite fusion (grade 5) in 80% and 91% of the levels (Table 1). Other radiographic criteria are listed in Tables 2 and 3. Interobserver agreement was 0.80 for degree of artifact, 0.95 for subsidence, 0.96 for both lucency and trabecular bone, 0.77 for anterior osseous bridging, and 0.95 for cystic vertebral changes.
Discussion
Radiographic analysis of interbody fusions is an important clinical issue. Investigators have shown that CT is the radiographic method of choice for assessing fusion.8,9 Others have reported that assessing fusion with metallic interbody implants is more difficult compared with PEEK (polyether ether ketone) or allograft bone.3,4,5,12
Heithoff and colleagues1,2 reported on difficulties they encountered in assessing interbody fusion with titanium implants, and their research has often been cited. The authors concluded that they could not accurately assess fusion in these cases because of artifact from the small apertures in the cages and metallic scatter. Their study was very small (8 patients, 12 surgical levels) and used paired BAK (Bagby and Kuslich) cages (Zimmer, Warsaw, Indiana).
Recently, a unique surface technology, used to manufacture osseointegrative dental implants, has been adapted for use in the spine.13-15 Acid etching modifies the surface of titanium to create a nano-scale (micron-level) alteration. Compared with PEEK and smooth titanium, acid-etched titanium stimulates a better osteogenic environment.16,17 As this technology is now used clinically in spinal surgery, we thought it important to revisit the issue of CT analysis for fusion assessment with the newer titanium implants.
Artifact
The results of our study support the idea that the design of a titanium interbody fusion implant is important to radiographic analysis. The implant studied has a large open central aperture that appears to generate less artifact than historical controls (paired cylindrical cages) have.1-4 Other investigators have reported fewer problems with artifact in their studies of implants incorporating larger openings for bone graft.6,18 The radiologists in the present study found no significant problems with artifact. Less artifact is clinically important, as the remaining fusion variables can be more clearly visualized (Table 2, Figure 2).
Anterior Osseous Bridging, Subsidence, Lysis
In this study, the bony endplates were preserved. The disc and endplate cartilage was removed without reaming or drilling. Endplate reaming most likely contributes to subsidence and loss of original fixation between implant and bone interface.1,4,12 Some authors have advocated recessing the cages deeply and then packing bone anteriorly to create a “sentinel fusion sign.”1,2,6 Deeply seating interbody implants, instead of resting them more widely on the apophyseal ring of the vertebral endplate, may also lead to subsidence.4,12 The issue of identifying a sentinel fusion sign is relevant only if the surgeon tries to create one. In the present study, the implant used was an impacted cage positioned on the apophyseal perimeter of the disc space, just slightly recessed, so there was no attempt to create a sentinel fusion sign, as reflected in the relatively low scores on anterior osseous bridging (48%, 52%).
Subsidence and peri-implant lysis are pathologic variables associated with motion and bone loss. Sethi and colleagues19 noted a high percentage of endplate resorption and subsidence in cases reviewed using PEEK or allograft spacers paired with BMP-2. Although BMP-2 was used in the present study, we found very low rates of subsidence (0%, 5%) and no significant peri-implant lucencies (2%, 4%) (Figure 2). Interobserver agreement for these variables was high (0.95, 0.96). We hypothesize that the combination of endplate-sparing surgical technique and implant–bone integration contributed to these results.
Trabecular Bone and Fusion Grade
The primary radiographic criterion for solid interbody fusion is trabecular bone throughout the cage, bridging the vertebral bodies. In our study, the success rates for this variable were 96% and 100%, and there was very high interobserver agreement (0.96) (Figure 3). This very high fusion rate may preclude detecting subtle differences in interobserver agreement, but to what degree, if any, is unknown. Other investigators have effectively identified trabecular bone across the interspace and throughout the cages.6,18 The openings for bone formation were larger in the implants they used than in first-generation fusion cages but not as large as the implant openings in the present study. Larger openings may correlate with improved ability to visualize bridging bone on CT.
Radiologists and surgeons must ultimately arrive at a conclusion regarding the likelihood a fusion has occurred. Our radiologists integrated all the separate radiologic variables cited here, as well as their overall impressions of the scans, to arrive at a final grade regarding fusion quality (Figures 3, 4). Although this category provides the most interpretive latitude of all the variables examined, the results demonstrate high interobserver reliability. Agreement to exactly the same fusion grade was 0.77, and agreement to within 1 category grade was 0.95.
This study had several limitations. Surgical explorations were not clinically indicated and were not performed. There were no suspected nonunions or hardware complications, two of the most common indications for exploration. In addition, this study was conducted not to determine specific accuracy of CT (compared with surgery exploration) for fusion assessment but to assess interobserver reliability. The clinical success rates for this population were high, and no patient required revision surgery for suspected pseudarthrosis. To assess the true accuracy of CT for fusion assessment, one would have to subject patients to follow-up exploratory surgery to test fusions mechanically.
Another limitation is the lack of a single industry-accepted radiographic fusion grading system. Fusion criteria are not standardized across all studies. Our radiologists have extensive research experience and limit their practices to neuromuscular radiology with a concentration on the spine. The radiographic criteria cited here are the same criteria they use in clinical practice, when reviewing CT scans for clinicians. Last, there was no control group for direct comparison against other cages. Historical controls were cited. This does not adversely affect the conclusions of this investigation.
Conclusion
Clinicians have been reluctant to rely on CT with titanium devices because of concerns about the accuracy of image interpretations. The interbody device used in this study demonstrated minimal artifact and minimal subsidence, and trabecular bone was easily identified throughout the implant in the majority of cases reviewed. We found high interobserver agreement scores across all fusion criteria. Although surgical exploration remains the gold standard for fusion assessment, surgeons should have confidence in using CT with this titanium implant.
1. Gilbert TJ, Heithoff KB, Mullin WJ. Radiographic assessment of cage-assisted interbody fusions in the lumbar spine. Semin Spine Surg. 2001;13:311-315.
2. Heithoff KB, Mullin WJ, Renfrew DL, Gilbert TJ. The failure of radiographic detection of pseudarthrosis in patients with titanium lumbar interbody fusion cages. In: Proceedings of the 14th Annual Meeting of the North American Spine Society; October 20-23, 1999; Chicago, IL. Abstract 14.
3. Cizek GR, Boyd LM. Imaging pitfalls of interbody implants. Spine. 2000;25(20):2633-2636.
4. Dorchak JD, Burkus JK, Foor BD, Sanders DL. Dual paired proximity and combined BAK/proximity interbody fusion cages: radiographic results. In: Proceedings of the 15th Annual Meeting of the North American Spine Society. New Orleans, LA: North American Spine Society; 2000:83-85.
5. Santos ER, Goss DG, Morcom RK, Fraser RD. Radiologic assessment of interbody fusion using carbon fiber cages. Spine. 2003;28(10):997-1001.
6. Carreon LY, Glassman SD, Schwender JD, Subach BR, Gornet MF, Ohno S. Reliability and accuracy of fine-cut computed tomography scans to determine the status of anterior interbody fusions with metallic cages. Spine J. 2008;8(6):998-1002.
7. Fogel GR, Toohey JS, Neidre A, Brantigan JW. Fusion assessment of posterior lumbar interbody fusion using radiolucent cages: x-ray films and helical computed tomography scans compared with surgical exploration of fusion. Spine J. 2008;8(4):570-577.
8. Selby MD, Clark SR, Hall DJ, Freeman BJ. Radiologic assessment of spinal fusion. J Am Acad Orthop Surg. 2012;20(11):694-703.
9. Chafetz N, Cann CE, Morris JM, Steinbach LS, Goldberg HI, Ax L. Pseudarthrosis following lumbar fusion: detection by direct coronal CT scanning. Radiology. 1987;162(3):803-805.
10. Landis RJ, Koch GG. The measurement of observer agreement for categorical data. Biometrics. 1977;33(1):159-174.
11. Viera AJ, Garrett JM. Understanding interobserver agreement; the kappa statistic. Fam Med. 2005;37(5):360-363.
12. Burkus JK, Foley K, Haid RW, Lehuec JC. Surgical Interbody Research Group—radiographic assessment of interbody fusion devices: fusion criteria for anterior lumbar interbody surgery. Neurosurg Focus. 2001;10(4):E11.
13. Albrektsson T, Zarb G, Worthington P, Eriksson AR. The long-term efficacy of currently used dental implants: a review and proposed criteria of success. Int J Oral Maxillofac Implants. 1986;1(1):11-25.
14. De Leonardis D, Garg AK, Pecora GE. Osseointegration of rough acid-etched titanium implants: 5-year follow-up of 100 Minimatic implants. Int J Oral Maxillofac Implants. 1999;14(3):384-391.
15. Schwartz Z, Raz P, Zhao G, et al. Effect of micrometer-scale roughness on the surface of Ti6Al4V pedicle screws in vitro and in vivo. J Bone Joint Surg Am. 2008;90(11):2485-2498.
16. Olivares-Navarrete R, Gittens RA, Schneider JM, et al. Osteoblasts exhibit a more differentiated phenotype and increased bone morphogenetic protein production on titanium alloy substrates than on poly-ether-ether-ketone. Spine J. 2012;12(3):265-272.
17. Olivares-Navarrete R, Hyzy SL, Gittens RA 1st, et al. Rough titanium alloys regulate osteoblast production of angiogenic factors. Spine J. 2013;13(11):1563-1570.
18. Burkus JK, Dorchak JD, Sanders DL. Radiographic assessment of interbody fusion using recombinant human bone morphogenetic protein type 2. Spine. 2003;28(4):372-377.
19. Sethi A, Craig J, Bartol S, et al. Radiographic and CT evaluation of recombinant human bone morphogenetic protein-2–assisted spinal interbody fusion. AJR Am J Roentgenol. 2011;197(1):W128-W133.
Biomechanical Comparison of Hamstring Tendon Fixation Devices for Anterior Cruciate Ligament Reconstruction: Part 2. Four Tibial Devices
Of the procedures performed by surgeons specializing in sports medicine and by general orthopedists, anterior cruciate ligament (ACL) reconstruction remains one of the most common.1 Recent years have seen a trend toward replacing the “gold standard” of bone–patellar tendon–bone autograft with autograft or allograft hamstring tendon in ACL reconstruction.2 This shift is being made to try to avoid the donor-site morbidity of patellar tendon autografts and decrease the incidence of postoperative anterior knee pain. With increased use of hamstring grafts in ACL reconstruction, it is important to determine the strength of different methods of graft fixation.
Rigid fixation of hamstring grafts is recognized as a crucial factor in the long-term success of ACL reconstruction. Grafts must withstand early rehabilitation forces as high as 500 N.2 There is therefore much concern about the strength of tibial fixation, given the lower bone density of the tibial metaphysis versus the femoral metaphysis. In addition, stability is more a concern in the tibia, as the forces are directly in line with the tibial tunnel.3,4
The challenge has been to engineer devices that provide stable, rigid graft fixation that allows expeditious tendon-to-bone healing and increased construct stiffness. Many new fixation devices are being marketed. There is much interest in determining which devices have the most fixation strength,4-9 but so far several products have not been compared with one another.
We conducted a study to determine if tibial hamstring fixation devices used in ACL reconstruction differ in fixation strength. We hypothesized we would find no differences.
Materials and Methods
Forty porcine tibias were harvested after the animals had been euthanized for other studies at our institution. Our study was approved by the institutional animal care and use committee. Specimens were stored at –25°C and, on day of testing, thawed to room temperature. Gracilis and semitendinosus tendon grafts were donated by a tissue bank (LifeNet Health, Virginia Beach, Virginia). The grafts were stored at –25°C; on day of testing, tendons were thawed to room temperature.
We evaluated 4 different tibial fixation devices (Figure 1): Delta screw and Retroscrew (Arthrex, Naples, Florida), WasherLoc (Arthrotek, Warsaw, Indiana), and Intrafix (Depuy Mitek, Raynham, Massachusetts). For each device, 10 ACL fixation constructs were tested.
Quadrupled human semitendinosus–gracilis tendon grafts were fixed into the tibias using the 4 tibial fixation devices. All fixations were done according to manufacturer specifications. All interference screws were placed eccentrically. The testing apparatus and procedure are described in an article by Kousa and colleagues.6 The specimens were mounted on the mechanical testing apparatus by threaded bars and custom clamps to secure fixation (Figure 2). Constant tension was maintained on all 4 strands of the hamstring grafts to equalize the tendons. After the looped end of the hamstring graft was secured by clamps, 25 mm of graft was left between the clamp and the intra-articular tunnel.
In the cyclic loading test, the load was applied parallel to the long axis of the tibial tunnel. A 50-N preload was initially applied to each specimen for 10 seconds. Subsequently, 1500 loading cycles between 50 N and 200 N at a rate of 1 cycle per 120 seconds were performed. Standard force-displacement curves were then generated. Each tibial fixation device underwent 10 cyclic loading tests. Specimens surviving the cyclic loading then underwent a single-cycle load-to-failure (LTF) test in which the load was applied parallel to the long axis of the drill hole at a rate of 50 mm per minute.
Residual displacement, stiffness, and ultimate LTF data were recorded from the force-displacement curves. Residual displacement data were generated from the cyclic loading test; residual displacement was determined by subtracting preload displacement from displacement at 1, 10, 50, 100, 250, 500, 1000, and 1500 cycles. Stiffness data were generated from the single-cycle LTF test; stiffness was defined as the linear region slope of the force-displacement curve corresponding to the steepest straight-line tangent to the loading curve. Ultimate LTF (yield load) data were generated from the single-cycle LTF test; ultimate LTF was defined as the load at the point where the slope of the load displacement curve initially decreases.
Statistical analysis generated standard descriptive statistics: means, standard deviations, and proportions. One-way analysis of variance (ANOVA) was used to determine any statistically significant differences in stiffness, yield load, and residual displacement between the different fixation devices. Differences in force (load) between the single cycle and the cyclic loading test were determined by ANOVA. P < .05 was considered statistically significant for all tests.
Results
The modes of failure for the devices were similar. In all 10 tests, Intrafix was pulled through the tunnel with the hamstring allografts. WasherLoc failed in each test, with the tendons eventually being pulled through the washer and thus out through the tunnel. Delta screw and Retroscrew both failed with slippage of the fixation device and the tendons pulled out through the tunnel.
For the cyclic loading tests, 8 of the 10 Delta screws and only 2 of the 10 Retroscrews completed the 1500-cycle loading test before failure. The 2 Delta screws that did not complete the testing failed after about 500 cycles, and the 8 Retroscrews that did not complete the testing failed after about 250 cycles. All 10 WasherLoc and Intrafix devices completed the testing.
Residual displacement data were calculated from the cyclic loading tests (Table). Mean (SS) residual displacement was lowest for Intrafix at 2.9 (1.2) mm, followed by WasherLoc at 5.6 (2.2) mm and Delta at 6.4 (3.3) mm. Retroscrew at 25.5 (11.0) mm had the highest residual displacement, though only 2 completed the cyclic tests. Intrafix, WasherLoc, and Delta were not statistically different, but there was a statistical difference between Retroscrew and the other devices (P < .001).

Stiffness data were calculated from the LTF tests (Table). Mean (SD) stiffness was highest for Intrafix at 129 (32.7) N/mm, followed by WasherLoc at 97 (11.6) N/mm, Delta at 93 (9.5) N/mm, and Retroscrew at 80.2 (8.8) N/mm. Intrafix had statistically higher stiffness compared with WasherLoc (P < .05), Delta (P < .01), and Retroscrew (P < .05). There were no significant differences in stiffness among WasherLoc, Delta, and Retroscrew.
Mean (SD) ultimate LTF was highest for Intrafix at 656 (182.6) N, followed by WasherLoc at 630 (129.3) N, Delta at 430 (90.0) N, and Retroscrew at 285 (33.8) N (Table). There were significant differences between Intrafix and Delta (P < .05) and Retroscrew (P < .05). WasherLoc failed at a significantly higher load compared with Delta (P < .05) and Retroscrew (P < .05). There were no significant differences in mean LTF between Intrafix and WasherLoc.
Discussion
In this biomechanical comparison of 4 different tibial fixation devices, Intrafix had results superior to those of the other implants. Intrafix failed at higher LTF and lower residual displacement and had higher stiffness. WasherLoc performed well and had LTF similar to that of Intrafix. The interference screws performed poorly with respect to LTF, residual displacement, and stiffness, and a large proportion of them failed early into cyclic loading.
Intrafix is a central fixation device that uses a 4-quadrant sleeve and a screw to establish tensioning across all 4 hamstring graft strands. The theory is this configuration increases the contact area between graft and bone for proper integration of graft into bone. Intrafix has performed well in other biomechanical studies. Using a study design similar to ours, Kousa and colleagues7 found the performance of Intrafix to be superior to that of other devices, including interference screws and WasherLoc. Starch and colleagues10 reported that, compared with a standard interference screw, Intrafix required significantly higher load to cause a millimeter of graft laxity. They concluded that this demonstrates superior fixation strength and reduced laxity of the graft after cyclic loading. Coleridge and Amis4 found that, compared with WasherLoc and various interference screws, Intrafix had the lower residual displacement. However, they also found that, compared with Intrafix and interference screws, WasherLoc had the highest ultimate tensile strength. Their findings may be difficult to compare with ours, as they tested fixation of calf extensor tendons, and we tested human hamstring grafts.
An important concern in the present study was the poor performance of the interference screws. Other authors recently expressed concern with using interference screws in soft-tissue ACL grafts—based on biomechanical study results of increased slippage, bone tunnel widening, and less strength.11 Delta screws and Retroscrews have not been specifically evaluated, and their fixation strengths have not been directly compared with those of other devices. In the present study, Delta screws and Retroscrews consistently performed the poorest with respect to ultimate LTF, residual displacement, and stiffness. Twenty percent of the Delta screws and 80% of the Retroscrews did not complete 1500 cycles. The poor performance of the interference screws was echoed in studies by Magen and colleagues12 and Kousa and colleagues,7 in which the only complete failures were in the cyclic loading of the interference screws.
Three possible confounding factors may have affected the performance of the interference screws: bone density of porcine tibia, length of interference screw, and location of screw placement. In addition, in clinical practice these screws may be used with other modes of graft fixation. Combined fixation (interference screws, other devices) was not evaluated in this study.
Porcine models have been used in many biomechanical graft fixation studies.4,6,7,12,13 Some authors have found porcine tibia to be a poor substitute for human cadaver tibia because the volumetric density of porcine bone is higher than that of human bone.14,15 Other authors have demonstrated fairly similar bone density between human and porcine tibia.16 The concern is that interference screw fixation strength correlates with the density of the bone in which screws are fixed.17 Therefore, one limitation of our study is that we did not determine the bone density of the porcine tibias for comparison with that of young human tibias.
Another important variable that could have affected the performance of the interference screws is screw length. One study found no significant difference in screw strength between various lengths, and longer screws failed to protect against graft slippage.18 However, Selby and colleagues19 found that, compared with 28-mm screws, 35-mm bioabsorbable interference screws failed at higher LTF. This is in part why we selected 35-mm Delta screws for our study. Both 35-mm Delta screws and 20-mm Retroscrews performed poorly. However, we could not determine if the poorer performance of Retroscrews was related to their length.
We used an eccentric placement for our interference screws. Although some studies have suggested concentric placement might improve fixation strength by increasing bone–tendon contact,20 Simonian and colleagues21 found no difference in graft slippage or ultimate LTF between eccentrically and concentrically placed screws. Although they were not biomechanically tested in our study, a few grafts were fixed with concentrically placed screws, and these tendons appeared to be more clinically damaged than the eccentrically placed screws.
Combined tibial fixation techniques may be used in clinical practice, but we did not evaluate them in our study. Yoo and colleagues9 compared interference screw, interference screw plus cortical screw and spiked washer, and cortical screw and spiked washer alone. They found that stiffness nearly doubled, residual displacement was less, and ultimate LTF was significantly higher in the group with interference screw plus cortical screw and spiked washer. In a similar study, Walsh and colleagues13 demonstrated improved stiffness and LTF in cyclic testing with the combination of retrograde interference screw and suture button over interference screw alone. Further study may include direct comparisons of additional tibial fixation techniques using more than one device. Cost analysis of use of additional fixation devices would be beneficial as well.
Study results have clearly demonstrated that tibial fixation is the weak point in ACL reconstruction3,17 and that early aggressive rehabilitation can help restore range of motion, strength, and function.22,23 Implants that can withstand early loads during rehabilitation periods are therefore of utmost importance.
Conclusion
Intrafix demonstrated superior strength in the fixation of hamstring grafts in the tibia, followed closely by WasherLoc. When used as the sole tibial fixation device, interference screws had low LTF, decreased stiffness, and high residual displacement, which may have clinical implications for early rehabilitation after ACL reconstruction.
1. Garrett WE Jr, Swiontkowski MF, Weinsten JN, et al. American Board of Orthopaedic Surgery Practice of the Orthopaedic Surgeon: part-II, certification examination case mix. J Bone Joint Surg Am. 2006;88(3):660-667.
2. West RV, Harner CD. Graft selection in anterior cruciate ligament reconstruction. J Am Acad Orthop Surg. 2005;13(3):197-207.
3. Brand J Jr, Weiler A, Caborn DN, Brown CH Jr, Johnson DL. Graft fixation in cruciate ligament reconstruction. Am J Sports Med. 2000;28(5):761-774.
4. Coleridge SD, Amis AA. A comparison of five tibial-fixation systems in hamstring-graft anterior cruciate ligament reconstruction. Knee Surg Sports Traumatol Arthrosc. 2004;12(5):391-397.
5. Fabbriciani C, Mulas PD, Ziranu F, Deriu L, Zarelli D, Milano G. Mechanical analysis of fixation methods for anterior cruciate ligament reconstruction with hamstring tendon graft. An experimental study in sheep knees. Knee. 2005;12(2):135-138.
6. Kousa P, Järvinen TL, Vihavainen M, Kannus P, Järvinen M. The fixation strength of six hamstring tendon graft fixation devices in anterior cruciate ligament reconstruction. Part I: femoral site. Am J Sports Med. 2003;31(2):174-181.
7. Kousa P, Järvinen TL, Vihavainen M, Kannus P, Järvinen M. The fixation strength of six hamstring tendon graft fixation devices in anterior cruciate ligament reconstruction. Part II: tibial site. Am J Sports Med. 2003;31(2):182-188.
8. Weiler A, Hoffmann RF, Stähelin AC, Bail HJ, Siepe CJ, Südkamp NP. Hamstring tendon fixation using interference screws: a biomechanical study in calf tibial bone. Arthroscopy. 1998;14(1):29-37.
9. Yoo JC, Ahn JH, Kim JH, et al. Biomechanical testing of hybrid hamstring graft tibial fixation in anterior cruciate ligament reconstruction. Knee. 2006;13(6):455-459.
10. Starch DW, Alexander JW, Noble PC, Reddy S, Lintner DM. Multistranded hamstring tendon graft fixation with a central four-quadrant or a standard tibial interference screw for anterior cruciate ligament reconstruction. Am J Sports Med. 2003;31(3):338-344.
11. Prodromos CC, Fu FH, Howell SM, Johnson DH, Lawhorn K. Controversies in soft-tissue anterior cruciate ligament reconstruction: grafts, bundles, tunnels, fixation, and harvest. J Am Acad Orthop Surg. 2008;16(7):376-384.
12. Magen HE, Howell SM, Hull ML. Structural properties of six tibial fixation methods for anterior cruciate ligament soft tissue grafts. Am J Sports Med. 1999;27(1):35-43.
13. Walsh MP, Wijdicks CA, Parker JB, Hapa O, LaPrade RF. A comparison between a retrograde interference screw, suture button, and combined fixation on the tibial side in an all-inside anterior cruciate ligament reconstruction: a biomechanical study in a porcine model. Am J Sports Med. 2009;37(1):160-167.
14. Nurmi JT, Järvinen TL, Kannus P, Sievänen H, Toukosalo J, Järvinen M. Compaction versus extraction drilling for fixation of the hamstring tendon graft in anterior cruciate ligament reconstruction. Am J Sports Med. 2002;30(2):167-173.
15. Nurmi JT, Sievänen H, Kannus P, Järvinen M, Järvinen TL. Porcine tibia is a poor substitute for human cadaver tibia for evaluating interference screw fixation. Am J Sports Med. 2004;32(3):765-771.
16. Nagarkatti DG, McKeon BP, Donahue BS, Fulkerson JP. Mechanical evaluation of a soft tissue interference screw in free tendon anterior cruciate ligament graft fixation. Am J Sports Med. 2001;29(1):67-71.
17. Brand JC Jr, Pienkowski D, Steenlage E, Hamilton D, Johnson DL, Caborn DN. Interference screw fixation strength of a quadrupled hamstring tendon graft is directly related to bone mineral density and insertion torque. Am J Sports Med. 2000;28(5):705-710.
18. Stadelmaier DM, Lowe WR, Ilahi OA, Noble PC, Kohl HW 3rd. Cyclic pull-out strength of hamstring tendon graft fixation with soft tissue interference screws. Influence of screw length. Am J Sports Med. 1999;27(6):778-783.
19. Selby JB, Johnson DL, Hester P, Caborn DN. Effect of screw length on bioabsorbable interference screw fixation in a tibial bone tunnel. Am J Sports Med. 2001;29(5):614-619.
20. Shino K, Pflaster DS. Comparison of eccentric and concentric screw placement for hamstring graft fixation in the tibial tunnel. Knee Surg Sports Traumatol Arthrosc. 2000;8(2):73-75.
21. Simonian PT, Sussmann PS, Baldini TH, Crockett HC, Wickiewicz TL. Interference screw position and hamstring graft location for anterior cruciate ligament reconstruction. Arthroscopy. 1998;14(5):459-464.
22. Shelbourne KD, Nitz P. Accelerated rehabilitation after anterior cruciate ligament reconstruction. Am J Sports Med. 1990;18(3):292-299.
23. Shelbourne KD, Wilckens JH. Current concepts in anterior cruciate ligament rehabilitation. Orthop Rev. 1990;19(11):957-964.
Of the procedures performed by surgeons specializing in sports medicine and by general orthopedists, anterior cruciate ligament (ACL) reconstruction remains one of the most common.1 Recent years have seen a trend toward replacing the “gold standard” of bone–patellar tendon–bone autograft with autograft or allograft hamstring tendon in ACL reconstruction.2 This shift is being made to try to avoid the donor-site morbidity of patellar tendon autografts and decrease the incidence of postoperative anterior knee pain. With increased use of hamstring grafts in ACL reconstruction, it is important to determine the strength of different methods of graft fixation.
Rigid fixation of hamstring grafts is recognized as a crucial factor in the long-term success of ACL reconstruction. Grafts must withstand early rehabilitation forces as high as 500 N.2 There is therefore much concern about the strength of tibial fixation, given the lower bone density of the tibial metaphysis versus the femoral metaphysis. In addition, stability is more a concern in the tibia, as the forces are directly in line with the tibial tunnel.3,4
The challenge has been to engineer devices that provide stable, rigid graft fixation that allows expeditious tendon-to-bone healing and increased construct stiffness. Many new fixation devices are being marketed. There is much interest in determining which devices have the most fixation strength,4-9 but so far several products have not been compared with one another.
We conducted a study to determine if tibial hamstring fixation devices used in ACL reconstruction differ in fixation strength. We hypothesized we would find no differences.
Materials and Methods
Forty porcine tibias were harvested after the animals had been euthanized for other studies at our institution. Our study was approved by the institutional animal care and use committee. Specimens were stored at –25°C and, on day of testing, thawed to room temperature. Gracilis and semitendinosus tendon grafts were donated by a tissue bank (LifeNet Health, Virginia Beach, Virginia). The grafts were stored at –25°C; on day of testing, tendons were thawed to room temperature.
We evaluated 4 different tibial fixation devices (Figure 1): Delta screw and Retroscrew (Arthrex, Naples, Florida), WasherLoc (Arthrotek, Warsaw, Indiana), and Intrafix (Depuy Mitek, Raynham, Massachusetts). For each device, 10 ACL fixation constructs were tested.
Quadrupled human semitendinosus–gracilis tendon grafts were fixed into the tibias using the 4 tibial fixation devices. All fixations were done according to manufacturer specifications. All interference screws were placed eccentrically. The testing apparatus and procedure are described in an article by Kousa and colleagues.6 The specimens were mounted on the mechanical testing apparatus by threaded bars and custom clamps to secure fixation (Figure 2). Constant tension was maintained on all 4 strands of the hamstring grafts to equalize the tendons. After the looped end of the hamstring graft was secured by clamps, 25 mm of graft was left between the clamp and the intra-articular tunnel.
In the cyclic loading test, the load was applied parallel to the long axis of the tibial tunnel. A 50-N preload was initially applied to each specimen for 10 seconds. Subsequently, 1500 loading cycles between 50 N and 200 N at a rate of 1 cycle per 120 seconds were performed. Standard force-displacement curves were then generated. Each tibial fixation device underwent 10 cyclic loading tests. Specimens surviving the cyclic loading then underwent a single-cycle load-to-failure (LTF) test in which the load was applied parallel to the long axis of the drill hole at a rate of 50 mm per minute.
Residual displacement, stiffness, and ultimate LTF data were recorded from the force-displacement curves. Residual displacement data were generated from the cyclic loading test; residual displacement was determined by subtracting preload displacement from displacement at 1, 10, 50, 100, 250, 500, 1000, and 1500 cycles. Stiffness data were generated from the single-cycle LTF test; stiffness was defined as the linear region slope of the force-displacement curve corresponding to the steepest straight-line tangent to the loading curve. Ultimate LTF (yield load) data were generated from the single-cycle LTF test; ultimate LTF was defined as the load at the point where the slope of the load displacement curve initially decreases.
Statistical analysis generated standard descriptive statistics: means, standard deviations, and proportions. One-way analysis of variance (ANOVA) was used to determine any statistically significant differences in stiffness, yield load, and residual displacement between the different fixation devices. Differences in force (load) between the single cycle and the cyclic loading test were determined by ANOVA. P < .05 was considered statistically significant for all tests.
Results
The modes of failure for the devices were similar. In all 10 tests, Intrafix was pulled through the tunnel with the hamstring allografts. WasherLoc failed in each test, with the tendons eventually being pulled through the washer and thus out through the tunnel. Delta screw and Retroscrew both failed with slippage of the fixation device and the tendons pulled out through the tunnel.
For the cyclic loading tests, 8 of the 10 Delta screws and only 2 of the 10 Retroscrews completed the 1500-cycle loading test before failure. The 2 Delta screws that did not complete the testing failed after about 500 cycles, and the 8 Retroscrews that did not complete the testing failed after about 250 cycles. All 10 WasherLoc and Intrafix devices completed the testing.
Residual displacement data were calculated from the cyclic loading tests (Table). Mean (SS) residual displacement was lowest for Intrafix at 2.9 (1.2) mm, followed by WasherLoc at 5.6 (2.2) mm and Delta at 6.4 (3.3) mm. Retroscrew at 25.5 (11.0) mm had the highest residual displacement, though only 2 completed the cyclic tests. Intrafix, WasherLoc, and Delta were not statistically different, but there was a statistical difference between Retroscrew and the other devices (P < .001).
Stiffness data were calculated from the LTF tests (Table). Mean (SD) stiffness was highest for Intrafix at 129 (32.7) N/mm, followed by WasherLoc at 97 (11.6) N/mm, Delta at 93 (9.5) N/mm, and Retroscrew at 80.2 (8.8) N/mm. Intrafix had statistically higher stiffness compared with WasherLoc (P < .05), Delta (P < .01), and Retroscrew (P < .05). There were no significant differences in stiffness among WasherLoc, Delta, and Retroscrew.
Mean (SD) ultimate LTF was highest for Intrafix at 656 (182.6) N, followed by WasherLoc at 630 (129.3) N, Delta at 430 (90.0) N, and Retroscrew at 285 (33.8) N (Table). There were significant differences between Intrafix and Delta (P < .05) and Retroscrew (P < .05). WasherLoc failed at a significantly higher load compared with Delta (P < .05) and Retroscrew (P < .05). There were no significant differences in mean LTF between Intrafix and WasherLoc.
Discussion
In this biomechanical comparison of 4 different tibial fixation devices, Intrafix had results superior to those of the other implants. Intrafix failed at higher LTF and lower residual displacement and had higher stiffness. WasherLoc performed well and had LTF similar to that of Intrafix. The interference screws performed poorly with respect to LTF, residual displacement, and stiffness, and a large proportion of them failed early into cyclic loading.
Intrafix is a central fixation device that uses a 4-quadrant sleeve and a screw to establish tensioning across all 4 hamstring graft strands. The theory is this configuration increases the contact area between graft and bone for proper integration of graft into bone. Intrafix has performed well in other biomechanical studies. Using a study design similar to ours, Kousa and colleagues7 found the performance of Intrafix to be superior to that of other devices, including interference screws and WasherLoc. Starch and colleagues10 reported that, compared with a standard interference screw, Intrafix required significantly higher load to cause a millimeter of graft laxity. They concluded that this demonstrates superior fixation strength and reduced laxity of the graft after cyclic loading. Coleridge and Amis4 found that, compared with WasherLoc and various interference screws, Intrafix had the lower residual displacement. However, they also found that, compared with Intrafix and interference screws, WasherLoc had the highest ultimate tensile strength. Their findings may be difficult to compare with ours, as they tested fixation of calf extensor tendons, and we tested human hamstring grafts.
An important concern in the present study was the poor performance of the interference screws. Other authors recently expressed concern with using interference screws in soft-tissue ACL grafts—based on biomechanical study results of increased slippage, bone tunnel widening, and less strength.11 Delta screws and Retroscrews have not been specifically evaluated, and their fixation strengths have not been directly compared with those of other devices. In the present study, Delta screws and Retroscrews consistently performed the poorest with respect to ultimate LTF, residual displacement, and stiffness. Twenty percent of the Delta screws and 80% of the Retroscrews did not complete 1500 cycles. The poor performance of the interference screws was echoed in studies by Magen and colleagues12 and Kousa and colleagues,7 in which the only complete failures were in the cyclic loading of the interference screws.
Three possible confounding factors may have affected the performance of the interference screws: bone density of porcine tibia, length of interference screw, and location of screw placement. In addition, in clinical practice these screws may be used with other modes of graft fixation. Combined fixation (interference screws, other devices) was not evaluated in this study.
Porcine models have been used in many biomechanical graft fixation studies.4,6,7,12,13 Some authors have found porcine tibia to be a poor substitute for human cadaver tibia because the volumetric density of porcine bone is higher than that of human bone.14,15 Other authors have demonstrated fairly similar bone density between human and porcine tibia.16 The concern is that interference screw fixation strength correlates with the density of the bone in which screws are fixed.17 Therefore, one limitation of our study is that we did not determine the bone density of the porcine tibias for comparison with that of young human tibias.
Another important variable that could have affected the performance of the interference screws is screw length. One study found no significant difference in screw strength between various lengths, and longer screws failed to protect against graft slippage.18 However, Selby and colleagues19 found that, compared with 28-mm screws, 35-mm bioabsorbable interference screws failed at higher LTF. This is in part why we selected 35-mm Delta screws for our study. Both 35-mm Delta screws and 20-mm Retroscrews performed poorly. However, we could not determine if the poorer performance of Retroscrews was related to their length.
We used an eccentric placement for our interference screws. Although some studies have suggested concentric placement might improve fixation strength by increasing bone–tendon contact,20 Simonian and colleagues21 found no difference in graft slippage or ultimate LTF between eccentrically and concentrically placed screws. Although they were not biomechanically tested in our study, a few grafts were fixed with concentrically placed screws, and these tendons appeared to be more clinically damaged than the eccentrically placed screws.
Combined tibial fixation techniques may be used in clinical practice, but we did not evaluate them in our study. Yoo and colleagues9 compared interference screw, interference screw plus cortical screw and spiked washer, and cortical screw and spiked washer alone. They found that stiffness nearly doubled, residual displacement was less, and ultimate LTF was significantly higher in the group with interference screw plus cortical screw and spiked washer. In a similar study, Walsh and colleagues13 demonstrated improved stiffness and LTF in cyclic testing with the combination of retrograde interference screw and suture button over interference screw alone. Further study may include direct comparisons of additional tibial fixation techniques using more than one device. Cost analysis of use of additional fixation devices would be beneficial as well.
Study results have clearly demonstrated that tibial fixation is the weak point in ACL reconstruction3,17 and that early aggressive rehabilitation can help restore range of motion, strength, and function.22,23 Implants that can withstand early loads during rehabilitation periods are therefore of utmost importance.
Conclusion
Intrafix demonstrated superior strength in the fixation of hamstring grafts in the tibia, followed closely by WasherLoc. When used as the sole tibial fixation device, interference screws had low LTF, decreased stiffness, and high residual displacement, which may have clinical implications for early rehabilitation after ACL reconstruction.
1. Garrett WE Jr, Swiontkowski MF, Weinsten JN, et al. American Board of Orthopaedic Surgery Practice of the Orthopaedic Surgeon: part-II, certification examination case mix. J Bone Joint Surg Am. 2006;88(3):660-667.
2. West RV, Harner CD. Graft selection in anterior cruciate ligament reconstruction. J Am Acad Orthop Surg. 2005;13(3):197-207.
3. Brand J Jr, Weiler A, Caborn DN, Brown CH Jr, Johnson DL. Graft fixation in cruciate ligament reconstruction. Am J Sports Med. 2000;28(5):761-774.
4. Coleridge SD, Amis AA. A comparison of five tibial-fixation systems in hamstring-graft anterior cruciate ligament reconstruction. Knee Surg Sports Traumatol Arthrosc. 2004;12(5):391-397.
5. Fabbriciani C, Mulas PD, Ziranu F, Deriu L, Zarelli D, Milano G. Mechanical analysis of fixation methods for anterior cruciate ligament reconstruction with hamstring tendon graft. An experimental study in sheep knees. Knee. 2005;12(2):135-138.
6. Kousa P, Järvinen TL, Vihavainen M, Kannus P, Järvinen M. The fixation strength of six hamstring tendon graft fixation devices in anterior cruciate ligament reconstruction. Part I: femoral site. Am J Sports Med. 2003;31(2):174-181.
7. Kousa P, Järvinen TL, Vihavainen M, Kannus P, Järvinen M. The fixation strength of six hamstring tendon graft fixation devices in anterior cruciate ligament reconstruction. Part II: tibial site. Am J Sports Med. 2003;31(2):182-188.
8. Weiler A, Hoffmann RF, Stähelin AC, Bail HJ, Siepe CJ, Südkamp NP. Hamstring tendon fixation using interference screws: a biomechanical study in calf tibial bone. Arthroscopy. 1998;14(1):29-37.
9. Yoo JC, Ahn JH, Kim JH, et al. Biomechanical testing of hybrid hamstring graft tibial fixation in anterior cruciate ligament reconstruction. Knee. 2006;13(6):455-459.
10. Starch DW, Alexander JW, Noble PC, Reddy S, Lintner DM. Multistranded hamstring tendon graft fixation with a central four-quadrant or a standard tibial interference screw for anterior cruciate ligament reconstruction. Am J Sports Med. 2003;31(3):338-344.
11. Prodromos CC, Fu FH, Howell SM, Johnson DH, Lawhorn K. Controversies in soft-tissue anterior cruciate ligament reconstruction: grafts, bundles, tunnels, fixation, and harvest. J Am Acad Orthop Surg. 2008;16(7):376-384.
12. Magen HE, Howell SM, Hull ML. Structural properties of six tibial fixation methods for anterior cruciate ligament soft tissue grafts. Am J Sports Med. 1999;27(1):35-43.
13. Walsh MP, Wijdicks CA, Parker JB, Hapa O, LaPrade RF. A comparison between a retrograde interference screw, suture button, and combined fixation on the tibial side in an all-inside anterior cruciate ligament reconstruction: a biomechanical study in a porcine model. Am J Sports Med. 2009;37(1):160-167.
14. Nurmi JT, Järvinen TL, Kannus P, Sievänen H, Toukosalo J, Järvinen M. Compaction versus extraction drilling for fixation of the hamstring tendon graft in anterior cruciate ligament reconstruction. Am J Sports Med. 2002;30(2):167-173.
15. Nurmi JT, Sievänen H, Kannus P, Järvinen M, Järvinen TL. Porcine tibia is a poor substitute for human cadaver tibia for evaluating interference screw fixation. Am J Sports Med. 2004;32(3):765-771.
16. Nagarkatti DG, McKeon BP, Donahue BS, Fulkerson JP. Mechanical evaluation of a soft tissue interference screw in free tendon anterior cruciate ligament graft fixation. Am J Sports Med. 2001;29(1):67-71.
17. Brand JC Jr, Pienkowski D, Steenlage E, Hamilton D, Johnson DL, Caborn DN. Interference screw fixation strength of a quadrupled hamstring tendon graft is directly related to bone mineral density and insertion torque. Am J Sports Med. 2000;28(5):705-710.
18. Stadelmaier DM, Lowe WR, Ilahi OA, Noble PC, Kohl HW 3rd. Cyclic pull-out strength of hamstring tendon graft fixation with soft tissue interference screws. Influence of screw length. Am J Sports Med. 1999;27(6):778-783.
19. Selby JB, Johnson DL, Hester P, Caborn DN. Effect of screw length on bioabsorbable interference screw fixation in a tibial bone tunnel. Am J Sports Med. 2001;29(5):614-619.
20. Shino K, Pflaster DS. Comparison of eccentric and concentric screw placement for hamstring graft fixation in the tibial tunnel. Knee Surg Sports Traumatol Arthrosc. 2000;8(2):73-75.
21. Simonian PT, Sussmann PS, Baldini TH, Crockett HC, Wickiewicz TL. Interference screw position and hamstring graft location for anterior cruciate ligament reconstruction. Arthroscopy. 1998;14(5):459-464.
22. Shelbourne KD, Nitz P. Accelerated rehabilitation after anterior cruciate ligament reconstruction. Am J Sports Med. 1990;18(3):292-299.
23. Shelbourne KD, Wilckens JH. Current concepts in anterior cruciate ligament rehabilitation. Orthop Rev. 1990;19(11):957-964.
Treatment of Proximal Humerus Fractures: Comparison of Shoulder and Trauma Surgeons
Proximal humerus fractures (PHFs), AO/OTA (Ar beitsgemeinschaft für Osteosynthesefragen/Orthopaedic Trauma Association) type 11,1 are common, representing 4% to 5% of all fractures in adults.2 However, there is no consensus as to optimal management of these injuries, with some reports supporting and others rejecting the various fixation methods,3 and there are no evidence-based practice guidelines informing treatment decisions.4 Not surprisingly, orthopedic surgeons do not agree on ideal treatment for PHFs5,6 and differ by region in their rates of surgical management.2 In addition, analyses of national databases have found variation in choice of surgical treatment for PHFs between surgeons and between hospitals of different patient volumes.4 Few studies have assessed surgeon agreement on treatment decisions. Findings from these limited investigations indicate there is little agreement on treatment choices, but training may have some impact.5-7 In 3 studies,5-7 shoulder and trauma fellowship–trained surgeons differed in their management of PHFs both in terms of rates of operative treatment5,7 and specific operative management choices.5,6 No study has assessed surgeon agreement on radiographic outcomes.
We conducted a study to compare expert shoulder and trauma surgeons’ treatment decision-making and agreement on final radiographic outcomes of surgically treated PHFs. We hypothesized there would be poor agreement on treatment decisions and better agreement on radiographic outcomes, with a difference between shoulder and trauma fellowship–trained surgeons.
Materials and Methods
After receiving institutional review board approval for this study, we collected data on 100 consecutive PHFs (AO/OTA type 111) surgically treated at 2 affiliated level I trauma centers between January 2004 and July 2008. None of the cases in the series was managed by any of the surgeons participating in this study.
We created a PowerPoint (Microsoft, Redmond, Washington) survey that included radiographs (preoperative, immediate postoperative, final postoperative) and, if available, a computed tomography image. This survey was sent to 4 orthopedic surgeons: Drs. Gardner, Gerber, Lorich, and Walch. Two of these authors are fellowship-trained in shoulder surgery, the other 2 in orthopedic traumatology with specialization in treating PHFs. All are internationally renowned in PHF management. Using the survey images and a 4-point Likert scale ranging from disagree strongly to agree strongly, the examiners rated their agreement with treatment decisions (arthroplasty vs fixation). They also rated (very poor to very good) immediate postoperative reduction or arthroplasty placement, immediate postoperative fixation methods for fractures treated with open reduction and internal fixation (ORIF), and final radiographic outcomes.
Interobserver agreement was calculated using the intraclass correlation coefficient (ICC),8,9 with scores of <0.2 (poor), 0.21 to 0.4 (fair), 0.41 to 0.6 (moderate), 0.61 to 0.8 (good), and >0.8 (excellent) used to indicate agreement among observers. ICC scores were determined by treating the 4 examiners as independent entities. Subgroup analyses were also performed to determine ICC scores comparing the 2 shoulder surgeons, comparing the 2 trauma surgeons, and comparing the shoulder surgeons and trauma surgeons as 2 separate groups. ICC scores were used instead of κ coefficients to assess agreement because ICC scores treat ratings as continuous variables, allow for comparison of 2 or more raters, and allow for assessment of correlation among raters, whereas κ coefficients treat data as categorical variables and assume the ratings have no natural ordering. ICC scores were generated by SAS 9.1.3 software (SAS Institute, Cary, North Carolina).
Results
The 4 surgeons’ overall ICC scores for agreement with the rating of immediate reduction or arthroplasty placement and the rating of final radiographic outcome indicated moderate levels of agreement (Table 1). Regarding treatment decision-making and ratings of fixation, the surgeons demonstrated poor and fair levels of agreement, respectively.
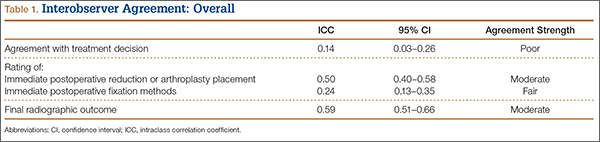
The ICC scores comparing the shoulder and trauma surgeons revealed similar levels of agreement (Table 2): moderate levels of agreement for ratings of both immediate postoperative reduction or arthroplasty placement and final radiographic outcomes, but poor and fair levels of agreement regarding treatment decision-making and the rating of immediate postoperative fixation methods for fractures treated with ORIF, respectively.
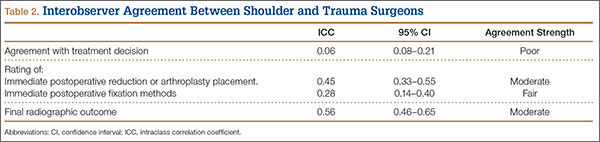
Subgroup analysis revealed that the 2 shoulder surgeons had poor and fair levels of agreement for treatment decisions and rating of immediate postoperative fixation, respectively, though they moderately agreed on rating of immediate postoperative reduction or arthroplasty placement and rating of final radiographic outcome (Table 3). When the 2 trauma surgeons were compared with each other, ICC scores revealed higher levels of agreement overall (Table 4). In other words, the 2 trauma surgeons agreed with each other more than the 2 shoulder surgeons agreed with each other.
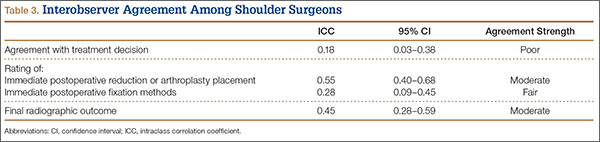
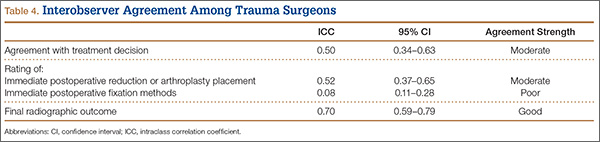
Discussion
This study had 3 major findings: (1) Surgeons do not agree on treatment decisions, including fixation methods, regarding PHFs; (2) regardless of their opinions on ideal treatment, they moderately agree on reductions and final radiographic outcomes; (3) expert trauma surgeons may agree more on treatment decisions than expert shoulder surgeons do. In other words, surgeons do not agree on the best treatment, but they radiographically recognize when a procedure has been performed technically well or poorly. These results support our hypothesis and the limited current literature.
An analysis of Medicare databases showed marked regional variation in rates of operative treatment of PHFs.2 Similarly, a Nationwide Inpatient Sample analysis revealed nationwide variation in operative management of PHFs.4 Both findings are consistent with our results of poor agreement about treatment decisions and ratings of postoperative fixation of PHFs. In 2010, Petit and colleagues6 reported that surgeons do not agree on PHF management. In 2011, Foroohar and colleagues10 similarly reported low interobserver agreement for treatment recommendations made by 4 upper extremity orthopedic specialists, 4 general orthopedic surgeons, 4 senior residents, and 4 junior residents, for a series of 16 PHFs—also consistent with our findings.
The lack of agreement about PHF treatment may reflect a difference in training, particularly in light of the recent expansion of shoulder and elbow fellowships.2 Three separate studies performed at 2 affiliated level I trauma centers demonstrated significant differences in treatment decision-making between shoulder and trauma fellowship–trained surgeons.5-7 Our results are consistent with the hypothesis that training affects treatment decision-making, as we found poor agreement between shoulder and trauma fellowship–trained surgeons regarding treatment decision for PHFs. Subanalyses revealed that expert trauma surgeons agreed with each other on treatment decisions more than expert shoulder surgeons agreed with each other, further suggesting that training may affect how surgeons manage PHFs. Differences in fellowship training even within the same specialty may account for the observed lesser levels of agreement between the shoulder surgeons, even among experts in the field.
The evidence for optimal treatment historically has been poor,4,6 with few high-quality prospective, randomized controlled studies on the topic up until the past few years. The most recent Cochrane Review on optimal PHF treatment concluded that there is insufficient evidence to make an evidence-based recommendation and that the long-term benefit of surgery is unclear.11 However, at least 5 controlled trials on the topic have been published within the past 5 years.12-16 The evidence is striking and generally supports nonoperative treatment for most PHFs, including some displaced fractures—contrary to general orthopedic practice in many parts of the United States,2 which hitherto had been based mainly on individual surgeon experience and the limited literature. Without strong evidence to support one treatment option over another, surgeons are left with no objective, scientific way of coming to agreement.
Related to the poor status quo of evidence for PHF treatments is new technology (eg, locking plates, reverse total shoulder arthroplasty) that has expanded surgical indications.2,17 Although such developments have the potential to improve surgical treatments, they may also exacerbate the disagreement between surgeons regarding optimal operative treatment of PHFs. This potential consequence of new technology may be reflected in our finding of disagreement among surgeons on immediate postoperative fixation methods. Precisely because they are new, such technological innovations have limited evidence supporting their use. This leaves surgeons with little to nothing to inform their decisions to use these devices, other than familiarity with and impressions of the new technology.
Our study had several limitations. First is the small sample size, of surgeons who are leaders in the field. Our sample therefore may not be generalizable to the general population of shoulder and trauma surgeons. Second, we did not calculate intraobserver variability. Third, inherent to studies of interobserver agreement is the uncertainty of their clinical relevance. In the clinical setting, a surgeon has much more information at hand (eg, patient history, physical examination findings, colleague consultations), thus raising the possibility of underestimations of interobserver agreements.18 Fourth, our comparison of surgeons’ ratings of outcomes was purely radiographic, which may or may not represent or be indicative of clinical outcomes (eg, pain relief, function, range of motion, patient satisfaction). The conclusions we may draw are accordingly limited, as we did not directly evaluate clinical outcome parameters.
Our study had several strengths as well. First, to our knowledge this is the first study to assess interobserver variability in surgeons’ ratings of radiographic outcomes. Its findings may provide further insight into the reasons for poor agreement among orthopedic surgeons on both classification and treatment of PHFs. Second, our surveying of internationally renowned expert surgeons from 4 different institutions may have helped reduce single-institution bias, and it presents the highest level of expertise in the treatment of PHFs.
Although the surgeons in our study moderately agreed on final radiographic outcomes of PHFs, such levels of agreement may still be clinically unacceptable.19 The overall disagreement on treatment decisions highlights the need for better evidence for optimal treatment of PHFs in order to improve consensus, particularly with anticipated increases in age and comorbidities in the population in coming years.4 Subgroup analysis suggested trauma fellowships may contribute to better treatment agreement, though this idea requires further study, perhaps by surveying shoulder and trauma fellowship directors and their curricula for variability in teaching treatment decision-making. The surgeons in our study agreed more on what they consider acceptable final radiographic outcomes, which is encouraging. However, treatment consensus is the primary goal. The recent publication of prospective, randomized studies is helping with this issue, but more studies are needed. It is encouraging that several are planned or under way.20-22
Conclusion
The surgeons surveyed in this study did not agree on ideal treatment for PHFs but moderately agreed on quality of radiographic outcomes. These differences may reflect a difference in training. We conducted this study to compare experienced shoulder and trauma fellowship–trained surgeons’ treatment decision-making and ratings of radiographic outcomes of PHFs when presented with the same group of patients managed at 2 level I trauma centers. We hypothesized there would be little agreement on treatment decisions, better agreement on final radiographic outcome, and a difference between decision-making and ratings of radiographic outcomes between expert shoulder and trauma surgeons. Our results showed that surgeons do not agree on the best treatment for PHFs but radiographically recognize when an operative treatment has been performed well or poorly. Regarding treatment decisions, our results also showed that expert trauma surgeons may agree more with each other than shoulder surgeons agree with each other. These results support our hypothesis and the limited current literature. The overall disagreement among the surgeons in our study and an aging population that grows sicker each year highlight the need for better evidence for the optimal treatment of PHFs in order to improve consensus.
1. Marsh JL, Slongo TF, Agel J, et al. Fracture and dislocation classification compendium – 2007: Orthopaedic Trauma Association classification, database and outcomes committee. J Orthop Trauma. 2007;21(10 suppl):S1-S133.
2. Bell JE, Leung BC, Spratt KF, et al. Trends and variation in incidence, surgical treatment, and repeat surgery of proximal humeral fractures in the elderly. J Bone Joint Surg Am. 2011;93(2):121-131.
3. McLaurin TM. Proximal humerus fractures in the elderly are we operating on too many? Bull Hosp Jt Dis. 2004;62(1-2):24-32.
4. Jain NB, Kuye I, Higgins LD, Warner JJP. Surgeon volume is associated with cost and variation in surgical treatment of proximal humeral fractures. Clin Orthop. 2012;471(2):655-664.
5. Boykin RE, Jawa A, O’Brien T, Higgins LD, Warner JJP. Variability in operative management of proximal humerus fractures. Shoulder Elbow. 2011;3(4):197-201.
6. Petit CJ, Millett PJ, Endres NK, Diller D, Harris MB, Warner JJP. Management of proximal humeral fractures: surgeons don’t agree. J Shoulder Elbow Surg. 2010;19(3):446-451.
7. Okike K, Lee OC, Makanji H, Harris MB, Vrahas MS. Factors associated with the decision for operative versus non-operative treatment of displaced proximal humerus fractures in the elderly. Injury. 2013;44(4):448-455.
8. Kodali P, Jones MH, Polster J, Miniaci A, Fening SD. Accuracy of measurement of Hill-Sachs lesions with computed tomography. J Shoulder Elbow Surg. 2011;20(8):1328-1334.
9. Shrout PE, Fleiss JL. Intraclass correlations: uses in assessing rater reliability. Psychol Bull. 1979;86(2):420-428.
10. Foroohar A, Tosti R, Richmond JM, Gaughan JP, Ilyas AM. Classification and treatment of proximal humerus fractures: inter-observer reliability and agreement across imaging modalities and experience. J Orthop Surg Res. 2011;6:38.
11. Handoll HH, Ollivere BJ. Interventions for treating proximal humeral fractures in adults. Cochrane Database Syst Rev. 2010;(12):CD000434.
12. Boons HW, Goosen JH, van Grinsven S, van Susante JL, van Loon CJ. Hemiarthroplasty for humeral four-part fractures for patients 65 years and older: a randomized controlled trial. Clin Orthop. 2012;470(12):3483-3491.
13. Fjalestad T, Hole MØ, Hovden IAH, Blücher J, Strømsøe K. Surgical treatment with an angular stable plate for complex displaced proximal humeral fractures in elderly patients: a randomized controlled trial. J Orthop Trauma. 2012;26(2):98-106.
14. Fjalestad T, Hole MØ, Jørgensen JJ, Strømsøe K, Kristiansen IS. Health and cost consequences of surgical versus conservative treatment for a comminuted proximal humeral fracture in elderly patients. Injury. 2010;41(6):599-605.
15. Olerud P, Ahrengart L, Ponzer S, Saving J, Tidermark J. Internal fixation versus nonoperative treatment of displaced 3-part proximal humeral fractures in elderly patients: a randomized controlled trial. J Shoulder Elbow Surg. 2011;20(5):747-755.
16. Olerud P, Ahrengart L, Ponzer S, Saving J, Tidermark J. Hemiarthroplasty versus nonoperative treatment of displaced 4-part proximal humeral fractures in elderly patients: a randomized controlled trial. J Shoulder Elbow Surg. 2011;20(7):1025-1033.
17. Agudelo J, Schürmann M, Stahel P, et al. Analysis of efficacy and failure in proximal humerus fractures treated with locking plates. J Orthop Trauma. 2007;21(10):676-681.
18. Brorson S, Hróbjartsson A. Training improves agreement among doctors using the Neer system for proximal humeral fractures in a systematic review. J Clin Epidemiol. 2008;61(1):7-16.
19. Brorson S, Olsen BS, Frich LH, et al. Surgeons agree more on treatment recommendations than on classification of proximal humeral fractures. BMC Musculoskelet Disord. 2012;13:114.
20. Handoll H, Brealey S, Rangan A, et al. Protocol for the ProFHER (PROximal Fracture of the Humerus: Evaluation by Randomisation) trial: a pragmatic multi-centre randomised controlled trial of surgical versus non-surgical treatment for proximal fracture of the humerus in adults. BMC Musculoskelet Disord. 2009;10:140.
21. Den Hartog D, Van Lieshout EMM, Tuinebreijer WE, et al. Primary hemiarthroplasty versus conservative treatment for comminuted fractures of the proximal humerus in the elderly (ProCon): a multicenter randomized controlled trial. BMC Musculoskelet Disord. 2010;11:97.
22. Verbeek PA, van den Akker-Scheek I, Wendt KW, Diercks RL. Hemiarthroplasty versus angle-stable locking compression plate osteosynthesis in the treatment of three- and four-part fractures of the proximal humerus in the elderly: design of a randomized controlled trial. BMC Musculoskelet Disord. 2012;13:16.
Proximal humerus fractures (PHFs), AO/OTA (Ar beitsgemeinschaft für Osteosynthesefragen/Orthopaedic Trauma Association) type 11,1 are common, representing 4% to 5% of all fractures in adults.2 However, there is no consensus as to optimal management of these injuries, with some reports supporting and others rejecting the various fixation methods,3 and there are no evidence-based practice guidelines informing treatment decisions.4 Not surprisingly, orthopedic surgeons do not agree on ideal treatment for PHFs5,6 and differ by region in their rates of surgical management.2 In addition, analyses of national databases have found variation in choice of surgical treatment for PHFs between surgeons and between hospitals of different patient volumes.4 Few studies have assessed surgeon agreement on treatment decisions. Findings from these limited investigations indicate there is little agreement on treatment choices, but training may have some impact.5-7 In 3 studies,5-7 shoulder and trauma fellowship–trained surgeons differed in their management of PHFs both in terms of rates of operative treatment5,7 and specific operative management choices.5,6 No study has assessed surgeon agreement on radiographic outcomes.
We conducted a study to compare expert shoulder and trauma surgeons’ treatment decision-making and agreement on final radiographic outcomes of surgically treated PHFs. We hypothesized there would be poor agreement on treatment decisions and better agreement on radiographic outcomes, with a difference between shoulder and trauma fellowship–trained surgeons.
Materials and Methods
After receiving institutional review board approval for this study, we collected data on 100 consecutive PHFs (AO/OTA type 111) surgically treated at 2 affiliated level I trauma centers between January 2004 and July 2008. None of the cases in the series was managed by any of the surgeons participating in this study.
We created a PowerPoint (Microsoft, Redmond, Washington) survey that included radiographs (preoperative, immediate postoperative, final postoperative) and, if available, a computed tomography image. This survey was sent to 4 orthopedic surgeons: Drs. Gardner, Gerber, Lorich, and Walch. Two of these authors are fellowship-trained in shoulder surgery, the other 2 in orthopedic traumatology with specialization in treating PHFs. All are internationally renowned in PHF management. Using the survey images and a 4-point Likert scale ranging from disagree strongly to agree strongly, the examiners rated their agreement with treatment decisions (arthroplasty vs fixation). They also rated (very poor to very good) immediate postoperative reduction or arthroplasty placement, immediate postoperative fixation methods for fractures treated with open reduction and internal fixation (ORIF), and final radiographic outcomes.
Interobserver agreement was calculated using the intraclass correlation coefficient (ICC),8,9 with scores of <0.2 (poor), 0.21 to 0.4 (fair), 0.41 to 0.6 (moderate), 0.61 to 0.8 (good), and >0.8 (excellent) used to indicate agreement among observers. ICC scores were determined by treating the 4 examiners as independent entities. Subgroup analyses were also performed to determine ICC scores comparing the 2 shoulder surgeons, comparing the 2 trauma surgeons, and comparing the shoulder surgeons and trauma surgeons as 2 separate groups. ICC scores were used instead of κ coefficients to assess agreement because ICC scores treat ratings as continuous variables, allow for comparison of 2 or more raters, and allow for assessment of correlation among raters, whereas κ coefficients treat data as categorical variables and assume the ratings have no natural ordering. ICC scores were generated by SAS 9.1.3 software (SAS Institute, Cary, North Carolina).
Results
The 4 surgeons’ overall ICC scores for agreement with the rating of immediate reduction or arthroplasty placement and the rating of final radiographic outcome indicated moderate levels of agreement (Table 1). Regarding treatment decision-making and ratings of fixation, the surgeons demonstrated poor and fair levels of agreement, respectively.
The ICC scores comparing the shoulder and trauma surgeons revealed similar levels of agreement (Table 2): moderate levels of agreement for ratings of both immediate postoperative reduction or arthroplasty placement and final radiographic outcomes, but poor and fair levels of agreement regarding treatment decision-making and the rating of immediate postoperative fixation methods for fractures treated with ORIF, respectively.
Subgroup analysis revealed that the 2 shoulder surgeons had poor and fair levels of agreement for treatment decisions and rating of immediate postoperative fixation, respectively, though they moderately agreed on rating of immediate postoperative reduction or arthroplasty placement and rating of final radiographic outcome (Table 3). When the 2 trauma surgeons were compared with each other, ICC scores revealed higher levels of agreement overall (Table 4). In other words, the 2 trauma surgeons agreed with each other more than the 2 shoulder surgeons agreed with each other.
Discussion
This study had 3 major findings: (1) Surgeons do not agree on treatment decisions, including fixation methods, regarding PHFs; (2) regardless of their opinions on ideal treatment, they moderately agree on reductions and final radiographic outcomes; (3) expert trauma surgeons may agree more on treatment decisions than expert shoulder surgeons do. In other words, surgeons do not agree on the best treatment, but they radiographically recognize when a procedure has been performed technically well or poorly. These results support our hypothesis and the limited current literature.
An analysis of Medicare databases showed marked regional variation in rates of operative treatment of PHFs.2 Similarly, a Nationwide Inpatient Sample analysis revealed nationwide variation in operative management of PHFs.4 Both findings are consistent with our results of poor agreement about treatment decisions and ratings of postoperative fixation of PHFs. In 2010, Petit and colleagues6 reported that surgeons do not agree on PHF management. In 2011, Foroohar and colleagues10 similarly reported low interobserver agreement for treatment recommendations made by 4 upper extremity orthopedic specialists, 4 general orthopedic surgeons, 4 senior residents, and 4 junior residents, for a series of 16 PHFs—also consistent with our findings.
The lack of agreement about PHF treatment may reflect a difference in training, particularly in light of the recent expansion of shoulder and elbow fellowships.2 Three separate studies performed at 2 affiliated level I trauma centers demonstrated significant differences in treatment decision-making between shoulder and trauma fellowship–trained surgeons.5-7 Our results are consistent with the hypothesis that training affects treatment decision-making, as we found poor agreement between shoulder and trauma fellowship–trained surgeons regarding treatment decision for PHFs. Subanalyses revealed that expert trauma surgeons agreed with each other on treatment decisions more than expert shoulder surgeons agreed with each other, further suggesting that training may affect how surgeons manage PHFs. Differences in fellowship training even within the same specialty may account for the observed lesser levels of agreement between the shoulder surgeons, even among experts in the field.
The evidence for optimal treatment historically has been poor,4,6 with few high-quality prospective, randomized controlled studies on the topic up until the past few years. The most recent Cochrane Review on optimal PHF treatment concluded that there is insufficient evidence to make an evidence-based recommendation and that the long-term benefit of surgery is unclear.11 However, at least 5 controlled trials on the topic have been published within the past 5 years.12-16 The evidence is striking and generally supports nonoperative treatment for most PHFs, including some displaced fractures—contrary to general orthopedic practice in many parts of the United States,2 which hitherto had been based mainly on individual surgeon experience and the limited literature. Without strong evidence to support one treatment option over another, surgeons are left with no objective, scientific way of coming to agreement.
Related to the poor status quo of evidence for PHF treatments is new technology (eg, locking plates, reverse total shoulder arthroplasty) that has expanded surgical indications.2,17 Although such developments have the potential to improve surgical treatments, they may also exacerbate the disagreement between surgeons regarding optimal operative treatment of PHFs. This potential consequence of new technology may be reflected in our finding of disagreement among surgeons on immediate postoperative fixation methods. Precisely because they are new, such technological innovations have limited evidence supporting their use. This leaves surgeons with little to nothing to inform their decisions to use these devices, other than familiarity with and impressions of the new technology.
Our study had several limitations. First is the small sample size, of surgeons who are leaders in the field. Our sample therefore may not be generalizable to the general population of shoulder and trauma surgeons. Second, we did not calculate intraobserver variability. Third, inherent to studies of interobserver agreement is the uncertainty of their clinical relevance. In the clinical setting, a surgeon has much more information at hand (eg, patient history, physical examination findings, colleague consultations), thus raising the possibility of underestimations of interobserver agreements.18 Fourth, our comparison of surgeons’ ratings of outcomes was purely radiographic, which may or may not represent or be indicative of clinical outcomes (eg, pain relief, function, range of motion, patient satisfaction). The conclusions we may draw are accordingly limited, as we did not directly evaluate clinical outcome parameters.
Our study had several strengths as well. First, to our knowledge this is the first study to assess interobserver variability in surgeons’ ratings of radiographic outcomes. Its findings may provide further insight into the reasons for poor agreement among orthopedic surgeons on both classification and treatment of PHFs. Second, our surveying of internationally renowned expert surgeons from 4 different institutions may have helped reduce single-institution bias, and it presents the highest level of expertise in the treatment of PHFs.
Although the surgeons in our study moderately agreed on final radiographic outcomes of PHFs, such levels of agreement may still be clinically unacceptable.19 The overall disagreement on treatment decisions highlights the need for better evidence for optimal treatment of PHFs in order to improve consensus, particularly with anticipated increases in age and comorbidities in the population in coming years.4 Subgroup analysis suggested trauma fellowships may contribute to better treatment agreement, though this idea requires further study, perhaps by surveying shoulder and trauma fellowship directors and their curricula for variability in teaching treatment decision-making. The surgeons in our study agreed more on what they consider acceptable final radiographic outcomes, which is encouraging. However, treatment consensus is the primary goal. The recent publication of prospective, randomized studies is helping with this issue, but more studies are needed. It is encouraging that several are planned or under way.20-22
Conclusion
The surgeons surveyed in this study did not agree on ideal treatment for PHFs but moderately agreed on quality of radiographic outcomes. These differences may reflect a difference in training. We conducted this study to compare experienced shoulder and trauma fellowship–trained surgeons’ treatment decision-making and ratings of radiographic outcomes of PHFs when presented with the same group of patients managed at 2 level I trauma centers. We hypothesized there would be little agreement on treatment decisions, better agreement on final radiographic outcome, and a difference between decision-making and ratings of radiographic outcomes between expert shoulder and trauma surgeons. Our results showed that surgeons do not agree on the best treatment for PHFs but radiographically recognize when an operative treatment has been performed well or poorly. Regarding treatment decisions, our results also showed that expert trauma surgeons may agree more with each other than shoulder surgeons agree with each other. These results support our hypothesis and the limited current literature. The overall disagreement among the surgeons in our study and an aging population that grows sicker each year highlight the need for better evidence for the optimal treatment of PHFs in order to improve consensus.
1. Marsh JL, Slongo TF, Agel J, et al. Fracture and dislocation classification compendium – 2007: Orthopaedic Trauma Association classification, database and outcomes committee. J Orthop Trauma. 2007;21(10 suppl):S1-S133.
2. Bell JE, Leung BC, Spratt KF, et al. Trends and variation in incidence, surgical treatment, and repeat surgery of proximal humeral fractures in the elderly. J Bone Joint Surg Am. 2011;93(2):121-131.
3. McLaurin TM. Proximal humerus fractures in the elderly are we operating on too many? Bull Hosp Jt Dis. 2004;62(1-2):24-32.
4. Jain NB, Kuye I, Higgins LD, Warner JJP. Surgeon volume is associated with cost and variation in surgical treatment of proximal humeral fractures. Clin Orthop. 2012;471(2):655-664.
5. Boykin RE, Jawa A, O’Brien T, Higgins LD, Warner JJP. Variability in operative management of proximal humerus fractures. Shoulder Elbow. 2011;3(4):197-201.
6. Petit CJ, Millett PJ, Endres NK, Diller D, Harris MB, Warner JJP. Management of proximal humeral fractures: surgeons don’t agree. J Shoulder Elbow Surg. 2010;19(3):446-451.
7. Okike K, Lee OC, Makanji H, Harris MB, Vrahas MS. Factors associated with the decision for operative versus non-operative treatment of displaced proximal humerus fractures in the elderly. Injury. 2013;44(4):448-455.
8. Kodali P, Jones MH, Polster J, Miniaci A, Fening SD. Accuracy of measurement of Hill-Sachs lesions with computed tomography. J Shoulder Elbow Surg. 2011;20(8):1328-1334.
9. Shrout PE, Fleiss JL. Intraclass correlations: uses in assessing rater reliability. Psychol Bull. 1979;86(2):420-428.
10. Foroohar A, Tosti R, Richmond JM, Gaughan JP, Ilyas AM. Classification and treatment of proximal humerus fractures: inter-observer reliability and agreement across imaging modalities and experience. J Orthop Surg Res. 2011;6:38.
11. Handoll HH, Ollivere BJ. Interventions for treating proximal humeral fractures in adults. Cochrane Database Syst Rev. 2010;(12):CD000434.
12. Boons HW, Goosen JH, van Grinsven S, van Susante JL, van Loon CJ. Hemiarthroplasty for humeral four-part fractures for patients 65 years and older: a randomized controlled trial. Clin Orthop. 2012;470(12):3483-3491.
13. Fjalestad T, Hole MØ, Hovden IAH, Blücher J, Strømsøe K. Surgical treatment with an angular stable plate for complex displaced proximal humeral fractures in elderly patients: a randomized controlled trial. J Orthop Trauma. 2012;26(2):98-106.
14. Fjalestad T, Hole MØ, Jørgensen JJ, Strømsøe K, Kristiansen IS. Health and cost consequences of surgical versus conservative treatment for a comminuted proximal humeral fracture in elderly patients. Injury. 2010;41(6):599-605.
15. Olerud P, Ahrengart L, Ponzer S, Saving J, Tidermark J. Internal fixation versus nonoperative treatment of displaced 3-part proximal humeral fractures in elderly patients: a randomized controlled trial. J Shoulder Elbow Surg. 2011;20(5):747-755.
16. Olerud P, Ahrengart L, Ponzer S, Saving J, Tidermark J. Hemiarthroplasty versus nonoperative treatment of displaced 4-part proximal humeral fractures in elderly patients: a randomized controlled trial. J Shoulder Elbow Surg. 2011;20(7):1025-1033.
17. Agudelo J, Schürmann M, Stahel P, et al. Analysis of efficacy and failure in proximal humerus fractures treated with locking plates. J Orthop Trauma. 2007;21(10):676-681.
18. Brorson S, Hróbjartsson A. Training improves agreement among doctors using the Neer system for proximal humeral fractures in a systematic review. J Clin Epidemiol. 2008;61(1):7-16.
19. Brorson S, Olsen BS, Frich LH, et al. Surgeons agree more on treatment recommendations than on classification of proximal humeral fractures. BMC Musculoskelet Disord. 2012;13:114.
20. Handoll H, Brealey S, Rangan A, et al. Protocol for the ProFHER (PROximal Fracture of the Humerus: Evaluation by Randomisation) trial: a pragmatic multi-centre randomised controlled trial of surgical versus non-surgical treatment for proximal fracture of the humerus in adults. BMC Musculoskelet Disord. 2009;10:140.
21. Den Hartog D, Van Lieshout EMM, Tuinebreijer WE, et al. Primary hemiarthroplasty versus conservative treatment for comminuted fractures of the proximal humerus in the elderly (ProCon): a multicenter randomized controlled trial. BMC Musculoskelet Disord. 2010;11:97.
22. Verbeek PA, van den Akker-Scheek I, Wendt KW, Diercks RL. Hemiarthroplasty versus angle-stable locking compression plate osteosynthesis in the treatment of three- and four-part fractures of the proximal humerus in the elderly: design of a randomized controlled trial. BMC Musculoskelet Disord. 2012;13:16.
The Effect of Humeral Rotation on Elbow Range-of-Motion Measurements
Elbow motion is crucial for activities of daily living and full function of the upper extremity.1 Measuring the elbow flexion arc accurately and consistently is an important part of the physical examination of patients with elbow pathology. Orthopedic surgeons rely on these measurements to follow patients over time, and they often base their treatment decisions on the range and progression/regression of motion arc.
In the clinical setting, elbow range of motion (ROM) is commonly measured with a handheld goniometer.2,3 The literature also suggests that goniometric measurements are highly reliable in the clinical setting and that intrarater reliability of elbow ROM measurements is high.2-4 Despite the routine use and clinical importance of flexion arc assessment, there is no universal recommendation regarding optimal measurement position. Textbooks and journal articles commonly do not specify arm position at time of elbow ROM measurements,5-8 and a literature review found no studies directly addressing this issue.
From a biomechanical standpoint, humeral rotation is often affected by forearm pronosupination position. Although forearm pronosupination is a product of the motion at the radioulnar joints, forearm position during elbow flexion arc measurement can influence the relationship of the distal humeral intercondylar axis to the plane of measurement. Full forearm supination rotates the distal humeral intercondylar axis externally to a position parallel to the floor and in line with the plane of measurement. Humeral rotation with the forearm in neutral pronosupination places the humeral condyles internally rotated relative to the floor. Therefore, for the purposes of this study, we defined full humeral external rotation and true plane of ulnohumeral motion as full forearm supination, and relative humeral and ulnohumeral joint internal rotation as neutral pronosupination.
Because of the potential for elbow ROM measurement changes caused by differences in the motion plane in which measurements are taken, some have advocated taking flexion arc measurements with the arm in full supination to allow measurements to be taken in the true plane of motion. We hypothesized that elbow flexion arc measurements taken with the forearm in neutral rotation would underestimate the extent of elbow flexion contractures compared with measurements taken in full supination.
Materials and Methods
This study received institutional review board approval. Eighty-four patients who presented with elbow dysfunction to a single shoulder and elbow orthopedic surgeon enrolled in the study. Skeletally immature patients and patients with a fracture or other disorder that prohibited elbow ROM were excluded. A standard goniometer was used to measure elbow flexion and extension with the humerus in 2 positions: full external rotation and neutral rotation.
All goniometer measurements were made by the same surgeon (to eliminate interobserver reliability error) using a standardized technique with the patient sitting upright. The goniometer was positioned laterally with its center of rotation over the lateral epicondyle, aligned proximally with the humeral head and distally with the center of the wrist. Measurements were obtained sequentially with the hand in both positions. For external rotation measurements, the patient’s arm was fully supinated to bring the humeral condyles parallel to the floor. For neutral positioning, the patient’s arm was placed in the “thumb-up” position with the hand perpendicular to the horizontal axis of the floor (Figures 1A–1C).
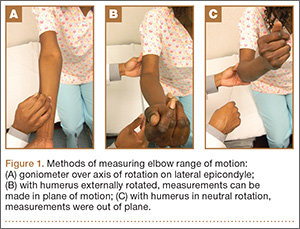
Data collected included demographics, diagnosis, hand dominance, affected side, and elbow ROM measurements with the hand in the 2 positions. These data were compiled and analyzed for all patients and then stratified into 3 groups by extent of elbow flexion contracture in the supinated position (group 1, hyperextension; group 2, 0°-29° elbow extension; group 3, ≥30° flexion contracture).
Statistically, paired t tests were used to identify differences between the 2 elbow ROM measurement methods. P < .05 was considered significant.
Results
Eighty-four (44 male, 40 female) consecutive patients (85 elbows) met the inclusion and exclusion criteria. Mean age was 51 years (range, 19-84 years). Seventy-six patients were right-handed, 7 were left-handed, and dominance was unknown in 1 patient. The right elbow was affected in 45 patients, the left in 38, and both in 1 patient. There were 25 different diagnoses, the most common of which was lateral epicondylitis; 7 patients had multiple disorders (Table).
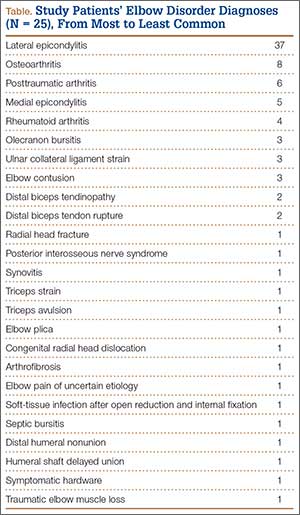
The first set of data, elbow ROM measurements, was taken with all 84 patients analyzed as a single group. In neutral humeral rotation, mean elbow extension was 14° (range, 10°-72°), and mean elbow flexion was 134° (range, 72°-145°). In external rotation, mean elbow extension was 20° (range, 12°-87°), and mean elbow flexion was 134° (range, 72°-145°). For the group, mean absolute difference in elbow extension was 8° (range, 0°-30°; P < .0001); there was no difference between external rotation and neutral rotation in flexion (Figure 2).
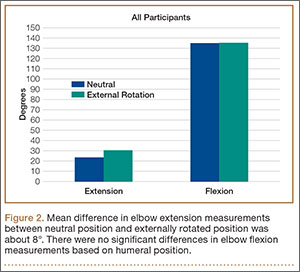
The data were reanalyzed after being stratified into 3 groups based on extent of elbow flexion contracture measured in supination.
The 9 elbows in group 1 (hyperextension) had mean extension of –2° (range, 10°-2°) and mean flexion of 141° (range, 130°-145°) in the neutral position. In external rotation, mean extension was –9° (range, –12° to –1°), and mean flexion was 141° (range, 130°-145°). When the 2 measurement positions were compared, group 1 had mean elbow ROM differences of –6° (range, –14° to 0°; P = .0033) for elbow extension and 0° for elbow flexion (Figure 3A).
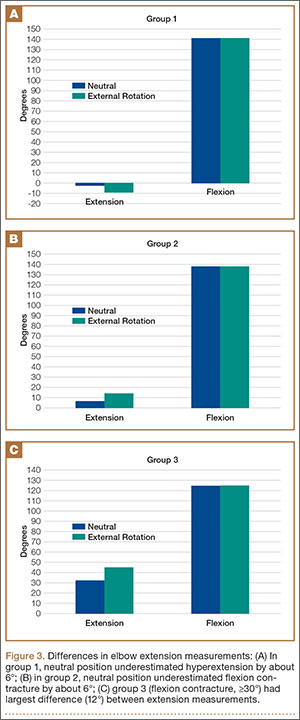
The 50 elbows in group 2 (0°-29° flexion contracture) had mean extension of 7° (range, 0°-20°) and mean flexion of 138° (range, 100°-145°) in the neutral position. In external rotation, mean extension was 13° (range, 0°-26°), and mean flexion was 138° (range, 100°-145°). Mean difference between neutral and external rotation measurements was 6° (range, 0°-20°; P < .0001) in extension and 0° in flexion (Figure 3B).
The 26 elbows in group 3 (≥30° flexion contracture) had mean extension of 33° (range, 0°-72°) and mean flexion of 124° (range, 72°-145°) in the neutral position. In external rotation, mean extension was 45° (range, 30°-87°), and mean flexion was 124° (range, 72°-145°). Mean difference between neutral and external rotation measurements was 12° (range, 0°-30°; P < .0001) in extension and 0° in flexion (Figure 3C).
Discussion
Elbow flexion arc measurements are crucial for patient outcomes and activities of daily living. Commonly cited as functional ROM, the 30°-to-130° flexion arc often is used to guide clinical decisions in patients with elbow disorders.1 However, our data indicate that humeral position can alter elbow ROM measurements. Specifically, because of neutral forearm pronosupination, measurements made with the humerus in neutral rotation underestimate both the extent of elbow hyperextension and the degree of flexion contracture (Figures 4A, 4B). The more severe the flexion contracture, the more values are altered by measurements taken in this position. The same does not apply for elbow flexion measurements, as varying humeral rotation did not significantly affect those values.
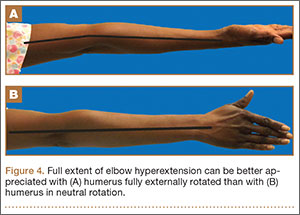
Our results indicate that patients evaluated with the arm in neutral humeral rotation had flexion contractures underestimated by a mean of 8°, while there was a negligible difference in flexion measurements. Stratifying our data into 3 groups, we found that neutral humeral rotation kept elbow extension measurements closer to 0° for patients with both hyperextension and contractures. With increasing severity of flexion contractures in groups 2 and 3, the measurement errors were magnified. The differences in extension measurement values between these 2 groups based on humeral rotation increased more than 4°—an indication that, as flexion contracture severity increases, so does the degree of measurement error when elbow extension is measured with the humerus in neutral rotation rather than external rotation.
Our literature review found no studies on ROM value differences based on position of humeral rotation. Most texts, in their descriptions of elbow ROM and biomechanics, make no reference to position of pronosupination at time of flexion arc measurement.5-8 Although many elbow authorities recommend taking elbow ROM measurements in full external rotation, we found no corroborating evidence.
Other investigators have evaluated the reliability of goniometer measurements.2,3 Rothstein and colleagues3 concluded that elbow and knee goniometric measurements are highly reliable in the clinical setting when taken by the same person. In particular, intratester reliability for elbow extension measurements was high. Armstrong and colleagues2 specifically examined intratester, intertester, and interdevice reliability and found that intratester reliability was much higher than intertester reliability for universal goniometry. In our study, all patients were measured with the same technique by the same orthopedic surgeon to eliminate any intertester reliability error. Armstrong and colleagues2 also found that intratester changes vis-a-vis extension measurements are meaningful when goniometric differences are more than 7°. In our study, the difference in extension measurements between the 2 humeral positions averaged 8° overall and 12° in group 3. This suggests that the data reported here reflect a true difference dependent on humeral rotation and are not a result of goniometer intratester variability.
Other studies have examined measurement devices other than the standard universal goniometer. Cleffken and colleagues4 found that the electronic digital inclinometer was reliable for elbow ROM measurements. Blonna and colleagues9 used digital photography–based goniometry to measure patient outcomes without doctor–patient contact at tertiary-care centers and found it to be more accurate and reliable than clinical goniometry in measuring elbow flexion and extension. Chapleau and colleagues10 compared the validity of goniometric elbow measurements in radiographic methods and concluded that the maximal error of goniometric measurements in extension was 10.3°. However, they also found high intraclass correlation coefficients for goniometric measurements. With the accepted clinical reliability of universal goniometry,2-4,10 we believe it to be the best clinical tool for this study because of its availability, minimal cost, and ease of use.
In the clinical setting, elbow flexion arc measurements are a major factor in treatment decisions and often dictate whether to proceed with operative interventions such as capsular release. In addition, ROM measurements are crucial in determining the success of treatments and the progression of disease. Erroneous elbow extension measurements can have significant consequences if they falsely indicate functional ROM when taken in neutral position. This is particularly true for patients with elbow flexion contractures of more than 30°, in whom differences in humeral rotation resulted in about 12° of variance between measured values. For instance, a patient with a true 40° flexion contracture in the externally rotated position could be determined to have functional ROM based on measurements made in the neutral position.
Limitations of this study include those involving goniometer reliability and intraobserver variability (already described) and the validity of goniometer measurements compared with radiographic measurements.
Conclusion
Because elbow goniometer extension measurements taken in neutral humeral rotation underestimate both the degree of elbow hyperextension and the degree of elbow flexion contracture, we recommend taking elbow flexion arc measurements in the true plane of motion, with the humerus externally rotated by fully supinating the forearm, such that the distal humeral condyles are parallel to the floor.
1. Morrey BF, Askew LJ, Chao EY. A biomechanical study of normal functional elbow motion. J Bone Joint Surg Am. 1981;63(6):872-877.
2. Armstrong AD, MacDermid JC, Chinchalkar S, Stevens RS, King GJ. Reliability of range-of-motion measurement in the elbow and forearm. J Shoulder Elbow Surg. 1998;7(6):573-580.
3. Rothstein JM, Miller PJ, Roettger RF. Goniometric reliability in a clinical setting. Elbow and knee measurements. Phys Ther. 1983;63(10):1611-1615.
4. Cleffken B, van Breukelen G, van Mameren H, Brink P, Olde Damink S. Test–retest reproducibility of elbow goniometric measurements in a rigid double-blinded protocol: intervals for distinguishing between measurement error and clinical change. J Shoulder Elbow Surg. 2007;16(6):788-794.
5. Hoppenfeld S. Physical Examination of the Spine and Extremities. Englewood Cliffs, NJ: Prentice-Hall; 1976.
6. Miller RM 3rd, Azar FM, Throckmorton TW. Shoulder and elbow injuries. In: Canale S, Beaty J, eds. Campbell’s Operative Orthopaedics. 12th ed. Philadelphia, PA: Mosby Elsevier; 2013:2241-2253.
7. Ring D. Elbow fractures and dislocations. In: Bucholz R, Heckman J, Court-Brown C, eds. Rockwood and Green’s Fractures in Adults. 6th ed. Philadelphia, PA: Lippincott Williams & Wilkins; 2006:901-991.
8. Katolik LI, Cohen MS. Lateral columnar release for extracapsular elbow contracture. In: Wiesel S, ed. Operative Techniques in Orthopaedic Surgery. Philadelphia, PA: Lippincott Williams & Wilkins; 2011:3406-3407.
9. Blonna D, Zarkadas PC, Fitzsimmons JS, O’Driscoll SW. Validation of a photography-based goniometry method for measuring joint range of motion. J Shoulder Elbow Surg. 2012;21(1):29-35.
10. Chapleau J, Canet F, Petit Y, Laflamme G, Rouleau D. Validity of elbow goniometer measurements. Comparative study with a radiographic method. Clin Orthop. 2001;(469):3134-3140.
Elbow motion is crucial for activities of daily living and full function of the upper extremity.1 Measuring the elbow flexion arc accurately and consistently is an important part of the physical examination of patients with elbow pathology. Orthopedic surgeons rely on these measurements to follow patients over time, and they often base their treatment decisions on the range and progression/regression of motion arc.
In the clinical setting, elbow range of motion (ROM) is commonly measured with a handheld goniometer.2,3 The literature also suggests that goniometric measurements are highly reliable in the clinical setting and that intrarater reliability of elbow ROM measurements is high.2-4 Despite the routine use and clinical importance of flexion arc assessment, there is no universal recommendation regarding optimal measurement position. Textbooks and journal articles commonly do not specify arm position at time of elbow ROM measurements,5-8 and a literature review found no studies directly addressing this issue.
From a biomechanical standpoint, humeral rotation is often affected by forearm pronosupination position. Although forearm pronosupination is a product of the motion at the radioulnar joints, forearm position during elbow flexion arc measurement can influence the relationship of the distal humeral intercondylar axis to the plane of measurement. Full forearm supination rotates the distal humeral intercondylar axis externally to a position parallel to the floor and in line with the plane of measurement. Humeral rotation with the forearm in neutral pronosupination places the humeral condyles internally rotated relative to the floor. Therefore, for the purposes of this study, we defined full humeral external rotation and true plane of ulnohumeral motion as full forearm supination, and relative humeral and ulnohumeral joint internal rotation as neutral pronosupination.
Because of the potential for elbow ROM measurement changes caused by differences in the motion plane in which measurements are taken, some have advocated taking flexion arc measurements with the arm in full supination to allow measurements to be taken in the true plane of motion. We hypothesized that elbow flexion arc measurements taken with the forearm in neutral rotation would underestimate the extent of elbow flexion contractures compared with measurements taken in full supination.
Materials and Methods
This study received institutional review board approval. Eighty-four patients who presented with elbow dysfunction to a single shoulder and elbow orthopedic surgeon enrolled in the study. Skeletally immature patients and patients with a fracture or other disorder that prohibited elbow ROM were excluded. A standard goniometer was used to measure elbow flexion and extension with the humerus in 2 positions: full external rotation and neutral rotation.
All goniometer measurements were made by the same surgeon (to eliminate interobserver reliability error) using a standardized technique with the patient sitting upright. The goniometer was positioned laterally with its center of rotation over the lateral epicondyle, aligned proximally with the humeral head and distally with the center of the wrist. Measurements were obtained sequentially with the hand in both positions. For external rotation measurements, the patient’s arm was fully supinated to bring the humeral condyles parallel to the floor. For neutral positioning, the patient’s arm was placed in the “thumb-up” position with the hand perpendicular to the horizontal axis of the floor (Figures 1A–1C).
Data collected included demographics, diagnosis, hand dominance, affected side, and elbow ROM measurements with the hand in the 2 positions. These data were compiled and analyzed for all patients and then stratified into 3 groups by extent of elbow flexion contracture in the supinated position (group 1, hyperextension; group 2, 0°-29° elbow extension; group 3, ≥30° flexion contracture).
Statistically, paired t tests were used to identify differences between the 2 elbow ROM measurement methods. P < .05 was considered significant.
Results
Eighty-four (44 male, 40 female) consecutive patients (85 elbows) met the inclusion and exclusion criteria. Mean age was 51 years (range, 19-84 years). Seventy-six patients were right-handed, 7 were left-handed, and dominance was unknown in 1 patient. The right elbow was affected in 45 patients, the left in 38, and both in 1 patient. There were 25 different diagnoses, the most common of which was lateral epicondylitis; 7 patients had multiple disorders (Table).
The first set of data, elbow ROM measurements, was taken with all 84 patients analyzed as a single group. In neutral humeral rotation, mean elbow extension was 14° (range, 10°-72°), and mean elbow flexion was 134° (range, 72°-145°). In external rotation, mean elbow extension was 20° (range, 12°-87°), and mean elbow flexion was 134° (range, 72°-145°). For the group, mean absolute difference in elbow extension was 8° (range, 0°-30°; P < .0001); there was no difference between external rotation and neutral rotation in flexion (Figure 2).
The data were reanalyzed after being stratified into 3 groups based on extent of elbow flexion contracture measured in supination.
The 9 elbows in group 1 (hyperextension) had mean extension of –2° (range, 10°-2°) and mean flexion of 141° (range, 130°-145°) in the neutral position. In external rotation, mean extension was –9° (range, –12° to –1°), and mean flexion was 141° (range, 130°-145°). When the 2 measurement positions were compared, group 1 had mean elbow ROM differences of –6° (range, –14° to 0°; P = .0033) for elbow extension and 0° for elbow flexion (Figure 3A).
The 50 elbows in group 2 (0°-29° flexion contracture) had mean extension of 7° (range, 0°-20°) and mean flexion of 138° (range, 100°-145°) in the neutral position. In external rotation, mean extension was 13° (range, 0°-26°), and mean flexion was 138° (range, 100°-145°). Mean difference between neutral and external rotation measurements was 6° (range, 0°-20°; P < .0001) in extension and 0° in flexion (Figure 3B).
The 26 elbows in group 3 (≥30° flexion contracture) had mean extension of 33° (range, 0°-72°) and mean flexion of 124° (range, 72°-145°) in the neutral position. In external rotation, mean extension was 45° (range, 30°-87°), and mean flexion was 124° (range, 72°-145°). Mean difference between neutral and external rotation measurements was 12° (range, 0°-30°; P < .0001) in extension and 0° in flexion (Figure 3C).
Discussion
Elbow flexion arc measurements are crucial for patient outcomes and activities of daily living. Commonly cited as functional ROM, the 30°-to-130° flexion arc often is used to guide clinical decisions in patients with elbow disorders.1 However, our data indicate that humeral position can alter elbow ROM measurements. Specifically, because of neutral forearm pronosupination, measurements made with the humerus in neutral rotation underestimate both the extent of elbow hyperextension and the degree of flexion contracture (Figures 4A, 4B). The more severe the flexion contracture, the more values are altered by measurements taken in this position. The same does not apply for elbow flexion measurements, as varying humeral rotation did not significantly affect those values.
Our results indicate that patients evaluated with the arm in neutral humeral rotation had flexion contractures underestimated by a mean of 8°, while there was a negligible difference in flexion measurements. Stratifying our data into 3 groups, we found that neutral humeral rotation kept elbow extension measurements closer to 0° for patients with both hyperextension and contractures. With increasing severity of flexion contractures in groups 2 and 3, the measurement errors were magnified. The differences in extension measurement values between these 2 groups based on humeral rotation increased more than 4°—an indication that, as flexion contracture severity increases, so does the degree of measurement error when elbow extension is measured with the humerus in neutral rotation rather than external rotation.
Our literature review found no studies on ROM value differences based on position of humeral rotation. Most texts, in their descriptions of elbow ROM and biomechanics, make no reference to position of pronosupination at time of flexion arc measurement.5-8 Although many elbow authorities recommend taking elbow ROM measurements in full external rotation, we found no corroborating evidence.
Other investigators have evaluated the reliability of goniometer measurements.2,3 Rothstein and colleagues3 concluded that elbow and knee goniometric measurements are highly reliable in the clinical setting when taken by the same person. In particular, intratester reliability for elbow extension measurements was high. Armstrong and colleagues2 specifically examined intratester, intertester, and interdevice reliability and found that intratester reliability was much higher than intertester reliability for universal goniometry. In our study, all patients were measured with the same technique by the same orthopedic surgeon to eliminate any intertester reliability error. Armstrong and colleagues2 also found that intratester changes vis-a-vis extension measurements are meaningful when goniometric differences are more than 7°. In our study, the difference in extension measurements between the 2 humeral positions averaged 8° overall and 12° in group 3. This suggests that the data reported here reflect a true difference dependent on humeral rotation and are not a result of goniometer intratester variability.
Other studies have examined measurement devices other than the standard universal goniometer. Cleffken and colleagues4 found that the electronic digital inclinometer was reliable for elbow ROM measurements. Blonna and colleagues9 used digital photography–based goniometry to measure patient outcomes without doctor–patient contact at tertiary-care centers and found it to be more accurate and reliable than clinical goniometry in measuring elbow flexion and extension. Chapleau and colleagues10 compared the validity of goniometric elbow measurements in radiographic methods and concluded that the maximal error of goniometric measurements in extension was 10.3°. However, they also found high intraclass correlation coefficients for goniometric measurements. With the accepted clinical reliability of universal goniometry,2-4,10 we believe it to be the best clinical tool for this study because of its availability, minimal cost, and ease of use.
In the clinical setting, elbow flexion arc measurements are a major factor in treatment decisions and often dictate whether to proceed with operative interventions such as capsular release. In addition, ROM measurements are crucial in determining the success of treatments and the progression of disease. Erroneous elbow extension measurements can have significant consequences if they falsely indicate functional ROM when taken in neutral position. This is particularly true for patients with elbow flexion contractures of more than 30°, in whom differences in humeral rotation resulted in about 12° of variance between measured values. For instance, a patient with a true 40° flexion contracture in the externally rotated position could be determined to have functional ROM based on measurements made in the neutral position.
Limitations of this study include those involving goniometer reliability and intraobserver variability (already described) and the validity of goniometer measurements compared with radiographic measurements.
Conclusion
Because elbow goniometer extension measurements taken in neutral humeral rotation underestimate both the degree of elbow hyperextension and the degree of elbow flexion contracture, we recommend taking elbow flexion arc measurements in the true plane of motion, with the humerus externally rotated by fully supinating the forearm, such that the distal humeral condyles are parallel to the floor.
1. Morrey BF, Askew LJ, Chao EY. A biomechanical study of normal functional elbow motion. J Bone Joint Surg Am. 1981;63(6):872-877.
2. Armstrong AD, MacDermid JC, Chinchalkar S, Stevens RS, King GJ. Reliability of range-of-motion measurement in the elbow and forearm. J Shoulder Elbow Surg. 1998;7(6):573-580.
3. Rothstein JM, Miller PJ, Roettger RF. Goniometric reliability in a clinical setting. Elbow and knee measurements. Phys Ther. 1983;63(10):1611-1615.
4. Cleffken B, van Breukelen G, van Mameren H, Brink P, Olde Damink S. Test–retest reproducibility of elbow goniometric measurements in a rigid double-blinded protocol: intervals for distinguishing between measurement error and clinical change. J Shoulder Elbow Surg. 2007;16(6):788-794.
5. Hoppenfeld S. Physical Examination of the Spine and Extremities. Englewood Cliffs, NJ: Prentice-Hall; 1976.
6. Miller RM 3rd, Azar FM, Throckmorton TW. Shoulder and elbow injuries. In: Canale S, Beaty J, eds. Campbell’s Operative Orthopaedics. 12th ed. Philadelphia, PA: Mosby Elsevier; 2013:2241-2253.
7. Ring D. Elbow fractures and dislocations. In: Bucholz R, Heckman J, Court-Brown C, eds. Rockwood and Green’s Fractures in Adults. 6th ed. Philadelphia, PA: Lippincott Williams & Wilkins; 2006:901-991.
8. Katolik LI, Cohen MS. Lateral columnar release for extracapsular elbow contracture. In: Wiesel S, ed. Operative Techniques in Orthopaedic Surgery. Philadelphia, PA: Lippincott Williams & Wilkins; 2011:3406-3407.
9. Blonna D, Zarkadas PC, Fitzsimmons JS, O’Driscoll SW. Validation of a photography-based goniometry method for measuring joint range of motion. J Shoulder Elbow Surg. 2012;21(1):29-35.
10. Chapleau J, Canet F, Petit Y, Laflamme G, Rouleau D. Validity of elbow goniometer measurements. Comparative study with a radiographic method. Clin Orthop. 2001;(469):3134-3140.
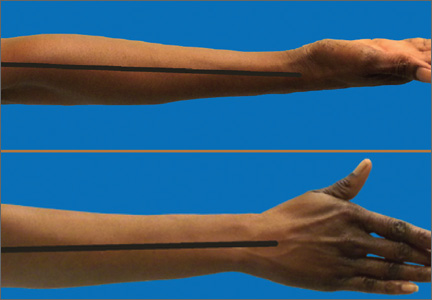
Sports Activity After Reverse Total Shoulder Arthroplasty With Minimum 2-Year Follow-Up
The treatment of patients with severe shoulder pain and disability combined with a nonfunctional rotator cuff was a clinical challenge until the development of the reverse total shoulder arthroplasty (RTSA).1-3 Massive rotator cuff tears can leave patients with a pseudoparalytic upper extremity and may result in advanced arthritis of the joint because of altered mechanical and nutritional factors.4 In this setting, simply replacing the arthritic joint with standard total shoulder arthroplasty (TSA) is not recommended because it does not address the functional deficits, and it has poor long-term outcomes.3,5 RTSA works by changing the center of rotation of the shoulder joint so that the deltoid muscle can be used to elevate the arm.6,7 The 4 rotator cuff muscles are not required for forward elevation or stability of this constrained implant.6,8
Current indications for RTSA are cuff tear arthropathy, complex proximal humerus fractures, and revision from hemiarthroplasty or TSA with rotator cuff dysfunction. Patients with advanced cuff tear arthropathy have minimal forward elevation and pseudoparalysis. Previous studies have shown mean preoperative forward flexion of 55º and mean ASES (American Shoulder and Elbow Surgeons) Standardized Shoulder Assessment Form score of 34.3.9 Thus, minimal overhead activity is possible without RTSA. Advances in the RTSA technique have led to promising results (excellent functional improvement), but there is limited information regarding the activity levels patients can achieve after surgery.7,9-11
We conducted a study of the types of sporting activities in which patients with RTSA could participate. We hypothesized that, relative to historic controls, patients with RTSA could return to low-intensity sporting activities with improvement in motion and ASES scores.
Materials and Methods
After this study received institutional review board approval, patients who had undergone RTSA at our institution between January 1, 2004 and December 31, 2010 were identified by the billing codes used for the procedure. Each patient who had RTSA performed during the study period was included in the study. Charts were then reviewed to extract demographic data, preoperative diagnosis, surgery date, operative side, dominant side, type of implant used, operative complications, and subsequent revisions. A questionnaire (Appendix) was designed and used to assess activity, functional status, pain, and satisfaction levels after RTSA. Patients had to be willing and able to complete this questionnaire in order to be included in the study.
The questionnaire included demographic questions; a list of 42 activities patients could choose from to describe their current activity level, activities they were able to perform before the surgery, and activities they wish they could perform; a list of reasons for any limitations; and questions about overall pain, strength, and satisfaction with the procedure. In addition, there was an open-ended question for activities that may not have been listed. The questionnaire also included a validated method for assessing shoulder range of motion (ROM) at home, where patients rated their overhead motion according to standardized physical landmarks, including the level of the shoulder, chin, eyebrows, top of head, and above head.12-14 Also provided was the ASES Standardized Shoulder Assessment Form, which features a 100-point visual analog scale for pain plus functional ability questions, with higher scores indicating less pain and better function.15,16 The minimal clinical significance in the ASES score is 6.4 points.17,18 Scores were recorded and analyzed. Student t test was used to calculate statistical differences between patients who had primary RTSA performed and patients who underwent revision RTSA.
Study personnel contacted patients by telephone and direct mailing. Patients who could not be reached initially were called at least 4 more times: twice during the weekday, once during the evening, and once on the weekend. Patients who could not be contacted by telephone were then cross-referenced with the Social Security database to see if any were deceased. Response data were tabulated, and patients were stratified into high-, moderate-, and low-intensity activity.
One of the 3 senior authors (Dr. Ahmad, Dr. Bigliani, Dr. Levine) performed the 95 RTSAs: 84 Zimmer (Warsaw, Indiana), 7 DePuy (Warsaw, Indiana), 4 Tornier (Minneapolis, Minnesota). The DePuy and Tornier implants were used when a 30-mm glenoid peg was required (before Zimmer offered this length in its system). The procedure was done with a deltopectoral approach with 20° of retroversion. In revision cases, the same approach was used, the hardware or implants were removed, and the position of the humeral component was determined based on the pectoralis major insertion and the deltoid tension. In 80% of cases, the subscapularis was not repaired; in the other 20%, it was. Whether it was repaired depended on tendon viability and surgeon preference, as subscapularis repair status has been shown not to affect functional outcome.19-21 No combined latissimus transfers were performed. Patients wore a sling the first 4 weeks after surgery (only wrist and elbow motion allowed) and then advanced to active shoulder ROM. Eight weeks after surgery, they began gentle shoulder strengthening.
Results
One hundred nine consecutive patients underwent RTSA at a single institution. Fifteen patients subsequently died, 14 could not be contacted, and 2 declined, leaving 78 patients available for clinical follow-up. Mean follow-up was 4.8 years (range 2-9 years). Mean (SD) age at surgery was 75.3 (7.5) years. Seventy-five percent of the patients were women. Sixty-one percent underwent surgery for cuff tear arthropathy, 31% for revision of previous arthroplasty or internal fixation, 7% for complex fractures, and 1% for tumor. Of the 24 revisions, 15 were for failed hemiarthroplasty, 3 were for failed TSA with rotator cuff dysfunction, 4 were for fracture with failed internal fixation, and 2 were for failed RTSA referred from other institutions. The dominant shoulder was involved 62% of the time. Preoperative active forward shoulder elevation was less than 90° in all patients. There were 10 complications: 2 dislocations that were closed-reduced and remained stable, 1 dislocation that required revision of the liner, 1 aseptic loosening in a patient who has declined revision, 2 dissociated glenosphere baseplates, 2 deep infections that required 2-stage exchanges, 1 deep infection that required a 2-stage exchange that was then complicated by dissociation of the glenosphere baseplate requiring revision, and 1 superficial infection that resolved with oral antibiotics.
After surgery, mean active forward elevation was 140°, mean active external rotation was 48°, and mean active internal rotation was to S1. Mean (SD) postoperative ASES score was 77.5 (23.4). Satisfaction level was high (mean, 8.3/10), and mean pain levels were low: 2.3 out of 10 on the visual analog scale and 44.0 (SD, 11.7) on the ASES pain component. Strength was rated a mean of good. Table 1 lists the clinical data for the primary and revision surgery patients.
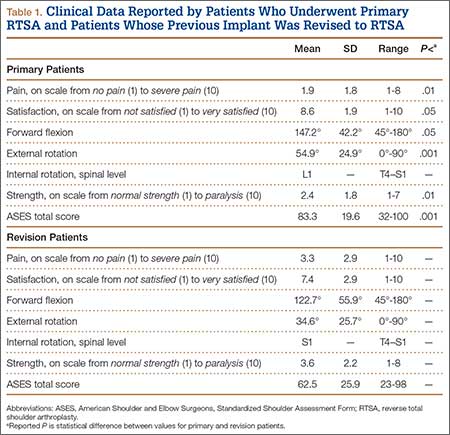
Eighteen patients (23.1%) returned to 24 different high-intensity activities, such as hunting, golf, and skiing; 38 patients (48.7%) returned to moderate-intensity activities, such as swimming, bowling, and raking leaves; and 22 patients (28.2%) returned to low-intensity activities, such as riding a stationary bike, playing a musical instrument, and walking (Table 2). Four patients played golf before and after RTSA, but neither of the 2 patients who played tennis before RTSA were able to do so after. Patients reported they engaged in their favorite leisure activity a mean of 4.8 times per week and a mean of 1.5 hours each time.
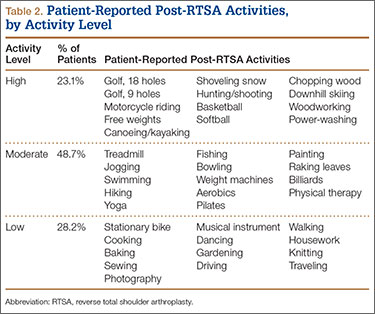
A medical problem was cited by 58% of patients as the reason for limited activity. These patients reported physical decline resulting from cardiac disease, diabetes, asthma/chronic obstructive pulmonary disease, or arthritis in other joints. Reasons for activity limitation are listed in Table 3. Post-RTSA activities that patients could not do for any reason are listed in Table 4. Activity limitations that patients attributed to the RTSA are listed in Table 5.
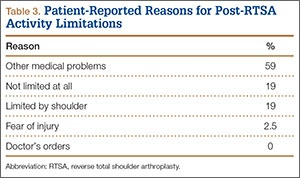
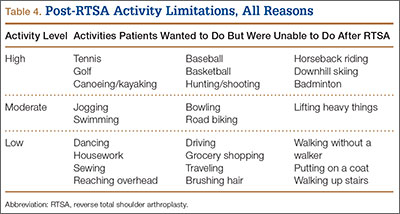
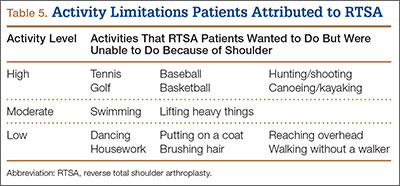
The majority of patients (57.7%) reported no change, from before RTSA to after RTSA, in being unable to do certain desired activities (eg, softball, target shooting, horseback riding, running, traveling). Sixteen patients (20.8%) reported being unable to return to an activity (eg, tennis, swimming, baseball, kayaking) they had been able to do before surgery. Most (69%) of those patients reported being unable to return to a moderate- or high-intensity activity after RTSA, but 81.8% were able to return to different moderate- or high-intensity activities.
Revision patients, who reported lower overhead activity levels, constituted 73% of the patients who felt their shoulder mechanically limited their activity, despite the fact that revisions constituted only 25% of the cases overall. Mean active ROM was statistically lower for revision patients than for primary patients (P < .05). Mean ASES score was statistically lower for the revision group (P < .001) and represented a clinically significant difference. Mean pain level was low (3.3) and satisfaction still generally high (7.4), but pain, satisfaction, and strength were about 1 point worse on average in the revision group than in the primary group.
Discussion
In the United States and other countries, RTSA implant survivorship is good.9,22 In this article, we have reported on post-RTSA activity levels, on the significant impact of comorbidities on this group, and on the negative effect of revisions on postoperative activity. Patients in this population reported that concomitant medical problems were the most important factor limiting their post-RTSA activity levels. Understanding and interpreting quality-of-life or functional scores in this elderly group must take into account the impact of comorbidities.23
Patients should have realistic postoperative expectations.24 In this study, some patients engaged in high-intensity overhead activities, such as golf, chopping wood, and shooting. However, the most difficulty was encountered trying to return to activities (eg, tennis, kayaking, archery, combing hair) that required external rotation in abduction.
Patients who had a previous implant (eg, hemiarthroplasty, TSA, failed internal fixation) revised to RTSA had lower activity levels and were 9 times more likely than primary patients to report having a mechanical shoulder limitation affecting their activity. Revision patients also had worse forward elevation, external rotation, pain, and satisfaction.
This study is limited in that it is retrospective. Subsequent prospective studies focused on younger patients who undergo primary RTSA may be useful if indications expand. In addition, subscapularis status and especially infraspinatus status may affect activity levels and could be analyzed in a study. Another limitation is that we did not specifically record detailed preoperative data, though all patients were known to have preoperative forward elevation of less than 90°.
In general, the primary measure of success for RTSA has been pain relief. Some studies have also reported on strength and ROM.2,20,25,26 A recent study using similar methodology demonstrated comparable ROM and low pain after RTSA, though revisions were not included in that study.26 In contrast to the present study, no patient in that study was able to play tennis or golf, but the reasons for the limited activity were not explored. In both studies, post-RTSA sports were generally of lower intensity than those played by patients after anatomical TSA.27
Overall, the majority of patients were very satisfied with their low pain level after RTSA. In addition, many patients not limited by other medical conditions were able to return to their pre-RTSA moderate-intensity recreational activities.
1. Baulot E, Chabernaud D, Grammont PM. Results of Grammont’s inverted prosthesis in omarthritis associated with major cuff destruction. Apropos of 16 cases [in French]. Acta Orthop Belg. 1995;61(suppl 1):112-119.
2. Sirveaux F, Favard L, Oudet D, Huquet D, Walch G, Molé D. Grammont inverted total shoulder arthroplasty in the treatment of glenohumeral osteoarthritis with massive rupture of the cuff. Results of a multicentre study of 80 shoulders. J Bone Joint Surg Br. 2004;86(3):388-395.
3. Franklin JL, Barrett WP, Jackins SE, Matsen FA 3rd. Glenoid loosening in total shoulder arthroplasty. Association with rotator cuff deficiency. J Arthroplasty. 1988;3(1):39-46.
4. Neer CS 2nd, Craig EV, Fukuda H. Cuff-tear arthropathy. J Bone Joint Surg Am. 1983;65(9):1232-1244.
5. Edwards TB, Boulahia A, Kempf JF, Boileau P, Nemoz C, Walch G. The influence of rotator cuff disease on the results of shoulder arthroplasty for primary osteoarthritis: results of a multicenter study. J Bone Joint Surg Am. 2002;84(12):2240-2248.
6. Boileau P, Watkinson DJ, Hatzidakis AM, Balg F. Grammont reverse prosthesis: design, rationale, and biomechanics. J Shoulder Elbow Surg. 2005;14(1 suppl S):147S-161S.
7. Nam D, Kepler CK, Neviaser AS, et al. Reverse total shoulder arthroplasty: current concepts, results, and component wear analysis. J Bone Joint Surg Am. 2010;92(suppl 2):23-35.
8. Ackland DC, Roshan-Zamir S, Richardson M, Pandy MG. Moment arms of the shoulder musculature after reverse total shoulder arthroplasty. J Bone Joint Surg Am. 2010;92(5):1221-1230.
9. Frankle M, Siegal S, Pupello D, Saleem A, Mighell M, Vasey M. The reverse shoulder prosthesis for glenohumeral arthritis associated with severe rotator cuff deficiency. A minimum two-year follow-up study of sixty patients. J Bone Joint Surg Am. 2005;87(8):1697-1705.
10. Cazeneuve JF, Cristofari DJ. Long term functional outcome following reverse shoulder arthroplasty in the elderly. Orthop Traumatol Surg Res. 2011;97(6):583-589.
11. Gerber C, Pennington, SD, Nyffeler RW. Reverse total shoulder arthroplasty. J Am Acad Orthop Surg. 2009;17(5):284-295.
12. Brophy RH, Beauvais RL, Jones EC, Cordasco FA, Marx RG. Measurement of shoulder activity level. Clin Orthop. 2005;(439):101-108.
13. Smith AM, Barnes SA, Sperling JW, Farrell CM, Cummings JD, Cofield RH. Patient and physician-assessed shoulder function after arthroplasty. J Bone Joint Surg Am. 2006;88(3):508-513.
14. Zarkadas PC, Throckmorton TQ, Dahm DL, Sperling J, Schleck CD, Cofield R. Patient reported activities after shoulder replacement: total and hemiarthroplasty. J Shoulder Elbow Surg. 2011;20(2):273-280.
15. Kocher, MS, Horan MP, Briggs KK, Richardson TR, O’Holleran J, Hawkins RJ. Reliability, validity, and responsiveness of the American Shoulder and Elbow Surgeons subjective shoulder scale in patients with shoulder instability, rotator cuff disease, and glenohumeral arthritis. J Bone Joint Surg Am. 2005;87(9):2006-2011.
16. Richards RR, An KN, Bigliani LU, et al. A standardized method for the assessment of shoulder function. J Shoulder Elbow Surg. 1994;3(6):347-352.
17. Michener LA, McClure PW, Sennett BJ. American Shoulder and Elbow Surgeons Standardized Shoulder Assessment Form, patient self-report section: reliability, validity, and responsiveness. J Shoulder Elbow Surg. 2002;11(6):587-594.
18. Hunsaker FG, Cioffi DA, Amadio PC, Wright JG, Caughlin B. The American Academy of Orthopaedic Surgeons outcomes instruments: normative values from the general population. J Bone Joint Surg Am. 2002;84(2):208-215.
19. Molé D, Favard L. Excentered scapulohumeral osteoarthritis [in French]. Rev Chir Orthop Reparatrice Appar Mot. 2007;93(6 suppl):37-94.
20. Clark JC, Ritchie J, Song FS, et al. Complication rates, dislocation, pain, and postoperative range of motion after reverse shoulder arthroplasty in patients with and without repair of the subscapularis. J Shoulder Elbow Surg. 2012;21(1):36-41.
21. Boulahia A, Edwards TB, Walch G, Baratta RV. Early results of a reverse design prosthesis in the treatment of arthritis of the shoulder in elderly patients with a large rotator cuff tear. Orthopedics. 2002;25(2):129-133.
22. Guery J, Favard L, Sirveaux F, Oudet D, Mole D, Walch G. Reverse total shoulder arthroplasty. Survivorship analysis of eighty replacements followed for five to ten years. J Bone Joint Surg Am. 2006;88(8):1742-1747.
23. Antuña SA, Sperling JW, Sánchez-Sotelo J, Cofield RH. Shoulder arthroplasty for proximal humeral nonunions. J Shoulder Elbow Surg. 2002;11(2):114-121.
24. Cheung E, Willis M, Walker M, Clark R, Frankle MA. Complications in reverse total shoulder arthroplasty. J Am Acad Orthop Surg. 2011;19(7):439-449.
25. Nolan BM, Ankerson E, Wiater JM. Reverse total shoulder arthroplasty improves function in cuff tear arthropathy. Clin Orthop. 2011;469(9):2476-2482.
26. Lawrence TM, Ahmadi S, Sanchez-Sotelo J, Sperling JW, Cofield RH. Patient reported activities after reverse shoulder arthroplasty: part II. J Shoulder Elbow Surg. 2012;21(11):1464-1469.
27. Schumann K, Flury MP, Schwyzer HK, Simmen BR, Drerup S, Goldhahn J. Sports activity after anatomical total shoulder arthroplasty. Am J Sports Med. 2010;38(10):2097-2105.
The treatment of patients with severe shoulder pain and disability combined with a nonfunctional rotator cuff was a clinical challenge until the development of the reverse total shoulder arthroplasty (RTSA).1-3 Massive rotator cuff tears can leave patients with a pseudoparalytic upper extremity and may result in advanced arthritis of the joint because of altered mechanical and nutritional factors.4 In this setting, simply replacing the arthritic joint with standard total shoulder arthroplasty (TSA) is not recommended because it does not address the functional deficits, and it has poor long-term outcomes.3,5 RTSA works by changing the center of rotation of the shoulder joint so that the deltoid muscle can be used to elevate the arm.6,7 The 4 rotator cuff muscles are not required for forward elevation or stability of this constrained implant.6,8
Current indications for RTSA are cuff tear arthropathy, complex proximal humerus fractures, and revision from hemiarthroplasty or TSA with rotator cuff dysfunction. Patients with advanced cuff tear arthropathy have minimal forward elevation and pseudoparalysis. Previous studies have shown mean preoperative forward flexion of 55º and mean ASES (American Shoulder and Elbow Surgeons) Standardized Shoulder Assessment Form score of 34.3.9 Thus, minimal overhead activity is possible without RTSA. Advances in the RTSA technique have led to promising results (excellent functional improvement), but there is limited information regarding the activity levels patients can achieve after surgery.7,9-11
We conducted a study of the types of sporting activities in which patients with RTSA could participate. We hypothesized that, relative to historic controls, patients with RTSA could return to low-intensity sporting activities with improvement in motion and ASES scores.
Materials and Methods
After this study received institutional review board approval, patients who had undergone RTSA at our institution between January 1, 2004 and December 31, 2010 were identified by the billing codes used for the procedure. Each patient who had RTSA performed during the study period was included in the study. Charts were then reviewed to extract demographic data, preoperative diagnosis, surgery date, operative side, dominant side, type of implant used, operative complications, and subsequent revisions. A questionnaire (Appendix) was designed and used to assess activity, functional status, pain, and satisfaction levels after RTSA. Patients had to be willing and able to complete this questionnaire in order to be included in the study.
The questionnaire included demographic questions; a list of 42 activities patients could choose from to describe their current activity level, activities they were able to perform before the surgery, and activities they wish they could perform; a list of reasons for any limitations; and questions about overall pain, strength, and satisfaction with the procedure. In addition, there was an open-ended question for activities that may not have been listed. The questionnaire also included a validated method for assessing shoulder range of motion (ROM) at home, where patients rated their overhead motion according to standardized physical landmarks, including the level of the shoulder, chin, eyebrows, top of head, and above head.12-14 Also provided was the ASES Standardized Shoulder Assessment Form, which features a 100-point visual analog scale for pain plus functional ability questions, with higher scores indicating less pain and better function.15,16 The minimal clinical significance in the ASES score is 6.4 points.17,18 Scores were recorded and analyzed. Student t test was used to calculate statistical differences between patients who had primary RTSA performed and patients who underwent revision RTSA.
Study personnel contacted patients by telephone and direct mailing. Patients who could not be reached initially were called at least 4 more times: twice during the weekday, once during the evening, and once on the weekend. Patients who could not be contacted by telephone were then cross-referenced with the Social Security database to see if any were deceased. Response data were tabulated, and patients were stratified into high-, moderate-, and low-intensity activity.
One of the 3 senior authors (Dr. Ahmad, Dr. Bigliani, Dr. Levine) performed the 95 RTSAs: 84 Zimmer (Warsaw, Indiana), 7 DePuy (Warsaw, Indiana), 4 Tornier (Minneapolis, Minnesota). The DePuy and Tornier implants were used when a 30-mm glenoid peg was required (before Zimmer offered this length in its system). The procedure was done with a deltopectoral approach with 20° of retroversion. In revision cases, the same approach was used, the hardware or implants were removed, and the position of the humeral component was determined based on the pectoralis major insertion and the deltoid tension. In 80% of cases, the subscapularis was not repaired; in the other 20%, it was. Whether it was repaired depended on tendon viability and surgeon preference, as subscapularis repair status has been shown not to affect functional outcome.19-21 No combined latissimus transfers were performed. Patients wore a sling the first 4 weeks after surgery (only wrist and elbow motion allowed) and then advanced to active shoulder ROM. Eight weeks after surgery, they began gentle shoulder strengthening.
Results
One hundred nine consecutive patients underwent RTSA at a single institution. Fifteen patients subsequently died, 14 could not be contacted, and 2 declined, leaving 78 patients available for clinical follow-up. Mean follow-up was 4.8 years (range 2-9 years). Mean (SD) age at surgery was 75.3 (7.5) years. Seventy-five percent of the patients were women. Sixty-one percent underwent surgery for cuff tear arthropathy, 31% for revision of previous arthroplasty or internal fixation, 7% for complex fractures, and 1% for tumor. Of the 24 revisions, 15 were for failed hemiarthroplasty, 3 were for failed TSA with rotator cuff dysfunction, 4 were for fracture with failed internal fixation, and 2 were for failed RTSA referred from other institutions. The dominant shoulder was involved 62% of the time. Preoperative active forward shoulder elevation was less than 90° in all patients. There were 10 complications: 2 dislocations that were closed-reduced and remained stable, 1 dislocation that required revision of the liner, 1 aseptic loosening in a patient who has declined revision, 2 dissociated glenosphere baseplates, 2 deep infections that required 2-stage exchanges, 1 deep infection that required a 2-stage exchange that was then complicated by dissociation of the glenosphere baseplate requiring revision, and 1 superficial infection that resolved with oral antibiotics.
After surgery, mean active forward elevation was 140°, mean active external rotation was 48°, and mean active internal rotation was to S1. Mean (SD) postoperative ASES score was 77.5 (23.4). Satisfaction level was high (mean, 8.3/10), and mean pain levels were low: 2.3 out of 10 on the visual analog scale and 44.0 (SD, 11.7) on the ASES pain component. Strength was rated a mean of good. Table 1 lists the clinical data for the primary and revision surgery patients.
Eighteen patients (23.1%) returned to 24 different high-intensity activities, such as hunting, golf, and skiing; 38 patients (48.7%) returned to moderate-intensity activities, such as swimming, bowling, and raking leaves; and 22 patients (28.2%) returned to low-intensity activities, such as riding a stationary bike, playing a musical instrument, and walking (Table 2). Four patients played golf before and after RTSA, but neither of the 2 patients who played tennis before RTSA were able to do so after. Patients reported they engaged in their favorite leisure activity a mean of 4.8 times per week and a mean of 1.5 hours each time.
A medical problem was cited by 58% of patients as the reason for limited activity. These patients reported physical decline resulting from cardiac disease, diabetes, asthma/chronic obstructive pulmonary disease, or arthritis in other joints. Reasons for activity limitation are listed in Table 3. Post-RTSA activities that patients could not do for any reason are listed in Table 4. Activity limitations that patients attributed to the RTSA are listed in Table 5.
The majority of patients (57.7%) reported no change, from before RTSA to after RTSA, in being unable to do certain desired activities (eg, softball, target shooting, horseback riding, running, traveling). Sixteen patients (20.8%) reported being unable to return to an activity (eg, tennis, swimming, baseball, kayaking) they had been able to do before surgery. Most (69%) of those patients reported being unable to return to a moderate- or high-intensity activity after RTSA, but 81.8% were able to return to different moderate- or high-intensity activities.
Revision patients, who reported lower overhead activity levels, constituted 73% of the patients who felt their shoulder mechanically limited their activity, despite the fact that revisions constituted only 25% of the cases overall. Mean active ROM was statistically lower for revision patients than for primary patients (P < .05). Mean ASES score was statistically lower for the revision group (P < .001) and represented a clinically significant difference. Mean pain level was low (3.3) and satisfaction still generally high (7.4), but pain, satisfaction, and strength were about 1 point worse on average in the revision group than in the primary group.
Discussion
In the United States and other countries, RTSA implant survivorship is good.9,22 In this article, we have reported on post-RTSA activity levels, on the significant impact of comorbidities on this group, and on the negative effect of revisions on postoperative activity. Patients in this population reported that concomitant medical problems were the most important factor limiting their post-RTSA activity levels. Understanding and interpreting quality-of-life or functional scores in this elderly group must take into account the impact of comorbidities.23
Patients should have realistic postoperative expectations.24 In this study, some patients engaged in high-intensity overhead activities, such as golf, chopping wood, and shooting. However, the most difficulty was encountered trying to return to activities (eg, tennis, kayaking, archery, combing hair) that required external rotation in abduction.
Patients who had a previous implant (eg, hemiarthroplasty, TSA, failed internal fixation) revised to RTSA had lower activity levels and were 9 times more likely than primary patients to report having a mechanical shoulder limitation affecting their activity. Revision patients also had worse forward elevation, external rotation, pain, and satisfaction.
This study is limited in that it is retrospective. Subsequent prospective studies focused on younger patients who undergo primary RTSA may be useful if indications expand. In addition, subscapularis status and especially infraspinatus status may affect activity levels and could be analyzed in a study. Another limitation is that we did not specifically record detailed preoperative data, though all patients were known to have preoperative forward elevation of less than 90°.
In general, the primary measure of success for RTSA has been pain relief. Some studies have also reported on strength and ROM.2,20,25,26 A recent study using similar methodology demonstrated comparable ROM and low pain after RTSA, though revisions were not included in that study.26 In contrast to the present study, no patient in that study was able to play tennis or golf, but the reasons for the limited activity were not explored. In both studies, post-RTSA sports were generally of lower intensity than those played by patients after anatomical TSA.27
Overall, the majority of patients were very satisfied with their low pain level after RTSA. In addition, many patients not limited by other medical conditions were able to return to their pre-RTSA moderate-intensity recreational activities.
1. Baulot E, Chabernaud D, Grammont PM. Results of Grammont’s inverted prosthesis in omarthritis associated with major cuff destruction. Apropos of 16 cases [in French]. Acta Orthop Belg. 1995;61(suppl 1):112-119.
2. Sirveaux F, Favard L, Oudet D, Huquet D, Walch G, Molé D. Grammont inverted total shoulder arthroplasty in the treatment of glenohumeral osteoarthritis with massive rupture of the cuff. Results of a multicentre study of 80 shoulders. J Bone Joint Surg Br. 2004;86(3):388-395.
3. Franklin JL, Barrett WP, Jackins SE, Matsen FA 3rd. Glenoid loosening in total shoulder arthroplasty. Association with rotator cuff deficiency. J Arthroplasty. 1988;3(1):39-46.
4. Neer CS 2nd, Craig EV, Fukuda H. Cuff-tear arthropathy. J Bone Joint Surg Am. 1983;65(9):1232-1244.
5. Edwards TB, Boulahia A, Kempf JF, Boileau P, Nemoz C, Walch G. The influence of rotator cuff disease on the results of shoulder arthroplasty for primary osteoarthritis: results of a multicenter study. J Bone Joint Surg Am. 2002;84(12):2240-2248.
6. Boileau P, Watkinson DJ, Hatzidakis AM, Balg F. Grammont reverse prosthesis: design, rationale, and biomechanics. J Shoulder Elbow Surg. 2005;14(1 suppl S):147S-161S.
7. Nam D, Kepler CK, Neviaser AS, et al. Reverse total shoulder arthroplasty: current concepts, results, and component wear analysis. J Bone Joint Surg Am. 2010;92(suppl 2):23-35.
8. Ackland DC, Roshan-Zamir S, Richardson M, Pandy MG. Moment arms of the shoulder musculature after reverse total shoulder arthroplasty. J Bone Joint Surg Am. 2010;92(5):1221-1230.
9. Frankle M, Siegal S, Pupello D, Saleem A, Mighell M, Vasey M. The reverse shoulder prosthesis for glenohumeral arthritis associated with severe rotator cuff deficiency. A minimum two-year follow-up study of sixty patients. J Bone Joint Surg Am. 2005;87(8):1697-1705.
10. Cazeneuve JF, Cristofari DJ. Long term functional outcome following reverse shoulder arthroplasty in the elderly. Orthop Traumatol Surg Res. 2011;97(6):583-589.
11. Gerber C, Pennington, SD, Nyffeler RW. Reverse total shoulder arthroplasty. J Am Acad Orthop Surg. 2009;17(5):284-295.
12. Brophy RH, Beauvais RL, Jones EC, Cordasco FA, Marx RG. Measurement of shoulder activity level. Clin Orthop. 2005;(439):101-108.
13. Smith AM, Barnes SA, Sperling JW, Farrell CM, Cummings JD, Cofield RH. Patient and physician-assessed shoulder function after arthroplasty. J Bone Joint Surg Am. 2006;88(3):508-513.
14. Zarkadas PC, Throckmorton TQ, Dahm DL, Sperling J, Schleck CD, Cofield R. Patient reported activities after shoulder replacement: total and hemiarthroplasty. J Shoulder Elbow Surg. 2011;20(2):273-280.
15. Kocher, MS, Horan MP, Briggs KK, Richardson TR, O’Holleran J, Hawkins RJ. Reliability, validity, and responsiveness of the American Shoulder and Elbow Surgeons subjective shoulder scale in patients with shoulder instability, rotator cuff disease, and glenohumeral arthritis. J Bone Joint Surg Am. 2005;87(9):2006-2011.
16. Richards RR, An KN, Bigliani LU, et al. A standardized method for the assessment of shoulder function. J Shoulder Elbow Surg. 1994;3(6):347-352.
17. Michener LA, McClure PW, Sennett BJ. American Shoulder and Elbow Surgeons Standardized Shoulder Assessment Form, patient self-report section: reliability, validity, and responsiveness. J Shoulder Elbow Surg. 2002;11(6):587-594.
18. Hunsaker FG, Cioffi DA, Amadio PC, Wright JG, Caughlin B. The American Academy of Orthopaedic Surgeons outcomes instruments: normative values from the general population. J Bone Joint Surg Am. 2002;84(2):208-215.
19. Molé D, Favard L. Excentered scapulohumeral osteoarthritis [in French]. Rev Chir Orthop Reparatrice Appar Mot. 2007;93(6 suppl):37-94.
20. Clark JC, Ritchie J, Song FS, et al. Complication rates, dislocation, pain, and postoperative range of motion after reverse shoulder arthroplasty in patients with and without repair of the subscapularis. J Shoulder Elbow Surg. 2012;21(1):36-41.
21. Boulahia A, Edwards TB, Walch G, Baratta RV. Early results of a reverse design prosthesis in the treatment of arthritis of the shoulder in elderly patients with a large rotator cuff tear. Orthopedics. 2002;25(2):129-133.
22. Guery J, Favard L, Sirveaux F, Oudet D, Mole D, Walch G. Reverse total shoulder arthroplasty. Survivorship analysis of eighty replacements followed for five to ten years. J Bone Joint Surg Am. 2006;88(8):1742-1747.
23. Antuña SA, Sperling JW, Sánchez-Sotelo J, Cofield RH. Shoulder arthroplasty for proximal humeral nonunions. J Shoulder Elbow Surg. 2002;11(2):114-121.
24. Cheung E, Willis M, Walker M, Clark R, Frankle MA. Complications in reverse total shoulder arthroplasty. J Am Acad Orthop Surg. 2011;19(7):439-449.
25. Nolan BM, Ankerson E, Wiater JM. Reverse total shoulder arthroplasty improves function in cuff tear arthropathy. Clin Orthop. 2011;469(9):2476-2482.
26. Lawrence TM, Ahmadi S, Sanchez-Sotelo J, Sperling JW, Cofield RH. Patient reported activities after reverse shoulder arthroplasty: part II. J Shoulder Elbow Surg. 2012;21(11):1464-1469.
27. Schumann K, Flury MP, Schwyzer HK, Simmen BR, Drerup S, Goldhahn J. Sports activity after anatomical total shoulder arthroplasty. Am J Sports Med. 2010;38(10):2097-2105.
Emotional Distress, Barriers to Care, and Health-Related Quality of Life in Sickle Cell Disease
From the UCSF Benioff Children’s Hospital Oakland, Oakland, CA
Abstract
- Objective: Emotional distress may adversely affect the course and complicate treatment for individuals with sickle cell disease (SCD). We evaluated variables associated with physical and mental components of health-related quality of life (HRQL) in SCD in the context of a biobehavioral model.
- Methods: We conducted a cross-sectional cohort study of 77 adults with SCD (18–69 years; 60% female; 73% Hgb SS) attending an urban, academic medical center. We measured emotional distress (Patient Health Questionnaire–9, Generalized Anxiety Disorder 7-item scale), clinical complications and utilization, barriers to health care, sociodemo-graphics and HRQL (SF-36 Health Survey). We developed models predictive of physical and mental HRQL by conducting stepwise regression analyses.
- Results: Sample prevalence of moderate to severe depression and anxiety symptoms was 33% and 36%, respectively; prevalence of impaired physical and mental HRQL was 17% and 16%, respectively. Increased symptoms of depression, older age, and ≥ 3 emergency department visits in the previous 12 months were independently associated with lower ratings of physical HRQL, controlling for anxiety and sex. Increased symptoms of depression were independently associated with lower ratings of mental HRQL, controlling for barriers to care, insurance status, lifetime complications of SCD, and sex.
- Conclusion: Emotional distress is an important contributor to both physical and mental HRQL for adults with SCD, although sociodemographic variables and barriers to care must also be considered. Innovative approaches that integrate mental health interventions with SCD clinical care are needed.
Emotional distress, including symptoms of depression and anxiety, may adversely affect the course and complicate the treatment of chronic physical conditions [1]. For patients with sickle cell disease (SCD), a group of inherited red blood cell conditions, symptoms of depression and anxiety are more prevalent compared with rates found in the general population [2–8]. The most common symptom of SCD is acute pain events, and other complications range from mild to life-threatening, including anemia, increased risk of infection, acute chest syndrome, stroke, skin ulcers, and pulmonary hypertension [9]. Depression in adults with SCD has been associated with increased sickle cell vaso-occlusive pain events, poor pain control, multiple blood transfusions, and prescription of the disease-modifying therapy hydroxyurea [4]. Adults with SCD and comorbid depression and anxiety had more daily pain and greater distress and interference from pain compared with those who did not have comorbid depression or anxiety [10]. Patients have linked emotional distress and episodes of illness [11], and research has found a relation between pain episodes and depression [12]. In a diary study, negative mood was significantly higher on pain days compared with non-pain days [13].
Studies examining the consequences of emotional distress on health-related quality of life (HRQL) for patients with SCD are emerging. Depressed adults with SCD rated their quality of life on the SF-36 Health Survey [14] as significantly poorer in all areas compared with non-depressed adults with SCD [15]. In regression models, depression was a stronger predictor of SF-36 scores than demographics, hemoglobin type, and pain measures. In a multi-site study [16], 1046 adults with SCD completed the SF-36. Increasing age was associated with significantly lower scores on all subscales except mental health, while female sex additionally contributed to diminished physical function and vitality scale scores in multivariate models [16]. The presence of a mood disorder was associated with bodily pain, and diminished vitality, social functioning, emotional role, and the mental component of HRQL. Medical complications other than pain were not associated with impaired HRQL. Anie and colleagues [17,18] have highlighted the contributions of sickle cell–related pain to diminished mood and HRQL, both in the acute hospital phase and 1 week post discharge.
A comprehensive literature review of patient-reported outcomes for adults with SCD revealed broad categories of the impact of SCD and its treatment on the lives of adults [19]. Categories included pain and pain management, emotional distress, poor social role functioning, diminished overall quality of life, and poor quality of care. Follow-up individual and group interviews with adults with SCD (n = 122) as well as individual interviews with their providers (n = 15) revealed findings consistent with the literature review on the major effects of pain on the lives of adults with SCD, interwoven with emotional distress, poor quality of care, and stigmatization [19].
In the present study, our goal was to describe variables associated with physical and mental HRQL in SCD within the context of the recently published comprehensive conceptual model of broad clinical and life effects associated with SCD [19]. The present analysis uses an existing clinical database and evaluates the effects of the relations between clinical complications of SCD, emotional distress, health care utilization, and HRQL. Our model includes barriers to health care that might prevent vulnerable patients from accessing needed health care services. Sociodemographic variables including ethnic and racial minority status and lower socioeconomic status and educational attainment may create barriers to health care for patients with SCD, as they do for individuals with other chronic conditions [20–23]. Over 60% of patients with SCD are on public insurance [24] and can have difficulties with accessing quality health care [25]. Negative provider attitudes and stigmatization when patients are seeking care for acute pain episodes have been highlighted by patients as major barriers to seeking health care [19,26–28]. In a qualitative study, 45 youth with SCD reported that competing school or peer-group activities, “feeling good,” poor patient-provider relationships, adverse clinic experiences, and forgetting were barriers to clinic attendance [29]. Limited research suggests that barriers to accessing health care are associated with poorer HRQL [30,31]; however no studies were identified that directly evaluated the relation between barriers to care and HRQL for populations with SCD.
We hypothesized that clinical complications of SCD, including pain, and barriers to accessing health care would be independently associated with the physical component of HRQL for adult patients with SCD, controlling for demographic variables. Further, we hypothesized that emotional distress, clinical complications of SCD, and barriers to accessing health care would be independently associated with the mental component of HRQL for adult patients with SCD, controlling for demographic variables.
Methods
Patient Recruitment
Participants were 18 years and older and were a subgroup selected from a larger prospective cohort enrolled in the Sickle Cell Disease Treatment Demonstration Program (SCDTDP) funded by the Health Resources and Services Administration (HRSA). As 1 of 7 SCDTDP grantees, our network collected common demographic, disease-related, and HRQL data as the other grantees to examine sickle cell health and health care [32]. Enrollment at our site was n = 115 from birth through adult, with data collection occurring at baseline in 2010 and annually through 2014. Participants were eligible for enrollment if they had any confirmed diagnosis of SCD and if they were seen at any facility treating SCD in the San Francisco Bay Area region. Interpreter services were available where English was a second language; however, no participant requested those services. The data collection site was an urban comprehensive sickle cell center. Participants were recruited through mailings, posted flyers, or were introduced to the project by their clinical providers. The institutional review boards of the sponsoring hospitals approved all procedures. This report describes analyses from the baseline data collected in 2010 and excludes pediatric patients under the age of 18 years, as we developed our conceptual model based on the adult SCD literature.
Procedures
Patients directly contacted the project coordinator or were introduced by their health care provider. The project coordinator explained the study in more detail, and if the patient agreed to participate, the project coordinator obtained thier informed consent. Participants completed the study materials in a private space in the clinic immediately after or were scheduled for a separate visit at a convenient time and location. Participants with known or observed difficulties with reading completed the questionnaires as an interview. We allowed participants who were unable to complete the forms in one visit to take them home or schedule a follow-up visit to complete them. We asked participants who took the questionnaires home to return them within 2 business days and provided them with a stamped addressed envelope. Participants were compensated with gift cards for their involvement.
Measures
Demographics and Clinical Characteristics
Participants completed an Individual Utilization Questionnaire created for the SCDTDP grantees [32], either as an interview or in paper and pencil format. Participants indicated their age, race and ethnicity, education level, type of insurance, and annual household income. They indicated the type of SCD, number of hospital days and emergency department (ED) visits in the previous 12 months, disease-modifying therapies including hydroxyurea or transfusions, and lifetime incidence of sickle cell–related complications. Complications included pain, acute chest syndrome, fever, severe infection, stroke, kidney damage, gallbladder attack, spleen problems and priapism. Medical data was verified by reviewing medical records when possible; the clinical databases in the hematology/oncology department at the sponsoring hospital are maintained using Microsoft SQL Server, a relational database management system designed for the enterprise environment. However, not all of the participating institutions were linked via this common clinical database or by an electronic health record at the time the study was conducted.
Barriers to Care
We modified a checklist of barriers to accessing health care for patients with a range of chronic conditions [33] to create a SCD-specific checklist [34]. The final checklist consists of 53 items organized into 8 categories including insurance, transportation, accommodations and accessibility, provider knowledge and attitudes, social support, individual barriers such as forgetting or difficulties understanding instructions, emotional barriers such as fear or anger, and barriers posed by SCD itself (eg, pain, fatigue). Participants check off any applicable barrier, yielding a total score ranging from 0 to 53. The checklist overall has demonstrated face validity and test-retest reliability (Pearson r = 0.74, P < 0.05).
Depressive Symptoms
Adults with SCD completed the PHQ-9, the 9-item depression scale of the Patient Health Questionnaire [35]. The PHQ-9 is a tool for assisting primary care clinicians in assessing symptoms of depression, based on criteria from the Diagnostic and Statistical Manual 4th edition (DSM-IV [36]). The PHQ-9 asks about such symptoms as sleep disturbance and difficulty concentrating over the past 2 weeks with scores ranging from 0 (Not at all) to 3 (Every day). The total symptom count is based on the number of items in which the respondent answered as “more than half of days” or greater, and scores are categorized as reflecting no (< 10), mild (10–14), moderate (15–19) or severe (≥ 20) symptoms of depression. Respondents indicate how difficult the symptoms make it for them to engage in daily activities from 0 (Not difficult at all) to 3 (Extremely difficult). The sensitivity and diagnostic and criterion validity of the PHQ-9 have been established [37]. The internal consistency of the PHQ-9 is high, with α > 0.85 in several studies and 48-hour test-retest reliability of 0.84. The PHQ has been used widely, including with African-American and Hispanic populations, and with individuals with chronic conditions [38].
Symptoms of Anxiety
Participants completed the Generalized Anxiety Disorder 7-item (GAD-7) questionnaire for screening and measuring severity of generalized anxiety disorder [39]. The GAD-7 asks about such symptoms as feeling nervous, anxious, or on edge over the past two weeks. Scores from all 7 items are added to obtain a total score [40]. Cut-points of 5, 10, and 15 represent mild, moderate, and severe levels of anxiety symptoms. Respondents indicate how difficult the symptoms make it for them to engage in daily activities from 0 (Not difficult at all) to 3 (Extremely difficult). The internal consistency of the GAD-7 is excellent (α = 0.92). Test-retest reliability is also good (Pearson r = 0.83) as is procedural validity (intraclass correlation = 0.83). The GAD-7 has excellent sensitivity and specificity to identify generalized anxiety disorder [41].
Health-Related Quality of Life
Participants completed the SF-36, which asks about the patient’s health status in the past week [14]. Eight subscales include physical functioning, role-physical, bodily pain, general health, vitality, social functioning, role-emotional and mental health. Two summary measures, the Physical Component Summary and the Mental Component Summary, are calculated from 4 scales each. Use of the summary measures has been shown to increase the reliability of scores and improve the validity of scores in discriminating between physical and psychosocial outcomes [14]. Higher scores represent better HRQL, with a mean score of 50 (SD = 50) for the general population. Internal consistency estimates for the component summary scores are α > 0.89, item discriminant validity estimates are greater than 92.5% and 2-week test-retest reliability was excellent. Scores on the SF-36 have been divided into categories of HRQL functioning [42,43]. Participants in the impaired to very impaired category have scores ≤ mean – 1 SD while participants with average to above average functioning have scores > mean – 1 SD.
The SF-36 has been used extensively in observational and randomized studies for a range of illness conditions. In SCD, some aspects of HRQL as measured by the SF-36 improved for adult patients who responded to hydroxyurea [44]. Participants in the Pain in Sickle Cell Epidemiology Study scored lower than national norms on all SF-36 subscales except psychosocial functioning [45]. HRQL decreased significantly as daily pain intensity increased [45]. Further, women reported worse bodily pain compared with men [46].
Data Analyses
All biostatistical analyses were conducted using Stata 13 [47]. Continuous variables were examined for normality with measures of skewness and peakedness. All variables satisfied the assumptions of normality with the exception of barriers to health care and ED utilization. The variable barriers to health care was transformed using a square root transformation, resulting in a more normally distributed variable. ED utilization was dichotomized as 0–2 versus 3 or more ED visits in the previous 12 months, based on the distribution of utilization in the sample. The cutpoint of ≥ 3 annual ED visits is consistent with other literature on SCD clinical severity [48].
Descriptive statistics were computed to include means, standard deviations and frequencies. Sociodemographic variables (age, sex, insurance status [public or private] and income) were examined as potential covariates using Pearson correlations and t tests. Associations among emotional distress (anxiety and depression symptoms), clinical complications and ED utilization, barriers to health care, and the outcomes of the Physical and Mental Component Summary scores from the SF-36 were examined using Pearson correlations. We conducted stepwise regression with forward selection to determine models predictive of physical and mental HRQL. We tested the addition of each chosen variable (anxiety symptoms, depression symptoms, clinical complications, ED utilization, barriers to health care, age, sex, insurance status, and income), adding the variables (if any) that were most correlated with the outcome, and repeated the process until the model was not improved. A significance level of 0.05 was used for all statistical tests.
Results
Demographic and Clinical Characteristics
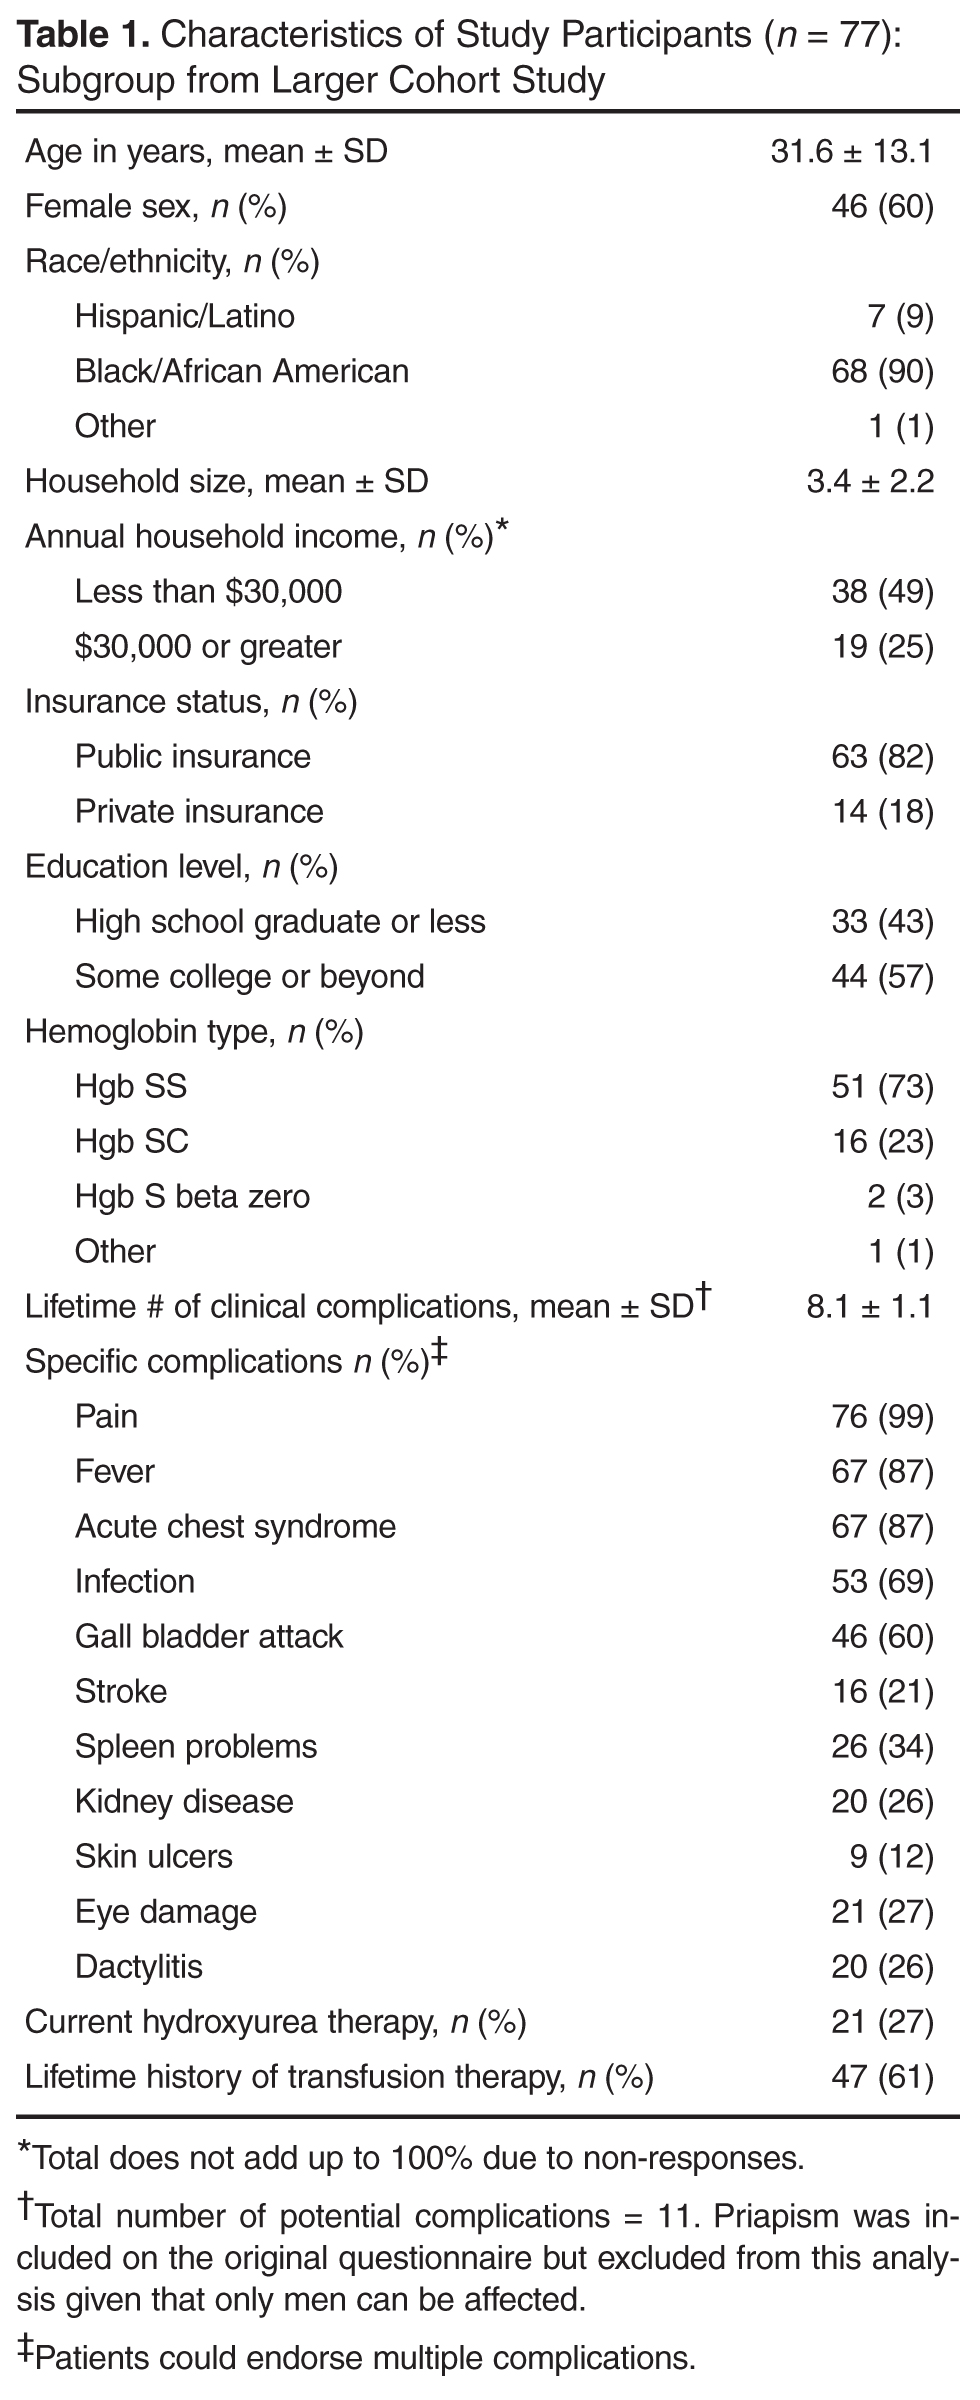
The majority of patients (73%) were diagnosed with Hgb SS disease and the most common lifetime complication was pain, reported by almost all of participants (Table 1). The next most common complication was fever, followed by acute chest syndrome. Twenty-seven percent of participants were currently on the disease-modifying therapy hydroxyurea, while 61% had a lifetime history of transfusion therapy. These data were verified with information from the clinical database for 73 participants (95%).
The median number of ED visits in the previous year was 1 (range, 0–50), with 19 patients (25%) with zero visits. The median number of hospital days in the previous year was 13 (range, 0–81). Twenty-nine patients (38%) had no hospital days in the previous year. These data were verified with information from the clinical database for 53 participants (69%), since hospital and ED visits occurred at institutions not always linked with the clinical databases at the sponsoring hospitals.
Emotional Distress, Barriers to Care, and Health-Related Quality of Life
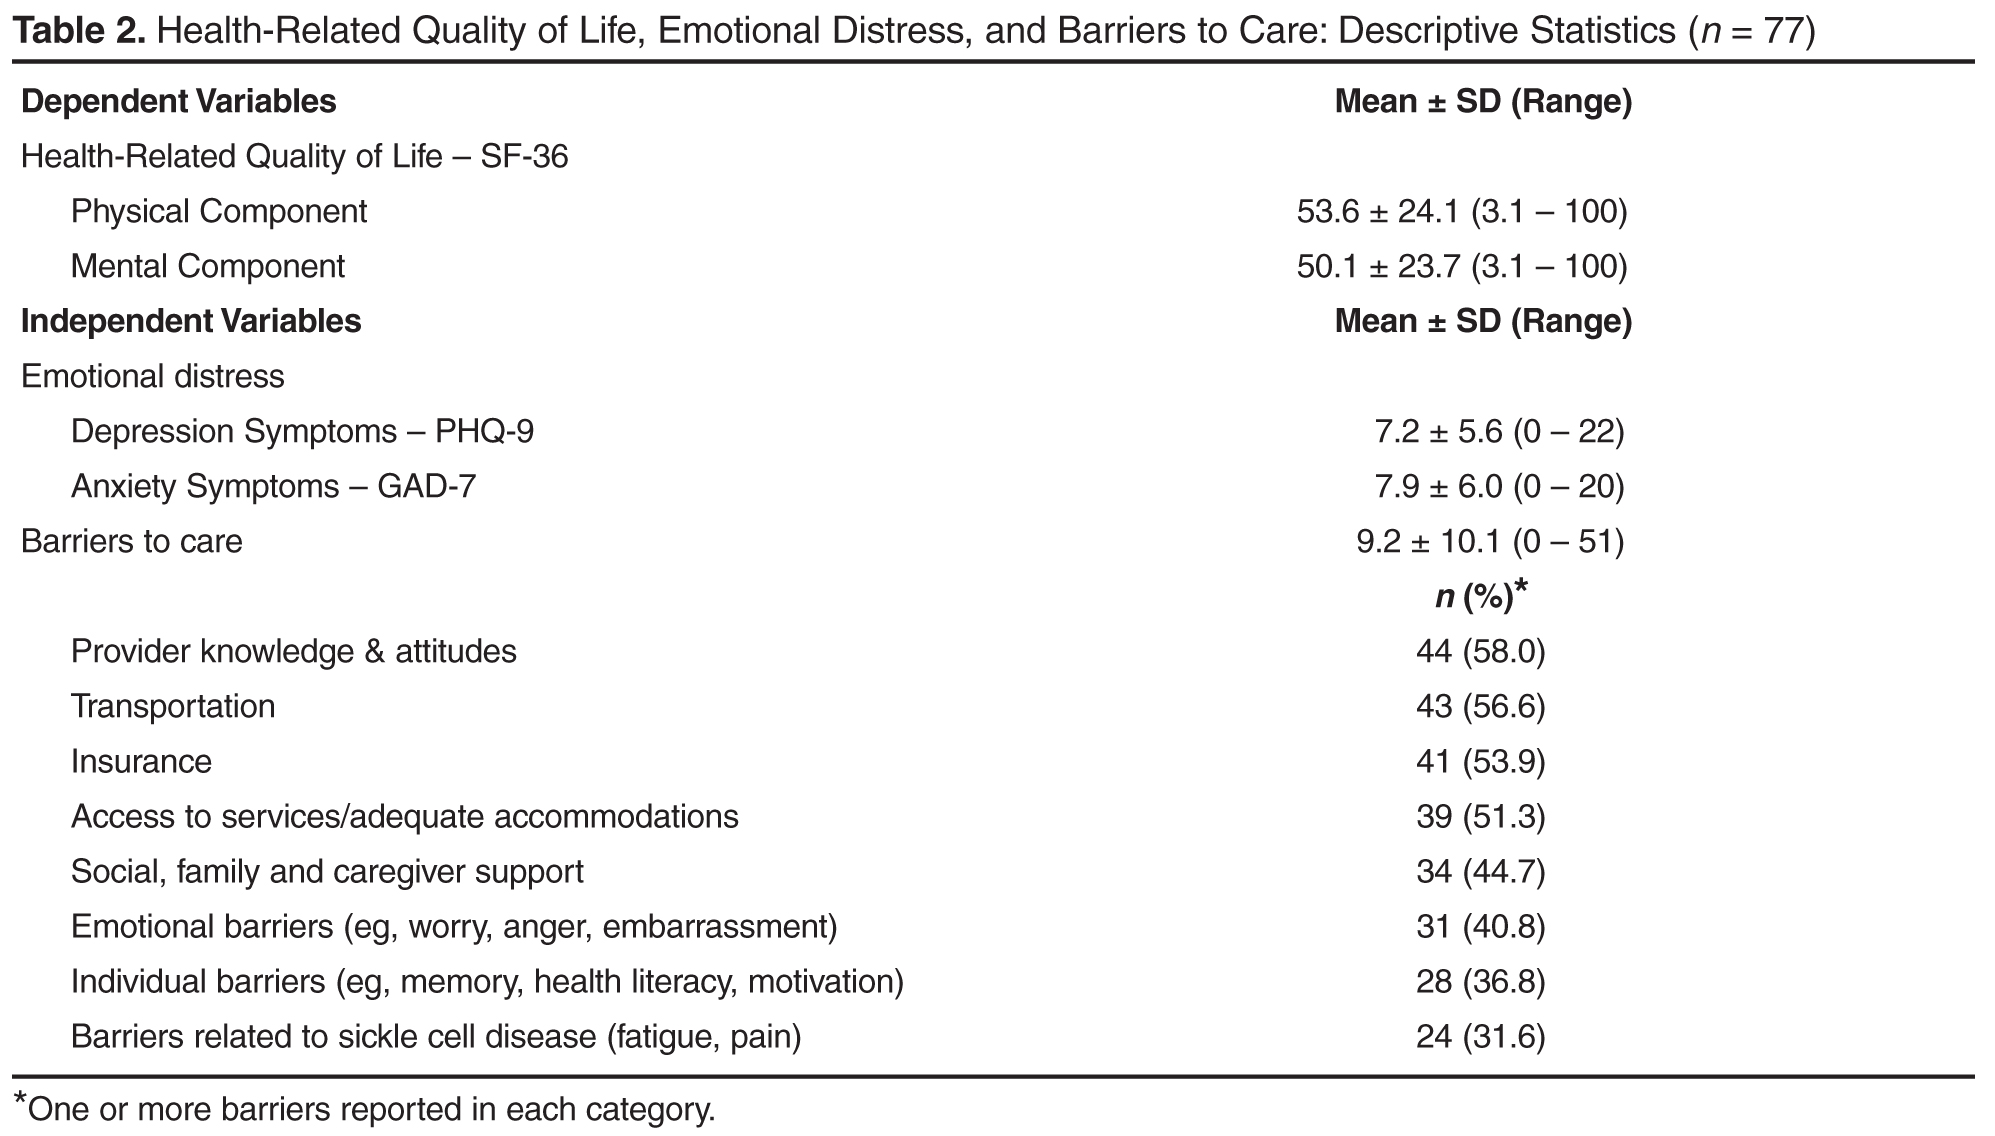
The mean score on the GAD-7 was 7.9 (SD = 6.0, α = 0.90, Table 2). The prevalence of moderate to severe symptoms of anxiety (scores ≥ 10) was 36.4% (n = 28). Fourteen patients with moderate to severe symptoms (50%) reported that anxiety symptoms created some difficulty in work, daily activities, or relationships. Twelve patients (43%) reported that symptoms created very much to extreme difficulty in work, daily activities, or relationships. Fifteen patients (29%) with moderate to severe symptoms of anxiety or depression exhibited comorbid anxiety and depression.
The mean Physical Component Summary score on the SF-36 was 53.6 (SD = 24.1, α = 0.94, Table 2). The prevalence of impaired to very impaired HRQL in the physical domain was 17% (n = 13). The mean Mental Component Summary score on the SF-36 for the sample was 50.1 (SD = 23.7, α = 0.93), with a prevalence of 16% (n = 12) in the impaired to very impaired range for HRQL in the mental domain.
The mean number of barriers from the barriers checklist was 9.2 (SD = 10.1) out of 53 possible. Sixty-five participants (86%) reported at least 1 barrier to accessing health care (Table 2). The most frequently cited barriers to care were provider knowledge and attitudes, followed by transportation, insurance, and access to services (eg, hours and location of services). Less frequently cited barriers to care were individual barriers, including memory, health literacy and motivation, as well as those related to SCD itself, ie, fatigue and pain.
Sociodemographic Variables, Emotional Distress, and Health-Related Quality of Life
Symptoms of anxiety and depression were highly correlated with one another, as would be expected (r = 0.75, P < 0.001). Physical and mental HRQL were significantly correlated with symptoms of depression (r = –0.67, P < 0.001 for physical HRQL component and r = –0.70 for mental HRQL component, P < 0.001), with impaired HRQL in both domains correlated with greater symptoms of depression. Physical and Mental Component Summary scores were significantly correlated with symptoms of anxiety (r = –0.58, P < 0.001 for the physical component and r = –0.62 for the mental component, P < 0.001), with impaired HRQL in both domains correlated with greater symptoms of anxiety. Ratings of difficulty with daily functioning from depressive symptoms were correlated with impaired HRQL in the physical (r = –0.46, P < 0.01) and mental domains (r = –0.52, P < 0.001). Ratings of difficulty with daily functioning from anxiety symptoms were also correlated with impaired HRQL in the physical (r = –0.58, P < 0.001) and mental domains (r = –0.63, P < 0.001). Reports of more barriers to health care were significantly correlated with reports of more depressive and anxiety symptoms (r = 0.53, P < 0.001 and r = 0.48, P < 0.001), with lower Mental Component Summary scores (r = –0.43, P < 0.05), and with more ED visits in the past year (r = 0.43, P < 0.05).
Relations Between Independent Variables and Outcomes
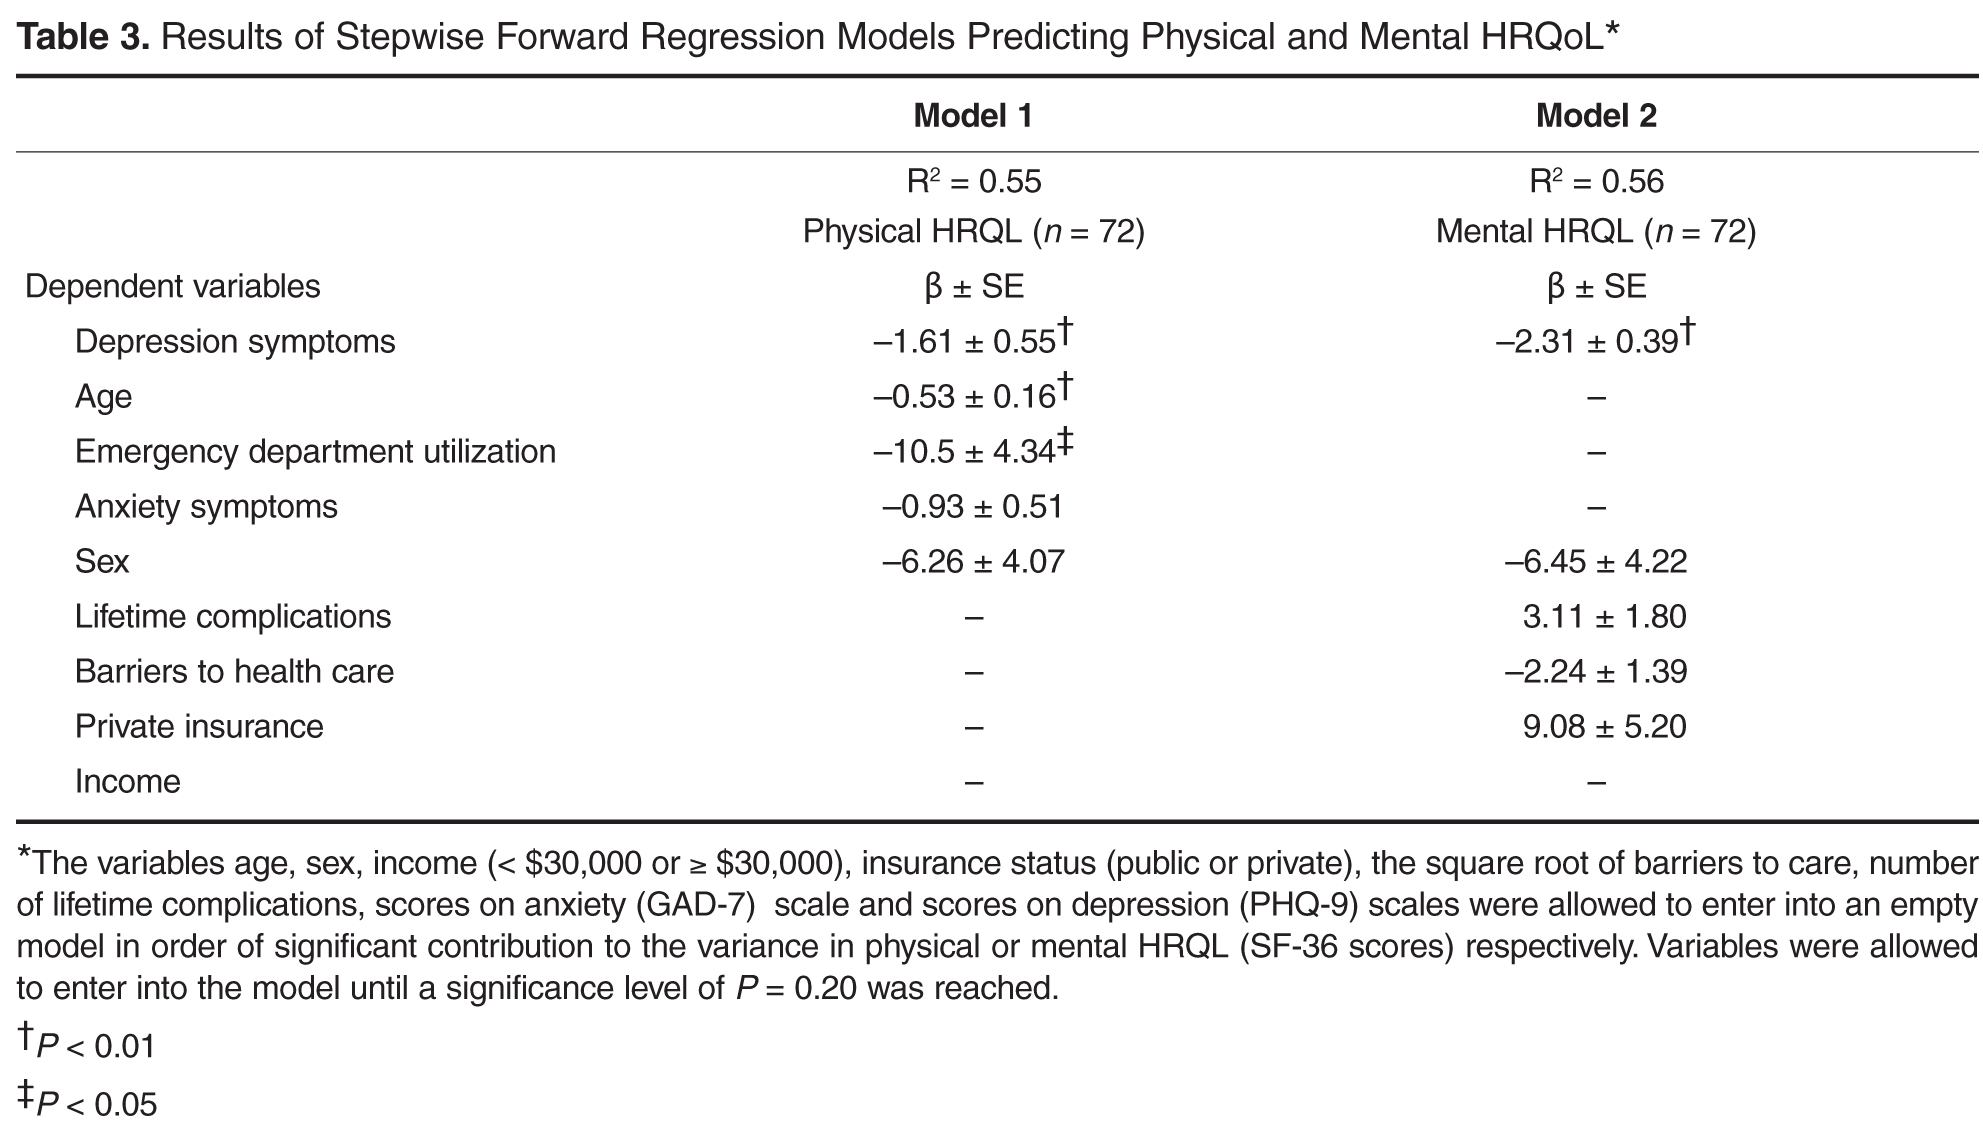
Discussion
Results of this study showed that as expected, symptoms of depression were independently associated with the mental component of HRQL, controlling for other variables. Symptoms of depression were also independently associated with the physical component of HRQL. The effect size for both models was moderate but comparable to effect sizes of other studies of predictive models of physical and mental HRQL in SCD [49]. Our findings were consistent with previous literature, with older age and increased ED utilization independently associated with lower ratings of physical HRQL, with sex and anxiety symptoms entering into the predictive model [15–18,44,45]. Contrary to our hypotheses, barriers to accessing health care were not independently associated with physical or mental HRQL but did contribute to the model for mental HRQL, as did clinical complications and private insurance status.
While our sample was similar to previous samples in mean age and percentage of women participants, our patients reported significantly higher physical HRQL scores, and a wider range of HRQL scores (eg, 53.6,
SD = 24.1 compared with 39.6, SD = 10.0 [16]). The mean Physical Component Summary score was in fact similar to the general population mean of 50. This may reflect improvements in quality of care and subsequent overall improved patient health and HRQL given that these data were collected in year 2 of the HRSA SCDTDP. As an SCDTDP grantee, we implemented goals to improve coordination of service delivery and to increase access to care. However, it should also be considered that there was a selection bias in our study, in favor of those with better HRQL. Nevertheless, as already noted, our findings are consistent with previous literature with regard to inter-relations between variables, ie, associations between lower physical HRQL ratings and symptoms of depression, older age, and increased ED utilization [15]. Future studies in SCD that directly evaluate reported access to a medical home in relation to HRQL are needed to assess the impact of access to care and care coordination on HRQL ratings.
Our use of a data collection tool that focused on lifetime rather than acute history of complications may have contributed to our failure to find a relation between clinical manifestations and physical HRQL. Further, we were not able to assess the effects of pain separately from other complications, since almost every participant reported a lifetime history of pain. However, our findings were consistent with those of researchers who have found psychosocial and sociodemographic factors, versus clinical manifestations, to be major influences on both physical and mental HRQL for individuals with SCD and other chronic and life-threatening conditions [15, 16, 50]. Our confidence is increased in this finding, given that we were able to verify self-reports of clinical manifestations with our clinical database. Our results contribute to the developing body of knowledge that emphasizes the importance of understanding the broad impact on the lives of adults of living with SCD, not just the physical symptomatology.
There has been limited research on barriers to accessing health care as associated with HRQL for SCD populations. Health care barriers have been identified for ethnic minorities, even within patient-centered medical homes, with minority status moderating the effect of barriers to care on HRQL [30]. Our findings that barriers to health care were correlated with depression and anxiety symptoms, mental HRQL, and greater ED utilization support the need to view SCD care within a biobehavioral framework. Health care provider negative attitudes and lack of knowledge were the most frequently cited barriers for adults in our study, particularly in the context of ED and inpatient care. These findings are similar to other studies that have highlighted the impact of these provider variables on quality of care [26,51]. We were not able to separate out effects of ethnic minority status, given that our patients were predominantly African American.
Contributors to poor HRQL that have been identified in SCD are poverty [42] and public insurance status [49]. While over half of our participants had family incomes of less than $30,000, despite a mean household size of 3 members, we did not find that income contributed to either of our models predicting physical or mental HRQL. Over half of our patients were well educated, which could have moderated the effect of their low incomes, but we did not measure other potential moderators such as active coping and supportive relationships [19]. These analyses were beyond the scope of our existing database, but future studies are needed on such resilience factors and processes. Our adults were predominantly on public insurance and we did find that private insurance status was positively associated with higher ratings of mental HRQL, consistent with other SCD research [49]. Taken together, our findings underscore the importance of considering the interplay between emotional distress, sociodemographic and clinical factors and quality of care in order to address risk factors for poor patient-reported outcomes [52,53].
There have not been previous reports of symptoms of emotional distress in SCD using the PHQ-9 and GAD-7, but both measures have been used widely for depression and anxiety screening, including with African-American populations. We selected these over other measures for their brevity, free availability, and psychometric properties. Our prevalence of moderate to severe depression and anxiety symptoms in the present study was similar to what has been found using other tools [2–8]. The PHQ-9 and GAD-7 also provide ratings of symptom interference on daily functioning, and we found that these ratings were associated with impaired physical and mental HRQL. Given that there generally are limited mental health resources in the communities where individuals with SCD reside and are treated, ratings of emotional distress and HRQL can be taken together to stratify those patients with the most immediate need for interventions. Further, screening can be used for early detection with the goal to intervene and prevent the progression of symptoms of emotional distress to long-term, disabling mental health disorders [54]. There is a need for innovative and cost-effective strategies for assessment and treatment of mental health symptoms and disorders for patients with SCD. One model for evidence-based practice in the management of emotional distress for patients with in SCD is the collaborative care model.
The collaborative care model integrates physical and mental health care in the patient-centered medical home and focuses on treating the whole person and family [55]. In this model, a care management staff (eg, nurse, social worker, psychologist) is integrated with the primary care team. The care management staff, in consultation with a psychiatrist, provides evidence-based care coordination, brief behavioral interventions, and support for other treatments, including medications. The effectiveness of collaborative care programs has been demonstrated for ethnic minority and safety net populations such as the SCD population, which is disproportionately low-income and on public insurance [56, 57]. Future research with SCD populations should investigate such interventions as the collaborative care model that addresses both emotional distress and barriers to care.
Limitations
Our results need to be interpreted with caution given the small sample size and the potential bias introduced by non-random sampling. In addition, as our patients are from an urban setting, findings might not generalize to rural populations. This study was cross sectional so no inferences can be made with regard to causality and temporal relations between anxiety symptoms, barriers to care, and HRQL. Our strategy for measuring total clinical complications and barriers to care conserved power but it was not possible to evaluate if specific complications or barriers may have exerted a greater impact on HRQL compared with others. Similarly, other studies have examined specific domains of HRQL, while we limited our analysis to the Physical and Mental Component Summary scores. The utilization questionnaire was designed to assess only lifetime complications, not complications more proximal to the HRQL ratings.
Patient-reported outcomes, now widely accepted as outcome measures, elicit patients’ descriptions of the impact of their condition on their day-to-day lives [34, 58–60]. However, measures of mental health symptoms and HRQL may be subject to recall bias, measurement error, and confounding [61,62]. Nevertheless, a range of studies support the idea that mental health symptoms and HRQL are distinct constructs, and that patients with physical and mental health symptoms are vulnerable to lower ratings of HRQL [63,64]. Disease-modifying therapies such as hydroxyurea can contribute to improved ratings of HRQL [44,65], but we were not able to evaluate the contribution of hydroxyurea to HRQL as it appears to have been underutilized in our sample.
Conclusion
We evaluated emotional distress and other variables in the context of a biobehavioral model of HRQL outcomes for adults with SCD. Integrating the patient's perspective of the impact of the disease and its treatment with assessment of clinical indications is critical to implementing and evaluating effective therapies [25]. However, there are conceptual challenges in determining what actually contributes to HRQL from the patient’s perspective in the context of genetic disorders such as SCD [50]. Our findings highlight the importance of incorporating comprehensive psychosocial screening in order to support optimal HRQL in SCD. Providers may be reluctant to include such screening if, as is often the case, mental health services are difficult to access. Models such as the collaborative care model, which include mental health interventions within the sickle cell center or primary care provider’s office, should be implented. Barriers to care and HRQL should also be routinely evaluated for patients with SCD. Use of disease-specific tools, such as the Adult Sickle Cell Quality of Life measurement system [66], may increase the specificity needed to detect differences within adults with SCD and improvements related to interventions, whether medical or psychosocial. Contributors to HRQL in SCD go beyond clinical manifestations to include psychological and social factors, as well as provider and health system variables. Research conducted within the framework of a comprehensive conceptual model of broad clinical and life effects associated with SCD can inform clinical applications that ultimately enhance HRQL for patients with SCD.
Acknowledgment: The authors wish to thank San Keller, PhD, for her helpful comments on a previous version of this manuscript.
Corresponding author: Marsha J. Treadwell, PhD, Hematology/Oncology Dept., UCSF Benioff Children’s Hospital Oakland, 747 52nd St., Oakland, CA 94609, mtreadwell@mail.cho.org.
Funding/support: This research was conducted as part of the National Initiative for Children’s Healthcare Quality (NICHQ) Working to Improve Sickle Cell Healthcare (WISCH) project. Further support came from a grant from the Health Resources and Services Administration (HRSA) Sickle Cell Disease Treatment Demonstration Project Grant No. U1EMC16492 and from the National Institutes of Health (NIH) Clinical and Translational Science Award UL1 RR024131. The views expressed in this publication do not necessarily reflect the views of WISCH, NICHQ, HRSA or NIH.
Financial disclosures: None.
Author contributions: conception and design, MJT; analysis and interpretation of data, MJT, GG; drafting of article, MJT, GG; critical revision of the article, MJT, KK, FB; statistical expertise, GG; obtaining of funding, MJT; administrative or technical support, KK, FB; collection and assembly of data, KK, FB.
From the UCSF Benioff Children’s Hospital Oakland, Oakland, CA
Abstract
- Objective: Emotional distress may adversely affect the course and complicate treatment for individuals with sickle cell disease (SCD). We evaluated variables associated with physical and mental components of health-related quality of life (HRQL) in SCD in the context of a biobehavioral model.
- Methods: We conducted a cross-sectional cohort study of 77 adults with SCD (18–69 years; 60% female; 73% Hgb SS) attending an urban, academic medical center. We measured emotional distress (Patient Health Questionnaire–9, Generalized Anxiety Disorder 7-item scale), clinical complications and utilization, barriers to health care, sociodemo-graphics and HRQL (SF-36 Health Survey). We developed models predictive of physical and mental HRQL by conducting stepwise regression analyses.
- Results: Sample prevalence of moderate to severe depression and anxiety symptoms was 33% and 36%, respectively; prevalence of impaired physical and mental HRQL was 17% and 16%, respectively. Increased symptoms of depression, older age, and ≥ 3 emergency department visits in the previous 12 months were independently associated with lower ratings of physical HRQL, controlling for anxiety and sex. Increased symptoms of depression were independently associated with lower ratings of mental HRQL, controlling for barriers to care, insurance status, lifetime complications of SCD, and sex.
- Conclusion: Emotional distress is an important contributor to both physical and mental HRQL for adults with SCD, although sociodemographic variables and barriers to care must also be considered. Innovative approaches that integrate mental health interventions with SCD clinical care are needed.
Emotional distress, including symptoms of depression and anxiety, may adversely affect the course and complicate the treatment of chronic physical conditions [1]. For patients with sickle cell disease (SCD), a group of inherited red blood cell conditions, symptoms of depression and anxiety are more prevalent compared with rates found in the general population [2–8]. The most common symptom of SCD is acute pain events, and other complications range from mild to life-threatening, including anemia, increased risk of infection, acute chest syndrome, stroke, skin ulcers, and pulmonary hypertension [9]. Depression in adults with SCD has been associated with increased sickle cell vaso-occlusive pain events, poor pain control, multiple blood transfusions, and prescription of the disease-modifying therapy hydroxyurea [4]. Adults with SCD and comorbid depression and anxiety had more daily pain and greater distress and interference from pain compared with those who did not have comorbid depression or anxiety [10]. Patients have linked emotional distress and episodes of illness [11], and research has found a relation between pain episodes and depression [12]. In a diary study, negative mood was significantly higher on pain days compared with non-pain days [13].
Studies examining the consequences of emotional distress on health-related quality of life (HRQL) for patients with SCD are emerging. Depressed adults with SCD rated their quality of life on the SF-36 Health Survey [14] as significantly poorer in all areas compared with non-depressed adults with SCD [15]. In regression models, depression was a stronger predictor of SF-36 scores than demographics, hemoglobin type, and pain measures. In a multi-site study [16], 1046 adults with SCD completed the SF-36. Increasing age was associated with significantly lower scores on all subscales except mental health, while female sex additionally contributed to diminished physical function and vitality scale scores in multivariate models [16]. The presence of a mood disorder was associated with bodily pain, and diminished vitality, social functioning, emotional role, and the mental component of HRQL. Medical complications other than pain were not associated with impaired HRQL. Anie and colleagues [17,18] have highlighted the contributions of sickle cell–related pain to diminished mood and HRQL, both in the acute hospital phase and 1 week post discharge.
A comprehensive literature review of patient-reported outcomes for adults with SCD revealed broad categories of the impact of SCD and its treatment on the lives of adults [19]. Categories included pain and pain management, emotional distress, poor social role functioning, diminished overall quality of life, and poor quality of care. Follow-up individual and group interviews with adults with SCD (n = 122) as well as individual interviews with their providers (n = 15) revealed findings consistent with the literature review on the major effects of pain on the lives of adults with SCD, interwoven with emotional distress, poor quality of care, and stigmatization [19].
In the present study, our goal was to describe variables associated with physical and mental HRQL in SCD within the context of the recently published comprehensive conceptual model of broad clinical and life effects associated with SCD [19]. The present analysis uses an existing clinical database and evaluates the effects of the relations between clinical complications of SCD, emotional distress, health care utilization, and HRQL. Our model includes barriers to health care that might prevent vulnerable patients from accessing needed health care services. Sociodemographic variables including ethnic and racial minority status and lower socioeconomic status and educational attainment may create barriers to health care for patients with SCD, as they do for individuals with other chronic conditions [20–23]. Over 60% of patients with SCD are on public insurance [24] and can have difficulties with accessing quality health care [25]. Negative provider attitudes and stigmatization when patients are seeking care for acute pain episodes have been highlighted by patients as major barriers to seeking health care [19,26–28]. In a qualitative study, 45 youth with SCD reported that competing school or peer-group activities, “feeling good,” poor patient-provider relationships, adverse clinic experiences, and forgetting were barriers to clinic attendance [29]. Limited research suggests that barriers to accessing health care are associated with poorer HRQL [30,31]; however no studies were identified that directly evaluated the relation between barriers to care and HRQL for populations with SCD.
We hypothesized that clinical complications of SCD, including pain, and barriers to accessing health care would be independently associated with the physical component of HRQL for adult patients with SCD, controlling for demographic variables. Further, we hypothesized that emotional distress, clinical complications of SCD, and barriers to accessing health care would be independently associated with the mental component of HRQL for adult patients with SCD, controlling for demographic variables.
Methods
Patient Recruitment
Participants were 18 years and older and were a subgroup selected from a larger prospective cohort enrolled in the Sickle Cell Disease Treatment Demonstration Program (SCDTDP) funded by the Health Resources and Services Administration (HRSA). As 1 of 7 SCDTDP grantees, our network collected common demographic, disease-related, and HRQL data as the other grantees to examine sickle cell health and health care [32]. Enrollment at our site was n = 115 from birth through adult, with data collection occurring at baseline in 2010 and annually through 2014. Participants were eligible for enrollment if they had any confirmed diagnosis of SCD and if they were seen at any facility treating SCD in the San Francisco Bay Area region. Interpreter services were available where English was a second language; however, no participant requested those services. The data collection site was an urban comprehensive sickle cell center. Participants were recruited through mailings, posted flyers, or were introduced to the project by their clinical providers. The institutional review boards of the sponsoring hospitals approved all procedures. This report describes analyses from the baseline data collected in 2010 and excludes pediatric patients under the age of 18 years, as we developed our conceptual model based on the adult SCD literature.
Procedures
Patients directly contacted the project coordinator or were introduced by their health care provider. The project coordinator explained the study in more detail, and if the patient agreed to participate, the project coordinator obtained thier informed consent. Participants completed the study materials in a private space in the clinic immediately after or were scheduled for a separate visit at a convenient time and location. Participants with known or observed difficulties with reading completed the questionnaires as an interview. We allowed participants who were unable to complete the forms in one visit to take them home or schedule a follow-up visit to complete them. We asked participants who took the questionnaires home to return them within 2 business days and provided them with a stamped addressed envelope. Participants were compensated with gift cards for their involvement.
Measures
Demographics and Clinical Characteristics
Participants completed an Individual Utilization Questionnaire created for the SCDTDP grantees [32], either as an interview or in paper and pencil format. Participants indicated their age, race and ethnicity, education level, type of insurance, and annual household income. They indicated the type of SCD, number of hospital days and emergency department (ED) visits in the previous 12 months, disease-modifying therapies including hydroxyurea or transfusions, and lifetime incidence of sickle cell–related complications. Complications included pain, acute chest syndrome, fever, severe infection, stroke, kidney damage, gallbladder attack, spleen problems and priapism. Medical data was verified by reviewing medical records when possible; the clinical databases in the hematology/oncology department at the sponsoring hospital are maintained using Microsoft SQL Server, a relational database management system designed for the enterprise environment. However, not all of the participating institutions were linked via this common clinical database or by an electronic health record at the time the study was conducted.
Barriers to Care
We modified a checklist of barriers to accessing health care for patients with a range of chronic conditions [33] to create a SCD-specific checklist [34]. The final checklist consists of 53 items organized into 8 categories including insurance, transportation, accommodations and accessibility, provider knowledge and attitudes, social support, individual barriers such as forgetting or difficulties understanding instructions, emotional barriers such as fear or anger, and barriers posed by SCD itself (eg, pain, fatigue). Participants check off any applicable barrier, yielding a total score ranging from 0 to 53. The checklist overall has demonstrated face validity and test-retest reliability (Pearson r = 0.74, P < 0.05).
Depressive Symptoms
Adults with SCD completed the PHQ-9, the 9-item depression scale of the Patient Health Questionnaire [35]. The PHQ-9 is a tool for assisting primary care clinicians in assessing symptoms of depression, based on criteria from the Diagnostic and Statistical Manual 4th edition (DSM-IV [36]). The PHQ-9 asks about such symptoms as sleep disturbance and difficulty concentrating over the past 2 weeks with scores ranging from 0 (Not at all) to 3 (Every day). The total symptom count is based on the number of items in which the respondent answered as “more than half of days” or greater, and scores are categorized as reflecting no (< 10), mild (10–14), moderate (15–19) or severe (≥ 20) symptoms of depression. Respondents indicate how difficult the symptoms make it for them to engage in daily activities from 0 (Not difficult at all) to 3 (Extremely difficult). The sensitivity and diagnostic and criterion validity of the PHQ-9 have been established [37]. The internal consistency of the PHQ-9 is high, with α > 0.85 in several studies and 48-hour test-retest reliability of 0.84. The PHQ has been used widely, including with African-American and Hispanic populations, and with individuals with chronic conditions [38].
Symptoms of Anxiety
Participants completed the Generalized Anxiety Disorder 7-item (GAD-7) questionnaire for screening and measuring severity of generalized anxiety disorder [39]. The GAD-7 asks about such symptoms as feeling nervous, anxious, or on edge over the past two weeks. Scores from all 7 items are added to obtain a total score [40]. Cut-points of 5, 10, and 15 represent mild, moderate, and severe levels of anxiety symptoms. Respondents indicate how difficult the symptoms make it for them to engage in daily activities from 0 (Not difficult at all) to 3 (Extremely difficult). The internal consistency of the GAD-7 is excellent (α = 0.92). Test-retest reliability is also good (Pearson r = 0.83) as is procedural validity (intraclass correlation = 0.83). The GAD-7 has excellent sensitivity and specificity to identify generalized anxiety disorder [41].
Health-Related Quality of Life
Participants completed the SF-36, which asks about the patient’s health status in the past week [14]. Eight subscales include physical functioning, role-physical, bodily pain, general health, vitality, social functioning, role-emotional and mental health. Two summary measures, the Physical Component Summary and the Mental Component Summary, are calculated from 4 scales each. Use of the summary measures has been shown to increase the reliability of scores and improve the validity of scores in discriminating between physical and psychosocial outcomes [14]. Higher scores represent better HRQL, with a mean score of 50 (SD = 50) for the general population. Internal consistency estimates for the component summary scores are α > 0.89, item discriminant validity estimates are greater than 92.5% and 2-week test-retest reliability was excellent. Scores on the SF-36 have been divided into categories of HRQL functioning [42,43]. Participants in the impaired to very impaired category have scores ≤ mean – 1 SD while participants with average to above average functioning have scores > mean – 1 SD.
The SF-36 has been used extensively in observational and randomized studies for a range of illness conditions. In SCD, some aspects of HRQL as measured by the SF-36 improved for adult patients who responded to hydroxyurea [44]. Participants in the Pain in Sickle Cell Epidemiology Study scored lower than national norms on all SF-36 subscales except psychosocial functioning [45]. HRQL decreased significantly as daily pain intensity increased [45]. Further, women reported worse bodily pain compared with men [46].
Data Analyses
All biostatistical analyses were conducted using Stata 13 [47]. Continuous variables were examined for normality with measures of skewness and peakedness. All variables satisfied the assumptions of normality with the exception of barriers to health care and ED utilization. The variable barriers to health care was transformed using a square root transformation, resulting in a more normally distributed variable. ED utilization was dichotomized as 0–2 versus 3 or more ED visits in the previous 12 months, based on the distribution of utilization in the sample. The cutpoint of ≥ 3 annual ED visits is consistent with other literature on SCD clinical severity [48].
Descriptive statistics were computed to include means, standard deviations and frequencies. Sociodemographic variables (age, sex, insurance status [public or private] and income) were examined as potential covariates using Pearson correlations and t tests. Associations among emotional distress (anxiety and depression symptoms), clinical complications and ED utilization, barriers to health care, and the outcomes of the Physical and Mental Component Summary scores from the SF-36 were examined using Pearson correlations. We conducted stepwise regression with forward selection to determine models predictive of physical and mental HRQL. We tested the addition of each chosen variable (anxiety symptoms, depression symptoms, clinical complications, ED utilization, barriers to health care, age, sex, insurance status, and income), adding the variables (if any) that were most correlated with the outcome, and repeated the process until the model was not improved. A significance level of 0.05 was used for all statistical tests.
Results
Demographic and Clinical Characteristics
The majority of patients (73%) were diagnosed with Hgb SS disease and the most common lifetime complication was pain, reported by almost all of participants (Table 1). The next most common complication was fever, followed by acute chest syndrome. Twenty-seven percent of participants were currently on the disease-modifying therapy hydroxyurea, while 61% had a lifetime history of transfusion therapy. These data were verified with information from the clinical database for 73 participants (95%).
The median number of ED visits in the previous year was 1 (range, 0–50), with 19 patients (25%) with zero visits. The median number of hospital days in the previous year was 13 (range, 0–81). Twenty-nine patients (38%) had no hospital days in the previous year. These data were verified with information from the clinical database for 53 participants (69%), since hospital and ED visits occurred at institutions not always linked with the clinical databases at the sponsoring hospitals.
Emotional Distress, Barriers to Care, and Health-Related Quality of Life
The mean score on the GAD-7 was 7.9 (SD = 6.0, α = 0.90, Table 2). The prevalence of moderate to severe symptoms of anxiety (scores ≥ 10) was 36.4% (n = 28). Fourteen patients with moderate to severe symptoms (50%) reported that anxiety symptoms created some difficulty in work, daily activities, or relationships. Twelve patients (43%) reported that symptoms created very much to extreme difficulty in work, daily activities, or relationships. Fifteen patients (29%) with moderate to severe symptoms of anxiety or depression exhibited comorbid anxiety and depression.
The mean Physical Component Summary score on the SF-36 was 53.6 (SD = 24.1, α = 0.94, Table 2). The prevalence of impaired to very impaired HRQL in the physical domain was 17% (n = 13). The mean Mental Component Summary score on the SF-36 for the sample was 50.1 (SD = 23.7, α = 0.93), with a prevalence of 16% (n = 12) in the impaired to very impaired range for HRQL in the mental domain.
The mean number of barriers from the barriers checklist was 9.2 (SD = 10.1) out of 53 possible. Sixty-five participants (86%) reported at least 1 barrier to accessing health care (Table 2). The most frequently cited barriers to care were provider knowledge and attitudes, followed by transportation, insurance, and access to services (eg, hours and location of services). Less frequently cited barriers to care were individual barriers, including memory, health literacy and motivation, as well as those related to SCD itself, ie, fatigue and pain.
Sociodemographic Variables, Emotional Distress, and Health-Related Quality of Life
Symptoms of anxiety and depression were highly correlated with one another, as would be expected (r = 0.75, P < 0.001). Physical and mental HRQL were significantly correlated with symptoms of depression (r = –0.67, P < 0.001 for physical HRQL component and r = –0.70 for mental HRQL component, P < 0.001), with impaired HRQL in both domains correlated with greater symptoms of depression. Physical and Mental Component Summary scores were significantly correlated with symptoms of anxiety (r = –0.58, P < 0.001 for the physical component and r = –0.62 for the mental component, P < 0.001), with impaired HRQL in both domains correlated with greater symptoms of anxiety. Ratings of difficulty with daily functioning from depressive symptoms were correlated with impaired HRQL in the physical (r = –0.46, P < 0.01) and mental domains (r = –0.52, P < 0.001). Ratings of difficulty with daily functioning from anxiety symptoms were also correlated with impaired HRQL in the physical (r = –0.58, P < 0.001) and mental domains (r = –0.63, P < 0.001). Reports of more barriers to health care were significantly correlated with reports of more depressive and anxiety symptoms (r = 0.53, P < 0.001 and r = 0.48, P < 0.001), with lower Mental Component Summary scores (r = –0.43, P < 0.05), and with more ED visits in the past year (r = 0.43, P < 0.05).
Relations Between Independent Variables and Outcomes
Discussion
Results of this study showed that as expected, symptoms of depression were independently associated with the mental component of HRQL, controlling for other variables. Symptoms of depression were also independently associated with the physical component of HRQL. The effect size for both models was moderate but comparable to effect sizes of other studies of predictive models of physical and mental HRQL in SCD [49]. Our findings were consistent with previous literature, with older age and increased ED utilization independently associated with lower ratings of physical HRQL, with sex and anxiety symptoms entering into the predictive model [15–18,44,45]. Contrary to our hypotheses, barriers to accessing health care were not independently associated with physical or mental HRQL but did contribute to the model for mental HRQL, as did clinical complications and private insurance status.
While our sample was similar to previous samples in mean age and percentage of women participants, our patients reported significantly higher physical HRQL scores, and a wider range of HRQL scores (eg, 53.6,
SD = 24.1 compared with 39.6, SD = 10.0 [16]). The mean Physical Component Summary score was in fact similar to the general population mean of 50. This may reflect improvements in quality of care and subsequent overall improved patient health and HRQL given that these data were collected in year 2 of the HRSA SCDTDP. As an SCDTDP grantee, we implemented goals to improve coordination of service delivery and to increase access to care. However, it should also be considered that there was a selection bias in our study, in favor of those with better HRQL. Nevertheless, as already noted, our findings are consistent with previous literature with regard to inter-relations between variables, ie, associations between lower physical HRQL ratings and symptoms of depression, older age, and increased ED utilization [15]. Future studies in SCD that directly evaluate reported access to a medical home in relation to HRQL are needed to assess the impact of access to care and care coordination on HRQL ratings.
Our use of a data collection tool that focused on lifetime rather than acute history of complications may have contributed to our failure to find a relation between clinical manifestations and physical HRQL. Further, we were not able to assess the effects of pain separately from other complications, since almost every participant reported a lifetime history of pain. However, our findings were consistent with those of researchers who have found psychosocial and sociodemographic factors, versus clinical manifestations, to be major influences on both physical and mental HRQL for individuals with SCD and other chronic and life-threatening conditions [15, 16, 50]. Our confidence is increased in this finding, given that we were able to verify self-reports of clinical manifestations with our clinical database. Our results contribute to the developing body of knowledge that emphasizes the importance of understanding the broad impact on the lives of adults of living with SCD, not just the physical symptomatology.
There has been limited research on barriers to accessing health care as associated with HRQL for SCD populations. Health care barriers have been identified for ethnic minorities, even within patient-centered medical homes, with minority status moderating the effect of barriers to care on HRQL [30]. Our findings that barriers to health care were correlated with depression and anxiety symptoms, mental HRQL, and greater ED utilization support the need to view SCD care within a biobehavioral framework. Health care provider negative attitudes and lack of knowledge were the most frequently cited barriers for adults in our study, particularly in the context of ED and inpatient care. These findings are similar to other studies that have highlighted the impact of these provider variables on quality of care [26,51]. We were not able to separate out effects of ethnic minority status, given that our patients were predominantly African American.
Contributors to poor HRQL that have been identified in SCD are poverty [42] and public insurance status [49]. While over half of our participants had family incomes of less than $30,000, despite a mean household size of 3 members, we did not find that income contributed to either of our models predicting physical or mental HRQL. Over half of our patients were well educated, which could have moderated the effect of their low incomes, but we did not measure other potential moderators such as active coping and supportive relationships [19]. These analyses were beyond the scope of our existing database, but future studies are needed on such resilience factors and processes. Our adults were predominantly on public insurance and we did find that private insurance status was positively associated with higher ratings of mental HRQL, consistent with other SCD research [49]. Taken together, our findings underscore the importance of considering the interplay between emotional distress, sociodemographic and clinical factors and quality of care in order to address risk factors for poor patient-reported outcomes [52,53].
There have not been previous reports of symptoms of emotional distress in SCD using the PHQ-9 and GAD-7, but both measures have been used widely for depression and anxiety screening, including with African-American populations. We selected these over other measures for their brevity, free availability, and psychometric properties. Our prevalence of moderate to severe depression and anxiety symptoms in the present study was similar to what has been found using other tools [2–8]. The PHQ-9 and GAD-7 also provide ratings of symptom interference on daily functioning, and we found that these ratings were associated with impaired physical and mental HRQL. Given that there generally are limited mental health resources in the communities where individuals with SCD reside and are treated, ratings of emotional distress and HRQL can be taken together to stratify those patients with the most immediate need for interventions. Further, screening can be used for early detection with the goal to intervene and prevent the progression of symptoms of emotional distress to long-term, disabling mental health disorders [54]. There is a need for innovative and cost-effective strategies for assessment and treatment of mental health symptoms and disorders for patients with SCD. One model for evidence-based practice in the management of emotional distress for patients with in SCD is the collaborative care model.
The collaborative care model integrates physical and mental health care in the patient-centered medical home and focuses on treating the whole person and family [55]. In this model, a care management staff (eg, nurse, social worker, psychologist) is integrated with the primary care team. The care management staff, in consultation with a psychiatrist, provides evidence-based care coordination, brief behavioral interventions, and support for other treatments, including medications. The effectiveness of collaborative care programs has been demonstrated for ethnic minority and safety net populations such as the SCD population, which is disproportionately low-income and on public insurance [56, 57]. Future research with SCD populations should investigate such interventions as the collaborative care model that addresses both emotional distress and barriers to care.
Limitations
Our results need to be interpreted with caution given the small sample size and the potential bias introduced by non-random sampling. In addition, as our patients are from an urban setting, findings might not generalize to rural populations. This study was cross sectional so no inferences can be made with regard to causality and temporal relations between anxiety symptoms, barriers to care, and HRQL. Our strategy for measuring total clinical complications and barriers to care conserved power but it was not possible to evaluate if specific complications or barriers may have exerted a greater impact on HRQL compared with others. Similarly, other studies have examined specific domains of HRQL, while we limited our analysis to the Physical and Mental Component Summary scores. The utilization questionnaire was designed to assess only lifetime complications, not complications more proximal to the HRQL ratings.
Patient-reported outcomes, now widely accepted as outcome measures, elicit patients’ descriptions of the impact of their condition on their day-to-day lives [34, 58–60]. However, measures of mental health symptoms and HRQL may be subject to recall bias, measurement error, and confounding [61,62]. Nevertheless, a range of studies support the idea that mental health symptoms and HRQL are distinct constructs, and that patients with physical and mental health symptoms are vulnerable to lower ratings of HRQL [63,64]. Disease-modifying therapies such as hydroxyurea can contribute to improved ratings of HRQL [44,65], but we were not able to evaluate the contribution of hydroxyurea to HRQL as it appears to have been underutilized in our sample.
Conclusion
We evaluated emotional distress and other variables in the context of a biobehavioral model of HRQL outcomes for adults with SCD. Integrating the patient's perspective of the impact of the disease and its treatment with assessment of clinical indications is critical to implementing and evaluating effective therapies [25]. However, there are conceptual challenges in determining what actually contributes to HRQL from the patient’s perspective in the context of genetic disorders such as SCD [50]. Our findings highlight the importance of incorporating comprehensive psychosocial screening in order to support optimal HRQL in SCD. Providers may be reluctant to include such screening if, as is often the case, mental health services are difficult to access. Models such as the collaborative care model, which include mental health interventions within the sickle cell center or primary care provider’s office, should be implented. Barriers to care and HRQL should also be routinely evaluated for patients with SCD. Use of disease-specific tools, such as the Adult Sickle Cell Quality of Life measurement system [66], may increase the specificity needed to detect differences within adults with SCD and improvements related to interventions, whether medical or psychosocial. Contributors to HRQL in SCD go beyond clinical manifestations to include psychological and social factors, as well as provider and health system variables. Research conducted within the framework of a comprehensive conceptual model of broad clinical and life effects associated with SCD can inform clinical applications that ultimately enhance HRQL for patients with SCD.
Acknowledgment: The authors wish to thank San Keller, PhD, for her helpful comments on a previous version of this manuscript.
Corresponding author: Marsha J. Treadwell, PhD, Hematology/Oncology Dept., UCSF Benioff Children’s Hospital Oakland, 747 52nd St., Oakland, CA 94609, mtreadwell@mail.cho.org.
Funding/support: This research was conducted as part of the National Initiative for Children’s Healthcare Quality (NICHQ) Working to Improve Sickle Cell Healthcare (WISCH) project. Further support came from a grant from the Health Resources and Services Administration (HRSA) Sickle Cell Disease Treatment Demonstration Project Grant No. U1EMC16492 and from the National Institutes of Health (NIH) Clinical and Translational Science Award UL1 RR024131. The views expressed in this publication do not necessarily reflect the views of WISCH, NICHQ, HRSA or NIH.
Financial disclosures: None.
Author contributions: conception and design, MJT; analysis and interpretation of data, MJT, GG; drafting of article, MJT, GG; critical revision of the article, MJT, KK, FB; statistical expertise, GG; obtaining of funding, MJT; administrative or technical support, KK, FB; collection and assembly of data, KK, FB.
Fiduciary Services for Veterans With Psychiatric Disabilities
Veterans with psychiatric disabilities who are found incompetent to manage their finances are assigned trustees to directly receive and disburse their disability funds. The term representative payee refers to trustees assigned by the Social Security Administration (SSA), and the term for those assigned by the Veterans Benefits Administration (VBA) is fiduciaries. The generic term trustee will be used when referring to an individual responsible for managing another person’s benefits, regardless of the source of those benefits.
Because a trustee assignment is associated with the loss of legal rights and personal autonomy, the clinical utility of appointing trustees has been extensively researched.1-7 However, almost all the literature on trustees for adults with psychiatric disabilities has focused on services within the civilian sector, whereas little is known about military veterans with similar arrangements.
Veterans with psychiatric disabilities face challenges in managing money on a daily basis. Like other individuals with serious mental illnesses, they may have limitations in basic monetary skills associated with mild to severe cognitive deficits, experience difficulties in budgeting finances, and have impulsive spending habits during periods of acute psychosis, mania, or depression. Unlike civilians with severe mental illness, veterans are able to receive disability benefits from both the VBA and the SSA, thus having the potential for substantially greater income than is typical among nonveterans with psychiatric disabilities.
This increased income can increase veterans’ risk of debt through increased capacity to obtain credit cards and other unsecured loans as well as make them more vulnerable to financial exploitation and victimization. Veterans with incomes from both VBA and SSA face the added complication of dealing with 2 distinct, ever-changing, and often difficult-to-navigate benefit systems.
This article compares the VBA fiduciary program with the better-known SSA representative payment program, then discusses in detail the fiduciary program administered by the VBA, highlighting areas of particular relevance to clinicians, and ends with a review of the published literature on the VBA fiduciary program for individuals with severe mental illness.
Federal Trustee Programs
The magnitude of the 2 main federal trustee systems is remarkable. In 2010, 1.5 million adult beneficiaries who received Supplemental Security Income (SSI) had representative payees responsible for managing about $4 billion per month.8,9 Likewise, in 2010, almost 100,000 individuals receiving VBA benefits had fiduciaries responsible for overseeing about $100 million per month in disability compensation or pension benefits.10
The SSA has a single arrangement for provision of representative payee services in which the payee assignment can be indefinite, the responsibility for modification of the arrangement lies with the beneficiary, and oversight is minimal in both policy and practice.9 In contrast, the VBA, which oversees veterans’ pensions and disability benefits, administers several fiduciary arrangements that range in permanency and level of oversight (Table).
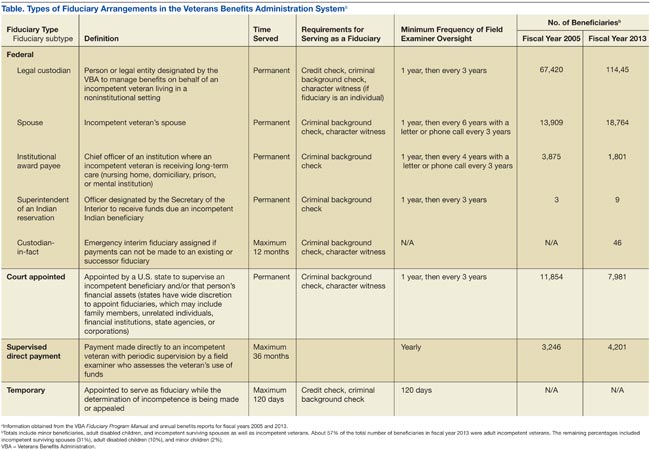
Permanent fiduciary appointments can be either federal or court appointed. Federal fiduciaries manage only VBA-appointed benefits, whereas court-appointed trustees (also known as guardians, fiduciaries, conservators, or curators, depending on the state) are appointed by the state to supervise all the financial assets of an incompetent beneficiary, potentially including both VBA and SSA benefits. Court-appointed trustees are usually designated when broader trust powers are needed to protect the beneficiary’s interests.11
A final VBA fiduciary arrangement is called a Supervised Direct Payment. The payment is made directly to a veteran with periodic supervision by a field examiner who assesses the veteran’s use of funds. This arrangement is used when a veteran has future potential to be deemed competent and released from VBA supervision. It allows the veteran a trial period of managing her/his funds generally for about a year but no longer than 36 months before transitioning to direct pay.11
Unlike SSA, which compensates total disability only, VBA has a rating system that estimates the degree to which a veteran is disabled and grants disability compensation accordingly.12 In 2009, the average monthly payment for all SSA recipients of SSI was $474; the average monthly payment for all recipients of disability benefits from VBA in that year was $925.13,14 For 2009, the federal maximum a SSA recipient could receive was only $674, although this could be supplemented by state funds. On the other hand, there is no set maximum for veterans’ benefits, which are determined through a formula that includes both percentage disability and number of dependents.12,13 In 2011, the average monthly payment for disabled veterans with fiduciaries was $2,540 per month.12 In a study of 49 veterans with trustees, the mean benefit from VBA was twice that of the SSA.15
Because VBA benefits are typically higher than those from SSA and because veterans can receive both SSA and VBA benefits, disabled veterans tend to have higher incomes than do civilians receiving disability benefits. Veterans also may receive lump sum payouts for past benefits, which can be substantial (often $20,000 to $40,000 and sometimes up to $100,000).16 For these reasons, identifying individuals who need a fiduciary and overseeing the management of funds once a fiduciary is assigned are critical.
Referral and Evaluation
The process through which a civilian SSA beneficiary is referred and evaluated for a representative payee is arguably less rigorous than is the referral of a veteran for the VBA fiduciary program. In the former, the treating clinician’s response to a single question, “In your opinion, is the beneficiary capable of managing his/her funds?” on the application for disability benefits often serves as the impetus for payee assignment.
In the latter, the VBA uses a rating agency to make determinations of a veteran’s capacity to handle VBA benefits either after receiving a request for such a determination or after receiving notice that a state court has determined the person is incompetent and/or has appointed a guardian to the person. The Code of Federal Regulations defines the criteria for finding a veteran with a psychiatric disability incompetent to manage his or her finances as follows: “a mentally incompetent person is one who because of injury or disease lacks the mental capacity to contract or to manage his or her own affairs, including disbursement of funds without limitation.”17 As such, if a veteran with mental illness is to be assigned a fiduciary, there needs to be evidence that the mental illness causes financial incompetence.
To assign a fiduciary, multiple sources of evidence are considered in demonstrating behaviors indicating financial incapacity. To illustrate, in Sanders v Principi, the VBA reviewed a veteran’s psychiatric history and weighed the opinion of a psychiatrist that the veteran’s mental illness was in remission against the opinion of family members that the veteran did not possess the ability to “conduct business transactions as his cognitive skills were severely impaired.”18
The VBA is expected to conduct a thorough review of the record and provide reasoned analysis in support of its conclusions, as discussed in Sims v Nicholson.19 The Sims court asserted that to render its decision, the VBA can consider a wide array of information sources, including field examination reports, private psychiatric examinations, medical examiners’ reports, and private physicians. Veterans are informed of the reasons behind the need for a fiduciary, which less commonly occurs in assigning representative payees in the SSA. Although the documented policy for evaluating and determining need for a fiduciary is impressive in its rigor, it is unknown to what extent these standards are put into actual practice.
For health care clinicians, deciding when to request formal assessment by the VBA rating agency of a veteran’s capacity to manage benefits can be challenging to both clinical judgment and to the therapeutic relationship. Although clinicians such as primary care providers, nurses, social workers, and case managers often hear information from the veteran and his/her family about the veteran’s day-to-day management of funds, most of these providers are not necessarily qualified to make a formal assessment of financial capacity.
Black and colleagues developed a measure to assess money mismanagement in a population composed primarily of veterans.20 Although this measure was correlated with client Global Assessment of Functioning scores and client-rated assessment of money mismanagement, it was not correlated with clinician judgment of the individual’s inability to manage funds. Rosen and colleagues similarly found that clinician assessment of whether a veteran would benefit from a trustee arrangement was not associated with the veteran meeting more stringent objective criteria, such as evidence that mismanagement of funds had resulted in the veteran’s inability to meet basic needs or had substantially harmed the veteran.21 Recognizing that their clinical judgment has limitations without external guidance, clinicians may postpone referral, particularly if there is also concern that the veteran may misunderstand the referral decision as a personal judgment, possibly impairing future relationships with the clinician or clinical team.
One option a clinician can consider prior to an official request to the VBA rating agency is to refer the veteran to a trained neuropsychologist for a financial capacity evaluation. The information obtained normally includes a detailed clinical interview, standardized performance measures, and neuropsychological testing.22 This evaluation may allow the clinician to feel more confident about his/her decision and provide a nonjudgmental way of initiating discussion with the veteran. Clinicians may also want to discuss the situation with staff of the Fiduciary Program prior to making a referral. The VBA website (http://benefits.va.gov/fiduciary) provides information about the fiduciary process, including regional contact information for fiduciary services, which clinicians and family members may find useful.
The Fiduciary Role
Once an individual has been determined to need a formal trustee, the decision of who will assume this role differs for SSA and VBA systems. Whereas over 70% of SSA-appointed representative payees for individuals are family members, the majority of fiduciaries for veterans are attorneys or paralegals.23,24 The ultimate designation of a trustee can have critical consequences for both beneficiaries and their families. Some studies have shown that people with psychiatric disabilities who are financially dependent on family members are significantly more likely to be aggressive and even violent toward those family members, with a greater elevated risk of conflict if the disabled person has more education, or even better money management skills, than the assigned family trustee.25-27 Although there are fewer family fiduciaries in the VBA system, it is still possible that veterans with psychiatric disabilities will have these conflicts.
The significant amount of money veterans receive may put them at higher risk for financial exploitation. Given that the VBA disability payment is a reliable source of income and that many veterans with psychiatric disabilities live in environments of lower socioeconomic status, the veteran with a psychiatric disability may be especially vulnerable to financial manipulation. In an environment where many individuals have limited monetary resources, experience financial strain, and are frequently unemployed, it is unsurprising that, at best, family and friends may seek help and assistance from the veteran, and at worst, may maliciously exploit him or her. As a disinterested third party, it can be helpful for the clinician to explore potential disparities between veterans’ disability benefits and the income of individuals with whom the veteran resides.
Additionally, the amount of compensation fiduciaries can receive for their role can be significant. Fiduciaries can receive up to 4% of the yearly VBA benefits of a veteran for whom they are managing money, although family members and court-appointed fiduciaries are not allowed to receive such a commission without a special exception.11 Because large retroactive payments may be disbursed all at once, 4% of the total can be substantial.16
Unsurprisingly, the VBA fiduciary system suffers from a certain amount of fraud, prompting recent efforts in Congress to investigate the program more closely.28 Particular concern has been expressed by the House Committee on Veterans Affairs about misuse of funds by so-called professional fiduciaries who provide services for multiple veterans.29 Recent audits estimated that over $400 million in payments and estates were at risk for misuse and over $80 million might be subject to fraud.16 Until 2004, there was no policy in place to replace a veteran’s funds if those funds had been misused by her/his fiduciary.30 However, this was corrected when Congress passed the Veterans Benefits Improvement Act, and the VBA now reissues benefits if they were misused and the VBA was found negligent in its monitoring of the fiduciary.31 Unfortunately, it is also the VBA that makes the determination of negligence, raising concerns about conflict of interest.
Clinicians may contact their VBA Regional Office to request an evaluation of a veteran’s situation if they have concerns about the fiduciary arrangement, either based on their own observations or on complaints received from the veteran. A field examiner is required to investigate concerns about misuse of veteran funds.11
Fiduciary Oversight
The SSA has been criticized for its lack of close oversight of representative payees. In a recent report on the SSA representative payee program, the evaluators noted, “More broadly, the [SSA] program does not require careful accounting and reporting by payees, nor does the current system appear to be useful in detecting possible misuse of benefits by payees.”9
In contrast, the VBA fiduciary program has designated field examiners who play a role in the initial competence determination, fiduciary arrangement and selection, and oversight of the fiduciary arrangement. Once the VBA has been alerted that a veteran may require a fiduciary, a field examiner is dispatched to observe the individual’s living conditions, fund requirements, and capacity to handle benefits.11 After the initial contact, the field examiner makes a recommendation of the appropriate financial arrangement and prospective fiduciary.
Regardless of the type of fiduciary arrangement in place, the field examiner makes periodic follow-up visits to the beneficiary based on the individual situation. The minimum frequency of required contacts is at least once per year.11 However, visits can occur as infrequently as 36 months in particular situations (Table). During follow-up visits, the field examiner evaluates the beneficiary’s welfare, the performance of the fiduciary, the use of funds, the competency of the beneficiary, and the necessity to continue the fiduciary relationship.11
Although detailed oversight of fiduciaries is technically required, there are a limited number of field examiners to provide that oversight. In 2006, caseloads for field examiners ranged from 132 to 592 cases per employee.Recent auditing showed that programs with the highest staff case loads also had the highest number of deficiencies, suggesting that some field examiners may be unable to provide sufficient oversight to all their clients.16 The effectiveness of field examiners may suffer when they are responsible for very high numbers of veterans.16 Improving oversight of fiduciaries is a stated goal of the VA Office of Inspector General, although increasing the number of field examiners is not mentioned as a means to achieve this goal.32
The SSA does not systematically assess whether a beneficiary is able to resume control over his or her finances. Responsibility lies with the beneficiary to initiate a request to become his/her own payee by demonstrating ability to care for self by means of any evidence, including providing a doctor’s statement or an official copy of a court order. The SSA further cautions beneficiaries who are considering submitting proof of their capability to manage their money as a result of improvement in their condition that, “If SSA believes your condition has improved to the point that you no longer need a payee, we may reevaluate your eligibility for disability payments.”33 This may discourage beneficiaries from attempting to rescind the payeeship, as they potentially risk losing their disability benefits as well.
In contrast, VBA requires regular assessment by a field examiner for continuation of the fiduciary arrangement.11 It is possible to rescind this arrangement if the veteran is found to be competent to handle his/her own funds, understands his/her financial situation, is applying funds to his/her needs appropriately, and would not benefit from further VBA supervision. Additionally, a trial period of limited fund disbursement for 3 to 5 months can be recommended in order to determine how well the veteran manages his/her money. This is commonly done when there are substantial amounts of money being held in trust for the veteran.11
Trustee Effectiveness
Considerable research has examined the effectiveness of the SSA representative payee program as well as potential benefits and risks to the payee. For example, in beneficiaries with psychiatric disabilities, payees can be instrumental in promoting residential stability, basic health care, and psychiatric treatment engagement.6 In addition, representative payeeship has been shown to be associated with reduced hospitalization, victimization, and homelessness.34,35 Finally, research has found better treatment adherence among consumers with payees compared with those without.5
On the other hand, risks noted in some studies suggest payeeship may be used coercively, thwart self-determination, and increase conflict.25 Additionally, payeeship was not associated with a differential reduction in substance use compared with SSA beneficiaries without a payee, nor did it have any effect on clinical outcomes.36-38 These studies may or may not be applicable to the veteran population: Few studies of SSA payeeship include veterans, and there are no studies examining the effectiveness of the VBA fiduciary program exclusively.
Conrad and colleagues reported on a randomized trial of a community trustee and case management program integrated with psychiatric care provided by the VHA.4 Twelve-month outcomes favored the use of the more integrated program, which showed a reduction in substance use, money mismanagement, and days homeless, along with an increased quality of life. However, the study did not distinguish between funding source (VBA, SSA, or both) and trustee status (SSA representative payee or VBA fiduciary). A voluntary program in which veterans worked with money managers who helped them manage funds and held their check books/bank cards also resulted in some improvement in substance use and money management, but this program did not involve either the formal SSA payee or VBA fiduciary systems.39
Although there is a perception that fiduciaries are unwanted impositions on individuals with mental illness, many veterans who have difficulty managing their money seem to want assistance. In one study, nearly 75% of the veterans interviewed agreed with the statement, “Someone who would give me advice around my funds would be helpful to me.” Thirty-four percent agreed with the statement, “Someone who would receive my check and control my funds would be helpful to me,” and 22% reported that they thought a money manager would have helped prevent their hospitalization.40 Additionally, veterans who had payees reported generally high levels of satisfaction and trust with their payee, as well as low feelings of coercion.15 Although similarities with the SSA system may allow some generalizing of findings across SSA and VBA, significant differences in how the programs are administered and the amount of money at stake justify independent evaluation of the VBA fiduciary program.
Conclusion
Veterans with psychiatric disabilities who are deemed incompetent to manage their finances are typically assigned a trustee to disperse disability funds. Both the VBA and SSA provide disability compensation and have a process for providing formal money management services for those determined to be financially incapacitated. However, these 2 federal programs are complex and have many differences.
Clinicians may come into contact with these programs when referring a veteran for services or when a veteran complains about their existing services. The decision of when to refer a veteran for evaluation for a fiduciary is challenging. Once a veteran is referred to the VBA rating agency, the VBA completes a more formalized evaluation to determine whether the beneficiary meets the criteria for a fiduciary. The VBA also has outlined more rigorous ongoing assessment requirements than has the SSA and has designated field examiners to complete these; however, in practice, field examiner heavy case-loads may make it more challenging for the VBA to achieve this rigor.
The VBA provides a formal means of evaluating a veteran’s ability to manage his or her funds through Supervised Direct Payment, which can allow a veteran to demonstrate the ability to manage money and thus end a fiduciary relationship that is no longer needed. In contrast, SSA has no formal evaluation program. Additionally, requesting an end to a payeeship for SSA funds can potentially trigger the loss of benefits, discouraging recipients from ever managing their money independently again.
Ultimately, assigning a fiduciary involves a complex decision weighing values of autonomy (veteran’s freedom to manage his or her own money) and social welfare (veteran’s safety if genuinely vulnerable to financial exploitation).
Author disclosures
The authors report no actual or potential conflicts of interest with regard to this article.
Disclaimer
The opinions expressed herein are those of the authors and do not necessarily reflect those of Federal Practitioner, Frontline Medical Communications Inc., the U.S. Government, or any of its agencies. This article may discuss unlabeled or investigational use of certain drugs. Please review the complete prescribing information for specific drugs or drug combinations—including indications, contraindications, warnings, and adverse effects—before administering pharmacologic therapy to patients.
1. Elbogen EB, Swanson JW, Swartz MS. Psychiatric disability, the use of financial leverage, and perceived coercion in mental health services. Int J Forensic Ment Health. 2003;2(2):119-127.
2. Rosen MI, Bailey M, Dombrowski E, Ablondi K, Rosenheck RA. A comparison of satisfaction with clinician, family members/friends and attorneys as payees. Community Ment Health J. 2005;41(3):291-306.
3. Rosenheck R. Disability payments and chemical dependence: Conflicting values and uncertain effects. Psychiatr Serv. 1997;48(6):789-791.
4. Conrad KJ, Lutz G, Matters MD, Donner L, Clark E, Lynch P. Randomized trial of psychiatric care with representative payeeship for persons with serious mental illness. Psychiatr Serv. 2006;57(2):197-204.
5. Elbogen EB, Swanson JW, Swartz MS. Effects of legal mechanisms on perceived coercion and treatment adherence among persons with severe mental illness. J Nerv Ment Dis. 2003;191(10):629-637.
6. Luchins DJ, Roberts DL, Hanrahan P. Representative payeeship and mental illness: A review. Adm Policy Ment Health. 2003;30(4):341-353.
7. Rosenheck R, Lam J, Randolph F. Impact of representative payees on substance abuse by homeless persons with serious mental illness. Psychiatr Serv. 1997;48(6):800-806.
8. Social Security Administration. 2010 Annual Report of the Supplemental Security Income Program. Washington, DC: Social Security Administration; 2010.
9. National Research Council Committee on Social Security Representative Payees. Improving the Social Security Representative Payee Program: Serving Beneficiaries and Minimizing Misuses. Washington, DC: Division of Behavioral and Social Sciences and Education; 2007.
10. Department of Veterans Affairs. Veterans Benefits Administration Annual Benefits Report Fiscal Year 2010. Washington, DC: Department of Veterans Affairs, Under Secretary of Veterans Affairs for Benefits; 2010.
11. Department of Veterans Affairs. Fiduciary Program Manual. Washington, DC: Department of Veterans Affairs, Under Secretary of Veterans Affairs for Benefits; 2005.
12. Department of Veterans Affairs. Veterans Benefits Administration Annual Benefits Report Fiscal Year 2011. Washington, DC: Department of Veterans Affairs, Under Secretary of Veterans Affairs for Benefits; 2011.
13. Social Security Administration. 2009 Annual Report of the Supplemental Security Income Program. Washington, DC: Social Security Administration; 2009.
14. Department of Veterans Affairs. Veterans Benefits Administration Annual Benefits Report Fiscal Year 2009. Washington, DC: Department of Veterans Affairs, Under Secretary of Veterans Affairs for Benefits; 2009.
15. Rosen MI, Rosenheck R, Shaner A, Eckman T, Gamache G, Krebs C. Payee relationships: Institutional payees versus personal acquaintances. Psychiatr Rehabil J. 2003;26(3):262-267.
16. Department of Veterans Affairs. Audit of Veterans Benefits Administration Fiduciary Program Operations. Document Number 05-01931-158. Washington, DC: Department of Veterans Affairs Office of Inspector General; 2006.
17. Calvert v Mansfield, 38 CFR § 3.353 (A) (2006).
18. Sanders v Principi, 17 Vet App 232 (2003).
19. Sims v Nicholson, 19 Vet App 453, 456 (2006).
20. Black RA, Rounsaville BJ, Rosenheck RA, Conrad KJ, Ball SA, Rosen MI. Measuring money mismanagement among dually diagnosed clients. J Nerv Ment Dis. 2008;196(7):576-579.
21. Rosen MI, Rosenheck RA, Shaner A, Eckman T, Gamache G, Krebs C. Veterans who may need a payee to prevent misuse of funds for drugs. Psychiatr Serv. 2002;53(8):995-1000.
22. American Bar Association Commission on Law and Aging/American Psychological Association. Assessment Of Older Adults With Diminished Capacity: A Handbook for Psychologists. Washington, DC: American Psychological Association; 2008.
23. Elbogen EB, Swanson JW, Swartz MS, Wagner HR. Characteristics of third-party money management for persons with psychiatric disabilities. Psychiatr Serv. 2003;54(8):1136-1141.
24. Social Security Administration. Annual Statistical Report on the Social Security Disability Insurance Program, 2006. Washington, DC: Social Security Administration; 2006.
25. Elbogen EB, Swanson JW, Swartz MS, Van Dorn R. Family representative payeeship and violence risk in severe mental illness. Law Hum Behav. 2005;29(5):563-574.
26. Estroff SE, Swanson JW, Lachicotte WS, Swartz M, Bolduc M. Risk reconsidered: Targets of violence in the social networks of people with serious psychiatric disorders. Soc Psychiatry Psychiatr Epidemiol. 1998;33(suppl 1):S95-S101.
27. Elbogen EB, Ferron JC, Swartz MS, Wilder CM, Swanson JW, Wagner HR. Characteristics of representative payeeship involving families of beneficiaries with psychiatric disabilities. Psychiatr Serv. 2007;58(11):1433-1440.
28. Mitchell A. VA fiduciary system seriously flawed. House Committee on Veterans Affairs Website. http://veterans.house.gov/press-release/va-fiduciary-system-seriously-flawed. Published February 9, 2012. Accessed November 25, 2014.
29. Subcommittee on Disability Assistance and Memorial Affairs, Committee on Veterans’ Affairs. Examining the U.S. Department of Veterans Affairs Fiduciary Program: How Can VA Better Protect Vulnerable Veterans and Their Families? Document 111-72. Washington, DC: U.S. Government Printing Office; 2010.
30. Subcommittee on Benefits Committee on Veterans Affairs. Hearing on Department of Veterans Affairs’ Fiduciary Program. Document Number 108-21. Washington, DC: U.S. Government Printing Office; 2003.
31. Thakker N. The state of veterans’ fiduciary programs: What is needed to protect our nation’s incapacitated veterans? Bifocal. 2006;28(2):19-27.
32. Department of Veterans Affairs. Semiannual Report to Congress: April 1, 2006-September 30, 2006. Washington, DC: Office of Inspector General, Department of Veterans Affairs; 2006.
33. Social Security. FAQs for beneficiaries who have a payee. Social Security Website. http://www.socialsecurity.gov/payee/faqbene.htm. Accessed November 25, 2014.
34. Hanrahan P, Luchins DJ, Savage C, Patrick G, Roberts D, Conrad KJ. Representative payee programs for persons with mental illness in Illinois. Psychiatr Serv. 2002;53(2):190-194.
35. Stoner MR. Money management services for the homeless mentally ill. Hosp Community Psychiatry. 1989;40(7):751-753.
36. Rosen MI, McMahon TJ, Rosenheck R. Does assigning a representative payee reduce substance abuse? Drug Alcohol Dependence. 2007;86(2-3):115-122.
37. Rosen MI. The ‘check effect’ reconsidered. Addiction. 2011;106(6):1071-1077.
38. Swartz JA, Hsieh CM, Baumohl J. Disability payments, drug use and representative payees: An analysis of the relationships. Addiction. 2003;98(7):965-975.
39. Rosen MI, Carroll KM, Stefanovics E, Rosenheck RA. A randomized controlled trial of a money management-based substance use intervention. Psychiatr Serv. 2009;60(4):498-504.
40. Rosen MI, Rosenheck R, Shaner A, Eckman T, Gamache G, Krebs C. Do patients who mismanage their funds use more health services? Adm Policy Ment Health. 2003;31(2):131-140.
Veterans with psychiatric disabilities who are found incompetent to manage their finances are assigned trustees to directly receive and disburse their disability funds. The term representative payee refers to trustees assigned by the Social Security Administration (SSA), and the term for those assigned by the Veterans Benefits Administration (VBA) is fiduciaries. The generic term trustee will be used when referring to an individual responsible for managing another person’s benefits, regardless of the source of those benefits.
Because a trustee assignment is associated with the loss of legal rights and personal autonomy, the clinical utility of appointing trustees has been extensively researched.1-7 However, almost all the literature on trustees for adults with psychiatric disabilities has focused on services within the civilian sector, whereas little is known about military veterans with similar arrangements.
Veterans with psychiatric disabilities face challenges in managing money on a daily basis. Like other individuals with serious mental illnesses, they may have limitations in basic monetary skills associated with mild to severe cognitive deficits, experience difficulties in budgeting finances, and have impulsive spending habits during periods of acute psychosis, mania, or depression. Unlike civilians with severe mental illness, veterans are able to receive disability benefits from both the VBA and the SSA, thus having the potential for substantially greater income than is typical among nonveterans with psychiatric disabilities.
This increased income can increase veterans’ risk of debt through increased capacity to obtain credit cards and other unsecured loans as well as make them more vulnerable to financial exploitation and victimization. Veterans with incomes from both VBA and SSA face the added complication of dealing with 2 distinct, ever-changing, and often difficult-to-navigate benefit systems.
This article compares the VBA fiduciary program with the better-known SSA representative payment program, then discusses in detail the fiduciary program administered by the VBA, highlighting areas of particular relevance to clinicians, and ends with a review of the published literature on the VBA fiduciary program for individuals with severe mental illness.
Federal Trustee Programs
The magnitude of the 2 main federal trustee systems is remarkable. In 2010, 1.5 million adult beneficiaries who received Supplemental Security Income (SSI) had representative payees responsible for managing about $4 billion per month.8,9 Likewise, in 2010, almost 100,000 individuals receiving VBA benefits had fiduciaries responsible for overseeing about $100 million per month in disability compensation or pension benefits.10
The SSA has a single arrangement for provision of representative payee services in which the payee assignment can be indefinite, the responsibility for modification of the arrangement lies with the beneficiary, and oversight is minimal in both policy and practice.9 In contrast, the VBA, which oversees veterans’ pensions and disability benefits, administers several fiduciary arrangements that range in permanency and level of oversight (Table).
Permanent fiduciary appointments can be either federal or court appointed. Federal fiduciaries manage only VBA-appointed benefits, whereas court-appointed trustees (also known as guardians, fiduciaries, conservators, or curators, depending on the state) are appointed by the state to supervise all the financial assets of an incompetent beneficiary, potentially including both VBA and SSA benefits. Court-appointed trustees are usually designated when broader trust powers are needed to protect the beneficiary’s interests.11
A final VBA fiduciary arrangement is called a Supervised Direct Payment. The payment is made directly to a veteran with periodic supervision by a field examiner who assesses the veteran’s use of funds. This arrangement is used when a veteran has future potential to be deemed competent and released from VBA supervision. It allows the veteran a trial period of managing her/his funds generally for about a year but no longer than 36 months before transitioning to direct pay.11
Unlike SSA, which compensates total disability only, VBA has a rating system that estimates the degree to which a veteran is disabled and grants disability compensation accordingly.12 In 2009, the average monthly payment for all SSA recipients of SSI was $474; the average monthly payment for all recipients of disability benefits from VBA in that year was $925.13,14 For 2009, the federal maximum a SSA recipient could receive was only $674, although this could be supplemented by state funds. On the other hand, there is no set maximum for veterans’ benefits, which are determined through a formula that includes both percentage disability and number of dependents.12,13 In 2011, the average monthly payment for disabled veterans with fiduciaries was $2,540 per month.12 In a study of 49 veterans with trustees, the mean benefit from VBA was twice that of the SSA.15
Because VBA benefits are typically higher than those from SSA and because veterans can receive both SSA and VBA benefits, disabled veterans tend to have higher incomes than do civilians receiving disability benefits. Veterans also may receive lump sum payouts for past benefits, which can be substantial (often $20,000 to $40,000 and sometimes up to $100,000).16 For these reasons, identifying individuals who need a fiduciary and overseeing the management of funds once a fiduciary is assigned are critical.
Referral and Evaluation
The process through which a civilian SSA beneficiary is referred and evaluated for a representative payee is arguably less rigorous than is the referral of a veteran for the VBA fiduciary program. In the former, the treating clinician’s response to a single question, “In your opinion, is the beneficiary capable of managing his/her funds?” on the application for disability benefits often serves as the impetus for payee assignment.
In the latter, the VBA uses a rating agency to make determinations of a veteran’s capacity to handle VBA benefits either after receiving a request for such a determination or after receiving notice that a state court has determined the person is incompetent and/or has appointed a guardian to the person. The Code of Federal Regulations defines the criteria for finding a veteran with a psychiatric disability incompetent to manage his or her finances as follows: “a mentally incompetent person is one who because of injury or disease lacks the mental capacity to contract or to manage his or her own affairs, including disbursement of funds without limitation.”17 As such, if a veteran with mental illness is to be assigned a fiduciary, there needs to be evidence that the mental illness causes financial incompetence.
To assign a fiduciary, multiple sources of evidence are considered in demonstrating behaviors indicating financial incapacity. To illustrate, in Sanders v Principi, the VBA reviewed a veteran’s psychiatric history and weighed the opinion of a psychiatrist that the veteran’s mental illness was in remission against the opinion of family members that the veteran did not possess the ability to “conduct business transactions as his cognitive skills were severely impaired.”18
The VBA is expected to conduct a thorough review of the record and provide reasoned analysis in support of its conclusions, as discussed in Sims v Nicholson.19 The Sims court asserted that to render its decision, the VBA can consider a wide array of information sources, including field examination reports, private psychiatric examinations, medical examiners’ reports, and private physicians. Veterans are informed of the reasons behind the need for a fiduciary, which less commonly occurs in assigning representative payees in the SSA. Although the documented policy for evaluating and determining need for a fiduciary is impressive in its rigor, it is unknown to what extent these standards are put into actual practice.
For health care clinicians, deciding when to request formal assessment by the VBA rating agency of a veteran’s capacity to manage benefits can be challenging to both clinical judgment and to the therapeutic relationship. Although clinicians such as primary care providers, nurses, social workers, and case managers often hear information from the veteran and his/her family about the veteran’s day-to-day management of funds, most of these providers are not necessarily qualified to make a formal assessment of financial capacity.
Black and colleagues developed a measure to assess money mismanagement in a population composed primarily of veterans.20 Although this measure was correlated with client Global Assessment of Functioning scores and client-rated assessment of money mismanagement, it was not correlated with clinician judgment of the individual’s inability to manage funds. Rosen and colleagues similarly found that clinician assessment of whether a veteran would benefit from a trustee arrangement was not associated with the veteran meeting more stringent objective criteria, such as evidence that mismanagement of funds had resulted in the veteran’s inability to meet basic needs or had substantially harmed the veteran.21 Recognizing that their clinical judgment has limitations without external guidance, clinicians may postpone referral, particularly if there is also concern that the veteran may misunderstand the referral decision as a personal judgment, possibly impairing future relationships with the clinician or clinical team.
One option a clinician can consider prior to an official request to the VBA rating agency is to refer the veteran to a trained neuropsychologist for a financial capacity evaluation. The information obtained normally includes a detailed clinical interview, standardized performance measures, and neuropsychological testing.22 This evaluation may allow the clinician to feel more confident about his/her decision and provide a nonjudgmental way of initiating discussion with the veteran. Clinicians may also want to discuss the situation with staff of the Fiduciary Program prior to making a referral. The VBA website (http://benefits.va.gov/fiduciary) provides information about the fiduciary process, including regional contact information for fiduciary services, which clinicians and family members may find useful.
The Fiduciary Role
Once an individual has been determined to need a formal trustee, the decision of who will assume this role differs for SSA and VBA systems. Whereas over 70% of SSA-appointed representative payees for individuals are family members, the majority of fiduciaries for veterans are attorneys or paralegals.23,24 The ultimate designation of a trustee can have critical consequences for both beneficiaries and their families. Some studies have shown that people with psychiatric disabilities who are financially dependent on family members are significantly more likely to be aggressive and even violent toward those family members, with a greater elevated risk of conflict if the disabled person has more education, or even better money management skills, than the assigned family trustee.25-27 Although there are fewer family fiduciaries in the VBA system, it is still possible that veterans with psychiatric disabilities will have these conflicts.
The significant amount of money veterans receive may put them at higher risk for financial exploitation. Given that the VBA disability payment is a reliable source of income and that many veterans with psychiatric disabilities live in environments of lower socioeconomic status, the veteran with a psychiatric disability may be especially vulnerable to financial manipulation. In an environment where many individuals have limited monetary resources, experience financial strain, and are frequently unemployed, it is unsurprising that, at best, family and friends may seek help and assistance from the veteran, and at worst, may maliciously exploit him or her. As a disinterested third party, it can be helpful for the clinician to explore potential disparities between veterans’ disability benefits and the income of individuals with whom the veteran resides.
Additionally, the amount of compensation fiduciaries can receive for their role can be significant. Fiduciaries can receive up to 4% of the yearly VBA benefits of a veteran for whom they are managing money, although family members and court-appointed fiduciaries are not allowed to receive such a commission without a special exception.11 Because large retroactive payments may be disbursed all at once, 4% of the total can be substantial.16
Unsurprisingly, the VBA fiduciary system suffers from a certain amount of fraud, prompting recent efforts in Congress to investigate the program more closely.28 Particular concern has been expressed by the House Committee on Veterans Affairs about misuse of funds by so-called professional fiduciaries who provide services for multiple veterans.29 Recent audits estimated that over $400 million in payments and estates were at risk for misuse and over $80 million might be subject to fraud.16 Until 2004, there was no policy in place to replace a veteran’s funds if those funds had been misused by her/his fiduciary.30 However, this was corrected when Congress passed the Veterans Benefits Improvement Act, and the VBA now reissues benefits if they were misused and the VBA was found negligent in its monitoring of the fiduciary.31 Unfortunately, it is also the VBA that makes the determination of negligence, raising concerns about conflict of interest.
Clinicians may contact their VBA Regional Office to request an evaluation of a veteran’s situation if they have concerns about the fiduciary arrangement, either based on their own observations or on complaints received from the veteran. A field examiner is required to investigate concerns about misuse of veteran funds.11
Fiduciary Oversight
The SSA has been criticized for its lack of close oversight of representative payees. In a recent report on the SSA representative payee program, the evaluators noted, “More broadly, the [SSA] program does not require careful accounting and reporting by payees, nor does the current system appear to be useful in detecting possible misuse of benefits by payees.”9
In contrast, the VBA fiduciary program has designated field examiners who play a role in the initial competence determination, fiduciary arrangement and selection, and oversight of the fiduciary arrangement. Once the VBA has been alerted that a veteran may require a fiduciary, a field examiner is dispatched to observe the individual’s living conditions, fund requirements, and capacity to handle benefits.11 After the initial contact, the field examiner makes a recommendation of the appropriate financial arrangement and prospective fiduciary.
Regardless of the type of fiduciary arrangement in place, the field examiner makes periodic follow-up visits to the beneficiary based on the individual situation. The minimum frequency of required contacts is at least once per year.11 However, visits can occur as infrequently as 36 months in particular situations (Table). During follow-up visits, the field examiner evaluates the beneficiary’s welfare, the performance of the fiduciary, the use of funds, the competency of the beneficiary, and the necessity to continue the fiduciary relationship.11
Although detailed oversight of fiduciaries is technically required, there are a limited number of field examiners to provide that oversight. In 2006, caseloads for field examiners ranged from 132 to 592 cases per employee.Recent auditing showed that programs with the highest staff case loads also had the highest number of deficiencies, suggesting that some field examiners may be unable to provide sufficient oversight to all their clients.16 The effectiveness of field examiners may suffer when they are responsible for very high numbers of veterans.16 Improving oversight of fiduciaries is a stated goal of the VA Office of Inspector General, although increasing the number of field examiners is not mentioned as a means to achieve this goal.32
The SSA does not systematically assess whether a beneficiary is able to resume control over his or her finances. Responsibility lies with the beneficiary to initiate a request to become his/her own payee by demonstrating ability to care for self by means of any evidence, including providing a doctor’s statement or an official copy of a court order. The SSA further cautions beneficiaries who are considering submitting proof of their capability to manage their money as a result of improvement in their condition that, “If SSA believes your condition has improved to the point that you no longer need a payee, we may reevaluate your eligibility for disability payments.”33 This may discourage beneficiaries from attempting to rescind the payeeship, as they potentially risk losing their disability benefits as well.
In contrast, VBA requires regular assessment by a field examiner for continuation of the fiduciary arrangement.11 It is possible to rescind this arrangement if the veteran is found to be competent to handle his/her own funds, understands his/her financial situation, is applying funds to his/her needs appropriately, and would not benefit from further VBA supervision. Additionally, a trial period of limited fund disbursement for 3 to 5 months can be recommended in order to determine how well the veteran manages his/her money. This is commonly done when there are substantial amounts of money being held in trust for the veteran.11
Trustee Effectiveness
Considerable research has examined the effectiveness of the SSA representative payee program as well as potential benefits and risks to the payee. For example, in beneficiaries with psychiatric disabilities, payees can be instrumental in promoting residential stability, basic health care, and psychiatric treatment engagement.6 In addition, representative payeeship has been shown to be associated with reduced hospitalization, victimization, and homelessness.34,35 Finally, research has found better treatment adherence among consumers with payees compared with those without.5
On the other hand, risks noted in some studies suggest payeeship may be used coercively, thwart self-determination, and increase conflict.25 Additionally, payeeship was not associated with a differential reduction in substance use compared with SSA beneficiaries without a payee, nor did it have any effect on clinical outcomes.36-38 These studies may or may not be applicable to the veteran population: Few studies of SSA payeeship include veterans, and there are no studies examining the effectiveness of the VBA fiduciary program exclusively.
Conrad and colleagues reported on a randomized trial of a community trustee and case management program integrated with psychiatric care provided by the VHA.4 Twelve-month outcomes favored the use of the more integrated program, which showed a reduction in substance use, money mismanagement, and days homeless, along with an increased quality of life. However, the study did not distinguish between funding source (VBA, SSA, or both) and trustee status (SSA representative payee or VBA fiduciary). A voluntary program in which veterans worked with money managers who helped them manage funds and held their check books/bank cards also resulted in some improvement in substance use and money management, but this program did not involve either the formal SSA payee or VBA fiduciary systems.39
Although there is a perception that fiduciaries are unwanted impositions on individuals with mental illness, many veterans who have difficulty managing their money seem to want assistance. In one study, nearly 75% of the veterans interviewed agreed with the statement, “Someone who would give me advice around my funds would be helpful to me.” Thirty-four percent agreed with the statement, “Someone who would receive my check and control my funds would be helpful to me,” and 22% reported that they thought a money manager would have helped prevent their hospitalization.40 Additionally, veterans who had payees reported generally high levels of satisfaction and trust with their payee, as well as low feelings of coercion.15 Although similarities with the SSA system may allow some generalizing of findings across SSA and VBA, significant differences in how the programs are administered and the amount of money at stake justify independent evaluation of the VBA fiduciary program.
Conclusion
Veterans with psychiatric disabilities who are deemed incompetent to manage their finances are typically assigned a trustee to disperse disability funds. Both the VBA and SSA provide disability compensation and have a process for providing formal money management services for those determined to be financially incapacitated. However, these 2 federal programs are complex and have many differences.
Clinicians may come into contact with these programs when referring a veteran for services or when a veteran complains about their existing services. The decision of when to refer a veteran for evaluation for a fiduciary is challenging. Once a veteran is referred to the VBA rating agency, the VBA completes a more formalized evaluation to determine whether the beneficiary meets the criteria for a fiduciary. The VBA also has outlined more rigorous ongoing assessment requirements than has the SSA and has designated field examiners to complete these; however, in practice, field examiner heavy case-loads may make it more challenging for the VBA to achieve this rigor.
The VBA provides a formal means of evaluating a veteran’s ability to manage his or her funds through Supervised Direct Payment, which can allow a veteran to demonstrate the ability to manage money and thus end a fiduciary relationship that is no longer needed. In contrast, SSA has no formal evaluation program. Additionally, requesting an end to a payeeship for SSA funds can potentially trigger the loss of benefits, discouraging recipients from ever managing their money independently again.
Ultimately, assigning a fiduciary involves a complex decision weighing values of autonomy (veteran’s freedom to manage his or her own money) and social welfare (veteran’s safety if genuinely vulnerable to financial exploitation).
Author disclosures
The authors report no actual or potential conflicts of interest with regard to this article.
Disclaimer
The opinions expressed herein are those of the authors and do not necessarily reflect those of Federal Practitioner, Frontline Medical Communications Inc., the U.S. Government, or any of its agencies. This article may discuss unlabeled or investigational use of certain drugs. Please review the complete prescribing information for specific drugs or drug combinations—including indications, contraindications, warnings, and adverse effects—before administering pharmacologic therapy to patients.
1. Elbogen EB, Swanson JW, Swartz MS. Psychiatric disability, the use of financial leverage, and perceived coercion in mental health services. Int J Forensic Ment Health. 2003;2(2):119-127.
2. Rosen MI, Bailey M, Dombrowski E, Ablondi K, Rosenheck RA. A comparison of satisfaction with clinician, family members/friends and attorneys as payees. Community Ment Health J. 2005;41(3):291-306.
3. Rosenheck R. Disability payments and chemical dependence: Conflicting values and uncertain effects. Psychiatr Serv. 1997;48(6):789-791.
4. Conrad KJ, Lutz G, Matters MD, Donner L, Clark E, Lynch P. Randomized trial of psychiatric care with representative payeeship for persons with serious mental illness. Psychiatr Serv. 2006;57(2):197-204.
5. Elbogen EB, Swanson JW, Swartz MS. Effects of legal mechanisms on perceived coercion and treatment adherence among persons with severe mental illness. J Nerv Ment Dis. 2003;191(10):629-637.
6. Luchins DJ, Roberts DL, Hanrahan P. Representative payeeship and mental illness: A review. Adm Policy Ment Health. 2003;30(4):341-353.
7. Rosenheck R, Lam J, Randolph F. Impact of representative payees on substance abuse by homeless persons with serious mental illness. Psychiatr Serv. 1997;48(6):800-806.
8. Social Security Administration. 2010 Annual Report of the Supplemental Security Income Program. Washington, DC: Social Security Administration; 2010.
9. National Research Council Committee on Social Security Representative Payees. Improving the Social Security Representative Payee Program: Serving Beneficiaries and Minimizing Misuses. Washington, DC: Division of Behavioral and Social Sciences and Education; 2007.
10. Department of Veterans Affairs. Veterans Benefits Administration Annual Benefits Report Fiscal Year 2010. Washington, DC: Department of Veterans Affairs, Under Secretary of Veterans Affairs for Benefits; 2010.
11. Department of Veterans Affairs. Fiduciary Program Manual. Washington, DC: Department of Veterans Affairs, Under Secretary of Veterans Affairs for Benefits; 2005.
12. Department of Veterans Affairs. Veterans Benefits Administration Annual Benefits Report Fiscal Year 2011. Washington, DC: Department of Veterans Affairs, Under Secretary of Veterans Affairs for Benefits; 2011.
13. Social Security Administration. 2009 Annual Report of the Supplemental Security Income Program. Washington, DC: Social Security Administration; 2009.
14. Department of Veterans Affairs. Veterans Benefits Administration Annual Benefits Report Fiscal Year 2009. Washington, DC: Department of Veterans Affairs, Under Secretary of Veterans Affairs for Benefits; 2009.
15. Rosen MI, Rosenheck R, Shaner A, Eckman T, Gamache G, Krebs C. Payee relationships: Institutional payees versus personal acquaintances. Psychiatr Rehabil J. 2003;26(3):262-267.
16. Department of Veterans Affairs. Audit of Veterans Benefits Administration Fiduciary Program Operations. Document Number 05-01931-158. Washington, DC: Department of Veterans Affairs Office of Inspector General; 2006.
17. Calvert v Mansfield, 38 CFR § 3.353 (A) (2006).
18. Sanders v Principi, 17 Vet App 232 (2003).
19. Sims v Nicholson, 19 Vet App 453, 456 (2006).
20. Black RA, Rounsaville BJ, Rosenheck RA, Conrad KJ, Ball SA, Rosen MI. Measuring money mismanagement among dually diagnosed clients. J Nerv Ment Dis. 2008;196(7):576-579.
21. Rosen MI, Rosenheck RA, Shaner A, Eckman T, Gamache G, Krebs C. Veterans who may need a payee to prevent misuse of funds for drugs. Psychiatr Serv. 2002;53(8):995-1000.
22. American Bar Association Commission on Law and Aging/American Psychological Association. Assessment Of Older Adults With Diminished Capacity: A Handbook for Psychologists. Washington, DC: American Psychological Association; 2008.
23. Elbogen EB, Swanson JW, Swartz MS, Wagner HR. Characteristics of third-party money management for persons with psychiatric disabilities. Psychiatr Serv. 2003;54(8):1136-1141.
24. Social Security Administration. Annual Statistical Report on the Social Security Disability Insurance Program, 2006. Washington, DC: Social Security Administration; 2006.
25. Elbogen EB, Swanson JW, Swartz MS, Van Dorn R. Family representative payeeship and violence risk in severe mental illness. Law Hum Behav. 2005;29(5):563-574.
26. Estroff SE, Swanson JW, Lachicotte WS, Swartz M, Bolduc M. Risk reconsidered: Targets of violence in the social networks of people with serious psychiatric disorders. Soc Psychiatry Psychiatr Epidemiol. 1998;33(suppl 1):S95-S101.
27. Elbogen EB, Ferron JC, Swartz MS, Wilder CM, Swanson JW, Wagner HR. Characteristics of representative payeeship involving families of beneficiaries with psychiatric disabilities. Psychiatr Serv. 2007;58(11):1433-1440.
28. Mitchell A. VA fiduciary system seriously flawed. House Committee on Veterans Affairs Website. http://veterans.house.gov/press-release/va-fiduciary-system-seriously-flawed. Published February 9, 2012. Accessed November 25, 2014.
29. Subcommittee on Disability Assistance and Memorial Affairs, Committee on Veterans’ Affairs. Examining the U.S. Department of Veterans Affairs Fiduciary Program: How Can VA Better Protect Vulnerable Veterans and Their Families? Document 111-72. Washington, DC: U.S. Government Printing Office; 2010.
30. Subcommittee on Benefits Committee on Veterans Affairs. Hearing on Department of Veterans Affairs’ Fiduciary Program. Document Number 108-21. Washington, DC: U.S. Government Printing Office; 2003.
31. Thakker N. The state of veterans’ fiduciary programs: What is needed to protect our nation’s incapacitated veterans? Bifocal. 2006;28(2):19-27.
32. Department of Veterans Affairs. Semiannual Report to Congress: April 1, 2006-September 30, 2006. Washington, DC: Office of Inspector General, Department of Veterans Affairs; 2006.
33. Social Security. FAQs for beneficiaries who have a payee. Social Security Website. http://www.socialsecurity.gov/payee/faqbene.htm. Accessed November 25, 2014.
34. Hanrahan P, Luchins DJ, Savage C, Patrick G, Roberts D, Conrad KJ. Representative payee programs for persons with mental illness in Illinois. Psychiatr Serv. 2002;53(2):190-194.
35. Stoner MR. Money management services for the homeless mentally ill. Hosp Community Psychiatry. 1989;40(7):751-753.
36. Rosen MI, McMahon TJ, Rosenheck R. Does assigning a representative payee reduce substance abuse? Drug Alcohol Dependence. 2007;86(2-3):115-122.
37. Rosen MI. The ‘check effect’ reconsidered. Addiction. 2011;106(6):1071-1077.
38. Swartz JA, Hsieh CM, Baumohl J. Disability payments, drug use and representative payees: An analysis of the relationships. Addiction. 2003;98(7):965-975.
39. Rosen MI, Carroll KM, Stefanovics E, Rosenheck RA. A randomized controlled trial of a money management-based substance use intervention. Psychiatr Serv. 2009;60(4):498-504.
40. Rosen MI, Rosenheck R, Shaner A, Eckman T, Gamache G, Krebs C. Do patients who mismanage their funds use more health services? Adm Policy Ment Health. 2003;31(2):131-140.
