User login
External Beam Radiotherapy of Extramammary Paget Disease
Extramammary Paget disease (EMPD) is an insidious intraepithelial neoplasm that occurs in areas with a high density of apocrine glands such as the penoscrotal area, the vulva, and occasionally the axillae. It mainly affects patients aged 50 to 80 years.1 Clinically, EMPD presents as pruritic, nonhealing, red plaques that can be mistaken for eczema. On histology, characteristic Paget cells have abundant pale cytoplasm and atypical nuclear lobuli and are adenocarcinomatous,1,2 usually infiltrating the epidermis.2 In approximately 25% of cases, EMPD is associated with neoplastic disease in adnexal structures or organs with a contiguous epithelial lining.2 Therefore, screening for an underlying malignancy when EMPD is first diagnosed is indispensable.
Because EMPD tends to be multifocal, presents in elderly patients, and affects functionally important areas such as the anal canal or genitals, treatment often is difficult.3,4 Surgery generally is considered as a first-line treatment5; however, the rate of positive margins ranges from 36% to 67%, and local recurrence is common.1
Radiotherapy has been used in EMPD patients mainly when surgery was not an option or was not effective, but several reports have indicated that it should play a more important role in the treatment of EMPD. Luk et al1 described 6 patients who were treated with different types of radiotherapy. Similar to the results of prior studies,3,5,6 they concluded that it was an effective treatment of EMPD.1
We conducted a retrospective study to analyze long-term outcomes in 7 patients who were treated with external beam radiotherapy (EBRT) for EMPD.
Methods
Seven patients (6 men and 1 woman) who had been diagnosed with EMPD and were treated with EBRT at the Department of Dermatology at the University Hospital Zurich in Switzerland (1988-2004) were evaluated. The diagnosis was confirmed by a dermatopathologist or pathologist via histology. Data regarding clinical presentation, EBRT regimen, and side effects were retrieved from the medical records. Long-term outcomes were evaluated by an attending dermatologist (1 case), a general practitioner (5 cases), or the hospital’s outpatient department (1 case). None of the patients showed an associated malignancy at the time of treatment; however, patient 5 had been diagnosed with and treated for a sigmoid colon adenocarcinoma 6 years prior to undergoing EBRT for EMPD. Three patients (patients 3, 5, and 7) received EBRT for local relapse after prior treatment of EMPD (ie, CO2 laser, multiple local treatments). One patient (patient 2) underwent surgical excision prior to EBRT. The remaining 3 patients had not undergone any prior treatment of EMPD. All patients underwent EBRT with the goal of complete remission.
Six patients received low-energy radiotherapy of 20 to 30 kV at doses of 200 to 400 cGy per day for 2 to 5 days per week until a total dose of 4000 to 5600 cGy was completed. A 0.4- to 0.5-mm aluminum filter was used, and the focus-skin distance (FSD) was 20 cm. One patient was treated with a radiograph of 40 kV at 400 cGy per day for 2 days per week until a total dose of 4800 cGy was completed. A 1.0-mm aluminum filter was used, and the FSD was 10 cm. The field of EBRT included 2-cm margins clear of all visible disease. The treatment parameters for all patients are outlined in the Table.
Results
Complete remission was initially obtained in 6 of 7 patients. In patient 3, an erosive perianal plaque remained following treatment with EBRT that was locally treated with imiquimod cream 3%. The patient relapsed 2.5 years later with a lesion in the vaginal area that was treated with imiquimod cream 3% and later via surgical excision. Complete remission was never achieved, and the patient died 7 years after EBRT treatment due to unrelated causes. Patient 5 relapsed after 6 years of remission following treatment with EBRT and also was treated with imiquimod.
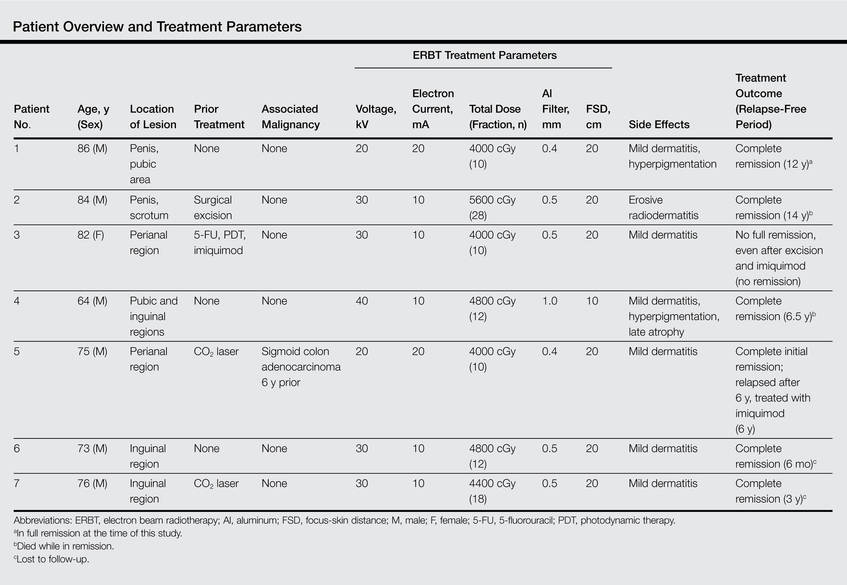
At the time of this study, 1 patient remained in full remission (patient 1: 12 years) and 2 had died while in remission (patient 2: 14 years; patient 4: 6.5 years). Two patients were lost to follow-up while in remision (patient 6: 6 months; patient 7: 3 years); however, they did not show any signs of relapse. The Figure shows patient 6 at baseline and at 4 and 8 months after starting treatment with ERBT.
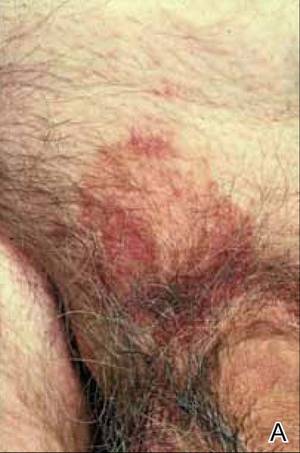 | 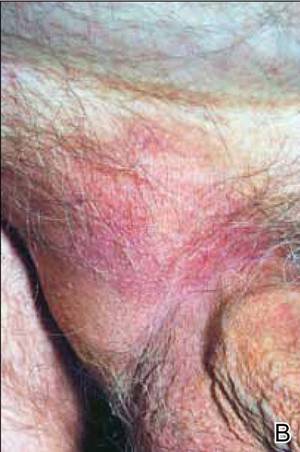 | 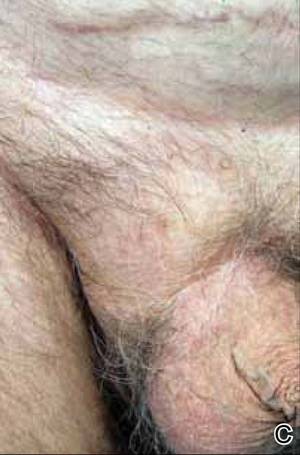 | ||
A 73-year-old man with extramammary Paget disease in the inguinal region at baseline (A) and 4 (B) and 8 (C) months after starting treatment with electron beam radiotherapy. | ||||
The most commonly reported side effect was mild dermatitis with reddening and desquamation. Patient 2 developed erosive radiodermatitis 4 days after the first treatment with EBRT. All acute reactions resolved with local treatment. Late side effects of EBRT were hyperpigmentation (patients 1 and 4) and mild skin atrophy (patient 4).
Comment
Because EMPD is such a rare disease, data regarding long-term treatment outcomes are mostly from small studies and case reports; evidence in the literature regarding treatment of EMPD with EBRT is especially limited. However, the good initial healing in most reported cases, the relatively low and late relapse rate, and the mild side effects reported in most cases make EBRT an effective treatment of EMPD. In the current study, initial complete remission was achieved in 6 of 7 patients. Patient 3 did not show complete macroscopic remission following EBRT but had a poor response to treatment in general, as she had already been unsuccessfully treated with several local treatments prior to EBRT; also, surgical and topical intervention following EBRT was not successful. Patient 5 relapsed after 6 years, but this case exceeds the follow-up period of many cases of EMPD found in the literature.
Overall, EBRT was well tolerated by the patients included in our study. All patients showed mild dermatitis following treatment as an acute reaction to EBRT. In most cases, these reactions resolved on their own or with topical treatment. Two patients developed late hyperpigmentation and one developed mild skin atrophy in the treatment area. One patient who was treated until a total dose of 5600 cGy was achieved developed erosive radiodermatitis, whereas the other patients were only treated 2 to 5 times per week. Side effects can therefore be considered as mild and/or easily controlled.
Luk et al1 also observed a low rate of long-term relapse in patients with EMPD, but consistent EBRT with similar doses and settings were applied in our study. The following parameters showed the best results in treatment response, low side effects, and relapse rate: total dose of 4000 to 4800 cGy; 20 to 30 kV; electron current of 10 to 20 mA; 0.4- to 0.5-mm aluminum filter; 20-cm FSD. This dose is at the low end of those for the standard fractionation regimen, which is a total dose of 4200 to 7000 cGy using 200-cGy fractions.1 The dose we used was slightly lower than the total dose recommended by Besa et al5 who treated 65 patients with radiotherapy for EMPD in 1992 (>50 Gy). It is equivalent to the doses used by Burrows et al6 and by Moreno-Arias et al3 (40–50 Gy). Lower radiograph doses may put treatment outcome at risk.7
Surgery is considered the first-line therapy for EMPD. Positive margin rates vary from 36% to 67% depending on the size of the lesion and the type of surgery that is used.5 Positive margin rates lead to a significant increase in recurrence rate (P<.001).8 Relapse rates for surgical intervention vary in the literature from 19% to 44%8 and 40% to 45% within 4 years of surgery.4 Wang et al8 reviewed long-term outcomes of surgical treatment in 130 Chinese patients with penoscrotal EMPD. They recommended 3-cm surgical margins and frozen section pathological examination for complicated conditions. A local recurrence rate of 9.9% was reported, which is remarkably lower than in many other studies in the literature.8 Nevertheless, the severe possible side effects of surgery cannot be easily put aside.
Electron beam radiotherapy should be considered as an alternate therapy in EMPD given its low risks and moderate side effects. In our study, the relapse rate was 28.6% (2/7), which is not remarkably higher than reports in the literature of relapse rates associated with surgical excision. Electron beam radiotherapy should be especially considered when extensive margin-controlled surgery is not an option, such as EMPD in sensitive areas or for an extensive circumference of the lesion, as surgery might then produce functional disfiguring results. Adequate limiting ray (grenz ray) or low-energy radiograph treatment has proved to preserve function, especially in the area of the vulva and glans penis.9 Furthermore, EBRT may be the treatment of choice in patients with an increased risk for morbidity from surgery, such as elderly patients5 or those with wound healing disorders (eg, diabetes mellitus).
Conclusion
Given that EMPD patients typically are elderly with multimorbidities, surgery should be carefully considered in this patient population, particularly because EMPD without underlying malignancies has an excellent survival rate.5 Highly invasive treatments should therefore be thoughtfully considered. Because of the inconsistent data on relapse rates and the small number of patients with EMPD who have been studied, further study with more cases is needed.
1. Luk NM, Yu KH, Yeung WK, et al. Extramammary Paget’s disease: outcome of radiotherapy with curative intent. Clin Exp Dermatol. 2003;28:360-363.
2. Lloyd J, Flanagan AM. Mammary and extramammary Paget’s disease. J Clin Pathol. 2000;53:742-749.
3. Moreno-Arias GA, Conill C, Castells-Mas A, et al. Radiotherapy for genital extramammary Paget’s disease in situ. Dermatol Surg. 2001;27:587-590.
4. Son SH, Lee JS, Kim YS, et al. The role of radiation therapy for the extramammary Paget’s disease of the vulva; experience of 3 cases. Cancer Res Treat. 2005;37:365-369.
5. Besa P, Rich TA, Delclos L, et al. Extramammary Paget’s disease of the perineal skin: role of radiotherapy. Int J Radiat Oncol Biol Phys. 1992;24:73-78.
6. Burrows NP, Jones DH, Hudson PM, et al. Treatment of extramammary Paget’s disease by radiotherapy. Br J Dermatol. 1995;132:970-972.
7. Jensen SL, Sjølin KE, Shokouh-Amiri MH, et al. Paget’s disease of the anal margin. Br J Surg. 1988;75:1089-1092.
8. Wang Z, Lu M, Dong GQ, et al. Penile and scrotal Paget’s disease: 130 Chinese patients with long-term follow-up. BJU Int. 2008;102:485-488.
9. Dummer R, ed. Physikalische Therapiemaßnahmen in der Dermatologie. 2nd ed. Darmstadt, Germany: Steinkopff Verlag Darmstadt; 2006.
Extramammary Paget disease (EMPD) is an insidious intraepithelial neoplasm that occurs in areas with a high density of apocrine glands such as the penoscrotal area, the vulva, and occasionally the axillae. It mainly affects patients aged 50 to 80 years.1 Clinically, EMPD presents as pruritic, nonhealing, red plaques that can be mistaken for eczema. On histology, characteristic Paget cells have abundant pale cytoplasm and atypical nuclear lobuli and are adenocarcinomatous,1,2 usually infiltrating the epidermis.2 In approximately 25% of cases, EMPD is associated with neoplastic disease in adnexal structures or organs with a contiguous epithelial lining.2 Therefore, screening for an underlying malignancy when EMPD is first diagnosed is indispensable.
Because EMPD tends to be multifocal, presents in elderly patients, and affects functionally important areas such as the anal canal or genitals, treatment often is difficult.3,4 Surgery generally is considered as a first-line treatment5; however, the rate of positive margins ranges from 36% to 67%, and local recurrence is common.1
Radiotherapy has been used in EMPD patients mainly when surgery was not an option or was not effective, but several reports have indicated that it should play a more important role in the treatment of EMPD. Luk et al1 described 6 patients who were treated with different types of radiotherapy. Similar to the results of prior studies,3,5,6 they concluded that it was an effective treatment of EMPD.1
We conducted a retrospective study to analyze long-term outcomes in 7 patients who were treated with external beam radiotherapy (EBRT) for EMPD.
Methods
Seven patients (6 men and 1 woman) who had been diagnosed with EMPD and were treated with EBRT at the Department of Dermatology at the University Hospital Zurich in Switzerland (1988-2004) were evaluated. The diagnosis was confirmed by a dermatopathologist or pathologist via histology. Data regarding clinical presentation, EBRT regimen, and side effects were retrieved from the medical records. Long-term outcomes were evaluated by an attending dermatologist (1 case), a general practitioner (5 cases), or the hospital’s outpatient department (1 case). None of the patients showed an associated malignancy at the time of treatment; however, patient 5 had been diagnosed with and treated for a sigmoid colon adenocarcinoma 6 years prior to undergoing EBRT for EMPD. Three patients (patients 3, 5, and 7) received EBRT for local relapse after prior treatment of EMPD (ie, CO2 laser, multiple local treatments). One patient (patient 2) underwent surgical excision prior to EBRT. The remaining 3 patients had not undergone any prior treatment of EMPD. All patients underwent EBRT with the goal of complete remission.
Six patients received low-energy radiotherapy of 20 to 30 kV at doses of 200 to 400 cGy per day for 2 to 5 days per week until a total dose of 4000 to 5600 cGy was completed. A 0.4- to 0.5-mm aluminum filter was used, and the focus-skin distance (FSD) was 20 cm. One patient was treated with a radiograph of 40 kV at 400 cGy per day for 2 days per week until a total dose of 4800 cGy was completed. A 1.0-mm aluminum filter was used, and the FSD was 10 cm. The field of EBRT included 2-cm margins clear of all visible disease. The treatment parameters for all patients are outlined in the Table.
Results
Complete remission was initially obtained in 6 of 7 patients. In patient 3, an erosive perianal plaque remained following treatment with EBRT that was locally treated with imiquimod cream 3%. The patient relapsed 2.5 years later with a lesion in the vaginal area that was treated with imiquimod cream 3% and later via surgical excision. Complete remission was never achieved, and the patient died 7 years after EBRT treatment due to unrelated causes. Patient 5 relapsed after 6 years of remission following treatment with EBRT and also was treated with imiquimod.
At the time of this study, 1 patient remained in full remission (patient 1: 12 years) and 2 had died while in remission (patient 2: 14 years; patient 4: 6.5 years). Two patients were lost to follow-up while in remision (patient 6: 6 months; patient 7: 3 years); however, they did not show any signs of relapse. The Figure shows patient 6 at baseline and at 4 and 8 months after starting treatment with ERBT.
| | | ||
A 73-year-old man with extramammary Paget disease in the inguinal region at baseline (A) and 4 (B) and 8 (C) months after starting treatment with electron beam radiotherapy. | ||||
The most commonly reported side effect was mild dermatitis with reddening and desquamation. Patient 2 developed erosive radiodermatitis 4 days after the first treatment with EBRT. All acute reactions resolved with local treatment. Late side effects of EBRT were hyperpigmentation (patients 1 and 4) and mild skin atrophy (patient 4).
Comment
Because EMPD is such a rare disease, data regarding long-term treatment outcomes are mostly from small studies and case reports; evidence in the literature regarding treatment of EMPD with EBRT is especially limited. However, the good initial healing in most reported cases, the relatively low and late relapse rate, and the mild side effects reported in most cases make EBRT an effective treatment of EMPD. In the current study, initial complete remission was achieved in 6 of 7 patients. Patient 3 did not show complete macroscopic remission following EBRT but had a poor response to treatment in general, as she had already been unsuccessfully treated with several local treatments prior to EBRT; also, surgical and topical intervention following EBRT was not successful. Patient 5 relapsed after 6 years, but this case exceeds the follow-up period of many cases of EMPD found in the literature.
Overall, EBRT was well tolerated by the patients included in our study. All patients showed mild dermatitis following treatment as an acute reaction to EBRT. In most cases, these reactions resolved on their own or with topical treatment. Two patients developed late hyperpigmentation and one developed mild skin atrophy in the treatment area. One patient who was treated until a total dose of 5600 cGy was achieved developed erosive radiodermatitis, whereas the other patients were only treated 2 to 5 times per week. Side effects can therefore be considered as mild and/or easily controlled.
Luk et al1 also observed a low rate of long-term relapse in patients with EMPD, but consistent EBRT with similar doses and settings were applied in our study. The following parameters showed the best results in treatment response, low side effects, and relapse rate: total dose of 4000 to 4800 cGy; 20 to 30 kV; electron current of 10 to 20 mA; 0.4- to 0.5-mm aluminum filter; 20-cm FSD. This dose is at the low end of those for the standard fractionation regimen, which is a total dose of 4200 to 7000 cGy using 200-cGy fractions.1 The dose we used was slightly lower than the total dose recommended by Besa et al5 who treated 65 patients with radiotherapy for EMPD in 1992 (>50 Gy). It is equivalent to the doses used by Burrows et al6 and by Moreno-Arias et al3 (40–50 Gy). Lower radiograph doses may put treatment outcome at risk.7
Surgery is considered the first-line therapy for EMPD. Positive margin rates vary from 36% to 67% depending on the size of the lesion and the type of surgery that is used.5 Positive margin rates lead to a significant increase in recurrence rate (P<.001).8 Relapse rates for surgical intervention vary in the literature from 19% to 44%8 and 40% to 45% within 4 years of surgery.4 Wang et al8 reviewed long-term outcomes of surgical treatment in 130 Chinese patients with penoscrotal EMPD. They recommended 3-cm surgical margins and frozen section pathological examination for complicated conditions. A local recurrence rate of 9.9% was reported, which is remarkably lower than in many other studies in the literature.8 Nevertheless, the severe possible side effects of surgery cannot be easily put aside.
Electron beam radiotherapy should be considered as an alternate therapy in EMPD given its low risks and moderate side effects. In our study, the relapse rate was 28.6% (2/7), which is not remarkably higher than reports in the literature of relapse rates associated with surgical excision. Electron beam radiotherapy should be especially considered when extensive margin-controlled surgery is not an option, such as EMPD in sensitive areas or for an extensive circumference of the lesion, as surgery might then produce functional disfiguring results. Adequate limiting ray (grenz ray) or low-energy radiograph treatment has proved to preserve function, especially in the area of the vulva and glans penis.9 Furthermore, EBRT may be the treatment of choice in patients with an increased risk for morbidity from surgery, such as elderly patients5 or those with wound healing disorders (eg, diabetes mellitus).
Conclusion
Given that EMPD patients typically are elderly with multimorbidities, surgery should be carefully considered in this patient population, particularly because EMPD without underlying malignancies has an excellent survival rate.5 Highly invasive treatments should therefore be thoughtfully considered. Because of the inconsistent data on relapse rates and the small number of patients with EMPD who have been studied, further study with more cases is needed.
1. Luk NM, Yu KH, Yeung WK, et al. Extramammary Paget’s disease: outcome of radiotherapy with curative intent. Clin Exp Dermatol. 2003;28:360-363.
2. Lloyd J, Flanagan AM. Mammary and extramammary Paget’s disease. J Clin Pathol. 2000;53:742-749.
3. Moreno-Arias GA, Conill C, Castells-Mas A, et al. Radiotherapy for genital extramammary Paget’s disease in situ. Dermatol Surg. 2001;27:587-590.
4. Son SH, Lee JS, Kim YS, et al. The role of radiation therapy for the extramammary Paget’s disease of the vulva; experience of 3 cases. Cancer Res Treat. 2005;37:365-369.
5. Besa P, Rich TA, Delclos L, et al. Extramammary Paget’s disease of the perineal skin: role of radiotherapy. Int J Radiat Oncol Biol Phys. 1992;24:73-78.
6. Burrows NP, Jones DH, Hudson PM, et al. Treatment of extramammary Paget’s disease by radiotherapy. Br J Dermatol. 1995;132:970-972.
7. Jensen SL, Sjølin KE, Shokouh-Amiri MH, et al. Paget’s disease of the anal margin. Br J Surg. 1988;75:1089-1092.
8. Wang Z, Lu M, Dong GQ, et al. Penile and scrotal Paget’s disease: 130 Chinese patients with long-term follow-up. BJU Int. 2008;102:485-488.
9. Dummer R, ed. Physikalische Therapiemaßnahmen in der Dermatologie. 2nd ed. Darmstadt, Germany: Steinkopff Verlag Darmstadt; 2006.
Practice Points
- Elderly patients with extramammary Paget disease (EMPD) usually are multimorbid and frail.
- Nonsurgical options for treatment of EMPD can be advantageous. External beam radiotherapy is a good option for EMPD.

Hepatitis C Clinical Dashboards: Improving Liver Specialty Care Access and Quality
The VHA cares for 170,000 patients with chronic hepatitis C virus (HCV) infection, making it the largest single provider of medical care to chronic HCV patients in the U.S.1 Although HCV treatment rates within the VHA outpace those of the private sector, only half of patients with HCV infection within the VHA have accessed a liver specialist and less than a quarter have received antiviral medication.2-4
Newer HCV treatment regimens promise treatment sustained virologic response (SVR) rates—a marker of viral clearance posttreatment—of ≥ 90% in most cases but require careful patient selection and management.5 In particular, the estimated 24% of patients with HCV infection with advanced liver disease require more rapid consideration for therapy to reduce complications of cirrhosis such as liver failure, hepatocellular carcinoma, and death.6 With the advent of promising HCV therapies and rising rates of cirrhosis, there is an urgent need for population health management approach to deliver HCV care more widely and effectively.5,7
Rationale for Clinical Dashboards
Although the VHA hosts the largest integrated electronic medical record (EMR) system in the U.S., an EMR on its own does not guarantee improved patient care or access.8 EMRs can be used to document health care delivery, but they do not routinely provide information about the burden of disease in a population, nor do they identify patients most in need of care.
Clinical dashboards are tools that are geared to provide clinicians with relevant data to improve patient care. Early clinical dashboard development across the VHA was primary care focused, targeting patients with diabetes, ischemic heart disease, and hypertension. This national primary care dashboard provides clinically relevant, actionable data and enables the clinical provider to track patient progress. In addition, regional data can be aggregated for use by VISN managers.
While the impact of dashboards on quality of care is not well investigated, it remains a vital tool with the potential to transform care.9
HCV dashboards have been developed by individual VISNs and facilities across the VHA. HCV dashboards serve to identify patients most in need of antiviral therapy, expand outreach to those previously unseen by specialty care, sort patients by severity of liver disease, track treatment status, and calculate SVR.
Current HCV dashboards incorporate elements derived from the VA Corporate Data Warehouse (CDW), a national VA data repository consisting of data from all facilities’ electronic medical record systems. Updated information from the previous day is made available in VISN data warehouses and is refreshed nightly. The final result is user-friendly clinical data available in near-real time to dashboard users.
VISN 21 HCV Dashboard
Purpose and Elements
The VISN 21 HCV dashboard will be discussed as a prototype. Graphics of the VISN 21 dashboard interface are presented in Figure 1 and Figure 2. The VISN 21 HCV dashboard was developed by pharmacists with specialty training in medical informatics, health care analytics, and data management. The dashboard addresses 3 previously unmet needs in HCV care: population management, patient treatment outcome tracking, and administrative planning.
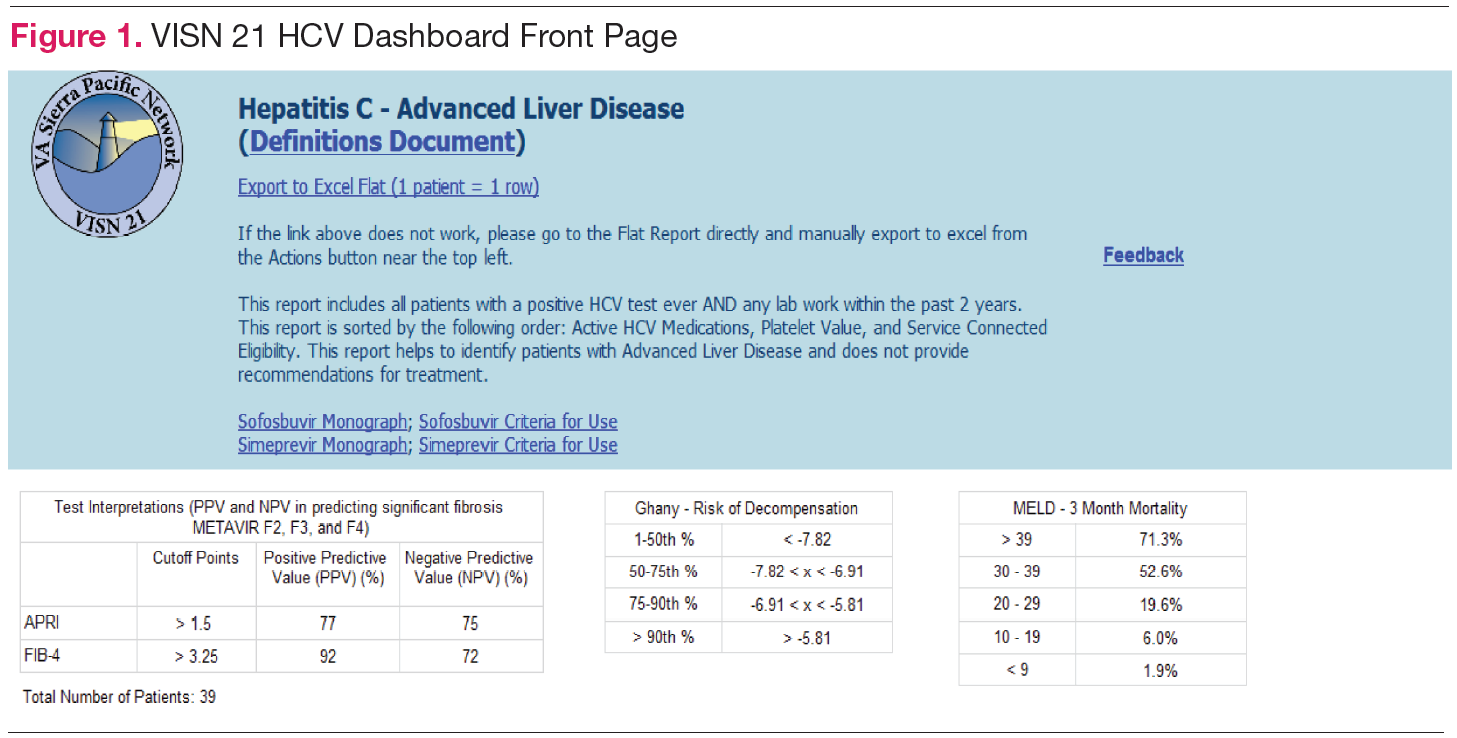
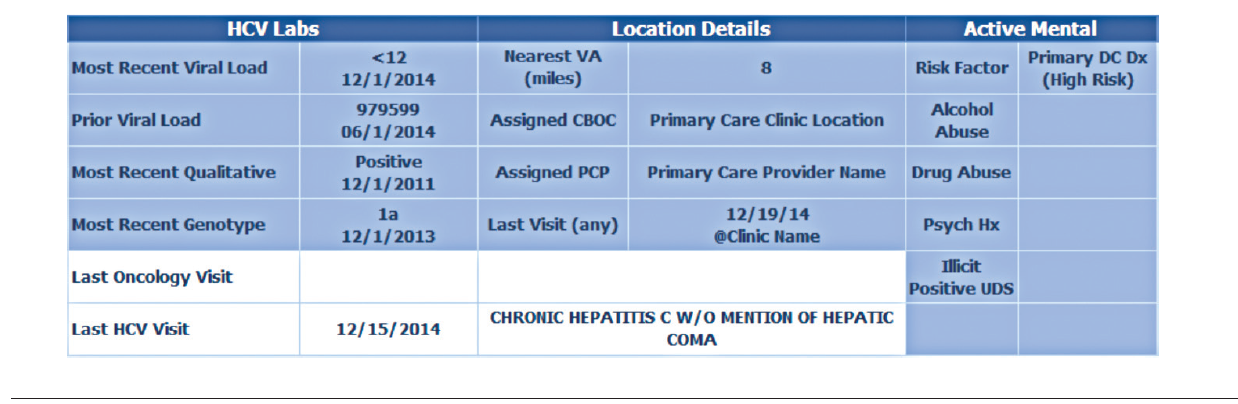
Population management. The VISN 21 HCV dashboard allows for a centralized approach to care across a large geographic area containing multiple facilities. One important function is to identify patients with advanced liver disease as well as those who have not been seen in specialty care within the previous 2 years. It also allows for pretreatment screening through identification of HCV viral characteristics (eg, genotype, viral load) and selected comorbidities (eg, renal function, mental health conditions) that may influence candidacy for specific antiviral therapies. Individual patient reports can be stratified by facility (eg, clinic or VAMC) to identify the burden of disease within a specific location.
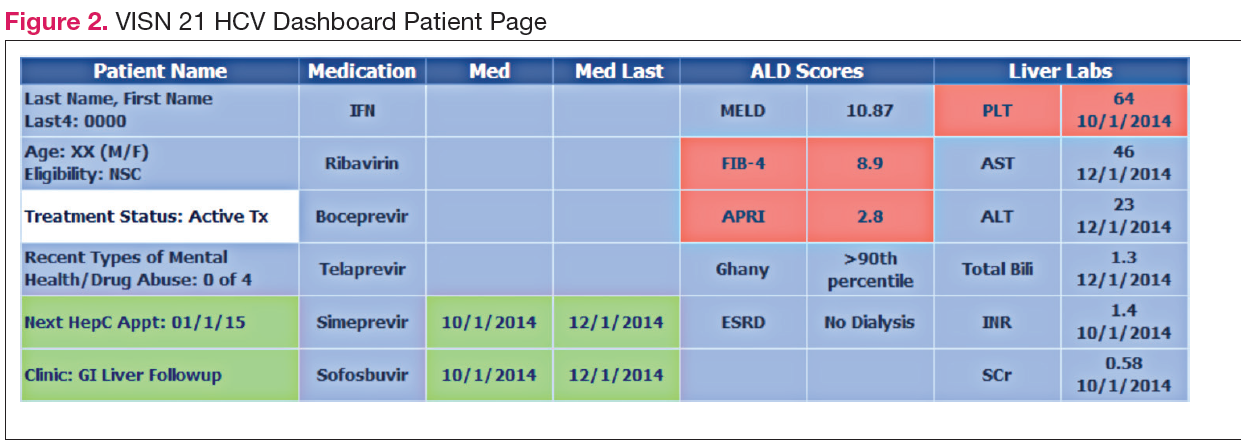
Patient treatment outcome tracking. The HCV dashboard allows tracking of the numbers and characteristics of patients who have previously received antiviral therapy. The number of patients achieving virologic cure may be tracked at the VISN and station levels, or displayed based on user-selected parameters, such as treatment history.
Administrative planning. The high costs of HCV antiviral medication requires careful budgetary planning and close communication with local and regional leadership. The VISN 21 HCV dashboard provides information crucial to assessing future treatment needs. Specifically, it allows administrators to view the number of patients actively being treated. The dashboard also allows for comparison of treatment rates among different facilities and help allocate resources where needed.
Design Architecture
To construct the source data for the dashboards, relevant data elements are pulled into a base table using Structured Query Language (SQL) code. Subsequently, SQL Server Reporting Services (SSRS) (Microsoft, Redmond, WA) compiles the dashboard output into an interactive and user-friendly interface that can be tailored to individual end users’ needs.
Dashboard development process. Through collaboration and survey of clinical providers, clinical factors necessary to decide patient and treatment readiness were identified. Relevant data elements include HCV genotype, selected medical and psychiatric comorbidities, prior receipt of treatment, and presence of advanced liver disease. While liver disease severity may be determined by invasive means, such as liver biopsy, the dashboard offers a noninvasive assessment using laboratory values (eg, calculated Fibrosis 4 score, Model for End Stage Liver Disease score).10,11
Once dashboard elements were selected, the variables were operationalized using data available in the CDW within the prescription, diagnostic, and laboratory data tables. As code was written, output was validated through chart review to ensure accuracy. Further validation was performed through comparison of the dashboard data with the clinical case registry, a registry of HCV viremic confirmed patients. Throughout dashboard development, the product was presented to end users to solicit requests for modifications. The code was refined over time to incorporate end user input.
Dashboard user interface. SSRS allows users to customize reports based on any variables defined within the data set including facility, severity of disease, HCV genotype, and prior antiviral treatment history among others. Results are displayed with summary information, including the total number of patients in the selected cohort, the number of patients who have been referred to a specialty liver clinic, and the number of patients who have been determined to achieve SVR. The end user has the option to export the results to excel for further use (eg, patient lists for telephone follow-up).
User recruitment. After piloting, the VISN 21 HCV dashboard was introduced during monthly pharmacy meetings and clinical telehealth encounters with providers. Feedback was solicited during the presentations and through postdevelopment surveys. In particular, providers requested spreadsheet-friendly formatting, additional informational fields consisting of mental health and substance abuse diagnoses, and identification of all patients with HCV regardless
of disease severity. A key element of dashboard refinement includes enhancing usability by solicitation of user feedback with subsequent tailoring of the user interface.12
Challenges
Many challenges exist in clinical dashboard development, expansion, and implementation including data integrity, workflow, and work culture. Data elements are often variable within a single facility, and this variation increases when identifying the same elements across facilities. For example, a laboratory test name (eg, “serum creatinine”) may exist with 2 to 3 different labels (eg, “creat,” “SCr,” “serum Cr”) within a single facility. As the variation increases, potential for inappropriate laboratory tests may be increased. Specialty clinic names also vary within and between facilities.
Local nomenclature for HCV clinic names may include “liver,” “infectious disease,” “hepatitis c,” or some variation, making it crucial for the dashboard developer to work closely with clinical staff to accurately matchspecialty clinic names being pulled from the data warehouse. Given the complexities of naming nomenclature within VA data, dashboard development requires a substantial investment of code customization and validation.
Ongoing dashboard maintenance is another important challenge due to the need for staff trained in SQL coding and familiarity with VA data warehouse architecture. Consequently, until the VHA dedicates resources to maintain such dashboards, only VISNs with existing technical knowledge and staffing will benefit from dashboards.
Usability, typically defined as “…effectiveness, efficiency and satisfaction with which the intended users can achieve their tasks in the intended context of product use,” is an additional consideration as the HCV clinical dashboard disseminates nationally.13 Standard clinic workflow is not always conducive to the use of dashboards. VHA providers use the Computerized Patient Record System (CPRS) to review and document patient notes. However, accessing the HCV dashboard involves a site hosted outside of CPRS, thereby requiring the user to take several extra steps. These and other usability factors will need to be considered as the dashboard disseminates more widely.
Finally, data describing the effectiveness of clinical dashboards is very limited. VISN 21 is tracking the number of users accessing the dashboard. However, further study is needed to determine if clinical dashboards improve patient access and quality of care as well as factors to enhance usability
Conclusion
Clinical dashboards have the ability to transform each clinical provider into a population health manager who can readily identify patients most in need of care within their facility catchment area and beyond. As HCV dashboard development and implementation grows across the VHA, there is a need to pair clinical and technological advancements with greater patient outreach and shared best practices. Understanding the factors that tie improved quality of care with usability as well as investment in dashboard development and related efforts will likely keep the VHA in the forefront of chronic care delivery.
Author disclosures
The authors report no actual or potential conflicts of interest with regard to this article.
Disclaimer
The opinions expressed herein are those of the authors and do not necessarily reflect those of Federal Practitioner, Frontline Medical Communications Inc., the U.S. Government, or any of its agencies. This article may discuss unlabeled or investigational use of certain drugs. Please review complete prescribing information for specific drugs or drug combinations—including indications, contraindications, warnings, and adverse effects—before administering pharmacologic therapy to patients.
1. Dominitz JA, Boyko EJ, Koepsell TD, et al. Elevated prevalence of hepatitis C infection in users of United States veterans medical centers. Hepatology. 2005;41(1):88-96.
2. United States Department of Veterans Affairs. HCV Viremic Veterans in VHA Care in 2013 with First Fill in the Year or Ever Filled a VHA Outpatient Prescription for a HCV Antiviral Medication for the Nation, by VISN and by Station Description. http://vaww.hepatitis.va.gov/data-reports/ccr2013/RegMed-AnyFirstEverInCare-Jan14-HCVVir-HCV-2013-All.asp. Accessed October 10, 2014.
3. Rongey C, Shen H, Hamilton N, Backus LI, Asch SM, Knight S. Impact of rural residence and health system structure on quality of liver care. PloS One. 2013;8(12):e84826.
4. Beste LA, Ioannou GN. Prevalence and Treatment of Chronic Hepatitis C Virus Infection in the U.S. Department of Veterans Affairs [published online ahead of print January 19, 2015]. Epidemiologic Reviews. doi: 10.1093/epirev/mxu002.
5. Lawitz E, Poordad FF, Pang PS, et al. Sofosbuvir and ledipasvir fixed-dose combination with and without ribavirin in treatment-naive and previously treated patients with genotype 1 hepatitis C virus infection (LONESTAR): an openlabel, randomised, phase 2 trial [published correction appears in Lancet. 2014;383(9920):870]. Lancet. 2014;383(9916):515-523.
6. United States Department of Veterans Affairs. HCV Viremic Veterans in VHA Care in 2013 who had a VHA Diagnosis of Fibrosis/Cirrhosis by FIB-4 in the year for the Nation, by VISN and by Station. http://vaww.hepatitis.va.gov/data-reports/ccr2013/Cond-FIB4CurInCare-Jan14HCVVir-2013-All.asp. Accessed October 10, 2014.
7. Kanwal F, Hoang T, Kramer JR, et al. Increasing prevalence of HCC and cirrhosis in patients with chronic hepatitis C virus infection. Gastroenterology. 2011;140(4):1182-1188.e1.
8. Furukawa MF, King J, Patel V, Hsiao CJ, Adler-Milstein J, Jha AK. Despite substantial progress in EHR adoption, health information exchange and patient engagement remain low in office settings. Health Aff (Millwood). 2014;33(9):1672-1679.
9. Vrieze SI, Docherty A, Thuras P, et al. Best practices: The electronic medical record is an invaluable clinical tool: Let’s start using it. Psychiatric Serv. 2013;64(10):946-949.
10. Vallet-Pichard A, Mallet V, Nalpas B, et al. FIB-4: An inexpensive and accurate marker of fibrosis in HCV infection. Comparison with liver biopsy and fibrotest. Hepatology. 2007;46(1):32-36.
11. Kamath PS, Kim WR; Advanced Liver Disease Study Group. The model for endstage liver disease (MELD). Hepatology. 2007;45(3):797-805.
12. Goldberg L, Lide B, Lowry S, et al. Usability and accessibility in consumer health informatics current trends and future challenges. Am J Prev Med. 2011;40(5 suppl 2):S187-S197.
13. Schumacher RM, Lowry SZ; National Institute of Standards and Technology. NIST Guide to the Processes Approach for Improving the Usability of Electronic Health Records. http://www.nist.gov/itl/hit/upload/Guide_Final_Publication_Version.pdf. Published November 29, 2010. Accessed November 24, 2014.
The VHA cares for 170,000 patients with chronic hepatitis C virus (HCV) infection, making it the largest single provider of medical care to chronic HCV patients in the U.S.1 Although HCV treatment rates within the VHA outpace those of the private sector, only half of patients with HCV infection within the VHA have accessed a liver specialist and less than a quarter have received antiviral medication.2-4
Newer HCV treatment regimens promise treatment sustained virologic response (SVR) rates—a marker of viral clearance posttreatment—of ≥ 90% in most cases but require careful patient selection and management.5 In particular, the estimated 24% of patients with HCV infection with advanced liver disease require more rapid consideration for therapy to reduce complications of cirrhosis such as liver failure, hepatocellular carcinoma, and death.6 With the advent of promising HCV therapies and rising rates of cirrhosis, there is an urgent need for population health management approach to deliver HCV care more widely and effectively.5,7
Rationale for Clinical Dashboards
Although the VHA hosts the largest integrated electronic medical record (EMR) system in the U.S., an EMR on its own does not guarantee improved patient care or access.8 EMRs can be used to document health care delivery, but they do not routinely provide information about the burden of disease in a population, nor do they identify patients most in need of care.
Clinical dashboards are tools that are geared to provide clinicians with relevant data to improve patient care. Early clinical dashboard development across the VHA was primary care focused, targeting patients with diabetes, ischemic heart disease, and hypertension. This national primary care dashboard provides clinically relevant, actionable data and enables the clinical provider to track patient progress. In addition, regional data can be aggregated for use by VISN managers.
While the impact of dashboards on quality of care is not well investigated, it remains a vital tool with the potential to transform care.9
HCV dashboards have been developed by individual VISNs and facilities across the VHA. HCV dashboards serve to identify patients most in need of antiviral therapy, expand outreach to those previously unseen by specialty care, sort patients by severity of liver disease, track treatment status, and calculate SVR.
Current HCV dashboards incorporate elements derived from the VA Corporate Data Warehouse (CDW), a national VA data repository consisting of data from all facilities’ electronic medical record systems. Updated information from the previous day is made available in VISN data warehouses and is refreshed nightly. The final result is user-friendly clinical data available in near-real time to dashboard users.
VISN 21 HCV Dashboard
Purpose and Elements
The VISN 21 HCV dashboard will be discussed as a prototype. Graphics of the VISN 21 dashboard interface are presented in Figure 1 and Figure 2. The VISN 21 HCV dashboard was developed by pharmacists with specialty training in medical informatics, health care analytics, and data management. The dashboard addresses 3 previously unmet needs in HCV care: population management, patient treatment outcome tracking, and administrative planning.
Population management. The VISN 21 HCV dashboard allows for a centralized approach to care across a large geographic area containing multiple facilities. One important function is to identify patients with advanced liver disease as well as those who have not been seen in specialty care within the previous 2 years. It also allows for pretreatment screening through identification of HCV viral characteristics (eg, genotype, viral load) and selected comorbidities (eg, renal function, mental health conditions) that may influence candidacy for specific antiviral therapies. Individual patient reports can be stratified by facility (eg, clinic or VAMC) to identify the burden of disease within a specific location.
Patient treatment outcome tracking. The HCV dashboard allows tracking of the numbers and characteristics of patients who have previously received antiviral therapy. The number of patients achieving virologic cure may be tracked at the VISN and station levels, or displayed based on user-selected parameters, such as treatment history.
Administrative planning. The high costs of HCV antiviral medication requires careful budgetary planning and close communication with local and regional leadership. The VISN 21 HCV dashboard provides information crucial to assessing future treatment needs. Specifically, it allows administrators to view the number of patients actively being treated. The dashboard also allows for comparison of treatment rates among different facilities and help allocate resources where needed.
Design Architecture
To construct the source data for the dashboards, relevant data elements are pulled into a base table using Structured Query Language (SQL) code. Subsequently, SQL Server Reporting Services (SSRS) (Microsoft, Redmond, WA) compiles the dashboard output into an interactive and user-friendly interface that can be tailored to individual end users’ needs.
Dashboard development process. Through collaboration and survey of clinical providers, clinical factors necessary to decide patient and treatment readiness were identified. Relevant data elements include HCV genotype, selected medical and psychiatric comorbidities, prior receipt of treatment, and presence of advanced liver disease. While liver disease severity may be determined by invasive means, such as liver biopsy, the dashboard offers a noninvasive assessment using laboratory values (eg, calculated Fibrosis 4 score, Model for End Stage Liver Disease score).10,11
Once dashboard elements were selected, the variables were operationalized using data available in the CDW within the prescription, diagnostic, and laboratory data tables. As code was written, output was validated through chart review to ensure accuracy. Further validation was performed through comparison of the dashboard data with the clinical case registry, a registry of HCV viremic confirmed patients. Throughout dashboard development, the product was presented to end users to solicit requests for modifications. The code was refined over time to incorporate end user input.
Dashboard user interface. SSRS allows users to customize reports based on any variables defined within the data set including facility, severity of disease, HCV genotype, and prior antiviral treatment history among others. Results are displayed with summary information, including the total number of patients in the selected cohort, the number of patients who have been referred to a specialty liver clinic, and the number of patients who have been determined to achieve SVR. The end user has the option to export the results to excel for further use (eg, patient lists for telephone follow-up).
User recruitment. After piloting, the VISN 21 HCV dashboard was introduced during monthly pharmacy meetings and clinical telehealth encounters with providers. Feedback was solicited during the presentations and through postdevelopment surveys. In particular, providers requested spreadsheet-friendly formatting, additional informational fields consisting of mental health and substance abuse diagnoses, and identification of all patients with HCV regardless
of disease severity. A key element of dashboard refinement includes enhancing usability by solicitation of user feedback with subsequent tailoring of the user interface.12
Challenges
Many challenges exist in clinical dashboard development, expansion, and implementation including data integrity, workflow, and work culture. Data elements are often variable within a single facility, and this variation increases when identifying the same elements across facilities. For example, a laboratory test name (eg, “serum creatinine”) may exist with 2 to 3 different labels (eg, “creat,” “SCr,” “serum Cr”) within a single facility. As the variation increases, potential for inappropriate laboratory tests may be increased. Specialty clinic names also vary within and between facilities.
Local nomenclature for HCV clinic names may include “liver,” “infectious disease,” “hepatitis c,” or some variation, making it crucial for the dashboard developer to work closely with clinical staff to accurately matchspecialty clinic names being pulled from the data warehouse. Given the complexities of naming nomenclature within VA data, dashboard development requires a substantial investment of code customization and validation.
Ongoing dashboard maintenance is another important challenge due to the need for staff trained in SQL coding and familiarity with VA data warehouse architecture. Consequently, until the VHA dedicates resources to maintain such dashboards, only VISNs with existing technical knowledge and staffing will benefit from dashboards.
Usability, typically defined as “…effectiveness, efficiency and satisfaction with which the intended users can achieve their tasks in the intended context of product use,” is an additional consideration as the HCV clinical dashboard disseminates nationally.13 Standard clinic workflow is not always conducive to the use of dashboards. VHA providers use the Computerized Patient Record System (CPRS) to review and document patient notes. However, accessing the HCV dashboard involves a site hosted outside of CPRS, thereby requiring the user to take several extra steps. These and other usability factors will need to be considered as the dashboard disseminates more widely.
Finally, data describing the effectiveness of clinical dashboards is very limited. VISN 21 is tracking the number of users accessing the dashboard. However, further study is needed to determine if clinical dashboards improve patient access and quality of care as well as factors to enhance usability
Conclusion
Clinical dashboards have the ability to transform each clinical provider into a population health manager who can readily identify patients most in need of care within their facility catchment area and beyond. As HCV dashboard development and implementation grows across the VHA, there is a need to pair clinical and technological advancements with greater patient outreach and shared best practices. Understanding the factors that tie improved quality of care with usability as well as investment in dashboard development and related efforts will likely keep the VHA in the forefront of chronic care delivery.
Author disclosures
The authors report no actual or potential conflicts of interest with regard to this article.
Disclaimer
The opinions expressed herein are those of the authors and do not necessarily reflect those of Federal Practitioner, Frontline Medical Communications Inc., the U.S. Government, or any of its agencies. This article may discuss unlabeled or investigational use of certain drugs. Please review complete prescribing information for specific drugs or drug combinations—including indications, contraindications, warnings, and adverse effects—before administering pharmacologic therapy to patients.
1. Dominitz JA, Boyko EJ, Koepsell TD, et al. Elevated prevalence of hepatitis C infection in users of United States veterans medical centers. Hepatology. 2005;41(1):88-96.
2. United States Department of Veterans Affairs. HCV Viremic Veterans in VHA Care in 2013 with First Fill in the Year or Ever Filled a VHA Outpatient Prescription for a HCV Antiviral Medication for the Nation, by VISN and by Station Description. http://vaww.hepatitis.va.gov/data-reports/ccr2013/RegMed-AnyFirstEverInCare-Jan14-HCVVir-HCV-2013-All.asp. Accessed October 10, 2014.
3. Rongey C, Shen H, Hamilton N, Backus LI, Asch SM, Knight S. Impact of rural residence and health system structure on quality of liver care. PloS One. 2013;8(12):e84826.
4. Beste LA, Ioannou GN. Prevalence and Treatment of Chronic Hepatitis C Virus Infection in the U.S. Department of Veterans Affairs [published online ahead of print January 19, 2015]. Epidemiologic Reviews. doi: 10.1093/epirev/mxu002.
5. Lawitz E, Poordad FF, Pang PS, et al. Sofosbuvir and ledipasvir fixed-dose combination with and without ribavirin in treatment-naive and previously treated patients with genotype 1 hepatitis C virus infection (LONESTAR): an openlabel, randomised, phase 2 trial [published correction appears in Lancet. 2014;383(9920):870]. Lancet. 2014;383(9916):515-523.
6. United States Department of Veterans Affairs. HCV Viremic Veterans in VHA Care in 2013 who had a VHA Diagnosis of Fibrosis/Cirrhosis by FIB-4 in the year for the Nation, by VISN and by Station. http://vaww.hepatitis.va.gov/data-reports/ccr2013/Cond-FIB4CurInCare-Jan14HCVVir-2013-All.asp. Accessed October 10, 2014.
7. Kanwal F, Hoang T, Kramer JR, et al. Increasing prevalence of HCC and cirrhosis in patients with chronic hepatitis C virus infection. Gastroenterology. 2011;140(4):1182-1188.e1.
8. Furukawa MF, King J, Patel V, Hsiao CJ, Adler-Milstein J, Jha AK. Despite substantial progress in EHR adoption, health information exchange and patient engagement remain low in office settings. Health Aff (Millwood). 2014;33(9):1672-1679.
9. Vrieze SI, Docherty A, Thuras P, et al. Best practices: The electronic medical record is an invaluable clinical tool: Let’s start using it. Psychiatric Serv. 2013;64(10):946-949.
10. Vallet-Pichard A, Mallet V, Nalpas B, et al. FIB-4: An inexpensive and accurate marker of fibrosis in HCV infection. Comparison with liver biopsy and fibrotest. Hepatology. 2007;46(1):32-36.
11. Kamath PS, Kim WR; Advanced Liver Disease Study Group. The model for endstage liver disease (MELD). Hepatology. 2007;45(3):797-805.
12. Goldberg L, Lide B, Lowry S, et al. Usability and accessibility in consumer health informatics current trends and future challenges. Am J Prev Med. 2011;40(5 suppl 2):S187-S197.
13. Schumacher RM, Lowry SZ; National Institute of Standards and Technology. NIST Guide to the Processes Approach for Improving the Usability of Electronic Health Records. http://www.nist.gov/itl/hit/upload/Guide_Final_Publication_Version.pdf. Published November 29, 2010. Accessed November 24, 2014.
Reflectance Confocal Microscopy: An Effective Diagnostic Tool for Dermatophytic Infections
There are a variety of well-established methods for diagnosing dermatophyte infections, including potassium hydroxide (KOH) preparations, fungal cultures, and skin biopsies. Each modality has its place in clinical practice, but they also have drawbacks. Reflectance confocal microscopy (RCM) is an emerging in vivo technology that could potentially serve as a sensitive, rapid, and noninvasive method of diagnosing dermatophytosis. Using near-infrared laser light scanning, RCM provides a quick noninvasive method of generating black-and-white, horizontal, quasipathology images that allow for the identification of cells and other structures similar to dermoscopy and histopathology.1 The images are obtained in a fully noninvasive fashion, as the device is placed in contact with the skin using a liquid medium. The process takes 5 to 15 minutes depending on the number of images obtained, and the images can then be displayed in real time on a computer screen or transmitted to a pathologist for evaluation.
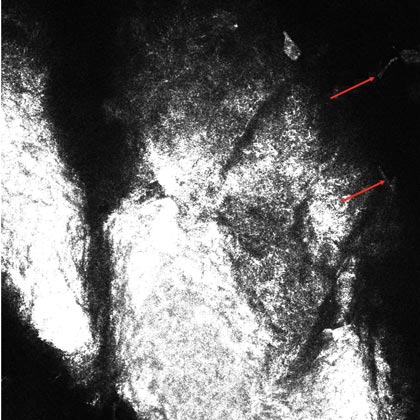
Most initial applications of RCM focused on evaluating melanocytic lesions with the primary goal of differentiating between benign nevi and melanomas, thus reducing the need for skin biopsies.2-4 Efforts to develop RCM diagnostic criteria for identification of other skin cancers5,6 as well as to aid in the diagnosis of nonneoplastic skin conditions are ongoing.7 The potential applications of RCM are virtually limitless, as this modality can (at least partially) take the place of biopsies in a variety of clinical scenarios.2,8 Few reports have documented the utility of RCM as a diagnostic tool for onychomycosis9,10 and dermatophytic infections of the skin.11,12 Hui et al13 reported use for RCM for microscopic evaluation of mycelium features. Turan et al14 found that RCM could not replace the current diagnostic standards for tinea incognito but may be successfully used as an in vivo noninvasive screening tool to facilitate diagnosis. Because it provides high-resolution horizontal images extending from the surface of the stratum corneum to the superficial reticular dermis, RCM could be an effective tool in the diagnosis of cutaneous dermatophyte infections, as organisms usually are located in the stratum corneum of the epidermis in this infection. Branching hyphae are readily visible in the stratum corneum on RCM (Figure).
We reviewed a series of 9 cases from a private practice setting in which RCM was used to diagnose dermatophytosis. We compared the diagnostic accuracy of RCM to results from other diagnostic methods and the ultimate clinical outcome to determine the usefulness of this new technology.
Methods
Our retrospective chart review included all cases in which RCM was used and the clinical differential diagnosis included tinea corporis over a 4-month period in a private, single-specialty dermatology practice. All patients were treated by the same dermatologist. The RCM images were taken using an imaging system that had a horizontal optical resolution of less than 1.25 μm and a vertical optical resolution of less than 5.0 μm. The imaging was performed by medical assistants who were trained by the device manufacturer.
The sample sites were cleaned with isopropyl alcohol and a translucent contact ring was affixed to the skin using a liquid medium. The imaging head of the device was connected to the imaging ring and the images were taken. Identical imaging protocol was used in all patients. Multiple sets of horizontal images and one stack of vertical images were obtained. Patients reported no discomfort during the procedure, and the entire process was usually completed within 15 minutes. The images were sent to the pathologist for evaluation using the manufacturer’s telepathology system and were returned with a diagnosis within 24 hours. (On-site, real-time diagnosis also is possible if the dermatologist is trained in interpreting the images.)
In the chart review we looked for other diagnostic methods used as well as clinical outcomes. A case was considered to be positive for dermatophytic infection if any of the other diagnostic modalities yielded positive results or if a definitive resolution of the condition could be achieved using antifungal treatments alone.
Results
Ten patients (mean age, 43.1 years; age range, 16–76 years) with lesions that presented as possible dermatophytic infections underwent RCM analysis. In addition to RCM imaging, 5 patients underwent KOH testing of skin scrapings, 3 underwent analysis by fungal culture utilizing dermatophyte test medium (DTM), and 5 underwent biopsies. The findings are further summarized in the Table. One patient (patient 5) was excluded from the study because the RCM could not be evaluated due to the poor quality of the confocal images. Additionally, 2 patients (patients 2 and 7) had suboptimal imaging, which limited the evaluation.
Of the 9 evaluable cases, 4 (patients 1–4) were determined to be positive for the presence of dermatophytic infection through the fulfillment of criteria independent of RCM imaging. In each of those 4 cases, RCM images revealed the presence of hyphae, which indicated the presence of dermato-phytic infection. In these 4 cases, RCM and other diagnostic methods reached the same diagnosis.
In the other 5 cases (patients 6–10), the final diagnosis was not a dermatophytic infection. In 4 of those cases (patients 7–10), there were no signs of any structure resembling hyphae on the RCM images; however, in 1 case (patient 6), the RCM images showed structures that were consistent with the appearance of hyphae to the extent that the investigators, based solely on analysis of the RCM images, deemed a diagnosis indicating presence of a dermatophytic infection to be valid. In this case, a 38-year-old man presented with extensive scaly patches on the back of several months’ duration. Repeated skin biopsies showed hyperkeratosis and occasionally minimal spongiosis, while periodic acid–Schiff staining did not reveal fungal elements. Fungal cultures and KOH preparations were negative. Prior treatments with topical antifungals and steroids failed to improve the condition, which resolved rapidly with urea cream 40%. The interpretation of the RCM images in this patient did not match up with the results obtained from other methods of diagnosis and the clinical outcome; thus, we classified it as an incorrect diagnosis based on RCM analysis alone. In total, successful diagnosis using RCM imaging was achieved in 8 of 9 cases included in the analysis.
Comment
In this chart review, we evaluated the utility of using RCM in the diagnosis of dermatophytic infections of the skin by comparing findings noted on confocal imaging with those of other methods of diagnosis (Table). We included cases in which the clinical presentation raised the possibility of dermatophytic infection. Cases were considered positive for dermatophytes if KOH preparation, fungal culture, or skin biopsy (with or without periodic acid–Schiff staining) were positive or if there was a complete response to antifungal treatment alone. In this small number of cases, we found that RCM was 100% sensitive, as hyphae were readily seen in all cases of dermatophytic infections. In 1 RCM-positive case (patient 3), fungal culture with DTM was negative, but antifungal therapy was nonetheless given. Because the lesion resolved promptly with econazole, RCM proved to be true positive and DTM proved to be false negative (Table). Reflectance confocal microscopy imaging, however, was less specific. Of the 5 cases that showed no presence of dermatophytic infection, there was 1 case (patient 6) in which the pathologist could recognize structures that resembled fungal hyphae. There are various possible sources of structures masquerading as dermatophytes on confocal imaging, including the edges of nonnucleated loose keratinocytes, keratin fragments, and other foreign fibers. Evaluation by an experienced investigator can certainly help in limiting false-positive analyses, but a larger case study would be useful to develop a set of specific criteria to aid in the differentiation of fungal hyphae from other artifacts as well as to further define the sensitivity and specificity of RCM.
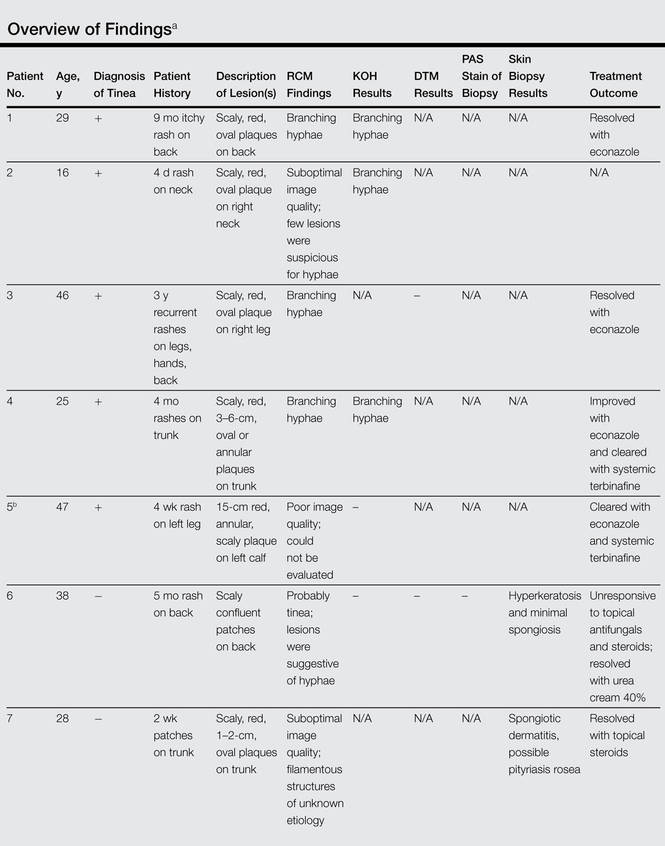
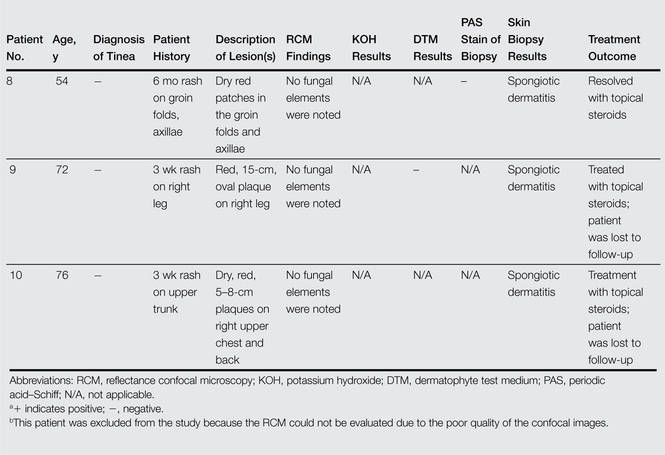
We also encountered difficulties with the technical aspects of RCM. One case (patient 5) was excluded from the analysis because the images were poor quality and could not be interpreted, and 2 cases (patients 2 and 7) had suboptimal images, in part due to operator error and in part due to equipment error that was recognized later on. The technical difficulties were problematic because no immediate review of image quality was available while patients were still present for possible reimaging. All of the images evaluated in this study were captured shortly after the RCM device was introduced to the practice. It is possible that with more training and a quick, on-site review of image quality, these technical problems could be avoided. Imaging protocols (ie, numbers and levels of scans taken by the confocal microscope) also could be adjusted so they include a large enough range to compensate for potential operator errors; however, these adjustments also could increase overall imaging time.
Conclusion
Based on our chart review of a small number of cases, we found that RCM can be a useful tool in diagnosing dermatophytic infections of the skin. With adequate training, dermatologists may be able to use RCM as an in-office tool to capture and evaluate images and subsequently diagnose or exclude dermatophytosis in a quick and noninvasive manner. However, further research and controlled studies of more cases will be required to develop accurate criteria for diagnosing fungal structures by RCM as well as to help determine the role of RCM in our diagnostic armamentarium.
1. Longo C, Farnetani F, Ciardo S, et al. Is confocal microscopy a valuable tool in diagnosing nodular lesions? a study of 140 cases. Br J Dermatol. 2013;169:58-67.
2. Debarbieux S, Dalle S, Depaepe L, et al. Second primary melanomas under BRAF blockers: study by reflectance confocal microscopy [published online a head of print April 1, 2013]. Br J Dermatol. 2013;168:1230-1235.
3. Schwartz RJ, Vera K, Navarrete N, et al. In vivo reflectance confocal microscopy of halo nevus. J Cutan Med Surg. 2013;17:33-38.
4. Pellacani G, Guitera P, Longo C, et al. The impact of in vivo reflectance confocal microscopy for the diagnostic accuracy of melanoma and equivocal melanocytic lesions. J Invest Dermatol. 2007;127:2759-2765.
5. Nori S, Rius-Diaz F, Cuevas J, et al. Sensitivity and specificity of reflectance-mode confocal micros-copy for in vivo diagnosis of basal cell carcinoma: a multicenter study. J Am Acad Dermatol. 2004;51:923-930.
6. Arzberger E, Komericki P, Ahlgrimm-Siess V, et al. Differentiation between balanitis and carcinoma in situ using reflectance confocal microscopy. JAMA Dermatol. 2013;149:440-445.
7. Ardigò M, Maliszewski I, Cota C, et al. Preliminary evaluation of in vivo reflectance confocal microscopy features of discoid lupus erythematosus. Br J Dermatol. 2007;156:1196-1203.
8. Longo C, Casari A, Pepe P, et al. Confocal microscopy insights into the treatment and cellular immune response of Basal cell carcinoma to photodynamic therapy. Dermatology. 2012;225:264-270.
9. Hongcharu W, Dwyer P, Gonzalez S, et al. Confirmation of onychomycosis by in vivo confocal microscopy. J Am Acad Dermatol. 2000;42:214-216.
10. Rothmund G, Sattler EC, Kaestle R, et al. Confocal laser scanning microscopy as a new valuable tool in the diagnosis of onychomycosis—comparison of six diagnostic methods [published online ahead of print April 23, 2012]. Mycoses. 2013;56:47-55.
11. Markus R, Huzaira M, Anderson RR, et al. A better potassium hydroxide preparation? Arch Dermatol. 2001;137:1076-1078.
12. Slutsky JB, Rabinovitz H, Grichnik JM, et al. Reflectance confocal microscopic features of dermatophytes, scabies, and Demodex. Arch Dermatol. 2011;147:1008.
13. Hui D, Xue-chang S, Ai-e X. Evaluation of reflectance confocal microscopy in dermatophytosis. Mycoses. 2013;56:130-133.
14. Turan E, Erdemir AT, Gurel MS, et al. A new diagnostic technique for tinea incognito: in vivo reflectance confocal microscopy. report of five cases. Skin Res Technol. 2013;19:e103-e107.
There are a variety of well-established methods for diagnosing dermatophyte infections, including potassium hydroxide (KOH) preparations, fungal cultures, and skin biopsies. Each modality has its place in clinical practice, but they also have drawbacks. Reflectance confocal microscopy (RCM) is an emerging in vivo technology that could potentially serve as a sensitive, rapid, and noninvasive method of diagnosing dermatophytosis. Using near-infrared laser light scanning, RCM provides a quick noninvasive method of generating black-and-white, horizontal, quasipathology images that allow for the identification of cells and other structures similar to dermoscopy and histopathology.1 The images are obtained in a fully noninvasive fashion, as the device is placed in contact with the skin using a liquid medium. The process takes 5 to 15 minutes depending on the number of images obtained, and the images can then be displayed in real time on a computer screen or transmitted to a pathologist for evaluation.
Most initial applications of RCM focused on evaluating melanocytic lesions with the primary goal of differentiating between benign nevi and melanomas, thus reducing the need for skin biopsies.2-4 Efforts to develop RCM diagnostic criteria for identification of other skin cancers5,6 as well as to aid in the diagnosis of nonneoplastic skin conditions are ongoing.7 The potential applications of RCM are virtually limitless, as this modality can (at least partially) take the place of biopsies in a variety of clinical scenarios.2,8 Few reports have documented the utility of RCM as a diagnostic tool for onychomycosis9,10 and dermatophytic infections of the skin.11,12 Hui et al13 reported use for RCM for microscopic evaluation of mycelium features. Turan et al14 found that RCM could not replace the current diagnostic standards for tinea incognito but may be successfully used as an in vivo noninvasive screening tool to facilitate diagnosis. Because it provides high-resolution horizontal images extending from the surface of the stratum corneum to the superficial reticular dermis, RCM could be an effective tool in the diagnosis of cutaneous dermatophyte infections, as organisms usually are located in the stratum corneum of the epidermis in this infection. Branching hyphae are readily visible in the stratum corneum on RCM (Figure).
We reviewed a series of 9 cases from a private practice setting in which RCM was used to diagnose dermatophytosis. We compared the diagnostic accuracy of RCM to results from other diagnostic methods and the ultimate clinical outcome to determine the usefulness of this new technology.
Methods
Our retrospective chart review included all cases in which RCM was used and the clinical differential diagnosis included tinea corporis over a 4-month period in a private, single-specialty dermatology practice. All patients were treated by the same dermatologist. The RCM images were taken using an imaging system that had a horizontal optical resolution of less than 1.25 μm and a vertical optical resolution of less than 5.0 μm. The imaging was performed by medical assistants who were trained by the device manufacturer.
The sample sites were cleaned with isopropyl alcohol and a translucent contact ring was affixed to the skin using a liquid medium. The imaging head of the device was connected to the imaging ring and the images were taken. Identical imaging protocol was used in all patients. Multiple sets of horizontal images and one stack of vertical images were obtained. Patients reported no discomfort during the procedure, and the entire process was usually completed within 15 minutes. The images were sent to the pathologist for evaluation using the manufacturer’s telepathology system and were returned with a diagnosis within 24 hours. (On-site, real-time diagnosis also is possible if the dermatologist is trained in interpreting the images.)
In the chart review we looked for other diagnostic methods used as well as clinical outcomes. A case was considered to be positive for dermatophytic infection if any of the other diagnostic modalities yielded positive results or if a definitive resolution of the condition could be achieved using antifungal treatments alone.
Results
Ten patients (mean age, 43.1 years; age range, 16–76 years) with lesions that presented as possible dermatophytic infections underwent RCM analysis. In addition to RCM imaging, 5 patients underwent KOH testing of skin scrapings, 3 underwent analysis by fungal culture utilizing dermatophyte test medium (DTM), and 5 underwent biopsies. The findings are further summarized in the Table. One patient (patient 5) was excluded from the study because the RCM could not be evaluated due to the poor quality of the confocal images. Additionally, 2 patients (patients 2 and 7) had suboptimal imaging, which limited the evaluation.
Of the 9 evaluable cases, 4 (patients 1–4) were determined to be positive for the presence of dermatophytic infection through the fulfillment of criteria independent of RCM imaging. In each of those 4 cases, RCM images revealed the presence of hyphae, which indicated the presence of dermato-phytic infection. In these 4 cases, RCM and other diagnostic methods reached the same diagnosis.
In the other 5 cases (patients 6–10), the final diagnosis was not a dermatophytic infection. In 4 of those cases (patients 7–10), there were no signs of any structure resembling hyphae on the RCM images; however, in 1 case (patient 6), the RCM images showed structures that were consistent with the appearance of hyphae to the extent that the investigators, based solely on analysis of the RCM images, deemed a diagnosis indicating presence of a dermatophytic infection to be valid. In this case, a 38-year-old man presented with extensive scaly patches on the back of several months’ duration. Repeated skin biopsies showed hyperkeratosis and occasionally minimal spongiosis, while periodic acid–Schiff staining did not reveal fungal elements. Fungal cultures and KOH preparations were negative. Prior treatments with topical antifungals and steroids failed to improve the condition, which resolved rapidly with urea cream 40%. The interpretation of the RCM images in this patient did not match up with the results obtained from other methods of diagnosis and the clinical outcome; thus, we classified it as an incorrect diagnosis based on RCM analysis alone. In total, successful diagnosis using RCM imaging was achieved in 8 of 9 cases included in the analysis.
Comment
In this chart review, we evaluated the utility of using RCM in the diagnosis of dermatophytic infections of the skin by comparing findings noted on confocal imaging with those of other methods of diagnosis (Table). We included cases in which the clinical presentation raised the possibility of dermatophytic infection. Cases were considered positive for dermatophytes if KOH preparation, fungal culture, or skin biopsy (with or without periodic acid–Schiff staining) were positive or if there was a complete response to antifungal treatment alone. In this small number of cases, we found that RCM was 100% sensitive, as hyphae were readily seen in all cases of dermatophytic infections. In 1 RCM-positive case (patient 3), fungal culture with DTM was negative, but antifungal therapy was nonetheless given. Because the lesion resolved promptly with econazole, RCM proved to be true positive and DTM proved to be false negative (Table). Reflectance confocal microscopy imaging, however, was less specific. Of the 5 cases that showed no presence of dermatophytic infection, there was 1 case (patient 6) in which the pathologist could recognize structures that resembled fungal hyphae. There are various possible sources of structures masquerading as dermatophytes on confocal imaging, including the edges of nonnucleated loose keratinocytes, keratin fragments, and other foreign fibers. Evaluation by an experienced investigator can certainly help in limiting false-positive analyses, but a larger case study would be useful to develop a set of specific criteria to aid in the differentiation of fungal hyphae from other artifacts as well as to further define the sensitivity and specificity of RCM.
We also encountered difficulties with the technical aspects of RCM. One case (patient 5) was excluded from the analysis because the images were poor quality and could not be interpreted, and 2 cases (patients 2 and 7) had suboptimal images, in part due to operator error and in part due to equipment error that was recognized later on. The technical difficulties were problematic because no immediate review of image quality was available while patients were still present for possible reimaging. All of the images evaluated in this study were captured shortly after the RCM device was introduced to the practice. It is possible that with more training and a quick, on-site review of image quality, these technical problems could be avoided. Imaging protocols (ie, numbers and levels of scans taken by the confocal microscope) also could be adjusted so they include a large enough range to compensate for potential operator errors; however, these adjustments also could increase overall imaging time.
Conclusion
Based on our chart review of a small number of cases, we found that RCM can be a useful tool in diagnosing dermatophytic infections of the skin. With adequate training, dermatologists may be able to use RCM as an in-office tool to capture and evaluate images and subsequently diagnose or exclude dermatophytosis in a quick and noninvasive manner. However, further research and controlled studies of more cases will be required to develop accurate criteria for diagnosing fungal structures by RCM as well as to help determine the role of RCM in our diagnostic armamentarium.
1. Longo C, Farnetani F, Ciardo S, et al. Is confocal microscopy a valuable tool in diagnosing nodular lesions? a study of 140 cases. Br J Dermatol. 2013;169:58-67.
2. Debarbieux S, Dalle S, Depaepe L, et al. Second primary melanomas under BRAF blockers: study by reflectance confocal microscopy [published online a head of print April 1, 2013]. Br J Dermatol. 2013;168:1230-1235.
3. Schwartz RJ, Vera K, Navarrete N, et al. In vivo reflectance confocal microscopy of halo nevus. J Cutan Med Surg. 2013;17:33-38.
4. Pellacani G, Guitera P, Longo C, et al. The impact of in vivo reflectance confocal microscopy for the diagnostic accuracy of melanoma and equivocal melanocytic lesions. J Invest Dermatol. 2007;127:2759-2765.
5. Nori S, Rius-Diaz F, Cuevas J, et al. Sensitivity and specificity of reflectance-mode confocal micros-copy for in vivo diagnosis of basal cell carcinoma: a multicenter study. J Am Acad Dermatol. 2004;51:923-930.
6. Arzberger E, Komericki P, Ahlgrimm-Siess V, et al. Differentiation between balanitis and carcinoma in situ using reflectance confocal microscopy. JAMA Dermatol. 2013;149:440-445.
7. Ardigò M, Maliszewski I, Cota C, et al. Preliminary evaluation of in vivo reflectance confocal microscopy features of discoid lupus erythematosus. Br J Dermatol. 2007;156:1196-1203.
8. Longo C, Casari A, Pepe P, et al. Confocal microscopy insights into the treatment and cellular immune response of Basal cell carcinoma to photodynamic therapy. Dermatology. 2012;225:264-270.
9. Hongcharu W, Dwyer P, Gonzalez S, et al. Confirmation of onychomycosis by in vivo confocal microscopy. J Am Acad Dermatol. 2000;42:214-216.
10. Rothmund G, Sattler EC, Kaestle R, et al. Confocal laser scanning microscopy as a new valuable tool in the diagnosis of onychomycosis—comparison of six diagnostic methods [published online ahead of print April 23, 2012]. Mycoses. 2013;56:47-55.
11. Markus R, Huzaira M, Anderson RR, et al. A better potassium hydroxide preparation? Arch Dermatol. 2001;137:1076-1078.
12. Slutsky JB, Rabinovitz H, Grichnik JM, et al. Reflectance confocal microscopic features of dermatophytes, scabies, and Demodex. Arch Dermatol. 2011;147:1008.
13. Hui D, Xue-chang S, Ai-e X. Evaluation of reflectance confocal microscopy in dermatophytosis. Mycoses. 2013;56:130-133.
14. Turan E, Erdemir AT, Gurel MS, et al. A new diagnostic technique for tinea incognito: in vivo reflectance confocal microscopy. report of five cases. Skin Res Technol. 2013;19:e103-e107.
Practice Points
- Current methods for diagnosing dermatophytosis can be invasive, with variable sensitivity and/or slow turnaround time.
- Reflectance confocal microscopy is a promising option for rapid noninvasive diagnosis of dermatophytosis.
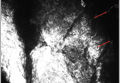
Outcomes of Treatment with Recombinant Tissue Plasminogen Activator in Patients Age 80 Years and Older Presenting with Acute Ischemic Stroke
From Summa Health System, Akron, OH.
Abstract
- Background: Ischemic stroke is a major cause of morbidity and mortality for patients ≥ 80 years old. The use of intravenous recombinant tissue plasminogen activator (tPA) in patients ≥ 80 years for treatment of ischemic stroke remains controversial.
- Objective: To examine outcomes in patients ≥ 80 years old who received tPA in our institution.
- Methods: This was a retrospective cohort study at a community-based certified acute stroke center. Individuals age ≥ 80 years evaluated emergently for acute neurologic changes consistent with ischemic stroke were included (n = 184). The comparison groups within this sample were patients who received tPA versus with those who did not because they came to the ED outside of the treatment window. Outcome measures included length of stay, symptomatic intracerebral hemorrhage (ICH), discharge disposition, and in-hospital death
- Results: 38 patients (20.7%) received tPA. 50 patients (27.2%) presented outside of treatment windows and were included in comparative analysis. There was no difference between groups in age (P = 0.26) or initial National Institute of Health Stroke Scale (P = 0.598). One patient (2.6%) who received tPA developed symptomatic ICH. Those receiving tPA were more likely to be discharged to acute rehabilitation hospitals (P = 0.012) and less likely to experience in hospital death (P = 0.048).
- Conclusion: At this institution, the use of tPA in patients ≥ 80 years old is not associated with increased mortality or risk of symptomatic ICH. Those who received tPA were more likely to be discharged to acute rehabilitation hospitals, suggesting greater potential for functional recovery.
Acute ischemic stroke is a major cause of morbidity and mortality in patients 80 years or older. Though less than 5% of the United States population is over the age of 80 [1], studies have shown that up to one-third of patients presenting with ischemic stroke are ≥ 80 years old [2] and among first-time strokes, a third occur in those ≥ 80 [3]. Older adults present with worse symptoms associated with ischemic stroke as measured by the National Institutes of Health Stroke Scale (NIHSS) compared with younger (< 80 years) counterparts [4]. Older patients are more likely to be discharged to a location other than home [5]. Older age is associated with higher hospital, 30-day, and 1-year mortality [3,5,6]. Patients ≥ 80 are significantly more likely to die in the hospital compared to younger patients, 11.7% to 23.6% vs 5.1%, respectively [3,7].
The Food and Drug Administration (FDA) approved the use of intravenous recombinant tissue plasminogen activator (tPA) in 1996 for the treatment of ischemic stroke [8]. Studies evaluating the safety and efficacy of tPA in ischemic stroke excluded or underrepresented patients ≥ 80 [8,9]. The use of tPA in those ≥ 80 has not been shown consistently to improve outcomes [6,10,11]. Post-hoc analysis of the National Institute of Neurologic Disorders and Stroke (NINDS) study did not show worse outcomes or harms to older adults treated with tPA [12]. Likewise, data from the International Stroke Treatment (IST-3) collaborative group show that treatment with tPA up to 6 hours from the onset of symptoms improves outcomes in the elderly [13]. Use of tPA in the oldest adults remains controversial due to perceived higher risk of symptomatic intracerebral hemorrhage (ICH). Published data suggest overall ICH risk of 4.3% to 6.4% across all age-groups [9,14,15].Studies have failed to demonstrate an increased risk in the oldest adults [4,10,16,17], though they may have higher mortality rates associated with ICH [15]. Despite this, trends suggest increasing use of tPA in those ≥ 80 over the past decade [2]. Along with primary data from NINDS [12] and IST-3 [13], a meta-analysis conducted in 2014 suggests that regardless of age, patients have improved outcomes with tPA [18].With the increasing age of the population, effective treatment of strokes in patients ≥ 80 will continue to be an important clinical and research endeavor.
This study evaluates the outcomes of clinical use of tPA for treatment of patients ≥ 80 years old who present to a community-based certified stroke center with ischemic stroke.
Methods
The study setting was a 540-bed acute care hospital that is a community-based certified stroke center. This study was deemed nonhuman subjects research by the institutional review board as the goal was to evaluate processes and outcomes of this institution’s stroke team in treating a subgroup of patients according to clinically accepted practice (quality improvement initiative). All patients presenting to the emergency department (ED) between 1 January 2011 and 30 November 2013 with the onset of stroke-like neurological deficits underwent evaluation and treatment by a neurologist and/or specially trained stroke team. This team consists of the attending neurologist, ED physician, resident physicians, advanced practice nurses, and ED staff nurses and emergency medicine technicians. Team members involved in the evaluation and treatment of these patients undergo routine clinical education and testing to ensure standardization. Patients undergo emergent evaluation including the National Institutes of Health Stroke Scale (NIHSS) and obtain brain imaging with computed tomography (CT).
Patients ≥ 80 years were identified among all those who presented to the ED with ischemic stroke. Patients were included if they were subsequently diagnosed with ischemic stroke or transient ischemic attacks (TIA). They were excluded from analysis if neurological changes were due to primary hemorrhagic stroke, intracranial hemorrhage, subarachnoid hemorrhage, seizure, conversion disorder, or metabolic derangements. They were also excluded from analysis if the acute ischemic stroke treatment included intra-arterial administration of tPA or endovascular revascularization.
Patient data collected included age, NIHSS at presentation to ED, time to presentation at ED, treatment with tPA, contraindications to tPA, discharge disposition, length of stay and in-hospital mortality. Raw NIHSS values were collected at the time of presentation. NIHSS were categorized into mild symptoms (NIHSS < 6), moderate symptoms (NIHSS 6–19), or severe symptoms (NIHSS ≥ 20). Clinical indications for receiving tPA include NIHSS > 4, focal neurological deficit onset < 3 hours (for those ≥ 80 years old), and no evidence of acute hemorrhage or acute infarct on CT. Contraindications include rapidly improving symptoms (repeat NIHSS < 4), active or history of intracranial hemorrhage, history of stroke or head trauma in past 3 months, gastrointestinal or genitourinary hemorrhage within 21 days, major surgery within 14 days, arterial puncture at a noncompressible site in past 7 days, treatment with anticoagulation with therapeutic indices, systolic blood pressure > 185 mm Hg or diastolic blood pressure > 110 mm Hg and not responding to treatment, or platelet count < 100,000/mm3. Patients who were not eligible for tPA based on contraindications with the exception of being outside the treatment window (3 hours) were excluded from comparative analysis. Patient length of stay was rounded to nearest full day. Discharge disposition was categorized as home, acute rehabilitation hospital, skilled nursing facility, home or facility with hospice services, other hospital setting, or death.
Statistics were calculated using SPSS statistical software. Variables were reported as means and percentages. Group means were compared using t tests and differences in proportions were compared using the chi square test. Correlations were performed using Pearson’s correlation. A 2-tailed P < 0.05 was considered statistically significant.
Results
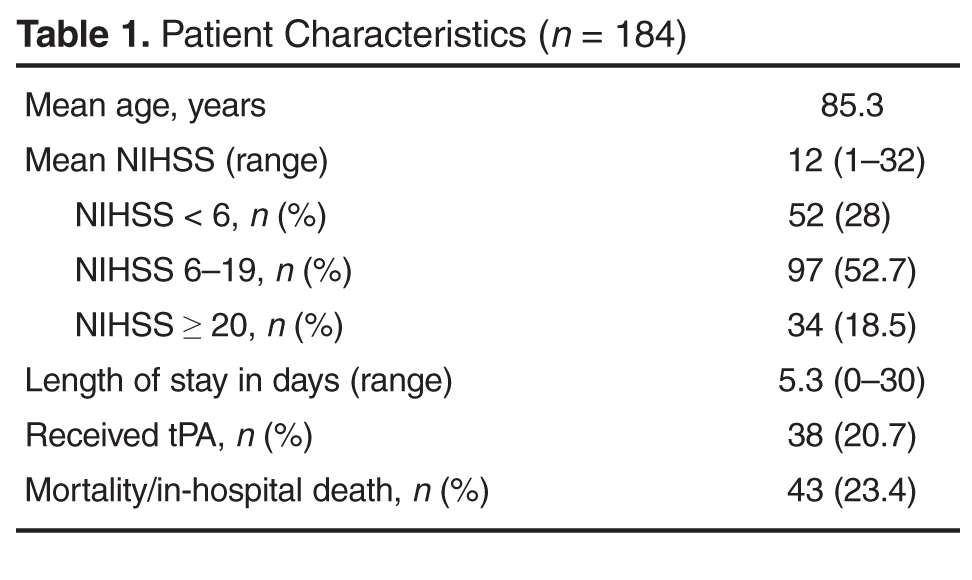
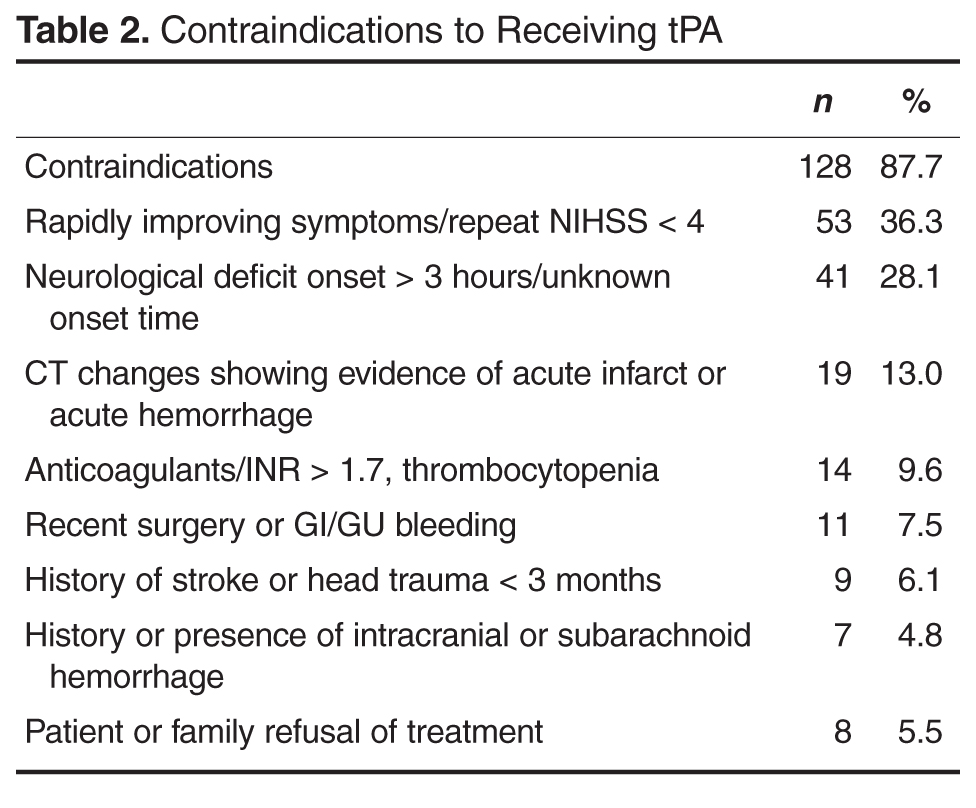
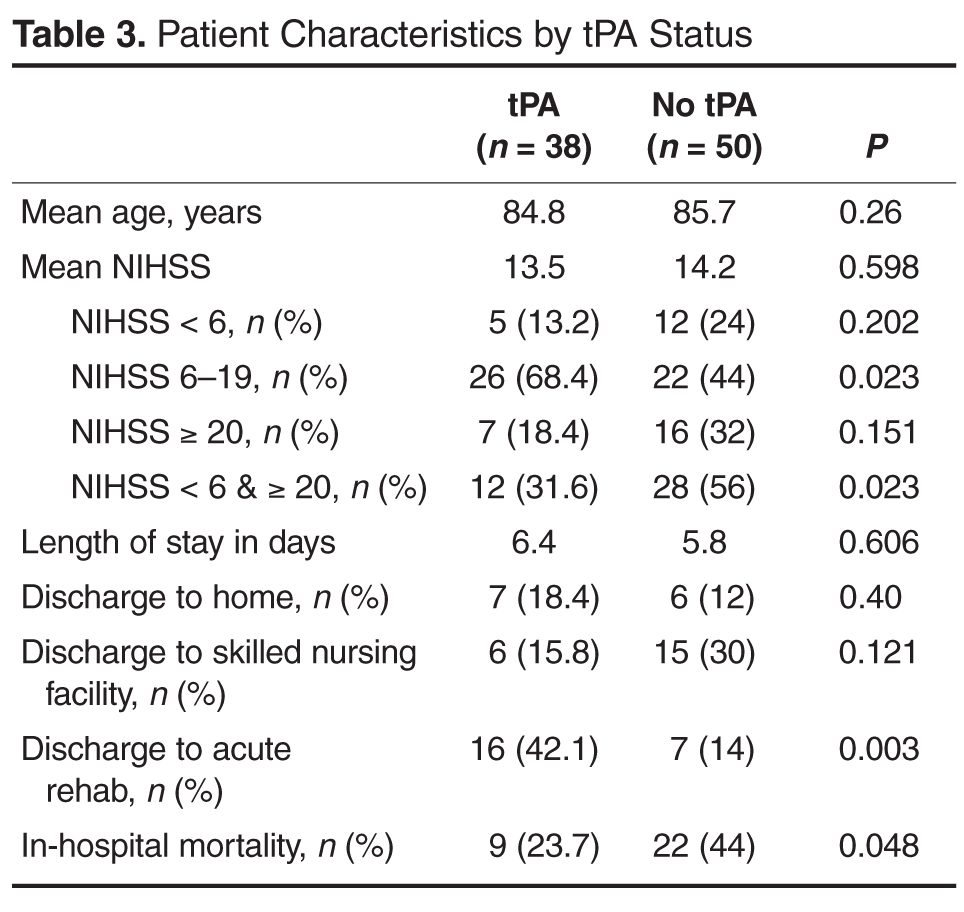
Discussion
Ischemic stroke remains a major cause of morbidity and mortality for very old patients. Though less than 5% of the United States population is over the age of 80 [1], at this community-based hospital 18% of those presenting to the ED with ischemic stroke were in this age-group. With a population of increasing age, more people in this age-group will present with ischemic stroke and need effective treatment to limit the associated morbidity and mortality. Being able to quickly and safely treat acute ischemic stroke may help very old adults maintain independence or prevent institutionalization. While the original studies demonstrating the effectiveness of tPA for acute ischemic stroke excluded or underrepresented those ≥ 80 years, retrospective analysis has not been conclusive regarding its use in very old patients [4–6,10,12,13].However, post-hoc analysis of NINDS and IST-3 data demonstrate efficacy and safety of treatment [12,13].
This study explored the use of tPA at a community-based certified stroke center. Similar to previous studies, it demonstrates the large proportion of patients presenting with acute neurological findings consistent with ischemic stroke are ≥ 80 years old [3,6]. Our incidence of acute ischemic stroke in the oldest patients may be slightly lower than reported elsewhere, which may reflect community differences, with higher rates of younger patients with multiple comorbidities presenting with stroke-like symptoms. Amongst this very old cohort, age was positively correlated with stroke severity. Mortality in patients ≥ 80 years old who present with acute ischemic stroke approaches 25%.
The majority of patients who did not receive tPA had documented contraindications to receiving the medication. The most common reason was rapidly improving symptoms with repeat NIHSS often ≤ 4. The second most common reason was presentation outside the treatment window of 3 hours. We compared those who either arrived too late to receive treatment with tPA or already had ischemic changes on CT to those who received tPA as this suggests the natural history of stroke progression and outcome without effective, early treatment. The outcomes at this institution support this trend. Very old patients who received tPA did not experience harm as evidenced by similar lengths of stay and rates of discharge to home. Also, rates of symptomatic ICH were lower than those reported in the literature. In fact, patients who received tPA were less likely to experience in-hospital death and more likely to be discharged to acute rehabilitation hospitals, suggesting more functional ability to tolerate aggressive recovery efforts.
Very few people who presented with acute ischemic stroke and were eligible for treatment with tPA failed to receive it. This suggests that despite the perceived increased risk to treating these patients with tPA, the specialized stroke team aggressively treats patients age ≥ 80 years who present with acute ischemic stroke. However, those who did not receive tPA were more likely to have presented with mild or severe strokes. This may suggest that treatment time frames are more strongly held, or that treatment teams are more likely to use time frames as a reason to not treat with tPA for patients with mild or severe strokes. Also, very few patients and families who were eligible to receive tPA declined treatment despite the associated risks. This suggests that patients and families are eager for aggressive treatment in attempt to prevent death or disability associated with ischemic stroke.
There are several limitations associated with this evaluation. First, this is a retrospective analysis of a single institution’s acute stroke procedures. Data was collected in an effort to evaluate the processes and outcomes of the specialized stroke team in evaluating and treating this very old cohort who present to a community-based hospital. It involved individualized clinical evaluation and decision making by multiple care providers who may offer different perspectives on the risk of treating patients ≥ 80 years old with tPA, which may result in selection bias. While comparing those who arrived outside treatment windows offers a comparison group who represents the natural course of untreated strokes, patient characteristics that prevented timely evaluation may also impact their outcomes including baseline mobility, care giving availability and underlying medical comorbidities. The similarity in mean presenting NIHSS scores of the two groups, however, argues against this possibility. Lastly, exclusion criteria to receiving tPA may represent intrinsic characteristics that impart higher risk of negative outcomes.
Conculsion
Although there have been no randomized controlled trials that evaluate the safety and efficacy of tPA in the treatment of acute ischemic stroke in very old patients, use at the community-based stroke center was not associated with worse outcomes including symptomatic ICH, hospital length of stay, and in-hospital mortality. In fact, there were trends towards better outcomes in older patients who received tPA, including a significant reduction in in-hospital mortality. This evaluation supports the benefits of using tPA to treat acute ischemic stroke as seen in prior randomized controlled trials that included the treatment of very old patients. Though ongoing research is needed, a growing body of evidence supports the use of tPA to treat acute ischemic stroke in patients ≥ 80 years.
Corresponding author: Jennifer C. Drost, DO, MPH, Summa Health System, 75 Arch St., Ste. G1, Akron, OH 44304, DrostJ@summahealth.org.
Financial disclosures: None.
Author contributions: Conception and design, JCD, SMB; analysis and interpretation of data, JCD, SMB; drafting of article, JCD; critical revision of the article, JCD, SMB; provision of study materials or patients, SMB; collection and assembly of data, JCD.
1. US Census Bureau. Annual estimates of the resident population for selected age groups by sex for the United States, States, Counties, and Puerto Rico Commonwealth and Municipios: April 1, 2010 to July 1, 2013. Accessed at www.census.gov/popest/index.html.
2. Fang MC, Cutler DM, Rosen AB. Trends in thrombolytic use for ischemic stroke in the United States. J Hosp Med 2010;5:406–9.
3. Marini C, Baldassarre M, Russo T, et al. Burden of first-ever ischemic stroke in the oldest old: evidence from a population-based study. Neurology 2004;62:77–81.
4. Sylaja PN, Cote R, Buchan AM, Hill MD. Thrombolysis in patients older than 80 years with acute ischaemic stroke: Canadian Alteplase for Stroke Effectiveness Study. J Neurol Neurosurg Psychiatry 2006;77:826–9.
5. Heitsch LE, Panagos PD. Treating the elderly stroke patient: complications, controversies, and best care metrics. Clin Geriatr Med 2013;29:231–55.
6. Engelter ST, Bonati LH, Lyrer PA. Intravenous thrombolysis in stroke patients of > or = 80 versus < 80 years of age--a systematic review across cohort studies. Age Ageing 2006;35:572–580.
7. Forti P, Maioli F, Procaccianti G, et al. Independent predictors of ischemic stroke in the elderly: prospective data from a stroke unit. Neurology 2013;80:29–38.
8. Hacke W, Donnan G, Fieschi C, et al. Association of outcome with early stroke treatment: pooled analysis of ATLANTischemic stroke, ECASS, and NINDS rt-PA stroke trials. Lancet 2004;363:768–74.
9. Tissue plasminogen activator for acute ischemic stroke. The National Institute of Neurological Disorders and Stroke rt-PA Stroke Study Group. N Engl J Med 1995;333:1581–7.
10. Sung PS, Chen CH, Hsieh HC, et al. Outcome of acute ischemic stroke in very elderly patients: is intravenous thrombolysis beneficial? Eur Neurol 2011;66:110–6.
11. Saposnik G, Guzik AK, Reeves M, et al. Stroke prognostication using age and NIH Stroke Scale: SPAN-100. Neurology 2013;80:21–8.
12. Generalized efficacy of t-PA for acute stroke. Subgroup analysis of the NINDS t-PA Stroke Trial. Stroke 1997;28:2119–25.
13. Sandercock P, Wardlaw JM, Lindley RI, et al. The benefits and harms of intravenous thrombolysis with recombinant tissue plasminogen activator within 6 h of acute ischaemic stroke (the third international stroke trial [IST-3]): a randomised controlled trial. Lancet 2012;379:2352–63.
14. Intracerebral hemorrhage after intravenous t-PA therapy for ischemic stroke. The NINDS t-PA Stroke Study Group. Stroke 1997;28:2109–18.
15. Bray BD, Campbell J, Hoffman A, et al. Stroke thrombolysis in England: an age stratified analysis of practice and outcome. Age Ageing 2013;42:240–5.
16. Kono S, Deguchi K, Morimoto N, et al. Intravenous thrombolysis with neuroprotective therapy by edaravone for ischemic stroke patients older than 80 years of age. J Stroke Cerebrovasc Dis 2013;22:1175–83.
17. Berrouschot J, Rother J, Glahn J, et al. Outcome and severe hemorrhagic complications of intravenous thrombolysis with tissue plasminogen activator in very old (> or =80 years) stroke patients. Stroke 2005;36:2421–5.
18. Emberson J, Lees KR, Lyden P, et al; Stroke Thrombolysis Trialists' Collaborative Group. Effect of treatment delay, age, and stroke severity on the effects of intravenous thrombolysis with alteplase for acute ischaemic stroke: a meta-analysis of individual patient data from randomised trials. Lancet 2014;384:1929–35.
From Summa Health System, Akron, OH.
Abstract
- Background: Ischemic stroke is a major cause of morbidity and mortality for patients ≥ 80 years old. The use of intravenous recombinant tissue plasminogen activator (tPA) in patients ≥ 80 years for treatment of ischemic stroke remains controversial.
- Objective: To examine outcomes in patients ≥ 80 years old who received tPA in our institution.
- Methods: This was a retrospective cohort study at a community-based certified acute stroke center. Individuals age ≥ 80 years evaluated emergently for acute neurologic changes consistent with ischemic stroke were included (n = 184). The comparison groups within this sample were patients who received tPA versus with those who did not because they came to the ED outside of the treatment window. Outcome measures included length of stay, symptomatic intracerebral hemorrhage (ICH), discharge disposition, and in-hospital death
- Results: 38 patients (20.7%) received tPA. 50 patients (27.2%) presented outside of treatment windows and were included in comparative analysis. There was no difference between groups in age (P = 0.26) or initial National Institute of Health Stroke Scale (P = 0.598). One patient (2.6%) who received tPA developed symptomatic ICH. Those receiving tPA were more likely to be discharged to acute rehabilitation hospitals (P = 0.012) and less likely to experience in hospital death (P = 0.048).
- Conclusion: At this institution, the use of tPA in patients ≥ 80 years old is not associated with increased mortality or risk of symptomatic ICH. Those who received tPA were more likely to be discharged to acute rehabilitation hospitals, suggesting greater potential for functional recovery.
Acute ischemic stroke is a major cause of morbidity and mortality in patients 80 years or older. Though less than 5% of the United States population is over the age of 80 [1], studies have shown that up to one-third of patients presenting with ischemic stroke are ≥ 80 years old [2] and among first-time strokes, a third occur in those ≥ 80 [3]. Older adults present with worse symptoms associated with ischemic stroke as measured by the National Institutes of Health Stroke Scale (NIHSS) compared with younger (< 80 years) counterparts [4]. Older patients are more likely to be discharged to a location other than home [5]. Older age is associated with higher hospital, 30-day, and 1-year mortality [3,5,6]. Patients ≥ 80 are significantly more likely to die in the hospital compared to younger patients, 11.7% to 23.6% vs 5.1%, respectively [3,7].
The Food and Drug Administration (FDA) approved the use of intravenous recombinant tissue plasminogen activator (tPA) in 1996 for the treatment of ischemic stroke [8]. Studies evaluating the safety and efficacy of tPA in ischemic stroke excluded or underrepresented patients ≥ 80 [8,9]. The use of tPA in those ≥ 80 has not been shown consistently to improve outcomes [6,10,11]. Post-hoc analysis of the National Institute of Neurologic Disorders and Stroke (NINDS) study did not show worse outcomes or harms to older adults treated with tPA [12]. Likewise, data from the International Stroke Treatment (IST-3) collaborative group show that treatment with tPA up to 6 hours from the onset of symptoms improves outcomes in the elderly [13]. Use of tPA in the oldest adults remains controversial due to perceived higher risk of symptomatic intracerebral hemorrhage (ICH). Published data suggest overall ICH risk of 4.3% to 6.4% across all age-groups [9,14,15].Studies have failed to demonstrate an increased risk in the oldest adults [4,10,16,17], though they may have higher mortality rates associated with ICH [15]. Despite this, trends suggest increasing use of tPA in those ≥ 80 over the past decade [2]. Along with primary data from NINDS [12] and IST-3 [13], a meta-analysis conducted in 2014 suggests that regardless of age, patients have improved outcomes with tPA [18].With the increasing age of the population, effective treatment of strokes in patients ≥ 80 will continue to be an important clinical and research endeavor.
This study evaluates the outcomes of clinical use of tPA for treatment of patients ≥ 80 years old who present to a community-based certified stroke center with ischemic stroke.
Methods
The study setting was a 540-bed acute care hospital that is a community-based certified stroke center. This study was deemed nonhuman subjects research by the institutional review board as the goal was to evaluate processes and outcomes of this institution’s stroke team in treating a subgroup of patients according to clinically accepted practice (quality improvement initiative). All patients presenting to the emergency department (ED) between 1 January 2011 and 30 November 2013 with the onset of stroke-like neurological deficits underwent evaluation and treatment by a neurologist and/or specially trained stroke team. This team consists of the attending neurologist, ED physician, resident physicians, advanced practice nurses, and ED staff nurses and emergency medicine technicians. Team members involved in the evaluation and treatment of these patients undergo routine clinical education and testing to ensure standardization. Patients undergo emergent evaluation including the National Institutes of Health Stroke Scale (NIHSS) and obtain brain imaging with computed tomography (CT).
Patients ≥ 80 years were identified among all those who presented to the ED with ischemic stroke. Patients were included if they were subsequently diagnosed with ischemic stroke or transient ischemic attacks (TIA). They were excluded from analysis if neurological changes were due to primary hemorrhagic stroke, intracranial hemorrhage, subarachnoid hemorrhage, seizure, conversion disorder, or metabolic derangements. They were also excluded from analysis if the acute ischemic stroke treatment included intra-arterial administration of tPA or endovascular revascularization.
Patient data collected included age, NIHSS at presentation to ED, time to presentation at ED, treatment with tPA, contraindications to tPA, discharge disposition, length of stay and in-hospital mortality. Raw NIHSS values were collected at the time of presentation. NIHSS were categorized into mild symptoms (NIHSS < 6), moderate symptoms (NIHSS 6–19), or severe symptoms (NIHSS ≥ 20). Clinical indications for receiving tPA include NIHSS > 4, focal neurological deficit onset < 3 hours (for those ≥ 80 years old), and no evidence of acute hemorrhage or acute infarct on CT. Contraindications include rapidly improving symptoms (repeat NIHSS < 4), active or history of intracranial hemorrhage, history of stroke or head trauma in past 3 months, gastrointestinal or genitourinary hemorrhage within 21 days, major surgery within 14 days, arterial puncture at a noncompressible site in past 7 days, treatment with anticoagulation with therapeutic indices, systolic blood pressure > 185 mm Hg or diastolic blood pressure > 110 mm Hg and not responding to treatment, or platelet count < 100,000/mm3. Patients who were not eligible for tPA based on contraindications with the exception of being outside the treatment window (3 hours) were excluded from comparative analysis. Patient length of stay was rounded to nearest full day. Discharge disposition was categorized as home, acute rehabilitation hospital, skilled nursing facility, home or facility with hospice services, other hospital setting, or death.
Statistics were calculated using SPSS statistical software. Variables were reported as means and percentages. Group means were compared using t tests and differences in proportions were compared using the chi square test. Correlations were performed using Pearson’s correlation. A 2-tailed P < 0.05 was considered statistically significant.
Results
Discussion
Ischemic stroke remains a major cause of morbidity and mortality for very old patients. Though less than 5% of the United States population is over the age of 80 [1], at this community-based hospital 18% of those presenting to the ED with ischemic stroke were in this age-group. With a population of increasing age, more people in this age-group will present with ischemic stroke and need effective treatment to limit the associated morbidity and mortality. Being able to quickly and safely treat acute ischemic stroke may help very old adults maintain independence or prevent institutionalization. While the original studies demonstrating the effectiveness of tPA for acute ischemic stroke excluded or underrepresented those ≥ 80 years, retrospective analysis has not been conclusive regarding its use in very old patients [4–6,10,12,13].However, post-hoc analysis of NINDS and IST-3 data demonstrate efficacy and safety of treatment [12,13].
This study explored the use of tPA at a community-based certified stroke center. Similar to previous studies, it demonstrates the large proportion of patients presenting with acute neurological findings consistent with ischemic stroke are ≥ 80 years old [3,6]. Our incidence of acute ischemic stroke in the oldest patients may be slightly lower than reported elsewhere, which may reflect community differences, with higher rates of younger patients with multiple comorbidities presenting with stroke-like symptoms. Amongst this very old cohort, age was positively correlated with stroke severity. Mortality in patients ≥ 80 years old who present with acute ischemic stroke approaches 25%.
The majority of patients who did not receive tPA had documented contraindications to receiving the medication. The most common reason was rapidly improving symptoms with repeat NIHSS often ≤ 4. The second most common reason was presentation outside the treatment window of 3 hours. We compared those who either arrived too late to receive treatment with tPA or already had ischemic changes on CT to those who received tPA as this suggests the natural history of stroke progression and outcome without effective, early treatment. The outcomes at this institution support this trend. Very old patients who received tPA did not experience harm as evidenced by similar lengths of stay and rates of discharge to home. Also, rates of symptomatic ICH were lower than those reported in the literature. In fact, patients who received tPA were less likely to experience in-hospital death and more likely to be discharged to acute rehabilitation hospitals, suggesting more functional ability to tolerate aggressive recovery efforts.
Very few people who presented with acute ischemic stroke and were eligible for treatment with tPA failed to receive it. This suggests that despite the perceived increased risk to treating these patients with tPA, the specialized stroke team aggressively treats patients age ≥ 80 years who present with acute ischemic stroke. However, those who did not receive tPA were more likely to have presented with mild or severe strokes. This may suggest that treatment time frames are more strongly held, or that treatment teams are more likely to use time frames as a reason to not treat with tPA for patients with mild or severe strokes. Also, very few patients and families who were eligible to receive tPA declined treatment despite the associated risks. This suggests that patients and families are eager for aggressive treatment in attempt to prevent death or disability associated with ischemic stroke.
There are several limitations associated with this evaluation. First, this is a retrospective analysis of a single institution’s acute stroke procedures. Data was collected in an effort to evaluate the processes and outcomes of the specialized stroke team in evaluating and treating this very old cohort who present to a community-based hospital. It involved individualized clinical evaluation and decision making by multiple care providers who may offer different perspectives on the risk of treating patients ≥ 80 years old with tPA, which may result in selection bias. While comparing those who arrived outside treatment windows offers a comparison group who represents the natural course of untreated strokes, patient characteristics that prevented timely evaluation may also impact their outcomes including baseline mobility, care giving availability and underlying medical comorbidities. The similarity in mean presenting NIHSS scores of the two groups, however, argues against this possibility. Lastly, exclusion criteria to receiving tPA may represent intrinsic characteristics that impart higher risk of negative outcomes.
Conculsion
Although there have been no randomized controlled trials that evaluate the safety and efficacy of tPA in the treatment of acute ischemic stroke in very old patients, use at the community-based stroke center was not associated with worse outcomes including symptomatic ICH, hospital length of stay, and in-hospital mortality. In fact, there were trends towards better outcomes in older patients who received tPA, including a significant reduction in in-hospital mortality. This evaluation supports the benefits of using tPA to treat acute ischemic stroke as seen in prior randomized controlled trials that included the treatment of very old patients. Though ongoing research is needed, a growing body of evidence supports the use of tPA to treat acute ischemic stroke in patients ≥ 80 years.
Corresponding author: Jennifer C. Drost, DO, MPH, Summa Health System, 75 Arch St., Ste. G1, Akron, OH 44304, DrostJ@summahealth.org.
Financial disclosures: None.
Author contributions: Conception and design, JCD, SMB; analysis and interpretation of data, JCD, SMB; drafting of article, JCD; critical revision of the article, JCD, SMB; provision of study materials or patients, SMB; collection and assembly of data, JCD.
1. US Census Bureau. Annual estimates of the resident population for selected age groups by sex for the United States, States, Counties, and Puerto Rico Commonwealth and Municipios: April 1, 2010 to July 1, 2013. Accessed at www.census.gov/popest/index.html.
2. Fang MC, Cutler DM, Rosen AB. Trends in thrombolytic use for ischemic stroke in the United States. J Hosp Med 2010;5:406–9.
3. Marini C, Baldassarre M, Russo T, et al. Burden of first-ever ischemic stroke in the oldest old: evidence from a population-based study. Neurology 2004;62:77–81.
4. Sylaja PN, Cote R, Buchan AM, Hill MD. Thrombolysis in patients older than 80 years with acute ischaemic stroke: Canadian Alteplase for Stroke Effectiveness Study. J Neurol Neurosurg Psychiatry 2006;77:826–9.
5. Heitsch LE, Panagos PD. Treating the elderly stroke patient: complications, controversies, and best care metrics. Clin Geriatr Med 2013;29:231–55.
6. Engelter ST, Bonati LH, Lyrer PA. Intravenous thrombolysis in stroke patients of > or = 80 versus < 80 years of age--a systematic review across cohort studies. Age Ageing 2006;35:572–580.
7. Forti P, Maioli F, Procaccianti G, et al. Independent predictors of ischemic stroke in the elderly: prospective data from a stroke unit. Neurology 2013;80:29–38.
8. Hacke W, Donnan G, Fieschi C, et al. Association of outcome with early stroke treatment: pooled analysis of ATLANTischemic stroke, ECASS, and NINDS rt-PA stroke trials. Lancet 2004;363:768–74.
9. Tissue plasminogen activator for acute ischemic stroke. The National Institute of Neurological Disorders and Stroke rt-PA Stroke Study Group. N Engl J Med 1995;333:1581–7.
10. Sung PS, Chen CH, Hsieh HC, et al. Outcome of acute ischemic stroke in very elderly patients: is intravenous thrombolysis beneficial? Eur Neurol 2011;66:110–6.
11. Saposnik G, Guzik AK, Reeves M, et al. Stroke prognostication using age and NIH Stroke Scale: SPAN-100. Neurology 2013;80:21–8.
12. Generalized efficacy of t-PA for acute stroke. Subgroup analysis of the NINDS t-PA Stroke Trial. Stroke 1997;28:2119–25.
13. Sandercock P, Wardlaw JM, Lindley RI, et al. The benefits and harms of intravenous thrombolysis with recombinant tissue plasminogen activator within 6 h of acute ischaemic stroke (the third international stroke trial [IST-3]): a randomised controlled trial. Lancet 2012;379:2352–63.
14. Intracerebral hemorrhage after intravenous t-PA therapy for ischemic stroke. The NINDS t-PA Stroke Study Group. Stroke 1997;28:2109–18.
15. Bray BD, Campbell J, Hoffman A, et al. Stroke thrombolysis in England: an age stratified analysis of practice and outcome. Age Ageing 2013;42:240–5.
16. Kono S, Deguchi K, Morimoto N, et al. Intravenous thrombolysis with neuroprotective therapy by edaravone for ischemic stroke patients older than 80 years of age. J Stroke Cerebrovasc Dis 2013;22:1175–83.
17. Berrouschot J, Rother J, Glahn J, et al. Outcome and severe hemorrhagic complications of intravenous thrombolysis with tissue plasminogen activator in very old (> or =80 years) stroke patients. Stroke 2005;36:2421–5.
18. Emberson J, Lees KR, Lyden P, et al; Stroke Thrombolysis Trialists' Collaborative Group. Effect of treatment delay, age, and stroke severity on the effects of intravenous thrombolysis with alteplase for acute ischaemic stroke: a meta-analysis of individual patient data from randomised trials. Lancet 2014;384:1929–35.
Hospital Renovation Patient Satisfaction
Hospitals are expensive and complex facilities to build and renovate. It is estimated $200 billion is being spent in the United States during this decade on hospital construction and renovation, and further expenditures in this area are expected.[1] Aging hospital infrastructure, competition, and health system expansion have motivated institutions to invest in renovation and new hospital building construction.[2, 3, 4, 5, 6, 7] There is a trend toward patient‐centered design in new hospital construction. Features of this trend include same‐handed design (ie, rooms on a unit have all beds oriented in the same direction and do not share headwalls); use of sound absorbent materials to reduced ambient noise[7, 8, 9]; rooms with improved view and increased natural lighting to reduce anxiety, decrease delirium, and increase sense of wellbeing[10, 11, 12]; incorporation of natural elements like gardens, water features, and art[12, 13, 14, 15, 16, 17, 18]; single‐patient rooms to reduce transmission of infection and enhance privacy and visitor comfort[7, 19, 20]; presence of comfortable waiting rooms and visitor accommodations to enhance comfort and family participation[21, 22, 23]; and hotel‐like amenities such as on‐demand entertainment and room service menus.[24, 25]
There is a belief among some hospital leaders that patients are generally unable to distinguish their positive experience with a pleasing healthcare environment from their positive experience with care, and thus improving facilities will lead to improved satisfaction across the board.[26, 27] In a controlled study of hospitalized patients, appealing rooms were associated with increased satisfaction with services including housekeeping and food service staff, meals, as well as physicians and overall satisfaction.[26] A 2012 survey of hospital leadership found that expanding and renovating facilities was considered a top priority in improving patient satisfaction, with 82% of the respondents stating that this was important.[27]
Despite these attitudes, the impact of patient‐centered design on patient satisfaction is not well understood. Studies have shown that renovations and hospital construction that incorporates noise reduction strategies, positive distraction, patient and caregiver control, attractive waiting rooms, improved patient room appearance, private rooms, and large windows result in improved satisfaction with nursing, noise level, unit environment and cleanliness, perceived wait time, discharge preparedness, and overall care. [7, 19, 20, 23, 28] However, these studies were limited by small sample size, inclusion of a narrow group of patients (eg, ambulatory, obstetric, geriatric rehabilitation, intensive care unit), and concurrent use of interventions other than design improvement (eg, nurse and patient education). Many of these studies did not use the ubiquitous Hospital Consumer Assessment of Healthcare Providers and Systems (HCAHPS) and Press Ganey patient satisfaction surveys.
We sought to determine the changes in patient satisfaction that occurred during a natural experiment, in which clinical units (comprising stable nursing, physician, and unit teams) were relocated from an historic clinical building to a new clinical building that featured patient‐centered design, using HCAHPS and Press Ganey surveys and a large study population. We hypothesized that new building features would positively impact both facility related (eg, noise level), nonfacility related (eg, physician and housekeeping service related), and overall satisfaction.
METHODS
This was a retrospective analysis of prospectively collected Press Ganey and HCAPHS patient satisfaction survey data for a single academic tertiary care hospital.[29] The research project was reviewed and approved by the institutional review board.
Participants
All patients discharged from 12 clinical units that relocated to the new clinical building and returned patient satisfaction surveys served as study patients. The moved units included the coronary care unit, cardiac step down unit, medical intensive care unit, neuro critical care unit, surgical intensive care unit, orthopedic unit, neurology unit, neurosurgery unit, obstetrics units, gynecology unit, urology unit, cardiothoracic surgery unit, and the transplant surgery and renal transplant unit. Patients on clinical units that did not move served as concurrent controls.
Exposure
Patients admitted to the new clinical building experienced several patient‐centered design features. These features included easy access to healing gardens with a water feature, soaring lobbies, a collection of more than 500 works of art, well‐decorated and light‐filled patient rooms with sleeping accommodations for family members, sound‐absorbing features in patient care corridors ranging from acoustical ceiling tiles to a quiet nurse‐call system, and an interactive television network with Internet, movies, and games. All patients during the baseline period and control patients during the study period were located in typical patient rooms with standard hospital amenities. No other major patient satisfaction interventions were initiated during the pre‐ or postperiod in either arm of the study; ongoing patient satisfaction efforts (such as unit‐based customer care representatives) were deployed broadly and not restricted to the new clinical building. Clinical teams comprised of physicians, nurses, and ancillary staff did not change significantly after the move.
Time Periods
The move to new clinical building occurred on May 1, 2012. After allowing for a 15‐day washout period, the postmove period included Press Ganey and HCAHPS surveys returned for discharges that occurred during a 7.5‐month period between May 15, 2102 and December 31, 2012. Baseline data included Press Ganey and HCAHPS surveys returned for discharges in the preceding 12 months (May 1, 2011 to April 30, 2012). Sensitivity analysis using only 7.5 months of baseline data did not reveal any significant difference when compared with 12‐month baseline data, and we report only data from the 12‐month baseline period.
Instruments
Press Ganey and HCAHPS patient satisfaction surveys were sent via mail in the same envelope. Fifty percent of the discharged patients were randomized to receive the surveys. The Press Ganey survey contained 33 items covering across several subdomains including room, meal, nursing, physician, ancillary staff, visitor, discharge, and overall satisfaction. The HCAHPS survey contained 29 Centers for Medicare and Medicaid Services (CMS)‐mandated items, of which 21 are related to patient satisfaction. The development and testing and methods for administration and reporting of the HCAHPS survey have been previously described.[30, 31] Press Ganey patient satisfaction survey results have been reported in the literature.[32, 33]
Outcome Variables
Press Ganey and HCAHPS patient satisfaction survey responses were the primary outcome variables of the study. The survey items were categorized as facility related (eg, noise level), nonfacility related (eg, physician and nursing staff satisfaction), and overall satisfaction related.
Covariates
Age, sex, length of stay (LOS), insurance type, and all‐payer refined diagnosis‐related groupassociated illness complexity were included as covariates.
Statistical Analysis
Percent top‐box scores were calculated for each survey item as the percent of patients who responded very good for a given item on Press Ganey survey items and always or definitely yes or 9 or 10 on HCAHPS survey items. CMS utilizes percent top‐box scores to calculate payments under the Value Based Purchasing (VBP) program and to report the results publicly. Numerous studies have also reported percent top‐box scores for HCAHPS survey results.[31, 32, 33, 34]
Odds ratios of premove versus postmove percentage of top‐box scores, adjusted for age, sex, LOS, complexity of illness, and insurance type were determined using logistic regression for the units that moved. Similar scores were calculated for unmoved units to detect secular trends. To determine whether the differences between the moved and unmoved units were significant, we introduced the interaction term (moved vs unmoved unit status) (pre‐ vs postmove time period) into the logistic regression models and examined the adjusted P value for this term. All statistical analysis was performed using SAS Institute Inc.'s (Cary, NC) JMP Pro 10.0.0.
RESULTS
The study included 1648 respondents in the moved units in the baseline period (ie, units designated to move to a new clinical building) and 1373 respondents in the postmove period. There were 1593 respondents in the control group during the baseline period and 1049 respondents in the postmove period. For the units that moved, survey response rates were 28.5% prior to the move and 28.3% after the move. For the units that did not move, survey response rates were 20.9% prior to the move and 22.7% after the move. A majority of survey respondents on the nursing units that moved were white, male, and had private insurance (Table 1). There were no significant differences between respondents across these characteristics between the pre‐ and postmove periods. Mean age and LOS were also similar. For these units, there were 70.5% private rooms prior to the move and 100% after the move. For the unmoved units, 58.9% of the rooms were private in the baseline period and 72.7% were private in the study period. Similar to the units that moved, characteristics of the respondents on the unmoved units also did not differ significantly in the postmove period.
| Patient demographics | Moved Units (N=3,021) | Unmoved Units (N=2,642) | ||||
|---|---|---|---|---|---|---|
| Pre | Post | P Value | Pre | Post | P Value | |
| ||||||
| White | 75.3% | 78.2% | 0.07 | 66.7% | 68.5% | 0.31 |
| Mean age, y | 57.3 | 57.4 | 0.84 | 57.3 | 57.1 | 0.81 |
| Male | 54.3% | 53.0% | 0.48 | 40.5% | 42.3% | 0.23 |
| Self‐reported health | ||||||
| Excellent or very good | 54.7% | 51.2% | 0.04 | 38.7% | 39.5% | 0.11 |
| Good | 27.8% | 32.0% | 29.3% | 32.2% | ||
| Fair or poor | 17.5% | 16.9% | 32.0% | 28.3% | ||
| Self‐reported language | ||||||
| English | 96.0% | 97.2% | 0.06 | 96.8% | 97.1% | 0.63 |
| Other | 4.0% | 2.8% | 3.2% | 2.9% | ||
| Self‐reported education | ||||||
| Less than high school | 5.8% | 5.0% | 0.24 | 10.8% | 10.4% | 0.24 |
| High school grad | 46.4% | 44.2% | 48.6% | 45.5% | ||
| College grad or more | 47.7% | 50.7% | 40.7% | 44.7% | ||
| Insurance type | ||||||
| Medicaid | 6.7% | 5.5% | 0.11 | 10.8% | 9.0% | 0.32 |
| Medicare | 32.0% | 35.5% | 36.0% | 36.1% | ||
| Private insurance | 55.6% | 52.8% | 48.0% | 50.3% | ||
| Mean APRDRG complexity* | 2.1 | 2.1 | 0.09 | 2.3 | 2.3 | 0.14 |
| Mean LOS | 4.7 | 5.0 | 0.12 | 4.9 | 5.0 | 0.77 |
| Service | ||||||
| Medicine | 15.4% | 16.2% | 0.51 | 40.0% | 34.5% | 0.10 |
| Surgery | 50.7% | 45.7% | 40.1% | 44.1% | ||
| Neurosciences | 20.3% | 24.1% | 6.0% | 6.0% | ||
| Obstetrics/gynecology | 7.5% | 8.2% | 5.7% | 5.6% | ||
The move was associated with significant improvements in facility‐related satisfaction (Tables 2 and 3). The most prominent increases in satisfaction were with pleasantness of dcor (33.6% vs 66.2%), noise level (39.9% vs 59.3%), and visitor accommodation and comfort (50.0% vs 70.3 %). There was improvement in satisfaction related to cleanliness of the room (49.0% vs 68.6 %), but no significant increase in satisfaction with courtesy of the person cleaning the room (59.8% vs 67.7%) when compared with units that did move.
| Satisfaction Domain | Moved Units | Unmoved Units | P Value of the Difference in Odds Ratio Between Moved and Unmoved Units | |||||
|---|---|---|---|---|---|---|---|---|
| % Top Box | Adjusted Odds Ratio* (95% CI) | % Top Box | Adjusted Odds Ratio* (95% CI) | |||||
| Pre | Post | Pre | Post | |||||
| ||||||||
| FACILITY RELATED | ||||||||
| Hospital environment | ||||||||
| Cleanliness of the room and bathroom | 61.0 | 70.8 | 1.62 (1.40‐1.90) | 64.0 | 69.2 | 1.24 (1.03‐1.48) | 0.03 | |
| Quietness of the room | 51.3 | 65.4 | 1.89 (1.63‐2.19) | 58.6 | 60.3 | 1.08 (0.90‐1.28) | <0.0001 | |
| NONFACILITY RELATED | ||||||||
| Nursing communication | ||||||||
| Nurses treated with courtesy/respect | 84.0 | 86.7 | 1.28 (1.05‐1.57) | 83.6 | 87.1 | 1.29 (1.02‐1.64) | 0.92 | |
| Nurses listened | 73.1 | 76.4 | 1.21 (1.03‐1.43) | 74.2 | 75.5 | 1.05 (0.86‐1.27) | 0.26 | |
| Nurses explained | 75.0 | 76.6 | 1.10 (0.94‐1.30) | 76.0 | 76.2 | 1.00 (0.82‐1.21) | 0.43 | |
| Physician communication | ||||||||
| Doctors treated with courtesy/respect | 89.5 | 90.5 | 1.13 (0.89‐1.42) | 84.9 | 87.3 | 1.20 (0.94‐1.53) | 0.77 | |
| Doctors listened | 81.4 | 81.0 | 0.93 (0.83‐1.19) | 77.7 | 77.1 | 0.94 (0.77‐1.15) | 0.68 | |
| Doctors explained | 79.2 | 79.0 | 1.00(0.84‐1.19) | 75.7 | 74.4 | 0.92 (0.76‐1.12) | 0.49 | |
| Other | ||||||||
| Help toileting as soon as you wanted | 61.8 | 63.7 | 1.08 (0.89‐1.32) | 62.3 | 60.6 | 0.92 (0.71‐1.18) | 0.31 | |
| Pain well controlled | 63.2 | 63.8 | 1.06 (0.90‐1.25) | 62.0 | 62.6 | 0.99 (0.81‐1.20) | 060 | |
| Staff do everything to help with pain | 77.7 | 80.1 | 1.19 (0.99‐1.44) | 76.8 | 75.7 | 0.90 (0.75‐1.13) | 0.07 | |
| Staff describe medicine side effects | 47.0 | 47.6 | 1.05 (0.89‐1.24) | 49.2 | 47.1 | 0.91 (0.74‐1.11) | 0.32 | |
| Tell you what new medicine was for | 76.4 | 76.4 | 1.02 (0.84‐1.25) | 77.1 | 78.8 | 1.09(0.85‐1.39) | 0.65 | |
| Overall | ||||||||
| Rate hospital (010) | 75.0 | 83.3 | 1.71 (1.44‐2.05) | 75.7 | 77.6 | 1.06 (0.87‐1.29) | 0.006 | |
| Recommend hospital | 82.5 | 87.1 | 1.43 (1.18‐1.76) | 81.4 | 82.0 | 0.98 (0.79‐1.22) | 0.03 | |
| Satisfaction Domain | Moved Unit | Unmoved Unit | P Value of the Difference in Odds Ratio Between Moved and Unmoved Units | ||||
|---|---|---|---|---|---|---|---|
| % Top Box | Adjusted Odds Ratio* (95% CI) | % Top Box | Adjusted Odds Ratio* (95% CI) | ||||
| Pre | Post | Pre | Post | ||||
| |||||||
| FACILITY RELATED | |||||||
| Room | |||||||
| Pleasantness of room dcor | 33.6 | 64.8 | 3.77 (3.24‐4.38) | 41.6 | 47.0 | 1.21 (1.02‐1.44) | <0.0001 |
| Room cleanliness | 49.0 | 68.6 | 2.35 (2.02‐2.73) | 51.6 | 59.1 | 1.32 (1.12‐1.58) | <0.0001 |
| Room temperature | 43.1 | 54.9 | 1.64 (1.43‐1.90) | 45.0 | 48.8 | 1.14 (0.96‐1.36) | 0.002 |
| Noise level in and around the room | 40.2 | 59.2 | 2.23 (1.92‐2.58) | 45.5 | 47.6 | 1.07 (0.90‐1.22) | <0.0001 |
| Visitor related | |||||||
| Accommodations and comfort of visitors | 50.0 | 70.3 | 2.44 (2.10‐2.83) | 55.3 | 59.1 | 1.14 (0.96‐1.35) | <0.0001 |
| NONFACILITY RELATED | |||||||
| Food | |||||||
| Temperature of the food | 31.1 | 33.6 | 1.15 (0.99‐1.34) | 34.0 | 38.9 | 1.23 (1.02‐1.47) | 0.51 |
| Quality of the food | 25.8 | 27.1 | 1.10 (0.93‐1.30) | 30.2 | 36.2 | 1.32 (1.10‐1.59) | 0.12 |
| Courtesy of the person who served food | 63.9 | 62.3 | 0.93 (0.80‐1.10) | 66.0 | 61.4 | 0.82 (0.69‐0.98) | 0.26 |
| Nursing | |||||||
| Friendliness/courtesy of the nurses | 76.3 | 82.8 | 1.49 (1.26‐1.79) | 77.7 | 80.1 | 1.10 (0.90‐1.37) | 0.04 |
| Promptness of response to call | 60.1 | 62.6 | 1.14 (0.98‐1.33) | 59.2 | 62.0 | 1.10 (0.91‐1.31) | 0.80 |
| Nurses' attitude toward requests | 71.0 | 75.8 | 1.30 (1.11‐1.54) | 70.5 | 72.4 | 1.06 (0.88‐1.28) | 0.13 |
| Attention to special/personal needs | 66.7 | 72.2 | 1.32 (1.13‐1.54) | 67.8 | 70.3 | 1.09 (0.91‐1.31) | 0.16 |
| Nurses kept you informed | 64.3 | 72.2 | 1.46 (1.25‐1.70) | 65.8 | 69.8 | 1.17 (0.98‐1.41) | 0.88 |
| Skill of the nurses | 75.3 | 79.5 | 1.28 (1.08‐1.52) | 74.3 | 78.6 | 1.23 (1.01‐1.51) | 0.89 |
| Ancillary staff | |||||||
| Courtesy of the person cleaning the room | 59.8 | 67.7 | 1.41 (1.21‐1.65) | 61.2 | 66.5 | 1.24 (1.03‐1.49) | 0.28 |
| Courtesy of the person who took blood | 66.5 | 68.1 | 1.10 (0.94‐1.28) | 63.2 | 63.1 | 0.96 (0.76‐1.08) | 0.34 |
| Courtesy of the person who started the IV | 70.0 | 71.7 | 1.09 (0.93‐1.28) | 66.6 | 69.3 | 1.11 (0.92‐1.33) | 0.88 |
| Visitor related | |||||||
| Staff attitude toward visitors | 68.1 | 79.4 | 1.84 (1.56‐2.18) | 70.3 | 72.2 | 1.06 (0.87‐1.28) | <0.0001 |
| Physician | |||||||
| Time physician spent with you | 55.0 | 58.9 | 1.20 (1.04‐1.39) | 53.2 | 55.9 | 1.10 (0.92‐1.30) | 0.46 |
| Physician concern questions/worries | 67.2 | 70.7 | 1.20 (1.03‐1.40) | 64.3 | 66.1 | 1.05 (0.88‐1.26) | 0.31 |
| Physician kept you informed | 65.3 | 67.5 | 1.12 (0.96‐1.30) | 61.6 | 63.2 | 1.05 (0.88‐1.25) | 0.58 |
| Friendliness/courtesy of physician | 76.3 | 78.1 | 1.11 (0.93‐1.31) | 71.0 | 73.3 | 1.08 (0.90‐1.31) | 0.89 |
| Skill of physician | 85.4 | 88.5 | 1.35 (1.09‐1.68) | 78.0 | 81.0 | 1.15 (0.93‐1.43) | 0.34 |
| Discharge | |||||||
| Extent felt ready for discharge | 62.0 | 66.7 | 1.23 (1.07‐1.44) | 59.2 | 62.3 | 1.10 (0.92‐1.30) | 0.35 |
| Speed of discharge process | 50.7 | 54.2 | 1.16 (1.01‐1.33) | 47.8 | 50.0 | 1.07 (0.90‐1.27) | 0.49 |
| Instructions for care at home | 66.4 | 71.1 | 1.25 (1.06‐1.46) | 64.0 | 67.7 | 1.16 (0.97‐1.39) | 0.54 |
| Staff concern for your privacy | 65.3 | 71.8 | 1.37 (1.17‐0.85) | 63.6 | 66.2 | 1.10 (0.91‐1.31) | 0.07 |
| Miscellaneous | |||||||
| How well your pain was controlled | 64.2 | 66.5 | 1.14 (0.97‐1.32) | 60.2 | 62.6 | 1.07 (0.89‐1.28) | 0.66 |
| Staff addressed emotional needs | 60.0 | 63.4 | 1.19 (1.02‐1.38) | 55.1 | 60.2 | 1.20 (1.01‐1.42) | 0.90 |
| Response to concerns/complaints | 61.1 | 64.5 | 1.19 (1.02‐1.38) | 57.2 | 60.1 | 1.10 (0.92‐1.31) | 0.57 |
| Overall | |||||||
| Staff worked together to care for you | 72.6 | 77.2 | 1.29 (1.10‐1.52) | 70.3 | 73.2 | 1.13 (0.93‐1.37) | 0.30 |
| Likelihood of recommending hospital | 79.1 | 84.3 | 1.44 (1.20‐1.74) | 76.3 | 79.2 | 1.14 (0.93‐1.39) | 0.10 |
| Overall rating of care given | 76.8 | 83.0 | 1.50 (1.25‐1.80) | 74.7 | 77.2 | 1.10 (0.90‐1.34) | 0.03 |
With regard to nonfacility‐related satisfaction, there were statistically higher scores in several nursing, physician, and discharge‐related satisfaction domains after the move. However, these changes were not associated with the move to the new clinical building as they were not significantly different from improvements on the unmoved units. Among nonfacility‐related items, only staff attitude toward visitors showed significant improvement (68.1% vs 79.4%). There was a significant improvement in hospital rating (75.0% vs 83.3% in the moved units and 75.7% vs 77.6% in the unmoved units). However, the other 3 measures of overall satisfaction did not show significant improvement associated with the move to the new clinical building when compared to the concurrent controls.
DISCUSSION
Contrary to our hypothesis and a belief held by many, we found that patients appeared able to distinguish their experience with hospital environment from their experience with providers and other services. Improvement in hospital facilities with incorporation of patient‐centered features was associated with improvements that were largely limited to increases in satisfaction with quietness, cleanliness, temperature, and dcor of the room along with visitor‐related satisfaction. Notably, there was no significant improvement in satisfaction related to physicians, nurses, housekeeping, and other service staff. There was improvement in satisfaction with staff attitude toward visitors, but this can be attributed to availability of visitor‐friendly facilities. There was a significant improvement in 1 of the 4 measures of overall satisfaction. Our findings also support the construct validity of HCAHPS and Press Ganey patient satisfaction surveys.
Ours is one of the largest studies on patient satisfaction related to patient‐centered design features in the inpatient acute care setting. Swan et al. also studied patients in an acute inpatient setting and compared satisfaction related to appealing versus typical hospital rooms. Patients were matched for case mix, insurance, gender, types of medical services received and LOS, and were served by the same set of physicians and similar food service and housekeeping staff.[26] Unlike our study, they found improved satisfaction related to physicians, housekeeping staff, food service staff, meals, and overall satisfaction. However, the study had some limitations. In particular, the study sample was self‐selected because the patients in this group were required to pay an extra daily fee to utilize the appealing room. Additionally, there were only 177 patients across the 2 groups, and the actual differences in satisfaction scores were small. Our sample was larger and patients in the study group were admitted to units in the new clinical buildings by the same criteria as they were admitted to the historic building prior to the move, and there were no significant differences in baseline characteristics between the comparison groups.
Jansen et al. also found broad improvements in patient satisfaction in a study of over 309 maternity unit patients in a new construction, all private‐room maternity unit with more appealing design elements and comfort features for visitors.[7] Improved satisfaction was noted with the physical environment, nursing care, assistance with feeding, respect for privacy, and discharge planning. However, it is difficult to extrapolate the results of this study to other settings, as maternity unit patients constitute a unique patient demographic with unique care needs. Additionally, when compared with patients in the control group, the patients in the study group were cared for by nurses who had a lower workload and who were not assigned other patients with more complex needs. Because nursing availability may be expected to impact satisfaction with clinical domains, the impact of private and appealing room may very well have been limited to improved satisfaction with the physical environment.
Despite the widespread belief among healthcare leadership that facility renovation or expansion is a vital strategy for improving patient satisfaction, our study shows that this may not be a dominant factor.[27] In fact, the Planetree model showed that improvement in satisfaction related to physical environment and nursing care was associated with implementation of both patient‐centered design features as well as with utilization of nurses that were trained to provide personalized care, educate patients, and involve patients and family.[28] It is more likely that provider‐level interventions will have a greater impact on provider level and overall satisfaction. This idea is supported by a recent JD Powers study suggesting that facilities represent only 19% of overall satisfaction in the inpatient setting.[35]
Although our study focused on patient‐centered design features, several renovation and construction projects have also focused on design features that improve patient safety and provider satisfaction, workflow, efficiency, productivity, stress, and time spent in direct care.[9] Interventions in these areas may lead to improvement in patient outcomes and perhaps lead to improvement in patient satisfaction; however, this relationship has not been well established at present.
In an era of cost containment, healthcare administrators are faced with high‐priced interventions, competing needs, limited resources, low profit margins, and often unclear evidence on cost‐effectiveness and return on investment of healthcare design features. Benefits are related to competitive advantage, higher reputation, patient retention, decreased malpractice costs, and increased Medicare payments through VBP programs that incentivize improved performance on quality metrics and patient satisfaction surveys. Our study supports the idea that a significant improvement in patient satisfaction related to creature comforts can be achieved with investment in patient‐centered design features. However, our findings also suggest that institutions should perform an individualized cost‐benefit analysis related to improvements in this narrow area of patient satisfaction. In our study, incorporation of patient‐centered design features resulted in improvement on 2 VBP HCAHPS measures, and its contribution toward total performance score under the VBP program would be limited.
Strengths of our study include the use of concurrent controls and our ability to capitalize on a natural experiment in which care teams remained constant before and after a move to a new clinical building. However, our study has some limitations. It was conducted at a single tertiary care academic center that predominantly serves an inner city population and referral patients seeking specialized care. Drivers of patient satisfaction may be different in community hospitals, and a different relationship may be observed between patient‐centered design and domains of patient satisfaction in this setting. Further studies in different hospital settings are needed to confirm our findings. Additionally, we were limited by the low response rate of the surveys. However, this is a widespread problem with all patient satisfaction research utilizing voluntary surveys, and our response rates are consistent with those previously reported.[34, 36, 37, 38] Furthermore, low response rates have not impeded the implementation of pay‐for‐performance programs on a national scale using HCHAPS.
In conclusion, our study suggests that hospitals should not use outdated facilities as an excuse for achievement of suboptimal satisfaction scores. Patients respond positively to creature comforts, pleasing surroundings, and visitor‐friendly facilities but can distinguish these positive experiences from experiences in other patient satisfaction domains. In our study, the move to a higher‐amenity building had only a modest impact on overall patient satisfaction, perhaps because clinical care is the primary driver of this outcome. Contrary to belief held by some hospital leaders, major strides in overall satisfaction across the board and other subdomains of satisfaction likely require intervention in areas other than facility renovation and expansion.
Disclosures
Zishan Siddiqui, MD, was supported by the Osler Center of Clinical Excellence Faculty Scholarship Grant. Funds from Johns Hopkins Hospitalist Scholars Program supported the research project. The authors have no conflict of interests to disclose.
- , . Create a blueprint for successful hospital construction. Nurs Manage. 2006;37(6):39–44.
- Walter Reed National Military Medical Center website. Facts at a glance. Available at: http://www.wrnmmc.capmed.mil/About%20Us/SitePages/Facts.aspx. Accessed June 19, 2013.
- . Keys to collaboration. Healthcare Design website. Available at: http://www.healthcaredesignmagazine.com/building‐ideas/keys‐collaboration. Accessed June 19, 2013.
- . A tale of 4 hospitals. Healthcare Design website. Available at: http://www.healthcaredesignmagazine.com/building‐ideas/tale‐4‐hospitals. Accessed June 19, 2013.
- . Gateway to the east. Healthcare Design website. Available at: http://www.healthcaredesignmagazine.com/building‐ideas/gateway‐east. Accessed June 19, 2013.
- . Lessons learned. Healthcare Design website. Available at: http://www.healthcaredesignmagazine.com/building‐ideas/lessons‐learned. Accessed June 19, 2013.
- , , , , . Single room maternity care and client satisfaction. Birth. 2000;27(4):235–243.
- , , , . Same‐handed and mirrored unit configurations: is there a difference in patient and nurse outcomes? J Nurs Adm. 2011;41(6):273–279.
- , . The Pebble Projects: coordinated evidence‐based case studies. Build Res Inform. 2008;36(2):129–145.
- , , . Effects of exposure to nature and abstract pictures on patients recovering from open heart surgery. J Soc Psychophysiol Res. 1993;30:7.
- , , , . Postoperative delirium. Curr Drug Targets. 2005;6(7):807–814.
- . Stimulus deprivation in windowless rooms. Anaesthesia. 1977;32(7):598–602.
- , , , . Post‐occupancy evaluation of healing gardens in a pediatric cancer center. Landsc Urban Plan. 2005;73(2):167–183.
- . Healing gardens in hospitals. Interdiscip Des Res J. 2007;1(1):1–27.
- , . Restorative gardens. BMJ. 1993;306(6885):1080–1081.
- . Effects of interior design on wellness: theory and recent scientific research. J Health Care Inter Des. 1991;3:97–109.
- , . Sunny hospital rooms expedite recovery from severe and refractory depressions. J Affect Disord. 1996;40(1‐2):49–51.
- . Art in hospital spaces: the role of hospitals in an aestheticised society. Int J Cult Policy. 2007;13(1):85–101.
- , , . Renovation of a semiprivate patient room. Bowman Center Geriatric Rehabilitation Unit. Nurs Clin North Am 1995;30(1):97–115.
- , , , et al. (2013). Effect of intensive care environment on family and patient satisfaction: a before‐after study. Intensive Care Med. 2013;39(9):1626–1634.
- , , , , . Outcomes of environmental appraisal of different hospital waiting areas. Environ Behav. 2003;35(6):842–869.
- . Redesigning the neurocritical care unit to enhance family participation and improve outcomes. Cleve Clin J Med. 2009;76(suppl 2):S70–S74.
- , . The ecology of the patient visit: physical attractiveness, waiting times, and perceived quality of care. J Ambul Care Manage. 2008;31(2):128–141.
- . Patient satisfaction and the new consumer. Hosp Health Netw. 2006;80(57):59–62.
- . Patient satisfaction. Hospitals embrace hotel‐like amenities. Hosp Health Netw. 2007;81(11):24–26.
- , , . Do appealing hospital rooms increase patient evaluations of physicians, nurses, and hospital services? Health Care Manage Rev. 2003;28(3):254–264.
- . Patient experience and HCAHPS: little consensus on a top priority. Health Leaders Media website. Available at http://www.healthleadersmedia.com/intelligence/detail.cfm?content_id=28289334(2):125–133.
- Centers for Medicare 67:27–37.
- Hospital Consumer Assessment of Healthcare Providers and Systems. Summary analysis. http://www.hcahpsonline.org/SummaryAnalyses.aspx. Accessed October 1, 2014.
- Centers for Medicare 44(2 pt 1):501–518.
- J.D. Power and Associates. Patient satisfaction influenced more by hospital staff than by the hospital facilities. Available at: http://www.jdpower.com/press‐releases/2012‐national‐patient‐experience‐study#sthash.gSv6wAdc.dpuf. Accessed December 10, 2013.
- , , , , . Racial and ethnic differences in a patient survey: patients' values, ratings, and reports regarding physician primary care performance in a large health maintenance organization. Med Care. 2000;38(3): 300–310.
- , , , . Patient experience in safety‐net hospitals implications for improving care and Value‐Based Purchasing patient experience in safety‐net hospitals. Arch Intern Med. 2012;172(16):1204–1210.
- , , , . Comparison of Hospital Consumer Assessment of Healthcare Providers and Systems patient satisfaction scores for specialty hospitals and general medical hospitals: confounding effect of survey response rate. J Hosp Med. 2014;9(9):590–593.
Hospitals are expensive and complex facilities to build and renovate. It is estimated $200 billion is being spent in the United States during this decade on hospital construction and renovation, and further expenditures in this area are expected.[1] Aging hospital infrastructure, competition, and health system expansion have motivated institutions to invest in renovation and new hospital building construction.[2, 3, 4, 5, 6, 7] There is a trend toward patient‐centered design in new hospital construction. Features of this trend include same‐handed design (ie, rooms on a unit have all beds oriented in the same direction and do not share headwalls); use of sound absorbent materials to reduced ambient noise[7, 8, 9]; rooms with improved view and increased natural lighting to reduce anxiety, decrease delirium, and increase sense of wellbeing[10, 11, 12]; incorporation of natural elements like gardens, water features, and art[12, 13, 14, 15, 16, 17, 18]; single‐patient rooms to reduce transmission of infection and enhance privacy and visitor comfort[7, 19, 20]; presence of comfortable waiting rooms and visitor accommodations to enhance comfort and family participation[21, 22, 23]; and hotel‐like amenities such as on‐demand entertainment and room service menus.[24, 25]
There is a belief among some hospital leaders that patients are generally unable to distinguish their positive experience with a pleasing healthcare environment from their positive experience with care, and thus improving facilities will lead to improved satisfaction across the board.[26, 27] In a controlled study of hospitalized patients, appealing rooms were associated with increased satisfaction with services including housekeeping and food service staff, meals, as well as physicians and overall satisfaction.[26] A 2012 survey of hospital leadership found that expanding and renovating facilities was considered a top priority in improving patient satisfaction, with 82% of the respondents stating that this was important.[27]
Despite these attitudes, the impact of patient‐centered design on patient satisfaction is not well understood. Studies have shown that renovations and hospital construction that incorporates noise reduction strategies, positive distraction, patient and caregiver control, attractive waiting rooms, improved patient room appearance, private rooms, and large windows result in improved satisfaction with nursing, noise level, unit environment and cleanliness, perceived wait time, discharge preparedness, and overall care. [7, 19, 20, 23, 28] However, these studies were limited by small sample size, inclusion of a narrow group of patients (eg, ambulatory, obstetric, geriatric rehabilitation, intensive care unit), and concurrent use of interventions other than design improvement (eg, nurse and patient education). Many of these studies did not use the ubiquitous Hospital Consumer Assessment of Healthcare Providers and Systems (HCAHPS) and Press Ganey patient satisfaction surveys.
We sought to determine the changes in patient satisfaction that occurred during a natural experiment, in which clinical units (comprising stable nursing, physician, and unit teams) were relocated from an historic clinical building to a new clinical building that featured patient‐centered design, using HCAHPS and Press Ganey surveys and a large study population. We hypothesized that new building features would positively impact both facility related (eg, noise level), nonfacility related (eg, physician and housekeeping service related), and overall satisfaction.
METHODS
This was a retrospective analysis of prospectively collected Press Ganey and HCAPHS patient satisfaction survey data for a single academic tertiary care hospital.[29] The research project was reviewed and approved by the institutional review board.
Participants
All patients discharged from 12 clinical units that relocated to the new clinical building and returned patient satisfaction surveys served as study patients. The moved units included the coronary care unit, cardiac step down unit, medical intensive care unit, neuro critical care unit, surgical intensive care unit, orthopedic unit, neurology unit, neurosurgery unit, obstetrics units, gynecology unit, urology unit, cardiothoracic surgery unit, and the transplant surgery and renal transplant unit. Patients on clinical units that did not move served as concurrent controls.
Exposure
Patients admitted to the new clinical building experienced several patient‐centered design features. These features included easy access to healing gardens with a water feature, soaring lobbies, a collection of more than 500 works of art, well‐decorated and light‐filled patient rooms with sleeping accommodations for family members, sound‐absorbing features in patient care corridors ranging from acoustical ceiling tiles to a quiet nurse‐call system, and an interactive television network with Internet, movies, and games. All patients during the baseline period and control patients during the study period were located in typical patient rooms with standard hospital amenities. No other major patient satisfaction interventions were initiated during the pre‐ or postperiod in either arm of the study; ongoing patient satisfaction efforts (such as unit‐based customer care representatives) were deployed broadly and not restricted to the new clinical building. Clinical teams comprised of physicians, nurses, and ancillary staff did not change significantly after the move.
Time Periods
The move to new clinical building occurred on May 1, 2012. After allowing for a 15‐day washout period, the postmove period included Press Ganey and HCAHPS surveys returned for discharges that occurred during a 7.5‐month period between May 15, 2102 and December 31, 2012. Baseline data included Press Ganey and HCAHPS surveys returned for discharges in the preceding 12 months (May 1, 2011 to April 30, 2012). Sensitivity analysis using only 7.5 months of baseline data did not reveal any significant difference when compared with 12‐month baseline data, and we report only data from the 12‐month baseline period.
Instruments
Press Ganey and HCAHPS patient satisfaction surveys were sent via mail in the same envelope. Fifty percent of the discharged patients were randomized to receive the surveys. The Press Ganey survey contained 33 items covering across several subdomains including room, meal, nursing, physician, ancillary staff, visitor, discharge, and overall satisfaction. The HCAHPS survey contained 29 Centers for Medicare and Medicaid Services (CMS)‐mandated items, of which 21 are related to patient satisfaction. The development and testing and methods for administration and reporting of the HCAHPS survey have been previously described.[30, 31] Press Ganey patient satisfaction survey results have been reported in the literature.[32, 33]
Outcome Variables
Press Ganey and HCAHPS patient satisfaction survey responses were the primary outcome variables of the study. The survey items were categorized as facility related (eg, noise level), nonfacility related (eg, physician and nursing staff satisfaction), and overall satisfaction related.
Covariates
Age, sex, length of stay (LOS), insurance type, and all‐payer refined diagnosis‐related groupassociated illness complexity were included as covariates.
Statistical Analysis
Percent top‐box scores were calculated for each survey item as the percent of patients who responded very good for a given item on Press Ganey survey items and always or definitely yes or 9 or 10 on HCAHPS survey items. CMS utilizes percent top‐box scores to calculate payments under the Value Based Purchasing (VBP) program and to report the results publicly. Numerous studies have also reported percent top‐box scores for HCAHPS survey results.[31, 32, 33, 34]
Odds ratios of premove versus postmove percentage of top‐box scores, adjusted for age, sex, LOS, complexity of illness, and insurance type were determined using logistic regression for the units that moved. Similar scores were calculated for unmoved units to detect secular trends. To determine whether the differences between the moved and unmoved units were significant, we introduced the interaction term (moved vs unmoved unit status) (pre‐ vs postmove time period) into the logistic regression models and examined the adjusted P value for this term. All statistical analysis was performed using SAS Institute Inc.'s (Cary, NC) JMP Pro 10.0.0.
RESULTS
The study included 1648 respondents in the moved units in the baseline period (ie, units designated to move to a new clinical building) and 1373 respondents in the postmove period. There were 1593 respondents in the control group during the baseline period and 1049 respondents in the postmove period. For the units that moved, survey response rates were 28.5% prior to the move and 28.3% after the move. For the units that did not move, survey response rates were 20.9% prior to the move and 22.7% after the move. A majority of survey respondents on the nursing units that moved were white, male, and had private insurance (Table 1). There were no significant differences between respondents across these characteristics between the pre‐ and postmove periods. Mean age and LOS were also similar. For these units, there were 70.5% private rooms prior to the move and 100% after the move. For the unmoved units, 58.9% of the rooms were private in the baseline period and 72.7% were private in the study period. Similar to the units that moved, characteristics of the respondents on the unmoved units also did not differ significantly in the postmove period.
| Patient demographics | Moved Units (N=3,021) | Unmoved Units (N=2,642) | ||||
|---|---|---|---|---|---|---|
| Pre | Post | P Value | Pre | Post | P Value | |
| ||||||
| White | 75.3% | 78.2% | 0.07 | 66.7% | 68.5% | 0.31 |
| Mean age, y | 57.3 | 57.4 | 0.84 | 57.3 | 57.1 | 0.81 |
| Male | 54.3% | 53.0% | 0.48 | 40.5% | 42.3% | 0.23 |
| Self‐reported health | ||||||
| Excellent or very good | 54.7% | 51.2% | 0.04 | 38.7% | 39.5% | 0.11 |
| Good | 27.8% | 32.0% | 29.3% | 32.2% | ||
| Fair or poor | 17.5% | 16.9% | 32.0% | 28.3% | ||
| Self‐reported language | ||||||
| English | 96.0% | 97.2% | 0.06 | 96.8% | 97.1% | 0.63 |
| Other | 4.0% | 2.8% | 3.2% | 2.9% | ||
| Self‐reported education | ||||||
| Less than high school | 5.8% | 5.0% | 0.24 | 10.8% | 10.4% | 0.24 |
| High school grad | 46.4% | 44.2% | 48.6% | 45.5% | ||
| College grad or more | 47.7% | 50.7% | 40.7% | 44.7% | ||
| Insurance type | ||||||
| Medicaid | 6.7% | 5.5% | 0.11 | 10.8% | 9.0% | 0.32 |
| Medicare | 32.0% | 35.5% | 36.0% | 36.1% | ||
| Private insurance | 55.6% | 52.8% | 48.0% | 50.3% | ||
| Mean APRDRG complexity* | 2.1 | 2.1 | 0.09 | 2.3 | 2.3 | 0.14 |
| Mean LOS | 4.7 | 5.0 | 0.12 | 4.9 | 5.0 | 0.77 |
| Service | ||||||
| Medicine | 15.4% | 16.2% | 0.51 | 40.0% | 34.5% | 0.10 |
| Surgery | 50.7% | 45.7% | 40.1% | 44.1% | ||
| Neurosciences | 20.3% | 24.1% | 6.0% | 6.0% | ||
| Obstetrics/gynecology | 7.5% | 8.2% | 5.7% | 5.6% | ||
The move was associated with significant improvements in facility‐related satisfaction (Tables 2 and 3). The most prominent increases in satisfaction were with pleasantness of dcor (33.6% vs 66.2%), noise level (39.9% vs 59.3%), and visitor accommodation and comfort (50.0% vs 70.3 %). There was improvement in satisfaction related to cleanliness of the room (49.0% vs 68.6 %), but no significant increase in satisfaction with courtesy of the person cleaning the room (59.8% vs 67.7%) when compared with units that did move.
| Satisfaction Domain | Moved Units | Unmoved Units | P Value of the Difference in Odds Ratio Between Moved and Unmoved Units | |||||
|---|---|---|---|---|---|---|---|---|
| % Top Box | Adjusted Odds Ratio* (95% CI) | % Top Box | Adjusted Odds Ratio* (95% CI) | |||||
| Pre | Post | Pre | Post | |||||
| ||||||||
| FACILITY RELATED | ||||||||
| Hospital environment | ||||||||
| Cleanliness of the room and bathroom | 61.0 | 70.8 | 1.62 (1.40‐1.90) | 64.0 | 69.2 | 1.24 (1.03‐1.48) | 0.03 | |
| Quietness of the room | 51.3 | 65.4 | 1.89 (1.63‐2.19) | 58.6 | 60.3 | 1.08 (0.90‐1.28) | <0.0001 | |
| NONFACILITY RELATED | ||||||||
| Nursing communication | ||||||||
| Nurses treated with courtesy/respect | 84.0 | 86.7 | 1.28 (1.05‐1.57) | 83.6 | 87.1 | 1.29 (1.02‐1.64) | 0.92 | |
| Nurses listened | 73.1 | 76.4 | 1.21 (1.03‐1.43) | 74.2 | 75.5 | 1.05 (0.86‐1.27) | 0.26 | |
| Nurses explained | 75.0 | 76.6 | 1.10 (0.94‐1.30) | 76.0 | 76.2 | 1.00 (0.82‐1.21) | 0.43 | |
| Physician communication | ||||||||
| Doctors treated with courtesy/respect | 89.5 | 90.5 | 1.13 (0.89‐1.42) | 84.9 | 87.3 | 1.20 (0.94‐1.53) | 0.77 | |
| Doctors listened | 81.4 | 81.0 | 0.93 (0.83‐1.19) | 77.7 | 77.1 | 0.94 (0.77‐1.15) | 0.68 | |
| Doctors explained | 79.2 | 79.0 | 1.00(0.84‐1.19) | 75.7 | 74.4 | 0.92 (0.76‐1.12) | 0.49 | |
| Other | ||||||||
| Help toileting as soon as you wanted | 61.8 | 63.7 | 1.08 (0.89‐1.32) | 62.3 | 60.6 | 0.92 (0.71‐1.18) | 0.31 | |
| Pain well controlled | 63.2 | 63.8 | 1.06 (0.90‐1.25) | 62.0 | 62.6 | 0.99 (0.81‐1.20) | 060 | |
| Staff do everything to help with pain | 77.7 | 80.1 | 1.19 (0.99‐1.44) | 76.8 | 75.7 | 0.90 (0.75‐1.13) | 0.07 | |
| Staff describe medicine side effects | 47.0 | 47.6 | 1.05 (0.89‐1.24) | 49.2 | 47.1 | 0.91 (0.74‐1.11) | 0.32 | |
| Tell you what new medicine was for | 76.4 | 76.4 | 1.02 (0.84‐1.25) | 77.1 | 78.8 | 1.09(0.85‐1.39) | 0.65 | |
| Overall | ||||||||
| Rate hospital (010) | 75.0 | 83.3 | 1.71 (1.44‐2.05) | 75.7 | 77.6 | 1.06 (0.87‐1.29) | 0.006 | |
| Recommend hospital | 82.5 | 87.1 | 1.43 (1.18‐1.76) | 81.4 | 82.0 | 0.98 (0.79‐1.22) | 0.03 | |
| Satisfaction Domain | Moved Unit | Unmoved Unit | P Value of the Difference in Odds Ratio Between Moved and Unmoved Units | ||||
|---|---|---|---|---|---|---|---|
| % Top Box | Adjusted Odds Ratio* (95% CI) | % Top Box | Adjusted Odds Ratio* (95% CI) | ||||
| Pre | Post | Pre | Post | ||||
| |||||||
| FACILITY RELATED | |||||||
| Room | |||||||
| Pleasantness of room dcor | 33.6 | 64.8 | 3.77 (3.24‐4.38) | 41.6 | 47.0 | 1.21 (1.02‐1.44) | <0.0001 |
| Room cleanliness | 49.0 | 68.6 | 2.35 (2.02‐2.73) | 51.6 | 59.1 | 1.32 (1.12‐1.58) | <0.0001 |
| Room temperature | 43.1 | 54.9 | 1.64 (1.43‐1.90) | 45.0 | 48.8 | 1.14 (0.96‐1.36) | 0.002 |
| Noise level in and around the room | 40.2 | 59.2 | 2.23 (1.92‐2.58) | 45.5 | 47.6 | 1.07 (0.90‐1.22) | <0.0001 |
| Visitor related | |||||||
| Accommodations and comfort of visitors | 50.0 | 70.3 | 2.44 (2.10‐2.83) | 55.3 | 59.1 | 1.14 (0.96‐1.35) | <0.0001 |
| NONFACILITY RELATED | |||||||
| Food | |||||||
| Temperature of the food | 31.1 | 33.6 | 1.15 (0.99‐1.34) | 34.0 | 38.9 | 1.23 (1.02‐1.47) | 0.51 |
| Quality of the food | 25.8 | 27.1 | 1.10 (0.93‐1.30) | 30.2 | 36.2 | 1.32 (1.10‐1.59) | 0.12 |
| Courtesy of the person who served food | 63.9 | 62.3 | 0.93 (0.80‐1.10) | 66.0 | 61.4 | 0.82 (0.69‐0.98) | 0.26 |
| Nursing | |||||||
| Friendliness/courtesy of the nurses | 76.3 | 82.8 | 1.49 (1.26‐1.79) | 77.7 | 80.1 | 1.10 (0.90‐1.37) | 0.04 |
| Promptness of response to call | 60.1 | 62.6 | 1.14 (0.98‐1.33) | 59.2 | 62.0 | 1.10 (0.91‐1.31) | 0.80 |
| Nurses' attitude toward requests | 71.0 | 75.8 | 1.30 (1.11‐1.54) | 70.5 | 72.4 | 1.06 (0.88‐1.28) | 0.13 |
| Attention to special/personal needs | 66.7 | 72.2 | 1.32 (1.13‐1.54) | 67.8 | 70.3 | 1.09 (0.91‐1.31) | 0.16 |
| Nurses kept you informed | 64.3 | 72.2 | 1.46 (1.25‐1.70) | 65.8 | 69.8 | 1.17 (0.98‐1.41) | 0.88 |
| Skill of the nurses | 75.3 | 79.5 | 1.28 (1.08‐1.52) | 74.3 | 78.6 | 1.23 (1.01‐1.51) | 0.89 |
| Ancillary staff | |||||||
| Courtesy of the person cleaning the room | 59.8 | 67.7 | 1.41 (1.21‐1.65) | 61.2 | 66.5 | 1.24 (1.03‐1.49) | 0.28 |
| Courtesy of the person who took blood | 66.5 | 68.1 | 1.10 (0.94‐1.28) | 63.2 | 63.1 | 0.96 (0.76‐1.08) | 0.34 |
| Courtesy of the person who started the IV | 70.0 | 71.7 | 1.09 (0.93‐1.28) | 66.6 | 69.3 | 1.11 (0.92‐1.33) | 0.88 |
| Visitor related | |||||||
| Staff attitude toward visitors | 68.1 | 79.4 | 1.84 (1.56‐2.18) | 70.3 | 72.2 | 1.06 (0.87‐1.28) | <0.0001 |
| Physician | |||||||
| Time physician spent with you | 55.0 | 58.9 | 1.20 (1.04‐1.39) | 53.2 | 55.9 | 1.10 (0.92‐1.30) | 0.46 |
| Physician concern questions/worries | 67.2 | 70.7 | 1.20 (1.03‐1.40) | 64.3 | 66.1 | 1.05 (0.88‐1.26) | 0.31 |
| Physician kept you informed | 65.3 | 67.5 | 1.12 (0.96‐1.30) | 61.6 | 63.2 | 1.05 (0.88‐1.25) | 0.58 |
| Friendliness/courtesy of physician | 76.3 | 78.1 | 1.11 (0.93‐1.31) | 71.0 | 73.3 | 1.08 (0.90‐1.31) | 0.89 |
| Skill of physician | 85.4 | 88.5 | 1.35 (1.09‐1.68) | 78.0 | 81.0 | 1.15 (0.93‐1.43) | 0.34 |
| Discharge | |||||||
| Extent felt ready for discharge | 62.0 | 66.7 | 1.23 (1.07‐1.44) | 59.2 | 62.3 | 1.10 (0.92‐1.30) | 0.35 |
| Speed of discharge process | 50.7 | 54.2 | 1.16 (1.01‐1.33) | 47.8 | 50.0 | 1.07 (0.90‐1.27) | 0.49 |
| Instructions for care at home | 66.4 | 71.1 | 1.25 (1.06‐1.46) | 64.0 | 67.7 | 1.16 (0.97‐1.39) | 0.54 |
| Staff concern for your privacy | 65.3 | 71.8 | 1.37 (1.17‐0.85) | 63.6 | 66.2 | 1.10 (0.91‐1.31) | 0.07 |
| Miscellaneous | |||||||
| How well your pain was controlled | 64.2 | 66.5 | 1.14 (0.97‐1.32) | 60.2 | 62.6 | 1.07 (0.89‐1.28) | 0.66 |
| Staff addressed emotional needs | 60.0 | 63.4 | 1.19 (1.02‐1.38) | 55.1 | 60.2 | 1.20 (1.01‐1.42) | 0.90 |
| Response to concerns/complaints | 61.1 | 64.5 | 1.19 (1.02‐1.38) | 57.2 | 60.1 | 1.10 (0.92‐1.31) | 0.57 |
| Overall | |||||||
| Staff worked together to care for you | 72.6 | 77.2 | 1.29 (1.10‐1.52) | 70.3 | 73.2 | 1.13 (0.93‐1.37) | 0.30 |
| Likelihood of recommending hospital | 79.1 | 84.3 | 1.44 (1.20‐1.74) | 76.3 | 79.2 | 1.14 (0.93‐1.39) | 0.10 |
| Overall rating of care given | 76.8 | 83.0 | 1.50 (1.25‐1.80) | 74.7 | 77.2 | 1.10 (0.90‐1.34) | 0.03 |
With regard to nonfacility‐related satisfaction, there were statistically higher scores in several nursing, physician, and discharge‐related satisfaction domains after the move. However, these changes were not associated with the move to the new clinical building as they were not significantly different from improvements on the unmoved units. Among nonfacility‐related items, only staff attitude toward visitors showed significant improvement (68.1% vs 79.4%). There was a significant improvement in hospital rating (75.0% vs 83.3% in the moved units and 75.7% vs 77.6% in the unmoved units). However, the other 3 measures of overall satisfaction did not show significant improvement associated with the move to the new clinical building when compared to the concurrent controls.
DISCUSSION
Contrary to our hypothesis and a belief held by many, we found that patients appeared able to distinguish their experience with hospital environment from their experience with providers and other services. Improvement in hospital facilities with incorporation of patient‐centered features was associated with improvements that were largely limited to increases in satisfaction with quietness, cleanliness, temperature, and dcor of the room along with visitor‐related satisfaction. Notably, there was no significant improvement in satisfaction related to physicians, nurses, housekeeping, and other service staff. There was improvement in satisfaction with staff attitude toward visitors, but this can be attributed to availability of visitor‐friendly facilities. There was a significant improvement in 1 of the 4 measures of overall satisfaction. Our findings also support the construct validity of HCAHPS and Press Ganey patient satisfaction surveys.
Ours is one of the largest studies on patient satisfaction related to patient‐centered design features in the inpatient acute care setting. Swan et al. also studied patients in an acute inpatient setting and compared satisfaction related to appealing versus typical hospital rooms. Patients were matched for case mix, insurance, gender, types of medical services received and LOS, and were served by the same set of physicians and similar food service and housekeeping staff.[26] Unlike our study, they found improved satisfaction related to physicians, housekeeping staff, food service staff, meals, and overall satisfaction. However, the study had some limitations. In particular, the study sample was self‐selected because the patients in this group were required to pay an extra daily fee to utilize the appealing room. Additionally, there were only 177 patients across the 2 groups, and the actual differences in satisfaction scores were small. Our sample was larger and patients in the study group were admitted to units in the new clinical buildings by the same criteria as they were admitted to the historic building prior to the move, and there were no significant differences in baseline characteristics between the comparison groups.
Jansen et al. also found broad improvements in patient satisfaction in a study of over 309 maternity unit patients in a new construction, all private‐room maternity unit with more appealing design elements and comfort features for visitors.[7] Improved satisfaction was noted with the physical environment, nursing care, assistance with feeding, respect for privacy, and discharge planning. However, it is difficult to extrapolate the results of this study to other settings, as maternity unit patients constitute a unique patient demographic with unique care needs. Additionally, when compared with patients in the control group, the patients in the study group were cared for by nurses who had a lower workload and who were not assigned other patients with more complex needs. Because nursing availability may be expected to impact satisfaction with clinical domains, the impact of private and appealing room may very well have been limited to improved satisfaction with the physical environment.
Despite the widespread belief among healthcare leadership that facility renovation or expansion is a vital strategy for improving patient satisfaction, our study shows that this may not be a dominant factor.[27] In fact, the Planetree model showed that improvement in satisfaction related to physical environment and nursing care was associated with implementation of both patient‐centered design features as well as with utilization of nurses that were trained to provide personalized care, educate patients, and involve patients and family.[28] It is more likely that provider‐level interventions will have a greater impact on provider level and overall satisfaction. This idea is supported by a recent JD Powers study suggesting that facilities represent only 19% of overall satisfaction in the inpatient setting.[35]
Although our study focused on patient‐centered design features, several renovation and construction projects have also focused on design features that improve patient safety and provider satisfaction, workflow, efficiency, productivity, stress, and time spent in direct care.[9] Interventions in these areas may lead to improvement in patient outcomes and perhaps lead to improvement in patient satisfaction; however, this relationship has not been well established at present.
In an era of cost containment, healthcare administrators are faced with high‐priced interventions, competing needs, limited resources, low profit margins, and often unclear evidence on cost‐effectiveness and return on investment of healthcare design features. Benefits are related to competitive advantage, higher reputation, patient retention, decreased malpractice costs, and increased Medicare payments through VBP programs that incentivize improved performance on quality metrics and patient satisfaction surveys. Our study supports the idea that a significant improvement in patient satisfaction related to creature comforts can be achieved with investment in patient‐centered design features. However, our findings also suggest that institutions should perform an individualized cost‐benefit analysis related to improvements in this narrow area of patient satisfaction. In our study, incorporation of patient‐centered design features resulted in improvement on 2 VBP HCAHPS measures, and its contribution toward total performance score under the VBP program would be limited.
Strengths of our study include the use of concurrent controls and our ability to capitalize on a natural experiment in which care teams remained constant before and after a move to a new clinical building. However, our study has some limitations. It was conducted at a single tertiary care academic center that predominantly serves an inner city population and referral patients seeking specialized care. Drivers of patient satisfaction may be different in community hospitals, and a different relationship may be observed between patient‐centered design and domains of patient satisfaction in this setting. Further studies in different hospital settings are needed to confirm our findings. Additionally, we were limited by the low response rate of the surveys. However, this is a widespread problem with all patient satisfaction research utilizing voluntary surveys, and our response rates are consistent with those previously reported.[34, 36, 37, 38] Furthermore, low response rates have not impeded the implementation of pay‐for‐performance programs on a national scale using HCHAPS.
In conclusion, our study suggests that hospitals should not use outdated facilities as an excuse for achievement of suboptimal satisfaction scores. Patients respond positively to creature comforts, pleasing surroundings, and visitor‐friendly facilities but can distinguish these positive experiences from experiences in other patient satisfaction domains. In our study, the move to a higher‐amenity building had only a modest impact on overall patient satisfaction, perhaps because clinical care is the primary driver of this outcome. Contrary to belief held by some hospital leaders, major strides in overall satisfaction across the board and other subdomains of satisfaction likely require intervention in areas other than facility renovation and expansion.
Disclosures
Zishan Siddiqui, MD, was supported by the Osler Center of Clinical Excellence Faculty Scholarship Grant. Funds from Johns Hopkins Hospitalist Scholars Program supported the research project. The authors have no conflict of interests to disclose.
- , . Create a blueprint for successful hospital construction. Nurs Manage. 2006;37(6):39–44.
- Walter Reed National Military Medical Center website. Facts at a glance. Available at: http://www.wrnmmc.capmed.mil/About%20Us/SitePages/Facts.aspx. Accessed June 19, 2013.
- . Keys to collaboration. Healthcare Design website. Available at: http://www.healthcaredesignmagazine.com/building‐ideas/keys‐collaboration. Accessed June 19, 2013.
- . A tale of 4 hospitals. Healthcare Design website. Available at: http://www.healthcaredesignmagazine.com/building‐ideas/tale‐4‐hospitals. Accessed June 19, 2013.
- . Gateway to the east. Healthcare Design website. Available at: http://www.healthcaredesignmagazine.com/building‐ideas/gateway‐east. Accessed June 19, 2013.
- . Lessons learned. Healthcare Design website. Available at: http://www.healthcaredesignmagazine.com/building‐ideas/lessons‐learned. Accessed June 19, 2013.
- , , , , . Single room maternity care and client satisfaction. Birth. 2000;27(4):235–243.
- , , , . Same‐handed and mirrored unit configurations: is there a difference in patient and nurse outcomes? J Nurs Adm. 2011;41(6):273–279.
- , . The Pebble Projects: coordinated evidence‐based case studies. Build Res Inform. 2008;36(2):129–145.
- , , . Effects of exposure to nature and abstract pictures on patients recovering from open heart surgery. J Soc Psychophysiol Res. 1993;30:7.
- , , , . Postoperative delirium. Curr Drug Targets. 2005;6(7):807–814.
- . Stimulus deprivation in windowless rooms. Anaesthesia. 1977;32(7):598–602.
- , , , . Post‐occupancy evaluation of healing gardens in a pediatric cancer center. Landsc Urban Plan. 2005;73(2):167–183.
- . Healing gardens in hospitals. Interdiscip Des Res J. 2007;1(1):1–27.
- , . Restorative gardens. BMJ. 1993;306(6885):1080–1081.
- . Effects of interior design on wellness: theory and recent scientific research. J Health Care Inter Des. 1991;3:97–109.
- , . Sunny hospital rooms expedite recovery from severe and refractory depressions. J Affect Disord. 1996;40(1‐2):49–51.
- . Art in hospital spaces: the role of hospitals in an aestheticised society. Int J Cult Policy. 2007;13(1):85–101.
- , , . Renovation of a semiprivate patient room. Bowman Center Geriatric Rehabilitation Unit. Nurs Clin North Am 1995;30(1):97–115.
- , , , et al. (2013). Effect of intensive care environment on family and patient satisfaction: a before‐after study. Intensive Care Med. 2013;39(9):1626–1634.
- , , , , . Outcomes of environmental appraisal of different hospital waiting areas. Environ Behav. 2003;35(6):842–869.
- . Redesigning the neurocritical care unit to enhance family participation and improve outcomes. Cleve Clin J Med. 2009;76(suppl 2):S70–S74.
- , . The ecology of the patient visit: physical attractiveness, waiting times, and perceived quality of care. J Ambul Care Manage. 2008;31(2):128–141.
- . Patient satisfaction and the new consumer. Hosp Health Netw. 2006;80(57):59–62.
- . Patient satisfaction. Hospitals embrace hotel‐like amenities. Hosp Health Netw. 2007;81(11):24–26.
- , , . Do appealing hospital rooms increase patient evaluations of physicians, nurses, and hospital services? Health Care Manage Rev. 2003;28(3):254–264.
- . Patient experience and HCAHPS: little consensus on a top priority. Health Leaders Media website. Available at http://www.healthleadersmedia.com/intelligence/detail.cfm?content_id=28289334(2):125–133.
- Centers for Medicare 67:27–37.
- Hospital Consumer Assessment of Healthcare Providers and Systems. Summary analysis. http://www.hcahpsonline.org/SummaryAnalyses.aspx. Accessed October 1, 2014.
- Centers for Medicare 44(2 pt 1):501–518.
- J.D. Power and Associates. Patient satisfaction influenced more by hospital staff than by the hospital facilities. Available at: http://www.jdpower.com/press‐releases/2012‐national‐patient‐experience‐study#sthash.gSv6wAdc.dpuf. Accessed December 10, 2013.
- , , , , . Racial and ethnic differences in a patient survey: patients' values, ratings, and reports regarding physician primary care performance in a large health maintenance organization. Med Care. 2000;38(3): 300–310.
- , , , . Patient experience in safety‐net hospitals implications for improving care and Value‐Based Purchasing patient experience in safety‐net hospitals. Arch Intern Med. 2012;172(16):1204–1210.
- , , , . Comparison of Hospital Consumer Assessment of Healthcare Providers and Systems patient satisfaction scores for specialty hospitals and general medical hospitals: confounding effect of survey response rate. J Hosp Med. 2014;9(9):590–593.
© 2014 Society of Hospital Medicine
Thiamine Prescribing Practices
Thiamine pyrophosphate, the biologically active form of thiamine (vitamin B1), is an essential cofactor for the aerobic breakdown of glucose, with daily requirements related to total caloric intake and the proportion of calories provided as carbohydrates. Patients presenting to the hospital are at risk of thiamine deficiency due to a preponderance of factors including baseline poor nutritional status,[1, 2, 3] diminished intake (associated with illness prodrome), increased metabolic demand (eg, occurring with sepsis, malignancy, surgery, pregnancy), and resuscitation with intravenous glucose‐containing fluids. Without thiamine pyrophosphate, glucose is metabolized through less‐efficient anaerobic pathways, producing lactic acid as a by‐product. The brain uses glucose as its main source of energy and is susceptible to injury due to acute thiamine deficiency. Petechial hemorrhage and demyelination within periventricular structures (thalami, mammillary bodies, ocular motor nuclei, and cerebellar vermis) account for the classical triad of Wernicke's encephalopathy (WE), including confusion/encephalopathy, ophthalmoplegia, and ataxia.[4, 5, 6, 7] Additional symptoms and signs are reported in WE, implicating more widespread consequences of thiamine deficiency.[6, 7, 8, 9]
Wernicke's encephalopathy remains an historically well‐documented illness,[4, 5] of continued relevance to hospitalist practice. Pathologic changes diagnostic of WE are reported in 1.9% to 2.8% of all patients at autopsy,[6, 10] and in as many as 20% of hospitalized patients following unexplained death.[11, 12] In cases of alcohol‐related death, the incidence may be as high as 59%.[13] Most troubling is the observation that the diagnosis is frequently missed in clinical settings,[14, 15, 16, 17, 18, 19] with devastating results. Case series report mortality in upward of 20% of patients with untreated or undertreated WE, with 85% of survivors developing Korsakoff syndromethe chronic form of WE.[8, 20, 21] The clinical diagnosis may be missed in as many as 94% of nonalcoholic patients, including patients admitted to surgical (ie, postgastrointestinal surgery), obstetrical (ie, hyperemesis gravidarum), psychiatric (ie, eating disorders), general internal medicine (ie, cancer‐associated cachexia and related complications), and subspecialty services (ie, dialysis and renal diseases).[15]
Recognition of WE is critical, as effective intervention and treatment is possible. For hospitalized patients, intervention should prioritize parenteral administration of thiamine[22, 23] to circumvent problems with oral absorption common in the medically ill, and to maximize serum thiamine concentrations, promoting passive (concentration‐dependent) movement of thiamine across the blood brain barrier. In lieu of evidence from randomized controlled trials supporting specific doses and schedules for thiamine administration,[24, 25] this recommendation relies on ample experiential evidence emphasizing the importance of higher doses of parenteral thiamine (in excess of 200 mg provided 3 times daily) for the prevention/treatment of WE.[12, 15, 20, 26, 27]
It remains to be determined whether the evidence emphasizing parenteral prescribing has affected current practice within inpatient populations. To address this need, we sought to quantify thiamine‐prescribing practices within Canadian university‐affiliated hospitals across a 2‐year period. We hypothesized that thiamine would be prescribed more frequently via the parenteral route, in line with published guidelines promoting parenteral administration of thiamine.[15, 20]
METHODS
Study Design and Recruitment
A retrospective observational study was used to evaluate thiamine prescribing within Canadian academic hospitals between January 2010 and December 2011. University‐affiliated institutions with English‐speaking postgraduate (ie, residency) adult medicine programs were eligible to participate. Participating centers all utilized computerized pharmacy information systems, allowing anonymized retrospective data to be reported for participants. Study objectives, methods, and procedures were approved by institutional research ethics boards at participating centers.
Data were extracted for the study period from computerized pharmacy information systems recording prescriptions processed by centralized hospital pharmacies. Thiamine prescribed as part of total parenteral nutrition was excluded from analysis, as prescribing was automated in most centers. Participants were assigned a randomized study number linked to prescription information specifying the prescribed dose of thiamine, route of administration (oral: per os, nasogastric tube, orogastric tube, gastric tube; versus parenteral: intravenous, intramuscular), frequency of dosing (eg, daily, twice daily, 3 times daily), and start/end dates. Complete data were available from 12 hospitals (12/14, 85.7%). One hospital was missing data concerning the frequency of prescribing. One hospital provided only summary data, specifying the number of prescriptions issued by route and dose. Information concerning the prescribing service was captured within records from 7 hospitals (7/14, 50.0%), allowing prescriptions to be stratified by prescribing services. Subspecialty designations were simplified to emergency department, intensive care unit (ICU) (including medical, surgical, and trauma ICUs), medical subspecialty (ie, cardiology, endocrinology, gastroenterology, medical oncology, rheumatology), general internal medicine, neurology, psychiatry, and surgical (ie, general surgery, cardiac surgery, neurosurgery, orthopedics, gynecology) services.
Statistical Analysis
Prescriptions for thiamine were summarized across each center specifying the route of administration (all prescriptions and initial prescription). Prescribing behaviors across centers were summarized using descriptive statistics. Differences in parenteral versus oral prescribing were evaluated using the z test for the difference between weighted averages, assuming a null hypothesis of equal prescribing (ie, 50% parenteral and 50% oral) within categories (i.e., all prescriptions, initial prescriptions, total doses).
Factors that may affect rates of parenteral prescribing were considered across centers. Hospitals were stratified based upon the presence of protocols promoting parenteral thiamine prescribing for the treatment of patients at risk of deficiency. The effect of protocols on prescribing behaviors was evaluated by comparing prescribing practices in centers with and without protocols using the z test for the difference between proportions. Forward linear regression was used to evaluate the correlation between the number of prescriptions and/or doses prescribed within centers, and the rates of parenteral prescribing. Rates of parenteral prescribing across hospital services were compared using pairwise comparisons.
Statistical analyses were completed using IBM SPSS Statistics 20 (IBM Corp., Armonk, NY). Significance was defined as P<0.05, using P values corrected for the total number of comparisons (Bonferroni correction), equivalent to a single‐comparison P value<0.001.
RESULTS
Thirteen university‐affiliated academic centers met inclusion criterion and were invited to participate. Data were obtained from 9 organizations (9/13, 69%), encompassing 14 geographically distributed academic hospitals (Figure 1). Centers that declined to participate cited a lack of comprehensive electronic databases tracking prescriptions as the main barrier. One of the 14 participating hospitals represented a network of affiliated health centers (site 2), rendering it an outlier in terms of total number of doses prescribed (>3 standard deviations above the mean). This affiliated network was unable to provide prescribing data separated by hospital and was excluded from analyses.
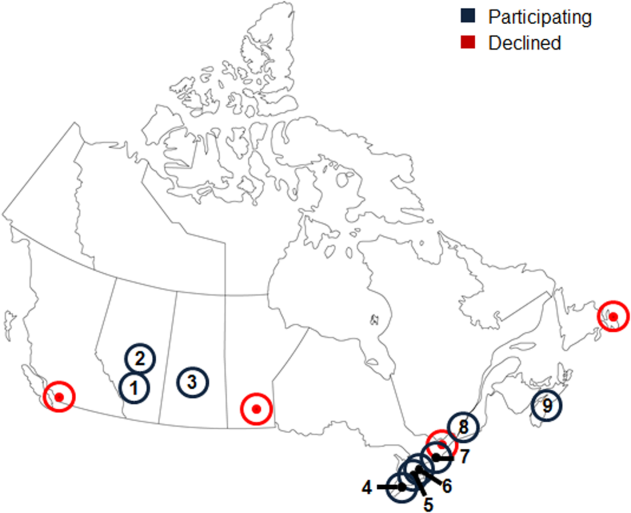
In total, data were collected corresponding to 48,806 prescriptions for 209,762 doses of thiamine, provided to 32,213 patients (Table 1). Prescriptions were divided by route of administration (parenteral vs oral) and prescribing practices summarized across centers. Rates of parenteral prescribing varied widely between centers (maximum=82.0%, minimum=33.9%). Overall, however, parenteral thiamine was prescribed more frequently than oral thiamine, accounting for 57.6% of all prescriptions (z=33.59, P<0.001) and 59.2% of initial prescriptions issued to patients (z=168.93, P<0.001). Oral thiamine constituted a significant majority of the total doses prescribed (68.4%, z=168.9; P<0.001).
| All Prescriptions | First Prescriptions | Doses | ||||||||
|---|---|---|---|---|---|---|---|---|---|---|
| Hospital | Total | Parenteral % | Oral % | Total | Parenteral % | Oral % | Total | Parenteral % | Oral % | |
| ||||||||||
| 1A* | 7,499 | 66.42 | 33.58 | 6,189 | 66.41 | 33.59 | 36,032 | 26.60 | 73.40 | |
| 1B* | 4,372 | 70.38 | 29.62 | 2,314 | 78.69 | 21.31 | 17,133 | 27.61 | 72.39 | |
| 1C* | 5,805 | 57.64 | 42.36 | 4,742 | 58.10 | 41.90 | 30,910 | 17.12 | 82.88 | |
| 3* | 3,519 | 45.27 | 54.73 | 2,236 | 59.57 | 40.43 | 8,037 | 52.37 | 47.63 | |
| 4* | 5,322 | 60.50 | 39.50 | 2,900 | 57.83 | 42.17 | 22,159 | 44.49 | 55.51 | |
| 5 | 3,857 | 46.85 | 53.15 | 2,858 | 56.37 | 43.63 | 16,035 | 33.51 | 66.49 | |
| 6A* | 6,105 | 55.46 | 44.54 | 2,907 | 55.04 | 44.96 | 15,947 | 44.22 | 55.78 | |
| 6B | 3,127 | 55.39 | 44.61 | 1,710 | 64.62 | 35.38 | 9,048 | 45.11 | 54.89 | |
| 6C* | 2,134 | 55.62 | 44.38 | 1,499 | 56.24 | 43.76 | 10,327 | 32.33 | 67.67 | |
| 6D | 617 | 35.82 | 64.18 | 505 | 34.65 | 65.35 | 2,647 | 35.70 | 64.30 | |
| 7* | 2,467 | 82.00 | 18.00 | 1,373 | 87.40 | 12.60 | 9,924 | 59.06 | 40.94 | |
| 8 | 1,122 | 50.98 | 49.02 | 694 | 58.79 | 41.21 | 3,048 | 64.73 | 35.27 | |
| 9 | 2,860 | 33.85 | 66.15 | 2,286 | 19.34 | 80.66 | 28,515 | 14.73 | 85.27 | |
| Total | 48,806 | 57.60 | 42.40 | 32,213 | 59.23 | 40.77 | 209,762 | 31.56 | 68.44 | |
The factors associated with higher rates of parenteral prescribing were further considered. Rates of parenteral prescribing were compared between centers with and without published guidelines governing thiamine usage. Eight of 13 hospitals (61.5%) had hospital‐wide protocols that promoted initial administration of thiamine via the parenteral route in patients at risk of deficiency. The presence of a protocol was associated with significantly higher overall rates of parenteral prescribing (61.3% with protocol, 45.7% without protocol; z=29.5; P<0.001). Linear regression revealed no predictive relationship between the number of prescriptions issued and the proportion of parenteral thiamine prescribed across centers (total prescriptions, standard 0.38, P=0.20; Figure 2). A negative correlation was observed between the proportion of doses prescribed via the parenteral route and the number of total doses prescribed (standard =0.61, P=0.03), suggesting that centers prescribing the greatest numbers of doses were less likely to prescribe parenteral thiamine.
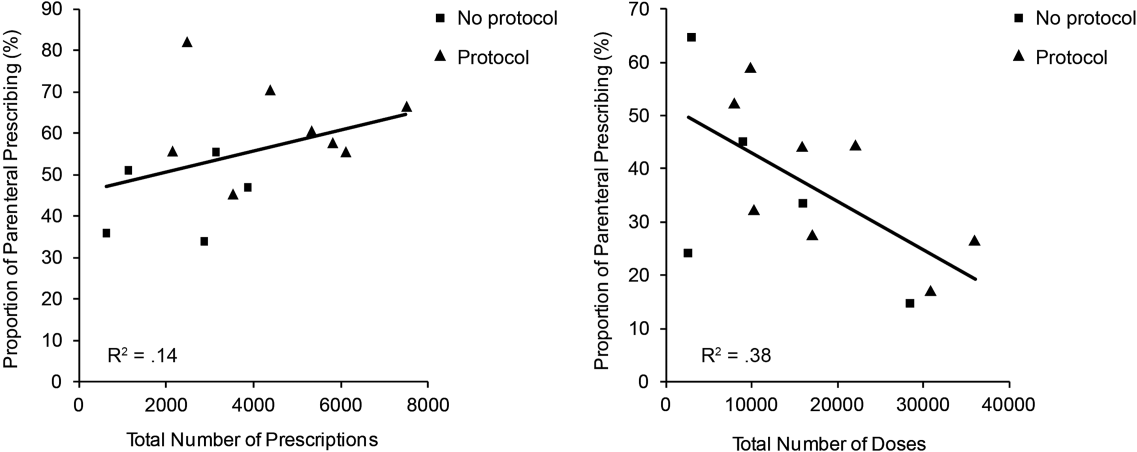
The effect of the inpatient practice environment on prescribing behavior was considered across the 7 centers for which service‐specific prescribing data were provided (Figure 3). Patients receiving care within emergency departments or intensive care, general medical or surgical units were more likely to be prescribed parenteral thiamine (z>3.0, P<0.001), whereas patients admitted to psychiatry units were more likely to be prescribed thiamine via the oral route (z=23.7, P<0.001). No differences were observed between rates of parenteral and oral prescribing for patients admitted under medical subspecialty (z=0.6, P=not significant) and neurology services (z=3.1, P=not significant). Pair‐wise comparisons for means confirmed that patients admitted to the ICU were significantly more likely to be prescribed parenteral thiamine than patients admitted to any other service; psychiatry inpatients were the least likely to be prescribed parenteral thiamine (P<0.001).
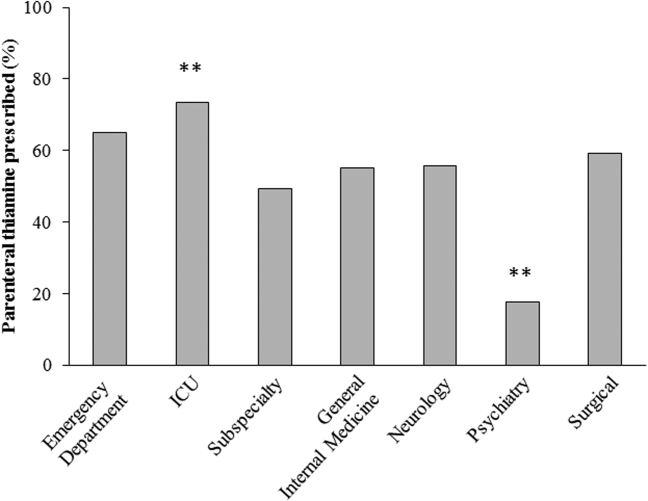
A post hoc analysis was used to determine the service‐specific effect of hospital‐wide protocols promoting parenteral prescribing. Protocols were associated with significantly higher rates of parenteral prescribing for patients receiving care under all services (ICU, z=3.76; medical subspecialties, z=16.07; general medicine, z=15.40; neurology, z=7.02; surgery, z=13.19; P<0.001), except psychiatry (z=2.0, P=not significant) and those within emergency departments (z=2.05, P=not significant).
In contrast to the differences in the rates of parenteral prescribing across centers, quantitative review of the doses and schedule of thiamine administration revealed a near‐universal approach to prescribing. Overall, 92.7% (45,266/48,806) of prescriptions were for 100 mg of thiamine (z=188.8, P<0.001); 74.6% (33,551/44,948) of prescriptions were ordered once daily (z=104.5, P<0.001). Thiamine was more likely to be prescribed via the parenteral route when prescribed in doses of 100 mg (57.6%, z=32.5, P<0.001) or >200 mg (76.1%, z=25.51, P<0.001), or when ordered as single doses (81.5%, z=64.86, P<0.001) (Figure 4).
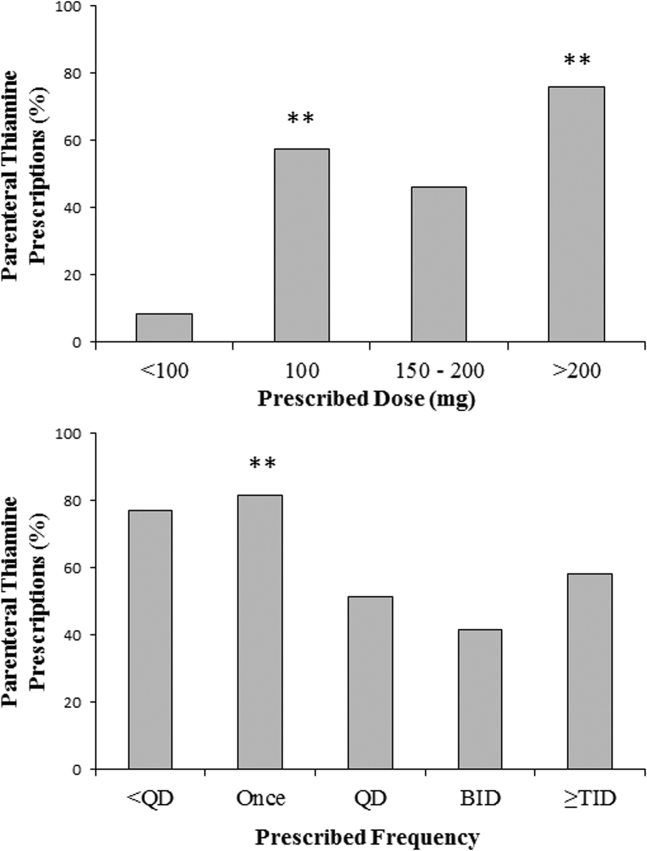
DISCUSSION
The causal relationship between thiamine deficiency and WE has been recognized since 1941,[28] with the importance of parenteral thiamine replacement in vulnerable populations emphasized in numerous case series,[29, 30] population‐based studies,[14, 31, 32] and consensus guidelines.[15, 20] Consistent with guideline recommendations, thiamine was significantly more likely to be prescribed via the parenteral route across a large network of geographically distributed Canadian academic healthcare centers. Somewhat surprisingly, however, oral thiamine accounted for 42.4% of all prescriptions, and a significant majority of doses prescribed to the over 30,000 patients studied. These findings confirm that oral thiamine continues to be prescribed to inpatients within Canadian academic hospitals.
The critical importance of parenteral thiamine administration for the treatment and prevention of WE is supported by an understanding of the pathophysiology of this disease. Wernicke's encephalopathy results from brain‐thiamine deficiency, leading to a cellular energy deficit, focal acidosis, regional increases in glutamate, and cell death.[20, 33, 34] Serum thiamine crosses the blood brain barrier through active (transporter‐mediated) and passive (concentration‐dependent) means.[20] It is therefore possible to drive thiamine into the central nervous system by establishing high serum thiamine levels. Interestingly, forward linear regression suggested that the centers prescribing the largest number of doses were less likely to prescribe parenteral thiamine. This may reflect a misguided preference for the use of prolonged/frequent courses of oral thiamine for the prevention and/or treatment of thiamine deficiency in hospitalized patients. Oral absorption of thiamine occurs within the duodenum by a rate‐limited process, with maximum absorption of 4.5 mg per dose.[20] This rate may be higher in healthy individuals, arguing for passive and active transport across enterocytes.[35] In sick individuals, however, oral absorption cannot be relied upon to attain the high serum thiamine levels necessary to reverse the effects of deficiency, exemplifying the importance of parenteral administration in hospitalized patients.
Protocols promoting parenteral administration of thiamine were associated with higher rates of parenteral prescribing across centers, and may represent an effective and convenient means of effecting prescriber behaviors. Efforts must be made, however, to identify additional barriers limiting parenteral thiamine prescribing within hospitals. One such barrier relates to the identification of at‐risk individuals. Despite advances in biochemical measures quantifying thiamine deficiency[36] and neuroimaging studies confirming changes within the brains of affected patients,[37] WE remains a clinical diagnosis. As such, clinical criteria have been proposed to identify those at risk of deficiency, with an emphasis on detection of WE in patients with alcohol‐use disorders. Specifically, guidelines from the Royal College of Physicians advocate that WE be considered in patients with evidence of alcohol misuse, and 1 of the following: (1) acute confusion, (2) decreased consciousness, (3) ataxia, (4) ophthalmoplegia, (5) memory disturbances, and (6) hypothermia with hypotension.[20] The European Federation of Neurological Sciences broadens the clinical criteria to include patients with and without alcohol‐use disorders, encouraging diagnosis and treatment in individuals with any 2 of the following: (1) dietary deficiencies, (2) oculomotor abnormalities, (3) cerebellar dysfunction, and (4) altered mental status or mild memory impairment.[15] Once identified, it remains imperative that patients receive appropriate therapies to reverse thiamine deficiency. To this end, the results of the present study may be used to identify potential inpatient populations at risk of undertreatment.
Psychiatric patients were the least likely to be prescribed parenteral thiamine, regardless of whether protocols promoting parenteral prescribing were in place within the study hospital. This observation is concerning, as psychiatric inpatients may be at risk of thiamine deficiency due to a confluence of factors related to mental illness (ie, malnutrition associated with eating disorders, substance abuse)[21, 38] and increased rates of comorbid physical illnesses.[39] Low rates of parenteral prescribing may reflect a number of service‐specific (ie, decreased ease of administration of parenteral medications) and patient‐specific factors (ie, challenges of maintaining intravenous catheter access in acutely ill psychiatric patients) that are not adequately addressed by hospital‐wide protocols. Alternatively, lower rates of parenteral prescribing may reflect a systematic preference for the use of oral thiamine in a patient population perceived to be at lower risk of thiamine deficiency. Although oral thiamine has been shown to be effective in correcting thiamine deficiency in a group of community‐dwelling elderly patients without clinical symptoms or signs suggesting WE (ie, subclinical thiamine deficiency),[40] it remains to be determined whether a similar treatment strategy can be endorsed in select inpatients with subclinical deficiency, in whom oral absorption and compliance can be reasonably assured.
Randomized control trial evidence supporting specific doses and schedules for administration of parenteral thiamine is not available.[24, 25] Accordingly, uncertainty exists concerning the doses and frequency of administration of thiamine required to prevent or reverse suspected WE. Despite this uncertainty, the dose and schedule of thiamine prescribed in our study population was remarkably uniform, with thiamine most commonly prescribed in 100‐mg doses once daily. Similar findings were reported in a retrospective study considering thiamine prescribing to 217 patients with alcohol‐use disorders admitted to an urban US teaching hospital: 76.9% of inpatients were prescribed 100‐mg daily doses of thiamine.[19] Interestingly, no differences in prescribing behaviors were noted when high‐risk patients presenting with alcohol intoxication, withdrawal, or delirium tremens were considered separately, suggesting that patient‐specific factors had little impact on the dosing strategy endorsed by clinicians.[19]
Although pervasive, the provision of 100 mg of thiamine daily is not supported by biochemical or clinical studies.[27] On the contrary, clinical‐pathological studies suggest that doses of thiamine between 50 and 100 mg per day may not be sufficient to reverse clinical signs or prevent death in patients with WE, whereas doses up to 250 mg may not reverse the biochemical abnormalities associated with clinically significant deficiency.[12, 41, 42] Such rationale is cited in support of consensus recommendations promoting administration of high doses of parenteral thiamine for the treatment of WE (200 or 500 mg, provided 3 times daily).[15, 20] As this project illustrates, however, rational, well‐justified guidelines are not enough to transform clinical practice.
The limitations of consensus guidelines and hospital‐specific protocols promoting thiamine prescribing have been explored in other specialty[43] and hospital environments.[44, 45] These studies offer several insights into the factors that may contribute to the disparity between recommended and real‐world practices, including continued under‐recognition of malnourished hospitalized patients at risk of thiamine deficiency,[1, 45, 46, 47] variations in consensus‐based guidelines governing thiamine prescribing,[15, 20] and challenges in communication of protocol rationales and recommendations.[44, 48] Together, these findings exemplify the need for additional strategies aimed at improving parenteral prescribing in vulnerable hospitalized populations. The proliferation of computerized physician order entry and clinical decision support systems may offer the opportunity to effect prescribing behaviors, with the possibility of specifying routes and doses of thiamine administration in accordance with guidelines,[49] without the requirement for dedicated monitoring and personnel‐driven interventions.
Limitations
By design, our study was limited to the assessment of thiamine‐prescribing data obtained directly from computerized pharmacy information systems. Consequently, only the minimum details required to safely prescribe a medication were captured. As a result, we were unable to evaluate the potential effect of patient‐specific factors (including clinical diagnosis) on prescriber behaviors. Thus, it remains possible that prescribing behaviors varied according to perceived patient risks in our study population. An additional limitation relates to the generalizability of results beyond academic hospitals in Canada. We suggest, however, that potential concerns relating to generalizability are counterbalanced by 2 advantages inherent within our study population. The first is that the majority of community‐based clinicians are trained within university‐affiliated hospitals. As a result, prescribing behaviors measured in these training centers should reflect optimal behaviors within downstream networks of community hospitals. The second is that the recruitment of hospitals funded by a universal single‐payer served to minimize variability in prescribing behaviors attributable to prescriber and patient concerns regarding reimbursement, thus providing a more accurate assessment of prescriber behaviors based on clinical evidence, independent of financial factors.
Acknowledging these limitations, we assert that parenteral administration of thiamine remains the best means of rapidly correcting thiamine deficiency, and should be considered for the treatment of clinically relevant thiamine deficiency in hospitalized patients. This recommendation effectively balances the potentially deleterious consequences of undertreatment of thiamine deficiency, with the favorable risk‐ and cost‐profile associated with the administration of parenteral thiamine.[15, 20, 23, 27, 50, 51]
CLINICAL AND RESEARCH IMPLICATIONS
In an era of overuse of vitamin supplementation,[52] it is increasingly important for healthcare providers to recognize not only when vitamin supplementation is required, but also how replacement therapies should be delivered. As shown in this study, protocols promoting the use of parenteral thiamine may improve overall compliance with recommendations. However, additional strategies are required to further improve rates of parenteral prescribing to hospitalized patients at risk of thiamine deficiency.
Acknowledgements
The authors are grateful for the contributions of support staff within local hospital pharmacy and information technology departments who made collection of these data possible. Dr. David F. Tang‐Wai reviewed an earlier draft of the manuscript and provided useful comments for which we are grateful.
Disclosures: G. S. Day developed the study concept and methods for implementation, and was primarily responsible for acquisition, analysis, and interpretation of data, as well as drafting, revision, and finalization of the manuscript. G. S. Day had full access to all study data, and takes responsibility for the integrity of the data and the accuracy of the analysis and interpretation. S. Ladak participated in the development of methods, acquisition of data, and revision and finalization of the manuscript. K. Curley participated in the development of methods, acquisition of data, and revision and finalization of the manuscript. N. A. S. Farb participated in analysis of data, and revision and finalization of the manuscript. P. Masiowski participated in acquisition of data, and revision and finalization of the manuscript. T. Pringsheim participated in acquisition of data, and revision and finalization of the manuscript. M. Ritchie participated in acquisition of data, and revision and finalization of the manuscript. A. Cheung participated in acquisition of data, and revision and finalization of the manuscript. S. Jansen participated in acquisition of data, and revision and finalization of the manuscript. L. Methot participated in acquisition of data, and revision and finalization of the manuscript. H. L. Neville participated in acquisition of data, and revision and finalization of the manuscript. D. Bates participated in acquisition of data, and revision and finalization of the manuscript. D. Lowe participated in acquisition of data, and revision and finalization of the manuscript. N. Fernandes participated in acquisition of data, and revision and finalization of the manuscript. A. Ferland participated in acquisition of data, and revision and finalization of the manuscript. C. M. del Campo acted as primary supervisor for this project, and approved study design and methods. He assisted with interpretation of data, and revision and finalization of the manuscript. Preliminary data were reported in abstract form at the 2013 Annual Meeting of the American Academy of Neurology (March 2013, San Diego, CA) and the 2014 Annual Meeting of the Canadian Neurological Sciences Foundation (June 2014, Banff, AB, Canada). No sources of funding are reported for this study. The authors report no conflicts of interest.
- , , , , . Nutrition in the hospitalized patient. J Hosp Med. 2013;8(1):52–58.
- , . The impact of malnutrition on morbidity, mortality, length of hospital stay and costs evaluated through a multivariate model analysis. Clin Nutr. 2003;22(3):235–239.
- , , , et al. Prevalence of malnutrition on admission to four hospitals in England. The Malnutrition Prevalence Group. Clin Nutr. 2000;19(3):191–195.
- . Die akute haemorrhagische polioencephalitis superior: Kassel, Germany; Fisher; 1881.
- . Diseases of the Nervous System. 5th ed. London: Oxford University Press; 1955.
- , , . Wernicke's encephalopathy. A clinical and pathological study of 28 autopsied cases. Arch Neurol. 1961;4:510–519.
- , , , . Diagnosis by treatment. J Hosp Med. 2011;6(9):546–549.
- , , . The Wernicke‐Korsakoff syndrome. A clinical and pathological study of 245 patients, 82 with post‐mortem examinations. Contemp Neurol Ser. 1971;7:1–206.
- , , , . Operational criteria for the classification of chronic alcoholics: identification of Wernicke's encephalopathy. J Neurol Neurosurg Psychiatry. 1997;62(1):51–60.
- . The incidence of Wernicke's encephalopathy in Australia–a neuropathological study of 131 cases. J Neurol Neurosurg Psychiatry. 1983;46(7):593–598.
- . Wernicke's encephalopathy: a more common disease than realised. A neuropathological study of 51 cases. J Neurol Neurosurg Psychiatry. 1979;42:226–231.
- , , . Clinical signs in the Wernicke‐Korsakoff complex: a retrospective analysis of 131 cases diagnosed at necropsy. J Neurol Neurosurg Psychiatry. 1986;49:341–345.
- , , . Autopsy prevalence of Wernicke's encephalopathy in alcohol‐related disease. S Afr Med J. 1996;86(9):1110–1112.
- , . Increasing incidence of Korsakoff's psychosis in the east end of Glasgow. Alcohol Alcohol. 1997;32(3):281–285.
- , , , et al. EFNS guidelines for diagnosis, therapy and prevention of Wernicke encephalopathy. Eur J Neurol. 2010;17(12):1408–1418.
- , , . A survey of the current clinical practice of psychiatrists and accident and emergency specialists in the United Kingdom concerning vitamin supplementation for chronic alcohol misusers. Alcohol Alcohol. 1999;34(6):862–867.
- , , . Thiamine deficiency in head injury: a missed insult? Alcohol Alcohol. 1997;32(4):493–500.
- . Thiamine (vitamin B1) deficiency and associated brain damage is still common throughout the world and prevention is simple and safe! Eur J Neurol. 2006;13(10):1078–1082.
- , , . Prescribing thiamine to inpatients with alcohol use disorders: how well are we doing? J Addict Med. 2014;8(1):1–5.
- , , , ; Royal College of Physicians, London. The Royal College of Physicians report on alcohol: guidelines for managing Wernicke's encephalopathy in the accident and Emergency Department. Alcohol Alcohol. 2002;37(6):513–521.
- , , . B Vitamin deficiency and neuropsychiatric syndromes in alcohol misuse. Alcohol Alcohol. 1998;33(4):317–336.
- , . Five things to know about Wernicke's Encephalopathy: a medical emergency. CMAJ. 2013;186(8):E295.
- , , . Wernicke‐Korsakoff‐syndrome: under‐recognized and under‐treated. Psychosomatics. 2012;53(6):507–516.
- , , , , . Thiamine for Wernicke‐Korsakoff Syndrome in people at risk from alcohol abuse. Cochrane Database Syst Rev. 2004;(1):CD004033.
- , , , , . Thiamine for prevention and treatment of Wernicke‐Korsakoff Syndrome in people who abuse alcohol. Cochrane Database Syst Rev. 2013;7:CD004033.
- , , . Thiamine Treatment and working memory function of alcohol‐dependent people: preliminary findings. Alcohol Clin Exp Res. 2001;25(1):112–116.
- , , , . Myths and misconceptions of Wernicke's encephalopathy: what every emergency physician should know. Ann Emerg Med. 2007;50(6):715–721.
- , . Wernicke's Encephalopathy: The clinical features and their probable relationship to vitamin B deficiency. Q J Med. 1941;10:(37):41–64.
- , , . Patterns of 35S‐thiamine hydrochloride absorption in the malnourished alcoholic patient. J Lab Clin Med. 1970;76(1):34–45.
- , , , . Thiamine propyl disulfide: absorption and utilization. Ann Intern Med. 1971;74(4):529–534.
- , . Parenteral thiamine and Wernicke's encephalopathy: the balance of risks and perception of concern. Alcohol Alcohol. 1997;32(3):207–209.
- , , , et al. Efficacy of vitamin supplementation in chronic alcoholics undergoing detoxification. Alcohol Alcohol Suppl. 1983;18:157–166.
- , , . Mechanisms of neuronal cell death in Wernicke's encephalopathy. Metab Brain Dis. 1998;13(2):97–122.
- , , , . Brain lactate synthesis in thiamine deficiency: a re‐evaluation using 1H‐13C nuclear magnetic resonance spectroscopy. J Neurosci Res. 2005;79(1‐2):33–41.
- , , . Pharmacokinetics of high‐dose oral thiamine hydrochloride in healthy subjects. BMC Clin Pharmacol. 2012;12(4):4.
- , , , et al. Simultaneous liquid chromatographic assessment of thiamine, thiamine monophosphate and thiamine diphosphate in human erythrocytes: a study on alcoholics. J Chromatogr B Analyt Technol Biomed Life Sci. 2003;789(2):355–363.
- , . Neuroimaging findings in acute Wernicke's encephalopathy: review of the literature. AJR Am J Roentgenol. 2009;192(2):501–508.
- , , , , . Beyond alcoholism: Wernicke‐Korsakoff syndrome in patients with psychiatric disorders. Cogn Behav Neurol. 2011;24(4):209–216.
- , , , , . Mental health status and gender as risk factors for onset of physical illness over 10 years. J Epidemiol Community Health. 2014;68(1):64–70.
- , , , , . The response to treatment of subclinical thiamine deficiency in the elderly. Am J Clin Nutr. 1997;66(4):925–928.
- , , . Thiamin and thiamin phosphate ester deficiency assessed by high performance liquid chromatography in four clinical cases of Wernicke's encephalopathy. Alcohol Clin Exp Res. 1993;17:712–716.
- . Prevention and treatment of Wernicke‐Korsakoff syndrome. Alcohol Alcohol Suppl. 2000;35(1):19–20.
- , , . Pabrinex prescribing in Scottish Emergency Departments. Poster presented at: Inaugural Scientific Conference of the College of Emergency Medicine; May 14–16, 2008; London, United Kingdom.
- , , , , , . Pharmacy‐based intervention in Wernicke's encephalopathy. Psychiatrist. 2010;34(6):234–238.
- , , . Time to act on the inadequate management of Wernicke's encephalopathy in the UK. Alcohol alcohol. Jan‐Feb 2013;48(1):4–8.
- , , , , . Malnutrition is prevalent in hospitalized medical patients: are housestaff identifying the malnourished patient? Nutrition. Apr 2006;22(4):350–354.
- , , , . Malnutrition among Hospitalized‐Patients ‐ a Problem of Physician Awareness. Archives of Internal Medicine. Aug 1987;147(8):1462–1465.
- , . BNF recommendations for the treatment of Wernicke's encephalopathy: lost in translation? Alcohol Alcohol. 2013;48(4):514–515.
- , , , , , . Reduction in medication errors in hospitals due to adoption of computerized provider order entry systems. J Am Med Inform Assoc. 2013;20(3):470–476.
- , . Is intravenous thiamine safe? Am J Emerg Med. 1992;10(2):165.
- , , . A toxicity study of parenteral thiamine hydrochloride. Ann Emerg Med. 1989;18(8):867–870.
- , , , , . Enough is enough: Stop wasting money on vitamin and mineral supplements. Ann Intern Med. 2013;159:850–851.
Thiamine pyrophosphate, the biologically active form of thiamine (vitamin B1), is an essential cofactor for the aerobic breakdown of glucose, with daily requirements related to total caloric intake and the proportion of calories provided as carbohydrates. Patients presenting to the hospital are at risk of thiamine deficiency due to a preponderance of factors including baseline poor nutritional status,[1, 2, 3] diminished intake (associated with illness prodrome), increased metabolic demand (eg, occurring with sepsis, malignancy, surgery, pregnancy), and resuscitation with intravenous glucose‐containing fluids. Without thiamine pyrophosphate, glucose is metabolized through less‐efficient anaerobic pathways, producing lactic acid as a by‐product. The brain uses glucose as its main source of energy and is susceptible to injury due to acute thiamine deficiency. Petechial hemorrhage and demyelination within periventricular structures (thalami, mammillary bodies, ocular motor nuclei, and cerebellar vermis) account for the classical triad of Wernicke's encephalopathy (WE), including confusion/encephalopathy, ophthalmoplegia, and ataxia.[4, 5, 6, 7] Additional symptoms and signs are reported in WE, implicating more widespread consequences of thiamine deficiency.[6, 7, 8, 9]
Wernicke's encephalopathy remains an historically well‐documented illness,[4, 5] of continued relevance to hospitalist practice. Pathologic changes diagnostic of WE are reported in 1.9% to 2.8% of all patients at autopsy,[6, 10] and in as many as 20% of hospitalized patients following unexplained death.[11, 12] In cases of alcohol‐related death, the incidence may be as high as 59%.[13] Most troubling is the observation that the diagnosis is frequently missed in clinical settings,[14, 15, 16, 17, 18, 19] with devastating results. Case series report mortality in upward of 20% of patients with untreated or undertreated WE, with 85% of survivors developing Korsakoff syndromethe chronic form of WE.[8, 20, 21] The clinical diagnosis may be missed in as many as 94% of nonalcoholic patients, including patients admitted to surgical (ie, postgastrointestinal surgery), obstetrical (ie, hyperemesis gravidarum), psychiatric (ie, eating disorders), general internal medicine (ie, cancer‐associated cachexia and related complications), and subspecialty services (ie, dialysis and renal diseases).[15]
Recognition of WE is critical, as effective intervention and treatment is possible. For hospitalized patients, intervention should prioritize parenteral administration of thiamine[22, 23] to circumvent problems with oral absorption common in the medically ill, and to maximize serum thiamine concentrations, promoting passive (concentration‐dependent) movement of thiamine across the blood brain barrier. In lieu of evidence from randomized controlled trials supporting specific doses and schedules for thiamine administration,[24, 25] this recommendation relies on ample experiential evidence emphasizing the importance of higher doses of parenteral thiamine (in excess of 200 mg provided 3 times daily) for the prevention/treatment of WE.[12, 15, 20, 26, 27]
It remains to be determined whether the evidence emphasizing parenteral prescribing has affected current practice within inpatient populations. To address this need, we sought to quantify thiamine‐prescribing practices within Canadian university‐affiliated hospitals across a 2‐year period. We hypothesized that thiamine would be prescribed more frequently via the parenteral route, in line with published guidelines promoting parenteral administration of thiamine.[15, 20]
METHODS
Study Design and Recruitment
A retrospective observational study was used to evaluate thiamine prescribing within Canadian academic hospitals between January 2010 and December 2011. University‐affiliated institutions with English‐speaking postgraduate (ie, residency) adult medicine programs were eligible to participate. Participating centers all utilized computerized pharmacy information systems, allowing anonymized retrospective data to be reported for participants. Study objectives, methods, and procedures were approved by institutional research ethics boards at participating centers.
Data were extracted for the study period from computerized pharmacy information systems recording prescriptions processed by centralized hospital pharmacies. Thiamine prescribed as part of total parenteral nutrition was excluded from analysis, as prescribing was automated in most centers. Participants were assigned a randomized study number linked to prescription information specifying the prescribed dose of thiamine, route of administration (oral: per os, nasogastric tube, orogastric tube, gastric tube; versus parenteral: intravenous, intramuscular), frequency of dosing (eg, daily, twice daily, 3 times daily), and start/end dates. Complete data were available from 12 hospitals (12/14, 85.7%). One hospital was missing data concerning the frequency of prescribing. One hospital provided only summary data, specifying the number of prescriptions issued by route and dose. Information concerning the prescribing service was captured within records from 7 hospitals (7/14, 50.0%), allowing prescriptions to be stratified by prescribing services. Subspecialty designations were simplified to emergency department, intensive care unit (ICU) (including medical, surgical, and trauma ICUs), medical subspecialty (ie, cardiology, endocrinology, gastroenterology, medical oncology, rheumatology), general internal medicine, neurology, psychiatry, and surgical (ie, general surgery, cardiac surgery, neurosurgery, orthopedics, gynecology) services.
Statistical Analysis
Prescriptions for thiamine were summarized across each center specifying the route of administration (all prescriptions and initial prescription). Prescribing behaviors across centers were summarized using descriptive statistics. Differences in parenteral versus oral prescribing were evaluated using the z test for the difference between weighted averages, assuming a null hypothesis of equal prescribing (ie, 50% parenteral and 50% oral) within categories (i.e., all prescriptions, initial prescriptions, total doses).
Factors that may affect rates of parenteral prescribing were considered across centers. Hospitals were stratified based upon the presence of protocols promoting parenteral thiamine prescribing for the treatment of patients at risk of deficiency. The effect of protocols on prescribing behaviors was evaluated by comparing prescribing practices in centers with and without protocols using the z test for the difference between proportions. Forward linear regression was used to evaluate the correlation between the number of prescriptions and/or doses prescribed within centers, and the rates of parenteral prescribing. Rates of parenteral prescribing across hospital services were compared using pairwise comparisons.
Statistical analyses were completed using IBM SPSS Statistics 20 (IBM Corp., Armonk, NY). Significance was defined as P<0.05, using P values corrected for the total number of comparisons (Bonferroni correction), equivalent to a single‐comparison P value<0.001.
RESULTS
Thirteen university‐affiliated academic centers met inclusion criterion and were invited to participate. Data were obtained from 9 organizations (9/13, 69%), encompassing 14 geographically distributed academic hospitals (Figure 1). Centers that declined to participate cited a lack of comprehensive electronic databases tracking prescriptions as the main barrier. One of the 14 participating hospitals represented a network of affiliated health centers (site 2), rendering it an outlier in terms of total number of doses prescribed (>3 standard deviations above the mean). This affiliated network was unable to provide prescribing data separated by hospital and was excluded from analyses.
In total, data were collected corresponding to 48,806 prescriptions for 209,762 doses of thiamine, provided to 32,213 patients (Table 1). Prescriptions were divided by route of administration (parenteral vs oral) and prescribing practices summarized across centers. Rates of parenteral prescribing varied widely between centers (maximum=82.0%, minimum=33.9%). Overall, however, parenteral thiamine was prescribed more frequently than oral thiamine, accounting for 57.6% of all prescriptions (z=33.59, P<0.001) and 59.2% of initial prescriptions issued to patients (z=168.93, P<0.001). Oral thiamine constituted a significant majority of the total doses prescribed (68.4%, z=168.9; P<0.001).
| All Prescriptions | First Prescriptions | Doses | ||||||||
|---|---|---|---|---|---|---|---|---|---|---|
| Hospital | Total | Parenteral % | Oral % | Total | Parenteral % | Oral % | Total | Parenteral % | Oral % | |
| ||||||||||
| 1A* | 7,499 | 66.42 | 33.58 | 6,189 | 66.41 | 33.59 | 36,032 | 26.60 | 73.40 | |
| 1B* | 4,372 | 70.38 | 29.62 | 2,314 | 78.69 | 21.31 | 17,133 | 27.61 | 72.39 | |
| 1C* | 5,805 | 57.64 | 42.36 | 4,742 | 58.10 | 41.90 | 30,910 | 17.12 | 82.88 | |
| 3* | 3,519 | 45.27 | 54.73 | 2,236 | 59.57 | 40.43 | 8,037 | 52.37 | 47.63 | |
| 4* | 5,322 | 60.50 | 39.50 | 2,900 | 57.83 | 42.17 | 22,159 | 44.49 | 55.51 | |
| 5 | 3,857 | 46.85 | 53.15 | 2,858 | 56.37 | 43.63 | 16,035 | 33.51 | 66.49 | |
| 6A* | 6,105 | 55.46 | 44.54 | 2,907 | 55.04 | 44.96 | 15,947 | 44.22 | 55.78 | |
| 6B | 3,127 | 55.39 | 44.61 | 1,710 | 64.62 | 35.38 | 9,048 | 45.11 | 54.89 | |
| 6C* | 2,134 | 55.62 | 44.38 | 1,499 | 56.24 | 43.76 | 10,327 | 32.33 | 67.67 | |
| 6D | 617 | 35.82 | 64.18 | 505 | 34.65 | 65.35 | 2,647 | 35.70 | 64.30 | |
| 7* | 2,467 | 82.00 | 18.00 | 1,373 | 87.40 | 12.60 | 9,924 | 59.06 | 40.94 | |
| 8 | 1,122 | 50.98 | 49.02 | 694 | 58.79 | 41.21 | 3,048 | 64.73 | 35.27 | |
| 9 | 2,860 | 33.85 | 66.15 | 2,286 | 19.34 | 80.66 | 28,515 | 14.73 | 85.27 | |
| Total | 48,806 | 57.60 | 42.40 | 32,213 | 59.23 | 40.77 | 209,762 | 31.56 | 68.44 | |
The factors associated with higher rates of parenteral prescribing were further considered. Rates of parenteral prescribing were compared between centers with and without published guidelines governing thiamine usage. Eight of 13 hospitals (61.5%) had hospital‐wide protocols that promoted initial administration of thiamine via the parenteral route in patients at risk of deficiency. The presence of a protocol was associated with significantly higher overall rates of parenteral prescribing (61.3% with protocol, 45.7% without protocol; z=29.5; P<0.001). Linear regression revealed no predictive relationship between the number of prescriptions issued and the proportion of parenteral thiamine prescribed across centers (total prescriptions, standard 0.38, P=0.20; Figure 2). A negative correlation was observed between the proportion of doses prescribed via the parenteral route and the number of total doses prescribed (standard =0.61, P=0.03), suggesting that centers prescribing the greatest numbers of doses were less likely to prescribe parenteral thiamine.
The effect of the inpatient practice environment on prescribing behavior was considered across the 7 centers for which service‐specific prescribing data were provided (Figure 3). Patients receiving care within emergency departments or intensive care, general medical or surgical units were more likely to be prescribed parenteral thiamine (z>3.0, P<0.001), whereas patients admitted to psychiatry units were more likely to be prescribed thiamine via the oral route (z=23.7, P<0.001). No differences were observed between rates of parenteral and oral prescribing for patients admitted under medical subspecialty (z=0.6, P=not significant) and neurology services (z=3.1, P=not significant). Pair‐wise comparisons for means confirmed that patients admitted to the ICU were significantly more likely to be prescribed parenteral thiamine than patients admitted to any other service; psychiatry inpatients were the least likely to be prescribed parenteral thiamine (P<0.001).
A post hoc analysis was used to determine the service‐specific effect of hospital‐wide protocols promoting parenteral prescribing. Protocols were associated with significantly higher rates of parenteral prescribing for patients receiving care under all services (ICU, z=3.76; medical subspecialties, z=16.07; general medicine, z=15.40; neurology, z=7.02; surgery, z=13.19; P<0.001), except psychiatry (z=2.0, P=not significant) and those within emergency departments (z=2.05, P=not significant).
In contrast to the differences in the rates of parenteral prescribing across centers, quantitative review of the doses and schedule of thiamine administration revealed a near‐universal approach to prescribing. Overall, 92.7% (45,266/48,806) of prescriptions were for 100 mg of thiamine (z=188.8, P<0.001); 74.6% (33,551/44,948) of prescriptions were ordered once daily (z=104.5, P<0.001). Thiamine was more likely to be prescribed via the parenteral route when prescribed in doses of 100 mg (57.6%, z=32.5, P<0.001) or >200 mg (76.1%, z=25.51, P<0.001), or when ordered as single doses (81.5%, z=64.86, P<0.001) (Figure 4).
DISCUSSION
The causal relationship between thiamine deficiency and WE has been recognized since 1941,[28] with the importance of parenteral thiamine replacement in vulnerable populations emphasized in numerous case series,[29, 30] population‐based studies,[14, 31, 32] and consensus guidelines.[15, 20] Consistent with guideline recommendations, thiamine was significantly more likely to be prescribed via the parenteral route across a large network of geographically distributed Canadian academic healthcare centers. Somewhat surprisingly, however, oral thiamine accounted for 42.4% of all prescriptions, and a significant majority of doses prescribed to the over 30,000 patients studied. These findings confirm that oral thiamine continues to be prescribed to inpatients within Canadian academic hospitals.
The critical importance of parenteral thiamine administration for the treatment and prevention of WE is supported by an understanding of the pathophysiology of this disease. Wernicke's encephalopathy results from brain‐thiamine deficiency, leading to a cellular energy deficit, focal acidosis, regional increases in glutamate, and cell death.[20, 33, 34] Serum thiamine crosses the blood brain barrier through active (transporter‐mediated) and passive (concentration‐dependent) means.[20] It is therefore possible to drive thiamine into the central nervous system by establishing high serum thiamine levels. Interestingly, forward linear regression suggested that the centers prescribing the largest number of doses were less likely to prescribe parenteral thiamine. This may reflect a misguided preference for the use of prolonged/frequent courses of oral thiamine for the prevention and/or treatment of thiamine deficiency in hospitalized patients. Oral absorption of thiamine occurs within the duodenum by a rate‐limited process, with maximum absorption of 4.5 mg per dose.[20] This rate may be higher in healthy individuals, arguing for passive and active transport across enterocytes.[35] In sick individuals, however, oral absorption cannot be relied upon to attain the high serum thiamine levels necessary to reverse the effects of deficiency, exemplifying the importance of parenteral administration in hospitalized patients.
Protocols promoting parenteral administration of thiamine were associated with higher rates of parenteral prescribing across centers, and may represent an effective and convenient means of effecting prescriber behaviors. Efforts must be made, however, to identify additional barriers limiting parenteral thiamine prescribing within hospitals. One such barrier relates to the identification of at‐risk individuals. Despite advances in biochemical measures quantifying thiamine deficiency[36] and neuroimaging studies confirming changes within the brains of affected patients,[37] WE remains a clinical diagnosis. As such, clinical criteria have been proposed to identify those at risk of deficiency, with an emphasis on detection of WE in patients with alcohol‐use disorders. Specifically, guidelines from the Royal College of Physicians advocate that WE be considered in patients with evidence of alcohol misuse, and 1 of the following: (1) acute confusion, (2) decreased consciousness, (3) ataxia, (4) ophthalmoplegia, (5) memory disturbances, and (6) hypothermia with hypotension.[20] The European Federation of Neurological Sciences broadens the clinical criteria to include patients with and without alcohol‐use disorders, encouraging diagnosis and treatment in individuals with any 2 of the following: (1) dietary deficiencies, (2) oculomotor abnormalities, (3) cerebellar dysfunction, and (4) altered mental status or mild memory impairment.[15] Once identified, it remains imperative that patients receive appropriate therapies to reverse thiamine deficiency. To this end, the results of the present study may be used to identify potential inpatient populations at risk of undertreatment.
Psychiatric patients were the least likely to be prescribed parenteral thiamine, regardless of whether protocols promoting parenteral prescribing were in place within the study hospital. This observation is concerning, as psychiatric inpatients may be at risk of thiamine deficiency due to a confluence of factors related to mental illness (ie, malnutrition associated with eating disorders, substance abuse)[21, 38] and increased rates of comorbid physical illnesses.[39] Low rates of parenteral prescribing may reflect a number of service‐specific (ie, decreased ease of administration of parenteral medications) and patient‐specific factors (ie, challenges of maintaining intravenous catheter access in acutely ill psychiatric patients) that are not adequately addressed by hospital‐wide protocols. Alternatively, lower rates of parenteral prescribing may reflect a systematic preference for the use of oral thiamine in a patient population perceived to be at lower risk of thiamine deficiency. Although oral thiamine has been shown to be effective in correcting thiamine deficiency in a group of community‐dwelling elderly patients without clinical symptoms or signs suggesting WE (ie, subclinical thiamine deficiency),[40] it remains to be determined whether a similar treatment strategy can be endorsed in select inpatients with subclinical deficiency, in whom oral absorption and compliance can be reasonably assured.
Randomized control trial evidence supporting specific doses and schedules for administration of parenteral thiamine is not available.[24, 25] Accordingly, uncertainty exists concerning the doses and frequency of administration of thiamine required to prevent or reverse suspected WE. Despite this uncertainty, the dose and schedule of thiamine prescribed in our study population was remarkably uniform, with thiamine most commonly prescribed in 100‐mg doses once daily. Similar findings were reported in a retrospective study considering thiamine prescribing to 217 patients with alcohol‐use disorders admitted to an urban US teaching hospital: 76.9% of inpatients were prescribed 100‐mg daily doses of thiamine.[19] Interestingly, no differences in prescribing behaviors were noted when high‐risk patients presenting with alcohol intoxication, withdrawal, or delirium tremens were considered separately, suggesting that patient‐specific factors had little impact on the dosing strategy endorsed by clinicians.[19]
Although pervasive, the provision of 100 mg of thiamine daily is not supported by biochemical or clinical studies.[27] On the contrary, clinical‐pathological studies suggest that doses of thiamine between 50 and 100 mg per day may not be sufficient to reverse clinical signs or prevent death in patients with WE, whereas doses up to 250 mg may not reverse the biochemical abnormalities associated with clinically significant deficiency.[12, 41, 42] Such rationale is cited in support of consensus recommendations promoting administration of high doses of parenteral thiamine for the treatment of WE (200 or 500 mg, provided 3 times daily).[15, 20] As this project illustrates, however, rational, well‐justified guidelines are not enough to transform clinical practice.
The limitations of consensus guidelines and hospital‐specific protocols promoting thiamine prescribing have been explored in other specialty[43] and hospital environments.[44, 45] These studies offer several insights into the factors that may contribute to the disparity between recommended and real‐world practices, including continued under‐recognition of malnourished hospitalized patients at risk of thiamine deficiency,[1, 45, 46, 47] variations in consensus‐based guidelines governing thiamine prescribing,[15, 20] and challenges in communication of protocol rationales and recommendations.[44, 48] Together, these findings exemplify the need for additional strategies aimed at improving parenteral prescribing in vulnerable hospitalized populations. The proliferation of computerized physician order entry and clinical decision support systems may offer the opportunity to effect prescribing behaviors, with the possibility of specifying routes and doses of thiamine administration in accordance with guidelines,[49] without the requirement for dedicated monitoring and personnel‐driven interventions.
Limitations
By design, our study was limited to the assessment of thiamine‐prescribing data obtained directly from computerized pharmacy information systems. Consequently, only the minimum details required to safely prescribe a medication were captured. As a result, we were unable to evaluate the potential effect of patient‐specific factors (including clinical diagnosis) on prescriber behaviors. Thus, it remains possible that prescribing behaviors varied according to perceived patient risks in our study population. An additional limitation relates to the generalizability of results beyond academic hospitals in Canada. We suggest, however, that potential concerns relating to generalizability are counterbalanced by 2 advantages inherent within our study population. The first is that the majority of community‐based clinicians are trained within university‐affiliated hospitals. As a result, prescribing behaviors measured in these training centers should reflect optimal behaviors within downstream networks of community hospitals. The second is that the recruitment of hospitals funded by a universal single‐payer served to minimize variability in prescribing behaviors attributable to prescriber and patient concerns regarding reimbursement, thus providing a more accurate assessment of prescriber behaviors based on clinical evidence, independent of financial factors.
Acknowledging these limitations, we assert that parenteral administration of thiamine remains the best means of rapidly correcting thiamine deficiency, and should be considered for the treatment of clinically relevant thiamine deficiency in hospitalized patients. This recommendation effectively balances the potentially deleterious consequences of undertreatment of thiamine deficiency, with the favorable risk‐ and cost‐profile associated with the administration of parenteral thiamine.[15, 20, 23, 27, 50, 51]
CLINICAL AND RESEARCH IMPLICATIONS
In an era of overuse of vitamin supplementation,[52] it is increasingly important for healthcare providers to recognize not only when vitamin supplementation is required, but also how replacement therapies should be delivered. As shown in this study, protocols promoting the use of parenteral thiamine may improve overall compliance with recommendations. However, additional strategies are required to further improve rates of parenteral prescribing to hospitalized patients at risk of thiamine deficiency.
Acknowledgements
The authors are grateful for the contributions of support staff within local hospital pharmacy and information technology departments who made collection of these data possible. Dr. David F. Tang‐Wai reviewed an earlier draft of the manuscript and provided useful comments for which we are grateful.
Disclosures: G. S. Day developed the study concept and methods for implementation, and was primarily responsible for acquisition, analysis, and interpretation of data, as well as drafting, revision, and finalization of the manuscript. G. S. Day had full access to all study data, and takes responsibility for the integrity of the data and the accuracy of the analysis and interpretation. S. Ladak participated in the development of methods, acquisition of data, and revision and finalization of the manuscript. K. Curley participated in the development of methods, acquisition of data, and revision and finalization of the manuscript. N. A. S. Farb participated in analysis of data, and revision and finalization of the manuscript. P. Masiowski participated in acquisition of data, and revision and finalization of the manuscript. T. Pringsheim participated in acquisition of data, and revision and finalization of the manuscript. M. Ritchie participated in acquisition of data, and revision and finalization of the manuscript. A. Cheung participated in acquisition of data, and revision and finalization of the manuscript. S. Jansen participated in acquisition of data, and revision and finalization of the manuscript. L. Methot participated in acquisition of data, and revision and finalization of the manuscript. H. L. Neville participated in acquisition of data, and revision and finalization of the manuscript. D. Bates participated in acquisition of data, and revision and finalization of the manuscript. D. Lowe participated in acquisition of data, and revision and finalization of the manuscript. N. Fernandes participated in acquisition of data, and revision and finalization of the manuscript. A. Ferland participated in acquisition of data, and revision and finalization of the manuscript. C. M. del Campo acted as primary supervisor for this project, and approved study design and methods. He assisted with interpretation of data, and revision and finalization of the manuscript. Preliminary data were reported in abstract form at the 2013 Annual Meeting of the American Academy of Neurology (March 2013, San Diego, CA) and the 2014 Annual Meeting of the Canadian Neurological Sciences Foundation (June 2014, Banff, AB, Canada). No sources of funding are reported for this study. The authors report no conflicts of interest.
- , , , , . Nutrition in the hospitalized patient. J Hosp Med. 2013;8(1):52–58.
- , . The impact of malnutrition on morbidity, mortality, length of hospital stay and costs evaluated through a multivariate model analysis. Clin Nutr. 2003;22(3):235–239.
- , , , et al. Prevalence of malnutrition on admission to four hospitals in England. The Malnutrition Prevalence Group. Clin Nutr. 2000;19(3):191–195.
- . Die akute haemorrhagische polioencephalitis superior: Kassel, Germany; Fisher; 1881.
- . Diseases of the Nervous System. 5th ed. London: Oxford University Press; 1955.
- , , . Wernicke's encephalopathy. A clinical and pathological study of 28 autopsied cases. Arch Neurol. 1961;4:510–519.
- , , , . Diagnosis by treatment. J Hosp Med. 2011;6(9):546–549.
- , , . The Wernicke‐Korsakoff syndrome. A clinical and pathological study of 245 patients, 82 with post‐mortem examinations. Contemp Neurol Ser. 1971;7:1–206.
- , , , . Operational criteria for the classification of chronic alcoholics: identification of Wernicke's encephalopathy. J Neurol Neurosurg Psychiatry. 1997;62(1):51–60.
- . The incidence of Wernicke's encephalopathy in Australia–a neuropathological study of 131 cases. J Neurol Neurosurg Psychiatry. 1983;46(7):593–598.
- . Wernicke's encephalopathy: a more common disease than realised. A neuropathological study of 51 cases. J Neurol Neurosurg Psychiatry. 1979;42:226–231.
- , , . Clinical signs in the Wernicke‐Korsakoff complex: a retrospective analysis of 131 cases diagnosed at necropsy. J Neurol Neurosurg Psychiatry. 1986;49:341–345.
- , , . Autopsy prevalence of Wernicke's encephalopathy in alcohol‐related disease. S Afr Med J. 1996;86(9):1110–1112.
- , . Increasing incidence of Korsakoff's psychosis in the east end of Glasgow. Alcohol Alcohol. 1997;32(3):281–285.
- , , , et al. EFNS guidelines for diagnosis, therapy and prevention of Wernicke encephalopathy. Eur J Neurol. 2010;17(12):1408–1418.
- , , . A survey of the current clinical practice of psychiatrists and accident and emergency specialists in the United Kingdom concerning vitamin supplementation for chronic alcohol misusers. Alcohol Alcohol. 1999;34(6):862–867.
- , , . Thiamine deficiency in head injury: a missed insult? Alcohol Alcohol. 1997;32(4):493–500.
- . Thiamine (vitamin B1) deficiency and associated brain damage is still common throughout the world and prevention is simple and safe! Eur J Neurol. 2006;13(10):1078–1082.
- , , . Prescribing thiamine to inpatients with alcohol use disorders: how well are we doing? J Addict Med. 2014;8(1):1–5.
- , , , ; Royal College of Physicians, London. The Royal College of Physicians report on alcohol: guidelines for managing Wernicke's encephalopathy in the accident and Emergency Department. Alcohol Alcohol. 2002;37(6):513–521.
- , , . B Vitamin deficiency and neuropsychiatric syndromes in alcohol misuse. Alcohol Alcohol. 1998;33(4):317–336.
- , . Five things to know about Wernicke's Encephalopathy: a medical emergency. CMAJ. 2013;186(8):E295.
- , , . Wernicke‐Korsakoff‐syndrome: under‐recognized and under‐treated. Psychosomatics. 2012;53(6):507–516.
- , , , , . Thiamine for Wernicke‐Korsakoff Syndrome in people at risk from alcohol abuse. Cochrane Database Syst Rev. 2004;(1):CD004033.
- , , , , . Thiamine for prevention and treatment of Wernicke‐Korsakoff Syndrome in people who abuse alcohol. Cochrane Database Syst Rev. 2013;7:CD004033.
- , , . Thiamine Treatment and working memory function of alcohol‐dependent people: preliminary findings. Alcohol Clin Exp Res. 2001;25(1):112–116.
- , , , . Myths and misconceptions of Wernicke's encephalopathy: what every emergency physician should know. Ann Emerg Med. 2007;50(6):715–721.
- , . Wernicke's Encephalopathy: The clinical features and their probable relationship to vitamin B deficiency. Q J Med. 1941;10:(37):41–64.
- , , . Patterns of 35S‐thiamine hydrochloride absorption in the malnourished alcoholic patient. J Lab Clin Med. 1970;76(1):34–45.
- , , , . Thiamine propyl disulfide: absorption and utilization. Ann Intern Med. 1971;74(4):529–534.
- , . Parenteral thiamine and Wernicke's encephalopathy: the balance of risks and perception of concern. Alcohol Alcohol. 1997;32(3):207–209.
- , , , et al. Efficacy of vitamin supplementation in chronic alcoholics undergoing detoxification. Alcohol Alcohol Suppl. 1983;18:157–166.
- , , . Mechanisms of neuronal cell death in Wernicke's encephalopathy. Metab Brain Dis. 1998;13(2):97–122.
- , , , . Brain lactate synthesis in thiamine deficiency: a re‐evaluation using 1H‐13C nuclear magnetic resonance spectroscopy. J Neurosci Res. 2005;79(1‐2):33–41.
- , , . Pharmacokinetics of high‐dose oral thiamine hydrochloride in healthy subjects. BMC Clin Pharmacol. 2012;12(4):4.
- , , , et al. Simultaneous liquid chromatographic assessment of thiamine, thiamine monophosphate and thiamine diphosphate in human erythrocytes: a study on alcoholics. J Chromatogr B Analyt Technol Biomed Life Sci. 2003;789(2):355–363.
- , . Neuroimaging findings in acute Wernicke's encephalopathy: review of the literature. AJR Am J Roentgenol. 2009;192(2):501–508.
- , , , , . Beyond alcoholism: Wernicke‐Korsakoff syndrome in patients with psychiatric disorders. Cogn Behav Neurol. 2011;24(4):209–216.
- , , , , . Mental health status and gender as risk factors for onset of physical illness over 10 years. J Epidemiol Community Health. 2014;68(1):64–70.
- , , , , . The response to treatment of subclinical thiamine deficiency in the elderly. Am J Clin Nutr. 1997;66(4):925–928.
- , , . Thiamin and thiamin phosphate ester deficiency assessed by high performance liquid chromatography in four clinical cases of Wernicke's encephalopathy. Alcohol Clin Exp Res. 1993;17:712–716.
- . Prevention and treatment of Wernicke‐Korsakoff syndrome. Alcohol Alcohol Suppl. 2000;35(1):19–20.
- , , . Pabrinex prescribing in Scottish Emergency Departments. Poster presented at: Inaugural Scientific Conference of the College of Emergency Medicine; May 14–16, 2008; London, United Kingdom.
- , , , , , . Pharmacy‐based intervention in Wernicke's encephalopathy. Psychiatrist. 2010;34(6):234–238.
- , , . Time to act on the inadequate management of Wernicke's encephalopathy in the UK. Alcohol alcohol. Jan‐Feb 2013;48(1):4–8.
- , , , , . Malnutrition is prevalent in hospitalized medical patients: are housestaff identifying the malnourished patient? Nutrition. Apr 2006;22(4):350–354.
- , , , . Malnutrition among Hospitalized‐Patients ‐ a Problem of Physician Awareness. Archives of Internal Medicine. Aug 1987;147(8):1462–1465.
- , . BNF recommendations for the treatment of Wernicke's encephalopathy: lost in translation? Alcohol Alcohol. 2013;48(4):514–515.
- , , , , , . Reduction in medication errors in hospitals due to adoption of computerized provider order entry systems. J Am Med Inform Assoc. 2013;20(3):470–476.
- , . Is intravenous thiamine safe? Am J Emerg Med. 1992;10(2):165.
- , , . A toxicity study of parenteral thiamine hydrochloride. Ann Emerg Med. 1989;18(8):867–870.
- , , , , . Enough is enough: Stop wasting money on vitamin and mineral supplements. Ann Intern Med. 2013;159:850–851.
© 2015 Society of Hospital Medicine

Impact of Inpatient GCS on CI Patients
Under the Patient Protection and Affordable Care Act of 2010, commonly referred to as the Affordable Care Act, hospitals face up to a 3% penalty in Medicare reimbursements for patients readmitted within 30 days of initial discharge, and measures have been proposed for modifying payments to hospitals based on their performance on this metric.[1] Cognitive impairment (CI) is considered a major risk factor for poor postdischarge outcomes including mortality and hospital readmission.[2, 3] Hospitals are seeking strategies to reduce postdischarge mortality and rehospitalization among patients with and without CI.[4] Such strategies include use of transitional care coaches, patient and caregiver education, postdischarge follow‐up, and provision of geriatric consultative services (GCS) for the care of complex patients in the hospital setting.[5, 6, 7]
GCS utilize comprehensive geriatric assessments and multidisciplinary processes to recognize and modify risk factors that may lead to poor outcomes among hospitalized patients.[8, 9, 10, 11] Implementation of GCS models including Acute Care for Elders and, recently, the Mobile Acute Care of the Elderly services have shown many benefits among older patients including a reduction in the hospital length of stay and readmission rates.[12, 13] The benefits of such services among hospitalized elders suffering from CI, however, are not well established. The objective of this article was to evaluate the impact of GCS on the readmission and mortality rates of older adults with CI within 12 months of their hospitalization to an urban, public hospital. We hypothesized that GCS will reduce both 12‐month hospital readmissions and mortality rates among this vulnerable group of older adults.
METHODS
The study was approved by the Indiana University institutional review board, and informed consent for identifiable chart review was obtained from subjects or their legally authorized representatives.
Setting
The study was conducted at Eskenazi hospital, Indianapolis, Indiana, a 340‐bed, university‐affiliated, public hospital with over 2300 admissions of patients aged 65 years or older every year.
Population
Four hundred fifteen hospitalized patients aged 65 years or older suffering from CI were enrolled into an original, randomized, controlled trial that evaluated the effect of a computerized decision support system on their quality and outcome of care between July 1, 2006 and May 30, 2008.[14] The computerized decision support included reminders for physicians to reduce the prescription of 18 anticholinergics, minimize physical restraints and Foley catheterization, and increase referral to the local GCS.[15] That previous trial neither showed an impact on quality of care nor health utilization among older patients, including mortality and hospital readmission rates. The current study uses the data from the clinical trial cohort to evaluate the effect of GCS on the 12‐month mortality and hospital readmission rates for hospitalized elders with CI (Figure 1).

Inclusion and Exclusion Criteria
Individuals were eligible for enrollment if they were aged 65 years or older, hospitalized on a medical ward, able to speak English, and had evidence of CI within 48 hours of hospital admission. Individuals were excluded if they were previously enrolled, were aphasic, or unresponsive. The presence of CI was based on the Short Portable Mental Status Questionnaire (SPMSQ),[16] a brief 10‐item screening test with a sensitivity of 86% and specificity of 99% for dementia using a score of 7 or less (maximum possible score of 10).[16] The SPMSQ scoring process adjusts for participant educational and racial status, which was a benefit to its use given the urban setting of our hospital serving a large proportion of minority and low‐education patients. A physician‐trained research assistant administered the SPMSQ within 48 hours of hospital admission.
Geriatric Consultative Services
GCS is an interdisciplinary team of a geriatrician, a geriatric pharmacist, a case manager nurse, a social worker, a medical assistant, physical therapists, and a representative of the local Area Agency on Aging. There may be a geriatric fellow and/or medicine resident available to the team based on their rotation structure. Team‐based bedside rounds are performed on new consults only, but all patients are seen individually by the team clinicians. The team emphasizes prevention of functional decline and polypharmacy, recognition and treatment of geriatric syndromes including dementia and delirium, and early discharge/transition planning. Consensus recommendations are prepared and documented in the consult notes section of the electronic medical records. Recommendations deemed critical are discussed directly with the primary teams, but no orders are placed by the GCS team. The GCS team is available on all weekdays but not on weekends or major holidays.
Study Outcomes
For this secondary analysis, we used the Regenstrief Medical Record System (RMRS) to measure 2 outcomes: hospital readmission and mortality rates up to 1 year from discharge following index hospitalization, defined as the first admission in the original clinical trial. The RMRS is the primary instrument for processing data and monitoring patient and physician activity for the hospital.[17, 18] The RMRS is linked with a state‐wide health information exchange to capture data on hospitalization outside the hospital. The RMRS also contains death certificate information for all registered patients who die in or outside the Eskenazi hospital.
Other Data Collections
Delirium was assessed at screening and then every weekday using the Confusion Assessment Method (CAM) by a trained research assistant.[19] CAM evaluates 10 symptoms of delirium specified in the Diagnostic and Statistical Manual of Mental Disorders‐III‐Revision: acute onset, fluctuating course, inattention, disorganized thinking, altered level of consciousness, disorientation, memory impairment, perceptual disturbances, psychomotor agitation or retardation, and sleep/wake disturbance. Participant demographic characteristics, including age, sex, ethnicity, and years of education, were collected from the RMRS and from interviews performed at the time of cognitive screening. Information on length of hospital stay and discharge destination (eg, home vs facility, including skilled nursing and acute rehabilitation facilities) was also obtained from the RMRS. Charlson Comorbidity Index score was calculated using International Classification of Diseases, Ninth Revision codes gathered from 1 year before admission until the time of each participant's discharge from the hospital.[20] The Acute Physiology Score (APS) from the Acute Physiology and Chronic Health Evaluation (APACHE) III was derived from data available in the RMRS to measure the severity of illness.[21] Although the APACHE III was developed in the intensive care unit using data from the first 24 hours after admission, for our study we used the worst laboratory test value during the entire hospital stay to calculate the APS.[22]
Statistical Analysis
Baseline variables are presented as means and standard deviations for continuous variables, and percentages for binary categorical variables. Comparisons between patients receiving GCS and those who did not were performed using 2 tests for categorical variables and Kruskal‐Wallis test for continuous variables. Cox proportional hazard models were used to determine the association between receiving GCS and time to hospital readmission or mortality within 30 days or 1‐year postindex admission while adjusting for other covariates. For the models using time to readmission, patients without readmission were censored either at the endpoint (30 days or 1 year) or at time of death for those who died within the time frame in each model. Because GCS was not randomly assigned, we also conducted a propensity score analysis.[23] A logistic model for the probability of receiving GCS was conducted using patient demographic variables and information collected before and at the time of GCS. Stratified Cox proportional models using quintiles of predicted probability of receiving GCS were used in a propensity‐adjusted Cox model. All data analyses were performed using SAS version 9.3 (SAS Institute, Inc., Cary, NC).
RESULTS
Between July 1, 2006 and May 30, 2008, 415 CI patients were enrolled in the original trial, with 176 receiving the GCS. As shown in Table 1, the GCS and non‐GCS groups differed significantly. The GCS group was older (79.2 years old, 8.1 standard deviation [SD] vs 75.8 years old, 7.8 SD; P0.001), scored lower on the SPMSQ (4.7, 2.7 SD vs 5.5, 2.7 SD; P=0.002), had fewer chronic conditions with a lower mean Charlson Comorbidity Index Score (2.1, 1.86 SD vs 2.8, 2.6 SD; P=0.023), but a higher percentage of delirium (48.9% vs 29.3%), a lower percentage of being discharged home (37.5% vs 56.1%), and a higher mean length of stay (6.4 days, 6.4 SD vs 5.6 days, 5.9 SD; P=0.004). They also had a lower malignancy rate (6.2% vs 14.6%; P=0.007) and a lower number of hospitalizations in the previous year (0.5 admissions, 0.9 SD vs 0.7 admissions, 1.1 SD; P=0.035). No differences were observed in regard to gender, ethnicity, history of myocardial infarctions, chronic obstructive pulmonary disease, cerebrovascular disease, peripheral vascular disease, diabetes, and use of anticholinergic medicines.
| No GCS, n=239 | GCS, n=176 | P Value* | |
|---|---|---|---|
| |||
| Baseline characteristics | |||
| Mean age (SD) | 75.8 (7.8) | 79.2 (8.1) | <0.001 |
| % Female | 66.1 [n=158] | 68.2 [n=120] | 0.657 |
| % African American | 54.8 [n=131] | 63.6 [n=112] | 0.071 |
| Mean SPMSQ score (SD) | 5.5 (2.7) | 4.7 (2.7) | 0.002 |
| Admission diagnoses | |||
| MI | 15.5 [n=37] | 13.6 [n=24] | 0.675 |
| CHF | 38.1 [n=91] | 34.7 [n=61] | 0.475 |
| PVD | 7.1 [n=17] | 9.7 [n=17] | 0.370 |
| Cerebrovascular | 13.8 [n=33] | 19.3 [n=34] | 0.140 |
| COPD | 41.0 [n=98] | 33.0 [n=58] | 0.094 |
| Diabetes | 47.7 [n=114] | 40.9 [n=72] | 0.169 |
| Malignancy | 14.6 [n=35] | 6.2 [n=11] | 0.007 |
| Metastatic cancer | 8.8 [n=21] | 1.7 [n=3] | 0.002 |
| Mean Charlson Comorbidity (SD) | 2.8 (2.6) | 2.1 (1.8) | 0.023 |
| Mean APS (SD) | 24.5 (13.8) | 25.9 (13.5) | 0.231 |
| Definite ACB Use | 35.2 [n=84] | 27.8 [n=49] | 0.136 |
| Length of stay | 5.6 (5.9) | 6.4 (6.4) | 0.004 |
| % Any delirium | 29.3 [n=70] | 48.9 [n=156] | <0.001 |
| % Discharged home | 56.1 [n=134] | 37.5 [n=66] | <0.001 |
| No. of inpatient stays prior year | 0.7 (1.1) | 0.5 (0.9) | 0.035 |
| Follow‐up outcomes | |||
| % Readmission within 30 days | 15.1 [n=36] | 22.7 [n=40] | 0.054 |
| % Readmission within 1 year | 54.4 [n=130] | 56.3 [n=99] | 0.765 |
| % Death within 30 days | 4.2 [n=10] | 1.7 [n=3] | 0.253 |
| % Death within 1 year | 26.8 [n=64] | 23.9 [n=42] | 0.569 |
| % Readmission or death within 30 days | 18.0 [n=43] | 24.4 [n=43] | 0.113 |
| % Readmission or death within 1 year | 64.8 [n=155] | 63.1 [n=111] | 0.708 |
Table 2 describes the association of various factors with receiving GCS. Patients who were positive for delirium (odds ratio [OR]=1.65; 95% confidence interval=0.98‐2.77) and were older (OR=1.04; 95% confidence interval=1.01‐1.08) had a higher propensity to receive GCS, whereas, the presence of metastatic cancer resulted in a lower propensity (OR=0.15; 95% confidence interval=0.02‐1.16) of receiving GCS. The logistic model estimated area under the receiver operating characteristic curve was 0.707.
| Adjusted OR (95% CI) | P Value | |
|---|---|---|
| ||
| Age | 1.04 (1.011.08) | 0.006 |
| Female | 1.02 (0.641.63) | 0.942 |
| African American | 1.11 (0.711.72) | 0.657 |
| Short Portable Mental Status Questionnaire score | 1.00 (0.911.10) | 0.990 |
| Acute Physiology Score | 1.00 (0.981.02) | 0.769 |
| Charlson Comorbidity Score | 1.11 (0.841.46) | 0.471 |
| Length of hospital stay | 1.02 (0.981.07) | 0.299 |
| Definite anticholinergic use* | 0.74 (0.461.20) | 0.219 |
| Any delirium during hospital stay | 1.65 (0.982.77) | 0.061 |
| Diabetes mellitus | 0.72 (0.411.26) | 0.253 |
| Myocardial infarction | 0.83 (0.411.66) | 0.593 |
| Congestive heart failure | 0.83 (0.471.47) | 0.524 |
| Peripheral vascular disease | 1.39 (0.613.18) | 0.433 |
| Cerebrovascular disease | 1.30 (0.652.59) | 0.464 |
| Malignancy | 0.45 (0.171.21) | 0.113 |
| Metastatic cancer | 0.15 (0.021.16) | 0.069 |
| Chronic obstructive pulmonary disease | 0.91 (0.531.55) | 0.727 |
Table 3 provides results from the Cox models for receiving GCS on readmission and mortality outcomes adjusting for various sets of covariates and with the propensity score adjustment. Model 1 presents unadjusted hazard ratio (HR). Model 2 presents HRs adjusting for a common set of covariates that were significantly associated with at least 1 of the outcomes, whereas model 3 presents the results adjusting for all covariates. All 4 models yielded similar results. As evident from this table, propensity‐adjusted HR for 30‐day readmission was still significantly higher among patients receiving GCS (HR=1.75; 95% confidence interval=1.06‐2.88) but not at 1 year (HR=1.19; 95% confidence interval=0.89‐1.59). There was a trend for decreased mortality for the GCS group at 30 days (HR=0.35; 95% confidence interval=0.09‐1.35), but it disappeared at 1 year (HR=0.91; 95% confidence interval=0.59‐1.40). A composite outcome of readmissions and mortality did not show any difference between the GCS and no‐GCS groups.
| Outcome Variables | Model 1 | Model 2 | Model 3 | Propensity Adjusted | ||||
|---|---|---|---|---|---|---|---|---|
| HR (95% CI) | P Value | HR (95% CI) | P Value | HR (95% CI) | P Value | HR (95% CI) | P Value | |
| ||||||||
| Readmission within 30 days | 1.65 (1.05, 2.59) | 0.030 | 1.73 (1.08, 2.78) | 0.024 | 1.84 (1.133.00) | 0.015 | 1.75 (1.062.88) | 0.029 |
| Readmission within 1 year | 1.13 (0.87, 1.46) | 0.373 | 1.24 (0.94, 1.63) | 0.125 | 1.26 (0.941.68) | 0.117 | 1.19 (0.891.59) | 0.245 |
| Death within 30 days | 0.43 (0.12, 1.56) | 0.199 | 0.34 (0.09, 1.28) | 0.110 | 0.25 (0.061.02) | 0.053 | 0.35 (0.091.35) | 0.126 |
| Death within 1 year | 0.95 (0.65, 1.45) | 0.806 | 0.87 (0.58 1.31) | 0.506 | 0.93 (0.601.42) | 0.724 | 0.91 (0.591.40) | 0.669 |
| Readmission or Death within 30 days | 1.48 (0.97, 2.26) | 0.070 | 1.49 (0.96, 2.33) | 0.078 | 1.56 (0.982.47) | 0.061 | 1.55 (0.972.48) | 0.069 |
| Readmission or death within 1 year | 1.05 (0.82, 1.34) | 0.699 | 1.11 (0.86, 1.43) | 0.412 | 1.15 (0.881.50) | 0.318 | 1.08 (0.831.42) | 0.569 |
DISCUSSION
To our knowledge, this is the first study to analyze the impact of GCS on hospital readmission and mortality rates of CI patients. Our results did not show any short‐term or long‐term benefits of GCS for CI patients. Recent studies exploring cost benefits of the GCS have found trends toward lower readmission, but none focused on patients with CI.[6, 24, 25] It is important to note that our study did not use random allocation to assigning the patient into the GCS or control group, thus raising the possibility that patients who received GCS were sicker and were medically and socially more complex than those who did not receive the consult. Moreover, GCS consultation is preferentially sought for and completed for patients with CI and functional limitations, consistent with our finding that GCS patients more often have delirium and are less‐often discharged home.
The nature of the GCS team is another important consideration. Our GCS model did not include unit cohorting of patients, an important component of other proposed GCS models.[26] A recent meta‐analysis found that the GCS models without unit cohorting of patients did not have an impact on 1‐ or 12‐month readmission rates.[27] Low adherence to consultant recommendations (less than 33%) was thought to be a reason for such results. Importance of cohorting with regard to accomplishing recommendations by primary teams, importance of unit staff expertise in geriatric principles, and impact of a unit model on teamwork has also been highlighted by another review.[28] These findings lend to the hypothesis that unit cohorting and direct order placement by the GCS team may improve outcomes among CI patients, including a reduction in readmission rates.
Although readmissions rates were not statistically different between GCS and control groups at 1‐year postdischarge, 30‐day readmission rates were higher among the GCS group. Previous research among older heart failure patients found that a comprehensive transitional care intervention at the time of hospital discharge significantly shortened the time to readmission in the intervention group (P=0.026).[29] The factors identified by the study authors included enhanced supervision by the transitional healthcare teams along with improved awareness and education among treated patients that may have facilitated early recognition of clinical deterioration.[29] A recent study with intensive outpatient care that resulted in increased admissions among chronically ill adults provided a similar conclusion.[30]
GCS patients showed a trend toward decreased mortality as did patients enrolled in previous studies evaluating GCS models in the inpatient setting, as suggested by a recent review.[27] A caveat to note is that these trends favored ward‐styled GCS services as compared to our open GCS model,[27, 28] although the factors cited in these dedicated units affecting mortality included prompt attention to early rehabilitation, delirium management, and prevention of pressure ulcers and are also frequently implemented for patients in our GCS service model and therefore may have produced similar results.
Our neutral results in regard to the readmissions need to be interpreted with caution. First, this study was conducted in a hospital that supports expert geriatric and palliative care teams, both in the inpatient and the ambulatory settings, that provide consultative services and train medicine teams and hospital nursing staff. On the outpatient side, the presence of a robust geriatrics house‐calls program and the Geriatric Resources for Assessment and Care of Elders team results in above‐average care for the control group, and thus may also impact apparent outcomes.[31, 32] Second, 30‐day readmissions represent a complex outcome. Two recent reviews of hospital‐initiated interventions have shown that evidence regarding best strategies to decrease 30‐day readmissions is unclear.[33] Neither review included studies that targeted patients with CI only. The 2 programs that reduced 30‐day readmissions were multifaceted and included personnel who provide bridging between the hospital and the outpatient setting.[34] The GCS does include a focus on postdischarge resources, but does that on a case‐by‐case basis and no formal posthospital follow‐ups are provided. Moreover, the value of 30‐day readmission rates as a marker of quality, even though used by policymakers as an indicator of hospital quality, remains controversial.[35, 36] Broadening the outcomes of interest to include patient‐centered outcomes including satisfaction with care, that have shown to impact other health outcomes, may help improve understanding the benefits of GCS in hospitals.[37] Other comprehensive transitional care models that failed to show a benefit on 30‐day readmissions in older patients still resulted in higher satisfaction among patients.[38] Unfortunately, our evaluation did not include an assessment of patient satisfaction and quality of transitions.
Since the study period, GCS at our hospital now has incorporated a more robust focus on advance care planning (ACP) and execution of Physician Orders for Scope of Treatment that were legislated in the state in July 2013. The GCS team members are expert in carrying out complex ACP discussions and also partner with the inpatient palliative care team. It is quite possible that a study of more recent outcomes will yield more positive results for the selected outcomes. Thus, for future trials that aim to study the impact of GCS in the inpatient settings, it may be advisable to include important quality markers such as implementation of ACP and patient satisfaction along with the health utilization outcomes.
Limitations
As mentioned previously, it is possible that our risk adjustment was insufficient to account for all the medical and psychosocial differences among groups. For example, the overall anticholinergic impact of various medications such as antipsychotic medications and histamine‐2 blockers was assessed via the Anticholinergic Burden Scale on admission, but we did not have information on medication prescribing during the stay. We were further limited by lack of baseline functional status and socioeconomic details, both of which are related to 30‐day readmissions. For example, living alone, prior use of assist devices, and belonging to lower socioeconomic status are correlated with higher readmission rates.[39, 40] Patients with available social support may receive more intense supervision and may seek medical attention sooner. On the other hand, worsening health among CI patients without any approximate social support may be unnoticed for days. Absence of details of inpatient interventions may also have resulted in unmeasurable confounders that could have impacted our study outcomes. Finally, lack of information on the uptake of GCS recommendations by the primary teams is another limitation of this analysis. Future trials should include strategies to address these information gaps.
CONCLUSION
Our results comparing inpatient geriatrics consultative services with usual care in hospitalized elders having cognitive impairment failed to demonstrate an impact on readmissions and mortality. A clinical lesson learned, however, is that much work is still required to reduce readmission and mortality rates in this especially vulnerable patient population.
Disclosures
Disclosures: This work was supported by grants from a Geriatric Academic Career Award (K01HP20517) through Health Resources and Services Administration, R01AG034205 and K23‐AG043476 from the National Institute on Aging, and the John A. Hartford Foundation Center for Excellence in Geriatric Medicine. The sponsors had no role in the study design, evaluation, or manuscript development. The authors report no conflicts of interest.
- , , , et al. Relationship between hospital readmission and mortality rates for patients hospitalized with acute myocardial infarction, heart failure, or pneumonia. JAMA. 2013;309(6):587–593.
- , , , Cognitive impairment. Can it predict the course of hospitalized patients? J Am Geriatr Soc. 1986;34(8):579–585.
- , , , , , Importance of functional measures in predicting mortality among older hospitalized patients. JAMA. 1998;279(15):1187–1193.
- , Understanding preventable hospital readmissions: masqueraders, markers, and true causal factors. J Hosp Med. 2011;6(2):51–53.
- , , , et al. A multicomponent intervention to prevent delirium in hospitalized older patients. N Engl J Med. 1999;340(9):669–676.
- , , , et al. Effects of a multicomponent intervention on functional outcomes and process of care in hospitalized older patients: a randomized controlled trial of Acute Care for Elders (ACE) in a community hospital. J Am Geriatr Soc. 2000;48(12):1572–1581.
- , ; American Geriatrics Society Health Care Systems Committee. Improving the quality of transitional care for persons with complex care needs. J Am Geriatr Soc. 2003;51(4):556–557.
- , , , Development and implementation of a proactive geriatrics consultation model in collaboration with hospitalists. J Am Geriatr Soc. 2009;57(11):2139–2145.
- , , , et al. Screening of the risk of functional decline performed by an inpatient geriatric consultation team in a general hospital [in French]. Revue medicale de Bruxelles. 2013;34(6):462–468.
- , , , et al. Systematic detection and multidisciplinary care of delirium in older medical inpatients: a randomized trial. CMAJ. 2002;167(7):753–759.
- , , Potentially inappropriate prescribing for geriatric inpatients: an acute care of the elderly unit compared to a general medicine service. Consult Pharm. 2003;18(1):37–42, 47–39.
- , , , Evaluation of the Mobile Acute Care of the Elderly (MACE) service. JAMA Intern Med. 2013;173(11):990–996.
- , , , , , Effects of an acute care for elders unit on costs and 30‐day readmissions. JAMA Intern Med. 2013;173(11):981–987.
- , , , et al. Impact and recognition of cognitive impairment among hospitalized elders. J Hosp Med. 2010;5(2):69–75.
- , , , et al. Enhancing care for hospitalized older adults with cognitive impairment: a randomized controlled trial. J Gen Intern Med. 2012;27(5):561–567.
- , , , Short Portable Mental Status Questionnaire as a screening test for dementia and delirium among the elderly. J Am Geriatr Soc. 1987;35(5):412–416.
- , , , et al. The Regenstrief Medical Record System: a quarter century experience. Int J Med Inform. 1999;54(3):225–253.
- , , , , , Factors determining the decision to institutionalize dementing individuals: a prospective study. Gerontologist. 1993;33(6):714–720.
- , , , , , Clarifying confusion: the confusion assessment method. A new method for detection of delirium. Ann Intern Med. 1990;113(12):941–948.
- , , , , , Resuscitation: how do we decide? A prospective study of physicians' preferences and the clinical course of hospitalized patients. JAMA. 1986;255(10):1316–1322.
- , , , et al. The APACHE III prognostic system. Risk prediction of hospital mortality for critically ill hospitalized adults. Chest. 1991;100(6):1619–1636.
- , , , et al. Interaction between cognitive impairment and discharge destination and its effect on rehospitalization. J Am Geriatr Soc. 2013;61(11):1958–1963.
- , , , , , Propensity scores in intensive care and anaesthesiology literature: a systematic review. Intensive Care Med. 2010;36(12):1993–2003.
- , , , et al. Improving functional outcomes in older patients: lessons from an acute care for elders unit. Jt Comm J Qual Improv. 1998;24(2):63–76.
- , , , et al. Developing a stroke unit using the acute care for elders intervention and model of care. J Am Geriatr Soc. 2003;51(11):1660–1667.
- , , , A medical unit for the acute care of the elderly. J Am Geriatr Soc. 1994;42(5):545–552.
- , , , , Impact of geriatric consultation teams on clinical outcome in acute hospitals: a systematic review and meta‐analysis. BMC Med. 2013;11:48.
- , , , , Comprehensive geriatric assessment for older adults admitted to hospital: meta‐analysis of randomised controlled trials. BMJ. 2011;343:d6553.
- , , , et al. Prevention of readmission in elderly patients with congestive heart failure: results of a prospective, randomized pilot study. J Gen Intern Med. 1993;8(11):585–590.
- , , , et al. Effect of a pharmacist intervention on clinically important medication errors after hospital discharge: a randomized trial. Ann Intern Med. 2012;157(1):1–10.
- , , , , House calls for seniors: building and sustaining a model of care for homebound seniors. J Am Geriatr Soc. 2009;57(6):1103–1109.
- , , , et al. Geriatric care management for low‐income seniors: a randomized controlled trial. JAMA. 2007;298(22):2623–2633.
- , , , , Interventions to reduce 30‐day rehospitalization: a systematic review. Ann Intern Med. 2011;155(8):520–528.
- , The effects of a discharge planning and home follow‐up intervention on elders hospitalized with common medical and surgical cardiac conditions. J Cardiovasc Nurs. 1999;14(1):44–54.
- Readmission to hospital: a measure of quality or outcome? Qual Saf Health Care. 2004;13(1):10–11.
- , , , , , Unintended consequences of steps to cut readmissions and reform payment may threaten care of vulnerable older adults. Health Aff (Millwood). 2012;31(7):1623–1632.
- , , Analyzing the effects of shared decision‐making, empathy and team interaction on patient satisfaction and treatment acceptance in medical rehabilitation using a structural equation modeling approach. Patient Educ Couns. 2013;91(2):167–175.
- , , , The Care Transitions Innovation (C‐TraIn) for Socioeconomically Disadvantaged Adults: results of a cluster randomized controlled trial. J Gen Intern Med. 2014;29(11):1460–1467.
- , , , Risk factors for early hospital readmission in low‐income elderly adults. J Am Geriatr Soc. 2014;62(3):489–494.
- , , , , , Understanding why patients of low socioeconomic status prefer hospitals over ambulatory care. Health Aff (Millwood). 2013;32(7):1196–1203.
Under the Patient Protection and Affordable Care Act of 2010, commonly referred to as the Affordable Care Act, hospitals face up to a 3% penalty in Medicare reimbursements for patients readmitted within 30 days of initial discharge, and measures have been proposed for modifying payments to hospitals based on their performance on this metric.[1] Cognitive impairment (CI) is considered a major risk factor for poor postdischarge outcomes including mortality and hospital readmission.[2, 3] Hospitals are seeking strategies to reduce postdischarge mortality and rehospitalization among patients with and without CI.[4] Such strategies include use of transitional care coaches, patient and caregiver education, postdischarge follow‐up, and provision of geriatric consultative services (GCS) for the care of complex patients in the hospital setting.[5, 6, 7]
GCS utilize comprehensive geriatric assessments and multidisciplinary processes to recognize and modify risk factors that may lead to poor outcomes among hospitalized patients.[8, 9, 10, 11] Implementation of GCS models including Acute Care for Elders and, recently, the Mobile Acute Care of the Elderly services have shown many benefits among older patients including a reduction in the hospital length of stay and readmission rates.[12, 13] The benefits of such services among hospitalized elders suffering from CI, however, are not well established. The objective of this article was to evaluate the impact of GCS on the readmission and mortality rates of older adults with CI within 12 months of their hospitalization to an urban, public hospital. We hypothesized that GCS will reduce both 12‐month hospital readmissions and mortality rates among this vulnerable group of older adults.
METHODS
The study was approved by the Indiana University institutional review board, and informed consent for identifiable chart review was obtained from subjects or their legally authorized representatives.
Setting
The study was conducted at Eskenazi hospital, Indianapolis, Indiana, a 340‐bed, university‐affiliated, public hospital with over 2300 admissions of patients aged 65 years or older every year.
Population
Four hundred fifteen hospitalized patients aged 65 years or older suffering from CI were enrolled into an original, randomized, controlled trial that evaluated the effect of a computerized decision support system on their quality and outcome of care between July 1, 2006 and May 30, 2008.[14] The computerized decision support included reminders for physicians to reduce the prescription of 18 anticholinergics, minimize physical restraints and Foley catheterization, and increase referral to the local GCS.[15] That previous trial neither showed an impact on quality of care nor health utilization among older patients, including mortality and hospital readmission rates. The current study uses the data from the clinical trial cohort to evaluate the effect of GCS on the 12‐month mortality and hospital readmission rates for hospitalized elders with CI (Figure 1).
Inclusion and Exclusion Criteria
Individuals were eligible for enrollment if they were aged 65 years or older, hospitalized on a medical ward, able to speak English, and had evidence of CI within 48 hours of hospital admission. Individuals were excluded if they were previously enrolled, were aphasic, or unresponsive. The presence of CI was based on the Short Portable Mental Status Questionnaire (SPMSQ),[16] a brief 10‐item screening test with a sensitivity of 86% and specificity of 99% for dementia using a score of 7 or less (maximum possible score of 10).[16] The SPMSQ scoring process adjusts for participant educational and racial status, which was a benefit to its use given the urban setting of our hospital serving a large proportion of minority and low‐education patients. A physician‐trained research assistant administered the SPMSQ within 48 hours of hospital admission.
Geriatric Consultative Services
GCS is an interdisciplinary team of a geriatrician, a geriatric pharmacist, a case manager nurse, a social worker, a medical assistant, physical therapists, and a representative of the local Area Agency on Aging. There may be a geriatric fellow and/or medicine resident available to the team based on their rotation structure. Team‐based bedside rounds are performed on new consults only, but all patients are seen individually by the team clinicians. The team emphasizes prevention of functional decline and polypharmacy, recognition and treatment of geriatric syndromes including dementia and delirium, and early discharge/transition planning. Consensus recommendations are prepared and documented in the consult notes section of the electronic medical records. Recommendations deemed critical are discussed directly with the primary teams, but no orders are placed by the GCS team. The GCS team is available on all weekdays but not on weekends or major holidays.
Study Outcomes
For this secondary analysis, we used the Regenstrief Medical Record System (RMRS) to measure 2 outcomes: hospital readmission and mortality rates up to 1 year from discharge following index hospitalization, defined as the first admission in the original clinical trial. The RMRS is the primary instrument for processing data and monitoring patient and physician activity for the hospital.[17, 18] The RMRS is linked with a state‐wide health information exchange to capture data on hospitalization outside the hospital. The RMRS also contains death certificate information for all registered patients who die in or outside the Eskenazi hospital.
Other Data Collections
Delirium was assessed at screening and then every weekday using the Confusion Assessment Method (CAM) by a trained research assistant.[19] CAM evaluates 10 symptoms of delirium specified in the Diagnostic and Statistical Manual of Mental Disorders‐III‐Revision: acute onset, fluctuating course, inattention, disorganized thinking, altered level of consciousness, disorientation, memory impairment, perceptual disturbances, psychomotor agitation or retardation, and sleep/wake disturbance. Participant demographic characteristics, including age, sex, ethnicity, and years of education, were collected from the RMRS and from interviews performed at the time of cognitive screening. Information on length of hospital stay and discharge destination (eg, home vs facility, including skilled nursing and acute rehabilitation facilities) was also obtained from the RMRS. Charlson Comorbidity Index score was calculated using International Classification of Diseases, Ninth Revision codes gathered from 1 year before admission until the time of each participant's discharge from the hospital.[20] The Acute Physiology Score (APS) from the Acute Physiology and Chronic Health Evaluation (APACHE) III was derived from data available in the RMRS to measure the severity of illness.[21] Although the APACHE III was developed in the intensive care unit using data from the first 24 hours after admission, for our study we used the worst laboratory test value during the entire hospital stay to calculate the APS.[22]
Statistical Analysis
Baseline variables are presented as means and standard deviations for continuous variables, and percentages for binary categorical variables. Comparisons between patients receiving GCS and those who did not were performed using 2 tests for categorical variables and Kruskal‐Wallis test for continuous variables. Cox proportional hazard models were used to determine the association between receiving GCS and time to hospital readmission or mortality within 30 days or 1‐year postindex admission while adjusting for other covariates. For the models using time to readmission, patients without readmission were censored either at the endpoint (30 days or 1 year) or at time of death for those who died within the time frame in each model. Because GCS was not randomly assigned, we also conducted a propensity score analysis.[23] A logistic model for the probability of receiving GCS was conducted using patient demographic variables and information collected before and at the time of GCS. Stratified Cox proportional models using quintiles of predicted probability of receiving GCS were used in a propensity‐adjusted Cox model. All data analyses were performed using SAS version 9.3 (SAS Institute, Inc., Cary, NC).
RESULTS
Between July 1, 2006 and May 30, 2008, 415 CI patients were enrolled in the original trial, with 176 receiving the GCS. As shown in Table 1, the GCS and non‐GCS groups differed significantly. The GCS group was older (79.2 years old, 8.1 standard deviation [SD] vs 75.8 years old, 7.8 SD; P0.001), scored lower on the SPMSQ (4.7, 2.7 SD vs 5.5, 2.7 SD; P=0.002), had fewer chronic conditions with a lower mean Charlson Comorbidity Index Score (2.1, 1.86 SD vs 2.8, 2.6 SD; P=0.023), but a higher percentage of delirium (48.9% vs 29.3%), a lower percentage of being discharged home (37.5% vs 56.1%), and a higher mean length of stay (6.4 days, 6.4 SD vs 5.6 days, 5.9 SD; P=0.004). They also had a lower malignancy rate (6.2% vs 14.6%; P=0.007) and a lower number of hospitalizations in the previous year (0.5 admissions, 0.9 SD vs 0.7 admissions, 1.1 SD; P=0.035). No differences were observed in regard to gender, ethnicity, history of myocardial infarctions, chronic obstructive pulmonary disease, cerebrovascular disease, peripheral vascular disease, diabetes, and use of anticholinergic medicines.
| No GCS, n=239 | GCS, n=176 | P Value* | |
|---|---|---|---|
| |||
| Baseline characteristics | |||
| Mean age (SD) | 75.8 (7.8) | 79.2 (8.1) | <0.001 |
| % Female | 66.1 [n=158] | 68.2 [n=120] | 0.657 |
| % African American | 54.8 [n=131] | 63.6 [n=112] | 0.071 |
| Mean SPMSQ score (SD) | 5.5 (2.7) | 4.7 (2.7) | 0.002 |
| Admission diagnoses | |||
| MI | 15.5 [n=37] | 13.6 [n=24] | 0.675 |
| CHF | 38.1 [n=91] | 34.7 [n=61] | 0.475 |
| PVD | 7.1 [n=17] | 9.7 [n=17] | 0.370 |
| Cerebrovascular | 13.8 [n=33] | 19.3 [n=34] | 0.140 |
| COPD | 41.0 [n=98] | 33.0 [n=58] | 0.094 |
| Diabetes | 47.7 [n=114] | 40.9 [n=72] | 0.169 |
| Malignancy | 14.6 [n=35] | 6.2 [n=11] | 0.007 |
| Metastatic cancer | 8.8 [n=21] | 1.7 [n=3] | 0.002 |
| Mean Charlson Comorbidity (SD) | 2.8 (2.6) | 2.1 (1.8) | 0.023 |
| Mean APS (SD) | 24.5 (13.8) | 25.9 (13.5) | 0.231 |
| Definite ACB Use | 35.2 [n=84] | 27.8 [n=49] | 0.136 |
| Length of stay | 5.6 (5.9) | 6.4 (6.4) | 0.004 |
| % Any delirium | 29.3 [n=70] | 48.9 [n=156] | <0.001 |
| % Discharged home | 56.1 [n=134] | 37.5 [n=66] | <0.001 |
| No. of inpatient stays prior year | 0.7 (1.1) | 0.5 (0.9) | 0.035 |
| Follow‐up outcomes | |||
| % Readmission within 30 days | 15.1 [n=36] | 22.7 [n=40] | 0.054 |
| % Readmission within 1 year | 54.4 [n=130] | 56.3 [n=99] | 0.765 |
| % Death within 30 days | 4.2 [n=10] | 1.7 [n=3] | 0.253 |
| % Death within 1 year | 26.8 [n=64] | 23.9 [n=42] | 0.569 |
| % Readmission or death within 30 days | 18.0 [n=43] | 24.4 [n=43] | 0.113 |
| % Readmission or death within 1 year | 64.8 [n=155] | 63.1 [n=111] | 0.708 |
Table 2 describes the association of various factors with receiving GCS. Patients who were positive for delirium (odds ratio [OR]=1.65; 95% confidence interval=0.98‐2.77) and were older (OR=1.04; 95% confidence interval=1.01‐1.08) had a higher propensity to receive GCS, whereas, the presence of metastatic cancer resulted in a lower propensity (OR=0.15; 95% confidence interval=0.02‐1.16) of receiving GCS. The logistic model estimated area under the receiver operating characteristic curve was 0.707.
| Adjusted OR (95% CI) | P Value | |
|---|---|---|
| ||
| Age | 1.04 (1.011.08) | 0.006 |
| Female | 1.02 (0.641.63) | 0.942 |
| African American | 1.11 (0.711.72) | 0.657 |
| Short Portable Mental Status Questionnaire score | 1.00 (0.911.10) | 0.990 |
| Acute Physiology Score | 1.00 (0.981.02) | 0.769 |
| Charlson Comorbidity Score | 1.11 (0.841.46) | 0.471 |
| Length of hospital stay | 1.02 (0.981.07) | 0.299 |
| Definite anticholinergic use* | 0.74 (0.461.20) | 0.219 |
| Any delirium during hospital stay | 1.65 (0.982.77) | 0.061 |
| Diabetes mellitus | 0.72 (0.411.26) | 0.253 |
| Myocardial infarction | 0.83 (0.411.66) | 0.593 |
| Congestive heart failure | 0.83 (0.471.47) | 0.524 |
| Peripheral vascular disease | 1.39 (0.613.18) | 0.433 |
| Cerebrovascular disease | 1.30 (0.652.59) | 0.464 |
| Malignancy | 0.45 (0.171.21) | 0.113 |
| Metastatic cancer | 0.15 (0.021.16) | 0.069 |
| Chronic obstructive pulmonary disease | 0.91 (0.531.55) | 0.727 |
Table 3 provides results from the Cox models for receiving GCS on readmission and mortality outcomes adjusting for various sets of covariates and with the propensity score adjustment. Model 1 presents unadjusted hazard ratio (HR). Model 2 presents HRs adjusting for a common set of covariates that were significantly associated with at least 1 of the outcomes, whereas model 3 presents the results adjusting for all covariates. All 4 models yielded similar results. As evident from this table, propensity‐adjusted HR for 30‐day readmission was still significantly higher among patients receiving GCS (HR=1.75; 95% confidence interval=1.06‐2.88) but not at 1 year (HR=1.19; 95% confidence interval=0.89‐1.59). There was a trend for decreased mortality for the GCS group at 30 days (HR=0.35; 95% confidence interval=0.09‐1.35), but it disappeared at 1 year (HR=0.91; 95% confidence interval=0.59‐1.40). A composite outcome of readmissions and mortality did not show any difference between the GCS and no‐GCS groups.
| Outcome Variables | Model 1 | Model 2 | Model 3 | Propensity Adjusted | ||||
|---|---|---|---|---|---|---|---|---|
| HR (95% CI) | P Value | HR (95% CI) | P Value | HR (95% CI) | P Value | HR (95% CI) | P Value | |
| ||||||||
| Readmission within 30 days | 1.65 (1.05, 2.59) | 0.030 | 1.73 (1.08, 2.78) | 0.024 | 1.84 (1.133.00) | 0.015 | 1.75 (1.062.88) | 0.029 |
| Readmission within 1 year | 1.13 (0.87, 1.46) | 0.373 | 1.24 (0.94, 1.63) | 0.125 | 1.26 (0.941.68) | 0.117 | 1.19 (0.891.59) | 0.245 |
| Death within 30 days | 0.43 (0.12, 1.56) | 0.199 | 0.34 (0.09, 1.28) | 0.110 | 0.25 (0.061.02) | 0.053 | 0.35 (0.091.35) | 0.126 |
| Death within 1 year | 0.95 (0.65, 1.45) | 0.806 | 0.87 (0.58 1.31) | 0.506 | 0.93 (0.601.42) | 0.724 | 0.91 (0.591.40) | 0.669 |
| Readmission or Death within 30 days | 1.48 (0.97, 2.26) | 0.070 | 1.49 (0.96, 2.33) | 0.078 | 1.56 (0.982.47) | 0.061 | 1.55 (0.972.48) | 0.069 |
| Readmission or death within 1 year | 1.05 (0.82, 1.34) | 0.699 | 1.11 (0.86, 1.43) | 0.412 | 1.15 (0.881.50) | 0.318 | 1.08 (0.831.42) | 0.569 |
DISCUSSION
To our knowledge, this is the first study to analyze the impact of GCS on hospital readmission and mortality rates of CI patients. Our results did not show any short‐term or long‐term benefits of GCS for CI patients. Recent studies exploring cost benefits of the GCS have found trends toward lower readmission, but none focused on patients with CI.[6, 24, 25] It is important to note that our study did not use random allocation to assigning the patient into the GCS or control group, thus raising the possibility that patients who received GCS were sicker and were medically and socially more complex than those who did not receive the consult. Moreover, GCS consultation is preferentially sought for and completed for patients with CI and functional limitations, consistent with our finding that GCS patients more often have delirium and are less‐often discharged home.
The nature of the GCS team is another important consideration. Our GCS model did not include unit cohorting of patients, an important component of other proposed GCS models.[26] A recent meta‐analysis found that the GCS models without unit cohorting of patients did not have an impact on 1‐ or 12‐month readmission rates.[27] Low adherence to consultant recommendations (less than 33%) was thought to be a reason for such results. Importance of cohorting with regard to accomplishing recommendations by primary teams, importance of unit staff expertise in geriatric principles, and impact of a unit model on teamwork has also been highlighted by another review.[28] These findings lend to the hypothesis that unit cohorting and direct order placement by the GCS team may improve outcomes among CI patients, including a reduction in readmission rates.
Although readmissions rates were not statistically different between GCS and control groups at 1‐year postdischarge, 30‐day readmission rates were higher among the GCS group. Previous research among older heart failure patients found that a comprehensive transitional care intervention at the time of hospital discharge significantly shortened the time to readmission in the intervention group (P=0.026).[29] The factors identified by the study authors included enhanced supervision by the transitional healthcare teams along with improved awareness and education among treated patients that may have facilitated early recognition of clinical deterioration.[29] A recent study with intensive outpatient care that resulted in increased admissions among chronically ill adults provided a similar conclusion.[30]
GCS patients showed a trend toward decreased mortality as did patients enrolled in previous studies evaluating GCS models in the inpatient setting, as suggested by a recent review.[27] A caveat to note is that these trends favored ward‐styled GCS services as compared to our open GCS model,[27, 28] although the factors cited in these dedicated units affecting mortality included prompt attention to early rehabilitation, delirium management, and prevention of pressure ulcers and are also frequently implemented for patients in our GCS service model and therefore may have produced similar results.
Our neutral results in regard to the readmissions need to be interpreted with caution. First, this study was conducted in a hospital that supports expert geriatric and palliative care teams, both in the inpatient and the ambulatory settings, that provide consultative services and train medicine teams and hospital nursing staff. On the outpatient side, the presence of a robust geriatrics house‐calls program and the Geriatric Resources for Assessment and Care of Elders team results in above‐average care for the control group, and thus may also impact apparent outcomes.[31, 32] Second, 30‐day readmissions represent a complex outcome. Two recent reviews of hospital‐initiated interventions have shown that evidence regarding best strategies to decrease 30‐day readmissions is unclear.[33] Neither review included studies that targeted patients with CI only. The 2 programs that reduced 30‐day readmissions were multifaceted and included personnel who provide bridging between the hospital and the outpatient setting.[34] The GCS does include a focus on postdischarge resources, but does that on a case‐by‐case basis and no formal posthospital follow‐ups are provided. Moreover, the value of 30‐day readmission rates as a marker of quality, even though used by policymakers as an indicator of hospital quality, remains controversial.[35, 36] Broadening the outcomes of interest to include patient‐centered outcomes including satisfaction with care, that have shown to impact other health outcomes, may help improve understanding the benefits of GCS in hospitals.[37] Other comprehensive transitional care models that failed to show a benefit on 30‐day readmissions in older patients still resulted in higher satisfaction among patients.[38] Unfortunately, our evaluation did not include an assessment of patient satisfaction and quality of transitions.
Since the study period, GCS at our hospital now has incorporated a more robust focus on advance care planning (ACP) and execution of Physician Orders for Scope of Treatment that were legislated in the state in July 2013. The GCS team members are expert in carrying out complex ACP discussions and also partner with the inpatient palliative care team. It is quite possible that a study of more recent outcomes will yield more positive results for the selected outcomes. Thus, for future trials that aim to study the impact of GCS in the inpatient settings, it may be advisable to include important quality markers such as implementation of ACP and patient satisfaction along with the health utilization outcomes.
Limitations
As mentioned previously, it is possible that our risk adjustment was insufficient to account for all the medical and psychosocial differences among groups. For example, the overall anticholinergic impact of various medications such as antipsychotic medications and histamine‐2 blockers was assessed via the Anticholinergic Burden Scale on admission, but we did not have information on medication prescribing during the stay. We were further limited by lack of baseline functional status and socioeconomic details, both of which are related to 30‐day readmissions. For example, living alone, prior use of assist devices, and belonging to lower socioeconomic status are correlated with higher readmission rates.[39, 40] Patients with available social support may receive more intense supervision and may seek medical attention sooner. On the other hand, worsening health among CI patients without any approximate social support may be unnoticed for days. Absence of details of inpatient interventions may also have resulted in unmeasurable confounders that could have impacted our study outcomes. Finally, lack of information on the uptake of GCS recommendations by the primary teams is another limitation of this analysis. Future trials should include strategies to address these information gaps.
CONCLUSION
Our results comparing inpatient geriatrics consultative services with usual care in hospitalized elders having cognitive impairment failed to demonstrate an impact on readmissions and mortality. A clinical lesson learned, however, is that much work is still required to reduce readmission and mortality rates in this especially vulnerable patient population.
Disclosures
Disclosures: This work was supported by grants from a Geriatric Academic Career Award (K01HP20517) through Health Resources and Services Administration, R01AG034205 and K23‐AG043476 from the National Institute on Aging, and the John A. Hartford Foundation Center for Excellence in Geriatric Medicine. The sponsors had no role in the study design, evaluation, or manuscript development. The authors report no conflicts of interest.
- , , , et al. Relationship between hospital readmission and mortality rates for patients hospitalized with acute myocardial infarction, heart failure, or pneumonia. JAMA. 2013;309(6):587–593.
- , , , Cognitive impairment. Can it predict the course of hospitalized patients? J Am Geriatr Soc. 1986;34(8):579–585.
- , , , , , Importance of functional measures in predicting mortality among older hospitalized patients. JAMA. 1998;279(15):1187–1193.
- , Understanding preventable hospital readmissions: masqueraders, markers, and true causal factors. J Hosp Med. 2011;6(2):51–53.
- , , , et al. A multicomponent intervention to prevent delirium in hospitalized older patients. N Engl J Med. 1999;340(9):669–676.
- , , , et al. Effects of a multicomponent intervention on functional outcomes and process of care in hospitalized older patients: a randomized controlled trial of Acute Care for Elders (ACE) in a community hospital. J Am Geriatr Soc. 2000;48(12):1572–1581.
- , ; American Geriatrics Society Health Care Systems Committee. Improving the quality of transitional care for persons with complex care needs. J Am Geriatr Soc. 2003;51(4):556–557.
- , , , Development and implementation of a proactive geriatrics consultation model in collaboration with hospitalists. J Am Geriatr Soc. 2009;57(11):2139–2145.
- , , , et al. Screening of the risk of functional decline performed by an inpatient geriatric consultation team in a general hospital [in French]. Revue medicale de Bruxelles. 2013;34(6):462–468.
- , , , et al. Systematic detection and multidisciplinary care of delirium in older medical inpatients: a randomized trial. CMAJ. 2002;167(7):753–759.
- , , Potentially inappropriate prescribing for geriatric inpatients: an acute care of the elderly unit compared to a general medicine service. Consult Pharm. 2003;18(1):37–42, 47–39.
- , , , Evaluation of the Mobile Acute Care of the Elderly (MACE) service. JAMA Intern Med. 2013;173(11):990–996.
- , , , , , Effects of an acute care for elders unit on costs and 30‐day readmissions. JAMA Intern Med. 2013;173(11):981–987.
- , , , et al. Impact and recognition of cognitive impairment among hospitalized elders. J Hosp Med. 2010;5(2):69–75.
- , , , et al. Enhancing care for hospitalized older adults with cognitive impairment: a randomized controlled trial. J Gen Intern Med. 2012;27(5):561–567.
- , , , Short Portable Mental Status Questionnaire as a screening test for dementia and delirium among the elderly. J Am Geriatr Soc. 1987;35(5):412–416.
- , , , et al. The Regenstrief Medical Record System: a quarter century experience. Int J Med Inform. 1999;54(3):225–253.
- , , , , , Factors determining the decision to institutionalize dementing individuals: a prospective study. Gerontologist. 1993;33(6):714–720.
- , , , , , Clarifying confusion: the confusion assessment method. A new method for detection of delirium. Ann Intern Med. 1990;113(12):941–948.
- , , , , , Resuscitation: how do we decide? A prospective study of physicians' preferences and the clinical course of hospitalized patients. JAMA. 1986;255(10):1316–1322.
- , , , et al. The APACHE III prognostic system. Risk prediction of hospital mortality for critically ill hospitalized adults. Chest. 1991;100(6):1619–1636.
- , , , et al. Interaction between cognitive impairment and discharge destination and its effect on rehospitalization. J Am Geriatr Soc. 2013;61(11):1958–1963.
- , , , , , Propensity scores in intensive care and anaesthesiology literature: a systematic review. Intensive Care Med. 2010;36(12):1993–2003.
- , , , et al. Improving functional outcomes in older patients: lessons from an acute care for elders unit. Jt Comm J Qual Improv. 1998;24(2):63–76.
- , , , et al. Developing a stroke unit using the acute care for elders intervention and model of care. J Am Geriatr Soc. 2003;51(11):1660–1667.
- , , , A medical unit for the acute care of the elderly. J Am Geriatr Soc. 1994;42(5):545–552.
- , , , , Impact of geriatric consultation teams on clinical outcome in acute hospitals: a systematic review and meta‐analysis. BMC Med. 2013;11:48.
- , , , , Comprehensive geriatric assessment for older adults admitted to hospital: meta‐analysis of randomised controlled trials. BMJ. 2011;343:d6553.
- , , , et al. Prevention of readmission in elderly patients with congestive heart failure: results of a prospective, randomized pilot study. J Gen Intern Med. 1993;8(11):585–590.
- , , , et al. Effect of a pharmacist intervention on clinically important medication errors after hospital discharge: a randomized trial. Ann Intern Med. 2012;157(1):1–10.
- , , , , House calls for seniors: building and sustaining a model of care for homebound seniors. J Am Geriatr Soc. 2009;57(6):1103–1109.
- , , , et al. Geriatric care management for low‐income seniors: a randomized controlled trial. JAMA. 2007;298(22):2623–2633.
- , , , , Interventions to reduce 30‐day rehospitalization: a systematic review. Ann Intern Med. 2011;155(8):520–528.
- , The effects of a discharge planning and home follow‐up intervention on elders hospitalized with common medical and surgical cardiac conditions. J Cardiovasc Nurs. 1999;14(1):44–54.
- Readmission to hospital: a measure of quality or outcome? Qual Saf Health Care. 2004;13(1):10–11.
- , , , , , Unintended consequences of steps to cut readmissions and reform payment may threaten care of vulnerable older adults. Health Aff (Millwood). 2012;31(7):1623–1632.
- , , Analyzing the effects of shared decision‐making, empathy and team interaction on patient satisfaction and treatment acceptance in medical rehabilitation using a structural equation modeling approach. Patient Educ Couns. 2013;91(2):167–175.
- , , , The Care Transitions Innovation (C‐TraIn) for Socioeconomically Disadvantaged Adults: results of a cluster randomized controlled trial. J Gen Intern Med. 2014;29(11):1460–1467.
- , , , Risk factors for early hospital readmission in low‐income elderly adults. J Am Geriatr Soc. 2014;62(3):489–494.
- , , , , , Understanding why patients of low socioeconomic status prefer hospitals over ambulatory care. Health Aff (Millwood). 2013;32(7):1196–1203.
© 2015 Society of Hospital Medicine
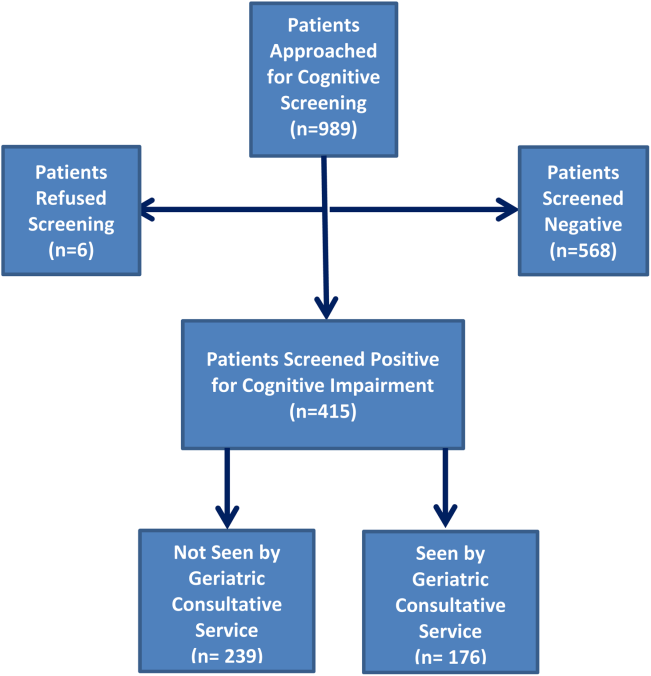
Biomechanical Evaluation of Proximally Placed Femoral Less-Invasive Stabilization System Plates
Several surgical options are available for treatment of supracondylar and intercondylar distal femur fractures, AO/OTA (Arbeitsgemeinschaft für Osteosynthesefragen/Orthopaedic Trauma Association) type 33. Preserving the osseous blood supply via indirect reduction techniques has been shown to increase union rates without the need for bone grafting.1,2 The Less-Invasive Stabilization System (LISS) made by Synthes (Paoli, Pennsylvania) melds minimally invasive internal fixation with multiple fixed-angle distal screws. It allows for submuscular placement, percutaneous unicortical screws in the diaphysis, and preservation of the metaphyseal fracture soft-tissue envelope.3
Proper lateral placement of the plate on the femur proximally can be difficult. Kregor and colleagues3 noted that 6% of cases did not have ideal placement on the lateral shaft of the femur when the 13-hole LISS plate was used. They advocated making a small incision at the proximal end of the LISS plate to aid in proper lateral placement. Kolb and colleagues4 noted that 2 of 31 patients had a “cutting out” of the proximal screws on LISS plates with anterior placement on the femur that eventually required repeat surgery in order to heal. This malpositioned plate was present at the end of the operation. These authors also recommended a proximal incision to avoid the issue. Schütz and colleagues5 noted that there were 4 cases of implant loosening among 107 distal femur fractures treated with LISS plating and that the unicortical screws in the diaphysis had loosened. They suggested anterior placement of the plate as a possible reason for fixation failure.
Although several studies have noted proximal screw pull-out, and proximal anterior malposition in the sagittal plane of the LISS plate has been suggested as a possible cause, we found no studies comparing incorrect proximal positioning on the femoral shaft with correct lateral placement of the LISS plate. Therefore, we used a previously established biomechanical model to compare LISS plates proximally placed either too anterior or too posterior to the direct lateral position on the femoral shaft. The constructs were tested in axial, torsional, and cyclical axial modes to assess plastic and total deformation, stiffness, and fixation failure.
Materials and Methods
Using fourth-generation femoral synthetic composite bones (Sawbones; Pacific Research Laboratories, Vashon, Washington) and a 13-hole Synthes femoral LISS plate, we made 3 groups of 9 specimens each, for a total of 27 femurs. The number of specimens was based on a power assessment in a study by Khalafi and colleagues.8 Several studies have validated use of Sawbones instead of cadavers in biomechanical testing to prevent variability.6-9 Proximal fixation was achieved with 5 unicortical screws (26 mm long) at screw holes 13, 11, 9, 7, and 4. All distal screw holes were filled for distal fixation with 75-mm-long screws to achieve bicortical fixation.
After application of the LISS plate, an AO/OTA 33-A3 fracture model was created in each specimen. A 1-cm gap was made 6 cm proximal to the intercondylar notch to create an unstable distal femur fracture pattern. In the method described by Zlowodzki and colleagues,10 an additional 3-cm cut was made diagonally in the medial cortex to prevent contact of the bone during mechanical testing.
Three different plate positions were used. The correct group was placed directly laterally proximally (Figure 1A). One incorrect group was plated with the proximal aspect of the plate 1 cm anterior (anterior group) (Figure 1B), and another incorrect group was plated with the proximal aspect of the plate 1 cm posterior (posterior group) (Figure 1C). Anterior or posterior plate placement resulted in some of the proximal screws having a more tangential placement, with fewer screws engaged compared with the properly placed plate.
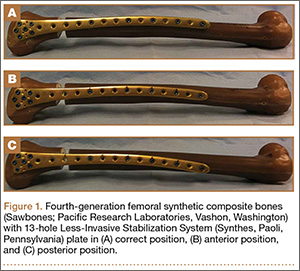
The distal and proximal ends of each specimen were held to simulate the mechanical axis of the femur. This design was based on a model by Cordey and colleagues.11 A materials testing system (MTS, Minneapolis, Minnesota) was used for mechanical testing of the model.
Based on the protocol of Khalafi and colleagues,8 the models were tested in axial, torsional, and cyclical axial modes (Figures 2, 3). Axial loading consisted of a preload of 100 N followed by a compressive loading rate of 100 mm per minute in a displacement control mode. Testing was considered completed when 1 of 3 events occurred: 500 N was reached, the medial fracture gap closed, or fixation was lost. Torsional loading involved a preload of 5 Nm and subsequent torqueing at 20° per minute up to 20 Nm or loss of fixation or screw pull-out.8 Cyclical axial loading was based on protocols described by Marti and colleagues2 and Zlowodzki and colleagues.10 The initial load was 10 cycles of 300 N. Each subsequent load increment was increased by 100 N up to 1000 N, providing 10-second rest increments. This loading was conducted in a displacement control mode at 0.75 mm per second. Testing was aborted on fixation loss or complete closure of the medial fracture gap.
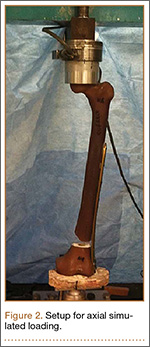

After testing was completed, statistically significant between-groups differences in plastic deformation and axial and torsional stiffness were determined by performing a Tukey-Kramer honestly significant difference test. Significance was set at P ≤ .05.
Results
During axial loading, there was no visual loss of fixation or change in displacement of the fracture gap for any group, and there was no screw cut-out or pull-out from the cortex during testing. In 1 plate in the posterior group, the most proximal screw made only loose contact with the cortex at only the distal portion of the screw. There was no significant difference (P = .9762) in stiffness in axial loading between the anterior group and the correct group. There was a significant (P = .0261) 16.4% increase in stiffness in the posterior group compared with the correct group (Table).
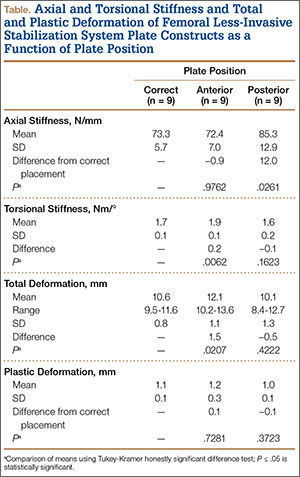
There was no screw cut-out, fixation failure, or change in displacement of the fracture gap for any group during torsional loading. There was a statistically significant (P = .0062) 12% increase in mean torsional stiffness in the anterior group compared with the correct group. There was no statistically significant difference (P = .1623) between the posterior group and the correct group (Table).
For cyclical axial testing, total deformation and plastic deformation were obtained by determining displacement under the initial 100 N load in the static/resting state. That number was then subtracted from maximum displacement, the peak value on the time-versus-displacement graph, to obtain the value for total deformation. Plastic deformation was calculated by subtracting initial displacement from final displacement in the static/resting state. The static/resting state is represented by the dips in displacement after each cycle on the time-versus-displacement graph (Figure 4).
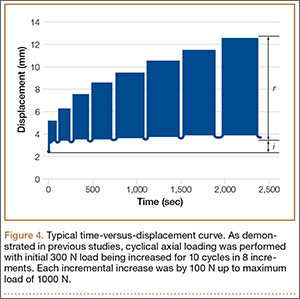
There was a statistically significant (P = .0207) 14% increase in total deformation of the anteriorly positioned plate compared with the correctly positioned plate. There was no statistically significant difference in total deformation between the posteriorly placed plates and the correctly placed plates (Table).
There was no significant difference in plastic deformation between any of the groups in this study. There was no screw cut-out or fixation loss in any group to suggest a clinically relevant difference based on proximal placement of the LISS plate.
Discussion
In evaluating the stability of various constructs for fixation of distal femur fractures, the literature is consistent in reporting stiffness as the key factor. Stiffness is determined most often in terms of motion at the fracture site, as measured by displacement under axial and torsional loads.2,8,10,13 The LISS plate, which acts essentially as an “internal fixator” with proximal unicortical fixed-angle locking screws, has been shown to be comparable to other established methods of fixation.10,12 Zlowodzki and colleagues10 reported that the LISS plate had a higher load to failure when compared with angled blade plating and intramedullary nailing. Their study used fresh-frozen cadaver specimens from patients 70 years old or older. They concluded that, for distal femur fractures in osteoporotic bone, the LISS plate provided improved distal fixation.
In the present study, the posteriorly placed LISS plate outperformed the correctly placed plate in axial stiffness by 16.4%. However, there was no statistically significant difference in torsional stiffness and cyclical axial loading. This result is difficult to explain given that there was no screw cut-out or fixation loss for any of the constructs. Theoretically, with less proximal screw purchase in the posteriorly placed plate, the overall construct should be more susceptible to screw cut-out and fixation loss resulting in less axial stiffness overall.
Khalafi and colleagues8 created a distal femur fracture model using Sawbones with a 1-cm fracture gap. Using the 9-hole LISS plate for fixation, they tested this construct under axial, torsional, and cyclical axial loads. They tested 2 groups of 9 femurs. For group 1, the LISS plate was placed in the correct position on the distal femur, with the proximal end in the correct position on the femoral shaft. In group 2, the LISS plate was rotated 1 cm anteriorly. They found that axial stiffness (N/mm) was 21.5% greater in the correctly positioned plate. The anteriorly positioned group demonstrated 55% more irreversible or plastic deformation. The authors concluded that correct positioning of the femoral LISS plate provided improved mechanical stability.
Overall, our study results did not agree with those of Khalafi and colleagues8 in terms of the mechanical stability of a malpositioned LISS plate. Our construct showed a significant increase in torsional stiffness in the anteriorly placed plate. However, our construct also showed a significant increase in total deformation in cyclical axial loading in the anteriorly placed plate. There was no increased plastic deformation in either of the incorrectly placed groups in our study. The difference in results between studies can best be explained by the difference in plate lengths. We used a 13-hole plate, and Khalafi and colleagues8 used a 9-hole plate. Our theory is that the longer plate provided more resistance to relatively minor variations in plate position at the proximal end and thus resulted in less change in stiffness and stability around the fracture site.
Our model differed from that used in other biomechanical studies using Sawbones to simulate distal femur fractures in that it used the entire femur, including the proximal portion.8,13 This setup theoretically resulted in a more anatomical weight distribution compared with other models, in which the proximal portion of the femur was potted in polymethylmethacrylate. This difference in weight distribution could explain the variation in our results compared with other biomechanical studies. In addition, with use of different boundary conditions, the distal femur had unconstrained distal motion similar to the native environment of the femur.
This study had several limitations. First is its relatively low power (9 femurs per group). Although groups of 9 specimens in 2 groups were used in the study by Khalafi and colleagues8, testing a larger number of femurs could potentially identify more subtle differences between the 3 groups in our study. Second, given that femoral LISS plates come in different lengths, this study could be expanded to include the other plate sizes, as plate length could potentially play a role in stability at the fracture site. Third, though this Sawbones model has consistently reproduced the stability characteristics of human bone without variation between specimens, an osteoporotic model could be explored, as the femoral LISS plate is often used in osteoporotic fractures.7,14
Conclusion
Overall, our study results showed that 1-cm variations, anterior or posterior, had little effect on axial or torsional stiffness or plastic deformation under cyclical axial loading. Although these data can be promising for clinical application, the anterior placement of the LISS plate noted in failed fixation in other studies necessitates cautious interpretation of this study. Our use of a 13-hole (longer) plate, versus the 9-hole plate used in other studies, could explain the lack of variation between the 2 groups as well as the stability and tolerance of inappropriate placement. An osteoporotic model could help clinicians further discern the importance of accurate proximal placement of the femoral LISS plate.
1. Bolhofner BR, Carmen B, Clifford P. The results of open reduction and internal fixation of distal femur fractures using a biologic (indirect) reduction technique. J Orthop Trauma. 1996;10(6):372-377.
2. Marti A, Frankhauser C, Frenk A, Cordey J, Gasser B. Biomechanical evaluation of the less invasive stabilization system for the internal fixation of distal femur fractures. J Orthop Trauma. 2001;15(7):482-487.
3. Kregor PJ, Stannard JA, Zlowodzki M, Cole PA. Treatment of distal femur fractures using the less invasive stabilization system. J Orthop Trauma. 2004;18(8):509-520.
4. Kolb W, Guhlmann H, Windisch C, Marx F, Kolb K, Koller H. Fixation of distal femoral fractures with the less invasive stabilization system: a minimally invasive treatment with locked fixed-angle screws. J Trauma. 2008;65(6):1425-1434.
5. Schütz M, Müller M, Krettek C, et al. Minimally invasive fracture stabilization of distal femoral fractures with the LISS: a prospective multicenter study. Results of a clinical study with special emphasis on difficult cases. Injury. 2001;32(suppl 3):SC55-SC63.
6. Chong AC, Friis EA, Ballard GP, Czuwala PJ, Cooke FW. Fatigue performance of composite analogue femur constructs under high activity loading. Ann Biomed Eng. 2007;35(7):1196-1205.
7. Heiner AD. Structural properties of fourth-generation composite femurs and tibias. J Biomech. 2008;41(15):3282-3284.
8. Khalafi A, Curtiss S, Hazelwood S, Wolinsky P. The effect of plate rotation on the stiffness of femoral LISS: a mechanical study. J Orthop Trauma. 2006;20(8):542-546.
9. Zdero R, Olsen M, Bougherara H, Schemitsch EH. Cancellous bone screw purchase: a comparison of synthetic femurs, human femurs, and finite element analysis. Proc Inst Mech Eng H. 2008;222(8):1175-1183.
10. Zlowodzki M, Williamson S, Cole PA, Zardiackas LD, Kregor PJ. Biomechanical evaluation of the less invasive stabilization system, angled blade plate, and retrograde intramedullary nail for the internal fixation of distal femur fractures. J Orthop Trauma. 2004;18(8):494-502.
11. Cordey J, Borgeaud M, Frankle, M, Harder Y, Martinet O. Loading model for the human femur taking the tension band effect of the ilio-tibial tract into account. Injury. 1999;30(suppl 1):A26-A30.
12. Weight M, Collinge C. Early results of the less invasive stabilization system for mechanically unstable fractures of the distal femur (AO/OTA types A2, A3, C2, and C3). J Orthop Trauma. 2004;18(8):503-508.
13. Otto RJ, Moed BR, Bledsoe JG. Biomechanical comparison of polyaxial-type locking plates and a fixed-angle locking plate for internal fixation of distal femur fractures. J Orthop Trauma. 2009;23(9):645–652.
14. Wong M, Leung F, Chow SP. Treatment of distal femoral fractures in the elderly using a less-invasive plating technique. Int Orthop. 2005;29(2):
117-120.
Several surgical options are available for treatment of supracondylar and intercondylar distal femur fractures, AO/OTA (Arbeitsgemeinschaft für Osteosynthesefragen/Orthopaedic Trauma Association) type 33. Preserving the osseous blood supply via indirect reduction techniques has been shown to increase union rates without the need for bone grafting.1,2 The Less-Invasive Stabilization System (LISS) made by Synthes (Paoli, Pennsylvania) melds minimally invasive internal fixation with multiple fixed-angle distal screws. It allows for submuscular placement, percutaneous unicortical screws in the diaphysis, and preservation of the metaphyseal fracture soft-tissue envelope.3
Proper lateral placement of the plate on the femur proximally can be difficult. Kregor and colleagues3 noted that 6% of cases did not have ideal placement on the lateral shaft of the femur when the 13-hole LISS plate was used. They advocated making a small incision at the proximal end of the LISS plate to aid in proper lateral placement. Kolb and colleagues4 noted that 2 of 31 patients had a “cutting out” of the proximal screws on LISS plates with anterior placement on the femur that eventually required repeat surgery in order to heal. This malpositioned plate was present at the end of the operation. These authors also recommended a proximal incision to avoid the issue. Schütz and colleagues5 noted that there were 4 cases of implant loosening among 107 distal femur fractures treated with LISS plating and that the unicortical screws in the diaphysis had loosened. They suggested anterior placement of the plate as a possible reason for fixation failure.
Although several studies have noted proximal screw pull-out, and proximal anterior malposition in the sagittal plane of the LISS plate has been suggested as a possible cause, we found no studies comparing incorrect proximal positioning on the femoral shaft with correct lateral placement of the LISS plate. Therefore, we used a previously established biomechanical model to compare LISS plates proximally placed either too anterior or too posterior to the direct lateral position on the femoral shaft. The constructs were tested in axial, torsional, and cyclical axial modes to assess plastic and total deformation, stiffness, and fixation failure.
Materials and Methods
Using fourth-generation femoral synthetic composite bones (Sawbones; Pacific Research Laboratories, Vashon, Washington) and a 13-hole Synthes femoral LISS plate, we made 3 groups of 9 specimens each, for a total of 27 femurs. The number of specimens was based on a power assessment in a study by Khalafi and colleagues.8 Several studies have validated use of Sawbones instead of cadavers in biomechanical testing to prevent variability.6-9 Proximal fixation was achieved with 5 unicortical screws (26 mm long) at screw holes 13, 11, 9, 7, and 4. All distal screw holes were filled for distal fixation with 75-mm-long screws to achieve bicortical fixation.
After application of the LISS plate, an AO/OTA 33-A3 fracture model was created in each specimen. A 1-cm gap was made 6 cm proximal to the intercondylar notch to create an unstable distal femur fracture pattern. In the method described by Zlowodzki and colleagues,10 an additional 3-cm cut was made diagonally in the medial cortex to prevent contact of the bone during mechanical testing.
Three different plate positions were used. The correct group was placed directly laterally proximally (Figure 1A). One incorrect group was plated with the proximal aspect of the plate 1 cm anterior (anterior group) (Figure 1B), and another incorrect group was plated with the proximal aspect of the plate 1 cm posterior (posterior group) (Figure 1C). Anterior or posterior plate placement resulted in some of the proximal screws having a more tangential placement, with fewer screws engaged compared with the properly placed plate.
The distal and proximal ends of each specimen were held to simulate the mechanical axis of the femur. This design was based on a model by Cordey and colleagues.11 A materials testing system (MTS, Minneapolis, Minnesota) was used for mechanical testing of the model.
Based on the protocol of Khalafi and colleagues,8 the models were tested in axial, torsional, and cyclical axial modes (Figures 2, 3). Axial loading consisted of a preload of 100 N followed by a compressive loading rate of 100 mm per minute in a displacement control mode. Testing was considered completed when 1 of 3 events occurred: 500 N was reached, the medial fracture gap closed, or fixation was lost. Torsional loading involved a preload of 5 Nm and subsequent torqueing at 20° per minute up to 20 Nm or loss of fixation or screw pull-out.8 Cyclical axial loading was based on protocols described by Marti and colleagues2 and Zlowodzki and colleagues.10 The initial load was 10 cycles of 300 N. Each subsequent load increment was increased by 100 N up to 1000 N, providing 10-second rest increments. This loading was conducted in a displacement control mode at 0.75 mm per second. Testing was aborted on fixation loss or complete closure of the medial fracture gap.
After testing was completed, statistically significant between-groups differences in plastic deformation and axial and torsional stiffness were determined by performing a Tukey-Kramer honestly significant difference test. Significance was set at P ≤ .05.
Results
During axial loading, there was no visual loss of fixation or change in displacement of the fracture gap for any group, and there was no screw cut-out or pull-out from the cortex during testing. In 1 plate in the posterior group, the most proximal screw made only loose contact with the cortex at only the distal portion of the screw. There was no significant difference (P = .9762) in stiffness in axial loading between the anterior group and the correct group. There was a significant (P = .0261) 16.4% increase in stiffness in the posterior group compared with the correct group (Table).
There was no screw cut-out, fixation failure, or change in displacement of the fracture gap for any group during torsional loading. There was a statistically significant (P = .0062) 12% increase in mean torsional stiffness in the anterior group compared with the correct group. There was no statistically significant difference (P = .1623) between the posterior group and the correct group (Table).
For cyclical axial testing, total deformation and plastic deformation were obtained by determining displacement under the initial 100 N load in the static/resting state. That number was then subtracted from maximum displacement, the peak value on the time-versus-displacement graph, to obtain the value for total deformation. Plastic deformation was calculated by subtracting initial displacement from final displacement in the static/resting state. The static/resting state is represented by the dips in displacement after each cycle on the time-versus-displacement graph (Figure 4).
There was a statistically significant (P = .0207) 14% increase in total deformation of the anteriorly positioned plate compared with the correctly positioned plate. There was no statistically significant difference in total deformation between the posteriorly placed plates and the correctly placed plates (Table).
There was no significant difference in plastic deformation between any of the groups in this study. There was no screw cut-out or fixation loss in any group to suggest a clinically relevant difference based on proximal placement of the LISS plate.
Discussion
In evaluating the stability of various constructs for fixation of distal femur fractures, the literature is consistent in reporting stiffness as the key factor. Stiffness is determined most often in terms of motion at the fracture site, as measured by displacement under axial and torsional loads.2,8,10,13 The LISS plate, which acts essentially as an “internal fixator” with proximal unicortical fixed-angle locking screws, has been shown to be comparable to other established methods of fixation.10,12 Zlowodzki and colleagues10 reported that the LISS plate had a higher load to failure when compared with angled blade plating and intramedullary nailing. Their study used fresh-frozen cadaver specimens from patients 70 years old or older. They concluded that, for distal femur fractures in osteoporotic bone, the LISS plate provided improved distal fixation.
In the present study, the posteriorly placed LISS plate outperformed the correctly placed plate in axial stiffness by 16.4%. However, there was no statistically significant difference in torsional stiffness and cyclical axial loading. This result is difficult to explain given that there was no screw cut-out or fixation loss for any of the constructs. Theoretically, with less proximal screw purchase in the posteriorly placed plate, the overall construct should be more susceptible to screw cut-out and fixation loss resulting in less axial stiffness overall.
Khalafi and colleagues8 created a distal femur fracture model using Sawbones with a 1-cm fracture gap. Using the 9-hole LISS plate for fixation, they tested this construct under axial, torsional, and cyclical axial loads. They tested 2 groups of 9 femurs. For group 1, the LISS plate was placed in the correct position on the distal femur, with the proximal end in the correct position on the femoral shaft. In group 2, the LISS plate was rotated 1 cm anteriorly. They found that axial stiffness (N/mm) was 21.5% greater in the correctly positioned plate. The anteriorly positioned group demonstrated 55% more irreversible or plastic deformation. The authors concluded that correct positioning of the femoral LISS plate provided improved mechanical stability.
Overall, our study results did not agree with those of Khalafi and colleagues8 in terms of the mechanical stability of a malpositioned LISS plate. Our construct showed a significant increase in torsional stiffness in the anteriorly placed plate. However, our construct also showed a significant increase in total deformation in cyclical axial loading in the anteriorly placed plate. There was no increased plastic deformation in either of the incorrectly placed groups in our study. The difference in results between studies can best be explained by the difference in plate lengths. We used a 13-hole plate, and Khalafi and colleagues8 used a 9-hole plate. Our theory is that the longer plate provided more resistance to relatively minor variations in plate position at the proximal end and thus resulted in less change in stiffness and stability around the fracture site.
Our model differed from that used in other biomechanical studies using Sawbones to simulate distal femur fractures in that it used the entire femur, including the proximal portion.8,13 This setup theoretically resulted in a more anatomical weight distribution compared with other models, in which the proximal portion of the femur was potted in polymethylmethacrylate. This difference in weight distribution could explain the variation in our results compared with other biomechanical studies. In addition, with use of different boundary conditions, the distal femur had unconstrained distal motion similar to the native environment of the femur.
This study had several limitations. First is its relatively low power (9 femurs per group). Although groups of 9 specimens in 2 groups were used in the study by Khalafi and colleagues8, testing a larger number of femurs could potentially identify more subtle differences between the 3 groups in our study. Second, given that femoral LISS plates come in different lengths, this study could be expanded to include the other plate sizes, as plate length could potentially play a role in stability at the fracture site. Third, though this Sawbones model has consistently reproduced the stability characteristics of human bone without variation between specimens, an osteoporotic model could be explored, as the femoral LISS plate is often used in osteoporotic fractures.7,14
Conclusion
Overall, our study results showed that 1-cm variations, anterior or posterior, had little effect on axial or torsional stiffness or plastic deformation under cyclical axial loading. Although these data can be promising for clinical application, the anterior placement of the LISS plate noted in failed fixation in other studies necessitates cautious interpretation of this study. Our use of a 13-hole (longer) plate, versus the 9-hole plate used in other studies, could explain the lack of variation between the 2 groups as well as the stability and tolerance of inappropriate placement. An osteoporotic model could help clinicians further discern the importance of accurate proximal placement of the femoral LISS plate.
1. Bolhofner BR, Carmen B, Clifford P. The results of open reduction and internal fixation of distal femur fractures using a biologic (indirect) reduction technique. J Orthop Trauma. 1996;10(6):372-377.
2. Marti A, Frankhauser C, Frenk A, Cordey J, Gasser B. Biomechanical evaluation of the less invasive stabilization system for the internal fixation of distal femur fractures. J Orthop Trauma. 2001;15(7):482-487.
3. Kregor PJ, Stannard JA, Zlowodzki M, Cole PA. Treatment of distal femur fractures using the less invasive stabilization system. J Orthop Trauma. 2004;18(8):509-520.
4. Kolb W, Guhlmann H, Windisch C, Marx F, Kolb K, Koller H. Fixation of distal femoral fractures with the less invasive stabilization system: a minimally invasive treatment with locked fixed-angle screws. J Trauma. 2008;65(6):1425-1434.
5. Schütz M, Müller M, Krettek C, et al. Minimally invasive fracture stabilization of distal femoral fractures with the LISS: a prospective multicenter study. Results of a clinical study with special emphasis on difficult cases. Injury. 2001;32(suppl 3):SC55-SC63.
6. Chong AC, Friis EA, Ballard GP, Czuwala PJ, Cooke FW. Fatigue performance of composite analogue femur constructs under high activity loading. Ann Biomed Eng. 2007;35(7):1196-1205.
7. Heiner AD. Structural properties of fourth-generation composite femurs and tibias. J Biomech. 2008;41(15):3282-3284.
8. Khalafi A, Curtiss S, Hazelwood S, Wolinsky P. The effect of plate rotation on the stiffness of femoral LISS: a mechanical study. J Orthop Trauma. 2006;20(8):542-546.
9. Zdero R, Olsen M, Bougherara H, Schemitsch EH. Cancellous bone screw purchase: a comparison of synthetic femurs, human femurs, and finite element analysis. Proc Inst Mech Eng H. 2008;222(8):1175-1183.
10. Zlowodzki M, Williamson S, Cole PA, Zardiackas LD, Kregor PJ. Biomechanical evaluation of the less invasive stabilization system, angled blade plate, and retrograde intramedullary nail for the internal fixation of distal femur fractures. J Orthop Trauma. 2004;18(8):494-502.
11. Cordey J, Borgeaud M, Frankle, M, Harder Y, Martinet O. Loading model for the human femur taking the tension band effect of the ilio-tibial tract into account. Injury. 1999;30(suppl 1):A26-A30.
12. Weight M, Collinge C. Early results of the less invasive stabilization system for mechanically unstable fractures of the distal femur (AO/OTA types A2, A3, C2, and C3). J Orthop Trauma. 2004;18(8):503-508.
13. Otto RJ, Moed BR, Bledsoe JG. Biomechanical comparison of polyaxial-type locking plates and a fixed-angle locking plate for internal fixation of distal femur fractures. J Orthop Trauma. 2009;23(9):645–652.
14. Wong M, Leung F, Chow SP. Treatment of distal femoral fractures in the elderly using a less-invasive plating technique. Int Orthop. 2005;29(2):
117-120.

Dilute Betadine Lavage Reduces Implant-Related Bacterial Burden in a Rabbit Knee Prosthetic Infection Model
Surgical site infection after arthroplasty causes substantial morbidity and potential mortality. Prosthetic joint infection (PJI) ranges from simple superficial wound infection and cellulitis to deep subfascial infection that involves the prosthesis. Consistent use of prophylactic antibiotics has reduced postoperative hip and knee arthroplasty infections to rates of 0.25% to 2%.1-4 Treatment of a patient with PJI commonly includes hospitalization, long-term intravenously administered antibiotics, resection arthroplasty, and staged reimplantation. The estimated cost of interventions reaches tens of millions of dollars annually in the United States and does not include the costs of psychosocial effects on patients and their families.5,6
Betadine (povidone-iodine) is a widely used antiseptic for skin and mucous membrane wounds and has been shown to be effective for the prevention of PJI.7 Dilute Betadine solution has been proposed as an aid in treatment of PJI.8 At a minimum concentration of 5%, cytotoxicity has been observed in chicken tibia osteoblasts.9 A balance of the bactericidal and cytotoxic activities of Betadine, while maintaining its efficacy against resistant organisms, such as methicillin-resistant Staphylococcus aureus (MRSA), is optimized at dilutions between 0.5% and 4%.10-14 We hypothesized that a dilute Betadine lavage of 3.5% would achieve a significant decrease in bacterial counts compared with an isolated saline lavage in an in vivo knee PJI model.
Materials and Methods
Animal Protocol
All surgical procedures were conducted according to the protocol approved by our institutional animal care and use committee. Using a power analysis and data obtained at our institution, we determined that 12 was the minimum number of animals needed to reach significance set at P < .05 and assuming a 50% decrease in colony-forming units (CFU) (SigmaStat Version 2.03; Aspire Software International, Ashburn, Virginia). Eight New Zealand White rabbits were used in our study; because significance was reached early, 12 were not needed. The average weight of the rabbits was 3.5 kg (weight range, 3.2-4.1 kg). All rabbits completed 1 week of acclimation before surgery.
Bacteria Preparation
A broth culture of methicillin-sensitive S aureus (MSSA) (ATCC 25923) was prepared 1 day before surgery. The bacteria were suspended in 5 mL of Trypticase Soy Broth (Becton Dickinson & Co, Franklin Lakes, New Jersey) and incubated at 37°C in a shaking incubator for 16 hours. The next day, the culture was centrifuged and irrigated twice with normal saline to remove the broth and prevent further growth. The bacteria were reconstituted in normal saline, and the concentration was standardized using a turbidity meter (LaMotte 2020e; LaMotte Co, Chestertown, Maryland), which correlated with 106 CFU/100 µl plated on trypticase soy agar plates with 10% sheep blood (Fisher Scientific, Pittsburgh, Pennsylvania).
Surgical and Postoperative Procedures
Our procedure was based on the New Zealand White rabbit knee PJI model.15 General anesthesia was induced with ketamine and xylazine, and maintained with isoflurane inhalation via a nose cone mask. Rabbits were positioned supine, and bilateral knees were shaved, prepped, and draped in a sterile fashion.
A 2-cm longitudinal incision was made over the lateral knee, and arthrotomy was performed, exposing the lateral collateral ligament attachment at the lateral femoral condyle. Using a 4-mm drill bit, a defect was drilled obliquely into the lateral femoral condyle, anterior to the lateral collateral ligament attachment. This produced a defect in the non-weight-bearing, nonarticulating portion of the knee. A fully threaded 4×14-mm stainless steel screw (Synthes, West Chester, Pennsylvania) with a U-shaped ultrahigh-molecular-weight polyethylene washer (Synthes) was inserted into the defect. The joint capsule was closed with a running 3-0 Vicryl suture (Ethicon, Somerville, New Jersey). The knee joint was inoculated with 100 µL of the S aureus preparation using a 22-gauge needle. The skin was closed with a 4-0 Biosyn suture (Ethicon). The procedure was repeated on the contralateral knee (Figures 1A, 1B).
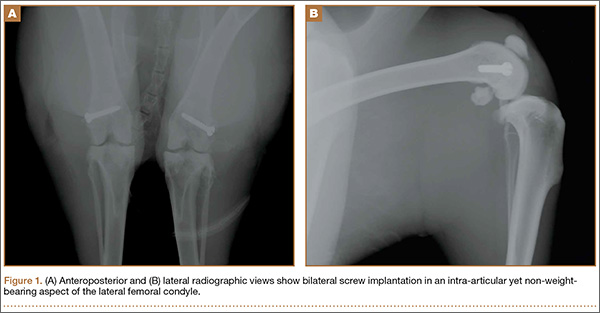
Seven days after the initial surgery, the rabbits were returned to the operating room and were anesthetized, positioned, and prepped for surgery as detailed above. Ceftriaxone (20 mg/kg of body weight) was intravenously administered to all rabbits for the treatment procedure. For each rabbit, a control knee and an experimental knee were randomly assigned. A longitudinal incision was made, exposing the previously placed implants. The screw was loosened slightly to remove the U-shaped polyethylene washer. Each knee then underwent lavage 2 times, for 90 seconds each time, with 3.5% dilute Betadine solution (experimental knee) or with normal saline (control knee). Because Pseudomonas contamination has been reported with povidone-iodine taken from unsterilized bottles,16,17 packets of sterilized povidone-iodine (Aplicare; Clorox, Oakland, California) were used. After the irrigation was complete, a new sterile polyethylene washer was placed and the screw was tightened. The wound closure was repeated as detailed above.
Postoperative analgesia was provided based on a standard institutional animal care and use committee protocol. Rabbits were permitted full cage activity and nutrition ad libitum. Wound healing, body weight, and signs of distress were monitored daily.
Outcome Measures
Seven days after surgery, the rabbits were euthanized with administration of phenobarbital (100 mg/kg of body weight). Arterial blood samples were obtained from the auricular vein to ensure that the rabbits were not systemically infected. Using a sterile technique, the screw, polyethylene washer, lateral femoral condyle bone from the defect, and joint capsule were cultured. Harvested bone and soft tissues were weighed and immediately homogenized (PowerGen Model 35 Handheld Homogenizer; Thermo Fisher Scientific, Inc, Waltham, Massachusetts). Implants were sonicated (UBATH-Y; World Precision Instruments, Inc, Sarasota, Florida) in cold saline to obtain a sensitive culture.18
Bacterial quantification was determined by using trypticase soy agar plates after 24 hours of growth. Final CFU were calculated after serial dilutions and were standardized per gram of biopsied tissues.19 Members of the team were blinded to the treatment type.
Statistical Analysis
Statistical differences in mean bacterial burden were calculated independently for lateral condyle bone, joint capsule, polyethylene, and screws by conducting a Student t test.
Results
Treatment effect was higher than expected, and the study was terminated after 8 animals completed the protocol. All 8 rabbits tolerated the procedures well and were appropriately monitored during the postoperative period. No animals had signs of systemic infection or positive blood culture. All local cultures for screw, polyethylene washer, lateral femoral condyle defect, and joint capsule were positive.
Statistically significant decreases were shown in the bacterial burden of the Betadine-irrigated screws and the Betadine-irrigated polyethylene washers compared with the saline-irrigated controls. Betadine-irrigated screws grew an average of 7.16 × 101 CFU of S aureus/g, whereas screws from control knees grew an average of 1.45 × 10³ CFU/g (P = .0003) (Figure 2). Betadine-treated washers grew an average of 1.28 × 10³ CFU/g compared with 1.62 × 10⁴ CFU/g for control washers (P =. 04) (Figure 3).
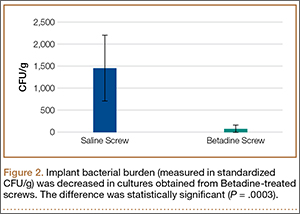
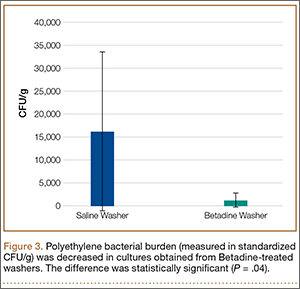
A trend toward decreased bacterial counts was shown in Betadine-treated soft tissues compared with saline-treated soft tissues, but the difference did not reach statistical significance (P = .9). Biopsied joint capsule from knees treated with Betadine grew an average of 2.84 × 10⁴ CFU/g compared with an average of 3.16 × 10⁴ CFU/g in control-rabbit knees (Figure 4). Cultured lateral condyle from Betadine-treated knees had an average bacterial load of 3.22 × 10⁴ CFU/g compared with an average bacterial load of 1 × 10⁵ CFU/g in control knees (Figure 4).
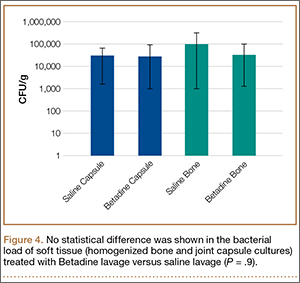
Discussion
Knees irrigated with Betadine showed a significant (P = .0003) decrease in metal implant–related S aureus bacterial counts by 20-fold and a significant (P < .05) decrease in polyethylene implant–related counts by more than 10-fold. This arthroplasty model used Betadine lavage as a treatment adjunct with intravenously administered antibiotics and polyethylene exchange. Our 1-week interval after the index procedure classifies the infection as an acute postoperative arthroplasty infection (occurring less than 4 weeks postoperatively).
The gold standard treatment for these infections is irrigation and débridement with component retention.18 The success rate has been reported to be as high as 71%20 but was closer to 44% in a study by Fridkin and colleagues,21 especially with more virulent bacteria. Staphylococcal species, higher American Society of Anesthesiologists scores, and frank pus around the prosthesis were markers of débridement failure in a recent study by Azzam and colleagues.18
The majority of postoperative joint arthroplasty infections are caused by S aureus, and the incidence of MRSA bacteria continues to rise.22 Community-acquired MRSA is increasing at an alarming rate and is now the predominant organism in skin and soft-tissue infections.23 Organism resistance also occurs at a cellular level by the formation of a glycocalyx layer, or biofilm. This layer assists in changing the phenotypic properties of the organism and decreases the efficacy of antibiotics.24 The self-produced layer of extracellular matrices, deoxyribonucleic acid, and polysaccharides attaches to inert material, preventing phagocytic action by neutrophils. In addition to antibacterial activity, povidone-iodine has antibiofilm activity against Staphylococcal species.25 The active ingredient targets the gene that produces biofilm. This correlates to our study in which the largest decrease in bacterial counts was noted on the implants.
The use of Betadine lavage has shown some promise in vivo as well. A prospective randomized controlled trial26 used 3.5% Betadine irrigation to prevent spine infection. No infections occurred in the Betadine group compared with a deep-infection rate of 2.9% in the control group. Brown and colleagues8 reviewed 1862 hip and knee arthroplasty cases before the use of Betadine lavage and 688 cases after the use of Betadine lavage and found a decrease in infection rate, from 0.97% to 0.15%. S aureus caused 13 of the 18 infections in the control group. These studies8,26 used Betadine lavage for prophylaxis and prevention of deep spine and arthroplasty infection. Betadine lavage as a treatment adjunct for acute arthroplasty infection has not been studied clinically. It has the potential to increase isolated incision and débridement success and to improve component survivorship.
Our arthroplasty model mimics an intra-articular environment and accounts for an implant–polyethylene interface.15 Limitations of our study include the use of MSSA as opposed to MRSA. However, povidone-iodine has the same effects on both MSSA and MRSA.12 We also treated our postoperative infection with 1 dose of antibiotics and not a course, although it should be noted that the single dose of ceftriaxone allowed us to isolate the independent effect of the Betadine lavage. A baseline level of infection severity could have been measured with cultures obtained at the time of irrigation and débridement. Also, a decrease in CFU does not directly correlate to a clinically significant outcome, such as a defined surgical site infection requiring intervention. Nevertheless, it is noteworthy that the decrease in bacterial counts on the stainless steel screws and polyethylene washers were maintained 1 week after the Betadine lavage.
Conclusion
Dilute Betadine lavage is a simple and inexpensive adjunct for the treatment of acute postoperative arthroplasty infection and may increase the rate of component retention. Additionally, the bactericidal and antibiofilm activities of Betadine may improve the effectiveness of systemic antibiotics. Further clinical investigation is warranted.
1. Wilson MG, Kelley K, Thornhill TS. Infection as a complication of total knee-replacement arthroplasty. Risk factors and treatment in sixty-seven cases. J Bone Joint Surg Am. 1990;72(6):878-883.
2. Ridgeway S, Wilson J, Charlet A, Kafatos G, Pearson A, Coello R. Infection of the surgical site after arthroplasty of the hip. J Bone Joint Surg Br. 2005;87(6):844-850.
3. Mahomed NN, Barrett JA, Katz JN, et al. Rates and outcomes of primary and revision total hip replacement in the United States medicare population. J Bone Joint Surg Am. 2003;85(1):27-32.
4. Mahomed NN, Barrett J, Katz JN, Baron JA, Wright J, Losina E. Epidemiology of total knee replacement in the United States Medicare population. J Bone Joint Surg Am. 2005;87(6):1222-1228.
5. Parvizi J, Zmistowski B, Adeli B. Periprosthetic joint infection: treatment options. Orthopedics. 2010;33(9):659.
6. Poultsides LA, Liaropoulos LL, Malizos KN. The socioeconomic impact of musculoskeletal infections. J Bone Joint Surg Am. 2010;92(11):e13.
7. Chundamala J, Wright JG. The efficacy and risks of using povidone-iodine irrigation to prevent surgical site infection: an evidence-based review. Can J Surg. 2007;50(6):473-481.
8. Brown NM, Cipriano CA, Moric M, Sporer SM, Della Valle CJ. Dilute betadine lavage before closure for the prevention of acute postoperative deep periprosthetic joint infection. J Arthroplasty. 2012;27(1):27-30.
9. Kaysinger KK, Nicholson NC, Ramp WK, Kellam JF. Toxic effects of wound irrigation solutions on cultured tibiae and osteoblasts. J Orthop Trauma. 1995;9(4):303-311.
10. Haley CE, Marling-Cason M, Smith JW, Luby JP, Mackowiak PA. Bactericidal activity of antiseptics against methicillin-resistant Staphylococcus aureus. J Clin Microbiol. 1985;21(6):991-992.
11. Lacey RW, Catto A. Action of povidone-iodine against methicillin-sensitive and -resistant cultures of Staphylococcus aureus. Postgrad Med J. 1993;69(3 suppl):S78-S83.
12. McLure AR, Gordon J. In-vitro evaluation of povidone-iodine and chlorhexidine against methicillin-resistant Staphylococcus aureus. J Hosp Infect. 1992;21(4):291-299.
13. Suzuki J, Komatsuzawa H, Kozai K, Nagasaka N. In vitro susceptibility of Staphylococcus aureus including MRSA to four disinfectants. ASDC J Dent Child. 1997;64(4):260-263.
14. Yasuda T, Yoshimura S, Katsuno Y, et al. Comparison of bactericidal activities of various disinfectants against methicillin-sensitive Staphylococcus aureus and methicillin-resistant Staphylococcus aureus. Postgrad Med J. 1993;69(3 suppl):S66-S69.
15. Craig MR, Poelstra KA, Sherrell JC, Kwon MS, Belzile EL, Brown TE. A novel total knee arthroplasty infection model in rabbits. J Orthop Res. 2005;23(5):1100-1104.
16. Hartman MB, Fehring TK, Jordan L, Norton HJ. Periprosthetic knee sepsis. The role of irrigation and debridement. Clin Orthop. 1991;273:113-118.
17. Mont MA, Waldman B, Banerjee C, Pacheco IH, Hungerford DS. Multiple irrigation, debridement, and retention of components in infected total knee arthroplasty. J Arthroplasty. 1997;12(4):426-433.
18. Azzam KA, Seeley M, Ghanem E, Austin MS, Purtill JJ, Parvizi J. Irrigation and debridement in the management of prosthetic joint infection: traditional indications revisited. J Arthroplasty. 2010;25(7):1022-1027.
19. Stall AC, Becker E, Ludwig SC, Gelb D, Poelstra KA. Reduction of postoperative spinal implant infection using gentamicin microspheres. Spine (Phila Pa 1976). 2009;34(5):479-483.
20. Hota B, Ellenbogen C, Hayden MK, Aroutcheva A, Rice TW, Weinstein RA. Community-associated methicillin-resistant Staphylococcus aureus skin and soft tissue infections at a public hospital: do public housing and incarceration amplify transmission? Arch Intern Med. 2007;167(10):1026-1033.
21. Fridkin SK, Hageman JC, Morrison M, et al, Active Bacterial Core Surveillance Program of the Emerging Infections Program Network. Methicillin-resistant Staphylococcus aureus disease in three communities. N Engl J Med. 2005;352(14):1436-1444.
22. Hosman AH, van der Mei HC, Bulstra SK, Busscher HJ, Neut D. Metal-on-metal bearings in total hip arthroplasties: influence of cobalt and chromium ions on bacterial growth and biofilm formation. J Biomed Mater Res A. 2009;88(3):711-716.
23. Oduwole KO, Glynn AA, Molony DC, et al. Anti-biofilm activity of sub-inhibitory povidone-iodine concentrations against Staphylococcus epidermidis and Staphylococcus aureus. J Orthop Res. 2010;28(9):1252-1256.
24. Cheng MT, Chang MC, Wang ST, Yu WK, Liu CL, Chen TH. Efficacy of dilute betadine solution irrigation in the prevention of postoperative infection of spinal surgery. Spine (Phila Pa 1976). 2005;30(15):1689-1693.
25. Anderson RL, Vess RW, Panlilio AL, Favero MS. Prolonged survival of Pseudomonas cepacia in commercially manufactured povidone-iodine. Appl Environ Microbiol. 1990;56(11):3598-3600.
26. Panlilio AL, Beck-Sague CM, Siegel JD, et al. Infections and pseudoinfections due to povidone-iodine solution contaminated with Pseudomonas cepacia. Clin Infect Dis. 1992;14(5):1078-1083.
Surgical site infection after arthroplasty causes substantial morbidity and potential mortality. Prosthetic joint infection (PJI) ranges from simple superficial wound infection and cellulitis to deep subfascial infection that involves the prosthesis. Consistent use of prophylactic antibiotics has reduced postoperative hip and knee arthroplasty infections to rates of 0.25% to 2%.1-4 Treatment of a patient with PJI commonly includes hospitalization, long-term intravenously administered antibiotics, resection arthroplasty, and staged reimplantation. The estimated cost of interventions reaches tens of millions of dollars annually in the United States and does not include the costs of psychosocial effects on patients and their families.5,6
Betadine (povidone-iodine) is a widely used antiseptic for skin and mucous membrane wounds and has been shown to be effective for the prevention of PJI.7 Dilute Betadine solution has been proposed as an aid in treatment of PJI.8 At a minimum concentration of 5%, cytotoxicity has been observed in chicken tibia osteoblasts.9 A balance of the bactericidal and cytotoxic activities of Betadine, while maintaining its efficacy against resistant organisms, such as methicillin-resistant Staphylococcus aureus (MRSA), is optimized at dilutions between 0.5% and 4%.10-14 We hypothesized that a dilute Betadine lavage of 3.5% would achieve a significant decrease in bacterial counts compared with an isolated saline lavage in an in vivo knee PJI model.
Materials and Methods
Animal Protocol
All surgical procedures were conducted according to the protocol approved by our institutional animal care and use committee. Using a power analysis and data obtained at our institution, we determined that 12 was the minimum number of animals needed to reach significance set at P < .05 and assuming a 50% decrease in colony-forming units (CFU) (SigmaStat Version 2.03; Aspire Software International, Ashburn, Virginia). Eight New Zealand White rabbits were used in our study; because significance was reached early, 12 were not needed. The average weight of the rabbits was 3.5 kg (weight range, 3.2-4.1 kg). All rabbits completed 1 week of acclimation before surgery.
Bacteria Preparation
A broth culture of methicillin-sensitive S aureus (MSSA) (ATCC 25923) was prepared 1 day before surgery. The bacteria were suspended in 5 mL of Trypticase Soy Broth (Becton Dickinson & Co, Franklin Lakes, New Jersey) and incubated at 37°C in a shaking incubator for 16 hours. The next day, the culture was centrifuged and irrigated twice with normal saline to remove the broth and prevent further growth. The bacteria were reconstituted in normal saline, and the concentration was standardized using a turbidity meter (LaMotte 2020e; LaMotte Co, Chestertown, Maryland), which correlated with 106 CFU/100 µl plated on trypticase soy agar plates with 10% sheep blood (Fisher Scientific, Pittsburgh, Pennsylvania).
Surgical and Postoperative Procedures
Our procedure was based on the New Zealand White rabbit knee PJI model.15 General anesthesia was induced with ketamine and xylazine, and maintained with isoflurane inhalation via a nose cone mask. Rabbits were positioned supine, and bilateral knees were shaved, prepped, and draped in a sterile fashion.
A 2-cm longitudinal incision was made over the lateral knee, and arthrotomy was performed, exposing the lateral collateral ligament attachment at the lateral femoral condyle. Using a 4-mm drill bit, a defect was drilled obliquely into the lateral femoral condyle, anterior to the lateral collateral ligament attachment. This produced a defect in the non-weight-bearing, nonarticulating portion of the knee. A fully threaded 4×14-mm stainless steel screw (Synthes, West Chester, Pennsylvania) with a U-shaped ultrahigh-molecular-weight polyethylene washer (Synthes) was inserted into the defect. The joint capsule was closed with a running 3-0 Vicryl suture (Ethicon, Somerville, New Jersey). The knee joint was inoculated with 100 µL of the S aureus preparation using a 22-gauge needle. The skin was closed with a 4-0 Biosyn suture (Ethicon). The procedure was repeated on the contralateral knee (Figures 1A, 1B).
Seven days after the initial surgery, the rabbits were returned to the operating room and were anesthetized, positioned, and prepped for surgery as detailed above. Ceftriaxone (20 mg/kg of body weight) was intravenously administered to all rabbits for the treatment procedure. For each rabbit, a control knee and an experimental knee were randomly assigned. A longitudinal incision was made, exposing the previously placed implants. The screw was loosened slightly to remove the U-shaped polyethylene washer. Each knee then underwent lavage 2 times, for 90 seconds each time, with 3.5% dilute Betadine solution (experimental knee) or with normal saline (control knee). Because Pseudomonas contamination has been reported with povidone-iodine taken from unsterilized bottles,16,17 packets of sterilized povidone-iodine (Aplicare; Clorox, Oakland, California) were used. After the irrigation was complete, a new sterile polyethylene washer was placed and the screw was tightened. The wound closure was repeated as detailed above.
Postoperative analgesia was provided based on a standard institutional animal care and use committee protocol. Rabbits were permitted full cage activity and nutrition ad libitum. Wound healing, body weight, and signs of distress were monitored daily.
Outcome Measures
Seven days after surgery, the rabbits were euthanized with administration of phenobarbital (100 mg/kg of body weight). Arterial blood samples were obtained from the auricular vein to ensure that the rabbits were not systemically infected. Using a sterile technique, the screw, polyethylene washer, lateral femoral condyle bone from the defect, and joint capsule were cultured. Harvested bone and soft tissues were weighed and immediately homogenized (PowerGen Model 35 Handheld Homogenizer; Thermo Fisher Scientific, Inc, Waltham, Massachusetts). Implants were sonicated (UBATH-Y; World Precision Instruments, Inc, Sarasota, Florida) in cold saline to obtain a sensitive culture.18
Bacterial quantification was determined by using trypticase soy agar plates after 24 hours of growth. Final CFU were calculated after serial dilutions and were standardized per gram of biopsied tissues.19 Members of the team were blinded to the treatment type.
Statistical Analysis
Statistical differences in mean bacterial burden were calculated independently for lateral condyle bone, joint capsule, polyethylene, and screws by conducting a Student t test.
Results
Treatment effect was higher than expected, and the study was terminated after 8 animals completed the protocol. All 8 rabbits tolerated the procedures well and were appropriately monitored during the postoperative period. No animals had signs of systemic infection or positive blood culture. All local cultures for screw, polyethylene washer, lateral femoral condyle defect, and joint capsule were positive.
Statistically significant decreases were shown in the bacterial burden of the Betadine-irrigated screws and the Betadine-irrigated polyethylene washers compared with the saline-irrigated controls. Betadine-irrigated screws grew an average of 7.16 × 101 CFU of S aureus/g, whereas screws from control knees grew an average of 1.45 × 10³ CFU/g (P = .0003) (Figure 2). Betadine-treated washers grew an average of 1.28 × 10³ CFU/g compared with 1.62 × 10⁴ CFU/g for control washers (P =. 04) (Figure 3).
A trend toward decreased bacterial counts was shown in Betadine-treated soft tissues compared with saline-treated soft tissues, but the difference did not reach statistical significance (P = .9). Biopsied joint capsule from knees treated with Betadine grew an average of 2.84 × 10⁴ CFU/g compared with an average of 3.16 × 10⁴ CFU/g in control-rabbit knees (Figure 4). Cultured lateral condyle from Betadine-treated knees had an average bacterial load of 3.22 × 10⁴ CFU/g compared with an average bacterial load of 1 × 10⁵ CFU/g in control knees (Figure 4).
Discussion
Knees irrigated with Betadine showed a significant (P = .0003) decrease in metal implant–related S aureus bacterial counts by 20-fold and a significant (P < .05) decrease in polyethylene implant–related counts by more than 10-fold. This arthroplasty model used Betadine lavage as a treatment adjunct with intravenously administered antibiotics and polyethylene exchange. Our 1-week interval after the index procedure classifies the infection as an acute postoperative arthroplasty infection (occurring less than 4 weeks postoperatively).
The gold standard treatment for these infections is irrigation and débridement with component retention.18 The success rate has been reported to be as high as 71%20 but was closer to 44% in a study by Fridkin and colleagues,21 especially with more virulent bacteria. Staphylococcal species, higher American Society of Anesthesiologists scores, and frank pus around the prosthesis were markers of débridement failure in a recent study by Azzam and colleagues.18
The majority of postoperative joint arthroplasty infections are caused by S aureus, and the incidence of MRSA bacteria continues to rise.22 Community-acquired MRSA is increasing at an alarming rate and is now the predominant organism in skin and soft-tissue infections.23 Organism resistance also occurs at a cellular level by the formation of a glycocalyx layer, or biofilm. This layer assists in changing the phenotypic properties of the organism and decreases the efficacy of antibiotics.24 The self-produced layer of extracellular matrices, deoxyribonucleic acid, and polysaccharides attaches to inert material, preventing phagocytic action by neutrophils. In addition to antibacterial activity, povidone-iodine has antibiofilm activity against Staphylococcal species.25 The active ingredient targets the gene that produces biofilm. This correlates to our study in which the largest decrease in bacterial counts was noted on the implants.
The use of Betadine lavage has shown some promise in vivo as well. A prospective randomized controlled trial26 used 3.5% Betadine irrigation to prevent spine infection. No infections occurred in the Betadine group compared with a deep-infection rate of 2.9% in the control group. Brown and colleagues8 reviewed 1862 hip and knee arthroplasty cases before the use of Betadine lavage and 688 cases after the use of Betadine lavage and found a decrease in infection rate, from 0.97% to 0.15%. S aureus caused 13 of the 18 infections in the control group. These studies8,26 used Betadine lavage for prophylaxis and prevention of deep spine and arthroplasty infection. Betadine lavage as a treatment adjunct for acute arthroplasty infection has not been studied clinically. It has the potential to increase isolated incision and débridement success and to improve component survivorship.
Our arthroplasty model mimics an intra-articular environment and accounts for an implant–polyethylene interface.15 Limitations of our study include the use of MSSA as opposed to MRSA. However, povidone-iodine has the same effects on both MSSA and MRSA.12 We also treated our postoperative infection with 1 dose of antibiotics and not a course, although it should be noted that the single dose of ceftriaxone allowed us to isolate the independent effect of the Betadine lavage. A baseline level of infection severity could have been measured with cultures obtained at the time of irrigation and débridement. Also, a decrease in CFU does not directly correlate to a clinically significant outcome, such as a defined surgical site infection requiring intervention. Nevertheless, it is noteworthy that the decrease in bacterial counts on the stainless steel screws and polyethylene washers were maintained 1 week after the Betadine lavage.
Conclusion
Dilute Betadine lavage is a simple and inexpensive adjunct for the treatment of acute postoperative arthroplasty infection and may increase the rate of component retention. Additionally, the bactericidal and antibiofilm activities of Betadine may improve the effectiveness of systemic antibiotics. Further clinical investigation is warranted.
1. Wilson MG, Kelley K, Thornhill TS. Infection as a complication of total knee-replacement arthroplasty. Risk factors and treatment in sixty-seven cases. J Bone Joint Surg Am. 1990;72(6):878-883.
2. Ridgeway S, Wilson J, Charlet A, Kafatos G, Pearson A, Coello R. Infection of the surgical site after arthroplasty of the hip. J Bone Joint Surg Br. 2005;87(6):844-850.
3. Mahomed NN, Barrett JA, Katz JN, et al. Rates and outcomes of primary and revision total hip replacement in the United States medicare population. J Bone Joint Surg Am. 2003;85(1):27-32.
4. Mahomed NN, Barrett J, Katz JN, Baron JA, Wright J, Losina E. Epidemiology of total knee replacement in the United States Medicare population. J Bone Joint Surg Am. 2005;87(6):1222-1228.
5. Parvizi J, Zmistowski B, Adeli B. Periprosthetic joint infection: treatment options. Orthopedics. 2010;33(9):659.
6. Poultsides LA, Liaropoulos LL, Malizos KN. The socioeconomic impact of musculoskeletal infections. J Bone Joint Surg Am. 2010;92(11):e13.
7. Chundamala J, Wright JG. The efficacy and risks of using povidone-iodine irrigation to prevent surgical site infection: an evidence-based review. Can J Surg. 2007;50(6):473-481.
8. Brown NM, Cipriano CA, Moric M, Sporer SM, Della Valle CJ. Dilute betadine lavage before closure for the prevention of acute postoperative deep periprosthetic joint infection. J Arthroplasty. 2012;27(1):27-30.
9. Kaysinger KK, Nicholson NC, Ramp WK, Kellam JF. Toxic effects of wound irrigation solutions on cultured tibiae and osteoblasts. J Orthop Trauma. 1995;9(4):303-311.
10. Haley CE, Marling-Cason M, Smith JW, Luby JP, Mackowiak PA. Bactericidal activity of antiseptics against methicillin-resistant Staphylococcus aureus. J Clin Microbiol. 1985;21(6):991-992.
11. Lacey RW, Catto A. Action of povidone-iodine against methicillin-sensitive and -resistant cultures of Staphylococcus aureus. Postgrad Med J. 1993;69(3 suppl):S78-S83.
12. McLure AR, Gordon J. In-vitro evaluation of povidone-iodine and chlorhexidine against methicillin-resistant Staphylococcus aureus. J Hosp Infect. 1992;21(4):291-299.
13. Suzuki J, Komatsuzawa H, Kozai K, Nagasaka N. In vitro susceptibility of Staphylococcus aureus including MRSA to four disinfectants. ASDC J Dent Child. 1997;64(4):260-263.
14. Yasuda T, Yoshimura S, Katsuno Y, et al. Comparison of bactericidal activities of various disinfectants against methicillin-sensitive Staphylococcus aureus and methicillin-resistant Staphylococcus aureus. Postgrad Med J. 1993;69(3 suppl):S66-S69.
15. Craig MR, Poelstra KA, Sherrell JC, Kwon MS, Belzile EL, Brown TE. A novel total knee arthroplasty infection model in rabbits. J Orthop Res. 2005;23(5):1100-1104.
16. Hartman MB, Fehring TK, Jordan L, Norton HJ. Periprosthetic knee sepsis. The role of irrigation and debridement. Clin Orthop. 1991;273:113-118.
17. Mont MA, Waldman B, Banerjee C, Pacheco IH, Hungerford DS. Multiple irrigation, debridement, and retention of components in infected total knee arthroplasty. J Arthroplasty. 1997;12(4):426-433.
18. Azzam KA, Seeley M, Ghanem E, Austin MS, Purtill JJ, Parvizi J. Irrigation and debridement in the management of prosthetic joint infection: traditional indications revisited. J Arthroplasty. 2010;25(7):1022-1027.
19. Stall AC, Becker E, Ludwig SC, Gelb D, Poelstra KA. Reduction of postoperative spinal implant infection using gentamicin microspheres. Spine (Phila Pa 1976). 2009;34(5):479-483.
20. Hota B, Ellenbogen C, Hayden MK, Aroutcheva A, Rice TW, Weinstein RA. Community-associated methicillin-resistant Staphylococcus aureus skin and soft tissue infections at a public hospital: do public housing and incarceration amplify transmission? Arch Intern Med. 2007;167(10):1026-1033.
21. Fridkin SK, Hageman JC, Morrison M, et al, Active Bacterial Core Surveillance Program of the Emerging Infections Program Network. Methicillin-resistant Staphylococcus aureus disease in three communities. N Engl J Med. 2005;352(14):1436-1444.
22. Hosman AH, van der Mei HC, Bulstra SK, Busscher HJ, Neut D. Metal-on-metal bearings in total hip arthroplasties: influence of cobalt and chromium ions on bacterial growth and biofilm formation. J Biomed Mater Res A. 2009;88(3):711-716.
23. Oduwole KO, Glynn AA, Molony DC, et al. Anti-biofilm activity of sub-inhibitory povidone-iodine concentrations against Staphylococcus epidermidis and Staphylococcus aureus. J Orthop Res. 2010;28(9):1252-1256.
24. Cheng MT, Chang MC, Wang ST, Yu WK, Liu CL, Chen TH. Efficacy of dilute betadine solution irrigation in the prevention of postoperative infection of spinal surgery. Spine (Phila Pa 1976). 2005;30(15):1689-1693.
25. Anderson RL, Vess RW, Panlilio AL, Favero MS. Prolonged survival of Pseudomonas cepacia in commercially manufactured povidone-iodine. Appl Environ Microbiol. 1990;56(11):3598-3600.
26. Panlilio AL, Beck-Sague CM, Siegel JD, et al. Infections and pseudoinfections due to povidone-iodine solution contaminated with Pseudomonas cepacia. Clin Infect Dis. 1992;14(5):1078-1083.
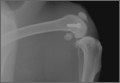
PCPs Who Adopted the Hospitalist Model
Although primary care physicians (PCPs) have traditionally treated patients in both ambulatory and hospital settings, many relinquished inpatient duties to hospitalists in recent decades.[1] Little is known about the PCPs who relinquished inpatient care duties or how the transition to the hospitalist model occurred. For example, what are the characteristics of PCPs who change? Do PCPs adopt the hospitalist model enthusiastically or cautiously? Characterizing PCPs who adopted the hospitalist model can help hospitalists understand their specialty's history and also inform health services research.
Much of the interest in the hospitalist model has been generated by studies reporting improved outcomes and lower hospital lengths of stay associated with hospitalist care.[2, 3, 4, 5] Conversely, detractors of the model point to reports of higher postacute care utilization among hospitalist patients.[6] Although these studies usually adjusted for differences among patients and hospitals, they did not account for PCP characteristics. As patients' access to PCPs and their PCP's capabilities are both plausible factors that could influence hospital length of stay (eg, decisions to complete more or less of a workup in the hospital), quality of care transitions, and postdischarge utilization, it is important to determine if PCPs who use hospitalists differ systematically from those who do not to correctly interpret health system utilization patterns that currently are attributed only to hospitalists.[7, 8]
We conducted this study to determine if observable PCP factors are associated with patients' use of hospitalists and to describe the trajectory by which PCPs referred their patients to hospitalists over time.
METHODS
Source of Data
We used claims data from 100% of Texas Medicare beneficiaries from 2000 to 2009, including Medicare beneficiary summary files, Medicare Provider Analysis and Review (MedPAR) files, Outpatient Standard Analytical Files (OutSAF), and Medicare Carrier files. Diagnosis related group (DRG)‐associated information, including weights, and Major Diagnostic Categories, were obtained from Centers for Medicare & Medicaid Services (
Establishment of the Study Cohort
Using the MedPAR file, we first selected hospital admissions from acute care hospitals in Texas for each year of the study period. We excluded beneficiaries younger than 66 years old, with incomplete Medicare Parts A and B enrollment, or with any health maintenance organization enrollment in the 12 months prior to the admission of interest. For patients with more than 1 admission in a given year, we randomly selected 1 admission. We then attempted to assign each patient to a PCP. We defined a PCP as a generalist (general practitioner, family physician, internist, or geriatrician) who saw a given beneficiary on 3 or more occasions in an outpatient setting in the year prior to the admission of interest.[9] We identified outpatient visits using Current Procedural Terminology (CPT) codes 99201 to 99205 (new patient encounters), and 99211 to 99215 (established patient encounters) from Carrier files. If more than 1 generalist physician saw the beneficiary on 3 or more occasions in a given year, the physician with more than 75% of the total outpatient evaluation and management (E&M) billings was classified as the beneficiary's PCP. Using these criteria, approximately 66% of patients were assigned to a PCP.
For cross‐sectional analyses, we restricted our cohort to beneficiaries whose PCPs were associated with at least 20 inpatients in a given year. To study trends in PCP practice patterns over time, we further restricted the cohort to beneficiaries whose PCPs were associated with at least 20 inpatients in every year of the study period, resulting in 1172 PCPs for the trajectory analyses. The reliability of PCPs' practice profiles increases as the number of patients in their panel increases. We chose 20 inpatients as the minimum because PCPs with 20 hospitalized patients per study year would achieve a reliability of 0.9 for estimating the proportion of their patients that received care from hospitalists.[10]
Identification of Hospitalists
We defined hospitalists as generalists who had at least 100 E&M billings in a given year and generated at least 90% of their total E&M billings in the year from inpatient services.[1] Inpatient E&M billings were identified by CPT codes 99221 to 99223 (new or established patient encounters), 99231 to 99233 (subsequent hospital care), and 99251 to 99255 (inpatient consultations).[1]
Patient Measures
Patient demographic information including, age at admission, gender, race/ethnicity, and Medicaid eligibility were obtained from Medicare beneficiary summary files. We used the Medicaid indicator as a proxy for low socioeconomic status. Information on weekday versus weekend admission, emergent admission, and DRG were obtained from MedPAR files. The DRG category (circulatory system, digestive system, infectious disease, nervous system, respiratory system, or other) was determined based on its Major Diagnostic Category. We determined residence in a nursing facility in the 3 months before the admission of interest from the MedPAR files and by E&M codes 99304 to 99318 (nursing facility services) from Carrier files.[11] Comorbidities were identified using the claims from MedPAR, Carrier, and OutSAF files in the year prior to the admission of interest.[12] Total hospitalizations and outpatient visits in the prior year were identified from MedPAR files and Carrier files, respectively.
PCP Measures
We categorized PCPs by specialty (general practice, gamily practice, geriatric medicine, or internal medicine), years in practice, gender, US‐ versus foreign‐trained, metropolitan statistical area (MSA) of their practice location, and board certification status. The specialty was identified from Carrier files and the other information from AMA data. For each PCP, the total number of outpatient visits and total number of patients seen as outpatients in each year was calculated based on E&M codes (9920199205, 9921199215) from Carrier files. For each year, we computed the average outpatient age, gender, race, and outpatient comorbidity for each PCP's patient panel. We computed hospital volumes using the number of hospitalized patients associated with each PCP in the study cohort.
Study Outcome
To determine whether hospitalized patients received care from hospitalists during a given hospitalization, we identified all inpatient E&M bills from generalist physicians during the admission of interest by linking MedPAR and Carrier files. If more than 50% of the generalist inpatient E&M billings from generalist physicians were from 1 or more hospitalists, the patient was considered to have received care from hospitalists.
Statistical Analyses
Multilevel analyses were used to account for the clustering of patients within PCPs. All multilevel models were adjusted for patient characteristics including age, race/ethnicity, gender, Medicaid eligibility, emergency admission, weekend admission, DRG weight, DRG category, any nursing home stay in the prior 3 months, number of comorbidities, number of hospitalizations, and number of physician visits in the year prior to the admission of interest. To analyze trends in practice patterns, we first used multilevel models to calculate the proportions of inpatients cared for by hospitalists each year for each of the 1172 PCPs with at least 20 patients. Then we employed an SAS procedure (PROC TRAJ) developed by Jones et al. to classify these PCPs into groups based on their trajectories.[13] This group‐based trajectory modeling allowed us to identify relatively homogeneous clusters within a heterogeneous sample population.[14] We chose a model that classified the PCPs into 4 groups.[15] With 4 groups, the average of the posterior probabilities of group membership for the PCPs assigned to each group exceeded 0.93, indicating a low rate of misclassification among these 4 distinct groups. For the 1172 PCPs, we tested interactions between year of hospitalization and PCP characteristics while adjusting for patient characteristics in order to investigate whether or not the impacts of PCP characteristics on how likely their patients being cared for by hospitalists differed with time. All analyses were performed with SAS version 9.2 (SAS Institute Inc., Cary, NC).
RESULTS
During the 2001 through 2009 study period, between 2252 and 2848 PCPs were associated with at least 20 hospitalized beneficiaries in any single year. Among these, 1172 PCPs were associated with at least 20 hospitalized beneficiaries in every year of the study period. These 1172 PCPs were associated with 608,686 hospitalizations over the 9 years.
Table 1 presents the characteristics of the PCPs who contributed to the cross‐sectional analyses in 2001 (N=2252) and 2009 (N=2387), as well as the 1172 PCPs for whom we had data for all 9 years for the longitudinal analyses. Most PCPs were male, trained in the United States, and were board certified. The average number of Medicare patients seen by these PCPs and number of outpatient Medicare visits went up about 7% between 2001 and 2009.
| PCP Characteristics | Cross‐Sectional Analysis | Trajectory Analysis, 20012009 | |
|---|---|---|---|
| 2001 | 2009 | ||
| |||
| Overall, no. (%) | 2,252 (100%) | 2,387 (100%) | 1,172 (100%) |
| Specialty, no. (%) | |||
| General practice | 39 (1.7%) | 34 (1.4%) | 15 (1.3%) |
| Family practice | 948 (42.1%) | 1,089 (45.6%) | 466 (39.8%) |
| Internal medicine | 1,255 (55.7%) | 1,249 (52.3%) | 688 (58.7%) |
| Geriatrics | 10 (0.4%) | 15 (0.6%) | 3 (0.3%) |
| Gender, no. (%) | |||
| Male | 1,990 (88.4%) | 2,015 (84.4%) | 1,072 (91.5%) |
| Female | 262 (11.6%) | 372 (15.6%) | 100 (8.5%) |
| Trained in the United States, no. (%) | |||
| Yes | 1,669 (74.1%) | 1,738 (72.8%) | 844 (72.0%) |
| No | 583 (25.9%) | 649 (27.2%) | 328 (28.0%) |
| Metropolitan statistical area, no. (%) | |||
| 99,999 or less | 417 (17.5) | 237 (20.2) | |
| 100,000249,000 | 438 (18.3) | 234 (20.0) | |
| 250,000999,999 | 381 (16.0) | 216 (18.4) | |
| 1,000,000 or more | 1,151 (48.2) | 485 (41.4) | |
| Board certification, no. (%) | |||
| Yes | 1,657 (69.4%) | 800 (68.3%) | |
| No | 730 (30.6%) | 372 (31.7%) | |
| Years in practice, 2001, meanSD (Q1Q3) | 22.310.6 (15.028.0) | 21.28.9 (15.027.0) | |
| Years in practice, 2009, meanSD (Q1Q3) | 25.010.2 (17.032.0) | 29.28.9 (23.035.0) | |
| Total no. of Medicare outpatient visits, 2001, meanSD (Q1Q3) | 1,624.8879.2 (1,057.51,970.0) | 1,883.39,48.5 (1,236.52,240.5) | |
| Total no. of Medicare outpatient visits, 2009, meanSD (Q1Q3) | 1,733.81,053.3 (1,080.02,048.0) | 2,020.51,200.9 (1,334.52,373.0) | |
| Total no. of Medicare outpatients, 2001, meanSD (Q1Q3) | 418.6186.9 (284.0522.0) | 473.4189.5 (338.0580.5) | |
| Total no. of Medicare outpatients, 2009, meanSD (Q1Q3) | 448.7217.8 (300.0548.0) | 508.7238.2 (350.5615.0) | |
| No. of hospitalized patients, 2001, meanSD (Q1Q3) | 46.025.0 (27.057.0) | 53.028.0 (32.066.0) | |
| No. of hospitalized patients, 2009, meanSD (Q1Q3) | 44.024.0 (26.052.0) | 52.027.0 (33.065.0) | |
| Average outpatient age, 2001, meanSD (Q1Q3) | 72.82.3 (71.574.2) | 72.82.1 (71.774.1) | |
| Average outpatient age, 2009, meanSD (Q1Q3) | 72.12.8 (70.673.9) | 72.82.7 (71.474.5) | |
| Average outpatient gender (% male), 2001, meanSD (Q1Q3) | 38.17.0 (35.542.3) | 38.56.4 (36.242.3) | |
| Average outpatient gender (% male), 2009, meanSD (Q1Q3) | 40.27.6 (37.644.8) | 41.06.5 (38.644.8) | |
| Average outpatient race (% white), 2001, meanSD (Q1Q3) | 84.316.4 (79.295.5) | 85.414.3 (79.995.7) | |
| Average outpatient race (% white), 2009, meanSD (Q1Q3) | 85.214.4 (79.895.2) | 86.312.9 (80.895.6) | |
| Average outpatient comorbidity, 2001, meanSD (Q1Q3)a | 1.60.5 (1.21.8) | 1.60.4 (1.21.8) | |
| Average outpatient comorbidity, 2009, meanSD (Q1Q3)a | 2.20.6 (1.82.5) | 2.20.6 (1.72.5) | |
Figure 1 graphs the percentage of PCPs as a function of what percent of their hospitalized patients received care from hospitalists, and how that changed from 2001 to 2009. For 70.9% of PCPs, fewer than 5% of their hospitalized patients received hospitalist care in 2001. By 2009, the percent of PCPs in this category had decreased to 15.2%. In contrast, in 2001, more than half of the patients for 2.1% of PCPs received hospitalist care, and the percent of PCPs in this category increased to 26.3% by 2009.
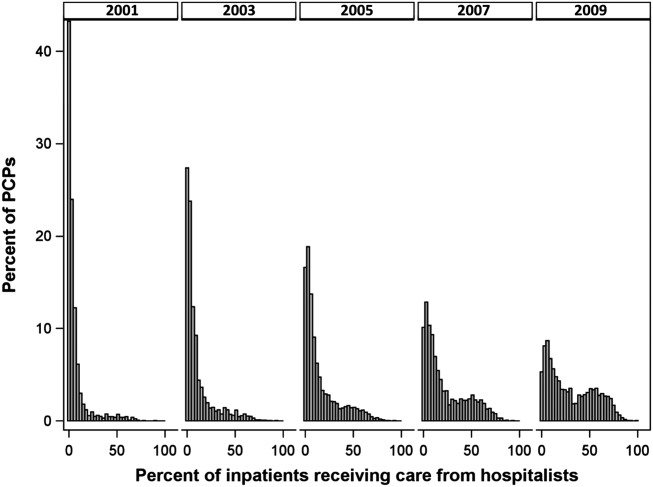
The pattern in Figure 1 shows that PCPs' use of hospitalists changed continuously and gradually over time. However, this pattern describes the PCPs as a group. When examined at the individual PCP level, different patterns emerge. Figure 2, which presents selected individual PCP's use of hospitalists over time, shows several distinct subpatterns of PCP practice behaviors. First, there are PCPs whose use of hospitalists was high in 2001 and stayed high or increased over time (eg, PCP A). There also were PCPs whose use of hospitalists stayed low over the entire study period (eg, PCP B). Finally, there were PCPs whose use of hospitalists was low in 2001 but high in 2009 (eg, PCP C). For this last group, the pattern of change in hospitalist utilization over time was discontinuous; that is, most of the increase occurred over a 1‐ or 2‐year period, instead of increasing gradually over time.
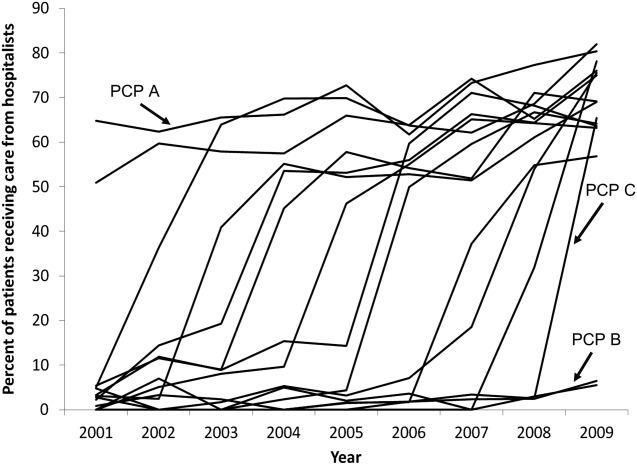
Among the 1172 PCPs associated with 20 hospitalized beneficiaries each year in all 9 years of the study period, group‐based trajectory modeling classified their practice patterns into 4 distinct trajectories (Figure 3). Among PCPs in group 1, more than one‐third of their hospitalized patients were cared for by hospitalists in 2001, and this increased to 60% by 2009. PCPs in groups 2 and 3 rarely used hospitalist care in 2001 but increased their use over time. The increase started early in the period for PCPs in group 2 and later for those in group 3. PCPs in group 4 were associated with little hospitalist use throughout the study period.
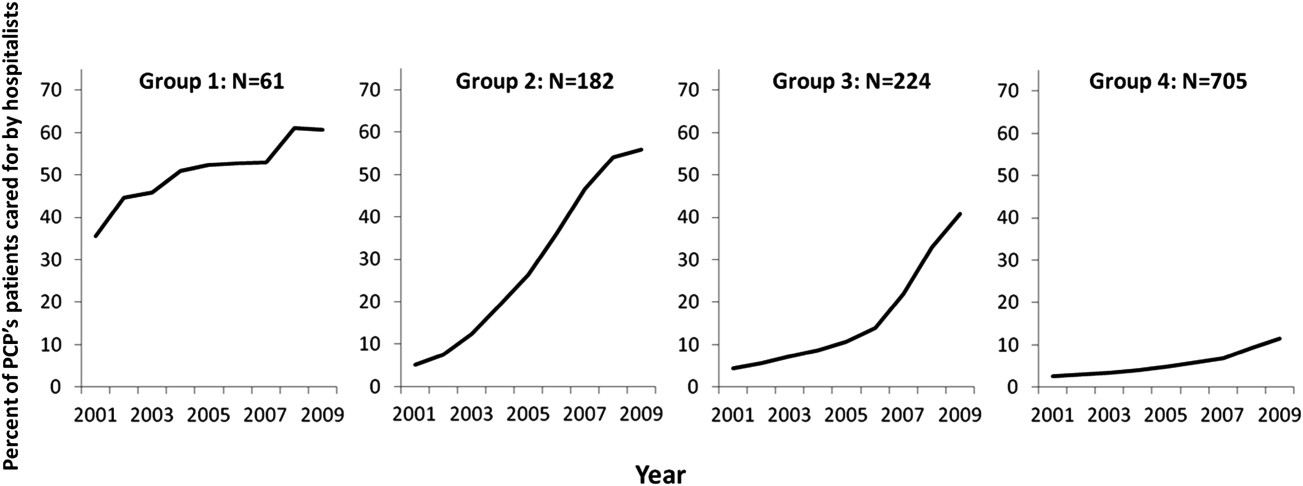
We constructed a model to describe the odds of a patient receiving care from hospitalists during the study period using patients associated with these 1172 PCPs. After adjusting for patient characteristics, the residual intraclass correlation coefficient for PCP level was 0.334, which indicates that 33.4% of the variance in whether a hospitalized patient received care from a hospitalist is explained by which PCP the patient saw. When adjusting for both patient and PCP characteristics, the overall odds of a patient receiving hospitalist care increased by 30% (95% confidence interval [CI]: 1.29‐1.30) per year from 2001 through 2009.
There were also significant interactions between year of hospitalization and several PCP characteristics. These interactions are illustrated in Table 2, which stratifies each of those PCP characteristics by 3 time periods: 2001 to 2003, 2004 to 2006, and 2007 to 2009. In all time periods, patients were more likely to receive hospitalist care if their PCP was US trained (US vs international medical graduate: odds ratio [OR]: 1.42, 95% CI: 1.19‐1.69 in 20012003; OR: 1.46, 95% CI: 1.23‐1.73 in 20072009), or specialized in family medicine (family medicine vs internal medicine: OR: 1.46, 95% CI: 1.25‐1.72 in 20012003; OR: 1.46, 95% CI: 1.25‐1.70 in 20072009). Over time, the relative odds of a patient receiving care from hospitalists decreased if their PCP was female (female vs male: OR: 1.91, 95% CI: 1.46‐2.50 in 20012003 vs OR: 1.50, 95% CI: 1.15‐1.95 in 20072009) or practiced in an urban area (largest vs smallest MSA: OR: 3.34, 95% CI: 2.72‐4.09 in 20012003; OR: 2.22, 95% CI: 1.82‐2.71 in 20072009). Although the longest‐practicing PCPs were most likely to use hospitalists in the early 2000s, this effect disappeared by 2007 to 2009 (most vs least years in practice: OR: 1.35, 95% CI: 1.06‐1.72 in 20012003 vs OR: 0.92, 95% CI: 0.73‐1.17 in 20072009).
| PCP Characteristics | 20012003, OR (95% CI) | 20042006, OR (95% CI) | 20072009, OR (95% CI) |
|---|---|---|---|
| |||
| Family practicea vs. internal medicineb | 1.46 (1.251.72) | 1.50 (1.281.76) | 1.46 (1.251.70) |
| Female vs male | 1.91 (1.462.50) | 1.43 (1.091.86) | 1.50 (1.151.95) |
| United States trained (yes vs no) | 1.42 (1.191.69) | 1.53 (1.281.81) | 1.46 (1.231.73) |
| Metropolitan statistical area | |||
| 99,999 or less | 1.00 | 1.00 | 1.00 |
| 100,000249,000 | 0.83 (0.651.05) | 1.00 (0.791.25) | 1.13 (0.901.41) |
| 250,000999,999 | 0.92 (0.721.17) | 1.03 (0.821.31) | 0.98 (0.771.23) |
| 1,000,000 or more | 3.34 (2.724.09) | 2.90 (2.373.54) | 2.22 (1.822.71) |
| Years in practice, 2001 | |||
| Q1 (lowest) | 1.00 | 1.00 | 1.00 |
| Q2 | 0.89 (0.711.12) | 0.83 (0.671.04) | 0.92 (0.741.14) |
| Q3 | 1.06 (0.841.34) | 0.99 (0.791.24) | 1.03 (0.821.29) |
| Q4 | 1.25 (0.991.59) | 1.13 (0.891.42) | 1.15 (0.921.45) |
| Q5 (highest) | 1.35 (1.061.72) | 1.05 (0.831.33) | 0.92 (0.731.17) |
| Total no. of outpatient visitsc | |||
| Q1 (lowest) | 1.00 | 1.00 | 1.00 |
| Q2 | 1.21 (1.121.30) | 1.07 (1.001.14) | 1.13 (1.071.19) |
| Q3 | 1.42 (1.301.54) | 1.18 (1.091.27) | 1.14 (1.071.22) |
| Q4 | 1.34 (1.211.47) | 1.34 (1.231.46) | 1.25 (1.161.35) |
| Q5 (highest) | 1.46 (1.301.63) | 1.33 (1.211.47) | 1.32 (1.201.44) |
| No. of hospitalized patientsc | |||
| Q1 (lowest) | 1.00 | 1.00 | 1.00 |
| Q2 | 1.07 (1.001.15) | 0.91 (0.860.96) | 0.85 (0.810.89) |
| Q3 | 1.00 (0.921.08) | 0.87 (0.820.93) | 0.74 (0.700.79) |
| Q4 | 0.89 (0.810.97) | 0.76 (0.710.82) | 0.62 (0.580.67) |
| Q5 (highest) | 1.05 (0.951.18) | 0.67 (0.610.73) | 0.55 (0.510.60) |
| Average outpatient agec | |||
| Q1 (lowest) | 1.00 | 1.00 | 1.00 |
| Q2 | 0.94 (0.871.01) | 1.15 (1.081.23) | 1.18 (1.111.25) |
| Q3 | 0.82 (0.760.90) | 1.05 (0.971.13) | 1.17 (1.091.25) |
| Q4 | 0.71 (0.650.79) | 1.03 (0.951.12) | 1.10 (1.021.19) |
| Q5 (highest) | 0.72 (0.640.81) | 1.12 (1.011.23) | 1.15 (1.051.26) |
| Average outpatient gender (% male)c | |||
| Q1 (lowest) | 1.00 | 1.00 | 1.00 |
| Q2 | 1.10 (1.021.18) | 1.19 (1.101.27) | 1.27 (1.181.37) |
| Q3 | 1.12 (1.031.22) | 1.27 (1.171.37) | 1.43 (1.321.54) |
| Q4 | 1.36 (1.251.48) | 1.49 (1.371.61) | 1.52 (1.401.65) |
| Q5 (highest) | 1.47 (1.341.61) | 1.84 (1.682.00) | 1.68 (1.541.83) |
| Average outpatient race (% white)c | |||
| Q1 (lowest) | 1.00 | 1.00 | 1.00 |
| Q2 | 1.08 (0.981.20) | 1.01 (0.921.10) | 1.23 (1.131.34) |
| Q3 | 1.27 (1.131.43) | 1.06 (0.951.18) | 1.21 (1.091.34) |
| Q4 | 1.47 (1.291.67) | 0.97 (0.861.09) | 1.33 (1.181.48) |
| Q5 (highest) | 1.39 (1.211.59) | 1.18 (1.041.34) | 1.25 (1.101.42) |
| Average outpatient comorbidityc | |||
| Q1 (lowest) | 1.00 | 1.00 | 1.00 |
| Q2 | 1.26 (1.191.35) | 1.23 (1.161.31) | 1.22 (1.141.30) |
| Q3 | 1.62 (1.491.75) | 1.61 (1.501.72) | 1.43 (1.341.54) |
| Q4 | 1.96 (1.792.15) | 1.86 (1.722.02) | 1.59 (1.471.72) |
| Q5 (highest) | 1.79 (1.592.01) | 2.20 (2.002.41) | 2.03 (1.852.22) |
In terms of PCP workload, patients of PCPs with high outpatient activity were more likely to receive hospitalists care throughout the study period, although the association had decreased by 2007 to 2009 (highest vs lowest outpatient volume: OR: 1.46, 95% CI: 1.30‐1.63 in 20012003 vs OR: 1.32, 95% CI: 1.20‐1.44 in 20072009). In contrast, PCPs with the lowest inpatient volumes became more likely to use hospitalists by the end of the study period (highest vs lowest inpatient volume: OR: 1.05, 95% CI: 0.95‐1.18 in 20012003 vs OR: 0.55, 95% CI: 0.51‐0.60 in 20072009).
The characteristics of PCPs' practice panels also were associated with patients' likelihood of receiving care from hospitalists. PCPs whose practice panels consisted of patients who were predominantly male, white, or with more outpatient comorbidities were consistently more likely to use hospitalists throughout the study period. PCPs with older patient panels were less likely to use hospitalists in 2001 to 2003, but by 2007 to 2009, they were slightly more likely to do so (oldest vs youngest average outpatient panel age: OR: 0.72, 95% CI: 0.64‐0.81 in 20012003 vs OR: 1.15, 95% CI: 1.05‐1.26 in 20072009).
CONCLUSIONS
Prior studies of the hospitalist model have shown that the likelihood of a patient receiving inpatient care from hospitalists is associated with patient characteristics, hospital characteristics, geographic region, and type of admission.[1, 16, 17] We found that PCP characteristics also predict whether patients receive care from hospitalists and that their use of hospitalists developed dynamically between 2001 to 2009. Although many factors (such as whether patients were admitted to a hospital where their PCP had admitting privileges) can influence the decision to use hospitalists, we found that over one‐third of the variance in whether a hospitalized patient received care from a hospitalist is explained by which PCP the patient saw. In showing that systemic differences exist among PCPs who use hospitalists and those who do not, our study suggests that future research on the hospitalist model should, if possible, adjust for PCP characteristics in addition to hospital and patient factors.
Although this study identifies the existence and magnitude of differences in whether or not PCPs use hospitalists, it cannot explain why the differences exist. We only can offer hypotheses. For example, our finding that PCPs with the most years of practice experience were more likely to use hospitalists in the early 2000s but not in more recent years suggests that in hospital medicine's early years, long‐practicing generalist physicians were choosing between practicing traditionalist medicine and adopting the hospitalists model, but by 2009, experienced generalist physicians had already specialized to either inpatient or outpatient settings earlier in their careers. On the other hand, the decreasing odds of urban PCPs using hospitalists may reflect a relative growth in hospitalist use in less populated areas rather than a change in urban PCPs' practice patterns.
PCPs trained in family medicine have reported less inpatient training and less comfort with providing hospital care,[18, 19] thus it is unsurprising that family physicians were more likely to refer patients to hospitalists. Although a recent study reported that family physicians' inpatient volumes remained constant, whereas those of outpatient internists declined between 2003 and 2012, the analysis used University Health Consortium data and thus reflects practice patterns in academic medical centers.[20] Our data suggest that outside of academia, family physicians have embraced the hospitalists as clinical partners.
Meltzer and Chung had previously proposed an economic model to describe the growing use of hospitalists in the United States. They posited that decisions to adopt the hospitalist model are governed by trade‐offs between coordination costs (eg, time and effort spent coordinating multiple providers across different settings) and switching costs (eg, time spent traveling between the office and the hospital or the effort of adjusting to different work settings).[16] The authors hypothesized that empirical testing of this model would show PCPs are more likely to use hospitalists if they have less available professional time (ie, work fewer hours per week), are female (due to competing demands from domestic responsibilities), have relatively few hospitalized patients, or live in areas with high traffic congestion. Our findings provide empirical evidence to support their division‐of‐labor model in showing that patients were more likely to receive hospitalist care if their PCP was female, practiced in an urban location, had higher outpatient practice volumes, or had lower inpatient volumes.
At first glance, some of our findings appear to contradict our earlier study, which showed that younger, black, male patients are more likely to receive inpatient care from hospitalists.[1] However, that study included patients regardless of whether they had a PCP. This study shows that when patients have a PCP, their PCPs are more likely to refer them to hospitalists if they are older, white, male, and have more comorbid conditions. A potential explanation for this finding is that PCPs may preferentially use hospitalists when caring for older and sicker hospitalized patients. For example, commentators often cite hospitalists' constant availability in the hospital as a valuable resource when caring for acutely ill patients.[21, 22]
Another potential explanation is that despite their preferences, PCPs who care for younger, minority patients lack access to hospitalist services. One large study of Medicare beneficiaries reported that physicians who care for black patients are less well‐trained clinically and often lack access to important clinical resources such as diagnostic imaging and nonemergency hospital admissions.[23] Similarly, international medical graduates are more likely than their US‐trained counterparts to care for underserved patients and to practice in small, independent offices.[24, 25, 26] As hospitalist groups often rely on cross‐subsidization from sources within a large healthcare organization, independent PCPs may have less access to their services when compared with PCPs in managed care organizations or large integrated groups. Viewed in this context, our findings imply that although hospitalists often care for socioeconomically vulnerable patients (eg, younger, uninsured, black men) who lack access to primary care services,[1] they also appear to share care responsibilities for more complex hospitalized patients with PCPs in more affluent communities. Further research may determine if the availability of hospitalists influences racial disparities in hospital care.
Our study has limitations. It is an observational study and thus subject to bias and confounding. As our cohort was formed using fee‐for‐service Medicare data in a single, large state, it may not be generalizable to PCPs who practice in other states, who care for a younger population, or who do not accept Medicare. Our findings also may not reflect the practice patterns of physicians‐in‐training, PCP populations with high board‐certification rates, those employed in temporary positions, or those who interrupt their practices for personal reasons, as we restricted our study to established PCPs who had been in practice long and consistently enough to be associated with 20 hospitalized patients during every year of the study. For example, the lower proportion of female PCPs in our cohort (15.6% in our study in 2009 vs 27.5% reported in a nationally representative 2008 survey[27]) may be explained by our exclusion of women who take prolonged time off for childcare duties. We also did not establish whether patient outcomes or healthcare costs differ between PCPs who adopted the hospitalist model and traditionalists. Finally, we could not examine the effect of a number of PCP factors that could plausibly influence whether or not PCPs relinquish inpatient care to hospitalists, such as their comfort with providing inpatient care, having hospital admitting privileges, having office‐based access to hospitals' electronic medical records, or the distance between their office and the hospital. However, this study lays the groundwork for future studies to explore these factors.
In summary, this study is the first, to our knowledge, to characterize PCPs who relinquished inpatient responsibilities to hospitalists. Our findings suggest that some groups of PCPs are more likely to refer patient to hospitalists, that the relationship between hospitalists and PCPs has evolved over time, and that the hospitalist model still has ample room to grow.
ACKNOWLEDGMENTS
Disclosures: This study was supported by grants from the National Institute on Aging (1RO1‐AG033134 and P30‐AG024832) and the National Cancer Institute (K05‐CA124923). The authors have no financial conflicts of interest to disclose. An oral abstract of this article was presented on May 18, 2013 at the Society of Hospital Medicine Annual Meeting in National Harbor, Maryland.
- , , , . Growth in the care of older patients by hospitalists in the United States. N Engl J Med. 2009;360(11):1102–1112.
- , . Effect of hospitalists on length of stay in the medicare population: variation according to hospital and patient characteristics. J Am Geriatr Soc. 2010;58(9):1649–1657.
- , , , , , . Outcomes of care by hospitalists, general internists, and family physicians. N Engl J Med. 2007;357(25):2589–2600.
- , , , , . Hospitalist care and length of stay in patients requiring complex discharge planning and close clinical monitoring. Arch Intern Med. 2007;167(17):1869–1874.
- , . The impact of hospitalists on the cost and quality of inpatient care in the United States: a research synthesis. Med Care Res Rev. 2005;62(4):379–406.
- , . Association of hospitalist care with medical utilization after discharge: evidence of cost shift from a cohort study. Ann Intern Med. 2011;155(3):152–159.
- , . Hospital care and medical utilization after discharge. Ann Intern Med. 2011;155(10):719–720; author reply 722.
- . Hospital care and medical utilization after discharge. Ann Intern Med. 2011;155(10):721; author reply 722.
- , , , , , . Administrative data algorithms can describe ambulatory physician utilization. Health Serv Res. 2007;42:1783–1796.
- , . Estimating the reliability of continuous measures with Cronbach's alpha or the intraclass correlation coefficient: toward the integration of two traditions. J Clin Epidemiol. 1991;44(4–5):381–390.
- , , . Ability of Medicare claims data to identify nursing home patients: a validation study. Med Care. 2008;46(11):1184–1187.
- , , , . Comorbidity measures for use with administrative data. Med Care. 1998;36(1):8–27.
- , , . A SAS procedure based on mixture models for estimating developmental trajectories. Sociol Methods Res. 2001;29(3):374–393.
- . Group‐Based Modeling of Development. Cambridge, MA: Harvard University Press; 2005.
- , . Group‐based trajectory modeling in clinical research. Annu Rev Clin Psychol. 2010;6:109–138.
- , . Coordination, switching costs and the division of labor in general medicine: an economic explanation for the emergence of hospitalists in the United States. National Bureau of Economic Research Working Paper Series No. 16040. Cambridge, MA: National Bureau of Economic Research; 2010.
- , , , , , . Continuity of outpatient and inpatient care by primary care physicians for hospitalized older adults. JAMA. 2009;301(16):1671–1680.
- . Hospitalists and family physicians: understanding opportunities and risks. J Fam Pract. 2004;53(6):473–481.
- , , , , , . Preparedness of internal medicine and family practice residents for treating common conditions. JAMA. 2002;288(20):2609–2614.
- , , , . The status of adult inpatient care by family physicians at US academic medical centers and affiliated teaching hospitals 2003 to 2012: the impact of the hospitalist movement. Fam Med. 2014;46(2):94–99.
- . Hospitalists and the hospital medicine system of care are good for patient care. Arch Intern Med. 2008;168(12):1254–1256; discussion 1259–1260.
- . Hospitalists in the United States—mission accomplished or work in progress? N Engl J Med. 2004;350(19):1935–1936.
- , , , , . Primary care physicians who treat blacks and whites. N Engl J Med. 2004;351(6):575–584.
- , , , . International medical graduates and the primary care workforce for rural underserved areas. Health Aff (Millwood). 2003;22(2):255–262.
- , , . Medical migration and the physician workforce. International medical graduates and American medicine. JAMA. 1995;273(19):1521–1527.
- , , , , . International medical graduates in family medicine in the United States of America: an exploration of professional characteristics and attitudes. Hum Resour Health. 2006;4:17.
- , , . A snapshot of U.S. physicians: key findings from the 2008 Health Tracking Physician Survey. Data Bull (Cent Stud Health Syst Change). 2009(35):1–11.
Although primary care physicians (PCPs) have traditionally treated patients in both ambulatory and hospital settings, many relinquished inpatient duties to hospitalists in recent decades.[1] Little is known about the PCPs who relinquished inpatient care duties or how the transition to the hospitalist model occurred. For example, what are the characteristics of PCPs who change? Do PCPs adopt the hospitalist model enthusiastically or cautiously? Characterizing PCPs who adopted the hospitalist model can help hospitalists understand their specialty's history and also inform health services research.
Much of the interest in the hospitalist model has been generated by studies reporting improved outcomes and lower hospital lengths of stay associated with hospitalist care.[2, 3, 4, 5] Conversely, detractors of the model point to reports of higher postacute care utilization among hospitalist patients.[6] Although these studies usually adjusted for differences among patients and hospitals, they did not account for PCP characteristics. As patients' access to PCPs and their PCP's capabilities are both plausible factors that could influence hospital length of stay (eg, decisions to complete more or less of a workup in the hospital), quality of care transitions, and postdischarge utilization, it is important to determine if PCPs who use hospitalists differ systematically from those who do not to correctly interpret health system utilization patterns that currently are attributed only to hospitalists.[7, 8]
We conducted this study to determine if observable PCP factors are associated with patients' use of hospitalists and to describe the trajectory by which PCPs referred their patients to hospitalists over time.
METHODS
Source of Data
We used claims data from 100% of Texas Medicare beneficiaries from 2000 to 2009, including Medicare beneficiary summary files, Medicare Provider Analysis and Review (MedPAR) files, Outpatient Standard Analytical Files (OutSAF), and Medicare Carrier files. Diagnosis related group (DRG)‐associated information, including weights, and Major Diagnostic Categories, were obtained from Centers for Medicare & Medicaid Services (
Establishment of the Study Cohort
Using the MedPAR file, we first selected hospital admissions from acute care hospitals in Texas for each year of the study period. We excluded beneficiaries younger than 66 years old, with incomplete Medicare Parts A and B enrollment, or with any health maintenance organization enrollment in the 12 months prior to the admission of interest. For patients with more than 1 admission in a given year, we randomly selected 1 admission. We then attempted to assign each patient to a PCP. We defined a PCP as a generalist (general practitioner, family physician, internist, or geriatrician) who saw a given beneficiary on 3 or more occasions in an outpatient setting in the year prior to the admission of interest.[9] We identified outpatient visits using Current Procedural Terminology (CPT) codes 99201 to 99205 (new patient encounters), and 99211 to 99215 (established patient encounters) from Carrier files. If more than 1 generalist physician saw the beneficiary on 3 or more occasions in a given year, the physician with more than 75% of the total outpatient evaluation and management (E&M) billings was classified as the beneficiary's PCP. Using these criteria, approximately 66% of patients were assigned to a PCP.
For cross‐sectional analyses, we restricted our cohort to beneficiaries whose PCPs were associated with at least 20 inpatients in a given year. To study trends in PCP practice patterns over time, we further restricted the cohort to beneficiaries whose PCPs were associated with at least 20 inpatients in every year of the study period, resulting in 1172 PCPs for the trajectory analyses. The reliability of PCPs' practice profiles increases as the number of patients in their panel increases. We chose 20 inpatients as the minimum because PCPs with 20 hospitalized patients per study year would achieve a reliability of 0.9 for estimating the proportion of their patients that received care from hospitalists.[10]
Identification of Hospitalists
We defined hospitalists as generalists who had at least 100 E&M billings in a given year and generated at least 90% of their total E&M billings in the year from inpatient services.[1] Inpatient E&M billings were identified by CPT codes 99221 to 99223 (new or established patient encounters), 99231 to 99233 (subsequent hospital care), and 99251 to 99255 (inpatient consultations).[1]
Patient Measures
Patient demographic information including, age at admission, gender, race/ethnicity, and Medicaid eligibility were obtained from Medicare beneficiary summary files. We used the Medicaid indicator as a proxy for low socioeconomic status. Information on weekday versus weekend admission, emergent admission, and DRG were obtained from MedPAR files. The DRG category (circulatory system, digestive system, infectious disease, nervous system, respiratory system, or other) was determined based on its Major Diagnostic Category. We determined residence in a nursing facility in the 3 months before the admission of interest from the MedPAR files and by E&M codes 99304 to 99318 (nursing facility services) from Carrier files.[11] Comorbidities were identified using the claims from MedPAR, Carrier, and OutSAF files in the year prior to the admission of interest.[12] Total hospitalizations and outpatient visits in the prior year were identified from MedPAR files and Carrier files, respectively.
PCP Measures
We categorized PCPs by specialty (general practice, gamily practice, geriatric medicine, or internal medicine), years in practice, gender, US‐ versus foreign‐trained, metropolitan statistical area (MSA) of their practice location, and board certification status. The specialty was identified from Carrier files and the other information from AMA data. For each PCP, the total number of outpatient visits and total number of patients seen as outpatients in each year was calculated based on E&M codes (9920199205, 9921199215) from Carrier files. For each year, we computed the average outpatient age, gender, race, and outpatient comorbidity for each PCP's patient panel. We computed hospital volumes using the number of hospitalized patients associated with each PCP in the study cohort.
Study Outcome
To determine whether hospitalized patients received care from hospitalists during a given hospitalization, we identified all inpatient E&M bills from generalist physicians during the admission of interest by linking MedPAR and Carrier files. If more than 50% of the generalist inpatient E&M billings from generalist physicians were from 1 or more hospitalists, the patient was considered to have received care from hospitalists.
Statistical Analyses
Multilevel analyses were used to account for the clustering of patients within PCPs. All multilevel models were adjusted for patient characteristics including age, race/ethnicity, gender, Medicaid eligibility, emergency admission, weekend admission, DRG weight, DRG category, any nursing home stay in the prior 3 months, number of comorbidities, number of hospitalizations, and number of physician visits in the year prior to the admission of interest. To analyze trends in practice patterns, we first used multilevel models to calculate the proportions of inpatients cared for by hospitalists each year for each of the 1172 PCPs with at least 20 patients. Then we employed an SAS procedure (PROC TRAJ) developed by Jones et al. to classify these PCPs into groups based on their trajectories.[13] This group‐based trajectory modeling allowed us to identify relatively homogeneous clusters within a heterogeneous sample population.[14] We chose a model that classified the PCPs into 4 groups.[15] With 4 groups, the average of the posterior probabilities of group membership for the PCPs assigned to each group exceeded 0.93, indicating a low rate of misclassification among these 4 distinct groups. For the 1172 PCPs, we tested interactions between year of hospitalization and PCP characteristics while adjusting for patient characteristics in order to investigate whether or not the impacts of PCP characteristics on how likely their patients being cared for by hospitalists differed with time. All analyses were performed with SAS version 9.2 (SAS Institute Inc., Cary, NC).
RESULTS
During the 2001 through 2009 study period, between 2252 and 2848 PCPs were associated with at least 20 hospitalized beneficiaries in any single year. Among these, 1172 PCPs were associated with at least 20 hospitalized beneficiaries in every year of the study period. These 1172 PCPs were associated with 608,686 hospitalizations over the 9 years.
Table 1 presents the characteristics of the PCPs who contributed to the cross‐sectional analyses in 2001 (N=2252) and 2009 (N=2387), as well as the 1172 PCPs for whom we had data for all 9 years for the longitudinal analyses. Most PCPs were male, trained in the United States, and were board certified. The average number of Medicare patients seen by these PCPs and number of outpatient Medicare visits went up about 7% between 2001 and 2009.
| PCP Characteristics | Cross‐Sectional Analysis | Trajectory Analysis, 20012009 | |
|---|---|---|---|
| 2001 | 2009 | ||
| |||
| Overall, no. (%) | 2,252 (100%) | 2,387 (100%) | 1,172 (100%) |
| Specialty, no. (%) | |||
| General practice | 39 (1.7%) | 34 (1.4%) | 15 (1.3%) |
| Family practice | 948 (42.1%) | 1,089 (45.6%) | 466 (39.8%) |
| Internal medicine | 1,255 (55.7%) | 1,249 (52.3%) | 688 (58.7%) |
| Geriatrics | 10 (0.4%) | 15 (0.6%) | 3 (0.3%) |
| Gender, no. (%) | |||
| Male | 1,990 (88.4%) | 2,015 (84.4%) | 1,072 (91.5%) |
| Female | 262 (11.6%) | 372 (15.6%) | 100 (8.5%) |
| Trained in the United States, no. (%) | |||
| Yes | 1,669 (74.1%) | 1,738 (72.8%) | 844 (72.0%) |
| No | 583 (25.9%) | 649 (27.2%) | 328 (28.0%) |
| Metropolitan statistical area, no. (%) | |||
| 99,999 or less | 417 (17.5) | 237 (20.2) | |
| 100,000249,000 | 438 (18.3) | 234 (20.0) | |
| 250,000999,999 | 381 (16.0) | 216 (18.4) | |
| 1,000,000 or more | 1,151 (48.2) | 485 (41.4) | |
| Board certification, no. (%) | |||
| Yes | 1,657 (69.4%) | 800 (68.3%) | |
| No | 730 (30.6%) | 372 (31.7%) | |
| Years in practice, 2001, meanSD (Q1Q3) | 22.310.6 (15.028.0) | 21.28.9 (15.027.0) | |
| Years in practice, 2009, meanSD (Q1Q3) | 25.010.2 (17.032.0) | 29.28.9 (23.035.0) | |
| Total no. of Medicare outpatient visits, 2001, meanSD (Q1Q3) | 1,624.8879.2 (1,057.51,970.0) | 1,883.39,48.5 (1,236.52,240.5) | |
| Total no. of Medicare outpatient visits, 2009, meanSD (Q1Q3) | 1,733.81,053.3 (1,080.02,048.0) | 2,020.51,200.9 (1,334.52,373.0) | |
| Total no. of Medicare outpatients, 2001, meanSD (Q1Q3) | 418.6186.9 (284.0522.0) | 473.4189.5 (338.0580.5) | |
| Total no. of Medicare outpatients, 2009, meanSD (Q1Q3) | 448.7217.8 (300.0548.0) | 508.7238.2 (350.5615.0) | |
| No. of hospitalized patients, 2001, meanSD (Q1Q3) | 46.025.0 (27.057.0) | 53.028.0 (32.066.0) | |
| No. of hospitalized patients, 2009, meanSD (Q1Q3) | 44.024.0 (26.052.0) | 52.027.0 (33.065.0) | |
| Average outpatient age, 2001, meanSD (Q1Q3) | 72.82.3 (71.574.2) | 72.82.1 (71.774.1) | |
| Average outpatient age, 2009, meanSD (Q1Q3) | 72.12.8 (70.673.9) | 72.82.7 (71.474.5) | |
| Average outpatient gender (% male), 2001, meanSD (Q1Q3) | 38.17.0 (35.542.3) | 38.56.4 (36.242.3) | |
| Average outpatient gender (% male), 2009, meanSD (Q1Q3) | 40.27.6 (37.644.8) | 41.06.5 (38.644.8) | |
| Average outpatient race (% white), 2001, meanSD (Q1Q3) | 84.316.4 (79.295.5) | 85.414.3 (79.995.7) | |
| Average outpatient race (% white), 2009, meanSD (Q1Q3) | 85.214.4 (79.895.2) | 86.312.9 (80.895.6) | |
| Average outpatient comorbidity, 2001, meanSD (Q1Q3)a | 1.60.5 (1.21.8) | 1.60.4 (1.21.8) | |
| Average outpatient comorbidity, 2009, meanSD (Q1Q3)a | 2.20.6 (1.82.5) | 2.20.6 (1.72.5) | |
Figure 1 graphs the percentage of PCPs as a function of what percent of their hospitalized patients received care from hospitalists, and how that changed from 2001 to 2009. For 70.9% of PCPs, fewer than 5% of their hospitalized patients received hospitalist care in 2001. By 2009, the percent of PCPs in this category had decreased to 15.2%. In contrast, in 2001, more than half of the patients for 2.1% of PCPs received hospitalist care, and the percent of PCPs in this category increased to 26.3% by 2009.
The pattern in Figure 1 shows that PCPs' use of hospitalists changed continuously and gradually over time. However, this pattern describes the PCPs as a group. When examined at the individual PCP level, different patterns emerge. Figure 2, which presents selected individual PCP's use of hospitalists over time, shows several distinct subpatterns of PCP practice behaviors. First, there are PCPs whose use of hospitalists was high in 2001 and stayed high or increased over time (eg, PCP A). There also were PCPs whose use of hospitalists stayed low over the entire study period (eg, PCP B). Finally, there were PCPs whose use of hospitalists was low in 2001 but high in 2009 (eg, PCP C). For this last group, the pattern of change in hospitalist utilization over time was discontinuous; that is, most of the increase occurred over a 1‐ or 2‐year period, instead of increasing gradually over time.
Among the 1172 PCPs associated with 20 hospitalized beneficiaries each year in all 9 years of the study period, group‐based trajectory modeling classified their practice patterns into 4 distinct trajectories (Figure 3). Among PCPs in group 1, more than one‐third of their hospitalized patients were cared for by hospitalists in 2001, and this increased to 60% by 2009. PCPs in groups 2 and 3 rarely used hospitalist care in 2001 but increased their use over time. The increase started early in the period for PCPs in group 2 and later for those in group 3. PCPs in group 4 were associated with little hospitalist use throughout the study period.
We constructed a model to describe the odds of a patient receiving care from hospitalists during the study period using patients associated with these 1172 PCPs. After adjusting for patient characteristics, the residual intraclass correlation coefficient for PCP level was 0.334, which indicates that 33.4% of the variance in whether a hospitalized patient received care from a hospitalist is explained by which PCP the patient saw. When adjusting for both patient and PCP characteristics, the overall odds of a patient receiving hospitalist care increased by 30% (95% confidence interval [CI]: 1.29‐1.30) per year from 2001 through 2009.
There were also significant interactions between year of hospitalization and several PCP characteristics. These interactions are illustrated in Table 2, which stratifies each of those PCP characteristics by 3 time periods: 2001 to 2003, 2004 to 2006, and 2007 to 2009. In all time periods, patients were more likely to receive hospitalist care if their PCP was US trained (US vs international medical graduate: odds ratio [OR]: 1.42, 95% CI: 1.19‐1.69 in 20012003; OR: 1.46, 95% CI: 1.23‐1.73 in 20072009), or specialized in family medicine (family medicine vs internal medicine: OR: 1.46, 95% CI: 1.25‐1.72 in 20012003; OR: 1.46, 95% CI: 1.25‐1.70 in 20072009). Over time, the relative odds of a patient receiving care from hospitalists decreased if their PCP was female (female vs male: OR: 1.91, 95% CI: 1.46‐2.50 in 20012003 vs OR: 1.50, 95% CI: 1.15‐1.95 in 20072009) or practiced in an urban area (largest vs smallest MSA: OR: 3.34, 95% CI: 2.72‐4.09 in 20012003; OR: 2.22, 95% CI: 1.82‐2.71 in 20072009). Although the longest‐practicing PCPs were most likely to use hospitalists in the early 2000s, this effect disappeared by 2007 to 2009 (most vs least years in practice: OR: 1.35, 95% CI: 1.06‐1.72 in 20012003 vs OR: 0.92, 95% CI: 0.73‐1.17 in 20072009).
| PCP Characteristics | 20012003, OR (95% CI) | 20042006, OR (95% CI) | 20072009, OR (95% CI) |
|---|---|---|---|
| |||
| Family practicea vs. internal medicineb | 1.46 (1.251.72) | 1.50 (1.281.76) | 1.46 (1.251.70) |
| Female vs male | 1.91 (1.462.50) | 1.43 (1.091.86) | 1.50 (1.151.95) |
| United States trained (yes vs no) | 1.42 (1.191.69) | 1.53 (1.281.81) | 1.46 (1.231.73) |
| Metropolitan statistical area | |||
| 99,999 or less | 1.00 | 1.00 | 1.00 |
| 100,000249,000 | 0.83 (0.651.05) | 1.00 (0.791.25) | 1.13 (0.901.41) |
| 250,000999,999 | 0.92 (0.721.17) | 1.03 (0.821.31) | 0.98 (0.771.23) |
| 1,000,000 or more | 3.34 (2.724.09) | 2.90 (2.373.54) | 2.22 (1.822.71) |
| Years in practice, 2001 | |||
| Q1 (lowest) | 1.00 | 1.00 | 1.00 |
| Q2 | 0.89 (0.711.12) | 0.83 (0.671.04) | 0.92 (0.741.14) |
| Q3 | 1.06 (0.841.34) | 0.99 (0.791.24) | 1.03 (0.821.29) |
| Q4 | 1.25 (0.991.59) | 1.13 (0.891.42) | 1.15 (0.921.45) |
| Q5 (highest) | 1.35 (1.061.72) | 1.05 (0.831.33) | 0.92 (0.731.17) |
| Total no. of outpatient visitsc | |||
| Q1 (lowest) | 1.00 | 1.00 | 1.00 |
| Q2 | 1.21 (1.121.30) | 1.07 (1.001.14) | 1.13 (1.071.19) |
| Q3 | 1.42 (1.301.54) | 1.18 (1.091.27) | 1.14 (1.071.22) |
| Q4 | 1.34 (1.211.47) | 1.34 (1.231.46) | 1.25 (1.161.35) |
| Q5 (highest) | 1.46 (1.301.63) | 1.33 (1.211.47) | 1.32 (1.201.44) |
| No. of hospitalized patientsc | |||
| Q1 (lowest) | 1.00 | 1.00 | 1.00 |
| Q2 | 1.07 (1.001.15) | 0.91 (0.860.96) | 0.85 (0.810.89) |
| Q3 | 1.00 (0.921.08) | 0.87 (0.820.93) | 0.74 (0.700.79) |
| Q4 | 0.89 (0.810.97) | 0.76 (0.710.82) | 0.62 (0.580.67) |
| Q5 (highest) | 1.05 (0.951.18) | 0.67 (0.610.73) | 0.55 (0.510.60) |
| Average outpatient agec | |||
| Q1 (lowest) | 1.00 | 1.00 | 1.00 |
| Q2 | 0.94 (0.871.01) | 1.15 (1.081.23) | 1.18 (1.111.25) |
| Q3 | 0.82 (0.760.90) | 1.05 (0.971.13) | 1.17 (1.091.25) |
| Q4 | 0.71 (0.650.79) | 1.03 (0.951.12) | 1.10 (1.021.19) |
| Q5 (highest) | 0.72 (0.640.81) | 1.12 (1.011.23) | 1.15 (1.051.26) |
| Average outpatient gender (% male)c | |||
| Q1 (lowest) | 1.00 | 1.00 | 1.00 |
| Q2 | 1.10 (1.021.18) | 1.19 (1.101.27) | 1.27 (1.181.37) |
| Q3 | 1.12 (1.031.22) | 1.27 (1.171.37) | 1.43 (1.321.54) |
| Q4 | 1.36 (1.251.48) | 1.49 (1.371.61) | 1.52 (1.401.65) |
| Q5 (highest) | 1.47 (1.341.61) | 1.84 (1.682.00) | 1.68 (1.541.83) |
| Average outpatient race (% white)c | |||
| Q1 (lowest) | 1.00 | 1.00 | 1.00 |
| Q2 | 1.08 (0.981.20) | 1.01 (0.921.10) | 1.23 (1.131.34) |
| Q3 | 1.27 (1.131.43) | 1.06 (0.951.18) | 1.21 (1.091.34) |
| Q4 | 1.47 (1.291.67) | 0.97 (0.861.09) | 1.33 (1.181.48) |
| Q5 (highest) | 1.39 (1.211.59) | 1.18 (1.041.34) | 1.25 (1.101.42) |
| Average outpatient comorbidityc | |||
| Q1 (lowest) | 1.00 | 1.00 | 1.00 |
| Q2 | 1.26 (1.191.35) | 1.23 (1.161.31) | 1.22 (1.141.30) |
| Q3 | 1.62 (1.491.75) | 1.61 (1.501.72) | 1.43 (1.341.54) |
| Q4 | 1.96 (1.792.15) | 1.86 (1.722.02) | 1.59 (1.471.72) |
| Q5 (highest) | 1.79 (1.592.01) | 2.20 (2.002.41) | 2.03 (1.852.22) |
In terms of PCP workload, patients of PCPs with high outpatient activity were more likely to receive hospitalists care throughout the study period, although the association had decreased by 2007 to 2009 (highest vs lowest outpatient volume: OR: 1.46, 95% CI: 1.30‐1.63 in 20012003 vs OR: 1.32, 95% CI: 1.20‐1.44 in 20072009). In contrast, PCPs with the lowest inpatient volumes became more likely to use hospitalists by the end of the study period (highest vs lowest inpatient volume: OR: 1.05, 95% CI: 0.95‐1.18 in 20012003 vs OR: 0.55, 95% CI: 0.51‐0.60 in 20072009).
The characteristics of PCPs' practice panels also were associated with patients' likelihood of receiving care from hospitalists. PCPs whose practice panels consisted of patients who were predominantly male, white, or with more outpatient comorbidities were consistently more likely to use hospitalists throughout the study period. PCPs with older patient panels were less likely to use hospitalists in 2001 to 2003, but by 2007 to 2009, they were slightly more likely to do so (oldest vs youngest average outpatient panel age: OR: 0.72, 95% CI: 0.64‐0.81 in 20012003 vs OR: 1.15, 95% CI: 1.05‐1.26 in 20072009).
CONCLUSIONS
Prior studies of the hospitalist model have shown that the likelihood of a patient receiving inpatient care from hospitalists is associated with patient characteristics, hospital characteristics, geographic region, and type of admission.[1, 16, 17] We found that PCP characteristics also predict whether patients receive care from hospitalists and that their use of hospitalists developed dynamically between 2001 to 2009. Although many factors (such as whether patients were admitted to a hospital where their PCP had admitting privileges) can influence the decision to use hospitalists, we found that over one‐third of the variance in whether a hospitalized patient received care from a hospitalist is explained by which PCP the patient saw. In showing that systemic differences exist among PCPs who use hospitalists and those who do not, our study suggests that future research on the hospitalist model should, if possible, adjust for PCP characteristics in addition to hospital and patient factors.
Although this study identifies the existence and magnitude of differences in whether or not PCPs use hospitalists, it cannot explain why the differences exist. We only can offer hypotheses. For example, our finding that PCPs with the most years of practice experience were more likely to use hospitalists in the early 2000s but not in more recent years suggests that in hospital medicine's early years, long‐practicing generalist physicians were choosing between practicing traditionalist medicine and adopting the hospitalists model, but by 2009, experienced generalist physicians had already specialized to either inpatient or outpatient settings earlier in their careers. On the other hand, the decreasing odds of urban PCPs using hospitalists may reflect a relative growth in hospitalist use in less populated areas rather than a change in urban PCPs' practice patterns.
PCPs trained in family medicine have reported less inpatient training and less comfort with providing hospital care,[18, 19] thus it is unsurprising that family physicians were more likely to refer patients to hospitalists. Although a recent study reported that family physicians' inpatient volumes remained constant, whereas those of outpatient internists declined between 2003 and 2012, the analysis used University Health Consortium data and thus reflects practice patterns in academic medical centers.[20] Our data suggest that outside of academia, family physicians have embraced the hospitalists as clinical partners.
Meltzer and Chung had previously proposed an economic model to describe the growing use of hospitalists in the United States. They posited that decisions to adopt the hospitalist model are governed by trade‐offs between coordination costs (eg, time and effort spent coordinating multiple providers across different settings) and switching costs (eg, time spent traveling between the office and the hospital or the effort of adjusting to different work settings).[16] The authors hypothesized that empirical testing of this model would show PCPs are more likely to use hospitalists if they have less available professional time (ie, work fewer hours per week), are female (due to competing demands from domestic responsibilities), have relatively few hospitalized patients, or live in areas with high traffic congestion. Our findings provide empirical evidence to support their division‐of‐labor model in showing that patients were more likely to receive hospitalist care if their PCP was female, practiced in an urban location, had higher outpatient practice volumes, or had lower inpatient volumes.
At first glance, some of our findings appear to contradict our earlier study, which showed that younger, black, male patients are more likely to receive inpatient care from hospitalists.[1] However, that study included patients regardless of whether they had a PCP. This study shows that when patients have a PCP, their PCPs are more likely to refer them to hospitalists if they are older, white, male, and have more comorbid conditions. A potential explanation for this finding is that PCPs may preferentially use hospitalists when caring for older and sicker hospitalized patients. For example, commentators often cite hospitalists' constant availability in the hospital as a valuable resource when caring for acutely ill patients.[21, 22]
Another potential explanation is that despite their preferences, PCPs who care for younger, minority patients lack access to hospitalist services. One large study of Medicare beneficiaries reported that physicians who care for black patients are less well‐trained clinically and often lack access to important clinical resources such as diagnostic imaging and nonemergency hospital admissions.[23] Similarly, international medical graduates are more likely than their US‐trained counterparts to care for underserved patients and to practice in small, independent offices.[24, 25, 26] As hospitalist groups often rely on cross‐subsidization from sources within a large healthcare organization, independent PCPs may have less access to their services when compared with PCPs in managed care organizations or large integrated groups. Viewed in this context, our findings imply that although hospitalists often care for socioeconomically vulnerable patients (eg, younger, uninsured, black men) who lack access to primary care services,[1] they also appear to share care responsibilities for more complex hospitalized patients with PCPs in more affluent communities. Further research may determine if the availability of hospitalists influences racial disparities in hospital care.
Our study has limitations. It is an observational study and thus subject to bias and confounding. As our cohort was formed using fee‐for‐service Medicare data in a single, large state, it may not be generalizable to PCPs who practice in other states, who care for a younger population, or who do not accept Medicare. Our findings also may not reflect the practice patterns of physicians‐in‐training, PCP populations with high board‐certification rates, those employed in temporary positions, or those who interrupt their practices for personal reasons, as we restricted our study to established PCPs who had been in practice long and consistently enough to be associated with 20 hospitalized patients during every year of the study. For example, the lower proportion of female PCPs in our cohort (15.6% in our study in 2009 vs 27.5% reported in a nationally representative 2008 survey[27]) may be explained by our exclusion of women who take prolonged time off for childcare duties. We also did not establish whether patient outcomes or healthcare costs differ between PCPs who adopted the hospitalist model and traditionalists. Finally, we could not examine the effect of a number of PCP factors that could plausibly influence whether or not PCPs relinquish inpatient care to hospitalists, such as their comfort with providing inpatient care, having hospital admitting privileges, having office‐based access to hospitals' electronic medical records, or the distance between their office and the hospital. However, this study lays the groundwork for future studies to explore these factors.
In summary, this study is the first, to our knowledge, to characterize PCPs who relinquished inpatient responsibilities to hospitalists. Our findings suggest that some groups of PCPs are more likely to refer patient to hospitalists, that the relationship between hospitalists and PCPs has evolved over time, and that the hospitalist model still has ample room to grow.
ACKNOWLEDGMENTS
Disclosures: This study was supported by grants from the National Institute on Aging (1RO1‐AG033134 and P30‐AG024832) and the National Cancer Institute (K05‐CA124923). The authors have no financial conflicts of interest to disclose. An oral abstract of this article was presented on May 18, 2013 at the Society of Hospital Medicine Annual Meeting in National Harbor, Maryland.
- , , , . Growth in the care of older patients by hospitalists in the United States. N Engl J Med. 2009;360(11):1102–1112.
- , . Effect of hospitalists on length of stay in the medicare population: variation according to hospital and patient characteristics. J Am Geriatr Soc. 2010;58(9):1649–1657.
- , , , , , . Outcomes of care by hospitalists, general internists, and family physicians. N Engl J Med. 2007;357(25):2589–2600.
- , , , , . Hospitalist care and length of stay in patients requiring complex discharge planning and close clinical monitoring. Arch Intern Med. 2007;167(17):1869–1874.
- , . The impact of hospitalists on the cost and quality of inpatient care in the United States: a research synthesis. Med Care Res Rev. 2005;62(4):379–406.
- , . Association of hospitalist care with medical utilization after discharge: evidence of cost shift from a cohort study. Ann Intern Med. 2011;155(3):152–159.
- , . Hospital care and medical utilization after discharge. Ann Intern Med. 2011;155(10):719–720; author reply 722.
- . Hospital care and medical utilization after discharge. Ann Intern Med. 2011;155(10):721; author reply 722.
- , , , , , . Administrative data algorithms can describe ambulatory physician utilization. Health Serv Res. 2007;42:1783–1796.
- , . Estimating the reliability of continuous measures with Cronbach's alpha or the intraclass correlation coefficient: toward the integration of two traditions. J Clin Epidemiol. 1991;44(4–5):381–390.
- , , . Ability of Medicare claims data to identify nursing home patients: a validation study. Med Care. 2008;46(11):1184–1187.
- , , , . Comorbidity measures for use with administrative data. Med Care. 1998;36(1):8–27.
- , , . A SAS procedure based on mixture models for estimating developmental trajectories. Sociol Methods Res. 2001;29(3):374–393.
- . Group‐Based Modeling of Development. Cambridge, MA: Harvard University Press; 2005.
- , . Group‐based trajectory modeling in clinical research. Annu Rev Clin Psychol. 2010;6:109–138.
- , . Coordination, switching costs and the division of labor in general medicine: an economic explanation for the emergence of hospitalists in the United States. National Bureau of Economic Research Working Paper Series No. 16040. Cambridge, MA: National Bureau of Economic Research; 2010.
- , , , , , . Continuity of outpatient and inpatient care by primary care physicians for hospitalized older adults. JAMA. 2009;301(16):1671–1680.
- . Hospitalists and family physicians: understanding opportunities and risks. J Fam Pract. 2004;53(6):473–481.
- , , , , , . Preparedness of internal medicine and family practice residents for treating common conditions. JAMA. 2002;288(20):2609–2614.
- , , , . The status of adult inpatient care by family physicians at US academic medical centers and affiliated teaching hospitals 2003 to 2012: the impact of the hospitalist movement. Fam Med. 2014;46(2):94–99.
- . Hospitalists and the hospital medicine system of care are good for patient care. Arch Intern Med. 2008;168(12):1254–1256; discussion 1259–1260.
- . Hospitalists in the United States—mission accomplished or work in progress? N Engl J Med. 2004;350(19):1935–1936.
- , , , , . Primary care physicians who treat blacks and whites. N Engl J Med. 2004;351(6):575–584.
- , , , . International medical graduates and the primary care workforce for rural underserved areas. Health Aff (Millwood). 2003;22(2):255–262.
- , , . Medical migration and the physician workforce. International medical graduates and American medicine. JAMA. 1995;273(19):1521–1527.
- , , , , . International medical graduates in family medicine in the United States of America: an exploration of professional characteristics and attitudes. Hum Resour Health. 2006;4:17.
- , , . A snapshot of U.S. physicians: key findings from the 2008 Health Tracking Physician Survey. Data Bull (Cent Stud Health Syst Change). 2009(35):1–11.
© 2015 Society of Hospital Medicine
