Health literacy (HL), defined as patients’ ability to understand health information and make health decisions,1 is a prevalent problem in the outpatient and inpatient settings.2,3 In both settings, low HL has adverse implications for self-care including interpreting health labels4 and taking medications correctly.5 Among outpatient cohorts, HL has been associated with worse outcomes and acute care utilization.6 Associations with low HL include increased hospitalizations,7 rehospitalizations,8,9 emergency department visits,10 and decreased preventative care use.11 Among the elderly, low HL is associated with increased mortality12 and decreased self-perception of health.13
A systematic review revealed that most high-quality HL outcome studies were conducted in the outpatient setting.6 There have been very few studies assessing effects of low HL in an acute-care setting.7,14 These studies have evaluated postdischarge outcomes, including admissions or readmissions,7-9 and medication knowledge.14 To the best of our knowledge, there are no studies evaluating associations between HL and hospital length of stay (LOS).
LOS has received much attention as providers and payers focus more on resource utilization and eliminating adverse effects of prolonged hospitalization.15 LOS is multifactorial, depending on clinical characteristics like disease severity, as well as on sociocultural, demographic, and geographic factors.16 Despite evidence that LOS reductions translate into improved resource allocation and potentially fewer complications, there remains a tension between the appropriate LOS and one that is too short for a given condition.17
Because low HL is associated with inefficient resource utilization, we hypothesized that low HL would be associated with increased LOS after controlling for illness severity. Our objectives were to evaluate the association between low HL and LOS and whether such an association was modified by illness severity and sociodemographics.
METHODS
Study Design, Setting, Participants
An in-hospital, cohort study design of patients who were admitted or transferred to the general medicine service at the University of Chicago between October 2012 and November 2015 and screened for inclusion as part of a large, ongoing study of inpatient care quality was conducted.18 Exclusion criteria included observation status, age under 18 years, non-English speaking, and repeat participants. Those who died during hospitalization or whose discharge status was missing were excluded because the primary goal was to examine the association of HL and time to discharge, which could not be evaluated among those who died. We excluded participants with LOS >30 days to limit overly influential effects of extreme outliers (1% of the population).
Variables
HL was screened using the Brief Health Literacy Screen (BHLS), a validated, 3-question verbal survey not requiring adequate visual acuity to assess HL.19,20 The 3 questions are as follows: (1) “How confident are you filling out medical forms by yourself?”, (2) “How often do you have someone help you read hospital materials?”, and (3) “How often do you have problems learning about your medical condition because of difficulty understanding written information?” Responses to the questions were scored on a 5-point Likert scale in which higher scores corresponded to higher HL.21,22 The scores for each of the 3 questions were summed to yield a range between 3 and 15. On the individual questions, prior work has demonstrated improved test performance with a cutoff of ≤3, which corresponds to a response of “some of the time” or “somewhat”; therefore, when the 3 questions were summed together, scores of ≤9 were considered indicative of low HL.21,23
For severity of illness adjustment, we used relative weights derived from the 3M (3M, Maplewood, MN) All Patient Refined Diagnosis Related Groups (APR-DRG) classification system, which uses administrative data to classify the severity. The APR-DRG system assigns each admission to a DRG based on principal diagnosis; for each DRG, patients are then subdivided into 4 severity classes based on age, comorbidity, and interactions between these variables and the admitting diagnosis.24 Using the base DRG and severity score, the system assigns relative weights that reflect differences in expected hospital resource utilization.
LOS was derived from hospital administrative data and counted from the date of admission to the hospital. Participants who were discharged on the day of admission were counted as having an LOS of 1. Insurance status (Medicare, Medicaid, no payer, private) also was obtained from administrative data. Age, sex (male or female), education (junior high or less, some high school, high school graduate, some college, college graduate, postgraduate), and race (black/African American, white, Asian or Pacific Islander [including Asian Indian, Chinese, Filipino, Japanese, Korean, Vietnamese, other Asian, Native Hawaiian, Guam/Chamorro, Samoan, other Pacific], American Indian or Alaskan Native, multiple race) were obtained from administrative data based on information provided by the patient. Participants with missing data on any of the sociodemographic variables or on the APR-DRG score were excluded from the analysis.
Statistical Analysis
χ2 and 2-tailed t tests were used to compare categorical and continuous variables, respectively. Multivariate linear regressions were employed to measure associations between the independent variables (HL, illness severity, race, gender, education, and insurance status) and the dependent variable, LOS. Independent variables were chosen for clinical significance and retained in the model regardless of statistical significance. The adjusted R2 values of models with and without the HL variable included were reported to provide information on the contribution of HL to the overall model.
Because LOS was observed to be right skewed and residuals of the untransformed regression were observed to be non-normally distributed, the decision was made to natural log transform LOS, which is consistent with previous hospital LOS studies.16 Regression coefficients and confidence intervals were then transformed into percentage estimates using the following equation: 100(eβ–1). Adjusted R2 was reported for the transformed regression.
The APR-DRG relative weight was treated as a continuous variable. Sociodemographic variables were dichotomized as follows: female vs male; high school graduates vs not; African American vs not; Medicaid/no payer vs Medicare/private payer. Age was not included in the multivariate model because it has been incorporated into the weighted APR-DRG illness severity scores.
Each of the sociodemographic variables and the APR-DRG score were examined for effect modification via the same multivariate linear equation described above, with the addition of an interaction term. A separate regression was performed with an interaction term between age (dichotomized at ≥65) and HL to investigate whether age modified the association between HL and LOS. Finally, we explored whether effects were isolated to long vs short LOS by dividing the sample based on the mean LOS (≥6 days) and performing separate multivariate comparisons.
Sensitivity analyses were performed to exclude those with LOS greater than the 90th percentile and those with APR-DRG score greater than the 90th percentile; age was added to the model as a continuous variable to evaluate whether the illness severity score fully adjusted for the effects of age on LOS. Furthermore, we compared the participants with missing data to those with complete data across both dependent and independent variables. Alpha was set at 0.05; analyses were performed using Stata Version 14 (Stata, College Station, TX).
RESULTS
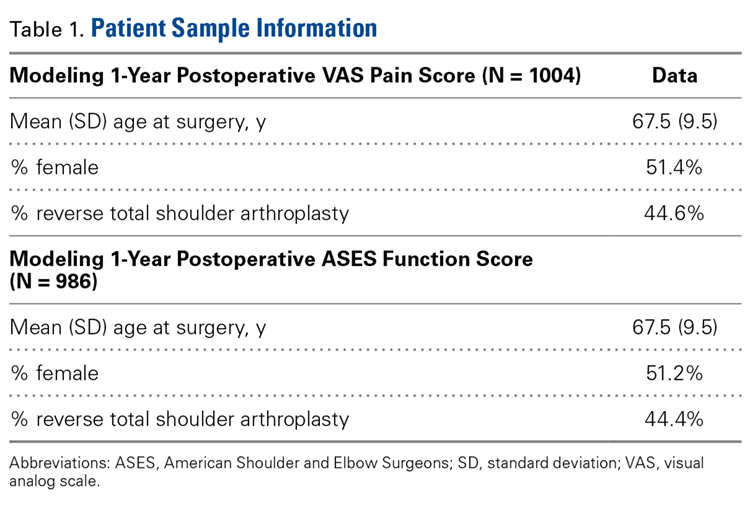
A total of 5983 participants met inclusion criteria and completed the HL assessment; of these participants, 75 (1%) died during hospitalization, 9 (0.2%) had missing discharge status, and 79 (1%) had LOS >30 days. Two hundred eighty (5%) were missing data on sociodemographic variables or APR-DRG score. Of the remaining (n= 5540), the mean age was 57 years (standard deviation [SD] = 19 years), over half of participants were female (57%), and the majority were African American (73%) and had graduated from high school (81%). The sample was divided into those with private insurance (25%), those with Medicare (46%), and those with Medicaid (26%); 2% had no payer. The mean APR-DRG score was 1.3 (SD = 1.2), and the scores ranged from 0.3 to 15.8.
On the BHLS screen for HL, 20% (1104/5540) had inadequate HL. Participants with low HL had higher weighted illness severity scores (average 1.4 vs 1.3; P = 0.003). Participants with low HL were also more likely to be 65 or older (55% vs 33%; P < 0.001), non-high school graduates (35% vs 15%; P < 0.001), and African American (78% vs 72%; P < 0.001), and to have Medicare or private insurance (75% vs 71%; P = 0.02). There was no significant difference with respect to gender (54% male vs 57% female; P = 0.1)
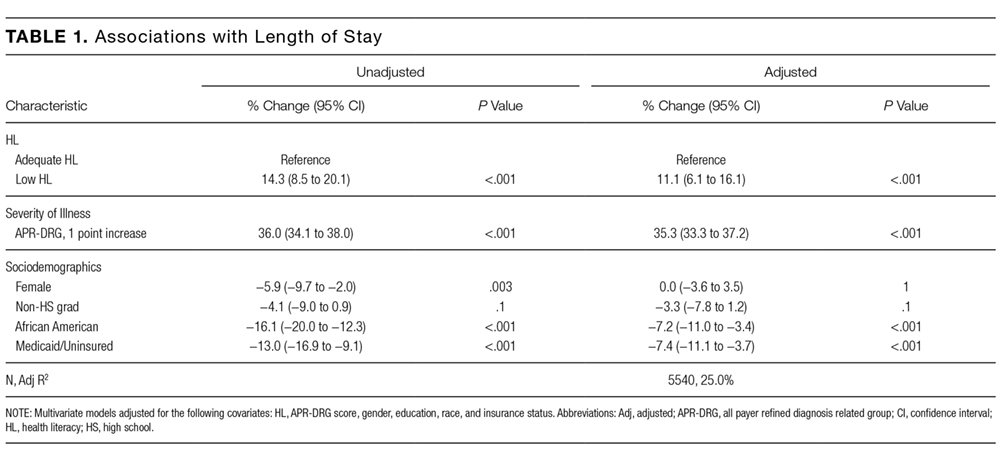
The mean and median LOS were 6 ± 5 days and 4 days (interquartile range 2-7 days), respectively. Those with low HL had a longer average LOS (6.0 vs 5.4 days; P < 0.001). In multivariate analysis controlling for APR-DRG score, gender, education, race, and insurance status, low HL was associated with an 11.1% longer LOS (95% CI, 6.1-16.1; P < 0.001; Table 1). The adjusted R2 value for the regression was 25.0% including HL and 24.7% with HL excluded. Additionally, being African American (P < 0.001) and having Medicaid or no insurance (P < 0.001) were associated with a shorter LOS in multivariate analysis (Table 1). The association of HL and LOS in multivariate modeling remained significant among participants with LOS <6 days (10.2%; 95% CI, 5.6%-14.9%; P < 0.001), but not among participants with LOS ≥6 days (0.4%; 95% CI, −3.6% to 4.4%; P = 0.8).
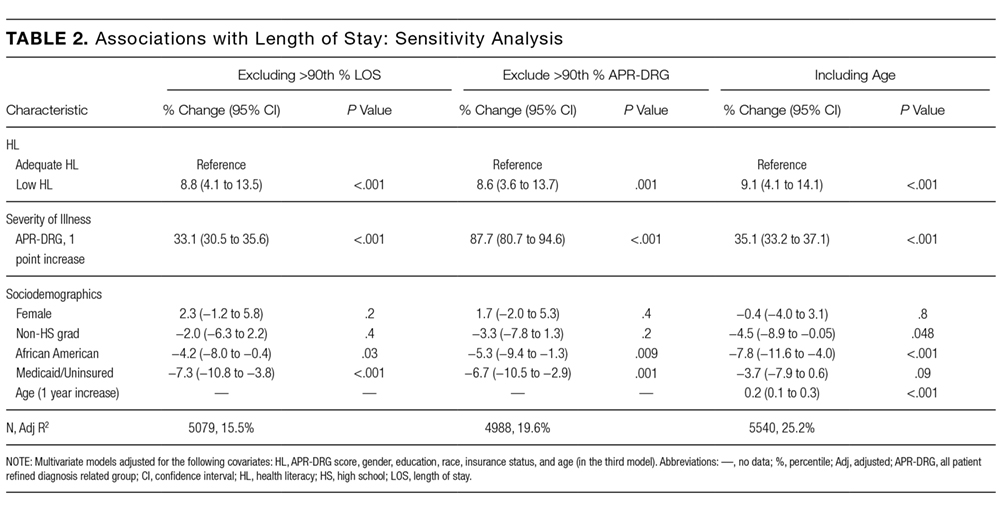
Neither age ≥65 (P = 0.4) nor illness severity score (P = 0.5) significantly modified the effect of HL on LOS. However, the effect of HL on hospital LOS was significantly modified by gender (P = 0.02). Among men, low HL was associated with a 17.8% longer LOS (95% CI, 10.0%-25.7%; P < 0.001), but among women, low HL was associated with only a 7.7% longer LOS (95% CI, 1.9%-13.5%; P = 0.009). Among the remaining demographics, high school graduation status (P = 0.4), being African American (P = 0.6), and insurance status (P = 0.2) did not significantly modify the effect of HL on LOS. In sensitivity analysis, excluding participants with LOS above the 90th percentile of 12 days and excluding participants with illness severity scores above the 90th percentile, low HL was still associated with longer LOS (P < 0.001 and P = 0.001, respectively; Table 2). In the final sensitivity analysis, although age remained a significant predictor of longer LOS after controlling for illness severity (0.2% increase per year, 95% CI, 0.1%-0.3%; P < 0.001), low HL nevertheless remained significantly associated with longer LOS (P < 0.001; Table 2).
Finally, we compared the group with missing data (n = 280) to the group with complete data (n= 5540). The participants with missing data were more likely to have low HL (31% [86/280] vs 20%; P < 0.001) and to have Medicare or private insurance (82% [177/217] vs 72%; P = 0.002); however, they were not more likely to be 65 or older (40% [112/280] vs 37%; P = 0.3), high school graduates (88% [113/129] vs 81%; P = 0.06), African American (69% [177/256] vs 73%; P = 0.1), or female (57% [158/279] vs 57%; P = 1), nor were they more likely to have longer LOS (5.7 [n= 280] vs 5.5 days; P = 0.6) or higher illness severity scores (1.3 [n = 231] vs 1.3; P = 0.7).
DISCUSSION
To our knowledge, this study is the first to evaluate the association between low HL and an important in-hospital outcome measure, hospital LOS. We found that low HL was associated with a longer hospital LOS, a result which remained significant when controlling for severity of illness and sociodemographic variables and when testing the model for sensitivity to the highest values of LOS and illness severity. Additionally, the association of HL with LOS appeared concentrated among participants with shorter LOS. Relative to other predictors, the contribution of HL to the overall LOS model was small, as evidenced by the change in adjusted R2 values with HL excluded.
Among the covariates, only gender modified the association between HL and LOS; the findings suggested that men were more susceptible to the effect of low HL on increased LOS. Illness severity and other sociodemographics, including age ≥65, did not appear to modify the association. We also found that being African American and having Medicaid or no insurance were associated with a significantly shorter LOS in multivariate analysis.
Previous work suggested that the adverse health effects of low HL may be mediated through several pathways, including health knowledge, self-efficacy, health skills, and illness stigma.25-27 The finding of a small but significant relationship between HL and LOS was not surprising given these known associations; nevertheless, there may be an additional patient-dependent effect of low HL on LOS not discovered here. For instance, patients with poor health knowledge and self-efficacy might stay in the hospital longer if they or their providers do not feel comfortable with their self-care ability.
This finding may be useful in developing hospital-based interventions. HL-specific interventions, several of which have been tested in the inpatient setting,14,28,29 have shown promise toward improving health knowledge,30 disease severity,31 and health resource utilization.32
Those with low HL may lack the self-efficacy to participate in discharge planning; in fact, previous work has related low HL to posthospital readmissions.8,9 Conversely, patients with low HL might struggle to engage in the inpatient milieu, advocating for shorter LOS if they feel alienated by the inpatient experience.
These possibilities show that LOS is a complex measure shown to depend on patient-level characteristics and on provider-based, geographical, and sociocultural factors.16,33 With these forces at play, additional effects of lower levels of HL may be lost without phenotyping patients by both level of HL and related characteristics, such as self-efficacy, health skills, and stigma. By gathering these additional data, future work should explore whether subpopulations of patients with low HL may be at risk for too-short vs too-long hospital admissions.
For instance, in this study, both race and Medicaid insurance were associated with shorter LOS. Being African American was associated with shorter LOS in our study but has been found to be associated with longer LOS in another study specifically focused on diabetes.34 Prior findings found uninsured patients have shorter LOS.35 Therefore, these findings in our study are difficult to explain without further work to understand whether there are health disparities in the way patients are cared for during hospitalization that may shorten or lengthen their LOS because of factors outside of their clinical need.
The finding that gender modified the effect of low HL on LOS was unexpected. There were similar proportions of men and women with low HL. There is evidence to support that women make the majority of health decisions for themselves and their familes36; therefore, there may be unmeasured aspects of HL that provide an advantage for female vs male inpatients. Furthermore, omitted confounders, such as social support, may not fully capture potential gender-related differences. Future work is needed to understand the role of gender in relationship to HL and LOS.
Limitations of this study include its observational, single-centered design with information derived from administrative data; positive and negative confounding cannot be ruled out. For instance, we did not control for complex aspects affecting LOS, such as discharge disposition and goals of care (eg, aggressive care after discharge vs hospice). To address this limitation, multivariate analyses were performed, which were adjusted for illness severity scores and took into account both comorbidity and severity of the current illness. Additionally, although it is important to study such populations, our largely urban, minority sample is not representative of the U.S. population, and within our large sample, there were participants with missing data who had lower HL on average, although this group represented only 5% of the sample. Finally, different HL tools have noncomplete concordance, which has been seen when comparing the BHLS with more objective tools.20,37 Furthermore, certain in-hospital clinical scenarios (eg, recent stroke or prolonged intensive care unit stay) may present unique challenges in establishing a baseline HL level. However, the BHLS was used in this study because of its greater feasibility.
In conclusion, this study is the first to evaluate the relationship between low HL and LOS. The findings suggest that HL may play a role in shaping outcomes in the inpatient setting and that targeting interventions toward screened patients may be a pathway toward mitigating adverse effects. Our findings need to be replicated in larger, more representative samples, and further work understanding subpopulations within the low HL population is needed. Future work should measure this association in diverse inpatient settings (eg, psychiatric, surgical, and specialty), in addition to assessing associations between HL and other important in-hospital outcome measures, including mortality and discharge disposition.
Acknowledgments
The authors thank the Hospitalist Project team for their assistance with data collection. The authors especially thank Chuanhong Liao and Ashley Snyder for assistance with statistical analyses; Andrea Flores, Ainoa Coltri, and Tom Best for their assistance with data management. The authors would also like to thank Nicole Twu for her help with preparing and editing the manuscript.
Disclosures
Dr. Jaffee was supported by a Calvin Fentress Research Fellowship and NIH R25MH094612. Dr. Press was supported by a career development award (NHLBI K23HL118151). This work was also supported by a seed grant from the Center for Health Administration Studies. All other authors declare no conflicts of interest.
References
1. U.S. Department of Health and Human Services. Healthy People 2010: Understanding and Improving Health. Washington, DC: U.S. Government Printing Office; 2000. 2. “What Did the Doctor Say”? Improving Health Literacy to Protect Patient Safety. The Joint Commission; 2007. 3. Kutner M, Greenberg E, Jin Y, Paulsen C. The Health Literacy of America’s Adults: Results from the 2003 National Assessment of Adult Literacy. National Center for Education Statistics; 2006. 4. Davis TC, Wolf MS, Bass PF, et al. Literacy and misunderstanding prescription drug labels. Ann Intern Med. 2006;145(12):887-894. PubMed 5. Kripalani S, Henderson LE, Chiu EY, Robertson R, Kolm P, Jacobson TA. Predictors of medication self-management skill in a low-literacy population. J Gen Intern Med. 2006;21(8):852-856. PubMed 6. Berkman ND, Sheridan SL, Donahue KE, Halpern DJ, Crotty K. Low health literacy and health outcomes: an updated systematic review. Ann Intern Med. 2011;155(2):97-107. PubMed 7. Baker DW, Parker RM, Williams MV, Clark WS. Health literacy and the risk of hospital admission. J Gen Intern Med. 1998;13(12):791-798. PubMed 8. Mitchell SE, Sadikova E, Jack BW, Paasche-Orlow MK. Health literacy and 30-day postdischarge hospital utilization. J Health Commun. 2012;17(Suppl 3):325-338. PubMed 9. Jaffee EG, Arora VM, Matthiesen MI, Hariprasad SM, Meltzer DO, Press VG. Postdischarge Falls and Readmissions: Associations with Insufficient Vision and Low Health Literacy among Hospitalized Seniors. J Health Commun. 2016;21(sup2):135-140. PubMed 10. Hope CJ, Wu J, Tu W, Young J, Murray MD. Association of medication adherence, knowledge, and skills with emergency department visits by adults 50 years or older with congestive heart failure. Am J Health Syst Pharm. 2004;61(19):2043-2049. PubMed 11. Bennett IM, Chen J, Soroui JS, White S. The contribution of health literacy to disparities in self-rated health status and preventive health behaviors in older adults. Ann Fam Med. 2009;7(3):204-211. PubMed 12. Baker DW, Wolf MS, Feinglass J, Thompson JA. Health literacy, cognitive abilities, and mortality among elderly persons. J Gen Intern Med. 2008;23(6):723-726. PubMed 13. Cho YI, Lee SY, Arozullah AM, Crittenden KS. Effects of health literacy on health status and health service utilization amongst the elderly. Soc Sci Med. 2008;66(8):1809-1816. PubMed 14. Paasche-Orlow MK, Riekert KA, Bilderback A, et al. Tailored education may reduce health literacy disparities in asthma self-management. Am J Respir Crit Care Med. 2005;172(8):980-986. PubMed 15. Soria-Aledo V, Carrillo-Alcaraz A, Campillo-Soto Á, et al. Associated factors and cost of inappropriate hospital admissions and stays in a second-level hospital. Am J Med Qual. 2009;24(4):321-332. PubMed 16. Lu M, Sajobi T, Lucyk K, Lorenzetti D, Quan H. Systematic review of risk adjustment models of hospital length of stay (LOS). Med Care. 2015;53(4):355-365. PubMed 17. Clarke A, Rosen R. Length of stay. How short should hospital care be? Eur J Public Health. 2001;11(2):166-170. PubMed 18. Meltzer D, Manning WG, Morrison J, et al. Effects of physician experience on costs and outcomes on an academic general medicine service: results of a trial of hospitalists. Ann Intern Med. 2002;137(11):866-874. PubMed 19. Chew LD, Bradley KA, Boyko EJ. Brief questions to identify patients with inadequate health literacy. Fam Med. 2004;36(8):588-594. PubMed 20. Press VG, Shapiro MI, Mayo AM, Meltzer DO, Arora VM. More than meets the eye: relationship between low health literacy and poor vision in hospitalized patients. J Health Commun. 2013;18 Suppl 1:197-204. PubMed 21. Willens DE, Kripalani S, Schildcrout JS, et al. Association of brief health literacy screening and blood pressure in primary care. J Health Commun. 2013;18 Suppl 1:129-142. PubMed 22. Peterson PN, Shetterly SM, Clarke CL, et al. Health literacy and outcomes among patients with heart failure. JAMA. 2011;305(16):1695-1701. PubMed 23. Chew LD, Griffin JM, Partin MR, et al. Validation of screening questions for limited health literacy in a large VA outpatient population. J Gen Intern Med. 2008;23(5):561-566. PubMed 24. Averill RF, Goldfield N, Hughes JS, et al. All Patient Refined Diagnosis Related Groups (APR-DRGs): Methodology Overview. 3M Health Information Systems; 2003. 25. Waite KR, Paasche-Orlow M, Rintamaki LS, Davis TC, Wolf MS. Literacy, social stigma, and HIV medication adherence. J Gen Intern Med. 2008;23(9):1367-1372. PubMed 26. Paasche-Orlow MK, Wolf MS. The causal pathways linking health literacy to health outcomes. Am J Health Behav. 2007;31 Suppl 1:S19-26. PubMed 27. Berkman ND, Sheridan SL, Donahue KE, et al. Health literacy interventions and outcomes: an updated systematic review. Evid Rep Technol Assess (Full Rep). 2011;(199):1-941. PubMed 28. Kripalani S, Roumie CL, Dalal AK, et al. Effect of a pharmacist intervention on clinically important medication errors after hospital discharge: a randomized trial. Ann Intern Med. 2012;157(1):1-10. PubMed 29. Press VG, Arora VM, Shah LM, et al. Teaching the use of respiratory inhalers to hospitalized patients with asthma or COPD: a randomized trial. J Gen Intern Med. 2012;27(10):1317-1325. PubMed 30. Sobel RM, Paasche-Orlow MK, Waite KR, Rittner SS, Wilson EAH, Wolf MS. Asthma 1-2-3: a low literacy multimedia tool to educate African American adults about asthma. J Community Health. 2009;34(4):321-327. PubMed 31. Rothman RL, DeWalt DA, Malone R, et al. Influence of patient literacy on the effectiveness of a primary care-based diabetes disease management program. JAMA. 2004;292(14):1711-1716. PubMed 32. DeWalt DA, Malone RM, Bryant ME, et al. A heart failure self-management program for patients of all literacy levels: a randomized, controlled trial [ISRCTN11535170]. BMC Health Serv Res. 2006;6:30. PubMed 33. Hasan O, Orav EJ, Hicks LS. Insurance status and hospital care for myocardial infarction, stroke, and pneumonia. J Hosp Med. 2010;5(8):452-459. PubMed 34. Cook CB, Naylor DB, Hentz JG, et al. Disparities in diabetes-related hospitalizations: relationship of age, sex, and race/ethnicity with hospital discharges, lengths of stay, and direct inpatient charges. Ethn Dis. 2006;16(1):126-131. PubMed 35. Hadley J, Steinberg EP, Feder J. Comparison of uninsured and privately insured hospital patients. Condition on admission, resource use, and outcome. JAMA. 1991;265(3):374-379. PubMed 36. Women’s Health Care Chartbook: Key Findings From the Kaiser Women’s Health Survey. May 2011. https://kaiserfamilyfoundation.files.wordpress. com/2013/01/8164.pdf. Accessed August 1, 2017. 37. Louis AJ, Arora VM, Matthiesen MI, Meltzer DO, Press VG. Screening Hospitalized Patients for Low Health Literacy: Beyond the REALM of Possibility? PubMed
Health literacy (HL), defined as patients’ ability to understand health information and make health decisions,1 is a prevalent problem in the outpatient and inpatient settings.2,3 In both settings, low HL has adverse implications for self-care including interpreting health labels4 and taking medications correctly.5 Among outpatient cohorts, HL has been associated with worse outcomes and acute care utilization.6 Associations with low HL include increased hospitalizations,7 rehospitalizations,8,9 emergency department visits,10 and decreased preventative care use.11 Among the elderly, low HL is associated with increased mortality12 and decreased self-perception of health.13
A systematic review revealed that most high-quality HL outcome studies were conducted in the outpatient setting.6 There have been very few studies assessing effects of low HL in an acute-care setting.7,14 These studies have evaluated postdischarge outcomes, including admissions or readmissions,7-9 and medication knowledge.14 To the best of our knowledge, there are no studies evaluating associations between HL and hospital length of stay (LOS).
LOS has received much attention as providers and payers focus more on resource utilization and eliminating adverse effects of prolonged hospitalization.15 LOS is multifactorial, depending on clinical characteristics like disease severity, as well as on sociocultural, demographic, and geographic factors.16 Despite evidence that LOS reductions translate into improved resource allocation and potentially fewer complications, there remains a tension between the appropriate LOS and one that is too short for a given condition.17
Because low HL is associated with inefficient resource utilization, we hypothesized that low HL would be associated with increased LOS after controlling for illness severity. Our objectives were to evaluate the association between low HL and LOS and whether such an association was modified by illness severity and sociodemographics.
METHODS
Study Design, Setting, Participants
An in-hospital, cohort study design of patients who were admitted or transferred to the general medicine service at the University of Chicago between October 2012 and November 2015 and screened for inclusion as part of a large, ongoing study of inpatient care quality was conducted.18 Exclusion criteria included observation status, age under 18 years, non-English speaking, and repeat participants. Those who died during hospitalization or whose discharge status was missing were excluded because the primary goal was to examine the association of HL and time to discharge, which could not be evaluated among those who died. We excluded participants with LOS >30 days to limit overly influential effects of extreme outliers (1% of the population).
Variables
HL was screened using the Brief Health Literacy Screen (BHLS), a validated, 3-question verbal survey not requiring adequate visual acuity to assess HL.19,20 The 3 questions are as follows: (1) “How confident are you filling out medical forms by yourself?”, (2) “How often do you have someone help you read hospital materials?”, and (3) “How often do you have problems learning about your medical condition because of difficulty understanding written information?” Responses to the questions were scored on a 5-point Likert scale in which higher scores corresponded to higher HL.21,22 The scores for each of the 3 questions were summed to yield a range between 3 and 15. On the individual questions, prior work has demonstrated improved test performance with a cutoff of ≤3, which corresponds to a response of “some of the time” or “somewhat”; therefore, when the 3 questions were summed together, scores of ≤9 were considered indicative of low HL.21,23
For severity of illness adjustment, we used relative weights derived from the 3M (3M, Maplewood, MN) All Patient Refined Diagnosis Related Groups (APR-DRG) classification system, which uses administrative data to classify the severity. The APR-DRG system assigns each admission to a DRG based on principal diagnosis; for each DRG, patients are then subdivided into 4 severity classes based on age, comorbidity, and interactions between these variables and the admitting diagnosis.24 Using the base DRG and severity score, the system assigns relative weights that reflect differences in expected hospital resource utilization.
LOS was derived from hospital administrative data and counted from the date of admission to the hospital. Participants who were discharged on the day of admission were counted as having an LOS of 1. Insurance status (Medicare, Medicaid, no payer, private) also was obtained from administrative data. Age, sex (male or female), education (junior high or less, some high school, high school graduate, some college, college graduate, postgraduate), and race (black/African American, white, Asian or Pacific Islander [including Asian Indian, Chinese, Filipino, Japanese, Korean, Vietnamese, other Asian, Native Hawaiian, Guam/Chamorro, Samoan, other Pacific], American Indian or Alaskan Native, multiple race) were obtained from administrative data based on information provided by the patient. Participants with missing data on any of the sociodemographic variables or on the APR-DRG score were excluded from the analysis.
Statistical Analysis
χ2 and 2-tailed t tests were used to compare categorical and continuous variables, respectively. Multivariate linear regressions were employed to measure associations between the independent variables (HL, illness severity, race, gender, education, and insurance status) and the dependent variable, LOS. Independent variables were chosen for clinical significance and retained in the model regardless of statistical significance. The adjusted R2 values of models with and without the HL variable included were reported to provide information on the contribution of HL to the overall model.
Because LOS was observed to be right skewed and residuals of the untransformed regression were observed to be non-normally distributed, the decision was made to natural log transform LOS, which is consistent with previous hospital LOS studies.16 Regression coefficients and confidence intervals were then transformed into percentage estimates using the following equation: 100(eβ–1). Adjusted R2 was reported for the transformed regression.
The APR-DRG relative weight was treated as a continuous variable. Sociodemographic variables were dichotomized as follows: female vs male; high school graduates vs not; African American vs not; Medicaid/no payer vs Medicare/private payer. Age was not included in the multivariate model because it has been incorporated into the weighted APR-DRG illness severity scores.
Each of the sociodemographic variables and the APR-DRG score were examined for effect modification via the same multivariate linear equation described above, with the addition of an interaction term. A separate regression was performed with an interaction term between age (dichotomized at ≥65) and HL to investigate whether age modified the association between HL and LOS. Finally, we explored whether effects were isolated to long vs short LOS by dividing the sample based on the mean LOS (≥6 days) and performing separate multivariate comparisons.
Sensitivity analyses were performed to exclude those with LOS greater than the 90th percentile and those with APR-DRG score greater than the 90th percentile; age was added to the model as a continuous variable to evaluate whether the illness severity score fully adjusted for the effects of age on LOS. Furthermore, we compared the participants with missing data to those with complete data across both dependent and independent variables. Alpha was set at 0.05; analyses were performed using Stata Version 14 (Stata, College Station, TX).
RESULTS
A total of 5983 participants met inclusion criteria and completed the HL assessment; of these participants, 75 (1%) died during hospitalization, 9 (0.2%) had missing discharge status, and 79 (1%) had LOS >30 days. Two hundred eighty (5%) were missing data on sociodemographic variables or APR-DRG score. Of the remaining (n= 5540), the mean age was 57 years (standard deviation [SD] = 19 years), over half of participants were female (57%), and the majority were African American (73%) and had graduated from high school (81%). The sample was divided into those with private insurance (25%), those with Medicare (46%), and those with Medicaid (26%); 2% had no payer. The mean APR-DRG score was 1.3 (SD = 1.2), and the scores ranged from 0.3 to 15.8.
On the BHLS screen for HL, 20% (1104/5540) had inadequate HL. Participants with low HL had higher weighted illness severity scores (average 1.4 vs 1.3; P = 0.003). Participants with low HL were also more likely to be 65 or older (55% vs 33%; P < 0.001), non-high school graduates (35% vs 15%; P < 0.001), and African American (78% vs 72%; P < 0.001), and to have Medicare or private insurance (75% vs 71%; P = 0.02). There was no significant difference with respect to gender (54% male vs 57% female; P = 0.1)
The mean and median LOS were 6 ± 5 days and 4 days (interquartile range 2-7 days), respectively. Those with low HL had a longer average LOS (6.0 vs 5.4 days; P < 0.001). In multivariate analysis controlling for APR-DRG score, gender, education, race, and insurance status, low HL was associated with an 11.1% longer LOS (95% CI, 6.1-16.1; P < 0.001; Table 1). The adjusted R2 value for the regression was 25.0% including HL and 24.7% with HL excluded. Additionally, being African American (P < 0.001) and having Medicaid or no insurance (P < 0.001) were associated with a shorter LOS in multivariate analysis (Table 1). The association of HL and LOS in multivariate modeling remained significant among participants with LOS <6 days (10.2%; 95% CI, 5.6%-14.9%; P < 0.001), but not among participants with LOS ≥6 days (0.4%; 95% CI, −3.6% to 4.4%; P = 0.8).
Neither age ≥65 (P = 0.4) nor illness severity score (P = 0.5) significantly modified the effect of HL on LOS. However, the effect of HL on hospital LOS was significantly modified by gender (P = 0.02). Among men, low HL was associated with a 17.8% longer LOS (95% CI, 10.0%-25.7%; P < 0.001), but among women, low HL was associated with only a 7.7% longer LOS (95% CI, 1.9%-13.5%; P = 0.009). Among the remaining demographics, high school graduation status (P = 0.4), being African American (P = 0.6), and insurance status (P = 0.2) did not significantly modify the effect of HL on LOS. In sensitivity analysis, excluding participants with LOS above the 90th percentile of 12 days and excluding participants with illness severity scores above the 90th percentile, low HL was still associated with longer LOS (P < 0.001 and P = 0.001, respectively; Table 2). In the final sensitivity analysis, although age remained a significant predictor of longer LOS after controlling for illness severity (0.2% increase per year, 95% CI, 0.1%-0.3%; P < 0.001), low HL nevertheless remained significantly associated with longer LOS (P < 0.001; Table 2).
Finally, we compared the group with missing data (n = 280) to the group with complete data (n= 5540). The participants with missing data were more likely to have low HL (31% [86/280] vs 20%; P < 0.001) and to have Medicare or private insurance (82% [177/217] vs 72%; P = 0.002); however, they were not more likely to be 65 or older (40% [112/280] vs 37%; P = 0.3), high school graduates (88% [113/129] vs 81%; P = 0.06), African American (69% [177/256] vs 73%; P = 0.1), or female (57% [158/279] vs 57%; P = 1), nor were they more likely to have longer LOS (5.7 [n= 280] vs 5.5 days; P = 0.6) or higher illness severity scores (1.3 [n = 231] vs 1.3; P = 0.7).
DISCUSSION
To our knowledge, this study is the first to evaluate the association between low HL and an important in-hospital outcome measure, hospital LOS. We found that low HL was associated with a longer hospital LOS, a result which remained significant when controlling for severity of illness and sociodemographic variables and when testing the model for sensitivity to the highest values of LOS and illness severity. Additionally, the association of HL with LOS appeared concentrated among participants with shorter LOS. Relative to other predictors, the contribution of HL to the overall LOS model was small, as evidenced by the change in adjusted R2 values with HL excluded.
Among the covariates, only gender modified the association between HL and LOS; the findings suggested that men were more susceptible to the effect of low HL on increased LOS. Illness severity and other sociodemographics, including age ≥65, did not appear to modify the association. We also found that being African American and having Medicaid or no insurance were associated with a significantly shorter LOS in multivariate analysis.
Previous work suggested that the adverse health effects of low HL may be mediated through several pathways, including health knowledge, self-efficacy, health skills, and illness stigma.25-27 The finding of a small but significant relationship between HL and LOS was not surprising given these known associations; nevertheless, there may be an additional patient-dependent effect of low HL on LOS not discovered here. For instance, patients with poor health knowledge and self-efficacy might stay in the hospital longer if they or their providers do not feel comfortable with their self-care ability.
This finding may be useful in developing hospital-based interventions. HL-specific interventions, several of which have been tested in the inpatient setting,14,28,29 have shown promise toward improving health knowledge,30 disease severity,31 and health resource utilization.32
Those with low HL may lack the self-efficacy to participate in discharge planning; in fact, previous work has related low HL to posthospital readmissions.8,9 Conversely, patients with low HL might struggle to engage in the inpatient milieu, advocating for shorter LOS if they feel alienated by the inpatient experience.
These possibilities show that LOS is a complex measure shown to depend on patient-level characteristics and on provider-based, geographical, and sociocultural factors.16,33 With these forces at play, additional effects of lower levels of HL may be lost without phenotyping patients by both level of HL and related characteristics, such as self-efficacy, health skills, and stigma. By gathering these additional data, future work should explore whether subpopulations of patients with low HL may be at risk for too-short vs too-long hospital admissions.
For instance, in this study, both race and Medicaid insurance were associated with shorter LOS. Being African American was associated with shorter LOS in our study but has been found to be associated with longer LOS in another study specifically focused on diabetes.34 Prior findings found uninsured patients have shorter LOS.35 Therefore, these findings in our study are difficult to explain without further work to understand whether there are health disparities in the way patients are cared for during hospitalization that may shorten or lengthen their LOS because of factors outside of their clinical need.
The finding that gender modified the effect of low HL on LOS was unexpected. There were similar proportions of men and women with low HL. There is evidence to support that women make the majority of health decisions for themselves and their familes36; therefore, there may be unmeasured aspects of HL that provide an advantage for female vs male inpatients. Furthermore, omitted confounders, such as social support, may not fully capture potential gender-related differences. Future work is needed to understand the role of gender in relationship to HL and LOS.
Limitations of this study include its observational, single-centered design with information derived from administrative data; positive and negative confounding cannot be ruled out. For instance, we did not control for complex aspects affecting LOS, such as discharge disposition and goals of care (eg, aggressive care after discharge vs hospice). To address this limitation, multivariate analyses were performed, which were adjusted for illness severity scores and took into account both comorbidity and severity of the current illness. Additionally, although it is important to study such populations, our largely urban, minority sample is not representative of the U.S. population, and within our large sample, there were participants with missing data who had lower HL on average, although this group represented only 5% of the sample. Finally, different HL tools have noncomplete concordance, which has been seen when comparing the BHLS with more objective tools.20,37 Furthermore, certain in-hospital clinical scenarios (eg, recent stroke or prolonged intensive care unit stay) may present unique challenges in establishing a baseline HL level. However, the BHLS was used in this study because of its greater feasibility.
In conclusion, this study is the first to evaluate the relationship between low HL and LOS. The findings suggest that HL may play a role in shaping outcomes in the inpatient setting and that targeting interventions toward screened patients may be a pathway toward mitigating adverse effects. Our findings need to be replicated in larger, more representative samples, and further work understanding subpopulations within the low HL population is needed. Future work should measure this association in diverse inpatient settings (eg, psychiatric, surgical, and specialty), in addition to assessing associations between HL and other important in-hospital outcome measures, including mortality and discharge disposition.
Acknowledgments
The authors thank the Hospitalist Project team for their assistance with data collection. The authors especially thank Chuanhong Liao and Ashley Snyder for assistance with statistical analyses; Andrea Flores, Ainoa Coltri, and Tom Best for their assistance with data management. The authors would also like to thank Nicole Twu for her help with preparing and editing the manuscript.
Disclosures
Dr. Jaffee was supported by a Calvin Fentress Research Fellowship and NIH R25MH094612. Dr. Press was supported by a career development award (NHLBI K23HL118151). This work was also supported by a seed grant from the Center for Health Administration Studies. All other authors declare no conflicts of interest.
References
1. U.S. Department of Health and Human Services. Healthy People 2010: Understanding and Improving Health. Washington, DC: U.S. Government Printing Office; 2000. 2. “What Did the Doctor Say”? Improving Health Literacy to Protect Patient Safety. The Joint Commission; 2007. 3. Kutner M, Greenberg E, Jin Y, Paulsen C. The Health Literacy of America’s Adults: Results from the 2003 National Assessment of Adult Literacy. National Center for Education Statistics; 2006. 4. Davis TC, Wolf MS, Bass PF, et al. Literacy and misunderstanding prescription drug labels. Ann Intern Med. 2006;145(12):887-894. PubMed 5. Kripalani S, Henderson LE, Chiu EY, Robertson R, Kolm P, Jacobson TA. Predictors of medication self-management skill in a low-literacy population. J Gen Intern Med. 2006;21(8):852-856. PubMed 6. Berkman ND, Sheridan SL, Donahue KE, Halpern DJ, Crotty K. Low health literacy and health outcomes: an updated systematic review. Ann Intern Med. 2011;155(2):97-107. PubMed 7. Baker DW, Parker RM, Williams MV, Clark WS. Health literacy and the risk of hospital admission. J Gen Intern Med. 1998;13(12):791-798. PubMed 8. Mitchell SE, Sadikova E, Jack BW, Paasche-Orlow MK. Health literacy and 30-day postdischarge hospital utilization. J Health Commun. 2012;17(Suppl 3):325-338. PubMed 9. Jaffee EG, Arora VM, Matthiesen MI, Hariprasad SM, Meltzer DO, Press VG. Postdischarge Falls and Readmissions: Associations with Insufficient Vision and Low Health Literacy among Hospitalized Seniors. J Health Commun. 2016;21(sup2):135-140. PubMed 10. Hope CJ, Wu J, Tu W, Young J, Murray MD. Association of medication adherence, knowledge, and skills with emergency department visits by adults 50 years or older with congestive heart failure. Am J Health Syst Pharm. 2004;61(19):2043-2049. PubMed 11. Bennett IM, Chen J, Soroui JS, White S. The contribution of health literacy to disparities in self-rated health status and preventive health behaviors in older adults. Ann Fam Med. 2009;7(3):204-211. PubMed 12. Baker DW, Wolf MS, Feinglass J, Thompson JA. Health literacy, cognitive abilities, and mortality among elderly persons. J Gen Intern Med. 2008;23(6):723-726. PubMed 13. Cho YI, Lee SY, Arozullah AM, Crittenden KS. Effects of health literacy on health status and health service utilization amongst the elderly. Soc Sci Med. 2008;66(8):1809-1816. PubMed 14. Paasche-Orlow MK, Riekert KA, Bilderback A, et al. Tailored education may reduce health literacy disparities in asthma self-management. Am J Respir Crit Care Med. 2005;172(8):980-986. PubMed 15. Soria-Aledo V, Carrillo-Alcaraz A, Campillo-Soto Á, et al. Associated factors and cost of inappropriate hospital admissions and stays in a second-level hospital. Am J Med Qual. 2009;24(4):321-332. PubMed 16. Lu M, Sajobi T, Lucyk K, Lorenzetti D, Quan H. Systematic review of risk adjustment models of hospital length of stay (LOS). Med Care. 2015;53(4):355-365. PubMed 17. Clarke A, Rosen R. Length of stay. How short should hospital care be? Eur J Public Health. 2001;11(2):166-170. PubMed 18. Meltzer D, Manning WG, Morrison J, et al. Effects of physician experience on costs and outcomes on an academic general medicine service: results of a trial of hospitalists. Ann Intern Med. 2002;137(11):866-874. PubMed 19. Chew LD, Bradley KA, Boyko EJ. Brief questions to identify patients with inadequate health literacy. Fam Med. 2004;36(8):588-594. PubMed 20. Press VG, Shapiro MI, Mayo AM, Meltzer DO, Arora VM. More than meets the eye: relationship between low health literacy and poor vision in hospitalized patients. J Health Commun. 2013;18 Suppl 1:197-204. PubMed 21. Willens DE, Kripalani S, Schildcrout JS, et al. Association of brief health literacy screening and blood pressure in primary care. J Health Commun. 2013;18 Suppl 1:129-142. PubMed 22. Peterson PN, Shetterly SM, Clarke CL, et al. Health literacy and outcomes among patients with heart failure. JAMA. 2011;305(16):1695-1701. PubMed 23. Chew LD, Griffin JM, Partin MR, et al. Validation of screening questions for limited health literacy in a large VA outpatient population. J Gen Intern Med. 2008;23(5):561-566. PubMed 24. Averill RF, Goldfield N, Hughes JS, et al. All Patient Refined Diagnosis Related Groups (APR-DRGs): Methodology Overview. 3M Health Information Systems; 2003. 25. Waite KR, Paasche-Orlow M, Rintamaki LS, Davis TC, Wolf MS. Literacy, social stigma, and HIV medication adherence. J Gen Intern Med. 2008;23(9):1367-1372. PubMed 26. Paasche-Orlow MK, Wolf MS. The causal pathways linking health literacy to health outcomes. Am J Health Behav. 2007;31 Suppl 1:S19-26. PubMed 27. Berkman ND, Sheridan SL, Donahue KE, et al. Health literacy interventions and outcomes: an updated systematic review. Evid Rep Technol Assess (Full Rep). 2011;(199):1-941. PubMed 28. Kripalani S, Roumie CL, Dalal AK, et al. Effect of a pharmacist intervention on clinically important medication errors after hospital discharge: a randomized trial. Ann Intern Med. 2012;157(1):1-10. PubMed 29. Press VG, Arora VM, Shah LM, et al. Teaching the use of respiratory inhalers to hospitalized patients with asthma or COPD: a randomized trial. J Gen Intern Med. 2012;27(10):1317-1325. PubMed 30. Sobel RM, Paasche-Orlow MK, Waite KR, Rittner SS, Wilson EAH, Wolf MS. Asthma 1-2-3: a low literacy multimedia tool to educate African American adults about asthma. J Community Health. 2009;34(4):321-327. PubMed 31. Rothman RL, DeWalt DA, Malone R, et al. Influence of patient literacy on the effectiveness of a primary care-based diabetes disease management program. JAMA. 2004;292(14):1711-1716. PubMed 32. DeWalt DA, Malone RM, Bryant ME, et al. A heart failure self-management program for patients of all literacy levels: a randomized, controlled trial [ISRCTN11535170]. BMC Health Serv Res. 2006;6:30. PubMed 33. Hasan O, Orav EJ, Hicks LS. Insurance status and hospital care for myocardial infarction, stroke, and pneumonia. J Hosp Med. 2010;5(8):452-459. PubMed 34. Cook CB, Naylor DB, Hentz JG, et al. Disparities in diabetes-related hospitalizations: relationship of age, sex, and race/ethnicity with hospital discharges, lengths of stay, and direct inpatient charges. Ethn Dis. 2006;16(1):126-131. PubMed 35. Hadley J, Steinberg EP, Feder J. Comparison of uninsured and privately insured hospital patients. Condition on admission, resource use, and outcome. JAMA. 1991;265(3):374-379. PubMed 36. Women’s Health Care Chartbook: Key Findings From the Kaiser Women’s Health Survey. May 2011. https://kaiserfamilyfoundation.files.wordpress. com/2013/01/8164.pdf. Accessed August 1, 2017. 37. Louis AJ, Arora VM, Matthiesen MI, Meltzer DO, Press VG. Screening Hospitalized Patients for Low Health Literacy: Beyond the REALM of Possibility? PubMed
Issue
Journal of Hospital Medicine 12(12)
Issue
Journal of Hospital Medicine 12(12)
Page Number
969-973. Published online first September 20, 2017
Page Number
969-973. Published online first September 20, 2017
Valerie G. Press, MD, MPH, 5841 South Maryland Avenue, MC 2007, Chicago, IL 60637; Telephone: 773-702-5170; Fax: 773-795-7398; E-mail: vpress@medicine.bsd.uchicago.edu
Content Gating
Open Access (article Unlocked/Open Access)
Alternative CME
Disqus Comments
Default
Consolidated Pubs: Do Not Show Source Publication Logo
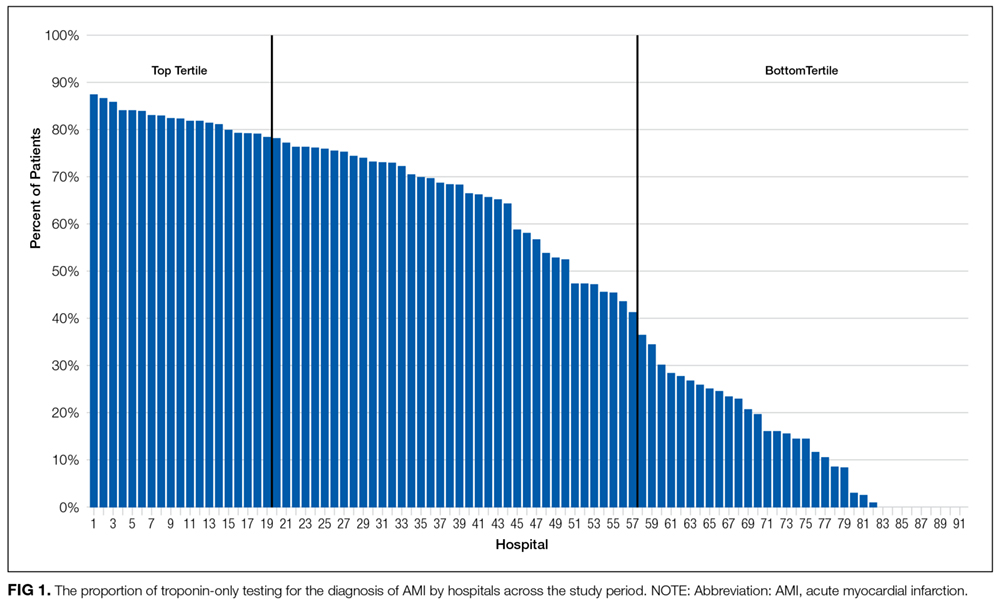
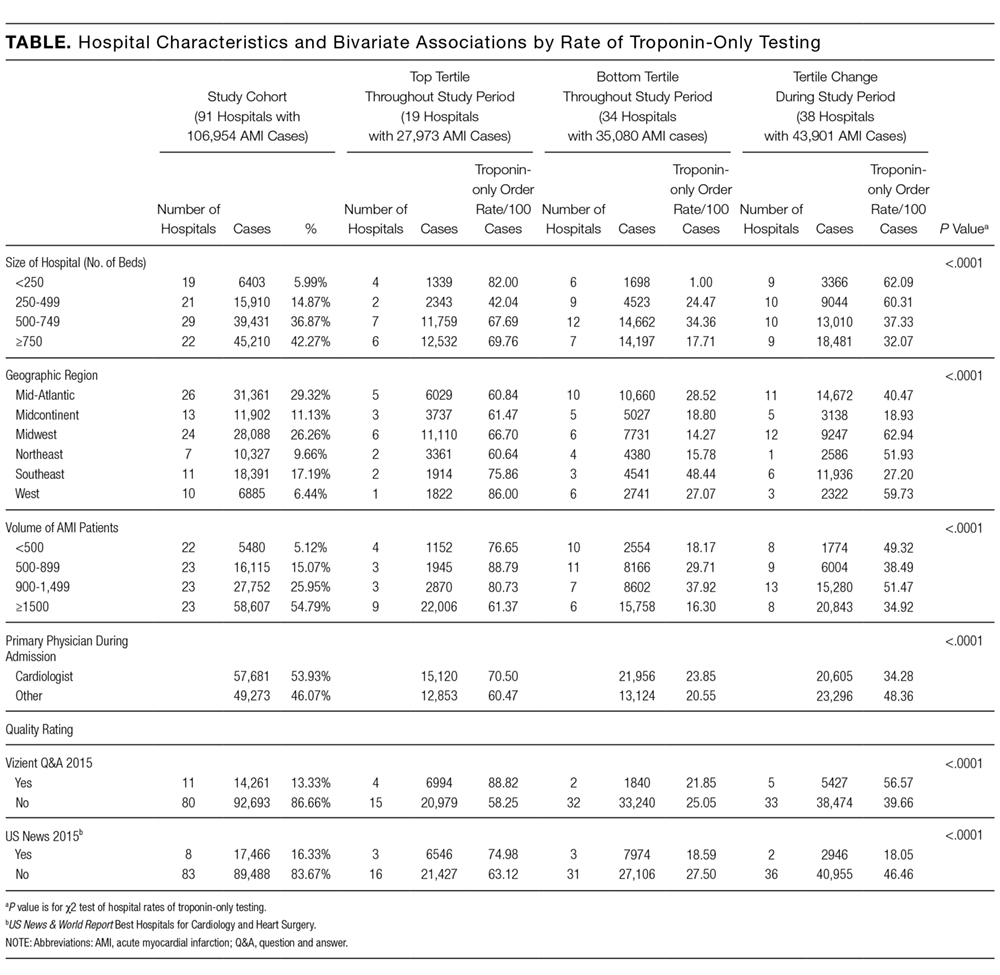
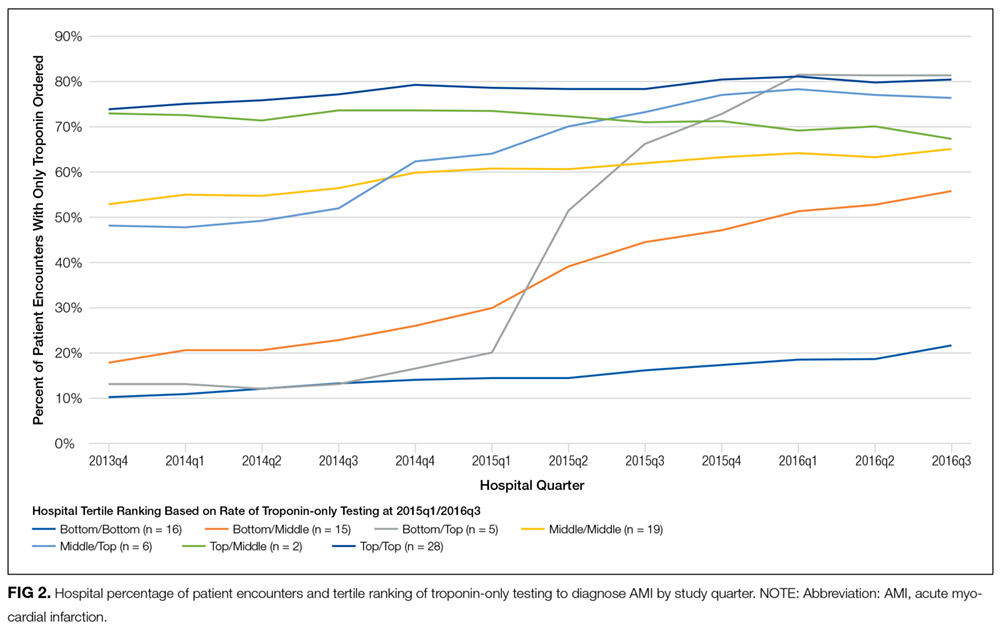
Evidence suggests that troponin-only testing is the superior strategy to diagnose acute myocardial infarction (AMI).1 Because of this, in February 2015, the Choosing Wisely® campaign issued a recommendation to use troponin I or T to diagnose AMI, and not to test for myoglobin or creatine kinase-MB (CK-MB).2 This recommendation was in line with guidelines from the American Heart Association and the American College of Cardiology, which recommended that myoglobin and CK-MB are not useful and offer no benefit for the diagnosis of acute coronary syndrome.3 Some institutions have developed interventions to promote troponin-only testing, reporting substantial cost savings and no negative consequences.4,5
Despite these successes, it is likely that institutions vary with respect to the adoption of the Choosing Wisely® troponin-only testing recommendation.6 Implementing this recommendation requires both promoting clinician behavior change and a strong institutional culture of high-value care.7 Understanding the variation across institutions of troponin-only testing could inform how to promote high-value care recommendations nationwide. We aimed to describe patterns of troponin, myoglobin, and CK-MB testing in a sample of academic teaching hospitals before and after the Choosing Wisely® recommendation.
METHODS
Troponin, myoglobin, and CK-MB ordering data were extracted from Vizient’s (formerly University HealthSystem Consortium, Chicago, IL) Clinical Database/Resource Manager (CDB/RM®) for all patients with a principal discharge diagnosis of AMI at all hospitals reporting all 36 months from the fourth quarter of 2013 through the third quarter of 2016. This period includes time both before and after the Choosing Wisely® recommendation, which was released in the first quarter of 2015. Vizient’s CDB/RM contains ordering data for 300 academic medical centers and their affiliated hospitals and includes the discharge diagnoses for patients cared for by these institutions. Only patients with a principal discharge diagnosis of AMI were included because the Choosing Wisely® recommendation is specific with regard to troponin-only testing for the diagnosis of AMI. Patients with a principal diagnosis code for subcategories of myocardial ischemia (eg, stable angina, unstable angina) were not included because of the large number of diagnosis codes for these subcategories (more than 100 in the International Classification of Diseases, Ninth Revision and the International Classification of Diseases, Tenth Revision) and because the variation in their use across institutions within the dataset limited the utility of using these codes to consistently and accurately identify patients with myocardial ischemia. Moreover, the diagnosis of AMI encompasses the subcategories of myocardial ischemia.8
Hospital rates of ordering cardiac biomarkers (troponin-only or troponin and myoglobin/CK-MB) were determined overall for the entire study period and for each quarter of the study period based on the total patients with a discharge diagnosis of AMI. For each quarter of the 12 study quarters, all the hospitals were divided into tertiles based on their rate of troponin-only testing per discharge diagnosis of AMI. Hospitals were then classified into 3 groups based on their tertile ranking over the full 12 study quarters. The first group included hospitals whose rate of troponin-only testing placed them in the top tertile for each and all quarters throughout the study period. The second group included hospitals whose troponin-only testing rate placed them in the bottom tertile for each and all quarters throughout the study period. The third group included hospitals whose troponin-only testing rate each quarter led to either an increase or decrease in their tertile ranking throughout the study period. χ2 tests were used to test for bivariate associations among hospitals based on their rate of troponin-only testing and hospital size (number of beds), their regional geographic location, the volume of AMI patients seen at the hospital, whether the primary physician during the hospitalization was a cardiologist or other provider, and the hospitals’ quality ratings. Quality rating was based on an internal Vizient rating and the “Best Hospitals for Cardiology and Heart Surgery Rankings” as published in the US News & World Report.9 The Vizient quality rating is based on a composite score that combines scores from the domains of quality (hospital quality incentive scores), safety (patient safety indicators), patient-centeredness (Hospital Consumer Assessment of Healthcare Providers and Systems Hospital Survey), and equity (distribution of care by race/ethnicity, gender, and age). Simple slopes were calculated to determine the rate of change in troponin-only testing for each study quarter, and Student t tests were used to compare the rates of change of these simple slopes across study quarters.
RESULTS
Of the 300 hospitals in Vizient’s CDB/RM, 91 (30%, 91/300) had full reporting of data throughout the study period. These hospitals had a total of 106,954 inpatient discharges with a principal diagnosis of AMI during the study period. The overall rates of troponin-only testing for AMI discharges by hospital varied from 0% to 87.4% (Figure 1). The mean rate of troponin-only testing across all patients with a discharge diagnosis of AMI was 29.2% at the start of the study (fourth quarter of 2013) and 53.5% at the end of the study (third quarter 2016; Supplemental Figure). Nineteen hospitals (21%, 19/91; 27,973 discharges) had high rates of troponin-only testing for AMI and were in the top tertile of all hospitals throughout the study period. Thirty-four hospitals (37%, 34/91; 35,080 discharges) ordered both troponin and myoglobin/CK-MB tests to diagnose AMI, and they were in the bottom tertile of all hospitals throughout the study period. In the 38 hospitals (42%, 38/91; 43,090 discharges) that were not in the top or bottom tertile for all study quarters, the rate of troponin-only testing for AMI increased at each hospital during each quarter of the study period (Table).
Pattern of Troponin-Only Testing by Hospital Size
Of the hospitals in the top tertile of troponin-only testing throughout the study period, the majority had ≥500 beds (13/19), but the highest rate of troponin-only testing was in hospitals that had <250 beds (n = 4, troponin-only testing rate of 82/100 patients). Additionally, in hospitals that improved their troponin-only testing during the study period, hospitals that had <500 beds had higher rates of troponin-only testing than did hospitals with ≥500 beds. The differences in the rates of troponin-only testing across the 3 groups of hospitals and hospital size were statistically significant (P < 0.0001; Table).
Pattern of Troponin-Only Testing by Geographic Region
The rate of troponin-only testing also varied and was statistically significantly different when comparing the 3 groups of hospitals across geographic regions of the country (P < 0.0001). Of the hospitals in the top tertile of troponin-only testing throughout the study period, the majority were in the Midwest (n = 6) and Mid-Atlantic (n = 5) regions. However, the rate of troponin-only testing for AMI in this group was highest in hospitals in the West (86/100 patients) and/or Southeast (75/100 patients) regions, although this rate was based on a small number of hospitals in these geographic areas (n = 1 in the West, n = 2 in the Southeast). Of hospitals in the bottom tertile of troponin-only testing throughout the study period, the majority were in the Mid-Atlantic region (n = 10). Hospitals that increased their troponin-only testing during the study period were predominantly in the Midwest (n = 12) and Mid-Atlantic regions (n = 11; Table), with the hospitals in the Midwest having the highest rate of troponin-only testing in this group.
Pattern of Troponin-Only Testing by Volume of AMI Patients
Of the hospitals in the top tertile of troponin-only testing during the study period, the majority cared for ≥1500 AMI patients (n = 9), but interestingly, among these hospitals, those caring for a smaller volume of AMI patients all had higher rates of troponin-only testing per 100 patients (P < 0.0001; Table). There was no other obvious pattern of troponin-only testing based on the volume of AMI patients cared for in hospitals in either the bottom tertile of troponin-only testing or hospitals that improved troponin-only testing during the study period.
Pattern of Troponin-Only Testing by Physician Type
Of the hospitals in the top tertile of troponin-only testing throughout the study period, those where a cardiologist cared for patients with AMI had higher rates of troponin-only testing (71/100 patients) than did hospitals where patients were cared for by a noncardiologist (60/100 patients). However, of the hospitals that improved their troponin-only testing during the study period, higher rates of troponin-only testing were seen in hospitals where patients were cared for by a noncardiologist (48/100 patients) compared with patients cared for by a cardiologist (34/100 patients; Table). These differences in hospital rates of troponin-only testing during the study period based on physician type were statistically significant (P < 0.0001; Table).
Pattern of Troponin-Only Testing by Quality Rating
Hospitals that were in the top tertile of troponin-only testing and were rated highly by Vizient’s quality rating or recognized as a top hospital by the US News & World Report had higher rates of troponin-only testing per 100 patients than did hospitals in the top tertile that were not ranked highly by Vizient’s quality rating or recognized as a top hospital by the US News & World Report. However, the majority of hospitals in the top tertile of troponin-only testing were not rated highly by Vizient (n = 15) or recognized as a top hospital by the US News & World Report (n = 16). The large majority of hospitals in the bottom tertile of troponin-only testing were not recognized as high-quality hospitals by Vizient (n = 32) or the US News & World Report (n = 31). Of the hospitals that improved their troponin-only testing during the study period, the majority were not recognized as high-quality hospitals by Vizient (n = 33) or the US News & World Report (n = 36), but among this group, those hospitals recognized by Vizient as high quality (n = 5) had the highest rate of troponin-only testing (57/100 patients). The differences in the rate of troponin-only testing across the different groups of hospitals and quality ratings were statistically significant (P < 0.0001; Table).
The Effect of Choosing Wisely® on Troponin-Only Testing
While in many institutions the rates of troponin-only testing were increasing before the Choosing Wisely® recommendation was released in 2015, the release of the recommendation was associated with a significant increase in the rate of troponin-only testing in the institutions that were in the bottom tertile of troponin-only testing prior to the release of the recommendation but moved to the top tertile after the release of the recommendation (n = 5). The slope percentage of the rate of change of the 5 hospitals that went from the bottom tertile to the top tertile after the release of the Choosing Wisely® recommendation was 5.7%. Additionally, the Choosing Wisely® recommendation was associated with an accelerated rate of troponin-only testing in hospitals moving from the bottom tertile before the release of the recommendation to the middle tertile after the recommendation (n = 15; slope = 3.2%) and in hospitals moving from the middle tertile before the release of the recommendation to the top tertile after (n = 6; slope = 2.4%) (Figure 2). For all of these hospitals (n = 26), the increased rate of troponin-only testing in the study quarter after the Choosing Wisely® recommendation was statistically significantly higher and different from the rate of troponin-only testing in all other study quarters, except for the period between 2014 quarter 3 and quarter 4 (P = 0.08), the period between 2015 quarter 2 and quarter 3 (P = 0.18), and 2015 quarter 3 and quarter 4 (P = 0.06), where the effect did not quite reach statistical significance (Figure 3).
DISCUSSION
In a broad sample of academic teaching hospitals, there was an overall increase in the rate of troponin-only testing starting from the fourth quarter of 2013 through the third quarter of 2016. However, there was wide variation in the adoption of troponin-only testing for AMI across institutions. Our study identified several high-performing hospitals where the rate of troponin-only testing was high prior to and after the Choosing Wisely® troponin-only recommendation. Additionally, we identified several poor-performing hospitals, which even after the release of the Choosing Wisely® recommendation continue to order both troponin and myoglobin/CK-MB tests for the diagnosis of AMI. Lastly, we identified several hospitals in which the release of the Choosing Wisely® recommendation was associated with a significant increase in the rate of troponin-only testing for the diagnosis of AMI. The high-performing hospitals in our sample that were in the top tertile of troponin-only testing throughout the study period are “early adopters,” having already instituted troponin-only testing before the release of the Choosing Wisely® troponin-only recommendation. These hospitals vary in size, geographic region of the country, volume of AMI patients cared for, whether AMI patients are cared for by a cardiologist or other provider, and quality rating. Interestingly, in these hospitals, AMI patients admitted under the care of a cardiologist had higher rates of troponin-only testing than when admitted under another physician type. This is perhaps not surprising given that cardiologists would be the most likely to be aware of the data supporting troponin-only testing prior to the Choosing Wisely® recommendation and the most likely to institute interventions to promote troponin-only testing and disseminate this knowledge across their institution. These institutions and their practice of troponin-only testing before the Choosing Wisely® recommendation represent the idea of positive deviance,10 whereby they had identified troponin-only testing as a superior strategy and instituted successful initiatives to reduce the use of unnecessary myoglobin and CK-MB testing before their peer hospitals and the release of the Choosing Wisely® recommendation. Further efforts to explore and understand the additional factors that define the hospitals that had high rates of troponin-only testing prior to the Choosing Wisely® recommendation may be helpful to understanding the necessary culture and institutional factors that can promote high-value care.
In the hospitals that demonstrated increasing adoption of troponin-only testing, there are several interesting patterns. First, among these hospitals, smaller hospitals tended to have higher overall rates of troponin-only testing per 100 patients than larger hospitals. Additionally, the hospitals with the highest rates were located in the Midwest region. These hospitals may be learning from and following the high-performing institutions observed in our data that are also located in the Midwest. Additionally, among the hospitals that significantly increased their rate of troponin-only testing, we see that the Choosing Wisely® recommendation appeared to facilitate accelerated adoption of troponin-only testing. In these institutions, it is likely that the impact of Choosing Wisely® was significant because there was attention to high-value care and already an existing movement underway to institute such high-value practices. For example, natural champions, leadership, infrastructure, and a supportive culture may all be prerequisites for Choosing Wisely® recommendations to become institutionally adopted.
Lastly, in the hospitals that have continued to order myoglobin and CK-MB, future work is needed to understand and overcome barriers to adopting high-value care practices.
There are several limitations to this study. First, because this was an observational study, we cannot prove a causal relationship between the Choosing Wisely® recommendation and the increased rates of troponin-only testing. Additionally, the Vizient CDB/RM contains reporting data for a limited number of academic medical centers only, and therefore, these results may not represent practices at nonacademic or even other academic medical centers. Our study only included patients with a principal discharge diagnosis of AMI because the Choosing Wisely® recommendation to order troponin-only is specific for diagnosing patients with AMI. However, it is possible that the Choosing Wisely® recommendation also has affected provider ordering in patients with diagnoses such as chest pain or angina, and these affects would not be captured in our study. Lastly, because instituting high-value care practices take time, our follow-up time may not have been long enough to capture improvement in troponin-only testing at institutions responding to and attempting to adhere to the Choosing Wisely® recommendation to order troponin-only testing for patients with AMI.
Disclosure
No other individuals besides the authors contributed to this work. This project was not funded or supported by any external grant or agency. Dr. Prochaska’s institute received funding from the Agency for Research Healthcare and Quality for a K12 Career Development Grant (AHRQ K12 HS023007) outside the submitted work. Dr. Hohmann and Dr Modes have nothing to disclose. Dr. Arora receives financial compensation as a member of the Board of Directors for the American Board of Internal Medicine and has received grant funding from the ABIM Foundation. She also receives royalties from McGraw Hill.
References
1. Pickering JW, Than MP, Cullen L, et al. Rapid rule-out of acute myocardial infarction with a single high-sensitivity cardiac troponin t measurement below the limit of detection: A collaborative meta-analysis. Ann Intern Med. 2017;166(10):715-724. PubMed 2. American Society for Clinical Pathology. Don’t test for myoglobin or CK-MB in the diagnosis of acute myocardial infarction (AMI). Instead, use troponin I or T. http://www.choosingwisely.org/clinician-lists/american-society-clinical-pathology-myoglobin-to-diagnose-acute-myocardial-infarction/. Accessed August 3, 2016. 3. Amsterdam EA, Wenger NK, Brindis RG, et al. 2014 AHA/ACC guideline for the management of patients with non–st-elevation acute coronary syndromes. Circulation. 2014;130(25):e344-e426. PubMed 4. Larochelle MR, Knight AM, Pantle H, Riedel S, Trost JC. Reducing excess cardiac biomarker testing at an academic medical center. J Gen Intern Med. 2014;29(11):1468-1474. PubMed 5. Le RD, Kosowsky JM, Landman AB, Bixho I, Melanson SEF, Tanasijevic MJ. Clinical and financial impact of removing creatine kinase-MB from the routine testing menu in the emergency setting. Am J Emerg Med. 2015;33(1):72-75. PubMed 6. Rosenberg A, Agiro A, Gottlieb M, et al. Early trends among seven recommendations from the choosing wisely campaign. JAMA Intern Med. 2015;175(12):1913. PubMed 7. Wolfson DB. Choosing Wisely recommendations using administrative claims data. JAMA Intern Med. 2016;176(4):565-565. PubMed 8. Thygesen K, Alpert JS, Jaffe AS, Simoons ML, Chaitman BR, White HD. Third universal definition of myocardial infarction. Circulation. 2012;126(16):2020-2035. PubMed 9. US News & World Report. Best hospitals for cardiology & heart surgery. http://health.usnews.com/best-hospitals/rankings/cardiology-and-heart-surgery. Accessed April 19, 2017. 10. Bradley EH, Curry LA, Ramanadhan S, Rowe L, Nembhard IM, Krumholz HM. Research in action: using positive deviance to improve quality of health care. Implement Sci IS. 2009;4:25. PubMed
Evidence suggests that troponin-only testing is the superior strategy to diagnose acute myocardial infarction (AMI).1 Because of this, in February 2015, the Choosing Wisely® campaign issued a recommendation to use troponin I or T to diagnose AMI, and not to test for myoglobin or creatine kinase-MB (CK-MB).2 This recommendation was in line with guidelines from the American Heart Association and the American College of Cardiology, which recommended that myoglobin and CK-MB are not useful and offer no benefit for the diagnosis of acute coronary syndrome.3 Some institutions have developed interventions to promote troponin-only testing, reporting substantial cost savings and no negative consequences.4,5
Despite these successes, it is likely that institutions vary with respect to the adoption of the Choosing Wisely® troponin-only testing recommendation.6 Implementing this recommendation requires both promoting clinician behavior change and a strong institutional culture of high-value care.7 Understanding the variation across institutions of troponin-only testing could inform how to promote high-value care recommendations nationwide. We aimed to describe patterns of troponin, myoglobin, and CK-MB testing in a sample of academic teaching hospitals before and after the Choosing Wisely® recommendation.
METHODS
Troponin, myoglobin, and CK-MB ordering data were extracted from Vizient’s (formerly University HealthSystem Consortium, Chicago, IL) Clinical Database/Resource Manager (CDB/RM®) for all patients with a principal discharge diagnosis of AMI at all hospitals reporting all 36 months from the fourth quarter of 2013 through the third quarter of 2016. This period includes time both before and after the Choosing Wisely® recommendation, which was released in the first quarter of 2015. Vizient’s CDB/RM contains ordering data for 300 academic medical centers and their affiliated hospitals and includes the discharge diagnoses for patients cared for by these institutions. Only patients with a principal discharge diagnosis of AMI were included because the Choosing Wisely® recommendation is specific with regard to troponin-only testing for the diagnosis of AMI. Patients with a principal diagnosis code for subcategories of myocardial ischemia (eg, stable angina, unstable angina) were not included because of the large number of diagnosis codes for these subcategories (more than 100 in the International Classification of Diseases, Ninth Revision and the International Classification of Diseases, Tenth Revision) and because the variation in their use across institutions within the dataset limited the utility of using these codes to consistently and accurately identify patients with myocardial ischemia. Moreover, the diagnosis of AMI encompasses the subcategories of myocardial ischemia.8
Hospital rates of ordering cardiac biomarkers (troponin-only or troponin and myoglobin/CK-MB) were determined overall for the entire study period and for each quarter of the study period based on the total patients with a discharge diagnosis of AMI. For each quarter of the 12 study quarters, all the hospitals were divided into tertiles based on their rate of troponin-only testing per discharge diagnosis of AMI. Hospitals were then classified into 3 groups based on their tertile ranking over the full 12 study quarters. The first group included hospitals whose rate of troponin-only testing placed them in the top tertile for each and all quarters throughout the study period. The second group included hospitals whose troponin-only testing rate placed them in the bottom tertile for each and all quarters throughout the study period. The third group included hospitals whose troponin-only testing rate each quarter led to either an increase or decrease in their tertile ranking throughout the study period. χ2 tests were used to test for bivariate associations among hospitals based on their rate of troponin-only testing and hospital size (number of beds), their regional geographic location, the volume of AMI patients seen at the hospital, whether the primary physician during the hospitalization was a cardiologist or other provider, and the hospitals’ quality ratings. Quality rating was based on an internal Vizient rating and the “Best Hospitals for Cardiology and Heart Surgery Rankings” as published in the US News & World Report.9 The Vizient quality rating is based on a composite score that combines scores from the domains of quality (hospital quality incentive scores), safety (patient safety indicators), patient-centeredness (Hospital Consumer Assessment of Healthcare Providers and Systems Hospital Survey), and equity (distribution of care by race/ethnicity, gender, and age). Simple slopes were calculated to determine the rate of change in troponin-only testing for each study quarter, and Student t tests were used to compare the rates of change of these simple slopes across study quarters.
RESULTS
Of the 300 hospitals in Vizient’s CDB/RM, 91 (30%, 91/300) had full reporting of data throughout the study period. These hospitals had a total of 106,954 inpatient discharges with a principal diagnosis of AMI during the study period. The overall rates of troponin-only testing for AMI discharges by hospital varied from 0% to 87.4% (Figure 1). The mean rate of troponin-only testing across all patients with a discharge diagnosis of AMI was 29.2% at the start of the study (fourth quarter of 2013) and 53.5% at the end of the study (third quarter 2016; Supplemental Figure). Nineteen hospitals (21%, 19/91; 27,973 discharges) had high rates of troponin-only testing for AMI and were in the top tertile of all hospitals throughout the study period. Thirty-four hospitals (37%, 34/91; 35,080 discharges) ordered both troponin and myoglobin/CK-MB tests to diagnose AMI, and they were in the bottom tertile of all hospitals throughout the study period. In the 38 hospitals (42%, 38/91; 43,090 discharges) that were not in the top or bottom tertile for all study quarters, the rate of troponin-only testing for AMI increased at each hospital during each quarter of the study period (Table).
Pattern of Troponin-Only Testing by Hospital Size
Of the hospitals in the top tertile of troponin-only testing throughout the study period, the majority had ≥500 beds (13/19), but the highest rate of troponin-only testing was in hospitals that had <250 beds (n = 4, troponin-only testing rate of 82/100 patients). Additionally, in hospitals that improved their troponin-only testing during the study period, hospitals that had <500 beds had higher rates of troponin-only testing than did hospitals with ≥500 beds. The differences in the rates of troponin-only testing across the 3 groups of hospitals and hospital size were statistically significant (P < 0.0001; Table).
Pattern of Troponin-Only Testing by Geographic Region
The rate of troponin-only testing also varied and was statistically significantly different when comparing the 3 groups of hospitals across geographic regions of the country (P < 0.0001). Of the hospitals in the top tertile of troponin-only testing throughout the study period, the majority were in the Midwest (n = 6) and Mid-Atlantic (n = 5) regions. However, the rate of troponin-only testing for AMI in this group was highest in hospitals in the West (86/100 patients) and/or Southeast (75/100 patients) regions, although this rate was based on a small number of hospitals in these geographic areas (n = 1 in the West, n = 2 in the Southeast). Of hospitals in the bottom tertile of troponin-only testing throughout the study period, the majority were in the Mid-Atlantic region (n = 10). Hospitals that increased their troponin-only testing during the study period were predominantly in the Midwest (n = 12) and Mid-Atlantic regions (n = 11; Table), with the hospitals in the Midwest having the highest rate of troponin-only testing in this group.
Pattern of Troponin-Only Testing by Volume of AMI Patients
Of the hospitals in the top tertile of troponin-only testing during the study period, the majority cared for ≥1500 AMI patients (n = 9), but interestingly, among these hospitals, those caring for a smaller volume of AMI patients all had higher rates of troponin-only testing per 100 patients (P < 0.0001; Table). There was no other obvious pattern of troponin-only testing based on the volume of AMI patients cared for in hospitals in either the bottom tertile of troponin-only testing or hospitals that improved troponin-only testing during the study period.
Pattern of Troponin-Only Testing by Physician Type
Of the hospitals in the top tertile of troponin-only testing throughout the study period, those where a cardiologist cared for patients with AMI had higher rates of troponin-only testing (71/100 patients) than did hospitals where patients were cared for by a noncardiologist (60/100 patients). However, of the hospitals that improved their troponin-only testing during the study period, higher rates of troponin-only testing were seen in hospitals where patients were cared for by a noncardiologist (48/100 patients) compared with patients cared for by a cardiologist (34/100 patients; Table). These differences in hospital rates of troponin-only testing during the study period based on physician type were statistically significant (P < 0.0001; Table).
Pattern of Troponin-Only Testing by Quality Rating
Hospitals that were in the top tertile of troponin-only testing and were rated highly by Vizient’s quality rating or recognized as a top hospital by the US News & World Report had higher rates of troponin-only testing per 100 patients than did hospitals in the top tertile that were not ranked highly by Vizient’s quality rating or recognized as a top hospital by the US News & World Report. However, the majority of hospitals in the top tertile of troponin-only testing were not rated highly by Vizient (n = 15) or recognized as a top hospital by the US News & World Report (n = 16). The large majority of hospitals in the bottom tertile of troponin-only testing were not recognized as high-quality hospitals by Vizient (n = 32) or the US News & World Report (n = 31). Of the hospitals that improved their troponin-only testing during the study period, the majority were not recognized as high-quality hospitals by Vizient (n = 33) or the US News & World Report (n = 36), but among this group, those hospitals recognized by Vizient as high quality (n = 5) had the highest rate of troponin-only testing (57/100 patients). The differences in the rate of troponin-only testing across the different groups of hospitals and quality ratings were statistically significant (P < 0.0001; Table).
The Effect of Choosing Wisely® on Troponin-Only Testing
While in many institutions the rates of troponin-only testing were increasing before the Choosing Wisely® recommendation was released in 2015, the release of the recommendation was associated with a significant increase in the rate of troponin-only testing in the institutions that were in the bottom tertile of troponin-only testing prior to the release of the recommendation but moved to the top tertile after the release of the recommendation (n = 5). The slope percentage of the rate of change of the 5 hospitals that went from the bottom tertile to the top tertile after the release of the Choosing Wisely® recommendation was 5.7%. Additionally, the Choosing Wisely® recommendation was associated with an accelerated rate of troponin-only testing in hospitals moving from the bottom tertile before the release of the recommendation to the middle tertile after the recommendation (n = 15; slope = 3.2%) and in hospitals moving from the middle tertile before the release of the recommendation to the top tertile after (n = 6; slope = 2.4%) (Figure 2). For all of these hospitals (n = 26), the increased rate of troponin-only testing in the study quarter after the Choosing Wisely® recommendation was statistically significantly higher and different from the rate of troponin-only testing in all other study quarters, except for the period between 2014 quarter 3 and quarter 4 (P = 0.08), the period between 2015 quarter 2 and quarter 3 (P = 0.18), and 2015 quarter 3 and quarter 4 (P = 0.06), where the effect did not quite reach statistical significance (Figure 3).
DISCUSSION
In a broad sample of academic teaching hospitals, there was an overall increase in the rate of troponin-only testing starting from the fourth quarter of 2013 through the third quarter of 2016. However, there was wide variation in the adoption of troponin-only testing for AMI across institutions. Our study identified several high-performing hospitals where the rate of troponin-only testing was high prior to and after the Choosing Wisely® troponin-only recommendation. Additionally, we identified several poor-performing hospitals, which even after the release of the Choosing Wisely® recommendation continue to order both troponin and myoglobin/CK-MB tests for the diagnosis of AMI. Lastly, we identified several hospitals in which the release of the Choosing Wisely® recommendation was associated with a significant increase in the rate of troponin-only testing for the diagnosis of AMI. The high-performing hospitals in our sample that were in the top tertile of troponin-only testing throughout the study period are “early adopters,” having already instituted troponin-only testing before the release of the Choosing Wisely® troponin-only recommendation. These hospitals vary in size, geographic region of the country, volume of AMI patients cared for, whether AMI patients are cared for by a cardiologist or other provider, and quality rating. Interestingly, in these hospitals, AMI patients admitted under the care of a cardiologist had higher rates of troponin-only testing than when admitted under another physician type. This is perhaps not surprising given that cardiologists would be the most likely to be aware of the data supporting troponin-only testing prior to the Choosing Wisely® recommendation and the most likely to institute interventions to promote troponin-only testing and disseminate this knowledge across their institution. These institutions and their practice of troponin-only testing before the Choosing Wisely® recommendation represent the idea of positive deviance,10 whereby they had identified troponin-only testing as a superior strategy and instituted successful initiatives to reduce the use of unnecessary myoglobin and CK-MB testing before their peer hospitals and the release of the Choosing Wisely® recommendation. Further efforts to explore and understand the additional factors that define the hospitals that had high rates of troponin-only testing prior to the Choosing Wisely® recommendation may be helpful to understanding the necessary culture and institutional factors that can promote high-value care.
In the hospitals that demonstrated increasing adoption of troponin-only testing, there are several interesting patterns. First, among these hospitals, smaller hospitals tended to have higher overall rates of troponin-only testing per 100 patients than larger hospitals. Additionally, the hospitals with the highest rates were located in the Midwest region. These hospitals may be learning from and following the high-performing institutions observed in our data that are also located in the Midwest. Additionally, among the hospitals that significantly increased their rate of troponin-only testing, we see that the Choosing Wisely® recommendation appeared to facilitate accelerated adoption of troponin-only testing. In these institutions, it is likely that the impact of Choosing Wisely® was significant because there was attention to high-value care and already an existing movement underway to institute such high-value practices. For example, natural champions, leadership, infrastructure, and a supportive culture may all be prerequisites for Choosing Wisely® recommendations to become institutionally adopted.
Lastly, in the hospitals that have continued to order myoglobin and CK-MB, future work is needed to understand and overcome barriers to adopting high-value care practices.
There are several limitations to this study. First, because this was an observational study, we cannot prove a causal relationship between the Choosing Wisely® recommendation and the increased rates of troponin-only testing. Additionally, the Vizient CDB/RM contains reporting data for a limited number of academic medical centers only, and therefore, these results may not represent practices at nonacademic or even other academic medical centers. Our study only included patients with a principal discharge diagnosis of AMI because the Choosing Wisely® recommendation to order troponin-only is specific for diagnosing patients with AMI. However, it is possible that the Choosing Wisely® recommendation also has affected provider ordering in patients with diagnoses such as chest pain or angina, and these affects would not be captured in our study. Lastly, because instituting high-value care practices take time, our follow-up time may not have been long enough to capture improvement in troponin-only testing at institutions responding to and attempting to adhere to the Choosing Wisely® recommendation to order troponin-only testing for patients with AMI.
Disclosure
No other individuals besides the authors contributed to this work. This project was not funded or supported by any external grant or agency. Dr. Prochaska’s institute received funding from the Agency for Research Healthcare and Quality for a K12 Career Development Grant (AHRQ K12 HS023007) outside the submitted work. Dr. Hohmann and Dr Modes have nothing to disclose. Dr. Arora receives financial compensation as a member of the Board of Directors for the American Board of Internal Medicine and has received grant funding from the ABIM Foundation. She also receives royalties from McGraw Hill.
References
1. Pickering JW, Than MP, Cullen L, et al. Rapid rule-out of acute myocardial infarction with a single high-sensitivity cardiac troponin t measurement below the limit of detection: A collaborative meta-analysis. Ann Intern Med. 2017;166(10):715-724. PubMed 2. American Society for Clinical Pathology. Don’t test for myoglobin or CK-MB in the diagnosis of acute myocardial infarction (AMI). Instead, use troponin I or T. http://www.choosingwisely.org/clinician-lists/american-society-clinical-pathology-myoglobin-to-diagnose-acute-myocardial-infarction/. Accessed August 3, 2016. 3. Amsterdam EA, Wenger NK, Brindis RG, et al. 2014 AHA/ACC guideline for the management of patients with non–st-elevation acute coronary syndromes. Circulation. 2014;130(25):e344-e426. PubMed 4. Larochelle MR, Knight AM, Pantle H, Riedel S, Trost JC. Reducing excess cardiac biomarker testing at an academic medical center. J Gen Intern Med. 2014;29(11):1468-1474. PubMed 5. Le RD, Kosowsky JM, Landman AB, Bixho I, Melanson SEF, Tanasijevic MJ. Clinical and financial impact of removing creatine kinase-MB from the routine testing menu in the emergency setting. Am J Emerg Med. 2015;33(1):72-75. PubMed 6. Rosenberg A, Agiro A, Gottlieb M, et al. Early trends among seven recommendations from the choosing wisely campaign. JAMA Intern Med. 2015;175(12):1913. PubMed 7. Wolfson DB. Choosing Wisely recommendations using administrative claims data. JAMA Intern Med. 2016;176(4):565-565. PubMed 8. Thygesen K, Alpert JS, Jaffe AS, Simoons ML, Chaitman BR, White HD. Third universal definition of myocardial infarction. Circulation. 2012;126(16):2020-2035. PubMed 9. US News & World Report. Best hospitals for cardiology & heart surgery. http://health.usnews.com/best-hospitals/rankings/cardiology-and-heart-surgery. Accessed April 19, 2017. 10. Bradley EH, Curry LA, Ramanadhan S, Rowe L, Nembhard IM, Krumholz HM. Research in action: using positive deviance to improve quality of health care. Implement Sci IS. 2009;4:25. PubMed
Issue
Journal of Hospital Medicine 12(12)
Issue
Journal of Hospital Medicine 12(12)
Page Number
957-962. Published online first September 20, 2017
Page Number
957-962. Published online first September 20, 2017
Micah T. Prochaska, MD, MS, University of Chicago, 5841 S. Maryland Avenue, MC 5000. Chicago, IL 60637; Telephone: 773-702-6988; Fax: 773-795-7398; E-mail: mprochas@medicine.bsd.uchicago.edu
Given the frequency, potential preventability, and costs associated with hospital readmissions, reducing readmissions is a priority in efforts to improve the quality and value of healthcare.1,2 State and national bodies have created diverse initiatives to facilitate improvements in hospital discharge practices and reduce 30-day readmission rates across payers.3-5 For example, the Agency for Healthcare Research and Quality (AHRQ) and the Institute for Healthcare Improvement have published tools for improving discharge practices.6,7 Medicare instituted financial penalties for hospitals with higher-than-expected readmission rates for acute myocardial infarction (AMI), heart failure (HF), and pneumonia in 2012, while private payers and Medicaid programs have established their own policies.8-13 Furthermore, private payers and Medicaid programs shifted toward capitated and value-based reimbursement models in which readmissions lead to financial losses for hospitals.14,15 Accordingly, hospitals have implemented diverse interventions to reduce readmissions.16,17 From 2009 to 2013, 30-day readmissions declined among privately insured adults (from 12.4% to 11.7%), Medicare patients (from 22.0% to 20.0%), and uninsured individuals (11.5% to 11.0%) but climbed among patients with Medicaid (from 19.8% to 20.5%) after index admissions for AMI, HF, pneumonia, or chronic obstructive pulmonary disease.18
To date, research, policies, and quality improvement interventions have largely focused on improvements to one aspect of the system of care—that provided in the inpatient setting—among older adults with Medicare. Yet, inpatient readmissions may underestimate how often patients return to the hospital because patients can be placed under observation or stabilized and discharged from the emergency department (ED) instead of being readmitted. Observation and ED visits are less costly to payers than inpatient admissions.19 Thus, information about utilization of inpatient, observation, and ED visits within 30 days of hospital discharge may be more informative than inpatient readmissions alone. However, little is known about trends in returns to the hospital for observation and ED visits and whether such trends vary by payer.
Our objective was to assess whether changes have occurred in rates of total 30-day, all-cause, unplanned returns to the hospital among adults with index admissions for AMI, HF, and pneumonia in which returns to the hospital included inpatient readmissions, observation visits, and ED visits. We also assessed whether changes in the rate of hospital inpatient readmissions coincided with changes in rates of returns for ED or observation visits. To examine the effects of readmission policies implemented by diverse payers and broad changes to the health system following the Affordable Care Act, we compared data from 201 hospitals in 4 states in 2009 and 2010 with data from the same hospitals for 2013 and 2014.
METHODS
Data Sources, Populations, and Study Variables
We used Healthcare Cost and Utilization Project (HCUP) State Inpatient Databases, State Emergency Department Databases, and State Ambulatory Surgery and Services Databases from Georgia, Nebraska, SouthCarolina, and Tennessee. These states comprise 7% of the US population and were the only states with data that included all observation and ED visits as well as encrypted patient identification numbers that permitted linkage across facilities and hospitals.20
Index admissions for patients aged 18 years and older were eligible if they occurred at nonfederal general medical/surgical hospitals (excluding critical access hospitals) that had at least 1 index admission per target condition per year and at least 5 inpatient, observation, and ED visits for any condition per year.
We classified patients into the following 4 populations by age and insurance coverage: 18 to 64 years with private insurance, 65 years and older with Medicare (excluding younger adults with Medicare), 18 to 64 years with Medicaid, and 18 to 64 years without insurance. We identified patients aged 65 years and older with Medicare by using the primary or secondary expected payer for the index admission. This group included patients who were dually eligible for Medicare and Medicaid. If Medicare was not the primary or secondary payer, we used the primary payer to identify Medicaid, privately insured, and uninsured patients aged 18 to 64 years. None of the states expanded Medicaid coverage during the years studied.
The primary outcome of interest was the rate of having 1 or more all-cause, unplanned return(s) to an acute care hospital within 30 days of discharge after an index admission for AMI, HF, and pneumonia as defined by a modified version of Centers for Medicare & Medicaid Services’ readmission metrics.21,22 We examined total return rates as well as rates for inpatient, observation, and ED care. We also examined the leading diagnoses associated with returns to the hospital. For each index admission, we included only 1 return visit, giving priority to inpatient readmissions, then observation visits, and then ED visits.
The HCUP databases are consistent with the definition of limited data sets under the Health Insurance Portability and Accountability Act Privacy Rule and contain no direct patient identifiers. The AHRQ Institutional Review Board considers research using HCUP data to have exempt status.
Statistical Analysis
To compare rates at which patients returned to the hospital during 2 cohort periods (2009 and 2010 vs 2013 and 2014), we used coarsened exact matching, a well-established matching technique for balancing covariates between 2 populations of patients that may be related to the outcome.23 For observational datasets, coarsened exact matching is preferable to traditional matching because it enables the investigator to assess balance between the 2 populations, select the desired degree of balance, and eliminate observations for which comparable matches cannot be found.
We assembled sets of index admissions in each study period that were similar with respect to payer, primary diagnosis, and other factors. Matching variables included the patient’s age group, sex, and Elixhauser Comorbidity Index24 (in deciles), as well as the hospital’s ratio of observation visits relative to inpatient admissions in 2009 and 2010 combined (in quartiles; see supplementary Appendix). For Medicare beneficiaries, we also matched on dual enrollment in Medicaid.
We conducted the matching process separately for each target condition and payer population. First, we grouped index admissions in both periods into strata defined by all possible combinations of the matching variables and allowing one-to-many random matching within strata. We then dropped records in any strata for which there were no records in 1 of the time periods. Finally, we calculated weights based on the size of each stratum. We used these weights to account for the different numbers of index admissions in each stratum between the 2 study periods. For example, if a stratum contained 10 index admissions in 2009 and 2010 combined and 20 in 2013 and 2014 combined, an admission weighed double in the earlier period. After weighting, the index admissions in each period (2009 and 2010; 2013 and 2014) had similar characteristics (Table 1).
After matching and weighting, we compared the percentage of index admissions for which patients returned to the hospital and the primary diagnoses at the return visit between the 2 study periods using 2-sided χ2 tests (P < 0.05). Analyses were conducted by using SAS software (version 9.4; SAS Institute Inc., Cary, NC).
RESULTS
There were 423,503 eligible index admissions for AMI, HF, and pneumonia in the 2 periods combined; 422,840 (99.8%) were successfully matched and included in this analysis. After matching weights were applied, there were few statistically significant differences across the 2 time periods (see Table 1 and supplementary Appendix).
From 2009 and 2010 to 2013 and 2014, the percentage of patients hospitalized for AMI, HF, and pneumonia who had only observation or ED visits when they returned to the hospital increased from 41.4% to 46.7% among patients with private insurance (P < 0.001), from 27.8% to 32.1% among older patients with Medicare (P < 0.001), from 39.5% to 41.8% among patients with Medicaid (P = 0.03), and from 49.2% to 52.8% among patients without insurance (P = 0.004; Table 1). The percentage of returns to the hospital for observation increased across all payers (P < 0.001); in 2013 and 2014 combined, observation visits ranged from 6.8% of hospital returns among patients with Medicare to 11.1% among patients with private insurance. The percentage of returns to the hospital for an ED visit increased among patients with private insurance (P = 0.02) and Medicare (P < 0.001); in 2013 and 2014, ED visits ranged from 25.3% of returns to the hospital among patients with Medicare to 42.9% among uninsured patients.
The increases in 30-day observation and ED visits coincided with reductions in inpatient readmissions among patients with private insurance and Medicare and contributed to growth in total returns to the hospital among patients with Medicaid or no insurance (Figure 1).
Among privately insured individuals, a decline in inpatient readmissions (from 8.9% to 8.2%; P = 0.001) coincided with increases in observation visits (from 1.2% to 1.7%; P < 0.001) and ED visits (from 5.1% to 5.5%; P = 0.02), leading to a stable rate of approximately 15% at which patients with AMI, HF, or pneumonia returned to the hospital during both periods (P = 0.45). Among Medicare patients, inpatient readmissions declined from 18.3% to 16.9% (P < 0.001), while observation visits and ED visits increased (from 1.2% to 1.7% and 5.8% to 6.3%, respectively; P < 0.001), leading to a small net decrease in total returns to the hospital (25.3% vs 25.0%; P = 0.04). Among Medicaid recipients, inpatient readmissions were unchanged (18.7%; P = 0.93), but an increase in observation visits (from 2.0% to 2.7%; P < 0.001) and a nonsignificant increase in ED visits (from 10.3% to 10.7%; P = 0.26) led to a rise in total revisits (31.0% vs 32.1%; P = 0.04). Among uninsured adults, inpatient readmissions were stable (around 9.5%; P = 0.76), while there was a rise in observation visits (1.3% vs 2.0%; P < 0.001) and ED visits (8.0% vs 8.6%; P = 0.04), yielding an increase in total revisits (18.8% vs 20.1%; P = 0.004).
Figure 2
shows individual differences for each of the 3 target conditions between 2009 and 2010 versus 2013 and 2014 by payer. Overall, rates at which patients returned to the hospital within 30 days remained stable, with 3 exceptions. For patients with private insurance, total returns to the hospital rose for pneumonia (14.8% vs 15.9%; P = 0.02). For seniors with Medicare, total returns to the hospital declined for pneumonia (from 24.1% to 23.5%; P = 0.03). Among the uninsured, total returns to the hospital rose for AMI (15.5% vs 17.2%; P = 0.02).
Patients initially hospitalized for HF and pneumonia who returned to the hospital within 30 days often returned for the same conditions (Table 2).
Reasons for returning to the hospital were similar in the 2 periods (2009 and 2010; 2013 and 2014) across the 3 target conditions. However, when patients returned to the hospital in 2013 and 2014 with the same diagnosis as the index admission, they were less likely to be readmitted and more likely to be placed under observation than in 2009 and 2010.
DISCUSSION
Matching index admissions for AMI, HF, or pneumonia in 201 hospitals in 2009 and 2010 with those in 2013 and 2014, we observed that increases in observation and ED visits coincided with reductions in inpatient readmissions among patients with private insurance and Medicare and contributed to growth in total returns to the hospital among patients with Medicaid or no insurance. Among patients with private insurance and Medicare, inpatient readmissions declined significantly for all 3 target conditions, but total returns to the hospital remained constant for AMI and HF, rose for privately insured patients with pneumonia, and declined modestly for Medicare patients with pneumonia. Inpatient readmissions were unchanged for adults aged 18 to 64 years with Medicaid or no insurance, but total returns to the hospital increased significantly, reaching 32% among those with Medicaid.
These findings add to recent literature, which has primarily emphasized inpatient readmissions among Medicare beneficiaries with several exceptions. A prior analysis indicates that readmissions have declined among diverse payer populations nationally.18 Gerhardt et al25 found that from 2011 to 2012, all-cause 30-day readmissions declined among fee-for-service (FFS) Medicare beneficiaries following any index admission, while ED revisits remained stable and observation revisits increased slightly. Evaluating the CMS Hospital Readmission Reductions Program (HRRP), Zuckerman et al17 reported that from 2007 to 2015, inpatient readmissions declined among FFS Medicare beneficiaries aged 65 years and older who were hospitalized with AMI, HF, or pneumonia, while returns to the hospital for observation rose approximately 2%; ED visits were not included. We found that Medicare (FFS and Medicare Advantage) patients with AMI and HF returned to the hospital with the same frequency in 2009 and 2010 as in 2013 and 2014, and those patients with pneumonia returned slightly less often. In aggregate, declines in inpatient readmissions in the 4 states we studied coincided with increases in observation and ED care. Moreover, these shifts occurred not only among Medicare beneficiaries but also among privately insured adults, Medicaid recipients, and the uninsured.
Three factors may have contributed to these apparent shifts from readmissions to observation and ED visits. First, some authors have suggested that hospitals may reduce readmissions by intentionally placing some of the patients who return to the hospital under observation instead of admitting them.17,26 If true, hospitals with greater declines in readmissions would have larger increases in observation revisits. Zuckerman et al17 found no correlation among Medicare beneficiaries between hospital-level trends in observation revisits and readmissions, but returns to observation rose more rapidly for AMI, HF, and pneumonia (compared with other conditions) during long term follow-up than during the HRRP implementation period. Other authors have documented that declines in readmissions have been greatest at hospitals with the highest baseline readmission rates,27,28 and hospitals with lower readmission rates have more observation return visits.29
Second, shifts from inpatient readmissions to return visits for observation may reflect unintentional rather than intentional changes in the services provided. Clinical practice patterns are evolving such that patients who present to the hospital for acute care increasingly are placed under observation or discharged from the ED instead of being admitted, regardless of whether they recently were hospitalized.30 Inpatient admissions, which are strongly correlated with readmission rates,28,31 are declining nationally,32 and both observation and ED visits are rising.33-35 Although little is known about effects on health outcomes and patient out-of-pocket costs,shifts from inpatient admissions to observation and ED visits reduce costs to payers.36,37
Third, instead of substitution, more patients may be returning for lower-acuity conditions that can be treated in the ED or under observation. Hospitals are implementing diverse and multifaceted interventions to reduce readmissions that can involve assessing patient needs and the risk for readmission, educating patients about self-care and risks after discharge, reconciling medication, scheduling follow-up visits, and monitoring patients through telephone calls and home nursing visits.26,38,39 Although the intent may be to reduce patients’ need to return to the hospital, interventions that educate patients about risks after discharge may lower the threshold at which they find symptoms worrisome enough to return. This could increase lower-acuity return visits. We found that reasons for returning were similar in 2009 and 2010 versus 2013 and 2014, but we did not examine acuity of illness at the time of return.
Other areas of concern are the high rates at which Medicaid patients are returning to the hospital and the increases in rates of returns among Medicaid patients and the uninsured. Individuals in these disadvantaged populations may be having difficulty accessing ambulatory care or may be turning to the ED more often for lower acuity problems that arise after discharge. In 3 of the 4 states we studied, 15% to 16% of adults live in poverty and 10% to 30% live in primary care health professional shortage areas.40,41 Given the implications for patient outcomes and costs, trends among these populations warrant further scrutiny.42,43
This analysis has several limitations.Data were from 4 states, but trends in readmissions are similar nationally. From 2010 through 2015, the all-condition readmission rate declined by 8% among Medicare beneficiaries nationally and by 6.1% in SouthCarolina, 7.4% in Georgia, 8.3% in Nebraska, and 8.7% in Tennessee.44 We report trends across hospitals and did not examine hospital-level revisits. Therefore, further research is needed to determine whether these findings are related to co-occurring trends, intentional substitution, or other factors.
In conclusion, measuring inpatient readmissions without accounting for return visits to the ED and observation underestimates the rate at which patients return to the hospital following an inpatient hospitalization. Because of growth in observation and ED visits, trends in the total rates at which patients return to the hospital can differ from trends in inpatient readmissions. In the 4 states we studied, total return rates were particularly high and rising among patients with Medicaid and lower, but also rising, among the uninsured. Policy analysts and researchers should investigate the factors contributing to growth in readmissions in these vulnerable populations and determine whether similar trends are occurring nationwide. Hospitalists play critical roles in admitting and discharging inpatients, caring for patients under observation, and implementing quality improvement programs. Irrespective of payer, hospitalists’ efforts to improve the quality and value of care should include observation and ED visits as well as inpatient readmissions.
Acknowledgments
The authors gratefully acknowledge Minya Sheng, M.S. (Truven Health Analytics) for assistance in programming and data management and Linda Lee, Ph.D. (Truven Health Analytics) for providing editorial review of the manuscript. We also wish to acknowledge the 4 HCUP Partner organizations that contributed to the HCUP State Databases used in this study: Georgia Hospital Association, Nebraska Hospital Association, South Carolina Revenue and Fiscal Affairs Office, and Tennessee Hospital Association.
Disclosure
Funding for this study was provided by the AHRQ Center for Delivery, Organization, and Markets, HCUP (Contract No. HHSA-290-2013-00002-C). The views expressed in this article are those of the authors and do not necessarily reflect those of the AHRQ or the U.S. Department of Health and Human Services. The authors have no conflicts of interest or financial disclosures to declare.
1. Jencks SF, Williams MV, Coleman EA. Rehospitalizations among patients in the Medicare fee-for-service program. N Engl J Med. 2009;360(14):1418-1428. PubMed 2. Lum HD, Studenski SA, Degenholtz HB, Hardy SE. Early hospital readmission is a predictor of one-year mortality in community-dwelling older Medicare beneficiaries. J Gen Intern Med. 2012;27(11):1467-1474. PubMed 3. Peach State Health Plan. New Peach State Health Plan 30-Day Readmission Payment Policy. https://www.pshpgeorgia.com/newsroom/30-day-readmission-payment-policy.html . Accessed September 26, 2017. 4. Axon RN, Cole L, Moonan A, et al. Evolution and Initial Experience of a Statewide Care Transitions Quality Improvement Collaborative: Preventing Avoidable Readmissions Together. Popul Health Manag. 2016 Feb;19(1):4-10. PubMed 5. Nebraska Hospital Association. Quality and Safety. http://www.nebraskahospitals.org/quality_and_safety/qs_home.html. Accessed July 25, 2017. 6. Agency for Healthcare Research and Quality. Re-Engineered Discharge (RED) Toolkit. http://www.ahrq.gov/professionals/systems/hospital/red/toolkit/index.html. Accessed July 25, 2017. 7. Institute for Healthcare Improvement. Readmissions. http://www.ihi.org/Topics/Readmissions/Pages/default.aspx. Accessed July 25, 2017. 8. Centers for Medicare & Medicaid Services (CMS). Readmissions Reduction Program (HRRP). https://www.cms.gov/medicare/medicare-fee-for-service-payment/acuteinpatientpps/readmissions-reduction-program.html. Accessed July 19, 2016. 9. Polinski JM, Moore JM, Kyrychenko P, et al. An insurer’s care transition program emphasizes medication reconciliation, reduces readmissions and costs. Health Aff (Millwood). 2016;35(7):1222-1229. PubMed 10. BlueCross BlueShield. Highmark’s Quality Blue Program helps hospitals reduce readmissions and infections for members. http://www.bcbs.com/healthcare-news/plans/highmark-quality-blue-program-helps-hospitals-reduce-readmissions-and-infections-for-members.html. Accessed November 7, 2016. 11. Agency for Healthcare Research and Quality (AHRQ). Designing and delivering whole-person transitional care: the hospital guide to reducing Medicaid readmissions. Rockville, MD: AHRQ; September 2016. AHRQ Pub. No. 16-0047-EF. http://www.ahrq.gov/sites/default/files/wysiwyg/professionals/systems/hospital/medicaidreadmitguide/medicaidreadmissions.pdf. Accessed March 15, 2017. 12. Aetna. Aetna, Genesis HealthCare take aim at preventing hospital readmissions. https://news.aetna.com/news-releases/aetna-genesis-healthcare-take-aim-at-preventing-hospital-readmissions/. Accessed November 7, 2016. 13. Molina Healthcare. Medical Management Program.http://www.molinahealthcare.com/providers/wi/medicaid/manual/PDF/manual_WI_19_Medical_Management.pdf. Accessed March 15, 2017. 14. Kaiser Family Foundation. Total Medicaid MCOs. State health facts, 2016. http://kff.org/other/state-indicator/total-medicaid-mcos/. Accessed July 19, 2016. 15. Muhlestein D, McClellan M. Accountable care organizations in 2016: private and public-sector growth and dispersion. Health Affairs blog. April 21, 2016. http://healthaffairs.org/blog/2016/04/21/accountable-care-organizations-in-2016-private-and-public-sector-growth-and-dispersion/. Accessed November 7, 2016. 16. Leppin AL, Gionfriddo MR, Kessler M, et al. Preventing 30-day hospital readmissions: a systematic review and meta-analysis of randomized trials. JAMA Intern Med. 2014;174(7):1095-1107. PubMed 17. Zuckerman RB, Sheingold SH, Orav EJ, Ruhter J, Epstein AM. Readmissions, observation, and the Hospital Readmissions Reduction Program. N Engl J Med. 2016;374(16):1543-1551. PubMed 18. Fingar KR, Washington R. Trends in hospital readmissions for four high-volume conditions, 2009–2013. Rockville, MD: Agency for Healthcare Research and Quality; November 2015. Statistical Brief No. 196. https://www.hcup-us.ahrq.gov/reports/statbriefs/sb196-Readmissions-Trends-High-Volume-Conditions.pdf. Accessed March 15, 2017. 19. Ross MA, Hockenberry JM, Mutter R, Barrett M, Wheatley M, Pitts SR. Protocol-driven emergency department observation units offer savings, shorter stays, and reduced admissions. Health Aff (Millwood). 2013;32(12):2149-2156. PubMed 20. Healthcare Cost and Utilization Project (HCUP). HCUP Databases. Rockville, MD: Agency for Healthcare Research and Quality; November 2016. www.hcup-us.ahrq.gov/databases.jsp. Accessed March 15, 2017. 21. QualityNet. Archived resources: readmission measures and measure methodology. https://www.qualitynet.org/dcs/ContentServer?cid=1228774371008&pagename=QnetPublic%2FPage%2FQnetTier4&c=Page. Accessed November 7, 2016. 22. Centers for Medicare & Medicaid Services. 2014 measures updates and specifications report: hospital-level 30-day risk-standardized readmission measures: acute myocardial infarction, heart failure, pneumonia, chronic obstructive pulmonary disease, stroke. March 2014. https://www.cms.gov/Medicare/Quality-Initiatives-Patient-Assessment-Instruments/HospitalQualityInits/Measure-Methodology.html. Accessed September 26, 2017. 23. Iacus SM, King G, Porro G. Causal inference without balance checking: coarsened exact matching. Political Analysis. 2012;20(1):1-24. 24. Moore BJ, White S, Washington R, Coenen N, Elixhauser A. Identifying increased risk of readmission and in-hospital mortality using hospital administrative data: The AHRQ Elixhauser Comorbidity Index. Med Care. 2017;55(7):698-705. PubMed 25. Gerhardt G, Yemane A, Apostle K, Oelschlaeger A, Rollins E, Brennan N. Evaluating whether changes in utilization of hospital outpatient services contributed to lower Medicare readmission rate. Medicare Medicaid Res Rev. 2014;4(1):mmrr2014.004.01.b03. PubMed 26. Kripalani S, Theobald CN, Anctil B, Vasilevskis EE. Reducing hospital readmission rates: current strategies and future directions. Annu Rev Med. 2014;65:471-485. PubMed 27. Desai NR, Ross JS, Kwon JY, et al. Association between hospital penalty status under the hospital readmission reduction program and readmission rates for target and nontarget conditions. JAMA. 2016;316(24):2647-2656. PubMed 28. Epstein AM, Jha AK, Orav EJ. The relationship between hospital admission rates and rehospitalizations. N Engl J Med. 2011;365(24):2287-2295. PubMed 29. Venkatesh AK, Wang C, Ross JS, et al. Hospital use of observation stays: cross sectional study of the impact on readmission rates. Med Care. 2016;54(12)1070-1077. PubMed 30. Nuckols TK, Fingar KR, Barrett M, Steiner CA, Stocks C, Owens PL. The shifting landscape in utilization of inpatient, observation, and emergency department Services Across Payers. J Hosp Med. 2017;12(6):443-446. PubMed 31. Dharmarajan K, Qin L, Lin Z, et al. Declining admission rates and thirty-day readmission rates positively associated even though patients grew sicker over time. Health Aff (Millwood). 2016;35(7):1294-1302. PubMed 32. Grube M, Kaufman K, York R. Decline in utilization rates signals a change in the inpatient business model. Health Affairs blog. March 8, 2013. http://healthaffairs.org/blog/2013/03/08/decline-in-utilization-rates-signals-a-change-in-the-inpatient-business-model/. Accessed November 7, 2016. 33. Feng Z, Wright B, Mor V. Sharp rise in Medicare enrollees being held in hospitals for observation raises concerns about causes and consequences. Health Aff (Millwood). 2012;31(6):1251-1259. PubMed 34. Venkatesh AK, Geisler BP, Gibson Chambers JJ, et al. Use of observation care in US emergency departments, 2001 to 2008. PLoS One. 2011;6(9):e24326. PubMed 35. Schuur JD, Venkatesh AK. The growing role of emergency departments in hospital admissions. N Engl J Med. 2012;367(5):391-393. PubMed 36. Kangovi S, Cafardi SG, Smith RA, Kulkarni R, Grande D. Patient financial responsibility for observation care. J Hosp Med. 2015;10(11):718-723. PubMed 37. Doyle BJ, Ettner SL, Nuckols TK. Supplemental insurance reduces out-of-pocket costs in Medicare observation services. J Hosp Med. 2016;11(7):502-504. doi:10.1002/jhm.2588. PubMed 38. Hansen LO, Young RS, Hinami K, Leung A, Williams MV. Interventions to reduce 30-day rehospitalization: a systematic review. Ann Intern Med. 2011;155(8):520-528. PubMed 39. Bradley EH, Curry L, Horwitz LI, et al. Hospital strategies associated with 30-day readmission rates for patients with heart failure. Circ Cardiovasc Qual Outcomes. 2013;6(4):444-450. PubMed 40. US Census Bureau. American Fact Finder: community facts. http://factfinder.census.gov/faces/nav/jsf/pages/index.xhtml. Accessed November 1, 2016. 41. Van Vleet A, Paradise J. Tapping nurse practitioners to meet rising demand for primary care. Kaiser Family Foundation Issue Brief. January 20, 2015. http://kff.org/medicaid/issue-brief/tapping-nurse-practitioners-to-meet-rising-demand-for-primary-care/. Accessed November 7, 2016. 42. Agency for Healthcare Research and Quality (AHRQ). Hospital guide to reducing Medicaid readmissions. Rockville, MD: AHRQ; August 2014. AHRQ Publication No. 14-0050-EF. http://www.ahrq.gov/sites/default/files/publications/files/medreadmissions.pdf. Accessed March 15, 2017. 43. Boccuti C, Casillas G. Aiming for fewer hospital U-turns: The Medicare Hospital Readmissions Reduction Program. Kaiser Family Foundation Issue Brief. March 10, 2017. http://kff.org/medicare/issue-brief/aiming-for-fewer-hospital-u-turns-the-medicare-hospital-readmission-reduction-program/. Accessed November 7, 2016. 44. Conway P, Gronniger T. New data: 49 states plus DC reduce avoidable hospital readmissions. Centers for Medicare & Medicaid Services blog. September 13, 2016. http://medtecheng.com/new-data-49-states-plus-dc-reduce-avoidable-hospital-readmissions/. Accessed September 26, 2017.
Given the frequency, potential preventability, and costs associated with hospital readmissions, reducing readmissions is a priority in efforts to improve the quality and value of healthcare.1,2 State and national bodies have created diverse initiatives to facilitate improvements in hospital discharge practices and reduce 30-day readmission rates across payers.3-5 For example, the Agency for Healthcare Research and Quality (AHRQ) and the Institute for Healthcare Improvement have published tools for improving discharge practices.6,7 Medicare instituted financial penalties for hospitals with higher-than-expected readmission rates for acute myocardial infarction (AMI), heart failure (HF), and pneumonia in 2012, while private payers and Medicaid programs have established their own policies.8-13 Furthermore, private payers and Medicaid programs shifted toward capitated and value-based reimbursement models in which readmissions lead to financial losses for hospitals.14,15 Accordingly, hospitals have implemented diverse interventions to reduce readmissions.16,17 From 2009 to 2013, 30-day readmissions declined among privately insured adults (from 12.4% to 11.7%), Medicare patients (from 22.0% to 20.0%), and uninsured individuals (11.5% to 11.0%) but climbed among patients with Medicaid (from 19.8% to 20.5%) after index admissions for AMI, HF, pneumonia, or chronic obstructive pulmonary disease.18
To date, research, policies, and quality improvement interventions have largely focused on improvements to one aspect of the system of care—that provided in the inpatient setting—among older adults with Medicare. Yet, inpatient readmissions may underestimate how often patients return to the hospital because patients can be placed under observation or stabilized and discharged from the emergency department (ED) instead of being readmitted. Observation and ED visits are less costly to payers than inpatient admissions.19 Thus, information about utilization of inpatient, observation, and ED visits within 30 days of hospital discharge may be more informative than inpatient readmissions alone. However, little is known about trends in returns to the hospital for observation and ED visits and whether such trends vary by payer.
Our objective was to assess whether changes have occurred in rates of total 30-day, all-cause, unplanned returns to the hospital among adults with index admissions for AMI, HF, and pneumonia in which returns to the hospital included inpatient readmissions, observation visits, and ED visits. We also assessed whether changes in the rate of hospital inpatient readmissions coincided with changes in rates of returns for ED or observation visits. To examine the effects of readmission policies implemented by diverse payers and broad changes to the health system following the Affordable Care Act, we compared data from 201 hospitals in 4 states in 2009 and 2010 with data from the same hospitals for 2013 and 2014.
METHODS
Data Sources, Populations, and Study Variables
We used Healthcare Cost and Utilization Project (HCUP) State Inpatient Databases, State Emergency Department Databases, and State Ambulatory Surgery and Services Databases from Georgia, Nebraska, SouthCarolina, and Tennessee. These states comprise 7% of the US population and were the only states with data that included all observation and ED visits as well as encrypted patient identification numbers that permitted linkage across facilities and hospitals.20
Index admissions for patients aged 18 years and older were eligible if they occurred at nonfederal general medical/surgical hospitals (excluding critical access hospitals) that had at least 1 index admission per target condition per year and at least 5 inpatient, observation, and ED visits for any condition per year.
We classified patients into the following 4 populations by age and insurance coverage: 18 to 64 years with private insurance, 65 years and older with Medicare (excluding younger adults with Medicare), 18 to 64 years with Medicaid, and 18 to 64 years without insurance. We identified patients aged 65 years and older with Medicare by using the primary or secondary expected payer for the index admission. This group included patients who were dually eligible for Medicare and Medicaid. If Medicare was not the primary or secondary payer, we used the primary payer to identify Medicaid, privately insured, and uninsured patients aged 18 to 64 years. None of the states expanded Medicaid coverage during the years studied.
The primary outcome of interest was the rate of having 1 or more all-cause, unplanned return(s) to an acute care hospital within 30 days of discharge after an index admission for AMI, HF, and pneumonia as defined by a modified version of Centers for Medicare & Medicaid Services’ readmission metrics.21,22 We examined total return rates as well as rates for inpatient, observation, and ED care. We also examined the leading diagnoses associated with returns to the hospital. For each index admission, we included only 1 return visit, giving priority to inpatient readmissions, then observation visits, and then ED visits.
The HCUP databases are consistent with the definition of limited data sets under the Health Insurance Portability and Accountability Act Privacy Rule and contain no direct patient identifiers. The AHRQ Institutional Review Board considers research using HCUP data to have exempt status.
Statistical Analysis
To compare rates at which patients returned to the hospital during 2 cohort periods (2009 and 2010 vs 2013 and 2014), we used coarsened exact matching, a well-established matching technique for balancing covariates between 2 populations of patients that may be related to the outcome.23 For observational datasets, coarsened exact matching is preferable to traditional matching because it enables the investigator to assess balance between the 2 populations, select the desired degree of balance, and eliminate observations for which comparable matches cannot be found.
We assembled sets of index admissions in each study period that were similar with respect to payer, primary diagnosis, and other factors. Matching variables included the patient’s age group, sex, and Elixhauser Comorbidity Index24 (in deciles), as well as the hospital’s ratio of observation visits relative to inpatient admissions in 2009 and 2010 combined (in quartiles; see supplementary Appendix). For Medicare beneficiaries, we also matched on dual enrollment in Medicaid.
We conducted the matching process separately for each target condition and payer population. First, we grouped index admissions in both periods into strata defined by all possible combinations of the matching variables and allowing one-to-many random matching within strata. We then dropped records in any strata for which there were no records in 1 of the time periods. Finally, we calculated weights based on the size of each stratum. We used these weights to account for the different numbers of index admissions in each stratum between the 2 study periods. For example, if a stratum contained 10 index admissions in 2009 and 2010 combined and 20 in 2013 and 2014 combined, an admission weighed double in the earlier period. After weighting, the index admissions in each period (2009 and 2010; 2013 and 2014) had similar characteristics (Table 1).
After matching and weighting, we compared the percentage of index admissions for which patients returned to the hospital and the primary diagnoses at the return visit between the 2 study periods using 2-sided χ2 tests (P < 0.05). Analyses were conducted by using SAS software (version 9.4; SAS Institute Inc., Cary, NC).
RESULTS
There were 423,503 eligible index admissions for AMI, HF, and pneumonia in the 2 periods combined; 422,840 (99.8%) were successfully matched and included in this analysis. After matching weights were applied, there were few statistically significant differences across the 2 time periods (see Table 1 and supplementary Appendix).
From 2009 and 2010 to 2013 and 2014, the percentage of patients hospitalized for AMI, HF, and pneumonia who had only observation or ED visits when they returned to the hospital increased from 41.4% to 46.7% among patients with private insurance (P < 0.001), from 27.8% to 32.1% among older patients with Medicare (P < 0.001), from 39.5% to 41.8% among patients with Medicaid (P = 0.03), and from 49.2% to 52.8% among patients without insurance (P = 0.004; Table 1). The percentage of returns to the hospital for observation increased across all payers (P < 0.001); in 2013 and 2014 combined, observation visits ranged from 6.8% of hospital returns among patients with Medicare to 11.1% among patients with private insurance. The percentage of returns to the hospital for an ED visit increased among patients with private insurance (P = 0.02) and Medicare (P < 0.001); in 2013 and 2014, ED visits ranged from 25.3% of returns to the hospital among patients with Medicare to 42.9% among uninsured patients.
The increases in 30-day observation and ED visits coincided with reductions in inpatient readmissions among patients with private insurance and Medicare and contributed to growth in total returns to the hospital among patients with Medicaid or no insurance (Figure 1).
Among privately insured individuals, a decline in inpatient readmissions (from 8.9% to 8.2%; P = 0.001) coincided with increases in observation visits (from 1.2% to 1.7%; P < 0.001) and ED visits (from 5.1% to 5.5%; P = 0.02), leading to a stable rate of approximately 15% at which patients with AMI, HF, or pneumonia returned to the hospital during both periods (P = 0.45). Among Medicare patients, inpatient readmissions declined from 18.3% to 16.9% (P < 0.001), while observation visits and ED visits increased (from 1.2% to 1.7% and 5.8% to 6.3%, respectively; P < 0.001), leading to a small net decrease in total returns to the hospital (25.3% vs 25.0%; P = 0.04). Among Medicaid recipients, inpatient readmissions were unchanged (18.7%; P = 0.93), but an increase in observation visits (from 2.0% to 2.7%; P < 0.001) and a nonsignificant increase in ED visits (from 10.3% to 10.7%; P = 0.26) led to a rise in total revisits (31.0% vs 32.1%; P = 0.04). Among uninsured adults, inpatient readmissions were stable (around 9.5%; P = 0.76), while there was a rise in observation visits (1.3% vs 2.0%; P < 0.001) and ED visits (8.0% vs 8.6%; P = 0.04), yielding an increase in total revisits (18.8% vs 20.1%; P = 0.004).
Figure 2
shows individual differences for each of the 3 target conditions between 2009 and 2010 versus 2013 and 2014 by payer. Overall, rates at which patients returned to the hospital within 30 days remained stable, with 3 exceptions. For patients with private insurance, total returns to the hospital rose for pneumonia (14.8% vs 15.9%; P = 0.02). For seniors with Medicare, total returns to the hospital declined for pneumonia (from 24.1% to 23.5%; P = 0.03). Among the uninsured, total returns to the hospital rose for AMI (15.5% vs 17.2%; P = 0.02).
Patients initially hospitalized for HF and pneumonia who returned to the hospital within 30 days often returned for the same conditions (Table 2).
Reasons for returning to the hospital were similar in the 2 periods (2009 and 2010; 2013 and 2014) across the 3 target conditions. However, when patients returned to the hospital in 2013 and 2014 with the same diagnosis as the index admission, they were less likely to be readmitted and more likely to be placed under observation than in 2009 and 2010.
DISCUSSION
Matching index admissions for AMI, HF, or pneumonia in 201 hospitals in 2009 and 2010 with those in 2013 and 2014, we observed that increases in observation and ED visits coincided with reductions in inpatient readmissions among patients with private insurance and Medicare and contributed to growth in total returns to the hospital among patients with Medicaid or no insurance. Among patients with private insurance and Medicare, inpatient readmissions declined significantly for all 3 target conditions, but total returns to the hospital remained constant for AMI and HF, rose for privately insured patients with pneumonia, and declined modestly for Medicare patients with pneumonia. Inpatient readmissions were unchanged for adults aged 18 to 64 years with Medicaid or no insurance, but total returns to the hospital increased significantly, reaching 32% among those with Medicaid.
These findings add to recent literature, which has primarily emphasized inpatient readmissions among Medicare beneficiaries with several exceptions. A prior analysis indicates that readmissions have declined among diverse payer populations nationally.18 Gerhardt et al25 found that from 2011 to 2012, all-cause 30-day readmissions declined among fee-for-service (FFS) Medicare beneficiaries following any index admission, while ED revisits remained stable and observation revisits increased slightly. Evaluating the CMS Hospital Readmission Reductions Program (HRRP), Zuckerman et al17 reported that from 2007 to 2015, inpatient readmissions declined among FFS Medicare beneficiaries aged 65 years and older who were hospitalized with AMI, HF, or pneumonia, while returns to the hospital for observation rose approximately 2%; ED visits were not included. We found that Medicare (FFS and Medicare Advantage) patients with AMI and HF returned to the hospital with the same frequency in 2009 and 2010 as in 2013 and 2014, and those patients with pneumonia returned slightly less often. In aggregate, declines in inpatient readmissions in the 4 states we studied coincided with increases in observation and ED care. Moreover, these shifts occurred not only among Medicare beneficiaries but also among privately insured adults, Medicaid recipients, and the uninsured.
Three factors may have contributed to these apparent shifts from readmissions to observation and ED visits. First, some authors have suggested that hospitals may reduce readmissions by intentionally placing some of the patients who return to the hospital under observation instead of admitting them.17,26 If true, hospitals with greater declines in readmissions would have larger increases in observation revisits. Zuckerman et al17 found no correlation among Medicare beneficiaries between hospital-level trends in observation revisits and readmissions, but returns to observation rose more rapidly for AMI, HF, and pneumonia (compared with other conditions) during long term follow-up than during the HRRP implementation period. Other authors have documented that declines in readmissions have been greatest at hospitals with the highest baseline readmission rates,27,28 and hospitals with lower readmission rates have more observation return visits.29
Second, shifts from inpatient readmissions to return visits for observation may reflect unintentional rather than intentional changes in the services provided. Clinical practice patterns are evolving such that patients who present to the hospital for acute care increasingly are placed under observation or discharged from the ED instead of being admitted, regardless of whether they recently were hospitalized.30 Inpatient admissions, which are strongly correlated with readmission rates,28,31 are declining nationally,32 and both observation and ED visits are rising.33-35 Although little is known about effects on health outcomes and patient out-of-pocket costs,shifts from inpatient admissions to observation and ED visits reduce costs to payers.36,37
Third, instead of substitution, more patients may be returning for lower-acuity conditions that can be treated in the ED or under observation. Hospitals are implementing diverse and multifaceted interventions to reduce readmissions that can involve assessing patient needs and the risk for readmission, educating patients about self-care and risks after discharge, reconciling medication, scheduling follow-up visits, and monitoring patients through telephone calls and home nursing visits.26,38,39 Although the intent may be to reduce patients’ need to return to the hospital, interventions that educate patients about risks after discharge may lower the threshold at which they find symptoms worrisome enough to return. This could increase lower-acuity return visits. We found that reasons for returning were similar in 2009 and 2010 versus 2013 and 2014, but we did not examine acuity of illness at the time of return.
Other areas of concern are the high rates at which Medicaid patients are returning to the hospital and the increases in rates of returns among Medicaid patients and the uninsured. Individuals in these disadvantaged populations may be having difficulty accessing ambulatory care or may be turning to the ED more often for lower acuity problems that arise after discharge. In 3 of the 4 states we studied, 15% to 16% of adults live in poverty and 10% to 30% live in primary care health professional shortage areas.40,41 Given the implications for patient outcomes and costs, trends among these populations warrant further scrutiny.42,43
This analysis has several limitations.Data were from 4 states, but trends in readmissions are similar nationally. From 2010 through 2015, the all-condition readmission rate declined by 8% among Medicare beneficiaries nationally and by 6.1% in SouthCarolina, 7.4% in Georgia, 8.3% in Nebraska, and 8.7% in Tennessee.44 We report trends across hospitals and did not examine hospital-level revisits. Therefore, further research is needed to determine whether these findings are related to co-occurring trends, intentional substitution, or other factors.
In conclusion, measuring inpatient readmissions without accounting for return visits to the ED and observation underestimates the rate at which patients return to the hospital following an inpatient hospitalization. Because of growth in observation and ED visits, trends in the total rates at which patients return to the hospital can differ from trends in inpatient readmissions. In the 4 states we studied, total return rates were particularly high and rising among patients with Medicaid and lower, but also rising, among the uninsured. Policy analysts and researchers should investigate the factors contributing to growth in readmissions in these vulnerable populations and determine whether similar trends are occurring nationwide. Hospitalists play critical roles in admitting and discharging inpatients, caring for patients under observation, and implementing quality improvement programs. Irrespective of payer, hospitalists’ efforts to improve the quality and value of care should include observation and ED visits as well as inpatient readmissions.
Acknowledgments
The authors gratefully acknowledge Minya Sheng, M.S. (Truven Health Analytics) for assistance in programming and data management and Linda Lee, Ph.D. (Truven Health Analytics) for providing editorial review of the manuscript. We also wish to acknowledge the 4 HCUP Partner organizations that contributed to the HCUP State Databases used in this study: Georgia Hospital Association, Nebraska Hospital Association, South Carolina Revenue and Fiscal Affairs Office, and Tennessee Hospital Association.
Disclosure
Funding for this study was provided by the AHRQ Center for Delivery, Organization, and Markets, HCUP (Contract No. HHSA-290-2013-00002-C). The views expressed in this article are those of the authors and do not necessarily reflect those of the AHRQ or the U.S. Department of Health and Human Services. The authors have no conflicts of interest or financial disclosures to declare.
References
1. Jencks SF, Williams MV, Coleman EA. Rehospitalizations among patients in the Medicare fee-for-service program. N Engl J Med. 2009;360(14):1418-1428. PubMed 2. Lum HD, Studenski SA, Degenholtz HB, Hardy SE. Early hospital readmission is a predictor of one-year mortality in community-dwelling older Medicare beneficiaries. J Gen Intern Med. 2012;27(11):1467-1474. PubMed 3. Peach State Health Plan. New Peach State Health Plan 30-Day Readmission Payment Policy. https://www.pshpgeorgia.com/newsroom/30-day-readmission-payment-policy.html . Accessed September 26, 2017. 4. Axon RN, Cole L, Moonan A, et al. Evolution and Initial Experience of a Statewide Care Transitions Quality Improvement Collaborative: Preventing Avoidable Readmissions Together. Popul Health Manag. 2016 Feb;19(1):4-10. PubMed 5. Nebraska Hospital Association. Quality and Safety. http://www.nebraskahospitals.org/quality_and_safety/qs_home.html. Accessed July 25, 2017. 6. Agency for Healthcare Research and Quality. Re-Engineered Discharge (RED) Toolkit. http://www.ahrq.gov/professionals/systems/hospital/red/toolkit/index.html. Accessed July 25, 2017. 7. Institute for Healthcare Improvement. Readmissions. http://www.ihi.org/Topics/Readmissions/Pages/default.aspx. Accessed July 25, 2017. 8. Centers for Medicare & Medicaid Services (CMS). Readmissions Reduction Program (HRRP). https://www.cms.gov/medicare/medicare-fee-for-service-payment/acuteinpatientpps/readmissions-reduction-program.html. Accessed July 19, 2016. 9. Polinski JM, Moore JM, Kyrychenko P, et al. An insurer’s care transition program emphasizes medication reconciliation, reduces readmissions and costs. Health Aff (Millwood). 2016;35(7):1222-1229. PubMed 10. BlueCross BlueShield. Highmark’s Quality Blue Program helps hospitals reduce readmissions and infections for members. http://www.bcbs.com/healthcare-news/plans/highmark-quality-blue-program-helps-hospitals-reduce-readmissions-and-infections-for-members.html. Accessed November 7, 2016. 11. Agency for Healthcare Research and Quality (AHRQ). Designing and delivering whole-person transitional care: the hospital guide to reducing Medicaid readmissions. Rockville, MD: AHRQ; September 2016. AHRQ Pub. No. 16-0047-EF. http://www.ahrq.gov/sites/default/files/wysiwyg/professionals/systems/hospital/medicaidreadmitguide/medicaidreadmissions.pdf. Accessed March 15, 2017. 12. Aetna. Aetna, Genesis HealthCare take aim at preventing hospital readmissions. https://news.aetna.com/news-releases/aetna-genesis-healthcare-take-aim-at-preventing-hospital-readmissions/. Accessed November 7, 2016. 13. Molina Healthcare. Medical Management Program.http://www.molinahealthcare.com/providers/wi/medicaid/manual/PDF/manual_WI_19_Medical_Management.pdf. Accessed March 15, 2017. 14. Kaiser Family Foundation. Total Medicaid MCOs. State health facts, 2016. http://kff.org/other/state-indicator/total-medicaid-mcos/. Accessed July 19, 2016. 15. Muhlestein D, McClellan M. Accountable care organizations in 2016: private and public-sector growth and dispersion. Health Affairs blog. April 21, 2016. http://healthaffairs.org/blog/2016/04/21/accountable-care-organizations-in-2016-private-and-public-sector-growth-and-dispersion/. Accessed November 7, 2016. 16. Leppin AL, Gionfriddo MR, Kessler M, et al. Preventing 30-day hospital readmissions: a systematic review and meta-analysis of randomized trials. JAMA Intern Med. 2014;174(7):1095-1107. PubMed 17. Zuckerman RB, Sheingold SH, Orav EJ, Ruhter J, Epstein AM. Readmissions, observation, and the Hospital Readmissions Reduction Program. N Engl J Med. 2016;374(16):1543-1551. PubMed 18. Fingar KR, Washington R. Trends in hospital readmissions for four high-volume conditions, 2009–2013. Rockville, MD: Agency for Healthcare Research and Quality; November 2015. Statistical Brief No. 196. https://www.hcup-us.ahrq.gov/reports/statbriefs/sb196-Readmissions-Trends-High-Volume-Conditions.pdf. Accessed March 15, 2017. 19. Ross MA, Hockenberry JM, Mutter R, Barrett M, Wheatley M, Pitts SR. Protocol-driven emergency department observation units offer savings, shorter stays, and reduced admissions. Health Aff (Millwood). 2013;32(12):2149-2156. PubMed 20. Healthcare Cost and Utilization Project (HCUP). HCUP Databases. Rockville, MD: Agency for Healthcare Research and Quality; November 2016. www.hcup-us.ahrq.gov/databases.jsp. Accessed March 15, 2017. 21. QualityNet. Archived resources: readmission measures and measure methodology. https://www.qualitynet.org/dcs/ContentServer?cid=1228774371008&pagename=QnetPublic%2FPage%2FQnetTier4&c=Page. Accessed November 7, 2016. 22. Centers for Medicare & Medicaid Services. 2014 measures updates and specifications report: hospital-level 30-day risk-standardized readmission measures: acute myocardial infarction, heart failure, pneumonia, chronic obstructive pulmonary disease, stroke. March 2014. https://www.cms.gov/Medicare/Quality-Initiatives-Patient-Assessment-Instruments/HospitalQualityInits/Measure-Methodology.html. Accessed September 26, 2017. 23. Iacus SM, King G, Porro G. Causal inference without balance checking: coarsened exact matching. Political Analysis. 2012;20(1):1-24. 24. Moore BJ, White S, Washington R, Coenen N, Elixhauser A. Identifying increased risk of readmission and in-hospital mortality using hospital administrative data: The AHRQ Elixhauser Comorbidity Index. Med Care. 2017;55(7):698-705. PubMed 25. Gerhardt G, Yemane A, Apostle K, Oelschlaeger A, Rollins E, Brennan N. Evaluating whether changes in utilization of hospital outpatient services contributed to lower Medicare readmission rate. Medicare Medicaid Res Rev. 2014;4(1):mmrr2014.004.01.b03. PubMed 26. Kripalani S, Theobald CN, Anctil B, Vasilevskis EE. Reducing hospital readmission rates: current strategies and future directions. Annu Rev Med. 2014;65:471-485. PubMed 27. Desai NR, Ross JS, Kwon JY, et al. Association between hospital penalty status under the hospital readmission reduction program and readmission rates for target and nontarget conditions. JAMA. 2016;316(24):2647-2656. PubMed 28. Epstein AM, Jha AK, Orav EJ. The relationship between hospital admission rates and rehospitalizations. N Engl J Med. 2011;365(24):2287-2295. PubMed 29. Venkatesh AK, Wang C, Ross JS, et al. Hospital use of observation stays: cross sectional study of the impact on readmission rates. Med Care. 2016;54(12)1070-1077. PubMed 30. Nuckols TK, Fingar KR, Barrett M, Steiner CA, Stocks C, Owens PL. The shifting landscape in utilization of inpatient, observation, and emergency department Services Across Payers. J Hosp Med. 2017;12(6):443-446. PubMed 31. Dharmarajan K, Qin L, Lin Z, et al. Declining admission rates and thirty-day readmission rates positively associated even though patients grew sicker over time. Health Aff (Millwood). 2016;35(7):1294-1302. PubMed 32. Grube M, Kaufman K, York R. Decline in utilization rates signals a change in the inpatient business model. Health Affairs blog. March 8, 2013. http://healthaffairs.org/blog/2013/03/08/decline-in-utilization-rates-signals-a-change-in-the-inpatient-business-model/. Accessed November 7, 2016. 33. Feng Z, Wright B, Mor V. Sharp rise in Medicare enrollees being held in hospitals for observation raises concerns about causes and consequences. Health Aff (Millwood). 2012;31(6):1251-1259. PubMed 34. Venkatesh AK, Geisler BP, Gibson Chambers JJ, et al. Use of observation care in US emergency departments, 2001 to 2008. PLoS One. 2011;6(9):e24326. PubMed 35. Schuur JD, Venkatesh AK. The growing role of emergency departments in hospital admissions. N Engl J Med. 2012;367(5):391-393. PubMed 36. Kangovi S, Cafardi SG, Smith RA, Kulkarni R, Grande D. Patient financial responsibility for observation care. J Hosp Med. 2015;10(11):718-723. PubMed 37. Doyle BJ, Ettner SL, Nuckols TK. Supplemental insurance reduces out-of-pocket costs in Medicare observation services. J Hosp Med. 2016;11(7):502-504. doi:10.1002/jhm.2588. PubMed 38. Hansen LO, Young RS, Hinami K, Leung A, Williams MV. Interventions to reduce 30-day rehospitalization: a systematic review. Ann Intern Med. 2011;155(8):520-528. PubMed 39. Bradley EH, Curry L, Horwitz LI, et al. Hospital strategies associated with 30-day readmission rates for patients with heart failure. Circ Cardiovasc Qual Outcomes. 2013;6(4):444-450. PubMed 40. US Census Bureau. American Fact Finder: community facts. http://factfinder.census.gov/faces/nav/jsf/pages/index.xhtml. Accessed November 1, 2016. 41. Van Vleet A, Paradise J. Tapping nurse practitioners to meet rising demand for primary care. Kaiser Family Foundation Issue Brief. January 20, 2015. http://kff.org/medicaid/issue-brief/tapping-nurse-practitioners-to-meet-rising-demand-for-primary-care/. Accessed November 7, 2016. 42. Agency for Healthcare Research and Quality (AHRQ). Hospital guide to reducing Medicaid readmissions. Rockville, MD: AHRQ; August 2014. AHRQ Publication No. 14-0050-EF. http://www.ahrq.gov/sites/default/files/publications/files/medreadmissions.pdf. Accessed March 15, 2017. 43. Boccuti C, Casillas G. Aiming for fewer hospital U-turns: The Medicare Hospital Readmissions Reduction Program. Kaiser Family Foundation Issue Brief. March 10, 2017. http://kff.org/medicare/issue-brief/aiming-for-fewer-hospital-u-turns-the-medicare-hospital-readmission-reduction-program/. Accessed November 7, 2016. 44. Conway P, Gronniger T. New data: 49 states plus DC reduce avoidable hospital readmissions. Centers for Medicare & Medicaid Services blog. September 13, 2016. http://medtecheng.com/new-data-49-states-plus-dc-reduce-avoidable-hospital-readmissions/. Accessed September 26, 2017.
Address for correspondence and reprint requests: Teryl K. Nuckols, MD, MSHS, RAND Corporation, 1776 Main Street, Santa Monica, CA 90401; Telephone: 310-393-0411; Fax: (310) 260-8159; E-mail: teryl.nuckols@cshs.org
Content Gating
Gated (full article locked unless allowed per User)
Alternative CME
Disqus Comments
Default
Gate On Date
Wed, 06/13/2018 - 06:00
Un-Gate On Date
Wed, 05/09/2018 - 06:00
Consolidated Pubs: Do Not Show Source Publication Logo
Hospitalist physicians care for an increasing proportion of general medicine inpatients and request a significant share of all subspecialty consultations.1 Subspecialty consultation in inpatient care is increasing,2,3 and effective hospitalist–consulting service interactions may affect team communication, patient care, and hospitalist learning. Therefore, enhancing hospitalist–consulting service interactions may have a broad-reaching, positive impact. Researchers in previous studies have explored resident–fellow consult interactions in the inpatient and emergency department settings as well as attending-to-attending consultation in the outpatient setting.4-7 However, to our knowledge, hospitalist–consulting team interactions have not been previously described. In academic medical centers, hospitalists are attending physicians who interact with both fellows (supervised by attending consultants) and directly with subspecialty attendings. Therefore, the exploration of the hospitalist–consultant interaction requires an evaluation of hospitalist–fellow and hospitalist–subspecialty attending interactions. The hospitalist–fellow interaction in particular is unique because it represents an unusual dynamic, in which an attending physician is primarily communicating with a trainee when requesting assistance with patient care.8 In order to explore hospitalist–consultant interactions (herein, the term “consultant” includes both fellow and attending consultants), we conducted a survey study in which we examine hospitalist practices and attitudes regarding consultation, with a specific focus on hospitalist consultation with internal medicine subspecialty consult services. In addition, we compared fellow–hospitalist and attending–hospitalist interactions and explored barriers to and facilitating factors of an effective hospitalist–consultant relationship.
METHODS
Survey Development
The survey instrument was developed by the authors based on findings of prior studies in which researchers examined consultation.2-6,9-16 The survey contained 31 questions (supplementary Appendix A) and evaluated 4 domains of the use of medical subspecialty consultation in direct patient care: (1) current consultation practices, (2) preferences regarding consultants, (3) barriers to and facilitating factors of effective consultation (both with respect to hospitalist learning and patient care), and (4) a comparison between hospitalist–fellow and hospitalist–subspecialty attending interactions. An evaluation of current consultation practices included a focus on communication methods (eg, in person, over the phone, through paging, or notes) because these have been found to be important during consultation.5,6,9,15,16 In order to explore hospitalist preferences regarding consult interactions and investigate perceptions of barriers to and facilitating factors of effective consultation, questions were developed based on previous literature, including our qualitative work examining resident–fellow interactions during consultation.4-6,9,12 We compared hospitalist consultation experiences among attending and fellow consultants because the interaction in which an attending hospitalist physician is primarily communicating with a trainee may differ from a consultation between a hospitalist attending and a subspecialty attending.8 Participants were asked to exclude their experiences when working on teaching services, during which students or housestaff often interact with consultants. The survey was cognitively tested with both hospitalist and non-hospitalist attending physicians not participating in the study and was revised by the authors using an iterative approach.
Study Participants
Hospitalist attending physicians at University of Texas Southwestern (UTSW) Medical Center, Emory University School of Medicine, Massachusetts General Hospital (MGH), and the Medical University of South Carolina (MUSC) were eligible to participate in the study. Consult team structures at each institution were composed of either a subspecialist-attending-only or a fellow-and-subspecialty-attending team. Fellows at all institutions are supervised by a subspecialty attending when performing consultations. Respondents who self-identified as nurse practitioners or physician assistants were excluded from the analysis. Hospitalists employed by the Veterans Affairs hospital system were also excluded. The study was approved by the institutional review boards of UTSW, Emory, MUSC, and MGH.
The survey was anonymous and administered to all hospitalists at participating institutions via a web-based survey tool (Qualtrics, Provo, UT). Participants were eligible to enter a raffle for a $500 gift card, and completion of the survey was not required for entry into the raffle.
Statistics
Results were summarized using the mean with standard deviation for continuous variables and the frequency with percentage for categorical variables after excluding missing values. All analyses were conducted using SAS version 9.4 (SAS Institute, Cary, NC). A 2-sided P value of ≤0.05 was considered statistically significant.
RESULTS
Of a possible 261 respondents, 122 (46.7%) participated in the survey. Missing values for survey responses ranged from 0% to 21.3%, with a mean of 15.2%. Demographic characteristics are shown in Table 1. Respondents had a mean age of 37.7 years and had worked as attending hospitalists for an average of 5.6 years. The majority of respondents (86.1%) practiced in academic medical centers, with the remaining working in satellite community hospitals. Respondents reported working daytime shifts 74.1% of the time on average and being on inpatient, direct-care services without house-staff 70.5% of the time.
Current Consultation Practices
Current consultation practices and descriptions of hospitalist–consultant communication are shown in Table 2. Forty percent of respondents requested 0-1 consults per day, while 51.7% requested 2-3 per day. The most common reasons for requesting a consultation were assistance with treatment (48.5%), assistance with diagnosis (25.7%), and request for a procedure (21.8%). When asked whether the frequency of consultation is changing, slightly more hospitalists felt that their personal use of consultation was increasing as compared to those who felt that it was decreasing (38.5% vs 30.3%, respectively).
An exploration of communication practices during consultation revealed that hospitalists most often interacted with fellows rather than attending physicians (81.4%). However, even when a fellow performs a consult and communicates with a hospitalist, a subspecialty attending is involved in the care of the patient, although he or she may not communicate directly with the hospitalist. Respondents indicated that they most often communicated a consult request to the consultant by phone (76.2%). Pushback from consultants (defined as perceived reluctance or resistance to perform the consult for any reason) was perceived as common, with 64.4% of hospitalists indicating that they experience pushback at least “sometimes” (3 on a 5-point Likert scale) and 22.1% reporting that pushback was “frequent” or occurred “most of the time”. Follow-up interactions (defined as communication of recommendations after the consultant evaluated the patient) infrequently occurred through in-person communication, with 90.9% reporting that this occurred in less than half of consultations. Communication by phone was most common, with 61.2% reporting that it occurred at least half the time, and 86% of respondents reported that communication by paging only occurred at least “sometimes”. Consultation was commonly seen as a valuable educational experience, with 56.9% of hospitalists indicating that they learned from at least half of consults.
Hospitalist Preferences
Eighty-six percent of respondents agreed that consultants should be required to communicate their recommendations either in person or over the phone. Eighty-three percent of hospitalists agreed that they would like to receive more teaching from the consulting services, and 74.0% agreed that consultants should attempt to teach hospitalists during consult interactions regardless of whether the hospitalist initiates the teaching–learning interaction.
Barriers to and Facilitating Factors of Effective Consultation
Participants reported that multiple factors affected patient care and their own learning during inpatient consultation (Figure 1). Consultant pushback, high hospitalist clinical workload, a perception that consultants had limited time, and minimal in-person interactions were all seen as factors that negatively affected the consult interaction. These generally affected both learning and patient care. Conversely, working on an interesting clinical case, more hospitalist free time, positive interaction with the consultant, and having previously worked with the consultant positively affected both learning and patient care (Figure 1).
Fellow Versus Attending Interactions
Respondents indicated that interacting directly with the consult attending was superior to hospitalist–fellow interactions in all aspects of care but particularly with respect to pushback, confidence in recommendations, professionalism, and hospitalist learning (Figure 2).
DISCUSSION
To our knowledge, this is the first study to describe hospitalist attending practices, attitudes, and perceptions of internal medicine subspecialty consultation. Our findings, which focus on the interaction between hospitalists and internal medicine subspecialty attendings and fellows, outline the hospitalist perspective on consultant interactions and identify a number of factors that are amenable to intervention. We found that hospitalists perceive the consult interaction to be important for patient care and a valuable opportunity for their own learning. In-person communication was seen as an important component of effective consultation but was reported to occur in a minority of consultations. We demonstrate that hospitalist–subspecialty attending consult interactions are perceived more positively than hospitalist–fellow interactions. Finally, we describe barriers and facilitating factors that may inform future interventions targeting this important interaction.
Effective communication between consultants and the primary team is critical for both patient care and teaching interactions.4-7 Pushback on consultation was reported to be the most significant barrier to hospitalist learning and had a major impact on patient care. Because hospitalists are attending physicians, we hypothesized that they may perceive pushback from fellows less frequently than residents.4 However, in our study, hospitalists reported pushback to be relatively frequent in their daily practice. Moreover, hospitalists reported a strong preference for in-person interactions with consultants, but our study demonstrated that such interactions are relatively infrequent. Researchers in studies of resident–fellow consult interactions have noted similar findings, suggesting that hospitalists and internal medicine residents face similar challenges during consultation.4-6 Hospitalists reported that positive interpersonal interactions and personal familiarity with the consultant positively affected the consult interaction. Most importantly, these effects were perceived to affect both hospitalist learning and patient care, suggesting the importance of interpersonal interactions in consultative medicine.
In an era of increasing clinical workload, the consult interaction represents an important workplace-based learning opportunity.4 Centered on a consult question, the hospitalist–consultant interaction embodies a teachable moment and can be an efficient opportunity to learn because both parties are familiar with the patient. Indeed, survey respondents reported that they frequently learned from consultation, and there was a strong preference for more teaching from consultants in this setting. However, the hospitalist–fellow consult interaction is unique because attending hospitalists are frequently communicating with fellow trainees, which could limit fellows’ confidence in their role as teachers and hospitalists’ perception of their role as learners. Our study identifies a number of barriers and facilitating factors (including communication, pushback, familiarity, and clinical workload) that affect the hospitalist–consultant teaching interaction and may be amenable to intervention.
Hospitalists expressed a consistent preference for interacting with attending subspecialists compared to clinical fellows during consultation. Preference for interaction with attendings was strongest in the areas of pushback, confidence in recommendations, professionalism, and learning from consultation. Some of the factors that relate to consult service structure and fellow experience, such as timeliness of consultation and confidence in recommendations, may not be amenable to intervention. For instance, fellows must first see and then staff the consult with their attending prior to leaving formal recommendations, which makes their communication less timely than that of attending physicians, when they are the primary consultant. However, aspects of the hospitalist–consultant interaction (such as professionalism, ease of communication, and pushback) should not be affected by the difference in experience between fellows and attending physicians. The reasons for such perceptions deserve further exploration; however, differences in incentive structures, workload, and communication skills between fellows and attending consultants may be potential explanations.
Our findings suggest that interventions aimed at enhancing hospitalist–consultant interactions focus on enhancing direct communication and teaching while limiting the perception of pushback. A number of interventions that are primarily focused on instituting a systematic approach to requesting consultation have shown an improvement in resident and medical student consult communication17,18 as well as resident–fellow teaching interactions.9 However, it is not clear whether these interventions would be effective given that hospitalists have more experience communicating with consultants than trainees. Given the unique nature of the hospitalist–consultant interaction, multiple barriers may need to be addressed in order to have a significant impact. Efforts to increase direct communication, such as a mechanism for hospitalists to make and request in-person or direct verbal communication about a particular consultation during the consult request, can help consultants prioritize direct communication with hospitalists for specific patients. Familiarizing fellows with hospitalist workflow and the locations of hospitalist workrooms also may promote in-person communication. Fellowship training can focus on enhancing fellow teaching and communication skills,19-22 particularly as they relate to hospitalists. Fellows in particular may benefit because the hospitalist–fellow teaching interaction may be bidirectional, with hospitalists having expertise in systems practice and quality efforts that can inform fellows’ practice. Furthermore, interacting with hospitalists is an opportunity for fellows to practice professional interactions, which will be critical to their careers. Increasing familiarity between fellows and hospitalists through joint events may also serve to enhance the interaction. Finally, enabling hospitalists to provide feedback to fellows stands to benefit both parties because multisource feedback is an important tool in assessing trainee competence and improving performance.23 However, we should note that because our study focused on hospitalist perceptions, an exploration of subspecialty fellows’ and attendings’ perceptions of the hospitalist–consultant interaction would provide additional, important data for shaping interventions.
Strengths of our study include the inclusion of multiple study sites, which may increase generalizability; however, our study has several limitations. The incomplete response rate reduces both generalizability and statistical power and may have created selection or nonresponder bias. However, low response rates occur commonly when surveying medical professionals, and our results are consistent with many prior hospitalist survey studies.24-26 Further, we conducted our study at a single time point; therefore, we could not evaluate the effect of fellow experience on hospitalist perceptions. However, we conducted our study in the second half of the academic year, when fellows had already gained considerable experience in the consultation setting. We did not capture participants’ institutional affiliations; therefore, a subgroup analysis by institution could not be performed. Additionally, our study reflects hospitalist perception rather than objectively measured communication practices between hospitalists and consultants, and it does not include the perspective of subspecialists. The specific needs of nurse practitioners and physicians’ assistants, who were excluded from this study, should also be evaluated in future research. Lastly, this is a hypothesis-generating study and should be replicated in a national cohort.
CONCLUSION
The hospitalists represented in our sample population perceived the consult interaction to be important for patient care and a valuable opportunity for their own learning. Participants expressed that they would like to increase direct communication with consultants and enhance consultant–hospitalist teaching interactions. Multiple barriers to effective hospitalist–consultant interactions (including communication, pushback, and hospitalist–consultant familiarity) are amenable to intervention.
Disclosure
The authors have no financial disclosures or conflicts of interest.
1. Kravolec PD, Miller JA, Wellikson L, Huddleston JM. The status of hospital medicine groups in the United States. J Hosp Med.2006;1(2):75-80. PubMed 2. Cai Q, Bruno CJ, Hagedorn CH, Desbiens NA. Temporal trends over ten years in formal inpatient gastroenterology consultations at an inner-city hospital. J Clin Gastroenterol. 2003;36(1):34-38. PubMed 3. Ta K, Gardner GC. Evaluation of the activity of an academic rheumatology consult service over 10 years: using data to shape curriculum. J Rheumatol. 2007;34(3):563-566. PubMed 4. Miloslavsky EM, McSparron JI, Richards JB, Puig A, Sullivan AM. Teaching during consultation: factors affecting the resident-fellow teaching interaction. Med Educ. 2015;49(7):717-730. PubMed 5. Chan T, Sabir K, Sanhan S, Sherbino J. Understanding the impact of residents’ interpersonal relationships during emergency department referrals and consultations. J Grad Med Educ. 2013;5(4):576-581. PubMed 6. Chan T, Bakewell F, Orlich D, Sherbino J. Conflict prevention, conflict mitigation, and manifestations of conflict during emergency department consultations. Acad Emerg Med. 2014;21(3):308-313. PubMed 7. Goldman L, Lee T, Rudd P. Ten commandments for effective consultations. Arch Intern Med. 1983;143(9):1753-1755. PubMed 8. Adams T. Barriers to hospitalist fellow interactions. Med Educ. 2016;50(3):370. PubMed 9. Gupta S, Alladina J, Heaton K, Miloslavsky E. A randomized trial of an intervention to improve resident-fellow teaching interaction on the wards. BMC Med Educ. 2016;16(1):276. PubMed 10. Day LW, Cello JP, Madden E, Segal M. Prospective assessment of inpatient gastrointestinal consultation requests in an academic teaching hospital. Am J Gastroenterol. 2010;105(3):484-489. PubMed 11. Kessler C, Kutka BM, Badillo C. Consultation in the emergency department: a qualitative analysis and review. J Emerg Med. 2012;42(6):704-711. PubMed 12. Salerno SM, Hurst FP, Halvorson S, Mercado DL. Principles of effective consultation: an update for the 21st-century consultant. Arch Intern Med. 2007;167(3):271-275. PubMed 13. Muzin LJ. Understanding the process of medical referral: part 1: critique of the literature. Can Fam Physician. 1991;37:2155-2161. PubMed 14. Muzin LJ. Understanding the process of medical referral: part 5: communication. Can Fam Physician. 1992;38:301-307. PubMed 15. Wadhwa A, Lingard L. A qualitative study examining tensions in interdoctor telephone consultations. Med Educ. 2006;40(8):759-767. PubMed 16. Grant IN, Dixon AS. “Thank you for seeing this patient”: studying the quality of communication between physicians. Can Fam Physician. 1987;33:605-611. PubMed 17. Kessler CS, Afshar Y, Sardar G, Yudkowsky R, Ankel F, Schwartz A. A prospective, randomized, controlled study demonstrating a novel, effective model of transfer of care between physicians: the 5 Cs of consultation. Acad Emerg Med. 2012;19(8):968-974. PubMed 18. Podolsky A, Stern DTP. The courteous consult: a CONSULT card and training to improve resident consults. J Grad Med Educ. 2015;7(1):113-117. PubMed 19. Tofil NM, Peterson DT, Harrington KF, et al. A novel iterative-learner simulation model: fellows as teachers. J. Grad. Med. Educ. 2014;6(1):127-132. PubMed 20. Kempainen RR, Hallstrand TS, Culver BH, Tonelli MR. Fellows as teachers: the teacher-assistant experience during pulmonary subspecialty training. Chest. 2005;128(1):401-406. PubMed 21. Backes CH, Reber KM, Trittmann JK, et al. Fellows as teachers: a model to enhance pediatric resident education. Med. Educ. Online. 2011;16:7205. PubMed 22. Miloslavsky EM, Degnan K, McNeill J, McSparron JI. Use of Fellow as Clinical Teacher (FACT) Curriculum for Teaching During Consultation: Effect on Subspecialty Fellow Teaching Skills. J Grad Med Educ. 2017;9(3):345-350 PubMed 23. Donnon T, Al Ansari A, Al Alawi S, Violato C. The reliability, validity, and feasibility of multisource feedback physician assessment: a systematic review. Acad. Med. 2014;89(3):511-516. PubMed 24. Monash B, Najafi N, Mourad M, et al. Standardized attending rounds to improve the patient experience: A pragmatic cluster randomized controlled trial. J Hosp Med. 2017;12(3):143-149. PubMed 25. Allen-Dicker J, Auerbach A, Herzig SJ. Perceived safety and value of inpatient “very important person” services. J Hosp Med. 2017;12(3):177-179. PubMed 26. Do D, Munchhof AM, Terry C, Emmett T, Kara A. Research and publication trends in hospital medicine. J Hosp Med. 2014;9(3):148-154. PubMed
Hospitalist physicians care for an increasing proportion of general medicine inpatients and request a significant share of all subspecialty consultations.1 Subspecialty consultation in inpatient care is increasing,2,3 and effective hospitalist–consulting service interactions may affect team communication, patient care, and hospitalist learning. Therefore, enhancing hospitalist–consulting service interactions may have a broad-reaching, positive impact. Researchers in previous studies have explored resident–fellow consult interactions in the inpatient and emergency department settings as well as attending-to-attending consultation in the outpatient setting.4-7 However, to our knowledge, hospitalist–consulting team interactions have not been previously described. In academic medical centers, hospitalists are attending physicians who interact with both fellows (supervised by attending consultants) and directly with subspecialty attendings. Therefore, the exploration of the hospitalist–consultant interaction requires an evaluation of hospitalist–fellow and hospitalist–subspecialty attending interactions. The hospitalist–fellow interaction in particular is unique because it represents an unusual dynamic, in which an attending physician is primarily communicating with a trainee when requesting assistance with patient care.8 In order to explore hospitalist–consultant interactions (herein, the term “consultant” includes both fellow and attending consultants), we conducted a survey study in which we examine hospitalist practices and attitudes regarding consultation, with a specific focus on hospitalist consultation with internal medicine subspecialty consult services. In addition, we compared fellow–hospitalist and attending–hospitalist interactions and explored barriers to and facilitating factors of an effective hospitalist–consultant relationship.
METHODS
Survey Development
The survey instrument was developed by the authors based on findings of prior studies in which researchers examined consultation.2-6,9-16 The survey contained 31 questions (supplementary Appendix A) and evaluated 4 domains of the use of medical subspecialty consultation in direct patient care: (1) current consultation practices, (2) preferences regarding consultants, (3) barriers to and facilitating factors of effective consultation (both with respect to hospitalist learning and patient care), and (4) a comparison between hospitalist–fellow and hospitalist–subspecialty attending interactions. An evaluation of current consultation practices included a focus on communication methods (eg, in person, over the phone, through paging, or notes) because these have been found to be important during consultation.5,6,9,15,16 In order to explore hospitalist preferences regarding consult interactions and investigate perceptions of barriers to and facilitating factors of effective consultation, questions were developed based on previous literature, including our qualitative work examining resident–fellow interactions during consultation.4-6,9,12 We compared hospitalist consultation experiences among attending and fellow consultants because the interaction in which an attending hospitalist physician is primarily communicating with a trainee may differ from a consultation between a hospitalist attending and a subspecialty attending.8 Participants were asked to exclude their experiences when working on teaching services, during which students or housestaff often interact with consultants. The survey was cognitively tested with both hospitalist and non-hospitalist attending physicians not participating in the study and was revised by the authors using an iterative approach.
Study Participants
Hospitalist attending physicians at University of Texas Southwestern (UTSW) Medical Center, Emory University School of Medicine, Massachusetts General Hospital (MGH), and the Medical University of South Carolina (MUSC) were eligible to participate in the study. Consult team structures at each institution were composed of either a subspecialist-attending-only or a fellow-and-subspecialty-attending team. Fellows at all institutions are supervised by a subspecialty attending when performing consultations. Respondents who self-identified as nurse practitioners or physician assistants were excluded from the analysis. Hospitalists employed by the Veterans Affairs hospital system were also excluded. The study was approved by the institutional review boards of UTSW, Emory, MUSC, and MGH.
The survey was anonymous and administered to all hospitalists at participating institutions via a web-based survey tool (Qualtrics, Provo, UT). Participants were eligible to enter a raffle for a $500 gift card, and completion of the survey was not required for entry into the raffle.
Statistics
Results were summarized using the mean with standard deviation for continuous variables and the frequency with percentage for categorical variables after excluding missing values. All analyses were conducted using SAS version 9.4 (SAS Institute, Cary, NC). A 2-sided P value of ≤0.05 was considered statistically significant.
RESULTS
Of a possible 261 respondents, 122 (46.7%) participated in the survey. Missing values for survey responses ranged from 0% to 21.3%, with a mean of 15.2%. Demographic characteristics are shown in Table 1. Respondents had a mean age of 37.7 years and had worked as attending hospitalists for an average of 5.6 years. The majority of respondents (86.1%) practiced in academic medical centers, with the remaining working in satellite community hospitals. Respondents reported working daytime shifts 74.1% of the time on average and being on inpatient, direct-care services without house-staff 70.5% of the time.
Current Consultation Practices
Current consultation practices and descriptions of hospitalist–consultant communication are shown in Table 2. Forty percent of respondents requested 0-1 consults per day, while 51.7% requested 2-3 per day. The most common reasons for requesting a consultation were assistance with treatment (48.5%), assistance with diagnosis (25.7%), and request for a procedure (21.8%). When asked whether the frequency of consultation is changing, slightly more hospitalists felt that their personal use of consultation was increasing as compared to those who felt that it was decreasing (38.5% vs 30.3%, respectively).
An exploration of communication practices during consultation revealed that hospitalists most often interacted with fellows rather than attending physicians (81.4%). However, even when a fellow performs a consult and communicates with a hospitalist, a subspecialty attending is involved in the care of the patient, although he or she may not communicate directly with the hospitalist. Respondents indicated that they most often communicated a consult request to the consultant by phone (76.2%). Pushback from consultants (defined as perceived reluctance or resistance to perform the consult for any reason) was perceived as common, with 64.4% of hospitalists indicating that they experience pushback at least “sometimes” (3 on a 5-point Likert scale) and 22.1% reporting that pushback was “frequent” or occurred “most of the time”. Follow-up interactions (defined as communication of recommendations after the consultant evaluated the patient) infrequently occurred through in-person communication, with 90.9% reporting that this occurred in less than half of consultations. Communication by phone was most common, with 61.2% reporting that it occurred at least half the time, and 86% of respondents reported that communication by paging only occurred at least “sometimes”. Consultation was commonly seen as a valuable educational experience, with 56.9% of hospitalists indicating that they learned from at least half of consults.
Hospitalist Preferences
Eighty-six percent of respondents agreed that consultants should be required to communicate their recommendations either in person or over the phone. Eighty-three percent of hospitalists agreed that they would like to receive more teaching from the consulting services, and 74.0% agreed that consultants should attempt to teach hospitalists during consult interactions regardless of whether the hospitalist initiates the teaching–learning interaction.
Barriers to and Facilitating Factors of Effective Consultation
Participants reported that multiple factors affected patient care and their own learning during inpatient consultation (Figure 1). Consultant pushback, high hospitalist clinical workload, a perception that consultants had limited time, and minimal in-person interactions were all seen as factors that negatively affected the consult interaction. These generally affected both learning and patient care. Conversely, working on an interesting clinical case, more hospitalist free time, positive interaction with the consultant, and having previously worked with the consultant positively affected both learning and patient care (Figure 1).
Fellow Versus Attending Interactions
Respondents indicated that interacting directly with the consult attending was superior to hospitalist–fellow interactions in all aspects of care but particularly with respect to pushback, confidence in recommendations, professionalism, and hospitalist learning (Figure 2).
DISCUSSION
To our knowledge, this is the first study to describe hospitalist attending practices, attitudes, and perceptions of internal medicine subspecialty consultation. Our findings, which focus on the interaction between hospitalists and internal medicine subspecialty attendings and fellows, outline the hospitalist perspective on consultant interactions and identify a number of factors that are amenable to intervention. We found that hospitalists perceive the consult interaction to be important for patient care and a valuable opportunity for their own learning. In-person communication was seen as an important component of effective consultation but was reported to occur in a minority of consultations. We demonstrate that hospitalist–subspecialty attending consult interactions are perceived more positively than hospitalist–fellow interactions. Finally, we describe barriers and facilitating factors that may inform future interventions targeting this important interaction.
Effective communication between consultants and the primary team is critical for both patient care and teaching interactions.4-7 Pushback on consultation was reported to be the most significant barrier to hospitalist learning and had a major impact on patient care. Because hospitalists are attending physicians, we hypothesized that they may perceive pushback from fellows less frequently than residents.4 However, in our study, hospitalists reported pushback to be relatively frequent in their daily practice. Moreover, hospitalists reported a strong preference for in-person interactions with consultants, but our study demonstrated that such interactions are relatively infrequent. Researchers in studies of resident–fellow consult interactions have noted similar findings, suggesting that hospitalists and internal medicine residents face similar challenges during consultation.4-6 Hospitalists reported that positive interpersonal interactions and personal familiarity with the consultant positively affected the consult interaction. Most importantly, these effects were perceived to affect both hospitalist learning and patient care, suggesting the importance of interpersonal interactions in consultative medicine.
In an era of increasing clinical workload, the consult interaction represents an important workplace-based learning opportunity.4 Centered on a consult question, the hospitalist–consultant interaction embodies a teachable moment and can be an efficient opportunity to learn because both parties are familiar with the patient. Indeed, survey respondents reported that they frequently learned from consultation, and there was a strong preference for more teaching from consultants in this setting. However, the hospitalist–fellow consult interaction is unique because attending hospitalists are frequently communicating with fellow trainees, which could limit fellows’ confidence in their role as teachers and hospitalists’ perception of their role as learners. Our study identifies a number of barriers and facilitating factors (including communication, pushback, familiarity, and clinical workload) that affect the hospitalist–consultant teaching interaction and may be amenable to intervention.
Hospitalists expressed a consistent preference for interacting with attending subspecialists compared to clinical fellows during consultation. Preference for interaction with attendings was strongest in the areas of pushback, confidence in recommendations, professionalism, and learning from consultation. Some of the factors that relate to consult service structure and fellow experience, such as timeliness of consultation and confidence in recommendations, may not be amenable to intervention. For instance, fellows must first see and then staff the consult with their attending prior to leaving formal recommendations, which makes their communication less timely than that of attending physicians, when they are the primary consultant. However, aspects of the hospitalist–consultant interaction (such as professionalism, ease of communication, and pushback) should not be affected by the difference in experience between fellows and attending physicians. The reasons for such perceptions deserve further exploration; however, differences in incentive structures, workload, and communication skills between fellows and attending consultants may be potential explanations.
Our findings suggest that interventions aimed at enhancing hospitalist–consultant interactions focus on enhancing direct communication and teaching while limiting the perception of pushback. A number of interventions that are primarily focused on instituting a systematic approach to requesting consultation have shown an improvement in resident and medical student consult communication17,18 as well as resident–fellow teaching interactions.9 However, it is not clear whether these interventions would be effective given that hospitalists have more experience communicating with consultants than trainees. Given the unique nature of the hospitalist–consultant interaction, multiple barriers may need to be addressed in order to have a significant impact. Efforts to increase direct communication, such as a mechanism for hospitalists to make and request in-person or direct verbal communication about a particular consultation during the consult request, can help consultants prioritize direct communication with hospitalists for specific patients. Familiarizing fellows with hospitalist workflow and the locations of hospitalist workrooms also may promote in-person communication. Fellowship training can focus on enhancing fellow teaching and communication skills,19-22 particularly as they relate to hospitalists. Fellows in particular may benefit because the hospitalist–fellow teaching interaction may be bidirectional, with hospitalists having expertise in systems practice and quality efforts that can inform fellows’ practice. Furthermore, interacting with hospitalists is an opportunity for fellows to practice professional interactions, which will be critical to their careers. Increasing familiarity between fellows and hospitalists through joint events may also serve to enhance the interaction. Finally, enabling hospitalists to provide feedback to fellows stands to benefit both parties because multisource feedback is an important tool in assessing trainee competence and improving performance.23 However, we should note that because our study focused on hospitalist perceptions, an exploration of subspecialty fellows’ and attendings’ perceptions of the hospitalist–consultant interaction would provide additional, important data for shaping interventions.
Strengths of our study include the inclusion of multiple study sites, which may increase generalizability; however, our study has several limitations. The incomplete response rate reduces both generalizability and statistical power and may have created selection or nonresponder bias. However, low response rates occur commonly when surveying medical professionals, and our results are consistent with many prior hospitalist survey studies.24-26 Further, we conducted our study at a single time point; therefore, we could not evaluate the effect of fellow experience on hospitalist perceptions. However, we conducted our study in the second half of the academic year, when fellows had already gained considerable experience in the consultation setting. We did not capture participants’ institutional affiliations; therefore, a subgroup analysis by institution could not be performed. Additionally, our study reflects hospitalist perception rather than objectively measured communication practices between hospitalists and consultants, and it does not include the perspective of subspecialists. The specific needs of nurse practitioners and physicians’ assistants, who were excluded from this study, should also be evaluated in future research. Lastly, this is a hypothesis-generating study and should be replicated in a national cohort.
CONCLUSION
The hospitalists represented in our sample population perceived the consult interaction to be important for patient care and a valuable opportunity for their own learning. Participants expressed that they would like to increase direct communication with consultants and enhance consultant–hospitalist teaching interactions. Multiple barriers to effective hospitalist–consultant interactions (including communication, pushback, and hospitalist–consultant familiarity) are amenable to intervention.
Disclosure
The authors have no financial disclosures or conflicts of interest.
References
1. Kravolec PD, Miller JA, Wellikson L, Huddleston JM. The status of hospital medicine groups in the United States. J Hosp Med.2006;1(2):75-80. PubMed 2. Cai Q, Bruno CJ, Hagedorn CH, Desbiens NA. Temporal trends over ten years in formal inpatient gastroenterology consultations at an inner-city hospital. J Clin Gastroenterol. 2003;36(1):34-38. PubMed 3. Ta K, Gardner GC. Evaluation of the activity of an academic rheumatology consult service over 10 years: using data to shape curriculum. J Rheumatol. 2007;34(3):563-566. PubMed 4. Miloslavsky EM, McSparron JI, Richards JB, Puig A, Sullivan AM. Teaching during consultation: factors affecting the resident-fellow teaching interaction. Med Educ. 2015;49(7):717-730. PubMed 5. Chan T, Sabir K, Sanhan S, Sherbino J. Understanding the impact of residents’ interpersonal relationships during emergency department referrals and consultations. J Grad Med Educ. 2013;5(4):576-581. PubMed 6. Chan T, Bakewell F, Orlich D, Sherbino J. Conflict prevention, conflict mitigation, and manifestations of conflict during emergency department consultations. Acad Emerg Med. 2014;21(3):308-313. PubMed 7. Goldman L, Lee T, Rudd P. Ten commandments for effective consultations. Arch Intern Med. 1983;143(9):1753-1755. PubMed 8. Adams T. Barriers to hospitalist fellow interactions. Med Educ. 2016;50(3):370. PubMed 9. Gupta S, Alladina J, Heaton K, Miloslavsky E. A randomized trial of an intervention to improve resident-fellow teaching interaction on the wards. BMC Med Educ. 2016;16(1):276. PubMed 10. Day LW, Cello JP, Madden E, Segal M. Prospective assessment of inpatient gastrointestinal consultation requests in an academic teaching hospital. Am J Gastroenterol. 2010;105(3):484-489. PubMed 11. Kessler C, Kutka BM, Badillo C. Consultation in the emergency department: a qualitative analysis and review. J Emerg Med. 2012;42(6):704-711. PubMed 12. Salerno SM, Hurst FP, Halvorson S, Mercado DL. Principles of effective consultation: an update for the 21st-century consultant. Arch Intern Med. 2007;167(3):271-275. PubMed 13. Muzin LJ. Understanding the process of medical referral: part 1: critique of the literature. Can Fam Physician. 1991;37:2155-2161. PubMed 14. Muzin LJ. Understanding the process of medical referral: part 5: communication. Can Fam Physician. 1992;38:301-307. PubMed 15. Wadhwa A, Lingard L. A qualitative study examining tensions in interdoctor telephone consultations. Med Educ. 2006;40(8):759-767. PubMed 16. Grant IN, Dixon AS. “Thank you for seeing this patient”: studying the quality of communication between physicians. Can Fam Physician. 1987;33:605-611. PubMed 17. Kessler CS, Afshar Y, Sardar G, Yudkowsky R, Ankel F, Schwartz A. A prospective, randomized, controlled study demonstrating a novel, effective model of transfer of care between physicians: the 5 Cs of consultation. Acad Emerg Med. 2012;19(8):968-974. PubMed 18. Podolsky A, Stern DTP. The courteous consult: a CONSULT card and training to improve resident consults. J Grad Med Educ. 2015;7(1):113-117. PubMed 19. Tofil NM, Peterson DT, Harrington KF, et al. A novel iterative-learner simulation model: fellows as teachers. J. Grad. Med. Educ. 2014;6(1):127-132. PubMed 20. Kempainen RR, Hallstrand TS, Culver BH, Tonelli MR. Fellows as teachers: the teacher-assistant experience during pulmonary subspecialty training. Chest. 2005;128(1):401-406. PubMed 21. Backes CH, Reber KM, Trittmann JK, et al. Fellows as teachers: a model to enhance pediatric resident education. Med. Educ. Online. 2011;16:7205. PubMed 22. Miloslavsky EM, Degnan K, McNeill J, McSparron JI. Use of Fellow as Clinical Teacher (FACT) Curriculum for Teaching During Consultation: Effect on Subspecialty Fellow Teaching Skills. J Grad Med Educ. 2017;9(3):345-350 PubMed 23. Donnon T, Al Ansari A, Al Alawi S, Violato C. The reliability, validity, and feasibility of multisource feedback physician assessment: a systematic review. Acad. Med. 2014;89(3):511-516. PubMed 24. Monash B, Najafi N, Mourad M, et al. Standardized attending rounds to improve the patient experience: A pragmatic cluster randomized controlled trial. J Hosp Med. 2017;12(3):143-149. PubMed 25. Allen-Dicker J, Auerbach A, Herzig SJ. Perceived safety and value of inpatient “very important person” services. J Hosp Med. 2017;12(3):177-179. PubMed 26. Do D, Munchhof AM, Terry C, Emmett T, Kara A. Research and publication trends in hospital medicine. J Hosp Med. 2014;9(3):148-154. PubMed
"Traci N. Adams, MD", UT Southwestern Medical Center, 5323 Harry Hines Blvd, Dallas, TX 75219; Telephone: 832-428-8135; Fax 214-645-6272; E-mail: tnfadams@gmail.com
Content Gating
Gated (full article locked unless allowed per User)
Alternative CME
Disqus Comments
Default
Gate On Date
Wed, 06/13/2018 - 06:00
Un-Gate On Date
Wed, 05/09/2018 - 06:00
Consolidated Pubs: Do Not Show Source Publication Logo
Shared decision-making tools, such as predictive models, can help empower the patient to make decisions for or against surgery equipped with more information about the expected outcome.
There is a role for preoperative collection of PROMs in the clinical decision-making process.
Mental health state, as reported by the VR-12 MCS, is a significant predictor of postoperative pain and function as reported by the VAS pain and ASES function scores.
A significant portion of the predictive ability of this model comes from the fact that at 1-year postoperatively, patients receiving a rTSA will on average have a 3.8 point lower on ASES function score than those receiving a TSA (P < .001, ω2=.083).
Future studies to discern the role of different modalities to improve a patient’s emotional health preoperatively will be beneficial as the healthcare industry trends toward value based medicine collecting PROMs as part of reimbursement schemes.
Over the past few decades, decisions regarding patients’ care have gradually transitioned from a paternalistic model to a more cooperative exchange between patient and physician. Shared decision-making provides patients a measure of autonomy in making choices for their health and their future. Patient participation may mitigate uncertainty and discomfort during selection of a course of treatment, which may lead to increased satisfaction levels after surgery.1 Moreover, shared decision-making may help patients better manage postoperative expectations through evidenced-based discussions of preoperative health levels and their corresponding outcomes. Patient-reported outcome measures (PROMs) use clinically sensitive and specific metrics to evaluate a patient’s self-reported pain, functional ability, and mental state.2 These metrics are useful in setting patient expectations for potential outcomes of treatment options. Use of evidence-based clinical decision-making tools, such as PROM-based predictive models, can facilitate a collaborative decision-making environment for patient and physician. Given the present cost-containment era, and the need for preoperative metrics that can assist in predictive analysis of postoperative improvement, models are clearly valuable.
In attempts to help patients set well-informed and reasonable expectations, physicians have turned to PROMs to facilitate preoperative evidence-based discussions. Although PROMs have been in use for almost 30 years, only recently have they been used to create tools that can aid quantitatively in the surgical decision-making process.2-6 Combining physical examination findings, imaging studies, comorbidities, and quantitative tools, such as this model, may enhance patients’ understanding of their preoperative condition and expected prognosis and thereby guide their surgical decisions.
We conducted a study to determine whether certain preoperative PROMs can predict 1-year postoperative visual analog scale (VAS) pain scores and American Shoulder and Elbow Surgeons (ASES) Function scores in total shoulder arthroplasty (TSA) and reverse TSA (rTSA). We hypothesized that preoperative mental health status as captured by Veterans RAND 12-Item Health Survey (VR-12) mental health component summary (MCS) score and preoperative VAS pain score would predict both VAS pain score and ASES Function score 1 year after surgery. Specifically, we hypothesized that a higher preoperative VR-12 MCS score would predict less pain and better function 1 year after surgery and that a higher preoperative VAS pain score would predict more pain and worse function 1 year after surgery.
Methods
This study was approved by the Institutional Review Board of Partners Healthcare. The study used the Surgical Outcome System (Arthrex), a comprehensive prospective database that stores preoperative and 1-year postoperative patient demographics and TSA-PROM data. Surveys are emailed to all enrolled patients before surgery and 1 year after surgery. As indicated by the Institutional Review Boards of all participating institutions, patients in the Surgical Outcome System have to sign a consent form to permit use of their responses in research.
The database includes patient data from 42 orthopedic surgeons across the United States. All primary TSAs and primary rTSAs in the database were included in this study, regardless of arthroplasty indication. Revisions were excluded. Also excluded were cases in which the 1-year postoperative questionnaire was not completed. Of the 1681 patients eligible for 1-year follow-up, 1225 (73%) completed the 1-year postoperative questionnaire. PROMs used in the study were VAS pain score, ASES Function score, VR-12 MCS score, and Single Assessment Numerical Evaluation (SANE). Unfortunately, not all surgeons use every measure in the 1-year postoperative questionnaire set. Thus, in our complete models, total number of observations was 1004 for modeling 1-year postoperative VAS pain scores and 986 for modeling 1-year postoperative ASES Function scores.
Metrics
On VAS, pain is rated from 0 (no pain) to 10 (pain as bad as it can be). Tashjian and colleagues7 estimated that the minimal clinically important difference (MCID) for postoperative VAS pain scores was 1.4 in a cohort of 326 patients who had TSA, rTSA, or shoulder hemiarthroplasty. ASES Function score is scaled from 0 to 30, with 30 representing best function.8 Wong and colleagues9 identified an MCID of 6.5 for ASES Function scores in a cohort of 107 patients who had TSA or rTSA. SANE ratings range from 0% to 100%, with 100% indicating the patient’s shoulder was totally “normal.”10 VR-12 MCS scores appear on a logarithmic scale, with higher numbers representing better mental health. The population mean estimate for VR-12 MCS scores is 50.1 (SD, 11.49; overall possible range, –2.47 to 76.1).11 Our patient population’s scores ranged from 12.5 to 73.8.
Statistical Analysis
Simple bivariate and multivariate linear regressions were performed to evaluate the predictive value of each of the outlined PROMs. Our complete model controls for patient sex, age, and type of arthroplasty. Categorical variables were dummy-coded. Both 1-year postoperative VAS pain score and 1-year postoperative ASES Function score were investigated as dependent variables. Regression coefficients and P and ω2 values are reported. Omega square represents how much of the variance in an outcome variable a model explains, like R2, and ω2 values can also be calculated for individual factors to see how much variance a given factor accounts for. For a simple relative risk calculation, we divided our cohort into 3 equal-sized groups based on preoperative VR-12 MCS scores and compared the risk that patients with scores in the top third (better mental health) would end up below certain ASES Total scores with the risk of patients with scores in the bottom third (worse mental health). All statistical analyses were performed with Stata (StataCorp).
Results
Table 1 lists summary statistics for the population used in these models.
Table 1.Our complete model for predicting VAS pain score 1 year after surgery accounted for 8% of the variability in this pain score (ω2 = .076), whereas our complete model for predicting ASES Function score 1 year after surgery accounted for 22% of the variability (ω2 = .219). These models include preoperative scores for VAS pain, ASES Function, VR-12 MCS, SANE, age at time of surgery, sex, and type of arthroplasty as possible explanatory variables.
Table 2.Predicting VAS Pain Score (Table 2)
Preoperative VAS pain score and VR-12 MCS score both predicted 1-year postoperative VAS pain score (P < .001). Preoperative ASES Function score did not predict pain 1 year after surgery. By contrast, higher preoperative VAS pain scores were associated with higher VAS pain scores 1 year after surgery. Higher preoperative VR-12 MCS scores were significantly associated with lower VAS pain scores 1 year after surgery, indicating that better preoperative mental health is significantly associated with better self-reported outcomes in terms of pain 1 year after surgery. These associations remained statistically significant when controlling for age at time of surgery, sex, and type of arthroplasty.
Preoperative VR-12 MCS score was more predictive of 1-year postoperative VAS pain score than preoperative VAS pain score was. In other words, preoperative VR-12 MCS score accounted for more variability in outcome for 1-year postoperative VAS pain score (2.4%; ω2 = .023) than preoperative VAS pain score did (1.6%; ω2 = .015).
Table 3.Predicting ASES Function Score (Table 3)
By contrast, preoperative VAS pain score did not predict 1-year postoperative ASES Function score. Preoperative ASES Function and VR-12 MCS scores both predicted 1-year postoperative ASES Function score (P < .001). Higher preoperative ASES Function scores were associated with higher 1-year postoperative ASES Function scores. In other words, reporting better shoulder function before surgery was associated with reporting better shoulder function after surgery.
An example gives a sense of the effect size associated with the coefficient for preoperative ASES Function score. Our model predicts that, compared with a patient who reports 5 points lower on preoperative ASES Function (which ranges from 0-30), a patient who reports 5 points higher will report on average about 1 point higher on 1-year postoperative ASES Function. As in the model for postoperative pain, these associations with preoperative function and mental health scores held when controlling for age, sex, and type of arthroplasty.
As in the postoperative pain model, preoperative VR-12 MCS score was more predictive of 1-year postoperative ASES Function score than preoperative ASES Function score was. Preoperative VR-12 MCS score accounted for more of the variation that our model predicts (ω2 = .029) than preoperative ASES Function score did (ω2 = .020). We compared the risk that patients with high preoperative VR-12 MCS scores (top third of cohort) would end up with ASES Total scores below 70, below 80, or below 90 with the risk of patients with low preoperative VR-12 MCS scores (bottom third). Results appear in Table 4.
Table 4.
A significant part of the predictive ability of our model for postoperative ASES Function scores stems from the fact that a patient who undergoes rTSA (vs TSA) is predicted to have an ASES Function score 3.8 points lower 1 year after surgery (P < .001, ω2 = .083). With type of arthroplasty controlled for, female sex is associated with an ASES Function score 1.6 points lower 1 year after surgery (P < .001, ω2 = .016).
Preoperative SANE score did not predict 1-year postoperative VAS pain score or ASES Function score. In addition, when our complete model was run with 1-year postoperative SANE score as the dependent variable, preoperative SANE score did not predict 1-year postoperative SANE score. Our data provide no supporting evidence for the use of SANE scores for predictive modeling for shoulder arthroplasty.
Discussion
We prospectively gathered data to determine which factors would predict patient subjective outcomes of primary TSA and primary rTSA. We hypothesized that preoperative VR-12 MCS scores and preoperative VAS pain scores would predict postoperative pain and function as measured with those PROMs. Second, we hypothesized that better preoperative mental health (as measured with VR-12 MCS scores) would predict lower postoperative pain (VAS pain scores) and better postoperative function (ASES Function scores). Third, we hypothesized that higher preoperative pain (VAS pain scores) would correlate with higher postoperative pain (VAS pain scores) and worse postoperative function (ASES Function scores).
Our main goal is to provide patients and surgeons with a predictive model that generates insights into what patients can expect after surgery. This model is not intended to be a screening tool for operative indications, but a clinical tool for helping set expectations.
Our results showed that patients with more pain before surgery were more likely to have more pain 1 year after surgery—confirming the hypothesized relationship between pain before and after surgery. Contrary to the hypothesis, however, degree of pain before surgery was not associated with function 1 year after surgery. Our mental health hypothesis was confirmed: Patients with better preoperative mental health scores had on average less pain and better function 1 year after surgery. Not surprisingly, our model demonstrated that patients with better self-reported function before surgery had better self-reported function after surgery. Patient-reported function before surgery did not significantly affect how much pain the patient had 1 year after surgery. Although we did not hypothesize about the role of function in predicting 1-year outcomes, function is a significant factor to be considered when setting patient expectations regarding shoulder arthroplasty outcomes (Table 5).
Table 5.
Although the effect sizes of each analyzed factor are small, together our models for 1-year postoperative pain and function provide significant insight into patients’ likely outcomes 1 year after TSA and rTSA.
Table 6.
Table 7.Table 6 and Table 7 listpreoperative PROMs and baseline characteristics for 2 sample patients and the corresponding 1-year postoperative results they should expect according to our model. Patient 1 (Table 6) achieves a theoretical ASES Total score of 67, and patient 2 (Table 7) achieves a theoretical ASES Total score of 90. During discussion of surgical options, these patients should be counseled differently. If patient 1 expects a “normal” shoulder after surgery, he or she likely will be disappointed with the outcome. Tools such as those provided here can contribute to evidence-based discussions and well-informed decision making.
Many studies have found that mental health correlated with pain and function during recovery from orthopedic trauma.12-18 For example, Wylie and colleagues19 found that preoperative mental health, as measured with the 36-Item Short Form Health Survey (SF-36) MCS score, predicted patient-reported pain and function in the setting of rotator cuff injury, regardless of treatment type (operative, nonoperative). Others have found that mental health may play a role in how patients report their pain and function on various PROMs.20,21 Modalities for improving patients’ emotional health baseline may even become a preoperative requirement as the healthcare industry moves toward value-based medicine and collection of patient-related outcomes as part of reimbursement schemes.
By contrast, some studies have found that preoperative mental health did not predict postoperative outcomes. For example, Kennedy and colleagues22 found that preoperative mental health (as measured with SF-36 MCS scores) did not predict functional outcome in patients with ankle arthritis treated with ankle arthroplasty or arthrodesis. Likewise, Styron and colleagues23 found no correlation between preoperative mental health (SF-12 MCS scores) and postoperative mental health and function in TSA. Their findings contradict those of the present study and many other studies.12-18 The contradiction in findings demonstrates the need for well-designed, sufficiently powered studies of the link between preoperative mental health and postoperative outcome. Our study, with its large sample and heterogeneous population, is a start.
Two other groups (Simmen and colleagues,18 Matsen and colleagues24) have attempted to develop a model predicting outcomes of shoulder arthroplasty. Simmen and colleagues18 estimated the probability of “treatment success” 1 year after TSA. Their model had 4 factors predictive of patient outcomes. Previous shoulder surgery and age over 75 years were significantly associated with lower probability of success, whereas higher preoperative SF-36 MCS scores and higher preoperative DASH (Disabilities of the Arm, Shoulder, and Hand) Function scores were associated with higher probability of success. The authors deemed TSA successful if the patient achieved a Constant score of ≥80 out of 100. Their model predicts probability of TSA “success,” whereas our models predict particular outcome scores. Both their results and ours support the hypothesis that preoperative mental health and function scores can predict how well a patient fares after surgery. Simmen and colleagues18 based their model on a cohort of only 140 patients and reported a 33.6% success rate (47/140 surgeries).
Matsen and colleagues24 used a 1-practice cohort of 337 patients who underwent different types of arthroplasties, including TSA, rTSA, hemiarthroplasty, and ream-and-run arthroplasty. Although their focus was not preoperative PROMs predicting postoperative PROMs, they used the Simple Shoulder Test (SST) baseline score as a predictive variable. They found that 6 baseline characteristics—American Society of Anesthesiologists class I, shoulder problem unrelated to work, no prior shoulder surgery, glenoid type other than A1, humeral head not superiorly displaced on anteroposterior radiograph, and lower baseline SST score—were statistically associated with better outcomes, and they developed a model driven by these characteristics. They urged other investigators to perform the same kind of analysis with larger patient populations from multiple practices. One of the strengths of our study is its large patient population. We collected data on 1004 patients for modeling 1-year postoperative VAS pain scores and 986 patients for modeling 1-year postoperative ASES Function scores.
Our study had several limitations. First, its data came from a 42-surgeon database, and there may be variations in how these surgeons enroll patients in the registry. If some surgeons did not enroll all their surgical patients, our sample could have been subject to selection bias. Second, in developing our model, we used only patient characteristics that were available in the database. On the other hand, the heterogeneity of the surgeon sample lended external validity to the model. A third limitation was that the model always predicts better pain and function outcomes after TSA than after rTSA. In other words, it does not consider whether TSA is appropriate for a particular patient. Instead, it predicts 1-year shoulder arthroplasty outcomes.
Our goal here is not to provide outcomes information or a surgical screening tool, but to report on our use of a simple data-driven tool for setting expectations. When appropriate data become available, tools like this should be expanded to predict longer-term shoulder arthroplasty outcomes. We need more studies that combine preoperative PROMs, more baseline clinical and patient characteristics (following the Matsen and colleagues24 model), and large sample sizes.
Conclusion
The educational models presented here can help patients and surgeons learn what to expect after surgery. These models reveal the value in collecting preoperative subjective PROMs and show how a quantitative tool can help facilitate shared decision-making and set patient expectations. Separately, the effect size of each factor is small, but together a patient’s preoperative VAS pain score, ASES Function score, VR-12 MCS score, age, sex, and type of arthroplasty can provide information predictive of the patient’s self-reported pain and function 1 year after surgery.
References
1. Stacey D, Légaré F, Col NF, et al. Decision aids for people facing health treatment or screening decisions. Cochrane Database Syst Rev. 2014;(1):CD001431.
2. Berliner JL, Brodke DJ, Chan V, SooHoo NF, Bozic KJ. Can preoperative patient-reported outcome measures be used to predict meaningful improvement in function after TKA? Clin Orthop Relat Res. 2017;475(1):149-157.
3. Berliner JL, Brodke DJ, Chan V, SooHoo NF, Bozic KJ. John Charnley award: preoperative patient-reported outcome measures predict clinically meaningful improvement in function after THA. Clin Orthop Relat Res. 2016;474(2):321-329.
4. Wong SE, Zhang AL, Berliner JL, Ma CB, Feeley BT. Preoperative patient-reported scores can predict postoperative outcomes after shoulder arthroplasty. J Shoulder Elbow Surg. 2016;25(6):913-919.
5. Werner BC, Chang B, Nguyen JT, Dines DM, Gulotta LV. What change in American Shoulder and Elbow Surgeons score represents a clinically important change after shoulder arthroplasty? Clin Orthop Relat Res. 2016;474(12):2672-2681.
7. Tashjian RZ, Hung M, Keener JD, et al. Determining the minimal clinically important difference for the American Shoulder and Elbow Surgeons score, Simple Shoulder Test, and visual analog scale (VAS) measuring pain after shoulder arthroplasty. J Shoulder Elbow Surg. 2017;26(1):144-148.
8. Michener LA, McClure PW, Sennett BJ. American Shoulder and Elbow Surgeons Standardized Shoulder Assessment Form, patient self-report section: reliability, validity, and responsiveness. J Shoulder Elbow Surg. 2002;11(6):587-594.
9. Wong SE, Zhang AL, Berliner JL, Ma CB, Feeley BT. Preoperative patient-reported scores can predict postoperative outcomes after shoulder arthroplasty. J Shoulder Elbow Surg. 2016;25(6):913-919.
10. Williams GN, Gangel TJ, Arciero RA, Uhorchak JM, Taylor DC. Comparison of the Single Assessment Numeric Evaluation method and two shoulder rating scales. Outcomes measures after shoulder surgery. Am J Sports Med. 1999;27(2):214-221.
11. Selim AJ, Rogers W, Fleishman JA, et al. Updated U.S. population standard for the Veterans RAND 12-Item Health Survey (VR-12). Qual Life Res. 2009;18(1):43-52.
12. Ayers DC, Franklin PD, Ploutz-Snyder R, Boisvert CB. Total knee replacement outcome and coexisting physical and emotional illness. Clin Orthop Relat Res. 2005;(440):157-161.
13. Ayers DC, Franklin PD, Trief PM, Ploutz-Snyder R, Freund D. Psychological attributes of preoperative total joint replacement patients: implications for optimal physical outcome. J Arthroplasty. 2004;19(7 suppl 2):125-130.
14. Barlow JD, Bishop JY, Dunn WR, Kuhn JE; MOON Shoulder Group. What factors are predictors of emotional health in patients with full-thickness rotator cuff tears? J Shoulder Elbow Surg. 2016;25(11):1769-1773.
15. Gandhi R, Davey JR, Mahomed NN. Predicting patient dissatisfaction following joint replacement surgery. J Rheumatol. 2008;35(12):2415-2418.
16. Parr J, Borsa P, Fillingim R, et al. Psychological influences predict recovery following exercise induced shoulder pain. Int J Sports Med. 2014;35(3):232-237.
18. Simmen BR, Bachmann LM, Drerup S, Schwyzer HK, Burkhart A, Goldhahn J. Development of a predictive model for estimating the probability of treatment success one year after total shoulder replacement—cohort study. Osteoarthritis Cartilage. 2008;16(5):631-634.
19. Wylie JD, Suter T, Potter MQ, Granger EK, Tashjian RZ. Mental health has a stronger association with patient-reported shoulder pain and function than tear size in patients with full-thickness rotator cuff tears. J Bone Joint Surg Am. 2016;98(4):251-256.
20. Potter MQ, Wylie JD, Greis PE, Burks RT, Tashjian RZ. Psychological distress negatively affects self-assessment of shoulder function in patients with rotator cuff tears. Clin Orthop Relat Res. 2014;472(12):3926-3932.
21. Roh YH, Noh JH, Oh JH, Baek GH, Gong HS. To what degree do shoulder outcome instruments reflect patients’ psychologic distress? Clin Orthop Relat Res. 2012;470(12):3470-3477.
22. Kennedy S, Barske H, Wing K, et al. SF-36 mental component summary (MCS) score does not predict functional outcome after surgery for end-stage ankle arthritis. J Bone Joint Surg Am. 2015;97(20):1702-1707.
23. Styron JF, Higuera CA, Strnad G, Iannotti JP. Greater patient confidence yields greater functional outcomes after primary total shoulder arthroplasty. J Shoulder Elbow Surg. 2015;24(8):1263-1267.
24. Matsen FA, Russ SM, Vu PT, Hsu JE, Lucas RM, Comstock BA. What factors are predictive of patient-reported outcomes? A prospective study of 337 shoulder arthroplasties. Clin Orthop Relat Res. 2016;474(11):2496-2510.
Shared decision-making tools, such as predictive models, can help empower the patient to make decisions for or against surgery equipped with more information about the expected outcome.
There is a role for preoperative collection of PROMs in the clinical decision-making process.
Mental health state, as reported by the VR-12 MCS, is a significant predictor of postoperative pain and function as reported by the VAS pain and ASES function scores.
A significant portion of the predictive ability of this model comes from the fact that at 1-year postoperatively, patients receiving a rTSA will on average have a 3.8 point lower on ASES function score than those receiving a TSA (P < .001, ω2=.083).
Future studies to discern the role of different modalities to improve a patient’s emotional health preoperatively will be beneficial as the healthcare industry trends toward value based medicine collecting PROMs as part of reimbursement schemes.
Over the past few decades, decisions regarding patients’ care have gradually transitioned from a paternalistic model to a more cooperative exchange between patient and physician. Shared decision-making provides patients a measure of autonomy in making choices for their health and their future. Patient participation may mitigate uncertainty and discomfort during selection of a course of treatment, which may lead to increased satisfaction levels after surgery.1 Moreover, shared decision-making may help patients better manage postoperative expectations through evidenced-based discussions of preoperative health levels and their corresponding outcomes. Patient-reported outcome measures (PROMs) use clinically sensitive and specific metrics to evaluate a patient’s self-reported pain, functional ability, and mental state.2 These metrics are useful in setting patient expectations for potential outcomes of treatment options. Use of evidence-based clinical decision-making tools, such as PROM-based predictive models, can facilitate a collaborative decision-making environment for patient and physician. Given the present cost-containment era, and the need for preoperative metrics that can assist in predictive analysis of postoperative improvement, models are clearly valuable.
In attempts to help patients set well-informed and reasonable expectations, physicians have turned to PROMs to facilitate preoperative evidence-based discussions. Although PROMs have been in use for almost 30 years, only recently have they been used to create tools that can aid quantitatively in the surgical decision-making process.2-6 Combining physical examination findings, imaging studies, comorbidities, and quantitative tools, such as this model, may enhance patients’ understanding of their preoperative condition and expected prognosis and thereby guide their surgical decisions.
We conducted a study to determine whether certain preoperative PROMs can predict 1-year postoperative visual analog scale (VAS) pain scores and American Shoulder and Elbow Surgeons (ASES) Function scores in total shoulder arthroplasty (TSA) and reverse TSA (rTSA). We hypothesized that preoperative mental health status as captured by Veterans RAND 12-Item Health Survey (VR-12) mental health component summary (MCS) score and preoperative VAS pain score would predict both VAS pain score and ASES Function score 1 year after surgery. Specifically, we hypothesized that a higher preoperative VR-12 MCS score would predict less pain and better function 1 year after surgery and that a higher preoperative VAS pain score would predict more pain and worse function 1 year after surgery.
Methods
This study was approved by the Institutional Review Board of Partners Healthcare. The study used the Surgical Outcome System (Arthrex), a comprehensive prospective database that stores preoperative and 1-year postoperative patient demographics and TSA-PROM data. Surveys are emailed to all enrolled patients before surgery and 1 year after surgery. As indicated by the Institutional Review Boards of all participating institutions, patients in the Surgical Outcome System have to sign a consent form to permit use of their responses in research.
The database includes patient data from 42 orthopedic surgeons across the United States. All primary TSAs and primary rTSAs in the database were included in this study, regardless of arthroplasty indication. Revisions were excluded. Also excluded were cases in which the 1-year postoperative questionnaire was not completed. Of the 1681 patients eligible for 1-year follow-up, 1225 (73%) completed the 1-year postoperative questionnaire. PROMs used in the study were VAS pain score, ASES Function score, VR-12 MCS score, and Single Assessment Numerical Evaluation (SANE). Unfortunately, not all surgeons use every measure in the 1-year postoperative questionnaire set. Thus, in our complete models, total number of observations was 1004 for modeling 1-year postoperative VAS pain scores and 986 for modeling 1-year postoperative ASES Function scores.
Metrics
On VAS, pain is rated from 0 (no pain) to 10 (pain as bad as it can be). Tashjian and colleagues7 estimated that the minimal clinically important difference (MCID) for postoperative VAS pain scores was 1.4 in a cohort of 326 patients who had TSA, rTSA, or shoulder hemiarthroplasty. ASES Function score is scaled from 0 to 30, with 30 representing best function.8 Wong and colleagues9 identified an MCID of 6.5 for ASES Function scores in a cohort of 107 patients who had TSA or rTSA. SANE ratings range from 0% to 100%, with 100% indicating the patient’s shoulder was totally “normal.”10 VR-12 MCS scores appear on a logarithmic scale, with higher numbers representing better mental health. The population mean estimate for VR-12 MCS scores is 50.1 (SD, 11.49; overall possible range, –2.47 to 76.1).11 Our patient population’s scores ranged from 12.5 to 73.8.
Statistical Analysis
Simple bivariate and multivariate linear regressions were performed to evaluate the predictive value of each of the outlined PROMs. Our complete model controls for patient sex, age, and type of arthroplasty. Categorical variables were dummy-coded. Both 1-year postoperative VAS pain score and 1-year postoperative ASES Function score were investigated as dependent variables. Regression coefficients and P and ω2 values are reported. Omega square represents how much of the variance in an outcome variable a model explains, like R2, and ω2 values can also be calculated for individual factors to see how much variance a given factor accounts for. For a simple relative risk calculation, we divided our cohort into 3 equal-sized groups based on preoperative VR-12 MCS scores and compared the risk that patients with scores in the top third (better mental health) would end up below certain ASES Total scores with the risk of patients with scores in the bottom third (worse mental health). All statistical analyses were performed with Stata (StataCorp).
Results
Table 1 lists summary statistics for the population used in these models.
Table 1.Our complete model for predicting VAS pain score 1 year after surgery accounted for 8% of the variability in this pain score (ω2 = .076), whereas our complete model for predicting ASES Function score 1 year after surgery accounted for 22% of the variability (ω2 = .219). These models include preoperative scores for VAS pain, ASES Function, VR-12 MCS, SANE, age at time of surgery, sex, and type of arthroplasty as possible explanatory variables.
Table 2.Predicting VAS Pain Score (Table 2)
Preoperative VAS pain score and VR-12 MCS score both predicted 1-year postoperative VAS pain score (P < .001). Preoperative ASES Function score did not predict pain 1 year after surgery. By contrast, higher preoperative VAS pain scores were associated with higher VAS pain scores 1 year after surgery. Higher preoperative VR-12 MCS scores were significantly associated with lower VAS pain scores 1 year after surgery, indicating that better preoperative mental health is significantly associated with better self-reported outcomes in terms of pain 1 year after surgery. These associations remained statistically significant when controlling for age at time of surgery, sex, and type of arthroplasty.
Preoperative VR-12 MCS score was more predictive of 1-year postoperative VAS pain score than preoperative VAS pain score was. In other words, preoperative VR-12 MCS score accounted for more variability in outcome for 1-year postoperative VAS pain score (2.4%; ω2 = .023) than preoperative VAS pain score did (1.6%; ω2 = .015).
Table 3.Predicting ASES Function Score (Table 3)
By contrast, preoperative VAS pain score did not predict 1-year postoperative ASES Function score. Preoperative ASES Function and VR-12 MCS scores both predicted 1-year postoperative ASES Function score (P < .001). Higher preoperative ASES Function scores were associated with higher 1-year postoperative ASES Function scores. In other words, reporting better shoulder function before surgery was associated with reporting better shoulder function after surgery.
An example gives a sense of the effect size associated with the coefficient for preoperative ASES Function score. Our model predicts that, compared with a patient who reports 5 points lower on preoperative ASES Function (which ranges from 0-30), a patient who reports 5 points higher will report on average about 1 point higher on 1-year postoperative ASES Function. As in the model for postoperative pain, these associations with preoperative function and mental health scores held when controlling for age, sex, and type of arthroplasty.
As in the postoperative pain model, preoperative VR-12 MCS score was more predictive of 1-year postoperative ASES Function score than preoperative ASES Function score was. Preoperative VR-12 MCS score accounted for more of the variation that our model predicts (ω2 = .029) than preoperative ASES Function score did (ω2 = .020). We compared the risk that patients with high preoperative VR-12 MCS scores (top third of cohort) would end up with ASES Total scores below 70, below 80, or below 90 with the risk of patients with low preoperative VR-12 MCS scores (bottom third). Results appear in Table 4.
Table 4.
A significant part of the predictive ability of our model for postoperative ASES Function scores stems from the fact that a patient who undergoes rTSA (vs TSA) is predicted to have an ASES Function score 3.8 points lower 1 year after surgery (P < .001, ω2 = .083). With type of arthroplasty controlled for, female sex is associated with an ASES Function score 1.6 points lower 1 year after surgery (P < .001, ω2 = .016).
Preoperative SANE score did not predict 1-year postoperative VAS pain score or ASES Function score. In addition, when our complete model was run with 1-year postoperative SANE score as the dependent variable, preoperative SANE score did not predict 1-year postoperative SANE score. Our data provide no supporting evidence for the use of SANE scores for predictive modeling for shoulder arthroplasty.
Discussion
We prospectively gathered data to determine which factors would predict patient subjective outcomes of primary TSA and primary rTSA. We hypothesized that preoperative VR-12 MCS scores and preoperative VAS pain scores would predict postoperative pain and function as measured with those PROMs. Second, we hypothesized that better preoperative mental health (as measured with VR-12 MCS scores) would predict lower postoperative pain (VAS pain scores) and better postoperative function (ASES Function scores). Third, we hypothesized that higher preoperative pain (VAS pain scores) would correlate with higher postoperative pain (VAS pain scores) and worse postoperative function (ASES Function scores).
Our main goal is to provide patients and surgeons with a predictive model that generates insights into what patients can expect after surgery. This model is not intended to be a screening tool for operative indications, but a clinical tool for helping set expectations.
Our results showed that patients with more pain before surgery were more likely to have more pain 1 year after surgery—confirming the hypothesized relationship between pain before and after surgery. Contrary to the hypothesis, however, degree of pain before surgery was not associated with function 1 year after surgery. Our mental health hypothesis was confirmed: Patients with better preoperative mental health scores had on average less pain and better function 1 year after surgery. Not surprisingly, our model demonstrated that patients with better self-reported function before surgery had better self-reported function after surgery. Patient-reported function before surgery did not significantly affect how much pain the patient had 1 year after surgery. Although we did not hypothesize about the role of function in predicting 1-year outcomes, function is a significant factor to be considered when setting patient expectations regarding shoulder arthroplasty outcomes (Table 5).
Table 5.
Although the effect sizes of each analyzed factor are small, together our models for 1-year postoperative pain and function provide significant insight into patients’ likely outcomes 1 year after TSA and rTSA.
Table 6.
Table 7.Table 6 and Table 7 listpreoperative PROMs and baseline characteristics for 2 sample patients and the corresponding 1-year postoperative results they should expect according to our model. Patient 1 (Table 6) achieves a theoretical ASES Total score of 67, and patient 2 (Table 7) achieves a theoretical ASES Total score of 90. During discussion of surgical options, these patients should be counseled differently. If patient 1 expects a “normal” shoulder after surgery, he or she likely will be disappointed with the outcome. Tools such as those provided here can contribute to evidence-based discussions and well-informed decision making.
Many studies have found that mental health correlated with pain and function during recovery from orthopedic trauma.12-18 For example, Wylie and colleagues19 found that preoperative mental health, as measured with the 36-Item Short Form Health Survey (SF-36) MCS score, predicted patient-reported pain and function in the setting of rotator cuff injury, regardless of treatment type (operative, nonoperative). Others have found that mental health may play a role in how patients report their pain and function on various PROMs.20,21 Modalities for improving patients’ emotional health baseline may even become a preoperative requirement as the healthcare industry moves toward value-based medicine and collection of patient-related outcomes as part of reimbursement schemes.
By contrast, some studies have found that preoperative mental health did not predict postoperative outcomes. For example, Kennedy and colleagues22 found that preoperative mental health (as measured with SF-36 MCS scores) did not predict functional outcome in patients with ankle arthritis treated with ankle arthroplasty or arthrodesis. Likewise, Styron and colleagues23 found no correlation between preoperative mental health (SF-12 MCS scores) and postoperative mental health and function in TSA. Their findings contradict those of the present study and many other studies.12-18 The contradiction in findings demonstrates the need for well-designed, sufficiently powered studies of the link between preoperative mental health and postoperative outcome. Our study, with its large sample and heterogeneous population, is a start.
Two other groups (Simmen and colleagues,18 Matsen and colleagues24) have attempted to develop a model predicting outcomes of shoulder arthroplasty. Simmen and colleagues18 estimated the probability of “treatment success” 1 year after TSA. Their model had 4 factors predictive of patient outcomes. Previous shoulder surgery and age over 75 years were significantly associated with lower probability of success, whereas higher preoperative SF-36 MCS scores and higher preoperative DASH (Disabilities of the Arm, Shoulder, and Hand) Function scores were associated with higher probability of success. The authors deemed TSA successful if the patient achieved a Constant score of ≥80 out of 100. Their model predicts probability of TSA “success,” whereas our models predict particular outcome scores. Both their results and ours support the hypothesis that preoperative mental health and function scores can predict how well a patient fares after surgery. Simmen and colleagues18 based their model on a cohort of only 140 patients and reported a 33.6% success rate (47/140 surgeries).
Matsen and colleagues24 used a 1-practice cohort of 337 patients who underwent different types of arthroplasties, including TSA, rTSA, hemiarthroplasty, and ream-and-run arthroplasty. Although their focus was not preoperative PROMs predicting postoperative PROMs, they used the Simple Shoulder Test (SST) baseline score as a predictive variable. They found that 6 baseline characteristics—American Society of Anesthesiologists class I, shoulder problem unrelated to work, no prior shoulder surgery, glenoid type other than A1, humeral head not superiorly displaced on anteroposterior radiograph, and lower baseline SST score—were statistically associated with better outcomes, and they developed a model driven by these characteristics. They urged other investigators to perform the same kind of analysis with larger patient populations from multiple practices. One of the strengths of our study is its large patient population. We collected data on 1004 patients for modeling 1-year postoperative VAS pain scores and 986 patients for modeling 1-year postoperative ASES Function scores.
Our study had several limitations. First, its data came from a 42-surgeon database, and there may be variations in how these surgeons enroll patients in the registry. If some surgeons did not enroll all their surgical patients, our sample could have been subject to selection bias. Second, in developing our model, we used only patient characteristics that were available in the database. On the other hand, the heterogeneity of the surgeon sample lended external validity to the model. A third limitation was that the model always predicts better pain and function outcomes after TSA than after rTSA. In other words, it does not consider whether TSA is appropriate for a particular patient. Instead, it predicts 1-year shoulder arthroplasty outcomes.
Our goal here is not to provide outcomes information or a surgical screening tool, but to report on our use of a simple data-driven tool for setting expectations. When appropriate data become available, tools like this should be expanded to predict longer-term shoulder arthroplasty outcomes. We need more studies that combine preoperative PROMs, more baseline clinical and patient characteristics (following the Matsen and colleagues24 model), and large sample sizes.
Conclusion
The educational models presented here can help patients and surgeons learn what to expect after surgery. These models reveal the value in collecting preoperative subjective PROMs and show how a quantitative tool can help facilitate shared decision-making and set patient expectations. Separately, the effect size of each factor is small, but together a patient’s preoperative VAS pain score, ASES Function score, VR-12 MCS score, age, sex, and type of arthroplasty can provide information predictive of the patient’s self-reported pain and function 1 year after surgery.
Take-Home Points
Shared decision-making tools, such as predictive models, can help empower the patient to make decisions for or against surgery equipped with more information about the expected outcome.
There is a role for preoperative collection of PROMs in the clinical decision-making process.
Mental health state, as reported by the VR-12 MCS, is a significant predictor of postoperative pain and function as reported by the VAS pain and ASES function scores.
A significant portion of the predictive ability of this model comes from the fact that at 1-year postoperatively, patients receiving a rTSA will on average have a 3.8 point lower on ASES function score than those receiving a TSA (P < .001, ω2=.083).
Future studies to discern the role of different modalities to improve a patient’s emotional health preoperatively will be beneficial as the healthcare industry trends toward value based medicine collecting PROMs as part of reimbursement schemes.
Over the past few decades, decisions regarding patients’ care have gradually transitioned from a paternalistic model to a more cooperative exchange between patient and physician. Shared decision-making provides patients a measure of autonomy in making choices for their health and their future. Patient participation may mitigate uncertainty and discomfort during selection of a course of treatment, which may lead to increased satisfaction levels after surgery.1 Moreover, shared decision-making may help patients better manage postoperative expectations through evidenced-based discussions of preoperative health levels and their corresponding outcomes. Patient-reported outcome measures (PROMs) use clinically sensitive and specific metrics to evaluate a patient’s self-reported pain, functional ability, and mental state.2 These metrics are useful in setting patient expectations for potential outcomes of treatment options. Use of evidence-based clinical decision-making tools, such as PROM-based predictive models, can facilitate a collaborative decision-making environment for patient and physician. Given the present cost-containment era, and the need for preoperative metrics that can assist in predictive analysis of postoperative improvement, models are clearly valuable.
In attempts to help patients set well-informed and reasonable expectations, physicians have turned to PROMs to facilitate preoperative evidence-based discussions. Although PROMs have been in use for almost 30 years, only recently have they been used to create tools that can aid quantitatively in the surgical decision-making process.2-6 Combining physical examination findings, imaging studies, comorbidities, and quantitative tools, such as this model, may enhance patients’ understanding of their preoperative condition and expected prognosis and thereby guide their surgical decisions.
We conducted a study to determine whether certain preoperative PROMs can predict 1-year postoperative visual analog scale (VAS) pain scores and American Shoulder and Elbow Surgeons (ASES) Function scores in total shoulder arthroplasty (TSA) and reverse TSA (rTSA). We hypothesized that preoperative mental health status as captured by Veterans RAND 12-Item Health Survey (VR-12) mental health component summary (MCS) score and preoperative VAS pain score would predict both VAS pain score and ASES Function score 1 year after surgery. Specifically, we hypothesized that a higher preoperative VR-12 MCS score would predict less pain and better function 1 year after surgery and that a higher preoperative VAS pain score would predict more pain and worse function 1 year after surgery.
Methods
This study was approved by the Institutional Review Board of Partners Healthcare. The study used the Surgical Outcome System (Arthrex), a comprehensive prospective database that stores preoperative and 1-year postoperative patient demographics and TSA-PROM data. Surveys are emailed to all enrolled patients before surgery and 1 year after surgery. As indicated by the Institutional Review Boards of all participating institutions, patients in the Surgical Outcome System have to sign a consent form to permit use of their responses in research.
The database includes patient data from 42 orthopedic surgeons across the United States. All primary TSAs and primary rTSAs in the database were included in this study, regardless of arthroplasty indication. Revisions were excluded. Also excluded were cases in which the 1-year postoperative questionnaire was not completed. Of the 1681 patients eligible for 1-year follow-up, 1225 (73%) completed the 1-year postoperative questionnaire. PROMs used in the study were VAS pain score, ASES Function score, VR-12 MCS score, and Single Assessment Numerical Evaluation (SANE). Unfortunately, not all surgeons use every measure in the 1-year postoperative questionnaire set. Thus, in our complete models, total number of observations was 1004 for modeling 1-year postoperative VAS pain scores and 986 for modeling 1-year postoperative ASES Function scores.
Metrics
On VAS, pain is rated from 0 (no pain) to 10 (pain as bad as it can be). Tashjian and colleagues7 estimated that the minimal clinically important difference (MCID) for postoperative VAS pain scores was 1.4 in a cohort of 326 patients who had TSA, rTSA, or shoulder hemiarthroplasty. ASES Function score is scaled from 0 to 30, with 30 representing best function.8 Wong and colleagues9 identified an MCID of 6.5 for ASES Function scores in a cohort of 107 patients who had TSA or rTSA. SANE ratings range from 0% to 100%, with 100% indicating the patient’s shoulder was totally “normal.”10 VR-12 MCS scores appear on a logarithmic scale, with higher numbers representing better mental health. The population mean estimate for VR-12 MCS scores is 50.1 (SD, 11.49; overall possible range, –2.47 to 76.1).11 Our patient population’s scores ranged from 12.5 to 73.8.
Statistical Analysis
Simple bivariate and multivariate linear regressions were performed to evaluate the predictive value of each of the outlined PROMs. Our complete model controls for patient sex, age, and type of arthroplasty. Categorical variables were dummy-coded. Both 1-year postoperative VAS pain score and 1-year postoperative ASES Function score were investigated as dependent variables. Regression coefficients and P and ω2 values are reported. Omega square represents how much of the variance in an outcome variable a model explains, like R2, and ω2 values can also be calculated for individual factors to see how much variance a given factor accounts for. For a simple relative risk calculation, we divided our cohort into 3 equal-sized groups based on preoperative VR-12 MCS scores and compared the risk that patients with scores in the top third (better mental health) would end up below certain ASES Total scores with the risk of patients with scores in the bottom third (worse mental health). All statistical analyses were performed with Stata (StataCorp).
Results
Table 1 lists summary statistics for the population used in these models.
Table 1.Our complete model for predicting VAS pain score 1 year after surgery accounted for 8% of the variability in this pain score (ω2 = .076), whereas our complete model for predicting ASES Function score 1 year after surgery accounted for 22% of the variability (ω2 = .219). These models include preoperative scores for VAS pain, ASES Function, VR-12 MCS, SANE, age at time of surgery, sex, and type of arthroplasty as possible explanatory variables.
Table 2.Predicting VAS Pain Score (Table 2)
Preoperative VAS pain score and VR-12 MCS score both predicted 1-year postoperative VAS pain score (P < .001). Preoperative ASES Function score did not predict pain 1 year after surgery. By contrast, higher preoperative VAS pain scores were associated with higher VAS pain scores 1 year after surgery. Higher preoperative VR-12 MCS scores were significantly associated with lower VAS pain scores 1 year after surgery, indicating that better preoperative mental health is significantly associated with better self-reported outcomes in terms of pain 1 year after surgery. These associations remained statistically significant when controlling for age at time of surgery, sex, and type of arthroplasty.
Preoperative VR-12 MCS score was more predictive of 1-year postoperative VAS pain score than preoperative VAS pain score was. In other words, preoperative VR-12 MCS score accounted for more variability in outcome for 1-year postoperative VAS pain score (2.4%; ω2 = .023) than preoperative VAS pain score did (1.6%; ω2 = .015).
Table 3.Predicting ASES Function Score (Table 3)
By contrast, preoperative VAS pain score did not predict 1-year postoperative ASES Function score. Preoperative ASES Function and VR-12 MCS scores both predicted 1-year postoperative ASES Function score (P < .001). Higher preoperative ASES Function scores were associated with higher 1-year postoperative ASES Function scores. In other words, reporting better shoulder function before surgery was associated with reporting better shoulder function after surgery.
An example gives a sense of the effect size associated with the coefficient for preoperative ASES Function score. Our model predicts that, compared with a patient who reports 5 points lower on preoperative ASES Function (which ranges from 0-30), a patient who reports 5 points higher will report on average about 1 point higher on 1-year postoperative ASES Function. As in the model for postoperative pain, these associations with preoperative function and mental health scores held when controlling for age, sex, and type of arthroplasty.
As in the postoperative pain model, preoperative VR-12 MCS score was more predictive of 1-year postoperative ASES Function score than preoperative ASES Function score was. Preoperative VR-12 MCS score accounted for more of the variation that our model predicts (ω2 = .029) than preoperative ASES Function score did (ω2 = .020). We compared the risk that patients with high preoperative VR-12 MCS scores (top third of cohort) would end up with ASES Total scores below 70, below 80, or below 90 with the risk of patients with low preoperative VR-12 MCS scores (bottom third). Results appear in Table 4.
Table 4.
A significant part of the predictive ability of our model for postoperative ASES Function scores stems from the fact that a patient who undergoes rTSA (vs TSA) is predicted to have an ASES Function score 3.8 points lower 1 year after surgery (P < .001, ω2 = .083). With type of arthroplasty controlled for, female sex is associated with an ASES Function score 1.6 points lower 1 year after surgery (P < .001, ω2 = .016).
Preoperative SANE score did not predict 1-year postoperative VAS pain score or ASES Function score. In addition, when our complete model was run with 1-year postoperative SANE score as the dependent variable, preoperative SANE score did not predict 1-year postoperative SANE score. Our data provide no supporting evidence for the use of SANE scores for predictive modeling for shoulder arthroplasty.
Discussion
We prospectively gathered data to determine which factors would predict patient subjective outcomes of primary TSA and primary rTSA. We hypothesized that preoperative VR-12 MCS scores and preoperative VAS pain scores would predict postoperative pain and function as measured with those PROMs. Second, we hypothesized that better preoperative mental health (as measured with VR-12 MCS scores) would predict lower postoperative pain (VAS pain scores) and better postoperative function (ASES Function scores). Third, we hypothesized that higher preoperative pain (VAS pain scores) would correlate with higher postoperative pain (VAS pain scores) and worse postoperative function (ASES Function scores).
Our main goal is to provide patients and surgeons with a predictive model that generates insights into what patients can expect after surgery. This model is not intended to be a screening tool for operative indications, but a clinical tool for helping set expectations.
Our results showed that patients with more pain before surgery were more likely to have more pain 1 year after surgery—confirming the hypothesized relationship between pain before and after surgery. Contrary to the hypothesis, however, degree of pain before surgery was not associated with function 1 year after surgery. Our mental health hypothesis was confirmed: Patients with better preoperative mental health scores had on average less pain and better function 1 year after surgery. Not surprisingly, our model demonstrated that patients with better self-reported function before surgery had better self-reported function after surgery. Patient-reported function before surgery did not significantly affect how much pain the patient had 1 year after surgery. Although we did not hypothesize about the role of function in predicting 1-year outcomes, function is a significant factor to be considered when setting patient expectations regarding shoulder arthroplasty outcomes (Table 5).
Table 5.
Although the effect sizes of each analyzed factor are small, together our models for 1-year postoperative pain and function provide significant insight into patients’ likely outcomes 1 year after TSA and rTSA.
Table 6.
Table 7.Table 6 and Table 7 listpreoperative PROMs and baseline characteristics for 2 sample patients and the corresponding 1-year postoperative results they should expect according to our model. Patient 1 (Table 6) achieves a theoretical ASES Total score of 67, and patient 2 (Table 7) achieves a theoretical ASES Total score of 90. During discussion of surgical options, these patients should be counseled differently. If patient 1 expects a “normal” shoulder after surgery, he or she likely will be disappointed with the outcome. Tools such as those provided here can contribute to evidence-based discussions and well-informed decision making.
Many studies have found that mental health correlated with pain and function during recovery from orthopedic trauma.12-18 For example, Wylie and colleagues19 found that preoperative mental health, as measured with the 36-Item Short Form Health Survey (SF-36) MCS score, predicted patient-reported pain and function in the setting of rotator cuff injury, regardless of treatment type (operative, nonoperative). Others have found that mental health may play a role in how patients report their pain and function on various PROMs.20,21 Modalities for improving patients’ emotional health baseline may even become a preoperative requirement as the healthcare industry moves toward value-based medicine and collection of patient-related outcomes as part of reimbursement schemes.
By contrast, some studies have found that preoperative mental health did not predict postoperative outcomes. For example, Kennedy and colleagues22 found that preoperative mental health (as measured with SF-36 MCS scores) did not predict functional outcome in patients with ankle arthritis treated with ankle arthroplasty or arthrodesis. Likewise, Styron and colleagues23 found no correlation between preoperative mental health (SF-12 MCS scores) and postoperative mental health and function in TSA. Their findings contradict those of the present study and many other studies.12-18 The contradiction in findings demonstrates the need for well-designed, sufficiently powered studies of the link between preoperative mental health and postoperative outcome. Our study, with its large sample and heterogeneous population, is a start.
Two other groups (Simmen and colleagues,18 Matsen and colleagues24) have attempted to develop a model predicting outcomes of shoulder arthroplasty. Simmen and colleagues18 estimated the probability of “treatment success” 1 year after TSA. Their model had 4 factors predictive of patient outcomes. Previous shoulder surgery and age over 75 years were significantly associated with lower probability of success, whereas higher preoperative SF-36 MCS scores and higher preoperative DASH (Disabilities of the Arm, Shoulder, and Hand) Function scores were associated with higher probability of success. The authors deemed TSA successful if the patient achieved a Constant score of ≥80 out of 100. Their model predicts probability of TSA “success,” whereas our models predict particular outcome scores. Both their results and ours support the hypothesis that preoperative mental health and function scores can predict how well a patient fares after surgery. Simmen and colleagues18 based their model on a cohort of only 140 patients and reported a 33.6% success rate (47/140 surgeries).
Matsen and colleagues24 used a 1-practice cohort of 337 patients who underwent different types of arthroplasties, including TSA, rTSA, hemiarthroplasty, and ream-and-run arthroplasty. Although their focus was not preoperative PROMs predicting postoperative PROMs, they used the Simple Shoulder Test (SST) baseline score as a predictive variable. They found that 6 baseline characteristics—American Society of Anesthesiologists class I, shoulder problem unrelated to work, no prior shoulder surgery, glenoid type other than A1, humeral head not superiorly displaced on anteroposterior radiograph, and lower baseline SST score—were statistically associated with better outcomes, and they developed a model driven by these characteristics. They urged other investigators to perform the same kind of analysis with larger patient populations from multiple practices. One of the strengths of our study is its large patient population. We collected data on 1004 patients for modeling 1-year postoperative VAS pain scores and 986 patients for modeling 1-year postoperative ASES Function scores.
Our study had several limitations. First, its data came from a 42-surgeon database, and there may be variations in how these surgeons enroll patients in the registry. If some surgeons did not enroll all their surgical patients, our sample could have been subject to selection bias. Second, in developing our model, we used only patient characteristics that were available in the database. On the other hand, the heterogeneity of the surgeon sample lended external validity to the model. A third limitation was that the model always predicts better pain and function outcomes after TSA than after rTSA. In other words, it does not consider whether TSA is appropriate for a particular patient. Instead, it predicts 1-year shoulder arthroplasty outcomes.
Our goal here is not to provide outcomes information or a surgical screening tool, but to report on our use of a simple data-driven tool for setting expectations. When appropriate data become available, tools like this should be expanded to predict longer-term shoulder arthroplasty outcomes. We need more studies that combine preoperative PROMs, more baseline clinical and patient characteristics (following the Matsen and colleagues24 model), and large sample sizes.
Conclusion
The educational models presented here can help patients and surgeons learn what to expect after surgery. These models reveal the value in collecting preoperative subjective PROMs and show how a quantitative tool can help facilitate shared decision-making and set patient expectations. Separately, the effect size of each factor is small, but together a patient’s preoperative VAS pain score, ASES Function score, VR-12 MCS score, age, sex, and type of arthroplasty can provide information predictive of the patient’s self-reported pain and function 1 year after surgery.
References
1. Stacey D, Légaré F, Col NF, et al. Decision aids for people facing health treatment or screening decisions. Cochrane Database Syst Rev. 2014;(1):CD001431.
2. Berliner JL, Brodke DJ, Chan V, SooHoo NF, Bozic KJ. Can preoperative patient-reported outcome measures be used to predict meaningful improvement in function after TKA? Clin Orthop Relat Res. 2017;475(1):149-157.
3. Berliner JL, Brodke DJ, Chan V, SooHoo NF, Bozic KJ. John Charnley award: preoperative patient-reported outcome measures predict clinically meaningful improvement in function after THA. Clin Orthop Relat Res. 2016;474(2):321-329.
4. Wong SE, Zhang AL, Berliner JL, Ma CB, Feeley BT. Preoperative patient-reported scores can predict postoperative outcomes after shoulder arthroplasty. J Shoulder Elbow Surg. 2016;25(6):913-919.
5. Werner BC, Chang B, Nguyen JT, Dines DM, Gulotta LV. What change in American Shoulder and Elbow Surgeons score represents a clinically important change after shoulder arthroplasty? Clin Orthop Relat Res. 2016;474(12):2672-2681.
7. Tashjian RZ, Hung M, Keener JD, et al. Determining the minimal clinically important difference for the American Shoulder and Elbow Surgeons score, Simple Shoulder Test, and visual analog scale (VAS) measuring pain after shoulder arthroplasty. J Shoulder Elbow Surg. 2017;26(1):144-148.
8. Michener LA, McClure PW, Sennett BJ. American Shoulder and Elbow Surgeons Standardized Shoulder Assessment Form, patient self-report section: reliability, validity, and responsiveness. J Shoulder Elbow Surg. 2002;11(6):587-594.
9. Wong SE, Zhang AL, Berliner JL, Ma CB, Feeley BT. Preoperative patient-reported scores can predict postoperative outcomes after shoulder arthroplasty. J Shoulder Elbow Surg. 2016;25(6):913-919.
10. Williams GN, Gangel TJ, Arciero RA, Uhorchak JM, Taylor DC. Comparison of the Single Assessment Numeric Evaluation method and two shoulder rating scales. Outcomes measures after shoulder surgery. Am J Sports Med. 1999;27(2):214-221.
11. Selim AJ, Rogers W, Fleishman JA, et al. Updated U.S. population standard for the Veterans RAND 12-Item Health Survey (VR-12). Qual Life Res. 2009;18(1):43-52.
12. Ayers DC, Franklin PD, Ploutz-Snyder R, Boisvert CB. Total knee replacement outcome and coexisting physical and emotional illness. Clin Orthop Relat Res. 2005;(440):157-161.
13. Ayers DC, Franklin PD, Trief PM, Ploutz-Snyder R, Freund D. Psychological attributes of preoperative total joint replacement patients: implications for optimal physical outcome. J Arthroplasty. 2004;19(7 suppl 2):125-130.
14. Barlow JD, Bishop JY, Dunn WR, Kuhn JE; MOON Shoulder Group. What factors are predictors of emotional health in patients with full-thickness rotator cuff tears? J Shoulder Elbow Surg. 2016;25(11):1769-1773.
15. Gandhi R, Davey JR, Mahomed NN. Predicting patient dissatisfaction following joint replacement surgery. J Rheumatol. 2008;35(12):2415-2418.
16. Parr J, Borsa P, Fillingim R, et al. Psychological influences predict recovery following exercise induced shoulder pain. Int J Sports Med. 2014;35(3):232-237.
18. Simmen BR, Bachmann LM, Drerup S, Schwyzer HK, Burkhart A, Goldhahn J. Development of a predictive model for estimating the probability of treatment success one year after total shoulder replacement—cohort study. Osteoarthritis Cartilage. 2008;16(5):631-634.
19. Wylie JD, Suter T, Potter MQ, Granger EK, Tashjian RZ. Mental health has a stronger association with patient-reported shoulder pain and function than tear size in patients with full-thickness rotator cuff tears. J Bone Joint Surg Am. 2016;98(4):251-256.
20. Potter MQ, Wylie JD, Greis PE, Burks RT, Tashjian RZ. Psychological distress negatively affects self-assessment of shoulder function in patients with rotator cuff tears. Clin Orthop Relat Res. 2014;472(12):3926-3932.
21. Roh YH, Noh JH, Oh JH, Baek GH, Gong HS. To what degree do shoulder outcome instruments reflect patients’ psychologic distress? Clin Orthop Relat Res. 2012;470(12):3470-3477.
22. Kennedy S, Barske H, Wing K, et al. SF-36 mental component summary (MCS) score does not predict functional outcome after surgery for end-stage ankle arthritis. J Bone Joint Surg Am. 2015;97(20):1702-1707.
23. Styron JF, Higuera CA, Strnad G, Iannotti JP. Greater patient confidence yields greater functional outcomes after primary total shoulder arthroplasty. J Shoulder Elbow Surg. 2015;24(8):1263-1267.
24. Matsen FA, Russ SM, Vu PT, Hsu JE, Lucas RM, Comstock BA. What factors are predictive of patient-reported outcomes? A prospective study of 337 shoulder arthroplasties. Clin Orthop Relat Res. 2016;474(11):2496-2510.
The authors have developed a total shoulder glenoid prosthesis that conforms with the humeral head in its center and is nonconforming on its peripheral edge.
All clinical survey and range of motion parameters demonstrated statistically significant improvements at final follow-up.
Only 3 shoulders (1.7%) required revision surgery.
Eighty-six (63%) of 136 shoulders demonstrated no radiographic evidence of glenoid loosening.
This is the first and largest study that evaluates the clinical and radiographic outcomes of this hybrid shoulder prosthesis.
Fixation of the glenoid component is the limiting factor in modern total shoulder arthroplasty (TSA). Glenoid loosening, the most common long-term complication, necessitates revision in up to 12% of patients.1-4 By contrast, humeral component loosening is relatively uncommon, affecting as few as 0.34% of patients.5 Multiple long-term studies have found consistently high rates (45%-93%) of radiolucencies around the glenoid component.3,6,7 Although their clinical significance has been debated, radiolucencies around the glenoid component raise concern about progressive loss of fixation.
Since TSA was introduced in the 1970s, complications with the glenoid component have been addressed with 2 different designs: conforming (congruent) and nonconforming. In a congruent articulation, the radii of curvature of the glenoid and humeral head components are identical, whereas they differ in a nonconforming model. Joint conformity is inversely related to glenohumeral translation.8 Neer’s original TSA was made congruent in order to limit translation and maximize the contact area. However, this design results in edge loading and a so-called rocking-horse phenomenon, which may lead to glenoid loosening.9-13 Surgeons therefore have increasingly turned to nonconforming implants. In the nonconforming design, the radius of curvature of the humeral head is smaller than that of the glenoid. Although this design may reduce edge loading,14 it allows more translation and reduces the relative contact area of the glenohumeral joint. As a result, more contact stress is transmitted to the glenoid component, leading to polyethylene deformation and wear.15,16
Figure 1.A desire to integrate the advantages of the 2 designs led to a novel glenoid implant design with variable conformity. This innovative component has a central conforming region and a peripheral nonconforming region or “translation zone” (Figure 1).
Dual radii of curvature are designed to augment joint stability without increasing component wear. Biomechanical data have indicated that edge loading is not increased by having a central conforming region added to a nonconforming model.17 The clinical value of this prosthesis, however, has not been determined. Therefore, we conducted a study to describe the intermediate-term clinical and radiographic outcomes of TSAs that use a novel hybrid glenoid component.
Materials and Methods
This study was approved (protocol AAAD3473) by the Institutional Review Board of Columbia University and was conducted in compliance with Health Insurance Portability and Accountability Act (HIPAA) regulations.
Patient Selection
At Columbia University Medical Center, Dr. Bigliani performed 196 TSAs with a hybrid glenoid component (Bigliani-Flatow; Zimmer Biomet) in 169 patients between September 1998 and November 2007. All patients had received a diagnosis of primary glenohumeral arthritis as defined by Neer.18 Patients with previous surgery such as rotator cuff repair or subacromial decompression were included in our review, and patients with a nonprimary form of arthritis, such as rheumatoid, posttraumatic, or post-capsulorrhaphy arthritis, were excluded.
Operative Technique
For all surgeries, Dr. Bigliani performed a subscapularis tenotomy with regional anesthesia and a standard deltopectoral approach. A partial anterior capsulectomy was performed to increase the glenoid’s visibility. The inferior labrum was removed with a needle-tip bovie while the axillary nerve was being protected with a metal finger or narrow Darrach retractor. After reaming and trialing, the final glenoid component was cemented into place. Cement was placed only in the peg or keel holes and pressurized twice before final implantation. Of the 196 glenoid components, 168 (86%) were pegged and 28 (14%) keeled; in addition,190 of these components were all-polyethylene, whereas 6 had trabecular-metal backing. All glenoid components incorporated the hybrid design of dual radii of curvature. After the glenoid was cemented, the final humeral component was placed in 30° of retroversion. Whenever posterior wear was found, retroversion was reduced by 5° to 10°. The humeral prosthesis was cemented in cases (104/196, 53%) of poor bone quality or a large canal.
After surgery, the patient’s sling was fitted with an abduction pillow and a swathe, to be worn the first 24 hours, and the arm was passively ranged. Patients typically were discharged on postoperative day 2. Then, for 2 weeks, they followed an assisted passive range of motion (ROM) protocol, with limited external rotation, for promotion of subscapularis healing.
Clinical Outcomes
Dr. Bigliani assessed preoperative ROM in all planes. During initial evaluation, patients completed a questionnaire that consisted of the 36-Item Short Form Health Survey19,20 (SF-36) and the American Shoulder and Elbow Surgeons21 (ASES) and Simple Shoulder Test22 (SST) surveys. Postoperative clinical data were collected from office follow-up visits, survey questionnaires, or both. Postoperative office data included ROM, subscapularis integrity testing (belly-press or lift-off), and any complications. Patients with <1 year of office follow-up were excluded. In addition, the same survey questionnaire that was used before surgery was mailed to all patients after surgery; then, for anyone who did not respond by mail, we attempted contact by telephone. Neer criteria were based on patients’ subjective assessment of each arm on a 3-point Likert scale (1 = very satisfied, 2 = satisfied, 3 = dissatisfied). Patients were also asked about any specific complications or revision operations since their index procedure.
Physical examination and office follow-up data were obtained for 129 patients (148/196 shoulders, 76% follow-up) at a mean of 3.7 years (range 1.0-10.2 years) after surgery. Surveys were completed by 117 patients (139/196 shoulders, 71% follow-up) at a mean of 5.1 years (range, 1.6-11.2 years) after surgery. Only 15 patients had neither 1 year of office follow-up nor a completed questionnaire. The remaining 154 patients (178/196 shoulders, 91% follow-up) had clinical follow-up with office, mail, or telephone questionnaire at a mean of 4.8 years (range, 1.0-11.2 years) after surgery. This cohort of patients was used to determine rates of surgical revisions, subscapularis tears, dislocations, and other complications.
Figure 2.Acromioplasty, performed in TSA patients who had subacromial impingement stemming from improved ROM, represented a second operation, and therefore the need for this surgery was deemed a complication as well. Figure 2 breaks down the 4 major study cohorts.
Radiographic Outcomes
Patients were included in the radiographic analysis if they had a shoulder radiograph at least 1 year after surgery. One hundred nineteen patients (136/196 shoulders, 69% follow-up) had radiographic follow-up at a mean of 3.7 years (range, 1.0-9.4 years) after surgery.
Table 1.All radiographs were independently assessed by 2 blinded physicians who were not involved in the index procedure. Any disputed radiographs were reassessed by these physicians together, until consensus was reached. Radiographs were reviewed for the presence of glenoid lucencies around the pegs or keel and were scored using the system of Lazarus and colleagues23 (Table 1). The humerus was assessed for total number of lucent lines in any of 8 periprosthetic zones, as described by Sperling and colleagues.24
Statistical Analysis
Statistical analysis was performed with Stata Version 10.0. Paired t tests were used to compare preoperative and postoperative numerical data, including ROM and survey scores. We calculated 95% confidence intervals (CIs) and set statistical significance at P < .05. For qualitative measures, the Fisher exact test was used. Survivorship analysis was performed according to the Kaplan-Meier method, with right-censored data for no event or missing data.25
Results
Clinical Analysis of Demographics
In demographics, the clinical and radiographic patient subgroups were similar to each other and to the overall study population (Table 2). Of 196 patients overall, 16 (8%) had a concomitant rotator cuff repair, and 27 (14%) underwent staged bilateral shoulder arthroplasties.
Table 2.
Clinical Analysis of ROM and Survey Scores
Operative shoulder ROM in forward elevation, external rotation at side, external rotation in abduction, and internal rotation all showed statistically significant (P < .001) improvement from before surgery to after surgery. Over 3.7 years, mean (SD) forward elevation improved from 107.3° (34.8°) to 159.0° (29.4°), external rotation at side improved from 20.4° (16.7°) to 49.4° (11.3°), and external rotation in abduction improved from 53.7° (24.3°) to 84.7° (9.1°). Internal rotation improved from a mean (SD) vertebral level of S1 (6.0 levels) to T9 (3.7 levels).
All validated survey scores also showed statistically significant (P < .001) improvement from before surgery to after surgery. Over 5.1 years, mean (SD) SF-36 scores improved from 64.9 (13.4) to 73.6 (17.1), ASES scores improved from 41.1 (22.5) to 82.7 (17.7), SST scores improved from 3.9 (2.8) to 9.7 (2.2), and visual analog scale pain scores improved from 5.6 (3.2) to 1.4 (2.1). Of 139 patients with follow-up, 130 (93.5%) were either satisfied or very satisfied with their TSA, and only 119 (86%) were either satisfied or very satisfied with the nonoperative shoulder.
Clinical Analysis of Postoperative Complications
Of the 178 shoulders evaluated for complications, 3 (1.7%) underwent revision surgery. Mean time to revision was 2.3 years (range, 1.5-3.9 years). Two revisions involved the glenoid component, and the third involved the humerus. In one of the glenoid cases, a 77-year-old woman fell and sustained a fracture at the base of the trabecular metal glenoid pegs; her component was revised to an all-polyethylene component, and she had no further complications. In the other glenoid case, a 73-year-old man’s all-polyethylene component loosened after 2 years and was revised to a trabecular metal implant, which loosened as well and was later converted to a hemiarthroplasty. In the humeral case, a 33-year-old man had his 4-year-old index TSA revised to a cemented stem and had no further complications.
Table 3.Of the 148 patients with office follow-up, only 8 had a positive belly-press or lift-off test. Of all 178 clinical study shoulders, 10 (5.6%) had a subscapularis tear confirmed by magnetic resonance imaging or a physician. Of these 10 tears, 3 resulted from traumatic falls. Four of the 10 tears were managed nonoperatively, and the other 6 underwent surgical repair at a mean of 2.9 years (range, 0.3-7.8 years) after index TSA. In 2 of the 6 repair cases, a 46-mm humeral head had been used, and, in the other 4 cases, a 52-mm humeral head. Of the 6 repaired tears, 2 were massive, and 4 were isolated to the subscapularis. None of these 6 tears required a second repair. Seven (4%) of the 178 shoulders experienced a clinically significant posterosuperior subluxation or dislocation; 5 of the 7 were managed nonoperatively, and the other 2 underwent open capsular shift, at 0.5 year and 3.0 years, respectively. Table 3 lists the other postoperative complications that required surgery.
Table 4.
Table 4 compares the clinical and radiographic outcomes of patients who required subscapularis repair, capsular shift, or implant revision with the outcomes of all other study patients, and Figure 3 shows Kaplan-Meier survivorship.
Figure 3.
Postoperative Radiographic Analysis
Glenoid Component. At a mean of 3.7 years (minimum, 1 year) after surgery, 86 (63%) of 136 radiographically evaluated shoulders showed no glenoid lucencies; the other 50 (37%) showed ≥1 lucency. Of the 136 shoulders, 33 (24%) had a Lazarus score of 1, 15 (11%) had a score of 2, and only 2 (2%) had a score of 3. None of the shoulders had a score of 4 or 5.
Humeral Component. Of the 136 shoulders, 91 (67%) showed no lucencies in any of the 8 humeral stem zones; the other 45 (33%) showed 1 to 3 lucencies. Thirty (22%) of the 136 shoulders had 1 stem lucency zone, 8 (6%) had 2, and 3 (2%) had 3. None of the shoulders had >3 periprosthetic zones with lucent lines.
Discussion
In this article, we describe a hybrid glenoid TSA component with dual radii of curvature. Its central portion is congruent with the humeral head, and its peripheral portion is noncongruent and larger. The most significant finding of our study is the low rate (1.1%) of glenoid component revision 4.8 years after surgery. This rate is the lowest that has been reported in a study of ≥100 patients. Overall implant survival appeared as an almost flat Kaplan-Meir curve. We attribute this low revision rate to improved biomechanics with the hybrid glenoid design.
Symptomatic glenoid component loosening is the most common TSA complication.1,26-28 In a review of 73 Neer TSAs, Cofield7 found glenoid radiolucencies in 71% of patients 3.8 years after surgery. Radiographic evidence of loosening, defined as component migration, or tilt, or a circumferential lucency 1.5 mm thick, was present in another 11% of patients, and 4.1% developed symptomatic loosening that required glenoid revision. In a study with 12.2-year follow-up, Torchia and colleagues3 found rates of 84% for glenoid radiolucencies, 44% for radiographic loosening, and 5.6% for symptomatic loosening that required revision. In a systematic review of studies with follow-up of ≥10 years, Bohsali and colleagues27 found similar lucency and radiographic loosening rates and a 7% glenoid revision rate. These data suggest glenoid radiolucencies may progress to component loosening.
Degree of joint congruence is a key factor in glenoid loosening. Neer’s congruent design increases the contact area with concentric loading and reduces glenohumeral translation, which leads to reduced polyethylene wear and improved joint stability. In extreme arm positions, however, humeral head subluxation results in edge loading and a glenoid rocking-horse effect.9-13,17,29-31 Conversely, nonconforming implants allow increased glenohumeral translation without edge loading,14 though they also reduce the relative glenohumeral contact area and thus transmit more contact stress to the glenoid.16,17 A hybrid glenoid component with central conforming and peripheral nonconforming zones may reduce the rocking-horse effect while maximizing ROM and joint stability. Wang and colleagues32 studied the biomechanical properties of this glenoid design and found that the addition of a central conforming region did not increase edge loading.
Additional results from our study support the efficacy of a hybrid glenoid component. Patients’ clinical outcomes improved significantly. At 5.1 years after surgery, 93.5% of patients were satisfied or very satisfied with their procedure and reported less satisfaction (86%) with the nonoperative shoulder. Also significant was the reduced number of radiolucencies. At 3.7 years after surgery, the overall percentage of shoulders with ≥1 glenoid radiolucency was 37%, considerably lower than the 82% reported by Cofield7 and the rates in more recent studies.3,16,33-36 Of the 178 shoulders in our study, 10 (5.6%) had subscapularis tears, and 6 (3.4%) of 178 had these tears surgically repaired. This 3.4% compares favorably with the 5.9% (of 119 patients) found by Miller and colleagues37 28 months after surgery. Of our 178 shoulders, 27 (15.2%) had clinically significant postoperative complications; 18 (10.1%) of the 178 had these complications surgically treated, and 9 (5.1%) had them managed nonoperatively. Bohsali and colleagues27 systematically reviewed 33 TSA studies and found a slightly higher complication rate (16.3%) 5.3 years after surgery. Furthermore, in our study, the 11 patients who underwent revision, capsular shift, or subscapularis repair had final outcomes comparable to those of the rest of our study population.
Our study had several potential weaknesses. First, its minimum clinical and radiographic follow-up was 1 year, whereas most long-term TSA series set a minimum of 2 years. We used 1 year because this was the first clinical study of the hybrid glenoid component design, and we wanted to maximize its sample size by reporting on intermediate-length outcomes. Even so, 93% (166/178) of our clinical patients and 83% (113/136) of our radiographic patients have had ≥2 years of follow-up, and we continue to follow all study patients for long-term outcomes. Another weakness of the study was its lack of a uniform group of patients with all the office, survey, complications, and radiographic data. Our retrospective study design made it difficult to obtain such a group without significantly reducing the sample size, so we divided patients into 4 data groups. A third potential weakness was the study’s variable method for collecting complications data. Rates of complications in the 178 shoulders were calculated from either office evaluation or patient self-report by mail or telephone. This data collection method is subject to recall bias, but mail and telephone contact was needed so the study would capture the large number of patients who had traveled to our institution for their surgery or had since moved away. Fourth, belly-press and lift-off tests were used in part to assess subscapularis function, but recent literature suggests post-TSA subscapularis assessment can be unreliable.38 These tests may be positive in up to two-thirds of patients after 2 years.39 Fifth, the generalizability of our findings to diagnoses such as rheumatoid and posttraumatic arthritis is limited. We had to restrict the study to patients with primary glenohumeral arthritis in order to minimize confounders.
This study’s main strength is its description of the clinical and radiographic outcomes of using a single prosthetic system in operations performed by a single surgeon in a large number of patients. This was the first and largest study evaluating the clinical and radiographic outcomes of this hybrid glenoid implant. Excluding patients with nonprimary arthritis allowed us to minimize potential confounding factors that affect patient outcomes. In conclusion, our study results showed the favorable clinical and radiographic outcomes of TSAs that have a hybrid glenoid component with dual radii of curvature. At a mean of 3.7 years after surgery, 63% of patients had no glenoid lucencies, and, at a mean of 4.8 years, only 1.7% of patients required revision. We continue to follow these patients to obtain long-term results of this innovative prosthesis.
References
1. Rodosky MW, Bigliani LU. Indications for glenoid resurfacing in shoulder arthroplasty. J Shoulder Elbow Surg. 1996;5(3):231-248.
2. Boyd AD Jr, Thomas WH, Scott RD, Sledge CB, Thornhill TS. Total shoulder arthroplasty versus hemiarthroplasty. Indications for glenoid resurfacing. J Arthroplasty. 1990;5(4):329-336.
3. Torchia ME, Cofield RH, Settergren CR. Total shoulder arthroplasty with the Neer prosthesis: long-term results. J Shoulder Elbow Surg. 1997;6(6):495-505.
4. Iannotti JP, Norris TR. Influence of preoperative factors on outcome of shoulder arthroplasty for glenohumeral osteoarthritis. J Bone Joint Surg Am. 2003;85(2):251-258.
5. Cofield RH. Degenerative and arthritic problems of the glenohumeral joint. In: Rockwood CA, Matsen FA, eds. The Shoulder. Philadelphia, PA: Saunders; 1990:740-745.
6. Neer CS 2nd, Watson KC, Stanton FJ. Recent experience in total shoulder replacement. J Bone Joint Surg Am. 1982;64(3):319-337.
7. Cofield RH. Total shoulder arthroplasty with the Neer prosthesis. J Bone Joint Surg Am. 1984;66(6):899-906.
8. Karduna AR, Williams GR, Williams JL, Iannotti JP. Kinematics of the glenohumeral joint: influences of muscle forces, ligamentous constraints, and articular geometry. J Orthop Res. 1996;14(6):986-993.
9. Karduna AR, Williams GR, Iannotti JP, Williams JL. Total shoulder arthroplasty biomechanics: a study of the forces and strains at the glenoid component. J Biomech Eng. 1998;120(1):92-99.
10. Karduna AR, Williams GR, Williams JL, Iannotti JP. Glenohumeral joint translations before and after total shoulder arthroplasty. A study in cadavera. J Bone Joint Surg Am. 1997;79(8):1166-1174.
11. Matsen FA 3rd, Clinton J, Lynch J, Bertelsen A, Richardson ML. Glenoid component failure in total shoulder arthroplasty. J Bone Joint Surg Am. 2008;90(4):885-896.
12. Franklin JL, Barrett WP, Jackins SE, Matsen FA 3rd. Glenoid loosening in total shoulder arthroplasty. Association with rotator cuff deficiency. J Arthroplasty. 1988;3(1):39-46.
13. Barrett WP, Franklin JL, Jackins SE, Wyss CR, Matsen FA 3rd. Total shoulder arthroplasty. J Bone Joint Surg Am. 1987;69(6):865-872.
14. Harryman DT, Sidles JA, Harris SL, Lippitt SB, Matsen FA 3rd. The effect of articular conformity and the size of the humeral head component on laxity and motion after glenohumeral arthroplasty. A study in cadavera. J Bone Joint Surg Am. 1995;77(4):555-563.
15. Flatow EL. Prosthetic design considerations in total shoulder arthroplasty. Semin Arthroplasty. 1995;6(4):233-244.
16. Klimkiewicz JJ, Iannotti JP, Rubash HE, Shanbhag AS. Aseptic loosening of the humeral component in total shoulder arthroplasty. J Shoulder Elbow Surg. 1998;7(4):422-426.
17. Wang VM, Krishnan R, Ugwonali OF, Flatow EL, Bigliani LU, Ateshian GA. Biomechanical evaluation of a novel glenoid design in total shoulder arthroplasty. J Shoulder Elbow Surg. 2005;14(1 suppl S):129S-140S.
18. Neer CS 2nd. Replacement arthroplasty for glenohumeral osteoarthritis. J Bone Joint Surg Am. 1974;56(1):1-13.
19. Boorman RS, Kopjar B, Fehringer E, Churchill RS, Smith K, Matsen FA 3rd. The effect of total shoulder arthroplasty on self-assessed health status is comparable to that of total hip arthroplasty and coronary artery bypass grafting. J Shoulder Elbow Surg. 2003;12(2):158-163.
20. Patel AA, Donegan D, Albert T. The 36-Item Short Form. J Am Acad Orthop Surg. 2007;15(2):126-134.
21. Richards RR, An KN, Bigliani LU, et al. A standardized method for the assessment of shoulder function. J Shoulder Elbow Surg. 1994;3(6):347-352.
22. Wright RW, Baumgarten KM. Shoulder outcomes measures. J Am Acad Orthop Surg. 2010;18(7):436-444.
23. Lazarus MD, Jensen KL, Southworth C, Matsen FA 3rd. The radiographic evaluation of keeled and pegged glenoid component insertion. J Bone Joint Surg Am. 2002;84(7):1174-1182.
24. Sperling JW, Cofield RH, O’Driscoll SW, Torchia ME, Rowland CM. Radiographic assessment of ingrowth total shoulder arthroplasty. J Shoulder Elbow Surg. 2000;9(6):507-513.
25. Dinse GE, Lagakos SW. Nonparametric estimation of lifetime and disease onset distributions from incomplete observations. Biometrics. 1982;38(4):921-932.
26. Baumgarten KM, Lashgari CJ, Yamaguchi K. Glenoid resurfacing in shoulder arthroplasty: indications and contraindications. Instr Course Lect. 2004;53:3-11.
27. Bohsali KI, Wirth MA, Rockwood CA Jr. Complications of total shoulder arthroplasty. J Bone Joint Surg Am. 2006;88(10):2279-2292.
28. Wirth MA, Rockwood CA Jr. Complications of total shoulder-replacement arthroplasty. J Bone Joint Surg Am. 1996;78(4):603-616.
29. Poppen NK, Walker PS. Normal and abnormal motion of the shoulder. J Bone Joint Surg Am. 1976;58(2):195-201.
30. Cotton RE, Rideout DF. Tears of the humeral rotator cuff; a radiological and pathological necropsy survey. J Bone Joint Surg Br. 1964;46:314-328.
31. Bigliani LU, Kelkar R, Flatow EL, Pollock RG, Mow VC. Glenohumeral stability. Biomechanical properties of passive and active stabilizers. Clin Orthop Relat Res. 1996;(330):13-30.
32. Wang VM, Sugalski MT, Levine WN, Pawluk RJ, Mow VC, Bigliani LU. Comparison of glenohumeral mechanics following a capsular shift and anterior tightening. J Bone Joint Surg Am. 2005;87(6):1312-1322.
33. Young A, Walch G, Boileau P, et al. A multicentre study of the long-term results of using a flat-back polyethylene glenoid component in shoulder replacement for primary osteoarthritis. J Bone Joint Surg Br. 2011;93(2):210-216.
34. Khan A, Bunker TD, Kitson JB. Clinical and radiological follow-up of the Aequalis third-generation cemented total shoulder replacement: a minimum ten-year study. J Bone Joint Surg Br. 2009;91(12):1594-1600.
35. Walch G, Edwards TB, Boulahia A, Boileau P, Mole D, Adeleine P. The influence of glenohumeral prosthetic mismatch on glenoid radiolucent lines: results of a multicenter study. J Bone Joint Surg Am. 2002;84(12):2186-2191.
36. Bartelt R, Sperling JW, Schleck CD, Cofield RH. Shoulder arthroplasty in patients aged fifty-five years or younger with osteoarthritis. J Shoulder Elbow Surg. 2011;20(1):123-130.
37. Miller BS, Joseph TA, Noonan TJ, Horan MP, Hawkins RJ. Rupture of the subscapularis tendon after shoulder arthroplasty: diagnosis, treatment, and outcome. J Shoulder Elbow Surg. 2005;14(5):492-496.
38. Armstrong A, Lashgari C, Teefey S, Menendez J, Yamaguchi K, Galatz LM. Ultrasound evaluation and clinical correlation of subscapularis repair after total shoulder arthroplasty. J Shoulder Elbow Surg. 2006;15(5):541-548.
39. Miller SL, Hazrati Y, Klepps S, Chiang A, Flatow EL. Loss of subscapularis function after total shoulder replacement: a seldom recognized problem. J Shoulder Elbow Surg. 2003;12(1):29-34.
Authors’ Disclosure Statement: Dr. Bigliani reports that he helped design the Zimmer Biomet prosthesis discussed in this article and has received royalties from Zimmer Biomet and Innomed. Columbia University, where Dr. Levine and Dr. Ahmad are employed, receives royalties from Zimmer Biomet, and Dr. Levine reports that he is an unpaid consultant to Zimmer Biomet. The other authors report no actual or potential conflict of interest in relation to this article.
Authors’ Disclosure Statement: Dr. Bigliani reports that he helped design the Zimmer Biomet prosthesis discussed in this article and has received royalties from Zimmer Biomet and Innomed. Columbia University, where Dr. Levine and Dr. Ahmad are employed, receives royalties from Zimmer Biomet, and Dr. Levine reports that he is an unpaid consultant to Zimmer Biomet. The other authors report no actual or potential conflict of interest in relation to this article.
Author and Disclosure Information
Authors’ Disclosure Statement: Dr. Bigliani reports that he helped design the Zimmer Biomet prosthesis discussed in this article and has received royalties from Zimmer Biomet and Innomed. Columbia University, where Dr. Levine and Dr. Ahmad are employed, receives royalties from Zimmer Biomet, and Dr. Levine reports that he is an unpaid consultant to Zimmer Biomet. The other authors report no actual or potential conflict of interest in relation to this article.
The authors have developed a total shoulder glenoid prosthesis that conforms with the humeral head in its center and is nonconforming on its peripheral edge.
All clinical survey and range of motion parameters demonstrated statistically significant improvements at final follow-up.
Only 3 shoulders (1.7%) required revision surgery.
Eighty-six (63%) of 136 shoulders demonstrated no radiographic evidence of glenoid loosening.
This is the first and largest study that evaluates the clinical and radiographic outcomes of this hybrid shoulder prosthesis.
Fixation of the glenoid component is the limiting factor in modern total shoulder arthroplasty (TSA). Glenoid loosening, the most common long-term complication, necessitates revision in up to 12% of patients.1-4 By contrast, humeral component loosening is relatively uncommon, affecting as few as 0.34% of patients.5 Multiple long-term studies have found consistently high rates (45%-93%) of radiolucencies around the glenoid component.3,6,7 Although their clinical significance has been debated, radiolucencies around the glenoid component raise concern about progressive loss of fixation.
Since TSA was introduced in the 1970s, complications with the glenoid component have been addressed with 2 different designs: conforming (congruent) and nonconforming. In a congruent articulation, the radii of curvature of the glenoid and humeral head components are identical, whereas they differ in a nonconforming model. Joint conformity is inversely related to glenohumeral translation.8 Neer’s original TSA was made congruent in order to limit translation and maximize the contact area. However, this design results in edge loading and a so-called rocking-horse phenomenon, which may lead to glenoid loosening.9-13 Surgeons therefore have increasingly turned to nonconforming implants. In the nonconforming design, the radius of curvature of the humeral head is smaller than that of the glenoid. Although this design may reduce edge loading,14 it allows more translation and reduces the relative contact area of the glenohumeral joint. As a result, more contact stress is transmitted to the glenoid component, leading to polyethylene deformation and wear.15,16
Figure 1.A desire to integrate the advantages of the 2 designs led to a novel glenoid implant design with variable conformity. This innovative component has a central conforming region and a peripheral nonconforming region or “translation zone” (Figure 1).
Dual radii of curvature are designed to augment joint stability without increasing component wear. Biomechanical data have indicated that edge loading is not increased by having a central conforming region added to a nonconforming model.17 The clinical value of this prosthesis, however, has not been determined. Therefore, we conducted a study to describe the intermediate-term clinical and radiographic outcomes of TSAs that use a novel hybrid glenoid component.
Materials and Methods
This study was approved (protocol AAAD3473) by the Institutional Review Board of Columbia University and was conducted in compliance with Health Insurance Portability and Accountability Act (HIPAA) regulations.
Patient Selection
At Columbia University Medical Center, Dr. Bigliani performed 196 TSAs with a hybrid glenoid component (Bigliani-Flatow; Zimmer Biomet) in 169 patients between September 1998 and November 2007. All patients had received a diagnosis of primary glenohumeral arthritis as defined by Neer.18 Patients with previous surgery such as rotator cuff repair or subacromial decompression were included in our review, and patients with a nonprimary form of arthritis, such as rheumatoid, posttraumatic, or post-capsulorrhaphy arthritis, were excluded.
Operative Technique
For all surgeries, Dr. Bigliani performed a subscapularis tenotomy with regional anesthesia and a standard deltopectoral approach. A partial anterior capsulectomy was performed to increase the glenoid’s visibility. The inferior labrum was removed with a needle-tip bovie while the axillary nerve was being protected with a metal finger or narrow Darrach retractor. After reaming and trialing, the final glenoid component was cemented into place. Cement was placed only in the peg or keel holes and pressurized twice before final implantation. Of the 196 glenoid components, 168 (86%) were pegged and 28 (14%) keeled; in addition,190 of these components were all-polyethylene, whereas 6 had trabecular-metal backing. All glenoid components incorporated the hybrid design of dual radii of curvature. After the glenoid was cemented, the final humeral component was placed in 30° of retroversion. Whenever posterior wear was found, retroversion was reduced by 5° to 10°. The humeral prosthesis was cemented in cases (104/196, 53%) of poor bone quality or a large canal.
After surgery, the patient’s sling was fitted with an abduction pillow and a swathe, to be worn the first 24 hours, and the arm was passively ranged. Patients typically were discharged on postoperative day 2. Then, for 2 weeks, they followed an assisted passive range of motion (ROM) protocol, with limited external rotation, for promotion of subscapularis healing.
Clinical Outcomes
Dr. Bigliani assessed preoperative ROM in all planes. During initial evaluation, patients completed a questionnaire that consisted of the 36-Item Short Form Health Survey19,20 (SF-36) and the American Shoulder and Elbow Surgeons21 (ASES) and Simple Shoulder Test22 (SST) surveys. Postoperative clinical data were collected from office follow-up visits, survey questionnaires, or both. Postoperative office data included ROM, subscapularis integrity testing (belly-press or lift-off), and any complications. Patients with <1 year of office follow-up were excluded. In addition, the same survey questionnaire that was used before surgery was mailed to all patients after surgery; then, for anyone who did not respond by mail, we attempted contact by telephone. Neer criteria were based on patients’ subjective assessment of each arm on a 3-point Likert scale (1 = very satisfied, 2 = satisfied, 3 = dissatisfied). Patients were also asked about any specific complications or revision operations since their index procedure.
Physical examination and office follow-up data were obtained for 129 patients (148/196 shoulders, 76% follow-up) at a mean of 3.7 years (range 1.0-10.2 years) after surgery. Surveys were completed by 117 patients (139/196 shoulders, 71% follow-up) at a mean of 5.1 years (range, 1.6-11.2 years) after surgery. Only 15 patients had neither 1 year of office follow-up nor a completed questionnaire. The remaining 154 patients (178/196 shoulders, 91% follow-up) had clinical follow-up with office, mail, or telephone questionnaire at a mean of 4.8 years (range, 1.0-11.2 years) after surgery. This cohort of patients was used to determine rates of surgical revisions, subscapularis tears, dislocations, and other complications.
Figure 2.Acromioplasty, performed in TSA patients who had subacromial impingement stemming from improved ROM, represented a second operation, and therefore the need for this surgery was deemed a complication as well. Figure 2 breaks down the 4 major study cohorts.
Radiographic Outcomes
Patients were included in the radiographic analysis if they had a shoulder radiograph at least 1 year after surgery. One hundred nineteen patients (136/196 shoulders, 69% follow-up) had radiographic follow-up at a mean of 3.7 years (range, 1.0-9.4 years) after surgery.
Table 1.All radiographs were independently assessed by 2 blinded physicians who were not involved in the index procedure. Any disputed radiographs were reassessed by these physicians together, until consensus was reached. Radiographs were reviewed for the presence of glenoid lucencies around the pegs or keel and were scored using the system of Lazarus and colleagues23 (Table 1). The humerus was assessed for total number of lucent lines in any of 8 periprosthetic zones, as described by Sperling and colleagues.24
Statistical Analysis
Statistical analysis was performed with Stata Version 10.0. Paired t tests were used to compare preoperative and postoperative numerical data, including ROM and survey scores. We calculated 95% confidence intervals (CIs) and set statistical significance at P < .05. For qualitative measures, the Fisher exact test was used. Survivorship analysis was performed according to the Kaplan-Meier method, with right-censored data for no event or missing data.25
Results
Clinical Analysis of Demographics
In demographics, the clinical and radiographic patient subgroups were similar to each other and to the overall study population (Table 2). Of 196 patients overall, 16 (8%) had a concomitant rotator cuff repair, and 27 (14%) underwent staged bilateral shoulder arthroplasties.
Table 2.
Clinical Analysis of ROM and Survey Scores
Operative shoulder ROM in forward elevation, external rotation at side, external rotation in abduction, and internal rotation all showed statistically significant (P < .001) improvement from before surgery to after surgery. Over 3.7 years, mean (SD) forward elevation improved from 107.3° (34.8°) to 159.0° (29.4°), external rotation at side improved from 20.4° (16.7°) to 49.4° (11.3°), and external rotation in abduction improved from 53.7° (24.3°) to 84.7° (9.1°). Internal rotation improved from a mean (SD) vertebral level of S1 (6.0 levels) to T9 (3.7 levels).
All validated survey scores also showed statistically significant (P < .001) improvement from before surgery to after surgery. Over 5.1 years, mean (SD) SF-36 scores improved from 64.9 (13.4) to 73.6 (17.1), ASES scores improved from 41.1 (22.5) to 82.7 (17.7), SST scores improved from 3.9 (2.8) to 9.7 (2.2), and visual analog scale pain scores improved from 5.6 (3.2) to 1.4 (2.1). Of 139 patients with follow-up, 130 (93.5%) were either satisfied or very satisfied with their TSA, and only 119 (86%) were either satisfied or very satisfied with the nonoperative shoulder.
Clinical Analysis of Postoperative Complications
Of the 178 shoulders evaluated for complications, 3 (1.7%) underwent revision surgery. Mean time to revision was 2.3 years (range, 1.5-3.9 years). Two revisions involved the glenoid component, and the third involved the humerus. In one of the glenoid cases, a 77-year-old woman fell and sustained a fracture at the base of the trabecular metal glenoid pegs; her component was revised to an all-polyethylene component, and she had no further complications. In the other glenoid case, a 73-year-old man’s all-polyethylene component loosened after 2 years and was revised to a trabecular metal implant, which loosened as well and was later converted to a hemiarthroplasty. In the humeral case, a 33-year-old man had his 4-year-old index TSA revised to a cemented stem and had no further complications.
Table 3.Of the 148 patients with office follow-up, only 8 had a positive belly-press or lift-off test. Of all 178 clinical study shoulders, 10 (5.6%) had a subscapularis tear confirmed by magnetic resonance imaging or a physician. Of these 10 tears, 3 resulted from traumatic falls. Four of the 10 tears were managed nonoperatively, and the other 6 underwent surgical repair at a mean of 2.9 years (range, 0.3-7.8 years) after index TSA. In 2 of the 6 repair cases, a 46-mm humeral head had been used, and, in the other 4 cases, a 52-mm humeral head. Of the 6 repaired tears, 2 were massive, and 4 were isolated to the subscapularis. None of these 6 tears required a second repair. Seven (4%) of the 178 shoulders experienced a clinically significant posterosuperior subluxation or dislocation; 5 of the 7 were managed nonoperatively, and the other 2 underwent open capsular shift, at 0.5 year and 3.0 years, respectively. Table 3 lists the other postoperative complications that required surgery.
Table 4.
Table 4 compares the clinical and radiographic outcomes of patients who required subscapularis repair, capsular shift, or implant revision with the outcomes of all other study patients, and Figure 3 shows Kaplan-Meier survivorship.
Figure 3.
Postoperative Radiographic Analysis
Glenoid Component. At a mean of 3.7 years (minimum, 1 year) after surgery, 86 (63%) of 136 radiographically evaluated shoulders showed no glenoid lucencies; the other 50 (37%) showed ≥1 lucency. Of the 136 shoulders, 33 (24%) had a Lazarus score of 1, 15 (11%) had a score of 2, and only 2 (2%) had a score of 3. None of the shoulders had a score of 4 or 5.
Humeral Component. Of the 136 shoulders, 91 (67%) showed no lucencies in any of the 8 humeral stem zones; the other 45 (33%) showed 1 to 3 lucencies. Thirty (22%) of the 136 shoulders had 1 stem lucency zone, 8 (6%) had 2, and 3 (2%) had 3. None of the shoulders had >3 periprosthetic zones with lucent lines.
Discussion
In this article, we describe a hybrid glenoid TSA component with dual radii of curvature. Its central portion is congruent with the humeral head, and its peripheral portion is noncongruent and larger. The most significant finding of our study is the low rate (1.1%) of glenoid component revision 4.8 years after surgery. This rate is the lowest that has been reported in a study of ≥100 patients. Overall implant survival appeared as an almost flat Kaplan-Meir curve. We attribute this low revision rate to improved biomechanics with the hybrid glenoid design.
Symptomatic glenoid component loosening is the most common TSA complication.1,26-28 In a review of 73 Neer TSAs, Cofield7 found glenoid radiolucencies in 71% of patients 3.8 years after surgery. Radiographic evidence of loosening, defined as component migration, or tilt, or a circumferential lucency 1.5 mm thick, was present in another 11% of patients, and 4.1% developed symptomatic loosening that required glenoid revision. In a study with 12.2-year follow-up, Torchia and colleagues3 found rates of 84% for glenoid radiolucencies, 44% for radiographic loosening, and 5.6% for symptomatic loosening that required revision. In a systematic review of studies with follow-up of ≥10 years, Bohsali and colleagues27 found similar lucency and radiographic loosening rates and a 7% glenoid revision rate. These data suggest glenoid radiolucencies may progress to component loosening.
Degree of joint congruence is a key factor in glenoid loosening. Neer’s congruent design increases the contact area with concentric loading and reduces glenohumeral translation, which leads to reduced polyethylene wear and improved joint stability. In extreme arm positions, however, humeral head subluxation results in edge loading and a glenoid rocking-horse effect.9-13,17,29-31 Conversely, nonconforming implants allow increased glenohumeral translation without edge loading,14 though they also reduce the relative glenohumeral contact area and thus transmit more contact stress to the glenoid.16,17 A hybrid glenoid component with central conforming and peripheral nonconforming zones may reduce the rocking-horse effect while maximizing ROM and joint stability. Wang and colleagues32 studied the biomechanical properties of this glenoid design and found that the addition of a central conforming region did not increase edge loading.
Additional results from our study support the efficacy of a hybrid glenoid component. Patients’ clinical outcomes improved significantly. At 5.1 years after surgery, 93.5% of patients were satisfied or very satisfied with their procedure and reported less satisfaction (86%) with the nonoperative shoulder. Also significant was the reduced number of radiolucencies. At 3.7 years after surgery, the overall percentage of shoulders with ≥1 glenoid radiolucency was 37%, considerably lower than the 82% reported by Cofield7 and the rates in more recent studies.3,16,33-36 Of the 178 shoulders in our study, 10 (5.6%) had subscapularis tears, and 6 (3.4%) of 178 had these tears surgically repaired. This 3.4% compares favorably with the 5.9% (of 119 patients) found by Miller and colleagues37 28 months after surgery. Of our 178 shoulders, 27 (15.2%) had clinically significant postoperative complications; 18 (10.1%) of the 178 had these complications surgically treated, and 9 (5.1%) had them managed nonoperatively. Bohsali and colleagues27 systematically reviewed 33 TSA studies and found a slightly higher complication rate (16.3%) 5.3 years after surgery. Furthermore, in our study, the 11 patients who underwent revision, capsular shift, or subscapularis repair had final outcomes comparable to those of the rest of our study population.
Our study had several potential weaknesses. First, its minimum clinical and radiographic follow-up was 1 year, whereas most long-term TSA series set a minimum of 2 years. We used 1 year because this was the first clinical study of the hybrid glenoid component design, and we wanted to maximize its sample size by reporting on intermediate-length outcomes. Even so, 93% (166/178) of our clinical patients and 83% (113/136) of our radiographic patients have had ≥2 years of follow-up, and we continue to follow all study patients for long-term outcomes. Another weakness of the study was its lack of a uniform group of patients with all the office, survey, complications, and radiographic data. Our retrospective study design made it difficult to obtain such a group without significantly reducing the sample size, so we divided patients into 4 data groups. A third potential weakness was the study’s variable method for collecting complications data. Rates of complications in the 178 shoulders were calculated from either office evaluation or patient self-report by mail or telephone. This data collection method is subject to recall bias, but mail and telephone contact was needed so the study would capture the large number of patients who had traveled to our institution for their surgery or had since moved away. Fourth, belly-press and lift-off tests were used in part to assess subscapularis function, but recent literature suggests post-TSA subscapularis assessment can be unreliable.38 These tests may be positive in up to two-thirds of patients after 2 years.39 Fifth, the generalizability of our findings to diagnoses such as rheumatoid and posttraumatic arthritis is limited. We had to restrict the study to patients with primary glenohumeral arthritis in order to minimize confounders.
This study’s main strength is its description of the clinical and radiographic outcomes of using a single prosthetic system in operations performed by a single surgeon in a large number of patients. This was the first and largest study evaluating the clinical and radiographic outcomes of this hybrid glenoid implant. Excluding patients with nonprimary arthritis allowed us to minimize potential confounding factors that affect patient outcomes. In conclusion, our study results showed the favorable clinical and radiographic outcomes of TSAs that have a hybrid glenoid component with dual radii of curvature. At a mean of 3.7 years after surgery, 63% of patients had no glenoid lucencies, and, at a mean of 4.8 years, only 1.7% of patients required revision. We continue to follow these patients to obtain long-term results of this innovative prosthesis.
Take-Home Points
The authors have developed a total shoulder glenoid prosthesis that conforms with the humeral head in its center and is nonconforming on its peripheral edge.
All clinical survey and range of motion parameters demonstrated statistically significant improvements at final follow-up.
Only 3 shoulders (1.7%) required revision surgery.
Eighty-six (63%) of 136 shoulders demonstrated no radiographic evidence of glenoid loosening.
This is the first and largest study that evaluates the clinical and radiographic outcomes of this hybrid shoulder prosthesis.
Fixation of the glenoid component is the limiting factor in modern total shoulder arthroplasty (TSA). Glenoid loosening, the most common long-term complication, necessitates revision in up to 12% of patients.1-4 By contrast, humeral component loosening is relatively uncommon, affecting as few as 0.34% of patients.5 Multiple long-term studies have found consistently high rates (45%-93%) of radiolucencies around the glenoid component.3,6,7 Although their clinical significance has been debated, radiolucencies around the glenoid component raise concern about progressive loss of fixation.
Since TSA was introduced in the 1970s, complications with the glenoid component have been addressed with 2 different designs: conforming (congruent) and nonconforming. In a congruent articulation, the radii of curvature of the glenoid and humeral head components are identical, whereas they differ in a nonconforming model. Joint conformity is inversely related to glenohumeral translation.8 Neer’s original TSA was made congruent in order to limit translation and maximize the contact area. However, this design results in edge loading and a so-called rocking-horse phenomenon, which may lead to glenoid loosening.9-13 Surgeons therefore have increasingly turned to nonconforming implants. In the nonconforming design, the radius of curvature of the humeral head is smaller than that of the glenoid. Although this design may reduce edge loading,14 it allows more translation and reduces the relative contact area of the glenohumeral joint. As a result, more contact stress is transmitted to the glenoid component, leading to polyethylene deformation and wear.15,16
Figure 1.A desire to integrate the advantages of the 2 designs led to a novel glenoid implant design with variable conformity. This innovative component has a central conforming region and a peripheral nonconforming region or “translation zone” (Figure 1).
Dual radii of curvature are designed to augment joint stability without increasing component wear. Biomechanical data have indicated that edge loading is not increased by having a central conforming region added to a nonconforming model.17 The clinical value of this prosthesis, however, has not been determined. Therefore, we conducted a study to describe the intermediate-term clinical and radiographic outcomes of TSAs that use a novel hybrid glenoid component.
Materials and Methods
This study was approved (protocol AAAD3473) by the Institutional Review Board of Columbia University and was conducted in compliance with Health Insurance Portability and Accountability Act (HIPAA) regulations.
Patient Selection
At Columbia University Medical Center, Dr. Bigliani performed 196 TSAs with a hybrid glenoid component (Bigliani-Flatow; Zimmer Biomet) in 169 patients between September 1998 and November 2007. All patients had received a diagnosis of primary glenohumeral arthritis as defined by Neer.18 Patients with previous surgery such as rotator cuff repair or subacromial decompression were included in our review, and patients with a nonprimary form of arthritis, such as rheumatoid, posttraumatic, or post-capsulorrhaphy arthritis, were excluded.
Operative Technique
For all surgeries, Dr. Bigliani performed a subscapularis tenotomy with regional anesthesia and a standard deltopectoral approach. A partial anterior capsulectomy was performed to increase the glenoid’s visibility. The inferior labrum was removed with a needle-tip bovie while the axillary nerve was being protected with a metal finger or narrow Darrach retractor. After reaming and trialing, the final glenoid component was cemented into place. Cement was placed only in the peg or keel holes and pressurized twice before final implantation. Of the 196 glenoid components, 168 (86%) were pegged and 28 (14%) keeled; in addition,190 of these components were all-polyethylene, whereas 6 had trabecular-metal backing. All glenoid components incorporated the hybrid design of dual radii of curvature. After the glenoid was cemented, the final humeral component was placed in 30° of retroversion. Whenever posterior wear was found, retroversion was reduced by 5° to 10°. The humeral prosthesis was cemented in cases (104/196, 53%) of poor bone quality or a large canal.
After surgery, the patient’s sling was fitted with an abduction pillow and a swathe, to be worn the first 24 hours, and the arm was passively ranged. Patients typically were discharged on postoperative day 2. Then, for 2 weeks, they followed an assisted passive range of motion (ROM) protocol, with limited external rotation, for promotion of subscapularis healing.
Clinical Outcomes
Dr. Bigliani assessed preoperative ROM in all planes. During initial evaluation, patients completed a questionnaire that consisted of the 36-Item Short Form Health Survey19,20 (SF-36) and the American Shoulder and Elbow Surgeons21 (ASES) and Simple Shoulder Test22 (SST) surveys. Postoperative clinical data were collected from office follow-up visits, survey questionnaires, or both. Postoperative office data included ROM, subscapularis integrity testing (belly-press or lift-off), and any complications. Patients with <1 year of office follow-up were excluded. In addition, the same survey questionnaire that was used before surgery was mailed to all patients after surgery; then, for anyone who did not respond by mail, we attempted contact by telephone. Neer criteria were based on patients’ subjective assessment of each arm on a 3-point Likert scale (1 = very satisfied, 2 = satisfied, 3 = dissatisfied). Patients were also asked about any specific complications or revision operations since their index procedure.
Physical examination and office follow-up data were obtained for 129 patients (148/196 shoulders, 76% follow-up) at a mean of 3.7 years (range 1.0-10.2 years) after surgery. Surveys were completed by 117 patients (139/196 shoulders, 71% follow-up) at a mean of 5.1 years (range, 1.6-11.2 years) after surgery. Only 15 patients had neither 1 year of office follow-up nor a completed questionnaire. The remaining 154 patients (178/196 shoulders, 91% follow-up) had clinical follow-up with office, mail, or telephone questionnaire at a mean of 4.8 years (range, 1.0-11.2 years) after surgery. This cohort of patients was used to determine rates of surgical revisions, subscapularis tears, dislocations, and other complications.
Figure 2.Acromioplasty, performed in TSA patients who had subacromial impingement stemming from improved ROM, represented a second operation, and therefore the need for this surgery was deemed a complication as well. Figure 2 breaks down the 4 major study cohorts.
Radiographic Outcomes
Patients were included in the radiographic analysis if they had a shoulder radiograph at least 1 year after surgery. One hundred nineteen patients (136/196 shoulders, 69% follow-up) had radiographic follow-up at a mean of 3.7 years (range, 1.0-9.4 years) after surgery.
Table 1.All radiographs were independently assessed by 2 blinded physicians who were not involved in the index procedure. Any disputed radiographs were reassessed by these physicians together, until consensus was reached. Radiographs were reviewed for the presence of glenoid lucencies around the pegs or keel and were scored using the system of Lazarus and colleagues23 (Table 1). The humerus was assessed for total number of lucent lines in any of 8 periprosthetic zones, as described by Sperling and colleagues.24
Statistical Analysis
Statistical analysis was performed with Stata Version 10.0. Paired t tests were used to compare preoperative and postoperative numerical data, including ROM and survey scores. We calculated 95% confidence intervals (CIs) and set statistical significance at P < .05. For qualitative measures, the Fisher exact test was used. Survivorship analysis was performed according to the Kaplan-Meier method, with right-censored data for no event or missing data.25
Results
Clinical Analysis of Demographics
In demographics, the clinical and radiographic patient subgroups were similar to each other and to the overall study population (Table 2). Of 196 patients overall, 16 (8%) had a concomitant rotator cuff repair, and 27 (14%) underwent staged bilateral shoulder arthroplasties.
Table 2.
Clinical Analysis of ROM and Survey Scores
Operative shoulder ROM in forward elevation, external rotation at side, external rotation in abduction, and internal rotation all showed statistically significant (P < .001) improvement from before surgery to after surgery. Over 3.7 years, mean (SD) forward elevation improved from 107.3° (34.8°) to 159.0° (29.4°), external rotation at side improved from 20.4° (16.7°) to 49.4° (11.3°), and external rotation in abduction improved from 53.7° (24.3°) to 84.7° (9.1°). Internal rotation improved from a mean (SD) vertebral level of S1 (6.0 levels) to T9 (3.7 levels).
All validated survey scores also showed statistically significant (P < .001) improvement from before surgery to after surgery. Over 5.1 years, mean (SD) SF-36 scores improved from 64.9 (13.4) to 73.6 (17.1), ASES scores improved from 41.1 (22.5) to 82.7 (17.7), SST scores improved from 3.9 (2.8) to 9.7 (2.2), and visual analog scale pain scores improved from 5.6 (3.2) to 1.4 (2.1). Of 139 patients with follow-up, 130 (93.5%) were either satisfied or very satisfied with their TSA, and only 119 (86%) were either satisfied or very satisfied with the nonoperative shoulder.
Clinical Analysis of Postoperative Complications
Of the 178 shoulders evaluated for complications, 3 (1.7%) underwent revision surgery. Mean time to revision was 2.3 years (range, 1.5-3.9 years). Two revisions involved the glenoid component, and the third involved the humerus. In one of the glenoid cases, a 77-year-old woman fell and sustained a fracture at the base of the trabecular metal glenoid pegs; her component was revised to an all-polyethylene component, and she had no further complications. In the other glenoid case, a 73-year-old man’s all-polyethylene component loosened after 2 years and was revised to a trabecular metal implant, which loosened as well and was later converted to a hemiarthroplasty. In the humeral case, a 33-year-old man had his 4-year-old index TSA revised to a cemented stem and had no further complications.
Table 3.Of the 148 patients with office follow-up, only 8 had a positive belly-press or lift-off test. Of all 178 clinical study shoulders, 10 (5.6%) had a subscapularis tear confirmed by magnetic resonance imaging or a physician. Of these 10 tears, 3 resulted from traumatic falls. Four of the 10 tears were managed nonoperatively, and the other 6 underwent surgical repair at a mean of 2.9 years (range, 0.3-7.8 years) after index TSA. In 2 of the 6 repair cases, a 46-mm humeral head had been used, and, in the other 4 cases, a 52-mm humeral head. Of the 6 repaired tears, 2 were massive, and 4 were isolated to the subscapularis. None of these 6 tears required a second repair. Seven (4%) of the 178 shoulders experienced a clinically significant posterosuperior subluxation or dislocation; 5 of the 7 were managed nonoperatively, and the other 2 underwent open capsular shift, at 0.5 year and 3.0 years, respectively. Table 3 lists the other postoperative complications that required surgery.
Table 4.
Table 4 compares the clinical and radiographic outcomes of patients who required subscapularis repair, capsular shift, or implant revision with the outcomes of all other study patients, and Figure 3 shows Kaplan-Meier survivorship.
Figure 3.
Postoperative Radiographic Analysis
Glenoid Component. At a mean of 3.7 years (minimum, 1 year) after surgery, 86 (63%) of 136 radiographically evaluated shoulders showed no glenoid lucencies; the other 50 (37%) showed ≥1 lucency. Of the 136 shoulders, 33 (24%) had a Lazarus score of 1, 15 (11%) had a score of 2, and only 2 (2%) had a score of 3. None of the shoulders had a score of 4 or 5.
Humeral Component. Of the 136 shoulders, 91 (67%) showed no lucencies in any of the 8 humeral stem zones; the other 45 (33%) showed 1 to 3 lucencies. Thirty (22%) of the 136 shoulders had 1 stem lucency zone, 8 (6%) had 2, and 3 (2%) had 3. None of the shoulders had >3 periprosthetic zones with lucent lines.
Discussion
In this article, we describe a hybrid glenoid TSA component with dual radii of curvature. Its central portion is congruent with the humeral head, and its peripheral portion is noncongruent and larger. The most significant finding of our study is the low rate (1.1%) of glenoid component revision 4.8 years after surgery. This rate is the lowest that has been reported in a study of ≥100 patients. Overall implant survival appeared as an almost flat Kaplan-Meir curve. We attribute this low revision rate to improved biomechanics with the hybrid glenoid design.
Symptomatic glenoid component loosening is the most common TSA complication.1,26-28 In a review of 73 Neer TSAs, Cofield7 found glenoid radiolucencies in 71% of patients 3.8 years after surgery. Radiographic evidence of loosening, defined as component migration, or tilt, or a circumferential lucency 1.5 mm thick, was present in another 11% of patients, and 4.1% developed symptomatic loosening that required glenoid revision. In a study with 12.2-year follow-up, Torchia and colleagues3 found rates of 84% for glenoid radiolucencies, 44% for radiographic loosening, and 5.6% for symptomatic loosening that required revision. In a systematic review of studies with follow-up of ≥10 years, Bohsali and colleagues27 found similar lucency and radiographic loosening rates and a 7% glenoid revision rate. These data suggest glenoid radiolucencies may progress to component loosening.
Degree of joint congruence is a key factor in glenoid loosening. Neer’s congruent design increases the contact area with concentric loading and reduces glenohumeral translation, which leads to reduced polyethylene wear and improved joint stability. In extreme arm positions, however, humeral head subluxation results in edge loading and a glenoid rocking-horse effect.9-13,17,29-31 Conversely, nonconforming implants allow increased glenohumeral translation without edge loading,14 though they also reduce the relative glenohumeral contact area and thus transmit more contact stress to the glenoid.16,17 A hybrid glenoid component with central conforming and peripheral nonconforming zones may reduce the rocking-horse effect while maximizing ROM and joint stability. Wang and colleagues32 studied the biomechanical properties of this glenoid design and found that the addition of a central conforming region did not increase edge loading.
Additional results from our study support the efficacy of a hybrid glenoid component. Patients’ clinical outcomes improved significantly. At 5.1 years after surgery, 93.5% of patients were satisfied or very satisfied with their procedure and reported less satisfaction (86%) with the nonoperative shoulder. Also significant was the reduced number of radiolucencies. At 3.7 years after surgery, the overall percentage of shoulders with ≥1 glenoid radiolucency was 37%, considerably lower than the 82% reported by Cofield7 and the rates in more recent studies.3,16,33-36 Of the 178 shoulders in our study, 10 (5.6%) had subscapularis tears, and 6 (3.4%) of 178 had these tears surgically repaired. This 3.4% compares favorably with the 5.9% (of 119 patients) found by Miller and colleagues37 28 months after surgery. Of our 178 shoulders, 27 (15.2%) had clinically significant postoperative complications; 18 (10.1%) of the 178 had these complications surgically treated, and 9 (5.1%) had them managed nonoperatively. Bohsali and colleagues27 systematically reviewed 33 TSA studies and found a slightly higher complication rate (16.3%) 5.3 years after surgery. Furthermore, in our study, the 11 patients who underwent revision, capsular shift, or subscapularis repair had final outcomes comparable to those of the rest of our study population.
Our study had several potential weaknesses. First, its minimum clinical and radiographic follow-up was 1 year, whereas most long-term TSA series set a minimum of 2 years. We used 1 year because this was the first clinical study of the hybrid glenoid component design, and we wanted to maximize its sample size by reporting on intermediate-length outcomes. Even so, 93% (166/178) of our clinical patients and 83% (113/136) of our radiographic patients have had ≥2 years of follow-up, and we continue to follow all study patients for long-term outcomes. Another weakness of the study was its lack of a uniform group of patients with all the office, survey, complications, and radiographic data. Our retrospective study design made it difficult to obtain such a group without significantly reducing the sample size, so we divided patients into 4 data groups. A third potential weakness was the study’s variable method for collecting complications data. Rates of complications in the 178 shoulders were calculated from either office evaluation or patient self-report by mail or telephone. This data collection method is subject to recall bias, but mail and telephone contact was needed so the study would capture the large number of patients who had traveled to our institution for their surgery or had since moved away. Fourth, belly-press and lift-off tests were used in part to assess subscapularis function, but recent literature suggests post-TSA subscapularis assessment can be unreliable.38 These tests may be positive in up to two-thirds of patients after 2 years.39 Fifth, the generalizability of our findings to diagnoses such as rheumatoid and posttraumatic arthritis is limited. We had to restrict the study to patients with primary glenohumeral arthritis in order to minimize confounders.
This study’s main strength is its description of the clinical and radiographic outcomes of using a single prosthetic system in operations performed by a single surgeon in a large number of patients. This was the first and largest study evaluating the clinical and radiographic outcomes of this hybrid glenoid implant. Excluding patients with nonprimary arthritis allowed us to minimize potential confounding factors that affect patient outcomes. In conclusion, our study results showed the favorable clinical and radiographic outcomes of TSAs that have a hybrid glenoid component with dual radii of curvature. At a mean of 3.7 years after surgery, 63% of patients had no glenoid lucencies, and, at a mean of 4.8 years, only 1.7% of patients required revision. We continue to follow these patients to obtain long-term results of this innovative prosthesis.
References
1. Rodosky MW, Bigliani LU. Indications for glenoid resurfacing in shoulder arthroplasty. J Shoulder Elbow Surg. 1996;5(3):231-248.
2. Boyd AD Jr, Thomas WH, Scott RD, Sledge CB, Thornhill TS. Total shoulder arthroplasty versus hemiarthroplasty. Indications for glenoid resurfacing. J Arthroplasty. 1990;5(4):329-336.
3. Torchia ME, Cofield RH, Settergren CR. Total shoulder arthroplasty with the Neer prosthesis: long-term results. J Shoulder Elbow Surg. 1997;6(6):495-505.
4. Iannotti JP, Norris TR. Influence of preoperative factors on outcome of shoulder arthroplasty for glenohumeral osteoarthritis. J Bone Joint Surg Am. 2003;85(2):251-258.
5. Cofield RH. Degenerative and arthritic problems of the glenohumeral joint. In: Rockwood CA, Matsen FA, eds. The Shoulder. Philadelphia, PA: Saunders; 1990:740-745.
6. Neer CS 2nd, Watson KC, Stanton FJ. Recent experience in total shoulder replacement. J Bone Joint Surg Am. 1982;64(3):319-337.
7. Cofield RH. Total shoulder arthroplasty with the Neer prosthesis. J Bone Joint Surg Am. 1984;66(6):899-906.
8. Karduna AR, Williams GR, Williams JL, Iannotti JP. Kinematics of the glenohumeral joint: influences of muscle forces, ligamentous constraints, and articular geometry. J Orthop Res. 1996;14(6):986-993.
9. Karduna AR, Williams GR, Iannotti JP, Williams JL. Total shoulder arthroplasty biomechanics: a study of the forces and strains at the glenoid component. J Biomech Eng. 1998;120(1):92-99.
10. Karduna AR, Williams GR, Williams JL, Iannotti JP. Glenohumeral joint translations before and after total shoulder arthroplasty. A study in cadavera. J Bone Joint Surg Am. 1997;79(8):1166-1174.
11. Matsen FA 3rd, Clinton J, Lynch J, Bertelsen A, Richardson ML. Glenoid component failure in total shoulder arthroplasty. J Bone Joint Surg Am. 2008;90(4):885-896.
12. Franklin JL, Barrett WP, Jackins SE, Matsen FA 3rd. Glenoid loosening in total shoulder arthroplasty. Association with rotator cuff deficiency. J Arthroplasty. 1988;3(1):39-46.
13. Barrett WP, Franklin JL, Jackins SE, Wyss CR, Matsen FA 3rd. Total shoulder arthroplasty. J Bone Joint Surg Am. 1987;69(6):865-872.
14. Harryman DT, Sidles JA, Harris SL, Lippitt SB, Matsen FA 3rd. The effect of articular conformity and the size of the humeral head component on laxity and motion after glenohumeral arthroplasty. A study in cadavera. J Bone Joint Surg Am. 1995;77(4):555-563.
15. Flatow EL. Prosthetic design considerations in total shoulder arthroplasty. Semin Arthroplasty. 1995;6(4):233-244.
16. Klimkiewicz JJ, Iannotti JP, Rubash HE, Shanbhag AS. Aseptic loosening of the humeral component in total shoulder arthroplasty. J Shoulder Elbow Surg. 1998;7(4):422-426.
17. Wang VM, Krishnan R, Ugwonali OF, Flatow EL, Bigliani LU, Ateshian GA. Biomechanical evaluation of a novel glenoid design in total shoulder arthroplasty. J Shoulder Elbow Surg. 2005;14(1 suppl S):129S-140S.
18. Neer CS 2nd. Replacement arthroplasty for glenohumeral osteoarthritis. J Bone Joint Surg Am. 1974;56(1):1-13.
19. Boorman RS, Kopjar B, Fehringer E, Churchill RS, Smith K, Matsen FA 3rd. The effect of total shoulder arthroplasty on self-assessed health status is comparable to that of total hip arthroplasty and coronary artery bypass grafting. J Shoulder Elbow Surg. 2003;12(2):158-163.
20. Patel AA, Donegan D, Albert T. The 36-Item Short Form. J Am Acad Orthop Surg. 2007;15(2):126-134.
21. Richards RR, An KN, Bigliani LU, et al. A standardized method for the assessment of shoulder function. J Shoulder Elbow Surg. 1994;3(6):347-352.
22. Wright RW, Baumgarten KM. Shoulder outcomes measures. J Am Acad Orthop Surg. 2010;18(7):436-444.
23. Lazarus MD, Jensen KL, Southworth C, Matsen FA 3rd. The radiographic evaluation of keeled and pegged glenoid component insertion. J Bone Joint Surg Am. 2002;84(7):1174-1182.
24. Sperling JW, Cofield RH, O’Driscoll SW, Torchia ME, Rowland CM. Radiographic assessment of ingrowth total shoulder arthroplasty. J Shoulder Elbow Surg. 2000;9(6):507-513.
25. Dinse GE, Lagakos SW. Nonparametric estimation of lifetime and disease onset distributions from incomplete observations. Biometrics. 1982;38(4):921-932.
26. Baumgarten KM, Lashgari CJ, Yamaguchi K. Glenoid resurfacing in shoulder arthroplasty: indications and contraindications. Instr Course Lect. 2004;53:3-11.
27. Bohsali KI, Wirth MA, Rockwood CA Jr. Complications of total shoulder arthroplasty. J Bone Joint Surg Am. 2006;88(10):2279-2292.
28. Wirth MA, Rockwood CA Jr. Complications of total shoulder-replacement arthroplasty. J Bone Joint Surg Am. 1996;78(4):603-616.
29. Poppen NK, Walker PS. Normal and abnormal motion of the shoulder. J Bone Joint Surg Am. 1976;58(2):195-201.
30. Cotton RE, Rideout DF. Tears of the humeral rotator cuff; a radiological and pathological necropsy survey. J Bone Joint Surg Br. 1964;46:314-328.
31. Bigliani LU, Kelkar R, Flatow EL, Pollock RG, Mow VC. Glenohumeral stability. Biomechanical properties of passive and active stabilizers. Clin Orthop Relat Res. 1996;(330):13-30.
32. Wang VM, Sugalski MT, Levine WN, Pawluk RJ, Mow VC, Bigliani LU. Comparison of glenohumeral mechanics following a capsular shift and anterior tightening. J Bone Joint Surg Am. 2005;87(6):1312-1322.
33. Young A, Walch G, Boileau P, et al. A multicentre study of the long-term results of using a flat-back polyethylene glenoid component in shoulder replacement for primary osteoarthritis. J Bone Joint Surg Br. 2011;93(2):210-216.
34. Khan A, Bunker TD, Kitson JB. Clinical and radiological follow-up of the Aequalis third-generation cemented total shoulder replacement: a minimum ten-year study. J Bone Joint Surg Br. 2009;91(12):1594-1600.
35. Walch G, Edwards TB, Boulahia A, Boileau P, Mole D, Adeleine P. The influence of glenohumeral prosthetic mismatch on glenoid radiolucent lines: results of a multicenter study. J Bone Joint Surg Am. 2002;84(12):2186-2191.
36. Bartelt R, Sperling JW, Schleck CD, Cofield RH. Shoulder arthroplasty in patients aged fifty-five years or younger with osteoarthritis. J Shoulder Elbow Surg. 2011;20(1):123-130.
37. Miller BS, Joseph TA, Noonan TJ, Horan MP, Hawkins RJ. Rupture of the subscapularis tendon after shoulder arthroplasty: diagnosis, treatment, and outcome. J Shoulder Elbow Surg. 2005;14(5):492-496.
38. Armstrong A, Lashgari C, Teefey S, Menendez J, Yamaguchi K, Galatz LM. Ultrasound evaluation and clinical correlation of subscapularis repair after total shoulder arthroplasty. J Shoulder Elbow Surg. 2006;15(5):541-548.
39. Miller SL, Hazrati Y, Klepps S, Chiang A, Flatow EL. Loss of subscapularis function after total shoulder replacement: a seldom recognized problem. J Shoulder Elbow Surg. 2003;12(1):29-34.
PFA improved knee function and pain scores in patients with isolated patellofemoral arthritis.
The majority (84.2%) of patients undergoing PFA were female.
Regardless of age or gender, 72.2% of patients returned to their desired preoperative activity after PFA, and 52.8% returned at the same or higher level.
The rate of conversion from PFA to TKA was 6.3%.
PFA is an alternative to TKA in active patients with isolated patellofemoral arthritis.
Compared with total knee arthroplasty (TKA), single-compartment knee arthroplasty may provide better physiologic function, faster recovery, and higher rates of return to activities in patients with unicompartmental knee disease.1-3 In 1955, McKeever4 introduced patellar arthroplasty for surgical management of isolated patellofemoral arthritis. In 1979, Lubinus5 improved on the technique and design by adding a femoral component. Since then, implants and techniques have been developed to effect better clinical outcomes. Patellofemoral arthroplasty (PFA) has many advantages over TKA in the treatment of patellofemoral arthritis. PFA is less invasive, requires shorter tourniquet times, has faster recovery, and spares the tibiofemoral compartment, leaving more native bone for potential conversion to TKA. Regarding activity and function, the resurfacing arthroplasty (vs TKA) allows maintenance of nearly normal knee kinematics.
Despite these advantages, the broader orthopedic surgery community has only cautiously accepted PFA. The procedure has high complication rates. Persistent instability, malalignment, wear, impingement, and tibiofemoral arthritis progression can occur after PFA.6 Although first-generation PFA prostheses often failed because of mechanical problems, loosening, maltracking, or instability,7 the most common indication for PFA revision has been, according to a recent large retrospective study,8 unexplained pain. More than 10 to 15 years after PFA, tibiofemoral arthritis may be the primary mechanism of failure.9 Nevertheless, compared with standard TKA for isolated patellofemoral arthritis, modern PFA does not have significantly different clinical outcomes, including complication and revision rates.6Numerous patient factors influence functional prognosis before and after knee arthroplasty, regardless of surgical technique and implant used. Age, comorbidities, athletic status, mental health, pain, functional limitations, excessive caution, “artificial joint”–related worries, and rehabilitation protocol all influence function.10 Return to activity and other quality-of-life indices are important aspects of postoperative patient satisfaction.
Methods
We conducted a retrospective cohort study to describe functional status after PFA for patellofemoral arthritis. We identified 48 consecutive PFAs (39 patients) performed by a team of 2 orthopedic surgeons (specialists in treating patellofemoral pathology) between 2009 and 2014.
Three validated patient-reported outcome measures (PROMs) were used to determine preoperative (baseline) and postoperative functional status: Kujala score, Lysholm score, and International Knee Documentation Committee (IKDC) score. The Kujala score is a measure of knee function specific to the patellofemoral joint; the Lysholm score focuses on activities related to the knee; and the IKDC score is a general measure of knee function. Charts were reviewed to extract patients’ clinical data, including preoperative outcome scores, medical history, physical examination data, intraoperative characteristics, and postoperative course. By telephone, patients answered questions about their postoperative clinical course and completed final follow-up questionnaires. They were also asked which sporting or fitness activity they had preferred before surgery and whether they were able to return to that activity after surgery.
Statistical analysis included the study population’s descriptive statistics. Means and SDs were reported for continuous variables, and frequencies and percentages were reported for categorical variables. Paired t tests were used to analyze changes in PROM scores. For comparison of differences between characteristics of patients who did and did not return to their previous activity level, independent-samples t tests were used for continuous variables. Chi-square tests or Fisher exact tests were used to compare discrete variables. Statistical significance was set at P ≤ .05. All analyses were performed with SPSS Version 22.0 (IBM).
Results
Table 1.Thirty-nine patients underwent PFA at our institution between 2009 and 2014. Mean age was 51.6 years. Of these patients, 84.2% were female, 28.6% had a body mass index of 30 kg/m2 or higher, and 23.4% had PFA for posttraumatic arthritis related to prior patellofemoral instability. Table 1 lists the study cohort’s demographic data.
Table 2.Table 2 lists self-reported activities limited by the affected knee before surgery, and Table 3 lists activity levels after surgery. Return to previous preferred activity was reported by 72.2% of patients, and 52.8% of patients reported returning to the same activity level or to a higher level. There were no differences in age (P = .978) or sex (P = .232) between patients who returned to the same or a higher activity level and patients who did not.
Table 3.However, mean BMI was significantly (P = .016) higher in patients who returned to the same or a higher activity level (28.6 kg/m2) than in patients who did not (23.7 kg/m2). Although the rate of posttraumatic arthritis (26%) was higher than the rate of primary osteoarthritis (19%) in patients who returned to the same or a higher activity level, this difference was not statistically significant (P = .724).
Postoperative knee-specific PROM scores and general pain score (reported by the patient on a scale of 0-10) were statistically significantly improved (P < .001 for all measures) over preoperative scores (Table 4).
Table 4.Mean follow-up was 26 months (range, 5-57 months). Kujala score improved a mean of 19.5 points; Lysholm score, 28.9 points; and IKDC score, 23.5 points. Mean general pain score improved from 6.3 before surgery to 2.8 after surgery. All PROM and pain score improvements were substantially larger than the minimal clinically important differences. Postoperative PROM scores and general pain score were significantly more improved in patients who returned to the same or a higher activity level than in patients who did not (P < .05 for all measures).
After surgery, 1 patient (2.6%) developed a pulmonary embolus, which was successfully identified and treated without incident. Five patients (10.4%) had another surgery on the same knee. Three patients (6.3%) underwent conversion to TKA: 1 for continued symptoms in the setting of newly diagnosed inflammatory arthritis, 1 for arthritic pain, and 1 for patellofemoral instability. Two patients (4.2%) underwent irrigation and débridement: 1 for hematoma and 1 for suspected (culture-negative) infection.
Discussion
Historically, the literature evaluating knee arthroplasty outcomes has focused on implant survivorship, pain relief, and patient satisfaction. Since the advent of partial knee arthroplasty options, more attention has been given to functional outcomes and return to activities after single-compartment knee resurfacing. TKA remains the gold standard by which newer, less invasive surgical options are measured. In a large prospective study, 97% of patients (age, >55 years) who had TKA for patellofemoral arthritis reported good or excellent clinical results, the majority being excellent.11 Post-TKA functional status and activity levels may not be rated as highly. After TKA, many patients switch to lower impact sports or reduce or stop their participation in sports.12 A small study of competitive adult tennis players found high levels of post-TKA satisfaction, ability to resume playing tennis, pain relief, and increased or continued enjoyment in playing.13 In a study of 355 patients (417 knees) who had underwent TKA, improvement in Knee Society function score showed a moderate correlation to an increase in weighted activity score (R = 0.362).14
Unicondylar knee arthroplasty (UKA) is becoming a popular treatment option for single-compartment tibiofemoral arthritis. A systematic review of 18 original studies of patients with knee osteoarthritis found that overall return to sports varied from 36% to 89% after TKA and from 75% to 100% after UKA.15 In another study, return-to-sports rates were similar for UKA (87%) and TKA (83%); the only significant difference was UKA patients returned quicker.16 The authors of a large meta-analysis conceded that significant heterogeneity of data prevented them from drawing definitive conclusions, but UKA patients seemed to return to low- and high-impact sports 2 weeks faster than their TKA counterparts.10 Overall, UKA and TKA patients (age, 51-71 years) had comparable return-to-sports rates at an average of 4 years after surgery.10 A smaller study corroborated faster return to sports for UKA over TKA patients and also found that, compared with TKA patients, UKA patients participated in sports more regularly and over a longer period.17 On the other hand, Walton and colleagues18 found similar return-to-sports rates but higher frequency of and satisfaction with sports participation in UKA over TKA patients.
A large retrospective study found no differences in rates of return to sports after TKA, UKA, patellar resurfacing, hip resurfacing, and total hip arthroplasty.19 Pain was the most common barrier to return. UKA patients who returned to sports tended to be younger than those who did not.20 Naal and colleagues3 found that 95% of UKA patients returned to their activities—hiking, walking, cycling, and swimming being most common. Although 90.3% of patients said surgery maintained or improved their ability to participate in sports, participation in high-impact sports (eg, running) decreased after surgery.
Outcomes of PFA vary because of evolving patient selection, implant design, surgical technique, and return-to-activity expectations.21,22 Most PFA outcome studies focus on implant survivorship, complication rates, and postoperative knee scores.23-28 PFA studies focused on return to activities are limited. Kooijman and colleagues7 and Mertl and colleagues29 reported good or excellent clinical results of PFA in 86% and 82% of patients, respectively. Neither study included a comprehensive analysis of postoperative functional status. Similarly, De Cloedt and colleagues30 reported good PFA outcomes in 43% of patients with degenerative joint disease and in 83% of patients with instability. Specific activity status was not described. Dahm and colleagues31 and Farr and colleagues32 suggested postoperative pain resolution motivates some PFA patients not only to resume preoperative activities but to start participating in new, higher level activities after pain has subsided. However, the studies did not examine the characteristics of patients who returned to baseline activities and did not examine return-to-sports rates.
Study Strengths and Limitations
Our study focused on the PFA patient population of a surgical team of 2 fellowship-trained orthopedic surgeons (specialists in treating patellofemoral pathology). Although generalization of our findings to other surgeons and different implants may be limited, the study design standardized treatment in a way that makes these findings more reliable. The 100% follow-up strengthens these findings as well. Last, though the patient population was relatively small, it was consistent with or larger than the PFA patient groups studied previously.
Conclusion
In this study, PROM and pain scores were significantly improved after PFA. That almost 75% of patients returned to their preferred activities and >50% of patients returned at the same or a higher activity level provides useful information for preoperative discussions with patients who want to remain active after PFA. Prospective studies are needed to evaluate the longevity and durability of PFA, particularly in active patients.
References
1. Laurencin CT, Zelicof SB, Scott RD, Ewald FC. Unicompartmental versus total knee arthroplasty in the same patient. A comparative study. Clin Orthop Relat Res. 1991;(273):151-156.
2. Kozinn SC, Scott R. Unicondylar knee arthroplasty. J Bone Joint Surg Am. 1989;71(1):145-150.
3. Naal FD, Fischer M, Preuss A, et al. Return to sports and recreational activity after unicompartmental knee arthroplasty. Am J Sports Med. 2007;35(10):1688-1695.
5. Lubinus HH. Patella glide bearing total replacement. Orthopedics. 1979;2(2):119-127.
6. Dy CJ, Franco N, Ma Y, Mazumdar M, McCarthy MM, Gonzalez Della Valle A. Complications after patello-femoral versus total knee replacement in the treatment of isolated patello-femoral osteoarthritis. A meta-analysis. Knee Surg Sports Traumatol Arthrosc. 2012;20(11):2174-2190.
7. Kooijman HJ, Driessen AP, van Horn JR. Long-term results of patellofemoral arthroplasty. A report of 56 arthroplasties with 17 years of follow-up. J Bone Joint Surg Br. 2003;85(6):836-840.
8. Baker PN, Refaie R, Gregg P, Deehan D. Revision following patello-femoral arthroplasty. Knee Surg Sports Traumatol Arthrosc. 2012;20(10):2047-2053.
9. Lonner JH, Bloomfield MR. The clinical outcome of patellofemoral arthroplasty. Orthop Clin North Am. 2013;44(3):271-280.
10. Papalia R, Del Buono A, Zampogna B, Maffulli N, Denaro V. Sport activity following joint arthroplasty: a systematic review. Br Med Bull. 2012;101:81-103.
11. Mont MA, Haas S, Mullick T, Hungerford DS. Total knee arthroplasty for patellofemoral arthritis. J Bone Joint Surg Am. 2002;84(11):1977-1981.
12. Chatterji U, Ashworth MJ, Lewis PL, Dobson PJ. Effect of total knee arthroplasty on recreational and sporting activity. ANZ J Surg. 2005;75(6):405-408.
13. Mont MA, Rajadhyaksha AD, Marxen JL, Silberstein CE, Hungerford DS. Tennis after total knee arthroplasty. Am J Sports Med. 2002;30(2):163-166.
14. Marker DR, Mont MA, Seyler TM, McGrath MS, Kolisek FR, Bonutti PM. Does functional improvement following TKA correlate to increased sports activity? Iowa Orthop J. 2009;29:11-16.
15. Witjes S, Gouttebarge V, Kuijer PP, van Geenen RC, Poolman RW, Kerkhoffs GM. Return to sports and physical activity after total and unicondylar knee arthroplasty: a systematic review and meta-analysis. Sports Med. 2016;46(2):269-292.
16. Ho JC, Stitzlein RN, Green CJ, Stoner T, Froimson MI. Return to sports activity following UKA and TKA. J Knee Surg. 2016;29(3):254-259.
17. Hopper GP, Leach WJ. Participation in sporting activities following knee replacement: total versus unicompartmental. Knee Surg Sports Traumatol Arthrosc. 2008;16(10):973-979.
18. Walton NP, Jahromi I, Lewis PL, Dobson PJ, Angel KR, Campbell DG. Patient-perceived outcomes and return to sport and work: TKA versus mini-incision unicompartmental knee arthroplasty. J Knee Surg. 2006;19(2):112-116.
19. Wylde V, Blom A, Dieppe P, Hewlett S, Learmonth I. Return to sport after joint replacement. J Bone Joint Surg Br. 2008;90(7):920-923.
20. Pietschmann MF, Wohlleb L, Weber P, et al. Sports activities after medial unicompartmental knee arthroplasty Oxford III—what can we expect? Int Orthop. 2013;37(1):31-37.
28. Leadbetter WB, Seyler TM, Ragland PS, Mont MA. Indications, contraindications, and pitfalls of patellofemoral arthroplasty. J Bone Joint Surg Am. 2006;88(suppl 4):122-137.
29. Mertl P, Van FT, Bonhomme P, Vives P. Femoropatellar osteoarthritis treated by prosthesis. Retrospective study of 50 implants [in French]. Rev Chir Orthop Reparatrice Appar Mot. 1997;83(8):712-718.
30. De Cloedt P, Legaye J, Lokietek W. Femoro-patellar prosthesis. A retrospective study of 45 consecutive cases with a follow-up of 3-12 years [in French]. Acta Orthop Belg. 1999;65(2):170-175.
31. Dahm DL, Al-Rayashi W, Dajani K, Shah JP, Levy BA, Stuart MJ. Patellofemoral arthroplasty versus total knee arthroplasty in patients with isolated patellofemoral osteoarthritis. Am J Orthop. 2010;39(10):487-491.
32. Farr J, Arendt E, Dahm D, Daynes J. Patellofemoral arthroplasty in the athlete. Clin Sports Med. 2014;33(3):547-552.
PFA improved knee function and pain scores in patients with isolated patellofemoral arthritis.
The majority (84.2%) of patients undergoing PFA were female.
Regardless of age or gender, 72.2% of patients returned to their desired preoperative activity after PFA, and 52.8% returned at the same or higher level.
The rate of conversion from PFA to TKA was 6.3%.
PFA is an alternative to TKA in active patients with isolated patellofemoral arthritis.
Compared with total knee arthroplasty (TKA), single-compartment knee arthroplasty may provide better physiologic function, faster recovery, and higher rates of return to activities in patients with unicompartmental knee disease.1-3 In 1955, McKeever4 introduced patellar arthroplasty for surgical management of isolated patellofemoral arthritis. In 1979, Lubinus5 improved on the technique and design by adding a femoral component. Since then, implants and techniques have been developed to effect better clinical outcomes. Patellofemoral arthroplasty (PFA) has many advantages over TKA in the treatment of patellofemoral arthritis. PFA is less invasive, requires shorter tourniquet times, has faster recovery, and spares the tibiofemoral compartment, leaving more native bone for potential conversion to TKA. Regarding activity and function, the resurfacing arthroplasty (vs TKA) allows maintenance of nearly normal knee kinematics.
Despite these advantages, the broader orthopedic surgery community has only cautiously accepted PFA. The procedure has high complication rates. Persistent instability, malalignment, wear, impingement, and tibiofemoral arthritis progression can occur after PFA.6 Although first-generation PFA prostheses often failed because of mechanical problems, loosening, maltracking, or instability,7 the most common indication for PFA revision has been, according to a recent large retrospective study,8 unexplained pain. More than 10 to 15 years after PFA, tibiofemoral arthritis may be the primary mechanism of failure.9 Nevertheless, compared with standard TKA for isolated patellofemoral arthritis, modern PFA does not have significantly different clinical outcomes, including complication and revision rates.6Numerous patient factors influence functional prognosis before and after knee arthroplasty, regardless of surgical technique and implant used. Age, comorbidities, athletic status, mental health, pain, functional limitations, excessive caution, “artificial joint”–related worries, and rehabilitation protocol all influence function.10 Return to activity and other quality-of-life indices are important aspects of postoperative patient satisfaction.
Methods
We conducted a retrospective cohort study to describe functional status after PFA for patellofemoral arthritis. We identified 48 consecutive PFAs (39 patients) performed by a team of 2 orthopedic surgeons (specialists in treating patellofemoral pathology) between 2009 and 2014.
Three validated patient-reported outcome measures (PROMs) were used to determine preoperative (baseline) and postoperative functional status: Kujala score, Lysholm score, and International Knee Documentation Committee (IKDC) score. The Kujala score is a measure of knee function specific to the patellofemoral joint; the Lysholm score focuses on activities related to the knee; and the IKDC score is a general measure of knee function. Charts were reviewed to extract patients’ clinical data, including preoperative outcome scores, medical history, physical examination data, intraoperative characteristics, and postoperative course. By telephone, patients answered questions about their postoperative clinical course and completed final follow-up questionnaires. They were also asked which sporting or fitness activity they had preferred before surgery and whether they were able to return to that activity after surgery.
Statistical analysis included the study population’s descriptive statistics. Means and SDs were reported for continuous variables, and frequencies and percentages were reported for categorical variables. Paired t tests were used to analyze changes in PROM scores. For comparison of differences between characteristics of patients who did and did not return to their previous activity level, independent-samples t tests were used for continuous variables. Chi-square tests or Fisher exact tests were used to compare discrete variables. Statistical significance was set at P ≤ .05. All analyses were performed with SPSS Version 22.0 (IBM).
Results
Table 1.Thirty-nine patients underwent PFA at our institution between 2009 and 2014. Mean age was 51.6 years. Of these patients, 84.2% were female, 28.6% had a body mass index of 30 kg/m2 or higher, and 23.4% had PFA for posttraumatic arthritis related to prior patellofemoral instability. Table 1 lists the study cohort’s demographic data.
Table 2.Table 2 lists self-reported activities limited by the affected knee before surgery, and Table 3 lists activity levels after surgery. Return to previous preferred activity was reported by 72.2% of patients, and 52.8% of patients reported returning to the same activity level or to a higher level. There were no differences in age (P = .978) or sex (P = .232) between patients who returned to the same or a higher activity level and patients who did not.
Table 3.However, mean BMI was significantly (P = .016) higher in patients who returned to the same or a higher activity level (28.6 kg/m2) than in patients who did not (23.7 kg/m2). Although the rate of posttraumatic arthritis (26%) was higher than the rate of primary osteoarthritis (19%) in patients who returned to the same or a higher activity level, this difference was not statistically significant (P = .724).
Postoperative knee-specific PROM scores and general pain score (reported by the patient on a scale of 0-10) were statistically significantly improved (P < .001 for all measures) over preoperative scores (Table 4).
Table 4.Mean follow-up was 26 months (range, 5-57 months). Kujala score improved a mean of 19.5 points; Lysholm score, 28.9 points; and IKDC score, 23.5 points. Mean general pain score improved from 6.3 before surgery to 2.8 after surgery. All PROM and pain score improvements were substantially larger than the minimal clinically important differences. Postoperative PROM scores and general pain score were significantly more improved in patients who returned to the same or a higher activity level than in patients who did not (P < .05 for all measures).
After surgery, 1 patient (2.6%) developed a pulmonary embolus, which was successfully identified and treated without incident. Five patients (10.4%) had another surgery on the same knee. Three patients (6.3%) underwent conversion to TKA: 1 for continued symptoms in the setting of newly diagnosed inflammatory arthritis, 1 for arthritic pain, and 1 for patellofemoral instability. Two patients (4.2%) underwent irrigation and débridement: 1 for hematoma and 1 for suspected (culture-negative) infection.
Discussion
Historically, the literature evaluating knee arthroplasty outcomes has focused on implant survivorship, pain relief, and patient satisfaction. Since the advent of partial knee arthroplasty options, more attention has been given to functional outcomes and return to activities after single-compartment knee resurfacing. TKA remains the gold standard by which newer, less invasive surgical options are measured. In a large prospective study, 97% of patients (age, >55 years) who had TKA for patellofemoral arthritis reported good or excellent clinical results, the majority being excellent.11 Post-TKA functional status and activity levels may not be rated as highly. After TKA, many patients switch to lower impact sports or reduce or stop their participation in sports.12 A small study of competitive adult tennis players found high levels of post-TKA satisfaction, ability to resume playing tennis, pain relief, and increased or continued enjoyment in playing.13 In a study of 355 patients (417 knees) who had underwent TKA, improvement in Knee Society function score showed a moderate correlation to an increase in weighted activity score (R = 0.362).14
Unicondylar knee arthroplasty (UKA) is becoming a popular treatment option for single-compartment tibiofemoral arthritis. A systematic review of 18 original studies of patients with knee osteoarthritis found that overall return to sports varied from 36% to 89% after TKA and from 75% to 100% after UKA.15 In another study, return-to-sports rates were similar for UKA (87%) and TKA (83%); the only significant difference was UKA patients returned quicker.16 The authors of a large meta-analysis conceded that significant heterogeneity of data prevented them from drawing definitive conclusions, but UKA patients seemed to return to low- and high-impact sports 2 weeks faster than their TKA counterparts.10 Overall, UKA and TKA patients (age, 51-71 years) had comparable return-to-sports rates at an average of 4 years after surgery.10 A smaller study corroborated faster return to sports for UKA over TKA patients and also found that, compared with TKA patients, UKA patients participated in sports more regularly and over a longer period.17 On the other hand, Walton and colleagues18 found similar return-to-sports rates but higher frequency of and satisfaction with sports participation in UKA over TKA patients.
A large retrospective study found no differences in rates of return to sports after TKA, UKA, patellar resurfacing, hip resurfacing, and total hip arthroplasty.19 Pain was the most common barrier to return. UKA patients who returned to sports tended to be younger than those who did not.20 Naal and colleagues3 found that 95% of UKA patients returned to their activities—hiking, walking, cycling, and swimming being most common. Although 90.3% of patients said surgery maintained or improved their ability to participate in sports, participation in high-impact sports (eg, running) decreased after surgery.
Outcomes of PFA vary because of evolving patient selection, implant design, surgical technique, and return-to-activity expectations.21,22 Most PFA outcome studies focus on implant survivorship, complication rates, and postoperative knee scores.23-28 PFA studies focused on return to activities are limited. Kooijman and colleagues7 and Mertl and colleagues29 reported good or excellent clinical results of PFA in 86% and 82% of patients, respectively. Neither study included a comprehensive analysis of postoperative functional status. Similarly, De Cloedt and colleagues30 reported good PFA outcomes in 43% of patients with degenerative joint disease and in 83% of patients with instability. Specific activity status was not described. Dahm and colleagues31 and Farr and colleagues32 suggested postoperative pain resolution motivates some PFA patients not only to resume preoperative activities but to start participating in new, higher level activities after pain has subsided. However, the studies did not examine the characteristics of patients who returned to baseline activities and did not examine return-to-sports rates.
Study Strengths and Limitations
Our study focused on the PFA patient population of a surgical team of 2 fellowship-trained orthopedic surgeons (specialists in treating patellofemoral pathology). Although generalization of our findings to other surgeons and different implants may be limited, the study design standardized treatment in a way that makes these findings more reliable. The 100% follow-up strengthens these findings as well. Last, though the patient population was relatively small, it was consistent with or larger than the PFA patient groups studied previously.
Conclusion
In this study, PROM and pain scores were significantly improved after PFA. That almost 75% of patients returned to their preferred activities and >50% of patients returned at the same or a higher activity level provides useful information for preoperative discussions with patients who want to remain active after PFA. Prospective studies are needed to evaluate the longevity and durability of PFA, particularly in active patients.
Take-Home Points
PFA improved knee function and pain scores in patients with isolated patellofemoral arthritis.
The majority (84.2%) of patients undergoing PFA were female.
Regardless of age or gender, 72.2% of patients returned to their desired preoperative activity after PFA, and 52.8% returned at the same or higher level.
The rate of conversion from PFA to TKA was 6.3%.
PFA is an alternative to TKA in active patients with isolated patellofemoral arthritis.
Compared with total knee arthroplasty (TKA), single-compartment knee arthroplasty may provide better physiologic function, faster recovery, and higher rates of return to activities in patients with unicompartmental knee disease.1-3 In 1955, McKeever4 introduced patellar arthroplasty for surgical management of isolated patellofemoral arthritis. In 1979, Lubinus5 improved on the technique and design by adding a femoral component. Since then, implants and techniques have been developed to effect better clinical outcomes. Patellofemoral arthroplasty (PFA) has many advantages over TKA in the treatment of patellofemoral arthritis. PFA is less invasive, requires shorter tourniquet times, has faster recovery, and spares the tibiofemoral compartment, leaving more native bone for potential conversion to TKA. Regarding activity and function, the resurfacing arthroplasty (vs TKA) allows maintenance of nearly normal knee kinematics.
Despite these advantages, the broader orthopedic surgery community has only cautiously accepted PFA. The procedure has high complication rates. Persistent instability, malalignment, wear, impingement, and tibiofemoral arthritis progression can occur after PFA.6 Although first-generation PFA prostheses often failed because of mechanical problems, loosening, maltracking, or instability,7 the most common indication for PFA revision has been, according to a recent large retrospective study,8 unexplained pain. More than 10 to 15 years after PFA, tibiofemoral arthritis may be the primary mechanism of failure.9 Nevertheless, compared with standard TKA for isolated patellofemoral arthritis, modern PFA does not have significantly different clinical outcomes, including complication and revision rates.6Numerous patient factors influence functional prognosis before and after knee arthroplasty, regardless of surgical technique and implant used. Age, comorbidities, athletic status, mental health, pain, functional limitations, excessive caution, “artificial joint”–related worries, and rehabilitation protocol all influence function.10 Return to activity and other quality-of-life indices are important aspects of postoperative patient satisfaction.
Methods
We conducted a retrospective cohort study to describe functional status after PFA for patellofemoral arthritis. We identified 48 consecutive PFAs (39 patients) performed by a team of 2 orthopedic surgeons (specialists in treating patellofemoral pathology) between 2009 and 2014.
Three validated patient-reported outcome measures (PROMs) were used to determine preoperative (baseline) and postoperative functional status: Kujala score, Lysholm score, and International Knee Documentation Committee (IKDC) score. The Kujala score is a measure of knee function specific to the patellofemoral joint; the Lysholm score focuses on activities related to the knee; and the IKDC score is a general measure of knee function. Charts were reviewed to extract patients’ clinical data, including preoperative outcome scores, medical history, physical examination data, intraoperative characteristics, and postoperative course. By telephone, patients answered questions about their postoperative clinical course and completed final follow-up questionnaires. They were also asked which sporting or fitness activity they had preferred before surgery and whether they were able to return to that activity after surgery.
Statistical analysis included the study population’s descriptive statistics. Means and SDs were reported for continuous variables, and frequencies and percentages were reported for categorical variables. Paired t tests were used to analyze changes in PROM scores. For comparison of differences between characteristics of patients who did and did not return to their previous activity level, independent-samples t tests were used for continuous variables. Chi-square tests or Fisher exact tests were used to compare discrete variables. Statistical significance was set at P ≤ .05. All analyses were performed with SPSS Version 22.0 (IBM).
Results
Table 1.Thirty-nine patients underwent PFA at our institution between 2009 and 2014. Mean age was 51.6 years. Of these patients, 84.2% were female, 28.6% had a body mass index of 30 kg/m2 or higher, and 23.4% had PFA for posttraumatic arthritis related to prior patellofemoral instability. Table 1 lists the study cohort’s demographic data.
Table 2.Table 2 lists self-reported activities limited by the affected knee before surgery, and Table 3 lists activity levels after surgery. Return to previous preferred activity was reported by 72.2% of patients, and 52.8% of patients reported returning to the same activity level or to a higher level. There were no differences in age (P = .978) or sex (P = .232) between patients who returned to the same or a higher activity level and patients who did not.
Table 3.However, mean BMI was significantly (P = .016) higher in patients who returned to the same or a higher activity level (28.6 kg/m2) than in patients who did not (23.7 kg/m2). Although the rate of posttraumatic arthritis (26%) was higher than the rate of primary osteoarthritis (19%) in patients who returned to the same or a higher activity level, this difference was not statistically significant (P = .724).
Postoperative knee-specific PROM scores and general pain score (reported by the patient on a scale of 0-10) were statistically significantly improved (P < .001 for all measures) over preoperative scores (Table 4).
Table 4.Mean follow-up was 26 months (range, 5-57 months). Kujala score improved a mean of 19.5 points; Lysholm score, 28.9 points; and IKDC score, 23.5 points. Mean general pain score improved from 6.3 before surgery to 2.8 after surgery. All PROM and pain score improvements were substantially larger than the minimal clinically important differences. Postoperative PROM scores and general pain score were significantly more improved in patients who returned to the same or a higher activity level than in patients who did not (P < .05 for all measures).
After surgery, 1 patient (2.6%) developed a pulmonary embolus, which was successfully identified and treated without incident. Five patients (10.4%) had another surgery on the same knee. Three patients (6.3%) underwent conversion to TKA: 1 for continued symptoms in the setting of newly diagnosed inflammatory arthritis, 1 for arthritic pain, and 1 for patellofemoral instability. Two patients (4.2%) underwent irrigation and débridement: 1 for hematoma and 1 for suspected (culture-negative) infection.
Discussion
Historically, the literature evaluating knee arthroplasty outcomes has focused on implant survivorship, pain relief, and patient satisfaction. Since the advent of partial knee arthroplasty options, more attention has been given to functional outcomes and return to activities after single-compartment knee resurfacing. TKA remains the gold standard by which newer, less invasive surgical options are measured. In a large prospective study, 97% of patients (age, >55 years) who had TKA for patellofemoral arthritis reported good or excellent clinical results, the majority being excellent.11 Post-TKA functional status and activity levels may not be rated as highly. After TKA, many patients switch to lower impact sports or reduce or stop their participation in sports.12 A small study of competitive adult tennis players found high levels of post-TKA satisfaction, ability to resume playing tennis, pain relief, and increased or continued enjoyment in playing.13 In a study of 355 patients (417 knees) who had underwent TKA, improvement in Knee Society function score showed a moderate correlation to an increase in weighted activity score (R = 0.362).14
Unicondylar knee arthroplasty (UKA) is becoming a popular treatment option for single-compartment tibiofemoral arthritis. A systematic review of 18 original studies of patients with knee osteoarthritis found that overall return to sports varied from 36% to 89% after TKA and from 75% to 100% after UKA.15 In another study, return-to-sports rates were similar for UKA (87%) and TKA (83%); the only significant difference was UKA patients returned quicker.16 The authors of a large meta-analysis conceded that significant heterogeneity of data prevented them from drawing definitive conclusions, but UKA patients seemed to return to low- and high-impact sports 2 weeks faster than their TKA counterparts.10 Overall, UKA and TKA patients (age, 51-71 years) had comparable return-to-sports rates at an average of 4 years after surgery.10 A smaller study corroborated faster return to sports for UKA over TKA patients and also found that, compared with TKA patients, UKA patients participated in sports more regularly and over a longer period.17 On the other hand, Walton and colleagues18 found similar return-to-sports rates but higher frequency of and satisfaction with sports participation in UKA over TKA patients.
A large retrospective study found no differences in rates of return to sports after TKA, UKA, patellar resurfacing, hip resurfacing, and total hip arthroplasty.19 Pain was the most common barrier to return. UKA patients who returned to sports tended to be younger than those who did not.20 Naal and colleagues3 found that 95% of UKA patients returned to their activities—hiking, walking, cycling, and swimming being most common. Although 90.3% of patients said surgery maintained or improved their ability to participate in sports, participation in high-impact sports (eg, running) decreased after surgery.
Outcomes of PFA vary because of evolving patient selection, implant design, surgical technique, and return-to-activity expectations.21,22 Most PFA outcome studies focus on implant survivorship, complication rates, and postoperative knee scores.23-28 PFA studies focused on return to activities are limited. Kooijman and colleagues7 and Mertl and colleagues29 reported good or excellent clinical results of PFA in 86% and 82% of patients, respectively. Neither study included a comprehensive analysis of postoperative functional status. Similarly, De Cloedt and colleagues30 reported good PFA outcomes in 43% of patients with degenerative joint disease and in 83% of patients with instability. Specific activity status was not described. Dahm and colleagues31 and Farr and colleagues32 suggested postoperative pain resolution motivates some PFA patients not only to resume preoperative activities but to start participating in new, higher level activities after pain has subsided. However, the studies did not examine the characteristics of patients who returned to baseline activities and did not examine return-to-sports rates.
Study Strengths and Limitations
Our study focused on the PFA patient population of a surgical team of 2 fellowship-trained orthopedic surgeons (specialists in treating patellofemoral pathology). Although generalization of our findings to other surgeons and different implants may be limited, the study design standardized treatment in a way that makes these findings more reliable. The 100% follow-up strengthens these findings as well. Last, though the patient population was relatively small, it was consistent with or larger than the PFA patient groups studied previously.
Conclusion
In this study, PROM and pain scores were significantly improved after PFA. That almost 75% of patients returned to their preferred activities and >50% of patients returned at the same or a higher activity level provides useful information for preoperative discussions with patients who want to remain active after PFA. Prospective studies are needed to evaluate the longevity and durability of PFA, particularly in active patients.
References
1. Laurencin CT, Zelicof SB, Scott RD, Ewald FC. Unicompartmental versus total knee arthroplasty in the same patient. A comparative study. Clin Orthop Relat Res. 1991;(273):151-156.
2. Kozinn SC, Scott R. Unicondylar knee arthroplasty. J Bone Joint Surg Am. 1989;71(1):145-150.
3. Naal FD, Fischer M, Preuss A, et al. Return to sports and recreational activity after unicompartmental knee arthroplasty. Am J Sports Med. 2007;35(10):1688-1695.
5. Lubinus HH. Patella glide bearing total replacement. Orthopedics. 1979;2(2):119-127.
6. Dy CJ, Franco N, Ma Y, Mazumdar M, McCarthy MM, Gonzalez Della Valle A. Complications after patello-femoral versus total knee replacement in the treatment of isolated patello-femoral osteoarthritis. A meta-analysis. Knee Surg Sports Traumatol Arthrosc. 2012;20(11):2174-2190.
7. Kooijman HJ, Driessen AP, van Horn JR. Long-term results of patellofemoral arthroplasty. A report of 56 arthroplasties with 17 years of follow-up. J Bone Joint Surg Br. 2003;85(6):836-840.
8. Baker PN, Refaie R, Gregg P, Deehan D. Revision following patello-femoral arthroplasty. Knee Surg Sports Traumatol Arthrosc. 2012;20(10):2047-2053.
9. Lonner JH, Bloomfield MR. The clinical outcome of patellofemoral arthroplasty. Orthop Clin North Am. 2013;44(3):271-280.
10. Papalia R, Del Buono A, Zampogna B, Maffulli N, Denaro V. Sport activity following joint arthroplasty: a systematic review. Br Med Bull. 2012;101:81-103.
11. Mont MA, Haas S, Mullick T, Hungerford DS. Total knee arthroplasty for patellofemoral arthritis. J Bone Joint Surg Am. 2002;84(11):1977-1981.
12. Chatterji U, Ashworth MJ, Lewis PL, Dobson PJ. Effect of total knee arthroplasty on recreational and sporting activity. ANZ J Surg. 2005;75(6):405-408.
13. Mont MA, Rajadhyaksha AD, Marxen JL, Silberstein CE, Hungerford DS. Tennis after total knee arthroplasty. Am J Sports Med. 2002;30(2):163-166.
14. Marker DR, Mont MA, Seyler TM, McGrath MS, Kolisek FR, Bonutti PM. Does functional improvement following TKA correlate to increased sports activity? Iowa Orthop J. 2009;29:11-16.
15. Witjes S, Gouttebarge V, Kuijer PP, van Geenen RC, Poolman RW, Kerkhoffs GM. Return to sports and physical activity after total and unicondylar knee arthroplasty: a systematic review and meta-analysis. Sports Med. 2016;46(2):269-292.
16. Ho JC, Stitzlein RN, Green CJ, Stoner T, Froimson MI. Return to sports activity following UKA and TKA. J Knee Surg. 2016;29(3):254-259.
17. Hopper GP, Leach WJ. Participation in sporting activities following knee replacement: total versus unicompartmental. Knee Surg Sports Traumatol Arthrosc. 2008;16(10):973-979.
18. Walton NP, Jahromi I, Lewis PL, Dobson PJ, Angel KR, Campbell DG. Patient-perceived outcomes and return to sport and work: TKA versus mini-incision unicompartmental knee arthroplasty. J Knee Surg. 2006;19(2):112-116.
19. Wylde V, Blom A, Dieppe P, Hewlett S, Learmonth I. Return to sport after joint replacement. J Bone Joint Surg Br. 2008;90(7):920-923.
20. Pietschmann MF, Wohlleb L, Weber P, et al. Sports activities after medial unicompartmental knee arthroplasty Oxford III—what can we expect? Int Orthop. 2013;37(1):31-37.
28. Leadbetter WB, Seyler TM, Ragland PS, Mont MA. Indications, contraindications, and pitfalls of patellofemoral arthroplasty. J Bone Joint Surg Am. 2006;88(suppl 4):122-137.
29. Mertl P, Van FT, Bonhomme P, Vives P. Femoropatellar osteoarthritis treated by prosthesis. Retrospective study of 50 implants [in French]. Rev Chir Orthop Reparatrice Appar Mot. 1997;83(8):712-718.
30. De Cloedt P, Legaye J, Lokietek W. Femoro-patellar prosthesis. A retrospective study of 45 consecutive cases with a follow-up of 3-12 years [in French]. Acta Orthop Belg. 1999;65(2):170-175.
31. Dahm DL, Al-Rayashi W, Dajani K, Shah JP, Levy BA, Stuart MJ. Patellofemoral arthroplasty versus total knee arthroplasty in patients with isolated patellofemoral osteoarthritis. Am J Orthop. 2010;39(10):487-491.
32. Farr J, Arendt E, Dahm D, Daynes J. Patellofemoral arthroplasty in the athlete. Clin Sports Med. 2014;33(3):547-552.
An environmental pathogen, Mycobacterium marinum can cause cutaneous infection when traumatized skin is exposed to fresh, brackish, or salt water. Fishing, aquarium cleaning, and aquatic recreational activities are risk factors for infection.1,2 Diagnosis often is delayed and is made several weeks or even months after initial symptoms appear.3 Due to the protracted clinical course, patients may not recall the initial exposure, contributing to the delay in diagnosis and initiation of appropriate treatment. It is not uncommon for patients with M marinum infection to be initially treated with antibiotics or antifungal drugs.
We present a review of 5 patients who were diagnosed with M marinum infection at our institution between January 2003 and March 2013.
Methods
This study was conducted at Henry Ford Hospital, a 900-bed tertiary care center in Detroit, Michigan. Patients who had cultures positive for M marinum between January 2003 and March 2013 were identified using the institution’s laboratory database. Medical records were reviewed, and relevant demographic, epidemiologic, and clinical data, including initial clinical presentation, alternative diagnoses, time between initial presentation and definitive diagnosis, and specific treatment, were recorded.
Results
We identified 5 patients who were diagnosed with culture-confirmed M marinum skin infections during the study period: 3 men and 2 women aged 43 to 72 years (Table 1). Two patients had diabetes mellitus and 1 had hepatitis C virus. None had classic immunosuppression. On repeated questioning after the diagnosis was established, all 5 patients reported that they kept a home aquarium, and all recalled mild trauma to the hand prior to the onset of symptoms; however, none of the patients initially linked the minor skin injury to the subsequent infection.
All 5 patients initially presented with erythema and swelling at the site of the injury, which evolved into inflammatory nodules that progressed proximally up to the arm despite empiric treatment with antibiotics active against streptococci and staphylococci (Figures 1 and 2). Three patients also received empiric antifungal therapy due to suspicion of sporotrichosis.
Figure 1. A 57-year-old woman (patient 4) presented with a 6-week history of a worsening erythematous swollen painful left thumb (A). She recalled some minor trauma while cleaning her basement. One week later she noticed swelling, erythema and purulent material under the nail bed. Two weeks later she noticed an erythematous nonpainful nodule on the radial aspect of the left wrist (B), followed by the appearance of multiple tender erythematous nodules on the left forearm that followed a linear progression from the dorsal aspect of the left hand, extending over the medial aspect of the forearm and arm (C).
Figure 2. A 72-year-old man (patient 5) presented with pain and erythema of the right thumb after clipping the nail (A). Erythema progressed to the axilla. He was treated with bacitracin ointment and cefadroxil with no improvement. Nodular lesions developed in a linear pattern that extended to the antecubital fossa (B and C).
Skin biopsies were performed on 4 patients, and incision and drainage of purulent material was performed on the fifth patient. Histopathologic examination revealed granulomatous inflammation in 3 patients. Stains for acid-fast bacilli were positive in all 5 patients. Definitive diagnosis of the organism was confirmed by growth of M marinum within 11 to 40 days from the tissue in 4 patients and purulent material in the fifth patient. Susceptibility testing was performed on only 1 of the 5 isolates and showed that the organism was susceptible to amikacin, clarithromycin, doxycycline, ethambutol, rifampin, and trimethoprim-sulfamethoxazole (TMP-SMX).
The mean time from initial presentation to initiation of appropriate therapy for M marinum infection was 91 days (range, 21–245 days). Several different treatment regimens were used. All patients received either doxycycline or minocycline with or without a macrolide. Two also received other agents (TMP-SMX or ethambutol). Treatment duration varied from 2 to 6 months in 4 patients, and all 4 had complete resolution of the lesions; 1 patient was lost to follow-up.
Comment
Diagnosing the Infection Diagnosis of M marinum infection remains problematic. In the 5 patients included in this study, the time between initial onset of symptoms and diagnosis of M marinum infection was delayed, as has been noted in other reports.4-7 Delays as long as 2 years before the diagnosis is made have been described.7 The clinical presentation of cutaneous infection with M marinum varies, which may delay diagnosis. Nodular lymphangitis is classic, but papules, pustules, ulcers, inflammatory plaques, and single nodules also can occur.1,2 Lymphadenopathy may or may not be present.4,8,9 The differential diagnosis is broad and includes infection by other nontuberculous mycobacteria such as Mycobacterium chelonae; Mycobacterium fortuitum; Nocardiaspecies, especially Nocardia brasiliensis; Francisella tularensis; Sporothrix schenckii; and Leishmania species. It is not surprising that 4 patients in our study were initially treated for a gram-positive bacterial infection and 3 were treated for a fungal infection before the diagnosis of M marinum was made. Distinctive features that may help to differentiate these infections are summarized in Table 2.
We found that the main cause of delayed diagnosis was the failure of physicians to obtain a thorough history regarding patients’ recreational activities and animalexposure. Patients often do not associate a remote aquatic exposure with their symptoms and will not volunteer this information unless directly asked.2,10 It was only after repeated questioning in all of these patients that they recounted prior trauma to the involved hand related to the aquarium.
Biopsy and Culture Histopathologic examination of material from a biopsied lesion can give an early clue that a mycobacterial infection might be involved. Biopsy can reveal either noncaseating or necrotizing granulomas that have larger numbers of neutrophils in addition to lymphocytes and macrophages. Giant cells often are noted.5,9,11 Organisms can be seen with the use of a tissue acid-fast stain, but species cannot be differentiated by acid-fast staining.12 However, the sensitivity of acid-fast stains on biopsy material is low.3,13,14
Culture of the involved tissue is crucial for establishing the diagnosis of this infection. However, the rate of growth of M marinumis slow.Temperature requirements for incubation and delay in transporting specimens to the laboratory can lead to bacterial overgrowth, resulting in the inability to recover M marinum from the culture.13Mycobacterium marinum grows preferentially between 28°C and 32°C, and growth is limited at temperatures above 33°C.13,15,16 As illustrated in the cases presented, recovery of the organism may not be accomplished from the first culture performed, and additional biopsy material for culture may be needed. Liquid media generally is more sensitive and produces more rapid results than solid media (eg, Löwenstein-Jensen, Middlebrook 7H10/7H11 agar). However, solid media carry the advantage of allowing observation of morphology and estimation of the number of organisms.12,17
Rapid Detection Advancements in molecular methods have allowed for more definitive and rapid identification of M marinum, substantially reducing the delay in diagnosis. Commercial molecular assays utilize in-solution hybridization or solid-format reverse-hybridization assays to allow mycobacterial detection as soon as growth appears.18 Use of matrix-assisted laser desorption/ionization time-of-flight mass spectrometry can substantially shorten the time to species identification.19,20 Nonculture-based tests that have been developed for the rapid detection of M marinum infection include polymerase chain reaction-restriction fragment length polymorphism and polymerase chain reaction amplification of the 16S RNAgene.21 It should be noted, however, that M marinum and Mycobacterium ulcerans have a very homologous 16S ribosomal RNA gene sequence, differing by only 1 nucleotide; thus, distinguishing between M marinumandM ulcerans using this method may be challenging.22,23
Management Treatment depends on the extent of the disease. Generally, localized cutaneous disease can be treated with monotherapy with agents such as doxycycline, clarithromycin, or TMP-SMX. Extensive disease typically requires a combination of 2 antimycobacterial agents, typically clarithromycin-rifampin, clarithromycin-ethambutol, or rifampin-ethambutol.12 Amikacin has been used in combination with other agents such as rifampin and clarithromycin in refractory cases.22,24 The use of ciprofloxacin is not encouraged because some isolates are resistant; however, other fluoroquinolones, such as moxifloxacin, may be options for combination therapy. Isoniazid, pyrazinamide, and streptomycin are not effective to treat M marinum.
Susceptibility testing of M marinum usually is performed to guide antimicrobial therapy in cases of poor clinical response or intolerance to first-line antimicrobials such as macrolides.25 The likelihood of M marinum developing resistance to the agents used for treatment appears to be low. Unfortunately, in vitro antimicrobial susceptibility tests do not correlate well with treatment efficiency.10
The duration of therapy is not standardized but usually is 5 to 6 months,7,10,26 with therapy often continuing 1 to 2 months after lesions appear to have resolved.12 However, in some cases (usually those who have more extensive disease), therapy has been extended to as long as 1 to 2 years.10 The ideal length of therapy in immunocompromised individuals has not been established27; however, a treatment duration of 6 to 9 months was reported in one study.28 Surgical debridement may be necessary in some patients who have involvement of deep structures of the hand or knee, those with persistent pain, or those who fail to respond to a prolonged period of medical therapy.29 Successful use of less conventional therapeutic approaches, including cryotherapy, radiation therapy, electrodesiccation, photodynamic therapy, curettage, and local hyperthermic therapy has been reported.30-32
Conclusion
Diagnosis and management of M marinum infection is difficult. Patients presenting with indolent nodular skin infections affecting the upper extremities should be asked about aquatic exposure. Tissue biopsy for histopathologic examination and culture is essential to establish an early diagnosis and promptly initiate appropriate therapy.
Acknowledgment We would like to thank Carol A. Kauffman, MD (Ann Arbor, Michigan), for her thoughtful comments that greatly improved this manuscript.
References
Lewis FM, Marsh BJ, von Reyn CF. Fish tank exposure and cutaneous infections due to Mycobacterium marinum: tuberculin skin testing, treatment, and prevention. Clin Infect Dis. 2003;37:390-397.
Jernigan JA, Farr BM. Incubation period and sources of exposure for cutaneous Mycobacterium marinum infection: case report and review of the literature. Clin Infect Dis. 2000;31:439-443.
Edelstein H. Mycobacterium marinumskin infections. report of 31 cases and review of the literature. Arch Intern Med. 1994;154:1359-1364.
Janik JP, Bang RH, Palmer CH. Case reports: successful treatment of Mycobacterium marinum infection with minocycline after complication of disease by delayed diagnosis and systemic steroids. J Drugs Dermatol. 2005;4:621-624.
Sette CS, Wachholz PA, Masuda PY, et al. Mycobacterium marinum infection: a case report. J Venom Anim Toxins Incl Trop Dis. 2015;21:7.
Johnson MG, Stout JE. Twenty-eight cases of Mycobacterium marinum infection: retrospective case series and literature review. Infection. 2015;43:655-662.
Eberst E, Dereure O, Guillot B, et al. Epidemiological, clinical, and therapeutic pattern of Mycobacterium marinum infection: a retrospective series of 35 cases from southern France. J Am Acad Dermatol.2012;66:E15-E16.
Philpott JA Jr, Woodburne AR, Philpott OS, et al. Swimming pool granuloma. a study of 290 cases. Arch Dermatol. 1963;88:158-162.
Aubry A, Chosidow O, Caumes E, et al. Sixty-three cases of Mycobacterium marinum infection: clinical features, treatment, and antibiotic susceptibility of causative isolates. Arch Intern Med.2002;162:1746-1752.
Feng Y, Xu H, Wang H, et al. Outbreak of a cutaneous Mycobacterium marinum infection in Jiangsu Haian, China. Diagn Microbiol Infect Dis. 2011;71:267-272.
Griffith DE, Aksamit T, Brown-Elliott BA, et al; ATS Mycobacterial Diseases Subcommittee; American Thoracic Society; Infectious Disease Society of America. An official ATS/IDSA statement: diagnosis, treatment, and prevention of non-tuberculous mycobacterial diseases. Am J Respir Crit Care Med. 2007;175:367-416.
Ang P, Rattana-Apiromyakij N, Goh CL. Retrospective study of Mycobacterium marinumskin infections. Int J Dermatol. 2000;39:343-347.
Wu TS, Chiu CH, Yang CH, et al. Fish tank granuloma caused by Mycobacterium marinum. PLoS One. 2012;7:e41296.
Ho WL, Chuang WY, Kuo AJ, et al. Nasal fish tank granuloma: an uncommon cause for epistaxis. Am J Trop Med Hyg. 2011;85:195-196.
Dobos KM, Quinn FD, Ashford DA, et al. Emergence of a unique group of necrotizing mycobacterial diseases. Emerg Infect Dis. 1999;5:367-378.
van Ingen J. Diagnosis of non-tuberculous mycobacterial infections. Semin Respir Crit Care Med. 2013;34:103-109.
Piersimoni C, Scarparo C. Extrapulmonary infections associated with non-tuberculous mycobacteria in immunocompetent persons. Emerg Infect Dis. 2009;15:1351-1358; quiz 1544.
Saleeb PG, Drake SK, Murray PR, et al. Identification of mycobacteria in solid-culture media by matrix-assisted laser desorption ionization-time of flight mass spectrometry. J Clin Microbiol. 2011;49:1790-1794.
Adams LL, Salee P, Dionne K, et al. A novel protein extraction method for identification of mycobacteria using MALDI-ToF MS. J Microbiol Methods. 2015;119:1-3.
Posteraro B, Sanguinetti M, Garcovich A, et al. Polymerase chain reaction-reverse cross-blot hybridization assay in the diagnosis of sporotrichoid Mycobacterium marinum infection. Br J Dermatol. 1998;139:872-876.
Lau SK, Curreem SO, Ngan AH, et al. First report of disseminated Mycobacterium skin infections in two liver transplant recipients and rapid diagnosis by hsp65 gene sequencing. J Clin Microbiol. 2011;49:3733-3738.
Hofer M, Hirschel B, Kirschner P, et al. Brief report: disseminated osteomyelitis fromMycobacterium ulcerans after a snakebite. N Engl J Med. 1993;328:1007-1009.
Huang Y, Xu X, Liu Y, et al. Successful treatment of refractory cutaneous infection caused by Mycobacterium marinum with a combined regimen containing amikacin. Clin Interv Aging. 2012;7:533-538.
Woods GL. Susceptibility testing for mycobacteria. Clin Infect Dis. 2000;31:1209-1215.
Balaqué N, Uçkay I, Vostrel P, et al. Non-tuberculous mycobacterial infections of the hand. Chir Main. 2015;34:18-23.
Pandian TK, Deziel PJ, Otley CC, et al. Mycobacterium marinum infections in transplant recipients: case report and review of the literature. Transpl Infect Dis. 2008;10:358-363.
Jacobs S, George A, Papanicolaou GA, et al. Disseminated Mycobacterium marinum infection in a hematopoietic stem cell transplant recipient. Transpl Infect Dis. 2012;14:410-414.
Chow SP, Ip FK, Lau JH, et al. Mycobacterium marinum infection of the hand and wrist. results of conservative treatment in twenty-four cases. J Bone Joint Surg Am. 1987;69:1161-1168.
Rallis E, Koumantaki-Mathioudaki E. Treatment of Mycobacterium marinum cutaneous infections. Expert Opin Pharmacother. 2007;8:2965-2978.
Nenoff P, Klapper BM, Mayser P, et al. Infections due to Mycobacterium marinum: a review. Hautarzt. 2011;62:266-271.
Prevost E, Walker EM Jr, Kreutner A Jr, et al. Mycobacterium marinum infections: diagnosis and treatment. South Med J. 1982;75:1349-1352.
Drs. Steinbrink and Miceli are from the Department of Internal Medicine, University of Michigan Medical School, Ann Arbor. Dr. Miceli also is from the Division of Infectious Diseases. Drs. Alexis, Angulo-Thompson, Ramesh, and Alangaden are from the Department of Internal Medicine, Henry Ford Health System, Detroit, Michigan. Drs. Alexis, Ramesh, and Alangaden also are from the Infectious Diseases Section.
The authors report no conflict of interest.
Correspondence: Marisa H. Miceli, MD, Division of Infectious Diseases, University of Michigan Medical School, 1500 E Medical Center Dr, University Hospital F4005, Ann Arbor, MI 48109-5378 (mmiceli@med.umich.edu).
Author and Disclosure Information
Drs. Steinbrink and Miceli are from the Department of Internal Medicine, University of Michigan Medical School, Ann Arbor. Dr. Miceli also is from the Division of Infectious Diseases. Drs. Alexis, Angulo-Thompson, Ramesh, and Alangaden are from the Department of Internal Medicine, Henry Ford Health System, Detroit, Michigan. Drs. Alexis, Ramesh, and Alangaden also are from the Infectious Diseases Section.
The authors report no conflict of interest.
Correspondence: Marisa H. Miceli, MD, Division of Infectious Diseases, University of Michigan Medical School, 1500 E Medical Center Dr, University Hospital F4005, Ann Arbor, MI 48109-5378 (mmiceli@med.umich.edu).
An environmental pathogen, Mycobacterium marinum can cause cutaneous infection when traumatized skin is exposed to fresh, brackish, or salt water. Fishing, aquarium cleaning, and aquatic recreational activities are risk factors for infection.1,2 Diagnosis often is delayed and is made several weeks or even months after initial symptoms appear.3 Due to the protracted clinical course, patients may not recall the initial exposure, contributing to the delay in diagnosis and initiation of appropriate treatment. It is not uncommon for patients with M marinum infection to be initially treated with antibiotics or antifungal drugs.
We present a review of 5 patients who were diagnosed with M marinum infection at our institution between January 2003 and March 2013.
Methods
This study was conducted at Henry Ford Hospital, a 900-bed tertiary care center in Detroit, Michigan. Patients who had cultures positive for M marinum between January 2003 and March 2013 were identified using the institution’s laboratory database. Medical records were reviewed, and relevant demographic, epidemiologic, and clinical data, including initial clinical presentation, alternative diagnoses, time between initial presentation and definitive diagnosis, and specific treatment, were recorded.
Results
We identified 5 patients who were diagnosed with culture-confirmed M marinum skin infections during the study period: 3 men and 2 women aged 43 to 72 years (Table 1). Two patients had diabetes mellitus and 1 had hepatitis C virus. None had classic immunosuppression. On repeated questioning after the diagnosis was established, all 5 patients reported that they kept a home aquarium, and all recalled mild trauma to the hand prior to the onset of symptoms; however, none of the patients initially linked the minor skin injury to the subsequent infection.
All 5 patients initially presented with erythema and swelling at the site of the injury, which evolved into inflammatory nodules that progressed proximally up to the arm despite empiric treatment with antibiotics active against streptococci and staphylococci (Figures 1 and 2). Three patients also received empiric antifungal therapy due to suspicion of sporotrichosis.
Figure 1. A 57-year-old woman (patient 4) presented with a 6-week history of a worsening erythematous swollen painful left thumb (A). She recalled some minor trauma while cleaning her basement. One week later she noticed swelling, erythema and purulent material under the nail bed. Two weeks later she noticed an erythematous nonpainful nodule on the radial aspect of the left wrist (B), followed by the appearance of multiple tender erythematous nodules on the left forearm that followed a linear progression from the dorsal aspect of the left hand, extending over the medial aspect of the forearm and arm (C).
Figure 2. A 72-year-old man (patient 5) presented with pain and erythema of the right thumb after clipping the nail (A). Erythema progressed to the axilla. He was treated with bacitracin ointment and cefadroxil with no improvement. Nodular lesions developed in a linear pattern that extended to the antecubital fossa (B and C).
Skin biopsies were performed on 4 patients, and incision and drainage of purulent material was performed on the fifth patient. Histopathologic examination revealed granulomatous inflammation in 3 patients. Stains for acid-fast bacilli were positive in all 5 patients. Definitive diagnosis of the organism was confirmed by growth of M marinum within 11 to 40 days from the tissue in 4 patients and purulent material in the fifth patient. Susceptibility testing was performed on only 1 of the 5 isolates and showed that the organism was susceptible to amikacin, clarithromycin, doxycycline, ethambutol, rifampin, and trimethoprim-sulfamethoxazole (TMP-SMX).
The mean time from initial presentation to initiation of appropriate therapy for M marinum infection was 91 days (range, 21–245 days). Several different treatment regimens were used. All patients received either doxycycline or minocycline with or without a macrolide. Two also received other agents (TMP-SMX or ethambutol). Treatment duration varied from 2 to 6 months in 4 patients, and all 4 had complete resolution of the lesions; 1 patient was lost to follow-up.
Comment
Diagnosing the Infection Diagnosis of M marinum infection remains problematic. In the 5 patients included in this study, the time between initial onset of symptoms and diagnosis of M marinum infection was delayed, as has been noted in other reports.4-7 Delays as long as 2 years before the diagnosis is made have been described.7 The clinical presentation of cutaneous infection with M marinum varies, which may delay diagnosis. Nodular lymphangitis is classic, but papules, pustules, ulcers, inflammatory plaques, and single nodules also can occur.1,2 Lymphadenopathy may or may not be present.4,8,9 The differential diagnosis is broad and includes infection by other nontuberculous mycobacteria such as Mycobacterium chelonae; Mycobacterium fortuitum; Nocardiaspecies, especially Nocardia brasiliensis; Francisella tularensis; Sporothrix schenckii; and Leishmania species. It is not surprising that 4 patients in our study were initially treated for a gram-positive bacterial infection and 3 were treated for a fungal infection before the diagnosis of M marinum was made. Distinctive features that may help to differentiate these infections are summarized in Table 2.
We found that the main cause of delayed diagnosis was the failure of physicians to obtain a thorough history regarding patients’ recreational activities and animalexposure. Patients often do not associate a remote aquatic exposure with their symptoms and will not volunteer this information unless directly asked.2,10 It was only after repeated questioning in all of these patients that they recounted prior trauma to the involved hand related to the aquarium.
Biopsy and Culture Histopathologic examination of material from a biopsied lesion can give an early clue that a mycobacterial infection might be involved. Biopsy can reveal either noncaseating or necrotizing granulomas that have larger numbers of neutrophils in addition to lymphocytes and macrophages. Giant cells often are noted.5,9,11 Organisms can be seen with the use of a tissue acid-fast stain, but species cannot be differentiated by acid-fast staining.12 However, the sensitivity of acid-fast stains on biopsy material is low.3,13,14
Culture of the involved tissue is crucial for establishing the diagnosis of this infection. However, the rate of growth of M marinumis slow.Temperature requirements for incubation and delay in transporting specimens to the laboratory can lead to bacterial overgrowth, resulting in the inability to recover M marinum from the culture.13Mycobacterium marinum grows preferentially between 28°C and 32°C, and growth is limited at temperatures above 33°C.13,15,16 As illustrated in the cases presented, recovery of the organism may not be accomplished from the first culture performed, and additional biopsy material for culture may be needed. Liquid media generally is more sensitive and produces more rapid results than solid media (eg, Löwenstein-Jensen, Middlebrook 7H10/7H11 agar). However, solid media carry the advantage of allowing observation of morphology and estimation of the number of organisms.12,17
Rapid Detection Advancements in molecular methods have allowed for more definitive and rapid identification of M marinum, substantially reducing the delay in diagnosis. Commercial molecular assays utilize in-solution hybridization or solid-format reverse-hybridization assays to allow mycobacterial detection as soon as growth appears.18 Use of matrix-assisted laser desorption/ionization time-of-flight mass spectrometry can substantially shorten the time to species identification.19,20 Nonculture-based tests that have been developed for the rapid detection of M marinum infection include polymerase chain reaction-restriction fragment length polymorphism and polymerase chain reaction amplification of the 16S RNAgene.21 It should be noted, however, that M marinum and Mycobacterium ulcerans have a very homologous 16S ribosomal RNA gene sequence, differing by only 1 nucleotide; thus, distinguishing between M marinumandM ulcerans using this method may be challenging.22,23
Management Treatment depends on the extent of the disease. Generally, localized cutaneous disease can be treated with monotherapy with agents such as doxycycline, clarithromycin, or TMP-SMX. Extensive disease typically requires a combination of 2 antimycobacterial agents, typically clarithromycin-rifampin, clarithromycin-ethambutol, or rifampin-ethambutol.12 Amikacin has been used in combination with other agents such as rifampin and clarithromycin in refractory cases.22,24 The use of ciprofloxacin is not encouraged because some isolates are resistant; however, other fluoroquinolones, such as moxifloxacin, may be options for combination therapy. Isoniazid, pyrazinamide, and streptomycin are not effective to treat M marinum.
Susceptibility testing of M marinum usually is performed to guide antimicrobial therapy in cases of poor clinical response or intolerance to first-line antimicrobials such as macrolides.25 The likelihood of M marinum developing resistance to the agents used for treatment appears to be low. Unfortunately, in vitro antimicrobial susceptibility tests do not correlate well with treatment efficiency.10
The duration of therapy is not standardized but usually is 5 to 6 months,7,10,26 with therapy often continuing 1 to 2 months after lesions appear to have resolved.12 However, in some cases (usually those who have more extensive disease), therapy has been extended to as long as 1 to 2 years.10 The ideal length of therapy in immunocompromised individuals has not been established27; however, a treatment duration of 6 to 9 months was reported in one study.28 Surgical debridement may be necessary in some patients who have involvement of deep structures of the hand or knee, those with persistent pain, or those who fail to respond to a prolonged period of medical therapy.29 Successful use of less conventional therapeutic approaches, including cryotherapy, radiation therapy, electrodesiccation, photodynamic therapy, curettage, and local hyperthermic therapy has been reported.30-32
Conclusion
Diagnosis and management of M marinum infection is difficult. Patients presenting with indolent nodular skin infections affecting the upper extremities should be asked about aquatic exposure. Tissue biopsy for histopathologic examination and culture is essential to establish an early diagnosis and promptly initiate appropriate therapy.
Acknowledgment We would like to thank Carol A. Kauffman, MD (Ann Arbor, Michigan), for her thoughtful comments that greatly improved this manuscript.
References
Lewis FM, Marsh BJ, von Reyn CF. Fish tank exposure and cutaneous infections due to Mycobacterium marinum: tuberculin skin testing, treatment, and prevention. Clin Infect Dis. 2003;37:390-397.
Jernigan JA, Farr BM. Incubation period and sources of exposure for cutaneous Mycobacterium marinum infection: case report and review of the literature. Clin Infect Dis. 2000;31:439-443.
Edelstein H. Mycobacterium marinumskin infections. report of 31 cases and review of the literature. Arch Intern Med. 1994;154:1359-1364.
Janik JP, Bang RH, Palmer CH. Case reports: successful treatment of Mycobacterium marinum infection with minocycline after complication of disease by delayed diagnosis and systemic steroids. J Drugs Dermatol. 2005;4:621-624.
Sette CS, Wachholz PA, Masuda PY, et al. Mycobacterium marinum infection: a case report. J Venom Anim Toxins Incl Trop Dis. 2015;21:7.
Johnson MG, Stout JE. Twenty-eight cases of Mycobacterium marinum infection: retrospective case series and literature review. Infection. 2015;43:655-662.
Eberst E, Dereure O, Guillot B, et al. Epidemiological, clinical, and therapeutic pattern of Mycobacterium marinum infection: a retrospective series of 35 cases from southern France. J Am Acad Dermatol.2012;66:E15-E16.
Philpott JA Jr, Woodburne AR, Philpott OS, et al. Swimming pool granuloma. a study of 290 cases. Arch Dermatol. 1963;88:158-162.
Aubry A, Chosidow O, Caumes E, et al. Sixty-three cases of Mycobacterium marinum infection: clinical features, treatment, and antibiotic susceptibility of causative isolates. Arch Intern Med.2002;162:1746-1752.
Feng Y, Xu H, Wang H, et al. Outbreak of a cutaneous Mycobacterium marinum infection in Jiangsu Haian, China. Diagn Microbiol Infect Dis. 2011;71:267-272.
Griffith DE, Aksamit T, Brown-Elliott BA, et al; ATS Mycobacterial Diseases Subcommittee; American Thoracic Society; Infectious Disease Society of America. An official ATS/IDSA statement: diagnosis, treatment, and prevention of non-tuberculous mycobacterial diseases. Am J Respir Crit Care Med. 2007;175:367-416.
Ang P, Rattana-Apiromyakij N, Goh CL. Retrospective study of Mycobacterium marinumskin infections. Int J Dermatol. 2000;39:343-347.
Wu TS, Chiu CH, Yang CH, et al. Fish tank granuloma caused by Mycobacterium marinum. PLoS One. 2012;7:e41296.
Ho WL, Chuang WY, Kuo AJ, et al. Nasal fish tank granuloma: an uncommon cause for epistaxis. Am J Trop Med Hyg. 2011;85:195-196.
Dobos KM, Quinn FD, Ashford DA, et al. Emergence of a unique group of necrotizing mycobacterial diseases. Emerg Infect Dis. 1999;5:367-378.
van Ingen J. Diagnosis of non-tuberculous mycobacterial infections. Semin Respir Crit Care Med. 2013;34:103-109.
Piersimoni C, Scarparo C. Extrapulmonary infections associated with non-tuberculous mycobacteria in immunocompetent persons. Emerg Infect Dis. 2009;15:1351-1358; quiz 1544.
Saleeb PG, Drake SK, Murray PR, et al. Identification of mycobacteria in solid-culture media by matrix-assisted laser desorption ionization-time of flight mass spectrometry. J Clin Microbiol. 2011;49:1790-1794.
Adams LL, Salee P, Dionne K, et al. A novel protein extraction method for identification of mycobacteria using MALDI-ToF MS. J Microbiol Methods. 2015;119:1-3.
Posteraro B, Sanguinetti M, Garcovich A, et al. Polymerase chain reaction-reverse cross-blot hybridization assay in the diagnosis of sporotrichoid Mycobacterium marinum infection. Br J Dermatol. 1998;139:872-876.
Lau SK, Curreem SO, Ngan AH, et al. First report of disseminated Mycobacterium skin infections in two liver transplant recipients and rapid diagnosis by hsp65 gene sequencing. J Clin Microbiol. 2011;49:3733-3738.
Hofer M, Hirschel B, Kirschner P, et al. Brief report: disseminated osteomyelitis fromMycobacterium ulcerans after a snakebite. N Engl J Med. 1993;328:1007-1009.
Huang Y, Xu X, Liu Y, et al. Successful treatment of refractory cutaneous infection caused by Mycobacterium marinum with a combined regimen containing amikacin. Clin Interv Aging. 2012;7:533-538.
Woods GL. Susceptibility testing for mycobacteria. Clin Infect Dis. 2000;31:1209-1215.
Balaqué N, Uçkay I, Vostrel P, et al. Non-tuberculous mycobacterial infections of the hand. Chir Main. 2015;34:18-23.
Pandian TK, Deziel PJ, Otley CC, et al. Mycobacterium marinum infections in transplant recipients: case report and review of the literature. Transpl Infect Dis. 2008;10:358-363.
Jacobs S, George A, Papanicolaou GA, et al. Disseminated Mycobacterium marinum infection in a hematopoietic stem cell transplant recipient. Transpl Infect Dis. 2012;14:410-414.
Chow SP, Ip FK, Lau JH, et al. Mycobacterium marinum infection of the hand and wrist. results of conservative treatment in twenty-four cases. J Bone Joint Surg Am. 1987;69:1161-1168.
Rallis E, Koumantaki-Mathioudaki E. Treatment of Mycobacterium marinum cutaneous infections. Expert Opin Pharmacother. 2007;8:2965-2978.
Nenoff P, Klapper BM, Mayser P, et al. Infections due to Mycobacterium marinum: a review. Hautarzt. 2011;62:266-271.
Prevost E, Walker EM Jr, Kreutner A Jr, et al. Mycobacterium marinum infections: diagnosis and treatment. South Med J. 1982;75:1349-1352.
Mycobacterium marinum infection should be suspected in patients with skin/soft tissue infections that fail to respond or progress despite treatment with antibiotics active against streptococci and staphylococci.
Inquiring about environmental exposure prior to the onset of the symptoms is key to elaborate a differential diagnosis list.
Biopsy for pathology evaluation and acid-fast bacilli smear and culture are key to establish the diagnosis of M marinum infection.
Patella alta has a reduced articular area of PF contact.
Presence of patella alta depends on the measurement method.
Patella alta is defined as ISI >1.2 and CDI >1.2 to >1.3.
On sagittal MRI, PTI is used most often with cutoff values of <0.125 to 0.28.
Tibial tubercle distalization is most often used to treat patella alta. The desired postoperative patellar height is a CDI of 1.0.
Patella alta is a patella that rides abnormally high in relation to the femur, the femoral trochlea, or the tibia,1 with decreased bony stability requiring increased knee flexion angles to engage the trochlea.2,3 An abnormally high patella may therefore insufficiently engage the proximal trochlea groove both in extension and in the early phase of knee flexion—making it one of the potential risk factors for patellar instability.4-10 Accordingly, patella alta is present in 30% of patients with recurrent patellar dislocation.11 It also occurs in other disorders, such as knee extensor apparatus disorders, in patients with patellofemoral (PF) pain, chondromalacia, Sinding-Larsen-Johansson disease, Osgood-Schlatter disease, patellar tendinopathy, and osteoarthritis.1,7,8,12-18 As such, patella alta represents an important predisposing factor for patellar malalignment and PF-related complaints. On the other hand, patella alta may also be a normal variant of a person’s knee anatomy and may be well tolerated when not combined with other instability factors.4
Despite the importance of patella alta, there is no consensus on a precise definition, the most reliable measurement method, or the factors thought to be important in clinical decisions regarding treatment. To address this issue, we systematically reviewed the patella alta literature for definitions, the most common measurement methods and their patella alta cutoff values, and cutoff values for surgical correction and proposed surgical techniques.
Methods
In February 2017, using the term patella alta, we performed a systematic literature search on PubMed. Inclusion criteria were original study or review articles, publication in peer-reviewed English-language journals between 2000 and 2017, and narrative description or measurement of human patellar height on plain radiographs or magnetic resonance imaging (MRI). Excluded were abstracts and articles in languages other than English; animal and computational/biomechanical studies; case reports; and knee arthroplasties, knee extensor ruptures, and hereditary and congenital diseases. All evidence levels were included.
We assessed measurement methods, reported cutoff values for patella alta, cutoff values for performing surgical correction, proposed surgical techniques, and postoperative target values. Original study articles and review articles were analyzed separately.
Results
Of 211 articles identified, 92 met the inclusion criteria for original study, and 28 for review. All their abstracts were reviewed, and 91 were excluded: 17 for language other than English, 11 for animal study, 12 for biomechanical/computational study, 20 for case report, 8 for arthroplasty, 13 for hereditary or congenital disease, 1 for extensor apparatus rupture, 3 for editorial letter, and 6 for other reasons. Full text copies of all included articles were obtained and reviewed.
Original Study Articles
Definition. Of the 92 original study articles, 17 (18.5%) defined patella alta by description alone, and 75 (81.5%) used imaging-based measurements. Patella alta was described as a patella that rides abnormally high in relation to the trochlear groove, with a reduced articular area of PF contact1,15,19-21 or decreased patella–trochlea cartilage overlap.22 With this reduced contact area, there is increased PF stress.21
With radiographic measurements, patella alta is defined as a Caton-Deschamps index (CDI) of >1.2 to >1.3, an Insall-Salvati index (ISI) of >1.2, a Blackburne-Peel index (PBI) of >1.0,4,15,18,23-25 and a patellotrochlear index (PTI) of <0.125 to 0.28.6,26
Table 1.
Table 2.Measurement Methods. Four different patella alta measurement methods were used: lateral radiographs with corresponding ratios (68 studies, 5 indices, Table 1), radiographic ratios measured on MRI (23 studies, 3 indices, Table 2), sagittal MRI (13 studies, 4 methods, Table 3), and patellar tendon length (PTL) measurements (11 studies, 5 methods, Table 4). In 26 studies, multiple measurement methods were used.
Table 3.
Table 4.
On lateral radiographs, ISI was the most common measurement (33 studies), with patella alta cutoff values ranging from >1.2 to >1.5. The second most common measurement was CDI (24 studies), with cutoff values of >1.2 to >1.3. Other indices, such as the modified ISI (6 studies), the BPI (1 study), and the Koshino index (2 studies), had their cutoff values used more consistently (>1.6 to >2.4, >1.0, and >1.2, respectively) but these indices were rarely reported in the literature (Table 1).27,28,29
Thirty-six studies defined patella alta with MRI using either the aforementioned radiographic ratios (23 studies, 3 indices, Table 2) or PF indices (13 studies, 4 methods, Table 3).30
On sagittal MRI, PTI was used most often; cutoff values were <0.125 to 0.28.
Thirteen studies defined patella alta with PTL: 5 using lateral conventional radiographs and 8 using sagittal MRI. For each type of imaging, the cutoff value was >52 mm to >56 mm. PTL was measured either independently or together with ISI on sagittal MRI (Table 4).
Table 5.Treatments. For patella alta, the surgical treatment goals are to increase the PF contact area and improve PF articular congruence and thereby increase PF stability.31-33 Four different procedures were used to treat patella alta (Table 5), but only 11 of the 92 studies included in our review mentioned a specific patellar height that required surgical correction (Table 5, Table 6). Recommendations were based on CDI (>1.2 to >1.4)34 and less often on ISI (>1.2)13 or PTL (>56 mm).22 Only 1 study defined how much distalization was necessary with the procedure.22
Table 6.
Review Articles
Twenty-eight review articles met the inclusion criteria.35-40 Patella alta was described mostly with ISI (75%) or CDI (64%). In up to 57% of these articles, a patella alta reference value was missing. Only 1 article mentioned different cutoff values for conventional radiographs and MRI. BPI was mentioned in 50% of studies, but only 2 indicated a cutoff value for patella alta. Eleven percent used PTI on sagittal MRI and took patella–trochlea cartilage overlap into account.
Eight review articles mentioned cutoff values for surgical correction. Only 1 of 4 articles mentioned a cutoff value for correcting patella alta in PF instability, and only 2 articles suggested an ideal postoperative patellar height (Table 6).
No review article relied on PTL to describe patella alta or to advise surgical treatment.
Discussion
Our review revealed many variations in patella alta definitions and descriptions, measurement methods, cutoff values, and treatment options. Interpretation of patellar height and, particularly, patella alta is very heterogeneous. Accordingly, comparing surgical indications, surgical treatment options, and outcomes across studies can be difficult.
Measurement Methods
Radiographs. Conventional radiographs were used to describe patella alta in two-thirds of the original study articles. The most common measurement methods marked the position of the patella relative to either the femur (direct assessment) or the tibia (indirect assessment).14,25 All established measurement methods use lateral radiographs, which do not show articular cartilage.11,14 Therefore, lateral radiograph ratios of different and variable bony landmarks do not measure actual PF articular congruence. The widely variable morphologies of patella (distal patellar nose, different articulating surface), femoral trochlea (facet in height and length), proximal tibia (inherited or acquired deformities on tibial tubercle), and slope are all confounding factors that may affect measurement (Figure 1). In addition, specific variations in PF joint morphology (eg, small patellar articular surface, short trochlea) are not well represented by these ratios.11
Figure 1.
All these methods have advantages, limitations, and different values of interobserver and intraobserver variability, reliability, and reproducibility (Table 7).29,41
Table 7.
Determination of both patellar height and patella alta depends on the measurement method used and is significantly affected by anatomical variants, such as extra-articular patella and femorotibial landmarks.
The ISI method is most commonly used because it does not depend on degree of knee flexion, is thought to measure the relative length of the patellar tendon the best,5 and has established MRI criteria.6 However, ISI has limitations: Its distal bony landmark is the tibial tuberosity, which can be difficult to assess14; the shape of the patella (mainly its inferior point) varies42; and the measurement does not change after distalization of the tibial tubercle.5
CDI is the most accurate diagnostic method because it relies on readily identifiable and reproducible anatomical landmarks; does not depend on radiograph quality, knee size, radiologic enlargement, or position of the tibial tubercle or patellar modification; and is unaffected by degree of knee flexion between 10° and 80°.38,43 CDI is the method that is most useful in describing patellar height after distalization of the tibial tubercle because it assesses the height of the patella relative to the tibial plateau.5 CDI is limited with respect to clear identification of the patellar and tibial articular margin.37
BPI has the lowest interobserver variability and discriminates best among patella alta, norma, and infera.41 Like CDI, BPI assesses patellar height relative to the tibial plateau, and thus is useful in describing patellar height after distalization of the tibial tubercle.5 BPI is limited in that it uses a line drawn along the tibial plateau, where variations in inclination and tibial slope produce inaccuracies,14 and depends highly on projection angles. Clinically, BPI is rarely used.
As the literature shows, the radiologic methods of determining patellar height are variable and unreliable and depend on the ratio used.26,41 These methods do not reveal precise information about the PF articular congruence, the key finding for necessary treatment.
Radiographic Indices on MRI. Some studies measured radiographic indices on sagittal MRI. Radiologic and MRI measurements are described as not significantly different or slightly different, and 0.09 to 0.13 needs to be added with ISI and BP ratios on radiographs, MRI, and computed tomography (CT).17,44-47 ISI is commonly used, and its clinical application is easy. Although classically measured on plain radiographs, ISI is reliably measured on MRI as well.17,30 The traditional 1.2 threshold for defining patella alta was used by Charles and colleagues.44 CDI is equally well measured on radiographs and MRI.47
Figure 2.MRI. Patellar height is reliably measured on sagittal MRI (Figure 2).6,14,26 The major advantage of sagittal MRI is that it shows the cartilage of the PF joint, and therefore patellar height can be assessed using patella–trochlea cartilage overlap,6,14,26,41 the clinical factor most relevant to patella alta.14
According to the literature, 3 different measurement methods have been used to describe degree of patella–trochlea cartilage overlap: PTI, sagittal patellofemoral engagement (SPE), and patellar articular overlap (PAO).1,11,26
PTI uses the true articular cartilage patella–trochlea relationship for measurement of patellar height on sagittal MRI in extension (Figure 3). If the patellar tendon is fully out to length (no laxity), PTI reliably and precisely determines the exact articular correlation of PF joint and patellar height.6
Figure 3.
SPE is similar to percentage of articular coverage.1,11 Patellar overlap of the trochlea is measured on 2 different sagittal MRI images: 1 with the greatest length of patellar cartilage and 1 with the greatest length of femoral trochlear cartilage. This measurement did not correlate with CDI.1 SPE was not evaluated in control studies, and normal and pathologic values are unavailable.
PAO is measured with patients positioned at rest and in standard knee coils.1 MRI was not obtained in full extension or with quadriceps activation, and knee flexion angle values are unavailable. Total patellar articular length was measured on the sagittal MRI that showed the greatest patellar length and articular cartilage thickness. The same image was used to measure articular overlap, or the length of patellar cartilage overlying the trochlear cartilage, as measured parallel to the subchondral surface of the patella. PAO correlates well with conventional patellar height measurements in the sagittal plane and shows promise as a simpler alternative to the conventional indices.1 Normal and pathologic values are unavailable.
So far, PTI is the only method that was controlled in several studies, assessed for its reliability, and compared with other patellar height measurements.6,14
Figure 4.Ten original study and 3 review articles mentioned PTI as a favorite diagnostic tool for patellar height (Figures 4A, 4B).6,14,40,48,49 SPE and PAO have no validated cutoff values and have not been compared with other patellar height measurements in patients with PF instability or in control patients. In addition, nontrivial technical limitations have been discussed in the literature (Table 8). Therefore, only PTI has proved valuable in measuring patella alta.
Table 8.
Patellar Tendon Length. PTL can be measured on lateral radiographs or sagittal MRI. Radiologic and MRI measurements are described as not significantly different47 or slightly different, and 0.09 to 0.13 needs to be added with the ISI ratio on radiographs, MRI, and CT.46 PTL is reliably evaluated with ISI.41,50 There is a weak correlation of patient height and PTL: Taller people have normally longer tendons.51-53
Figure 5.Some authors have used MRI to measure PTL because MRI 3-dimensionally depicts the patellar tendon and associated anatomy.46,54 The reliability of patellar tendon measurement on MRI is improved relative to radiographs because of improved soft-tissue contrast and cross-sectional depiction (Figure 5).46,54,55
PTL measurements revealed that the posterior surface of the patellar tendon was significantly shorter than the anterior surface. Compared with their corresponding posterior fascicles, anterior fascicles are longer; their attachment is more proximal to the patella and more distal to the tibia. In addition, posterior PTL is significantly shorter with the posterior patellar attachment (adheres to posterior aspect of the inferior patellar pole) than with the anterior attachment (adheres to anterior aspect of the inferior patellar pole).56 Moreover, the lateral and medial fascicles are longer than the central fascicles attaching at the most inferior patellar pole. This issue must be considered in image cut selection (Figures 6A, 6B). Furthermore, type of inferior pole of patella (pointed, intermediate, blunt) is important in measurement.56 Overall, mean (SD) PTL was 54.9 (1.2) mm on the anterior surface and 35.0 (0.6) mm on the posterior surface.
Figure 6.
It is important to precisely describe the measurement method and location (sagittal cut) and to consider the shape of the inferior patellar pole and the site of the patellar tendon attachment.56
Treatments. For patella alta, the surgical treatment goals are to increase the PF contact area and improve PF articular congruence, and thereby increase PF stability.31-33 Four different procedures were used to treat patella alta (Table 5), but only 11 of the 92 original study articles and 8 of the 28 review articles included in our review mentioned a specific patellar height that required surgical correction (Tables 5, 6). Recommendations were based on CDI (>1.2 to >1.4) and less often on ISI (>1.2 to >1.4) or PTL (>56 mm).
Tibial tubercle distalization is effective in normalizing patellar height to correct the patellar index in patella alta (Figures 7A, 7B).13,18,38,55,57 Tibial tubercle distalization and patellar tendon tenodesis attached to the original insertion normalize PTL and stabilize the PF joint in patients with patella alta.5,47 In a comparison of these surgical procedures, cartilage stress was lower with distalization than with distalization and tenodesis.13
Figure 7.
Soft-tissue methods are recommended in children, as bone procedures injure the proximal tibial physis and may cause it to close prematurely.58 The patella can be distally advanced by completely mobilizing the patellar tendon and fixating with sutures through the cartilaginous tibial tubercle. This technique is a satisfactory treatment for skeletally immature patients who present with habitual patellar dislocation associated with patella alta.58,59
CDI and BPI assess patellar height relative to the tibial plateau, and therefore are the most useful measurement methods for patellar height after distalization of the tibial tubercle.5 ISI does not change after distalization of the tibial tubercle and cannot be recommended.5,18 As PF indices (eg, PTI) can trace preoperative and postoperative values, these measurements are valuable.
Controversies
Our review found no consensus on measurement method or cutoff value. No measurement method showed clear clinical or methodologic superiority. Most published patellar height and patella alta data are based on conventional radiographs using a tibial reference point, even though a femoral or even trochlear reference point seems more reproducible, particularly in PF pathologies. Several cutoff values have been reported for each patella alta measurement method. Regarding pathologic thresholds, which might require surgical correction, very little information has been published, and scientific evidence is lacking. Numerous important aspects remain unanswered after this review, and clarification is mandatory.
Five Key Facts
1. In patella alta assessment, different morphologic, biomechanical, and functional aspects must be considered. The most relevant aspect is decreased engagement of the patella and trochlea,4-9,11,26 which results in decreased bony stability in knee extension.1-3 Therefore, patella alta is one of the potential risk factors for patellar instability with a high percentage of recurrent patellar dislocation.4-9 In early knee flexion, the patella translates more distally with better engagement of the patella in the trochlea and better stability. Therefore, measurement in extension, with the patellar tendon out to length, seems to offer a more reliable assessment of the patella–femur relationship.
2. Insufficient engagement of the patella in the trochlea is the most important aspect of patella alta.11 Therefore, direct measurement of this engagement seems logical.
3. As radiographs do not show articular cartilage, they should not be used to assess the articular patella–femur relationship.11,14,26 Patella–trochlea cartilage overlap is the most relevant factor for patella alta and should be measured on MRI.6,14,26,32
4. PTL is an important factor for patellar height and particularly patella alta. The range of normal PTL values is wide: 35 mm to 61 mm. The described cutoff values for patella alta (>52 mm to >56 mm) fall within this normal range. The cause may be the different measurement methods used.33,47,59-61 Therefore, for precise diagnostics, a standardized measurement method that includes the selected cut imaging is mandatory.
Table 9.5. Despite the relevance of surgical correction, investigators have reported only a few values for the postoperative position of the patella with the desired level.37,39,47 Exact values after surgical correction and type of measurement method must be defined. Many important aspects remain unanswered, and clarification is mandatory (Table 9).
Conclusion
Our review revealed many variations in patella alta definitions and descriptions, measurement methods, cutoff values, and treatment options. Presence of patella alta depends on measurement method used. Methods cannot be used interchangeably, and they all have their advantages and limitations. Unfortunately, there is no generally accepted consensus on measurement method, patella alta cutoff value, or treatment with ideal correction. Treatment planning and outcomes assessment require clarification of these many issues.
References
1 Munch JL, Sullivan JP, Nguyen JT, et al. Patellar articular overlap on MRI is a simple alternative to conventional measurements of patellar height. Orthop J Sports Med. 2016;4(7):2325967116656328.
2. Elias JJ, Soehnlen NT, Guseila LM, Cosgarea AJ. Dynamic tracking influenced by anatomy in patellar instability. Knee. 2016;23(3):450-455.
3. Fabricant PD, Ladenhauf HN, Salvati EA, Green DW. Medial patellofemoral ligament (MPFL) reconstruction improves radiographic measures of patella alta in children. Knee. 2014;21(6):1180-1184.
4. Askenberger M, Janarv PM, Finnbogason T, Arendt EA. Morphology and anatomic patellar instability risk factors in first-time traumatic lateral patellar dislocations. Am J Sports Med. 2017;45(1):50-58.
5. Mayer C, Magnussen RA, Servien E, et al. Patellar tendon tenodesis in association with tibial tubercle distalization for the treatment of episodic patellar dislocation with patella alta. Am J Sports Med. 2012;40(2):346-351.
6. Ali SA, Helmer R, Terk MR. Patella alta: lack of correlation between patellotrochlear cartilage congruence and commonly used patellar height ratios. AJR Am J Roentgenol. 2009;193(5):1361-1366.
7. Lewallen LW, McIntosh AL, Dahm DL. Predictors of recurrent instability after acute patellofemoral dislocation in pediatric and adolescent patients. Am J Sports Med. 2013;41(3):575-581.
8. Ward SR, Terk MR, Powers CM. Patella alta: association with patellofemoral alignment and changes in contact area during weight-bearing. J Bone Joint Surg Am. 2007;89(8):1749-1755.
9. Dejour H, Walch G, Nove-Josserand L, Guier C. Factors of patellar instability: an anatomic radiographic study. Knee Surg Sports Traumatol Arthrosc. 1994;2(1):19-26.
10. Arendt EA, Fithian DC, Cohen E. Current concepts of lateral patella dislocation. Clin Sports Med. 2002;21(3):499-519.
11. Dejour D, Ferrua P, Ntagiopoulos PG, et al. The introduction of a new MRI index to evaluate sagittal patellofemoral engagement. Orthop Traumatol Surg Res. 2013;99(8 suppl):S391-S398.
12. Althani S, Shahi A, Tan TL, Al-Belooshi A. Position of the patella among Emirati adult knees. Is Insall-Salvati ratio applicable to Middle-Easterners? Arch Bone Joint Surg. 2016;4(2):137-140.
13. Yin L, Liao TC, Yang L, Powers CM. Does patella tendon tenodesis improve tibial tubercle distalization in treating patella alta? A computational study. Clin Orthop Relat Res. 2016;474(11):2451-2461.
15. Otsuki S, Nakajima M, Fujiwara K, et al. Influence of age on clinical outcomes of three-dimensional transfer of the tibial tuberosity for patellar instability with patella alta. Knee Surg Sports Traumatol Arthrosc. 2017;25(8):2392-2396.
16. Otsuki S, Nakajima M, Oda S, et al. Three-dimensional transfer of the tibial tuberosity for patellar instability with patella alta. J Orthop Sci. 2013;18(3):437-442.
17. Steensen RN, Bentley JC, Trinh TQ, Backes JR, Wiltfong RE. The prevalence and combined prevalences of anatomic factors associated with recurrent patellar dislocation: a magnetic resonance imaging study. Am J Sports Med. 2015;43(4):921-927.
18. Magnussen RA, De Simone V, Lustig S, Neyret P, Flanigan DC. Treatment of patella alta in patients with episodic patellar dislocation: a systematic review. Knee Surg Sports Traumatol Arthrosc. 2014;22(10):2545-2550.
19. Bertollo N, Pelletier MH, Walsh WR. Simulation of patella alta and the implications for in vitro patellar tracking in the ovine stifle joint. J Orthop Res. 2012;30(11):1789-1797.
20. Narkbunnam R, Chareancholvanich K. Effect of patient position on measurement of patellar height ratio. Arch Orthop Trauma Surg. 2015;135(8):1151-1156.
21. Stefanik JJ, Zhu Y, Zumwalt AC, et al. Association between patella alta and the prevalence and worsening of structural features of patellofemoral joint osteoarthritis: the Multicenter Osteoarthritis Study. Arthritis Care Res. 2010;62(9):1258-1265.
22. Monk AP, Doll HA, Gibbons CL, et al. The patho-anatomy of patellofemoral subluxation. J Bone Joint Surg Br. 2011;93(10):1341-1347.
23. Hirano A, Fukubayashi T, Ishii T, Ochiai N. Relationship between the patellar height and the disorder of the knee extensor mechanism in immature athletes. J Pediatr Orthop. 2001;21(4):541-544.
24. Ng JP, Cawley DT, Beecher SM, Lee MJ, Bergin D, Shannon FJ. Focal intratendinous radiolucency: a new radiographic method for diagnosing patellar tendon ruptures. Knee. 2016;23(3):482-486.
25. van Duijvenbode D, Stavenuiter M, Burger B, van Dijke C, Spermon J, Hoozemans M. The reliability of four widely used patellar height ratios. Int Orthop. 2016;40(3):493-497.
26. Biedert RM, Albrecht S. The patellotrochlear index: a new index for assessing patellar height. Knee Surg Sports Traumatol Arthrosc. 2006;14(8):707-712.
27. Grelsamer RP, Meadows S. The modified Insall-Salvati ratio for assessment of patellar height. Clin Orthop Relat Res. 1992;(282):170-176.
28. Thaunat M, Erasmus PJ. The favourable anisometry: an original concept for medial patellofemoral ligament reconstruction. Knee. 2007;14(6):424-428.
29. Anagnostakos K, Lorbach O, Reiter S, Kohn D. Comparison of five patellar height measurement methods in 90 degrees knee flexion. Int Orthop. 2011;35(12):1791-1797.
30. Miller TT, Staron RB, Feldman F. Patellar height on sagittal MR imaging of the knee. AJR Am J Roentgenol. 1996;167(2):339-341.
31. Dejour D, Le Coultre B. Osteotomies in patello-femoral instabilities. Sports Med Arthrosc Rev. 2007;15(1):39-46.
32. Rhee SJ, Pavlou G, Oakley J, Barlow D, Haddad F. Modern management of patellar instability. Int Orthop. 2012;36(12):2447-2456.
33. Servien E, Verdonk PC, Neyret P. Tibial tuberosity transfer for episodic patellar dislocation. Sports Med Arthrosc Rev. 2007;15(2):61-67.
35. Meyers AB, Laor T, Sharafinski M, Zbojniewicz AM. Imaging assessment of patellar instability and its treatment in children and adolescents. Pediatr Radiol. 2016;46(5):618-636.
37. Dietrich TJ, Fucentese SF, Pfirrmann CW. Imaging of individual anatomical risk factors for patellar instability. Semin Musculoskelet Radiol. 2016;20(1):65-73.
38. Dean CS, Chahla J, Serra Cruz R, Cram TR, LaPrade RF. Patellofemoral joint reconstruction for patellar instability: medial patellofemoral ligament reconstruction, trochleoplasty, and tibial tubercle osteotomy. Arthrosc Tech. 2016;5(1):e169-e175.
39. Frosch KH, Schmeling A. A new classification system of patellar instability and patellar maltracking. Arch Orthop Trauma Surg. 2016;136(4):485-497.
40. Weber AE, Nathani A, Dines JS, et al. An algorithmic approach to the management of recurrent lateral patellar dislocation. J Bone Joint Surg Am. 2016;98(5):417-427.
41. Seil R, Muller B, Georg T, Kohn D, Rupp S. Reliability and interobserver variability in radiological patellar height ratios. Knee Surg Sports Traumatol Arthrosc. 2000;8(4):231-236.
42. Laprade J, Culham E. Radiographic measures in subjects who are asymptomatic and subjects with patellofemoral pain syndrome. Clin Orthop Relat Res. 2003;(414):172-182.
43. Caton JH, Dejour D. Tibial tubercle osteotomy in patello-femoral instability and in patellar height abnormality. Int Orthop. 2010;34(2):305-309.
44. Charles MD, Haloman S, Chen L, Ward SR, Fithian D, Afra R. Magnetic resonance imaging–based topographical differences between control and recurrent patellofemoral instability patients. Am J Sports Med. 2013;41(2):374-384.
45. Kurtul Yildiz H, Ekin EE. Patellar malalignment: a new method on knee MRI. Springerplus. 2016;5(1):1500.
46. Lee PP, Chalian M, Carrino JA, Eng J, Chhabra A. Multimodality correlations of patellar height measurement on x-ray, CT, and MRI. Skeletal Radiol. 2012;41(10):1309-1314.
47. Neyret P, Robinson AH, Le Coultre B, Lapra C, Chambat P. Patellar tendon length—the factor in patellar instability? Knee. 2002;9(1):3-6.
48. Diederichs G, Issever AS, Scheffler S. MR imaging of patellar instability: injury patterns and assessment of risk factors. Radiographics. 2010;30(4):961-981.
49. Earhart C, Patel DB, White EA, Gottsegen CJ, Forrester DM, Matcuk GR Jr. Transient lateral patellar dislocation: review of imaging findings, patellofemoral anatomy, and treatment options. Emerg Radiol. 2013;20(1):11-23.
50. Aarimaa V, Ranne J, Mattila K, Rahi K, Virolainen P, Hiltunen A. Patellar tendon shortening after treatment of patellar instability with a patellar tendon medialization procedure. Scand J Med Sci Sports. 2008;18(4):442-446.
51. Brown DE, Alexander AH, Lichtman DM. The Elmslie-Trillat procedure: evaluation in patellar dislocation and subluxation. Am J Sports Med. 1984;12(2):104-109.
52. Goldstein JL, Verma N, McNickle AG, Zelazny A, Ghodadra N, Bach BR Jr. Avoiding mismatch in allograft anterior cruciate ligament reconstruction: correlation between patient height and patellar tendon length. Arthroscopy. 2010;26(5):643-650.
53. Navali AM, Jafarabadi MA. Is there any correlation between patient height and patellar tendon length? Arch Bone Joint Surg. 2015;3(2):99-103.
54. Park MS, Chung CY, Lee KM, Lee SH, Choi IH. Which is the best method to determine the patellar height in children and adolescents? Clin Orthop Relat Res. 2010;468(5):1344-1351.
55. Berard JB, Magnussen RA, Bonjean G, et al. Femoral tunnel enlargement after medial patellofemoral ligament reconstruction: prevalence, risk factors, and clinical effect. Am J Sports Med. 2014;42(2):297-301.
56. Edama M, Kageyama I, Nakamura M, et al. Anatomical study of the inferior patellar pole and patellar tendon [published online ahead of print February 16, 2017]. Scand J Med Sci Sports. doi:10.1111/sms.12858.
57. Al-Sayyad MJ, Cameron JC. Functional outcome after tibial tubercle transfer for the painful patella alta. Clin Orthop Relat Res. 2002;(396):152-162.
58. Benoit B, Laflamme GY, Laflamme GH, Rouleau D, Delisle J, Morin B. Long-term outcome of surgically-treated habitual patellar dislocation in children with coexistent patella alta. Minimum follow-up of 11 years. J Bone Joint Surg Br. 2007;89(9):1172-1177.
59. Simmons E Jr, Cameron JC. Patella alta and recurrent dislocation of the patella. Clin Orthop Relat Res. 1992;(274):265-269.
60. Degnan AJ, Maldjian C, Adam RJ, Fu FH, Di Domenica M. Comparison of Insall-Salvati ratios in children with an acute anterior cruciate ligament tear and a matched control population. AJR Am J Roentgenol. 2015;204(1):161-166.
61. Wittstein JR, Bartlett EC, Easterbrook J, Byrd JC. Magnetic resonance imaging evaluation of patellofemoral malalignment. Arthroscopy. 2006;22(6):643-649.
Patella alta has a reduced articular area of PF contact.
Presence of patella alta depends on the measurement method.
Patella alta is defined as ISI >1.2 and CDI >1.2 to >1.3.
On sagittal MRI, PTI is used most often with cutoff values of <0.125 to 0.28.
Tibial tubercle distalization is most often used to treat patella alta. The desired postoperative patellar height is a CDI of 1.0.
Patella alta is a patella that rides abnormally high in relation to the femur, the femoral trochlea, or the tibia,1 with decreased bony stability requiring increased knee flexion angles to engage the trochlea.2,3 An abnormally high patella may therefore insufficiently engage the proximal trochlea groove both in extension and in the early phase of knee flexion—making it one of the potential risk factors for patellar instability.4-10 Accordingly, patella alta is present in 30% of patients with recurrent patellar dislocation.11 It also occurs in other disorders, such as knee extensor apparatus disorders, in patients with patellofemoral (PF) pain, chondromalacia, Sinding-Larsen-Johansson disease, Osgood-Schlatter disease, patellar tendinopathy, and osteoarthritis.1,7,8,12-18 As such, patella alta represents an important predisposing factor for patellar malalignment and PF-related complaints. On the other hand, patella alta may also be a normal variant of a person’s knee anatomy and may be well tolerated when not combined with other instability factors.4
Despite the importance of patella alta, there is no consensus on a precise definition, the most reliable measurement method, or the factors thought to be important in clinical decisions regarding treatment. To address this issue, we systematically reviewed the patella alta literature for definitions, the most common measurement methods and their patella alta cutoff values, and cutoff values for surgical correction and proposed surgical techniques.
Methods
In February 2017, using the term patella alta, we performed a systematic literature search on PubMed. Inclusion criteria were original study or review articles, publication in peer-reviewed English-language journals between 2000 and 2017, and narrative description or measurement of human patellar height on plain radiographs or magnetic resonance imaging (MRI). Excluded were abstracts and articles in languages other than English; animal and computational/biomechanical studies; case reports; and knee arthroplasties, knee extensor ruptures, and hereditary and congenital diseases. All evidence levels were included.
We assessed measurement methods, reported cutoff values for patella alta, cutoff values for performing surgical correction, proposed surgical techniques, and postoperative target values. Original study articles and review articles were analyzed separately.
Results
Of 211 articles identified, 92 met the inclusion criteria for original study, and 28 for review. All their abstracts were reviewed, and 91 were excluded: 17 for language other than English, 11 for animal study, 12 for biomechanical/computational study, 20 for case report, 8 for arthroplasty, 13 for hereditary or congenital disease, 1 for extensor apparatus rupture, 3 for editorial letter, and 6 for other reasons. Full text copies of all included articles were obtained and reviewed.
Original Study Articles
Definition. Of the 92 original study articles, 17 (18.5%) defined patella alta by description alone, and 75 (81.5%) used imaging-based measurements. Patella alta was described as a patella that rides abnormally high in relation to the trochlear groove, with a reduced articular area of PF contact1,15,19-21 or decreased patella–trochlea cartilage overlap.22 With this reduced contact area, there is increased PF stress.21
With radiographic measurements, patella alta is defined as a Caton-Deschamps index (CDI) of >1.2 to >1.3, an Insall-Salvati index (ISI) of >1.2, a Blackburne-Peel index (PBI) of >1.0,4,15,18,23-25 and a patellotrochlear index (PTI) of <0.125 to 0.28.6,26
Table 1.
Table 2.Measurement Methods. Four different patella alta measurement methods were used: lateral radiographs with corresponding ratios (68 studies, 5 indices, Table 1), radiographic ratios measured on MRI (23 studies, 3 indices, Table 2), sagittal MRI (13 studies, 4 methods, Table 3), and patellar tendon length (PTL) measurements (11 studies, 5 methods, Table 4). In 26 studies, multiple measurement methods were used.
Table 3.
Table 4.
On lateral radiographs, ISI was the most common measurement (33 studies), with patella alta cutoff values ranging from >1.2 to >1.5. The second most common measurement was CDI (24 studies), with cutoff values of >1.2 to >1.3. Other indices, such as the modified ISI (6 studies), the BPI (1 study), and the Koshino index (2 studies), had their cutoff values used more consistently (>1.6 to >2.4, >1.0, and >1.2, respectively) but these indices were rarely reported in the literature (Table 1).27,28,29
Thirty-six studies defined patella alta with MRI using either the aforementioned radiographic ratios (23 studies, 3 indices, Table 2) or PF indices (13 studies, 4 methods, Table 3).30
On sagittal MRI, PTI was used most often; cutoff values were <0.125 to 0.28.
Thirteen studies defined patella alta with PTL: 5 using lateral conventional radiographs and 8 using sagittal MRI. For each type of imaging, the cutoff value was >52 mm to >56 mm. PTL was measured either independently or together with ISI on sagittal MRI (Table 4).
Table 5.Treatments. For patella alta, the surgical treatment goals are to increase the PF contact area and improve PF articular congruence and thereby increase PF stability.31-33 Four different procedures were used to treat patella alta (Table 5), but only 11 of the 92 studies included in our review mentioned a specific patellar height that required surgical correction (Table 5, Table 6). Recommendations were based on CDI (>1.2 to >1.4)34 and less often on ISI (>1.2)13 or PTL (>56 mm).22 Only 1 study defined how much distalization was necessary with the procedure.22
Table 6.
Review Articles
Twenty-eight review articles met the inclusion criteria.35-40 Patella alta was described mostly with ISI (75%) or CDI (64%). In up to 57% of these articles, a patella alta reference value was missing. Only 1 article mentioned different cutoff values for conventional radiographs and MRI. BPI was mentioned in 50% of studies, but only 2 indicated a cutoff value for patella alta. Eleven percent used PTI on sagittal MRI and took patella–trochlea cartilage overlap into account.
Eight review articles mentioned cutoff values for surgical correction. Only 1 of 4 articles mentioned a cutoff value for correcting patella alta in PF instability, and only 2 articles suggested an ideal postoperative patellar height (Table 6).
No review article relied on PTL to describe patella alta or to advise surgical treatment.
Discussion
Our review revealed many variations in patella alta definitions and descriptions, measurement methods, cutoff values, and treatment options. Interpretation of patellar height and, particularly, patella alta is very heterogeneous. Accordingly, comparing surgical indications, surgical treatment options, and outcomes across studies can be difficult.
Measurement Methods
Radiographs. Conventional radiographs were used to describe patella alta in two-thirds of the original study articles. The most common measurement methods marked the position of the patella relative to either the femur (direct assessment) or the tibia (indirect assessment).14,25 All established measurement methods use lateral radiographs, which do not show articular cartilage.11,14 Therefore, lateral radiograph ratios of different and variable bony landmarks do not measure actual PF articular congruence. The widely variable morphologies of patella (distal patellar nose, different articulating surface), femoral trochlea (facet in height and length), proximal tibia (inherited or acquired deformities on tibial tubercle), and slope are all confounding factors that may affect measurement (Figure 1). In addition, specific variations in PF joint morphology (eg, small patellar articular surface, short trochlea) are not well represented by these ratios.11
Figure 1.
All these methods have advantages, limitations, and different values of interobserver and intraobserver variability, reliability, and reproducibility (Table 7).29,41
Table 7.
Determination of both patellar height and patella alta depends on the measurement method used and is significantly affected by anatomical variants, such as extra-articular patella and femorotibial landmarks.
The ISI method is most commonly used because it does not depend on degree of knee flexion, is thought to measure the relative length of the patellar tendon the best,5 and has established MRI criteria.6 However, ISI has limitations: Its distal bony landmark is the tibial tuberosity, which can be difficult to assess14; the shape of the patella (mainly its inferior point) varies42; and the measurement does not change after distalization of the tibial tubercle.5
CDI is the most accurate diagnostic method because it relies on readily identifiable and reproducible anatomical landmarks; does not depend on radiograph quality, knee size, radiologic enlargement, or position of the tibial tubercle or patellar modification; and is unaffected by degree of knee flexion between 10° and 80°.38,43 CDI is the method that is most useful in describing patellar height after distalization of the tibial tubercle because it assesses the height of the patella relative to the tibial plateau.5 CDI is limited with respect to clear identification of the patellar and tibial articular margin.37
BPI has the lowest interobserver variability and discriminates best among patella alta, norma, and infera.41 Like CDI, BPI assesses patellar height relative to the tibial plateau, and thus is useful in describing patellar height after distalization of the tibial tubercle.5 BPI is limited in that it uses a line drawn along the tibial plateau, where variations in inclination and tibial slope produce inaccuracies,14 and depends highly on projection angles. Clinically, BPI is rarely used.
As the literature shows, the radiologic methods of determining patellar height are variable and unreliable and depend on the ratio used.26,41 These methods do not reveal precise information about the PF articular congruence, the key finding for necessary treatment.
Radiographic Indices on MRI. Some studies measured radiographic indices on sagittal MRI. Radiologic and MRI measurements are described as not significantly different or slightly different, and 0.09 to 0.13 needs to be added with ISI and BP ratios on radiographs, MRI, and computed tomography (CT).17,44-47 ISI is commonly used, and its clinical application is easy. Although classically measured on plain radiographs, ISI is reliably measured on MRI as well.17,30 The traditional 1.2 threshold for defining patella alta was used by Charles and colleagues.44 CDI is equally well measured on radiographs and MRI.47
Figure 2.MRI. Patellar height is reliably measured on sagittal MRI (Figure 2).6,14,26 The major advantage of sagittal MRI is that it shows the cartilage of the PF joint, and therefore patellar height can be assessed using patella–trochlea cartilage overlap,6,14,26,41 the clinical factor most relevant to patella alta.14
According to the literature, 3 different measurement methods have been used to describe degree of patella–trochlea cartilage overlap: PTI, sagittal patellofemoral engagement (SPE), and patellar articular overlap (PAO).1,11,26
PTI uses the true articular cartilage patella–trochlea relationship for measurement of patellar height on sagittal MRI in extension (Figure 3). If the patellar tendon is fully out to length (no laxity), PTI reliably and precisely determines the exact articular correlation of PF joint and patellar height.6
Figure 3.
SPE is similar to percentage of articular coverage.1,11 Patellar overlap of the trochlea is measured on 2 different sagittal MRI images: 1 with the greatest length of patellar cartilage and 1 with the greatest length of femoral trochlear cartilage. This measurement did not correlate with CDI.1 SPE was not evaluated in control studies, and normal and pathologic values are unavailable.
PAO is measured with patients positioned at rest and in standard knee coils.1 MRI was not obtained in full extension or with quadriceps activation, and knee flexion angle values are unavailable. Total patellar articular length was measured on the sagittal MRI that showed the greatest patellar length and articular cartilage thickness. The same image was used to measure articular overlap, or the length of patellar cartilage overlying the trochlear cartilage, as measured parallel to the subchondral surface of the patella. PAO correlates well with conventional patellar height measurements in the sagittal plane and shows promise as a simpler alternative to the conventional indices.1 Normal and pathologic values are unavailable.
So far, PTI is the only method that was controlled in several studies, assessed for its reliability, and compared with other patellar height measurements.6,14
Figure 4.Ten original study and 3 review articles mentioned PTI as a favorite diagnostic tool for patellar height (Figures 4A, 4B).6,14,40,48,49 SPE and PAO have no validated cutoff values and have not been compared with other patellar height measurements in patients with PF instability or in control patients. In addition, nontrivial technical limitations have been discussed in the literature (Table 8). Therefore, only PTI has proved valuable in measuring patella alta.
Table 8.
Patellar Tendon Length. PTL can be measured on lateral radiographs or sagittal MRI. Radiologic and MRI measurements are described as not significantly different47 or slightly different, and 0.09 to 0.13 needs to be added with the ISI ratio on radiographs, MRI, and CT.46 PTL is reliably evaluated with ISI.41,50 There is a weak correlation of patient height and PTL: Taller people have normally longer tendons.51-53
Figure 5.Some authors have used MRI to measure PTL because MRI 3-dimensionally depicts the patellar tendon and associated anatomy.46,54 The reliability of patellar tendon measurement on MRI is improved relative to radiographs because of improved soft-tissue contrast and cross-sectional depiction (Figure 5).46,54,55
PTL measurements revealed that the posterior surface of the patellar tendon was significantly shorter than the anterior surface. Compared with their corresponding posterior fascicles, anterior fascicles are longer; their attachment is more proximal to the patella and more distal to the tibia. In addition, posterior PTL is significantly shorter with the posterior patellar attachment (adheres to posterior aspect of the inferior patellar pole) than with the anterior attachment (adheres to anterior aspect of the inferior patellar pole).56 Moreover, the lateral and medial fascicles are longer than the central fascicles attaching at the most inferior patellar pole. This issue must be considered in image cut selection (Figures 6A, 6B). Furthermore, type of inferior pole of patella (pointed, intermediate, blunt) is important in measurement.56 Overall, mean (SD) PTL was 54.9 (1.2) mm on the anterior surface and 35.0 (0.6) mm on the posterior surface.
Figure 6.
It is important to precisely describe the measurement method and location (sagittal cut) and to consider the shape of the inferior patellar pole and the site of the patellar tendon attachment.56
Treatments. For patella alta, the surgical treatment goals are to increase the PF contact area and improve PF articular congruence, and thereby increase PF stability.31-33 Four different procedures were used to treat patella alta (Table 5), but only 11 of the 92 original study articles and 8 of the 28 review articles included in our review mentioned a specific patellar height that required surgical correction (Tables 5, 6). Recommendations were based on CDI (>1.2 to >1.4) and less often on ISI (>1.2 to >1.4) or PTL (>56 mm).
Tibial tubercle distalization is effective in normalizing patellar height to correct the patellar index in patella alta (Figures 7A, 7B).13,18,38,55,57 Tibial tubercle distalization and patellar tendon tenodesis attached to the original insertion normalize PTL and stabilize the PF joint in patients with patella alta.5,47 In a comparison of these surgical procedures, cartilage stress was lower with distalization than with distalization and tenodesis.13
Figure 7.
Soft-tissue methods are recommended in children, as bone procedures injure the proximal tibial physis and may cause it to close prematurely.58 The patella can be distally advanced by completely mobilizing the patellar tendon and fixating with sutures through the cartilaginous tibial tubercle. This technique is a satisfactory treatment for skeletally immature patients who present with habitual patellar dislocation associated with patella alta.58,59
CDI and BPI assess patellar height relative to the tibial plateau, and therefore are the most useful measurement methods for patellar height after distalization of the tibial tubercle.5 ISI does not change after distalization of the tibial tubercle and cannot be recommended.5,18 As PF indices (eg, PTI) can trace preoperative and postoperative values, these measurements are valuable.
Controversies
Our review found no consensus on measurement method or cutoff value. No measurement method showed clear clinical or methodologic superiority. Most published patellar height and patella alta data are based on conventional radiographs using a tibial reference point, even though a femoral or even trochlear reference point seems more reproducible, particularly in PF pathologies. Several cutoff values have been reported for each patella alta measurement method. Regarding pathologic thresholds, which might require surgical correction, very little information has been published, and scientific evidence is lacking. Numerous important aspects remain unanswered after this review, and clarification is mandatory.
Five Key Facts
1. In patella alta assessment, different morphologic, biomechanical, and functional aspects must be considered. The most relevant aspect is decreased engagement of the patella and trochlea,4-9,11,26 which results in decreased bony stability in knee extension.1-3 Therefore, patella alta is one of the potential risk factors for patellar instability with a high percentage of recurrent patellar dislocation.4-9 In early knee flexion, the patella translates more distally with better engagement of the patella in the trochlea and better stability. Therefore, measurement in extension, with the patellar tendon out to length, seems to offer a more reliable assessment of the patella–femur relationship.
2. Insufficient engagement of the patella in the trochlea is the most important aspect of patella alta.11 Therefore, direct measurement of this engagement seems logical.
3. As radiographs do not show articular cartilage, they should not be used to assess the articular patella–femur relationship.11,14,26 Patella–trochlea cartilage overlap is the most relevant factor for patella alta and should be measured on MRI.6,14,26,32
4. PTL is an important factor for patellar height and particularly patella alta. The range of normal PTL values is wide: 35 mm to 61 mm. The described cutoff values for patella alta (>52 mm to >56 mm) fall within this normal range. The cause may be the different measurement methods used.33,47,59-61 Therefore, for precise diagnostics, a standardized measurement method that includes the selected cut imaging is mandatory.
Table 9.5. Despite the relevance of surgical correction, investigators have reported only a few values for the postoperative position of the patella with the desired level.37,39,47 Exact values after surgical correction and type of measurement method must be defined. Many important aspects remain unanswered, and clarification is mandatory (Table 9).
Conclusion
Our review revealed many variations in patella alta definitions and descriptions, measurement methods, cutoff values, and treatment options. Presence of patella alta depends on measurement method used. Methods cannot be used interchangeably, and they all have their advantages and limitations. Unfortunately, there is no generally accepted consensus on measurement method, patella alta cutoff value, or treatment with ideal correction. Treatment planning and outcomes assessment require clarification of these many issues.
Take-Home Points
Patella alta has a reduced articular area of PF contact.
Presence of patella alta depends on the measurement method.
Patella alta is defined as ISI >1.2 and CDI >1.2 to >1.3.
On sagittal MRI, PTI is used most often with cutoff values of <0.125 to 0.28.
Tibial tubercle distalization is most often used to treat patella alta. The desired postoperative patellar height is a CDI of 1.0.
Patella alta is a patella that rides abnormally high in relation to the femur, the femoral trochlea, or the tibia,1 with decreased bony stability requiring increased knee flexion angles to engage the trochlea.2,3 An abnormally high patella may therefore insufficiently engage the proximal trochlea groove both in extension and in the early phase of knee flexion—making it one of the potential risk factors for patellar instability.4-10 Accordingly, patella alta is present in 30% of patients with recurrent patellar dislocation.11 It also occurs in other disorders, such as knee extensor apparatus disorders, in patients with patellofemoral (PF) pain, chondromalacia, Sinding-Larsen-Johansson disease, Osgood-Schlatter disease, patellar tendinopathy, and osteoarthritis.1,7,8,12-18 As such, patella alta represents an important predisposing factor for patellar malalignment and PF-related complaints. On the other hand, patella alta may also be a normal variant of a person’s knee anatomy and may be well tolerated when not combined with other instability factors.4
Despite the importance of patella alta, there is no consensus on a precise definition, the most reliable measurement method, or the factors thought to be important in clinical decisions regarding treatment. To address this issue, we systematically reviewed the patella alta literature for definitions, the most common measurement methods and their patella alta cutoff values, and cutoff values for surgical correction and proposed surgical techniques.
Methods
In February 2017, using the term patella alta, we performed a systematic literature search on PubMed. Inclusion criteria were original study or review articles, publication in peer-reviewed English-language journals between 2000 and 2017, and narrative description or measurement of human patellar height on plain radiographs or magnetic resonance imaging (MRI). Excluded were abstracts and articles in languages other than English; animal and computational/biomechanical studies; case reports; and knee arthroplasties, knee extensor ruptures, and hereditary and congenital diseases. All evidence levels were included.
We assessed measurement methods, reported cutoff values for patella alta, cutoff values for performing surgical correction, proposed surgical techniques, and postoperative target values. Original study articles and review articles were analyzed separately.
Results
Of 211 articles identified, 92 met the inclusion criteria for original study, and 28 for review. All their abstracts were reviewed, and 91 were excluded: 17 for language other than English, 11 for animal study, 12 for biomechanical/computational study, 20 for case report, 8 for arthroplasty, 13 for hereditary or congenital disease, 1 for extensor apparatus rupture, 3 for editorial letter, and 6 for other reasons. Full text copies of all included articles were obtained and reviewed.
Original Study Articles
Definition. Of the 92 original study articles, 17 (18.5%) defined patella alta by description alone, and 75 (81.5%) used imaging-based measurements. Patella alta was described as a patella that rides abnormally high in relation to the trochlear groove, with a reduced articular area of PF contact1,15,19-21 or decreased patella–trochlea cartilage overlap.22 With this reduced contact area, there is increased PF stress.21
With radiographic measurements, patella alta is defined as a Caton-Deschamps index (CDI) of >1.2 to >1.3, an Insall-Salvati index (ISI) of >1.2, a Blackburne-Peel index (PBI) of >1.0,4,15,18,23-25 and a patellotrochlear index (PTI) of <0.125 to 0.28.6,26
Table 1.
Table 2.Measurement Methods. Four different patella alta measurement methods were used: lateral radiographs with corresponding ratios (68 studies, 5 indices, Table 1), radiographic ratios measured on MRI (23 studies, 3 indices, Table 2), sagittal MRI (13 studies, 4 methods, Table 3), and patellar tendon length (PTL) measurements (11 studies, 5 methods, Table 4). In 26 studies, multiple measurement methods were used.
Table 3.
Table 4.
On lateral radiographs, ISI was the most common measurement (33 studies), with patella alta cutoff values ranging from >1.2 to >1.5. The second most common measurement was CDI (24 studies), with cutoff values of >1.2 to >1.3. Other indices, such as the modified ISI (6 studies), the BPI (1 study), and the Koshino index (2 studies), had their cutoff values used more consistently (>1.6 to >2.4, >1.0, and >1.2, respectively) but these indices were rarely reported in the literature (Table 1).27,28,29
Thirty-six studies defined patella alta with MRI using either the aforementioned radiographic ratios (23 studies, 3 indices, Table 2) or PF indices (13 studies, 4 methods, Table 3).30
On sagittal MRI, PTI was used most often; cutoff values were <0.125 to 0.28.
Thirteen studies defined patella alta with PTL: 5 using lateral conventional radiographs and 8 using sagittal MRI. For each type of imaging, the cutoff value was >52 mm to >56 mm. PTL was measured either independently or together with ISI on sagittal MRI (Table 4).
Table 5.Treatments. For patella alta, the surgical treatment goals are to increase the PF contact area and improve PF articular congruence and thereby increase PF stability.31-33 Four different procedures were used to treat patella alta (Table 5), but only 11 of the 92 studies included in our review mentioned a specific patellar height that required surgical correction (Table 5, Table 6). Recommendations were based on CDI (>1.2 to >1.4)34 and less often on ISI (>1.2)13 or PTL (>56 mm).22 Only 1 study defined how much distalization was necessary with the procedure.22
Table 6.
Review Articles
Twenty-eight review articles met the inclusion criteria.35-40 Patella alta was described mostly with ISI (75%) or CDI (64%). In up to 57% of these articles, a patella alta reference value was missing. Only 1 article mentioned different cutoff values for conventional radiographs and MRI. BPI was mentioned in 50% of studies, but only 2 indicated a cutoff value for patella alta. Eleven percent used PTI on sagittal MRI and took patella–trochlea cartilage overlap into account.
Eight review articles mentioned cutoff values for surgical correction. Only 1 of 4 articles mentioned a cutoff value for correcting patella alta in PF instability, and only 2 articles suggested an ideal postoperative patellar height (Table 6).
No review article relied on PTL to describe patella alta or to advise surgical treatment.
Discussion
Our review revealed many variations in patella alta definitions and descriptions, measurement methods, cutoff values, and treatment options. Interpretation of patellar height and, particularly, patella alta is very heterogeneous. Accordingly, comparing surgical indications, surgical treatment options, and outcomes across studies can be difficult.
Measurement Methods
Radiographs. Conventional radiographs were used to describe patella alta in two-thirds of the original study articles. The most common measurement methods marked the position of the patella relative to either the femur (direct assessment) or the tibia (indirect assessment).14,25 All established measurement methods use lateral radiographs, which do not show articular cartilage.11,14 Therefore, lateral radiograph ratios of different and variable bony landmarks do not measure actual PF articular congruence. The widely variable morphologies of patella (distal patellar nose, different articulating surface), femoral trochlea (facet in height and length), proximal tibia (inherited or acquired deformities on tibial tubercle), and slope are all confounding factors that may affect measurement (Figure 1). In addition, specific variations in PF joint morphology (eg, small patellar articular surface, short trochlea) are not well represented by these ratios.11
Figure 1.
All these methods have advantages, limitations, and different values of interobserver and intraobserver variability, reliability, and reproducibility (Table 7).29,41
Table 7.
Determination of both patellar height and patella alta depends on the measurement method used and is significantly affected by anatomical variants, such as extra-articular patella and femorotibial landmarks.
The ISI method is most commonly used because it does not depend on degree of knee flexion, is thought to measure the relative length of the patellar tendon the best,5 and has established MRI criteria.6 However, ISI has limitations: Its distal bony landmark is the tibial tuberosity, which can be difficult to assess14; the shape of the patella (mainly its inferior point) varies42; and the measurement does not change after distalization of the tibial tubercle.5
CDI is the most accurate diagnostic method because it relies on readily identifiable and reproducible anatomical landmarks; does not depend on radiograph quality, knee size, radiologic enlargement, or position of the tibial tubercle or patellar modification; and is unaffected by degree of knee flexion between 10° and 80°.38,43 CDI is the method that is most useful in describing patellar height after distalization of the tibial tubercle because it assesses the height of the patella relative to the tibial plateau.5 CDI is limited with respect to clear identification of the patellar and tibial articular margin.37
BPI has the lowest interobserver variability and discriminates best among patella alta, norma, and infera.41 Like CDI, BPI assesses patellar height relative to the tibial plateau, and thus is useful in describing patellar height after distalization of the tibial tubercle.5 BPI is limited in that it uses a line drawn along the tibial plateau, where variations in inclination and tibial slope produce inaccuracies,14 and depends highly on projection angles. Clinically, BPI is rarely used.
As the literature shows, the radiologic methods of determining patellar height are variable and unreliable and depend on the ratio used.26,41 These methods do not reveal precise information about the PF articular congruence, the key finding for necessary treatment.
Radiographic Indices on MRI. Some studies measured radiographic indices on sagittal MRI. Radiologic and MRI measurements are described as not significantly different or slightly different, and 0.09 to 0.13 needs to be added with ISI and BP ratios on radiographs, MRI, and computed tomography (CT).17,44-47 ISI is commonly used, and its clinical application is easy. Although classically measured on plain radiographs, ISI is reliably measured on MRI as well.17,30 The traditional 1.2 threshold for defining patella alta was used by Charles and colleagues.44 CDI is equally well measured on radiographs and MRI.47
Figure 2.MRI. Patellar height is reliably measured on sagittal MRI (Figure 2).6,14,26 The major advantage of sagittal MRI is that it shows the cartilage of the PF joint, and therefore patellar height can be assessed using patella–trochlea cartilage overlap,6,14,26,41 the clinical factor most relevant to patella alta.14
According to the literature, 3 different measurement methods have been used to describe degree of patella–trochlea cartilage overlap: PTI, sagittal patellofemoral engagement (SPE), and patellar articular overlap (PAO).1,11,26
PTI uses the true articular cartilage patella–trochlea relationship for measurement of patellar height on sagittal MRI in extension (Figure 3). If the patellar tendon is fully out to length (no laxity), PTI reliably and precisely determines the exact articular correlation of PF joint and patellar height.6
Figure 3.
SPE is similar to percentage of articular coverage.1,11 Patellar overlap of the trochlea is measured on 2 different sagittal MRI images: 1 with the greatest length of patellar cartilage and 1 with the greatest length of femoral trochlear cartilage. This measurement did not correlate with CDI.1 SPE was not evaluated in control studies, and normal and pathologic values are unavailable.
PAO is measured with patients positioned at rest and in standard knee coils.1 MRI was not obtained in full extension or with quadriceps activation, and knee flexion angle values are unavailable. Total patellar articular length was measured on the sagittal MRI that showed the greatest patellar length and articular cartilage thickness. The same image was used to measure articular overlap, or the length of patellar cartilage overlying the trochlear cartilage, as measured parallel to the subchondral surface of the patella. PAO correlates well with conventional patellar height measurements in the sagittal plane and shows promise as a simpler alternative to the conventional indices.1 Normal and pathologic values are unavailable.
So far, PTI is the only method that was controlled in several studies, assessed for its reliability, and compared with other patellar height measurements.6,14
Figure 4.Ten original study and 3 review articles mentioned PTI as a favorite diagnostic tool for patellar height (Figures 4A, 4B).6,14,40,48,49 SPE and PAO have no validated cutoff values and have not been compared with other patellar height measurements in patients with PF instability or in control patients. In addition, nontrivial technical limitations have been discussed in the literature (Table 8). Therefore, only PTI has proved valuable in measuring patella alta.
Table 8.
Patellar Tendon Length. PTL can be measured on lateral radiographs or sagittal MRI. Radiologic and MRI measurements are described as not significantly different47 or slightly different, and 0.09 to 0.13 needs to be added with the ISI ratio on radiographs, MRI, and CT.46 PTL is reliably evaluated with ISI.41,50 There is a weak correlation of patient height and PTL: Taller people have normally longer tendons.51-53
Figure 5.Some authors have used MRI to measure PTL because MRI 3-dimensionally depicts the patellar tendon and associated anatomy.46,54 The reliability of patellar tendon measurement on MRI is improved relative to radiographs because of improved soft-tissue contrast and cross-sectional depiction (Figure 5).46,54,55
PTL measurements revealed that the posterior surface of the patellar tendon was significantly shorter than the anterior surface. Compared with their corresponding posterior fascicles, anterior fascicles are longer; their attachment is more proximal to the patella and more distal to the tibia. In addition, posterior PTL is significantly shorter with the posterior patellar attachment (adheres to posterior aspect of the inferior patellar pole) than with the anterior attachment (adheres to anterior aspect of the inferior patellar pole).56 Moreover, the lateral and medial fascicles are longer than the central fascicles attaching at the most inferior patellar pole. This issue must be considered in image cut selection (Figures 6A, 6B). Furthermore, type of inferior pole of patella (pointed, intermediate, blunt) is important in measurement.56 Overall, mean (SD) PTL was 54.9 (1.2) mm on the anterior surface and 35.0 (0.6) mm on the posterior surface.
Figure 6.
It is important to precisely describe the measurement method and location (sagittal cut) and to consider the shape of the inferior patellar pole and the site of the patellar tendon attachment.56
Treatments. For patella alta, the surgical treatment goals are to increase the PF contact area and improve PF articular congruence, and thereby increase PF stability.31-33 Four different procedures were used to treat patella alta (Table 5), but only 11 of the 92 original study articles and 8 of the 28 review articles included in our review mentioned a specific patellar height that required surgical correction (Tables 5, 6). Recommendations were based on CDI (>1.2 to >1.4) and less often on ISI (>1.2 to >1.4) or PTL (>56 mm).
Tibial tubercle distalization is effective in normalizing patellar height to correct the patellar index in patella alta (Figures 7A, 7B).13,18,38,55,57 Tibial tubercle distalization and patellar tendon tenodesis attached to the original insertion normalize PTL and stabilize the PF joint in patients with patella alta.5,47 In a comparison of these surgical procedures, cartilage stress was lower with distalization than with distalization and tenodesis.13
Figure 7.
Soft-tissue methods are recommended in children, as bone procedures injure the proximal tibial physis and may cause it to close prematurely.58 The patella can be distally advanced by completely mobilizing the patellar tendon and fixating with sutures through the cartilaginous tibial tubercle. This technique is a satisfactory treatment for skeletally immature patients who present with habitual patellar dislocation associated with patella alta.58,59
CDI and BPI assess patellar height relative to the tibial plateau, and therefore are the most useful measurement methods for patellar height after distalization of the tibial tubercle.5 ISI does not change after distalization of the tibial tubercle and cannot be recommended.5,18 As PF indices (eg, PTI) can trace preoperative and postoperative values, these measurements are valuable.
Controversies
Our review found no consensus on measurement method or cutoff value. No measurement method showed clear clinical or methodologic superiority. Most published patellar height and patella alta data are based on conventional radiographs using a tibial reference point, even though a femoral or even trochlear reference point seems more reproducible, particularly in PF pathologies. Several cutoff values have been reported for each patella alta measurement method. Regarding pathologic thresholds, which might require surgical correction, very little information has been published, and scientific evidence is lacking. Numerous important aspects remain unanswered after this review, and clarification is mandatory.
Five Key Facts
1. In patella alta assessment, different morphologic, biomechanical, and functional aspects must be considered. The most relevant aspect is decreased engagement of the patella and trochlea,4-9,11,26 which results in decreased bony stability in knee extension.1-3 Therefore, patella alta is one of the potential risk factors for patellar instability with a high percentage of recurrent patellar dislocation.4-9 In early knee flexion, the patella translates more distally with better engagement of the patella in the trochlea and better stability. Therefore, measurement in extension, with the patellar tendon out to length, seems to offer a more reliable assessment of the patella–femur relationship.
2. Insufficient engagement of the patella in the trochlea is the most important aspect of patella alta.11 Therefore, direct measurement of this engagement seems logical.
3. As radiographs do not show articular cartilage, they should not be used to assess the articular patella–femur relationship.11,14,26 Patella–trochlea cartilage overlap is the most relevant factor for patella alta and should be measured on MRI.6,14,26,32
4. PTL is an important factor for patellar height and particularly patella alta. The range of normal PTL values is wide: 35 mm to 61 mm. The described cutoff values for patella alta (>52 mm to >56 mm) fall within this normal range. The cause may be the different measurement methods used.33,47,59-61 Therefore, for precise diagnostics, a standardized measurement method that includes the selected cut imaging is mandatory.
Table 9.5. Despite the relevance of surgical correction, investigators have reported only a few values for the postoperative position of the patella with the desired level.37,39,47 Exact values after surgical correction and type of measurement method must be defined. Many important aspects remain unanswered, and clarification is mandatory (Table 9).
Conclusion
Our review revealed many variations in patella alta definitions and descriptions, measurement methods, cutoff values, and treatment options. Presence of patella alta depends on measurement method used. Methods cannot be used interchangeably, and they all have their advantages and limitations. Unfortunately, there is no generally accepted consensus on measurement method, patella alta cutoff value, or treatment with ideal correction. Treatment planning and outcomes assessment require clarification of these many issues.
References
1 Munch JL, Sullivan JP, Nguyen JT, et al. Patellar articular overlap on MRI is a simple alternative to conventional measurements of patellar height. Orthop J Sports Med. 2016;4(7):2325967116656328.
2. Elias JJ, Soehnlen NT, Guseila LM, Cosgarea AJ. Dynamic tracking influenced by anatomy in patellar instability. Knee. 2016;23(3):450-455.
3. Fabricant PD, Ladenhauf HN, Salvati EA, Green DW. Medial patellofemoral ligament (MPFL) reconstruction improves radiographic measures of patella alta in children. Knee. 2014;21(6):1180-1184.
4. Askenberger M, Janarv PM, Finnbogason T, Arendt EA. Morphology and anatomic patellar instability risk factors in first-time traumatic lateral patellar dislocations. Am J Sports Med. 2017;45(1):50-58.
5. Mayer C, Magnussen RA, Servien E, et al. Patellar tendon tenodesis in association with tibial tubercle distalization for the treatment of episodic patellar dislocation with patella alta. Am J Sports Med. 2012;40(2):346-351.
6. Ali SA, Helmer R, Terk MR. Patella alta: lack of correlation between patellotrochlear cartilage congruence and commonly used patellar height ratios. AJR Am J Roentgenol. 2009;193(5):1361-1366.
7. Lewallen LW, McIntosh AL, Dahm DL. Predictors of recurrent instability after acute patellofemoral dislocation in pediatric and adolescent patients. Am J Sports Med. 2013;41(3):575-581.
8. Ward SR, Terk MR, Powers CM. Patella alta: association with patellofemoral alignment and changes in contact area during weight-bearing. J Bone Joint Surg Am. 2007;89(8):1749-1755.
9. Dejour H, Walch G, Nove-Josserand L, Guier C. Factors of patellar instability: an anatomic radiographic study. Knee Surg Sports Traumatol Arthrosc. 1994;2(1):19-26.
10. Arendt EA, Fithian DC, Cohen E. Current concepts of lateral patella dislocation. Clin Sports Med. 2002;21(3):499-519.
11. Dejour D, Ferrua P, Ntagiopoulos PG, et al. The introduction of a new MRI index to evaluate sagittal patellofemoral engagement. Orthop Traumatol Surg Res. 2013;99(8 suppl):S391-S398.
12. Althani S, Shahi A, Tan TL, Al-Belooshi A. Position of the patella among Emirati adult knees. Is Insall-Salvati ratio applicable to Middle-Easterners? Arch Bone Joint Surg. 2016;4(2):137-140.
13. Yin L, Liao TC, Yang L, Powers CM. Does patella tendon tenodesis improve tibial tubercle distalization in treating patella alta? A computational study. Clin Orthop Relat Res. 2016;474(11):2451-2461.
15. Otsuki S, Nakajima M, Fujiwara K, et al. Influence of age on clinical outcomes of three-dimensional transfer of the tibial tuberosity for patellar instability with patella alta. Knee Surg Sports Traumatol Arthrosc. 2017;25(8):2392-2396.
16. Otsuki S, Nakajima M, Oda S, et al. Three-dimensional transfer of the tibial tuberosity for patellar instability with patella alta. J Orthop Sci. 2013;18(3):437-442.
17. Steensen RN, Bentley JC, Trinh TQ, Backes JR, Wiltfong RE. The prevalence and combined prevalences of anatomic factors associated with recurrent patellar dislocation: a magnetic resonance imaging study. Am J Sports Med. 2015;43(4):921-927.
18. Magnussen RA, De Simone V, Lustig S, Neyret P, Flanigan DC. Treatment of patella alta in patients with episodic patellar dislocation: a systematic review. Knee Surg Sports Traumatol Arthrosc. 2014;22(10):2545-2550.
19. Bertollo N, Pelletier MH, Walsh WR. Simulation of patella alta and the implications for in vitro patellar tracking in the ovine stifle joint. J Orthop Res. 2012;30(11):1789-1797.
20. Narkbunnam R, Chareancholvanich K. Effect of patient position on measurement of patellar height ratio. Arch Orthop Trauma Surg. 2015;135(8):1151-1156.
21. Stefanik JJ, Zhu Y, Zumwalt AC, et al. Association between patella alta and the prevalence and worsening of structural features of patellofemoral joint osteoarthritis: the Multicenter Osteoarthritis Study. Arthritis Care Res. 2010;62(9):1258-1265.
22. Monk AP, Doll HA, Gibbons CL, et al. The patho-anatomy of patellofemoral subluxation. J Bone Joint Surg Br. 2011;93(10):1341-1347.
23. Hirano A, Fukubayashi T, Ishii T, Ochiai N. Relationship between the patellar height and the disorder of the knee extensor mechanism in immature athletes. J Pediatr Orthop. 2001;21(4):541-544.
24. Ng JP, Cawley DT, Beecher SM, Lee MJ, Bergin D, Shannon FJ. Focal intratendinous radiolucency: a new radiographic method for diagnosing patellar tendon ruptures. Knee. 2016;23(3):482-486.
25. van Duijvenbode D, Stavenuiter M, Burger B, van Dijke C, Spermon J, Hoozemans M. The reliability of four widely used patellar height ratios. Int Orthop. 2016;40(3):493-497.
26. Biedert RM, Albrecht S. The patellotrochlear index: a new index for assessing patellar height. Knee Surg Sports Traumatol Arthrosc. 2006;14(8):707-712.
27. Grelsamer RP, Meadows S. The modified Insall-Salvati ratio for assessment of patellar height. Clin Orthop Relat Res. 1992;(282):170-176.
28. Thaunat M, Erasmus PJ. The favourable anisometry: an original concept for medial patellofemoral ligament reconstruction. Knee. 2007;14(6):424-428.
29. Anagnostakos K, Lorbach O, Reiter S, Kohn D. Comparison of five patellar height measurement methods in 90 degrees knee flexion. Int Orthop. 2011;35(12):1791-1797.
30. Miller TT, Staron RB, Feldman F. Patellar height on sagittal MR imaging of the knee. AJR Am J Roentgenol. 1996;167(2):339-341.
31. Dejour D, Le Coultre B. Osteotomies in patello-femoral instabilities. Sports Med Arthrosc Rev. 2007;15(1):39-46.
32. Rhee SJ, Pavlou G, Oakley J, Barlow D, Haddad F. Modern management of patellar instability. Int Orthop. 2012;36(12):2447-2456.
33. Servien E, Verdonk PC, Neyret P. Tibial tuberosity transfer for episodic patellar dislocation. Sports Med Arthrosc Rev. 2007;15(2):61-67.
35. Meyers AB, Laor T, Sharafinski M, Zbojniewicz AM. Imaging assessment of patellar instability and its treatment in children and adolescents. Pediatr Radiol. 2016;46(5):618-636.
37. Dietrich TJ, Fucentese SF, Pfirrmann CW. Imaging of individual anatomical risk factors for patellar instability. Semin Musculoskelet Radiol. 2016;20(1):65-73.
38. Dean CS, Chahla J, Serra Cruz R, Cram TR, LaPrade RF. Patellofemoral joint reconstruction for patellar instability: medial patellofemoral ligament reconstruction, trochleoplasty, and tibial tubercle osteotomy. Arthrosc Tech. 2016;5(1):e169-e175.
39. Frosch KH, Schmeling A. A new classification system of patellar instability and patellar maltracking. Arch Orthop Trauma Surg. 2016;136(4):485-497.
40. Weber AE, Nathani A, Dines JS, et al. An algorithmic approach to the management of recurrent lateral patellar dislocation. J Bone Joint Surg Am. 2016;98(5):417-427.
41. Seil R, Muller B, Georg T, Kohn D, Rupp S. Reliability and interobserver variability in radiological patellar height ratios. Knee Surg Sports Traumatol Arthrosc. 2000;8(4):231-236.
42. Laprade J, Culham E. Radiographic measures in subjects who are asymptomatic and subjects with patellofemoral pain syndrome. Clin Orthop Relat Res. 2003;(414):172-182.
43. Caton JH, Dejour D. Tibial tubercle osteotomy in patello-femoral instability and in patellar height abnormality. Int Orthop. 2010;34(2):305-309.
44. Charles MD, Haloman S, Chen L, Ward SR, Fithian D, Afra R. Magnetic resonance imaging–based topographical differences between control and recurrent patellofemoral instability patients. Am J Sports Med. 2013;41(2):374-384.
45. Kurtul Yildiz H, Ekin EE. Patellar malalignment: a new method on knee MRI. Springerplus. 2016;5(1):1500.
46. Lee PP, Chalian M, Carrino JA, Eng J, Chhabra A. Multimodality correlations of patellar height measurement on x-ray, CT, and MRI. Skeletal Radiol. 2012;41(10):1309-1314.
47. Neyret P, Robinson AH, Le Coultre B, Lapra C, Chambat P. Patellar tendon length—the factor in patellar instability? Knee. 2002;9(1):3-6.
48. Diederichs G, Issever AS, Scheffler S. MR imaging of patellar instability: injury patterns and assessment of risk factors. Radiographics. 2010;30(4):961-981.
49. Earhart C, Patel DB, White EA, Gottsegen CJ, Forrester DM, Matcuk GR Jr. Transient lateral patellar dislocation: review of imaging findings, patellofemoral anatomy, and treatment options. Emerg Radiol. 2013;20(1):11-23.
50. Aarimaa V, Ranne J, Mattila K, Rahi K, Virolainen P, Hiltunen A. Patellar tendon shortening after treatment of patellar instability with a patellar tendon medialization procedure. Scand J Med Sci Sports. 2008;18(4):442-446.
51. Brown DE, Alexander AH, Lichtman DM. The Elmslie-Trillat procedure: evaluation in patellar dislocation and subluxation. Am J Sports Med. 1984;12(2):104-109.
52. Goldstein JL, Verma N, McNickle AG, Zelazny A, Ghodadra N, Bach BR Jr. Avoiding mismatch in allograft anterior cruciate ligament reconstruction: correlation between patient height and patellar tendon length. Arthroscopy. 2010;26(5):643-650.
53. Navali AM, Jafarabadi MA. Is there any correlation between patient height and patellar tendon length? Arch Bone Joint Surg. 2015;3(2):99-103.
54. Park MS, Chung CY, Lee KM, Lee SH, Choi IH. Which is the best method to determine the patellar height in children and adolescents? Clin Orthop Relat Res. 2010;468(5):1344-1351.
55. Berard JB, Magnussen RA, Bonjean G, et al. Femoral tunnel enlargement after medial patellofemoral ligament reconstruction: prevalence, risk factors, and clinical effect. Am J Sports Med. 2014;42(2):297-301.
56. Edama M, Kageyama I, Nakamura M, et al. Anatomical study of the inferior patellar pole and patellar tendon [published online ahead of print February 16, 2017]. Scand J Med Sci Sports. doi:10.1111/sms.12858.
57. Al-Sayyad MJ, Cameron JC. Functional outcome after tibial tubercle transfer for the painful patella alta. Clin Orthop Relat Res. 2002;(396):152-162.
58. Benoit B, Laflamme GY, Laflamme GH, Rouleau D, Delisle J, Morin B. Long-term outcome of surgically-treated habitual patellar dislocation in children with coexistent patella alta. Minimum follow-up of 11 years. J Bone Joint Surg Br. 2007;89(9):1172-1177.
59. Simmons E Jr, Cameron JC. Patella alta and recurrent dislocation of the patella. Clin Orthop Relat Res. 1992;(274):265-269.
60. Degnan AJ, Maldjian C, Adam RJ, Fu FH, Di Domenica M. Comparison of Insall-Salvati ratios in children with an acute anterior cruciate ligament tear and a matched control population. AJR Am J Roentgenol. 2015;204(1):161-166.
61. Wittstein JR, Bartlett EC, Easterbrook J, Byrd JC. Magnetic resonance imaging evaluation of patellofemoral malalignment. Arthroscopy. 2006;22(6):643-649.
There is no difference in PROMs following knotless or knotted labral repair.
Operative time is shorter for knotless compared to knotted glenoid labral tears.
Knotless constructs may be more predictable than knotted constructs biomechanically.
Orthopedic surgeons often encounter labral pathology, and labral tears historically have required open techniques.1-3 Arthroscopy allows for advanced visualization and treatment of shoulder lesions,4,5 including anterior, posterior, and superior labrum anterior to posterior (SLAP) lesions.6
The goal of arthroscopic labral repair is to restore joint stability while maintaining range of motion. Arthroscopically repairing the labrum with suture anchors has become the standard technique, and several studies have reported satisfactory biomechanical and clinical results.1,7-12 Surgeons traditionally have been required to tie knots for these anchors, but knot security varies significantly among experienced arthroscopic surgeons.13 In addition, knots can migrate,14 and bulky knots can cause chondral abrasion.15,16 Several manufacturers have introduced knotless anchors for soft-tissue fixation.15,17 The knotless technique provides a low-profile repair with potentially less operating time.8 These factors may warrant switching from knotted to knotless techniques if outcomes are clinically acceptable. However, few studies have compared knotted and knotless techniques for glenohumeral labral repair.8,15,18-21
We conducted a study to compare the clinical results and operative times of knotless and knotted fixation of anterior and posterior glenohumeral labral repairs and SLAP repairs. We hypothesized there would be no difference in patient-reported outcome measures (PROMs) between knotted and knotless techniques.
Methods
We retrospectively evaluated data that had been prospectively collected between 2012 and 2016 in a Surgical Outcomes System (SOS; Arthrex) database. Participation in this registry is elective, and enrollment can occur on a case-by-case basis. The database stores data on basic demographics, PROMs, and operative time. Data for our specific analysis were available for surgeries performed by 115 different surgeons. Inclusion criteria included primary isolated arthroscopic anterior, isolated posterior, and isolated SLAP repair with completely knotted or completely knotless labral repair and minimum 1-year follow-up. Exclusion criteria included hybrid knotted–knotless repair, rotator cuff repair, revision surgery, open surgery, and lack of complete follow-up data.
SOS is a proprietary registry that allows for the collection of basic patient demographics, diagnostic and operative data, and PROMs. PROMs in the SOS shoulder arthroscopy module include Veterans RAND 12-Item Health Survey (VR-12) mental health and physical health component summary scores, visual analog scale (VAS) pain scores, and American Shoulder and Elbow Surgeons (ASES) scores. For this study, PROMs were reviewed before surgery and 6 and 12 months after surgery. In addition, operative times of all procedures were collected.
For the analysis, completely knotted and completely knotless techniques were compared for anterior repair, posterior repair, and SLAP repair. A t test was used to compare the techniques on PROMs, and χ2 test was used to evaluate proportion differences. Statistical significance was set at P < .05.
Results
Anterior Labral Repairs
Of the 102 knotted anterior labral repairs that met the study criteria, 26 (25%) had minimum 1-year follow-up. Of the 122 knotless labral repairs, 33 (27%) had minimum 1-year follow-up. Seventy-five percent of knotted repairs and 80% of knotless repairs were performed in men. Mean (SD) age was 25.3 (11.7) years for the knotted group and 26.9 (10.6) years for the knotless group (P = .109). Anterior labral repairs did not differ in PROMs at any point (Table 1).
Table 1.
A mean of 2.8 anchors was used for knotted repairs, and a mean of 3.1 anchors was used for knotless repairs. Mean operative time was 75.8 minutes for knotted repairs and 67.5 minutes for knotless repairs. Mean (SD) time per anchor was 30.9 (13.9) minutes for knotted repairs and 25.6 (19.5) minutes for knotless repairs (P = .021).
Posterior Labral Repairs
Of the 165 knotted posterior labral repairs that met the study criteria, 39 (29%) had minimum 1-year follow-up. Of the 229 knotless labral repairs, 56 (24%) had minimum 1-year follow-up. Eighty-five percent of knotted repairs and 74% of knotless repairs were performed in men. Mean (SD) age was 29.1 (12.0) years for the knotted group and 27.5 (11.9) years for the knotless group (P = .148). Posterior labral repairs did not differ in PROMs before surgery or 1 year after surgery; 6 months after surgery, these repairs differed only in ASES scores (Table 2).
Table 2.
A mean of 3.6 anchors was used for knotted repairs, and a mean of 3.0 anchors was used for knotless repairs. Mean operative time was 67.0 minutes for knotted repairs and 43.1 minutes for knotless repairs. Mean (SD) time per anchor was 21.1 (10.7) minutes for knotted repairs and 17.5 (14.7) minutes for knotless repairs (P = .031).
SLAP Repairs
Of the 54 knotted SLAP repairs that met the study criteria, 24 (44%) had minimum 1-year follow-up. Of the 138 knotless SLAP repairs, 48 (35%) had minimum 1-year follow-up. Seventy-two percent of knotted repairs and 72% of knotless repairs were performed in men. Mean (SD) age was 32.1 (11.6) years for the knotted group and 35.0 (12.8) years for the knotless group (P = .246). SLAP repairs did not differ in PROMs at any point (Table 3).
Table 3.
A mean of 1.9 anchors was used for knotted repairs, and a mean of 2.1 anchors was used for knotless repairs. Mean operative time was 59.0 minutes for knotted repairs and 40.9 minutes for knotless repairs. Mean (SD) time per anchor was 36.6 (22.4) minutes for knotted repairs and 26.3 (14.0) minutes for knotless repairs (P = .080).
Discussion
Our hypothesis that there would be no difference in PROMs between knotted and knotless labral repairs was confirmed. Our findings are important because this study compared the gold standard of knotted suture anchor with the alternative knotless suture anchor in glenohumeral labral repair. These findings have several important implications for labral repair.
Knot tying traditionally has been used to achieve fixation with an anchor. Although simple in concept, knot tying can be challenging and its quality variable. Thal15 wrote that good-quality arthroscopic suture anchor repair is difficult to achieve because satisfactory knot tying requires significant practice with certain devices designed specifically for knot tying. Multiple surgeons have noted a significant learning curve associated with knot tying, and there is no agreement on which knot is superior.22-26 Leedle and Miller17 even suggested that, because knot tying is difficult, tying knots arthroscopically can lead to knot failure. In their study, they concluded that the knot is consistently the weakest link in suture repair of an anterior labrum construct. In a controlled laboratory study, Hanypsiak and colleagues13 found considerable knot-strength variability among expert arthroscopists. Only 65 (18%) of 365 knots tied fell within 20% of the mean for ultimate load failure, and only 128 (36%) of 365 fell within 20% of the mean for clinical failure (3 mm of displacement). These data suggested expert arthroscopists were unable to tie 5 consecutive knots of the same type consistently. Even among experts, it seems, knot strength varies significantly, and knot-strength issues may affect the rates of labral repair failure.
Multiple authors have also reported that bulky knots can cause chondral abrasion or that knots can migrate.25,27 Rhee and Ha27 reported that, when another knot (eg, a half-hitch knot) is tied to prevent knot failure, the resulting overall knot can be too bulky for a limited space, and chondral abrasion can result. In addition, regardless of size, a knot can migrate and, in its new position, start rubbing against the head of the humerus. Kim and colleagues14 found that, even when a knot is placed away from the humeral head, migration and repeated contact with the head are possible. Park and colleagues28 found that a significant number of knotted SLAP repairs required arthroscopic knot removal for relief of knot-induced pain and clicking.
Knotless constructs have several theoretical advantages over knotted constructs. Compared with a knotted technique, a knotless technique appears to provide more predictable strength, as variability in knot tying is eliminated (unpublished data). A knotless repair also has a lower profile,8 which should lead to less contact with the humeral head.19 Last, a knotless repair is more efficient—it takes less time to perform. In our study, operative time was reduced by a mean of 5.3 minutes per anchor for anterior labral repair. Assuming a mean of 3 anchors, this reduction equates to 16 minutes per case. Therefore, a surgeon who performs 25 labral repairs a year can save 6.7 hours a year. Reduced operative time benefits the patient (ie, lower risk of infection and other complications29), the surgeon, and the healthcare system (ie, cost savings). Macario30 found that operating room costs averaged $62 per minute (range, $22-$133 per minute). Therefore, saving 16 minutes per case could lead to saving $992 per case. In summary, a knotless technique appears to be clinically and financially advantageous as long as its results are the same as or better than those of a knotted technique.
A few other studies have compared knotted and knotless techniques. In a cadaveric study, Slabaugh and colleagues20 found no difference in labral height between traditional and knotless suture anchors. Leedle and Miller17 found that knotless constructs are biomechanically stronger than knotted constructs in anterior labral repair. In a level 3 clinical study, Yang and colleagues21 compared a conventional vertical knot with a knotless horizontal mattress suture in 41 patients who underwent SLAP repair. Functional outcome was no different between the 2 groups, but postoperative range of motion was improved in the knotless group. Ng and Kumar31 compared 45 patients who had knotted Bankart repair with 42 patients who had knotless Bankart repair and found no difference in functional outcome or rate of recurrent dislocation. Similarly, Kocaoglu and colleagues22 found no difference in recurrence rate between 18 patients who underwent a knotted technique for arthroscopic Bankart repair and 20 patients who underwent a knotless technique. Our findings corroborate the findings of these studies and further support the idea that there is no difference between knotted and knotless constructs with respect to PROMs.
Study Limitations
The major strength of this study was its large cohort and large population of surgeons. However, there were several study limitations. First, we could not detail specific repair techniques, such as simple or horizontal mattress orientation, and rehabilitation protocols and other variables are likely as well. Second, the repair technique was not randomized, and therefore there may have been a selection bias based on tissue quality. Although we cannot prove no bias, we think it was unlikely given that the groups were similar in age. Third, our data did not include information on range of motion or recurrent instability. Our goal was simply to evaluate PROMs among multiple surgeons using the 2 techniques. Fourth, there was substantial follow-up loss, which introduced potential selection bias. Last, there may have been conditions under which a hybrid technique with inferior knot tying, combined with a hybrid knotless construct, could have proved advantageous.
Conclusion
Our data showed that the advantages of knotless repair are not compromised in clinical situations. Although the data showed no significant difference in clinical outcomes, knotless repairs may provide surgeons with shorter surgeries, simpler constructs, less potential for chondral damage, and more consistent suture tensioning. Additional studies may further confirm these results.
References
1. Levy DM, Cole BJ, Bach BR Jr. History of surgical intervention of anterior shoulder instability. J Shoulder Elbow Surg. 2016;25(6):e139-e150.
2. Gill TJ, Zarins B. Open repairs for the treatment of anterior shoulder instability. Am J Sports Med. 2003;31(1):142-153.
3. Millett PJ, Clavert P, Warner JJ. Open operative treatment for anterior shoulder instability: when and why? J Bone Joint Surg Am. 2005;87(2):419-432.
4. Stein DA, Jazrawi L, Bartolozzi AR. Arthroscopic stabilization of anterior shoulder instability: a review of the literature. Arthroscopy. 2002;18(8):912-924.
5. Kim SH, Ha KI, Kim SH. Bankart repair in traumatic anterior shoulder instability: open versus arthroscopic technique. Arthroscopy. 2002;18(7):755-763.
6. Snyder SJ, Karzel RP, Del Pizzo W, Ferkel RD, Friedman MJ. SLAP lesions of the shoulder. Arthroscopy. 1990;6(4):274-279.
7. Hantes M, Raoulis V. Arthroscopic findings in anterior shoulder instability. Open Orthop J. 2017;11:119-132.
8. Sileo MJ, Lee SJ, Kremenic IJ, et al. Biomechanical comparison of a knotless suture anchor with standard suture anchor in the repair of type II SLAP tears. Arthroscopy. 2009;25(4):348-354.
9. Iqbal S, Jacobs U, Akhtar A, Macfarlane RJ, Waseem M. A history of shoulder surgery. Open Orthop J. 2013;7:305-309.
10. Garofalo R, Mocci A, Moretti B, et al. Arthroscopic treatment of anterior shoulder instability using knotless suture anchors. Arthroscopy. 2005;21(11):1283-1289.
11. Kersten AD, Fabing M, Ensminger S, et al. Suture capsulorrhaphy versus capsulolabral advancement for shoulder instability. Arthroscopy. 2012;28(10):1344-1351.
12. Cole BJ, Warner JJ. Arthroscopic versus open Bankart repair for traumatic anterior shoulder instability. Clin Sports Med. 2000;19(1):19-48.
13. Hanypsiak BT, DeLong JM, Simmons L, Lowe W, Burkhart S. Knot strength varies widely among expert arthroscopists. Am J Sports Med. 2014;42(8):1978-1984.
14. Kim SH, Ha KI, Park JH, et al. Arthroscopic posterior labral repair and capsular shift for traumatic unidirectional recurrent posterior subluxation of the shoulder. J Bone Joint Surg Am. 2003;85(8):1479-1487.
17. Leedle BP, Miller MD. Pullout strength of knotless suture anchors. Arthroscopy. 2005;21(1):81-85.
18. Caldwell PE 3rd, Pearson SE, D’Angelo MS. Arthroscopic knotless repair of the posterior labrum using LabralTape. Arthrosc Tech. 2016;5(2):e315-e320.
19. Tennent D, Concina C, Pearse E. Arthroscopic posterior stabilization of the shoulder using a percutaneous knotless mattress suture technique. Arthrosc Tech. 2014;3(1):e161-e164.
20. Slabaugh MA, Friel NA, Wang VM, Cole BJ. Restoring the labral height for treatment of Bankart lesions: a comparison of suture anchor constructs. Arthroscopy. 2010;26(5):587-591.
21. Yang HJ, Yoon K, Jin H, Song HS. Clinical outcome of arthroscopic SLAP repair: conventional vertical knot versus knotless horizontal mattress sutures. Knee Surg Sports Traumatol Arthrosc. 2016;24(2):464-469.
22. Kocaoglu B, Guven O, Nalbantoglu U, Aydin N, Haklar U. No difference between knotless sutures and suture anchors in arthroscopic repair of Bankart lesions in collision athletes. Knee Surg Sports Traumatol Arthrosc. 2009;17(7):844-849.
23. Aboalata M, Halawa A, Basyoni Y. The double Bankart bridge: a technique for restoration of the labral footprint in arthroscopic shoulder instability repair. Arthrosc Tech. 2017;6(1):e43-e47.
24. Rhee SM, Kang SY, Jang EC, Kim JY, Ha YC. Clinical outcomes after arthroscopic acetabular labral repair using knot-tying or knotless suture technique. Arch Orthop Trauma Surg. 2016;136(10):1411-1416.
25. Oh JH, Lee HK, Kim JY, Kim SH, Gong HS. Clinical and radiologic outcomes of arthroscopic glenoid labrum repair with the BioKnotless suture anchor. Am J Sports Med. 2009;37(12):2340-2348.
26. Yian E, Wang C, Millett PJ, Warner JJ. Arthroscopic repair of SLAP lesions with a BioKnotless suture anchor. Arthroscopy. 2004;20(5):547-551.
27. Rhee YG, Ha JH. Knot-induced glenoid erosion after arthroscopic fixation for unstable superior labrum anterior-posterior lesion: case report. J Shoulder Elbow Surg. 2006;15(3):391-393.
28. Park JG, Cho NS, Kim JY, Song JH, Hong SJ, Rhee YG. Arthroscopic knot removal for failed superior labrum anterior-posterior repair secondary to knot-induced pain. Am J Sports Med. 2017;45(11):2563-2568.
29. Wang DS. Re: how slow is too slow? Correlation of operative time to complications: an analysis from the Tennessee Surgical Quality Collaborative. J Urol. 2016;195(5):1510-1511.
30. Macario A. What does one minute of operating room time cost? J Clin Anesth. 2010;22(4):233-236.
31. Ng DZ, Kumar VP. Arthroscopic Bankart repair using knot-tying versus knotless suture anchors: is there a difference? Arthroscopy. 2014;30(4):422-427.
Authors’ Disclosure Statement: Dr. Brady and Dr. Denard report that they are consultants for and receive royalties from Arthrex. Dr. Adams reports that he is an employee of Arthrex. Dr. Tokish reports that he is a consultant for Arthrex. The other authors report no actual or potential conflict of interest in relation to this article.
Authors’ Disclosure Statement: Dr. Brady and Dr. Denard report that they are consultants for and receive royalties from Arthrex. Dr. Adams reports that he is an employee of Arthrex. Dr. Tokish reports that he is a consultant for Arthrex. The other authors report no actual or potential conflict of interest in relation to this article.
Author and Disclosure Information
Authors’ Disclosure Statement: Dr. Brady and Dr. Denard report that they are consultants for and receive royalties from Arthrex. Dr. Adams reports that he is an employee of Arthrex. Dr. Tokish reports that he is a consultant for Arthrex. The other authors report no actual or potential conflict of interest in relation to this article.
There is no difference in PROMs following knotless or knotted labral repair.
Operative time is shorter for knotless compared to knotted glenoid labral tears.
Knotless constructs may be more predictable than knotted constructs biomechanically.
Orthopedic surgeons often encounter labral pathology, and labral tears historically have required open techniques.1-3 Arthroscopy allows for advanced visualization and treatment of shoulder lesions,4,5 including anterior, posterior, and superior labrum anterior to posterior (SLAP) lesions.6
The goal of arthroscopic labral repair is to restore joint stability while maintaining range of motion. Arthroscopically repairing the labrum with suture anchors has become the standard technique, and several studies have reported satisfactory biomechanical and clinical results.1,7-12 Surgeons traditionally have been required to tie knots for these anchors, but knot security varies significantly among experienced arthroscopic surgeons.13 In addition, knots can migrate,14 and bulky knots can cause chondral abrasion.15,16 Several manufacturers have introduced knotless anchors for soft-tissue fixation.15,17 The knotless technique provides a low-profile repair with potentially less operating time.8 These factors may warrant switching from knotted to knotless techniques if outcomes are clinically acceptable. However, few studies have compared knotted and knotless techniques for glenohumeral labral repair.8,15,18-21
We conducted a study to compare the clinical results and operative times of knotless and knotted fixation of anterior and posterior glenohumeral labral repairs and SLAP repairs. We hypothesized there would be no difference in patient-reported outcome measures (PROMs) between knotted and knotless techniques.
Methods
We retrospectively evaluated data that had been prospectively collected between 2012 and 2016 in a Surgical Outcomes System (SOS; Arthrex) database. Participation in this registry is elective, and enrollment can occur on a case-by-case basis. The database stores data on basic demographics, PROMs, and operative time. Data for our specific analysis were available for surgeries performed by 115 different surgeons. Inclusion criteria included primary isolated arthroscopic anterior, isolated posterior, and isolated SLAP repair with completely knotted or completely knotless labral repair and minimum 1-year follow-up. Exclusion criteria included hybrid knotted–knotless repair, rotator cuff repair, revision surgery, open surgery, and lack of complete follow-up data.
SOS is a proprietary registry that allows for the collection of basic patient demographics, diagnostic and operative data, and PROMs. PROMs in the SOS shoulder arthroscopy module include Veterans RAND 12-Item Health Survey (VR-12) mental health and physical health component summary scores, visual analog scale (VAS) pain scores, and American Shoulder and Elbow Surgeons (ASES) scores. For this study, PROMs were reviewed before surgery and 6 and 12 months after surgery. In addition, operative times of all procedures were collected.
For the analysis, completely knotted and completely knotless techniques were compared for anterior repair, posterior repair, and SLAP repair. A t test was used to compare the techniques on PROMs, and χ2 test was used to evaluate proportion differences. Statistical significance was set at P < .05.
Results
Anterior Labral Repairs
Of the 102 knotted anterior labral repairs that met the study criteria, 26 (25%) had minimum 1-year follow-up. Of the 122 knotless labral repairs, 33 (27%) had minimum 1-year follow-up. Seventy-five percent of knotted repairs and 80% of knotless repairs were performed in men. Mean (SD) age was 25.3 (11.7) years for the knotted group and 26.9 (10.6) years for the knotless group (P = .109). Anterior labral repairs did not differ in PROMs at any point (Table 1).
Table 1.
A mean of 2.8 anchors was used for knotted repairs, and a mean of 3.1 anchors was used for knotless repairs. Mean operative time was 75.8 minutes for knotted repairs and 67.5 minutes for knotless repairs. Mean (SD) time per anchor was 30.9 (13.9) minutes for knotted repairs and 25.6 (19.5) minutes for knotless repairs (P = .021).
Posterior Labral Repairs
Of the 165 knotted posterior labral repairs that met the study criteria, 39 (29%) had minimum 1-year follow-up. Of the 229 knotless labral repairs, 56 (24%) had minimum 1-year follow-up. Eighty-five percent of knotted repairs and 74% of knotless repairs were performed in men. Mean (SD) age was 29.1 (12.0) years for the knotted group and 27.5 (11.9) years for the knotless group (P = .148). Posterior labral repairs did not differ in PROMs before surgery or 1 year after surgery; 6 months after surgery, these repairs differed only in ASES scores (Table 2).
Table 2.
A mean of 3.6 anchors was used for knotted repairs, and a mean of 3.0 anchors was used for knotless repairs. Mean operative time was 67.0 minutes for knotted repairs and 43.1 minutes for knotless repairs. Mean (SD) time per anchor was 21.1 (10.7) minutes for knotted repairs and 17.5 (14.7) minutes for knotless repairs (P = .031).
SLAP Repairs
Of the 54 knotted SLAP repairs that met the study criteria, 24 (44%) had minimum 1-year follow-up. Of the 138 knotless SLAP repairs, 48 (35%) had minimum 1-year follow-up. Seventy-two percent of knotted repairs and 72% of knotless repairs were performed in men. Mean (SD) age was 32.1 (11.6) years for the knotted group and 35.0 (12.8) years for the knotless group (P = .246). SLAP repairs did not differ in PROMs at any point (Table 3).
Table 3.
A mean of 1.9 anchors was used for knotted repairs, and a mean of 2.1 anchors was used for knotless repairs. Mean operative time was 59.0 minutes for knotted repairs and 40.9 minutes for knotless repairs. Mean (SD) time per anchor was 36.6 (22.4) minutes for knotted repairs and 26.3 (14.0) minutes for knotless repairs (P = .080).
Discussion
Our hypothesis that there would be no difference in PROMs between knotted and knotless labral repairs was confirmed. Our findings are important because this study compared the gold standard of knotted suture anchor with the alternative knotless suture anchor in glenohumeral labral repair. These findings have several important implications for labral repair.
Knot tying traditionally has been used to achieve fixation with an anchor. Although simple in concept, knot tying can be challenging and its quality variable. Thal15 wrote that good-quality arthroscopic suture anchor repair is difficult to achieve because satisfactory knot tying requires significant practice with certain devices designed specifically for knot tying. Multiple surgeons have noted a significant learning curve associated with knot tying, and there is no agreement on which knot is superior.22-26 Leedle and Miller17 even suggested that, because knot tying is difficult, tying knots arthroscopically can lead to knot failure. In their study, they concluded that the knot is consistently the weakest link in suture repair of an anterior labrum construct. In a controlled laboratory study, Hanypsiak and colleagues13 found considerable knot-strength variability among expert arthroscopists. Only 65 (18%) of 365 knots tied fell within 20% of the mean for ultimate load failure, and only 128 (36%) of 365 fell within 20% of the mean for clinical failure (3 mm of displacement). These data suggested expert arthroscopists were unable to tie 5 consecutive knots of the same type consistently. Even among experts, it seems, knot strength varies significantly, and knot-strength issues may affect the rates of labral repair failure.
Multiple authors have also reported that bulky knots can cause chondral abrasion or that knots can migrate.25,27 Rhee and Ha27 reported that, when another knot (eg, a half-hitch knot) is tied to prevent knot failure, the resulting overall knot can be too bulky for a limited space, and chondral abrasion can result. In addition, regardless of size, a knot can migrate and, in its new position, start rubbing against the head of the humerus. Kim and colleagues14 found that, even when a knot is placed away from the humeral head, migration and repeated contact with the head are possible. Park and colleagues28 found that a significant number of knotted SLAP repairs required arthroscopic knot removal for relief of knot-induced pain and clicking.
Knotless constructs have several theoretical advantages over knotted constructs. Compared with a knotted technique, a knotless technique appears to provide more predictable strength, as variability in knot tying is eliminated (unpublished data). A knotless repair also has a lower profile,8 which should lead to less contact with the humeral head.19 Last, a knotless repair is more efficient—it takes less time to perform. In our study, operative time was reduced by a mean of 5.3 minutes per anchor for anterior labral repair. Assuming a mean of 3 anchors, this reduction equates to 16 minutes per case. Therefore, a surgeon who performs 25 labral repairs a year can save 6.7 hours a year. Reduced operative time benefits the patient (ie, lower risk of infection and other complications29), the surgeon, and the healthcare system (ie, cost savings). Macario30 found that operating room costs averaged $62 per minute (range, $22-$133 per minute). Therefore, saving 16 minutes per case could lead to saving $992 per case. In summary, a knotless technique appears to be clinically and financially advantageous as long as its results are the same as or better than those of a knotted technique.
A few other studies have compared knotted and knotless techniques. In a cadaveric study, Slabaugh and colleagues20 found no difference in labral height between traditional and knotless suture anchors. Leedle and Miller17 found that knotless constructs are biomechanically stronger than knotted constructs in anterior labral repair. In a level 3 clinical study, Yang and colleagues21 compared a conventional vertical knot with a knotless horizontal mattress suture in 41 patients who underwent SLAP repair. Functional outcome was no different between the 2 groups, but postoperative range of motion was improved in the knotless group. Ng and Kumar31 compared 45 patients who had knotted Bankart repair with 42 patients who had knotless Bankart repair and found no difference in functional outcome or rate of recurrent dislocation. Similarly, Kocaoglu and colleagues22 found no difference in recurrence rate between 18 patients who underwent a knotted technique for arthroscopic Bankart repair and 20 patients who underwent a knotless technique. Our findings corroborate the findings of these studies and further support the idea that there is no difference between knotted and knotless constructs with respect to PROMs.
Study Limitations
The major strength of this study was its large cohort and large population of surgeons. However, there were several study limitations. First, we could not detail specific repair techniques, such as simple or horizontal mattress orientation, and rehabilitation protocols and other variables are likely as well. Second, the repair technique was not randomized, and therefore there may have been a selection bias based on tissue quality. Although we cannot prove no bias, we think it was unlikely given that the groups were similar in age. Third, our data did not include information on range of motion or recurrent instability. Our goal was simply to evaluate PROMs among multiple surgeons using the 2 techniques. Fourth, there was substantial follow-up loss, which introduced potential selection bias. Last, there may have been conditions under which a hybrid technique with inferior knot tying, combined with a hybrid knotless construct, could have proved advantageous.
Conclusion
Our data showed that the advantages of knotless repair are not compromised in clinical situations. Although the data showed no significant difference in clinical outcomes, knotless repairs may provide surgeons with shorter surgeries, simpler constructs, less potential for chondral damage, and more consistent suture tensioning. Additional studies may further confirm these results.
Take-Home Points
There is no difference in PROMs following knotless or knotted labral repair.
Operative time is shorter for knotless compared to knotted glenoid labral tears.
Knotless constructs may be more predictable than knotted constructs biomechanically.
Orthopedic surgeons often encounter labral pathology, and labral tears historically have required open techniques.1-3 Arthroscopy allows for advanced visualization and treatment of shoulder lesions,4,5 including anterior, posterior, and superior labrum anterior to posterior (SLAP) lesions.6
The goal of arthroscopic labral repair is to restore joint stability while maintaining range of motion. Arthroscopically repairing the labrum with suture anchors has become the standard technique, and several studies have reported satisfactory biomechanical and clinical results.1,7-12 Surgeons traditionally have been required to tie knots for these anchors, but knot security varies significantly among experienced arthroscopic surgeons.13 In addition, knots can migrate,14 and bulky knots can cause chondral abrasion.15,16 Several manufacturers have introduced knotless anchors for soft-tissue fixation.15,17 The knotless technique provides a low-profile repair with potentially less operating time.8 These factors may warrant switching from knotted to knotless techniques if outcomes are clinically acceptable. However, few studies have compared knotted and knotless techniques for glenohumeral labral repair.8,15,18-21
We conducted a study to compare the clinical results and operative times of knotless and knotted fixation of anterior and posterior glenohumeral labral repairs and SLAP repairs. We hypothesized there would be no difference in patient-reported outcome measures (PROMs) between knotted and knotless techniques.
Methods
We retrospectively evaluated data that had been prospectively collected between 2012 and 2016 in a Surgical Outcomes System (SOS; Arthrex) database. Participation in this registry is elective, and enrollment can occur on a case-by-case basis. The database stores data on basic demographics, PROMs, and operative time. Data for our specific analysis were available for surgeries performed by 115 different surgeons. Inclusion criteria included primary isolated arthroscopic anterior, isolated posterior, and isolated SLAP repair with completely knotted or completely knotless labral repair and minimum 1-year follow-up. Exclusion criteria included hybrid knotted–knotless repair, rotator cuff repair, revision surgery, open surgery, and lack of complete follow-up data.
SOS is a proprietary registry that allows for the collection of basic patient demographics, diagnostic and operative data, and PROMs. PROMs in the SOS shoulder arthroscopy module include Veterans RAND 12-Item Health Survey (VR-12) mental health and physical health component summary scores, visual analog scale (VAS) pain scores, and American Shoulder and Elbow Surgeons (ASES) scores. For this study, PROMs were reviewed before surgery and 6 and 12 months after surgery. In addition, operative times of all procedures were collected.
For the analysis, completely knotted and completely knotless techniques were compared for anterior repair, posterior repair, and SLAP repair. A t test was used to compare the techniques on PROMs, and χ2 test was used to evaluate proportion differences. Statistical significance was set at P < .05.
Results
Anterior Labral Repairs
Of the 102 knotted anterior labral repairs that met the study criteria, 26 (25%) had minimum 1-year follow-up. Of the 122 knotless labral repairs, 33 (27%) had minimum 1-year follow-up. Seventy-five percent of knotted repairs and 80% of knotless repairs were performed in men. Mean (SD) age was 25.3 (11.7) years for the knotted group and 26.9 (10.6) years for the knotless group (P = .109). Anterior labral repairs did not differ in PROMs at any point (Table 1).
Table 1.
A mean of 2.8 anchors was used for knotted repairs, and a mean of 3.1 anchors was used for knotless repairs. Mean operative time was 75.8 minutes for knotted repairs and 67.5 minutes for knotless repairs. Mean (SD) time per anchor was 30.9 (13.9) minutes for knotted repairs and 25.6 (19.5) minutes for knotless repairs (P = .021).
Posterior Labral Repairs
Of the 165 knotted posterior labral repairs that met the study criteria, 39 (29%) had minimum 1-year follow-up. Of the 229 knotless labral repairs, 56 (24%) had minimum 1-year follow-up. Eighty-five percent of knotted repairs and 74% of knotless repairs were performed in men. Mean (SD) age was 29.1 (12.0) years for the knotted group and 27.5 (11.9) years for the knotless group (P = .148). Posterior labral repairs did not differ in PROMs before surgery or 1 year after surgery; 6 months after surgery, these repairs differed only in ASES scores (Table 2).
Table 2.
A mean of 3.6 anchors was used for knotted repairs, and a mean of 3.0 anchors was used for knotless repairs. Mean operative time was 67.0 minutes for knotted repairs and 43.1 minutes for knotless repairs. Mean (SD) time per anchor was 21.1 (10.7) minutes for knotted repairs and 17.5 (14.7) minutes for knotless repairs (P = .031).
SLAP Repairs
Of the 54 knotted SLAP repairs that met the study criteria, 24 (44%) had minimum 1-year follow-up. Of the 138 knotless SLAP repairs, 48 (35%) had minimum 1-year follow-up. Seventy-two percent of knotted repairs and 72% of knotless repairs were performed in men. Mean (SD) age was 32.1 (11.6) years for the knotted group and 35.0 (12.8) years for the knotless group (P = .246). SLAP repairs did not differ in PROMs at any point (Table 3).
Table 3.
A mean of 1.9 anchors was used for knotted repairs, and a mean of 2.1 anchors was used for knotless repairs. Mean operative time was 59.0 minutes for knotted repairs and 40.9 minutes for knotless repairs. Mean (SD) time per anchor was 36.6 (22.4) minutes for knotted repairs and 26.3 (14.0) minutes for knotless repairs (P = .080).
Discussion
Our hypothesis that there would be no difference in PROMs between knotted and knotless labral repairs was confirmed. Our findings are important because this study compared the gold standard of knotted suture anchor with the alternative knotless suture anchor in glenohumeral labral repair. These findings have several important implications for labral repair.
Knot tying traditionally has been used to achieve fixation with an anchor. Although simple in concept, knot tying can be challenging and its quality variable. Thal15 wrote that good-quality arthroscopic suture anchor repair is difficult to achieve because satisfactory knot tying requires significant practice with certain devices designed specifically for knot tying. Multiple surgeons have noted a significant learning curve associated with knot tying, and there is no agreement on which knot is superior.22-26 Leedle and Miller17 even suggested that, because knot tying is difficult, tying knots arthroscopically can lead to knot failure. In their study, they concluded that the knot is consistently the weakest link in suture repair of an anterior labrum construct. In a controlled laboratory study, Hanypsiak and colleagues13 found considerable knot-strength variability among expert arthroscopists. Only 65 (18%) of 365 knots tied fell within 20% of the mean for ultimate load failure, and only 128 (36%) of 365 fell within 20% of the mean for clinical failure (3 mm of displacement). These data suggested expert arthroscopists were unable to tie 5 consecutive knots of the same type consistently. Even among experts, it seems, knot strength varies significantly, and knot-strength issues may affect the rates of labral repair failure.
Multiple authors have also reported that bulky knots can cause chondral abrasion or that knots can migrate.25,27 Rhee and Ha27 reported that, when another knot (eg, a half-hitch knot) is tied to prevent knot failure, the resulting overall knot can be too bulky for a limited space, and chondral abrasion can result. In addition, regardless of size, a knot can migrate and, in its new position, start rubbing against the head of the humerus. Kim and colleagues14 found that, even when a knot is placed away from the humeral head, migration and repeated contact with the head are possible. Park and colleagues28 found that a significant number of knotted SLAP repairs required arthroscopic knot removal for relief of knot-induced pain and clicking.
Knotless constructs have several theoretical advantages over knotted constructs. Compared with a knotted technique, a knotless technique appears to provide more predictable strength, as variability in knot tying is eliminated (unpublished data). A knotless repair also has a lower profile,8 which should lead to less contact with the humeral head.19 Last, a knotless repair is more efficient—it takes less time to perform. In our study, operative time was reduced by a mean of 5.3 minutes per anchor for anterior labral repair. Assuming a mean of 3 anchors, this reduction equates to 16 minutes per case. Therefore, a surgeon who performs 25 labral repairs a year can save 6.7 hours a year. Reduced operative time benefits the patient (ie, lower risk of infection and other complications29), the surgeon, and the healthcare system (ie, cost savings). Macario30 found that operating room costs averaged $62 per minute (range, $22-$133 per minute). Therefore, saving 16 minutes per case could lead to saving $992 per case. In summary, a knotless technique appears to be clinically and financially advantageous as long as its results are the same as or better than those of a knotted technique.
A few other studies have compared knotted and knotless techniques. In a cadaveric study, Slabaugh and colleagues20 found no difference in labral height between traditional and knotless suture anchors. Leedle and Miller17 found that knotless constructs are biomechanically stronger than knotted constructs in anterior labral repair. In a level 3 clinical study, Yang and colleagues21 compared a conventional vertical knot with a knotless horizontal mattress suture in 41 patients who underwent SLAP repair. Functional outcome was no different between the 2 groups, but postoperative range of motion was improved in the knotless group. Ng and Kumar31 compared 45 patients who had knotted Bankart repair with 42 patients who had knotless Bankart repair and found no difference in functional outcome or rate of recurrent dislocation. Similarly, Kocaoglu and colleagues22 found no difference in recurrence rate between 18 patients who underwent a knotted technique for arthroscopic Bankart repair and 20 patients who underwent a knotless technique. Our findings corroborate the findings of these studies and further support the idea that there is no difference between knotted and knotless constructs with respect to PROMs.
Study Limitations
The major strength of this study was its large cohort and large population of surgeons. However, there were several study limitations. First, we could not detail specific repair techniques, such as simple or horizontal mattress orientation, and rehabilitation protocols and other variables are likely as well. Second, the repair technique was not randomized, and therefore there may have been a selection bias based on tissue quality. Although we cannot prove no bias, we think it was unlikely given that the groups were similar in age. Third, our data did not include information on range of motion or recurrent instability. Our goal was simply to evaluate PROMs among multiple surgeons using the 2 techniques. Fourth, there was substantial follow-up loss, which introduced potential selection bias. Last, there may have been conditions under which a hybrid technique with inferior knot tying, combined with a hybrid knotless construct, could have proved advantageous.
Conclusion
Our data showed that the advantages of knotless repair are not compromised in clinical situations. Although the data showed no significant difference in clinical outcomes, knotless repairs may provide surgeons with shorter surgeries, simpler constructs, less potential for chondral damage, and more consistent suture tensioning. Additional studies may further confirm these results.
References
1. Levy DM, Cole BJ, Bach BR Jr. History of surgical intervention of anterior shoulder instability. J Shoulder Elbow Surg. 2016;25(6):e139-e150.
2. Gill TJ, Zarins B. Open repairs for the treatment of anterior shoulder instability. Am J Sports Med. 2003;31(1):142-153.
3. Millett PJ, Clavert P, Warner JJ. Open operative treatment for anterior shoulder instability: when and why? J Bone Joint Surg Am. 2005;87(2):419-432.
4. Stein DA, Jazrawi L, Bartolozzi AR. Arthroscopic stabilization of anterior shoulder instability: a review of the literature. Arthroscopy. 2002;18(8):912-924.
5. Kim SH, Ha KI, Kim SH. Bankart repair in traumatic anterior shoulder instability: open versus arthroscopic technique. Arthroscopy. 2002;18(7):755-763.
6. Snyder SJ, Karzel RP, Del Pizzo W, Ferkel RD, Friedman MJ. SLAP lesions of the shoulder. Arthroscopy. 1990;6(4):274-279.
7. Hantes M, Raoulis V. Arthroscopic findings in anterior shoulder instability. Open Orthop J. 2017;11:119-132.
8. Sileo MJ, Lee SJ, Kremenic IJ, et al. Biomechanical comparison of a knotless suture anchor with standard suture anchor in the repair of type II SLAP tears. Arthroscopy. 2009;25(4):348-354.
9. Iqbal S, Jacobs U, Akhtar A, Macfarlane RJ, Waseem M. A history of shoulder surgery. Open Orthop J. 2013;7:305-309.
10. Garofalo R, Mocci A, Moretti B, et al. Arthroscopic treatment of anterior shoulder instability using knotless suture anchors. Arthroscopy. 2005;21(11):1283-1289.
11. Kersten AD, Fabing M, Ensminger S, et al. Suture capsulorrhaphy versus capsulolabral advancement for shoulder instability. Arthroscopy. 2012;28(10):1344-1351.
12. Cole BJ, Warner JJ. Arthroscopic versus open Bankart repair for traumatic anterior shoulder instability. Clin Sports Med. 2000;19(1):19-48.
13. Hanypsiak BT, DeLong JM, Simmons L, Lowe W, Burkhart S. Knot strength varies widely among expert arthroscopists. Am J Sports Med. 2014;42(8):1978-1984.
14. Kim SH, Ha KI, Park JH, et al. Arthroscopic posterior labral repair and capsular shift for traumatic unidirectional recurrent posterior subluxation of the shoulder. J Bone Joint Surg Am. 2003;85(8):1479-1487.
17. Leedle BP, Miller MD. Pullout strength of knotless suture anchors. Arthroscopy. 2005;21(1):81-85.
18. Caldwell PE 3rd, Pearson SE, D’Angelo MS. Arthroscopic knotless repair of the posterior labrum using LabralTape. Arthrosc Tech. 2016;5(2):e315-e320.
19. Tennent D, Concina C, Pearse E. Arthroscopic posterior stabilization of the shoulder using a percutaneous knotless mattress suture technique. Arthrosc Tech. 2014;3(1):e161-e164.
20. Slabaugh MA, Friel NA, Wang VM, Cole BJ. Restoring the labral height for treatment of Bankart lesions: a comparison of suture anchor constructs. Arthroscopy. 2010;26(5):587-591.
21. Yang HJ, Yoon K, Jin H, Song HS. Clinical outcome of arthroscopic SLAP repair: conventional vertical knot versus knotless horizontal mattress sutures. Knee Surg Sports Traumatol Arthrosc. 2016;24(2):464-469.
22. Kocaoglu B, Guven O, Nalbantoglu U, Aydin N, Haklar U. No difference between knotless sutures and suture anchors in arthroscopic repair of Bankart lesions in collision athletes. Knee Surg Sports Traumatol Arthrosc. 2009;17(7):844-849.
23. Aboalata M, Halawa A, Basyoni Y. The double Bankart bridge: a technique for restoration of the labral footprint in arthroscopic shoulder instability repair. Arthrosc Tech. 2017;6(1):e43-e47.
24. Rhee SM, Kang SY, Jang EC, Kim JY, Ha YC. Clinical outcomes after arthroscopic acetabular labral repair using knot-tying or knotless suture technique. Arch Orthop Trauma Surg. 2016;136(10):1411-1416.
25. Oh JH, Lee HK, Kim JY, Kim SH, Gong HS. Clinical and radiologic outcomes of arthroscopic glenoid labrum repair with the BioKnotless suture anchor. Am J Sports Med. 2009;37(12):2340-2348.
26. Yian E, Wang C, Millett PJ, Warner JJ. Arthroscopic repair of SLAP lesions with a BioKnotless suture anchor. Arthroscopy. 2004;20(5):547-551.
27. Rhee YG, Ha JH. Knot-induced glenoid erosion after arthroscopic fixation for unstable superior labrum anterior-posterior lesion: case report. J Shoulder Elbow Surg. 2006;15(3):391-393.
28. Park JG, Cho NS, Kim JY, Song JH, Hong SJ, Rhee YG. Arthroscopic knot removal for failed superior labrum anterior-posterior repair secondary to knot-induced pain. Am J Sports Med. 2017;45(11):2563-2568.
29. Wang DS. Re: how slow is too slow? Correlation of operative time to complications: an analysis from the Tennessee Surgical Quality Collaborative. J Urol. 2016;195(5):1510-1511.
30. Macario A. What does one minute of operating room time cost? J Clin Anesth. 2010;22(4):233-236.
31. Ng DZ, Kumar VP. Arthroscopic Bankart repair using knot-tying versus knotless suture anchors: is there a difference? Arthroscopy. 2014;30(4):422-427.