User login
Tools, Clinical Prediction Rules, and Algorithms for the Insertion of Peripheral Intravenous Catheters in Adult Hospitalized Patients: A Systematic Scoping Review of Literature
Up to a billion peripheral intravenous catheters (PIVCs) are inserted annually; therefore, the importance of this invasive device in modern medicine cannot be argued.1 The insertion of a PIVC is a clinical procedure undertaken by a range of clinical staff and in a variety of patient populations and settings. In many clinical environments (for example, the emergency department [ED]), PIVCs are the predominant first-choice vascular access device (VAD).2,3 Researchers in one study estimated over 25 million PIVCs are used in French EDs each year,3 and intravenous therapy is the leading ED treatment in the United States.4
The purpose of this systematic scoping review was to investigate what PIVC decision-making approaches exist to facilitate FTIS of PIVCs in adult hospitalized patients. Our intention was to systematically synthesize the research on TRAs, to review significant associations identified with these TRAs, and to critique TRA validity and reliability.
METHODS
Scoping Review
We selected a scoping review method that, by definition, maps the evidence to identify gaps,13,14 set research agendas, and identify implications for decision making. This allowed a targeted approach to answering our 3 research questions:
- What published clinical TRAs exist to facilitate PIVC insertion in adults?
- What clinical, patient and/or product variables have been identified using TRAs as having significant associations with FTIS for PIVCs in adult patients?
- What is the reported reliability, validity, responsiveness, clinical feasibility, and utility of existing TRAs for PIVC insertion in adults?
Our aim was to identify the amount, variety and essential qualities of TRA literature rather than to critically appraise and evaluate the effectiveness of TRAs, a process reserved for systematic review and meta-analysis of interventional studies.13,14 We followed scoping review guidelines published by members and collaborators of the Joanna Briggs Institute, an internationally recognized leader in research synthesis, evidence use, and implementation. The guidance is based on 5 steps: (i) scoping review objective and question, (ii) background of the topic to support scoping review, (iii) study selection, (iv) charting the results, and (v) collating and summarizing results.15 Clinicometric assessment of a TRA or any clinical prediction rule requires 4 specific phases: (i) development (identification of predictors from data), (ii) validation (testing the rule in a separate population for reliability), (iii) impact analysis or responsiveness (How clinically useful is the rule in the clinical setting? Is it resource heavy or light? Is it cost effective?), and (iv) implementation and adoption (uptake into clinical practice).16
Search Strategy
We included studies that described the use or development of any TRA regarding PIVC insertion in the adult hospitalized population.
Inclusion Criteria
Studies were included if they were published in the English Language, included TRAs for PIVC insertion in adult hospital patients, and prospectively assessed a clinical category of patient for PIVC insertion using a traditional approach. We defined a traditional PIVC insertion approach as an assessment and/or insertion with touch and feel, therefore, without vessel-locating technology such as ultrasound and/or near infrared technology.
Exclusion Criteria
Exclusion criteria included pediatric studies, authors’ personal (nonresearch) experience of tools, TRAs focused on postinsertion assessment of the cannula (such as phlebitis, infiltration, and/or dressing failure), and papers with a focus on VADs other than PIVCs. We excluded studies using PIVC ultrasound and/or near infrared technology because these are not standard in all insertions and greatly change the information available for pre-insertion assessment as well as the likelihood of insertion success.
In June 2016, a systematic search of the Cochrane library, Ovid Medline® In-process & Other Non-Indexed Citations and Ovid MEDLINE(R) <1946 to Present>, EBSCO CINAHL databases, and Google Scholar with specific keywords to identify publications that identified or defined TRAs was undertaken. Medical subject headings were created with assistance from a research librarian using tailored functions within individual databases. With key search terms, we limited studies to those related to our inclusion criteria. See Appendix 1 for our search strategy for Medline and CINAHL.
We used Covidence, a web-based application specifically designed for systematic reviews to screen and evaluate eligible publications.17 Two authors (PJC and NSH) screened the initial retrieved searches based upon the predetermined inclusion and exclusion criteria.
Data Extraction
A paper template was developed and used by 2 reviewers (P.J.C. and N.S.H.). Data included the following: study sample, aim(s), design, setting and country in which the study took place, clinical and patient variables, and how the TRAs were developed and tested. Studies were categorized by TRA type. We also sought to identify if clinical trial registration (where appropriate) was evidenced, in addition to evidence of protocol publication and what standardized reporting guidelines were used (such as those outlined by the EQUATOR Network).18
Data Synthesis
Formal meta-analysis was beyond the scope and intention of this review. However, we provide the FTIS rate and the ranges of odds ratios (ORs) with 95% confidence intervals (CIs) for certain independent predictors.
RESULTS
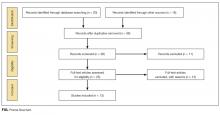
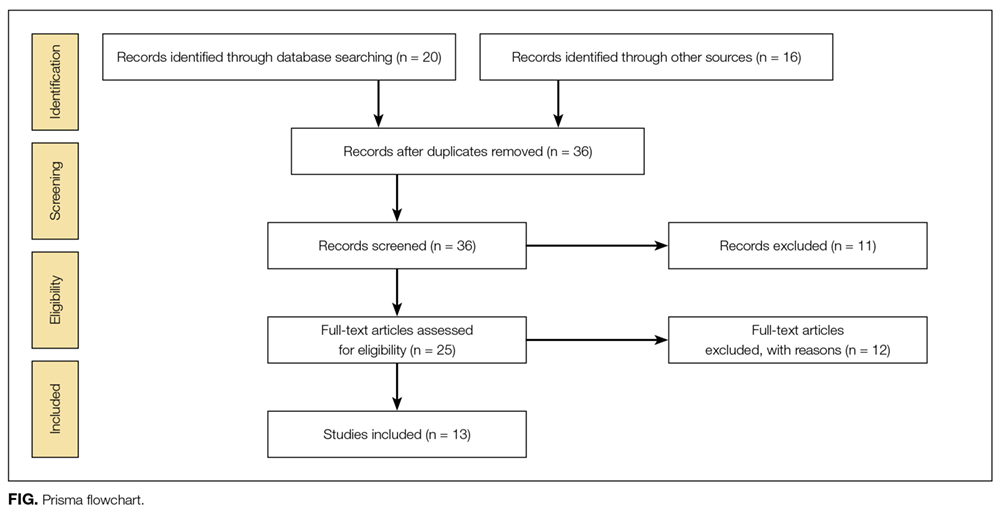
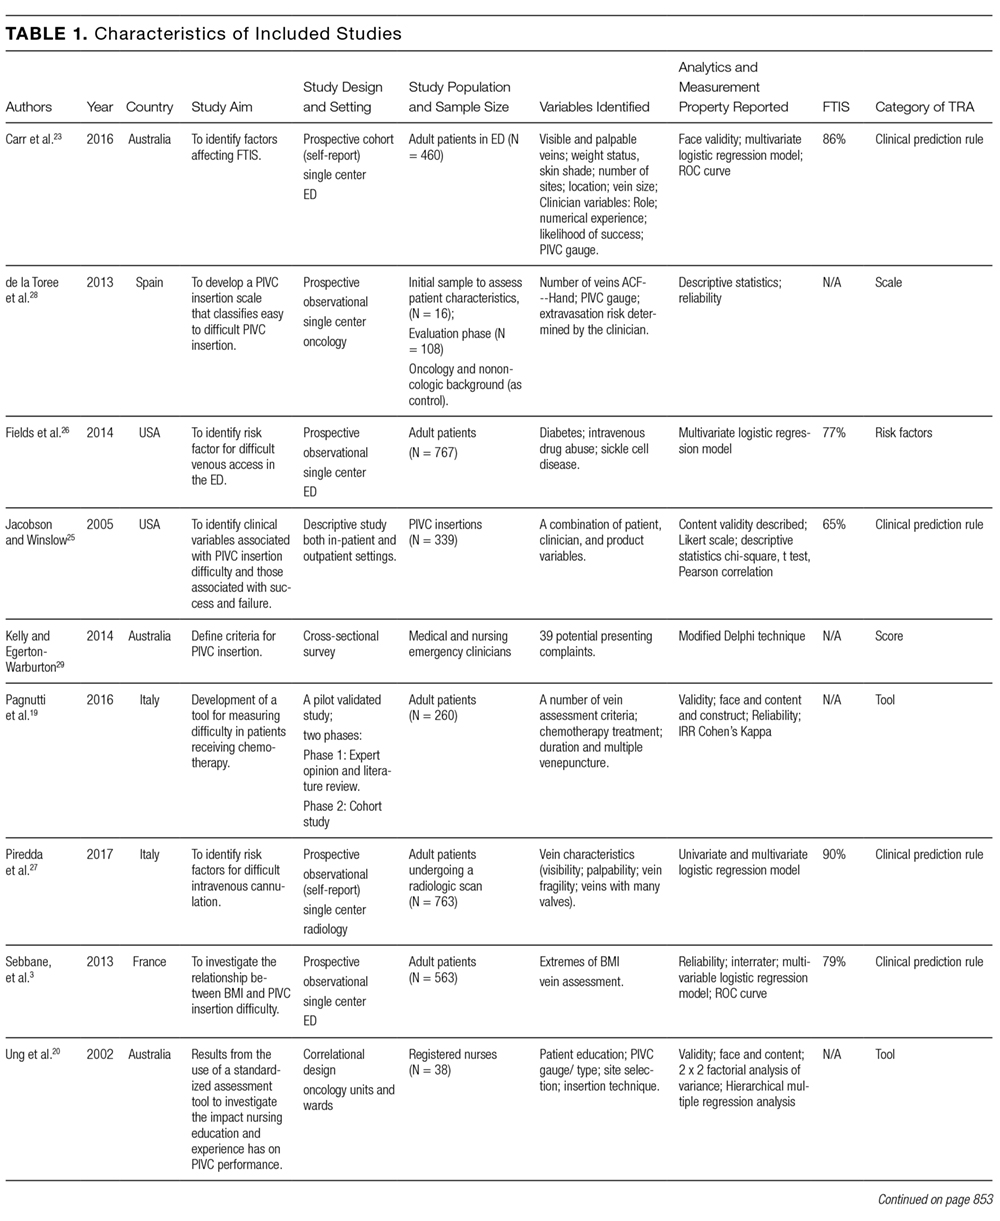
Thirty-six references were imported for screening against title and abstract content, with 11 studies excluded and 25 studies assessed for full-text eligibility (see Figure, PRISMA Flowchart). We then excluded a further 12 studies (6 did not meet inclusion criteria, 2 were focused on the prehospital setting, 2 were personal correspondence and focused on another type of VAD, 1 was a protocol to establish a TRA, and 1 was a framework for all device types), leaving 13 studies included in the final review (see Figure). These studies presented data on 4 tools,19-22 4 predictive models3,23-25 (of which 3 present receiver operating characteristic/area under the curve scores),3,23,24 2 framed as risk factor studies,26,27 and 1 of each of the following: a scale,28 a score,29 and an estimation of the incidence report rate (Table 1).30 Seven studies had “difficult” or “difficulty” in their title as a term to use to describe insertion failure.3,19,24-27,30 One study was titled exclusively for the nursing profession,20 5 studies were reported in medical journals,3,24,26,29,30 and 6 were reported in nursing journals,19-22,25,27 with the remainder published in a vascular access journal.23,28

General Characteristics of Included Studies
One TRA which was registered as a clinical trial24 involved a standardized reporting tool as is recommended by the EQUATOR Network.18
Nine of the 13 papers reported that TRA components were chosen based on identified predictors of successful insertion from observational data3,19,23-28,30, with 5 papers using multivariate logistic regression to identify independent predictors.3,23,24,26,2 At least 4330 insertion attempts on patients were reported. Seven papers reported FTIS, which ranged from 61%-90%.3,23-27,30
Two clinical settings accounted for 10 of the 13 included studies. We identified 5 papers from the ED setting3,23,26,29,30 and 5 studies specific to cancer settings.19-22,28 Two ED papers identified clinical predictors of insertion difficulty, with 1 identifying an existing medical diagnosis (such as sickle cell disease, diabetes, or intravenous drug abuse) and the other reporting a pragmatic patient self-report of difficulty.26,30 Three studies focused on patient-exclusive variables (such as vein characteristics)19,21,28 and some with a combined clinician and patient focus.3,23-25,27,30Relatively few studies reported interobserver measurements to describe the reliability of clinical assessments made.3,19,21,28 Webster et al. in Australia assessed interrater reliability of a vein assessment tool (VAT) and found high agreement (kappa 0.83 for medical imaging nurses and 0.93 for oncology nurses).21 Wells compared reliability with Altman’s K scores obtained from a different VAT when compared with the Deciding on Intravenous Access tool and found good agreement.22 Vein deterioration was proposed as a variable for inclusion when developing an assessment tool within an oncological context.31 In Spain, de la Torre and colleagues28 demonstrated good interrater agreement (with kappa, 0.77) for the Venous International Assessment (VIA) tool. The VIA offers a grading system scale to predict the patient’s declining vessel size while undergoing chemotherapy via peripheral veins with PIVCs. Grade I suggests little or no insertion failure, whereas a Grade V should predict insertion failure.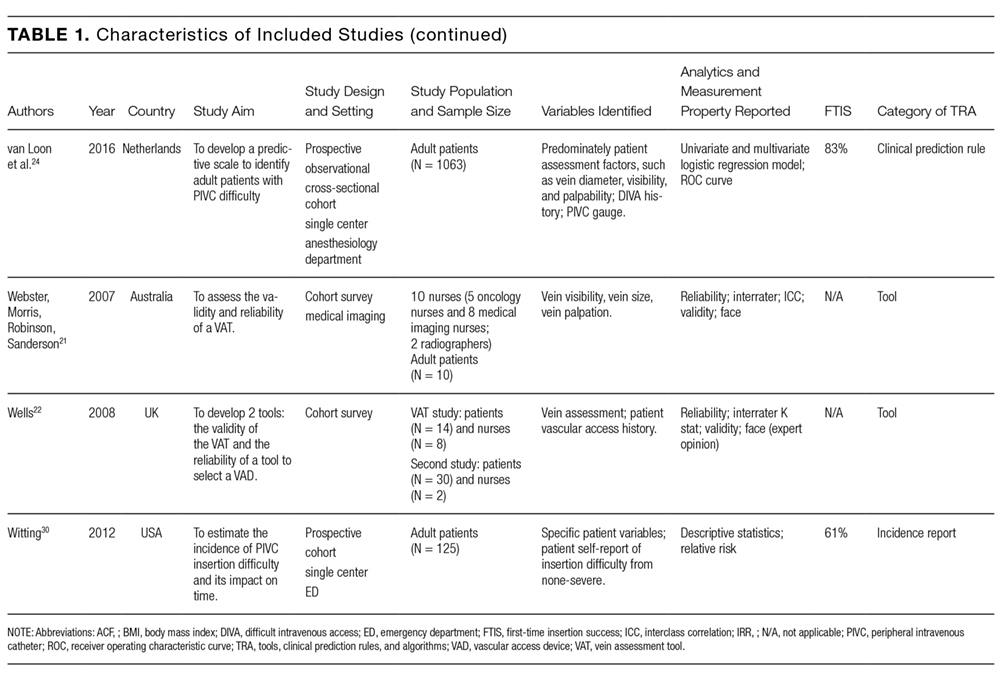
Patient Variables
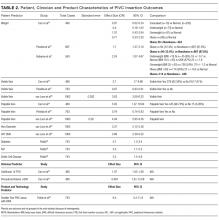
Vein characteristics were significant independent factors associated with insertion success in a number of studies.3,19,23,24,27,28 These included the number of veins, descriptive quality (eg, small, medium, large), size, location, visible veins, and palpable veins. Other factors appear to be patient specific (such as chronic conditions), including diabetes (OR, 2.1 [adjusted to identify demographic risk factors]; 95% CI, 1.3-3.4), sickle cell disease (OR, 3.5; 95% CI, 1.4-4.8), and intravenous drug abuse (OR, 2.4; 95% CI, 1.1-5.3).26 It is unclear if a consistent relationship between weight classification and insertion outcomes exists. Despite a finding that BMI was not independently associated with insertion difficulty,26 one study reports that BMI was independently associated with insertion failure (BMI <18.5 [OR, 2.24; 95% CI, 1.07-4.67], BMI >30 [OR, 1.98; 95% CI, 1.9-3.60])3 and another reports emaciated patients were associated with greater failure when compared to normal weight patients (OR, 0.07; 95% CI, 0.02-0.34).23 Consequently, extremes of BMI appear to be associated with insertion outcomes despite 1 study reporting no significant association with BMI as an independent factor of insertion failure.26 A history of difficult intravenous access (DIVA) was reported in 1 study and independently associated with insertion failure (OR, 3.86; 95% CI, 2.39-6.25; see Table 2). DIVA appears to be the motivating factor in the title of 7 studies. When defined, the definitions of DIVA are heterogeneous and varied and include the following: >1 minute to insert a PIVC and requiring >1 attempt27; 2 failed attempts30; 3 or more PIVC attempts.26 In the remaining 4 studies, variables associated with difficulty are identified and, therefore, TRAs to target those in future with predicted difficulty prior to any attempts are proposed.3,19,24,25
Clinician Variables

Specialist nurse certification, years of experience, and self-report skill level (P < 0.001) appear to be significantly associated with successful insertions.25 This is in part validated in another study reporting greater procedural inserting PIVCs as an independent predictor of success (OR, 4.404; 95% CI, 1.61-12-06; see Table 2).23 Two studies involved simple pragmatic percentage cut offs for PIVCs: likelihood of use29 and likelihood of insertion success.23 One paper using a cross-sectional design that surveyed ED clinicians suggested if the clinician’s predicted likelihood of the patient needing a PIVC was >80%, this was a reasonable trigger for PIVC insertion.29 The other, in a self-report cohort study, reported that a clinician’s likelihood estimation of PIVC FTIS prior to insertion is independently associated with FTIS (OR, 1.06; 95% CI, 1.04-1.07).23
Product Variables
In this review, higher failure rates were identified in smaller sizes (22-24 g).26 One study revealed gauge size was significantly associated with a failed first attempt in a univariate analysis (OR, 0.44; 95% CI, 0.34-0.58), but this was not retained in a multivariate model.24 Matching the PIVC size with vein assessment is considered in the VIA tool.28 It suggests a large PIVC (18 g) can be considered in patients with at least 6 vein options; smaller PIVCs of 22 to 24 g are recommended when 3 or fewer veins are found.28 One paper describes a greater proportion of success between PIVC brands.25
DISCUSSION
The published evidence for TRAs for PIVCs is limited, with few studies using 2 or more reliability, validity, responsiveness, clinical feasibility, or utility measurements in their development. There is a clear need to assess the clinical utility and clinical feasibility of these approaches so they can be externally validated prior to clinical adoption.16 For this reason, a validated TRA is likely required but must be appropriate for the capability of the healthcare services to use it. We suggest the consistent absence of all of these phases is owing to the variety of healthcare practitioners who are responsible for the insertion, the care and surveillance of peripheral cannulae, and the fragmentation of clinical approaches that exist.32
Previously, a comprehensive systematic review on the subject of PIVCs found that the presence of a visible and/or palpable vein is usually associated with FTIS.33 This current review found evidence of simple scores or cutoff percentage estimates in 2 TRA reports to predict either appropriate PIVC insertion or FTIS.23,29 If such methods are supported by future experimental trials, then such simple approaches could initiate huge clinical return, particularly given that idle or unused PIVCs are of substantial clinical concern.34-36 PIVCs transcend a variety of clinical environments with excessive use identified in the ED, where it may be performed for blood sampling alone and, hence, are labeled as “just in case” PIVCs and contribute to the term “idle PIVC.”23,34 Therefore, a clinical indication to perform PIVC insertion in the first instance must be embedded into any TRA; for example, clinical deterioration is likely and the risks are outweighed by benefit, intravenous fluids and/or medicines are required, and/or diagnostic or clinical procedures are requested (such as contrast scans or procedural sedation).
In the majority of papers reviewed, researchers described how to categorize patients into levels of anticipated and predicted difficulty, but none offered corresponding detailed recommendations for strategies to increase insertion success, such as insertion with ultrasound or vascular access expert. Hypothetically, adopting a TRA may assist with the early identification of difficult to cannulate patients who may require a more expert vascular access clinician. However, in this review, we identify that a uniform definition for DIVA is lacking. Both Webster et al.21 and Wells22 suggest that an expert inserter is required if difficult access is identified by their tools, but there is no clear description of the qualities of an expert inserter in the literature.37 Recently, consensus recommendations for the definition of vascular access specialist add to discussions about defining vascular access as an interdisciplinary specialist role.38 This is supported by other publications that highlight the association between PIVC procedural experience and increased insertion success.6,23,39-41With regards to products, PIVC gauge size may or may not be significantly associated with insertion success. For identifying a relationship of PIVC gauge with vein quality, both the vein diameter and description will help with the clinical interpretation of results. For example, it may be the case that bigger veins are easier to insert a PIVC and, thus, larger PIVCs are inserted. The opposite can occur when the veins are small and poorly visualized; hence, one may select a small gauge catheter. This argument is supported by Prottengeier et al.42 in a prehospital study that excluded PIVC size in a multivariate analysis because of confounding. However, gauge size is very likely to influence postinsertion complications. Prospective studies are contradictory and suggest 16 to 18 g PIVCs are more likely to contribute to superficial thrombus,43 phlebitis, and, thus, device failure, in contrast to others reporting more frequent dislodgement with smaller 22 g PIVCs.6,44Finally, the studies included did not assess survival times of the inserted PIVCs, given postinsertion failure in the hospitalized patient is prevalent45 and, importantly, modifiable.46 A TRA may yield initial insertion success, but if postinsertion the PIVC fails because of a modifiable reason that the TRA has not acknowledged, then it may be of negligible overall benefit. Therefore, TRAs for PIVC insertion need calibration, further development, and ongoing refinement prior to external validation testing.24 Future research should also examine the role of TRAs in settings where ultrasound or other insertion technology is routinely used.
CONCLUSION
This review identifies a clinically significant gap in vascular access science. The findings of this review support recent work on vessel health and preservation47-49 and appropriate device insertion.50 It also points to the need for further research on the development and testing of an appropriate clinical TRA to improve vascular access outcomes in clinical practice.
Acknowledgments
The authors thank Ms. Kylie Black and Mr. Simon Lewis, who are medical research librarians at The University of Western Australia.
Disclosure
Mr. Carr has received “speakers bureau” payment form CareFusion in 2013 and Becton Dickinson (BD) in 2014 for lectures on the subject of vascular access. He received a grant from CareFusion (facilitated by his institution at the time) to attend a scientific meeting on vascular access in the USA in 2012. Griffith University has received unrestricted investigator initiated research or educational grants on Marie Cooke’s behalf from product manufacturers: Baxter; Becton, Dickinson and Company; Centurion Medical Products and Entrotech Lifesciences. Griffith University has received unrestricted investigator initiated research or educational grants on Claire M. Rickard’s behalf from product manufacturers: 3M; Adhezion Biomedical, AngioDynamics; Bard, Baxter; B.Braun; Becton, Dickinson and Company; Centurion Medical Products; Cook Medical; Entrotech, Flomedical; ICU Medical; Medtronic; Smiths Medical, Teleflex. Griffith University has received consultancy payments on Claire M. Rickard’s behalf from product manufacturers: 3M, Bard; BBraun, BD, ResQDevices, Smiths Medical. Dr. Higgins and Dr. Rippey have nothing to disclose. All of the aforementioned have not biased or influenced this review.
All authors have made substantial contributions with this review. Each author has contributed to drafting and editing the manuscript and approves the final version for publishing.
1. Alexandrou E, Ray-Barruel G, Carr PJ, et al. International prevalence of the use of peripheral intravenous catheters. J Hosp Med. 2015;10(8):530-533. PubMed
2. Tiwari MM, Hermsen ED, Charlton ME, Anderson JR, Rupp ME. Inappropriate intravascular device use: a prospective study. J Hosp Infect. 2011;78(2):128-132. PubMed
3. Sebbane M, Claret PG, Lefebvre S, et al. Predicting peripheral venous access difficulty in the emergency department using body mass index and a clinical evaluation of venous accessibility. J Emerg Med. 2013;44(2):299-305. PubMed
4. Niska R, Bhuiya F, Xu J. National Hospital Ambulatory Medical Care Survey: 2007 emergency department summary. Natl Health Stat Report. 2010;(26):1-31. PubMed
5. Aulagnier J, Hoc C, Mathieu E, Dreyfus JF, Fischler M, Le Guen M. Efficacy of AccuVein to Facilitate Peripheral Intravenous Placement in Adults Presenting to an Emergency Department: A Randomized Clinical Trial. Acad Emerg Med. 2014;21(8):858-863. PubMed
6. Carr PJ, Glynn RW, Dineen B, Kropmans TJ. A pilot intravenous cannulation team: an Irish perspective. Br J Nurs. 2010;19(10):S19-S27. PubMed
7. Conaghan PG. Predicting outcomes in rheumatoid arthritis. Clin Rheumatol. 2011;30(Suppl 1):S41-S47. PubMed
8. Hendriksen JM, Geersing GJ, Moons KG, de Groot JA. Diagnostic and prognostic prediction models. J Thromb Haemost. 2013;11(Suppl 1):129-141. PubMed
9. Hodgson C, Needham D, Haines K, et al. Feasibility and inter-rater reliability of the ICU Mobility Scale. Heart Lung. 2014;43(1):19-24. PubMed
10. Pace NL, Eberhart LHJ, Kranke PR. Quantifying prognosis with risk predictions. Eur J Anaesthesiol. 2012;29(1):7-16. PubMed
11. Yen K, Riegert A, Gorelick MH. Derivation of the DIVA score: A clinical prediction rule for the identification of children with difficult intravenous access. Pediatr Emerg Care. 2008;24(3):143-147. PubMed
12. Manuel DG, Rosella LC, Hennessy D, Sanmartin C, Wilson K. Predictive risk algorithms in a population setting: An overview. J Epidemiol Community Health. 2012;66(10):859-865. PubMed
13. Tricco AC, Lillie E, Zarin W, et al. A scoping review on the conduct and reporting of scoping reviews. BMC Med Res Methodol. 2016;16:15. PubMed
14. Pham MT, Rajić A, Greig JD, Sargeant JM, Papadopoulos A, McEwen SA. A scoping review of scoping reviews: advancing the approach and enhancing the consistency. Res Synth Methods. 2014;5(4):371-385. PubMed
15. Peters MDJ, Godfrey CM, Khalil H, McInerney P, Parker D, Soares CB. Guidance for conducting systematic scoping reviews. Int J Evid Based Healthc. 2015;13(3):141-146. PubMed
16. Adams ST, Leveson SH. Clinical prediction rules. BMJ. 2012;344:d8312 PubMed
17. Babineau J. Product Review: Covidence (Systematic Review Software). J Can Health Libr Assoc. 2014;35(2):68-71.
18. Morris C. The EQUATOR network: Promoting the transparent and accurate reporting of research. Dev Med Child Neurol. 2008;50(10):723. PubMed
19. Pagnutti L, Bin A, Donato R, et al. Difficult intravenous access tool in patients receiving peripheral chemotherapy: A pilot-validation study. Eur J Oncol Nurs. 2016;20:58-63. PubMed
20. Ung L, Cook S, Edwards B, Hocking L, Osmond F, Buttergieg H. Peripheral intravenous cannulation in nursing: performance predictors. J Infus Nurs. 2002;25(3):189-195. PubMed
21. Webster J, Morris H-L, Robinson K, Sanderson U. Development and validation of a Vein Assessment Tool (VAT). Aust J Adv Nurs. 2007;24(4):5-7. PubMed
22. Wells S. Venous access in oncology and haematology patients: Part two. Nurs Stand. 2008;23(1):35–42. PubMed
23. Carr PJ, Rippey JA, Budgeon CA, Cooke ML, Higgins NS, Rickard Claire M. Insertion of peripheral intravenous cannulae in the Emergency Department: factors associated with first-time insertion success. J Vasc Access. 2016;17(2):182-190. PubMed
24. Loon FHJ van, Puijn LAPM, Houterman S, Bouwman ARA. Development of the A-DIVA Scale: A Clinical Predictive Scale to Identify Difficult Intravenous Access in Adult Patients Based on Clinical Observations. Medicine (Baltimore). 2016;95(16):e3428. PubMed
25. Jacobson AF, Winslow EH. Variables influencing intravenous catheter insertion difficulty and failure: an analysis of 339 intravenous catheter insertions. Heart Lung. 2005;34(5):345-359. PubMed
26. Fields MJ, Piela NE, Au AK, Ku BS. Risk factors associated with difficult venous access in adult ED patients. Am J Emerg Med. 2014;32(10):1179-1182 PubMed
27. Piredda M, Biagioli V, Barrella B, et al. Factors Affecting Difficult Peripheral Intravenous Cannulation in Adults: A Prospective Observational Study. J Clin Nurs. 2017;26(7-8):1074-1084 PubMed
28. de la Torre-Montero J-C, Montealegre-Sanz M, Faraldo-Cabana A, et al. Venous International Assessment, VIA scale, validated classification procedure for the peripheral venous system. J Vasc Access. 2014;15(1):45-50. PubMed
29. Kelly AM, Egerton-Warburton D. When is peripheral intravenous catheter insertion indicated in the emergency department? Emerg Med Australas. 2014;26(5):515–516. PubMed
30. Witting MD. IV access difficulty: Incidence and delays in an urban emergency department. J Emerg Med. 2012;42(4):483-487. PubMed
31. McGowan D, Wood S. Developing a venous assessment tool in IV chemotherapy administration. Br J Nurs. 2008;17(3):158-164. PubMed
32. Castro-Sánchez E, Charani E, Drumright LN, Sevdalis N, Shah N, Holmes AH. Fragmentation of Care Threatens Patient Safety in Peripheral Vascular Catheter Management in Acute Care–A Qualitative Study. PLoS One. 2014;9(1):e86167. PubMed
33. Sabri A, Szalas J, Holmes KS, Labib L, Mussivand T. Failed attempts and improvement strategies in peripheral intravenous catheterization. Biomed Mater Eng. 2013;23(1-2):93-108. PubMed
34. Limm EI, Fang X, Dendle C, Stuart RL, Egerton Warburton D. Half of All Peripheral Intravenous Lines in an Australian Tertiary Emergency Department Are Unused: Pain With No Gain? Ann Emerg Med. 2013;62(5):521-525 PubMed
35. Egerton-Warburton D, Ieraci S. First do no harm: In fact, first do nothing, at least not a cannula. Emerg Med Australas. 2013;25(4):289-290.
36. Becerra MB, Shirley D, Safdar N. Prevalence, risk factors, and outcomes of idle intravenous catheters: An integrative review. Am J Infect Control. 2016;44(10):e167-e172. PubMed
37. Carr PJ, Higgins NS, Cooke ML, Mihala G, Rickard CM. Vascular access specialist teams for device insertion and prevention of failure. Cochrane Library. John Wiley & Sons, Ltd; 2014.
38. Davis L, Owens AK, Thompson J. Defining the Specialty of Vascular Access through Consensus: Shaping the Future of Vascular Access. J Assoc Vasc Access. 2016;21(3):125-130.
39. Da Silva GA, Priebe S, Dias FN. Benefits of establishing an intravenous team and the standardization of peripheral intravenous catheters. J Infus Nurs. 2010;33(3):156-160. PubMed
40. Soifer NE, Borzak S, Edlin BR, Weinstein RA. Prevention of peripheral venous catheter complications with an intravenous therapy team: A randomized controlled trial. Arch Intern Med. 1998;158(5):473-477. PubMed
41. Cuper NJ, de Graaff JC, van Dijk AT, Verdaasdonk RM, van der Werff DB, Kalkman CJ. Predictive factors for difficult intravenous cannulation in pediatric patients at a tertiary pediatric hospital. Paediatr Anaesth. 2012;22(3):223-229. PubMed
42. Prottengeier J, Albermann M, Heinrich S, Birkholz T, Gall C, Schmidt J. The prehospital intravenous access assessment: a prospective study on intravenous access failure and access delay in prehospital emergency medicine. Eur J Emerg Med. 2016; 23(6)442-447. PubMed
43. Cicolini G, Bonghi AP, Di Labio L, Di Mascio R. Position of peripheral venous cannulae and the incidence of thrombophlebitis: an observational study. J Adv Nurs. 2009;65(6):1268-1273. PubMed
44. Wallis MC, McGrail M, Webster J, et al. Risk factors for peripheral intravenous catheter failure: a multivariate analysis of data from a randomized controlled trial. Infect Control Hosp Epidemiol. 2014;35(1):63-68. PubMed
45. Carr PJ, Rippey J, Moore T, et al. Reasons for Removal of Emergency Department-Inserted Peripheral Intravenous Cannulae in Admitted Patients: A Retrospective Medical Chart Audit in Australia. Infect Control Hosp Epidemiol. 2016;37(7):874-876. PubMed
46. Bugden S, Shean K, Scott M, et al. Skin Glue Reduces the Failure Rate of Emergency Department-Inserted Peripheral Intravenous Catheters: A Randomized Controlled Trial. Ann Emerg Med. 2016;68(2):196-201. PubMed
47. Moureau N, Trick N, Nifong T, Perry C, Kelley C, Carrico R, et al. Vessel health and preservation (Part 1): a new evidence-based approach to vascular access selection and management. J Vasc Access. 2012;13(3):351-356. PubMed
48. Jackson T, Hallam C, Corner T, Hill S. Right line, right patient, right time: Every choice matters. Br J Nurs. 2013;22(8):S24-S28. PubMed
49. Hallam C, Weston V, Denton A, et al. Development of the UK Vessel Health and Preservation (VHP) framework: a multi-organisational collaborative. J Infect Prev. 2016;17(2):65-72.
50. Chopra V, Flanders SA, Saint S, et al. The Michigan Appropriateness Guide for Intravenous Catheters (MAGIC): Results From a Multispecialty Panel Using the RAND/UCLA Appropriateness Method. Ann Intern Med. 2015;163(6 Suppl):S1-S40. PubMed
Up to a billion peripheral intravenous catheters (PIVCs) are inserted annually; therefore, the importance of this invasive device in modern medicine cannot be argued.1 The insertion of a PIVC is a clinical procedure undertaken by a range of clinical staff and in a variety of patient populations and settings. In many clinical environments (for example, the emergency department [ED]), PIVCs are the predominant first-choice vascular access device (VAD).2,3 Researchers in one study estimated over 25 million PIVCs are used in French EDs each year,3 and intravenous therapy is the leading ED treatment in the United States.4
The purpose of this systematic scoping review was to investigate what PIVC decision-making approaches exist to facilitate FTIS of PIVCs in adult hospitalized patients. Our intention was to systematically synthesize the research on TRAs, to review significant associations identified with these TRAs, and to critique TRA validity and reliability.
METHODS
Scoping Review
We selected a scoping review method that, by definition, maps the evidence to identify gaps,13,14 set research agendas, and identify implications for decision making. This allowed a targeted approach to answering our 3 research questions:
- What published clinical TRAs exist to facilitate PIVC insertion in adults?
- What clinical, patient and/or product variables have been identified using TRAs as having significant associations with FTIS for PIVCs in adult patients?
- What is the reported reliability, validity, responsiveness, clinical feasibility, and utility of existing TRAs for PIVC insertion in adults?
Our aim was to identify the amount, variety and essential qualities of TRA literature rather than to critically appraise and evaluate the effectiveness of TRAs, a process reserved for systematic review and meta-analysis of interventional studies.13,14 We followed scoping review guidelines published by members and collaborators of the Joanna Briggs Institute, an internationally recognized leader in research synthesis, evidence use, and implementation. The guidance is based on 5 steps: (i) scoping review objective and question, (ii) background of the topic to support scoping review, (iii) study selection, (iv) charting the results, and (v) collating and summarizing results.15 Clinicometric assessment of a TRA or any clinical prediction rule requires 4 specific phases: (i) development (identification of predictors from data), (ii) validation (testing the rule in a separate population for reliability), (iii) impact analysis or responsiveness (How clinically useful is the rule in the clinical setting? Is it resource heavy or light? Is it cost effective?), and (iv) implementation and adoption (uptake into clinical practice).16
Search Strategy
We included studies that described the use or development of any TRA regarding PIVC insertion in the adult hospitalized population.
Inclusion Criteria
Studies were included if they were published in the English Language, included TRAs for PIVC insertion in adult hospital patients, and prospectively assessed a clinical category of patient for PIVC insertion using a traditional approach. We defined a traditional PIVC insertion approach as an assessment and/or insertion with touch and feel, therefore, without vessel-locating technology such as ultrasound and/or near infrared technology.
Exclusion Criteria
Exclusion criteria included pediatric studies, authors’ personal (nonresearch) experience of tools, TRAs focused on postinsertion assessment of the cannula (such as phlebitis, infiltration, and/or dressing failure), and papers with a focus on VADs other than PIVCs. We excluded studies using PIVC ultrasound and/or near infrared technology because these are not standard in all insertions and greatly change the information available for pre-insertion assessment as well as the likelihood of insertion success.
In June 2016, a systematic search of the Cochrane library, Ovid Medline® In-process & Other Non-Indexed Citations and Ovid MEDLINE(R) <1946 to Present>, EBSCO CINAHL databases, and Google Scholar with specific keywords to identify publications that identified or defined TRAs was undertaken. Medical subject headings were created with assistance from a research librarian using tailored functions within individual databases. With key search terms, we limited studies to those related to our inclusion criteria. See Appendix 1 for our search strategy for Medline and CINAHL.
We used Covidence, a web-based application specifically designed for systematic reviews to screen and evaluate eligible publications.17 Two authors (PJC and NSH) screened the initial retrieved searches based upon the predetermined inclusion and exclusion criteria.
Data Extraction
A paper template was developed and used by 2 reviewers (P.J.C. and N.S.H.). Data included the following: study sample, aim(s), design, setting and country in which the study took place, clinical and patient variables, and how the TRAs were developed and tested. Studies were categorized by TRA type. We also sought to identify if clinical trial registration (where appropriate) was evidenced, in addition to evidence of protocol publication and what standardized reporting guidelines were used (such as those outlined by the EQUATOR Network).18
Data Synthesis
Formal meta-analysis was beyond the scope and intention of this review. However, we provide the FTIS rate and the ranges of odds ratios (ORs) with 95% confidence intervals (CIs) for certain independent predictors.
RESULTS
Thirty-six references were imported for screening against title and abstract content, with 11 studies excluded and 25 studies assessed for full-text eligibility (see Figure, PRISMA Flowchart). We then excluded a further 12 studies (6 did not meet inclusion criteria, 2 were focused on the prehospital setting, 2 were personal correspondence and focused on another type of VAD, 1 was a protocol to establish a TRA, and 1 was a framework for all device types), leaving 13 studies included in the final review (see Figure). These studies presented data on 4 tools,19-22 4 predictive models3,23-25 (of which 3 present receiver operating characteristic/area under the curve scores),3,23,24 2 framed as risk factor studies,26,27 and 1 of each of the following: a scale,28 a score,29 and an estimation of the incidence report rate (Table 1).30 Seven studies had “difficult” or “difficulty” in their title as a term to use to describe insertion failure.3,19,24-27,30 One study was titled exclusively for the nursing profession,20 5 studies were reported in medical journals,3,24,26,29,30 and 6 were reported in nursing journals,19-22,25,27 with the remainder published in a vascular access journal.23,28
General Characteristics of Included Studies
One TRA which was registered as a clinical trial24 involved a standardized reporting tool as is recommended by the EQUATOR Network.18
Nine of the 13 papers reported that TRA components were chosen based on identified predictors of successful insertion from observational data3,19,23-28,30, with 5 papers using multivariate logistic regression to identify independent predictors.3,23,24,26,2 At least 4330 insertion attempts on patients were reported. Seven papers reported FTIS, which ranged from 61%-90%.3,23-27,30
Two clinical settings accounted for 10 of the 13 included studies. We identified 5 papers from the ED setting3,23,26,29,30 and 5 studies specific to cancer settings.19-22,28 Two ED papers identified clinical predictors of insertion difficulty, with 1 identifying an existing medical diagnosis (such as sickle cell disease, diabetes, or intravenous drug abuse) and the other reporting a pragmatic patient self-report of difficulty.26,30 Three studies focused on patient-exclusive variables (such as vein characteristics)19,21,28 and some with a combined clinician and patient focus.3,23-25,27,30Relatively few studies reported interobserver measurements to describe the reliability of clinical assessments made.3,19,21,28 Webster et al. in Australia assessed interrater reliability of a vein assessment tool (VAT) and found high agreement (kappa 0.83 for medical imaging nurses and 0.93 for oncology nurses).21 Wells compared reliability with Altman’s K scores obtained from a different VAT when compared with the Deciding on Intravenous Access tool and found good agreement.22 Vein deterioration was proposed as a variable for inclusion when developing an assessment tool within an oncological context.31 In Spain, de la Torre and colleagues28 demonstrated good interrater agreement (with kappa, 0.77) for the Venous International Assessment (VIA) tool. The VIA offers a grading system scale to predict the patient’s declining vessel size while undergoing chemotherapy via peripheral veins with PIVCs. Grade I suggests little or no insertion failure, whereas a Grade V should predict insertion failure.
Patient Variables
Vein characteristics were significant independent factors associated with insertion success in a number of studies.3,19,23,24,27,28 These included the number of veins, descriptive quality (eg, small, medium, large), size, location, visible veins, and palpable veins. Other factors appear to be patient specific (such as chronic conditions), including diabetes (OR, 2.1 [adjusted to identify demographic risk factors]; 95% CI, 1.3-3.4), sickle cell disease (OR, 3.5; 95% CI, 1.4-4.8), and intravenous drug abuse (OR, 2.4; 95% CI, 1.1-5.3).26 It is unclear if a consistent relationship between weight classification and insertion outcomes exists. Despite a finding that BMI was not independently associated with insertion difficulty,26 one study reports that BMI was independently associated with insertion failure (BMI <18.5 [OR, 2.24; 95% CI, 1.07-4.67], BMI >30 [OR, 1.98; 95% CI, 1.9-3.60])3 and another reports emaciated patients were associated with greater failure when compared to normal weight patients (OR, 0.07; 95% CI, 0.02-0.34).23 Consequently, extremes of BMI appear to be associated with insertion outcomes despite 1 study reporting no significant association with BMI as an independent factor of insertion failure.26 A history of difficult intravenous access (DIVA) was reported in 1 study and independently associated with insertion failure (OR, 3.86; 95% CI, 2.39-6.25; see Table 2). DIVA appears to be the motivating factor in the title of 7 studies. When defined, the definitions of DIVA are heterogeneous and varied and include the following: >1 minute to insert a PIVC and requiring >1 attempt27; 2 failed attempts30; 3 or more PIVC attempts.26 In the remaining 4 studies, variables associated with difficulty are identified and, therefore, TRAs to target those in future with predicted difficulty prior to any attempts are proposed.3,19,24,25
Clinician Variables
Specialist nurse certification, years of experience, and self-report skill level (P < 0.001) appear to be significantly associated with successful insertions.25 This is in part validated in another study reporting greater procedural inserting PIVCs as an independent predictor of success (OR, 4.404; 95% CI, 1.61-12-06; see Table 2).23 Two studies involved simple pragmatic percentage cut offs for PIVCs: likelihood of use29 and likelihood of insertion success.23 One paper using a cross-sectional design that surveyed ED clinicians suggested if the clinician’s predicted likelihood of the patient needing a PIVC was >80%, this was a reasonable trigger for PIVC insertion.29 The other, in a self-report cohort study, reported that a clinician’s likelihood estimation of PIVC FTIS prior to insertion is independently associated with FTIS (OR, 1.06; 95% CI, 1.04-1.07).23
Product Variables
In this review, higher failure rates were identified in smaller sizes (22-24 g).26 One study revealed gauge size was significantly associated with a failed first attempt in a univariate analysis (OR, 0.44; 95% CI, 0.34-0.58), but this was not retained in a multivariate model.24 Matching the PIVC size with vein assessment is considered in the VIA tool.28 It suggests a large PIVC (18 g) can be considered in patients with at least 6 vein options; smaller PIVCs of 22 to 24 g are recommended when 3 or fewer veins are found.28 One paper describes a greater proportion of success between PIVC brands.25
DISCUSSION
The published evidence for TRAs for PIVCs is limited, with few studies using 2 or more reliability, validity, responsiveness, clinical feasibility, or utility measurements in their development. There is a clear need to assess the clinical utility and clinical feasibility of these approaches so they can be externally validated prior to clinical adoption.16 For this reason, a validated TRA is likely required but must be appropriate for the capability of the healthcare services to use it. We suggest the consistent absence of all of these phases is owing to the variety of healthcare practitioners who are responsible for the insertion, the care and surveillance of peripheral cannulae, and the fragmentation of clinical approaches that exist.32
Previously, a comprehensive systematic review on the subject of PIVCs found that the presence of a visible and/or palpable vein is usually associated with FTIS.33 This current review found evidence of simple scores or cutoff percentage estimates in 2 TRA reports to predict either appropriate PIVC insertion or FTIS.23,29 If such methods are supported by future experimental trials, then such simple approaches could initiate huge clinical return, particularly given that idle or unused PIVCs are of substantial clinical concern.34-36 PIVCs transcend a variety of clinical environments with excessive use identified in the ED, where it may be performed for blood sampling alone and, hence, are labeled as “just in case” PIVCs and contribute to the term “idle PIVC.”23,34 Therefore, a clinical indication to perform PIVC insertion in the first instance must be embedded into any TRA; for example, clinical deterioration is likely and the risks are outweighed by benefit, intravenous fluids and/or medicines are required, and/or diagnostic or clinical procedures are requested (such as contrast scans or procedural sedation).
In the majority of papers reviewed, researchers described how to categorize patients into levels of anticipated and predicted difficulty, but none offered corresponding detailed recommendations for strategies to increase insertion success, such as insertion with ultrasound or vascular access expert. Hypothetically, adopting a TRA may assist with the early identification of difficult to cannulate patients who may require a more expert vascular access clinician. However, in this review, we identify that a uniform definition for DIVA is lacking. Both Webster et al.21 and Wells22 suggest that an expert inserter is required if difficult access is identified by their tools, but there is no clear description of the qualities of an expert inserter in the literature.37 Recently, consensus recommendations for the definition of vascular access specialist add to discussions about defining vascular access as an interdisciplinary specialist role.38 This is supported by other publications that highlight the association between PIVC procedural experience and increased insertion success.6,23,39-41With regards to products, PIVC gauge size may or may not be significantly associated with insertion success. For identifying a relationship of PIVC gauge with vein quality, both the vein diameter and description will help with the clinical interpretation of results. For example, it may be the case that bigger veins are easier to insert a PIVC and, thus, larger PIVCs are inserted. The opposite can occur when the veins are small and poorly visualized; hence, one may select a small gauge catheter. This argument is supported by Prottengeier et al.42 in a prehospital study that excluded PIVC size in a multivariate analysis because of confounding. However, gauge size is very likely to influence postinsertion complications. Prospective studies are contradictory and suggest 16 to 18 g PIVCs are more likely to contribute to superficial thrombus,43 phlebitis, and, thus, device failure, in contrast to others reporting more frequent dislodgement with smaller 22 g PIVCs.6,44Finally, the studies included did not assess survival times of the inserted PIVCs, given postinsertion failure in the hospitalized patient is prevalent45 and, importantly, modifiable.46 A TRA may yield initial insertion success, but if postinsertion the PIVC fails because of a modifiable reason that the TRA has not acknowledged, then it may be of negligible overall benefit. Therefore, TRAs for PIVC insertion need calibration, further development, and ongoing refinement prior to external validation testing.24 Future research should also examine the role of TRAs in settings where ultrasound or other insertion technology is routinely used.
CONCLUSION
This review identifies a clinically significant gap in vascular access science. The findings of this review support recent work on vessel health and preservation47-49 and appropriate device insertion.50 It also points to the need for further research on the development and testing of an appropriate clinical TRA to improve vascular access outcomes in clinical practice.
Acknowledgments
The authors thank Ms. Kylie Black and Mr. Simon Lewis, who are medical research librarians at The University of Western Australia.
Disclosure
Mr. Carr has received “speakers bureau” payment form CareFusion in 2013 and Becton Dickinson (BD) in 2014 for lectures on the subject of vascular access. He received a grant from CareFusion (facilitated by his institution at the time) to attend a scientific meeting on vascular access in the USA in 2012. Griffith University has received unrestricted investigator initiated research or educational grants on Marie Cooke’s behalf from product manufacturers: Baxter; Becton, Dickinson and Company; Centurion Medical Products and Entrotech Lifesciences. Griffith University has received unrestricted investigator initiated research or educational grants on Claire M. Rickard’s behalf from product manufacturers: 3M; Adhezion Biomedical, AngioDynamics; Bard, Baxter; B.Braun; Becton, Dickinson and Company; Centurion Medical Products; Cook Medical; Entrotech, Flomedical; ICU Medical; Medtronic; Smiths Medical, Teleflex. Griffith University has received consultancy payments on Claire M. Rickard’s behalf from product manufacturers: 3M, Bard; BBraun, BD, ResQDevices, Smiths Medical. Dr. Higgins and Dr. Rippey have nothing to disclose. All of the aforementioned have not biased or influenced this review.
All authors have made substantial contributions with this review. Each author has contributed to drafting and editing the manuscript and approves the final version for publishing.
1. Alexandrou E, Ray-Barruel G, Carr PJ, et al. International prevalence of the use of peripheral intravenous catheters. J Hosp Med. 2015;10(8):530-533. PubMed
2. Tiwari MM, Hermsen ED, Charlton ME, Anderson JR, Rupp ME. Inappropriate intravascular device use: a prospective study. J Hosp Infect. 2011;78(2):128-132. PubMed
3. Sebbane M, Claret PG, Lefebvre S, et al. Predicting peripheral venous access difficulty in the emergency department using body mass index and a clinical evaluation of venous accessibility. J Emerg Med. 2013;44(2):299-305. PubMed
4. Niska R, Bhuiya F, Xu J. National Hospital Ambulatory Medical Care Survey: 2007 emergency department summary. Natl Health Stat Report. 2010;(26):1-31. PubMed
5. Aulagnier J, Hoc C, Mathieu E, Dreyfus JF, Fischler M, Le Guen M. Efficacy of AccuVein to Facilitate Peripheral Intravenous Placement in Adults Presenting to an Emergency Department: A Randomized Clinical Trial. Acad Emerg Med. 2014;21(8):858-863. PubMed
6. Carr PJ, Glynn RW, Dineen B, Kropmans TJ. A pilot intravenous cannulation team: an Irish perspective. Br J Nurs. 2010;19(10):S19-S27. PubMed
7. Conaghan PG. Predicting outcomes in rheumatoid arthritis. Clin Rheumatol. 2011;30(Suppl 1):S41-S47. PubMed
8. Hendriksen JM, Geersing GJ, Moons KG, de Groot JA. Diagnostic and prognostic prediction models. J Thromb Haemost. 2013;11(Suppl 1):129-141. PubMed
9. Hodgson C, Needham D, Haines K, et al. Feasibility and inter-rater reliability of the ICU Mobility Scale. Heart Lung. 2014;43(1):19-24. PubMed
10. Pace NL, Eberhart LHJ, Kranke PR. Quantifying prognosis with risk predictions. Eur J Anaesthesiol. 2012;29(1):7-16. PubMed
11. Yen K, Riegert A, Gorelick MH. Derivation of the DIVA score: A clinical prediction rule for the identification of children with difficult intravenous access. Pediatr Emerg Care. 2008;24(3):143-147. PubMed
12. Manuel DG, Rosella LC, Hennessy D, Sanmartin C, Wilson K. Predictive risk algorithms in a population setting: An overview. J Epidemiol Community Health. 2012;66(10):859-865. PubMed
13. Tricco AC, Lillie E, Zarin W, et al. A scoping review on the conduct and reporting of scoping reviews. BMC Med Res Methodol. 2016;16:15. PubMed
14. Pham MT, Rajić A, Greig JD, Sargeant JM, Papadopoulos A, McEwen SA. A scoping review of scoping reviews: advancing the approach and enhancing the consistency. Res Synth Methods. 2014;5(4):371-385. PubMed
15. Peters MDJ, Godfrey CM, Khalil H, McInerney P, Parker D, Soares CB. Guidance for conducting systematic scoping reviews. Int J Evid Based Healthc. 2015;13(3):141-146. PubMed
16. Adams ST, Leveson SH. Clinical prediction rules. BMJ. 2012;344:d8312 PubMed
17. Babineau J. Product Review: Covidence (Systematic Review Software). J Can Health Libr Assoc. 2014;35(2):68-71.
18. Morris C. The EQUATOR network: Promoting the transparent and accurate reporting of research. Dev Med Child Neurol. 2008;50(10):723. PubMed
19. Pagnutti L, Bin A, Donato R, et al. Difficult intravenous access tool in patients receiving peripheral chemotherapy: A pilot-validation study. Eur J Oncol Nurs. 2016;20:58-63. PubMed
20. Ung L, Cook S, Edwards B, Hocking L, Osmond F, Buttergieg H. Peripheral intravenous cannulation in nursing: performance predictors. J Infus Nurs. 2002;25(3):189-195. PubMed
21. Webster J, Morris H-L, Robinson K, Sanderson U. Development and validation of a Vein Assessment Tool (VAT). Aust J Adv Nurs. 2007;24(4):5-7. PubMed
22. Wells S. Venous access in oncology and haematology patients: Part two. Nurs Stand. 2008;23(1):35–42. PubMed
23. Carr PJ, Rippey JA, Budgeon CA, Cooke ML, Higgins NS, Rickard Claire M. Insertion of peripheral intravenous cannulae in the Emergency Department: factors associated with first-time insertion success. J Vasc Access. 2016;17(2):182-190. PubMed
24. Loon FHJ van, Puijn LAPM, Houterman S, Bouwman ARA. Development of the A-DIVA Scale: A Clinical Predictive Scale to Identify Difficult Intravenous Access in Adult Patients Based on Clinical Observations. Medicine (Baltimore). 2016;95(16):e3428. PubMed
25. Jacobson AF, Winslow EH. Variables influencing intravenous catheter insertion difficulty and failure: an analysis of 339 intravenous catheter insertions. Heart Lung. 2005;34(5):345-359. PubMed
26. Fields MJ, Piela NE, Au AK, Ku BS. Risk factors associated with difficult venous access in adult ED patients. Am J Emerg Med. 2014;32(10):1179-1182 PubMed
27. Piredda M, Biagioli V, Barrella B, et al. Factors Affecting Difficult Peripheral Intravenous Cannulation in Adults: A Prospective Observational Study. J Clin Nurs. 2017;26(7-8):1074-1084 PubMed
28. de la Torre-Montero J-C, Montealegre-Sanz M, Faraldo-Cabana A, et al. Venous International Assessment, VIA scale, validated classification procedure for the peripheral venous system. J Vasc Access. 2014;15(1):45-50. PubMed
29. Kelly AM, Egerton-Warburton D. When is peripheral intravenous catheter insertion indicated in the emergency department? Emerg Med Australas. 2014;26(5):515–516. PubMed
30. Witting MD. IV access difficulty: Incidence and delays in an urban emergency department. J Emerg Med. 2012;42(4):483-487. PubMed
31. McGowan D, Wood S. Developing a venous assessment tool in IV chemotherapy administration. Br J Nurs. 2008;17(3):158-164. PubMed
32. Castro-Sánchez E, Charani E, Drumright LN, Sevdalis N, Shah N, Holmes AH. Fragmentation of Care Threatens Patient Safety in Peripheral Vascular Catheter Management in Acute Care–A Qualitative Study. PLoS One. 2014;9(1):e86167. PubMed
33. Sabri A, Szalas J, Holmes KS, Labib L, Mussivand T. Failed attempts and improvement strategies in peripheral intravenous catheterization. Biomed Mater Eng. 2013;23(1-2):93-108. PubMed
34. Limm EI, Fang X, Dendle C, Stuart RL, Egerton Warburton D. Half of All Peripheral Intravenous Lines in an Australian Tertiary Emergency Department Are Unused: Pain With No Gain? Ann Emerg Med. 2013;62(5):521-525 PubMed
35. Egerton-Warburton D, Ieraci S. First do no harm: In fact, first do nothing, at least not a cannula. Emerg Med Australas. 2013;25(4):289-290.
36. Becerra MB, Shirley D, Safdar N. Prevalence, risk factors, and outcomes of idle intravenous catheters: An integrative review. Am J Infect Control. 2016;44(10):e167-e172. PubMed
37. Carr PJ, Higgins NS, Cooke ML, Mihala G, Rickard CM. Vascular access specialist teams for device insertion and prevention of failure. Cochrane Library. John Wiley & Sons, Ltd; 2014.
38. Davis L, Owens AK, Thompson J. Defining the Specialty of Vascular Access through Consensus: Shaping the Future of Vascular Access. J Assoc Vasc Access. 2016;21(3):125-130.
39. Da Silva GA, Priebe S, Dias FN. Benefits of establishing an intravenous team and the standardization of peripheral intravenous catheters. J Infus Nurs. 2010;33(3):156-160. PubMed
40. Soifer NE, Borzak S, Edlin BR, Weinstein RA. Prevention of peripheral venous catheter complications with an intravenous therapy team: A randomized controlled trial. Arch Intern Med. 1998;158(5):473-477. PubMed
41. Cuper NJ, de Graaff JC, van Dijk AT, Verdaasdonk RM, van der Werff DB, Kalkman CJ. Predictive factors for difficult intravenous cannulation in pediatric patients at a tertiary pediatric hospital. Paediatr Anaesth. 2012;22(3):223-229. PubMed
42. Prottengeier J, Albermann M, Heinrich S, Birkholz T, Gall C, Schmidt J. The prehospital intravenous access assessment: a prospective study on intravenous access failure and access delay in prehospital emergency medicine. Eur J Emerg Med. 2016; 23(6)442-447. PubMed
43. Cicolini G, Bonghi AP, Di Labio L, Di Mascio R. Position of peripheral venous cannulae and the incidence of thrombophlebitis: an observational study. J Adv Nurs. 2009;65(6):1268-1273. PubMed
44. Wallis MC, McGrail M, Webster J, et al. Risk factors for peripheral intravenous catheter failure: a multivariate analysis of data from a randomized controlled trial. Infect Control Hosp Epidemiol. 2014;35(1):63-68. PubMed
45. Carr PJ, Rippey J, Moore T, et al. Reasons for Removal of Emergency Department-Inserted Peripheral Intravenous Cannulae in Admitted Patients: A Retrospective Medical Chart Audit in Australia. Infect Control Hosp Epidemiol. 2016;37(7):874-876. PubMed
46. Bugden S, Shean K, Scott M, et al. Skin Glue Reduces the Failure Rate of Emergency Department-Inserted Peripheral Intravenous Catheters: A Randomized Controlled Trial. Ann Emerg Med. 2016;68(2):196-201. PubMed
47. Moureau N, Trick N, Nifong T, Perry C, Kelley C, Carrico R, et al. Vessel health and preservation (Part 1): a new evidence-based approach to vascular access selection and management. J Vasc Access. 2012;13(3):351-356. PubMed
48. Jackson T, Hallam C, Corner T, Hill S. Right line, right patient, right time: Every choice matters. Br J Nurs. 2013;22(8):S24-S28. PubMed
49. Hallam C, Weston V, Denton A, et al. Development of the UK Vessel Health and Preservation (VHP) framework: a multi-organisational collaborative. J Infect Prev. 2016;17(2):65-72.
50. Chopra V, Flanders SA, Saint S, et al. The Michigan Appropriateness Guide for Intravenous Catheters (MAGIC): Results From a Multispecialty Panel Using the RAND/UCLA Appropriateness Method. Ann Intern Med. 2015;163(6 Suppl):S1-S40. PubMed
© 2017 Society of Hospital Medicine
Dust in the Wind
A 52-year-old woman presented with a 4-day history of progressive dyspnea, nonproductive cough, pleuritic chest pain, and subjective fevers. She described dyspnea at rest, which worsened with exertion. She reported no chills, night sweats, weight change, wheezing, hemoptysis, orthopnea, lower extremity edema, or nasal congestion. She also denied myalgia, arthralgia, or joint swelling. She reported no rash, itching, or peripheral lymphadenopathy. She had no seasonal allergies. She was treated for presumed bronchitis with azithromycin by her primary care provider 4 days prior to presentation but experienced progressive dyspnea.
The constellation of dry cough, fever, and dyspnea is often infectious in origin, with the nonproductive, dry cough more suggestive of a viral than bacterial syndrome. Atypical organisms such as Mycoplasma pneumoniae, Legionella pneumophila, and Chlamydia pneumoniae may also present with these symptoms. Noninfectious etiologies should also be considered, including pulmonary embolism, systemic lupus erythematosus, asbestosis, hypersensitivity pneumonitis, sarcoidosis, and lung cancer. The dyspnea at rest stands out as a worrisome feature, as it implies hypoxia; therefore, an oxygen saturation is necessary to quickly determine her peripheral oxygen saturation.
Her past medical history was notable for lung adenocarcinoma, for which she had undergone right upper lobectomy, without chemotherapy or radiation, 13 years ago without recurrence. She had no history of chronic obstructive pulmonary disease, asthma, or pneumonia, nor a family history of chronic obstructive pulmonary disease, asthma, pneumonia, or lung cancer. Her only medication was azithromycin. She drank alcohol on occasion and denied illicit drug use. Three weeks prior to admission, she began smoking 4 to 5 cigarettes per day after 13 years of abstinence. Her smoking history prior to abstinence was 1 pack per day for 20 years. She worked as a department store remodeler; she had no exposure to asbestos, mold, or water-damaged wood. She reported no recent travel, sick contacts, or exposure to animals.
A primary lung neoplasm with a pleural effusion could cause her shortness of breath and pleuritic chest pain. Her history of lung cancer at age 39 raises the possibility of recurrence. For cigarette smokers, a second lung cancer may occur many years after the first diagnosis and treatment, even if they have quit smoking. A review of her original cancer records is essential to confirm the diagnosis of pulmonary adenocarcinoma. What is now being described as pulmonary adenocarcinoma may have been a metastatic lesion arising from outside the lung. Although unlikely, a primary adenocarcinoma may remain active.
Infectious etiologies continue to merit consideration. A parapneumonic effusion from a pneumonia or an empyema are consistent with her symptoms. Systemic lupus erythematosus can cause lung disease with pleural effusions. She does exhibit dyspnea and pleurisy, which are consistent with autoimmune disease, but does not exhibit some of the more typical autoimmune symptoms such as arthralgias, joint swelling, and rash. Pneumothorax could also produce her symptoms; however, pneumothorax usually occurs spontaneously in younger patients or after trauma or a procedure. Remote right upper lobectomy would not be a cause of pneumothorax now. Her reported history makes lung disease or pneumoconiosis due to occupational exposure to mold or aspergillosis a possibility. Legionellosis, histoplasmosis, or coccidioidomycosis should be considered if she lives in or has visited a high-risk area. Pulmonary embolism remains a concern for all patients with new-onset shortness of breath. Decision support tools, such as the Wells criteria, are valuable, but the gestalt of the physician does not lag far behind in accuracy.
Cardiac disease is also in the differential. Bibasilar crackles, third heart sound gallop, and jugular vein distension would suggest heart failure. A pericardial friction rub would be highly suggestive of pericarditis. A paradoxical pulse would raise concern for pericardial tamponade. Pleurisy may be associated with a pericardial effusion, making viral pericarditis and myocarditis possibilities.
She was in moderate distress with tachypnea and increased work of breathing. Her temperature was 36.7°C, heart rate 104 beats per minute, respiratory rate 24 breaths per minute, oxygen saturation was 88% on room air, 94% on 3 liters of oxygen, and blood pressure was 147/61 mmHg. Auscultation of the lungs revealed bibasilar crackles and decreased breath sounds at the bases. She was tachycardic, with a regular rhythm and no appreciable murmurs, rubs, or gallops. There was no jugular venous distention or lower extremity edema. Her thyroid was palpable, without appreciation of nodules. Skin and musculoskeletal examinations were normal.
Unless she is immunocompromised, infection has become lower in the differential, as she is afebrile. Decreased breath sounds at the bases and bibasilar crackles may be due to pleural effusions. Congestive heart failure is a possibility, especially given her dyspnea and bibasilar crackles. Volume overload from renal failure is possible, but she does not have other signs of volume overload such as lower extremity edema or jugular venous distension. It is important to note that crackles may be due to other etiologies, including atelectasis, fibrosis, or pneumonia. Pulmonary embolism may cause hypoxia, tachycardia, and pleural effusions. Additional diseases may present similarly, including human immunodeficiency virus with Pneumocystis jirovecii, causing dyspnea, tachypnea, and tachycardia; hematologic malignancy with anemia, causing dyspnea and tachycardia; and thyrotoxic states with thyromegaly, causing dyspnea and tachycardia. Thyroid storm patients appear in distress, are tachycardic, and may have thyromegaly.
Moderate distress, increased work of breathing, tachycardia, tachypnea, and hypoxia are all worrisome signs. Her temperature is subnormal, although this may not be accurate, as oral temperatures may register lower in patients with increased respiratory rates because of increased air flow across the thermometer. Bibasilar crackles with decreased bibasilar sounds require further investigation. A complete blood count, complete metabolic profile, troponin, arterial blood gas (ABG), electrocardiogram (ECG), and chest radiograph are warranted.
Laboratory studies revealed a white blood cell count of 8600 per mm3 with 11% bands and 7.3% eosinophils, and a hemoglobin count of 15 gm/dL. Basic metabolic panel, liver function tests, coagulation panel, and urinalysis were within normal limits, including serum creatinine 0.7 mg/dL, sodium 143 mmoL/L, chloride 104 mmoL/L, bicarbonate 30 mEq/L, anion gap 9 mmoL/L, and blood urea nitrogen 12 mg/dL. Chest radiograph disclosed diffusely increased interstitial markings and a small left pleural effusion (Figure 1).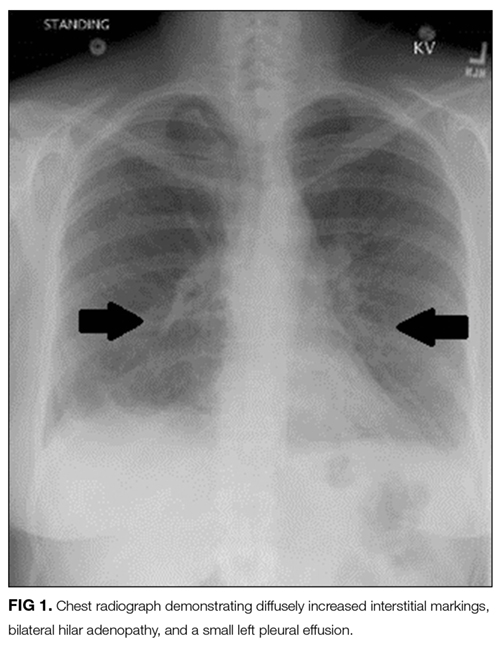
Her bandemia suggests infection. Stress can cause a leukocytosis by demargination of mature white blood cells; however, stress does not often cause immature cells such as bands to appear. Her chest radiograph with diffuse interstitial markings is consistent with a community-acquired pneumonia. Empiric antibiotic therapy should be initiated because of the possibility of community-acquired pneumonia. Recent studies demonstrate that steroids decrease mortality, the need for mechanical ventilation, and the length of stay for patients hospitalized with community-acquired pneumonia; therefore, this patient should also be treated with steroids.
Eosinophilia may be seen in drug reactions, allergies, pulmonary emboli, pleural effusions, and occasionally in malignancy. Eosinophilic pneumonia typically has the “reverse pulmonary edema” picture, with infiltrates in the periphery and not centrally, as in congestive heart failure.
A serum bicarbonate of 30 mEq/L suggests a metabolic compensation for a chronic respiratory acidosis as renal compensation, and rise in bicarbonate generally takes 3 days. She may have been hypoxic longer than her symptoms suggest.
An ABG should be ordered to determine the degree of hypoxia and whether a higher level of care is indicated. The abnormal chest radiograph, along with her hypoxia, merits a closer look at her lung parenchyma with chest computed tomography (CT). A D-dimer would be beneficial to rule out pulmonary embolism. If the D-dimer is positive, chest CT with contrast is indicated to determine if a pulmonary embolism is present. A brain natriuretic peptide would assist in the diagnosis of congestive heart failure. A sputum culture and Gram stain and respiratory viral panel may establish a pathogen for pneumonia. An ECG and troponin to rule out myocardial infarction should be performed as well.
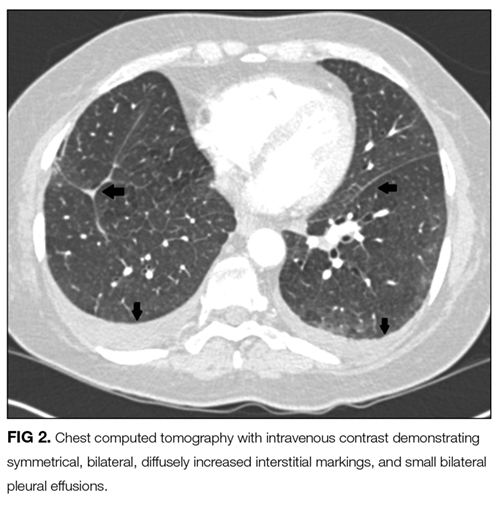
The presence of hilar and subcarinal lymph nodes expands the differential. Stage IV pulmonary sarcoid may present with diffuse infiltrates and nodes, although the acuity in this case makes it less likely. A very aggressive malignancy such as Burkitt lymphoma may have these findings. Acute viral and atypical pneumonias remain possible. Right middle lobe syndrome may cause partial collapse of the right middle lobe. Tuberculosis can be associated with right middle lobe syndrome; however, in this day and age an obstructing mass is more likely the cause. Pulmonary disease, such as cryptogenic organizing pneumonia, idiopathic pulmonary fibrosis, and interstitial lung disease, should be considered in patients with pneumonia unresponsive to antibiotics. Lung biopsy and bronchoalveolar lavage (BAL) would help make the diagnosis and should be the next step, unless her degree of hypoxia is prohibitive. Similarly, thoracentesis with analysis of the pleural fluid for cell count, Gram stain, and culture may help make the diagnosis. Thoracentesis should be done with fluoroscopic guidance, given the risk of pneumothorax, which would further compromise her tenuous respiratory status.
Thoracentesis was attempted, but the pleural effusion was too small to provide a sample. Subsequent serum blood counts with differential showed an increased eosinophilia to 20% and resolved bandemia. Upon further questioning, she recalled several months of extensive, daily, fine-dust exposure from demolition during the remodeling of a new building.
Hypereosinophilia and pulmonary infiltrates narrow the differential considerably to include asthma; parasitic infection, such as the pulmonary phase of ascariasis; exposure, such as to dust, cigarettes, or asbestosis; or hypereosinophilic syndromes characterized by peripheral eosinophilia, along with a tissue eosinophilia, causing organ dysfunction. Idiopathic hypereosinophilic syndrome, a hypereosinophilic syndrome of unknown etiology despite extensive diagnostic testing, is rare, and eosinophilic leukemia even rarer. Her history strongly suggests exposure. Many eosinophilic diseases respond rapidly to steroids, and response to treatment would help narrow the diagnosis. If she does not respond to steroids, a lung and/or bone marrow biopsy would be the next step.
A BAL of the right middle lobe revealed 51% eosinophils, 3% neutrophils, 15% macrophages, and 28% lymphocytes. Gram stain, as well as cultures for bacteria, acid fast bacilli, fungus, herpes simplex virus, and cytomegalovirus cultures, were negative. Transbronchial lung biopsy revealed focal interstitial fibrosis and inflammation, without evidence of infection.
Eosinophils are primarily located in tissues; therefore, peripheral blood eosinophil counts often underestimate the degree of infiltration into end organs such as the lung. With 50% eosinophils, her BAL reflects this. Mold, fungus, chemical, and particle exposure could produce an eosinophilic BAL. She does not appear to be at risk for parasitic exposure. Eosinophilic granulomatosis (previously known as Churg-Strauss) is a consideration, but the lack of signs of vasculitis and wheezing make this less likely. A negative antineutrophil cytoplasmic antibody may provide reassurance. “Fine dust exposure” is consistent with environmental exposure but not a specific antigen. Steroids provide a brisk eosinophil reduction and are appropriate for this patient. There is the possibility of missing infectious or parasitic etiologies; therefore, a culture of BAL fluid should be sent.
Eosinophilic infiltration may lead to fibrosis, as was found on the lung biopsy. She should be counseled to avoid “fine dust exposure” in the future. Follow-up lung imaging and pulmonary function tests (PFTs) should be performed once her acute illness resolves. She should be strongly urged not to smoke tobacco. Interestingly, there are reports that ex-smokers who restart smoking have an increased risk of eosinophilic pneumonia, but in this case dust exposure is the more likely etiology.
She was diagnosed with acute eosinophilic pneumonia (AEP). Antibiotics were discontinued, and oral prednisone was initiated at 40 mg daily, with a brisk response and resolution of her dyspnea. She was discharged with a 6-week prednisone taper. She had no cough, dyspnea, chest pain, or fevers at her follow-up 14 days after discharge. On a 6-week, postdischarge phone call, she continued to report no symptoms, and she maintained abstinence from cigarette smoking.
This case highlights that the very best test in any medical situation is a thorough, detailed history and physical examination. A comprehensive history with physical examination is noninvasive, safe, and cheap. Had the history of fine-dust exposure been known, it is likely that a great deal of testing and money would have been saved. The patient would have been diagnosed and treated earlier, and suffered less.
COMMENTARY
First described in 1989,1,2 AEP is an uncommon cause of acute respiratory failure. Cases have been reported throughout the world, including in the United States, Belgium, Japan, and Iraq.2,3 AEP is an acute febrile illness with cough, chest pain, and dyspnea for fewer than 7 days, diffuse pulmonary infiltrates on chest radiograph, hypoxemia, no history of asthma or atopic disease, no infection, and greater than 25% eosinophils on a BAL.1,3 Physical examination typically reveals fever, tachypnea, and crackles on auscultation.1 Peripheral blood eosinophilia is inconsistently seen at presentation but generally observed as the disease progresses.1 Peripheral eosinophilia at presentation is positively correlated with a milder course of AEP, including higher oxygen saturation and fewer intensive care admissions.4 Acute respiratory failure in AEP progresses rapidly, often within hours.1 Delayed recognition of AEP may lead to respiratory failure, requiring intubation, and even to death.1
Reticular markings with Kerley-B lines, mixed reticular and alveolar infiltrates, and pleural effusions are usually found on chest radiography.1 Bilateral areas of ground-glass attenuation, interlobular septal thickening, bronchovascular bundle thickening, and pleural effusions are seen on chest CT.5 Marked eosinophilic infiltration of the interstitium and alveolar spaces, as well as diffuse alveolar damage with hyaline membrane fibroblast proliferation and inflammatory cells, are present on lung biopsy.1 Restriction with impaired diffusion capacity is found on PFTs. However, PFTs return to normal after recovery.1
AEP is distinguished from other pulmonary diseases by BAL, lung biopsy, symptoms, symptom course, and/or radiographically. AEP is often misdiagnosed as severe community-acquired pneumonia and/or acute respiratory distress syndrome, as AEP tends to occur in previously healthy individuals who have diffuse infiltrates on chest radiograph, fevers, and acute, often severe, respiratory symptoms.1-3 Other eosinophilic lung diseases to rule out include simple pulmonary eosinophilia, chronic eosinophilic pneumonia, eosinophilic granulomatosis with polyangitis (Churg-Strauss), idiopathic hypereosinophilic syndrome, infection, and drug reactions.1,3,5 Simple eosinophilic pneumonia is characterized by no symptoms or very mild pulmonary symptoms and transient patchy infiltrates on radiography.3,5 Patients with simple pulmonary eosinophilia do not have interlobular septal thickening, thickening of the bronchovascular bundles, or pleural effusions radiographically, as seen with AEP.5 Chronic eosinophilic pneumonia is subacute, with respiratory symptoms of more than 3 months in duration, in contrast with the 7 days of respiratory symptoms for AEP, and is also not associated with interlobular septal thickening, thickening of the bronchovascular bundles, or pleural effusions on radiography.3,5 Unlike AEP, chronic eosinophilic pneumonia often recurs after the course of steroids has ended.3 In contrast with AEP, eosinophilic granulomatosis with polyangitis is associated with concomitant asthma and the involvement of nonpulmonary organs.3 Idiopathic hypereosinophilic syndrome is characterized by extremely high peripheral eosinophilia and by eosinophilic involvement of multiple organs, and it requires chronic steroid use.3 Patients with allergic bronchopulmonary aspergillosis (ABPA), in contrast with AEP, typically have steroid-dependent asthma and chronic respiratory symptoms.3 ABPA also differs from AEP in that radiographic infiltrates are localized and transient, and the syndrome may relapse after steroid treatment.3 Other infectious etiologies that may present similarly to AEP include invasive pulmonary aspergillosis, pulmonary coccidiodomycosis, Pneumocystis jioveri pneumonia, pulmonary toxocariasis, pulmonary filariasis, paragonimiasis, and Loeffler syndrome (pneumonia due to Strongyloides, Ascaris, or hookworms), highlighting the importance of a thorough travel and exposure history.1,3 Several drugs may cause eosinophilic lung disease, including nitrofurantoin, tetracyclines, phenytoin, L-tryptophan, acetaminophen, ampicillin, heroin, and cocaine, which necessitates a thorough review of medication and illegal drug use.3
Steroids and supportive care are the treatment of choice for AEP, although spontaneous resolution has been seen.1,3 Significant clinical improvement occurs within 24 to 48 hours of steroid initiation.1,3 Optimal dose and duration of therapy have not been determined; however, methylprednisolone 125 mg intravenously every 6 hours until improvement is an often-used option.1 Tapers vary from 2 to 12 weeks with no difference in outcome.1-3 AEP does not recur after appropriate treatment with steroids.1,3
Little is known about the etiology of AEP. It usually occurs in young, healthy individuals and is presumed to be an unusual, acute hypersensitivity reaction to an inhaled allergen.1 A report of 18 US soldiers deployed in or near Iraq proposed dust exposure and cigarette or cigar smoking as a cause of AEP.2 Similar to our patient’s fine-dust exposure and recent onset of cigarette smoking, the soldiers were exposed to the dusty, arid environment for at least 1 day and had been smoking for at least 1 month.2 The authors proposed that small dust particles irritate alveoli, stimulating eosinophils, which are exacerbated by the onset of smoking. Alternatively, cigarette smoke may prime the lung such that dust triggers an inflammatory cascade, resulting in AEP.
TEACHING POINTS
- With the potential for the rapid progression of respiratory failure, it is imperative that the diagnosis of AEP be considered for a patient with diffuse infiltrates on a chest radiograph and acute respiratory failure of unknown cause.
- A thorough history of exposure is key to including AEP in the differential of acute pulmonary disease, with recent-onset cigarette smoking and dust exposure.
- The rapid initiation of steroids leads to a full recovery without recurrence and may be life-saving in AEP.
Disclosure
The authors report no conflicts of interest.
1. Allen J. Acute eosinophilic pneumonia. Semin Respir Crit Care Med. 2006;27:142-147. PubMed
2. Shorr AF, Scoville SL, Cersovsky SB, et al. Acute eosinophilic pneumonia among US military personnel deployed in or near Iraq. JAMA. 2004;292:2997-3005. PubMed
3. Pope-Harman AL, Davis WB, Allen ED, Christoforidis AJ, Allen JN. Acute eosinophilic pneumonia. A summary of 15 cases and review of the literature. Medicine (Baltimore). 1996;75(6):334-342. PubMed
4. Jhun BW, Kim SJ, Kim K, Lee JE. Clinical implications of initial peripheral eosinophilia in acute eosinophilic pneumonia. Respirology. 2014;19:1059-1065. PubMed
5. Daimon T, Johkoh T, Sumikawa H, et al. Acute eosinophilic pneumonia: Thin-section CT findings in 29 patients. Eur J Radiol. 2008;65:462-467. PubMed
A 52-year-old woman presented with a 4-day history of progressive dyspnea, nonproductive cough, pleuritic chest pain, and subjective fevers. She described dyspnea at rest, which worsened with exertion. She reported no chills, night sweats, weight change, wheezing, hemoptysis, orthopnea, lower extremity edema, or nasal congestion. She also denied myalgia, arthralgia, or joint swelling. She reported no rash, itching, or peripheral lymphadenopathy. She had no seasonal allergies. She was treated for presumed bronchitis with azithromycin by her primary care provider 4 days prior to presentation but experienced progressive dyspnea.
The constellation of dry cough, fever, and dyspnea is often infectious in origin, with the nonproductive, dry cough more suggestive of a viral than bacterial syndrome. Atypical organisms such as Mycoplasma pneumoniae, Legionella pneumophila, and Chlamydia pneumoniae may also present with these symptoms. Noninfectious etiologies should also be considered, including pulmonary embolism, systemic lupus erythematosus, asbestosis, hypersensitivity pneumonitis, sarcoidosis, and lung cancer. The dyspnea at rest stands out as a worrisome feature, as it implies hypoxia; therefore, an oxygen saturation is necessary to quickly determine her peripheral oxygen saturation.
Her past medical history was notable for lung adenocarcinoma, for which she had undergone right upper lobectomy, without chemotherapy or radiation, 13 years ago without recurrence. She had no history of chronic obstructive pulmonary disease, asthma, or pneumonia, nor a family history of chronic obstructive pulmonary disease, asthma, pneumonia, or lung cancer. Her only medication was azithromycin. She drank alcohol on occasion and denied illicit drug use. Three weeks prior to admission, she began smoking 4 to 5 cigarettes per day after 13 years of abstinence. Her smoking history prior to abstinence was 1 pack per day for 20 years. She worked as a department store remodeler; she had no exposure to asbestos, mold, or water-damaged wood. She reported no recent travel, sick contacts, or exposure to animals.
A primary lung neoplasm with a pleural effusion could cause her shortness of breath and pleuritic chest pain. Her history of lung cancer at age 39 raises the possibility of recurrence. For cigarette smokers, a second lung cancer may occur many years after the first diagnosis and treatment, even if they have quit smoking. A review of her original cancer records is essential to confirm the diagnosis of pulmonary adenocarcinoma. What is now being described as pulmonary adenocarcinoma may have been a metastatic lesion arising from outside the lung. Although unlikely, a primary adenocarcinoma may remain active.
Infectious etiologies continue to merit consideration. A parapneumonic effusion from a pneumonia or an empyema are consistent with her symptoms. Systemic lupus erythematosus can cause lung disease with pleural effusions. She does exhibit dyspnea and pleurisy, which are consistent with autoimmune disease, but does not exhibit some of the more typical autoimmune symptoms such as arthralgias, joint swelling, and rash. Pneumothorax could also produce her symptoms; however, pneumothorax usually occurs spontaneously in younger patients or after trauma or a procedure. Remote right upper lobectomy would not be a cause of pneumothorax now. Her reported history makes lung disease or pneumoconiosis due to occupational exposure to mold or aspergillosis a possibility. Legionellosis, histoplasmosis, or coccidioidomycosis should be considered if she lives in or has visited a high-risk area. Pulmonary embolism remains a concern for all patients with new-onset shortness of breath. Decision support tools, such as the Wells criteria, are valuable, but the gestalt of the physician does not lag far behind in accuracy.
Cardiac disease is also in the differential. Bibasilar crackles, third heart sound gallop, and jugular vein distension would suggest heart failure. A pericardial friction rub would be highly suggestive of pericarditis. A paradoxical pulse would raise concern for pericardial tamponade. Pleurisy may be associated with a pericardial effusion, making viral pericarditis and myocarditis possibilities.
She was in moderate distress with tachypnea and increased work of breathing. Her temperature was 36.7°C, heart rate 104 beats per minute, respiratory rate 24 breaths per minute, oxygen saturation was 88% on room air, 94% on 3 liters of oxygen, and blood pressure was 147/61 mmHg. Auscultation of the lungs revealed bibasilar crackles and decreased breath sounds at the bases. She was tachycardic, with a regular rhythm and no appreciable murmurs, rubs, or gallops. There was no jugular venous distention or lower extremity edema. Her thyroid was palpable, without appreciation of nodules. Skin and musculoskeletal examinations were normal.
Unless she is immunocompromised, infection has become lower in the differential, as she is afebrile. Decreased breath sounds at the bases and bibasilar crackles may be due to pleural effusions. Congestive heart failure is a possibility, especially given her dyspnea and bibasilar crackles. Volume overload from renal failure is possible, but she does not have other signs of volume overload such as lower extremity edema or jugular venous distension. It is important to note that crackles may be due to other etiologies, including atelectasis, fibrosis, or pneumonia. Pulmonary embolism may cause hypoxia, tachycardia, and pleural effusions. Additional diseases may present similarly, including human immunodeficiency virus with Pneumocystis jirovecii, causing dyspnea, tachypnea, and tachycardia; hematologic malignancy with anemia, causing dyspnea and tachycardia; and thyrotoxic states with thyromegaly, causing dyspnea and tachycardia. Thyroid storm patients appear in distress, are tachycardic, and may have thyromegaly.
Moderate distress, increased work of breathing, tachycardia, tachypnea, and hypoxia are all worrisome signs. Her temperature is subnormal, although this may not be accurate, as oral temperatures may register lower in patients with increased respiratory rates because of increased air flow across the thermometer. Bibasilar crackles with decreased bibasilar sounds require further investigation. A complete blood count, complete metabolic profile, troponin, arterial blood gas (ABG), electrocardiogram (ECG), and chest radiograph are warranted.
Laboratory studies revealed a white blood cell count of 8600 per mm3 with 11% bands and 7.3% eosinophils, and a hemoglobin count of 15 gm/dL. Basic metabolic panel, liver function tests, coagulation panel, and urinalysis were within normal limits, including serum creatinine 0.7 mg/dL, sodium 143 mmoL/L, chloride 104 mmoL/L, bicarbonate 30 mEq/L, anion gap 9 mmoL/L, and blood urea nitrogen 12 mg/dL. Chest radiograph disclosed diffusely increased interstitial markings and a small left pleural effusion (Figure 1).
Her bandemia suggests infection. Stress can cause a leukocytosis by demargination of mature white blood cells; however, stress does not often cause immature cells such as bands to appear. Her chest radiograph with diffuse interstitial markings is consistent with a community-acquired pneumonia. Empiric antibiotic therapy should be initiated because of the possibility of community-acquired pneumonia. Recent studies demonstrate that steroids decrease mortality, the need for mechanical ventilation, and the length of stay for patients hospitalized with community-acquired pneumonia; therefore, this patient should also be treated with steroids.
Eosinophilia may be seen in drug reactions, allergies, pulmonary emboli, pleural effusions, and occasionally in malignancy. Eosinophilic pneumonia typically has the “reverse pulmonary edema” picture, with infiltrates in the periphery and not centrally, as in congestive heart failure.
A serum bicarbonate of 30 mEq/L suggests a metabolic compensation for a chronic respiratory acidosis as renal compensation, and rise in bicarbonate generally takes 3 days. She may have been hypoxic longer than her symptoms suggest.
An ABG should be ordered to determine the degree of hypoxia and whether a higher level of care is indicated. The abnormal chest radiograph, along with her hypoxia, merits a closer look at her lung parenchyma with chest computed tomography (CT). A D-dimer would be beneficial to rule out pulmonary embolism. If the D-dimer is positive, chest CT with contrast is indicated to determine if a pulmonary embolism is present. A brain natriuretic peptide would assist in the diagnosis of congestive heart failure. A sputum culture and Gram stain and respiratory viral panel may establish a pathogen for pneumonia. An ECG and troponin to rule out myocardial infarction should be performed as well.
The presence of hilar and subcarinal lymph nodes expands the differential. Stage IV pulmonary sarcoid may present with diffuse infiltrates and nodes, although the acuity in this case makes it less likely. A very aggressive malignancy such as Burkitt lymphoma may have these findings. Acute viral and atypical pneumonias remain possible. Right middle lobe syndrome may cause partial collapse of the right middle lobe. Tuberculosis can be associated with right middle lobe syndrome; however, in this day and age an obstructing mass is more likely the cause. Pulmonary disease, such as cryptogenic organizing pneumonia, idiopathic pulmonary fibrosis, and interstitial lung disease, should be considered in patients with pneumonia unresponsive to antibiotics. Lung biopsy and bronchoalveolar lavage (BAL) would help make the diagnosis and should be the next step, unless her degree of hypoxia is prohibitive. Similarly, thoracentesis with analysis of the pleural fluid for cell count, Gram stain, and culture may help make the diagnosis. Thoracentesis should be done with fluoroscopic guidance, given the risk of pneumothorax, which would further compromise her tenuous respiratory status.
Thoracentesis was attempted, but the pleural effusion was too small to provide a sample. Subsequent serum blood counts with differential showed an increased eosinophilia to 20% and resolved bandemia. Upon further questioning, she recalled several months of extensive, daily, fine-dust exposure from demolition during the remodeling of a new building.
Hypereosinophilia and pulmonary infiltrates narrow the differential considerably to include asthma; parasitic infection, such as the pulmonary phase of ascariasis; exposure, such as to dust, cigarettes, or asbestosis; or hypereosinophilic syndromes characterized by peripheral eosinophilia, along with a tissue eosinophilia, causing organ dysfunction. Idiopathic hypereosinophilic syndrome, a hypereosinophilic syndrome of unknown etiology despite extensive diagnostic testing, is rare, and eosinophilic leukemia even rarer. Her history strongly suggests exposure. Many eosinophilic diseases respond rapidly to steroids, and response to treatment would help narrow the diagnosis. If she does not respond to steroids, a lung and/or bone marrow biopsy would be the next step.
A BAL of the right middle lobe revealed 51% eosinophils, 3% neutrophils, 15% macrophages, and 28% lymphocytes. Gram stain, as well as cultures for bacteria, acid fast bacilli, fungus, herpes simplex virus, and cytomegalovirus cultures, were negative. Transbronchial lung biopsy revealed focal interstitial fibrosis and inflammation, without evidence of infection.
Eosinophils are primarily located in tissues; therefore, peripheral blood eosinophil counts often underestimate the degree of infiltration into end organs such as the lung. With 50% eosinophils, her BAL reflects this. Mold, fungus, chemical, and particle exposure could produce an eosinophilic BAL. She does not appear to be at risk for parasitic exposure. Eosinophilic granulomatosis (previously known as Churg-Strauss) is a consideration, but the lack of signs of vasculitis and wheezing make this less likely. A negative antineutrophil cytoplasmic antibody may provide reassurance. “Fine dust exposure” is consistent with environmental exposure but not a specific antigen. Steroids provide a brisk eosinophil reduction and are appropriate for this patient. There is the possibility of missing infectious or parasitic etiologies; therefore, a culture of BAL fluid should be sent.
Eosinophilic infiltration may lead to fibrosis, as was found on the lung biopsy. She should be counseled to avoid “fine dust exposure” in the future. Follow-up lung imaging and pulmonary function tests (PFTs) should be performed once her acute illness resolves. She should be strongly urged not to smoke tobacco. Interestingly, there are reports that ex-smokers who restart smoking have an increased risk of eosinophilic pneumonia, but in this case dust exposure is the more likely etiology.
She was diagnosed with acute eosinophilic pneumonia (AEP). Antibiotics were discontinued, and oral prednisone was initiated at 40 mg daily, with a brisk response and resolution of her dyspnea. She was discharged with a 6-week prednisone taper. She had no cough, dyspnea, chest pain, or fevers at her follow-up 14 days after discharge. On a 6-week, postdischarge phone call, she continued to report no symptoms, and she maintained abstinence from cigarette smoking.
This case highlights that the very best test in any medical situation is a thorough, detailed history and physical examination. A comprehensive history with physical examination is noninvasive, safe, and cheap. Had the history of fine-dust exposure been known, it is likely that a great deal of testing and money would have been saved. The patient would have been diagnosed and treated earlier, and suffered less.
COMMENTARY
First described in 1989,1,2 AEP is an uncommon cause of acute respiratory failure. Cases have been reported throughout the world, including in the United States, Belgium, Japan, and Iraq.2,3 AEP is an acute febrile illness with cough, chest pain, and dyspnea for fewer than 7 days, diffuse pulmonary infiltrates on chest radiograph, hypoxemia, no history of asthma or atopic disease, no infection, and greater than 25% eosinophils on a BAL.1,3 Physical examination typically reveals fever, tachypnea, and crackles on auscultation.1 Peripheral blood eosinophilia is inconsistently seen at presentation but generally observed as the disease progresses.1 Peripheral eosinophilia at presentation is positively correlated with a milder course of AEP, including higher oxygen saturation and fewer intensive care admissions.4 Acute respiratory failure in AEP progresses rapidly, often within hours.1 Delayed recognition of AEP may lead to respiratory failure, requiring intubation, and even to death.1
Reticular markings with Kerley-B lines, mixed reticular and alveolar infiltrates, and pleural effusions are usually found on chest radiography.1 Bilateral areas of ground-glass attenuation, interlobular septal thickening, bronchovascular bundle thickening, and pleural effusions are seen on chest CT.5 Marked eosinophilic infiltration of the interstitium and alveolar spaces, as well as diffuse alveolar damage with hyaline membrane fibroblast proliferation and inflammatory cells, are present on lung biopsy.1 Restriction with impaired diffusion capacity is found on PFTs. However, PFTs return to normal after recovery.1
AEP is distinguished from other pulmonary diseases by BAL, lung biopsy, symptoms, symptom course, and/or radiographically. AEP is often misdiagnosed as severe community-acquired pneumonia and/or acute respiratory distress syndrome, as AEP tends to occur in previously healthy individuals who have diffuse infiltrates on chest radiograph, fevers, and acute, often severe, respiratory symptoms.1-3 Other eosinophilic lung diseases to rule out include simple pulmonary eosinophilia, chronic eosinophilic pneumonia, eosinophilic granulomatosis with polyangitis (Churg-Strauss), idiopathic hypereosinophilic syndrome, infection, and drug reactions.1,3,5 Simple eosinophilic pneumonia is characterized by no symptoms or very mild pulmonary symptoms and transient patchy infiltrates on radiography.3,5 Patients with simple pulmonary eosinophilia do not have interlobular septal thickening, thickening of the bronchovascular bundles, or pleural effusions radiographically, as seen with AEP.5 Chronic eosinophilic pneumonia is subacute, with respiratory symptoms of more than 3 months in duration, in contrast with the 7 days of respiratory symptoms for AEP, and is also not associated with interlobular septal thickening, thickening of the bronchovascular bundles, or pleural effusions on radiography.3,5 Unlike AEP, chronic eosinophilic pneumonia often recurs after the course of steroids has ended.3 In contrast with AEP, eosinophilic granulomatosis with polyangitis is associated with concomitant asthma and the involvement of nonpulmonary organs.3 Idiopathic hypereosinophilic syndrome is characterized by extremely high peripheral eosinophilia and by eosinophilic involvement of multiple organs, and it requires chronic steroid use.3 Patients with allergic bronchopulmonary aspergillosis (ABPA), in contrast with AEP, typically have steroid-dependent asthma and chronic respiratory symptoms.3 ABPA also differs from AEP in that radiographic infiltrates are localized and transient, and the syndrome may relapse after steroid treatment.3 Other infectious etiologies that may present similarly to AEP include invasive pulmonary aspergillosis, pulmonary coccidiodomycosis, Pneumocystis jioveri pneumonia, pulmonary toxocariasis, pulmonary filariasis, paragonimiasis, and Loeffler syndrome (pneumonia due to Strongyloides, Ascaris, or hookworms), highlighting the importance of a thorough travel and exposure history.1,3 Several drugs may cause eosinophilic lung disease, including nitrofurantoin, tetracyclines, phenytoin, L-tryptophan, acetaminophen, ampicillin, heroin, and cocaine, which necessitates a thorough review of medication and illegal drug use.3
Steroids and supportive care are the treatment of choice for AEP, although spontaneous resolution has been seen.1,3 Significant clinical improvement occurs within 24 to 48 hours of steroid initiation.1,3 Optimal dose and duration of therapy have not been determined; however, methylprednisolone 125 mg intravenously every 6 hours until improvement is an often-used option.1 Tapers vary from 2 to 12 weeks with no difference in outcome.1-3 AEP does not recur after appropriate treatment with steroids.1,3
Little is known about the etiology of AEP. It usually occurs in young, healthy individuals and is presumed to be an unusual, acute hypersensitivity reaction to an inhaled allergen.1 A report of 18 US soldiers deployed in or near Iraq proposed dust exposure and cigarette or cigar smoking as a cause of AEP.2 Similar to our patient’s fine-dust exposure and recent onset of cigarette smoking, the soldiers were exposed to the dusty, arid environment for at least 1 day and had been smoking for at least 1 month.2 The authors proposed that small dust particles irritate alveoli, stimulating eosinophils, which are exacerbated by the onset of smoking. Alternatively, cigarette smoke may prime the lung such that dust triggers an inflammatory cascade, resulting in AEP.
TEACHING POINTS
- With the potential for the rapid progression of respiratory failure, it is imperative that the diagnosis of AEP be considered for a patient with diffuse infiltrates on a chest radiograph and acute respiratory failure of unknown cause.
- A thorough history of exposure is key to including AEP in the differential of acute pulmonary disease, with recent-onset cigarette smoking and dust exposure.
- The rapid initiation of steroids leads to a full recovery without recurrence and may be life-saving in AEP.
Disclosure
The authors report no conflicts of interest.
1. Allen J. Acute eosinophilic pneumonia. Semin Respir Crit Care Med. 2006;27:142-147. PubMed
2. Shorr AF, Scoville SL, Cersovsky SB, et al. Acute eosinophilic pneumonia among US military personnel deployed in or near Iraq. JAMA. 2004;292:2997-3005. PubMed
3. Pope-Harman AL, Davis WB, Allen ED, Christoforidis AJ, Allen JN. Acute eosinophilic pneumonia. A summary of 15 cases and review of the literature. Medicine (Baltimore). 1996;75(6):334-342. PubMed
4. Jhun BW, Kim SJ, Kim K, Lee JE. Clinical implications of initial peripheral eosinophilia in acute eosinophilic pneumonia. Respirology. 2014;19:1059-1065. PubMed
5. Daimon T, Johkoh T, Sumikawa H, et al. Acute eosinophilic pneumonia: Thin-section CT findings in 29 patients. Eur J Radiol. 2008;65:462-467. PubMed
Things We Do For No Reason: Against Medical Advice Discharges
The “Things We Do for No Reason” (TWDFNR) series reviews practices which have become common parts of hospital care but which may provide little value to our patients. Practices reviewed in the TWDFNR series do not represent “black and white” conclusions or clinical practice standards, but are meant as a starting place for research and active discussions among hospitalists and patients. We invite you to be part of that discussion. https://www.choosingwisely.org/

Against medical advice (AMA) discharges, which account for up to 2% of all inpatient discharges, are associated with worse health and health services outcomes and disproportionately affect vulnerable patient populations. This paper will review the background data on AMA discharges as well as the reasons physicians may choose to discharge patients AMA. From a healthcare quality perspective, the designation of a discharge as AMA is low-value care in that it is a routine hospital practice without demonstrated benefit and is not supported by a strong evidence base. We argue that designating discharges as AMA has never been shown to advance patient care and that it has the potential to harm patients by reducing access to care and promoting stigma. We believe that greater attention to both shared decision-making as well as harm reduction principles in discharge planning can serve as effective, patient-centered alternatives when patients choose not to follow a healthcare professional’s recommended advice.
CASE PRESENTATION
A 54-year-old man with active intravenous (IV) drug use and hepatitis C was admitted with lower extremity cellulitis. On hospital day 2, the patient insisted that he wanted to go home. The treatment team informed the patient that an additional 2-3 days of IV antibiotics would produce a more reliable cure and reduce the risk of readmission. Should the team inform the patient that he will be discharged against medical advice (AMA) if he chooses to leave the hospital prematurely?
BACKGROUND
In the United States, patients are discharged AMA approximately 500,000 times per year (1%-2% of all discharges).1 These discharges represent a wide array of clinical scenarios that all culminate in the formal recognition and documentation of a competent patient’s choice to decline further inpatient medical care and leave the hospital prior to a recommended clinical endpoint. Compared with standard discharges, AMA discharges are associated with an increased adjusted relative risk of 30-day mortality as high as 10% and 30-day readmission rates that are 20%-40% higher than readmission rates following standard discharges.2 AMA discharges are more likely among patients with substance use disorders, psychiatric illness, and HIV.3
WHY YOU MIGHT THINK AMA DISCHARGES ARE HELPFUL
Although there are little empirical data to inform how and why physicians choose to designate a discharge as AMA when patients decline recommended care, the existing evidence suggests that fears of legal liability are strongly driving the practice.4 Physicians may believe that they must discharge patients AMA in order to fulfill their legal and ethical responsibilities, or to demonstrate in writing the physician’s concern and the significant risk of leaving.5,6 Clinicians may have been acculturated during training to believe that an AMA discharge may also be seen as a way of formally distancing themselves from the patient’s request for a nonstandard or unsafe discharge plan, thus deflecting any potential blame for worse patient outcomes.
Finally, clinicians and administrators may also believe that an AMA discharge is the appropriate designation for a hospital stay that ended because the patient chose to prematurely discontinue the treatment relationship or to decline the postdischarge placement recommendations. This reasoning may explain why the hospital penalties authorized by Medicare’s Hospital Readmission Reduction Program generally exclude initial admissions ending in an AMA discharge7 and may provide the rationale (and perhaps a financial incentive) to discharge patients AMA in order to limit CMS readmission penalties.
WHY AMA DISCHARGES ADD NO VALUE TO A PATIENT’S FULLY INFORMED DECLINATION OF CARE
The AMA discharge is a routine hospital practice without demonstrated patient benefit and which disproportionately affects vulnerable populations. There is also a growing literature that demonstrates that AMA discharges stigmatize patients, reduce their access to care, and can reduce the quality of informed consent discussions in discharge planning.8-10 Although there are no conclusive data that AMA discharges are more likely among underrepresented racial minorities, the disproportionate burden of AMA discharges and their worse health outcomes are borne by the homeless, those with substance use disorders, and the uninsured.3,11
Compared to patients discharged conventionally from an emergency department, 25% of patients discharged AMA reported not wanting to return for follow-up care.8 This reluctance to return for care is in part mediated by provider-generated stigma and blame9,12 and may be exacerbated when patients believe that their decision to leave AMA was based upon extenuating circumstance or competing necessity (eg, limited care options for their dependents, poor quality hospital care, etc.).
To persuade patients to remain hospitalized, 85% of trainees and 67% of attending physicians in one study incorrectly informed their patients that insurance will not reimburse a hospitalization if they leave AMA.13 Because this study demonstrated that there is no empirical evidence that payment after AMA discharges is denied by private or government payers, physicians sharing this misinformation can breed distrust and coercively undermine patients’ ability to make a voluntary choice.
When clinicians assert they are bound by duty to discharge a patient AMA, they may be conflating a presumed legal obligation to formally designate the discharge as AMA in the medical record with their actual obligation to obtain the patient’s informed consent for the discharge. In other words, there is no identifiable medico-legal requirement to specifically designate a discharge as AMA.
Although clinicians may presume that the AMA designation provides protection from liability, the claim is not supported by the available literature.14,15 In these studies, which reviewed relevant case law, defendants prevailed not because of the physician’s AMA designation, but because the plaintiff was not able to prove negligence. The proper execution of the discharge process, not the specific designation of AMA, is what conferred liability protection.5 Indeed, malpractice claims, which are associated with patient perceptions of feeling deserted or devalued,16 might be more likely with AMA discharges when they result from flawed and stigmatizing communication processes.17
Finally, there are no clinical, regulatory, or professional standards that specify the designation of an AMA discharge. Neither the Joint Commission nor any other professional organization specify under what conditions a clinician should discharge a patient AMA, thus promoting wide variability in its use and further limiting it as a valid and reliable healthcare metric.
WHAT SHOULD PHYSICIANS DO INSTEAD: AVOID THE AMA DESIGNATION AND PROMOTE SHARED DECISION-MAKING AND HARM REDUCTION
Because all competent patients have the right to decline recommended inpatient treatment, the ethical and legal standard is that the physician obtain the patient’s informed consent to leave by communicating the risks, benefits, and alternatives to leaving and fully documenting the conversation in the medical record.2 The additional steps of formalizing the discharge as AMA and providing AMA forms for the patient to sign have never been demonstrated to improve quality (and add needless clerical work). When declining any treatment, even life-sustaining treatment, the request for a patient signature to decline such treatment has not been demonstrated to improve risk communication and is not considered a best practice for informed consent.18 When the physician’s motives for this behavior are punitive or directed primarily at reducing liability, it may distract the physician from their fiduciary duty to put patients first.
The solution to improve quality is straightforward—avoid designating discharges as AMA. Instead, clinicians should maintain a single discharge process with clear, objective documentation including providing appropriate prescriptions and follow-up appointments regardless of whether the patient’s choice is consistent with a physician’s recommendation. In its place, the physician should use shared decision-making (SDM) and harm reduction principles to enhance the patient’s well-being within the identified constraints. SDM involves physicians and patients making healthcare decisions together by combining the patients’ values and preferences for care with the physicians’ expertise and knowledge of medical evidence. Harm reduction practices seek to reduce the adverse health consequences that may come from unhealthy behaviors while assuming that patients will likely continue such behaviors. Evidence-based and widely accepted examples of harm reduction strategies include nicotine replacement therapy and needle exchange programs.19
SDM in discharge planning provides a range of discharge and transitional care options that are within prevailing medical standards, not simply a single recommendation that prioritizes health promotion to the exclusion of other identified patient goals. Quality discharge planning should provide the “right care for the right patient at the right time”20 that moves beyond the false choice of either remaining in the hospital under the conditions specified by the physician or leaving AMA. Although physicians are understandably concerned about patients making choices that do not prioritize their health, physicians can consider the evidence for harm reduction programs’ effectiveness in improving health outcomes21 and accommodate patients by providing harm-reducing discharge options that, while suboptimal, may not be substandard.22
Physicians who wish to promote stronger patient-centered discharge practices may find that avoiding or limiting AMA discharges may conflict with their institution’s policy. In those cases, physicians should work closely with their leadership and legal counsel to ensure that any proposed practice changes are legally compliant but also improve SDM and reduce stigma for this population.
Although ending the clinical practice of designating discharges as AMA is unlikely to completely ameliorate the morbidity and costs associated with patients declining episodes of inpatient care, there is reasonable face validity to conclude that replacing the AMA practice with greater attention to harm reduction and SDM can reduce some of the preventable harms like stigmatization and reduced access to care. Together, these practices demonstrate the profession’s continued commitment to the public to practice patient-centered care.
RECOMMENDATIONS
- Treat all discharges similarly. Avoid designating an inpatient discharge as AMA.
- Ensure there is objective documentation of the patient’s informed choice to leave the hospital.
- When patients wish to leave the hospital prior to a physician-recommended clinical endpoint, engage in SDM with a focus on providing all medically reasonable treatment options that promote harm reduction.
- If you choose to designate a discharge as AMA, approach the discharge planning process consistently and with patient-centered principles by optimizing SDM and harm reduction.
CONCLUSION
The physician informed the patient of the risks, benefits, and alternatives to leaving the hospital prior to the completion of IV antibiotics and confirmed the patient’s decision-making capacity. Next, the physician elicited the patient’s preferences for care and identified competing priorities. The patient wanted treatment for his cellulitis, but he was experiencing pain and opioid withdrawal. The physician then expanded the range of potential treatment options, including evaluation for medication-assisted treatment for the patient’s opioid use disorder (OUD) and harm reduction measures such as safer injection practices, needle exchange, housing assistance, and overdose prevention and treatment education.23 An alternative harm-reducing option included discharge with oral antibiotics and follow-up with his primary physician in 48-72 hours. After the patient indicated that he wanted to leave because he was not yet ready for OUD treatment, he was discharged with the standard discharge paperwork and antibiotics, and the physician documented the informed consent discussion.
Disclosure
The authors report no conflicts of interest, financial or otherwise. The views expressed in this article are those of the authors and do not necessarily reflect the position or policy of the US Department of Veterans Affairs, the VA National Center for Ethics in Health Care or the US Government.
Do you think this is a low-value practice? Is this truly a “Thing We Do for No Reason?” Share what you do in your practice and join in the conversation online by retweeting it on Twitter (#TWDFNR) and liking it on Facebook. We invite you to propose ideas for other “Things We Do for No Reason” topics by emailing TWDFNR@hospitalmedicine.org
1. Ibrahim SA, Kwoh CK, Krishnan E. Factors associated with patients who leave acute-care hospitals against medical advice. Am J Public Health. 2007;97(12):2204-2208. PubMed
2. Alfandre DJ. “I’m going home”: discharges against medical advice. Mayo Clin Proc. 2009;84(3):255-260. PubMed
3. Kraut A, Fransoo R, Olafson K, Ramsey CD, Yogendran M, Garland A. A population-based analysis of leaving the hospital against medical advice: incidence and associated variables. BMC Health Serv Res. 2013;13:415. PubMed
4. Green P, Watts D, Poole S, Dhopesh V. Why patients sign out against medical advice (AMA): factors motivating patients to sign out AMA. Am J Drug Alcohol Abuse. 2004;30(2):489-493. PubMed
5. Levy F, Mareiniss DP, Iacovelli C. The Importance of a Proper Against-Medical-Advice (AMA) Discharge: How Signing Out AMA May Create Significant Liability Protection for Providers. J Emerg Med. 2012;43(3):516-520. PubMed
6. Brenner J, Joslin J, Goulette A, Grant WD, Wojcik SM. Against Medical Advice: A Survey of ED Clinicians’ Rationale for Use. J Emerg Nurs. 2016;42(5):408-411. PubMed
7. Hospital-Wide (All-Condition) 30-Day Risk-Standardized Readmission Measure. https://www.cms.gov/Medicare/Quality-Initiatives-Patient-Assessment-Instruments/MMS/downloads/MMSHospital-WideAll-ConditionReadmissionRate.pdf. Accessed on July 22, 2016.
8. Jerrard DA, Chasm RM. Patients leaving against medical advice (AMA) from the emergency department--disease prevalence and willingness to return. J Emerg Med. 2011;41(4):412-417. PubMed
9. Haywood C, Jr, Lanzkron S, Hughes MT, et al. A video-intervention to improve clinician attitudes toward patients with sickle cell disease: the results of a randomized experiment. J Gen Intern Med. 2011;26(5):518-523. PubMed
10. Wigder HN, Propp DA, Leslie K, Mathew A. Insurance companies refusing payment for patients who leave the emergency department against medical advice is a myth. Ann Emerg Med. 2010;55(4):393. PubMed
11. Saab D, Nisenbaum R, Dhalla I, Hwang SW. Hospital Readmissions in a Community-based Sample of Homeless Adults: a Matched-cohort Study. J Gen Intern Med. 2016;31(9):1011-1018. PubMed
12. Lekas HM, Alfandre D, Gordon P, Harwood K, Yin MT. The role of patient-provider interactions: Using an accounts framework to explain hospital discharges against medical advice. Soc Sci Med. 2016;156:106-113. PubMed
13. Schaefer GR, Matus H, Schumann JH, et al. Financial Responsibility of Hospitalized Patients Who Left Against Medical Advice: Medical Urban Legend? J Gen Intern Med. 2012;27(7):825-830. PubMed
14. Devitt PJ, Devitt AC, Dewan M. Does identifying a discharge as “against medical advice” confer legal protection? J Fam Pract. 2000;49(3):224-227. PubMed
15. Devitt PJ, Devitt AC, Dewan M. An examination of whether discharging patients against medical advice protects physicians from malpractice charges. Psychiatr Serv. 2000;51(7):899-902. PubMed
16. Beckman HB, Markakis KM, Suchman AL, Frankel RM. The doctor-patient relationship and malpractice. Lessons from plaintiff depositions. Arch Intern Med. 1994;154(12):1365-1370. PubMed
17. Windish DM, Ratanawongsa N. Providers’ perceptions of relationships and professional roles when caring for patients who leave the hospital against medical advice. J Gen Intern Med. 2008;23(10):1698-1707. PubMed
18. Sulmasy DP, Sood JR, Texiera K, McAuley RL, McGugins J, Ury WA. A prospective trial of a new policy eliminating signed consent for do not resuscitate orders. J Gen Intern Med. 2006;21(12):1261-1268. PubMed
19. Stratton K, Shetty P, Wallace R, Bondurant S. Clearing the smoke: the science base for tobacco harm reduction--executive summary. Tob Control. 2001;10(2):189-195. PubMed
20. What is Health Care Quality and Who Decides?. March 2009. Agency for Healthcare Research and Quality, Rockville, MD. https://archive.ahrq.gov/news/speech/test031809.html
21. Hobden KL, Cunningham JA. Barriers to the dissemination of four harm reduction strategies: a survey of addiction treatment providers in Ontario. Harm Reduct J. 2006;3:35. PubMed
22. Alfandre D. Clinical Recommendations in Medical Practice: A Proposed Framework to Reduce Bias and Improve the Quality of Medical Decisions. J Clin Ethics. 2016;27(1):21-27. PubMed
23. Fanucchi L, Lofwall MR. Putting Parity into Practice - Integrating Opioid-Use Disorder Treatment into the Hospital Setting. N Engl J Med. 2016;375(9):811-813. PubMed
The “Things We Do for No Reason” (TWDFNR) series reviews practices which have become common parts of hospital care but which may provide little value to our patients. Practices reviewed in the TWDFNR series do not represent “black and white” conclusions or clinical practice standards, but are meant as a starting place for research and active discussions among hospitalists and patients. We invite you to be part of that discussion. https://www.choosingwisely.org/
Against medical advice (AMA) discharges, which account for up to 2% of all inpatient discharges, are associated with worse health and health services outcomes and disproportionately affect vulnerable patient populations. This paper will review the background data on AMA discharges as well as the reasons physicians may choose to discharge patients AMA. From a healthcare quality perspective, the designation of a discharge as AMA is low-value care in that it is a routine hospital practice without demonstrated benefit and is not supported by a strong evidence base. We argue that designating discharges as AMA has never been shown to advance patient care and that it has the potential to harm patients by reducing access to care and promoting stigma. We believe that greater attention to both shared decision-making as well as harm reduction principles in discharge planning can serve as effective, patient-centered alternatives when patients choose not to follow a healthcare professional’s recommended advice.
CASE PRESENTATION
A 54-year-old man with active intravenous (IV) drug use and hepatitis C was admitted with lower extremity cellulitis. On hospital day 2, the patient insisted that he wanted to go home. The treatment team informed the patient that an additional 2-3 days of IV antibiotics would produce a more reliable cure and reduce the risk of readmission. Should the team inform the patient that he will be discharged against medical advice (AMA) if he chooses to leave the hospital prematurely?
BACKGROUND
In the United States, patients are discharged AMA approximately 500,000 times per year (1%-2% of all discharges).1 These discharges represent a wide array of clinical scenarios that all culminate in the formal recognition and documentation of a competent patient’s choice to decline further inpatient medical care and leave the hospital prior to a recommended clinical endpoint. Compared with standard discharges, AMA discharges are associated with an increased adjusted relative risk of 30-day mortality as high as 10% and 30-day readmission rates that are 20%-40% higher than readmission rates following standard discharges.2 AMA discharges are more likely among patients with substance use disorders, psychiatric illness, and HIV.3
WHY YOU MIGHT THINK AMA DISCHARGES ARE HELPFUL
Although there are little empirical data to inform how and why physicians choose to designate a discharge as AMA when patients decline recommended care, the existing evidence suggests that fears of legal liability are strongly driving the practice.4 Physicians may believe that they must discharge patients AMA in order to fulfill their legal and ethical responsibilities, or to demonstrate in writing the physician’s concern and the significant risk of leaving.5,6 Clinicians may have been acculturated during training to believe that an AMA discharge may also be seen as a way of formally distancing themselves from the patient’s request for a nonstandard or unsafe discharge plan, thus deflecting any potential blame for worse patient outcomes.
Finally, clinicians and administrators may also believe that an AMA discharge is the appropriate designation for a hospital stay that ended because the patient chose to prematurely discontinue the treatment relationship or to decline the postdischarge placement recommendations. This reasoning may explain why the hospital penalties authorized by Medicare’s Hospital Readmission Reduction Program generally exclude initial admissions ending in an AMA discharge7 and may provide the rationale (and perhaps a financial incentive) to discharge patients AMA in order to limit CMS readmission penalties.
WHY AMA DISCHARGES ADD NO VALUE TO A PATIENT’S FULLY INFORMED DECLINATION OF CARE
The AMA discharge is a routine hospital practice without demonstrated patient benefit and which disproportionately affects vulnerable populations. There is also a growing literature that demonstrates that AMA discharges stigmatize patients, reduce their access to care, and can reduce the quality of informed consent discussions in discharge planning.8-10 Although there are no conclusive data that AMA discharges are more likely among underrepresented racial minorities, the disproportionate burden of AMA discharges and their worse health outcomes are borne by the homeless, those with substance use disorders, and the uninsured.3,11
Compared to patients discharged conventionally from an emergency department, 25% of patients discharged AMA reported not wanting to return for follow-up care.8 This reluctance to return for care is in part mediated by provider-generated stigma and blame9,12 and may be exacerbated when patients believe that their decision to leave AMA was based upon extenuating circumstance or competing necessity (eg, limited care options for their dependents, poor quality hospital care, etc.).
To persuade patients to remain hospitalized, 85% of trainees and 67% of attending physicians in one study incorrectly informed their patients that insurance will not reimburse a hospitalization if they leave AMA.13 Because this study demonstrated that there is no empirical evidence that payment after AMA discharges is denied by private or government payers, physicians sharing this misinformation can breed distrust and coercively undermine patients’ ability to make a voluntary choice.
When clinicians assert they are bound by duty to discharge a patient AMA, they may be conflating a presumed legal obligation to formally designate the discharge as AMA in the medical record with their actual obligation to obtain the patient’s informed consent for the discharge. In other words, there is no identifiable medico-legal requirement to specifically designate a discharge as AMA.
Although clinicians may presume that the AMA designation provides protection from liability, the claim is not supported by the available literature.14,15 In these studies, which reviewed relevant case law, defendants prevailed not because of the physician’s AMA designation, but because the plaintiff was not able to prove negligence. The proper execution of the discharge process, not the specific designation of AMA, is what conferred liability protection.5 Indeed, malpractice claims, which are associated with patient perceptions of feeling deserted or devalued,16 might be more likely with AMA discharges when they result from flawed and stigmatizing communication processes.17
Finally, there are no clinical, regulatory, or professional standards that specify the designation of an AMA discharge. Neither the Joint Commission nor any other professional organization specify under what conditions a clinician should discharge a patient AMA, thus promoting wide variability in its use and further limiting it as a valid and reliable healthcare metric.
WHAT SHOULD PHYSICIANS DO INSTEAD: AVOID THE AMA DESIGNATION AND PROMOTE SHARED DECISION-MAKING AND HARM REDUCTION
Because all competent patients have the right to decline recommended inpatient treatment, the ethical and legal standard is that the physician obtain the patient’s informed consent to leave by communicating the risks, benefits, and alternatives to leaving and fully documenting the conversation in the medical record.2 The additional steps of formalizing the discharge as AMA and providing AMA forms for the patient to sign have never been demonstrated to improve quality (and add needless clerical work). When declining any treatment, even life-sustaining treatment, the request for a patient signature to decline such treatment has not been demonstrated to improve risk communication and is not considered a best practice for informed consent.18 When the physician’s motives for this behavior are punitive or directed primarily at reducing liability, it may distract the physician from their fiduciary duty to put patients first.
The solution to improve quality is straightforward—avoid designating discharges as AMA. Instead, clinicians should maintain a single discharge process with clear, objective documentation including providing appropriate prescriptions and follow-up appointments regardless of whether the patient’s choice is consistent with a physician’s recommendation. In its place, the physician should use shared decision-making (SDM) and harm reduction principles to enhance the patient’s well-being within the identified constraints. SDM involves physicians and patients making healthcare decisions together by combining the patients’ values and preferences for care with the physicians’ expertise and knowledge of medical evidence. Harm reduction practices seek to reduce the adverse health consequences that may come from unhealthy behaviors while assuming that patients will likely continue such behaviors. Evidence-based and widely accepted examples of harm reduction strategies include nicotine replacement therapy and needle exchange programs.19
SDM in discharge planning provides a range of discharge and transitional care options that are within prevailing medical standards, not simply a single recommendation that prioritizes health promotion to the exclusion of other identified patient goals. Quality discharge planning should provide the “right care for the right patient at the right time”20 that moves beyond the false choice of either remaining in the hospital under the conditions specified by the physician or leaving AMA. Although physicians are understandably concerned about patients making choices that do not prioritize their health, physicians can consider the evidence for harm reduction programs’ effectiveness in improving health outcomes21 and accommodate patients by providing harm-reducing discharge options that, while suboptimal, may not be substandard.22
Physicians who wish to promote stronger patient-centered discharge practices may find that avoiding or limiting AMA discharges may conflict with their institution’s policy. In those cases, physicians should work closely with their leadership and legal counsel to ensure that any proposed practice changes are legally compliant but also improve SDM and reduce stigma for this population.
Although ending the clinical practice of designating discharges as AMA is unlikely to completely ameliorate the morbidity and costs associated with patients declining episodes of inpatient care, there is reasonable face validity to conclude that replacing the AMA practice with greater attention to harm reduction and SDM can reduce some of the preventable harms like stigmatization and reduced access to care. Together, these practices demonstrate the profession’s continued commitment to the public to practice patient-centered care.
RECOMMENDATIONS
- Treat all discharges similarly. Avoid designating an inpatient discharge as AMA.
- Ensure there is objective documentation of the patient’s informed choice to leave the hospital.
- When patients wish to leave the hospital prior to a physician-recommended clinical endpoint, engage in SDM with a focus on providing all medically reasonable treatment options that promote harm reduction.
- If you choose to designate a discharge as AMA, approach the discharge planning process consistently and with patient-centered principles by optimizing SDM and harm reduction.
CONCLUSION
The physician informed the patient of the risks, benefits, and alternatives to leaving the hospital prior to the completion of IV antibiotics and confirmed the patient’s decision-making capacity. Next, the physician elicited the patient’s preferences for care and identified competing priorities. The patient wanted treatment for his cellulitis, but he was experiencing pain and opioid withdrawal. The physician then expanded the range of potential treatment options, including evaluation for medication-assisted treatment for the patient’s opioid use disorder (OUD) and harm reduction measures such as safer injection practices, needle exchange, housing assistance, and overdose prevention and treatment education.23 An alternative harm-reducing option included discharge with oral antibiotics and follow-up with his primary physician in 48-72 hours. After the patient indicated that he wanted to leave because he was not yet ready for OUD treatment, he was discharged with the standard discharge paperwork and antibiotics, and the physician documented the informed consent discussion.
Disclosure
The authors report no conflicts of interest, financial or otherwise. The views expressed in this article are those of the authors and do not necessarily reflect the position or policy of the US Department of Veterans Affairs, the VA National Center for Ethics in Health Care or the US Government.
Do you think this is a low-value practice? Is this truly a “Thing We Do for No Reason?” Share what you do in your practice and join in the conversation online by retweeting it on Twitter (#TWDFNR) and liking it on Facebook. We invite you to propose ideas for other “Things We Do for No Reason” topics by emailing TWDFNR@hospitalmedicine.org
1. Ibrahim SA, Kwoh CK, Krishnan E. Factors associated with patients who leave acute-care hospitals against medical advice. Am J Public Health. 2007;97(12):2204-2208. PubMed
2. Alfandre DJ. “I’m going home”: discharges against medical advice. Mayo Clin Proc. 2009;84(3):255-260. PubMed
3. Kraut A, Fransoo R, Olafson K, Ramsey CD, Yogendran M, Garland A. A population-based analysis of leaving the hospital against medical advice: incidence and associated variables. BMC Health Serv Res. 2013;13:415. PubMed
4. Green P, Watts D, Poole S, Dhopesh V. Why patients sign out against medical advice (AMA): factors motivating patients to sign out AMA. Am J Drug Alcohol Abuse. 2004;30(2):489-493. PubMed
5. Levy F, Mareiniss DP, Iacovelli C. The Importance of a Proper Against-Medical-Advice (AMA) Discharge: How Signing Out AMA May Create Significant Liability Protection for Providers. J Emerg Med. 2012;43(3):516-520. PubMed
6. Brenner J, Joslin J, Goulette A, Grant WD, Wojcik SM. Against Medical Advice: A Survey of ED Clinicians’ Rationale for Use. J Emerg Nurs. 2016;42(5):408-411. PubMed
7. Hospital-Wide (All-Condition) 30-Day Risk-Standardized Readmission Measure. https://www.cms.gov/Medicare/Quality-Initiatives-Patient-Assessment-Instruments/MMS/downloads/MMSHospital-WideAll-ConditionReadmissionRate.pdf. Accessed on July 22, 2016.
8. Jerrard DA, Chasm RM. Patients leaving against medical advice (AMA) from the emergency department--disease prevalence and willingness to return. J Emerg Med. 2011;41(4):412-417. PubMed
9. Haywood C, Jr, Lanzkron S, Hughes MT, et al. A video-intervention to improve clinician attitudes toward patients with sickle cell disease: the results of a randomized experiment. J Gen Intern Med. 2011;26(5):518-523. PubMed
10. Wigder HN, Propp DA, Leslie K, Mathew A. Insurance companies refusing payment for patients who leave the emergency department against medical advice is a myth. Ann Emerg Med. 2010;55(4):393. PubMed
11. Saab D, Nisenbaum R, Dhalla I, Hwang SW. Hospital Readmissions in a Community-based Sample of Homeless Adults: a Matched-cohort Study. J Gen Intern Med. 2016;31(9):1011-1018. PubMed
12. Lekas HM, Alfandre D, Gordon P, Harwood K, Yin MT. The role of patient-provider interactions: Using an accounts framework to explain hospital discharges against medical advice. Soc Sci Med. 2016;156:106-113. PubMed
13. Schaefer GR, Matus H, Schumann JH, et al. Financial Responsibility of Hospitalized Patients Who Left Against Medical Advice: Medical Urban Legend? J Gen Intern Med. 2012;27(7):825-830. PubMed
14. Devitt PJ, Devitt AC, Dewan M. Does identifying a discharge as “against medical advice” confer legal protection? J Fam Pract. 2000;49(3):224-227. PubMed
15. Devitt PJ, Devitt AC, Dewan M. An examination of whether discharging patients against medical advice protects physicians from malpractice charges. Psychiatr Serv. 2000;51(7):899-902. PubMed
16. Beckman HB, Markakis KM, Suchman AL, Frankel RM. The doctor-patient relationship and malpractice. Lessons from plaintiff depositions. Arch Intern Med. 1994;154(12):1365-1370. PubMed
17. Windish DM, Ratanawongsa N. Providers’ perceptions of relationships and professional roles when caring for patients who leave the hospital against medical advice. J Gen Intern Med. 2008;23(10):1698-1707. PubMed
18. Sulmasy DP, Sood JR, Texiera K, McAuley RL, McGugins J, Ury WA. A prospective trial of a new policy eliminating signed consent for do not resuscitate orders. J Gen Intern Med. 2006;21(12):1261-1268. PubMed
19. Stratton K, Shetty P, Wallace R, Bondurant S. Clearing the smoke: the science base for tobacco harm reduction--executive summary. Tob Control. 2001;10(2):189-195. PubMed
20. What is Health Care Quality and Who Decides?. March 2009. Agency for Healthcare Research and Quality, Rockville, MD. https://archive.ahrq.gov/news/speech/test031809.html
21. Hobden KL, Cunningham JA. Barriers to the dissemination of four harm reduction strategies: a survey of addiction treatment providers in Ontario. Harm Reduct J. 2006;3:35. PubMed
22. Alfandre D. Clinical Recommendations in Medical Practice: A Proposed Framework to Reduce Bias and Improve the Quality of Medical Decisions. J Clin Ethics. 2016;27(1):21-27. PubMed
23. Fanucchi L, Lofwall MR. Putting Parity into Practice - Integrating Opioid-Use Disorder Treatment into the Hospital Setting. N Engl J Med. 2016;375(9):811-813. PubMed
©2017 Society of Hospital Medicine
An Opportunity to Improve Medicare’s Planned Readmissions Measure
Readmissions result in $41.3 billion in annual healthcare expenses.1 As a result of the Affordable Care Act, Centers for Medicare & Medicaid Services (CMS) implemented the Hospital Readmission Reduction Program (HRRP) to reduce expenditures and improve quality associated with hospital care.2-5 The HRRP monitors readmission rates for pneumonia, congestive heart failure (CHF), acute myocardial infarction (AMI), chronic obstructive pulmonary disease (COPD), coronary artery bypass graft (CABG), and joint replacement. Hospitals are penalized for excess readmissions that occur following any of these index admissions. However, some readmissions within 30 days of an index admission are planned. For example, patients may have scheduled admissions for chemotherapy visits or may have prescheduled elective surgeries that happen to fall within a 30-day postdischarge window. Furthermore, even unplanned readmissions may not be a marker of suboptimal care.6 To prevent penalization for planned readmissions, CMS developed an algorithm to exclude planned readmissions from the HRRP.7
Few studies have investigated the planned readmissions in the HRRP since Horwitz and colleagues7 developed the algorithm with the assistance of a technical expert panel and validated it by reviewing charts in 2 healthcare systems comprising 7 hospitals. Most studies focus on unplanned readmissions.8,9 We build on this work by studying readmissions for 131 hospitals and using administrative claims to determine whether the algorithm could be improved. Specifically, we examined planned readmissions after the conditions included in the HRRP and determine whether they occurred under elective, urgent, or emergent circumstances. The goal is to assess whether the algorithm may misclassify some readmissions as planned even though the readmission is unanticipated. We hypothesize that some readmissions considered planned by the HRRP will occur under emergent circumstances. Our findings will provide more nuanced insights regarding planned readmissions and potentially provide a mechanism to identify potentially misclassified readmissions without administrative burden.
METHODS
We analyzed Medicare claims from 2011 to 2015 for beneficiaries in Michigan who had index admissions for pneumonia, CHF, AMI, COPD, CABG, and joint replacement. Exclusion criteria were as follows: patients who were not continuously enrolled in Medicare Part A and B, had health maintenance organization coverage, were transferred to another hospital during the index admission, or received Medicare because of end-stage renal disease or disability. Patients with hip fractures were excluded because the HRRP readmission algorithm only includes elective, unilateral, total hip arthroplasties. Transfer patients were excluded because these patients are excluded from the HRRP readmission algorithm. We also excluded patients who died within 90 days of their index admission because these patients are often outliers in regards to healthcare utilization. The institutional review board at our health system deemed this study exempt from review.
For each hospital and each condition, we calculated 30-day readmission rates by identifying inpatient claims that occurred following discharge from the index admission. For patients who had multiple readmissions, we only considered the first readmission, as this follows the HRRP method. All readmissions were credited to the hospital where the index admission occurred.
To calculate 30-day planned readmission rates, we examined all readmissions and identified those deemed planned by version 3.0 of the CMS readmissions algorithm.10 We characterized these planned readmissions by examining the admission type variable and the presence or absence of emergency department (ED) charges. Planned readmissions that had an admission type of “emergent” or “urgent” and/or ED charges may have been unplanned. Because we cannot unequivocally determine whether or not the readmissions were misclassified, we refer to these readmissions as “potentially misclassified” in this manuscript. We also calculated the potential misclassification rate by hospital type.
RESULTS

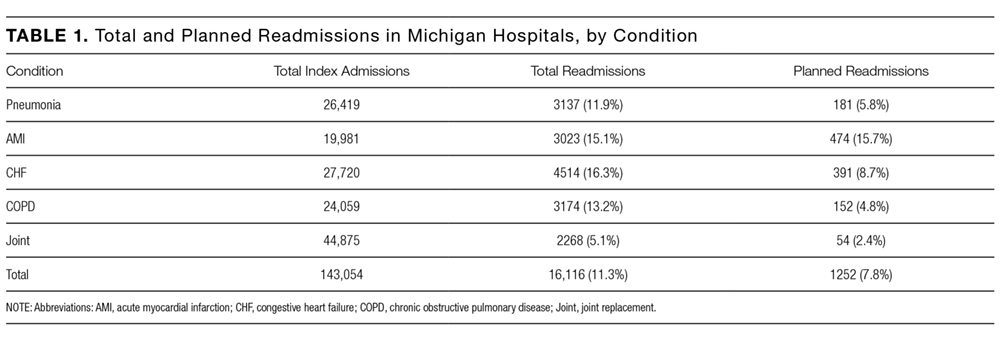
For 131 Michigan hospitals, we identified 143,054 index admissions, 16,116 (11.3%) 30-day readmissions, and 1252 (7.8%) planned readmissions (Table 1).
Of the unplanned readmissions, 97.0% had either an admission type that was “urgent” or “emergent” and/or ED charges, 96.2% were associated with an “emergent” or “urgent” admission type, and 84.3% had emergency room charges on the claim line.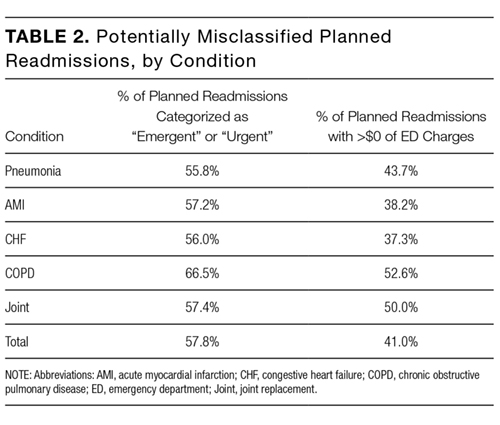
There were some differences in potential misclassification rate by hospital type. Specifically, teaching hospitals had lower potential misclassification rates than nonteaching hospitals (57.9% vs 59.7%). Larger (≥300 beds) hospitals had similar potential misclassification rates to smaller (<300 beds) hospitals (58.1% vs 58.6%). Urban hospitals had lower potential misclassification rates than rural hospitals (58.0% vs 63.3%).
DISCUSSION
In this study, we found that planned readmissions are generally infrequent. However, the majority are coded with an emergent or urgent admission type and many have ED charges reported on the claim. These findings suggest that the CMS readmission algorithm examined in this study may potentially misclassify many planned readmissions and that CMS should explore the use of admission type and presence of ED charges in the unplanned/planned readmission algorithm.
Our primary finding that planned readmissions are infrequent is supported by several observations.7-9,11 In the initial article describing the CMS algorithm,7 7.8% of readmissions were considered planned; upon review of the discharge medical records from the index admissions, 41.3% of these planned readmissions were found to be unplanned. These findings closely correlate with our own findings that 7.8% of readmissions were considered planned by the CMS criteria, and 57.8% of planned readmissions were urgent or emergent. From a clinical perspective, there are few circumstances where a patient undergoing an elective procedure will transit electively through the ED.
The CMS algorithm was intentionally designed to have a high specificity for unplanned readmissions to ensure that truly planned readmissions would not be characterized as unplanned.7 There is a potential tradeoff to increasing the sensitivity for unplanned readmissions, in that more planned readmissions might be inadvertently characterized as unplanned. Additional validation work (ie, medical chart review) will be required to explore potentially misclassified planned readmissions in greater detail.
Our study has several limitations. First, we rely solely on information in administrative claims to determine whether an admission is planned. The full clinical story is obviously limited by this method. However, the CMS readmission algorithm is only based on information from administrative claims,7 and our goal was to explore a method of improving the algorithm that could be applied by CMS in a pragmatic manner. Second, the validity of the admission type variable for the purpose of identifying “emergent” and “urgent” admissions is not entirely clear. However, based on personal communication with the Research Data Assistance Center, the variable is known to be reliable, although no specific validity testing has been performed. Third, it is possible that some truly planned readmissions began in the ED. This situation may arise at small hospitals. However, we found that most of the planned readmissions that started in the ED had secondary diagnosis codes associated with acute conditions. In addition, we did not find a disproportionate number of potentially misclassified planned readmissions at small hospitals. Fourth, the association between high readmission rates and poor quality of care has been called into question recently. However, the purpose of this study is not to assess the quality of healthcare provided by these hospitals; our intent is to explore opportunities to improve the HRRP planned readmission algorithm. Fifth, our analysis only included the state of Michigan. However, Michigan is 1 of the 10 largest states by population, and we do not expect significant differences between our data and the rest of the country. Sixth, we conducted this analysis with version 3.0 of the CMS readmission algorithm. The latest version (4.0) has made several substantial changes to reduce the number of potentially misclassified planned readmissions. However, neither admission type nor presence of ED charges are considered in the updated version. Therefore, our study provides another potential target for further improvement.
These limitations notwithstanding, these findings have important implications for key stakeholders. Relevant to policymakers, the finding that a large percentage of the planned readmissions had ED charges and/or emergent/urgent admission claim type suggests that CMS should explore the use of these variables in their readmission algorithm. Relevant to hospitals and physicians, the potential misclassification of some planned readmissions suggests that close evaluation of the sources and causes of readmission is imperative during the local development of readmission reduction initiatives.
Collectively, these findings suggest that although planned readmissions are infrequent, many of these planned readmissions may actually be nonelective or unplanned in nature. Furthermore, our findings suggest that the CMS readmission algorithm might improve its accuracy by considering the admission type and the presence of ED charges. Future research in this area should focus on validating the use of ED charges and admission type to identify unplanned readmissions through medical chart review. The aim of the HRRP is to identify signals of poor quality in a fair and equitable manner. Misclassification of readmissions will limit CMS’ ability to achieve this important goal.
Disclosure
None of the authors have any conflicts of interest to disclose.
1. Hines AL, Barrett ML, Jiang HJ, Steiner CA. Conditions with the largest number of adult hospital readmissions by payer, 2011. HCUP Statistical Brief #172. April 2014. https://www.hcup-us.ahrq.gov/reports/statbriefs/sb172-Conditions-Readmissions-Payer.jsp. PubMed
2. Kahn CN, Ault T, Potetz L, et al. Assessing Medicare’s hospital pay-for- performance programs and whether they are achieving their goals. Health Aff (Millwood). 2015;34:1281-1288. PubMed
3. Barnett ML, Hsu J and McWilliams JM. Patient characteristics and differences in hospital readmission rates. JAMA Intern. Med. 2015;175:1803-1812. PubMed
4. Jha AK. Seeking rational approaches to fixing hospital readmissions. JAMA 2015;314:1681-1682. PubMed
5. Shih T, Ryan AM, Gonzalez AA, et al. Medicare’s hospital readmissions reduction program in surgery may disproportionately affect minority-serving hospitals. Ann Surg. 2015;261:1027-1031. PubMed
6. Schairer WW, Sing DC, Vail TP, et al. Causes and frequency of unplanned hospital readmission after total hip arthroplasty. Clin Orthop Relat Res. 2014;472:464-470. PubMed
7. Horwitz LI, Grady JN, Cohen DB, et al. Development and validation of an algorithm to identify planned readmissions from claims data. J Hosp Med. 2015;10:670-677. PubMed
8. Bernatz JT, Tueting JL, Hetzel S, et al. What are the 30-day readmission rates across orthopaedic subspecialties? Clin Orthop Relat Res. 2016;474:838-847. PubMed
9. Sacks GD, Dawes AJ, Russell MM, et al. Evaluation of hospital readmissions in surgical patients: do administrative data tell the real story? JAMA Surg. 2014;149:759-764. PubMed
10. QualityNet. http://www.qualitynet.org/dcs/ContentServer?c=Page&pagename=QnetPublic%2FPage%2FQnetTier4&cid=1228774267858. Accessed on January 15, 2016.
11. Glebova NO, Bronsert M, Hicks CW, et al. Contributions of planned readmissions and patient comorbidities to high readmission rates in vascular surgery patients. J Vasc Surg. 2016;63:746-755.e2. PubMed
Readmissions result in $41.3 billion in annual healthcare expenses.1 As a result of the Affordable Care Act, Centers for Medicare & Medicaid Services (CMS) implemented the Hospital Readmission Reduction Program (HRRP) to reduce expenditures and improve quality associated with hospital care.2-5 The HRRP monitors readmission rates for pneumonia, congestive heart failure (CHF), acute myocardial infarction (AMI), chronic obstructive pulmonary disease (COPD), coronary artery bypass graft (CABG), and joint replacement. Hospitals are penalized for excess readmissions that occur following any of these index admissions. However, some readmissions within 30 days of an index admission are planned. For example, patients may have scheduled admissions for chemotherapy visits or may have prescheduled elective surgeries that happen to fall within a 30-day postdischarge window. Furthermore, even unplanned readmissions may not be a marker of suboptimal care.6 To prevent penalization for planned readmissions, CMS developed an algorithm to exclude planned readmissions from the HRRP.7
Few studies have investigated the planned readmissions in the HRRP since Horwitz and colleagues7 developed the algorithm with the assistance of a technical expert panel and validated it by reviewing charts in 2 healthcare systems comprising 7 hospitals. Most studies focus on unplanned readmissions.8,9 We build on this work by studying readmissions for 131 hospitals and using administrative claims to determine whether the algorithm could be improved. Specifically, we examined planned readmissions after the conditions included in the HRRP and determine whether they occurred under elective, urgent, or emergent circumstances. The goal is to assess whether the algorithm may misclassify some readmissions as planned even though the readmission is unanticipated. We hypothesize that some readmissions considered planned by the HRRP will occur under emergent circumstances. Our findings will provide more nuanced insights regarding planned readmissions and potentially provide a mechanism to identify potentially misclassified readmissions without administrative burden.
METHODS
We analyzed Medicare claims from 2011 to 2015 for beneficiaries in Michigan who had index admissions for pneumonia, CHF, AMI, COPD, CABG, and joint replacement. Exclusion criteria were as follows: patients who were not continuously enrolled in Medicare Part A and B, had health maintenance organization coverage, were transferred to another hospital during the index admission, or received Medicare because of end-stage renal disease or disability. Patients with hip fractures were excluded because the HRRP readmission algorithm only includes elective, unilateral, total hip arthroplasties. Transfer patients were excluded because these patients are excluded from the HRRP readmission algorithm. We also excluded patients who died within 90 days of their index admission because these patients are often outliers in regards to healthcare utilization. The institutional review board at our health system deemed this study exempt from review.
For each hospital and each condition, we calculated 30-day readmission rates by identifying inpatient claims that occurred following discharge from the index admission. For patients who had multiple readmissions, we only considered the first readmission, as this follows the HRRP method. All readmissions were credited to the hospital where the index admission occurred.
To calculate 30-day planned readmission rates, we examined all readmissions and identified those deemed planned by version 3.0 of the CMS readmissions algorithm.10 We characterized these planned readmissions by examining the admission type variable and the presence or absence of emergency department (ED) charges. Planned readmissions that had an admission type of “emergent” or “urgent” and/or ED charges may have been unplanned. Because we cannot unequivocally determine whether or not the readmissions were misclassified, we refer to these readmissions as “potentially misclassified” in this manuscript. We also calculated the potential misclassification rate by hospital type.
RESULTS
For 131 Michigan hospitals, we identified 143,054 index admissions, 16,116 (11.3%) 30-day readmissions, and 1252 (7.8%) planned readmissions (Table 1).
Of the unplanned readmissions, 97.0% had either an admission type that was “urgent” or “emergent” and/or ED charges, 96.2% were associated with an “emergent” or “urgent” admission type, and 84.3% had emergency room charges on the claim line.
There were some differences in potential misclassification rate by hospital type. Specifically, teaching hospitals had lower potential misclassification rates than nonteaching hospitals (57.9% vs 59.7%). Larger (≥300 beds) hospitals had similar potential misclassification rates to smaller (<300 beds) hospitals (58.1% vs 58.6%). Urban hospitals had lower potential misclassification rates than rural hospitals (58.0% vs 63.3%).
DISCUSSION
In this study, we found that planned readmissions are generally infrequent. However, the majority are coded with an emergent or urgent admission type and many have ED charges reported on the claim. These findings suggest that the CMS readmission algorithm examined in this study may potentially misclassify many planned readmissions and that CMS should explore the use of admission type and presence of ED charges in the unplanned/planned readmission algorithm.
Our primary finding that planned readmissions are infrequent is supported by several observations.7-9,11 In the initial article describing the CMS algorithm,7 7.8% of readmissions were considered planned; upon review of the discharge medical records from the index admissions, 41.3% of these planned readmissions were found to be unplanned. These findings closely correlate with our own findings that 7.8% of readmissions were considered planned by the CMS criteria, and 57.8% of planned readmissions were urgent or emergent. From a clinical perspective, there are few circumstances where a patient undergoing an elective procedure will transit electively through the ED.
The CMS algorithm was intentionally designed to have a high specificity for unplanned readmissions to ensure that truly planned readmissions would not be characterized as unplanned.7 There is a potential tradeoff to increasing the sensitivity for unplanned readmissions, in that more planned readmissions might be inadvertently characterized as unplanned. Additional validation work (ie, medical chart review) will be required to explore potentially misclassified planned readmissions in greater detail.
Our study has several limitations. First, we rely solely on information in administrative claims to determine whether an admission is planned. The full clinical story is obviously limited by this method. However, the CMS readmission algorithm is only based on information from administrative claims,7 and our goal was to explore a method of improving the algorithm that could be applied by CMS in a pragmatic manner. Second, the validity of the admission type variable for the purpose of identifying “emergent” and “urgent” admissions is not entirely clear. However, based on personal communication with the Research Data Assistance Center, the variable is known to be reliable, although no specific validity testing has been performed. Third, it is possible that some truly planned readmissions began in the ED. This situation may arise at small hospitals. However, we found that most of the planned readmissions that started in the ED had secondary diagnosis codes associated with acute conditions. In addition, we did not find a disproportionate number of potentially misclassified planned readmissions at small hospitals. Fourth, the association between high readmission rates and poor quality of care has been called into question recently. However, the purpose of this study is not to assess the quality of healthcare provided by these hospitals; our intent is to explore opportunities to improve the HRRP planned readmission algorithm. Fifth, our analysis only included the state of Michigan. However, Michigan is 1 of the 10 largest states by population, and we do not expect significant differences between our data and the rest of the country. Sixth, we conducted this analysis with version 3.0 of the CMS readmission algorithm. The latest version (4.0) has made several substantial changes to reduce the number of potentially misclassified planned readmissions. However, neither admission type nor presence of ED charges are considered in the updated version. Therefore, our study provides another potential target for further improvement.
These limitations notwithstanding, these findings have important implications for key stakeholders. Relevant to policymakers, the finding that a large percentage of the planned readmissions had ED charges and/or emergent/urgent admission claim type suggests that CMS should explore the use of these variables in their readmission algorithm. Relevant to hospitals and physicians, the potential misclassification of some planned readmissions suggests that close evaluation of the sources and causes of readmission is imperative during the local development of readmission reduction initiatives.
Collectively, these findings suggest that although planned readmissions are infrequent, many of these planned readmissions may actually be nonelective or unplanned in nature. Furthermore, our findings suggest that the CMS readmission algorithm might improve its accuracy by considering the admission type and the presence of ED charges. Future research in this area should focus on validating the use of ED charges and admission type to identify unplanned readmissions through medical chart review. The aim of the HRRP is to identify signals of poor quality in a fair and equitable manner. Misclassification of readmissions will limit CMS’ ability to achieve this important goal.
Disclosure
None of the authors have any conflicts of interest to disclose.
1. Hines AL, Barrett ML, Jiang HJ, Steiner CA. Conditions with the largest number of adult hospital readmissions by payer, 2011. HCUP Statistical Brief #172. April 2014. https://www.hcup-us.ahrq.gov/reports/statbriefs/sb172-Conditions-Readmissions-Payer.jsp. PubMed
2. Kahn CN, Ault T, Potetz L, et al. Assessing Medicare’s hospital pay-for- performance programs and whether they are achieving their goals. Health Aff (Millwood). 2015;34:1281-1288. PubMed
3. Barnett ML, Hsu J and McWilliams JM. Patient characteristics and differences in hospital readmission rates. JAMA Intern. Med. 2015;175:1803-1812. PubMed
4. Jha AK. Seeking rational approaches to fixing hospital readmissions. JAMA 2015;314:1681-1682. PubMed
5. Shih T, Ryan AM, Gonzalez AA, et al. Medicare’s hospital readmissions reduction program in surgery may disproportionately affect minority-serving hospitals. Ann Surg. 2015;261:1027-1031. PubMed
6. Schairer WW, Sing DC, Vail TP, et al. Causes and frequency of unplanned hospital readmission after total hip arthroplasty. Clin Orthop Relat Res. 2014;472:464-470. PubMed
7. Horwitz LI, Grady JN, Cohen DB, et al. Development and validation of an algorithm to identify planned readmissions from claims data. J Hosp Med. 2015;10:670-677. PubMed
8. Bernatz JT, Tueting JL, Hetzel S, et al. What are the 30-day readmission rates across orthopaedic subspecialties? Clin Orthop Relat Res. 2016;474:838-847. PubMed
9. Sacks GD, Dawes AJ, Russell MM, et al. Evaluation of hospital readmissions in surgical patients: do administrative data tell the real story? JAMA Surg. 2014;149:759-764. PubMed
10. QualityNet. http://www.qualitynet.org/dcs/ContentServer?c=Page&pagename=QnetPublic%2FPage%2FQnetTier4&cid=1228774267858. Accessed on January 15, 2016.
11. Glebova NO, Bronsert M, Hicks CW, et al. Contributions of planned readmissions and patient comorbidities to high readmission rates in vascular surgery patients. J Vasc Surg. 2016;63:746-755.e2. PubMed
©2017 Society of Hospital Medicine
Post-Intensive Care Unit Psychiatric Comorbidity and Quality of Life
The prevalence of depression, anxiety, and posttraumatic stress disorder (PTSD) symptoms in intensive care unit (ICU) survivors ranges from 17% to 44%.1-4 Psychiatric comorbidity, the presence of 2 or more psychiatric disorders, is highly prevalent in survivors of acute respiratory distress syndrome and is associated with higher mortality in postsurgical ICU survivors.5-7 While long-term cognitive impairment in patients with ICU delirium has been associated with poor quality of life (QoL),1 the effects of psychiatric comorbidity on QoL among similar patients are not as well understood. In this study, we examined whether psychiatric comorbidity was associated with poorer QoL in survivors of ICU delirium.
METHODS
We examined subjects who participated in the Pharmacologic Management of Delirium (PMD) clinical trial. This trial examined the efficacy of a pharmacological intervention for patients who developed ICU delirium at a local tertiary-care academic hospital.8 Out of 62 patients who participated in the follow-up of the PMD study, 58 completed QoL interviews and validated psychiatric screens (Patient Health Questionnaire-9 [PHQ-9] for depression, the Generalized Anxiety Disorder-7 [GAD-7] questionnaire for anxiety, and the Post-Traumatic Stress Syndrome [PTSS-10] questionnaire for PTSD) at 3 months after hospital discharge. High psychiatric comorbidity was defined as having significant symptoms for all 3 conditions (depression: PHQ-9 score ≥ 10; anxiety: GAD-7 ≥ 10; and PTSD: PTSS-10 > 35). No psychiatric morbidity was defined as having no significant symptoms for all 3 conditions. Low to moderate (low-moderate) psychiatric morbidity was defined as having symptoms for 1 to 2 conditions.
Participants also completed 2 complementary QoL measures: the EuroQol 5 dimensions questionnaire 3-level (EQ-5D-3L) Index and the EuroQol 5 dimensions Visual Analog Scale (EQ-5D-VAS).9 The EQ-5D-3L Index asks participants to rate themselves as having (1) no problems, (2) some problems, or (3) extreme problems on the following 5 scales: mobility, self-care, usual activities, pain/discomfort, and anxiety/depression. The scores are then indexed against the US population to create a continuous index scale ranging from −0.11 to 1.00.
Fisher’s exact tests were used to compare dichotomous outcomes. Analysis of variance (ANOVA) was used to compare continuous outcomes across the 3 psychiatric groups. Analysis of covariance (ANCOVA) was used to determine whether psychiatric comorbidity in survivors of ICU delirium was associated with QoL measures. Models were adjusted for the following covariates: age, gender, Charlson Comorbidity Index, discharged to home, prior history of depression, and prior history of anxiety. To assess the relationship of psychiatric comorbidity with QoL, we chose the 2 continuous QoL measures as the outcome. Because we were interested in the effect of psychiatric burden on QoL, we used ANCOVA with QoL as the dependent variable and psychiatric burden as an independent variable. Pairwise comparisons were then performed when overall differences were significant (P < 0.05). We performed 2 separate sensitivity analyses. The first analysis looked solely at the subgroup of patients from the medical intensive care unit. We also recalculated the EQ-5D-3L index excluding the anxiety/depression item.
RESULTS
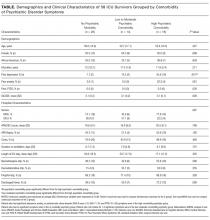
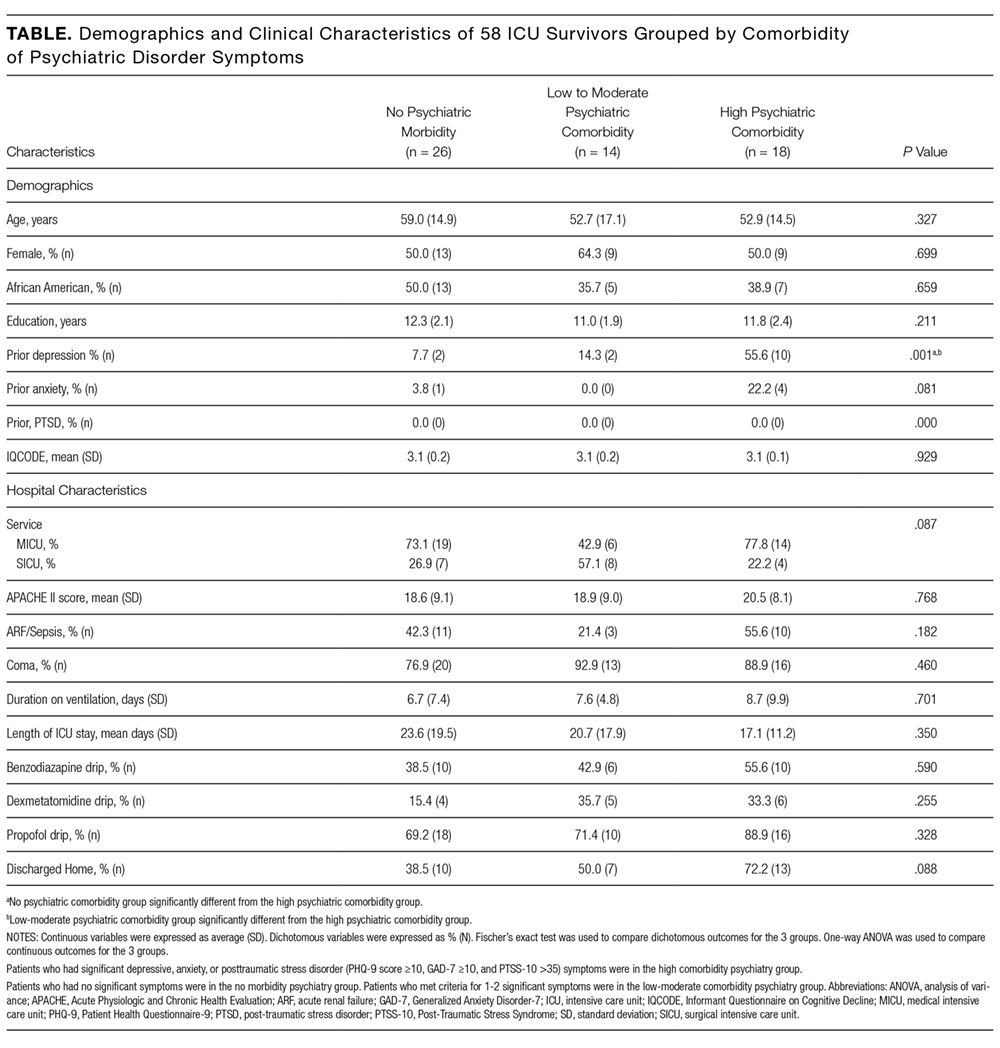
Nearly one-third of patients (18/58) had high psychiatric burden. The table looks at the demographic and clinical characteristics of patients with high psychiatric comorbidity versus those of low-moderate psychiatric comorbidity and those with no psychiatric morbidity. Patient groups did not differ significantly in terms of demographics. For clinical characteristics, patients with high psychiatric comorbidity were more likely than patients with low-moderate psychiatric comorbidity to have a prior history of depression (P < 0.05).
Patients with high psychiatric comorbidity were more likely to have a poorer QoL when compared with patients with low-moderate psychiatric comorbidity and to those with no morbidity as measured by a lower EQ-5D-3L Index (no, 0.69 ± 0.25; low-moderate, 0.70 ± 0.19; high, 0.48 ± 0.24; P = 0.006) and EQ-5D-VAS (no, 67.0 ± 20.7; low-moderate, 76.6 ± 20.0; high, 50.8 ± 22.4; P = 0.004). After adjusting for covariates, patients with high psychiatric comorbidity had a poorer QoL compared with those with no morbidity or low-moderate comorbidity on the EQ-5D-3L Index (P = 0.017 for overall differences), whereas patients who had high psychiatric comorbidity had a poorer QoL compared to those with low-moderate comorbidity on the EQ-5D-VAS (P = 0.039 for overall differences; Figure). Subgroup analysis of MICU patients yielded similar results. Patients with high psychiatric burden had significantly poorer QoL as measured by the EQ-5D-3L (unadjusted P = 0.044, adjusted P = 0.003) and the EQ-5D-VAS (unadjusted P = 0.007, adjusted P = 0.021). After excluding the anxiety/depression item from the EQ-5D-3L, we observed similar differences (no, 0.71 ± 0.24; low-moderate, 0.75 ± 0.15; high, 0.58 ± 0.22; unadjusted P = 0.062; adjusted P = 0.040).
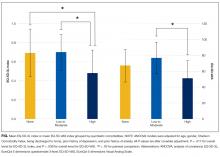
DISCUSSION/CONCLUSION
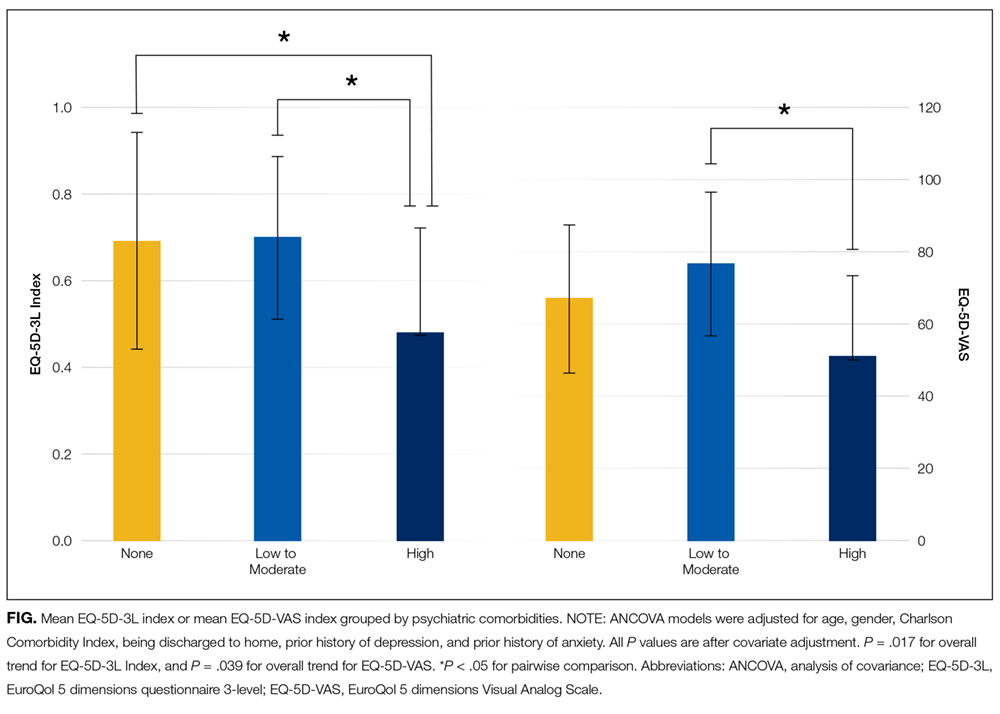
Psychiatric comorbidities in ICU survivors are common and pose a significant clinical issue. Patients with multiple psychiatric comorbidities can be more complicated to identify from a diagnostic standpoint and often require more prolonged, intensive mental health treatment when compared with patients with a single psychiatric disorder.10,11 Our study showed that high psychiatric comorbidity in survivors of ICU delirium is associated with a decreased QoL compared with those with no psychiatric comorbidity or with low-moderate psychiatric comorbidity. This finding is consistent with previous studies in the general population that patients with multiple psychiatric comorbidities are associated with a poorer QoL compared with patients with a single psychiatric comorbidity.10,11
There is a pressing need to better characterize psychiatric comorbidities in ICU survivors because our current evidence suggests that the prevalence of psychiatric comorbidities of ICU survivors is substantially higher than that of the general population. We found that nearly one-third of survivors of ICU delirium had comorbid depression, anxiety, and PTSD symptoms at 3 months. This is consistent with the few other studies of ICU survivors, which showed a prevalence of psychiatric comorbidity of 25% to 33%.5,12 These rates are substantially higher than the prevalence in the general population of 6%.13
The high rate of psychiatric comorbidities may render it difficult to effectively treat the mental health symptoms in ICU survivors.14 Treating multiple psychiatric comorbidities may also be especially challenging in survivors of ICU delirium because they have a high prevalence of cognitive impairment. Mental health treatments for patients with psychiatric disorders and comorbid cognitive impairment are limited. Better characterization of psychiatric comorbidity in ICU survivors, particularly those with ICU delirium, is vital to the development of more effective, bundled treatments for this population with multiple comorbidities.
Standardized screenings of ICU survivors at a high risk for psychiatric disorders, such as survivors of ICU delirium, may help to identify patients with comorbid psychiatric disorder symptoms and have them referred to appropriate treatment earlier with the hope of improving their QoL sooner. Although opportunities to deliver integrated outpatient collaborative mental health and medical care for a subspecialty population are limited, one potential model of care would be to utilize a collaborative-care model in an ICU survivor clinic.15
Strengths of our study include the examination of psychiatric comorbidities in survivors of ICU delirium, who often have a poor QoL. A deeper understanding of psychiatric comorbidity and its relationship with QoL is needed to better understand how to deliver more effective treatments for these survivors. Limitations include the small sample size, a one-time measurement of psychiatric comorbidities at the 3-month follow-up based on screenings tools, and a lack of objective measures of physical functioning to determine the effects of psychiatric comorbidities on physical functioning. There may also have been differences in how patients with no psychiatric comorbidity responded to the EQ-5D-VAS as a result of premorbid differences (eg, they were healthier prior to their ICU stay and perceived their survivor status more negatively). This may explain why we did not see a statistically significant difference between no psychiatric comorbidity and high psychiatric comorbidity groups on the EQ-5D-VAS. Nevertheless, we did see a difference between the low-moderate psychiatric comorbidity group on EQ-5D-VAS and differences between the no comorbidity and low-moderate comorbidity groups versus the high comorbidity group on the EQ-5D-3L. Finally, data about psychiatric history and QoL prior to ICU hospitalization were limited. Therefore, truly determining incidence versus prevalence of post-ICU comorbidities and whether psychiatric symptoms and its effects on QoL were due to ICU hospitalization or to premorbid psychiatric symptoms is difficult.
Our study demonstrated that in survivors of ICU delirium, higher comorbidity of psychiatric symptoms was associated with poorer QoL. Future studies will need to confirm these findings. We will also need to identify potentially reversible risk factors for psychiatric comorbidity and poorer QoL and develop treatments to effectively target the mental health symptoms of survivors of ICU delirium.
Disclosure
Grant support: The PMD trial is funded through the National Institutes of Health grant R01AG054205-02. SW is supported by NIA 2P30AG010133. AP is supported by CMS 1 L1 CMS331444-02-00, Indiana CTSI, and NIA R01AG054205-02. SG is supported by NIA 2P30AG010133, NIA 5R01AG045350, and NIA R01AG054205-02. SK is supported by NHBLI 5T32HL091816-07. MB is supported by NIA R01 AG040220-05, AHRQ P30 HS024384-02, CMS 1 L1 CMS331444-02-00, NIA R01 AG030618-05A1 and NIA R01AG054205-02. BK is supported by NIA K23-AG043476 and NHLBI R01HL131730. The funding agency had no role in the development of the study design, collection, analysis, interpretation of data, manuscript development, or the decision to submit the manuscript for publication. Conflicts of interest include MB, SG, and AP being funded by NIA R01AG054205-02 for the PMD study.
1. Jutte JE, Erb CT, Jackson JC. Physical, cognitive, and psychological disability following critical illness: what is the risk? Semin Respir Crit Care Med. 2015;36(6):943-958. PubMed
2. Nikayin S, Rabiee A, Hashem MD, et al. Anxiety symptoms in survivors of critical illness: a systematic review and meta-analysis. Gen Hosp Psychiatry. 2016;43:23-29. PubMed
3. Rabiee A, Nikayin S, Hashem MD, et al. Depressive symptoms after critical illness: a systematic review and meta-analysis. Crit Care Med. 2016;44(9):1744-1753. PubMed
4. Parker AM, Sricharoenchai T, Raparla S, Schneck KW, Bienvenu OJ, Needham DM. Posttraumatic stress disorder in critical illness survivors: a metaanalysis. Crit Care Med. 2015;43(5):1121-1129. PubMed
5. Bienvenu OJ, Colantuoni E, Mendez-Tellez PA, et al. Cooccurrence of and remission from general anxiety, depression, and posttraumatic stress disorder symptoms after acute lung injury: a 2-year longitudinal study. Crit Care Med. 2015;43(3):642-653. PubMed
6. Huang M, Parker AM, Bienvenu OJ, et al. Psychiatric Symptoms in Acute Respiratory Distress Syndrome Survivors: A 1-Year National Multicenter Study. Crit Care Med. 2016;44(5):954-965. PubMed
7. Abrams TE, Vaughan-Sarrazin M, Rosenthal GE. Influence of psychiatric comorbidity on surgical mortality. Arch Surg. 2010;145(10):947-953. PubMed
8. Campbell NL, Khan BA, Farber M, et al. Improving delirium care in the intensive care unit: the design of a pragmatic study. Trials. 2011;12:139. PubMed
9. EuroQol Group. EuroQol--a new facility for the measurement of health-related quality of life. Health Policy. 1990;16(3):199-208. PubMed
10. Hirschfeld RM. The comorbidity of major depression and anxiety disorders: recognition and management in primary care. Prim Care Companion J Clin Psychiatry. 2001;3(6):244–254. PubMed
11. Campbell DG, Felker BL, Liu CF, et al. Prevalence of depression–PTSD comorbidity: implications for clinical practice guidelines and primary care-based interventions. J Gen Intern Med. 2007;22(6):711–718. PubMed
12. Wolters AE, Peelen LM, Welling MC, et al. Long-term mental health problems after delirium in the ICU. Crit Care Med. 2016;44(10):1808-1813. PubMed
13. Kessler RC, Chiu WT, Demler O, Merikangas KR, Walters EE. Prevalence, severity, and comorbidity of 12-month DSM-IV disorders in the National Comorbidity Survey Replication. Arch Gen Psychiatry. 2005;62(6):617-627. PubMed
14. Mehlhorn J, Freytag A, Schmidt K, et al. Rehabilitation interventions for postintensive care syndrome: a systematic review. Crit Care Med. 2014;42(5):1263-1271. PubMed
15. Khan BA, Lasiter S, Boustani MA. CE: critical care recovery center: an innovative collaborative care model for ICU survivors. Am J Nurs. 2015;115(3):24-31. PubMed
The prevalence of depression, anxiety, and posttraumatic stress disorder (PTSD) symptoms in intensive care unit (ICU) survivors ranges from 17% to 44%.1-4 Psychiatric comorbidity, the presence of 2 or more psychiatric disorders, is highly prevalent in survivors of acute respiratory distress syndrome and is associated with higher mortality in postsurgical ICU survivors.5-7 While long-term cognitive impairment in patients with ICU delirium has been associated with poor quality of life (QoL),1 the effects of psychiatric comorbidity on QoL among similar patients are not as well understood. In this study, we examined whether psychiatric comorbidity was associated with poorer QoL in survivors of ICU delirium.
METHODS
We examined subjects who participated in the Pharmacologic Management of Delirium (PMD) clinical trial. This trial examined the efficacy of a pharmacological intervention for patients who developed ICU delirium at a local tertiary-care academic hospital.8 Out of 62 patients who participated in the follow-up of the PMD study, 58 completed QoL interviews and validated psychiatric screens (Patient Health Questionnaire-9 [PHQ-9] for depression, the Generalized Anxiety Disorder-7 [GAD-7] questionnaire for anxiety, and the Post-Traumatic Stress Syndrome [PTSS-10] questionnaire for PTSD) at 3 months after hospital discharge. High psychiatric comorbidity was defined as having significant symptoms for all 3 conditions (depression: PHQ-9 score ≥ 10; anxiety: GAD-7 ≥ 10; and PTSD: PTSS-10 > 35). No psychiatric morbidity was defined as having no significant symptoms for all 3 conditions. Low to moderate (low-moderate) psychiatric morbidity was defined as having symptoms for 1 to 2 conditions.
Participants also completed 2 complementary QoL measures: the EuroQol 5 dimensions questionnaire 3-level (EQ-5D-3L) Index and the EuroQol 5 dimensions Visual Analog Scale (EQ-5D-VAS).9 The EQ-5D-3L Index asks participants to rate themselves as having (1) no problems, (2) some problems, or (3) extreme problems on the following 5 scales: mobility, self-care, usual activities, pain/discomfort, and anxiety/depression. The scores are then indexed against the US population to create a continuous index scale ranging from −0.11 to 1.00.
Fisher’s exact tests were used to compare dichotomous outcomes. Analysis of variance (ANOVA) was used to compare continuous outcomes across the 3 psychiatric groups. Analysis of covariance (ANCOVA) was used to determine whether psychiatric comorbidity in survivors of ICU delirium was associated with QoL measures. Models were adjusted for the following covariates: age, gender, Charlson Comorbidity Index, discharged to home, prior history of depression, and prior history of anxiety. To assess the relationship of psychiatric comorbidity with QoL, we chose the 2 continuous QoL measures as the outcome. Because we were interested in the effect of psychiatric burden on QoL, we used ANCOVA with QoL as the dependent variable and psychiatric burden as an independent variable. Pairwise comparisons were then performed when overall differences were significant (P < 0.05). We performed 2 separate sensitivity analyses. The first analysis looked solely at the subgroup of patients from the medical intensive care unit. We also recalculated the EQ-5D-3L index excluding the anxiety/depression item.
RESULTS
Nearly one-third of patients (18/58) had high psychiatric burden. The table looks at the demographic and clinical characteristics of patients with high psychiatric comorbidity versus those of low-moderate psychiatric comorbidity and those with no psychiatric morbidity. Patient groups did not differ significantly in terms of demographics. For clinical characteristics, patients with high psychiatric comorbidity were more likely than patients with low-moderate psychiatric comorbidity to have a prior history of depression (P < 0.05).
Patients with high psychiatric comorbidity were more likely to have a poorer QoL when compared with patients with low-moderate psychiatric comorbidity and to those with no morbidity as measured by a lower EQ-5D-3L Index (no, 0.69 ± 0.25; low-moderate, 0.70 ± 0.19; high, 0.48 ± 0.24; P = 0.006) and EQ-5D-VAS (no, 67.0 ± 20.7; low-moderate, 76.6 ± 20.0; high, 50.8 ± 22.4; P = 0.004). After adjusting for covariates, patients with high psychiatric comorbidity had a poorer QoL compared with those with no morbidity or low-moderate comorbidity on the EQ-5D-3L Index (P = 0.017 for overall differences), whereas patients who had high psychiatric comorbidity had a poorer QoL compared to those with low-moderate comorbidity on the EQ-5D-VAS (P = 0.039 for overall differences; Figure). Subgroup analysis of MICU patients yielded similar results. Patients with high psychiatric burden had significantly poorer QoL as measured by the EQ-5D-3L (unadjusted P = 0.044, adjusted P = 0.003) and the EQ-5D-VAS (unadjusted P = 0.007, adjusted P = 0.021). After excluding the anxiety/depression item from the EQ-5D-3L, we observed similar differences (no, 0.71 ± 0.24; low-moderate, 0.75 ± 0.15; high, 0.58 ± 0.22; unadjusted P = 0.062; adjusted P = 0.040).
DISCUSSION/CONCLUSION
Psychiatric comorbidities in ICU survivors are common and pose a significant clinical issue. Patients with multiple psychiatric comorbidities can be more complicated to identify from a diagnostic standpoint and often require more prolonged, intensive mental health treatment when compared with patients with a single psychiatric disorder.10,11 Our study showed that high psychiatric comorbidity in survivors of ICU delirium is associated with a decreased QoL compared with those with no psychiatric comorbidity or with low-moderate psychiatric comorbidity. This finding is consistent with previous studies in the general population that patients with multiple psychiatric comorbidities are associated with a poorer QoL compared with patients with a single psychiatric comorbidity.10,11
There is a pressing need to better characterize psychiatric comorbidities in ICU survivors because our current evidence suggests that the prevalence of psychiatric comorbidities of ICU survivors is substantially higher than that of the general population. We found that nearly one-third of survivors of ICU delirium had comorbid depression, anxiety, and PTSD symptoms at 3 months. This is consistent with the few other studies of ICU survivors, which showed a prevalence of psychiatric comorbidity of 25% to 33%.5,12 These rates are substantially higher than the prevalence in the general population of 6%.13
The high rate of psychiatric comorbidities may render it difficult to effectively treat the mental health symptoms in ICU survivors.14 Treating multiple psychiatric comorbidities may also be especially challenging in survivors of ICU delirium because they have a high prevalence of cognitive impairment. Mental health treatments for patients with psychiatric disorders and comorbid cognitive impairment are limited. Better characterization of psychiatric comorbidity in ICU survivors, particularly those with ICU delirium, is vital to the development of more effective, bundled treatments for this population with multiple comorbidities.
Standardized screenings of ICU survivors at a high risk for psychiatric disorders, such as survivors of ICU delirium, may help to identify patients with comorbid psychiatric disorder symptoms and have them referred to appropriate treatment earlier with the hope of improving their QoL sooner. Although opportunities to deliver integrated outpatient collaborative mental health and medical care for a subspecialty population are limited, one potential model of care would be to utilize a collaborative-care model in an ICU survivor clinic.15
Strengths of our study include the examination of psychiatric comorbidities in survivors of ICU delirium, who often have a poor QoL. A deeper understanding of psychiatric comorbidity and its relationship with QoL is needed to better understand how to deliver more effective treatments for these survivors. Limitations include the small sample size, a one-time measurement of psychiatric comorbidities at the 3-month follow-up based on screenings tools, and a lack of objective measures of physical functioning to determine the effects of psychiatric comorbidities on physical functioning. There may also have been differences in how patients with no psychiatric comorbidity responded to the EQ-5D-VAS as a result of premorbid differences (eg, they were healthier prior to their ICU stay and perceived their survivor status more negatively). This may explain why we did not see a statistically significant difference between no psychiatric comorbidity and high psychiatric comorbidity groups on the EQ-5D-VAS. Nevertheless, we did see a difference between the low-moderate psychiatric comorbidity group on EQ-5D-VAS and differences between the no comorbidity and low-moderate comorbidity groups versus the high comorbidity group on the EQ-5D-3L. Finally, data about psychiatric history and QoL prior to ICU hospitalization were limited. Therefore, truly determining incidence versus prevalence of post-ICU comorbidities and whether psychiatric symptoms and its effects on QoL were due to ICU hospitalization or to premorbid psychiatric symptoms is difficult.
Our study demonstrated that in survivors of ICU delirium, higher comorbidity of psychiatric symptoms was associated with poorer QoL. Future studies will need to confirm these findings. We will also need to identify potentially reversible risk factors for psychiatric comorbidity and poorer QoL and develop treatments to effectively target the mental health symptoms of survivors of ICU delirium.
Disclosure
Grant support: The PMD trial is funded through the National Institutes of Health grant R01AG054205-02. SW is supported by NIA 2P30AG010133. AP is supported by CMS 1 L1 CMS331444-02-00, Indiana CTSI, and NIA R01AG054205-02. SG is supported by NIA 2P30AG010133, NIA 5R01AG045350, and NIA R01AG054205-02. SK is supported by NHBLI 5T32HL091816-07. MB is supported by NIA R01 AG040220-05, AHRQ P30 HS024384-02, CMS 1 L1 CMS331444-02-00, NIA R01 AG030618-05A1 and NIA R01AG054205-02. BK is supported by NIA K23-AG043476 and NHLBI R01HL131730. The funding agency had no role in the development of the study design, collection, analysis, interpretation of data, manuscript development, or the decision to submit the manuscript for publication. Conflicts of interest include MB, SG, and AP being funded by NIA R01AG054205-02 for the PMD study.
1. Jutte JE, Erb CT, Jackson JC. Physical, cognitive, and psychological disability following critical illness: what is the risk? Semin Respir Crit Care Med. 2015;36(6):943-958. PubMed
2. Nikayin S, Rabiee A, Hashem MD, et al. Anxiety symptoms in survivors of critical illness: a systematic review and meta-analysis. Gen Hosp Psychiatry. 2016;43:23-29. PubMed
3. Rabiee A, Nikayin S, Hashem MD, et al. Depressive symptoms after critical illness: a systematic review and meta-analysis. Crit Care Med. 2016;44(9):1744-1753. PubMed
4. Parker AM, Sricharoenchai T, Raparla S, Schneck KW, Bienvenu OJ, Needham DM. Posttraumatic stress disorder in critical illness survivors: a metaanalysis. Crit Care Med. 2015;43(5):1121-1129. PubMed
5. Bienvenu OJ, Colantuoni E, Mendez-Tellez PA, et al. Cooccurrence of and remission from general anxiety, depression, and posttraumatic stress disorder symptoms after acute lung injury: a 2-year longitudinal study. Crit Care Med. 2015;43(3):642-653. PubMed
6. Huang M, Parker AM, Bienvenu OJ, et al. Psychiatric Symptoms in Acute Respiratory Distress Syndrome Survivors: A 1-Year National Multicenter Study. Crit Care Med. 2016;44(5):954-965. PubMed
7. Abrams TE, Vaughan-Sarrazin M, Rosenthal GE. Influence of psychiatric comorbidity on surgical mortality. Arch Surg. 2010;145(10):947-953. PubMed
8. Campbell NL, Khan BA, Farber M, et al. Improving delirium care in the intensive care unit: the design of a pragmatic study. Trials. 2011;12:139. PubMed
9. EuroQol Group. EuroQol--a new facility for the measurement of health-related quality of life. Health Policy. 1990;16(3):199-208. PubMed
10. Hirschfeld RM. The comorbidity of major depression and anxiety disorders: recognition and management in primary care. Prim Care Companion J Clin Psychiatry. 2001;3(6):244–254. PubMed
11. Campbell DG, Felker BL, Liu CF, et al. Prevalence of depression–PTSD comorbidity: implications for clinical practice guidelines and primary care-based interventions. J Gen Intern Med. 2007;22(6):711–718. PubMed
12. Wolters AE, Peelen LM, Welling MC, et al. Long-term mental health problems after delirium in the ICU. Crit Care Med. 2016;44(10):1808-1813. PubMed
13. Kessler RC, Chiu WT, Demler O, Merikangas KR, Walters EE. Prevalence, severity, and comorbidity of 12-month DSM-IV disorders in the National Comorbidity Survey Replication. Arch Gen Psychiatry. 2005;62(6):617-627. PubMed
14. Mehlhorn J, Freytag A, Schmidt K, et al. Rehabilitation interventions for postintensive care syndrome: a systematic review. Crit Care Med. 2014;42(5):1263-1271. PubMed
15. Khan BA, Lasiter S, Boustani MA. CE: critical care recovery center: an innovative collaborative care model for ICU survivors. Am J Nurs. 2015;115(3):24-31. PubMed
© 2017 Society of Hospital Medicine
Outpatient Treatment of Deep Vein Thrombosis in the United States: The Reasons for Geographic and Racial Differences in Stroke Study
Venous thromboembolism (VTE) is a common medical condition comprising deep vein thrombosis (DVT) and pulmonary embolism (PE). Estimates of the incidence of DVT in the United States vary between 0.5 and 1.5 cases per 1000 person-years.1 Left untreated, roughly 50% of DVT patients progress to a PE, of whom 10% to 25% die within 3 months.2
Since the 1990s, multiple randomized controlled studies3-5 demonstrated the safety and efficacy of outpatient treatment for selected DVT patients with low molecular weight heparin and warfarin. The United States Food and Drug Administration approved enoxaparin, a low molecular weight heparin for outpatient use in 1998,6 and by the end of the decade, multiple treatment guidelines for VTE acknowledged the safety of outpatient treatment of DVT with low molecular weight heparin in selected patients.7-9 Recently, the approval of direct oral anticoagulants (DOACs) by the Food and Drug Administration allows an all-oral treatment regimen for VTE, which could further facilitate outpatient treatment of DVT.
Costs associated with treatment of VTE are enormous. For outpatient treatment, researchers differ on individual estimates of cost savings associated with outpatient DVT management, but most report a cost savings of several thousand dollars per patient treated as an outpatient compared with as an inpatient.6,10 Given the incidence of DVT, reducing costs while maintaining a high quality of care in even a small percentage of DVT patients would result in significant healthcare cost savings as well as increased convenience for patients.
Despite high-quality evidence supporting the efficacy and safety of outpatient DVT treatment, little is known about the adoption of outpatient DVT treatment in the United States. Several studies that have been published were limited to single hospitals and were small in size11,12 or limited to a cohort of patients already diagnosed with DVT.13
The purpose of this study was to report the frequency of outpatient treatment of DVT in the United States and describe patient characteristics associated with outpatient treatment. Information was gathered from The Reasons for Geographic and Racial Differences in Stroke (REGARDS) study, a contemporary cohort study of more than 30,000 patients residing in the contiguous United States with racial and geographic diversity. We hypothesized that an individual’s age, sex, race, region of residence, urban or rural residence, education level, and personal income would be associated with outpatient treatment. Results would allow the implementation of interventions to promote the appropriate use of outpatient treatment in order to reduce healthcare costs and increase patient convenience without compromising safety or efficacy of care.
METHODS
Cohort Characteristics
VTE events were ascertained in the REGARDS cohort, a prospective, longitudinal cohort study investigating the causes of racial and geographic disparities in stroke and cognitive decline.14 Between 2003 and 2007, there were 30,239 participants in the contiguous United States ≥45 years old enrolled in REGARDS. By design, 55% were female, 41% were black, the mean age was 65 years, and 56% lived in the southeastern United States. Participants were recruited from a commercial list by mail and telephone contact followed by verbal consent. A telephone interview was followed by an in-home examination, including obtaining written informed consent. On study entry, many participants had comorbid conditions, including 8% with reported atrial fibrillation, 56% receiving treatment for hypertension, 22% receiving treatment for diabetes, 3.7% taking warfarin, and 14% who were actively smoking.15,16 Participants were only excluded if they had active cancer, stated a self-reported race other than white or black, were unable to converse in English, had cognitive impairment as judged by the telephone interviewer, or were residing in or on the waiting list for a nursing home. Study methods were reviewed and approved by the institutional review boards at each study institution and have been published elsewhere.14
Event Ascertainment and Definitions
DVT event ascertainment is complete through 2011, with identification by telephone interview, review of reported hospitalizations, and review of deaths.17 Questionnaires in similar epidemiological studies have 98% specificity and >70% sensitivity for ascertaining VTE events.18 A research nurse reviewed the text and recorded each reported hospitalization through 2011. Any report of a blood clot in the legs, arms, or lungs was a potential case for physician review. Medical records were retrieved for up to 1 year before and 1 year after potential events. Retrieved records were used to help guide further record retrieval if they did not contain the primary VTE event. Primary inpatient and outpatient records including history and physical examinations, discharge summaries, imaging reports (to include limb ultrasounds, computed tomography scans, and magnetic resonance imaging), autopsies, and outpatient notes were retrieved using up to 3 attempts.19 Using all available information, characteristics of the VTE event and treatment were systematically recorded. For each potential VTE case, two of three physician reviewers abstracted medical records to validate and classify the event. If the physician reviewers disagreed, the third physician would review the case, and if VTE status remained uncertain, cases were discussed and resolved. Race was determined by participant self-report as black or white. Location of residence was defined by geocoding the addresses, and urban or rural status was defined by United States census tract data using rural-urban commuting area codes (RUCA; with rural areas being RUCA codes 4–10).20 Other risk factors were obtained through surveys, telephone interviews, or in-home visits.14
Outpatient treatment was defined as receiving a DVT diagnosis in an emergency department or ambulatory clinic but not receiving an overnight hospitalization. Inpatient treatment was defined as at least 1 overnight stay in a hospital (but not in an emergency department). Only participants admitted with a primary diagnosis of DVT were included in the analysis. If someone was noted to have DVT but was admitted to the hospital for another cause, he or she was not included in the analysis and classified as a hospital-associated DVT. A provoked DVT was defined as occurring within 90 days of a major trauma, surgery, or marked immobility or was associated with active cancer or treatment for cancer (ie, chemotherapy, radiotherapy, or surgical therapy), while an unprovoked DVT was defined as having none of the above provoking factors. A distal DVT was defined as a DVT occurring in the posterior tibial, anterior tibial, peroneal, or soleus sinuses. The primary outcome was DVT treated as an outpatient only without concurrent diagnosis of PE or VTE as a complication of hospitalization (as these individuals were not eligible for outpatient treatment at the time).
Statistical Analysis
Age, sex, race, region of residence (inside or outside the southeastern United States), education, income (determined as greater or less than $20,000 per year), and urban or rural status of residence were compared between DVT patients treated as outpatients and inpatients using χ2 analysis by inpatient or outpatient treatment. Univariable and multivariable logistic regression was then used to determine the odds ratio (OR) of receiving outpatient DVT treatment by the same variables with age per 10-year increment. ORs were adjusted for age, sex, race, year of DVT diagnosis, and region of residence as appropriate. Statistical significance was defined as P < 0.05. All statistical analyses were performed by N.A.Z. and conducted with SAS version 9.3 (SAS Institute, Cary, NC). All authors had access to the primary clinical data.
RESULTS
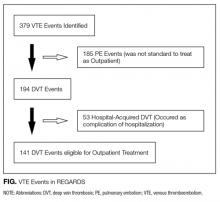
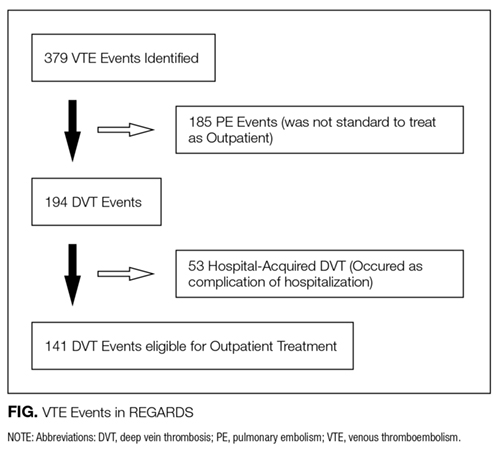
Over a mean of 4.7 years follow-up, 379 VTE events occurred (incident and recurrent); 185 were diagnosed with a PE, and 53 occurred as a complication of hospitalization (and were not eligible for outpatient treatment), leaving 141 DVT events potentially eligible for outpatient treatment out of a population of 29,556 participants with available records and follow-up in the cohort (Figure).
Of 141 DVT events, 39 (28%) were treated as outpatients. Table 1 presents the characteristics of participants treated as inpatients and as outpatients. Factors significantly associated with outpatient DVT treatment were younger age, female sex, white race, residing in an urban area, having a distal DVT only, and having a higher income. In the study, DVT events were recorded between 2003 and 2011; the median year of a diagnosed DVT and treated as an outpatient was 2009, while the median year of inpatient treatment was 2008. Living in the Southeast versus the rest of the country (P = 0.13) and having a high school education or greater (P = 0.07) were marginally associated with receiving outpatient treatment. In absolute terms, 11% of people living in rural areas and 19% of black patients had outpatient DVT treatment while 33% of the urban dwellers and 32% of white patients received outpatient treatment (Table 1). At the time of cohort enrollment, 92% of participants claimed to have insurance; however, this did not differentiate between Medicare, Medicaid, and private insurance. Only 1 participant diagnosed with DVT had an estimated glomerular filtration rate <30, and this individual was admitted for treatment.
Table 2 reports the multivariable adjusted OR for outpatient treatment of DVT adjusted for age, sex, race, region, and year of DVT diagnosis. Outpatient treatment of VTE was associated with younger age (OR 1.90; 95% confidence interval [CI], 1.19-3.02 for every 10 years younger in age), female sex (OR 2.41; 95% CI, 1.06-5.47), and white race (OR 3.29; 95% CI, 1.30-8.30). For each progressive calendar year in which the diagnosis was made, individuals had a 1.35-fold increase in their odds (95% CI, 1.03-1.77) of receiving outpatient treatment. Individuals living in urban areas were 4.16 (95% CI, 1.25-13.79) times more likely to receive outpatient treatment than those in rural areas. Living outside of the southeastern United States and having an income of more than $20,000 per year had increased, but nonsignificant, odds of being treated as outpatient (Table 2).
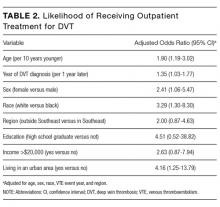
DISCUSSION

In this national, prospective, observational cohort study, only 28% of participants diagnosed with DVT were treated as outpatients versus being hospitalized. Urban area of residence, white race, female sex, and younger age were significantly associated with an increased odds of outpatient treatment. Groups that had particularly low outpatient treatment rates were rural dwellers and black participants, who had outpatient treatment rates of 11% and 19%, respectively. The odds of receiving outpatient treatment did improve over the course of the study, but in the last year of VTE assessment, outpatient treatment remained at 40%, but this was quite variable over the study years (being 8% two years prior).
The feasibility of outpatient treatment of DVTs requires a coordinated healthcare system and patient support to ensure education and appropriate anticoagulation monitoring. While not all DVTs should be treated as outpatients, differences in treatment location by sex, race, and residence point to potential healthcare disparities that increase the burden on patients and increase healthcare costs. Other studies have documented low outpatient treatment rates of DVTs (20% in 1 United States multicenter DVT registry) but have not discussed the associations of outpatient versus inpatient treatment.13 Outpatient treatment also appears to be underutilized in other developed countries; in the European Computerized Registry of Patients with Venous Thromboembolism, only 31% of DVT patients were treated on an outpatient basis between 2001 and 2011.21 To our knowledge, this is the first study to document the uptake of outpatient DVT treatment in the United States across multiple states, regions, and health systems well after the safety and efficacy of outpatient treatment of DVT was established by randomized controlled trials.3-5
The strengths of this study are that these data are derived from a contemporary cohort with a large geographic and racial distribution in the United States and are well characterized with a mean of 4.6 years follow-up.19 We are limited by a relatively small number of DVT events that were eligible for outpatient treatment (n = 141) and so may miss modest associations. Further, while the geographic scope of the cohort is a tremendous strength of our study, we may have missed some events and did not have complete record retrieval of reported events and could not assess access to healthcare in detail. These data were recorded before the use of DOACs became common. DOACs are an effective and safe alternative to conventional anticoagulation treatment for acute DVT.22 Their use might result in increased outpatient treatment, as they are not parenteral; however, cost considerations (~$400.00 per month), especially with high-deductible insurance plans, may limit their impact on VTE treatment location.23 This study cannot account for why the racial, sex, and urban–rural differences exist, and by extension if hospitalization rates differ due to associated comorbidities or if this represents a healthcare disparity. While it is reasonable from a healthcare perspective that younger individuals would more likely be treated as outpatients, there is no data to suggest that differences in DVT by sex, race, and residential location support decreased outpatient treatment. Due to the age of the cohort, most individuals had some form of insurance and a primary care provider. However, we were unable to assess the quality of insurance and the ease of access to their primary care providers. More research is needed to determine whether patients were hospitalized on medical grounds or because of a lack of coordinated healthcare systems to care for them as outpatients.
In conclusion, only a minority of patients who were potentially eligible for outpatient DVT treatment (28%) were treated as outpatients in this study, and there were significant racial and socioeconomic differences in who received inpatient and outpatient treatment. While outpatient treatment rates were below 40% in all groups, we identified groups with especially low likelihoods of receiving outpatient treatment. While all eligible individuals should be offered outpatient DVT treatment, these data highlight the need for specific efforts to overcome barriers to outpatient treatment in the elderly, rural areas, black patients, and men. Even modest increases in the rate of outpatient DVT treatment could result in substantial cost savings and increased patient convenience without compromising the efficacy or safety of medical care.
Acknowledgements
The authors thank the staff and participants of REGARDS for their important contributions. The executive committee of REGARDS reviewed and approved this manuscript for publication. This research project is supported by cooperative agreement U01 NS041588 from the National Institute of Neurological Disorders and Stroke, National Institutes of Health, Department of Health and Human Services. The content is solely the responsibility of the authors and does not necessarily represent the official views of the National Institute of Neurological Disorders and Stroke or the National Institutes of Health. Representatives of the funding agency have been involved in the review of the manuscript but not directly involved in the collection, management, analysis, or interpretation of the data. The authors thank the other investigators, the staff, and the participants of the REGARDS study for their valuable contributions. A full list of participating REGARDS investigators and institutions can be found at http://www.regardsstudy.org. Additional funding was provided by an investigator-initiated grant in aid from the American Recovery and Reinvestment Act grant RC1HL099460 from the National Heart, Lung, and Blood Institute. Work for the manuscript was supported in part by the Lake Champlain Cancer Research Organization (Burlington, Vermont).
Disclosure
The authors have no conflicts of interest to report.
1. Raskob GE, Angchaisuksiri P, Blanco A N, et al. Thrombosis: A major contributor to global disease burden. Thromb Res. 2014;134(5):931-938. doi:10.1016/j.thromres.2014.08.014. PubMed
2. Kearon C. Natural history of venous thromboembolism. Circulation. 2003;107(SUPPL. 23):22-31. doi:10.1161/01.CIR.0000078464.82671.78. PubMed
3. Koopman MM, Prandoni P, Piovella F, et al. Treatment of venous thrombosis with intravenous unfractionated heparin administered in the hospital as compared with subcutaneous low-molecular-weight heparin administered at home. The Tasman Study Group. N Engl J Med. 1996;334(11):682-687. doi:10.1056/NEJM199603143341102. PubMed
4. Prandoni P, Lensing AW, Büller HR, et al. Comparison of subcutaneous low-molecular-weight heparin with intravenous standard heparin in proximal deep-vein thrombosis. Lancet. 1992;339(8791):441-445. doi:10.1016/S0196-0644(05)81047-9. PubMed
5. Levine M, Gent M, Hirsh J, et al. A comparison of low-molecular-weight heparin administered primarily at home with unfractionated heparin administered in the hospital for proximal deep-vein thrombosis. N Engl J Med. 1996;334(11):677-681. doi:10.1056/NEJM199603143341101. PubMed
6. Segal JB, Bolger DT, Jenckes MW, et al. Outpatient therapy with low molecular weight heparin for the treatment of venous thromboembolism: a review of efficacy, safety, and costs. Am J Med. 2003;115(4):298-308. doi:10.1016/S0002-9343(03)00326-7. PubMed
7. Hyers TM, Agnelli G, Hull RD, et al. Antithrombotic therapy for venous thromboembolic disease. Chest. 2001;119(1 Suppl):176S-193S. PubMed
8. Hirsh J, Hoak J. Management of deep vein thrombosis and pulmonary embolism. A statement for healthcare professionals. Council on Thrombosis (in consultation with the Council on Cardiovascular Radiology), American Heart Association. Circulation. 1996;93(12):2212-2245. PubMed
9. Dunn AS, Coller B. Outpatient treatment of deep vein thrombosis: translating clinical trials into practice. Am J Med. 1999;106(6):660-669. PubMed
10. Spyropoulos AC, Lin J. Direct medical costs of venous thromboembolism and subsequent hospital readmission rates: an administrative claims analysis from 30 managed care organizations. J Manag Care Pharm. 2007;13(6):475-486. doi:2007(13)6: 475-486 [pii]. PubMed
11. Lee M, Pao D, Hsu T, Sonderskov A. Cost savings and effectiveness of outpatient treatment with low molecular weight heparin of deep vein thrombosis in a community hospital. Can J Clin Pharmacol. 2004;11(1):e17-e27. PubMed
12. Pearson SD, Blair R, Halpert A, Eddy E, Mckean S. An outpatient program to treat deep venous thrombosis with low-molecular-weight heparin. Eff Clin Pract. 1999;2(5):210-217. PubMed
13. Goldhaber SZ, Tapson VF. A prospective registry of 5,451 patients with ultrasound-confirmed deep vein thrombosis. Am J Cardiol. 2004;93(2):259-262. doi:10.1016/j.amjcard.2003.09.057. PubMed
14. Howard VJ, Cushman M, Pulley L, et al. The reasons for geographic and racial differences in stroke study: Objectives and design. Neuroepidemiology. 2005;25(3):135-143. doi:10.1159/000086678. PubMed
15. Meschia JF, Merrill P, Soliman EZ, et al. Racial disparities in awareness and treatment of atrial fibrillation: the REasons for Geographic and Racial Differences in Stroke (REGARDS) study. Stroke. 2010;41(4):581-587. doi:10.1161/STROKEAHA.109.573907. PubMed
16. Cushman M, Cantrell RA, McClure LA, et al. Estimated 10-year stroke risk by region and race in the United States: geographic and racial differences in stroke risk. Ann Neurol. 2008;64(5):507-513. doi:10.1002/ana.21493. PubMed
17. Wojcik NC, Huebner WW, Jorgensen G. Strategies for using the National Death Index and the Social Security Administration for death ascertainment in large occupational cohort mortality studies. Am J Epidemiol. 2010;172(4):469-477. doi:10.1093/aje/kwq130. PubMed
18. Frezzato M, Tosetto A, Rodeghiero F. Validated questionnaire for the identification of previous personal or familial venous thromboembolism. Am J Epidemiol. 1996;143(12):1257-1265. PubMed
19. Zakai NA, McClure LA, Judd SE, et al. Racial and regional differences in venous thromboembolism in the United States in 3 cohorts. Circulation. 2014;129(14):1502-1509. doi:10.1161/CIRCULATIONAHA.113.006472. PubMed
20. Morrill R, Cromartie J, Hart G. Metropolitan, Urban, and Rural Commuting Areas: Toward a Better Depiction of the United States Settlement System. Urban Geogr. 1999;20(8):727-748. doi:10.2747/0272-3638.20.8.727.
21. Lozano F, Trujillo-Santos J, Barrón M, et al. Home versus in-hospital treatment of outpatients with acute deep venous thrombosis of the lower limbs. J Vasc Surg. 2014;59(5):1362-1367.e1. doi:10.1016/j.jvs.2013.11.091. PubMed
22. Robertson L, Kesteven P, McCaslin JE. Oral direct thrombin inhibitors or oral factor Xa inhibitors for the treatment of deep vein thrombosis. Cochrane Database Syst Rev. 2015;6:CD010956. doi:10.1002/14651858.CD010956.pub2. PubMed
23. Cushman M. Treating Acute Venous Thromboembolism — Shift with Care A New Era in the Treatment of Amyloidosis ? N Engl J Med. 2013:29-30. doi:10.1056/NEJMe1307413.
Venous thromboembolism (VTE) is a common medical condition comprising deep vein thrombosis (DVT) and pulmonary embolism (PE). Estimates of the incidence of DVT in the United States vary between 0.5 and 1.5 cases per 1000 person-years.1 Left untreated, roughly 50% of DVT patients progress to a PE, of whom 10% to 25% die within 3 months.2
Since the 1990s, multiple randomized controlled studies3-5 demonstrated the safety and efficacy of outpatient treatment for selected DVT patients with low molecular weight heparin and warfarin. The United States Food and Drug Administration approved enoxaparin, a low molecular weight heparin for outpatient use in 1998,6 and by the end of the decade, multiple treatment guidelines for VTE acknowledged the safety of outpatient treatment of DVT with low molecular weight heparin in selected patients.7-9 Recently, the approval of direct oral anticoagulants (DOACs) by the Food and Drug Administration allows an all-oral treatment regimen for VTE, which could further facilitate outpatient treatment of DVT.
Costs associated with treatment of VTE are enormous. For outpatient treatment, researchers differ on individual estimates of cost savings associated with outpatient DVT management, but most report a cost savings of several thousand dollars per patient treated as an outpatient compared with as an inpatient.6,10 Given the incidence of DVT, reducing costs while maintaining a high quality of care in even a small percentage of DVT patients would result in significant healthcare cost savings as well as increased convenience for patients.
Despite high-quality evidence supporting the efficacy and safety of outpatient DVT treatment, little is known about the adoption of outpatient DVT treatment in the United States. Several studies that have been published were limited to single hospitals and were small in size11,12 or limited to a cohort of patients already diagnosed with DVT.13
The purpose of this study was to report the frequency of outpatient treatment of DVT in the United States and describe patient characteristics associated with outpatient treatment. Information was gathered from The Reasons for Geographic and Racial Differences in Stroke (REGARDS) study, a contemporary cohort study of more than 30,000 patients residing in the contiguous United States with racial and geographic diversity. We hypothesized that an individual’s age, sex, race, region of residence, urban or rural residence, education level, and personal income would be associated with outpatient treatment. Results would allow the implementation of interventions to promote the appropriate use of outpatient treatment in order to reduce healthcare costs and increase patient convenience without compromising safety or efficacy of care.
METHODS
Cohort Characteristics
VTE events were ascertained in the REGARDS cohort, a prospective, longitudinal cohort study investigating the causes of racial and geographic disparities in stroke and cognitive decline.14 Between 2003 and 2007, there were 30,239 participants in the contiguous United States ≥45 years old enrolled in REGARDS. By design, 55% were female, 41% were black, the mean age was 65 years, and 56% lived in the southeastern United States. Participants were recruited from a commercial list by mail and telephone contact followed by verbal consent. A telephone interview was followed by an in-home examination, including obtaining written informed consent. On study entry, many participants had comorbid conditions, including 8% with reported atrial fibrillation, 56% receiving treatment for hypertension, 22% receiving treatment for diabetes, 3.7% taking warfarin, and 14% who were actively smoking.15,16 Participants were only excluded if they had active cancer, stated a self-reported race other than white or black, were unable to converse in English, had cognitive impairment as judged by the telephone interviewer, or were residing in or on the waiting list for a nursing home. Study methods were reviewed and approved by the institutional review boards at each study institution and have been published elsewhere.14
Event Ascertainment and Definitions
DVT event ascertainment is complete through 2011, with identification by telephone interview, review of reported hospitalizations, and review of deaths.17 Questionnaires in similar epidemiological studies have 98% specificity and >70% sensitivity for ascertaining VTE events.18 A research nurse reviewed the text and recorded each reported hospitalization through 2011. Any report of a blood clot in the legs, arms, or lungs was a potential case for physician review. Medical records were retrieved for up to 1 year before and 1 year after potential events. Retrieved records were used to help guide further record retrieval if they did not contain the primary VTE event. Primary inpatient and outpatient records including history and physical examinations, discharge summaries, imaging reports (to include limb ultrasounds, computed tomography scans, and magnetic resonance imaging), autopsies, and outpatient notes were retrieved using up to 3 attempts.19 Using all available information, characteristics of the VTE event and treatment were systematically recorded. For each potential VTE case, two of three physician reviewers abstracted medical records to validate and classify the event. If the physician reviewers disagreed, the third physician would review the case, and if VTE status remained uncertain, cases were discussed and resolved. Race was determined by participant self-report as black or white. Location of residence was defined by geocoding the addresses, and urban or rural status was defined by United States census tract data using rural-urban commuting area codes (RUCA; with rural areas being RUCA codes 4–10).20 Other risk factors were obtained through surveys, telephone interviews, or in-home visits.14
Outpatient treatment was defined as receiving a DVT diagnosis in an emergency department or ambulatory clinic but not receiving an overnight hospitalization. Inpatient treatment was defined as at least 1 overnight stay in a hospital (but not in an emergency department). Only participants admitted with a primary diagnosis of DVT were included in the analysis. If someone was noted to have DVT but was admitted to the hospital for another cause, he or she was not included in the analysis and classified as a hospital-associated DVT. A provoked DVT was defined as occurring within 90 days of a major trauma, surgery, or marked immobility or was associated with active cancer or treatment for cancer (ie, chemotherapy, radiotherapy, or surgical therapy), while an unprovoked DVT was defined as having none of the above provoking factors. A distal DVT was defined as a DVT occurring in the posterior tibial, anterior tibial, peroneal, or soleus sinuses. The primary outcome was DVT treated as an outpatient only without concurrent diagnosis of PE or VTE as a complication of hospitalization (as these individuals were not eligible for outpatient treatment at the time).
Statistical Analysis
Age, sex, race, region of residence (inside or outside the southeastern United States), education, income (determined as greater or less than $20,000 per year), and urban or rural status of residence were compared between DVT patients treated as outpatients and inpatients using χ2 analysis by inpatient or outpatient treatment. Univariable and multivariable logistic regression was then used to determine the odds ratio (OR) of receiving outpatient DVT treatment by the same variables with age per 10-year increment. ORs were adjusted for age, sex, race, year of DVT diagnosis, and region of residence as appropriate. Statistical significance was defined as P < 0.05. All statistical analyses were performed by N.A.Z. and conducted with SAS version 9.3 (SAS Institute, Cary, NC). All authors had access to the primary clinical data.
RESULTS
Over a mean of 4.7 years follow-up, 379 VTE events occurred (incident and recurrent); 185 were diagnosed with a PE, and 53 occurred as a complication of hospitalization (and were not eligible for outpatient treatment), leaving 141 DVT events potentially eligible for outpatient treatment out of a population of 29,556 participants with available records and follow-up in the cohort (Figure).
Of 141 DVT events, 39 (28%) were treated as outpatients. Table 1 presents the characteristics of participants treated as inpatients and as outpatients. Factors significantly associated with outpatient DVT treatment were younger age, female sex, white race, residing in an urban area, having a distal DVT only, and having a higher income. In the study, DVT events were recorded between 2003 and 2011; the median year of a diagnosed DVT and treated as an outpatient was 2009, while the median year of inpatient treatment was 2008. Living in the Southeast versus the rest of the country (P = 0.13) and having a high school education or greater (P = 0.07) were marginally associated with receiving outpatient treatment. In absolute terms, 11% of people living in rural areas and 19% of black patients had outpatient DVT treatment while 33% of the urban dwellers and 32% of white patients received outpatient treatment (Table 1). At the time of cohort enrollment, 92% of participants claimed to have insurance; however, this did not differentiate between Medicare, Medicaid, and private insurance. Only 1 participant diagnosed with DVT had an estimated glomerular filtration rate <30, and this individual was admitted for treatment.
Table 2 reports the multivariable adjusted OR for outpatient treatment of DVT adjusted for age, sex, race, region, and year of DVT diagnosis. Outpatient treatment of VTE was associated with younger age (OR 1.90; 95% confidence interval [CI], 1.19-3.02 for every 10 years younger in age), female sex (OR 2.41; 95% CI, 1.06-5.47), and white race (OR 3.29; 95% CI, 1.30-8.30). For each progressive calendar year in which the diagnosis was made, individuals had a 1.35-fold increase in their odds (95% CI, 1.03-1.77) of receiving outpatient treatment. Individuals living in urban areas were 4.16 (95% CI, 1.25-13.79) times more likely to receive outpatient treatment than those in rural areas. Living outside of the southeastern United States and having an income of more than $20,000 per year had increased, but nonsignificant, odds of being treated as outpatient (Table 2).
DISCUSSION
In this national, prospective, observational cohort study, only 28% of participants diagnosed with DVT were treated as outpatients versus being hospitalized. Urban area of residence, white race, female sex, and younger age were significantly associated with an increased odds of outpatient treatment. Groups that had particularly low outpatient treatment rates were rural dwellers and black participants, who had outpatient treatment rates of 11% and 19%, respectively. The odds of receiving outpatient treatment did improve over the course of the study, but in the last year of VTE assessment, outpatient treatment remained at 40%, but this was quite variable over the study years (being 8% two years prior).
The feasibility of outpatient treatment of DVTs requires a coordinated healthcare system and patient support to ensure education and appropriate anticoagulation monitoring. While not all DVTs should be treated as outpatients, differences in treatment location by sex, race, and residence point to potential healthcare disparities that increase the burden on patients and increase healthcare costs. Other studies have documented low outpatient treatment rates of DVTs (20% in 1 United States multicenter DVT registry) but have not discussed the associations of outpatient versus inpatient treatment.13 Outpatient treatment also appears to be underutilized in other developed countries; in the European Computerized Registry of Patients with Venous Thromboembolism, only 31% of DVT patients were treated on an outpatient basis between 2001 and 2011.21 To our knowledge, this is the first study to document the uptake of outpatient DVT treatment in the United States across multiple states, regions, and health systems well after the safety and efficacy of outpatient treatment of DVT was established by randomized controlled trials.3-5
The strengths of this study are that these data are derived from a contemporary cohort with a large geographic and racial distribution in the United States and are well characterized with a mean of 4.6 years follow-up.19 We are limited by a relatively small number of DVT events that were eligible for outpatient treatment (n = 141) and so may miss modest associations. Further, while the geographic scope of the cohort is a tremendous strength of our study, we may have missed some events and did not have complete record retrieval of reported events and could not assess access to healthcare in detail. These data were recorded before the use of DOACs became common. DOACs are an effective and safe alternative to conventional anticoagulation treatment for acute DVT.22 Their use might result in increased outpatient treatment, as they are not parenteral; however, cost considerations (~$400.00 per month), especially with high-deductible insurance plans, may limit their impact on VTE treatment location.23 This study cannot account for why the racial, sex, and urban–rural differences exist, and by extension if hospitalization rates differ due to associated comorbidities or if this represents a healthcare disparity. While it is reasonable from a healthcare perspective that younger individuals would more likely be treated as outpatients, there is no data to suggest that differences in DVT by sex, race, and residential location support decreased outpatient treatment. Due to the age of the cohort, most individuals had some form of insurance and a primary care provider. However, we were unable to assess the quality of insurance and the ease of access to their primary care providers. More research is needed to determine whether patients were hospitalized on medical grounds or because of a lack of coordinated healthcare systems to care for them as outpatients.
In conclusion, only a minority of patients who were potentially eligible for outpatient DVT treatment (28%) were treated as outpatients in this study, and there were significant racial and socioeconomic differences in who received inpatient and outpatient treatment. While outpatient treatment rates were below 40% in all groups, we identified groups with especially low likelihoods of receiving outpatient treatment. While all eligible individuals should be offered outpatient DVT treatment, these data highlight the need for specific efforts to overcome barriers to outpatient treatment in the elderly, rural areas, black patients, and men. Even modest increases in the rate of outpatient DVT treatment could result in substantial cost savings and increased patient convenience without compromising the efficacy or safety of medical care.
Acknowledgements
The authors thank the staff and participants of REGARDS for their important contributions. The executive committee of REGARDS reviewed and approved this manuscript for publication. This research project is supported by cooperative agreement U01 NS041588 from the National Institute of Neurological Disorders and Stroke, National Institutes of Health, Department of Health and Human Services. The content is solely the responsibility of the authors and does not necessarily represent the official views of the National Institute of Neurological Disorders and Stroke or the National Institutes of Health. Representatives of the funding agency have been involved in the review of the manuscript but not directly involved in the collection, management, analysis, or interpretation of the data. The authors thank the other investigators, the staff, and the participants of the REGARDS study for their valuable contributions. A full list of participating REGARDS investigators and institutions can be found at http://www.regardsstudy.org. Additional funding was provided by an investigator-initiated grant in aid from the American Recovery and Reinvestment Act grant RC1HL099460 from the National Heart, Lung, and Blood Institute. Work for the manuscript was supported in part by the Lake Champlain Cancer Research Organization (Burlington, Vermont).
Disclosure
The authors have no conflicts of interest to report.
1. Raskob GE, Angchaisuksiri P, Blanco A N, et al. Thrombosis: A major contributor to global disease burden. Thromb Res. 2014;134(5):931-938. doi:10.1016/j.thromres.2014.08.014. PubMed
2. Kearon C. Natural history of venous thromboembolism. Circulation. 2003;107(SUPPL. 23):22-31. doi:10.1161/01.CIR.0000078464.82671.78. PubMed
3. Koopman MM, Prandoni P, Piovella F, et al. Treatment of venous thrombosis with intravenous unfractionated heparin administered in the hospital as compared with subcutaneous low-molecular-weight heparin administered at home. The Tasman Study Group. N Engl J Med. 1996;334(11):682-687. doi:10.1056/NEJM199603143341102. PubMed
4. Prandoni P, Lensing AW, Büller HR, et al. Comparison of subcutaneous low-molecular-weight heparin with intravenous standard heparin in proximal deep-vein thrombosis. Lancet. 1992;339(8791):441-445. doi:10.1016/S0196-0644(05)81047-9. PubMed
5. Levine M, Gent M, Hirsh J, et al. A comparison of low-molecular-weight heparin administered primarily at home with unfractionated heparin administered in the hospital for proximal deep-vein thrombosis. N Engl J Med. 1996;334(11):677-681. doi:10.1056/NEJM199603143341101. PubMed
6. Segal JB, Bolger DT, Jenckes MW, et al. Outpatient therapy with low molecular weight heparin for the treatment of venous thromboembolism: a review of efficacy, safety, and costs. Am J Med. 2003;115(4):298-308. doi:10.1016/S0002-9343(03)00326-7. PubMed
7. Hyers TM, Agnelli G, Hull RD, et al. Antithrombotic therapy for venous thromboembolic disease. Chest. 2001;119(1 Suppl):176S-193S. PubMed
8. Hirsh J, Hoak J. Management of deep vein thrombosis and pulmonary embolism. A statement for healthcare professionals. Council on Thrombosis (in consultation with the Council on Cardiovascular Radiology), American Heart Association. Circulation. 1996;93(12):2212-2245. PubMed
9. Dunn AS, Coller B. Outpatient treatment of deep vein thrombosis: translating clinical trials into practice. Am J Med. 1999;106(6):660-669. PubMed
10. Spyropoulos AC, Lin J. Direct medical costs of venous thromboembolism and subsequent hospital readmission rates: an administrative claims analysis from 30 managed care organizations. J Manag Care Pharm. 2007;13(6):475-486. doi:2007(13)6: 475-486 [pii]. PubMed
11. Lee M, Pao D, Hsu T, Sonderskov A. Cost savings and effectiveness of outpatient treatment with low molecular weight heparin of deep vein thrombosis in a community hospital. Can J Clin Pharmacol. 2004;11(1):e17-e27. PubMed
12. Pearson SD, Blair R, Halpert A, Eddy E, Mckean S. An outpatient program to treat deep venous thrombosis with low-molecular-weight heparin. Eff Clin Pract. 1999;2(5):210-217. PubMed
13. Goldhaber SZ, Tapson VF. A prospective registry of 5,451 patients with ultrasound-confirmed deep vein thrombosis. Am J Cardiol. 2004;93(2):259-262. doi:10.1016/j.amjcard.2003.09.057. PubMed
14. Howard VJ, Cushman M, Pulley L, et al. The reasons for geographic and racial differences in stroke study: Objectives and design. Neuroepidemiology. 2005;25(3):135-143. doi:10.1159/000086678. PubMed
15. Meschia JF, Merrill P, Soliman EZ, et al. Racial disparities in awareness and treatment of atrial fibrillation: the REasons for Geographic and Racial Differences in Stroke (REGARDS) study. Stroke. 2010;41(4):581-587. doi:10.1161/STROKEAHA.109.573907. PubMed
16. Cushman M, Cantrell RA, McClure LA, et al. Estimated 10-year stroke risk by region and race in the United States: geographic and racial differences in stroke risk. Ann Neurol. 2008;64(5):507-513. doi:10.1002/ana.21493. PubMed
17. Wojcik NC, Huebner WW, Jorgensen G. Strategies for using the National Death Index and the Social Security Administration for death ascertainment in large occupational cohort mortality studies. Am J Epidemiol. 2010;172(4):469-477. doi:10.1093/aje/kwq130. PubMed
18. Frezzato M, Tosetto A, Rodeghiero F. Validated questionnaire for the identification of previous personal or familial venous thromboembolism. Am J Epidemiol. 1996;143(12):1257-1265. PubMed
19. Zakai NA, McClure LA, Judd SE, et al. Racial and regional differences in venous thromboembolism in the United States in 3 cohorts. Circulation. 2014;129(14):1502-1509. doi:10.1161/CIRCULATIONAHA.113.006472. PubMed
20. Morrill R, Cromartie J, Hart G. Metropolitan, Urban, and Rural Commuting Areas: Toward a Better Depiction of the United States Settlement System. Urban Geogr. 1999;20(8):727-748. doi:10.2747/0272-3638.20.8.727.
21. Lozano F, Trujillo-Santos J, Barrón M, et al. Home versus in-hospital treatment of outpatients with acute deep venous thrombosis of the lower limbs. J Vasc Surg. 2014;59(5):1362-1367.e1. doi:10.1016/j.jvs.2013.11.091. PubMed
22. Robertson L, Kesteven P, McCaslin JE. Oral direct thrombin inhibitors or oral factor Xa inhibitors for the treatment of deep vein thrombosis. Cochrane Database Syst Rev. 2015;6:CD010956. doi:10.1002/14651858.CD010956.pub2. PubMed
23. Cushman M. Treating Acute Venous Thromboembolism — Shift with Care A New Era in the Treatment of Amyloidosis ? N Engl J Med. 2013:29-30. doi:10.1056/NEJMe1307413.
© 2017 Society of Hospital Medicine
Regional Variation in Standardized Costs of Care at Children’s Hospitals
With some areas of the country spending close to 3 times more on healthcare than others, regional variation in healthcare spending has been the focus of national attention.1-7 Since 1973, the Dartmouth Institute has studied regional variation in healthcare utilization and spending and concluded that variation is “unwarranted” because it is driven by providers’ practice patterns rather than differences in medical need, patient preferences, or evidence-based medicine.8-11 However, critics of the Dartmouth Institute’s findings argue that their approach does not adequately adjust for community-level income, and that higher costs in some areas reflect greater patient needs that are not reflected in illness acuity alone.12-14
While Medicare data have made it possible to study variations in spending for the senior population, fragmentation of insurance coverage and nonstandardized data structures make studying the pediatric population more difficult. However, the Children’s Hospital Association’s (CHA) Pediatric Health Information System (PHIS) has made large-scale comparisons more feasible. To overcome challenges associated with using charges and nonuniform cost data, PHIS-derived standardized costs provide new opportunities for comparisons.15,16 Initial analyses using PHIS data showed significant interhospital variations in costs of care,15 but they did not adjust for differences in populations and assess the drivers of variation. A more recent study that controlled for payer status, comorbidities, and illness severity found that intensive care unit (ICU) utilization varied significantly for children hospitalized for asthma, suggesting that hospital practice patterns drive differences in cost.17
This study uses PHIS data to analyze regional variations in standardized costs of care for 3 conditions for which children are hospitalized. To assess potential drivers of variation, the study investigates the effects of patient-level demographic and illness-severity variables as well as encounter-level variables on costs of care. It also estimates cost savings from reducing variation.
METHODS
Data Source
This retrospective cohort study uses the PHIS database (CHA, Overland Park, KS), which includes 48 freestanding children’s hospitals located in noncompeting markets across the United States and accounts for approximately 20% of pediatric hospitalizations. PHIS includes patient demographics, International Classification of Diseases, 9th Revision (ICD-9) diagnosis and procedure codes, as well as hospital charges. In addition to total charges, PHIS reports imaging, laboratory, pharmacy, and “other” charges. The “other” category aggregates clinical, supply, room, and nursing charges (including facility fees and ancillary staff services).
Inclusion Criteria
Inpatient- and observation-status hospitalizations for asthma, diabetic ketoacidosis (DKA), and acute gastroenteritis (AGE) at 46 PHIS hospitals from October 2014 to September 2015 were included. Two hospitals were excluded because of missing data. Hospitalizations for patients >18 years were excluded.
Hospitalizations were categorized by using All Patient Refined-Diagnosis Related Groups (APR-DRGs) version 24 (3M Health Information Systems, St. Paul, MN)18 based on the ICD-9 diagnosis and procedure codes assigned during the episode of care. Analyses included APR-DRG 141 (asthma), primary diagnosis ICD-9 codes 250.11 and 250.13 (DKA), and APR-DRG 249 (AGE). ICD-9 codes were used for DKA for increased specificity.19 These conditions were chosen to represent 3 clinical scenarios: (1) a diagnosis for which hospitals differ on whether certain aspects of care are provided in the ICU (asthma), (2) a diagnosis that frequently includes care in an ICU (DKA), and (3) a diagnosis that typically does not include ICU care (AGE).19
Study Design
To focus the analysis on variation in resource utilization across hospitals rather than variations in hospital item charges, each billed resource was assigned a standardized cost.15,16 For each clinical transaction code (CTC), the median unit cost was calculated for each hospital. The median of the hospital medians was defined as the standardized unit cost for that CTC.
The primary outcome variable was the total standardized cost for the hospitalization adjusted for patient-level demographic and illness-severity variables. Patient demographic and illness-severity covariates included age, race, gender, ZIP code-based median annual household income (HHI), rural-urban location, distance from home ZIP code to the hospital, chronic condition indicator (CCI), and severity-of-illness (SOI). When assessing drivers of variation, encounter-level covariates were added, including length of stay (LOS) in hours, ICU utilization, and 7-day readmission (an imprecise measure to account for quality of care during the index visit). The contribution of imaging, laboratory, pharmacy, and “other” costs was also considered.
Median annual HHI for patients’ home ZIP code was obtained from 2010 US Census data. Community-level HHI, a proxy for socioeconomic status (SES),20,21 was classified into categories based on the 2015 US federal poverty level (FPL) for a family of 422: HHI-1 = ≤ 1.5 × FPL; HHI-2 = 1.5 to 2 × FPL; HHI-3 = 2 to 3 × FPL; HHI-4 = ≥ 3 × FPL. Rural-urban commuting area (RUCA) codes were used to determine the rural-urban classification of the patient’s home.23 The distance from home ZIP code to the hospital was included as an additional control for illness severity because patients traveling longer distances are often more sick and require more resources.24
The Agency for Healthcare Research and Quality CCI classification system was used to identify the presence of a chronic condition.25 For asthma, CCI was flagged if the patient had a chronic condition other than asthma; for DKA, CCI was flagged if the patient had a chronic condition other than DKA; and for AGE, CCI was flagged if the patient had any chronic condition.
The APR-DRG system provides a 4-level SOI score with each APR-DRG category. Patient factors, such as comorbid diagnoses, are considered in severity scores generated through 3M’s proprietary algorithms.18
For the first analysis, the 46 hospitals were categorized into 7 geographic regions based on 2010 US Census Divisions.26 To overcome small hospital sample sizes, Mountain and Pacific were combined into West, and Middle Atlantic and New England were combined into North East. Because PHIS hospitals are located in noncompeting geographic regions, for the second analysis, we examined hospital-level variation (considering each hospital as its own region).
Data Analysis
To focus the analysis on “typical” patients and produce more robust estimates of central tendencies, the top and bottom 5% of hospitalizations with the most extreme standardized costs by condition were trimmed.27 Standardized costs were log-transformed because of their nonnormal distribution and analyzed by using linear mixed models. Covariates were added stepwise to assess the proportion of the variance explained by each predictor. Post-hoc tests with conservative single-step stepwise mutation model corrections for multiple testing were used to compare adjusted costs. Statistical analyses were performed using SAS version 9.3 (SAS Institute, Cary, NC). P values < 0.05 were considered significant. The Children’s Hospital of Philadelphia Institutional Review Board did not classify this study as human subjects research.
RESULTS
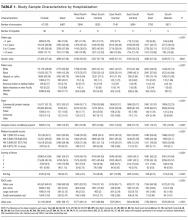

During the study period, there were 26,430 hospitalizations for asthma, 5056 for DKA, and 16,274 for AGE (Table 1).
Variation Across Census Regions
After adjusting for patient-level demographic and illness-severity variables, differences in adjusted total standardized costs remained between regions (P < 0.001). Although no region was an outlier compared to the overall mean for any of the conditions, regions were statistically different in pairwise comparison. The East North Central, South Atlantic, and West South Central regions had the highest adjusted total standardized costs for each of the conditions. The East South Central and West North Central regions had the lowest costs for each of the conditions. Adjusted total standardized costs were 120% higher for asthma ($1920 vs $4227), 46% higher for DKA ($7429 vs $10,881), and 150% higher for AGE ($3316 vs $8292) in the highest-cost region compared with the lowest-cost region (Table 2A).
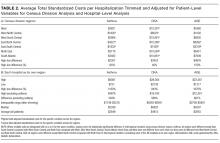
Variation Within Census Regions

After controlling for patient-level demographic and illness-severity variables, standardized costs were different across hospitals in the same region (P < 0.001; panel A in Figure). This was true for all conditions in each region. Differences between the lowest- and highest-cost hospitals within the same region ranged from 111% to 420% for asthma, 101% to 398% for DKA, and 166% to 787% for AGE (Table 3).
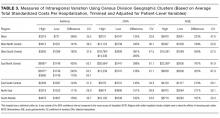
Variation Across Hospitals (Each Hospital as Its Own Region)
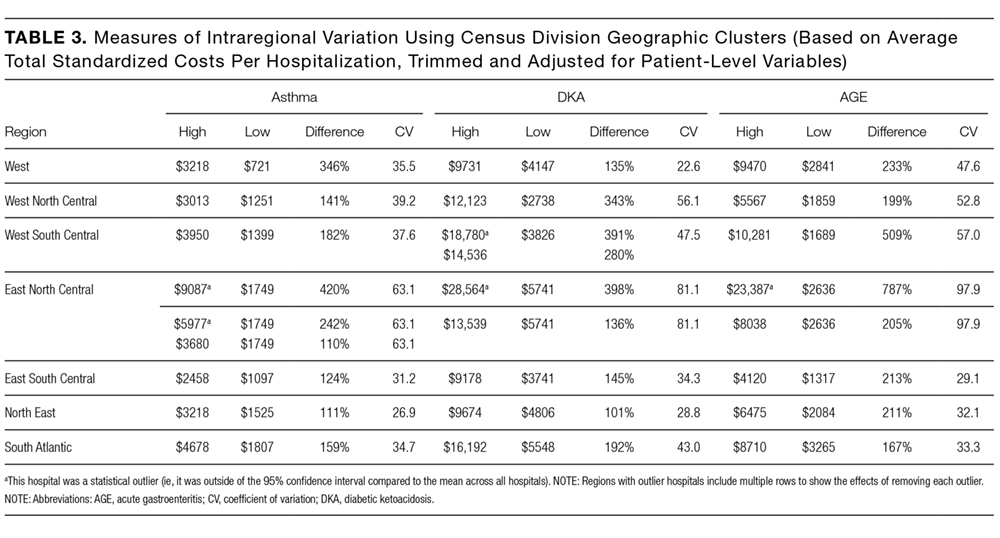
One hospital had the highest adjusted standardized costs for all 3 conditions ($9087 for asthma, $28,564 for DKA, and $23,387 for AGE) and was outside of the 95% confidence interval compared with the overall means. The second highest-cost hospitals for asthma ($5977) and AGE ($18,780) were also outside of the 95% confidence interval. After removing these outliers, the difference between the highest- and lowest-cost hospitals was 549% for asthma ($721 vs $4678), 491% for DKA ($2738 vs $16,192), and 681% for AGE ($1317 vs $10,281; Table 2B).
Drivers of Variation Across Census Regions
Patient-level demographic and illness-severity variables explained very little of the variation in standardized costs across regions. For each of the conditions, age, race, gender, community-level HHI, RUCA, and distance from home to the hospital each accounted for <1.5% of variation, while SOI and CCI each accounted for <5%. Overall, patient-level variables explained 5.5%, 3.7%, and 6.7% of variation for asthma, DKA, and AGE.
Encounter-level variables explained a much larger percentage of the variation in costs. LOS accounted for 17.8% of the variation for asthma, 9.8% for DKA, and 8.7% for AGE. ICU utilization explained 6.9% of the variation for asthma and 12.5% for DKA; ICU use was not a major driver for AGE. Seven-day readmissions accounted for <0.5% for each of the conditions. The combination of patient-level and encounter-level variables explained 27%, 24%, and 15% of the variation for asthma, DKA, and AGE.
Drivers of Variation Across Hospitals
For each of the conditions, patient-level demographic variables each accounted for <2% of variation in costs between hospitals. SOI accounted for 4.5% of the variation for asthma and CCI accounted for 5.2% for AGE. Overall, patient-level variables explained 6.9%, 5.3%, and 7.3% of variation for asthma, DKA, and AGE.
Encounter-level variables accounted for a much larger percentage of the variation in cost. LOS explained 25.4% for asthma, 13.3% for DKA, and 14.2% for AGE. ICU utilization accounted for 13.4% for asthma and 21.9% for DKA; ICU use was not a major driver for AGE. Seven-day readmissions accounted for <0.5% for each of the conditions. Together, patient-level and encounter-level variables explained 40%, 36%, and 22% of variation for asthma, DKA, and AGE.
Imaging, Laboratory, Pharmacy, and “Other” Costs
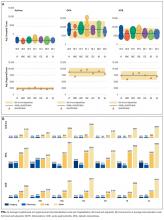
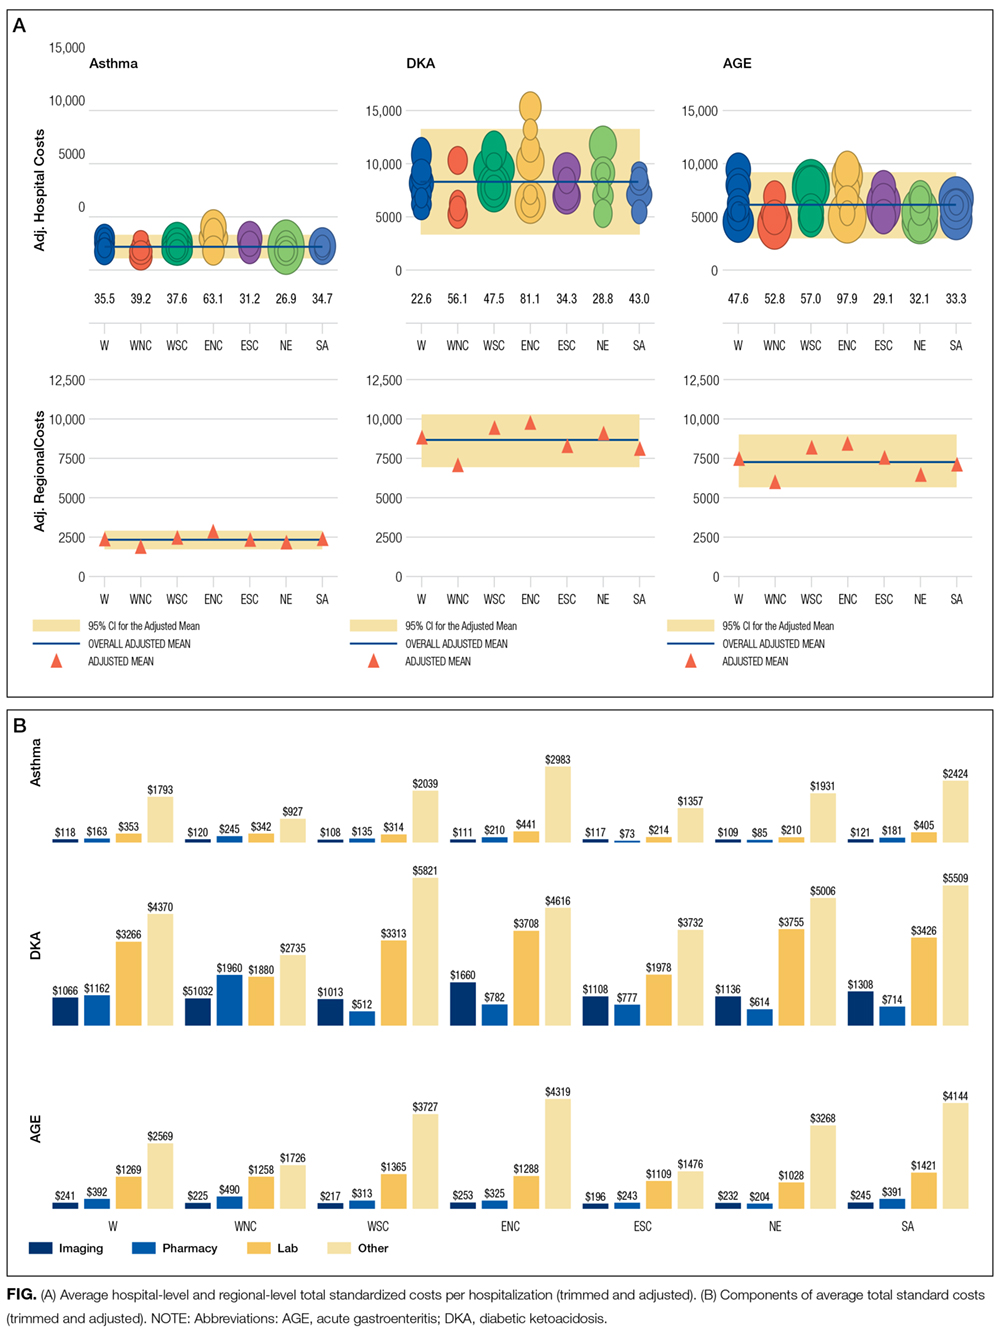
The largest contributor to total costs adjusted for patient-level factors for all conditions was “other,” which aggregates room, nursing, clinical, and supply charges (panel B in Figure). When considering drivers of variation, this category explained >50% for each of the conditions. The next largest contributor to total costs was laboratory charges, which accounted for 15% of the variation across regions for asthma and 11% for DKA. Differences in imaging accounted for 18% of the variation for DKA and 15% for AGE. Differences in pharmacy charges accounted for <4% of the variation for each of the conditions. Adding the 4 cost components to the other patient- and encounter-level covariates, the model explained 81%, 78%, and 72% of the variation across census regions for asthma, DKA, and AGE.
For the hospital-level analysis, differences in “other” remained the largest driver of cost variation. For asthma, “other” explained 61% of variation, while pharmacy, laboratory, and imaging each accounted for <8%. For DKA, differences in imaging accounted for 18% of the variation and laboratory charges accounted for 12%. For AGE, imaging accounted for 15% of the variation. Adding the 4 cost components to the other patient- and encounter-level covariates, the model explained 81%, 72%, and 67% of the variation for asthma, DKA, and AGE.
Cost Savings
If all hospitals in this cohort with adjusted standardized costs above the national PHIS average achieved costs equal to the national PHIS average, estimated annual savings in adjusted standardized costs for these 3 conditions would be $69.1 million. If each hospital with adjusted costs above the average within its census region achieved costs equal to its regional average, estimated annual savings in adjusted standardized costs for these conditions would be $25.2 million.
DISCUSSION
This study reported on the regional variation in costs of care for 3 conditions treated at 46 children’s hospitals across 7 geographic regions, and it demonstrated that variations in costs of care exist in pediatrics. This study used standardized costs to compare utilization patterns across hospitals and adjusted for several patient-level demographic and illness-severity factors, and it found that differences in costs of care for children hospitalized with asthma, DKA, and AGE remained both between and within regions.
These variations are noteworthy, as hospitals strive to improve the value of healthcare. If the higher-cost hospitals in this cohort could achieve costs equal to the national PHIS averages, estimated annual savings in adjusted standardized costs for these conditions alone would equal $69.1 million. If higher-cost hospitals relative to the average in their own region reduced costs to their regional averages, annual standardized cost savings could equal $25.2 million for these conditions.
The differences observed are also significant in that they provide a foundation for exploring whether lower-cost regions or lower-cost hospitals achieve comparable quality outcomes.28 If so, studying what those hospitals do to achieve outcomes more efficiently can serve as the basis for the establishment of best practices.29 Standardizing best practices through protocols, pathways, and care-model redesign can reduce potentially unnecessary spending.30
Our findings showed that patient-level demographic and illness-severity covariates, including community-level HHI and SOI, did not consistently explain cost differences. Instead, LOS and ICU utilization were associated with higher costs.17,19 When considering the effect of the 4 cost components on the variation in total standardized costs between regions and between hospitals, the fact that the “other” category accounted for the largest percent of the variation is not surprising, because the cost of room occupancy and nursing services increases with longer LOS and more time in the ICU. Other individual cost components that were major drivers of variation were laboratory utilization for asthma and imaging for DKA and AGE31 (though they accounted for a much smaller proportion of total adjusted costs).19
To determine if these factors are modifiable, more information is needed to explain why practices differ. Many factors may contribute to varying utilization patterns, including differences in capabilities and resources (in the hospital and in the community) and patient volumes. For example, some hospitals provide continuous albuterol for status asthmaticus only in ICUs, while others provide it on regular units.32 But if certain hospitals do not have adequate resources or volumes to effectively care for certain populations outside of the ICU, their higher-value approach (considering quality and cost) may be to utilize ICU beds, even if some other hospitals care for those patients on non-ICU floors. Another possibility is that family preferences about care delivery (such as how long children stay in the hospital) may vary across regions.33
Other evidence suggests that physician practice and spending patterns are strongly influenced by the practices of the region where they trained.34 Because physicians often practice close to where they trained,35,36 this may partially explain how regional patterns are reinforced.
Even considering all mentioned covariates, our model did not fully explain variation in standardized costs. After adding the cost components as covariates, between one-third and one-fifth of the variation remained unexplained. It is possible that this unexplained variation stemmed from unmeasured patient-level factors.
In addition, while proxies for SES, including community-level HHI, did not significantly predict differences in costs across regions, it is possible that SES affected LOS differently in different regions. Previous studies have suggested that lower SES is associated with longer LOS.37 If this effect is more pronounced in certain regions (potentially because of differences in social service infrastructures), SES may be contributing to variations in cost through LOS.
Our findings were subject to limitations. First, this study only examined 3 diagnoses and did not include surgical or less common conditions. Second, while PHIS includes tertiary care, academic, and freestanding children’s hospitals, it does not include general hospitals, which is where most pediatric patients receive care.38 Third, we used ZIP code-based median annual HHI to account for SES, and we used ZIP codes to determine the distance to the hospital and rural-urban location of patients’ homes. These approximations lack precision because SES and distances vary within ZIP codes.39 Fourth, while adjusted standardized costs allow for comparisons between hospitals, they do not represent actual costs to patients or individual hospitals. Additionally, when determining whether variation remained after controlling for patient-level variables, we included SOI as a reflection of illness-severity at presentation. However, in practice, SOI scores may be assigned partially based on factors determined during the hospitalization.18 Finally, the use of other regional boundaries or the selection of different hospitals may yield different results.
CONCLUSION
This study reveals regional variations in costs of care for 3 inpatient pediatric conditions. Future studies should explore whether lower-cost regions or lower-cost hospitals achieve comparable quality outcomes. To the extent that variation is driven by modifiable factors and lower spending does not compromise outcomes, these data may prompt reviews of care models to reduce unwarranted variation and improve the value of care delivery at local, regional, and national levels.
Disclosure
Internal funds from the CHA and The Children’s Hospital of Philadelphia supported the conduct of this work. The authors have no financial interests, relationships, or affiliations relevant to the subject matter or materials discussed in the manuscript to disclose. The authors have no potential conflicts of interest relevant to the subject matter or materials discussed in the manuscript to disclose
1. Fisher E, Skinner J. Making Sense of Geographic Variations in Health Care: The New IOM Report. 2013; http://healthaffairs.org/blog/2013/07/24/making-sense-of-geographic-variations-in-health-care-the-new-iom-report/. Accessed on April 11, 2014.
With some areas of the country spending close to 3 times more on healthcare than others, regional variation in healthcare spending has been the focus of national attention.1-7 Since 1973, the Dartmouth Institute has studied regional variation in healthcare utilization and spending and concluded that variation is “unwarranted” because it is driven by providers’ practice patterns rather than differences in medical need, patient preferences, or evidence-based medicine.8-11 However, critics of the Dartmouth Institute’s findings argue that their approach does not adequately adjust for community-level income, and that higher costs in some areas reflect greater patient needs that are not reflected in illness acuity alone.12-14
While Medicare data have made it possible to study variations in spending for the senior population, fragmentation of insurance coverage and nonstandardized data structures make studying the pediatric population more difficult. However, the Children’s Hospital Association’s (CHA) Pediatric Health Information System (PHIS) has made large-scale comparisons more feasible. To overcome challenges associated with using charges and nonuniform cost data, PHIS-derived standardized costs provide new opportunities for comparisons.15,16 Initial analyses using PHIS data showed significant interhospital variations in costs of care,15 but they did not adjust for differences in populations and assess the drivers of variation. A more recent study that controlled for payer status, comorbidities, and illness severity found that intensive care unit (ICU) utilization varied significantly for children hospitalized for asthma, suggesting that hospital practice patterns drive differences in cost.17
This study uses PHIS data to analyze regional variations in standardized costs of care for 3 conditions for which children are hospitalized. To assess potential drivers of variation, the study investigates the effects of patient-level demographic and illness-severity variables as well as encounter-level variables on costs of care. It also estimates cost savings from reducing variation.
METHODS
Data Source
This retrospective cohort study uses the PHIS database (CHA, Overland Park, KS), which includes 48 freestanding children’s hospitals located in noncompeting markets across the United States and accounts for approximately 20% of pediatric hospitalizations. PHIS includes patient demographics, International Classification of Diseases, 9th Revision (ICD-9) diagnosis and procedure codes, as well as hospital charges. In addition to total charges, PHIS reports imaging, laboratory, pharmacy, and “other” charges. The “other” category aggregates clinical, supply, room, and nursing charges (including facility fees and ancillary staff services).
Inclusion Criteria
Inpatient- and observation-status hospitalizations for asthma, diabetic ketoacidosis (DKA), and acute gastroenteritis (AGE) at 46 PHIS hospitals from October 2014 to September 2015 were included. Two hospitals were excluded because of missing data. Hospitalizations for patients >18 years were excluded.
Hospitalizations were categorized by using All Patient Refined-Diagnosis Related Groups (APR-DRGs) version 24 (3M Health Information Systems, St. Paul, MN)18 based on the ICD-9 diagnosis and procedure codes assigned during the episode of care. Analyses included APR-DRG 141 (asthma), primary diagnosis ICD-9 codes 250.11 and 250.13 (DKA), and APR-DRG 249 (AGE). ICD-9 codes were used for DKA for increased specificity.19 These conditions were chosen to represent 3 clinical scenarios: (1) a diagnosis for which hospitals differ on whether certain aspects of care are provided in the ICU (asthma), (2) a diagnosis that frequently includes care in an ICU (DKA), and (3) a diagnosis that typically does not include ICU care (AGE).19
Study Design
To focus the analysis on variation in resource utilization across hospitals rather than variations in hospital item charges, each billed resource was assigned a standardized cost.15,16 For each clinical transaction code (CTC), the median unit cost was calculated for each hospital. The median of the hospital medians was defined as the standardized unit cost for that CTC.
The primary outcome variable was the total standardized cost for the hospitalization adjusted for patient-level demographic and illness-severity variables. Patient demographic and illness-severity covariates included age, race, gender, ZIP code-based median annual household income (HHI), rural-urban location, distance from home ZIP code to the hospital, chronic condition indicator (CCI), and severity-of-illness (SOI). When assessing drivers of variation, encounter-level covariates were added, including length of stay (LOS) in hours, ICU utilization, and 7-day readmission (an imprecise measure to account for quality of care during the index visit). The contribution of imaging, laboratory, pharmacy, and “other” costs was also considered.
Median annual HHI for patients’ home ZIP code was obtained from 2010 US Census data. Community-level HHI, a proxy for socioeconomic status (SES),20,21 was classified into categories based on the 2015 US federal poverty level (FPL) for a family of 422: HHI-1 = ≤ 1.5 × FPL; HHI-2 = 1.5 to 2 × FPL; HHI-3 = 2 to 3 × FPL; HHI-4 = ≥ 3 × FPL. Rural-urban commuting area (RUCA) codes were used to determine the rural-urban classification of the patient’s home.23 The distance from home ZIP code to the hospital was included as an additional control for illness severity because patients traveling longer distances are often more sick and require more resources.24
The Agency for Healthcare Research and Quality CCI classification system was used to identify the presence of a chronic condition.25 For asthma, CCI was flagged if the patient had a chronic condition other than asthma; for DKA, CCI was flagged if the patient had a chronic condition other than DKA; and for AGE, CCI was flagged if the patient had any chronic condition.
The APR-DRG system provides a 4-level SOI score with each APR-DRG category. Patient factors, such as comorbid diagnoses, are considered in severity scores generated through 3M’s proprietary algorithms.18
For the first analysis, the 46 hospitals were categorized into 7 geographic regions based on 2010 US Census Divisions.26 To overcome small hospital sample sizes, Mountain and Pacific were combined into West, and Middle Atlantic and New England were combined into North East. Because PHIS hospitals are located in noncompeting geographic regions, for the second analysis, we examined hospital-level variation (considering each hospital as its own region).
Data Analysis
To focus the analysis on “typical” patients and produce more robust estimates of central tendencies, the top and bottom 5% of hospitalizations with the most extreme standardized costs by condition were trimmed.27 Standardized costs were log-transformed because of their nonnormal distribution and analyzed by using linear mixed models. Covariates were added stepwise to assess the proportion of the variance explained by each predictor. Post-hoc tests with conservative single-step stepwise mutation model corrections for multiple testing were used to compare adjusted costs. Statistical analyses were performed using SAS version 9.3 (SAS Institute, Cary, NC). P values < 0.05 were considered significant. The Children’s Hospital of Philadelphia Institutional Review Board did not classify this study as human subjects research.
RESULTS
During the study period, there were 26,430 hospitalizations for asthma, 5056 for DKA, and 16,274 for AGE (Table 1).
Variation Across Census Regions
After adjusting for patient-level demographic and illness-severity variables, differences in adjusted total standardized costs remained between regions (P < 0.001). Although no region was an outlier compared to the overall mean for any of the conditions, regions were statistically different in pairwise comparison. The East North Central, South Atlantic, and West South Central regions had the highest adjusted total standardized costs for each of the conditions. The East South Central and West North Central regions had the lowest costs for each of the conditions. Adjusted total standardized costs were 120% higher for asthma ($1920 vs $4227), 46% higher for DKA ($7429 vs $10,881), and 150% higher for AGE ($3316 vs $8292) in the highest-cost region compared with the lowest-cost region (Table 2A).
Variation Within Census Regions
After controlling for patient-level demographic and illness-severity variables, standardized costs were different across hospitals in the same region (P < 0.001; panel A in Figure). This was true for all conditions in each region. Differences between the lowest- and highest-cost hospitals within the same region ranged from 111% to 420% for asthma, 101% to 398% for DKA, and 166% to 787% for AGE (Table 3).
Variation Across Hospitals (Each Hospital as Its Own Region)
One hospital had the highest adjusted standardized costs for all 3 conditions ($9087 for asthma, $28,564 for DKA, and $23,387 for AGE) and was outside of the 95% confidence interval compared with the overall means. The second highest-cost hospitals for asthma ($5977) and AGE ($18,780) were also outside of the 95% confidence interval. After removing these outliers, the difference between the highest- and lowest-cost hospitals was 549% for asthma ($721 vs $4678), 491% for DKA ($2738 vs $16,192), and 681% for AGE ($1317 vs $10,281; Table 2B).
Drivers of Variation Across Census Regions
Patient-level demographic and illness-severity variables explained very little of the variation in standardized costs across regions. For each of the conditions, age, race, gender, community-level HHI, RUCA, and distance from home to the hospital each accounted for <1.5% of variation, while SOI and CCI each accounted for <5%. Overall, patient-level variables explained 5.5%, 3.7%, and 6.7% of variation for asthma, DKA, and AGE.
Encounter-level variables explained a much larger percentage of the variation in costs. LOS accounted for 17.8% of the variation for asthma, 9.8% for DKA, and 8.7% for AGE. ICU utilization explained 6.9% of the variation for asthma and 12.5% for DKA; ICU use was not a major driver for AGE. Seven-day readmissions accounted for <0.5% for each of the conditions. The combination of patient-level and encounter-level variables explained 27%, 24%, and 15% of the variation for asthma, DKA, and AGE.
Drivers of Variation Across Hospitals
For each of the conditions, patient-level demographic variables each accounted for <2% of variation in costs between hospitals. SOI accounted for 4.5% of the variation for asthma and CCI accounted for 5.2% for AGE. Overall, patient-level variables explained 6.9%, 5.3%, and 7.3% of variation for asthma, DKA, and AGE.
Encounter-level variables accounted for a much larger percentage of the variation in cost. LOS explained 25.4% for asthma, 13.3% for DKA, and 14.2% for AGE. ICU utilization accounted for 13.4% for asthma and 21.9% for DKA; ICU use was not a major driver for AGE. Seven-day readmissions accounted for <0.5% for each of the conditions. Together, patient-level and encounter-level variables explained 40%, 36%, and 22% of variation for asthma, DKA, and AGE.
Imaging, Laboratory, Pharmacy, and “Other” Costs
The largest contributor to total costs adjusted for patient-level factors for all conditions was “other,” which aggregates room, nursing, clinical, and supply charges (panel B in Figure). When considering drivers of variation, this category explained >50% for each of the conditions. The next largest contributor to total costs was laboratory charges, which accounted for 15% of the variation across regions for asthma and 11% for DKA. Differences in imaging accounted for 18% of the variation for DKA and 15% for AGE. Differences in pharmacy charges accounted for <4% of the variation for each of the conditions. Adding the 4 cost components to the other patient- and encounter-level covariates, the model explained 81%, 78%, and 72% of the variation across census regions for asthma, DKA, and AGE.
For the hospital-level analysis, differences in “other” remained the largest driver of cost variation. For asthma, “other” explained 61% of variation, while pharmacy, laboratory, and imaging each accounted for <8%. For DKA, differences in imaging accounted for 18% of the variation and laboratory charges accounted for 12%. For AGE, imaging accounted for 15% of the variation. Adding the 4 cost components to the other patient- and encounter-level covariates, the model explained 81%, 72%, and 67% of the variation for asthma, DKA, and AGE.
Cost Savings
If all hospitals in this cohort with adjusted standardized costs above the national PHIS average achieved costs equal to the national PHIS average, estimated annual savings in adjusted standardized costs for these 3 conditions would be $69.1 million. If each hospital with adjusted costs above the average within its census region achieved costs equal to its regional average, estimated annual savings in adjusted standardized costs for these conditions would be $25.2 million.
DISCUSSION
This study reported on the regional variation in costs of care for 3 conditions treated at 46 children’s hospitals across 7 geographic regions, and it demonstrated that variations in costs of care exist in pediatrics. This study used standardized costs to compare utilization patterns across hospitals and adjusted for several patient-level demographic and illness-severity factors, and it found that differences in costs of care for children hospitalized with asthma, DKA, and AGE remained both between and within regions.
These variations are noteworthy, as hospitals strive to improve the value of healthcare. If the higher-cost hospitals in this cohort could achieve costs equal to the national PHIS averages, estimated annual savings in adjusted standardized costs for these conditions alone would equal $69.1 million. If higher-cost hospitals relative to the average in their own region reduced costs to their regional averages, annual standardized cost savings could equal $25.2 million for these conditions.
The differences observed are also significant in that they provide a foundation for exploring whether lower-cost regions or lower-cost hospitals achieve comparable quality outcomes.28 If so, studying what those hospitals do to achieve outcomes more efficiently can serve as the basis for the establishment of best practices.29 Standardizing best practices through protocols, pathways, and care-model redesign can reduce potentially unnecessary spending.30
Our findings showed that patient-level demographic and illness-severity covariates, including community-level HHI and SOI, did not consistently explain cost differences. Instead, LOS and ICU utilization were associated with higher costs.17,19 When considering the effect of the 4 cost components on the variation in total standardized costs between regions and between hospitals, the fact that the “other” category accounted for the largest percent of the variation is not surprising, because the cost of room occupancy and nursing services increases with longer LOS and more time in the ICU. Other individual cost components that were major drivers of variation were laboratory utilization for asthma and imaging for DKA and AGE31 (though they accounted for a much smaller proportion of total adjusted costs).19
To determine if these factors are modifiable, more information is needed to explain why practices differ. Many factors may contribute to varying utilization patterns, including differences in capabilities and resources (in the hospital and in the community) and patient volumes. For example, some hospitals provide continuous albuterol for status asthmaticus only in ICUs, while others provide it on regular units.32 But if certain hospitals do not have adequate resources or volumes to effectively care for certain populations outside of the ICU, their higher-value approach (considering quality and cost) may be to utilize ICU beds, even if some other hospitals care for those patients on non-ICU floors. Another possibility is that family preferences about care delivery (such as how long children stay in the hospital) may vary across regions.33
Other evidence suggests that physician practice and spending patterns are strongly influenced by the practices of the region where they trained.34 Because physicians often practice close to where they trained,35,36 this may partially explain how regional patterns are reinforced.
Even considering all mentioned covariates, our model did not fully explain variation in standardized costs. After adding the cost components as covariates, between one-third and one-fifth of the variation remained unexplained. It is possible that this unexplained variation stemmed from unmeasured patient-level factors.
In addition, while proxies for SES, including community-level HHI, did not significantly predict differences in costs across regions, it is possible that SES affected LOS differently in different regions. Previous studies have suggested that lower SES is associated with longer LOS.37 If this effect is more pronounced in certain regions (potentially because of differences in social service infrastructures), SES may be contributing to variations in cost through LOS.
Our findings were subject to limitations. First, this study only examined 3 diagnoses and did not include surgical or less common conditions. Second, while PHIS includes tertiary care, academic, and freestanding children’s hospitals, it does not include general hospitals, which is where most pediatric patients receive care.38 Third, we used ZIP code-based median annual HHI to account for SES, and we used ZIP codes to determine the distance to the hospital and rural-urban location of patients’ homes. These approximations lack precision because SES and distances vary within ZIP codes.39 Fourth, while adjusted standardized costs allow for comparisons between hospitals, they do not represent actual costs to patients or individual hospitals. Additionally, when determining whether variation remained after controlling for patient-level variables, we included SOI as a reflection of illness-severity at presentation. However, in practice, SOI scores may be assigned partially based on factors determined during the hospitalization.18 Finally, the use of other regional boundaries or the selection of different hospitals may yield different results.
CONCLUSION
This study reveals regional variations in costs of care for 3 inpatient pediatric conditions. Future studies should explore whether lower-cost regions or lower-cost hospitals achieve comparable quality outcomes. To the extent that variation is driven by modifiable factors and lower spending does not compromise outcomes, these data may prompt reviews of care models to reduce unwarranted variation and improve the value of care delivery at local, regional, and national levels.
Disclosure
Internal funds from the CHA and The Children’s Hospital of Philadelphia supported the conduct of this work. The authors have no financial interests, relationships, or affiliations relevant to the subject matter or materials discussed in the manuscript to disclose. The authors have no potential conflicts of interest relevant to the subject matter or materials discussed in the manuscript to disclose
1. Fisher E, Skinner J. Making Sense of Geographic Variations in Health Care: The New IOM Report. 2013; http://healthaffairs.org/blog/2013/07/24/making-sense-of-geographic-variations-in-health-care-the-new-iom-report/. Accessed on April 11, 2014.
1. Fisher E, Skinner J. Making Sense of Geographic Variations in Health Care: The New IOM Report. 2013; http://healthaffairs.org/blog/2013/07/24/making-sense-of-geographic-variations-in-health-care-the-new-iom-report/. Accessed on April 11, 2014.
© 2017 Society of Hospital Medicine
A Concise Tool for Measuring Care Coordination from the Provider’s Perspective in the Hospital Setting
Care Coordination has been defined as “…the deliberate organization of patient care activities between two or more participants (including the patient) involved in a patient’s care to facilitate the appropriate delivery of healthcare services.”1 The Institute of Medicine identified care coordination as a key strategy to improve the American healthcare system,2 and evidence has been building that well-coordinated care improves patient outcomes and reduces healthcare costs associated with chronic conditions.3-5 In 2012, Johns Hopkins Medicine was awarded a Healthcare Innovation Award by the Centers for Medicare & Medicaid Services to improve coordination of care across the continuum of care for adult patients admitted to Johns Hopkins Hospital (JHH) and Johns Hopkins Bayview Medical Center (JHBMC), and for high-risk low-income Medicare and Medicaid beneficiaries receiving ambulatory care in targeted zip codes. The purpose of this project, known as the Johns Hopkins Community Health Partnership (J-CHiP), was to improve health and healthcare and to reduce healthcare costs. The acute care component of the program consisted of a bundle of interventions focused on improving coordination of care for all patients, including a “bridge to home” discharge process, as they transitioned back to the community from inpatient admission. The bundle included the following: early screening for discharge planning to predict needed postdischarge services; discussion in daily multidisciplinary rounds about goals and priorities of the hospitalization and potential postdischarge needs; patient and family self-care management; education enhanced medication management, including the option of “medications in hand” at the time of discharge; postdischarge telephone follow-up by nurses; and, for patients identified as high-risk, a “transition guide” (a nurse who works with the patient via home visits and by phone to optimize compliance with care for 30 days postdischarge).6 While the primary endpoints of the J-CHiP program were to improve clinical outcomes and reduce healthcare costs, we were also interested in the impact of the program on care coordination processes in the acute care setting. This created the need for an instrument to measure healthcare professionals’ views of care coordination in their immediate work environments.
We began our search for existing measures by reviewing the Coordination Measures Atlas published in 2014.7 Although this report evaluates over 80 different measures of care coordination, most of them focus on the perspective of the patient and/or family members, on specific conditions, and on primary care or outpatient settings.7,8 We were unable to identify an existing measure from the provider perspective, designed for the inpatient setting, that was both brief but comprehensive enough to cover a range of care coordination domains.8
Consequently, our first aim was to develop a brief, comprehensive tool to measure care coordination from the perspective of hospital inpatient staff that could be used to compare different units or types of providers, or to conduct longitudinal assessment. The second aim was to conduct a preliminary evaluation of the tool in our healthcare setting, including to assess its psychometric properties, to describe provider perceptions of care coordination after the implementation of J-CHiP, and to explore potential differences among departments, types of professionals, and between the 2 hospitals.
METHODS
Development of the Care Coordination Questionnaire
The survey was developed in collaboration with leaders of the J-CHiP Acute Care Team. We met at the outset and on multiple subsequent occasions to align survey domains with the main components of the J-CHiP acute care intervention and to assure that the survey would be relevant and understandable to a variety of multidisciplinary professionals, including physicians, nurses, social workers, physical therapists, and other health professionals. Care was taken to avoid redundancy with existing evaluation efforts and to minimize respondent burden. This process helped to ensure the content validity of the items, the usefulness of the results, and the future usability of the tool.
We modeled the Care Coordination Questionnaire (CCQ) after the Safety Attitudes Questionnaire (SAQ),9 a widely used survey that is deployed approximately annually at JHH and JHBMC. While the SAQ focuses on healthcare provider attitudes about issues relevant to patient safety (often referred to as safety climate or safety culture), this new tool was designed to focus on healthcare professionals’ attitudes about care coordination. Similar to the way that the SAQ “elicits a snapshot of the safety climate through surveys of frontline worker perceptions,” we sought to elicit a picture of our care coordination climate through a survey of frontline hospital staff.
The CCQ was built upon the domains and approaches to care coordination described in the Agency for Healthcare Research and Quality Care Coordination Atlas.3 This report identifies 9 mechanisms for achieving care coordination, including the following: Establish Accountability or Negotiate Responsibility; Communicate; Facilitate Transitions; Assess Needs and Goals; Create a Proactive Plan of Care; Monitor, Follow Up, and Respond to Change; Support Self-Management Goals; Link to Community Resources; and Align Resources with Patient and Population Needs; as well as 5 broad approaches commonly used to improve the delivery of healthcare, including Teamwork Focused on Coordination, Healthcare Home, Care Management, Medication Management, and Health IT-Enabled Coordination.7 We generated at least 1 item to represent 8 of the 9 domains, as well as the broad approach described as Teamwork Focused on Coordination. After developing an initial set of items, we sought input from 3 senior leaders of the J-CHiP Acute Care Team to determine if the items covered the care coordination domains of interest, and to provide feedback on content validity. To test the interpretability of survey items and consistency across professional groups, we sent an initial version of the survey questions to at least 1 person from each of the following professional groups: hospitalist, social worker, case manager, clinical pharmacist, and nurse. We asked them to review all of our survey questions and to provide us with feedback on all aspects of the questions, such as whether they believed the questions were relevant and understandable to the members of their professional discipline, the appropriateness of the wording of the questions, and other comments. Modifications were made to the content and wording of the questions based on the feedback received. The final draft of the questionnaire was reviewed by the leadership team of the J-CHiP Acute Care Team to ensure its usefulness in providing actionable information.
The resulting 12-item questionnaire used a 5-point Likert response scale ranging from 1 = “disagree strongly” to 5 = “agree strongly,” and an additional option of “not applicable (N/A).” To help assess construct validity, a global question was added at the end of the questionnaire asking, “Overall, how would you rate the care coordination at the hospital of your primary work setting?” The response was measured on a 10-point Likert-type scale ranging from 1 = “totally uncoordinated care” to 10 = “perfectly coordinated care” (see Appendix). In addition, the questionnaire requested information about the respondents’ gender, position, and their primary unit, department, and hospital affiliation.
Data Collection Procedures
An invitation to complete an anonymous questionnaire was sent to the following inpatient care professionals: all nursing staff working on care coordination units in the departments of medicine, surgery, and neurology/neurosurgery, as well as physicians, pharmacists, acute care therapists (eg, occupational and physical therapists), and other frontline staff. All healthcare staff fitting these criteria was sent an e-mail with a request to fill out the survey online using QualtricsTM (Qualtrics Labs Inc., Provo, UT), as well as multiple follow-up reminders. The participants worked either at the JHH (a 1194-bed tertiary academic medical center in Baltimore, MD) or the JHBMC (a 440-bed academic community hospital located nearby). Data were collected from October 2015 through January 2016.
Analysis
Means and standard deviations were calculated by treating the responses as continuous variables. We tried 3 different methods to handle missing data: (1) without imputation, (2) imputing the mean value of each item, and (3) substituting a neutral score. Because all 3 methods produced very similar results, we treated the N/A responses as missing values without imputation for simplicity of analysis. We used STATA 13.1 (Stata Corporation, College Station, Texas) to analyze the data.
To identify subscales, we performed exploratory factor analysis on responses to the 12 specific items. Promax rotation was selected based on the simple structure. Subscale scores for each respondent were generated by computing the mean of responses to the items in the subscale. Internal consistency reliability of the subscales was estimated using Cronbach’s alpha. We calculated Pearson correlation coefficients for the items in each subscale, and examined Cronbach’s alpha deleting each item in turn. For each of the subscales identified and the global scale, we calculated the mean, standard deviation, median and interquartile range. Although distributions of scores tended to be non-normal, this was done to increase interpretability. We also calculated percent scoring at the ceiling (highest possible score).
We analyzed the data with 3 research questions in mind: Was there a difference in perceptions of care coordination between (1) staff affiliated with the 2 different hospitals, (2) staff affiliated with different clinical departments, or (3) staff with different professional roles? For comparisons based on hospital and department, and type of professional, nonparametric tests (Wilcoxon rank-sum and Kruskal-Wallis test) were used with a level of statistical significance set at 0.05. The comparison between hospitals and departments was made only among nurses to minimize the confounding effect of different distribution of professionals. We tested the distribution of “years in specialty” between hospitals and departments for this comparison using Pearson’s χ2 test. The difference was not statistically significant (P = 0.167 for hospitals, and P = 0.518 for departments), so we assumed that the potential confounding effect of this variable was negligible in this analysis. The comparison of scores within each professional group used the Friedman test. Pearson’s χ2 test was used to compare the baseline characteristics between 2 hospitals.
RESULTS
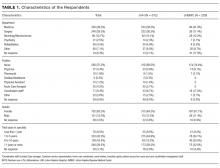
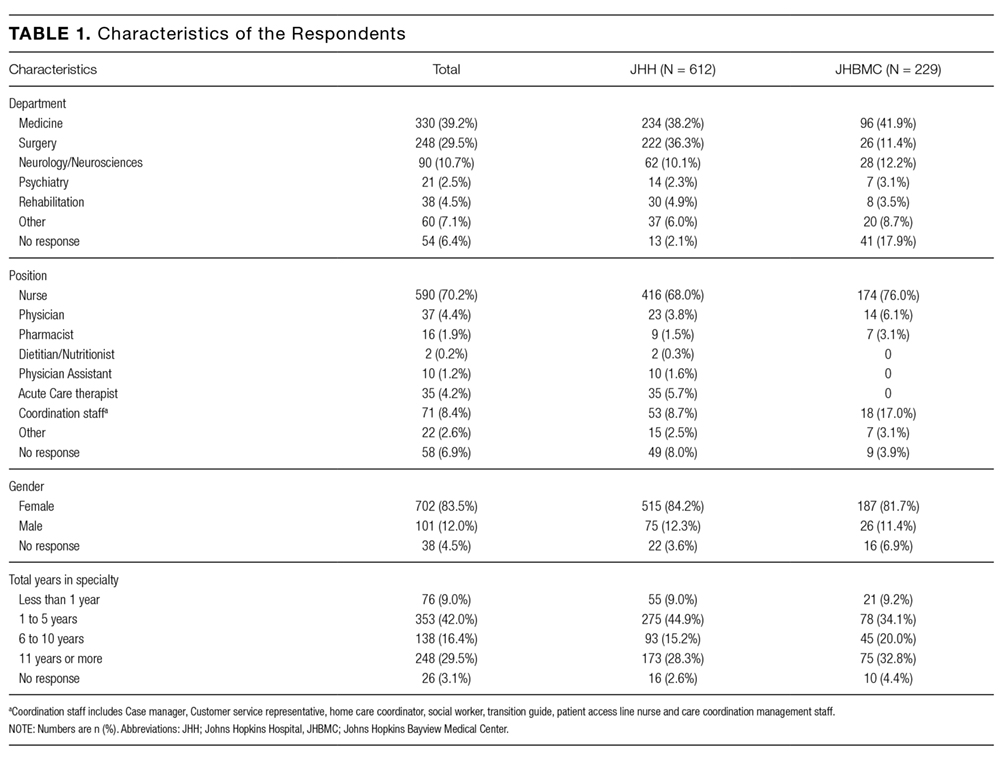
Among the 1486 acute care professionals asked to participate in the survey, 841 completed the questionnaire (response rate 56.6%). Table 1 shows the characteristics of the participants from each hospital. Table 2 summarizes the item response rates, proportion scoring at the ceiling, and weighting from the factor analysis. All items had completion rates of 99.2% or higher, with N/A responses ranging from 0% (item 2) to 3.1% (item 7). The percent scoring at the ceiling was 1.7% for the global item and ranged from 18.3% up to 63.3% for other individual items.
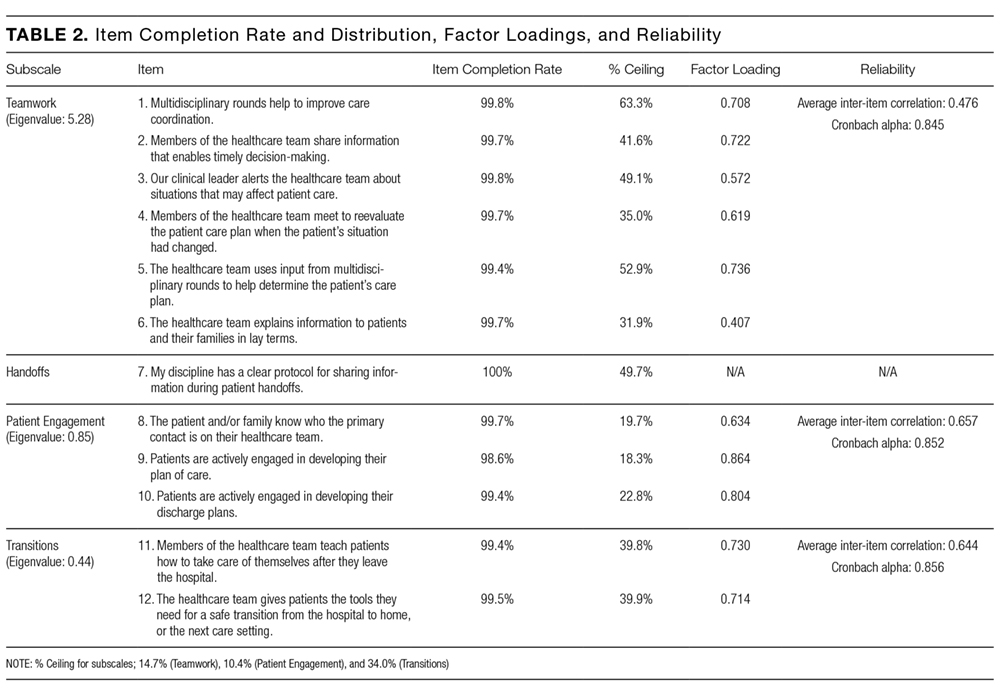
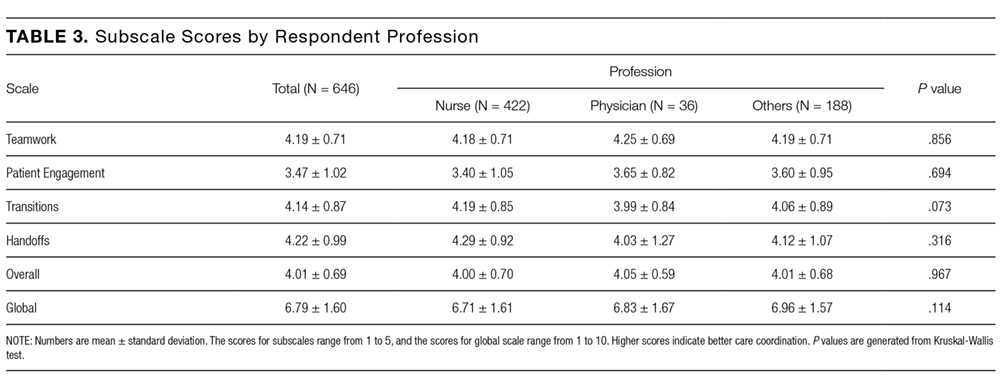

We also examined differences in perceptions of care coordination among nursing units to illustrate the tool’s ability to detect variation in Patient Engagement subscale scores for JHH nurses (see Appendix).
DISCUSSION
This study resulted in one of the first measurement tools to succinctly measure multiple aspects of care coordination in the hospital from the perspective of healthcare professionals. Given the hectic work environment of healthcare professionals, and the increasing emphasis on collecting data for evaluation and improvement, it is important to minimize respondent burden. This effort was catalyzed by a multifaceted initiative to redesign acute care delivery and promote seamless transitions of care, supported by the Center for Medicare & Medicaid Innovation. In initial testing, this questionnaire has evidence for reliability and validity. It was encouraging to find that the preliminary psychometric performance of the measure was very similar in 2 different settings of a tertiary academic hospital and a community hospital.
Our analysis of the survey data explored potential differences between the 2 hospitals, among different types of healthcare professionals and across different departments. Although we expected differences, we had no specific hypotheses about what those differences might be, and, in fact, did not observe any substantial differences. This could be taken to indicate that the intervention was uniformly and successfully implemented in both hospitals, and engaged various professionals in different departments. The ability to detect differences in care coordination at the nursing unit level could also prove to be beneficial for more precisely targeting where process improvement is needed. Further data collection and analyses should be conducted to more systematically compare units and to help identify those where practice is most advanced and those where improvements may be needed. It would also be informative to link differences in care coordination scores with patient outcomes. In addition, differences identified on specific domains between professional groups could be helpful to identify where greater efforts are needed to improve interdisciplinary practice. Sampling strategies stratified by provider type would need to be targeted to make this kind of analysis informative.
The consistently lower scores observed for patient engagement, from the perspective of care professionals in all groups, suggest that this is an area where improvement is needed. These findings are consistent with published reports on the common failure by hospitals to include patients as a member of their own care team. In addition to measuring care processes from the perspective of frontline healthcare workers, future evaluations within the healthcare system would also benefit from including data collected from the perspective of the patient and family.
This study had some limitations. First, there may be more than 4 domains of care coordination that are important and can be measured in the acute care setting from provider perspective. However, the addition of more domains should be balanced against practicality and respondent burden. It may be possible to further clarify priority domains in hospital settings as opposed to the primary care setting. Future research should be directed to find these areas and to develop a more comprehensive, yet still concise measurement instrument. Second, the tool was developed to measure the impact of a large-scale intervention, and to fit into the specific context of 2 hospitals. Therefore, it should be tested in different settings of hospital care to see how it performs. However, virtually all hospitals in the United States today are adapting to changes in both financing and healthcare delivery. A tool such as the one described in this paper could be helpful to many organizations. Third, the scoring system for the overall scale score is not weighted and therefore reflects teamwork more than other components of care coordination, which are represented by fewer items. In general, we believe that use of the subscale scores may be more informative. Alternative scoring systems might also be proposed, including item weighting based on factor scores.
For the purposes of evaluation in this specific instance, we only collected data at a single point in time, after the intervention had been deployed. Thus, we were not able to evaluate the effectiveness of the J-CHiP intervention. We also did not intend to focus too much on the differences between units, given the limited number of respondents from individual units. It would be useful to collect more data at future time points, both to test the responsiveness of the scales and to evaluate the impact of future interventions at both the hospital and unit level.
The preliminary data from this study have generated insights about gaps in current practice, such as in engaging patients in the inpatient care process. It has also increased awareness by hospital leaders about the need to achieve high reliability in the adoption of new procedures and interdisciplinary practice. This tool might be used to find areas in need of improvement, to evaluate the effect of initiatives to improve care coordination, to monitor the change over time in the perception of care coordination among healthcare professionals, and to develop better intervention strategies for coordination activities in acute care settings. Additional research is needed to provide further evidence for the reliability and validity of this measure in diverse settings.
Disclosure
The project described was supported by Grant Number 1C1CMS331053-01-00 from the US Department of Health and Human Services, Centers for Medicare & Medicaid Services. The contents of this publication are solely the responsibility of the authors and do not necessarily represent the official views of the US Department of Health and Human Services or any of its agencies. The research presented was conducted by the awardee. Results may or may not be consistent with or confirmed by the findings of the independent evaluation contractor.
The authors have no other disclosures.
1. McDonald KM, Sundaram V, Bravata DM, et al. Closing the Quality Gap: A Critical Analysis of Quality Improvement Strategies (Vol. 7: Care Coordination). Technical Reviews, No. 9.7. Rockville (MD): Agency for Healthcare Research and Quality (US); 2007. PubMed
2. Adams K, Corrigan J. Priority areas for national action: transforming health care quality. Washington, DC: National Academies Press; 2003. PubMed
3. Renders CM, Valk GD, Griffin S, Wagner EH, Eijk JT, Assendelft WJ. Interventions to improve the management of diabetes mellitus in primary care, outpatient and community settings. Cochrane Database Syst Rev. 2001(1):CD001481. PubMed
4. McAlister FA, Lawson FM, Teo KK, Armstrong PW. A systematic review of randomized trials of disease management programs in heart failure. Am J Med. 2001;110(5):378-384. PubMed
5. Bruce ML, Raue PJ, Reilly CF, et al. Clinical effectiveness of integrating depression care management into medicare home health: the Depression CAREPATH Randomized trial. JAMA Intern Med. 2015;175(1):55-64. PubMed
6. Berkowitz SA, Brown P, Brotman DJ, et al. Case Study: Johns Hopkins Community Health Partnership: A model for transformation. Healthc (Amst). 2016;4(4):264-270. PubMed
7. McDonald. KM, Schultz. E, Albin. L, et al. Care Coordination Measures Atlas Version 4. Rockville, MD: Agency for Healthcare Research and Quality; 2014.
8 Schultz EM, Pineda N, Lonhart J, Davies SM, McDonald KM. A systematic review of the care coordination measurement landscape. BMC Health Serv Res. 2013;13:119. PubMed
9. Sexton JB, Helmreich RL, Neilands TB, et al. The Safety Attitudes Questionnaire: psychometric properties, benchmarking data, and emerging research. BMC Health Serv Res. 2006;6:44. PubMed
Care Coordination has been defined as “…the deliberate organization of patient care activities between two or more participants (including the patient) involved in a patient’s care to facilitate the appropriate delivery of healthcare services.”1 The Institute of Medicine identified care coordination as a key strategy to improve the American healthcare system,2 and evidence has been building that well-coordinated care improves patient outcomes and reduces healthcare costs associated with chronic conditions.3-5 In 2012, Johns Hopkins Medicine was awarded a Healthcare Innovation Award by the Centers for Medicare & Medicaid Services to improve coordination of care across the continuum of care for adult patients admitted to Johns Hopkins Hospital (JHH) and Johns Hopkins Bayview Medical Center (JHBMC), and for high-risk low-income Medicare and Medicaid beneficiaries receiving ambulatory care in targeted zip codes. The purpose of this project, known as the Johns Hopkins Community Health Partnership (J-CHiP), was to improve health and healthcare and to reduce healthcare costs. The acute care component of the program consisted of a bundle of interventions focused on improving coordination of care for all patients, including a “bridge to home” discharge process, as they transitioned back to the community from inpatient admission. The bundle included the following: early screening for discharge planning to predict needed postdischarge services; discussion in daily multidisciplinary rounds about goals and priorities of the hospitalization and potential postdischarge needs; patient and family self-care management; education enhanced medication management, including the option of “medications in hand” at the time of discharge; postdischarge telephone follow-up by nurses; and, for patients identified as high-risk, a “transition guide” (a nurse who works with the patient via home visits and by phone to optimize compliance with care for 30 days postdischarge).6 While the primary endpoints of the J-CHiP program were to improve clinical outcomes and reduce healthcare costs, we were also interested in the impact of the program on care coordination processes in the acute care setting. This created the need for an instrument to measure healthcare professionals’ views of care coordination in their immediate work environments.
We began our search for existing measures by reviewing the Coordination Measures Atlas published in 2014.7 Although this report evaluates over 80 different measures of care coordination, most of them focus on the perspective of the patient and/or family members, on specific conditions, and on primary care or outpatient settings.7,8 We were unable to identify an existing measure from the provider perspective, designed for the inpatient setting, that was both brief but comprehensive enough to cover a range of care coordination domains.8
Consequently, our first aim was to develop a brief, comprehensive tool to measure care coordination from the perspective of hospital inpatient staff that could be used to compare different units or types of providers, or to conduct longitudinal assessment. The second aim was to conduct a preliminary evaluation of the tool in our healthcare setting, including to assess its psychometric properties, to describe provider perceptions of care coordination after the implementation of J-CHiP, and to explore potential differences among departments, types of professionals, and between the 2 hospitals.
METHODS
Development of the Care Coordination Questionnaire
The survey was developed in collaboration with leaders of the J-CHiP Acute Care Team. We met at the outset and on multiple subsequent occasions to align survey domains with the main components of the J-CHiP acute care intervention and to assure that the survey would be relevant and understandable to a variety of multidisciplinary professionals, including physicians, nurses, social workers, physical therapists, and other health professionals. Care was taken to avoid redundancy with existing evaluation efforts and to minimize respondent burden. This process helped to ensure the content validity of the items, the usefulness of the results, and the future usability of the tool.
We modeled the Care Coordination Questionnaire (CCQ) after the Safety Attitudes Questionnaire (SAQ),9 a widely used survey that is deployed approximately annually at JHH and JHBMC. While the SAQ focuses on healthcare provider attitudes about issues relevant to patient safety (often referred to as safety climate or safety culture), this new tool was designed to focus on healthcare professionals’ attitudes about care coordination. Similar to the way that the SAQ “elicits a snapshot of the safety climate through surveys of frontline worker perceptions,” we sought to elicit a picture of our care coordination climate through a survey of frontline hospital staff.
The CCQ was built upon the domains and approaches to care coordination described in the Agency for Healthcare Research and Quality Care Coordination Atlas.3 This report identifies 9 mechanisms for achieving care coordination, including the following: Establish Accountability or Negotiate Responsibility; Communicate; Facilitate Transitions; Assess Needs and Goals; Create a Proactive Plan of Care; Monitor, Follow Up, and Respond to Change; Support Self-Management Goals; Link to Community Resources; and Align Resources with Patient and Population Needs; as well as 5 broad approaches commonly used to improve the delivery of healthcare, including Teamwork Focused on Coordination, Healthcare Home, Care Management, Medication Management, and Health IT-Enabled Coordination.7 We generated at least 1 item to represent 8 of the 9 domains, as well as the broad approach described as Teamwork Focused on Coordination. After developing an initial set of items, we sought input from 3 senior leaders of the J-CHiP Acute Care Team to determine if the items covered the care coordination domains of interest, and to provide feedback on content validity. To test the interpretability of survey items and consistency across professional groups, we sent an initial version of the survey questions to at least 1 person from each of the following professional groups: hospitalist, social worker, case manager, clinical pharmacist, and nurse. We asked them to review all of our survey questions and to provide us with feedback on all aspects of the questions, such as whether they believed the questions were relevant and understandable to the members of their professional discipline, the appropriateness of the wording of the questions, and other comments. Modifications were made to the content and wording of the questions based on the feedback received. The final draft of the questionnaire was reviewed by the leadership team of the J-CHiP Acute Care Team to ensure its usefulness in providing actionable information.
The resulting 12-item questionnaire used a 5-point Likert response scale ranging from 1 = “disagree strongly” to 5 = “agree strongly,” and an additional option of “not applicable (N/A).” To help assess construct validity, a global question was added at the end of the questionnaire asking, “Overall, how would you rate the care coordination at the hospital of your primary work setting?” The response was measured on a 10-point Likert-type scale ranging from 1 = “totally uncoordinated care” to 10 = “perfectly coordinated care” (see Appendix). In addition, the questionnaire requested information about the respondents’ gender, position, and their primary unit, department, and hospital affiliation.
Data Collection Procedures
An invitation to complete an anonymous questionnaire was sent to the following inpatient care professionals: all nursing staff working on care coordination units in the departments of medicine, surgery, and neurology/neurosurgery, as well as physicians, pharmacists, acute care therapists (eg, occupational and physical therapists), and other frontline staff. All healthcare staff fitting these criteria was sent an e-mail with a request to fill out the survey online using QualtricsTM (Qualtrics Labs Inc., Provo, UT), as well as multiple follow-up reminders. The participants worked either at the JHH (a 1194-bed tertiary academic medical center in Baltimore, MD) or the JHBMC (a 440-bed academic community hospital located nearby). Data were collected from October 2015 through January 2016.
Analysis
Means and standard deviations were calculated by treating the responses as continuous variables. We tried 3 different methods to handle missing data: (1) without imputation, (2) imputing the mean value of each item, and (3) substituting a neutral score. Because all 3 methods produced very similar results, we treated the N/A responses as missing values without imputation for simplicity of analysis. We used STATA 13.1 (Stata Corporation, College Station, Texas) to analyze the data.
To identify subscales, we performed exploratory factor analysis on responses to the 12 specific items. Promax rotation was selected based on the simple structure. Subscale scores for each respondent were generated by computing the mean of responses to the items in the subscale. Internal consistency reliability of the subscales was estimated using Cronbach’s alpha. We calculated Pearson correlation coefficients for the items in each subscale, and examined Cronbach’s alpha deleting each item in turn. For each of the subscales identified and the global scale, we calculated the mean, standard deviation, median and interquartile range. Although distributions of scores tended to be non-normal, this was done to increase interpretability. We also calculated percent scoring at the ceiling (highest possible score).
We analyzed the data with 3 research questions in mind: Was there a difference in perceptions of care coordination between (1) staff affiliated with the 2 different hospitals, (2) staff affiliated with different clinical departments, or (3) staff with different professional roles? For comparisons based on hospital and department, and type of professional, nonparametric tests (Wilcoxon rank-sum and Kruskal-Wallis test) were used with a level of statistical significance set at 0.05. The comparison between hospitals and departments was made only among nurses to minimize the confounding effect of different distribution of professionals. We tested the distribution of “years in specialty” between hospitals and departments for this comparison using Pearson’s χ2 test. The difference was not statistically significant (P = 0.167 for hospitals, and P = 0.518 for departments), so we assumed that the potential confounding effect of this variable was negligible in this analysis. The comparison of scores within each professional group used the Friedman test. Pearson’s χ2 test was used to compare the baseline characteristics between 2 hospitals.
RESULTS
Among the 1486 acute care professionals asked to participate in the survey, 841 completed the questionnaire (response rate 56.6%). Table 1 shows the characteristics of the participants from each hospital. Table 2 summarizes the item response rates, proportion scoring at the ceiling, and weighting from the factor analysis. All items had completion rates of 99.2% or higher, with N/A responses ranging from 0% (item 2) to 3.1% (item 7). The percent scoring at the ceiling was 1.7% for the global item and ranged from 18.3% up to 63.3% for other individual items.
We also examined differences in perceptions of care coordination among nursing units to illustrate the tool’s ability to detect variation in Patient Engagement subscale scores for JHH nurses (see Appendix).
DISCUSSION
This study resulted in one of the first measurement tools to succinctly measure multiple aspects of care coordination in the hospital from the perspective of healthcare professionals. Given the hectic work environment of healthcare professionals, and the increasing emphasis on collecting data for evaluation and improvement, it is important to minimize respondent burden. This effort was catalyzed by a multifaceted initiative to redesign acute care delivery and promote seamless transitions of care, supported by the Center for Medicare & Medicaid Innovation. In initial testing, this questionnaire has evidence for reliability and validity. It was encouraging to find that the preliminary psychometric performance of the measure was very similar in 2 different settings of a tertiary academic hospital and a community hospital.
Our analysis of the survey data explored potential differences between the 2 hospitals, among different types of healthcare professionals and across different departments. Although we expected differences, we had no specific hypotheses about what those differences might be, and, in fact, did not observe any substantial differences. This could be taken to indicate that the intervention was uniformly and successfully implemented in both hospitals, and engaged various professionals in different departments. The ability to detect differences in care coordination at the nursing unit level could also prove to be beneficial for more precisely targeting where process improvement is needed. Further data collection and analyses should be conducted to more systematically compare units and to help identify those where practice is most advanced and those where improvements may be needed. It would also be informative to link differences in care coordination scores with patient outcomes. In addition, differences identified on specific domains between professional groups could be helpful to identify where greater efforts are needed to improve interdisciplinary practice. Sampling strategies stratified by provider type would need to be targeted to make this kind of analysis informative.
The consistently lower scores observed for patient engagement, from the perspective of care professionals in all groups, suggest that this is an area where improvement is needed. These findings are consistent with published reports on the common failure by hospitals to include patients as a member of their own care team. In addition to measuring care processes from the perspective of frontline healthcare workers, future evaluations within the healthcare system would also benefit from including data collected from the perspective of the patient and family.
This study had some limitations. First, there may be more than 4 domains of care coordination that are important and can be measured in the acute care setting from provider perspective. However, the addition of more domains should be balanced against practicality and respondent burden. It may be possible to further clarify priority domains in hospital settings as opposed to the primary care setting. Future research should be directed to find these areas and to develop a more comprehensive, yet still concise measurement instrument. Second, the tool was developed to measure the impact of a large-scale intervention, and to fit into the specific context of 2 hospitals. Therefore, it should be tested in different settings of hospital care to see how it performs. However, virtually all hospitals in the United States today are adapting to changes in both financing and healthcare delivery. A tool such as the one described in this paper could be helpful to many organizations. Third, the scoring system for the overall scale score is not weighted and therefore reflects teamwork more than other components of care coordination, which are represented by fewer items. In general, we believe that use of the subscale scores may be more informative. Alternative scoring systems might also be proposed, including item weighting based on factor scores.
For the purposes of evaluation in this specific instance, we only collected data at a single point in time, after the intervention had been deployed. Thus, we were not able to evaluate the effectiveness of the J-CHiP intervention. We also did not intend to focus too much on the differences between units, given the limited number of respondents from individual units. It would be useful to collect more data at future time points, both to test the responsiveness of the scales and to evaluate the impact of future interventions at both the hospital and unit level.
The preliminary data from this study have generated insights about gaps in current practice, such as in engaging patients in the inpatient care process. It has also increased awareness by hospital leaders about the need to achieve high reliability in the adoption of new procedures and interdisciplinary practice. This tool might be used to find areas in need of improvement, to evaluate the effect of initiatives to improve care coordination, to monitor the change over time in the perception of care coordination among healthcare professionals, and to develop better intervention strategies for coordination activities in acute care settings. Additional research is needed to provide further evidence for the reliability and validity of this measure in diverse settings.
Disclosure
The project described was supported by Grant Number 1C1CMS331053-01-00 from the US Department of Health and Human Services, Centers for Medicare & Medicaid Services. The contents of this publication are solely the responsibility of the authors and do not necessarily represent the official views of the US Department of Health and Human Services or any of its agencies. The research presented was conducted by the awardee. Results may or may not be consistent with or confirmed by the findings of the independent evaluation contractor.
The authors have no other disclosures.
1. McDonald KM, Sundaram V, Bravata DM, et al. Closing the Quality Gap: A Critical Analysis of Quality Improvement Strategies (Vol. 7: Care Coordination). Technical Reviews, No. 9.7. Rockville (MD): Agency for Healthcare Research and Quality (US); 2007. PubMed
2. Adams K, Corrigan J. Priority areas for national action: transforming health care quality. Washington, DC: National Academies Press; 2003. PubMed
3. Renders CM, Valk GD, Griffin S, Wagner EH, Eijk JT, Assendelft WJ. Interventions to improve the management of diabetes mellitus in primary care, outpatient and community settings. Cochrane Database Syst Rev. 2001(1):CD001481. PubMed
4. McAlister FA, Lawson FM, Teo KK, Armstrong PW. A systematic review of randomized trials of disease management programs in heart failure. Am J Med. 2001;110(5):378-384. PubMed
5. Bruce ML, Raue PJ, Reilly CF, et al. Clinical effectiveness of integrating depression care management into medicare home health: the Depression CAREPATH Randomized trial. JAMA Intern Med. 2015;175(1):55-64. PubMed
6. Berkowitz SA, Brown P, Brotman DJ, et al. Case Study: Johns Hopkins Community Health Partnership: A model for transformation. Healthc (Amst). 2016;4(4):264-270. PubMed
7. McDonald. KM, Schultz. E, Albin. L, et al. Care Coordination Measures Atlas Version 4. Rockville, MD: Agency for Healthcare Research and Quality; 2014.
8 Schultz EM, Pineda N, Lonhart J, Davies SM, McDonald KM. A systematic review of the care coordination measurement landscape. BMC Health Serv Res. 2013;13:119. PubMed
9. Sexton JB, Helmreich RL, Neilands TB, et al. The Safety Attitudes Questionnaire: psychometric properties, benchmarking data, and emerging research. BMC Health Serv Res. 2006;6:44. PubMed
© 2017 Society of Hospital Medicine
Associations of Physician Empathy with Patient Anxiety and Ratings of Communication in Hospital Admission Encounters
Admission to a hospital can be a stressful event,1,2 and patients report having many concerns at the time of hospital admission.3 Over the last 20 years, the United States has widely adopted the hospitalist model of inpatient care. Although this model has clear benefits, it also has the potential to contribute to patient stress, as hospitalized patients generally lack preexisting relationships with their inpatient physicians.4,5 In this changing hospital environment, defining and promoting effective medical communication has become an essential goal of both individual practitioners and medical centers.
Successful communication and strong therapeutic relationships with physicians support patients’ coping with illness-associated stress6,7 as well as promote adherence to medical treatment plans.8 Empathy serves as an important building block of patient-centered communication and encourages a strong therapeutic alliance.9 Studies from primary care, oncology, and intensive care unit (ICU) settings indicate that physician empathy is associated with decreased emotional distress,10,11 improved ratings of communication,12 and even better medical outcomes.13
Prior work has shown that hospitalists, like other clinicians, underutilize empathy as a tool in their daily interactions with patients.14-16 Our prior qualitative analysis of audio-recorded hospitalist-patient admission encounters indicated that how hospitalists respond to patient expressions of negative emotion influences relationships with patients and alignment around care plans.17 To determine whether empathic communication is associated with patient-reported outcomes in the hospitalist model, we quantitatively analyzed coded admission encounters and survey data to examine the association between hospitalists’ responses to patient expressions of negative emotion (anxiety, sadness, and anger) and patient anxiety and ratings of communication. Given the often-limited time hospitalists have to complete admission encounters, we also examined the association between response to emotion and encounter length.
METHODS
We analyzed data collected as part of an observational study of hospitalist-patient communication during hospital admission encounters14 to assess the association between the way physicians responded to patient expressions of negative emotion and patient anxiety, ratings of communication in the encounter, and encounter length. We collected data between August 2008 and March 2009 on the general medical service at 2 urban hospitals that are part of an academic medical center. Participants were attending hospitalists (not physician trainees), and patients admitted under participating hospitalists’ care who were able to communicate verbally in English and provide informed consent for the study. The institutional review board at the University of California, San Francisco approved the study; physician and patient participants provided written informed consent.
Enrollment and data collection has been described previously.17 Our cohort for this analysis included 76 patients of 27 physicians who completed encounter audio recordings and pre- and postencounter surveys. Following enrollment, patients completed a preencounter survey to collect demographic information and to measure their baseline anxiety via the State Anxiety Scale (STAI-S), which assesses transient anxious mood using 20 items answered on a 4-point scale for a final score range of 20 to 80.10,18,19 We timed and audio-recorded admission encounters. Encounter recordings were obtained solely from patient interactions with attending hospitalists and did not take into account the time patients may have spent with other physicians, including trainees. After the encounter, patients completed postencounter surveys, which included the STAI-S and patients’ ratings of communication during the encounter. To rate communication, patients responded to 7 items on a 0- to 10-point scale that were derived from previous work (Table 1)12,20,21; the anchors were “not at all” and “completely.” To identify patients with serious illness, which we used as a covariate in regression models, we asked physicians on a postencounter survey whether or not they “would be surprised by this patient’s death or admission to the ICU in the next year.”22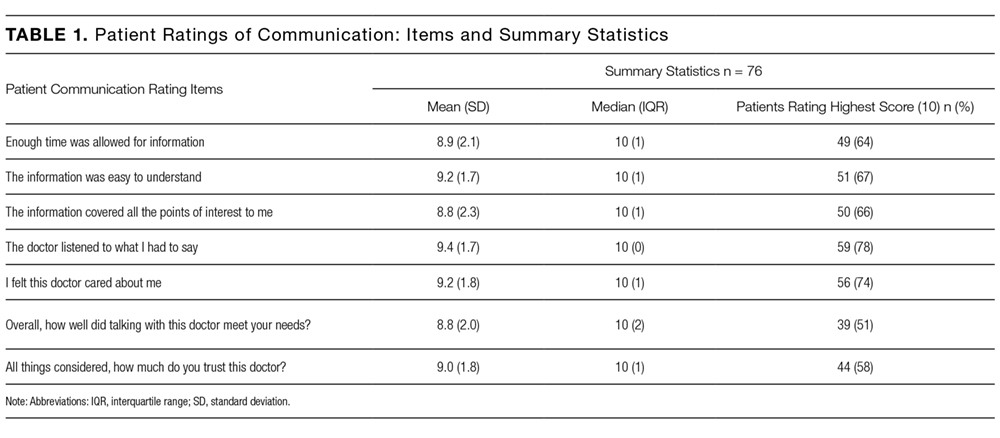
We considered physician as a clustering variable in the calculation of robust standard errors for all models. In addition, we included in each model covariates that were associated with the outcome at P ≤ 0.10, including patient gender, patient age, serious illness,22 preencounter anxiety, encounter length, and hospital. We considered P values < 0.05 to be statistically significant. We used Stata SE 13 (StataCorp LLC, College Station, TX) for all statistical analyses.
RESULTS

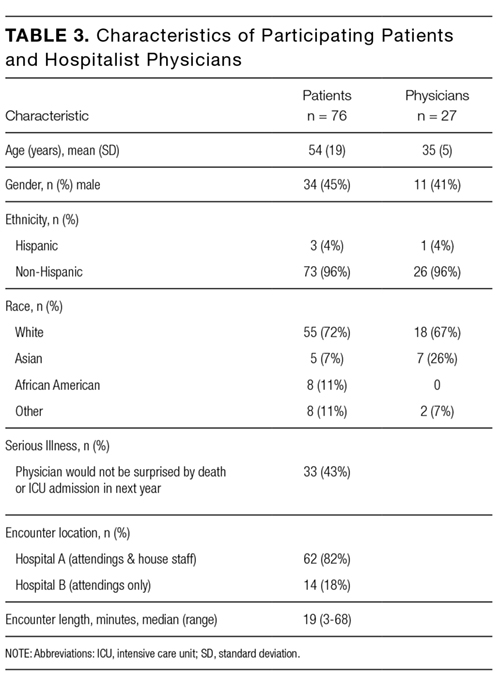
We analyzed data from admission encounters with 76 patients (consent rate 63%) and 27 hospitalists (consent rate 91%). Their characteristics are shown in Table 3. Median encounter length was 19 minutes (mean 21 minutes, range 3-68). Patients expressed negative emotion in 190 instances across all encounters; median number of expressions per encounter was 1 (range 0-14). Hospitalists responded empathically to 32% (n = 61) of the patient expressions, neutrally to 43% (n = 81), and nonempathically to 25% (n = 48).
The STAI-S was normally distributed. The mean preencounter STAI-S score was 39 (standard deviation [SD] 8.9). Mean postencounter STAI-S score was 38 (SD 10.7). Mean change in anxiety over the course of the encounter, calculated as the postencounter minus preencounter mean was −1.2 (SD 7.6). Table 1 shows summary statistics for the patient ratings of communication items. All items were rated highly. Across the items, between 51% and 78% of patients rated the highest score of 10.
Across the range of frequencies of emotional expressions per encounter in our data set (0-14 expressions), each additional empathic hospitalist response was associated with a 1.65-point decrease in the STAI-S (95% confidence interval [CI], 0.48-2.82). We did not find significant associations between changes in the STAI-S and the number of neutral hospitalist responses (−0.65 per response; 95% CI, −1.67-0.37) or nonempathic hospitalist responses (0.61 per response; 95% CI, −0.88-2.10).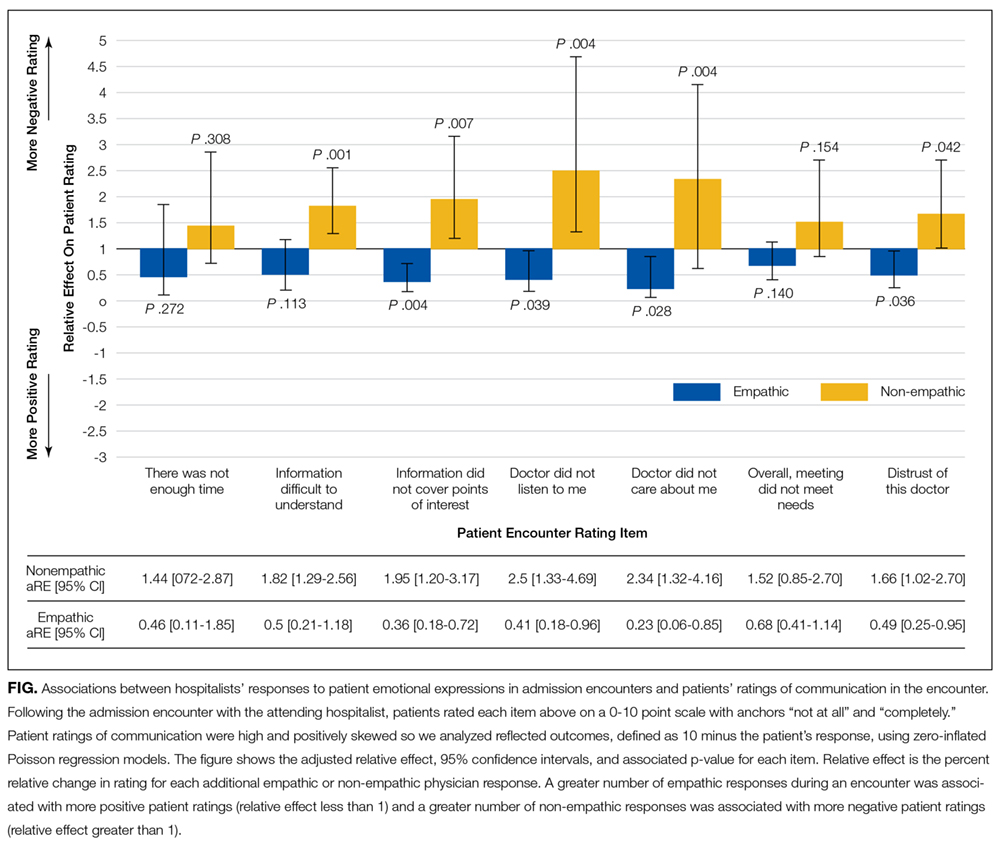
In addition, nonempathic responses were associated with more negative ratings of communication for 5 of the 7 items: ease of understanding information, covering points of interest, the doctor listening, the doctor caring, and trusting the doctor. For example, for the item “I felt this doctor cared about me,” each nonempathic hospitalist response was associated with a more than doubling of negative patient ratings (aRE: 2.3; 95% CI, 1.32-4.16). Neutral physician responses to patient expressions of negative emotion were associated with less negative patient ratings for 2 of the items: covering points of interest (aRE 0.68; 95% CI, 0.51-0.90) and trusting the doctor (aRE: 0.86; 95% CI, 0.75-0.99).
We did not find a statistical association between encounter length and the number of empathic hospitalist responses in the encounter (percent change in encounter length per response [PC]: 1%; 95% CI, −8%-10%) or the number of nonempathic responses (PC: 18%; 95% CI, −2%-42%). We did find a statistically significant association between the number of neutral responses and encounter length (PC: 13%; 95% CI, 3%-24%), corresponding to 2.5 minutes of additional encounter time per neutral response for the median encounter length of 19 minutes.
DISCUSSION
Our study set out to measure how hospitalists responded to expressions of negative emotion during admission encounters with patients and how those responses correlated with patient anxiety, ratings of communication, and encounter length. We found that empathic responses were associated with diminishing patient anxiety after the visit, as well as with better ratings of several domains of hospitalist communication. Moreover, nonempathic responses to negative emotion were associated with more strongly negative ratings of hospitalist communication. Finally, while clinicians may worry that encouraging patients to speak further about emotion will result in excessive visit lengths, we did not find a statistical association between empathic responses and encounter duration. To our knowledge, this is the first study to indicate an association between empathy and patient anxiety and communication ratings within the hospitalist model, which is rapidly becoming the predominant model for providing inpatient care in the United States.4,5
As in oncologic care, anxiety is an emotion commonly confronted by clinicians meeting admitted medical patients for the first time. Studies show that not only do patient anxiety levels remain high throughout a hospital course, patients who experience higher levels of anxiety tend to stay longer in the hospital.1,2,27-30 But unlike oncologic care or other therapy provided in an outpatient setting, the hospitalist model does not facilitate “continuity” of care, or the ability to care for the same patients over a long period of time. This reality of inpatient care makes rapid, effective rapport-building critical to establishing strong physician-patient relationships. In this setting, a simple communication tool that is potentially able to reduce inpatients’ anxiety could have a meaningful impact on hospitalist-provided care and patient outcomes.
In terms of the magnitude of the effect of empathic responses, the clinical significance of a 1.65-point decrease in the STAI-S anxiety score is not precisely clear. A prior study that examined the effect of music therapy on anxiety levels in patients with cancer found an average anxiety reduction of approximately 9.5 units on the STAIS-S scale after sensitivity analysis, suggesting a rather large meaningful effect size.31 Given we found a reduction of 1.65 points for each empathic response, however, with a range of 0-14 negative emotions expressed over a median 19-minute encounter, there is opportunity for hospitalists to achieve a clinically significant decrease in patient anxiety during an admission encounter. The potential to reduce anxiety is extended further when we consider that the impact of an empathic response may apply not just to the admission encounter alone but also to numerous other patient-clinician interactions over the course of a hospitalization.
A healthy body of communication research supports the associations we found in our study between empathy and patient ratings of communication and physicians. Families in ICU conferences rate communication more positively when physicians express empathy,12 and a number of studies indicate an association between empathy and patient satisfaction in outpatient settings.8 Given the associations we found with negative ratings on the items in our study, promoting empathic responses to expressions of emotion and, more importantly, stressing avoidance of nonempathic responses may be relevant efforts in working to improve patient satisfaction scores on surveys reporting “top box” percentages, such as Hospital Consumer Assessment of Healthcare Providers and Systems (HCAHPS). More notably, evidence indicates that empathy has positive impacts beyond satisfaction surveys, such as adherence, better diagnostic and clinical outcomes, and strengthening of patient enablement.8Not all hospitalist responses to emotion were associated with patient ratings across the 7 communication items we assessed. For example, we did not find an association between how physicians responded to patient expressions of negative emotion and patient perception that enough time was spent in the visit or the degree to which talking with the doctor met a patient’s overall needs. It follows logically, and other research supports, that empathy would influence patient ratings of physician caring and trust,32 whereas other communication factors we were unable to measure (eg, physician body language, tone, and use of jargon and patient health literacy and primary language) may have a more significant association with patient ratings of the other items we assessed.
In considering the clinical application of our results, it is important to note that communication skills, including responding empathically to patient expressions of negative emotion, can be imparted through training in the same way as abdominal examination or electrocardiogram interpretation skills.33-35 However, training of hospitalists in communication skills requires time and some financial investment on the part of the physician, their hospital or group, or, ideally, both. Effective training methods, like those for other skill acquisition, involve learner-centered teaching and practicing skills with role-play and feedback.36 Given the importance of a learner-centered approach, learning would likely be better received and more effective if it was tailored to the specific needs and patient scenarios commonly encountered by hospitalist physicians. As these programs are developed, it will be important to assess the impact of any training on the patient-reported outcomes we assessed in this observational study, along with clinical outcomes.
Our study has several limitations. First, we were only able to evaluate whether hospitalists verbally responded to patient emotion and were thus not able to account for nonverbal empathy such as facial expressions, body language, or voice tone. Second, given our patient consent rate of 63%, patients who agreed to participate in the study may have had different opinions than those who declined to participate. Also, hospitalists and patients may have behaved differently as a result of being audio recorded. We only included patients who spoke English, and our patient population was predominately non-Hispanic white. Patients who spoke other languages or came from other cultural backgrounds may have had different responses. Third, we did not use a single validated scale for patient ratings of communication, and multiple analyses increase our risk of finding statistically significant associations by chance. The skewing of the communication rating items toward high scores may also have led to our results being driven by outliers, although the model we chose for analysis does penalize for this. Furthermore, our sample size was small, leading to wide CIs and potential for lack of statistical associations due to insufficient power. Our findings warrant replication in larger studies. Fourth, the setting of our study in an academic center may affect generalizability. Finally, the age of our data (collected between 2008 and 2009) is also a limitation. Given a recent focus on communication and patient experience since the initiation of HCAHPS feedback, a similar analysis of empathy and communication methods now may result in different outcomes.
In conclusion, our results suggest that enhancing hospitalists’ empathic responses to patient expressions of negative emotion could decrease patient anxiety and improve patients’ perceptions of (and thus possibly their relationships with) hospitalists, without sacrificing efficiency. Future work should focus on tailoring and implementing communication skills training programs for hospitalists and evaluating the impact of training on patient outcomes.
Acknowledgments
The authors extend their sincere thanks to the patients and physicians who participated in this study. Dr. Anderson was funded by the National Palliative Care Research Center and the University of California, San Francisco Clinical and Translational Science Institute Career Development Program, National Institutes of Health (NIH) grant number 5 KL2 RR024130-04. Project costs were funded by a grant from the University of California, San Francisco Academic Senate.
Disclosure
All coauthors have seen and agree with the contents of this manuscript. This submission is not under review by any other publication. Wendy Anderson received funding for this project from the National Palliative Care Research Center, University of California San Francisco Clinical and Translational Science Institute (NIH grant number 5KL2RR024130-04), and the University of San Francisco Academic Senate [From Section 2 of Author Disclosure Form]. Andy Auerbach has a Patient-Centered Outcomes Research Institute research grant in development [From Section 3 of the Author Disclosure Form].
1. Walker FB, Novack DH, Kaiser DL, Knight A, Oblinger P. Anxiety and depression among medical and surgical patients nearing hospital discharge. J Gen Intern Med. 1987;2(2):99-101. PubMed
2. Castillo MI, Cooke M, Macfarlane B, Aitken LM. Factors associated with anxiety in critically ill patients: A prospective observational cohort study. Int J Nurs Stud. 2016;60:225-233. PubMed
3. Anderson WG, Winters K, Auerbach AD. Patient concerns at hospital admission. Arch Intern Med. 2011;171(15):1399-1400. PubMed
4. Kuo Y-F, Sharma G, Freeman JL, Goodwin JS. Growth in the care of older patients by hospitalists in the United States. N Engl J Med. 2009;360(11):1102-1112. PubMed
5. Wachter RM, Goldman L. Zero to 50,000 - The 20th Anniversary of the Hospitalist. N Engl J Med. 2016;375(11):1009-1011. PubMed
6. Mack JW, Block SD, Nilsson M, et al. Measuring therapeutic alliance between oncologists and patients with advanced cancer: the Human Connection Scale. Cancer. 2009;115(14):3302-3311. PubMed
7. Huff NG, Nadig N, Ford DW, Cox CE. Therapeutic Alliance between the Caregivers of Critical Illness Survivors and Intensive Care Unit Clinicians. [published correction appears in Ann Am Thorac Soc. 2016;13(4):576]. Ann Am Thorac Soc. 2015;12(11):1646-1653. PubMed
8. Derksen F, Bensing J, Lagro-Janssen A. Effectiveness of empathy in general practice: a systematic review. Br J Gen Pract. 2013;63(606):e76-e84. PubMed
9. Dwamena F, Holmes-Rovner M, Gaulden CM, et al. Interventions for providers to promote a patient-centred approach in clinical consultations. Cochrane Database Syst Rev. 2012;12:CD003267. PubMed
10. Fogarty LA, Curbow BA, Wingard JR, McDonnell K, Somerfield MR. Can 40 seconds of compassion reduce patient anxiety? J Clin Oncol. 1999;17(1):371-379. PubMed
11. Roter DL, Hall JA, Kern DE, Barker LR, Cole KA, Roca RP. Improving physicians’ interviewing skills and reducing patients’ emotional distress. A randomized clinical trial. Arch Intern Med. 1995;155(17):1877-1884. PubMed
12. Stapleton RD, Engelberg RA, Wenrich MD, Goss CH, Curtis JR. Clinician statements and family satisfaction with family conferences in the intensive care unit. Crit Care Med. 2006;34(6):1679-1685. PubMed
13. Hojat M, Louis DZ, Markham FW, Wender R, Rabinowitz C, Gonnella JS. Physicians’ empathy and clinical outcomes for diabetic patients. Acad Med. 2011;86(3):359-364. PubMed
14. Anderson WG, Winters K, Arnold RM, Puntillo KA, White DB, Auerbach AD. Studying physician-patient communication in the acute care setting: the hospitalist rapport study. Patient Educ Couns. 2011;82(2):275-279. PubMed
15. Pollak KI, Arnold RM, Jeffreys AS, et al. Oncologist communication about emotion during visits with patients with advanced cancer. J Clin Oncol. 2007;25(36):5748-5752. PubMed
16. Suchman AL, Markakis K, Beckman HB, Frankel R. A model of empathic communication in the medical interview. JAMA. 1997;277(8):678-682. PubMed
17. Adams K, Cimino JEW, Arnold RM, Anderson WG. Why should I talk about emotion? Communication patterns associated with physician discussion of patient expressions of negative emotion in hospital admission encounters. Patient Educ Couns. 2012;89(1):44-50. PubMed
18. Julian LJ. Measures of anxiety: State-Trait Anxiety Inventory (STAI), Beck Anxiety Inventory (BAI), and Hospital Anxiety and Depression Scale-Anxiety (HADS-A). Arthritis Care Res (Hoboken). 2011;63 Suppl 11:S467-S472. PubMed
19. Speilberger C, Ritterband L, Sydeman S, Reheiser E, Unger K. Assessment of emotional states and personality traits: measuring psychological vital signs. In: Butcher J, editor. Clinical personality assessment: practical approaches. New York: Oxford University Press; 1995.
20. Safran DG, Kosinski M, Tarlov AR, et al. The Primary Care Assessment Survey: tests of data quality and measurement performance. Med Care. 1998;36(5):728-739. PubMed
21. Azoulay E, Pochard F, Kentish-Barnes N, et al. Risk of post-traumatic stress symptoms in family members of intensive care unit patients. Am J Respir Crit Care Med. 2005;171(9):987-994. PubMed
22. Lynn J. Perspectives on care at the close of life. Serving patients who may die soon and their families: the role of hospice and other services. JAMA. 2001;285(7):925-932. PubMed
23. Kennifer SL, Alexander SC, Pollak KI, et al. Negative emotions in cancer care: do oncologists’ responses depend on severity and type of emotion? Patient Educ Couns. 2009;76(1):51-56. PubMed
24. Butow PN, Brown RF, Cogar S, Tattersall MHN, Dunn SM. Oncologists’ reactions to cancer patients’ verbal cues. Psychooncology. 2002;11(1):47-58. PubMed
25. Levinson W, Gorawara-Bhat R, Lamb J. A study of patient clues and physician responses in primary care and surgical settings. JAMA. 2000;284(8):1021-1027. PubMed
26. Cohen J. A coefficient of agreement for nominal scales. Educ Psychol Meas. 1960;20(1):37-46.
27. Fulop G. Anxiety disorders in the general hospital setting. Psychiatr Med. 1990;8(3):187-195. PubMed
28. Gerson S, Mistry R, Bastani R, et al. Symptoms of depression and anxiety (MHI) following acute medical/surgical hospitalization and post-discharge psychiatric diagnoses (DSM) in 839 geriatric US veterans. Int J Geriatr Psychiatry. 2004;19(12):1155-1167. PubMed
29. Kathol RG, Wenzel RP. Natural history of symptoms of depression and anxiety during inpatient treatment on general medicine wards. J Gen Intern Med. 1992;7(3):287-293. PubMed
30. Unsal A, Unaldi C, Baytemir C. Anxiety and depression levels of inpatients in the city centre of Kirşehir in Turkey. Int J Nurs Pract. 2011;17(4):411-418. PubMed
31. Bradt J, Dileo C, Grocke D, Magill L. Music interventions for improving psychological and physical outcomes in cancer patients. [Update appears in Cochrane Database Syst Rev. 2016;(8):CD006911] Cochrane Database Syst Rev. 2011;(8):CD006911. PubMed
32. Kim SS, Kaplowitz S, Johnston MV. The effects of physician empathy on patient satisfaction and compliance. Eval Health Prof. 2004;27(3):237-251. PubMed
33. Tulsky JA, Arnold RM, Alexander SC, et al. Enhancing communication between oncologists and patients with a computer-based training program: a randomized trial. Ann Intern Med. 2011;155(9):593-601. PubMed
34. Bays AM, Engelberg RA, Back AL, et al. Interprofessional communication skills training for serious illness: evaluation of a small-group, simulated patient intervention. J Palliat Med. 2014;17(2):159-166. PubMed
35. Epstein RM, Duberstein PR, Fenton JJ, et al. Effect of a Patient-Centered Communication Intervention on Oncologist-Patient Communication, Quality of Life, and Health Care Utilization in Advanced Cancer: The VOICE Randomized Clinical Trial. JAMA Oncol. 2017;3(1):92-100. PubMed
36. Berkhof M, van Rijssen HJ, Schellart AJM, Anema JR, van der Beek AJ. Effective training strategies for teaching communication skills to physicians: an overview of systematic reviews. Patient Educ Couns. 2011;84(2):152-162. PubMed
Admission to a hospital can be a stressful event,1,2 and patients report having many concerns at the time of hospital admission.3 Over the last 20 years, the United States has widely adopted the hospitalist model of inpatient care. Although this model has clear benefits, it also has the potential to contribute to patient stress, as hospitalized patients generally lack preexisting relationships with their inpatient physicians.4,5 In this changing hospital environment, defining and promoting effective medical communication has become an essential goal of both individual practitioners and medical centers.
Successful communication and strong therapeutic relationships with physicians support patients’ coping with illness-associated stress6,7 as well as promote adherence to medical treatment plans.8 Empathy serves as an important building block of patient-centered communication and encourages a strong therapeutic alliance.9 Studies from primary care, oncology, and intensive care unit (ICU) settings indicate that physician empathy is associated with decreased emotional distress,10,11 improved ratings of communication,12 and even better medical outcomes.13
Prior work has shown that hospitalists, like other clinicians, underutilize empathy as a tool in their daily interactions with patients.14-16 Our prior qualitative analysis of audio-recorded hospitalist-patient admission encounters indicated that how hospitalists respond to patient expressions of negative emotion influences relationships with patients and alignment around care plans.17 To determine whether empathic communication is associated with patient-reported outcomes in the hospitalist model, we quantitatively analyzed coded admission encounters and survey data to examine the association between hospitalists’ responses to patient expressions of negative emotion (anxiety, sadness, and anger) and patient anxiety and ratings of communication. Given the often-limited time hospitalists have to complete admission encounters, we also examined the association between response to emotion and encounter length.
METHODS
We analyzed data collected as part of an observational study of hospitalist-patient communication during hospital admission encounters14 to assess the association between the way physicians responded to patient expressions of negative emotion and patient anxiety, ratings of communication in the encounter, and encounter length. We collected data between August 2008 and March 2009 on the general medical service at 2 urban hospitals that are part of an academic medical center. Participants were attending hospitalists (not physician trainees), and patients admitted under participating hospitalists’ care who were able to communicate verbally in English and provide informed consent for the study. The institutional review board at the University of California, San Francisco approved the study; physician and patient participants provided written informed consent.
Enrollment and data collection has been described previously.17 Our cohort for this analysis included 76 patients of 27 physicians who completed encounter audio recordings and pre- and postencounter surveys. Following enrollment, patients completed a preencounter survey to collect demographic information and to measure their baseline anxiety via the State Anxiety Scale (STAI-S), which assesses transient anxious mood using 20 items answered on a 4-point scale for a final score range of 20 to 80.10,18,19 We timed and audio-recorded admission encounters. Encounter recordings were obtained solely from patient interactions with attending hospitalists and did not take into account the time patients may have spent with other physicians, including trainees. After the encounter, patients completed postencounter surveys, which included the STAI-S and patients’ ratings of communication during the encounter. To rate communication, patients responded to 7 items on a 0- to 10-point scale that were derived from previous work (Table 1)12,20,21; the anchors were “not at all” and “completely.” To identify patients with serious illness, which we used as a covariate in regression models, we asked physicians on a postencounter survey whether or not they “would be surprised by this patient’s death or admission to the ICU in the next year.”22
We considered physician as a clustering variable in the calculation of robust standard errors for all models. In addition, we included in each model covariates that were associated with the outcome at P ≤ 0.10, including patient gender, patient age, serious illness,22 preencounter anxiety, encounter length, and hospital. We considered P values < 0.05 to be statistically significant. We used Stata SE 13 (StataCorp LLC, College Station, TX) for all statistical analyses.
RESULTS
We analyzed data from admission encounters with 76 patients (consent rate 63%) and 27 hospitalists (consent rate 91%). Their characteristics are shown in Table 3. Median encounter length was 19 minutes (mean 21 minutes, range 3-68). Patients expressed negative emotion in 190 instances across all encounters; median number of expressions per encounter was 1 (range 0-14). Hospitalists responded empathically to 32% (n = 61) of the patient expressions, neutrally to 43% (n = 81), and nonempathically to 25% (n = 48).
The STAI-S was normally distributed. The mean preencounter STAI-S score was 39 (standard deviation [SD] 8.9). Mean postencounter STAI-S score was 38 (SD 10.7). Mean change in anxiety over the course of the encounter, calculated as the postencounter minus preencounter mean was −1.2 (SD 7.6). Table 1 shows summary statistics for the patient ratings of communication items. All items were rated highly. Across the items, between 51% and 78% of patients rated the highest score of 10.
Across the range of frequencies of emotional expressions per encounter in our data set (0-14 expressions), each additional empathic hospitalist response was associated with a 1.65-point decrease in the STAI-S (95% confidence interval [CI], 0.48-2.82). We did not find significant associations between changes in the STAI-S and the number of neutral hospitalist responses (−0.65 per response; 95% CI, −1.67-0.37) or nonempathic hospitalist responses (0.61 per response; 95% CI, −0.88-2.10).
In addition, nonempathic responses were associated with more negative ratings of communication for 5 of the 7 items: ease of understanding information, covering points of interest, the doctor listening, the doctor caring, and trusting the doctor. For example, for the item “I felt this doctor cared about me,” each nonempathic hospitalist response was associated with a more than doubling of negative patient ratings (aRE: 2.3; 95% CI, 1.32-4.16). Neutral physician responses to patient expressions of negative emotion were associated with less negative patient ratings for 2 of the items: covering points of interest (aRE 0.68; 95% CI, 0.51-0.90) and trusting the doctor (aRE: 0.86; 95% CI, 0.75-0.99).
We did not find a statistical association between encounter length and the number of empathic hospitalist responses in the encounter (percent change in encounter length per response [PC]: 1%; 95% CI, −8%-10%) or the number of nonempathic responses (PC: 18%; 95% CI, −2%-42%). We did find a statistically significant association between the number of neutral responses and encounter length (PC: 13%; 95% CI, 3%-24%), corresponding to 2.5 minutes of additional encounter time per neutral response for the median encounter length of 19 minutes.
DISCUSSION
Our study set out to measure how hospitalists responded to expressions of negative emotion during admission encounters with patients and how those responses correlated with patient anxiety, ratings of communication, and encounter length. We found that empathic responses were associated with diminishing patient anxiety after the visit, as well as with better ratings of several domains of hospitalist communication. Moreover, nonempathic responses to negative emotion were associated with more strongly negative ratings of hospitalist communication. Finally, while clinicians may worry that encouraging patients to speak further about emotion will result in excessive visit lengths, we did not find a statistical association between empathic responses and encounter duration. To our knowledge, this is the first study to indicate an association between empathy and patient anxiety and communication ratings within the hospitalist model, which is rapidly becoming the predominant model for providing inpatient care in the United States.4,5
As in oncologic care, anxiety is an emotion commonly confronted by clinicians meeting admitted medical patients for the first time. Studies show that not only do patient anxiety levels remain high throughout a hospital course, patients who experience higher levels of anxiety tend to stay longer in the hospital.1,2,27-30 But unlike oncologic care or other therapy provided in an outpatient setting, the hospitalist model does not facilitate “continuity” of care, or the ability to care for the same patients over a long period of time. This reality of inpatient care makes rapid, effective rapport-building critical to establishing strong physician-patient relationships. In this setting, a simple communication tool that is potentially able to reduce inpatients’ anxiety could have a meaningful impact on hospitalist-provided care and patient outcomes.
In terms of the magnitude of the effect of empathic responses, the clinical significance of a 1.65-point decrease in the STAI-S anxiety score is not precisely clear. A prior study that examined the effect of music therapy on anxiety levels in patients with cancer found an average anxiety reduction of approximately 9.5 units on the STAIS-S scale after sensitivity analysis, suggesting a rather large meaningful effect size.31 Given we found a reduction of 1.65 points for each empathic response, however, with a range of 0-14 negative emotions expressed over a median 19-minute encounter, there is opportunity for hospitalists to achieve a clinically significant decrease in patient anxiety during an admission encounter. The potential to reduce anxiety is extended further when we consider that the impact of an empathic response may apply not just to the admission encounter alone but also to numerous other patient-clinician interactions over the course of a hospitalization.
A healthy body of communication research supports the associations we found in our study between empathy and patient ratings of communication and physicians. Families in ICU conferences rate communication more positively when physicians express empathy,12 and a number of studies indicate an association between empathy and patient satisfaction in outpatient settings.8 Given the associations we found with negative ratings on the items in our study, promoting empathic responses to expressions of emotion and, more importantly, stressing avoidance of nonempathic responses may be relevant efforts in working to improve patient satisfaction scores on surveys reporting “top box” percentages, such as Hospital Consumer Assessment of Healthcare Providers and Systems (HCAHPS). More notably, evidence indicates that empathy has positive impacts beyond satisfaction surveys, such as adherence, better diagnostic and clinical outcomes, and strengthening of patient enablement.8Not all hospitalist responses to emotion were associated with patient ratings across the 7 communication items we assessed. For example, we did not find an association between how physicians responded to patient expressions of negative emotion and patient perception that enough time was spent in the visit or the degree to which talking with the doctor met a patient’s overall needs. It follows logically, and other research supports, that empathy would influence patient ratings of physician caring and trust,32 whereas other communication factors we were unable to measure (eg, physician body language, tone, and use of jargon and patient health literacy and primary language) may have a more significant association with patient ratings of the other items we assessed.
In considering the clinical application of our results, it is important to note that communication skills, including responding empathically to patient expressions of negative emotion, can be imparted through training in the same way as abdominal examination or electrocardiogram interpretation skills.33-35 However, training of hospitalists in communication skills requires time and some financial investment on the part of the physician, their hospital or group, or, ideally, both. Effective training methods, like those for other skill acquisition, involve learner-centered teaching and practicing skills with role-play and feedback.36 Given the importance of a learner-centered approach, learning would likely be better received and more effective if it was tailored to the specific needs and patient scenarios commonly encountered by hospitalist physicians. As these programs are developed, it will be important to assess the impact of any training on the patient-reported outcomes we assessed in this observational study, along with clinical outcomes.
Our study has several limitations. First, we were only able to evaluate whether hospitalists verbally responded to patient emotion and were thus not able to account for nonverbal empathy such as facial expressions, body language, or voice tone. Second, given our patient consent rate of 63%, patients who agreed to participate in the study may have had different opinions than those who declined to participate. Also, hospitalists and patients may have behaved differently as a result of being audio recorded. We only included patients who spoke English, and our patient population was predominately non-Hispanic white. Patients who spoke other languages or came from other cultural backgrounds may have had different responses. Third, we did not use a single validated scale for patient ratings of communication, and multiple analyses increase our risk of finding statistically significant associations by chance. The skewing of the communication rating items toward high scores may also have led to our results being driven by outliers, although the model we chose for analysis does penalize for this. Furthermore, our sample size was small, leading to wide CIs and potential for lack of statistical associations due to insufficient power. Our findings warrant replication in larger studies. Fourth, the setting of our study in an academic center may affect generalizability. Finally, the age of our data (collected between 2008 and 2009) is also a limitation. Given a recent focus on communication and patient experience since the initiation of HCAHPS feedback, a similar analysis of empathy and communication methods now may result in different outcomes.
In conclusion, our results suggest that enhancing hospitalists’ empathic responses to patient expressions of negative emotion could decrease patient anxiety and improve patients’ perceptions of (and thus possibly their relationships with) hospitalists, without sacrificing efficiency. Future work should focus on tailoring and implementing communication skills training programs for hospitalists and evaluating the impact of training on patient outcomes.
Acknowledgments
The authors extend their sincere thanks to the patients and physicians who participated in this study. Dr. Anderson was funded by the National Palliative Care Research Center and the University of California, San Francisco Clinical and Translational Science Institute Career Development Program, National Institutes of Health (NIH) grant number 5 KL2 RR024130-04. Project costs were funded by a grant from the University of California, San Francisco Academic Senate.
Disclosure
All coauthors have seen and agree with the contents of this manuscript. This submission is not under review by any other publication. Wendy Anderson received funding for this project from the National Palliative Care Research Center, University of California San Francisco Clinical and Translational Science Institute (NIH grant number 5KL2RR024130-04), and the University of San Francisco Academic Senate [From Section 2 of Author Disclosure Form]. Andy Auerbach has a Patient-Centered Outcomes Research Institute research grant in development [From Section 3 of the Author Disclosure Form].
1. Walker FB, Novack DH, Kaiser DL, Knight A, Oblinger P. Anxiety and depression among medical and surgical patients nearing hospital discharge. J Gen Intern Med. 1987;2(2):99-101. PubMed
2. Castillo MI, Cooke M, Macfarlane B, Aitken LM. Factors associated with anxiety in critically ill patients: A prospective observational cohort study. Int J Nurs Stud. 2016;60:225-233. PubMed
3. Anderson WG, Winters K, Auerbach AD. Patient concerns at hospital admission. Arch Intern Med. 2011;171(15):1399-1400. PubMed
4. Kuo Y-F, Sharma G, Freeman JL, Goodwin JS. Growth in the care of older patients by hospitalists in the United States. N Engl J Med. 2009;360(11):1102-1112. PubMed
5. Wachter RM, Goldman L. Zero to 50,000 - The 20th Anniversary of the Hospitalist. N Engl J Med. 2016;375(11):1009-1011. PubMed
6. Mack JW, Block SD, Nilsson M, et al. Measuring therapeutic alliance between oncologists and patients with advanced cancer: the Human Connection Scale. Cancer. 2009;115(14):3302-3311. PubMed
7. Huff NG, Nadig N, Ford DW, Cox CE. Therapeutic Alliance between the Caregivers of Critical Illness Survivors and Intensive Care Unit Clinicians. [published correction appears in Ann Am Thorac Soc. 2016;13(4):576]. Ann Am Thorac Soc. 2015;12(11):1646-1653. PubMed
8. Derksen F, Bensing J, Lagro-Janssen A. Effectiveness of empathy in general practice: a systematic review. Br J Gen Pract. 2013;63(606):e76-e84. PubMed
9. Dwamena F, Holmes-Rovner M, Gaulden CM, et al. Interventions for providers to promote a patient-centred approach in clinical consultations. Cochrane Database Syst Rev. 2012;12:CD003267. PubMed
10. Fogarty LA, Curbow BA, Wingard JR, McDonnell K, Somerfield MR. Can 40 seconds of compassion reduce patient anxiety? J Clin Oncol. 1999;17(1):371-379. PubMed
11. Roter DL, Hall JA, Kern DE, Barker LR, Cole KA, Roca RP. Improving physicians’ interviewing skills and reducing patients’ emotional distress. A randomized clinical trial. Arch Intern Med. 1995;155(17):1877-1884. PubMed
12. Stapleton RD, Engelberg RA, Wenrich MD, Goss CH, Curtis JR. Clinician statements and family satisfaction with family conferences in the intensive care unit. Crit Care Med. 2006;34(6):1679-1685. PubMed
13. Hojat M, Louis DZ, Markham FW, Wender R, Rabinowitz C, Gonnella JS. Physicians’ empathy and clinical outcomes for diabetic patients. Acad Med. 2011;86(3):359-364. PubMed
14. Anderson WG, Winters K, Arnold RM, Puntillo KA, White DB, Auerbach AD. Studying physician-patient communication in the acute care setting: the hospitalist rapport study. Patient Educ Couns. 2011;82(2):275-279. PubMed
15. Pollak KI, Arnold RM, Jeffreys AS, et al. Oncologist communication about emotion during visits with patients with advanced cancer. J Clin Oncol. 2007;25(36):5748-5752. PubMed
16. Suchman AL, Markakis K, Beckman HB, Frankel R. A model of empathic communication in the medical interview. JAMA. 1997;277(8):678-682. PubMed
17. Adams K, Cimino JEW, Arnold RM, Anderson WG. Why should I talk about emotion? Communication patterns associated with physician discussion of patient expressions of negative emotion in hospital admission encounters. Patient Educ Couns. 2012;89(1):44-50. PubMed
18. Julian LJ. Measures of anxiety: State-Trait Anxiety Inventory (STAI), Beck Anxiety Inventory (BAI), and Hospital Anxiety and Depression Scale-Anxiety (HADS-A). Arthritis Care Res (Hoboken). 2011;63 Suppl 11:S467-S472. PubMed
19. Speilberger C, Ritterband L, Sydeman S, Reheiser E, Unger K. Assessment of emotional states and personality traits: measuring psychological vital signs. In: Butcher J, editor. Clinical personality assessment: practical approaches. New York: Oxford University Press; 1995.
20. Safran DG, Kosinski M, Tarlov AR, et al. The Primary Care Assessment Survey: tests of data quality and measurement performance. Med Care. 1998;36(5):728-739. PubMed
21. Azoulay E, Pochard F, Kentish-Barnes N, et al. Risk of post-traumatic stress symptoms in family members of intensive care unit patients. Am J Respir Crit Care Med. 2005;171(9):987-994. PubMed
22. Lynn J. Perspectives on care at the close of life. Serving patients who may die soon and their families: the role of hospice and other services. JAMA. 2001;285(7):925-932. PubMed
23. Kennifer SL, Alexander SC, Pollak KI, et al. Negative emotions in cancer care: do oncologists’ responses depend on severity and type of emotion? Patient Educ Couns. 2009;76(1):51-56. PubMed
24. Butow PN, Brown RF, Cogar S, Tattersall MHN, Dunn SM. Oncologists’ reactions to cancer patients’ verbal cues. Psychooncology. 2002;11(1):47-58. PubMed
25. Levinson W, Gorawara-Bhat R, Lamb J. A study of patient clues and physician responses in primary care and surgical settings. JAMA. 2000;284(8):1021-1027. PubMed
26. Cohen J. A coefficient of agreement for nominal scales. Educ Psychol Meas. 1960;20(1):37-46.
27. Fulop G. Anxiety disorders in the general hospital setting. Psychiatr Med. 1990;8(3):187-195. PubMed
28. Gerson S, Mistry R, Bastani R, et al. Symptoms of depression and anxiety (MHI) following acute medical/surgical hospitalization and post-discharge psychiatric diagnoses (DSM) in 839 geriatric US veterans. Int J Geriatr Psychiatry. 2004;19(12):1155-1167. PubMed
29. Kathol RG, Wenzel RP. Natural history of symptoms of depression and anxiety during inpatient treatment on general medicine wards. J Gen Intern Med. 1992;7(3):287-293. PubMed
30. Unsal A, Unaldi C, Baytemir C. Anxiety and depression levels of inpatients in the city centre of Kirşehir in Turkey. Int J Nurs Pract. 2011;17(4):411-418. PubMed
31. Bradt J, Dileo C, Grocke D, Magill L. Music interventions for improving psychological and physical outcomes in cancer patients. [Update appears in Cochrane Database Syst Rev. 2016;(8):CD006911] Cochrane Database Syst Rev. 2011;(8):CD006911. PubMed
32. Kim SS, Kaplowitz S, Johnston MV. The effects of physician empathy on patient satisfaction and compliance. Eval Health Prof. 2004;27(3):237-251. PubMed
33. Tulsky JA, Arnold RM, Alexander SC, et al. Enhancing communication between oncologists and patients with a computer-based training program: a randomized trial. Ann Intern Med. 2011;155(9):593-601. PubMed
34. Bays AM, Engelberg RA, Back AL, et al. Interprofessional communication skills training for serious illness: evaluation of a small-group, simulated patient intervention. J Palliat Med. 2014;17(2):159-166. PubMed
35. Epstein RM, Duberstein PR, Fenton JJ, et al. Effect of a Patient-Centered Communication Intervention on Oncologist-Patient Communication, Quality of Life, and Health Care Utilization in Advanced Cancer: The VOICE Randomized Clinical Trial. JAMA Oncol. 2017;3(1):92-100. PubMed
36. Berkhof M, van Rijssen HJ, Schellart AJM, Anema JR, van der Beek AJ. Effective training strategies for teaching communication skills to physicians: an overview of systematic reviews. Patient Educ Couns. 2011;84(2):152-162. PubMed
© 2017 Society of Hospital Medicine
Sound and Light Levels Are Similarly Disruptive in ICU and non-ICU Wards
The hospital environment fails to promote adequate sleep for acutely or critically ill patients. Intensive care units (ICUs) have received the most scrutiny, because critically ill patients suffer from severely fragmented sleep as well as a lack of deeper, more restorative sleep.1-4 ICU survivors frequently cite sleep deprivation, contributed to by ambient noise, as a major stressor while receiving care.5,6 Importantly, efforts to modify the ICU environment to promote sleep have been associated with reductions in delirium.7,8 However, sleep deprivation and delirium in the hospital are not limited to ICU patients.
Sleep in the non-ICU setting is also notoriously poor, with 50%-80% of patients reporting sleep as “unsound” or otherwise subjectively poor.9-11 Additionally, patients frequently ask for and/or receive pharmacological sleeping aids12 despite little evidence of efficacy13 and increasing evidence of harm.14 Here too, efforts to improve sleep seems to attenuate risk of delirium,15 which remains a substantial problem on general wards, with incidence reported as high as 20%-30%. The reasons for poor sleep in the hospital are multifactorial, but data suggest that the inpatient environment, including noise and light levels, which are measurable and modifiable entities, contribute significantly to the problem.16
The World Health Organization (WHO) recommends that nighttime baseline noise levels do not exceed 30 decibels (dB) and that nighttime noise peaks (ie, loud noises) do not exceed 40 dB17; most studies suggest that ICU and general ward rooms are above this range on average.10,18 Others have also demonstrated an association between loud noises and patients’ subjective perception of poor sleep.10,19 However, when considering clinically important noise, peak and average noise levels may not be the key factor in causing arousals from sleep. Buxton and colleagues20 found that noise quality affects arousal probability; for example, electronic alarms and conversational noise are more likely to cause awakenings compared with the opening or closing of doors and ice machines. Importantly, peak and average noise levels may also matter less for sleep than do sound level changes (SLCs), which are defined as the difference between background/baseline noise and peak noise. Using healthy subjects exposed to simulated ICU noise, Stanchina et al.21 found that SLCs >17.5 dB were more likely to cause polysomnographic arousals from sleep regardless of peak noise level. This sound pressure change of approximately 20 dB would be perceived as 4 times louder, or, as an example, would be the difference between normal conversation between 2 people (~40 dB) that is then interrupted by the start of a vacuum cleaner (~60 dB). To our knowledge, no other studies have closely examined SLCs in different hospital environments.
Ambient light also likely affects sleep quality in the hospital. The circadian rhythm system, which controls the human sleep–wake cycle as well as multiple other physiologic functions, depends on ambient light as the primary external factor for regulating the internal clock.22,23 Insufficient and inappropriately timed light exposure can desynchronize the biological clock, thereby negatively affecting sleep quality.24,25 Conversely, patients exposed to early-morning bright light may sleep better while in the hospital.16 In addition to sleep patterns, ambient light affects other aspects of patient care; for example, lower light levels in the hospital have recently been associated with higher levels of fatigue and mood disturbance.26A growing body of data has investigated the ambient environment in the ICU, but fewer studies have focused on sound and light analysis in other inpatient areas such as the general ward and telemetry floors. We examined sound and light levels in the ICU and non-ICU environment, hypothesizing that average sound levels would be higher in the ICU than on non-ICU floors but that the number of SLCs >17.5 dB would be similar. Additionally, we expected that average light levels would be higher in the ICU than on non-ICU floors.
METHODS
This was an observational study of the sound and light environment in the inpatient setting. Per our Institutional Review Board, no consent was required. Battery-operated sound-level (SDL600, Extech Instruments, Nashua, NH) and light-level (SDL400, Extech Instruments, Nashua, NH) meters were placed in 24 patient rooms in our tertiary-care adult hospital in La Jolla, CA. Recordings were obtained in randomly selected, single-patient occupied rooms that were from 3 different hospital units and included 8 general ward rooms, 8 telemetry floor rooms, and 8 ICU rooms. We recorded for approximately 24-72 hours. Depending on the geographic layout of the room, meters were placed as close to the head of the patient’s bed as possible and were generally not placed farther than 2 meters away from the patient’s head of bed; all rooms contained a window.
Sound Measurements
Sound meters measured ambient noise in dB every 2 seconds and were set for A-weighted frequency measurements. We averaged individual data points to obtain hourly averages for ICU and non-ICU rooms. For hourly sound averages, we further separated the data to compare the general ward telemetry floors (both non-ICU), the latter of which has more patient monitoring and a lower nurse-to-patient ratio compared with the general ward floor.
Data from ICU versus non-ICU rooms were analyzed for the number of sound peaks throughout the 24-hour day and for sound peak over the nighttime, defined as the number of times sound levels exceeded 65 dB, 70 dB, or 80 dB, which were averaged over 24 hours and over the nighttime (10 PM to 6 AM). We also calculated the number of average SLCs ≥17.5 dB observed over 24 hours and over the nighttime.
Light Measurements
Light meters measured luminescence in lux at a frequency of 120 seconds. We averaged individual data points to obtain hourly averages for ICU and non-ICU rooms. In addition to hourly averages, light-level data were analyzed for maximum levels throughout the day and night.
Statistical Analysis
Hourly sound-level averages between the 3 floors were evaluated using a 1-way analysis of variance (ANOVA); sound averages from the general ward and telemetry floor were also compared at each hour using a Student t test. Light-level data, sound-level peak data, as well as SLC data were also evaluated using a Student t test.
RESULTS
Sound Measurements
Examples of the raw data distribution for individual sound recordings in an ICU and non-ICU room are shown in Figure 1A and 1B. Sound-level analysis with specific average values and significance levels between ICU and non-ICU rooms (with non-ICU rooms further divided between telemetry and general ward floors for purposes of hourly averages) are shown in Table 1. The average hourly values in all 3 locations were always above the 30-35 dB level (nighttime and daytime, respectively) recommended by the WHO (Figure 1C). A 1-way ANOVA analysis revealed significant differences between the 3 floors at all time points except for 10 AM. An analysis of the means at each time point between the telemetry floor and the general ward floor showed that the telemetry floor had significantly higher sound averages compared with the general ward floor at 10 PM, 11 PM, and 12 AM. Sound levels dropped during the nighttime on both non-ICU wards but remained fairly constant throughout the day and night in the ICU.
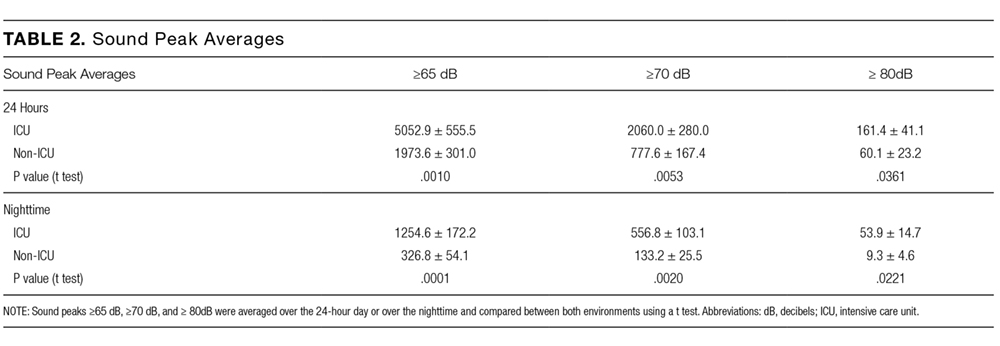
Importantly, despite average and peak sound levels showing that the ICU environment is louder overall, there were an equivalent number of SLCs ≥ 17.5 dB in the ICU and on non-ICU floors. The number of SLCs ≥ 17.5 dB is not statistically different when comparing ICU and non-ICU rooms either averaged over 24 hours or averaged over the nighttime (Figure 1E).
Light Measurements
Examples of light levels over a 24-hour period in an ICU and non-ICU room are shown in Figure 2A and 2B, respectively. Maximum average light levels (reported here as average value ± standard deviation to demonstrate variability within the data) in the ICU were 169.7 ± 127.1 lux and occurred at 1 PM, while maximum average light levels in the non-ICU rooms were 213.5 ± 341.6 lux and occurred at 5 PM (Figure 2C). Average light levels in the morning hours remained low and ranged from 15.9 ± 12.7 lux to 38.9 ± 43.4 lux in the ICU and from 22.3 ± 17.5 lux to 100.7 ± 92.0 lux on the non-ICU floors. The maximum measured level from any of the recordings was 2530 lux and occurred in a general ward room in the 5 PM hour. Overall, light averages remained low, but this particular room had light levels that were significantly higher than the others. A t test analysis of the hourly averages revealed only 1 time point of significant difference between the 2 floors; at 7 AM, the general ward floor had a higher lux level of 49.9 ± 27.5 versus 19.2 ± 10.7 in the ICU (P = 0.038). Otherwise, there were no differences between light levels in ICU rooms versus non-ICU rooms. Evaluation of the data revealed a substantial amount of variability in light levels throughout the daytime hours. Light levels during the nighttime remained low and were not significantly different between the 2 groups.
DISCUSSION
To our knowledge, this is the first study to directly compare the ICU and non-ICU environment for its potential impact on sleep and circadian alignment. Our study adds to the literature with several novel findings. First, average sound levels on non-ICU wards are lower than in the ICU. Second, although quieter on average, SLCs >17.5 dB occurred an equivalent number of times for both the ICU and non-ICU wards. Third, average daytime light levels in both the ICU and non-ICU environment are low. Lastly, peak light levels for both ICU and non-ICU wards occur later in the day instead of in the morning. All of the above have potential impact for optimizing the ward environment to better aid in sleep for patients.
Sound-Level Findings
Data on sound levels for non-ICU floors are limited but mostly consistent with our finding
Average and peak sound levels contribute to the ambient noise experienced by patients but may not be the source of sleep disruptions. Using polysomnography in healthy subjects exposed to recordings of ICU noise, Stanchina et al.21 showed that SLCs from baseline and not peak sound levels determined whether a subject was aroused from sleep by sound. Accordingly, they also found that increasing baseline sound levels by using white noise reduced the number of arousals that subjects experienced. To our knowledge, other studies have not quantified and compared SLCs in the ICU and non-ICU environments. Our data show that patients on non-ICU floors experience at least the same number of SLCs, and thereby the same potential for arousals from sleep, when compared with ICU patients. The higher baseline level of noise in the ICU likely explains the relatively lower number of SLCs when compared with the non-ICU floors. Although decreasing overall noise to promote sleep in the hospital seems like the obvious solution, the treatment for noise pollution in the hospital may actually be more background noise, not less.
Recent studies support the clinical implications of our findings. First, decreasing overall noise levels is difficult to accomplish.29 Second, recent studies utilized white noise in different hospital settings with some success in improving patients’ subjective sleep quality, although more studies using objective data measurements are needed to further understand the impact of white noise on sleep in hospitalized patients.30,31 Third, efforts at reducing interruptions—which likely will decrease the number of SLCs—such as clustering nursing care or reducing intermittent alarms may be more beneficial in improving sleep than efforts at decreasing average sound levels. For example, Bartick et al. reduced the number of patient interruptions at night by eliminating routine vital signs and clustering medication administration. Although they included other interventions as well, we note that this approach likely reduced SLCs and was associated with a reduction in the use of sedative medications.32 Ultimately, our data show that a focus on reducing SLCs will be one necessary component of a multipronged solution to improving inpatient sleep.33
Light-Level Findings
Because of its effect on circadian rhythms, the daily light-dark cycle has a powerful impact on human physiology and behavior, which includes sleep.34 Little is understood about how light affects sleep and other circadian-related functions in general ward patients, as it is not commonly measured. Our findings suggest that patients admitted to the hospital are exposed to light levels and patterns that may not optimally promote wake and sleep. Encouragingly, we did not find excessive average light levels during the nighttime in either ICU or non-ICU environment of our hospital, although others have described intrusive nighttime light in the hospital setting.35,36 Even short bursts of low or moderate light during the nighttime can cause circadian phase delay,37 and efforts to maintain darkness in patient rooms at night should continue.
Our measurements show that average daytime light levels did not exceed 250 lux, which corresponds to low, office-level lighting, while the brightest average light levels occurred in the afternoon for both environments. These levels are consistent with other reports26,35,36 as is the light-level variability noted throughout the day (which is not unexpected given room positioning, patient preference, curtains, etc). The level and amount of daytime light needed to maintain circadian rhythms in humans is still unknown.38 Brighter light is generally more effective at influencing the circadian pacemaker in a dose-dependent manner.39 Although entrainment (synchronization of the body’s biological rhythm with environmental cues such as ambient light) of the human circadian rhythm has been shown with low light levels (eg, <100 lux), these studies included healthy volunteers in a carefully controlled, constant, routine environment.23 How these data apply to acutely ill subjects in the hospital environment is not clear. We note that low to moderate levels of light (50-1000 lux) are less effective for entrainment of the circadian rhythm in older people (age >65 years, the majority of our admissions) compared with younger people. Thus, older, hospitalized patients may require greater light levels for regulation of the sleep-wake cycle.40 These data are important when designing interventions to improve light for and maintain circadian rhythms in hospitalized patients. For example, Simons et al. found that dynamic light-application therapy, which achieved a maximum average lux level of <800 lux, did not reduce rates of delirium in critically ill patients (mean age ~65). One interpretation of these results, though there are many others, is that the light levels achieved were not high enough to influence circadian timing in hospitalized, mostly elderly patients. The physiological impact of light on the circadian rhythm in hospitalized patients still remains to be measured.
LIMITATIONS
Our study does have a few limitations. We did not assess sound quality, which is another determinant of arousal potential.20 Also, a shorter measurement interval might be useful in determining sharper sound increases. It may also be important to consider A- versus C-weighted measurements of sound levels, as A-weighted measurements usually reflect higher-frequency sound while C-weighted measurements usually reflect low-frequency noise18; we obtained only A-weighted measurements in our study. However, A-weighted measurements are generally considered more reflective of what the human ear considers noise and are used more standardly than C-weighted measurements.
Regarding light measurements, we recorded from rooms facing different cardinal directions and during different times of the year, which likely contributed to some of the variability in the daytime light levels on both floors. Additionally, light levels were not measured directly at the patient’s eye level. However, given that overhead fluorescent lighting was the primary source of lighting, it is doubtful that we substantially underestimated optic-nerve light levels. In the future, it may also be important to measure the different wavelengths of lights, as blue light may have a greater impact on sleep than other wavelengths.41 Although our findings align with others’, we note that this was a single-center study, which could limit the generalizability of our findings given inter-hospital variations in patient volume, interior layout and structure, and geographic location.
CONCLUSIONS
Overall, our study suggests that the light and sound environment for sleep in the inpatient setting, including both the ICU and non-ICU wards, has multiple areas for improvement. Our data also suggest specific directions for future clinical efforts at improvement. For example, efforts to decrease average sound levels may worsen sleep fragmentation. Similarly, more light during the day may be more helpful than further attempts to limit light during the night.
Disclosure
This research was funded in part by a NIH/NCATS flagship Clinical and Translational Science Award Grant (5KL2TR001112). None of the authors report any conflict of interest, financial or otherwise, in the preparation of this article.
1. Freedman NS, Gazendam J, Levan L, Pack AI, Schwab RJ. Abnormal sleep/wake
cycles and the effect of environmental noise on sleep disruption in the intensive
care unit. Am J Respir Crit Care Med. 2001;163(2):451-457. PubMed
2. Watson PL, Pandharipande P, Gehlbach BK, et al. Atypical sleep in ventilated
patients: empirical electroencephalography findings and the path toward revised ICU sleep scoring criteria. Crit Care Med. 2013;41(8):1958-1967. PubMed
3. Gehlbach BK, Chapotot F, Leproult R, et al. Temporal disorganization of circadian rhythmicity and sleep-wake regulation in mechanically ventilated patients receiving continuous intravenous sedation. Sleep. 2012;35(8):1105-1114. PubMed
4. Elliott R, McKinley S, Cistulli P, Fien M. Characterisation of sleep in intensive care using 24-hour polysomnography: an observational study. Crit Care. 2013;17(2):R46. PubMed
5. Novaes MA, Aronovich A, Ferraz MB, Knobel E. Stressors in ICU: patients’ evaluation. Intensive Care Med. 1997;23(12):1282-1285. PubMed
6. Tembo AC, Parker V, Higgins I. The experience of sleep deprivation in intensive care patients: findings from a larger hermeneutic phenomenological study. Intensive Crit Care Nurs. 2013;29(6):310-316. PubMed
7. Kamdar BB, Yang J, King LM, et al. Developing, implementing, and evaluating a multifaceted quality improvement intervention to promote sleep in an ICU. Am J Med Qual. 2014;29(6):546-554. PubMed
8. Patel J, Baldwin J, Bunting P, Laha S. The effect of a multicomponent multidisciplinary bundle of interventions on sleep and delirium in medical and surgical intensive care patients. Anaesthesia. 2014;69(6):540-549. PubMed
9. Manian FA, Manian CJ. Sleep quality in adult hospitalized patients with infection: an observational study. Am J Med Sci. 2015;349(1):56-60. PubMed
10. Park MJ, Yoo JH, Cho BW, Kim KT, Jeong WC, Ha M. Noise in hospital rooms and sleep disturbance in hospitalized medical patients. Environ Health Toxicol. 2014;29:e2014006. PubMed
11. Dobing S, Frolova N, McAlister F, Ringrose J. Sleep quality and factors influencing self-reported sleep duration and quality in the general internal medicine inpatient population. PLoS One. 2016;11(6):e0156735. PubMed
12. Gillis CM, Poyant JO, Degrado JR, Ye L, Anger KE, Owens RL. Inpatient pharmacological
sleep aid utilization is common at a tertiary medical center. J Hosp Med. 2014;9(10):652-657. PubMed
13. Krenk L, Jennum P, Kehlet H. Postoperative sleep disturbances after zolpidem treatment in fast-track hip and knee replacement. J Clin Sleep Med. 2014;10(3):321-326. PubMed
14. Kolla BP, Lovely JK, Mansukhani MP, Morgenthaler TI. Zolpidem is independently
associated with increased risk of inpatient falls. J Hosp Med. 2013;8(1):1-6. PubMed
15. Inouye SK, Bogardus ST Jr, Charpentier PA, et al. A multicomponent intervention to prevent delirium in hospitalized older patients. N Engl J Med. 1999;340(9):669-676. PubMed
16. Bano M, Chiaromanni F, Corrias M, et al. The influence of environmental factors on sleep quality in hospitalized medical patients. Front Neurol. 2014;5:267. PubMed
17. Berglund BLTSD. Guidelines for Community Noise. World Health Organization. 1999.
18. Knauert M, Jeon S, Murphy TE, Yaggi HK, Pisani MA, Redeker NS. Comparing average levels and peak occurrence of overnight sound in the medical intensive care unit on A-weighted and C-weighted decibel scales. J Crit Care. 2016;36:1-7. PubMed
19. Yoder JC, Staisiunas PG, Meltzer DO, Knutson KL, Arora VM. Noise and sleep among adult medical inpatients: far from a quiet night. Arch Intern Med. 2012;172(1):68-70. PubMed
20. Buxton OM, Ellenbogen JM, Wang W, et al. Sleep disruption due to hospital noises: a prospective evaluation. Ann Intern Med. 2012;157(3):170-179. PubMed
21. Stanchina ML, Abu-Hijleh M, Chaudhry BK, Carlisle CC, Millman RP. The influence of white noise on sleep in subjects exposed to ICU noise. Sleep Med. 2005;6(5):423-428. PubMed
22. Czeisler CA, Allan JS, Strogatz SH, et al. Bright light resets the human circadian pacemaker independent of the timing of the sleep-wake cycle. Science. 1986;233(4764):667-671. PubMed
23. Duffy JF, Czeisler CA. Effect of light on human circadian physiology. Sleep Med Clin. 2009;4(2):165-177. PubMed
24. Lewy AJ, Wehr TA, Goodwin FK, Newsome DA, Markey SP. Light suppresses melatonin secretion in humans. Science. 1980;210(4475):1267-1269. PubMed
25. Zeitzer JM, Dijk DJ, Kronauer R, Brown E, Czeisler C. Sensitivity of the human circadian pacemaker to nocturnal light: melatonin phase resetting and suppression. J Physiol. 2000;526:695-702. PubMed
26. Bernhofer EI, Higgins PA, Daly BJ, Burant CJ, Hornick TR. Hospital lighting and its association with sleep, mood and pain in medical inpatients. J Adv Nurs. 2014;70(5):1164-1173. PubMed
27. Darbyshire JL, Young JD. An investigation of sound levels on intensive care units with reference to the WHO guidelines. Crit Care. 2013;17(5):R187. PubMed
28. Gillis S. Pharmacologic treatment of depression during pregnancy. J Midwifery Womens Health. 2000;45(4):357-359. PubMed
29. Tainter CR, Levine AR, Quraishi SA, et al. Noise levels in surgical ICUs are consistently above recommended standards. Crit Care Med. 2016;44(1):147-152. PubMed
30. Farrehi PM, Clore KR, Scott JR, Vanini G, Clauw DJ. Efficacy of Sleep Tool Education During Hospitalization: A Randomized Controlled Trial. Am J Med. 2016;129(12):1329.e9-1329.e17. PubMed
31. Farokhnezhad Afshar P, Bahramnezhad F, Asgari P, Shiri M. Effect of white noise on sleep in patients admitted to a coronary care. J Caring Sci. 2016;5(2):103-109. PubMed
32. Bartick MC, Thai X, Schmidt T, Altaye A, Solet JM. Decrease in as-needed sedative use by limiting nighttime sleep disruptions from hospital staff. J Hosp Med. 2010;5(3):E20-E24. PubMed
33. Tamrat R, Huynh-Le MP, Goyal M. Non-pharmacologic interventions to improve the sleep of hospitalized patients: a systematic review. J Gen Intern Med. 2014;29(5):788-795. PubMed
34. Dijk DJ, Archer SN. Light, sleep, and circadian rhythms: together again. PLoS Biol. 2009;7(6):e1000145. PubMed
35. Verceles AC, Liu X, Terrin ML, et al. Ambient light levels and critical care outcomes. J Crit Care. 2013;28(1):110.e1-110.e8. PubMed
36. Hu RF, Hegadoren KM, Wang XY, Jiang XY. An investigation of light and sound levels on intensive care units in China. Aust Crit Care. 2016;29(2):62-67. PubMed
37. Zeitzer JM, Ruby NF, Fisicaro RA, Heller HC. Response of the human circadian system to millisecond flashes of light. PLoS One. 2011;6(7):e22078. PubMed
38. Duffy JF, Wright KP, Jr. Entrainment of the human circadian system by light. J Biol Rhythms. 2005;20(4):326-338. PubMed
39. Wright KP Jr, Gronfier C, Duffy JF, Czeisler CA. Intrinsic period and light intensity determine the phase relationship between melatonin and sleep in humans. J Biol Rhythms. 2005;20(2):168-177. PubMed
40. Duffy JF, Zeitzer JM, Czeisler CA. Decreased sensitivity to phase-delaying effects of moderate intensity light in older subjects. Neurobiol Aging. 2007;28(5):799-807. PubMed
41. Figueiro MG, Plitnick BA, Lok A, et al. Tailored lighting intervention improves measures of sleep, depression, and agitation in persons with Alzheimer’s disease and related dementia living in long-term care facilities. Clin Interv Aging. 2014;9:1527-1537. PubMed
The hospital environment fails to promote adequate sleep for acutely or critically ill patients. Intensive care units (ICUs) have received the most scrutiny, because critically ill patients suffer from severely fragmented sleep as well as a lack of deeper, more restorative sleep.1-4 ICU survivors frequently cite sleep deprivation, contributed to by ambient noise, as a major stressor while receiving care.5,6 Importantly, efforts to modify the ICU environment to promote sleep have been associated with reductions in delirium.7,8 However, sleep deprivation and delirium in the hospital are not limited to ICU patients.
Sleep in the non-ICU setting is also notoriously poor, with 50%-80% of patients reporting sleep as “unsound” or otherwise subjectively poor.9-11 Additionally, patients frequently ask for and/or receive pharmacological sleeping aids12 despite little evidence of efficacy13 and increasing evidence of harm.14 Here too, efforts to improve sleep seems to attenuate risk of delirium,15 which remains a substantial problem on general wards, with incidence reported as high as 20%-30%. The reasons for poor sleep in the hospital are multifactorial, but data suggest that the inpatient environment, including noise and light levels, which are measurable and modifiable entities, contribute significantly to the problem.16
The World Health Organization (WHO) recommends that nighttime baseline noise levels do not exceed 30 decibels (dB) and that nighttime noise peaks (ie, loud noises) do not exceed 40 dB17; most studies suggest that ICU and general ward rooms are above this range on average.10,18 Others have also demonstrated an association between loud noises and patients’ subjective perception of poor sleep.10,19 However, when considering clinically important noise, peak and average noise levels may not be the key factor in causing arousals from sleep. Buxton and colleagues20 found that noise quality affects arousal probability; for example, electronic alarms and conversational noise are more likely to cause awakenings compared with the opening or closing of doors and ice machines. Importantly, peak and average noise levels may also matter less for sleep than do sound level changes (SLCs), which are defined as the difference between background/baseline noise and peak noise. Using healthy subjects exposed to simulated ICU noise, Stanchina et al.21 found that SLCs >17.5 dB were more likely to cause polysomnographic arousals from sleep regardless of peak noise level. This sound pressure change of approximately 20 dB would be perceived as 4 times louder, or, as an example, would be the difference between normal conversation between 2 people (~40 dB) that is then interrupted by the start of a vacuum cleaner (~60 dB). To our knowledge, no other studies have closely examined SLCs in different hospital environments.
Ambient light also likely affects sleep quality in the hospital. The circadian rhythm system, which controls the human sleep–wake cycle as well as multiple other physiologic functions, depends on ambient light as the primary external factor for regulating the internal clock.22,23 Insufficient and inappropriately timed light exposure can desynchronize the biological clock, thereby negatively affecting sleep quality.24,25 Conversely, patients exposed to early-morning bright light may sleep better while in the hospital.16 In addition to sleep patterns, ambient light affects other aspects of patient care; for example, lower light levels in the hospital have recently been associated with higher levels of fatigue and mood disturbance.26A growing body of data has investigated the ambient environment in the ICU, but fewer studies have focused on sound and light analysis in other inpatient areas such as the general ward and telemetry floors. We examined sound and light levels in the ICU and non-ICU environment, hypothesizing that average sound levels would be higher in the ICU than on non-ICU floors but that the number of SLCs >17.5 dB would be similar. Additionally, we expected that average light levels would be higher in the ICU than on non-ICU floors.
METHODS
This was an observational study of the sound and light environment in the inpatient setting. Per our Institutional Review Board, no consent was required. Battery-operated sound-level (SDL600, Extech Instruments, Nashua, NH) and light-level (SDL400, Extech Instruments, Nashua, NH) meters were placed in 24 patient rooms in our tertiary-care adult hospital in La Jolla, CA. Recordings were obtained in randomly selected, single-patient occupied rooms that were from 3 different hospital units and included 8 general ward rooms, 8 telemetry floor rooms, and 8 ICU rooms. We recorded for approximately 24-72 hours. Depending on the geographic layout of the room, meters were placed as close to the head of the patient’s bed as possible and were generally not placed farther than 2 meters away from the patient’s head of bed; all rooms contained a window.
Sound Measurements
Sound meters measured ambient noise in dB every 2 seconds and were set for A-weighted frequency measurements. We averaged individual data points to obtain hourly averages for ICU and non-ICU rooms. For hourly sound averages, we further separated the data to compare the general ward telemetry floors (both non-ICU), the latter of which has more patient monitoring and a lower nurse-to-patient ratio compared with the general ward floor.
Data from ICU versus non-ICU rooms were analyzed for the number of sound peaks throughout the 24-hour day and for sound peak over the nighttime, defined as the number of times sound levels exceeded 65 dB, 70 dB, or 80 dB, which were averaged over 24 hours and over the nighttime (10 PM to 6 AM). We also calculated the number of average SLCs ≥17.5 dB observed over 24 hours and over the nighttime.
Light Measurements
Light meters measured luminescence in lux at a frequency of 120 seconds. We averaged individual data points to obtain hourly averages for ICU and non-ICU rooms. In addition to hourly averages, light-level data were analyzed for maximum levels throughout the day and night.
Statistical Analysis
Hourly sound-level averages between the 3 floors were evaluated using a 1-way analysis of variance (ANOVA); sound averages from the general ward and telemetry floor were also compared at each hour using a Student t test. Light-level data, sound-level peak data, as well as SLC data were also evaluated using a Student t test.
RESULTS
Sound Measurements
Examples of the raw data distribution for individual sound recordings in an ICU and non-ICU room are shown in Figure 1A and 1B. Sound-level analysis with specific average values and significance levels between ICU and non-ICU rooms (with non-ICU rooms further divided between telemetry and general ward floors for purposes of hourly averages) are shown in Table 1. The average hourly values in all 3 locations were always above the 30-35 dB level (nighttime and daytime, respectively) recommended by the WHO (Figure 1C). A 1-way ANOVA analysis revealed significant differences between the 3 floors at all time points except for 10 AM. An analysis of the means at each time point between the telemetry floor and the general ward floor showed that the telemetry floor had significantly higher sound averages compared with the general ward floor at 10 PM, 11 PM, and 12 AM. Sound levels dropped during the nighttime on both non-ICU wards but remained fairly constant throughout the day and night in the ICU.
Importantly, despite average and peak sound levels showing that the ICU environment is louder overall, there were an equivalent number of SLCs ≥ 17.5 dB in the ICU and on non-ICU floors. The number of SLCs ≥ 17.5 dB is not statistically different when comparing ICU and non-ICU rooms either averaged over 24 hours or averaged over the nighttime (Figure 1E).
Light Measurements
Examples of light levels over a 24-hour period in an ICU and non-ICU room are shown in Figure 2A and 2B, respectively. Maximum average light levels (reported here as average value ± standard deviation to demonstrate variability within the data) in the ICU were 169.7 ± 127.1 lux and occurred at 1 PM, while maximum average light levels in the non-ICU rooms were 213.5 ± 341.6 lux and occurred at 5 PM (Figure 2C). Average light levels in the morning hours remained low and ranged from 15.9 ± 12.7 lux to 38.9 ± 43.4 lux in the ICU and from 22.3 ± 17.5 lux to 100.7 ± 92.0 lux on the non-ICU floors. The maximum measured level from any of the recordings was 2530 lux and occurred in a general ward room in the 5 PM hour. Overall, light averages remained low, but this particular room had light levels that were significantly higher than the others. A t test analysis of the hourly averages revealed only 1 time point of significant difference between the 2 floors; at 7 AM, the general ward floor had a higher lux level of 49.9 ± 27.5 versus 19.2 ± 10.7 in the ICU (P = 0.038). Otherwise, there were no differences between light levels in ICU rooms versus non-ICU rooms. Evaluation of the data revealed a substantial amount of variability in light levels throughout the daytime hours. Light levels during the nighttime remained low and were not significantly different between the 2 groups.
DISCUSSION
To our knowledge, this is the first study to directly compare the ICU and non-ICU environment for its potential impact on sleep and circadian alignment. Our study adds to the literature with several novel findings. First, average sound levels on non-ICU wards are lower than in the ICU. Second, although quieter on average, SLCs >17.5 dB occurred an equivalent number of times for both the ICU and non-ICU wards. Third, average daytime light levels in both the ICU and non-ICU environment are low. Lastly, peak light levels for both ICU and non-ICU wards occur later in the day instead of in the morning. All of the above have potential impact for optimizing the ward environment to better aid in sleep for patients.
Sound-Level Findings
Data on sound levels for non-ICU floors are limited but mostly consistent with our finding
Average and peak sound levels contribute to the ambient noise experienced by patients but may not be the source of sleep disruptions. Using polysomnography in healthy subjects exposed to recordings of ICU noise, Stanchina et al.21 showed that SLCs from baseline and not peak sound levels determined whether a subject was aroused from sleep by sound. Accordingly, they also found that increasing baseline sound levels by using white noise reduced the number of arousals that subjects experienced. To our knowledge, other studies have not quantified and compared SLCs in the ICU and non-ICU environments. Our data show that patients on non-ICU floors experience at least the same number of SLCs, and thereby the same potential for arousals from sleep, when compared with ICU patients. The higher baseline level of noise in the ICU likely explains the relatively lower number of SLCs when compared with the non-ICU floors. Although decreasing overall noise to promote sleep in the hospital seems like the obvious solution, the treatment for noise pollution in the hospital may actually be more background noise, not less.
Recent studies support the clinical implications of our findings. First, decreasing overall noise levels is difficult to accomplish.29 Second, recent studies utilized white noise in different hospital settings with some success in improving patients’ subjective sleep quality, although more studies using objective data measurements are needed to further understand the impact of white noise on sleep in hospitalized patients.30,31 Third, efforts at reducing interruptions—which likely will decrease the number of SLCs—such as clustering nursing care or reducing intermittent alarms may be more beneficial in improving sleep than efforts at decreasing average sound levels. For example, Bartick et al. reduced the number of patient interruptions at night by eliminating routine vital signs and clustering medication administration. Although they included other interventions as well, we note that this approach likely reduced SLCs and was associated with a reduction in the use of sedative medications.32 Ultimately, our data show that a focus on reducing SLCs will be one necessary component of a multipronged solution to improving inpatient sleep.33
Light-Level Findings
Because of its effect on circadian rhythms, the daily light-dark cycle has a powerful impact on human physiology and behavior, which includes sleep.34 Little is understood about how light affects sleep and other circadian-related functions in general ward patients, as it is not commonly measured. Our findings suggest that patients admitted to the hospital are exposed to light levels and patterns that may not optimally promote wake and sleep. Encouragingly, we did not find excessive average light levels during the nighttime in either ICU or non-ICU environment of our hospital, although others have described intrusive nighttime light in the hospital setting.35,36 Even short bursts of low or moderate light during the nighttime can cause circadian phase delay,37 and efforts to maintain darkness in patient rooms at night should continue.
Our measurements show that average daytime light levels did not exceed 250 lux, which corresponds to low, office-level lighting, while the brightest average light levels occurred in the afternoon for both environments. These levels are consistent with other reports26,35,36 as is the light-level variability noted throughout the day (which is not unexpected given room positioning, patient preference, curtains, etc). The level and amount of daytime light needed to maintain circadian rhythms in humans is still unknown.38 Brighter light is generally more effective at influencing the circadian pacemaker in a dose-dependent manner.39 Although entrainment (synchronization of the body’s biological rhythm with environmental cues such as ambient light) of the human circadian rhythm has been shown with low light levels (eg, <100 lux), these studies included healthy volunteers in a carefully controlled, constant, routine environment.23 How these data apply to acutely ill subjects in the hospital environment is not clear. We note that low to moderate levels of light (50-1000 lux) are less effective for entrainment of the circadian rhythm in older people (age >65 years, the majority of our admissions) compared with younger people. Thus, older, hospitalized patients may require greater light levels for regulation of the sleep-wake cycle.40 These data are important when designing interventions to improve light for and maintain circadian rhythms in hospitalized patients. For example, Simons et al. found that dynamic light-application therapy, which achieved a maximum average lux level of <800 lux, did not reduce rates of delirium in critically ill patients (mean age ~65). One interpretation of these results, though there are many others, is that the light levels achieved were not high enough to influence circadian timing in hospitalized, mostly elderly patients. The physiological impact of light on the circadian rhythm in hospitalized patients still remains to be measured.
LIMITATIONS
Our study does have a few limitations. We did not assess sound quality, which is another determinant of arousal potential.20 Also, a shorter measurement interval might be useful in determining sharper sound increases. It may also be important to consider A- versus C-weighted measurements of sound levels, as A-weighted measurements usually reflect higher-frequency sound while C-weighted measurements usually reflect low-frequency noise18; we obtained only A-weighted measurements in our study. However, A-weighted measurements are generally considered more reflective of what the human ear considers noise and are used more standardly than C-weighted measurements.
Regarding light measurements, we recorded from rooms facing different cardinal directions and during different times of the year, which likely contributed to some of the variability in the daytime light levels on both floors. Additionally, light levels were not measured directly at the patient’s eye level. However, given that overhead fluorescent lighting was the primary source of lighting, it is doubtful that we substantially underestimated optic-nerve light levels. In the future, it may also be important to measure the different wavelengths of lights, as blue light may have a greater impact on sleep than other wavelengths.41 Although our findings align with others’, we note that this was a single-center study, which could limit the generalizability of our findings given inter-hospital variations in patient volume, interior layout and structure, and geographic location.
CONCLUSIONS
Overall, our study suggests that the light and sound environment for sleep in the inpatient setting, including both the ICU and non-ICU wards, has multiple areas for improvement. Our data also suggest specific directions for future clinical efforts at improvement. For example, efforts to decrease average sound levels may worsen sleep fragmentation. Similarly, more light during the day may be more helpful than further attempts to limit light during the night.
Disclosure
This research was funded in part by a NIH/NCATS flagship Clinical and Translational Science Award Grant (5KL2TR001112). None of the authors report any conflict of interest, financial or otherwise, in the preparation of this article.
1. Freedman NS, Gazendam J, Levan L, Pack AI, Schwab RJ. Abnormal sleep/wake
cycles and the effect of environmental noise on sleep disruption in the intensive
care unit. Am J Respir Crit Care Med. 2001;163(2):451-457. PubMed
2. Watson PL, Pandharipande P, Gehlbach BK, et al. Atypical sleep in ventilated
patients: empirical electroencephalography findings and the path toward revised ICU sleep scoring criteria. Crit Care Med. 2013;41(8):1958-1967. PubMed
3. Gehlbach BK, Chapotot F, Leproult R, et al. Temporal disorganization of circadian rhythmicity and sleep-wake regulation in mechanically ventilated patients receiving continuous intravenous sedation. Sleep. 2012;35(8):1105-1114. PubMed
4. Elliott R, McKinley S, Cistulli P, Fien M. Characterisation of sleep in intensive care using 24-hour polysomnography: an observational study. Crit Care. 2013;17(2):R46. PubMed
5. Novaes MA, Aronovich A, Ferraz MB, Knobel E. Stressors in ICU: patients’ evaluation. Intensive Care Med. 1997;23(12):1282-1285. PubMed
6. Tembo AC, Parker V, Higgins I. The experience of sleep deprivation in intensive care patients: findings from a larger hermeneutic phenomenological study. Intensive Crit Care Nurs. 2013;29(6):310-316. PubMed
7. Kamdar BB, Yang J, King LM, et al. Developing, implementing, and evaluating a multifaceted quality improvement intervention to promote sleep in an ICU. Am J Med Qual. 2014;29(6):546-554. PubMed
8. Patel J, Baldwin J, Bunting P, Laha S. The effect of a multicomponent multidisciplinary bundle of interventions on sleep and delirium in medical and surgical intensive care patients. Anaesthesia. 2014;69(6):540-549. PubMed
9. Manian FA, Manian CJ. Sleep quality in adult hospitalized patients with infection: an observational study. Am J Med Sci. 2015;349(1):56-60. PubMed
10. Park MJ, Yoo JH, Cho BW, Kim KT, Jeong WC, Ha M. Noise in hospital rooms and sleep disturbance in hospitalized medical patients. Environ Health Toxicol. 2014;29:e2014006. PubMed
11. Dobing S, Frolova N, McAlister F, Ringrose J. Sleep quality and factors influencing self-reported sleep duration and quality in the general internal medicine inpatient population. PLoS One. 2016;11(6):e0156735. PubMed
12. Gillis CM, Poyant JO, Degrado JR, Ye L, Anger KE, Owens RL. Inpatient pharmacological
sleep aid utilization is common at a tertiary medical center. J Hosp Med. 2014;9(10):652-657. PubMed
13. Krenk L, Jennum P, Kehlet H. Postoperative sleep disturbances after zolpidem treatment in fast-track hip and knee replacement. J Clin Sleep Med. 2014;10(3):321-326. PubMed
14. Kolla BP, Lovely JK, Mansukhani MP, Morgenthaler TI. Zolpidem is independently
associated with increased risk of inpatient falls. J Hosp Med. 2013;8(1):1-6. PubMed
15. Inouye SK, Bogardus ST Jr, Charpentier PA, et al. A multicomponent intervention to prevent delirium in hospitalized older patients. N Engl J Med. 1999;340(9):669-676. PubMed
16. Bano M, Chiaromanni F, Corrias M, et al. The influence of environmental factors on sleep quality in hospitalized medical patients. Front Neurol. 2014;5:267. PubMed
17. Berglund BLTSD. Guidelines for Community Noise. World Health Organization. 1999.
18. Knauert M, Jeon S, Murphy TE, Yaggi HK, Pisani MA, Redeker NS. Comparing average levels and peak occurrence of overnight sound in the medical intensive care unit on A-weighted and C-weighted decibel scales. J Crit Care. 2016;36:1-7. PubMed
19. Yoder JC, Staisiunas PG, Meltzer DO, Knutson KL, Arora VM. Noise and sleep among adult medical inpatients: far from a quiet night. Arch Intern Med. 2012;172(1):68-70. PubMed
20. Buxton OM, Ellenbogen JM, Wang W, et al. Sleep disruption due to hospital noises: a prospective evaluation. Ann Intern Med. 2012;157(3):170-179. PubMed
21. Stanchina ML, Abu-Hijleh M, Chaudhry BK, Carlisle CC, Millman RP. The influence of white noise on sleep in subjects exposed to ICU noise. Sleep Med. 2005;6(5):423-428. PubMed
22. Czeisler CA, Allan JS, Strogatz SH, et al. Bright light resets the human circadian pacemaker independent of the timing of the sleep-wake cycle. Science. 1986;233(4764):667-671. PubMed
23. Duffy JF, Czeisler CA. Effect of light on human circadian physiology. Sleep Med Clin. 2009;4(2):165-177. PubMed
24. Lewy AJ, Wehr TA, Goodwin FK, Newsome DA, Markey SP. Light suppresses melatonin secretion in humans. Science. 1980;210(4475):1267-1269. PubMed
25. Zeitzer JM, Dijk DJ, Kronauer R, Brown E, Czeisler C. Sensitivity of the human circadian pacemaker to nocturnal light: melatonin phase resetting and suppression. J Physiol. 2000;526:695-702. PubMed
26. Bernhofer EI, Higgins PA, Daly BJ, Burant CJ, Hornick TR. Hospital lighting and its association with sleep, mood and pain in medical inpatients. J Adv Nurs. 2014;70(5):1164-1173. PubMed
27. Darbyshire JL, Young JD. An investigation of sound levels on intensive care units with reference to the WHO guidelines. Crit Care. 2013;17(5):R187. PubMed
28. Gillis S. Pharmacologic treatment of depression during pregnancy. J Midwifery Womens Health. 2000;45(4):357-359. PubMed
29. Tainter CR, Levine AR, Quraishi SA, et al. Noise levels in surgical ICUs are consistently above recommended standards. Crit Care Med. 2016;44(1):147-152. PubMed
30. Farrehi PM, Clore KR, Scott JR, Vanini G, Clauw DJ. Efficacy of Sleep Tool Education During Hospitalization: A Randomized Controlled Trial. Am J Med. 2016;129(12):1329.e9-1329.e17. PubMed
31. Farokhnezhad Afshar P, Bahramnezhad F, Asgari P, Shiri M. Effect of white noise on sleep in patients admitted to a coronary care. J Caring Sci. 2016;5(2):103-109. PubMed
32. Bartick MC, Thai X, Schmidt T, Altaye A, Solet JM. Decrease in as-needed sedative use by limiting nighttime sleep disruptions from hospital staff. J Hosp Med. 2010;5(3):E20-E24. PubMed
33. Tamrat R, Huynh-Le MP, Goyal M. Non-pharmacologic interventions to improve the sleep of hospitalized patients: a systematic review. J Gen Intern Med. 2014;29(5):788-795. PubMed
34. Dijk DJ, Archer SN. Light, sleep, and circadian rhythms: together again. PLoS Biol. 2009;7(6):e1000145. PubMed
35. Verceles AC, Liu X, Terrin ML, et al. Ambient light levels and critical care outcomes. J Crit Care. 2013;28(1):110.e1-110.e8. PubMed
36. Hu RF, Hegadoren KM, Wang XY, Jiang XY. An investigation of light and sound levels on intensive care units in China. Aust Crit Care. 2016;29(2):62-67. PubMed
37. Zeitzer JM, Ruby NF, Fisicaro RA, Heller HC. Response of the human circadian system to millisecond flashes of light. PLoS One. 2011;6(7):e22078. PubMed
38. Duffy JF, Wright KP, Jr. Entrainment of the human circadian system by light. J Biol Rhythms. 2005;20(4):326-338. PubMed
39. Wright KP Jr, Gronfier C, Duffy JF, Czeisler CA. Intrinsic period and light intensity determine the phase relationship between melatonin and sleep in humans. J Biol Rhythms. 2005;20(2):168-177. PubMed
40. Duffy JF, Zeitzer JM, Czeisler CA. Decreased sensitivity to phase-delaying effects of moderate intensity light in older subjects. Neurobiol Aging. 2007;28(5):799-807. PubMed
41. Figueiro MG, Plitnick BA, Lok A, et al. Tailored lighting intervention improves measures of sleep, depression, and agitation in persons with Alzheimer’s disease and related dementia living in long-term care facilities. Clin Interv Aging. 2014;9:1527-1537. PubMed
© 2017 Society of Hospital Medicine