User login
"Nonurgent" Patients Might Still End up Being Hospitalized
(Reuters Health) - Patients assigned a "nonurgent" status on arrival in the emergency room might still be sick enough to be hospitalized, a new study shows.
Patients deemed by triage nurses to be "nonurgent" often receive diagnostic services and procedures, and some are even admitted to critical care units, researchers found.
Triage was never intended to completely rule out severe illness, only to give patients an estimate of how long they may have to wait to see a doctor, the researchers note.
Dr. Renee Y. Hsia of the University of California, San Francisco and colleagues used a national survey of patient visits to the emergency department (E.D.) between 2009 and 2011, with triage scores assigned by a nurse when the patient arrived. The scores range from one to five, with one through three including immediate, emergency and urgent patients, and four and five being semi-urgent and nonurgent.
They used data on almost 60,000 observations of patients age 18 to 64 collected between 2009 and 2011, which represented 240 million E.D. visits. More than 90 percent had a score of one to
four and were deemed "urgent" visits, while about eight percent had a score of five and were "nonurgent."
Almost half of nonurgent visits involved diagnostic scans, imaging or blood tests, and a third involved procedures like splinting or giving intravenous fluids. For urgent visits, about three-quarters involved diagnostics and half involved procedures.
About four of every 100 non-urgent visits resulted in hospital admission, as reported in JAMA Internal Medicine.
Backache, acute upper respiratory infections, soft-tissue inflammation, and acute sore throat were among the 10 most common diagnoses for both urgent and non-urgent patients.
"Triage is normally done at the very beginning of the visit, usually by a triage nurse," Hsia told Reuters Health by email. "Triaging patients is an extremely difficult task, since patients are what we (as providers) call 'undifferentiated,' since there has not been time to do a full history and physical, and nurses have limited information upon which to base their determination."
"We should not expect triage categorization to be perfect, and one of the goals of this paper is to show that, indeed, triage is not," Hsia said.
Many states have policies that patients with Medicaid insurance who present to the E.D. for "non-urgent" visits will be charged a co-payment, which may keep people from seeking
needed care, even though the triage system is not perfect, she said.
"It is important that we do not blame the patient for going to the E.D. if there were no alternatives that were available in a timely manner," Hsia said.
"Our study cannot distinguish the reasons behind why we found such a high proportion of visits that received diagnostic services or procedures," she said.
Some of the procedures may not have needed to happen in an E.D. setting, but since the patients presented there, they were treated, Hsia added.
Protein enables expansion of cord blood HSCs
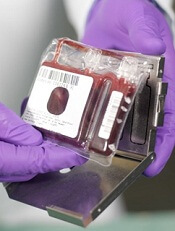
Photo courtesy of NHS
New research suggests an RNA-binding protein can be used to expand hematopoietic stem cells (HSCs) derived from umbilical cord blood.
Investigators found the protein, Musashi-2 (MSI2), regulates the function and development of cord-blood derived HSCs, and overexpressing MSI2 can significantly expand both short-term and long-term repopulating HSCs.
“By expanding the stem cells as we have done, many more donated [cord blood] samples could now be used for transplants,” said Kristin Hope, PhD, of McMaster University in Hamilton, Ontario, Canada.
“Providing enhanced numbers of stem cells for transplantation could alleviate some of the current post-transplantation complications and allow for faster recoveries, in turn, reducing overall healthcare costs and wait times for newly diagnosed patients seeking treatment.”
Dr Hope and her colleagues described this exploration of HSC expansion in Nature.
The team first found that expression of MSI2 messenger RNA was elevated in primitive cord blood hematopoietic stem and progenitor cells (HSPCs), but it decreased during differentiation.
They then found that overexpressing MSI2 enhances the activity of cord blood progenitors in vitro and increases the number of short-term repopulating HSCs in vitro and in vivo.
During in vitro culture, MSI2-overexpressing cells were 2.3-fold more abundant than control cells at 7 days and 6-fold more abundant at 21 days. After 7 days, MSI2-overexpressing cells showed a cumulative 9.3-fold increase in colony-forming cells but no changes in cell cycling or death.
MSI2-overexpressing short-term repopulating cells (STRCs) yielded 1.8-fold more primitive CD34+ cells than control STRCs. And the MSI2-overexpressing STRCs prompted a 17-fold increase in functional STRCs.
Furthermore, 100% of mice transplanted with MSI2-overexpressing STRCs were engrafted at 6.5 weeks, compared to 50% of mice transplanted with control STRCs.
Additional transplant experiments showed that MSI2 overexpression also impacted long-term HSCs (LT-HSCs). Compared to control cells, MSI2-overexpressing cells increased the percentage of GFP+ HSCs in the bone marrow 4.6-fold and the frequency of LT-HSCs 3.5-fold.
The researchers said the increase in LT-HSC frequency corresponded to MSI2-overexpressing GFP+ HSCs having expanded in mice 2.4-fold over input. With control HSCs, on the other hand, there was a 1.5-fold decrease.
In ex vivo culture, MSI2 overexpression induced a cumulative 23-fold expansion of secondary LT-HSCs when compared to control LT-HSCs.
Finally, the researchers performed a global analysis of MSI2–RNA interactions and found that MSI2 mediates HSPC self-renewal and ex vivo expansion by coordinating the post-transcriptional regulation of proteins belonging to a shared self-renewal regulatory pathway.
“We’ve really shone a light on the way these stem cells work,” Dr Hope said. “We now understand how they operate at a completely new level, and that provides us with a serious advantage in determining how to maximize these stem cells in therapeutics. With this newfound ability to control the regeneration of these cells, more people will be able to get the treatment they need.” ![]()
Product approved for hemoglobin maintenance
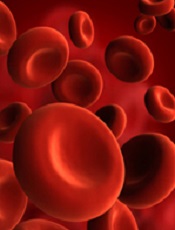
Image courtesy of NHLBI
The US Food and Drug Administration (FDA) has approved the use of a powder formulation of ferric pyrophosphate citrate (Triferic powder packet) to maintain hemoglobin in adult patients with hemodialysis-dependent chronic kidney disease.
The FDA previously approved ferric pyrophosphate citrate solution (Triferic) in ampule form. It is an iron-replacement drug intended to treat anemia in chronic kidney disease patients receiving hemodialysis.
Triferic is delivered to hemodialysis patients via dialysate, replacing the ongoing iron loss that occurs during their dialysis treatment. The drug is added to the bicarbonate concentrate on-site at the dialysis clinic.
Once in dialysate, Triferic crosses the dialyzer membrane and enters the blood, where it immediately binds to transferrin and is transported to the erythroid precursor cells to be incorporated into hemoglobin.
Triferic is designed to deliver sufficient iron to the bone marrow and maintain hemoglobin without increasing iron stores.
“We are pleased to obtain this FDA approval for the Triferic powder packet,” said Robert L. Chioini, founder, chairman, and chief executive officer of Rockwell Medical, Inc., makers of Triferic.
“The Triferic powder packet is similar to the size of a packet of sugar. It is much smaller and lighter than the current Triferic liquid ampule, and it enables us to place 3-times greater the number of units in an even smaller carton.”
“This presentation is much more convenient for customers, as it reduces storage space and requires fewer reorders to maintain inventory. We expect it to be commercially available shortly.” ![]()
Manipulating a microRNA to treat AML

Image by Su Jung Song
The microRNA miR-22 is “an essential antitumor gatekeeper” in acute myeloid leukemia (AML), researchers have reported in Nature Communications.
The team found that miR-22 was significantly downregulated in AML, and forced expression of miR-22 produced antileukemic effects in AML cells
and mouse models of the disease.
Futhermore, nanoparticles carrying miR-22 oligonucleotides appeared to cure AML in some mice.
“Previous research has shown that microRNA miR-22 is linked to breast cancer and other blood disorders [myelodysplastic syndromes], which sometimes turn into AML,” said study author Jianjun Chen, PhD, of the University of Cincinnati in Ohio.
“But we found in this study that it could be an essential antitumor gatekeeper in AML when it is downregulated. When we forced miR-22 expression, we saw difficulty in leukemia cells developing, growing, and thriving.”
Dr Chen and his colleagues first found that miR-22 was significantly downregulated (P<0.05) in samples from AML patients, when compared with normal CD34+ hematopoietic stem/progenitor cells, CD33+ myeloid progenitor cells, and mononuclear cells. The set of AML samples included MLL, t(15;17), t(8;21), and inv(16) AML.
When the researchers forced expression of miR-22 in human AML cells, they found the microRNA significantly inhibited cell viability, growth, and proliferation, while promoting apoptosis.
The team also investigated the role of miR-22 in colony formation induced by MLL-AF10/t(10;11), PML-RARA/t(15;17), and AML1-ETO9a/t(8;21). They found that forced expression of miR-22 significantly inhibited colony formation induced by all of these oncogenic fusion genes.
In mice, forced expression of miR-22 blocked MLL-AF9-mediated leukemogenesis and MLL-AF10-mediated leukemogenesis.
Forced expression of miR-22 also inhibited progression of AML induced by MLL-AF9, AE9a, or FLT3-ITD/NPM1c+ in secondary recipient mice. The researchers said this resulted in “largely normal” morphologies in the peripheral blood, bone marrow, spleen, and liver tissues of these mice.
In addition, the team found that nanoparticles carrying miR-22 oligonucleotides significantly delayed AML progression in secondary recipient mice with MLL-AF9 and AE9a-induced AML. At least 40% of the mice appeared to be completely cured.
In a xenotransplantation model, miR-22 nanoparticles significantly delayed AML progression induced by human MV4;11/t(4;11) cells.
Further investigation into the role miR-22 plays in AML revealed that 3 oncogenes—CRTC1, FLT3, and MYCBP—are “functionally important” targets of miR-22 in AML. And miR-22 represses the CREB and MYC signaling pathways.
The researchers also found DNA copy-number loss in the miR-22 gene locus in AML cases, and they discovered the expression of miR-22 is epigenetically repressed in AML.
“The downregulation, or decreased output, of miR-22 in AML is caused by the loss of the number of DNA being copied and/or stopping their expression through a pathway called TET1/GFI1/EZH2/SIN3A,” Dr Chen explained.
“Our study uncovers a previously unappreciated signaling pathway—TET1/GFI1/EZH2/SIN3A/miR-22/CREB-MYC—and provides new insights into genetic mechanisms causing and progressing AML and also highlights the clinical potential of miR-22-based AML therapy. More research on this pathway and ways to target it are necessary.” ![]()
CKD: Latest on Screening
Q) suPAR, a new screening tool for chronic kidney disease, has gotten a lot of press recently. My practice is interested in implementing it, but we can’t find information on how to obtain it. Is it commercially available yet? How can we order it? And importantly for our patients, do insurance plans cover it?
Research has been ongoing regarding biomarkers that could identify those at risk for chronic kidney disease (CKD) long before loss of renal function is apparent. A recently published study suggests that the circulating protein, soluble urokinase-type plasminogen activator receptor (suPAR), may be such a biomarker.
In a study of 3,683 subjects (ages 20 to 90) undergoing cardiac catheterization, and a further evaluation of 347 subjects in the Women’s Interagency HIV Study, Hayek et al found that elevated levels of suPAR were independently associated with CKD and with accelerated loss of renal function. At five-year follow-up, 24% of the 1,335 subjects with an initial estimated glomerular filtration rate (eGFR) ≥ 60 mL/min/1.73 m2 had developed CKD. Risk for progression to CKD was about 41% in those with a baseline suPAR level ≥ 3,040 ng/mL, compared to 12% in those with lower baseline suPAR levels.1 Thus, the cutoff for high versus low risk appears to be 3,040 ng/mL.
Hayek and associates are not the first or the only investigators studying the connection between suPAR and kidney disease. Evolving research has suggested suPAR may be an initiating factor in the development of focal segmental glomerulosclerosis (FSGS).2 However, a recent study did not support this association.3
Currently, in the United States, laboratory testing for suPAR is available only for research purposes and has not been approved by the FDA for direct patient care.4 While more research is needed with different cohorts, there is much excitement in the field of nephrology regarding the potential role of suPAR as a biomarker for predicting CKD. —CS
Cindy Smith, DNP, APRN, CNN-NP, FNP-BC
Renal Consultants, PLLC, South Charleston, West Virgina
References
1. Hayek SS, Sever S, Ko Y-A, et al. Soluble urokinase receptor and chronic kidney disease. N Engl J Med. 2015;373:1916-1925.
2. Spinale JM, Mariani LH, Kapoor S, et al. A reassessment of soluble urokinase-type plasminogen activator receptor in glomerular disease. Kidney Int. 2015;87(3):564-574.
3. Wei C, El Hindi S, Li J, et al. Circulating urokinase receptor as a cause of focal segmental glomerulosclerosis.Nature Med. 2011;17: 952-960.
4. Rush University Medical Center. Early warning found for chronic kidney disease: common protein in blood rises months or years before disease develops [news release]. November 5, 2015. www.rush.edu/news/press-releases/early-warning-found-chronic-kidney-disease. Accessed April 11, 2016.
| Clinician Reviews in partnership with |
Renal Consult is edited by Jane S. Davis, CRNP, DNP, a member of the Clinician Reviews editorial board, who is a nurse practitioner in the Division of Nephrology at the University of Alabama at Birmingham and is the communications chairperson for the National Kidney Foundation’s Council of Advanced Practitioners (NKF-CAP); and Kim Zuber, PA-C, MSPS, DFAAPA, a retired PA who works with the American Academy of Nephrology PAs and is also past chair of the NKF-CAP. This month’s responses were authored by Cindy Smith, DNP, APRN, CNN-NP, FNP-BC, who practices with Renal Consultants, PLLC, in South Charleston, West Virgina, and Crystal Johnson, PA-C, Angela Harker-Bacchus, FNP-BC, Irina Sadovskaya, PA-C, and Beverly Benmoussa, FNP-BC, who practice in the Transplant Nephrology Extra-Renal CKD Clinic at the University of Michigan.
Q) suPAR, a new screening tool for chronic kidney disease, has gotten a lot of press recently. My practice is interested in implementing it, but we can’t find information on how to obtain it. Is it commercially available yet? How can we order it? And importantly for our patients, do insurance plans cover it?
Research has been ongoing regarding biomarkers that could identify those at risk for chronic kidney disease (CKD) long before loss of renal function is apparent. A recently published study suggests that the circulating protein, soluble urokinase-type plasminogen activator receptor (suPAR), may be such a biomarker.
In a study of 3,683 subjects (ages 20 to 90) undergoing cardiac catheterization, and a further evaluation of 347 subjects in the Women’s Interagency HIV Study, Hayek et al found that elevated levels of suPAR were independently associated with CKD and with accelerated loss of renal function. At five-year follow-up, 24% of the 1,335 subjects with an initial estimated glomerular filtration rate (eGFR) ≥ 60 mL/min/1.73 m2 had developed CKD. Risk for progression to CKD was about 41% in those with a baseline suPAR level ≥ 3,040 ng/mL, compared to 12% in those with lower baseline suPAR levels.1 Thus, the cutoff for high versus low risk appears to be 3,040 ng/mL.
Hayek and associates are not the first or the only investigators studying the connection between suPAR and kidney disease. Evolving research has suggested suPAR may be an initiating factor in the development of focal segmental glomerulosclerosis (FSGS).2 However, a recent study did not support this association.3
Currently, in the United States, laboratory testing for suPAR is available only for research purposes and has not been approved by the FDA for direct patient care.4 While more research is needed with different cohorts, there is much excitement in the field of nephrology regarding the potential role of suPAR as a biomarker for predicting CKD. —CS
Cindy Smith, DNP, APRN, CNN-NP, FNP-BC
Renal Consultants, PLLC, South Charleston, West Virgina
References
1. Hayek SS, Sever S, Ko Y-A, et al. Soluble urokinase receptor and chronic kidney disease. N Engl J Med. 2015;373:1916-1925.
2. Spinale JM, Mariani LH, Kapoor S, et al. A reassessment of soluble urokinase-type plasminogen activator receptor in glomerular disease. Kidney Int. 2015;87(3):564-574.
3. Wei C, El Hindi S, Li J, et al. Circulating urokinase receptor as a cause of focal segmental glomerulosclerosis.Nature Med. 2011;17: 952-960.
4. Rush University Medical Center. Early warning found for chronic kidney disease: common protein in blood rises months or years before disease develops [news release]. November 5, 2015. www.rush.edu/news/press-releases/early-warning-found-chronic-kidney-disease. Accessed April 11, 2016.
CKD: Latest on Management
Q) I have a patient with stage 3a chronic kidney disease (glomerular filtration rate, 45-60 mL/min/1.73 m2). I have her on a statin and an ACE inhibitor. Is there anything else I can do to slow the progression of kidney disease?
For patients with stage 3a chronic kidney disease (CKD), ongoing evaluation of risk factors and management can impact the rate of disease progression. The cornerstones of CKD care include identification and treatment of the cause; management of hypertension, albuminuria, and diabetes (if applicable); reduction of cardiovascular (CV) risk; and correction of metabolic abnormalities.5
When considering factors that can contribute to kidney injury, clinicians should consider possible pre-, intra-, and post-renal processes that could potentially cause injury.
Prerenal: Approximately 20% of cardiac output is directed to the kidneys. Reduced left ventricular function, diastolic dysfunction, and pulmonary hypertension can all contribute to a reduction in renal blood flow and subsequent kidney injury.6
Intrarenal: Exploration of possible intra-renal processes begins with a thorough history of any familial disease, hematuria, stones, proteinuria, and exposure to nephrotoxins. The nephrotoxicity profile of all medications should be examined, and patients should be educated about products, particularly OTC medications (eg, NSAIDs, common cold preparations, and herbal or weight-loss products), that can be harmful to the kidneys. Patients should also be made aware of the risk for contrast-induced renal injury, especially when considering imaging or cardiac testing. Since diabetes is a leading cause of kidney disease, good diabetic control can reduce nephropathy and slow disease progression.
Postrenal: Benign prostatic hypertrophy, kidney stones, and neurogenic bladder can all cause injury. These warrant further evaluation and treatment.
CKD often worsens existing hypertension, which is an independent risk factor for kidney failure.7 Goal blood pressure (BP) for all patients without significant albuminuria should be < 140/90 mm Hg; for those with urinary albumin ≥ 30 mg/24 h, the goal is < 130/80 mm Hg.8 Choice of antihypertensive agents can be tailored to other comorbidities, but an ACE inhibitor or angiotensin receptor blocker should be considered firstline treatment. Nocturnal hypertension is common in patients with CKD and an independent marker of CV risk. By dosing antihypertensive medications at bedtime, the clinician supports CV risk reduction.9
CKD is an independent risk factor for CV disease, thus risk factor modification should be aggressively pursued. Regardless of the cause of CKD, cigarette smoking has been associated with a more rapid decline in renal function. Patients should be counseled on the risks and offered interventions to assist in smoking cessation.10 There is also emerging evidence that exercise likely benefits the vascular health of the kidneys and appears to slow the rate of kidney decline.11,12 Overall, lifestyle interventions that help mitigate CV risk may directly benefit preservation of kidney function as well.
Metabolic abnormalities increase with CKD progression. Maintaining proper bone health through control of phosphate/acidosis and calcium equilibrium reduces morbidity as it relates to vascular and soft-tissue calcification. This can often be effectively managed through dietary modifications in early to moderate CKD. As the number of functioning nephrons decrease in CKD, so does the ability of the kidney to maintain proper acid/base balance. Persistent metabolic acidosis is related to CKD progression. Acid buffering with oral bicarbonate may be needed to achieve a goal CO2 of 22 to 32 mEq/L.8
Through adoption of a comprehensive approach—one that is inclusive of the patient—optimal outcomes can be achieved for this rapidly growing and often underrecognized population. —CJ, AH-B, IS, BB
Crystal Johnson, PA-C
Angela Harker-Bacchus, FNP-BC
Irina Sadovskaya, PA-C
Beverly Benmoussa, FNP-BC
Transplant Nephrology Extra-Renal CKD Clinic, University of Michigan
References
5. Murphree DD, Thelen SM. Chronic kidney disease in primary care. J Am Board Fam Med. 2010;23(4):542-550.
6. Coppolino G, Presta P, Saturno L, Fuiano G. Acute kidney injury in patients undergoing cardiac surgery. J Nephrol. 2013;26(1):32-40.
7. Ravera M, Re M, Defarri L, et al. Importance of blood pressure control in chronic kidney disease. J Am Soc Nephrol. 2006;17(4 suppl 2):S98-S103.
8. Kidney Disease: Improving Global Outcomes (KDIGO) CKD Work Group. KDIGO 2012 Clinical Practice Guideline for the Evaluation and Management of Chronic Kidney Disease. Kidney Int. 2013;3(suppl):1-150.
9. Hermida RC, Ayala DE, Mojón A, Fernández JR. Bedtime dosing of antihypertensive medications reduces cardiovascular risk in CKD. J Am Soc Nephrol. 2011;22(12):2313-2321.
10. Ricardo AC, Anderson CA, Yang W, et al. Healthy lifestyle and risk of kidney disease progression, atherosclerotic events, and death in CKD: findings from the Chronic Renal Insufficiency Cohort (CRIC) study. Am J Kidney Dis. 2015;65(3):412-424.
11. Gould DW, Graham-Brown MPM, Watson EL, et al. Physiological benefits of exercise in pre-dialysis chronic kidney disease. Nephrology (Carlton). 2014;19(9):519-527.
12. Robinson-Cohen C, Littman AJ, Duncan GE, et al. Physical activity and change in estimated GFR among persons with CKD. J Am Soc Nephrol. 2014;25(2):399-406.
| Clinician Reviews in partnership with |
Renal Consult is edited by Jane S. Davis, CRNP, DNP, a member of the Clinician Reviews editorial board, who is a nurse practitioner in the Division of Nephrology at the University of Alabama at Birmingham and is the communications chairperson for the National Kidney Foundation’s Council of Advanced Practitioners (NKF-CAP); and Kim Zuber, PA-C, MSPS, DFAAPA, a retired PA who works with the American Academy of Nephrology PAs and is also past chair of the NKF-CAP. This month’s responses were authored by Cindy Smith, DNP, APRN, CNN-NP, FNP-BC, who practices with Renal Consultants, PLLC, in South Charleston, West Virgina, and Crystal Johnson, PA-C, Angela Harker-Bacchus, FNP-BC, Irina Sadovskaya, PA-C, and Beverly Benmoussa, FNP-BC, who practice in the Transplant Nephrology Extra-Renal CKD Clinic at the University of Michigan.
Q) I have a patient with stage 3a chronic kidney disease (glomerular filtration rate, 45-60 mL/min/1.73 m2). I have her on a statin and an ACE inhibitor. Is there anything else I can do to slow the progression of kidney disease?
For patients with stage 3a chronic kidney disease (CKD), ongoing evaluation of risk factors and management can impact the rate of disease progression. The cornerstones of CKD care include identification and treatment of the cause; management of hypertension, albuminuria, and diabetes (if applicable); reduction of cardiovascular (CV) risk; and correction of metabolic abnormalities.5
When considering factors that can contribute to kidney injury, clinicians should consider possible pre-, intra-, and post-renal processes that could potentially cause injury.
Prerenal: Approximately 20% of cardiac output is directed to the kidneys. Reduced left ventricular function, diastolic dysfunction, and pulmonary hypertension can all contribute to a reduction in renal blood flow and subsequent kidney injury.6
Intrarenal: Exploration of possible intra-renal processes begins with a thorough history of any familial disease, hematuria, stones, proteinuria, and exposure to nephrotoxins. The nephrotoxicity profile of all medications should be examined, and patients should be educated about products, particularly OTC medications (eg, NSAIDs, common cold preparations, and herbal or weight-loss products), that can be harmful to the kidneys. Patients should also be made aware of the risk for contrast-induced renal injury, especially when considering imaging or cardiac testing. Since diabetes is a leading cause of kidney disease, good diabetic control can reduce nephropathy and slow disease progression.
Postrenal: Benign prostatic hypertrophy, kidney stones, and neurogenic bladder can all cause injury. These warrant further evaluation and treatment.
CKD often worsens existing hypertension, which is an independent risk factor for kidney failure.7 Goal blood pressure (BP) for all patients without significant albuminuria should be < 140/90 mm Hg; for those with urinary albumin ≥ 30 mg/24 h, the goal is < 130/80 mm Hg.8 Choice of antihypertensive agents can be tailored to other comorbidities, but an ACE inhibitor or angiotensin receptor blocker should be considered firstline treatment. Nocturnal hypertension is common in patients with CKD and an independent marker of CV risk. By dosing antihypertensive medications at bedtime, the clinician supports CV risk reduction.9
CKD is an independent risk factor for CV disease, thus risk factor modification should be aggressively pursued. Regardless of the cause of CKD, cigarette smoking has been associated with a more rapid decline in renal function. Patients should be counseled on the risks and offered interventions to assist in smoking cessation.10 There is also emerging evidence that exercise likely benefits the vascular health of the kidneys and appears to slow the rate of kidney decline.11,12 Overall, lifestyle interventions that help mitigate CV risk may directly benefit preservation of kidney function as well.
Metabolic abnormalities increase with CKD progression. Maintaining proper bone health through control of phosphate/acidosis and calcium equilibrium reduces morbidity as it relates to vascular and soft-tissue calcification. This can often be effectively managed through dietary modifications in early to moderate CKD. As the number of functioning nephrons decrease in CKD, so does the ability of the kidney to maintain proper acid/base balance. Persistent metabolic acidosis is related to CKD progression. Acid buffering with oral bicarbonate may be needed to achieve a goal CO2 of 22 to 32 mEq/L.8
Through adoption of a comprehensive approach—one that is inclusive of the patient—optimal outcomes can be achieved for this rapidly growing and often underrecognized population. —CJ, AH-B, IS, BB
Crystal Johnson, PA-C
Angela Harker-Bacchus, FNP-BC
Irina Sadovskaya, PA-C
Beverly Benmoussa, FNP-BC
Transplant Nephrology Extra-Renal CKD Clinic, University of Michigan
References
5. Murphree DD, Thelen SM. Chronic kidney disease in primary care. J Am Board Fam Med. 2010;23(4):542-550.
6. Coppolino G, Presta P, Saturno L, Fuiano G. Acute kidney injury in patients undergoing cardiac surgery. J Nephrol. 2013;26(1):32-40.
7. Ravera M, Re M, Defarri L, et al. Importance of blood pressure control in chronic kidney disease. J Am Soc Nephrol. 2006;17(4 suppl 2):S98-S103.
8. Kidney Disease: Improving Global Outcomes (KDIGO) CKD Work Group. KDIGO 2012 Clinical Practice Guideline for the Evaluation and Management of Chronic Kidney Disease. Kidney Int. 2013;3(suppl):1-150.
9. Hermida RC, Ayala DE, Mojón A, Fernández JR. Bedtime dosing of antihypertensive medications reduces cardiovascular risk in CKD. J Am Soc Nephrol. 2011;22(12):2313-2321.
10. Ricardo AC, Anderson CA, Yang W, et al. Healthy lifestyle and risk of kidney disease progression, atherosclerotic events, and death in CKD: findings from the Chronic Renal Insufficiency Cohort (CRIC) study. Am J Kidney Dis. 2015;65(3):412-424.
11. Gould DW, Graham-Brown MPM, Watson EL, et al. Physiological benefits of exercise in pre-dialysis chronic kidney disease. Nephrology (Carlton). 2014;19(9):519-527.
12. Robinson-Cohen C, Littman AJ, Duncan GE, et al. Physical activity and change in estimated GFR among persons with CKD. J Am Soc Nephrol. 2014;25(2):399-406.
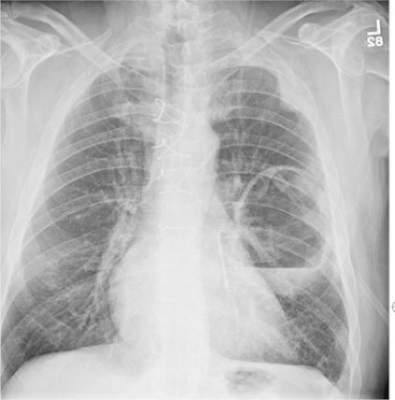
Is Postop Lethargy Cause for Concern?
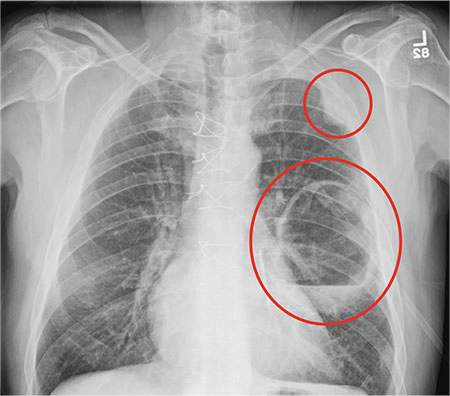
Answer
The radiograph shows a large cavitary lesion within the left mid-lung with evidence of an air fluid level. This finding is strongly suggestive of a postoperative abscess or empyema. Secondarily, there is some pleural thickening within the left lateral apex region. This can be suggestive of scarring or possibly a neoplasm.
The patient was admitted to the ICU for a sepsis workup, and Interventional Radiology was consulted to evaluate for CT-guided drain placement.

A 65-year-old man is transported to your emergency department from a local rehabilitation hospital. He is three weeks status post cardiac bypass surgery as well as “some other valve procedure.” In the past two to three days, staff members report, the patient has been less active and has not participated in therapy. This morning, he was found to be lethargic, and that is what prompted the call to 911. Examination reveals a lethargic male who has little verbal communication beyond moaning and groaning. His vital signs include a temperature of 36°C; blood pressure, 90/40 mm Hg; and heart rate, 135 beats/min. His O2 saturation is 90% on room air. Inspection of the patient’s chest reveals a recent, healing midline sternotomy incision. There is no overt redness or swelling. On auscultation, you note decreased breath sounds on the left side, with some coarse crackles. As you initiate your facility’s sepsis protocol order set, a stat portable chest radiograph is obtained. What is your impression?
It Reminds Him of When His Heart “Got Very Sick”
ANSWER
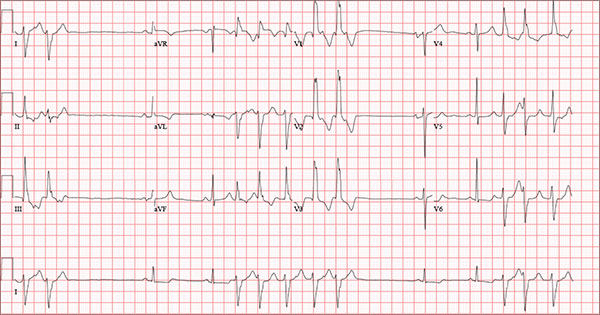
Findings on this ECG include sinus rhythm with frequent, consecutive premature ventricular complexes (PVCs) consistent with nonsustained ventricular tachycardia (NSVT). There is also evidence of a probable left atrial enlargement.
The key to interpreting this ECG is to first locate normal-appearing complexes. These are illustrated by the third, fourth, 10th, and 11th complexes on the rhythm strip (lead I) at the bottom of the ECG. Notice that there is a normal-appearing PQRST complex for each of these beats.
The rate of 82 beats/min is calculated from a sum average of all beats on the 12-lead ECG; however, the R-R interval between the third and fourth and the 10th and 11th beats is roughly 60 beats/min, signifying a normal sinus rhythm. All other beats are PVCs arising from the left ventricle (as evidenced by a right bundle branch pattern in lead V1).
Careful inspection will reveal retrograde P waves located in the terminal upstroke of the S wave. NSVT is defined as three or more consecutive PVCs at a rate greater than 100 beats/min with a duration of less than 30 seconds. The pauses seen between a PVC and a normally conducting P wave are caused by retrograde conduction from the ventricle to the atrium, with subsequent block within the atrium.
Finally, left atrial enlargement is evidenced by a biphasic P wave in the normally conducting beat seen in lead V1.
ANSWER
Findings on this ECG include sinus rhythm with frequent, consecutive premature ventricular complexes (PVCs) consistent with nonsustained ventricular tachycardia (NSVT). There is also evidence of a probable left atrial enlargement.
The key to interpreting this ECG is to first locate normal-appearing complexes. These are illustrated by the third, fourth, 10th, and 11th complexes on the rhythm strip (lead I) at the bottom of the ECG. Notice that there is a normal-appearing PQRST complex for each of these beats.
The rate of 82 beats/min is calculated from a sum average of all beats on the 12-lead ECG; however, the R-R interval between the third and fourth and the 10th and 11th beats is roughly 60 beats/min, signifying a normal sinus rhythm. All other beats are PVCs arising from the left ventricle (as evidenced by a right bundle branch pattern in lead V1).
Careful inspection will reveal retrograde P waves located in the terminal upstroke of the S wave. NSVT is defined as three or more consecutive PVCs at a rate greater than 100 beats/min with a duration of less than 30 seconds. The pauses seen between a PVC and a normally conducting P wave are caused by retrograde conduction from the ventricle to the atrium, with subsequent block within the atrium.
Finally, left atrial enlargement is evidenced by a biphasic P wave in the normally conducting beat seen in lead V1.

An 84-year-old man is transferred to your facility from a skilled nursing facility (SNF). During the routine morning vital signs check, the medical assistant (MA) at the SNF noted that the patient had a normal blood pressure but an irregular heart rate that she hadn’t observed before. The MA asked the nursing supervisor to verify her findings. The nursing supervisor noticed not only an irregular heart rate, but also pauses of up to 3 seconds. The patient denied chest pain, shortness of breath, or syncope, but he did say that twice overnight he had become lightheaded while walking from his bed to the bathroom. Upon further questioning, he informed the staff that this had happened once before: right before his “heart became very sick” and he spent a long time in the hospital “getting it fixed.” Given this history and the physical findings, the nursing supervisor called 911 to have him further evaluated. Your first impression of the patient is that he is comfortable, pleasant, and in no distress. His medical history is remarkable for a nonischemic cardiomyopathy with acute onset chronic heart failure. A year ago, he had an echocardiogram at another facility that showed aortic sclerosis, mild mitral regurgitation, and a left ventricular ejection fraction of 35%. He also has a history of hypertension, COPD, hypothyroidism, and osteoarthritis. His surgical history is remarkable for bilateral knee replacements, left hip replacement, and appendectomy. Family history is significant for heart failure in both parents and in his maternal grandparents. His father died in World War I, and his mother died of complications from abdominal surgery. The patient, a retired contract painter, became a widower five years ago, when his wife died of a hemorrhagic stroke. He has no children. Before voluntarily moving to the SNF after his wife’s death, he smoked one pack of cigarettes and drank one six-pack of beer per day. He now abstains from both substances. His medication list includes metoprolol, furosemide, potassium, lisinopril, and levothyroxine. He is allergic to tetracycline antibiotics.The review of systems is remarkable for hearing loss requiring bilateral hearing aids, corrective lenses, and use of a cane for ambulation. Physical examination reveals a frail, elderly male with a weight of 148 lb and a height of 68 in. His blood pressure is 104/52 mm Hg; pulse, irregularly irregular with pauses at an average rate of 80 beats/min; and O2 saturation, 94% on room air. He is afebrile. Pertinent physical findings include corrective lenses and bilateral hearing aids. A cataract is visible on the left eye. The lungs are clear bilaterally. The cardiac exam reveals an irregular rate, a grade II/VI early systolic murmur at the left upper sternal border with radiation into the neck, a grade II/VI early diastolic murmur heard during periods of a regular heart rate, and no rubs or gallops. The abdomen is protuberant but soft, with an old right lower quadrant surgical scar. The extremities show no evidence of peripheral edema; however, there are advanced changes related to osteoarthritis in both hands, and surgical scars over both knees and the lateral aspect of his left hip. Bloodwork is obtained for analysis, and an ECG is performed. The latter reveals a ventricular rate of 82 beats/min; PR interval, 146 ms; QRS duration, 76 ms; QT/QTc interval, 438/511 ms; P axis, 73°; R axis, 62°; and T axis, 92°. What is your interpretation of this ECG?
Ear “Wart” Prompts Unkind Comments
ANSWER
The correct answer is nevus sebaceous (choice “b”), a rather common hamartomatous congenital tumor. The diagnosis was confirmed by pathologic examination of a tiny sample from the most papular portion of the lesion.
Given the lesion’s congenital nature and complete lack of response to treatment, wart (choice “a”) was quite unlikely. And although trichofolliculoma (choice “c”) and epidermal nevus (choice “d”) were possible differential items, the former usually appears much later in life and the latter is usually more dry and rough to the touch.
DISCUSSION
Nevus sebaceous (NS) of Jadassohn was first described in 1895 by a Swedish dermatologist who had seen a series of young patients with hairless plaques in the scalp or on surrounding neck or facial skin. Pathologic exam confirmed them to be organoid nevi representing an overgrowth of sebaceous glands.
Over time, it became clear that NS affects all genders and races equally. For most patients, the lesions are of cosmetic concern due to the lack of hair. But it has also been established that NS can develop in areas, including the face, ears, and neck, on which they may be cosmetically significant and difficult to remove.
Concern arose when reports began to surface that NS could undergo malignant transformation, especially in larger scalp lesions that are subject to years of excess UV exposure. This was the driving force behind the common practice of removing NS at puberty. We now know that although basal or squamous cell carcinoma, or even melanoma, can develop in longstanding NS, the frequency is probably far less than previously thought.
Most cases of NS in the scalp are easy to diagnose by their pink color, plaquish morphology, and mammillated hairless surface (coupled with congenital manifestation). But a few, such as this patient’s ear lesion, require biopsy for confirmation. As this patient ages, he may feel the need to have the rest of it surgically removed.
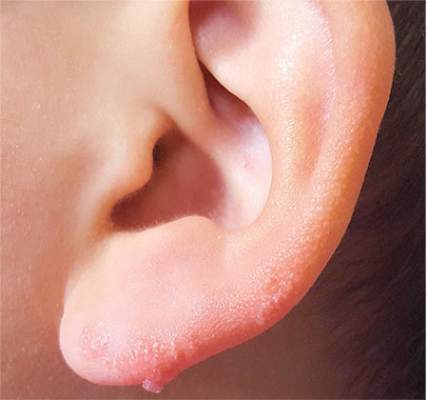
An 8-year-old boy is referred to dermatology for evaluation and treatment of a “wart” on the inferior rim of his left helix that has been present (and unchanged) since birth. The lesion is asymptomatic, and the boy’s biggest complaint is that it makes him the object of unkind comments from his siblings and friends. The patient’s mother claims the child is otherwise healthy; there is no history of seizure or other neurologic problems, and he does not have any medical conditions requiring treatment. The lesion has been treated, unsuccessfully, with a variety of wart remedies, including salicylic acid-based products and liquid nitrogen. Along the inferior rim of the left helix is a 5-cm linear collection of soft, skin-colored papules that range in size from pinpoint to 2.5 mm. They are so small and flesh-toned as to easily escape detection unless specifically sought. No other significant lesions are seen on the ear or elsewhere on the head or neck. The child looks his stated age and appears well developed and well nourished.

Low Back Pain: Evidence-based Diagnosis and Treatment
CE/CME No: CR-1605
PROGRAM OVERVIEW
Earn credit by reading this article and successfully completing the posttest and evaluation. Successful completion is defined as a cumulative score of at least 70% correct.
EDUCATIONAL OBJECTIVES
• Identify "red flag" items in the history and physical exam that make low back pain (LBP) "complicated."
• Stratify patients into three categories: simple back pain, complicated back pain, and back pain with sciatica.
• Discuss when appropriate additional testing/imaging is needed based on LBP categories.
• Discuss patient perceptions and costs associated with imaging and LBP.
• Describe basic treatment options for noncomplicated acute LBP.
FACULTY
Mike Roscoe is the PA Program Director at the University of Evansville, Indiana. Alyssa Nishihira is in her final year of the PA program at Butler University, Indianapolis; after graduation, she will be practicing at Advanced Neurosurgery in Reno, Nevada.
The authors have no financial relationships to disclose.
ACCREDITATION STATEMENT
![]()
This program has been reviewed and is approved for a maximum of 1.0 hour of American Academy of Physician Assistants (AAPA) Category 1 CME credit by the Physician Assistant Review Panel. [NPs: Both ANCC and the AANP Certification Program recognize AAPA as an approved provider of Category 1 credit.] Approval is valid for one year from the issue date of May 2016.
Article begins on next page >>
Low back pain (LBP) is one of the most common reasons for an office visit, but most cases—at least 95%—have a benign underlying cause. Evaluation of LBP patients in the primary care setting, therefore, must focus on identifying “red flags” in the history and physical exam that suggest a significant underlying process requiring further work-up, including imaging. This evidence-based approach helps control costs and prevents the detrimental effects of unnecessary testing.
Low back pain (LBP) plagues many Americans and is a common reason for office visits in the United States. In 2010, back symptoms were the principal reason for 1.3% of office visits in the US.1 Recent data suggest that 75% to 85% of all Americans will experience an episode of LBP at least once in their lifetime.2 It is the leading cause of years lived with disability in the US3 and is a common reason for work disability. From a health care system standpoint, LBP imposes a considerable burden, accounting for more than $85 billion annually in direct costs.2
The etiology of LBP can be related to several anatomic and physiologic changes. Potential origins of LBP include, but are not limited to, pathology of the vertebrospinal ligaments, musculature, facet joints, fascia, vertebra and vertebral disks, and the extensive neurovascular components of the lumbar region. Although the potential causes of LBP are many, the majority of patients presenting with acute LBP usually improve with minimal clinical intervention within the first month. This is true even for patients who report limitations in daily activities and those with severe, acute cases of LBP.
A single standard of care for patients presenting with LBP has not been established. The wide array of choices for diagnosis and treatment of LBP is one factor that hinders the development of a standard diagnostic protocol. The challenge to clinicians when diagnosing LBP is to differentiate the patients with benign, self-limiting LBP (simple), who comprise the vast majority of LBP patients, from the 1% to 5% with a serious underlying pathology (complicated).4
Continue for stratification of low back pain >>
STRATIFICATION OF LOW BACK PAIN
Koes and colleagues analyzed 13 different national guidelines and two international guidelines for the management of LBP.5 They found that the guidelines consistently recommend focusing the history and physical exam (HPE) on identifying features suggestive of underlying serious pathology, or “red flags,” and excluding specific diseases.5 They also found that none of the guidelines recommends the routine use of imaging in patients without suspected serious pathology.5 The American College of Radiology simplified this approach to patients with LBP by creating a list of red flags to look for during the HPE.3 The presence of red flags indicates a case of complicated LBP, and patients who present with them should undergo additional diagnostic studies to screen for serious underlying conditions (see the Table).
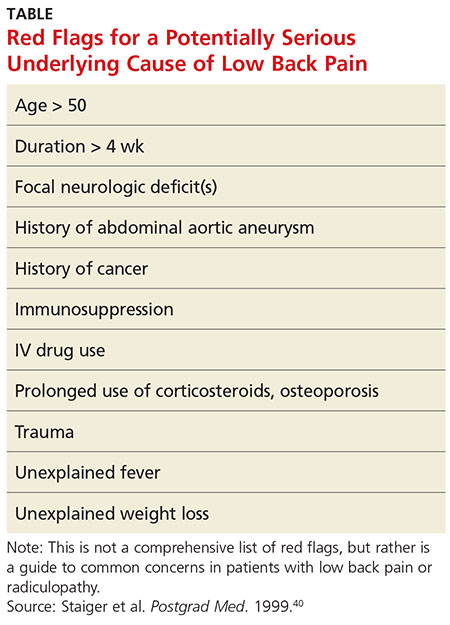
The HPE should ultimately separate patients into three categories to determine the need for imaging (and course of treatment): (1) simple acute back pain, (2) complicated back pain with red flag (ie, a potential underlying systemic disease), and (3) LBP with neurologic deficits potentially requiring surgery.5
Simple acute low back pain
Up to 85% of patients presenting with LBP may never receive a definitive diagnosis due to lack of specific symptoms and ambiguous imaging results.6 Clinicians can assume that LBP in these patients is due to a mechanical cause, by far the most common cause of LBP.7 It is therefore more useful to rule out serious or potentially fatal causes of LBP (complicated LBP) rather than rule in a cause for patients presenting with LBP.
It is generally accepted among practitioners that a thorough HPE alone is sufficient for evaluating most patients presenting with acute LBP lasting less than four weeks.5 Patients presenting without red flags should be assured that improvement of acute LBP is typical, and that no diagnostic intervention is needed unless they do not improve as expected per patient or provider (eg, in terms of activities of daily living or work restrictions). The Figure depicts an appropriate approach to diagnosis and treatment in patients presenting with LBP.8 Clinicians should also offer patient education for self-care and discuss noninvasive treatment options, including pharmacologic and nonpharmacologic therapy.9
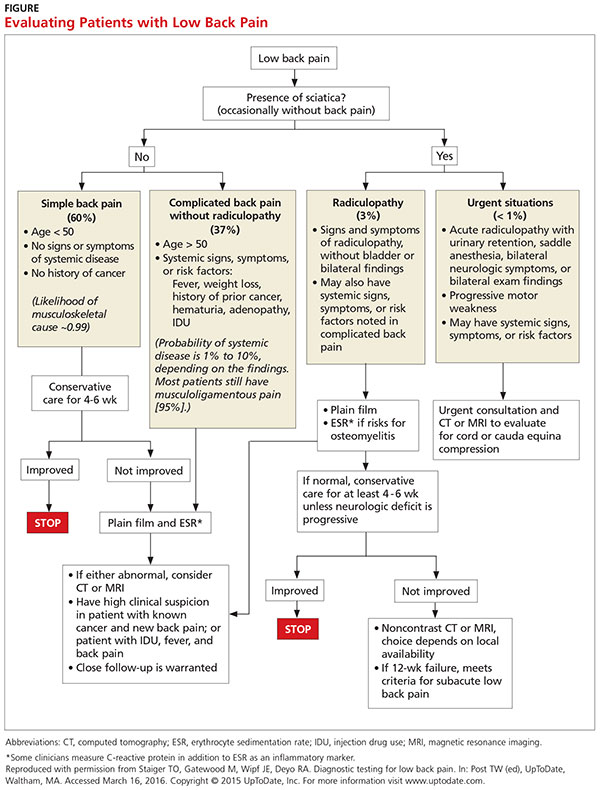
Low back pain with red flags (complicated)
Patient history is more useful than the physical exam in screening for spinal malignancies. In one particular combination (age > 50, history of cancer, unexplained weight loss, and failure to improve with conservative therapy), red flag symptoms are 100% sensitive for detecting malignancy.10 However, malignant neoplasms of the spine make up less than 1% of the diagnoses of patients presenting with LBP in primary care.4 Additionally, Deyo and Diehl reviewed five studies of a large series of consecutive spine films with large sample sizes and found the incidence of tumors, infections, and inflammatory spondyloarthropathies together were present in less than 2%.11 This low prevalence underscores the challenge of diagnosing serious pathology of the spine in the primary care setting.
Patients with complicated back pain presenting with red flags should always be examined for an underlying systemic disease. There is one red flag that, seen in isolation, meaningfully increases the likelihood of cancer: a previous history of cancer.4 Otherwise, inflammatory markers (eg, erythrocyte sedimentation rate) can be used to determine the need for advanced imaging (see the Figure).10
Low back pain with neurologic findings (sciatica)
Screening (HPE) for neurologic damage is difficult because traditional findings of neurologic injury (paresis or muscle weakness, impaired reflexes, sensory deficits, and decreased range of motion) all have low sensitivity with higher specificity.12 For this reason, these tests are of limited value as screening tools during the HPE. Specific exams, such as the straight leg raise and crossed straight leg tests, are also of limited value, especially in the primary care setting, because of inconsistent sensitivity and specificity.
This is the primary reason that the HPE in patients with LBP who have neurologic findings must include evaluation for urgent findings (see the Figure). If any red flags are present, advanced imaging is immediately warranted. Otherwise, inflammatory markers and plain radiography may be obtained, and advanced imaging may be considered if the plain radiography and/or inflammatory markers are abnormal.
There is also an approach that advocates the use of advanced imaging in patients with significant functional disability due to their LBP. Two questionnaires, the Oswestry Low Back Pain Disability Index and the Roland-Morris Disability Questionnaire, evaluate subjective data to determine a patient’s functional disability due to LBP.The validity of both tests has been confirmed.13
Continue for diagnostic imaging >>
DIAGNOSTIC IMAGING
The majority of patients presenting with LBP without concerning symptoms can be assumed to have nonspecific mechanical back pain. These patients do not need radiography unless the pain has not improved after four to six weeks of conservative care, because plain radiographs often detect findings (degenerative joint disease, bone spurs, spondylosis) that are unrelated to symptoms.9 Advanced imaging is generally recommended only for LBP patients with red flags due to the potentially critical nature of these cases.5 Patients with LBP presenting with any of these factors require further testing, even if the duration of their pain is less than four weeks.
If a patient’s LBP persists beyond four weeks, the clinician must decide which diagnostic test to order. General medical knowledge suggests that MRI is superior to plain radiography because it shows soft tissue and can detect more concerning abnormalities, such as infections, cancer, and metastatic tumors. CT is better for showing bony abnormalities, but these rarely correlate with a patient’s LBP, and CT subjects patients to levels of radiation that can increase cancer risks.14 Plain radiography in this cohort (LBP > 4 wk) is not generally recommended as it cannot show intervertebral discs or evaluate the degree of spinal stenosis as accurately as MRI. Additionally, these lumbar radiographs expose patients to more than 35 times the radiation delivered in a single chest radiograph.15
COSTS AND PATIENT OUTCOMES
The estimated cost of unnecessary imaging for LBP is $300 million per year.16 There is evidence of a strong association between advanced lumbar spine imaging and increased rates of surgery and significantly higher total medical expenditures.17,18 One study examined patients with nonspecific LBP who either received MRI within 30 days post-onset (defined as “early MRI”) or did not receive MRI. Early-MRI patients had significantly higher total medical expenses ($12,948, P < .0001) than the no-MRI group.17 The early-MRI group also had significantly longer periods of disability and were less likely to go off disability than the no-MRI group (P < .0001).
Cost-effectiveness studies of plain radiographs, dating back to 1982, have yielded similar findings. Liang et al suggested that if radiography was done routinely at the initial visit in patients with acute LBP but no red flags, the cost would be more than $2,000 (in 1982 dollars) to avert one day of pain.19 A more recent study examined patients with acute LBP who received MRI, with one group blinded (both patients and physicians) to their MRI results for six months while the other group received their results within 48 hours.20 All patients underwent a physical exam by a study coordinator, and treatment was assigned prior to imaging. At six weeks and one year, there was no significant difference in treatment assignments or self-reported surveys between groups, indicating that the MRI results had no significant influence on patient outcomes.
Despite the large increase in the use of advanced diagnostic imaging aimed at improving patient care and outcomes, there is a lack of data showing any correlative or causative connection between the two. Given this lack of evidence, and the potentially detrimental radiation exposure and increased costs to patients, clinicians should follow evidence-based guidelines when considering diagnostic imaging in patients presenting with LBP.
Continue for patient perception >>
PATIENT PERCEPTION
Patient satisfaction plays a very important role in health care and may correlate with compliance and other outcomes. One study showed that while radiography in patients with LBP was not associated with improved clinical outcomes, it did increase patients’ satisfaction with the care they received.21 A study that grouped patients requiring imaging for LBP into rapid MRI and plain film radiography cohorts found that patients who received rapid MRI were more assured by their results than were patients in the radiography group (74% vs 58%, P = .002).22 Both groups showed significant clinical improvement in the first three months, but there was no difference between groups at either the three- or 12-month mark. In both groups, reassurance was positively correlated with patient satisfaction (Pearson correlation coefficients, 0.55-0.59, P < .001).
Patients may be reassured by imaging, even when it is unnecessary. Effectively explaining symptomatology during the HPE to patients with LBP should be of high priority to clinicians. A study found that when patients with mechanical LBP did not receive an adequate explanation of the problem, they were less satisfied with their visit and wanted more diagnostic tests.11 Another study found that when low-risk patients were randomly assigned to a control group and received an educational intervention only, they reported equal satisfaction with their care and had clinical outcomes equal to those of the treatment group that received a plain radiograph.11
Given the costs, radiation risks, and other negative aspects of unnecessary imaging, additional diagnostic tests may not be in a patient’s best interest. A careful physical exam should be performed, with the clinician providing ongoing commentary to reassure patients that the clinician is neither dismissing the patient’s symptoms nor inappropriately avoiding further tests.
Often, medical providers order imaging with the intention to reassure patients with the results and thus ultimately increase the patient’s sense of well-being. However, the opposite effect may occur, with patients actually developing a decreased sense of wellness with no alteration of outcomes. A study evaluated general health (GH) scores (based on results from several screening questionnaires that assessed the patient’s current physical and mental health state) in patients receiving MRI results.20 The patients were divided into those who received results (within 48 hours), and those who did not unless it was critical to patient management (blinded group). At six weeks, the blinded group’s GH score was significantly higher than the early-informed group’s GH score. This suggests that receiving MRI results may negatively influence patients’ perception of their general health.20
The same meta-analysis that reviewed patient outcomes also evaluated mental health and quality-of-life scores of LBP patients who received either MRI, CT, or radiography.23 There was no short-term (< 3 mo) or long-term (6-12 mo) difference between patients who received radiography versus advanced imaging. This indicates that using imaging of any kind in patients with LBP but without indications of serious underlying conditions does not improve clinical outcomes and is negatively correlated with quality-of-life measures at short- and long-term intervals.23
Continue for treatment >>
TREATMENT
The prognosis of simple acute mechanical LBP is excellent. Although back pain is a leading reason for visiting health care providers, many affected individuals never seek medical care and apparently improve on their own. In a random telephone survey of North Carolina residents, only 39% of persons with LBP sought medical care.24 Therefore, patients who do seek treatment should be given reassurance, and therapies should be tailored to the individual in the least invasive and most cost-effective manner. Many treatment options are available for LBP, but often strong evidence of benefit is lacking.
Pharmacologic therapy
Anti-inflammatories. It can be assumed that when a patient comes to the practitioner for evaluation of LBP, there is an expectation that some type of medication will be recommended or prescribed for pain relief. Unless there is a contraindication, NSAIDs are often first-line therapy, and they are effective for short-term symptom relief when compared with placebo.25 A mild pain medication, such as acetaminophen, is also a common treatment. The 2007 joint practice guideline from the American Pain Society (APS) and the American College of Physicians (ACP) recommends acetaminophen or NSAIDs as first-line therapy for acute LBP.3 Neither agent—NSAIDs or acetaminophen—has shown superiority, and combining the two has shown no additional benefits.26 Caution must be used, however, as NSAIDs have a risk for gastrointestinal toxicity and nephrotoxicity, and acetaminophen has a dose- and patient-dependent risk for hepatotoxicity.
Muscle relaxants. Muscle relaxants are another pharmacologic treatment option for LBP. Most pain reduction from this class of medication occurs in the first one to two weeks of therapy, although benefit may continue for up to four weeks.27 There is also evidence that a combination of an NSAID and a muscle relaxer has added benefits.27 These medications are centrally acting, so sedation and dizziness are common; all medications in this class have these adverse effects to some degree. Carisoprodol has as its first metabolite meprobamate, which is a tranquilizer used to treat anxiety disorders; it has a potential for abuse and should be used with caution in certain populations.
Opioids. Opioids are commonly prescribed to patients with LBP, though there are limited data regarding efficacy. One trial compared an NSAID alone versus an NSAID plus oxycodone/acetaminophen and found no significant difference in pain or disability after seven days.28 In addition, the adverse effects of opioids, which include sedation, constipation, nausea, and confusion, may be amplified in the elderly population; therefore, opioids should be prescribed with caution in these patients. If prescribed to treat acute LBP, opioids should be used in short, scheduled dosing regimens since NSAIDs or acetaminophen suffice for most patients.
Corticosteroids. Oral glucocorticoids are sometimes given to patients with acute LBP, and they likely are used more frequently in patients with radicular symptoms. However, the APS/ACP 2007 joint guidelines recommend against use of systemic glucocorticoids for acute LBP due to lack of proven benefit.3 Epidural steroid injections are not generally beneficial for isolated acute LBP, but there is evidence that they are helpful with persistent radicular pain.29 Zarghooni and colleagues found significant reductions in pain and use of pain medication after single-shot epidural injections.29
Other pharmacologic therapies, acupuncture, sclerotherapy, and other methods are used to treat back pain, but these are typically reserved for chronic, not acute, LBP.
Nonpharmacologic therapy
Physical therapy. Physical therapy is a commonly prescribed treatment for LBP. Systematic literature reviews indicate that for patients with acute LBP (< 6 wk), there is no difference in the effectiveness of exercise therapy compared to no treatment and care provided by a general practitioner or to manipulations.30 For patients with subacute (6-12 wk) and chronic (≥ 12 wk) LBP, exercise therapy is effective compared to no treatment.30 There is debate, however, over which exercise activities should be used. Research supports strength/resistance and coordination/stabilization exercises.
Most therapists recommend the McKenzie method or spine stabilization exercises.31 The McKenzie method is used for LBP with sciatica; the patient moves through exercises within the prone position and focuses on extension of the spine. Spine stabilization is an active form of exercise based on a “neutral spine” position and helps strengthen muscles to maintain this position (core stabilization). The McKenzie method, when added to first-line care for LBP, does not produce significant improvements in pain or other clinical outcomes, although it may reduce health care utilization.32 Spine stabilization exercises have been shown to decrease pain, disability, and risk for recurrence after a first episode of back pain.33 The apparent success of physical therapy is attributed to compliance with directed home exercise programs, which have been shown to reduce the rate of recurrence, decrease episodes of acute LBP, and decrease the need for health services.34
Spinal traction. Traction or nonsurgical spinal decompression has emerged as a treatment for LBP. Unfortunately, there are little data to support its use as a treatment for acute LBP. Only a few randomized trials showed benefit, and these were small studies with a high risk for bias. A Cochrane review published in 2013 looked at 32 studies involving 2,762 patients with acute, subacute, and chronic LBP.35 The review did not find any evidence that traction alone or in combination with other therapy was any better than placebo treatment.35
Spinal manipulation. Spinal manipulation may be more effective than placebo treatment in reducing pain when the pain has been present for less than six weeks, but it is not more effective in reducing disability.36 There is little or no high-level evidence about spinal manipulation for acute LBP. However, there is some evidence of cost-effectiveness when using spinal manipulation in subacute to chronic pain.37 Chiropractic techniques are considered safe (when performed by a trained provider), but a systematic review found that these techniques provide no clinically relevant improvement in pain or disability when compared to other treatments.38
Bed rest. Bed rest has not been shown to improve outcomes, and in fact patients who had bed rest had less favorable outcomes than those who stayed active.39 Bed rest is less effective at reducing pain and improving function when compared to staying active.39
Continue for recommended management >>
Recommended management
A patient who presents with nonspecific acute LBP should have a thorough HPE to evaluate for the presence of red flags. If no concerning findings are present, the initial visit should focus on patient education based on the following items: (1) good prognosis with little intervention, (2) staying active and avoiding bed rest as much as possible, and (3) avoiding pain-causing movements when possible. The second step is to initiate a trial of an NSAID or acetaminophen and consider a muscle relaxant based on pain severity. Avoid opioid therapy if possible, but use conservative dosing if required for severe pain. Patients should be advised to return in two to four weeks if they do not experience significant improvement. At this time, the clinician may consider referring the patient for physical therapy, changing NSAIDs, ordering inflammatory markers, and/or referring to a specialist.
CONCLUSION
Although no single diagnostic protocol for LBP exists, the clinician must be able to distinguish simple from complex types. A thorough HPE is useful for categorizing the patient’s pain, with diagnostic imaging reserved for those patients with severe or progressive neurologic deficits, suspicion of serious underlying conditions, or LBP lasting more than four weeks without improvement. MRI, if available, is generally preferred over CT because it does not use ionizing radiation and provides better visualization of soft tissue, vertebral marrow, and the spinal cord. Symptomatology should be explained to patients with LBP during the HPE, with ongoing commentary to increase patient satisfaction and compliance. About two-thirds of patients with LBP do not seek evaluation from a health care provider; therefore, those who do seek treatment should be reassured, and therapies tailored to the individual in the least invasive and most cost-effective manner possible.
1. CDC. National Ambulatory Medical Care Survey: 2010 Summary Tables. Table 9. www.cdc.gov/nchs/data/ahcd/namcs_summary/2010_namcs_web_tables.pdf. Accessed March 29, 2016.
2. Davies C, Nitz AJ, Mattacola CG, et al. Practice patterns when treating patients with low back pain: a survey of physical therapists. Physiother Theor Pract. 2014;30(6):399-408.
3. American College of Radiology. ACR Appropriateness Criteria. Low back pain. 2015. www.acr.org/~/media/ACR/Documents/AppCriteria/Diagnostic/LowBackPain.pdf. Accessed March 10, 2016.
4. Henschke N, Maher CG, Ostelo RW, et al. Red flags to screen for malignancy in patients with low back pain. Cochrane Database Syst Rev. 2013;2:CD008686.
5. Koes BW, Tulder M, Lin CW, et al. An updated overview of clinical guidelines for the management of non-specific low back pain in primary care. Eur Spine J. 2010;19(12):2075-2094.
6. Deyo RA, Rainville J, Kent DL. What can the history and physical examination tell us about low back pain? JAMA. 1992;268(6):760-765.
7. Jarvik JG. Diagnostic evaluation of low back pain with emphasis on imaging. Ann Intern Med. 2002;137:586-597.
8. Diagnostic testing for low back pain. In: Post TW (ed), UpToDate, Waltham, MA. www.uptodate.com. Accessed March 16, 2016.
9. Chou R, Qaseem A, Snow V, et al; Clinical Efficacy Assessment Subcommittee of the American College of Physicians; American College of Physicians; American Pain Society Low Back Pain Guidelines Panel. Diagnosis and treatment of low back pain: a joint clinical practice guideline from the American College of Physicians and the American Pain Society. Ann Intern Med. 2007;147(7):478-491.
10. Deyo RA, Diehl AK. Cancer as a cause of back pain: frequency, clinical presentation, and diagnostic strategies. J Gen Intern Med. 1988;3(3):230-238.
11. Deyo RA, Diehl AK. Patient satisfaction with medical care for low-back pain. Spine. 1986;11(1):28-30.
12. Pradeep S, Rainville J, Katz JN, et al. The accuracy of the physical examination for the diagnosis of midlumbar and low lumbar nerve root impingement. Spine. 2011;36(1):63-73.
13. Leclaire R, Blier F, Fortin L, Proulx R. A cross-sectional study comparing the Oswestry and Roland-Morris Functional Disability Scales in two populations of patients with low back pain of different levels of severity. Spine. 1997;22(1):68-71
14. FDA. Radiation emitting products. www.fda.gov/Radiation-EmittingProducts/RadiationEmittingProductsandProcedures/MedicalImaging/MedicalX-Rays/ucm115317.htm. Accessed March 29, 2016.
15. Simpson AK, Whang PG, Jonisch A, et al. The radiation exposure associated with cervical and lumbar spine radiographs. J Spinal Disord Tech. 2008;21(6):409-412.
16. Srinivas S, Deyo R, Berger Z. Application of “less is more” to lower back pain. Arch Intern Med. 2012;172(13):1016-1020.
17. Webster BS, Bauer AZ, Choi Y, et al. Iatrogenic consequences of early magnetic resonance imaging in acute, work-related, disabling back pain. Spine. 2013;38(22):1939-1946.
18. Webster BS, Bauer AZ, Choi Y, et al. The cascade of medical services and associated longitudinal costs due to nonadherent magnetic resonance imaging for low back pain. Spine. 2014;39(17):1433-1440.
19. Liang M, Komaroff AL. Roentgenograms in primary care patients with acute low back pain: a cost-effectiveness analysis. Arch Intern Med. 1982;142(6):1108-1112.
20. Ash LM, Modic MT, Obuchowski NA, et al. Effects of diagnostic information, per se, on patient outcomes in acute radiculopathy and low back pain. AJNR Am J Neuroradiol. 2008;29(6):1098-1103.
21. Kendrick D, Fielding K, Bentley E, et al. Radiography of the lumbar spine in primary care patients with low back pain: randomized controlled trial. BMJ. 2001;322(7283):400-405.
22. Jarvik JG, Hollingworth W, Martin B, et al. Rapid magnetic resonance imaging vs radiographs for patients with low back pain. JAMA. 2003;289(21):2810-2818.
23. Chou R, Fu R, Carrino JA, Deyo RA. Imaging strategies for low-back pain: systematic review and meta-analysis. Lancet. 2009;373(9662):463-472.
24. Carey TS, Evans AT, Hadler NM, et al. Acute severe low back pain: a population-based study of prevalence and care-seeking. Spine. 1996;21(3):339-344.
25. Roelofs PD, Deyo RA, Koes BW, et al. Nonsteroidal anti-inflammatory drugs for low back pain. Spine. 2008;33(16):1766-1774.
26. Hancock MJ, Maher CG, Latimer J, et al. Assessment of diclofenac or spinal manipulative therapy, or both, in addition to recommended first-line treatment for acute low back pain: a randomized controlled trial. Lancet. 2007;370(10):1638-1643.
27. Van Tulder MW, Touray T, Furlan AD, et al. Muscle relaxants for non-specific low-back pain. Cochrane Database Syst Rev. 2003;(4):CD004252.
28. Friedman BW, Dym AA, Davitt M, et al. Naproxen with cyclobenzaprine, oxycodone/acetaminophen, or placebo for treating acute low back pain: a randomized clinical trial. JAMA. 2015;314(15):1572-1580.
29. Zarghooni K, Rashidi A, Siewe, J, et al. Single-shot epidural injections in the management of radicular pain. Orthop Rev (Pavia). 2015;7(4):5985.
30. Smidt N, deVet HC, Bouter LM, et al. Effectiveness of exercise therapy: A best-evidence summary of systematic reviews. Aust J Physiother. 2005;51(2):71-85.
31. Casazza BA. Diagnosis and treatment of acute low back pain. Am Fam Physician. 2012;85(4):343-350.
32. Machado LA, Maher CG, Herbert RD, et al. The effectiveness of the McKenzie method in addition to first-line care for acute low back pain: a randomized controlled trial. BMC Med. 2010;8(10):1-10.
33. Cho I, Jeon C, Lee S, et al. Effects of lumbar stabilization exercise on functional disability and lumbar lordosis angle in patients with chronic low back pain. J Phys Ther Sci. 2015;27(6):1983-1985.
34. Choi BK, Verbeek JH, Tam WW, Jiang JY. Exercises for prevention of recurrences of low-back pain (review). Cochrane Database Syst Rev. 2010;(1):CD006555.
35. Wegner I, Widyahening IS, van Tulder MW, et al. Traction for low-back pain with or without sciatica (review). Cochrane Database Syst Rev. 2013;(8):CD003010.
36. Hoiriis KT, Pfleger B, McDuffie FC, et al. A randomized clinical trial comparing chiropractic adjustments to muscle relaxants for subacute low back pain. J Manipulative Physiol Ther. 2004;27(6):388-398.
37. Lin CC, Haas M, Maher CG, et al. Cost-effectiveness of guideline-endorsed treatments for low back pain: a systematic review. Eur Spine J. 2011;20:1024-1038.
38. Walker BF, French SD, Grant W, Green S. A Cochrane Review of combined chiropractic interventions for low-back pain. Spine. 2011;36(3): 230-242.
39. Dahm KT, Brurberg KG, Jamtvedt G, Hagen KB. Advice to rest in bed versus advice to stay active for acute low-back pain and sciatica. Cochrane Database Syst Rev. 2010;(6):CD007612.
40. Staiger T, Paauw D, Deyo A, Jarvik JG. Imaging studies for acute low back pain. When and when not to order them. Postgrad Med. 1999;105(4):161-162,165-166,171-172.
CE/CME No: CR-1605
PROGRAM OVERVIEW
Earn credit by reading this article and successfully completing the posttest and evaluation. Successful completion is defined as a cumulative score of at least 70% correct.
EDUCATIONAL OBJECTIVES
• Identify "red flag" items in the history and physical exam that make low back pain (LBP) "complicated."
• Stratify patients into three categories: simple back pain, complicated back pain, and back pain with sciatica.
• Discuss when appropriate additional testing/imaging is needed based on LBP categories.
• Discuss patient perceptions and costs associated with imaging and LBP.
• Describe basic treatment options for noncomplicated acute LBP.
FACULTY
Mike Roscoe is the PA Program Director at the University of Evansville, Indiana. Alyssa Nishihira is in her final year of the PA program at Butler University, Indianapolis; after graduation, she will be practicing at Advanced Neurosurgery in Reno, Nevada.
The authors have no financial relationships to disclose.
ACCREDITATION STATEMENT
![]()
This program has been reviewed and is approved for a maximum of 1.0 hour of American Academy of Physician Assistants (AAPA) Category 1 CME credit by the Physician Assistant Review Panel. [NPs: Both ANCC and the AANP Certification Program recognize AAPA as an approved provider of Category 1 credit.] Approval is valid for one year from the issue date of May 2016.
Article begins on next page >>
Low back pain (LBP) is one of the most common reasons for an office visit, but most cases—at least 95%—have a benign underlying cause. Evaluation of LBP patients in the primary care setting, therefore, must focus on identifying “red flags” in the history and physical exam that suggest a significant underlying process requiring further work-up, including imaging. This evidence-based approach helps control costs and prevents the detrimental effects of unnecessary testing.
Low back pain (LBP) plagues many Americans and is a common reason for office visits in the United States. In 2010, back symptoms were the principal reason for 1.3% of office visits in the US.1 Recent data suggest that 75% to 85% of all Americans will experience an episode of LBP at least once in their lifetime.2 It is the leading cause of years lived with disability in the US3 and is a common reason for work disability. From a health care system standpoint, LBP imposes a considerable burden, accounting for more than $85 billion annually in direct costs.2
The etiology of LBP can be related to several anatomic and physiologic changes. Potential origins of LBP include, but are not limited to, pathology of the vertebrospinal ligaments, musculature, facet joints, fascia, vertebra and vertebral disks, and the extensive neurovascular components of the lumbar region. Although the potential causes of LBP are many, the majority of patients presenting with acute LBP usually improve with minimal clinical intervention within the first month. This is true even for patients who report limitations in daily activities and those with severe, acute cases of LBP.
A single standard of care for patients presenting with LBP has not been established. The wide array of choices for diagnosis and treatment of LBP is one factor that hinders the development of a standard diagnostic protocol. The challenge to clinicians when diagnosing LBP is to differentiate the patients with benign, self-limiting LBP (simple), who comprise the vast majority of LBP patients, from the 1% to 5% with a serious underlying pathology (complicated).4
Continue for stratification of low back pain >>
STRATIFICATION OF LOW BACK PAIN
Koes and colleagues analyzed 13 different national guidelines and two international guidelines for the management of LBP.5 They found that the guidelines consistently recommend focusing the history and physical exam (HPE) on identifying features suggestive of underlying serious pathology, or “red flags,” and excluding specific diseases.5 They also found that none of the guidelines recommends the routine use of imaging in patients without suspected serious pathology.5 The American College of Radiology simplified this approach to patients with LBP by creating a list of red flags to look for during the HPE.3 The presence of red flags indicates a case of complicated LBP, and patients who present with them should undergo additional diagnostic studies to screen for serious underlying conditions (see the Table).
The HPE should ultimately separate patients into three categories to determine the need for imaging (and course of treatment): (1) simple acute back pain, (2) complicated back pain with red flag (ie, a potential underlying systemic disease), and (3) LBP with neurologic deficits potentially requiring surgery.5
Simple acute low back pain
Up to 85% of patients presenting with LBP may never receive a definitive diagnosis due to lack of specific symptoms and ambiguous imaging results.6 Clinicians can assume that LBP in these patients is due to a mechanical cause, by far the most common cause of LBP.7 It is therefore more useful to rule out serious or potentially fatal causes of LBP (complicated LBP) rather than rule in a cause for patients presenting with LBP.
It is generally accepted among practitioners that a thorough HPE alone is sufficient for evaluating most patients presenting with acute LBP lasting less than four weeks.5 Patients presenting without red flags should be assured that improvement of acute LBP is typical, and that no diagnostic intervention is needed unless they do not improve as expected per patient or provider (eg, in terms of activities of daily living or work restrictions). The Figure depicts an appropriate approach to diagnosis and treatment in patients presenting with LBP.8 Clinicians should also offer patient education for self-care and discuss noninvasive treatment options, including pharmacologic and nonpharmacologic therapy.9
Low back pain with red flags (complicated)
Patient history is more useful than the physical exam in screening for spinal malignancies. In one particular combination (age > 50, history of cancer, unexplained weight loss, and failure to improve with conservative therapy), red flag symptoms are 100% sensitive for detecting malignancy.10 However, malignant neoplasms of the spine make up less than 1% of the diagnoses of patients presenting with LBP in primary care.4 Additionally, Deyo and Diehl reviewed five studies of a large series of consecutive spine films with large sample sizes and found the incidence of tumors, infections, and inflammatory spondyloarthropathies together were present in less than 2%.11 This low prevalence underscores the challenge of diagnosing serious pathology of the spine in the primary care setting.
Patients with complicated back pain presenting with red flags should always be examined for an underlying systemic disease. There is one red flag that, seen in isolation, meaningfully increases the likelihood of cancer: a previous history of cancer.4 Otherwise, inflammatory markers (eg, erythrocyte sedimentation rate) can be used to determine the need for advanced imaging (see the Figure).10
Low back pain with neurologic findings (sciatica)
Screening (HPE) for neurologic damage is difficult because traditional findings of neurologic injury (paresis or muscle weakness, impaired reflexes, sensory deficits, and decreased range of motion) all have low sensitivity with higher specificity.12 For this reason, these tests are of limited value as screening tools during the HPE. Specific exams, such as the straight leg raise and crossed straight leg tests, are also of limited value, especially in the primary care setting, because of inconsistent sensitivity and specificity.
This is the primary reason that the HPE in patients with LBP who have neurologic findings must include evaluation for urgent findings (see the Figure). If any red flags are present, advanced imaging is immediately warranted. Otherwise, inflammatory markers and plain radiography may be obtained, and advanced imaging may be considered if the plain radiography and/or inflammatory markers are abnormal.
There is also an approach that advocates the use of advanced imaging in patients with significant functional disability due to their LBP. Two questionnaires, the Oswestry Low Back Pain Disability Index and the Roland-Morris Disability Questionnaire, evaluate subjective data to determine a patient’s functional disability due to LBP.The validity of both tests has been confirmed.13
Continue for diagnostic imaging >>
DIAGNOSTIC IMAGING
The majority of patients presenting with LBP without concerning symptoms can be assumed to have nonspecific mechanical back pain. These patients do not need radiography unless the pain has not improved after four to six weeks of conservative care, because plain radiographs often detect findings (degenerative joint disease, bone spurs, spondylosis) that are unrelated to symptoms.9 Advanced imaging is generally recommended only for LBP patients with red flags due to the potentially critical nature of these cases.5 Patients with LBP presenting with any of these factors require further testing, even if the duration of their pain is less than four weeks.
If a patient’s LBP persists beyond four weeks, the clinician must decide which diagnostic test to order. General medical knowledge suggests that MRI is superior to plain radiography because it shows soft tissue and can detect more concerning abnormalities, such as infections, cancer, and metastatic tumors. CT is better for showing bony abnormalities, but these rarely correlate with a patient’s LBP, and CT subjects patients to levels of radiation that can increase cancer risks.14 Plain radiography in this cohort (LBP > 4 wk) is not generally recommended as it cannot show intervertebral discs or evaluate the degree of spinal stenosis as accurately as MRI. Additionally, these lumbar radiographs expose patients to more than 35 times the radiation delivered in a single chest radiograph.15
COSTS AND PATIENT OUTCOMES
The estimated cost of unnecessary imaging for LBP is $300 million per year.16 There is evidence of a strong association between advanced lumbar spine imaging and increased rates of surgery and significantly higher total medical expenditures.17,18 One study examined patients with nonspecific LBP who either received MRI within 30 days post-onset (defined as “early MRI”) or did not receive MRI. Early-MRI patients had significantly higher total medical expenses ($12,948, P < .0001) than the no-MRI group.17 The early-MRI group also had significantly longer periods of disability and were less likely to go off disability than the no-MRI group (P < .0001).
Cost-effectiveness studies of plain radiographs, dating back to 1982, have yielded similar findings. Liang et al suggested that if radiography was done routinely at the initial visit in patients with acute LBP but no red flags, the cost would be more than $2,000 (in 1982 dollars) to avert one day of pain.19 A more recent study examined patients with acute LBP who received MRI, with one group blinded (both patients and physicians) to their MRI results for six months while the other group received their results within 48 hours.20 All patients underwent a physical exam by a study coordinator, and treatment was assigned prior to imaging. At six weeks and one year, there was no significant difference in treatment assignments or self-reported surveys between groups, indicating that the MRI results had no significant influence on patient outcomes.
Despite the large increase in the use of advanced diagnostic imaging aimed at improving patient care and outcomes, there is a lack of data showing any correlative or causative connection between the two. Given this lack of evidence, and the potentially detrimental radiation exposure and increased costs to patients, clinicians should follow evidence-based guidelines when considering diagnostic imaging in patients presenting with LBP.
Continue for patient perception >>
PATIENT PERCEPTION
Patient satisfaction plays a very important role in health care and may correlate with compliance and other outcomes. One study showed that while radiography in patients with LBP was not associated with improved clinical outcomes, it did increase patients’ satisfaction with the care they received.21 A study that grouped patients requiring imaging for LBP into rapid MRI and plain film radiography cohorts found that patients who received rapid MRI were more assured by their results than were patients in the radiography group (74% vs 58%, P = .002).22 Both groups showed significant clinical improvement in the first three months, but there was no difference between groups at either the three- or 12-month mark. In both groups, reassurance was positively correlated with patient satisfaction (Pearson correlation coefficients, 0.55-0.59, P < .001).
Patients may be reassured by imaging, even when it is unnecessary. Effectively explaining symptomatology during the HPE to patients with LBP should be of high priority to clinicians. A study found that when patients with mechanical LBP did not receive an adequate explanation of the problem, they were less satisfied with their visit and wanted more diagnostic tests.11 Another study found that when low-risk patients were randomly assigned to a control group and received an educational intervention only, they reported equal satisfaction with their care and had clinical outcomes equal to those of the treatment group that received a plain radiograph.11
Given the costs, radiation risks, and other negative aspects of unnecessary imaging, additional diagnostic tests may not be in a patient’s best interest. A careful physical exam should be performed, with the clinician providing ongoing commentary to reassure patients that the clinician is neither dismissing the patient’s symptoms nor inappropriately avoiding further tests.
Often, medical providers order imaging with the intention to reassure patients with the results and thus ultimately increase the patient’s sense of well-being. However, the opposite effect may occur, with patients actually developing a decreased sense of wellness with no alteration of outcomes. A study evaluated general health (GH) scores (based on results from several screening questionnaires that assessed the patient’s current physical and mental health state) in patients receiving MRI results.20 The patients were divided into those who received results (within 48 hours), and those who did not unless it was critical to patient management (blinded group). At six weeks, the blinded group’s GH score was significantly higher than the early-informed group’s GH score. This suggests that receiving MRI results may negatively influence patients’ perception of their general health.20
The same meta-analysis that reviewed patient outcomes also evaluated mental health and quality-of-life scores of LBP patients who received either MRI, CT, or radiography.23 There was no short-term (< 3 mo) or long-term (6-12 mo) difference between patients who received radiography versus advanced imaging. This indicates that using imaging of any kind in patients with LBP but without indications of serious underlying conditions does not improve clinical outcomes and is negatively correlated with quality-of-life measures at short- and long-term intervals.23
Continue for treatment >>
TREATMENT
The prognosis of simple acute mechanical LBP is excellent. Although back pain is a leading reason for visiting health care providers, many affected individuals never seek medical care and apparently improve on their own. In a random telephone survey of North Carolina residents, only 39% of persons with LBP sought medical care.24 Therefore, patients who do seek treatment should be given reassurance, and therapies should be tailored to the individual in the least invasive and most cost-effective manner. Many treatment options are available for LBP, but often strong evidence of benefit is lacking.
Pharmacologic therapy
Anti-inflammatories. It can be assumed that when a patient comes to the practitioner for evaluation of LBP, there is an expectation that some type of medication will be recommended or prescribed for pain relief. Unless there is a contraindication, NSAIDs are often first-line therapy, and they are effective for short-term symptom relief when compared with placebo.25 A mild pain medication, such as acetaminophen, is also a common treatment. The 2007 joint practice guideline from the American Pain Society (APS) and the American College of Physicians (ACP) recommends acetaminophen or NSAIDs as first-line therapy for acute LBP.3 Neither agent—NSAIDs or acetaminophen—has shown superiority, and combining the two has shown no additional benefits.26 Caution must be used, however, as NSAIDs have a risk for gastrointestinal toxicity and nephrotoxicity, and acetaminophen has a dose- and patient-dependent risk for hepatotoxicity.
Muscle relaxants. Muscle relaxants are another pharmacologic treatment option for LBP. Most pain reduction from this class of medication occurs in the first one to two weeks of therapy, although benefit may continue for up to four weeks.27 There is also evidence that a combination of an NSAID and a muscle relaxer has added benefits.27 These medications are centrally acting, so sedation and dizziness are common; all medications in this class have these adverse effects to some degree. Carisoprodol has as its first metabolite meprobamate, which is a tranquilizer used to treat anxiety disorders; it has a potential for abuse and should be used with caution in certain populations.
Opioids. Opioids are commonly prescribed to patients with LBP, though there are limited data regarding efficacy. One trial compared an NSAID alone versus an NSAID plus oxycodone/acetaminophen and found no significant difference in pain or disability after seven days.28 In addition, the adverse effects of opioids, which include sedation, constipation, nausea, and confusion, may be amplified in the elderly population; therefore, opioids should be prescribed with caution in these patients. If prescribed to treat acute LBP, opioids should be used in short, scheduled dosing regimens since NSAIDs or acetaminophen suffice for most patients.
Corticosteroids. Oral glucocorticoids are sometimes given to patients with acute LBP, and they likely are used more frequently in patients with radicular symptoms. However, the APS/ACP 2007 joint guidelines recommend against use of systemic glucocorticoids for acute LBP due to lack of proven benefit.3 Epidural steroid injections are not generally beneficial for isolated acute LBP, but there is evidence that they are helpful with persistent radicular pain.29 Zarghooni and colleagues found significant reductions in pain and use of pain medication after single-shot epidural injections.29
Other pharmacologic therapies, acupuncture, sclerotherapy, and other methods are used to treat back pain, but these are typically reserved for chronic, not acute, LBP.
Nonpharmacologic therapy
Physical therapy. Physical therapy is a commonly prescribed treatment for LBP. Systematic literature reviews indicate that for patients with acute LBP (< 6 wk), there is no difference in the effectiveness of exercise therapy compared to no treatment and care provided by a general practitioner or to manipulations.30 For patients with subacute (6-12 wk) and chronic (≥ 12 wk) LBP, exercise therapy is effective compared to no treatment.30 There is debate, however, over which exercise activities should be used. Research supports strength/resistance and coordination/stabilization exercises.
Most therapists recommend the McKenzie method or spine stabilization exercises.31 The McKenzie method is used for LBP with sciatica; the patient moves through exercises within the prone position and focuses on extension of the spine. Spine stabilization is an active form of exercise based on a “neutral spine” position and helps strengthen muscles to maintain this position (core stabilization). The McKenzie method, when added to first-line care for LBP, does not produce significant improvements in pain or other clinical outcomes, although it may reduce health care utilization.32 Spine stabilization exercises have been shown to decrease pain, disability, and risk for recurrence after a first episode of back pain.33 The apparent success of physical therapy is attributed to compliance with directed home exercise programs, which have been shown to reduce the rate of recurrence, decrease episodes of acute LBP, and decrease the need for health services.34
Spinal traction. Traction or nonsurgical spinal decompression has emerged as a treatment for LBP. Unfortunately, there are little data to support its use as a treatment for acute LBP. Only a few randomized trials showed benefit, and these were small studies with a high risk for bias. A Cochrane review published in 2013 looked at 32 studies involving 2,762 patients with acute, subacute, and chronic LBP.35 The review did not find any evidence that traction alone or in combination with other therapy was any better than placebo treatment.35
Spinal manipulation. Spinal manipulation may be more effective than placebo treatment in reducing pain when the pain has been present for less than six weeks, but it is not more effective in reducing disability.36 There is little or no high-level evidence about spinal manipulation for acute LBP. However, there is some evidence of cost-effectiveness when using spinal manipulation in subacute to chronic pain.37 Chiropractic techniques are considered safe (when performed by a trained provider), but a systematic review found that these techniques provide no clinically relevant improvement in pain or disability when compared to other treatments.38
Bed rest. Bed rest has not been shown to improve outcomes, and in fact patients who had bed rest had less favorable outcomes than those who stayed active.39 Bed rest is less effective at reducing pain and improving function when compared to staying active.39
Continue for recommended management >>
Recommended management
A patient who presents with nonspecific acute LBP should have a thorough HPE to evaluate for the presence of red flags. If no concerning findings are present, the initial visit should focus on patient education based on the following items: (1) good prognosis with little intervention, (2) staying active and avoiding bed rest as much as possible, and (3) avoiding pain-causing movements when possible. The second step is to initiate a trial of an NSAID or acetaminophen and consider a muscle relaxant based on pain severity. Avoid opioid therapy if possible, but use conservative dosing if required for severe pain. Patients should be advised to return in two to four weeks if they do not experience significant improvement. At this time, the clinician may consider referring the patient for physical therapy, changing NSAIDs, ordering inflammatory markers, and/or referring to a specialist.
CONCLUSION
Although no single diagnostic protocol for LBP exists, the clinician must be able to distinguish simple from complex types. A thorough HPE is useful for categorizing the patient’s pain, with diagnostic imaging reserved for those patients with severe or progressive neurologic deficits, suspicion of serious underlying conditions, or LBP lasting more than four weeks without improvement. MRI, if available, is generally preferred over CT because it does not use ionizing radiation and provides better visualization of soft tissue, vertebral marrow, and the spinal cord. Symptomatology should be explained to patients with LBP during the HPE, with ongoing commentary to increase patient satisfaction and compliance. About two-thirds of patients with LBP do not seek evaluation from a health care provider; therefore, those who do seek treatment should be reassured, and therapies tailored to the individual in the least invasive and most cost-effective manner possible.
1. CDC. National Ambulatory Medical Care Survey: 2010 Summary Tables. Table 9. www.cdc.gov/nchs/data/ahcd/namcs_summary/2010_namcs_web_tables.pdf. Accessed March 29, 2016.
2. Davies C, Nitz AJ, Mattacola CG, et al. Practice patterns when treating patients with low back pain: a survey of physical therapists. Physiother Theor Pract. 2014;30(6):399-408.
3. American College of Radiology. ACR Appropriateness Criteria. Low back pain. 2015. www.acr.org/~/media/ACR/Documents/AppCriteria/Diagnostic/LowBackPain.pdf. Accessed March 10, 2016.
4. Henschke N, Maher CG, Ostelo RW, et al. Red flags to screen for malignancy in patients with low back pain. Cochrane Database Syst Rev. 2013;2:CD008686.
5. Koes BW, Tulder M, Lin CW, et al. An updated overview of clinical guidelines for the management of non-specific low back pain in primary care. Eur Spine J. 2010;19(12):2075-2094.
6. Deyo RA, Rainville J, Kent DL. What can the history and physical examination tell us about low back pain? JAMA. 1992;268(6):760-765.
7. Jarvik JG. Diagnostic evaluation of low back pain with emphasis on imaging. Ann Intern Med. 2002;137:586-597.
8. Diagnostic testing for low back pain. In: Post TW (ed), UpToDate, Waltham, MA. www.uptodate.com. Accessed March 16, 2016.
9. Chou R, Qaseem A, Snow V, et al; Clinical Efficacy Assessment Subcommittee of the American College of Physicians; American College of Physicians; American Pain Society Low Back Pain Guidelines Panel. Diagnosis and treatment of low back pain: a joint clinical practice guideline from the American College of Physicians and the American Pain Society. Ann Intern Med. 2007;147(7):478-491.
10. Deyo RA, Diehl AK. Cancer as a cause of back pain: frequency, clinical presentation, and diagnostic strategies. J Gen Intern Med. 1988;3(3):230-238.
11. Deyo RA, Diehl AK. Patient satisfaction with medical care for low-back pain. Spine. 1986;11(1):28-30.
12. Pradeep S, Rainville J, Katz JN, et al. The accuracy of the physical examination for the diagnosis of midlumbar and low lumbar nerve root impingement. Spine. 2011;36(1):63-73.
13. Leclaire R, Blier F, Fortin L, Proulx R. A cross-sectional study comparing the Oswestry and Roland-Morris Functional Disability Scales in two populations of patients with low back pain of different levels of severity. Spine. 1997;22(1):68-71
14. FDA. Radiation emitting products. www.fda.gov/Radiation-EmittingProducts/RadiationEmittingProductsandProcedures/MedicalImaging/MedicalX-Rays/ucm115317.htm. Accessed March 29, 2016.
15. Simpson AK, Whang PG, Jonisch A, et al. The radiation exposure associated with cervical and lumbar spine radiographs. J Spinal Disord Tech. 2008;21(6):409-412.
16. Srinivas S, Deyo R, Berger Z. Application of “less is more” to lower back pain. Arch Intern Med. 2012;172(13):1016-1020.
17. Webster BS, Bauer AZ, Choi Y, et al. Iatrogenic consequences of early magnetic resonance imaging in acute, work-related, disabling back pain. Spine. 2013;38(22):1939-1946.
18. Webster BS, Bauer AZ, Choi Y, et al. The cascade of medical services and associated longitudinal costs due to nonadherent magnetic resonance imaging for low back pain. Spine. 2014;39(17):1433-1440.
19. Liang M, Komaroff AL. Roentgenograms in primary care patients with acute low back pain: a cost-effectiveness analysis. Arch Intern Med. 1982;142(6):1108-1112.
20. Ash LM, Modic MT, Obuchowski NA, et al. Effects of diagnostic information, per se, on patient outcomes in acute radiculopathy and low back pain. AJNR Am J Neuroradiol. 2008;29(6):1098-1103.
21. Kendrick D, Fielding K, Bentley E, et al. Radiography of the lumbar spine in primary care patients with low back pain: randomized controlled trial. BMJ. 2001;322(7283):400-405.
22. Jarvik JG, Hollingworth W, Martin B, et al. Rapid magnetic resonance imaging vs radiographs for patients with low back pain. JAMA. 2003;289(21):2810-2818.
23. Chou R, Fu R, Carrino JA, Deyo RA. Imaging strategies for low-back pain: systematic review and meta-analysis. Lancet. 2009;373(9662):463-472.
24. Carey TS, Evans AT, Hadler NM, et al. Acute severe low back pain: a population-based study of prevalence and care-seeking. Spine. 1996;21(3):339-344.
25. Roelofs PD, Deyo RA, Koes BW, et al. Nonsteroidal anti-inflammatory drugs for low back pain. Spine. 2008;33(16):1766-1774.
26. Hancock MJ, Maher CG, Latimer J, et al. Assessment of diclofenac or spinal manipulative therapy, or both, in addition to recommended first-line treatment for acute low back pain: a randomized controlled trial. Lancet. 2007;370(10):1638-1643.
27. Van Tulder MW, Touray T, Furlan AD, et al. Muscle relaxants for non-specific low-back pain. Cochrane Database Syst Rev. 2003;(4):CD004252.
28. Friedman BW, Dym AA, Davitt M, et al. Naproxen with cyclobenzaprine, oxycodone/acetaminophen, or placebo for treating acute low back pain: a randomized clinical trial. JAMA. 2015;314(15):1572-1580.
29. Zarghooni K, Rashidi A, Siewe, J, et al. Single-shot epidural injections in the management of radicular pain. Orthop Rev (Pavia). 2015;7(4):5985.
30. Smidt N, deVet HC, Bouter LM, et al. Effectiveness of exercise therapy: A best-evidence summary of systematic reviews. Aust J Physiother. 2005;51(2):71-85.
31. Casazza BA. Diagnosis and treatment of acute low back pain. Am Fam Physician. 2012;85(4):343-350.
32. Machado LA, Maher CG, Herbert RD, et al. The effectiveness of the McKenzie method in addition to first-line care for acute low back pain: a randomized controlled trial. BMC Med. 2010;8(10):1-10.
33. Cho I, Jeon C, Lee S, et al. Effects of lumbar stabilization exercise on functional disability and lumbar lordosis angle in patients with chronic low back pain. J Phys Ther Sci. 2015;27(6):1983-1985.
34. Choi BK, Verbeek JH, Tam WW, Jiang JY. Exercises for prevention of recurrences of low-back pain (review). Cochrane Database Syst Rev. 2010;(1):CD006555.
35. Wegner I, Widyahening IS, van Tulder MW, et al. Traction for low-back pain with or without sciatica (review). Cochrane Database Syst Rev. 2013;(8):CD003010.
36. Hoiriis KT, Pfleger B, McDuffie FC, et al. A randomized clinical trial comparing chiropractic adjustments to muscle relaxants for subacute low back pain. J Manipulative Physiol Ther. 2004;27(6):388-398.
37. Lin CC, Haas M, Maher CG, et al. Cost-effectiveness of guideline-endorsed treatments for low back pain: a systematic review. Eur Spine J. 2011;20:1024-1038.
38. Walker BF, French SD, Grant W, Green S. A Cochrane Review of combined chiropractic interventions for low-back pain. Spine. 2011;36(3): 230-242.
39. Dahm KT, Brurberg KG, Jamtvedt G, Hagen KB. Advice to rest in bed versus advice to stay active for acute low-back pain and sciatica. Cochrane Database Syst Rev. 2010;(6):CD007612.
40. Staiger T, Paauw D, Deyo A, Jarvik JG. Imaging studies for acute low back pain. When and when not to order them. Postgrad Med. 1999;105(4):161-162,165-166,171-172.