User login
IRB members and industry relationships

Institutional Review Boards (IRBs) at academic health centers have gotten better at managing members’ industry relationships in the last several years, but issues persist, according to a new study.
The research is a follow-up to a study published in 2006.
The new study showed improvements in the management of industry relationships, with increased levels of disclosure and fewer “problematic relationships” than were reported in the previous study.
However, nearly a third of IRB members in the new study said they were unaware of their board’s conflict of interest policies. And a quarter of IRB members reported voting on protocols with which they have conflicts of interest, which is a violation of federal regulations.
“IRBs are the primary mechanisms by which institutions oversee research that involves human participants, and industry relationships of IRB members have the potential to impact their IRB-related activities in both positive and negative ways,” said Eric G. Campbell, PhD, of the Mongan Institute for Health Policy at Massachusetts General Hospital in Boston.
“While our principal findings are that, compared to a decade ago, IRBs appear to be doing a much better job at managing their members’ industry relationships, there still are findings that are concerning.”
Dr Campbell and his colleagues described these findings in JAMA Internal Medicine.
Every US institution that conducts research involving human participants must have an IRB, which reviews proposed studies to ensure their design is scientifically valid and does not violate ethical and regulatory guidelines. IRBs also monitor ongoing studies to make sure they maintain appropriate practices.
The first study to examine industry relationships of IRB members, conducted by Dr Campbell and his colleagues, was based on a survey of IRB members at 100 institutions that was published in NEJM in November 2006.
That study showed that more than a third of IRB members had some sort of financial relationship with commercial firms. And while most respondents did not believe that such relationships had an inappropriate impact on IRB decision making, significant percentages were not aware of institutional guidelines for disclosing industry relationships or defining conflicts of interest.
The current study involved an identical survey administered in 2014 to nearly 500 IRB members at 115 medical schools and teaching hospitals around the country.
As in the 2006 study, respondents were asked about specific types of relationships with commercial companies, whether they received any industry funding and for what purposes, and how many protocols had come before their IRB that involved companies with which they had a relationship.
For protocols with which IRB members had a conflict—relating either to companies they had relationships with or to competitors—they were asked whether they had disclosed their relationships to the IRB, whether they participated in discussion of those protocols, and whether they voted on the protocols.
Results
There was no significant difference between the current study and the previous study in the percentage of IRB members who reported having industry relationships overall—37% and 32%, respectively.
However, the percentage of respondents who reported receiving payments for attending meetings and conferences or for serving on speakers’ bureaus—relationships that are considered problematic—dropped significantly. The percentages fell from 16% to 9% for meeting/conference participation and from 14% to 4% for speakers’ bureaus.
“We were encouraged to see that the prevalence of potentially beneficial relationships—such as industry funding to support research studies—was essentially unchanged, indicating IRBs have not tried to eliminate members’ industry relationships across the board,” said Christine Vogeli, PhD, also of the Mongan Institute.
Survey respondents were more likely in the current study than in the previous one to say that their IRB had a written definition of conflicts of interest—63% compared with 46%. In addition, the percentage of respondents who reported their IRB had no policy related to conflicts dropped from 14% to 5%.
However, the researchers were concerned by the fact that 32% of respondents still did not know whether or not their IRB had a policy on conflicts, even though that number had dropped from 41% in the previous study.
The percentage of respondents who handled their conflicts of interest in an appropriate manner increased. Eighty percent of respondents with conflicts reported them to the IRB, up from 55% in the previous study.
And 68% of respondents said they always left the room when a protocol with which they had a conflict was being discussed, up from 38% in the previous study.
However, a quarter of respondents with conflicts indicated they had voted on protocols with which they had a conflict. While that was a drop from what was reported in the previous study, it was not statistically significant.
The percentage of respondents who felt that at least one protocol had been presented to their IRB in a biased fashion because of another member’s industry relationships dropped from 14% in the previous study to 8% in this study.
And when asked about the types of bias they perceived in the presentation—questions not included in the previous survey—8% of respondents reported a pro-industry bias, and 14% reported an anti-industry bias.
“The fact that we found any bias—either pro- or anti-industry—is an issue, since bias is antithetical to research and should be eliminated,” Dr Campbell said. “IRBs should address that issue, along with increasing efforts to educate their members about what constitutes a conflict of interest and the inappropriateness of voting on protocols with which they have a conflict.” ![]()
‘Choosing Wisely’: Canada vs. U.S.
In 2011, the American Board of Internal Medicine started the Choosing Wisely campaign, a subtly subversive call to curb health care spending. As part of that campaign, the American College of Rheumatology published its own list of five “tests, treatments, or services … whose necessity or value should be questioned” in March 2013.
As it turns out, Canada has also started a Choosing Wisely Canada campaign, and in February of this year the Canadian Rheumatology Association published their list of five. Though the methodology for coming up with the list was the same in these two very similar populations, there is surprisingly little overlap between the two lists. It is likely that the differences are partly explained by how medicine is practiced and paid for in the two countries. How invested physicians are in their respective professional societies may play a role, too. As part of the methodology, surveys were sent out to membership: At the time of the study the ACR had 6,188 members and a 17% response rate, while the CRA had a membership of 484 and a 35% response rate.
The ACR publication reminds us that the initiative is in part a response to a physician charter for medical professionalism, drafted in 2002 by a collaboration of physician organizations, including the ABIM Foundation and the American College of Physicians, outlining principles of professionalism, “including patient welfare, patient autonomy, and social justice” (Ann. Intern. Med. 2002;136:143-6).
Social justice, according to the ACR, “calls on the profession to promote a fair distribution of health care resources and to engage in collective efforts to improve the health care system for the welfare of society.” I wonder if the gap between the survey response rates of the American and the Canadian groups reflects greater indifference to societal welfare, but I certainly hope not.
In any event, I would like to devote some space to reviewing these two lists. They are worth revisiting often. I’ve included some clarifying statements from each publication that I thought were helpful.
The ACR list (Arthritis Care Res. 2013;65:329-39)
• Do not test ANA subserologies without a positive ANA and clinical suspicion of immune-mediated disease. Exceptions include anti-Jo1, which can be positive in some forms of myositis, or occasionally, anti-SSA in the setting of lupus or Sjögren syndrome.
• Do not test for Lyme disease as a cause of musculoskeletal symptoms without an exposure history and appropriate examination findings. Diffuse arthralgias, myalgias, or fibromyalgia alone are not criteria for musculoskeletal Lyme disease.
• Do not perform MRI of the peripheral joints to routinely monitor inflammatory arthritis.
• Do not prescribe biologic agents for RA before a trial of methotrexate (or another conventional nonbiologic DMARD)
• Do not routinely repeat DXA scans more often than once every 2 years. DXA scans should only be repeated if the result will influence clinical management or if rapid changes in bone density are expected.
The CRA list (J. Rheumatol. 2015;42:682-9)
• Do not order ANA as a screening test in patients without specific signs or symptoms of systemic lupus erythematosus or other connective tissue disease. At one center in Canada, ANA testing was positive only 15% of the time and cost more than $800,000 over 3 years when combined with ENA and anti-dsDNA. … An ANA test should be ordered only if the clinician feels there is reasonable clinical suspicion of SLE or CTD based on historical information, physical findings and results of other laboratory tests.
• Do not order an HLA-B27 unless spondyloarthritis is suspected based on specific signs or symptoms. There is no clinical utility to ordering an HLA-B27 in the absence of positive imaging or the minimally required SpA signs or symptoms.
• Do not repeat DXA scans more often than every 2 years. If BMD are stable and/or individuals are at low risk of fracture, then less frequent monitoring up to an interval of 5-10 years can be considered.
• Do not prescribe bisphosphonates for patients at low risk of fracture.
• Do not perform whole body bone scans (e.g., scintigraphy) for diagnostic screening for peripheral and axial arthritis in the adult population.
Dr. Chan practices rheumatology in Pawtucket, R.I.

Chemical Peels
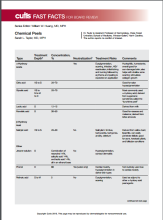
After, test your knowledge by answering the 5 practice questions.
Practice Questions
1. Which one of the following peels produces “frosting” after application?
a. citric acid
b. glycolic acid
c. mandelic acid
d. salicylic acid
e. trichloroacetic acid
2. Which one of the following peels is lipophilic?
a. citric acid
b. glycolic acid
c. mandelic acid
d. salicylic acid
e. trichloroacetic acid
3. A Jessner solution peel contains which of the following 4 components?
a. lactic acid, resorcinol, salicylic acid, ethanol
b. lactic acid, resorcinol, salicylic acid, methanol
c. lactic acid, resorcinol, salicylic acid, retinoic acid
d. retinoic acid, resorcinol, phenol, ethanol
e. retinoic acid, resorcinol, glycolic acid, methanol
4. What is the most serious risk associated with phenol peels?
a. cardiac dysrhythmia
b. hearing loss
c. scarring
d. seizure
e. tinnitus
5. Which one of the following peels self-neutralizes?
a. citric acid
b. glycolic acid
c. lactic acid
d. mandelic acid
e. salicylic acid
The answers appear on the next page.
Practice Question Answers
1. Which one of the following peels produces “frosting” after application?
a. citric acid
b. glycolic acid
c. mandelic acid
d. salicylic acid
e. trichloroacetic acid
2. Which one of the following peels is lipophilic?
a. citric acid
b. glycolic acid
c. mandelic acid
d. salicylic acid
e. trichloroacetic acid
3. A Jessner solution peel contains which of the following 4 components?
a. lactic acid, resorcinol, salicylic acid, ethanol
b. lactic acid, resorcinol, salicylic acid, methanol
c. lactic acid, resorcinol, salicylic acid, retinoic acid
d. retinoic acid, resorcinol, phenol, ethanol
e. retinoic acid, resorcinol, glycolic acid, methanol
4. What is the most serious risk associated with phenol peels?
a. cardiac dysrhythmia
b. hearing loss
c. scarring
d. seizure
e. tinnitus
5. Which one of the following peels self-neutralizes?
a. citric acid
b. glycolic acid
c. lactic acid
d. mandelic acid
e. salicylic acid

Make the Diagnosis - July 2015
Diagnosis: Systemic sclerosis
Systemic sclerosis, or scleroderma, is a rare connective tissue disorder in which excessive collagen is deposited in the skin and internal organs. This disease predominantly affects women (3-6:1) between the ages of 20 and 60 years with no apparent racial predominance. Effective treatment is critical, as scleroderma carries a poor prognosis, with a mortality rate of up to 50% at 5 years in severe cases. The pathogenesis of systemic sclerosis is unknown, but three pathways are implicated, including immune deregulation, vascular abnormalities, and abnormal fibroblast activation.
Clinical presentation is variable because of the involvement of multiple organ systems. Common features include cutaneous pruritus, skin thickening, Raynaud's phenomenon, difficulty swallowing, shortness of breath, palpitations, nonproductive cough, and joint pain and swelling, as well as muscle pain and weakness. Laboratory findings may include elevated erythrocyte sedimentation rate, thrombocytopenia, hypergammaglobulinemia, increased urea and creatinine levels, and elevated C-reactive protein. Antinuclear antibodies are usually elevated, especially Scl-70, antimitochondrial, and anticentromere antibodies. Cardiac and pulmonary function should be assessed upon diagnosis. A Doppler echocardiogram may detect cardiac abnormalities, and chest x-ray or high-resolution CT is used to assess for pulmonary fibrosis.
Despite the severity of the disease, there are no Food and Drug Administration-approved disease-modifying agents for the treatment of scleroderma, and management often focuses on symptom relief. For example, patients with kidney involvement should be placed on an ACE inhibitor or angiotensin II inhibitor therapy, and patients with gastrointestinal tract involvement should use proton pump inhibitors and H2 blockers to control reflux. Bosentan and pentoxifylline, which target vascular abnormalities, also may help improve skin fibrosis. Steroids show benefits in the early stages of the disease, but carry a risk of scleroderma renal crisis with doses greater than 15 mg of prednisone daily. Mycophenolate mofetil and sirolimus have immunomodulatory and antifibrotic properties, which may be of benefit in this disease.
Cyclophosphamide is reserved for more severe cases. Other treatment modalities include rituximab, intravenous immunoglobulin, and autologous stem cell transplantation.

This case and photo were submitted by Charlotte E. LaSenna and Dr. Andrea Maderal of the University of Miami department of dermatology. Dr. Bilu Martin is in private practice at Premier Dermatology, MD in Aventura, Fla. To submit your case for possible publication, send an e-mail to dermnews@frontlinemedcom.com. A 55-year-old woman with an 8-year history of previously diagnosed vitiligo presented with worsening pruritus and swelling of the hands and feet for several months. Her medical history included liver disease. Upon physical examination, she was ill-appearing, with notable salt-and-pepper diffuse depigmentation, as well as pitting edema of the bilateral hands and face. Laboratory studies showed a positive ANA >1:2,560 with a centromere pattern, negative Scl-70, and positive antimitochondrial antibody at 158.5. Renal function and urinalysis were normal. Liver function tests were abnormal with elevated alkaline phosphatase and bilirubin.

Prolonged sitting may increase cancer risk in women

Photo by Petr Kratochvil
Results of a large study indicate that women who spend their leisure time sitting for prolonged periods—6 or more hours a day—have an increased risk of developing certain cancers.
These women had a significant increase in the risk of overall cancer, multiple myeloma, breast cancer, and ovarian cancer.
The increased risks were present even after taking into account a woman’s body mass index (BMI), frequency of physical activity, and other factors.
For men, there was no association between leisure time spent sitting and any type of cancer.
Alpa Patel, PhD, of the American Cancer Society in Atlanta, Georgia, and her colleagues conducted this research and reported the results in Cancer Epidemiology, Biomarkers & Prevention.
The researchers analyzed data on 69,260 men and 77,462 women who were initially cancer-free and enrolled in the American Cancer Society Cancer Prevention Study II Nutrition Cohort.
In addition to evaluating the amount of leisure time subjects spent sitting, the researchers assessed factors such as age, race, BMI, alcohol use, smoking status, diabetes status, diet, and frequency and type of physical activity.
At baseline, the men enrolled in this study were slightly older, leaner, and more likely to have ever smoked cigarettes compared to the women. Men and women who spent the most leisure time sitting were more likely than their peers to be obese, have type II diabetes mellitus or other chronic diseases, have a higher caloric intake, eat more red/processed meat, and have ever smoked.
Between 1992 and 2009, 18,555 men and 12,236 women were diagnosed with cancer.
In women, longer leisure time spent sitting was associated with a significantly increased risk of cancer overall, even after the researchers adjusted for potential confounders such as overall physical activity and BMI.
The relative risk (RR) of cancer was 1.10 for women who spent an average of 6 or more hours a day sitting, compared to those who spent less than 3 hours a day sitting.
Women who sat for 6 or more hours a day also had a significantly increased risk of multiple myeloma (RR=1.65), invasive breast cancer (RR=1.10), and ovarian cancer (RR=1.43).
Initially, there was a significant association between prolonged sitting and endometrial cancer, but this was attenuated after the researchers adjusted for BMI. The researchers also found positive, but not significant, associations between sitting time and esophageal, head and neck, and gallbladder cancers.
For men, there was no significant association between time spent sitting and overall cancer risk or the risk of individual cancers. The researchers said further study is warranted to better understand this difference between the sexes.
The team also noted that American Cancer Society guidelines for cancer prevention recommend reducing sitting time when possible. And, given the high rate of time spent sitting in the US, even a modest positive association with cancer could have broad public health implications. ![]()
NICE recommends edoxaban for VTE

Image by Keven MacKenzie
The UK’s National Institute for Health and Care Excellence (NICE) has issued a draft guidance recommending the oral anticoagulant edoxaban tosylate (Lixiana) as an option for treating and preventing the recurrence of venous thromboembolism (VTE).
A committee advising NICE concluded that edoxaban is clinically effective, and the drug will be a cost-effective use of National Health Service resources.
“The newer oral anticoagulants like edoxaban tosylate are an alternative to warfarin as the mainstay of treatment to prevent recurrent blood clots,” said Carole Longson, NICE Health Technology Evaluation Centre Director.
“The committee concluded that patients value newer oral anticoagulants such as edoxaban tosylate, which cause less disruption to their day-to-day lives than warfarin. We are pleased, therefore, to be able to recommend edoxaban tosylate as a further cost-effective option for treating [VTE] and preventing further episodes in adults.”
Clinical effectiveness
Edoxaban was recently approved in the European Union to treat and prevent deep vein thrombosis (DVT) and pulmonary embolism (PE). This approval was based on results of the Hokusai-VTE trial. The committee advising NICE analyzed data from this trial when considering the clinical effectiveness of edoxaban.
For Hokusai-VTE, researchers evaluated edoxaban in 4921 patients with DVT and 3319 with PE. Patients received initial treatment with low-molecular-weight heparin and were then randomized to receive edoxaban or warfarin daily for 3 to 12 months.
Overall, edoxaban proved as effective as warfarin. Recurrent, symptomatic VTE occurred in 3.2% and 3.5% of patients, respectively (P<0.001 for non-inferiority).
In addition, the incidence of clinically relevant bleeding was significantly lower in the edoxaban arm than the warfarin arm—8.5% and 10.3%, respectively (P=0.004 for superiority).
Cost-effectiveness
The recommended dose of edoxaban is 60 mg once daily, or 30 mg once daily in specific patient groups—those with renal impairment, low body weight (60 kg or less), or concomitant use of potent permeability glycoprotein inhibitors—following treatment with a parenteral anticoagulant for at least 5 days.
Edoxaban costs £2.10 per 15 mg, 30 mg, or 60 mg tablet (excluding value-added tax). Costs may vary in different settings because of negotiated procurement discounts.
Taking into account the lack of any clear evidence that edoxaban is significantly different from the other new oral anticoagulants, as well as the testimony of experts, the committee advising NICE concluded that the most plausible incremental cost-effectiveness ratio for edoxaban was likely to be in line with the other oral anticoagulants already recommended by NICE.
The draft guidance for edoxaban is now with consultees, who have the opportunity to appeal against it. Once NICE issues its final guidance on a technology, it replaces local recommendations. ![]()
Prenatal test results linked to cancer in mothers

Photo by Nina Matthews
Researchers have again found evidence to suggest that tests used to identify chromosomal fetal disorders can detect occult malignancies in pregnant women.
In a study made public last month, non-invasive prenatal tests (NIPTs) revealed 2 cases of lymphoma and a case of ovarian cancer in expectant mothers.
In the new study, researchers showed that positive NIPT results were due to leukemia, lymphoma, or solid tumors in 10 expectant mothers.
The research was published in JAMA and presented at the 19th International Conference on Prenatal Diagnosis and Therapy in Washington, DC. Funding for the study was provided by Illumina, and company employees were involved in the research.
“We did this study because noninvasive prenatal testing using sequencing of cell-free DNA in the mother’s plasma is the fastest-growing area of prenatal testing and, indeed, of genomic medicine,” said study author Diana W. Bianchi, MD, of Tufts Medical Center in Boston, Massachusetts.
“As the volume of tests has expanded, we’ve become increasingly aware of the so-called “false-positive” cases. [A]pproximately 0.2% of the time, there is a discrepancy between the results of the prenatal test—in which an aneuploidy is reported—and the result from the diagnostic fetal procedure, the amniocentesis or the chorionic villus sampling.”
“So we’re interested in the situation where the fetal chromosomes are normal, but the prenatal test shows that there’s an aneuploidy detected. We’re interested in the possible explanations for that discrepancy.”
To gain some insight, Dr Bianchi and her colleagues evaluated 125,426 samples from asymptomatic pregnant women who underwent plasma cell-free DNA sequencing for clinical prenatal aneuploidy screening using Illumina’s verifi Prenatal Test.
In all, 3757 samples (3%) were positive for 1 or more aneuploidies involving chromosomes 13, 18, 21, X, or Y. These were reported to the ordering physician with recommendations for further evaluation.
“In a small minority of women, [subsequent tests analyzing only fetal DNA] showed that the fetal chromosomes were normal, and that disagreed with [results of the NIPT],” Dr Bianchi said. “We were examining whether cancer could explain the discrepancy between these two test results.”
The researchers found that 10 of the women with discordant test results were subsequently diagnosed with cancer. There were 3 cases of B-cell lymphoma and 1 case each of T-cell leukemia, Hodgkin lymphoma, unspecified adenocarcinoma, leiomyosarcoma, and neuroendocrine, colorectal, and anal carcinomas.
Dr Bianchi and her colleagues were able to obtain detailed clinical and sequencing data for 8 of these cases. In the other 2 cases (leiomyosarcoma and unspecified adenocarcinoma), the women were critically ill and were not approached about participating in the study.
The researchers found that maternal cancers most frequently occurred when the NIPT detected more than 1 aneuploidy. There were 7 known cancers among 39 cases of multiple aneuploidies by NIPT. In 1 case, blood was sampled after the patient completed treatment for colorectal cancer, and the abnormal pattern was no longer evident.
When the researchers examined additional genetic information for the women with cancer, they found unique patterns of nonspecific copy-number gains and losses across multiple chromosomes.
“[These women] had DNA imbalances all across the genome,” Dr Bianchi said. “The [NIPT] normally is only looking at DNA material from the chromosomes of clinical interest—chromosomes 13, 18, 21, X, and Y.”
“When we opened up their results to look at all of the chromosomes, there were multiple abnormalities in other places, such as chromosome 8, chromosome 6, etc. Each woman had a unique pattern that was abnormal in many places. This suggested that it was the tumor DNA that was being shed into her blood and was contributing to the abnormal pattern.”
Dr Bianchi stressed that the tumor DNA did not affect the babies. She said all were born healthy, although labor was induced early in one mother to facilitate her cancer treatment. ![]()
YA cancer survivors hospitalized more often
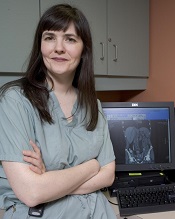
Photo courtesy of
St. Michael’s Hospital
Up to 20 years after they are declared cancer-free, young adult (YA) cancer survivors are still hospitalized more often than the general population, according to research published in the Journal of Clinical Oncology.
Overall, the cancer survivors, who were ages 20 to 44 at diagnosis, were hospitalized about 1.5 times as often as control subjects.
“Even when young adults survive cancer, the cancer still has an impact on their lives and their long-term health, and this age group still has a lot of life to live,” said study author Nancy Baxter, MD, PhD, of St. Michael’s Hospital in Toronto, Ontario, Canada.
To conduct this study, Dr Baxter and her colleagues examined data from the Ontario Cancer Registry spanning the period from 1992 to 1999.
This included 20,275 patients who had their first cancer diagnosis between the ages of 20 and 44 and had lived for 5 years cancer-free. The researchers compared hospitalizations among these patients to hospitalizations in 101,344 non-cancer controls.
During the study period, 34.3% of cancer survivors (n=6948) were admitted to the hospital. The adjusted relative rate (ARR) of hospitalizations in survivors compared to controls was 1.51.
There was a significant decrease in hospitalizations among cancer survivors from the first time point the researchers analyzed to the last time point (P<0.0001).
But hospitalizations were more common among cancer survivors regardless of the time point. The ARR was 1.67 at 5 to 8 years after cancer diagnosis and 1.22 at 18 to 20 years after diagnosis.
When the researchers looked at individual malignancies, they found that survivors of melanoma or testicular cancer did not have higher rates of hospitalization than the control population. The ARRs were 0.97 and 1.07, respectively.
However, the rate of hospitalization was at least twice as high as the control population for survivors of leukemia (ARR=2.23) and lymphoma (ARR=2.02), as well as gastrointestinal (ARR=2.49), urologic (ARR=2.20), colorectal (ARR=2.10), and brain cancers (ARR=2.04).
Dr Baxter said having a better understanding of healthcare utilization and late effects in the YA cancer population may help healthcare providers counsel YA survivors on their future quality of life, identify areas where preventative strategies could be employed, and highlight the need to consider treatments that are not associated with long-term health consequences. ![]()
Simulation Resident‐as‐Teacher Program
Residency training, in addition to developing clinical competence among trainees, is charged with improving resident teaching skills. The Liaison Committee on Medical Education and the Accreditation Council for Graduate Medical Education require that residents be provided with training or resources to develop their teaching skills.[1, 2] A variety of resident‐as‐teacher (RaT) programs have been described; however, the optimal format of such programs remains in question.[3] High‐fidelity medical simulation using mannequins has been shown to be an effective teaching tool in various medical specialties[4, 5, 6, 7] and may prove to be useful in teacher training.[8] Teaching in a simulation‐based environment can give participants the opportunity to apply their teaching skills in a clinical environment, as they would on the wards, but in a more controlled, predictable setting and without compromising patient safety. In addition, simulation offers the opportunity to engage in deliberate practice by allowing teachers to facilitate the same case on multiple occasions with different learners. Deliberate practice, which involves task repetition with feedback aimed at improving performance, has been shown to be important in developing expertise.[9]
We previously described the first use of a high‐fidelity simulation curriculum for internal medicine (IM) interns focused on clinical decision‐making skills, in which second‐ and third‐year residents served as facilitators.[10, 11] Herein, we describe a RaT program in which residents participated in a workshop, then served as facilitators in the intern curriculum and received feedback from faculty. We hypothesized that such a program would improve residents' teaching and feedback skills, both in the simulation environment and on the wards.
METHODS
We conducted a single‐group study evaluating teaching and feedback skills among upper‐level resident facilitators before and after participation in the RaT program. We measured residents' teaching skills using pre‐ and post‐program self‐assessments as well as evaluations completed by the intern learners after each session and at the completion of the curriculum.
Setting and Participants
We embedded the RaT program within a simulation curriculum administered July to October of 2013 for all IM interns at Massachusetts General Hospital (interns in the preliminary program who planned to pursue another field after the completion of the intern year were excluded) (n = 52). We invited postgraduate year (PGY) II and III residents (n = 102) to participate in the IM simulation program as facilitators via email. The curriculum consisted of 8 cases focusing on acute clinical scenarios encountered on the general medicine wards. The cases were administered during 1‐hour sessions 4 mornings per week from 7 AM to 8 AM prior to clinical duties. Interns completed the curriculum over 4 sessions during their outpatient rotation. The case topics were (1) hypertensive emergency, (2) post‐procedure bleed, (3) congestive heart failure, (4) atrial fibrillation with rapid ventricular response, (5) altered mental status/alcohol withdrawal, (6) nonsustained ventricular tachycardia heralding acute coronary syndrome, (7) cardiac tamponade, and (8) anaphylaxis. During each session, groups of 2 to 3 interns worked through 2 cases using a high‐fidelity mannequin (Laerdal 3G, Wappingers Falls, NY) with 2 resident facilitators. One facilitator operated the mannequin, while the other served as a nurse. Each case was followed by a structured debriefing led by 1 of the resident facilitators (facilitators switched roles for the second case). The number of sessions facilitated varied for each resident based on individual schedules and preferences.
Four senior residents who were appointed as simulation leaders (G.A.A., J.K.H., R.K., Z.S.) and 2 faculty advisors (P.F.C., E.M.M.) administered the program. Simulation resident leaders scheduled facilitators and interns and participated in a portion of simulation sessions as facilitators, but they were not analyzed as participants for the purposes of this study. The curriculum was administered without interfering with clinical duties, and no additional time was protected for interns or residents participating in the curriculum.
Resident‐as‐Teacher Program Structure
We invited participating resident facilitators to attend a 1‐hour interactive workshop prior to serving as facilitators. The workshop focused on building learner‐centered and small‐group teaching skills, as well as introducing residents to a 5‐stage debriefing framework developed by the authors and based on simulation debriefing best practices (Table 1).[12, 13, 14]
| Stage of Debriefing | Action | Rationale |
|---|---|---|
| ||
| Emotional response | Elicit learners' emotions about the case | It is important to acknowledge and address both positive and negative emotions that arise during the case before debriefing the specific medical and communications aspects of the case. Unaddressed emotional responses may hinder subsequent debriefing. |
| Objectives* | Elicit learners' objectives and combine them with the stated learning objectives of the case to determine debriefing objectives | The limited amount of time allocated for debriefing (1520 minutes) does not allow the facilitator to cover all aspects of medical management and communication skills in a particular case. Focusing on the most salient objectives, including those identified by the learners, allows the facilitator to engage in learner‐centered debriefing. |
| Analysis | Analyze the learners' approach to the case | Analyzing the learners' approach to the case using the advocacy‐inquiry method[11] seeks to uncover the learner's assumptions/frameworks behind the decision made during the case. This approach allows the facilitator to understand the learners' thought process and target teaching points to more precisely address the learners' needs. |
| Teaching | Address knowledge gaps and incorrect assumptions | Learner‐centered debriefing within a limited timeframe requires teaching to be brief and targeted toward the defined objectives. It should also address the knowledge gaps and incorrect assumptions uncovered during the analysis phase. |
| Summary | Summarize key takeaways | Summarizing highlights the key points of the debriefing and can be used to suggest further exploration of topics through self‐study (if necessary). |
Resident facilitators were observed by simulation faculty and simulation resident leaders throughout the intern curriculum and given structured feedback either in‐person immediately after completion of the simulation session or via a detailed same‐day e‐mail if the time allotted for feedback was not sufficient. Feedback was structured by the 5 stages of debriefing described in Table 1, and included soliciting residents' observations on the teaching experience and specific behaviors observed by faculty during the scenarios. E‐mail feedback (also structured by stages of debriefing and including observed behaviors) was typically followed by verbal feedback during the next simulation session.
The RaT program was composed of 3 elements: the workshop, case facilitation, and direct observation with feedback. Because we felt that the opportunity for directly observed teaching and feedback in a ward‐like controlled environment was a unique advantage offered by the simulation setting, we included all residents who served as facilitators in the analysis, regardless of whether or not they had attended the workshop.
Evaluation Instruments
Survey instruments were developed by the investigators, reviewed by several experts in simulation, pilot tested among residents not participating in the simulation program, and revised by the investigators.
Pre‐program Facilitator Survey
Prior to the RaT workshop, resident facilitators completed a baseline survey evaluating their preparedness to teach and give feedback on the wards and in a simulation‐based setting on a 5‐point scale (see Supporting Information, Appendix I, in the online version of this article).
Post‐program Facilitator Survey
Approximately 3 weeks after completion of the intern simulation curriculum, resident facilitators were asked to complete an online post‐program survey, which remained open for 1 month (residents completed this survey anywhere from 3 weeks to 4 months after their participation in the RaT program depending on the timing of their facilitation). The survey asked residents to evaluate their comfort with their current post‐program teaching skills as well as their pre‐program skills in retrospect, as previous research demonstrated that learners may overestimate their skills prior to training programs.[15] Resident facilitators could complete the surveys nonanonymously to allow for matched‐pairs analysis of the change in teaching skills over the course of the program (see Supporting Information, Appendix II, in the online version of this article).
Intern Evaluation of Facilitator Debriefing Skills
After each case, intern learners were asked to anonymously evaluate the teaching effectiveness of the lead resident facilitator using the adapted Debriefing Assessment for Simulation in Healthcare (DASH) instrument.[16] The DASH instrument evaluated the following domains: (1) instructor maintained an engaging context for learning, (2) instructor structured the debriefing in an organized way, (3) instructor provoked in‐depth discussions that led me to reflect on my performance, (4) instructor identified what I did well or poorly and why, (5) instructor helped me see how to improve or how to sustain good performance, (6) overall effectiveness of the simulation session (see Supporting Information, Appendix III, in the online version of this article).
Post‐program Intern Survey
Two months following the completion of the simulation curriculum, intern learners received an anonymous online post‐program evaluation assessing program efficacy and resident facilitator teaching (see Supporting Information, Appendix IV, in the online version of this article).
Statistical Analysis
Teaching skills and learners' DASH ratings were compared using the Student t test, Pearson 2 test, and Fisher exact test as appropriate. Pre‐ and post‐program rating of teaching skills was undertaken in aggregate and as a matched‐pairs analysis.
The study was approved by the Partners Institutional Review Board.
RESULTS
Forty‐one resident facilitators participated in 118 individual simulation sessions encompassing 236 case scenarios. Thirty‐four residents completed the post‐program facilitator survey and were included in the analysis. Of these, 26 (76%) participated in the workshop and completed the pre‐program survey. Twenty‐three of the 34 residents (68%) completed the post‐program evaluation nonanonymously (13 PGY‐II, 10 PGY‐III). Of these, 16 completed the pre‐program survey nonanonymously. The average number of sessions facilitated by each resident was 3.9 (range, 112).
Pre‐ and Post‐program Self‐Assessment of Residents' Teaching Skills
Participation in the simulation RaT program led to improvements in resident facilitators' self‐reported teaching skills across multiple domains (Table 2). These results were consistent when using the retrospective pre‐program assessment in matched‐pairs analysis (n=34) and when performing the analysis using the true pre‐program preparedness compared to post‐program comfort with teaching skills in a non‐matched‐pairs fashion (n = 26) and matched‐pairs fashion (n = 16). We report P values for the more conservative estimates using the retrospective pre‐program assessment matched‐pairs analysis. The most significant improvements occurred in residents' ability to teach in a simulated environment (2.81 to 4.16, P < 0.001 [5‐point scale]) and give feedback (3.35 to 3.77, P < 0.001).
| Pre‐program Rating (n = 34) | Post‐program Rating (n = 34) | P Value | |
|---|---|---|---|
| |||
| Teaching on rounds | 3.75 | 4.03 | 0.005 |
| Teaching on wards outside rounds | 3.83 | 4.07 | 0.007 |
| Teaching in simulation | 2.81 | 4.16 | <0.001 |
| Giving feedback | 3.35 | 3.77 | <0.001 |
Resident facilitators reported that participation in the RaT program had a significant impact on their teaching skills both within and outside of the simulation environment (Table 3). However, the greatest gains were seen in the domain of teaching in simulation. It was also noted that participation in the program improved resident facilitators' medical knowledge.
| Category | Not at All | Slightly Improved | Moderately Improved | Greatly Improved | Not Sure |
|---|---|---|---|---|---|
| Teaching on rounds, n = 34 | 4 (12%) | 12 (35%) | 13 (38%) | 4 (12%) | 1 (3%) |
| Teaching on wards outside rounds, n = 34 | 3 (9%) | 13 (38%) | 12 (35%) | 5 (15%) | 1 (3%) |
| Teaching in simulation, n = 34 | 0 (0%) | 4 (12%) | 7 (21%) | 23 (68%) | 0 (0%) |
| Giving feedback, n = 34 | 4 (12%) | 10 (29%) | 12 (35%) | 6 (18%) | 2 (6%) |
| Medical knowledge, n = 34 | 2 (6%) | 11 (32%) | 18 (53%) | 3 (9%) | 0 (0%) |
Subgroup analyses were performed comparing the perceived improvement in teaching and feedback skills among those who did or did not attend the facilitator workshop, those who facilitated 5 or more versus less than 5 sessions, and those who received or did not receive direct observation and feedback from faculty. Although numerically greater gains were seen across all 4 domains among those who attended the workshop, facilitated 5 or more sessions, or received feedback from faculty, only teaching on rounds and on the wards outside rounds reached statistical significance (Table 4). It should be noted that all residents who facilitated 5 or more sessions also attended the workshop and received feedback from faculty. We also compared perceived improvement among PGY‐II and PGY‐III residents. In contrast to PGY‐II residents, who demonstrated an improvement in all 4 domains, PGY‐III residents only demonstrated improvement in simulation‐based teaching.
| Pre‐program | Post‐program | P Value | Pre‐program | Post‐program | P Value | |
|---|---|---|---|---|---|---|
| Facilitated Less Than 5 Sessions (n = 18) | Facilitated 5 or More Sessions (n = 11) | |||||
| Did Not Attend Workshop (n = 10) | Attended Workshop (n = 22) | |||||
| Received Feedback From Resident Leaders Only (n = 11) | Received Faculty Feedback (n = 21) | |||||
| PGY‐II (n = 13) | PGY‐III (n = 9) | |||||
| ||||||
| Teaching on rounds | 3.68 | 3.79 | 0.16 | 3.85 | 4.38 | 0.01 |
| Teaching on wards outside rounds | 3.82 | 4 | 0.08 | 3.85 | 4.15 | 0.04 |
| Teaching in simulation | 2.89 | 4.06 | <0.01 | 2.69 | 4.31 | <0.01 |
| Giving feedback | 3.33 | 3.67 | 0.01 | 3.38 | 3.92 | 0.01 |
| Teaching on rounds | 4 | 4.1 | 0.34 | 3.64 | 4 | <0.01 |
| Teaching on wards outside rounds | 4 | 4 | 1.00 | 3.76 | 4.1 | <0.01 |
| Teaching in simulation | 2.89 | 4.11 | <0.01 | 2.77 | 4.18 | <0.01 |
| Giving feedback | 3.56 | 3.78 | 0.17 | 3.27 | 3.77 | <0.01 |
| Teaching on rounds | 3.55 | 3.82 | 0.19 | 3.86 | 4.14 | 0.01 |
| Teaching on wards outside rounds | 4 | 4 | 1.00 | 3.75 | 4.1 | <0.01 |
| Teaching in simulation | 2.7 | 3.8 | <0.01 | 2.86 | 4.33 | <0.01 |
| Giving feedback | 3.2 | 3.6 | 0.04 | 3.43 | 3.86 | <0.01 |
| Teaching on rounds | 3.38 | 3.85 | 0.03 | 4.22 | 4.22 | 1 |
| Teaching on wards outside rounds | 3.54 | 3.85 | 0.04 | 4.14 | 4.14 | 1 |
| Teaching in simulation | 2.46 | 4.15 | <0.01 | 3.13 | 4.13 | <0.01 |
| Giving feedback | 3.23 | 3.62 | 0.02 | 3.5 | 3.88 | 0.08 |
Intern Learners' Assessment of Resident Facilitators and the Program Overall
During the course of the program, intern learners completed 166 DASH ratings evaluating 34 resident facilitators (see Supporting Information, Appendix V, in the online version of this article). Ratings for the 6 DASH items ranged from 6.49 to 6.73 (7‐point scale), demonstrating a high level of facilitator efficacy across multiple domains. No differences in DASH scores were noted among subgroups of resident facilitators described in the previous paragraph.
Thirty‐eight of 52 intern learners (73%) completed the post‐program survey.
| Facilitator Behaviors | Very Often, >75% | Often, >50% | Sometimes, 25%50% | Rarely, <25% | Never |
|---|---|---|---|---|---|
| Elicited emotional reactions, n = 38 | 18 (47%) | 16 (42%) | 4 (11%) | 0 (0%) | 0 (0%) |
| Elicited objectives from learner, n = 37 | 26 (69%) | 8 (22%) | 2 (6%) | 1 (3%) | 0 (0%) |
| Asked to share clinical reasoning, n = 38 | 21 (56%) | 13 (33%) | 4 (11%) | 0 (0%) | 0 (0%) |
| Summarized learning points, n = 38 | 31 (81%) | 7 (19%) | 0 (0%) | 0 (0%) | 0 (0%) |
| Spoke for less than half of the session, n = 38 | 8 (22%) | 17 (44%) | 11 (28%) | 2 (6%) | 0 (0%) |
All intern learners rated the overall simulation experience as either excellent (81%) or good (19%) on the post‐program evaluation (4 or 5 on a 5‐point Likert scale, respectively). All interns strongly agreed (72%) or agreed (28%) that the simulation sessions improved their ability to manage acute clinical scenarios. Interns reported that resident facilitators frequently utilized specific debriefing techniques covered in the RaT curriculum during the debriefing sessions (Table 5).
DISCUSSION
We describe a unique RaT program embedded within a high‐fidelity medical simulation curriculum for IM interns. Our study demonstrates that resident facilitators noted an improvement in their teaching and feedback skills, both in the simulation setting and on the wards. Intern learners rated residents' teaching skills and the overall simulation curriculum highly, suggesting that residents were effective teachers.
The use of simulation in trainee‐as‐teacher curricula holds promise because it can provide an opportunity to teach in an environment closely approximating the wards, where trainees have the most opportunities to teach. However, in contrast to true ward‐based teaching, simulation can provide predictable scenarios in a controlled environment, which eliminates the distractions and unpredictability that exist on the wards, without compromising patient safety. Recently, Tofil et al. described the first use of simulation in a trainee‐as‐teacher program.[17] The investigators utilized a 1‐time simulation‐based teaching session, during which pediatric fellows completed a teacher‐training workshop, developed and served as facilitators in a simulated case, and received feedback. The use of simulation allowed fellows an opportunity to apply newly acquired skills in a controlled environment and receive feedback, which has been shown to improve teaching skills.[18]
The experience from our program expands on that of Tofil et al., as well as previously described trainee‐as‐teacher curricula, by introducing a component of deliberate practice that is unique to the simulation setting and has been absent from most previously described RaT programs.[3] Most residents had the opportunity to facilitate the same case on multiple occasions, allowing them to receive feedback and make adjustments. Residents who facilitated 5 or more sessions demonstrated more improvement, particularly in teaching outside of simulation, than residents who facilitated fewer sessions. It is notable that PGY‐II resident facilitators reported an improvement in their teaching skills on the wards, though less pronounced as compared to teaching in the simulation‐based environment, suggesting that benefits of the program may extend to nonsimulation‐based settings. Additional studies focusing on objective evaluation of ward‐based teaching are needed to further explore this phenomenon. Finally, the self‐reported improvements in medical knowledge by resident facilitators may serve as another benefit of our program.
Analysis of learner‐level data collected in the postcurriculum intern survey and DASH ratings provides additional support for the effectiveness of the RaT program. The majority of intern learners reported that resident facilitators used the techniques covered in our program frequently during debriefings. In addition, DASH scores clustered around maximum efficacy for all facilitators, suggesting that residents were effective teachers. Although we cannot directly assess whether the differences demonstrated in resident facilitators' self‐assessments translated to their teaching or were significant from the learners' perspective, these results support the hypothesis that self‐assessed improvements in teaching and feedback skills were significant.
In addition to improving resident teaching skills, our program had a positive impact on intern learners as evidenced by intern evaluations of the simulation curriculum. While utilizing relatively few faculty resources, our program was able to deliver an extensive and well‐received simulation curriculum to over 50 interns. The fact that 40% of second‐ and third‐year residents volunteered to teach in the program despite the early morning timing of the sessions speaks to the interest that trainees have in teaching in this setting. This model can serve as an important and efficient learning platform in residency training programs. It may be particularly salient to IM training programs where implementation of simulation curricula is challenging due to large numbers of residents and limited faculty resources. The barriers to and lessons learned from our experience with implementing the simulation curriculum have been previously described.[10, 11]
Our study has several limitations. Changes in residents' teaching skills were self‐assessed, which may be inaccurate as learners may overestimate their abilities.[19] Although we collected data on the experiences of intern learners that supported residents' self‐assessment, further studies using more objective measures (such as the Objective Structured Teaching Exercise[20]) should be undertaken. We did not objectively assess improvement of residents' teaching skills on the wards, with the exception of the residents' self assessment. Due to the timing of survey administration, some residents had as little as 1 month between completion of the curriculum and responding to the post‐curriculum survey, limiting their ability to evaluate their teaching skills on the wards. The transferability of the skills gained in simulation‐based teaching to teaching on the wards deserves further study. We cannot definitively attribute perceived improvement of teaching skills to the RaT program without a control group. However, the frequent use of recommended techniques during debriefing, which are not typically taught in other settings, supports the efficacy of the RaT program.
Our study did not allow us to determine which of the 3 components of the RaT program (workshop, facilitation practice, or direct observation and feedback) had the greatest impact on teaching skills or DASH ratings, as those who facilitated more sessions also completed the other components of the program. Furthermore, there may have been a selection bias among facilitators who facilitated more sessions. Because only 16 of 34 participants completed both the pre‐program and post‐program self‐assessments in a non‐anonymous fashion, we were not able to analyze the effect of pre‐program factors, such as prior teaching experience, on program outcomes. It should also be noted that allowing resident facilitators the option to complete the survey non‐anonymously could have biased our results. The simulation curriculum was conducted in a single center, and resident facilitators were self‐selecting; therefore, our results may not be generalizable. Finally, the DASH instrument was only administered after the RaT workshop and was likely limited further by the ceiling effect created by the learners' high satisfaction with the simulation program overall.
In summary, our simulation‐based RaT program improved resident facilitators' self‐reported teaching and feedback skills. Simulation‐based training provided an opportunity for deliberate practice of teaching skills in a controlled environment, which was a unique component of the program. The impact of deliberate practice on resident teaching skills and optimal methods to incorporate deliberate practice in RaT programs deserves further study. Our curriculum design may serve as a model for the development of simulation programs that can be employed to improve both intern learning and resident teaching skills.
Acknowledgements
The authors acknowledge Deborah Navedo, PhD, Assistant Professor, Massachusetts General Hospital Institute of Health Professions, and Emily M. Hayden, MD, Assistant Professor, Department of Emergency Medicine, Massachusetts General Hospital and Harvard Medical School, for their assistance with development of the RaT curriculum. The authors thank Dr. Jenny Rudolph, Senior Director, Institute for Medical Simulation at the Center for Medical Simulation, for her help in teaching us to use the DASH instrument. The authors also thank Dr. Daniel Hunt, MD, Associate Professor, Department of Medicine, Massachusetts General Hospital and Harvard Medical School, for his thoughtful review of this manuscript.
Disclosure: Nothing to report.
- Liaison Committee on Medical Education. Functions and structure of a medical school: standards for accreditation of medical education programs leading to the M.D. degree. Washington, DC, and Chicago, IL: Association of American Medical Colleges and American Medical Association; 2000.
- Accreditation Council for Graduate Medical Education. ACGME program requirements for graduate medical education in pediatrics. Available at: http://www.acgme.org/acgmeweb/Portals/0/PFAssets/2013-PR-FAQ-PIF/320_pediatrics_07012013.pdf. Accessed June 18, 2014.
- , , , . A systematic review of resident‐as‐teacher programmes. Med Educ. 2009;43(12):1129–1140.
- , , , et al. The utility of simulation in medical education: what is the evidence? Mt Sinai J Med. 2009;76:330–343.
- , , , et al. National growth in simulation training within emergency medicine residency programs, 2003–2008. Acad Emerg Med. 2008;15:1113–1116.
- , , , et al. Simulation center accreditation and programmatic benchmarks: a review for emergency medicine. Acad Emerg Med. 2010;17(10):1093–1103.
- . How much evidence does it take? A cumulative meta‐analysis of outcomes of simulation‐based education. Med Educ. 2014;48(8):750–760.
- , , , et al.. Resident‐as‐teacher: a suggested curriculum for emergency medicine. Acad Emerg Med. 2006;13(6):677–679.
- . Deliberate practice and the acquisition and maintenance of expert performance in medicine and related domains. Acad Med. 2004;79(10 suppl):S70–S81.
- , , , , , . Pilot program utilizing medical simulation in clinical decision making training for internal medicine interns. J Grad Med Educ. 2012;4:490–495.
- , , , et al. How we implemented a resident‐led medical simulation curriculum in a large internal medicine residency program. Med Teach. 2014;36(4):279–283.
- , , , . There's no such thing as “nonjudgmental” debriefing: a theory and method for debriefing with good judgment. Simul Healthc. 2006;1:49–55.
- , , , . Improving faculty feedback to resident trainees during a simulated case: a randomized, controlled trial of an educational intervention. Anesthesiology. 2014;120(1):160–171.
- . Introduction to debriefing. Semin Perinatol. 2013:37(3)166–174.
- , . Response‐shift bias: a source of contamination of self‐report measures. J Appl Psychol. 1979;4:93–106.
- Center for Medical Simulation. Debriefing assessment for simulation in healthcare. Available at: http://www.harvardmedsim.org/debriefing‐assesment‐simulation‐healthcare.php. Accessed June 18, 2014.
- , , , et al. A novel iterative‐learner simulation model: fellows as teachers. J Grad Med Educ. 2014;6(1):127–132.
- , , . Direct observation of faculty with feedback: an effective means of improving patient‐centered and learner‐centered teaching skills. Teach Learn Med. 2007;19(3):278–286.
- , . Unskilled and unaware of it: how difficulties in recognizing one's own incompetence lead to inflated self assessments. J Pers Soc Psychol. 1999;77:1121–1134.
- , , , et al. Reliability and validity of an objective structured teaching examination for generalist resident teachers. Acad Med. 2002;77(10 suppl):S29–S32.
Residency training, in addition to developing clinical competence among trainees, is charged with improving resident teaching skills. The Liaison Committee on Medical Education and the Accreditation Council for Graduate Medical Education require that residents be provided with training or resources to develop their teaching skills.[1, 2] A variety of resident‐as‐teacher (RaT) programs have been described; however, the optimal format of such programs remains in question.[3] High‐fidelity medical simulation using mannequins has been shown to be an effective teaching tool in various medical specialties[4, 5, 6, 7] and may prove to be useful in teacher training.[8] Teaching in a simulation‐based environment can give participants the opportunity to apply their teaching skills in a clinical environment, as they would on the wards, but in a more controlled, predictable setting and without compromising patient safety. In addition, simulation offers the opportunity to engage in deliberate practice by allowing teachers to facilitate the same case on multiple occasions with different learners. Deliberate practice, which involves task repetition with feedback aimed at improving performance, has been shown to be important in developing expertise.[9]
We previously described the first use of a high‐fidelity simulation curriculum for internal medicine (IM) interns focused on clinical decision‐making skills, in which second‐ and third‐year residents served as facilitators.[10, 11] Herein, we describe a RaT program in which residents participated in a workshop, then served as facilitators in the intern curriculum and received feedback from faculty. We hypothesized that such a program would improve residents' teaching and feedback skills, both in the simulation environment and on the wards.
METHODS
We conducted a single‐group study evaluating teaching and feedback skills among upper‐level resident facilitators before and after participation in the RaT program. We measured residents' teaching skills using pre‐ and post‐program self‐assessments as well as evaluations completed by the intern learners after each session and at the completion of the curriculum.
Setting and Participants
We embedded the RaT program within a simulation curriculum administered July to October of 2013 for all IM interns at Massachusetts General Hospital (interns in the preliminary program who planned to pursue another field after the completion of the intern year were excluded) (n = 52). We invited postgraduate year (PGY) II and III residents (n = 102) to participate in the IM simulation program as facilitators via email. The curriculum consisted of 8 cases focusing on acute clinical scenarios encountered on the general medicine wards. The cases were administered during 1‐hour sessions 4 mornings per week from 7 AM to 8 AM prior to clinical duties. Interns completed the curriculum over 4 sessions during their outpatient rotation. The case topics were (1) hypertensive emergency, (2) post‐procedure bleed, (3) congestive heart failure, (4) atrial fibrillation with rapid ventricular response, (5) altered mental status/alcohol withdrawal, (6) nonsustained ventricular tachycardia heralding acute coronary syndrome, (7) cardiac tamponade, and (8) anaphylaxis. During each session, groups of 2 to 3 interns worked through 2 cases using a high‐fidelity mannequin (Laerdal 3G, Wappingers Falls, NY) with 2 resident facilitators. One facilitator operated the mannequin, while the other served as a nurse. Each case was followed by a structured debriefing led by 1 of the resident facilitators (facilitators switched roles for the second case). The number of sessions facilitated varied for each resident based on individual schedules and preferences.
Four senior residents who were appointed as simulation leaders (G.A.A., J.K.H., R.K., Z.S.) and 2 faculty advisors (P.F.C., E.M.M.) administered the program. Simulation resident leaders scheduled facilitators and interns and participated in a portion of simulation sessions as facilitators, but they were not analyzed as participants for the purposes of this study. The curriculum was administered without interfering with clinical duties, and no additional time was protected for interns or residents participating in the curriculum.
Resident‐as‐Teacher Program Structure
We invited participating resident facilitators to attend a 1‐hour interactive workshop prior to serving as facilitators. The workshop focused on building learner‐centered and small‐group teaching skills, as well as introducing residents to a 5‐stage debriefing framework developed by the authors and based on simulation debriefing best practices (Table 1).[12, 13, 14]
| Stage of Debriefing | Action | Rationale |
|---|---|---|
| ||
| Emotional response | Elicit learners' emotions about the case | It is important to acknowledge and address both positive and negative emotions that arise during the case before debriefing the specific medical and communications aspects of the case. Unaddressed emotional responses may hinder subsequent debriefing. |
| Objectives* | Elicit learners' objectives and combine them with the stated learning objectives of the case to determine debriefing objectives | The limited amount of time allocated for debriefing (1520 minutes) does not allow the facilitator to cover all aspects of medical management and communication skills in a particular case. Focusing on the most salient objectives, including those identified by the learners, allows the facilitator to engage in learner‐centered debriefing. |
| Analysis | Analyze the learners' approach to the case | Analyzing the learners' approach to the case using the advocacy‐inquiry method[11] seeks to uncover the learner's assumptions/frameworks behind the decision made during the case. This approach allows the facilitator to understand the learners' thought process and target teaching points to more precisely address the learners' needs. |
| Teaching | Address knowledge gaps and incorrect assumptions | Learner‐centered debriefing within a limited timeframe requires teaching to be brief and targeted toward the defined objectives. It should also address the knowledge gaps and incorrect assumptions uncovered during the analysis phase. |
| Summary | Summarize key takeaways | Summarizing highlights the key points of the debriefing and can be used to suggest further exploration of topics through self‐study (if necessary). |
Resident facilitators were observed by simulation faculty and simulation resident leaders throughout the intern curriculum and given structured feedback either in‐person immediately after completion of the simulation session or via a detailed same‐day e‐mail if the time allotted for feedback was not sufficient. Feedback was structured by the 5 stages of debriefing described in Table 1, and included soliciting residents' observations on the teaching experience and specific behaviors observed by faculty during the scenarios. E‐mail feedback (also structured by stages of debriefing and including observed behaviors) was typically followed by verbal feedback during the next simulation session.
The RaT program was composed of 3 elements: the workshop, case facilitation, and direct observation with feedback. Because we felt that the opportunity for directly observed teaching and feedback in a ward‐like controlled environment was a unique advantage offered by the simulation setting, we included all residents who served as facilitators in the analysis, regardless of whether or not they had attended the workshop.
Evaluation Instruments
Survey instruments were developed by the investigators, reviewed by several experts in simulation, pilot tested among residents not participating in the simulation program, and revised by the investigators.
Pre‐program Facilitator Survey
Prior to the RaT workshop, resident facilitators completed a baseline survey evaluating their preparedness to teach and give feedback on the wards and in a simulation‐based setting on a 5‐point scale (see Supporting Information, Appendix I, in the online version of this article).
Post‐program Facilitator Survey
Approximately 3 weeks after completion of the intern simulation curriculum, resident facilitators were asked to complete an online post‐program survey, which remained open for 1 month (residents completed this survey anywhere from 3 weeks to 4 months after their participation in the RaT program depending on the timing of their facilitation). The survey asked residents to evaluate their comfort with their current post‐program teaching skills as well as their pre‐program skills in retrospect, as previous research demonstrated that learners may overestimate their skills prior to training programs.[15] Resident facilitators could complete the surveys nonanonymously to allow for matched‐pairs analysis of the change in teaching skills over the course of the program (see Supporting Information, Appendix II, in the online version of this article).
Intern Evaluation of Facilitator Debriefing Skills
After each case, intern learners were asked to anonymously evaluate the teaching effectiveness of the lead resident facilitator using the adapted Debriefing Assessment for Simulation in Healthcare (DASH) instrument.[16] The DASH instrument evaluated the following domains: (1) instructor maintained an engaging context for learning, (2) instructor structured the debriefing in an organized way, (3) instructor provoked in‐depth discussions that led me to reflect on my performance, (4) instructor identified what I did well or poorly and why, (5) instructor helped me see how to improve or how to sustain good performance, (6) overall effectiveness of the simulation session (see Supporting Information, Appendix III, in the online version of this article).
Post‐program Intern Survey
Two months following the completion of the simulation curriculum, intern learners received an anonymous online post‐program evaluation assessing program efficacy and resident facilitator teaching (see Supporting Information, Appendix IV, in the online version of this article).
Statistical Analysis
Teaching skills and learners' DASH ratings were compared using the Student t test, Pearson 2 test, and Fisher exact test as appropriate. Pre‐ and post‐program rating of teaching skills was undertaken in aggregate and as a matched‐pairs analysis.
The study was approved by the Partners Institutional Review Board.
RESULTS
Forty‐one resident facilitators participated in 118 individual simulation sessions encompassing 236 case scenarios. Thirty‐four residents completed the post‐program facilitator survey and were included in the analysis. Of these, 26 (76%) participated in the workshop and completed the pre‐program survey. Twenty‐three of the 34 residents (68%) completed the post‐program evaluation nonanonymously (13 PGY‐II, 10 PGY‐III). Of these, 16 completed the pre‐program survey nonanonymously. The average number of sessions facilitated by each resident was 3.9 (range, 112).
Pre‐ and Post‐program Self‐Assessment of Residents' Teaching Skills
Participation in the simulation RaT program led to improvements in resident facilitators' self‐reported teaching skills across multiple domains (Table 2). These results were consistent when using the retrospective pre‐program assessment in matched‐pairs analysis (n=34) and when performing the analysis using the true pre‐program preparedness compared to post‐program comfort with teaching skills in a non‐matched‐pairs fashion (n = 26) and matched‐pairs fashion (n = 16). We report P values for the more conservative estimates using the retrospective pre‐program assessment matched‐pairs analysis. The most significant improvements occurred in residents' ability to teach in a simulated environment (2.81 to 4.16, P < 0.001 [5‐point scale]) and give feedback (3.35 to 3.77, P < 0.001).
| Pre‐program Rating (n = 34) | Post‐program Rating (n = 34) | P Value | |
|---|---|---|---|
| |||
| Teaching on rounds | 3.75 | 4.03 | 0.005 |
| Teaching on wards outside rounds | 3.83 | 4.07 | 0.007 |
| Teaching in simulation | 2.81 | 4.16 | <0.001 |
| Giving feedback | 3.35 | 3.77 | <0.001 |
Resident facilitators reported that participation in the RaT program had a significant impact on their teaching skills both within and outside of the simulation environment (Table 3). However, the greatest gains were seen in the domain of teaching in simulation. It was also noted that participation in the program improved resident facilitators' medical knowledge.
| Category | Not at All | Slightly Improved | Moderately Improved | Greatly Improved | Not Sure |
|---|---|---|---|---|---|
| Teaching on rounds, n = 34 | 4 (12%) | 12 (35%) | 13 (38%) | 4 (12%) | 1 (3%) |
| Teaching on wards outside rounds, n = 34 | 3 (9%) | 13 (38%) | 12 (35%) | 5 (15%) | 1 (3%) |
| Teaching in simulation, n = 34 | 0 (0%) | 4 (12%) | 7 (21%) | 23 (68%) | 0 (0%) |
| Giving feedback, n = 34 | 4 (12%) | 10 (29%) | 12 (35%) | 6 (18%) | 2 (6%) |
| Medical knowledge, n = 34 | 2 (6%) | 11 (32%) | 18 (53%) | 3 (9%) | 0 (0%) |
Subgroup analyses were performed comparing the perceived improvement in teaching and feedback skills among those who did or did not attend the facilitator workshop, those who facilitated 5 or more versus less than 5 sessions, and those who received or did not receive direct observation and feedback from faculty. Although numerically greater gains were seen across all 4 domains among those who attended the workshop, facilitated 5 or more sessions, or received feedback from faculty, only teaching on rounds and on the wards outside rounds reached statistical significance (Table 4). It should be noted that all residents who facilitated 5 or more sessions also attended the workshop and received feedback from faculty. We also compared perceived improvement among PGY‐II and PGY‐III residents. In contrast to PGY‐II residents, who demonstrated an improvement in all 4 domains, PGY‐III residents only demonstrated improvement in simulation‐based teaching.
| Pre‐program | Post‐program | P Value | Pre‐program | Post‐program | P Value | |
|---|---|---|---|---|---|---|
| Facilitated Less Than 5 Sessions (n = 18) | Facilitated 5 or More Sessions (n = 11) | |||||
| Did Not Attend Workshop (n = 10) | Attended Workshop (n = 22) | |||||
| Received Feedback From Resident Leaders Only (n = 11) | Received Faculty Feedback (n = 21) | |||||
| PGY‐II (n = 13) | PGY‐III (n = 9) | |||||
| ||||||
| Teaching on rounds | 3.68 | 3.79 | 0.16 | 3.85 | 4.38 | 0.01 |
| Teaching on wards outside rounds | 3.82 | 4 | 0.08 | 3.85 | 4.15 | 0.04 |
| Teaching in simulation | 2.89 | 4.06 | <0.01 | 2.69 | 4.31 | <0.01 |
| Giving feedback | 3.33 | 3.67 | 0.01 | 3.38 | 3.92 | 0.01 |
| Teaching on rounds | 4 | 4.1 | 0.34 | 3.64 | 4 | <0.01 |
| Teaching on wards outside rounds | 4 | 4 | 1.00 | 3.76 | 4.1 | <0.01 |
| Teaching in simulation | 2.89 | 4.11 | <0.01 | 2.77 | 4.18 | <0.01 |
| Giving feedback | 3.56 | 3.78 | 0.17 | 3.27 | 3.77 | <0.01 |
| Teaching on rounds | 3.55 | 3.82 | 0.19 | 3.86 | 4.14 | 0.01 |
| Teaching on wards outside rounds | 4 | 4 | 1.00 | 3.75 | 4.1 | <0.01 |
| Teaching in simulation | 2.7 | 3.8 | <0.01 | 2.86 | 4.33 | <0.01 |
| Giving feedback | 3.2 | 3.6 | 0.04 | 3.43 | 3.86 | <0.01 |
| Teaching on rounds | 3.38 | 3.85 | 0.03 | 4.22 | 4.22 | 1 |
| Teaching on wards outside rounds | 3.54 | 3.85 | 0.04 | 4.14 | 4.14 | 1 |
| Teaching in simulation | 2.46 | 4.15 | <0.01 | 3.13 | 4.13 | <0.01 |
| Giving feedback | 3.23 | 3.62 | 0.02 | 3.5 | 3.88 | 0.08 |
Intern Learners' Assessment of Resident Facilitators and the Program Overall
During the course of the program, intern learners completed 166 DASH ratings evaluating 34 resident facilitators (see Supporting Information, Appendix V, in the online version of this article). Ratings for the 6 DASH items ranged from 6.49 to 6.73 (7‐point scale), demonstrating a high level of facilitator efficacy across multiple domains. No differences in DASH scores were noted among subgroups of resident facilitators described in the previous paragraph.
Thirty‐eight of 52 intern learners (73%) completed the post‐program survey.
| Facilitator Behaviors | Very Often, >75% | Often, >50% | Sometimes, 25%50% | Rarely, <25% | Never |
|---|---|---|---|---|---|
| Elicited emotional reactions, n = 38 | 18 (47%) | 16 (42%) | 4 (11%) | 0 (0%) | 0 (0%) |
| Elicited objectives from learner, n = 37 | 26 (69%) | 8 (22%) | 2 (6%) | 1 (3%) | 0 (0%) |
| Asked to share clinical reasoning, n = 38 | 21 (56%) | 13 (33%) | 4 (11%) | 0 (0%) | 0 (0%) |
| Summarized learning points, n = 38 | 31 (81%) | 7 (19%) | 0 (0%) | 0 (0%) | 0 (0%) |
| Spoke for less than half of the session, n = 38 | 8 (22%) | 17 (44%) | 11 (28%) | 2 (6%) | 0 (0%) |
All intern learners rated the overall simulation experience as either excellent (81%) or good (19%) on the post‐program evaluation (4 or 5 on a 5‐point Likert scale, respectively). All interns strongly agreed (72%) or agreed (28%) that the simulation sessions improved their ability to manage acute clinical scenarios. Interns reported that resident facilitators frequently utilized specific debriefing techniques covered in the RaT curriculum during the debriefing sessions (Table 5).
DISCUSSION
We describe a unique RaT program embedded within a high‐fidelity medical simulation curriculum for IM interns. Our study demonstrates that resident facilitators noted an improvement in their teaching and feedback skills, both in the simulation setting and on the wards. Intern learners rated residents' teaching skills and the overall simulation curriculum highly, suggesting that residents were effective teachers.
The use of simulation in trainee‐as‐teacher curricula holds promise because it can provide an opportunity to teach in an environment closely approximating the wards, where trainees have the most opportunities to teach. However, in contrast to true ward‐based teaching, simulation can provide predictable scenarios in a controlled environment, which eliminates the distractions and unpredictability that exist on the wards, without compromising patient safety. Recently, Tofil et al. described the first use of simulation in a trainee‐as‐teacher program.[17] The investigators utilized a 1‐time simulation‐based teaching session, during which pediatric fellows completed a teacher‐training workshop, developed and served as facilitators in a simulated case, and received feedback. The use of simulation allowed fellows an opportunity to apply newly acquired skills in a controlled environment and receive feedback, which has been shown to improve teaching skills.[18]
The experience from our program expands on that of Tofil et al., as well as previously described trainee‐as‐teacher curricula, by introducing a component of deliberate practice that is unique to the simulation setting and has been absent from most previously described RaT programs.[3] Most residents had the opportunity to facilitate the same case on multiple occasions, allowing them to receive feedback and make adjustments. Residents who facilitated 5 or more sessions demonstrated more improvement, particularly in teaching outside of simulation, than residents who facilitated fewer sessions. It is notable that PGY‐II resident facilitators reported an improvement in their teaching skills on the wards, though less pronounced as compared to teaching in the simulation‐based environment, suggesting that benefits of the program may extend to nonsimulation‐based settings. Additional studies focusing on objective evaluation of ward‐based teaching are needed to further explore this phenomenon. Finally, the self‐reported improvements in medical knowledge by resident facilitators may serve as another benefit of our program.
Analysis of learner‐level data collected in the postcurriculum intern survey and DASH ratings provides additional support for the effectiveness of the RaT program. The majority of intern learners reported that resident facilitators used the techniques covered in our program frequently during debriefings. In addition, DASH scores clustered around maximum efficacy for all facilitators, suggesting that residents were effective teachers. Although we cannot directly assess whether the differences demonstrated in resident facilitators' self‐assessments translated to their teaching or were significant from the learners' perspective, these results support the hypothesis that self‐assessed improvements in teaching and feedback skills were significant.
In addition to improving resident teaching skills, our program had a positive impact on intern learners as evidenced by intern evaluations of the simulation curriculum. While utilizing relatively few faculty resources, our program was able to deliver an extensive and well‐received simulation curriculum to over 50 interns. The fact that 40% of second‐ and third‐year residents volunteered to teach in the program despite the early morning timing of the sessions speaks to the interest that trainees have in teaching in this setting. This model can serve as an important and efficient learning platform in residency training programs. It may be particularly salient to IM training programs where implementation of simulation curricula is challenging due to large numbers of residents and limited faculty resources. The barriers to and lessons learned from our experience with implementing the simulation curriculum have been previously described.[10, 11]
Our study has several limitations. Changes in residents' teaching skills were self‐assessed, which may be inaccurate as learners may overestimate their abilities.[19] Although we collected data on the experiences of intern learners that supported residents' self‐assessment, further studies using more objective measures (such as the Objective Structured Teaching Exercise[20]) should be undertaken. We did not objectively assess improvement of residents' teaching skills on the wards, with the exception of the residents' self assessment. Due to the timing of survey administration, some residents had as little as 1 month between completion of the curriculum and responding to the post‐curriculum survey, limiting their ability to evaluate their teaching skills on the wards. The transferability of the skills gained in simulation‐based teaching to teaching on the wards deserves further study. We cannot definitively attribute perceived improvement of teaching skills to the RaT program without a control group. However, the frequent use of recommended techniques during debriefing, which are not typically taught in other settings, supports the efficacy of the RaT program.
Our study did not allow us to determine which of the 3 components of the RaT program (workshop, facilitation practice, or direct observation and feedback) had the greatest impact on teaching skills or DASH ratings, as those who facilitated more sessions also completed the other components of the program. Furthermore, there may have been a selection bias among facilitators who facilitated more sessions. Because only 16 of 34 participants completed both the pre‐program and post‐program self‐assessments in a non‐anonymous fashion, we were not able to analyze the effect of pre‐program factors, such as prior teaching experience, on program outcomes. It should also be noted that allowing resident facilitators the option to complete the survey non‐anonymously could have biased our results. The simulation curriculum was conducted in a single center, and resident facilitators were self‐selecting; therefore, our results may not be generalizable. Finally, the DASH instrument was only administered after the RaT workshop and was likely limited further by the ceiling effect created by the learners' high satisfaction with the simulation program overall.
In summary, our simulation‐based RaT program improved resident facilitators' self‐reported teaching and feedback skills. Simulation‐based training provided an opportunity for deliberate practice of teaching skills in a controlled environment, which was a unique component of the program. The impact of deliberate practice on resident teaching skills and optimal methods to incorporate deliberate practice in RaT programs deserves further study. Our curriculum design may serve as a model for the development of simulation programs that can be employed to improve both intern learning and resident teaching skills.
Acknowledgements
The authors acknowledge Deborah Navedo, PhD, Assistant Professor, Massachusetts General Hospital Institute of Health Professions, and Emily M. Hayden, MD, Assistant Professor, Department of Emergency Medicine, Massachusetts General Hospital and Harvard Medical School, for their assistance with development of the RaT curriculum. The authors thank Dr. Jenny Rudolph, Senior Director, Institute for Medical Simulation at the Center for Medical Simulation, for her help in teaching us to use the DASH instrument. The authors also thank Dr. Daniel Hunt, MD, Associate Professor, Department of Medicine, Massachusetts General Hospital and Harvard Medical School, for his thoughtful review of this manuscript.
Disclosure: Nothing to report.
- Liaison Committee on Medical Education. Functions and structure of a medical school: standards for accreditation of medical education programs leading to the M.D. degree. Washington, DC, and Chicago, IL: Association of American Medical Colleges and American Medical Association; 2000.
- Accreditation Council for Graduate Medical Education. ACGME program requirements for graduate medical education in pediatrics. Available at: http://www.acgme.org/acgmeweb/Portals/0/PFAssets/2013-PR-FAQ-PIF/320_pediatrics_07012013.pdf. Accessed June 18, 2014.
- , , , . A systematic review of resident‐as‐teacher programmes. Med Educ. 2009;43(12):1129–1140.
- , , , et al. The utility of simulation in medical education: what is the evidence? Mt Sinai J Med. 2009;76:330–343.
- , , , et al. National growth in simulation training within emergency medicine residency programs, 2003–2008. Acad Emerg Med. 2008;15:1113–1116.
- , , , et al. Simulation center accreditation and programmatic benchmarks: a review for emergency medicine. Acad Emerg Med. 2010;17(10):1093–1103.
- . How much evidence does it take? A cumulative meta‐analysis of outcomes of simulation‐based education. Med Educ. 2014;48(8):750–760.
- , , , et al.. Resident‐as‐teacher: a suggested curriculum for emergency medicine. Acad Emerg Med. 2006;13(6):677–679.
- . Deliberate practice and the acquisition and maintenance of expert performance in medicine and related domains. Acad Med. 2004;79(10 suppl):S70–S81.
- , , , , , . Pilot program utilizing medical simulation in clinical decision making training for internal medicine interns. J Grad Med Educ. 2012;4:490–495.
- , , , et al. How we implemented a resident‐led medical simulation curriculum in a large internal medicine residency program. Med Teach. 2014;36(4):279–283.
- , , , . There's no such thing as “nonjudgmental” debriefing: a theory and method for debriefing with good judgment. Simul Healthc. 2006;1:49–55.
- , , , . Improving faculty feedback to resident trainees during a simulated case: a randomized, controlled trial of an educational intervention. Anesthesiology. 2014;120(1):160–171.
- . Introduction to debriefing. Semin Perinatol. 2013:37(3)166–174.
- , . Response‐shift bias: a source of contamination of self‐report measures. J Appl Psychol. 1979;4:93–106.
- Center for Medical Simulation. Debriefing assessment for simulation in healthcare. Available at: http://www.harvardmedsim.org/debriefing‐assesment‐simulation‐healthcare.php. Accessed June 18, 2014.
- , , , et al. A novel iterative‐learner simulation model: fellows as teachers. J Grad Med Educ. 2014;6(1):127–132.
- , , . Direct observation of faculty with feedback: an effective means of improving patient‐centered and learner‐centered teaching skills. Teach Learn Med. 2007;19(3):278–286.
- , . Unskilled and unaware of it: how difficulties in recognizing one's own incompetence lead to inflated self assessments. J Pers Soc Psychol. 1999;77:1121–1134.
- , , , et al. Reliability and validity of an objective structured teaching examination for generalist resident teachers. Acad Med. 2002;77(10 suppl):S29–S32.
© 2015 Society of Hospital Medicine
Undiagnosed Psoriatic Arthritis
Of all the comorbidities associated with psoriasis, psoriatic arthritis (PsA) is the most common and one of the most problematic. Early recognition, diagnosis, and treatment of PsA can help prevent or limit extensive joint damage that occurs in later stages of the disease. Because cutaneous psoriasis precedes the onset of PsA in 84% of patients with psoriasis, it is incumbent upon dermatologists to be the first line of defense in the screening for joint problems. However, the efficacy of PsA screening remains unknown.
In a recent article published online on June 5 in the Journal of the American Academy of Dermatology, Villani et al performed an analysis to determine the point prevalence of undiagnosed PsA in patients with psoriasis, utilizing a systematic search of the literature and meta-analysis. Searching PubMed, Cochrane, and Embase databases, the authors identified 394 studies for review. None of the studies sought to determine the prevalence of undiagnosed PsA in patients with psoriasis.
The investigators made the assumption that the prevalence of newly diagnosed PsA in patients with psoriasis at the time they sought medical care could be a reasonable estimate of this value. Seven epidemiological studies and 5 studies on PsA screening questionnaires were selected for review and were used to clearly identify patients with newly diagnosed PsA.
The authors found that the prevalence of undiagnosed PsA was 15.5% when all studies were analyzed and 10.1% when only epidemiological studies were included. The high prevalence of undiagnosed PsA in patients with psoriasis reinforces the recommendation that dermatologists need to screen all patients with psoriasis for PsA.
What’s the issue?
The findings of this study are not surprising. Therefore, it is important that we double our efforts to screen patients for PsA to address this comorbidity as early as possible. Improved algorithms for screening of patients for PsA would be a welcome advancement. How will you improve your screening methods for PsA?