User login
Agent can reduce ESR in SCD, study suggests
Credit: Graham Colm
MIAMI—Results of a small study suggest an experimental agent can decrease the erythrocyte sedimentation rate (ESR) in patients with sickle cell disease (SCD).
Previous research has shown the ESR is elevated in SCD patients during vaso-occlusive crisis.
In the current study, the experimental agent MST-188 decreased elevated ESRs by 50% in blood from SCD patients.
According to researchers, this reflects reduced red blood cell (RBC) aggregation and suggests improved microvascular blood flow.
“The data from this study are consistent with observations in prior studies that MST-188 decreases blood viscosity and RBC aggregation and improves microvascular blood flow, and supportive of the potential for MST-188 to shorten the duration of sickle cell crisis,” said Martin Emanuele, PhD, of Mast Therapeutics, the company developing MST-188.
Dr Emanuele presented the study data at the recent 8th Annual Sickle Cell Disease Research & Educational Symposium.
MST-188 is a non-ionic, linear block copolymer composed of a central chain of hydrophobic polyoxypropylene and 2 flanking chains of hydrophylic polyoxyethylene. In previous studies, the agent has shown hemorheologic properties that result in improved microvascular blood flow.
For the current study, the researchers compared MST-188 to dextrans, evaluating their effects on the ESR in blood collected from SCD patients and healthy controls. Dextrans are branched polysaccharides of 10-70 kDa that have been used as antithrombotic agents and plasma expanders.
The researchers analyzed EDTA-anticoagulated whole blood collected from 8 healthy individuals and 11 SCD patients. The team treated samples with MST-188; dextran 10K, 18K , 40K, and 70K at various concentrations; or saline control.
At baseline, ESRs for SCD patients were significantly higher than for the healthy subjects. The mean ESRs were 26.4 ± 7.1 mm/hr and 14.6 ± 2.1 mm/hr, respectively.
However, adding MST-188 to the SCD patient samples decreased the mean ESR to 14.1 ± 4.6 mm/hr (Δ47%). On the other hand, comparable concentrations of dextrans showed little or no effect on the ESR in SCD samples.
The researchers said MST-188 may reduce the ESR by inhibiting acute-phase-reactant-induced RBC aggregates, and this may result from the effect of MST-188 on RBC membranes or cell-protein interactions.
Regardless of the exact mechanism, the team said lowering the ESR reflects reduced RBC aggregation and suggests improved microvascular blood flow, which indicates that MST-188 may be able to shorten the duration of vaso-occlusive crisis.
“It is widely understood that multiple biological processes contribute to vaso-occlusion and that an effective solution requires a broad, multi-modal approach rather than a single targeted therapy,” Dr Emanuele said.
“In addition to the effects on RBC aggregation, our data suggest that MST-188 addresses cell adhesion and platelet activation, reduces hemolysis, lowers blood viscosity, and limits reperfusion injury following restoration of blood flow.”
He and his colleagues at Mast Therapeutics are planning additional studies of MST-188 in SCD. The agent is currently under investigation in a phase 3 trial. ![]()
Patient Flow Composite Measurement
Patient flow refers to the management and movement of patients in a healthcare facility. Healthcare institutions utilize patient flow analyses to evaluate and improve aspects of the patient experience including safety, effectiveness, efficiency, timeliness, patient centeredness, and equity.[1, 2, 3, 4, 5, 6, 7, 8] Hospitals can evaluate patient flow using specific metrics, such as time in emergency department (ED) or percent of discharges completed by a certain time of day. However, no single metric can represent the full spectrum of processes inherent to patient flow. For example, ED length of stay (LOS) is dependent on inpatient occupancy, which is dependent on discharge timeliness. Each of these activities depends on various smaller activities, such as cleaning rooms or identifying available beds.
Evaluating the quality that healthcare organizations deliver is growing in importance.[9] Composite scores are being used increasingly to assess clinical processes and outcomes for professionals and institutions.[10, 11] Where various aspects of performance coexist, composite measures can incorporate multiple metrics into a comprehensive summary.[12, 13, 14, 15, 16] They also allow organizations to track a range of metrics for more holistic, comprehensive evaluations.[9, 13]
This article describes a balanced scorecard with composite scoring used at a large urban children's hospital to evaluate patient flow and direct improvement resources where they are needed most.
METHODS
The Children's Hospital of Philadelphia identified patient flow improvement as an operating plan initiative. Previously, performance was measured with a series of independent measures including time from ED arrival to transfer to the inpatient floor, and time from discharge order to room vacancy. These metrics were dismissed as sole measures of flow because they did not reflect the complexity and interdependence of processes or improvement efforts. There were also concerns that efforts to improve a measure caused unintended consequences for others, which at best lead to little overall improvement, and at worst reduced performance elsewhere in the value chain. For example, to meet a goal time for entering discharge orders, physicians could enter orders earlier. But, if patients were not actually ready to leave, their beds were not made available any earlier. Similarly, bed management staff could rush to meet a goal for speed of unit assignment, but this could cause an increase in patients admitted to the wrong specialty floor.
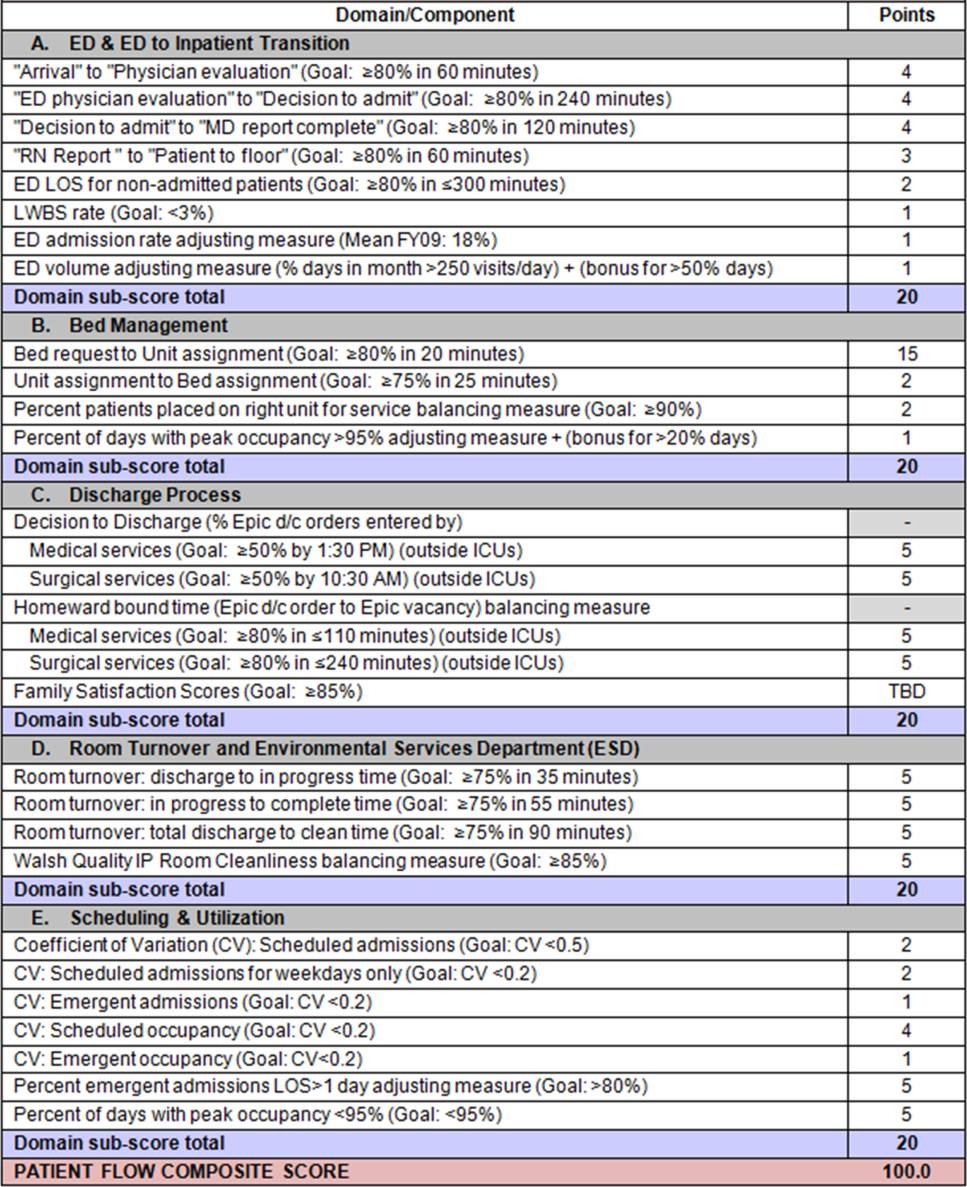
To address these concerns, a group of physicians, nurses, quality improvement specialists, and researchers designed a patient flow scorecard with composite measurement. Five domains of patient flow were identified: (1) ED and ED‐to‐inpatient transition, (2) bed management, (3) discharge process, (4) room turnover and environmental services department (ESD) activities, and (5) scheduling and utilization. Component measures for each domain were selected for 1 of 3 purposes: (1) to correspond to processes of importance to flow and improvement work, (2) to act as adjusters for factors that affect performance, or (3) to act as balancing measures so that progress in a measure would not result in the degradation of another. Each domain was assigned 20 points, which were distributed across the domain's components based on a consensus of the component's relative importance to overall domain performance (Figure 1). Data from the previous year were used as guidelines for setting performance percentile goals. For example, a goal of 80% in 60 minutes for arrival to physician evaluation meant that 80% of patients should see a physician within 1 hour of arriving at the ED.
Scores were also categorized to correspond to commonly used color descriptors.[17] For each component measure, performance meeting or exceeding the goal fell into the green category. Performances <10 percentage points below the goal fell into the yellow category, and performances below that level fell into the red category. Domain‐level scores and overall composite scores were also assigned colors. Performance at or above 80% (16 on the 20‐point domain scale, or 80 on the 100‐point overall scale) were designated green, scores between 70% and 79% were yellow, and scores below 70% were red.
DOMAINS OF THE PATIENT FLOW COMPOSITE SCORE
ED and ED‐to‐Inpatient Transition
Patient progression from the ED to an inpatient unit was separated into 4 steps (Figure 1A): (1) arrival to physician evaluation, (2) ED physician evaluation to decision to admit, (3) decision to admit to medical doctor (MD) report complete, and (4) registered nurse (RN) report to patient to floor. Four additional metrics included: (5) ED LOS for nonadmitted patients, (6) leaving without being seen (LWBS) rate, (7) ED admission rate, and (8) ED volume.
Arrival to physician evaluation measures time between patient arrival in the ED and self‐assignment by the first doctor or nurse practitioner in the electronic record, with a goal of 80% of patients seen within 60 minutes. The component score is calculated as percent of patients meeting this goal (ie, seen within 60 minutes) component weight. ED physician evaluation to decision to admit measures time from the start of the physician evaluation to the decision to admit, using bed request as a proxy; the goal was 80% within 4 hours. Decision to admit to MD report complete measures time from bed request to patient sign‐out to the inpatient floor, with a goal of 80% within 2 hours. RN report to patient to floor measures time from sign‐out to the patient leaving the ED, with a goal of 80% within 1 hour. ED LOS for nonadmitted patients measures time in the ED for patients who are not admitted, and the goal was 80% in <5 hours. The domain also tracks the LWBS rate, with a goal of keeping it below 3%. Its component score is calculated as percent patients seen component weight. ED admission rate is an adjusting factor for the severity of patients visiting the ED. Its component score is calculated as (percent of patients visiting the ED who are admitted to the hospital 5) component weight. Because the average admission rate is around 20%, the percent admitted is multiplied by 5 to more effectively adjust for high‐severity patients. ED volume is an adjusting factor that accounts for high volume. Its component score is calculated as percent of days in a month with more than 250 visits (a threshold chosen by the ED team) component weight. If these days exceed 50%, that percent would be added to the component score as an additional adjustment for excessive volume.
Bed Management
The bed management domain measures how efficiently and effectively patients are assigned to units and beds using 4 metrics (Figure 1B): (1) bed request to unit assignment, (2) unit assignment to bed assignment, (3) percentage of patients placed on right unit for service, and (4) percent of days with peak occupancy >95%.
Bed request to unit assignment measures time from the ED request for a bed in the electronic system to patient being assigned to a unit, with a goal of 80% of assignments made within 20 minutes. Unit assignment to bed assignment measures time from unit assignment to bed assignment, with a goal of 75% within 25 minutes. Because this goal was set to 75% rather than 80%, this component score was multiplied by 80/75 so that all component scores could be compared on the same scale. Percentage of patients placed on right unit for service is a balancing measure for speed of assignment. Because the goal was set to 90% rather than 80%, this component score was also multiplied by an adjusting factor (80/90) so that all components could be compared on the same scale. Percent of days with peak occupancy >95% is an adjusting measure that reflects that locating an appropriate bed takes longer when the hospital is approaching full occupancy. Its component score is calculated as (percent of days with peak occupancy >95% + 1) component weight. The was added to more effectively adjust for high occupancy. If more than 20% of days had peak occupancy greater than 95%, that percent would be added to the component score as an additional adjustment for excessive capacity.
Discharge Process
The discharge process domain measures the efficiency of patient discharge using 2 metrics (Figure 1C): (1) decision to discharge and (2) homeward bound time.
Decision to discharge tracks when clinicians enter electronic discharge orders. The goal was 50% by 1:30 pm for medical services and 10:30 am for surgical services. This encourages physicians to enter discharge orders early to enable downstream discharge work to begin. The component score is calculated as percent entered by goal time component weight (80/50) to adjust the 50% goal up to 80% so all component scores could be compared on the same scale. Homeward bound time measures the time between the discharge order and room vacancy as entered by the unit clerk, with a goal of 80% of patients leaving within 110 minutes for medical services and 240 minutes for surgical services. This balancing measure captures the fact that entering discharge orders early does not facilitate flow if the patients do not actually leave the hospital.
Room Turnover and Environmental Services Department
The room turnover and ESD domain measures the quality of the room turnover processes using 4 metrics (Figure 1D): (1) discharge to in progress time, (2) in progress to complete time, (3) total discharge to clean time, and (4) room cleanliness.
Discharge to in progress time measures time from patient vacancy until ESD staff enters the room, with a goal of 75% within 35 minutes. Because the goal was set to 75% rather than 80%, this component score was multiplied by 80/75 so all component scores could be compared on the same scale. In progress to complete time measures time as entered in the electronic health record from ESD staff entering the room to the room being clean, with a goal of 75% within 55 minutes. The component score is calculated identically to the previous metric. Total discharge to clean time measures the length of the total process, with a goal of 75% within 90 minutes. This component score was also multiplied by 80/75 so that all component scores could be compared on the same scale. Although this repeats the first 2 measures, given workflow and interface issues with our electronic health record (Epic, Epic Systems Corporation, Verona Wisconsin), it is necessary to include a total end‐to‐end measure in addition to the subparts. Patient and family ratings of room cleanliness serve as balancing measures, with the component score calculated as percent satisfaction component weight (80/85) to adjust the 85% satisfaction goal to 80% so all component scores could be compared on the same scale.
Scheduling and Utilization
The scheduling and utilization domain measures hospital operations and variations in bed utilization using 7 metrics including (Figure 1E): (1) coefficient of variation (CV): scheduled admissions, (2) CV: scheduled admissions for weekdays only, (3) CV: emergent admissions, (4) CV: scheduled occupancy, (5) CV: emergent occupancy, (6) percent emergent admissions with LOS >1 day, and (7) percent of days with peak occupancy <95%.
The CV, standard deviation divided by the mean of a distribution, is a measure of dispersion. Because it is a normalized value reported as a percentage, CV can be used to compare variability when sample sizes differ. CV: scheduled admissions captures the variability in admissions coded as an elective across all days in a month. The raw CV score is the standard deviation of the elective admissions for each day divided by the mean. The component score is (1 CV) component weight. A higher CV indicates greater variability, and yields a lower component score. CV on scheduled and emergent occupancy is derived from peak daily occupancy. Percent emergent admissions with LOS >1 day captures the efficiency of bed use, because high volumes of short‐stay patients increases turnover work. Its component score is calculated as the percent of emergent admissions in a month with LOS >1 day component weight. Percent of days with peak occupancy <95% incentivizes the hospital to avoid full occupancy, because effective flow requires that some beds remain open.[18, 19] Its component score is calculated as the percent of days in the month with peak occupancy <95% component weight. Although a similar measure, percent of days with peak occupancy >95%, was an adjusting factor in the bed management domain, it is included again here, because this factor has a unique effect on both domains.
RESULTS
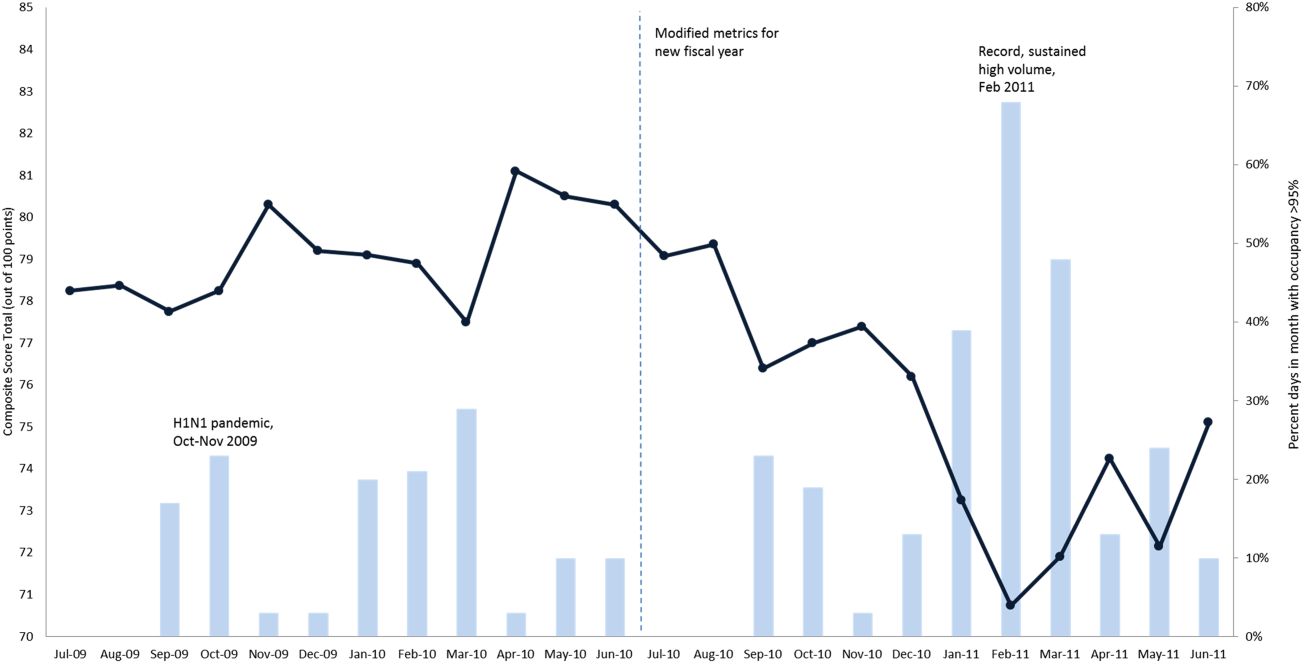
The balanced scorecard with composite measures provided improvement teams and administrators with a picture of patient flow (Figure 2). The overall score provided a global perspective on patient flow over time and captured trends in performance during various states of hospital occupancy. One trend that it captured was an association between high volume and poor composite scores (Figure 3). Notably, the H1N1 influenza pandemic in the fall of 2009 and the turnover of computer systems in January 2011 can be linked to dips in performance. The changes between fiscal years reflect a shift in baseline metrics.
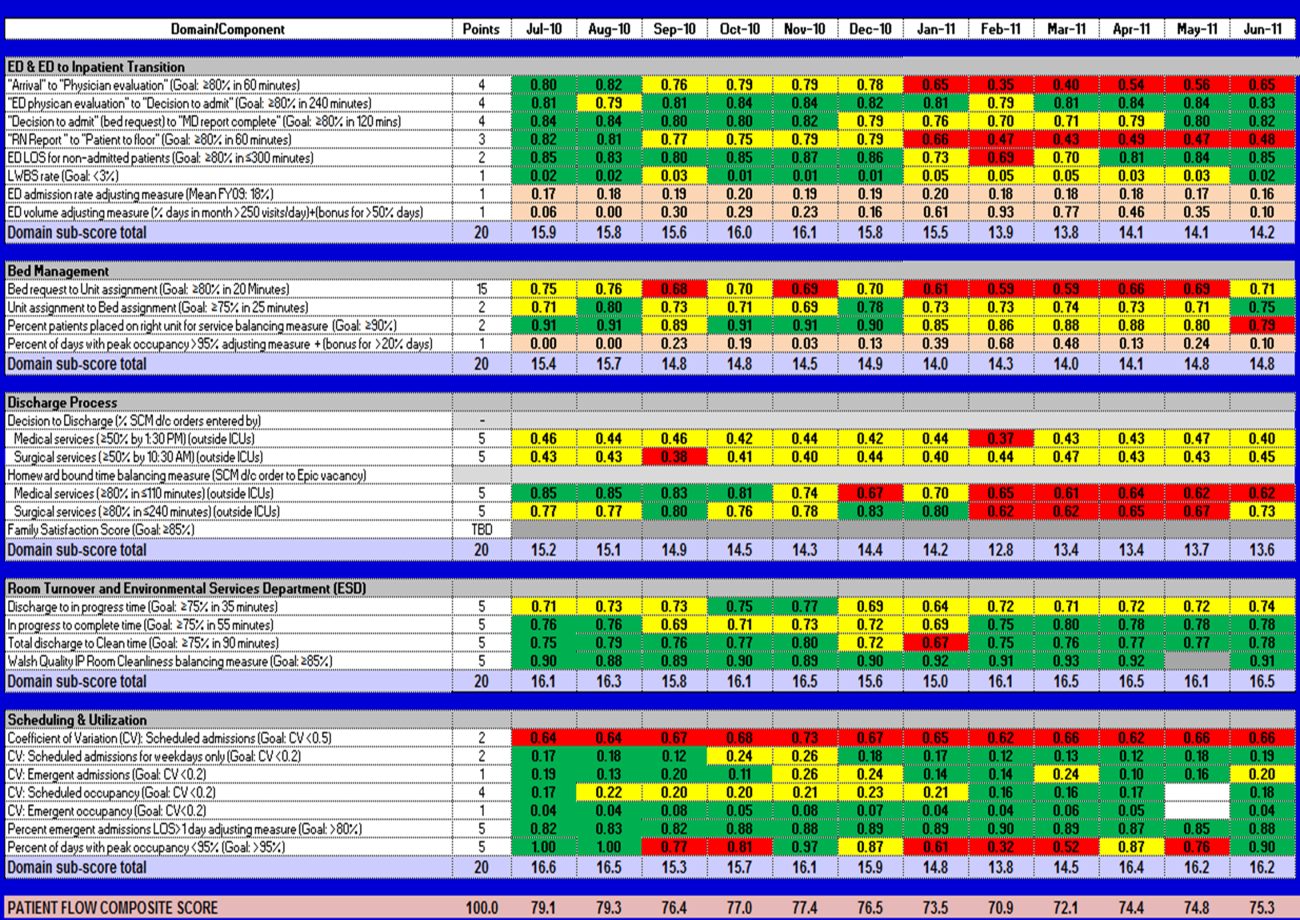
In addition to the overall composite score, the domain level and individual component scores allowed for more specific evaluation of variables affecting quality of care and enabled targeted improvement activities (Figure 4). For example, in December 2010 and January 2011, room turnover and ESD domain scores dropped, especially in the total discharge to clean time component. In response, the ESD made staffing adjustments, and starting in February 2011, component scores and the domain score improved. Feedback from the scheduling and utilization domain scores also initiated positive change. In August 2010, the CV: scheduled occupancy component score started to drop. In response, certain elective admissions were shifted to weekends to distribute hospital occupancy more evenly throughout the week. By February 2011, the component returned to its goal level. This continual evaluation of performance motivates continual improvement.
DISCUSSION
The use of a patient flow balanced scorecard with composite measurement overcomes pitfalls associated with a single or unaggregated measure. Aggregate scores alone mask important differences and relationships among components.[13] For example, 2 domains may be inversely related, or a provider with an overall average score might score above average in 1 domain but below in another. The composite scorecard, however, shows individual component and domain scores in addition to an aggregate score. The individual component and domain level scores highlight specific areas that need improvement and allow attention to be directed to those areas.
Additionally, a composite score is more likely to engage the range of staff involved in patient flow. Scaling out of 100 points and the red‐yellow‐green model are familiar for operations performance and can be easily understood.[17] Moreover, a composite score allows for dynamic performance goals while maintaining a stable measurement structure. For example, standardized LOS ratios, readmission rates, and denied hospital days can be added to the scorecard to provide more information and balancing measures.
Although balanced scorecards with composites can make holistic performance visible across multiple operational domains, they have some disadvantages. First, because there is a degree of complexity associated with a measure that incorporates multiple aspects of flow, certain elements, such as the relationship between a metric and its balancing measure, may not be readily apparent. Second, composite measures may not provide actionable information if the measure is not clearly related to a process that can be improved.[13, 14] Third, individual metrics may not be replicable between locations, so composites may need to be individualized to each setting.[10, 20]
Improving patient flow is a goal at many hospitals. Although measurement is crucial to identifying and mitigating variations, measuring the multidimensional aspects of flow and their impact on quality is difficult. Our scorecard, with composite measurement, addresses the need for an improved method to assess patient flow and improve quality by tracking care processes simultaneously.
Acknowledgements
The authors thank Bhuvaneswari Jayaraman for her contributions to the original calculations for the first version of the composite score.
Disclosures: Internal funds from The Children's Hospital of Philadelphia supported the conduct of this work. The authors report no conflicts of interest.
- AHA Solutions. Patient Flow Challenges Assessment 2009. Chicago, IL: American Hospital Association; 2009.
- , , , et al. The impact of emergency department crowding measures on time to antibiotics for patients with community‐acquired pneumonia. Ann Emerg Med. 2007;50(5):510–516.
- . Practice variation: implications for our health care system. Manag Care. 2004;13(9 suppl):3–7.
- . Managing variability in patient flow is the key to improving access to care, nursing staffing, quality of care, and reducing its cost. Paper presented at: Institute of Medicine; June 24, 2004; Washington, DC.
- , , . Developing models for patient flow and daily surge capacity research. Acad Emerg Med. 2006;13(11):1109–1113.
- , , , , . Patient flow variability and unplanned readmissions to an intensive care unit. Crit Care Med. 2009;37(11):2882–2887.
- , , , , , . Scheduled admissions and high occupancy at a children's hospital. J Hosp Med. 2011;6(2):81–87.
- , , . Frequent overcrowding in US emergency departments. Acad Emerg Med. 2001;8(2):151–155.
- Institute of Medicine. Performance measurement: accelerating improvement. Available at: http://www.iom.edu/Reports/2005/Performance‐Measurement‐Accelerating‐Improvement.aspx. Published December 1, 2005. Accessed December 5, 2012.
- , , , . Emergency department performance measures and benchmarking summit. Acad Emerg Med. 2006;13(10):1074–1080.
- . The Surgical Infection Prevention and Surgical Care Improvement Projects: promises and pitfalls. Am Surg. 2006;72(11):1010–1016; discussion 1021–1030, 1133–1048.
- , , . Patient safety quality indicators. Composite measures workgroup. Final report. Rockville, MD; Agency for Healthcare Research and Quality; 2008.
- , , , et al. ACCF/AHA 2010 position statement on composite measures for healthcare performance assessment: a report of the American College of Cardiology Foundation/American Heart Association Task Force on performance measures (Writing Committee to develop a position statement on composite measures). Circulation. 2010;121(15):1780–1791.
- , . A five‐point checklist to help performance reports incentivize improvement and effectively guide patients. Health Aff (Millwood). 2012;31(3):612–618.
- , , , , . Composite measures for profiling hospitals on surgical morbidity. Ann Surg. 2013;257(1):67–72.
- , . All‐or‐none measurement raises the bar on performance. JAMA. 2006;295(10):1168–1170.
- , , , et al. Quality improvement. Red light‐green light: from kids' game to discharge tool. Healthc Q. 2011;14:77–81.
- , , , . Myths of ideal hospital occupancy. Med J Aust. 2010;192(1):42–43.
- , . Emergency department overcrowding in the United States: an emerging threat to patient safety and public health. Emerg Med J. 2003;20(5):402–405.
- , , , . Emergency department crowding: consensus development of potential measures. Ann Emerg Med. 2003;42(6):824–834.
Patient flow refers to the management and movement of patients in a healthcare facility. Healthcare institutions utilize patient flow analyses to evaluate and improve aspects of the patient experience including safety, effectiveness, efficiency, timeliness, patient centeredness, and equity.[1, 2, 3, 4, 5, 6, 7, 8] Hospitals can evaluate patient flow using specific metrics, such as time in emergency department (ED) or percent of discharges completed by a certain time of day. However, no single metric can represent the full spectrum of processes inherent to patient flow. For example, ED length of stay (LOS) is dependent on inpatient occupancy, which is dependent on discharge timeliness. Each of these activities depends on various smaller activities, such as cleaning rooms or identifying available beds.
Evaluating the quality that healthcare organizations deliver is growing in importance.[9] Composite scores are being used increasingly to assess clinical processes and outcomes for professionals and institutions.[10, 11] Where various aspects of performance coexist, composite measures can incorporate multiple metrics into a comprehensive summary.[12, 13, 14, 15, 16] They also allow organizations to track a range of metrics for more holistic, comprehensive evaluations.[9, 13]
This article describes a balanced scorecard with composite scoring used at a large urban children's hospital to evaluate patient flow and direct improvement resources where they are needed most.
METHODS
The Children's Hospital of Philadelphia identified patient flow improvement as an operating plan initiative. Previously, performance was measured with a series of independent measures including time from ED arrival to transfer to the inpatient floor, and time from discharge order to room vacancy. These metrics were dismissed as sole measures of flow because they did not reflect the complexity and interdependence of processes or improvement efforts. There were also concerns that efforts to improve a measure caused unintended consequences for others, which at best lead to little overall improvement, and at worst reduced performance elsewhere in the value chain. For example, to meet a goal time for entering discharge orders, physicians could enter orders earlier. But, if patients were not actually ready to leave, their beds were not made available any earlier. Similarly, bed management staff could rush to meet a goal for speed of unit assignment, but this could cause an increase in patients admitted to the wrong specialty floor.
To address these concerns, a group of physicians, nurses, quality improvement specialists, and researchers designed a patient flow scorecard with composite measurement. Five domains of patient flow were identified: (1) ED and ED‐to‐inpatient transition, (2) bed management, (3) discharge process, (4) room turnover and environmental services department (ESD) activities, and (5) scheduling and utilization. Component measures for each domain were selected for 1 of 3 purposes: (1) to correspond to processes of importance to flow and improvement work, (2) to act as adjusters for factors that affect performance, or (3) to act as balancing measures so that progress in a measure would not result in the degradation of another. Each domain was assigned 20 points, which were distributed across the domain's components based on a consensus of the component's relative importance to overall domain performance (Figure 1). Data from the previous year were used as guidelines for setting performance percentile goals. For example, a goal of 80% in 60 minutes for arrival to physician evaluation meant that 80% of patients should see a physician within 1 hour of arriving at the ED.
Scores were also categorized to correspond to commonly used color descriptors.[17] For each component measure, performance meeting or exceeding the goal fell into the green category. Performances <10 percentage points below the goal fell into the yellow category, and performances below that level fell into the red category. Domain‐level scores and overall composite scores were also assigned colors. Performance at or above 80% (16 on the 20‐point domain scale, or 80 on the 100‐point overall scale) were designated green, scores between 70% and 79% were yellow, and scores below 70% were red.
DOMAINS OF THE PATIENT FLOW COMPOSITE SCORE
ED and ED‐to‐Inpatient Transition
Patient progression from the ED to an inpatient unit was separated into 4 steps (Figure 1A): (1) arrival to physician evaluation, (2) ED physician evaluation to decision to admit, (3) decision to admit to medical doctor (MD) report complete, and (4) registered nurse (RN) report to patient to floor. Four additional metrics included: (5) ED LOS for nonadmitted patients, (6) leaving without being seen (LWBS) rate, (7) ED admission rate, and (8) ED volume.
Arrival to physician evaluation measures time between patient arrival in the ED and self‐assignment by the first doctor or nurse practitioner in the electronic record, with a goal of 80% of patients seen within 60 minutes. The component score is calculated as percent of patients meeting this goal (ie, seen within 60 minutes) component weight. ED physician evaluation to decision to admit measures time from the start of the physician evaluation to the decision to admit, using bed request as a proxy; the goal was 80% within 4 hours. Decision to admit to MD report complete measures time from bed request to patient sign‐out to the inpatient floor, with a goal of 80% within 2 hours. RN report to patient to floor measures time from sign‐out to the patient leaving the ED, with a goal of 80% within 1 hour. ED LOS for nonadmitted patients measures time in the ED for patients who are not admitted, and the goal was 80% in <5 hours. The domain also tracks the LWBS rate, with a goal of keeping it below 3%. Its component score is calculated as percent patients seen component weight. ED admission rate is an adjusting factor for the severity of patients visiting the ED. Its component score is calculated as (percent of patients visiting the ED who are admitted to the hospital 5) component weight. Because the average admission rate is around 20%, the percent admitted is multiplied by 5 to more effectively adjust for high‐severity patients. ED volume is an adjusting factor that accounts for high volume. Its component score is calculated as percent of days in a month with more than 250 visits (a threshold chosen by the ED team) component weight. If these days exceed 50%, that percent would be added to the component score as an additional adjustment for excessive volume.
Bed Management
The bed management domain measures how efficiently and effectively patients are assigned to units and beds using 4 metrics (Figure 1B): (1) bed request to unit assignment, (2) unit assignment to bed assignment, (3) percentage of patients placed on right unit for service, and (4) percent of days with peak occupancy >95%.
Bed request to unit assignment measures time from the ED request for a bed in the electronic system to patient being assigned to a unit, with a goal of 80% of assignments made within 20 minutes. Unit assignment to bed assignment measures time from unit assignment to bed assignment, with a goal of 75% within 25 minutes. Because this goal was set to 75% rather than 80%, this component score was multiplied by 80/75 so that all component scores could be compared on the same scale. Percentage of patients placed on right unit for service is a balancing measure for speed of assignment. Because the goal was set to 90% rather than 80%, this component score was also multiplied by an adjusting factor (80/90) so that all components could be compared on the same scale. Percent of days with peak occupancy >95% is an adjusting measure that reflects that locating an appropriate bed takes longer when the hospital is approaching full occupancy. Its component score is calculated as (percent of days with peak occupancy >95% + 1) component weight. The was added to more effectively adjust for high occupancy. If more than 20% of days had peak occupancy greater than 95%, that percent would be added to the component score as an additional adjustment for excessive capacity.
Discharge Process
The discharge process domain measures the efficiency of patient discharge using 2 metrics (Figure 1C): (1) decision to discharge and (2) homeward bound time.
Decision to discharge tracks when clinicians enter electronic discharge orders. The goal was 50% by 1:30 pm for medical services and 10:30 am for surgical services. This encourages physicians to enter discharge orders early to enable downstream discharge work to begin. The component score is calculated as percent entered by goal time component weight (80/50) to adjust the 50% goal up to 80% so all component scores could be compared on the same scale. Homeward bound time measures the time between the discharge order and room vacancy as entered by the unit clerk, with a goal of 80% of patients leaving within 110 minutes for medical services and 240 minutes for surgical services. This balancing measure captures the fact that entering discharge orders early does not facilitate flow if the patients do not actually leave the hospital.
Room Turnover and Environmental Services Department
The room turnover and ESD domain measures the quality of the room turnover processes using 4 metrics (Figure 1D): (1) discharge to in progress time, (2) in progress to complete time, (3) total discharge to clean time, and (4) room cleanliness.
Discharge to in progress time measures time from patient vacancy until ESD staff enters the room, with a goal of 75% within 35 minutes. Because the goal was set to 75% rather than 80%, this component score was multiplied by 80/75 so all component scores could be compared on the same scale. In progress to complete time measures time as entered in the electronic health record from ESD staff entering the room to the room being clean, with a goal of 75% within 55 minutes. The component score is calculated identically to the previous metric. Total discharge to clean time measures the length of the total process, with a goal of 75% within 90 minutes. This component score was also multiplied by 80/75 so that all component scores could be compared on the same scale. Although this repeats the first 2 measures, given workflow and interface issues with our electronic health record (Epic, Epic Systems Corporation, Verona Wisconsin), it is necessary to include a total end‐to‐end measure in addition to the subparts. Patient and family ratings of room cleanliness serve as balancing measures, with the component score calculated as percent satisfaction component weight (80/85) to adjust the 85% satisfaction goal to 80% so all component scores could be compared on the same scale.
Scheduling and Utilization
The scheduling and utilization domain measures hospital operations and variations in bed utilization using 7 metrics including (Figure 1E): (1) coefficient of variation (CV): scheduled admissions, (2) CV: scheduled admissions for weekdays only, (3) CV: emergent admissions, (4) CV: scheduled occupancy, (5) CV: emergent occupancy, (6) percent emergent admissions with LOS >1 day, and (7) percent of days with peak occupancy <95%.
The CV, standard deviation divided by the mean of a distribution, is a measure of dispersion. Because it is a normalized value reported as a percentage, CV can be used to compare variability when sample sizes differ. CV: scheduled admissions captures the variability in admissions coded as an elective across all days in a month. The raw CV score is the standard deviation of the elective admissions for each day divided by the mean. The component score is (1 CV) component weight. A higher CV indicates greater variability, and yields a lower component score. CV on scheduled and emergent occupancy is derived from peak daily occupancy. Percent emergent admissions with LOS >1 day captures the efficiency of bed use, because high volumes of short‐stay patients increases turnover work. Its component score is calculated as the percent of emergent admissions in a month with LOS >1 day component weight. Percent of days with peak occupancy <95% incentivizes the hospital to avoid full occupancy, because effective flow requires that some beds remain open.[18, 19] Its component score is calculated as the percent of days in the month with peak occupancy <95% component weight. Although a similar measure, percent of days with peak occupancy >95%, was an adjusting factor in the bed management domain, it is included again here, because this factor has a unique effect on both domains.
RESULTS
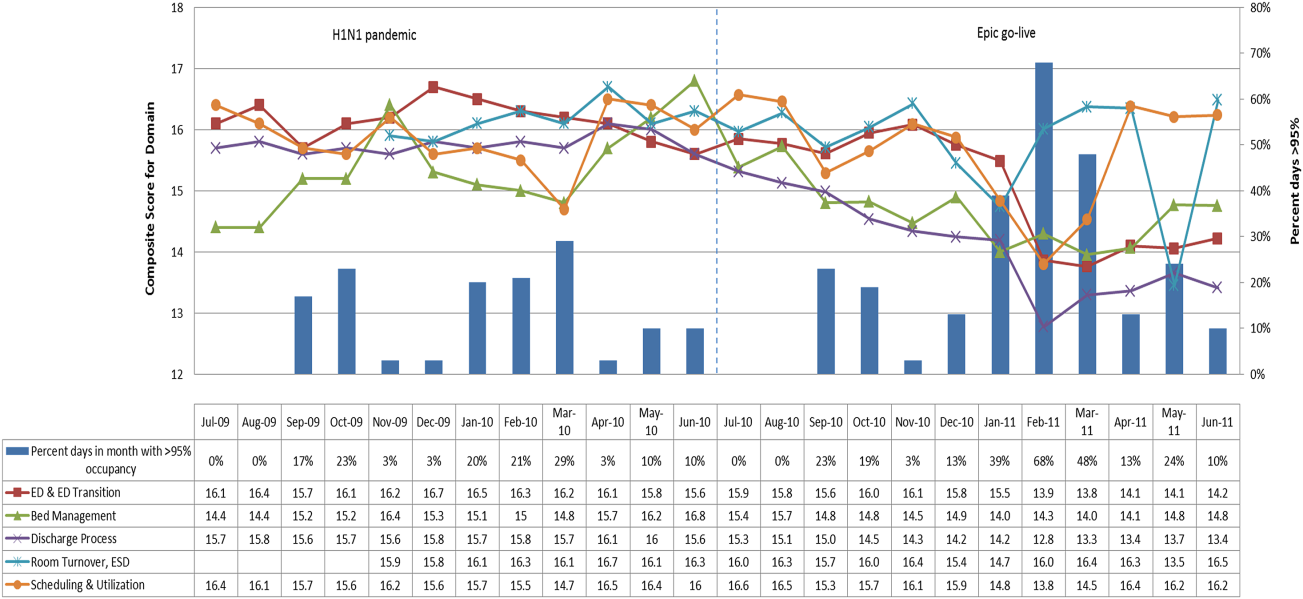
The balanced scorecard with composite measures provided improvement teams and administrators with a picture of patient flow (Figure 2). The overall score provided a global perspective on patient flow over time and captured trends in performance during various states of hospital occupancy. One trend that it captured was an association between high volume and poor composite scores (Figure 3). Notably, the H1N1 influenza pandemic in the fall of 2009 and the turnover of computer systems in January 2011 can be linked to dips in performance. The changes between fiscal years reflect a shift in baseline metrics.
In addition to the overall composite score, the domain level and individual component scores allowed for more specific evaluation of variables affecting quality of care and enabled targeted improvement activities (Figure 4). For example, in December 2010 and January 2011, room turnover and ESD domain scores dropped, especially in the total discharge to clean time component. In response, the ESD made staffing adjustments, and starting in February 2011, component scores and the domain score improved. Feedback from the scheduling and utilization domain scores also initiated positive change. In August 2010, the CV: scheduled occupancy component score started to drop. In response, certain elective admissions were shifted to weekends to distribute hospital occupancy more evenly throughout the week. By February 2011, the component returned to its goal level. This continual evaluation of performance motivates continual improvement.
DISCUSSION
The use of a patient flow balanced scorecard with composite measurement overcomes pitfalls associated with a single or unaggregated measure. Aggregate scores alone mask important differences and relationships among components.[13] For example, 2 domains may be inversely related, or a provider with an overall average score might score above average in 1 domain but below in another. The composite scorecard, however, shows individual component and domain scores in addition to an aggregate score. The individual component and domain level scores highlight specific areas that need improvement and allow attention to be directed to those areas.
Additionally, a composite score is more likely to engage the range of staff involved in patient flow. Scaling out of 100 points and the red‐yellow‐green model are familiar for operations performance and can be easily understood.[17] Moreover, a composite score allows for dynamic performance goals while maintaining a stable measurement structure. For example, standardized LOS ratios, readmission rates, and denied hospital days can be added to the scorecard to provide more information and balancing measures.
Although balanced scorecards with composites can make holistic performance visible across multiple operational domains, they have some disadvantages. First, because there is a degree of complexity associated with a measure that incorporates multiple aspects of flow, certain elements, such as the relationship between a metric and its balancing measure, may not be readily apparent. Second, composite measures may not provide actionable information if the measure is not clearly related to a process that can be improved.[13, 14] Third, individual metrics may not be replicable between locations, so composites may need to be individualized to each setting.[10, 20]
Improving patient flow is a goal at many hospitals. Although measurement is crucial to identifying and mitigating variations, measuring the multidimensional aspects of flow and their impact on quality is difficult. Our scorecard, with composite measurement, addresses the need for an improved method to assess patient flow and improve quality by tracking care processes simultaneously.
Acknowledgements
The authors thank Bhuvaneswari Jayaraman for her contributions to the original calculations for the first version of the composite score.
Disclosures: Internal funds from The Children's Hospital of Philadelphia supported the conduct of this work. The authors report no conflicts of interest.
Patient flow refers to the management and movement of patients in a healthcare facility. Healthcare institutions utilize patient flow analyses to evaluate and improve aspects of the patient experience including safety, effectiveness, efficiency, timeliness, patient centeredness, and equity.[1, 2, 3, 4, 5, 6, 7, 8] Hospitals can evaluate patient flow using specific metrics, such as time in emergency department (ED) or percent of discharges completed by a certain time of day. However, no single metric can represent the full spectrum of processes inherent to patient flow. For example, ED length of stay (LOS) is dependent on inpatient occupancy, which is dependent on discharge timeliness. Each of these activities depends on various smaller activities, such as cleaning rooms or identifying available beds.
Evaluating the quality that healthcare organizations deliver is growing in importance.[9] Composite scores are being used increasingly to assess clinical processes and outcomes for professionals and institutions.[10, 11] Where various aspects of performance coexist, composite measures can incorporate multiple metrics into a comprehensive summary.[12, 13, 14, 15, 16] They also allow organizations to track a range of metrics for more holistic, comprehensive evaluations.[9, 13]
This article describes a balanced scorecard with composite scoring used at a large urban children's hospital to evaluate patient flow and direct improvement resources where they are needed most.
METHODS
The Children's Hospital of Philadelphia identified patient flow improvement as an operating plan initiative. Previously, performance was measured with a series of independent measures including time from ED arrival to transfer to the inpatient floor, and time from discharge order to room vacancy. These metrics were dismissed as sole measures of flow because they did not reflect the complexity and interdependence of processes or improvement efforts. There were also concerns that efforts to improve a measure caused unintended consequences for others, which at best lead to little overall improvement, and at worst reduced performance elsewhere in the value chain. For example, to meet a goal time for entering discharge orders, physicians could enter orders earlier. But, if patients were not actually ready to leave, their beds were not made available any earlier. Similarly, bed management staff could rush to meet a goal for speed of unit assignment, but this could cause an increase in patients admitted to the wrong specialty floor.
To address these concerns, a group of physicians, nurses, quality improvement specialists, and researchers designed a patient flow scorecard with composite measurement. Five domains of patient flow were identified: (1) ED and ED‐to‐inpatient transition, (2) bed management, (3) discharge process, (4) room turnover and environmental services department (ESD) activities, and (5) scheduling and utilization. Component measures for each domain were selected for 1 of 3 purposes: (1) to correspond to processes of importance to flow and improvement work, (2) to act as adjusters for factors that affect performance, or (3) to act as balancing measures so that progress in a measure would not result in the degradation of another. Each domain was assigned 20 points, which were distributed across the domain's components based on a consensus of the component's relative importance to overall domain performance (Figure 1). Data from the previous year were used as guidelines for setting performance percentile goals. For example, a goal of 80% in 60 minutes for arrival to physician evaluation meant that 80% of patients should see a physician within 1 hour of arriving at the ED.
Scores were also categorized to correspond to commonly used color descriptors.[17] For each component measure, performance meeting or exceeding the goal fell into the green category. Performances <10 percentage points below the goal fell into the yellow category, and performances below that level fell into the red category. Domain‐level scores and overall composite scores were also assigned colors. Performance at or above 80% (16 on the 20‐point domain scale, or 80 on the 100‐point overall scale) were designated green, scores between 70% and 79% were yellow, and scores below 70% were red.
DOMAINS OF THE PATIENT FLOW COMPOSITE SCORE
ED and ED‐to‐Inpatient Transition
Patient progression from the ED to an inpatient unit was separated into 4 steps (Figure 1A): (1) arrival to physician evaluation, (2) ED physician evaluation to decision to admit, (3) decision to admit to medical doctor (MD) report complete, and (4) registered nurse (RN) report to patient to floor. Four additional metrics included: (5) ED LOS for nonadmitted patients, (6) leaving without being seen (LWBS) rate, (7) ED admission rate, and (8) ED volume.
Arrival to physician evaluation measures time between patient arrival in the ED and self‐assignment by the first doctor or nurse practitioner in the electronic record, with a goal of 80% of patients seen within 60 minutes. The component score is calculated as percent of patients meeting this goal (ie, seen within 60 minutes) component weight. ED physician evaluation to decision to admit measures time from the start of the physician evaluation to the decision to admit, using bed request as a proxy; the goal was 80% within 4 hours. Decision to admit to MD report complete measures time from bed request to patient sign‐out to the inpatient floor, with a goal of 80% within 2 hours. RN report to patient to floor measures time from sign‐out to the patient leaving the ED, with a goal of 80% within 1 hour. ED LOS for nonadmitted patients measures time in the ED for patients who are not admitted, and the goal was 80% in <5 hours. The domain also tracks the LWBS rate, with a goal of keeping it below 3%. Its component score is calculated as percent patients seen component weight. ED admission rate is an adjusting factor for the severity of patients visiting the ED. Its component score is calculated as (percent of patients visiting the ED who are admitted to the hospital 5) component weight. Because the average admission rate is around 20%, the percent admitted is multiplied by 5 to more effectively adjust for high‐severity patients. ED volume is an adjusting factor that accounts for high volume. Its component score is calculated as percent of days in a month with more than 250 visits (a threshold chosen by the ED team) component weight. If these days exceed 50%, that percent would be added to the component score as an additional adjustment for excessive volume.
Bed Management
The bed management domain measures how efficiently and effectively patients are assigned to units and beds using 4 metrics (Figure 1B): (1) bed request to unit assignment, (2) unit assignment to bed assignment, (3) percentage of patients placed on right unit for service, and (4) percent of days with peak occupancy >95%.
Bed request to unit assignment measures time from the ED request for a bed in the electronic system to patient being assigned to a unit, with a goal of 80% of assignments made within 20 minutes. Unit assignment to bed assignment measures time from unit assignment to bed assignment, with a goal of 75% within 25 minutes. Because this goal was set to 75% rather than 80%, this component score was multiplied by 80/75 so that all component scores could be compared on the same scale. Percentage of patients placed on right unit for service is a balancing measure for speed of assignment. Because the goal was set to 90% rather than 80%, this component score was also multiplied by an adjusting factor (80/90) so that all components could be compared on the same scale. Percent of days with peak occupancy >95% is an adjusting measure that reflects that locating an appropriate bed takes longer when the hospital is approaching full occupancy. Its component score is calculated as (percent of days with peak occupancy >95% + 1) component weight. The was added to more effectively adjust for high occupancy. If more than 20% of days had peak occupancy greater than 95%, that percent would be added to the component score as an additional adjustment for excessive capacity.
Discharge Process
The discharge process domain measures the efficiency of patient discharge using 2 metrics (Figure 1C): (1) decision to discharge and (2) homeward bound time.
Decision to discharge tracks when clinicians enter electronic discharge orders. The goal was 50% by 1:30 pm for medical services and 10:30 am for surgical services. This encourages physicians to enter discharge orders early to enable downstream discharge work to begin. The component score is calculated as percent entered by goal time component weight (80/50) to adjust the 50% goal up to 80% so all component scores could be compared on the same scale. Homeward bound time measures the time between the discharge order and room vacancy as entered by the unit clerk, with a goal of 80% of patients leaving within 110 minutes for medical services and 240 minutes for surgical services. This balancing measure captures the fact that entering discharge orders early does not facilitate flow if the patients do not actually leave the hospital.
Room Turnover and Environmental Services Department
The room turnover and ESD domain measures the quality of the room turnover processes using 4 metrics (Figure 1D): (1) discharge to in progress time, (2) in progress to complete time, (3) total discharge to clean time, and (4) room cleanliness.
Discharge to in progress time measures time from patient vacancy until ESD staff enters the room, with a goal of 75% within 35 minutes. Because the goal was set to 75% rather than 80%, this component score was multiplied by 80/75 so all component scores could be compared on the same scale. In progress to complete time measures time as entered in the electronic health record from ESD staff entering the room to the room being clean, with a goal of 75% within 55 minutes. The component score is calculated identically to the previous metric. Total discharge to clean time measures the length of the total process, with a goal of 75% within 90 minutes. This component score was also multiplied by 80/75 so that all component scores could be compared on the same scale. Although this repeats the first 2 measures, given workflow and interface issues with our electronic health record (Epic, Epic Systems Corporation, Verona Wisconsin), it is necessary to include a total end‐to‐end measure in addition to the subparts. Patient and family ratings of room cleanliness serve as balancing measures, with the component score calculated as percent satisfaction component weight (80/85) to adjust the 85% satisfaction goal to 80% so all component scores could be compared on the same scale.
Scheduling and Utilization
The scheduling and utilization domain measures hospital operations and variations in bed utilization using 7 metrics including (Figure 1E): (1) coefficient of variation (CV): scheduled admissions, (2) CV: scheduled admissions for weekdays only, (3) CV: emergent admissions, (4) CV: scheduled occupancy, (5) CV: emergent occupancy, (6) percent emergent admissions with LOS >1 day, and (7) percent of days with peak occupancy <95%.
The CV, standard deviation divided by the mean of a distribution, is a measure of dispersion. Because it is a normalized value reported as a percentage, CV can be used to compare variability when sample sizes differ. CV: scheduled admissions captures the variability in admissions coded as an elective across all days in a month. The raw CV score is the standard deviation of the elective admissions for each day divided by the mean. The component score is (1 CV) component weight. A higher CV indicates greater variability, and yields a lower component score. CV on scheduled and emergent occupancy is derived from peak daily occupancy. Percent emergent admissions with LOS >1 day captures the efficiency of bed use, because high volumes of short‐stay patients increases turnover work. Its component score is calculated as the percent of emergent admissions in a month with LOS >1 day component weight. Percent of days with peak occupancy <95% incentivizes the hospital to avoid full occupancy, because effective flow requires that some beds remain open.[18, 19] Its component score is calculated as the percent of days in the month with peak occupancy <95% component weight. Although a similar measure, percent of days with peak occupancy >95%, was an adjusting factor in the bed management domain, it is included again here, because this factor has a unique effect on both domains.
RESULTS
The balanced scorecard with composite measures provided improvement teams and administrators with a picture of patient flow (Figure 2). The overall score provided a global perspective on patient flow over time and captured trends in performance during various states of hospital occupancy. One trend that it captured was an association between high volume and poor composite scores (Figure 3). Notably, the H1N1 influenza pandemic in the fall of 2009 and the turnover of computer systems in January 2011 can be linked to dips in performance. The changes between fiscal years reflect a shift in baseline metrics.
In addition to the overall composite score, the domain level and individual component scores allowed for more specific evaluation of variables affecting quality of care and enabled targeted improvement activities (Figure 4). For example, in December 2010 and January 2011, room turnover and ESD domain scores dropped, especially in the total discharge to clean time component. In response, the ESD made staffing adjustments, and starting in February 2011, component scores and the domain score improved. Feedback from the scheduling and utilization domain scores also initiated positive change. In August 2010, the CV: scheduled occupancy component score started to drop. In response, certain elective admissions were shifted to weekends to distribute hospital occupancy more evenly throughout the week. By February 2011, the component returned to its goal level. This continual evaluation of performance motivates continual improvement.
DISCUSSION
The use of a patient flow balanced scorecard with composite measurement overcomes pitfalls associated with a single or unaggregated measure. Aggregate scores alone mask important differences and relationships among components.[13] For example, 2 domains may be inversely related, or a provider with an overall average score might score above average in 1 domain but below in another. The composite scorecard, however, shows individual component and domain scores in addition to an aggregate score. The individual component and domain level scores highlight specific areas that need improvement and allow attention to be directed to those areas.
Additionally, a composite score is more likely to engage the range of staff involved in patient flow. Scaling out of 100 points and the red‐yellow‐green model are familiar for operations performance and can be easily understood.[17] Moreover, a composite score allows for dynamic performance goals while maintaining a stable measurement structure. For example, standardized LOS ratios, readmission rates, and denied hospital days can be added to the scorecard to provide more information and balancing measures.
Although balanced scorecards with composites can make holistic performance visible across multiple operational domains, they have some disadvantages. First, because there is a degree of complexity associated with a measure that incorporates multiple aspects of flow, certain elements, such as the relationship between a metric and its balancing measure, may not be readily apparent. Second, composite measures may not provide actionable information if the measure is not clearly related to a process that can be improved.[13, 14] Third, individual metrics may not be replicable between locations, so composites may need to be individualized to each setting.[10, 20]
Improving patient flow is a goal at many hospitals. Although measurement is crucial to identifying and mitigating variations, measuring the multidimensional aspects of flow and their impact on quality is difficult. Our scorecard, with composite measurement, addresses the need for an improved method to assess patient flow and improve quality by tracking care processes simultaneously.
Acknowledgements
The authors thank Bhuvaneswari Jayaraman for her contributions to the original calculations for the first version of the composite score.
Disclosures: Internal funds from The Children's Hospital of Philadelphia supported the conduct of this work. The authors report no conflicts of interest.
- AHA Solutions. Patient Flow Challenges Assessment 2009. Chicago, IL: American Hospital Association; 2009.
- , , , et al. The impact of emergency department crowding measures on time to antibiotics for patients with community‐acquired pneumonia. Ann Emerg Med. 2007;50(5):510–516.
- . Practice variation: implications for our health care system. Manag Care. 2004;13(9 suppl):3–7.
- . Managing variability in patient flow is the key to improving access to care, nursing staffing, quality of care, and reducing its cost. Paper presented at: Institute of Medicine; June 24, 2004; Washington, DC.
- , , . Developing models for patient flow and daily surge capacity research. Acad Emerg Med. 2006;13(11):1109–1113.
- , , , , . Patient flow variability and unplanned readmissions to an intensive care unit. Crit Care Med. 2009;37(11):2882–2887.
- , , , , , . Scheduled admissions and high occupancy at a children's hospital. J Hosp Med. 2011;6(2):81–87.
- , , . Frequent overcrowding in US emergency departments. Acad Emerg Med. 2001;8(2):151–155.
- Institute of Medicine. Performance measurement: accelerating improvement. Available at: http://www.iom.edu/Reports/2005/Performance‐Measurement‐Accelerating‐Improvement.aspx. Published December 1, 2005. Accessed December 5, 2012.
- , , , . Emergency department performance measures and benchmarking summit. Acad Emerg Med. 2006;13(10):1074–1080.
- . The Surgical Infection Prevention and Surgical Care Improvement Projects: promises and pitfalls. Am Surg. 2006;72(11):1010–1016; discussion 1021–1030, 1133–1048.
- , , . Patient safety quality indicators. Composite measures workgroup. Final report. Rockville, MD; Agency for Healthcare Research and Quality; 2008.
- , , , et al. ACCF/AHA 2010 position statement on composite measures for healthcare performance assessment: a report of the American College of Cardiology Foundation/American Heart Association Task Force on performance measures (Writing Committee to develop a position statement on composite measures). Circulation. 2010;121(15):1780–1791.
- , . A five‐point checklist to help performance reports incentivize improvement and effectively guide patients. Health Aff (Millwood). 2012;31(3):612–618.
- , , , , . Composite measures for profiling hospitals on surgical morbidity. Ann Surg. 2013;257(1):67–72.
- , . All‐or‐none measurement raises the bar on performance. JAMA. 2006;295(10):1168–1170.
- , , , et al. Quality improvement. Red light‐green light: from kids' game to discharge tool. Healthc Q. 2011;14:77–81.
- , , , . Myths of ideal hospital occupancy. Med J Aust. 2010;192(1):42–43.
- , . Emergency department overcrowding in the United States: an emerging threat to patient safety and public health. Emerg Med J. 2003;20(5):402–405.
- , , , . Emergency department crowding: consensus development of potential measures. Ann Emerg Med. 2003;42(6):824–834.

FDA discourages use of laparoscopic power morcellation during hysterectomy and myomectomy
On April 17, 2014, the US Food and Drug Administration (FDA) issued a Safety Communication discouraging the use of laparoscopic power morcellation in hysterectomy and myomectomy for uterine fibroids.
Based on an FDA analysis of current data, “… it is estimated that 1 in 350 women undergoing hysterectomy or myomectomy for the treatment of fibroids is found to have an unsuspected uterine sarcoma, a type of uterine cancer that includes leiomyosarcoma. If laparoscopic power morcellation is performed in women with unsuspected uterine sarcoma, there is a risk that the procedure will spread the cancerous tissue within the abdomen and pelvis, significantly worsening the patient’s likelihood of long-term survival.”1
FDA recommendations
The FDA posted the following recommendations for health-care providers1:
- Laparoscopic uterine power morcellation should not be used in women with suspected or known uterine cancer
- All available treatment options should be considered for women with symptomatic uterine fibroids
- The benefits and risks of all treatments should be discussed thoroughly with each patient
- If, after a careful benefit-risk evaluation, laparoscopic power morcellation is considered the best therapeutic option for an individual patient, then:
- Inform the patient that her fibroid(s) may contain unexpected cancerous tissue and that laparoscopic power morcellation may spread the cancer, significantly worsening her prognosis
- Some clinicians and medical institutions now advocate using a specimen “bag” during morcellation in an attempt to contain the uterine tissue and minimize the risk of spread in the abdomen and pelvis.
Although many women choose laparoscopic hysterectomy or myomectomy because of the associated benefits, there are other treatments available, including vaginal or abdominal hysterectomy and myomectomy; laparoscopic hysterectomy or myomectomy without morcellation; minilaparotomy; uterine artery embolization; high-intensity focused ultrasound; and drug therapy.
FDA actions
To reduce the risk of inadvertent spread of unsuspected cancer to the abdomen and pelvis, the FDA has instructed manufacturers of power morcellators used during laparoscopic hysterectomy and myomectomy to immediately review labeling for accurate risk information.
A to-be-convened public meeting of the FDA’s Obstetrics and Gynecological Medical Device Advisory Committee will discuss1:
- the clinical role of laparoscopic power morcellation in the treatment of uterine fibroids
- whether surgical techniques and/or use of accessories, such as morcellation and/or specimen bags, can enhance the safe and effective use of these devices
- if a boxed warning relating the risk of cancer spread should be required for laparoscopic power morcellators.
The FDA will continue to review adverse event reports and peer-reviewed literature, as well as patient information and evidence from health-care providers, gynecologic and surgical professional societies, and medical device manufacturers.
Adverse events should promptly be reported to the FDA by filing a voluntary report through MedWatch, the FDA Safety Information and Adverse Event Reporting program.
Institution reaction
Brigham and Women's Hospital had banned the use of open power morcellation on March 31, 2014, allowing for the use of power morcellators within a containment system. In light of the FDA notice that discourages the use of power morcellators during hysterectomy or myomectomy for the treatment of uterine fibroids, however, Robert L. Barbieri, MD, chair of obstetrics and gynecology at Brigham and Women’s advised surgical staff to "immediately suspend use of power morcellators in all cases until further notice."
Massachusetts General, which also had placed restrictions on the use of power morcellators prior to the FDA communication, suspended the use of power morcellation.
“I have asked our doctors to stop the procedure immediately until more information is available,’’ Dr. Isaac Schiff, Massachusetts General’s chief of obstetrics and gynecology, told the Boston Globe.
Reference
- US Food and Drug Administration. Laparoscopic uterine power morcellation in Hysterectomy and Myomectomy: FDA Safety Communication. http://www.fda.gov/MedicalDevices/Safety/AlertsandNotices/ucm393576.htm. Published April 17, 2014. Accessed April 17, 2014.
On April 17, 2014, the US Food and Drug Administration (FDA) issued a Safety Communication discouraging the use of laparoscopic power morcellation in hysterectomy and myomectomy for uterine fibroids.
Based on an FDA analysis of current data, “… it is estimated that 1 in 350 women undergoing hysterectomy or myomectomy for the treatment of fibroids is found to have an unsuspected uterine sarcoma, a type of uterine cancer that includes leiomyosarcoma. If laparoscopic power morcellation is performed in women with unsuspected uterine sarcoma, there is a risk that the procedure will spread the cancerous tissue within the abdomen and pelvis, significantly worsening the patient’s likelihood of long-term survival.”1
FDA recommendations
The FDA posted the following recommendations for health-care providers1:
- Laparoscopic uterine power morcellation should not be used in women with suspected or known uterine cancer
- All available treatment options should be considered for women with symptomatic uterine fibroids
- The benefits and risks of all treatments should be discussed thoroughly with each patient
- If, after a careful benefit-risk evaluation, laparoscopic power morcellation is considered the best therapeutic option for an individual patient, then:
- Inform the patient that her fibroid(s) may contain unexpected cancerous tissue and that laparoscopic power morcellation may spread the cancer, significantly worsening her prognosis
- Some clinicians and medical institutions now advocate using a specimen “bag” during morcellation in an attempt to contain the uterine tissue and minimize the risk of spread in the abdomen and pelvis.
Although many women choose laparoscopic hysterectomy or myomectomy because of the associated benefits, there are other treatments available, including vaginal or abdominal hysterectomy and myomectomy; laparoscopic hysterectomy or myomectomy without morcellation; minilaparotomy; uterine artery embolization; high-intensity focused ultrasound; and drug therapy.
FDA actions
To reduce the risk of inadvertent spread of unsuspected cancer to the abdomen and pelvis, the FDA has instructed manufacturers of power morcellators used during laparoscopic hysterectomy and myomectomy to immediately review labeling for accurate risk information.
A to-be-convened public meeting of the FDA’s Obstetrics and Gynecological Medical Device Advisory Committee will discuss1:
- the clinical role of laparoscopic power morcellation in the treatment of uterine fibroids
- whether surgical techniques and/or use of accessories, such as morcellation and/or specimen bags, can enhance the safe and effective use of these devices
- if a boxed warning relating the risk of cancer spread should be required for laparoscopic power morcellators.
The FDA will continue to review adverse event reports and peer-reviewed literature, as well as patient information and evidence from health-care providers, gynecologic and surgical professional societies, and medical device manufacturers.
Adverse events should promptly be reported to the FDA by filing a voluntary report through MedWatch, the FDA Safety Information and Adverse Event Reporting program.
Institution reaction
Brigham and Women's Hospital had banned the use of open power morcellation on March 31, 2014, allowing for the use of power morcellators within a containment system. In light of the FDA notice that discourages the use of power morcellators during hysterectomy or myomectomy for the treatment of uterine fibroids, however, Robert L. Barbieri, MD, chair of obstetrics and gynecology at Brigham and Women’s advised surgical staff to "immediately suspend use of power morcellators in all cases until further notice."
Massachusetts General, which also had placed restrictions on the use of power morcellators prior to the FDA communication, suspended the use of power morcellation.
“I have asked our doctors to stop the procedure immediately until more information is available,’’ Dr. Isaac Schiff, Massachusetts General’s chief of obstetrics and gynecology, told the Boston Globe.
Reference
- US Food and Drug Administration. Laparoscopic uterine power morcellation in Hysterectomy and Myomectomy: FDA Safety Communication. http://www.fda.gov/MedicalDevices/Safety/AlertsandNotices/ucm393576.htm. Published April 17, 2014. Accessed April 17, 2014.
Reference
- US Food and Drug Administration. Laparoscopic uterine power morcellation in Hysterectomy and Myomectomy: FDA Safety Communication. http://www.fda.gov/MedicalDevices/Safety/AlertsandNotices/ucm393576.htm. Published April 17, 2014. Accessed April 17, 2014.
Click here to access articles, videos, and audiocasts in the Morcellation Topic Collection
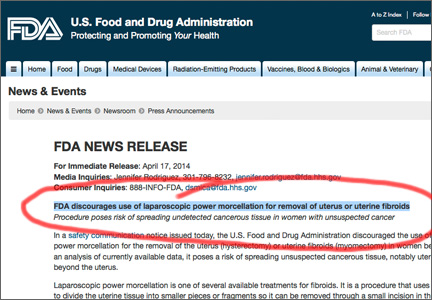
The Use of Secure Messaging in Medical Specialty Care
Secure messaging (SM) is an encrypted, web-based mode of communication within the My HealtheVet (MHV) website. It was developed for the nonurgent, nonemergency communication of test results and other health information as well as for scheduling appointments and renewing medication prescriptions. Secure messaging is asynchronous, which means that communication between parties is not done at the same time. It was designed to address the need for a secure means of communication between patient and provider.1 Messages can be triaged across teams and saved to the Computerized Patient Record System (CPRS).
The VA patients who use MHV can upgrade their account through an in-person authentication process (IPA), which takes about 10 minutes. Any health care provider (HCP) team or administrator can use SM if set up in the system. Health care providers can only receive messages from patients who have been associated with their triage care group. Patients may only message an HCP with which they are associated. In general, this group would comprise their HCP and 1 or more specialty clinics where they have already been seen. Patients can choose an HCP from a limited drop-down menu.
Patients using SM choose a subject, such as appointments, medications, tests, or general. Patients are then able to type a message, and they are also able to see the threads of previous messages. They may access test results or attachments sent to them by the HCPs. Patients are notified of messages through their previously registered e-mail account, which displays a message asking them to log on to MHV.
Health care providers may access MHV either through the CPRS on the tools menu or as a link in an e-mail. Once HCPs log on, they will see their inbox and messages listed by sender and type of inquiry (ie, prescription refill, test question, and so forth). The HCPs can view escalated messages (those that have not been answered within 3 days), drafts, and sent and completed messages. Health care providers can also create special folders to store their messages.
The health care team can personalize how and to whom messages appear. There are 2 main models used by Specialty Care. The first involves a staff member designated to triage messages for the team. This staff member will see all incoming messages and forward them appropriately. For example, in one clinic model, the program assistant reviews all messages and then forwards them to the appropriate provider. The team pharmacist receives prescription requests, the HCP receives general or test inquiries from patients, and the program assistant retains and answers all communication related to appointments and cancellations. Another model involves employing a staff person or administrator as a co-user with each HCP. The HCP can then forward messages that may need administrative action.
The HCPs receive an e-mail notification with a link when a message has been received. Clicking on the link takes them directly to SM within MHV, where they can sign in to see all their messages. Users can also add a signature block, which will appear on all correspondence. They may also designate a surrogate to answer messages when they are unavailable, such as during administrative or personal leave. The HCPs also have the ability to create a SM even if the patient has not yet messaged them. Users can also send copies of messages to other staff members. Providers and staff have the ability to attach a file, which can be a test result, letter, records, etc. Messages can then be saved in the CPRS if desired.
Patients, however, cannot send attachments to their HCP. Only those HCPs who have seen the patient will be available for communication. This system eliminates the possibility of patients self-referring to a specialist and asking questions of HCPs who have never seen them. The HCPs and staff may also forward messages to the appropriate person.
Secure messaging can provide unique opportunities for communication and improvement in outcome measures in certain specialties. For example, in endocrinology patients may be asked to send home blood sugar or blood pressure (BP) readings in between visits, to allow for more rapid medication titration and achievement of treatment goals. A study by Harris and colleagues showed that the frequent use of electronic SM was associated with improved glycemic control.2
At the Atlanta VAMC, SM was implemented in the Primary Care Service Line prior to the Medicine Specialty Care Service Line. The implementation was a natural fit for the organized Primary Care teams. Implementation within the specialties brought forth a new set of issues. Many specialties were not formally organized with a team leader. There were often multiple HCPs in a division, some full time, some part time, in addition to subspecialty pharmacists, physician assistants, and nurse practitioners. Because the Atlanta VAMC is also a training hospital for the Emory University School of Medicine, new residents and fellows are included in the teams each month. It was, therefore, necessary for each specialty to design a message flow that would best fit its needs. Initially, there was concern that SM would add yet another layer of responsibilities to the already stretched HCPs.
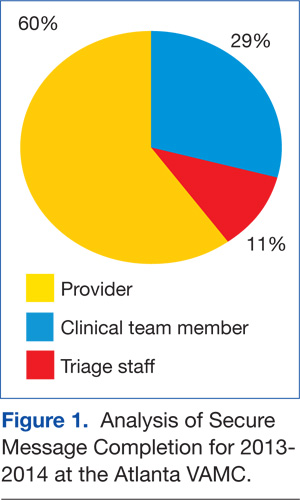
The reality has been the opposite. Secure messaging was found to be an additional type of communication, which could be completed more rapidly than a phone call or generating a results letter. The HCPs were also concerned that patients would attempt to use them as primary care providers (PCPs). However, as patients were able to view both their PCP and their specialty care provider in the drop-down menu, they were generally able to direct their questions appropriately.
At the Atlanta VAMC, 60% of the messages were completed by the provider, 29% by a clinical team member, and 11% by the triage staff from 2013 to 2014 (Figure 1). Some HCPs were concerned that once SM was in place, they would be inundated with messages. The reality seems to be that most patients use SM judiciously, and although they are comfortable in the knowledge that they can communicate directly with their HCP, the need is infrequent. The number of messages has slowly increased over the past year as more patients join MHV and SM (Table). Surprisingly, as the number of inbound messages increased, the percentage of escalated messages (messages not answered within 3 days) declined, indicating a learning curve as HCPs begin using SM.
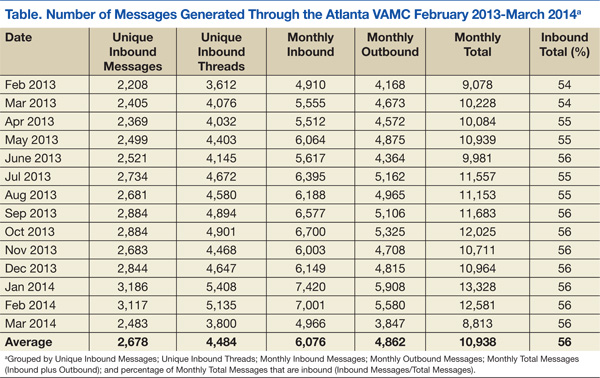
There are 3 steps to patient enrollment in SM. The first is enrollment in MHV, which can be done either online or at the VAMC. The second step requires the patient to go to the VAMC and present identification to complete the IPA. Finally, the enrolled patients must opt-in to the program. Enrollment in MHV has steadily increased through advertising campaigns on the VAMC website, within the VAMC, and through HCPs and staff (Figure 2).
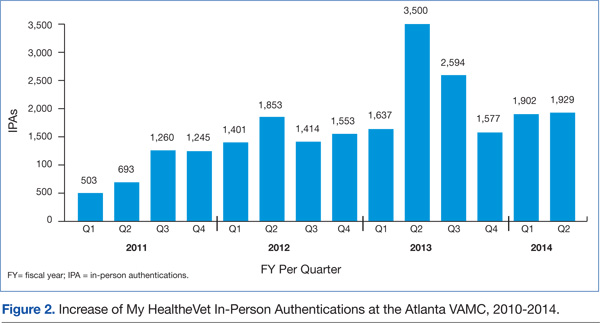
However, barriers still exist. Some patients do not have an Internet connection and are not computer savvy. Other patients express interest but put it off to another visit. Some patients have been confused about the additional step of IPA that is required for SM and stop at enrollment in MHV only.
Therefore the key challenges for implementing SM are facilitating MHV enrollment, IPA, and completion of the opt-in feature. To encourage participation, VISN 7 mailed postcards to all 33,000 patients who had undergone IPA but had not yet opted-in. The number of patients who opted-in quadrupled, demonstrating that this type of promotion is an effective recruitment tool.
Another ongoing challenge is developing a method to easily generate workload credit for the HCPs’ time spent using SM for patient care. This will be an important parameter to track, as the time spent on SM per provider is expected to increase. It has also been suggested that there be an out-of-office response for nonemergent messages and the assignment of a surrogate to handle incoming messages for HCPs who are on leave. An unforeseen example of a nonemergent message occurs when a patient replies “Thank you” to a message from an HCP. That message is then counted as a new message and must be viewed and completed like any other message. It can also become an escalated message, even though there is no important information being transmitted.
Conclusions
Secure messaging provides a simple means of rapid communication and feedback between HCPs and their patients. An e-mail notification is generated, HCPs access SM through the link, the reply is sent, and a CPRS note is automatically generated. That same communication would require a far more time-consuming and complicated process without SM: The patient must contact the service, usually the program assistant, and leave a message; that message would be passed on via voicemail or e-mail to the appropriate HCP; the provider would need to access the CPRS, phone the patient, discuss the issue if the patient is available, and then document the contact with a note in the CPRS. If the patient was unavailable, this process would require multiple phone calls.
With respect to patients, the benefits of SM are significant and include easy access to prescription refills and a quick response to questions about medications, dosages, or tests. Patients are able to change or cancel appointments, thereby avoiding no-shows. Frustration concerning the inability to reach the correct party or to speak with staff directly is reduced with SM, and overall communication between HCP and patient is streamlined.
Author disclosures
The authors report no actual or potential conflicts of interest with regard to this article.
Disclaimer
The opinions expressed herein are those of the authors and do not necessarily reflect those of Federal Practitioner, Frontline Medical Communications Inc., the U.S. Government, or any of its agencies. This article may discuss unlabeled or investigational use of certain drugs. Please review complete prescribing information for specific drugs or drug combinations—including indications, contraindications, warnings, and adverse effects—before administering pharmacologic therapy to patients.
1. Delbanco T, Sands DZ. Electrons in flight—e-mail between doctors and patients. New Engl J Med. 2004;350(17):1705-1707.
2. Harris LT, Haneuse SJ, Martin DP, Ralston JD. Diabetes quality of care and outpatient utilization associated with electronic patient-provider messaging: A cross-sectional analysis. Diabetes Care. 2009;32(7):1182-1187.
Secure messaging (SM) is an encrypted, web-based mode of communication within the My HealtheVet (MHV) website. It was developed for the nonurgent, nonemergency communication of test results and other health information as well as for scheduling appointments and renewing medication prescriptions. Secure messaging is asynchronous, which means that communication between parties is not done at the same time. It was designed to address the need for a secure means of communication between patient and provider.1 Messages can be triaged across teams and saved to the Computerized Patient Record System (CPRS).
The VA patients who use MHV can upgrade their account through an in-person authentication process (IPA), which takes about 10 minutes. Any health care provider (HCP) team or administrator can use SM if set up in the system. Health care providers can only receive messages from patients who have been associated with their triage care group. Patients may only message an HCP with which they are associated. In general, this group would comprise their HCP and 1 or more specialty clinics where they have already been seen. Patients can choose an HCP from a limited drop-down menu.
Patients using SM choose a subject, such as appointments, medications, tests, or general. Patients are then able to type a message, and they are also able to see the threads of previous messages. They may access test results or attachments sent to them by the HCPs. Patients are notified of messages through their previously registered e-mail account, which displays a message asking them to log on to MHV.
Health care providers may access MHV either through the CPRS on the tools menu or as a link in an e-mail. Once HCPs log on, they will see their inbox and messages listed by sender and type of inquiry (ie, prescription refill, test question, and so forth). The HCPs can view escalated messages (those that have not been answered within 3 days), drafts, and sent and completed messages. Health care providers can also create special folders to store their messages.
The health care team can personalize how and to whom messages appear. There are 2 main models used by Specialty Care. The first involves a staff member designated to triage messages for the team. This staff member will see all incoming messages and forward them appropriately. For example, in one clinic model, the program assistant reviews all messages and then forwards them to the appropriate provider. The team pharmacist receives prescription requests, the HCP receives general or test inquiries from patients, and the program assistant retains and answers all communication related to appointments and cancellations. Another model involves employing a staff person or administrator as a co-user with each HCP. The HCP can then forward messages that may need administrative action.
The HCPs receive an e-mail notification with a link when a message has been received. Clicking on the link takes them directly to SM within MHV, where they can sign in to see all their messages. Users can also add a signature block, which will appear on all correspondence. They may also designate a surrogate to answer messages when they are unavailable, such as during administrative or personal leave. The HCPs also have the ability to create a SM even if the patient has not yet messaged them. Users can also send copies of messages to other staff members. Providers and staff have the ability to attach a file, which can be a test result, letter, records, etc. Messages can then be saved in the CPRS if desired.
Patients, however, cannot send attachments to their HCP. Only those HCPs who have seen the patient will be available for communication. This system eliminates the possibility of patients self-referring to a specialist and asking questions of HCPs who have never seen them. The HCPs and staff may also forward messages to the appropriate person.
Secure messaging can provide unique opportunities for communication and improvement in outcome measures in certain specialties. For example, in endocrinology patients may be asked to send home blood sugar or blood pressure (BP) readings in between visits, to allow for more rapid medication titration and achievement of treatment goals. A study by Harris and colleagues showed that the frequent use of electronic SM was associated with improved glycemic control.2
At the Atlanta VAMC, SM was implemented in the Primary Care Service Line prior to the Medicine Specialty Care Service Line. The implementation was a natural fit for the organized Primary Care teams. Implementation within the specialties brought forth a new set of issues. Many specialties were not formally organized with a team leader. There were often multiple HCPs in a division, some full time, some part time, in addition to subspecialty pharmacists, physician assistants, and nurse practitioners. Because the Atlanta VAMC is also a training hospital for the Emory University School of Medicine, new residents and fellows are included in the teams each month. It was, therefore, necessary for each specialty to design a message flow that would best fit its needs. Initially, there was concern that SM would add yet another layer of responsibilities to the already stretched HCPs.
The reality has been the opposite. Secure messaging was found to be an additional type of communication, which could be completed more rapidly than a phone call or generating a results letter. The HCPs were also concerned that patients would attempt to use them as primary care providers (PCPs). However, as patients were able to view both their PCP and their specialty care provider in the drop-down menu, they were generally able to direct their questions appropriately.
At the Atlanta VAMC, 60% of the messages were completed by the provider, 29% by a clinical team member, and 11% by the triage staff from 2013 to 2014 (Figure 1). Some HCPs were concerned that once SM was in place, they would be inundated with messages. The reality seems to be that most patients use SM judiciously, and although they are comfortable in the knowledge that they can communicate directly with their HCP, the need is infrequent. The number of messages has slowly increased over the past year as more patients join MHV and SM (Table). Surprisingly, as the number of inbound messages increased, the percentage of escalated messages (messages not answered within 3 days) declined, indicating a learning curve as HCPs begin using SM.
There are 3 steps to patient enrollment in SM. The first is enrollment in MHV, which can be done either online or at the VAMC. The second step requires the patient to go to the VAMC and present identification to complete the IPA. Finally, the enrolled patients must opt-in to the program. Enrollment in MHV has steadily increased through advertising campaigns on the VAMC website, within the VAMC, and through HCPs and staff (Figure 2).
However, barriers still exist. Some patients do not have an Internet connection and are not computer savvy. Other patients express interest but put it off to another visit. Some patients have been confused about the additional step of IPA that is required for SM and stop at enrollment in MHV only.
Therefore the key challenges for implementing SM are facilitating MHV enrollment, IPA, and completion of the opt-in feature. To encourage participation, VISN 7 mailed postcards to all 33,000 patients who had undergone IPA but had not yet opted-in. The number of patients who opted-in quadrupled, demonstrating that this type of promotion is an effective recruitment tool.
Another ongoing challenge is developing a method to easily generate workload credit for the HCPs’ time spent using SM for patient care. This will be an important parameter to track, as the time spent on SM per provider is expected to increase. It has also been suggested that there be an out-of-office response for nonemergent messages and the assignment of a surrogate to handle incoming messages for HCPs who are on leave. An unforeseen example of a nonemergent message occurs when a patient replies “Thank you” to a message from an HCP. That message is then counted as a new message and must be viewed and completed like any other message. It can also become an escalated message, even though there is no important information being transmitted.
Conclusions
Secure messaging provides a simple means of rapid communication and feedback between HCPs and their patients. An e-mail notification is generated, HCPs access SM through the link, the reply is sent, and a CPRS note is automatically generated. That same communication would require a far more time-consuming and complicated process without SM: The patient must contact the service, usually the program assistant, and leave a message; that message would be passed on via voicemail or e-mail to the appropriate HCP; the provider would need to access the CPRS, phone the patient, discuss the issue if the patient is available, and then document the contact with a note in the CPRS. If the patient was unavailable, this process would require multiple phone calls.
With respect to patients, the benefits of SM are significant and include easy access to prescription refills and a quick response to questions about medications, dosages, or tests. Patients are able to change or cancel appointments, thereby avoiding no-shows. Frustration concerning the inability to reach the correct party or to speak with staff directly is reduced with SM, and overall communication between HCP and patient is streamlined.
Author disclosures
The authors report no actual or potential conflicts of interest with regard to this article.
Disclaimer
The opinions expressed herein are those of the authors and do not necessarily reflect those of Federal Practitioner, Frontline Medical Communications Inc., the U.S. Government, or any of its agencies. This article may discuss unlabeled or investigational use of certain drugs. Please review complete prescribing information for specific drugs or drug combinations—including indications, contraindications, warnings, and adverse effects—before administering pharmacologic therapy to patients.
1. Delbanco T, Sands DZ. Electrons in flight—e-mail between doctors and patients. New Engl J Med. 2004;350(17):1705-1707.
2. Harris LT, Haneuse SJ, Martin DP, Ralston JD. Diabetes quality of care and outpatient utilization associated with electronic patient-provider messaging: A cross-sectional analysis. Diabetes Care. 2009;32(7):1182-1187.
Reovirus shows synergy with agents used to treat MM
SAN DIEGO—Reovirus can induce cell death in a range of multiple myeloma (MM) cell lines, and it is synergistic with drugs used to treat MM, according to research presented at the AACR Annual Meeting 2014.
Six of the 7 MM cell lines tested were at least moderately sensitive to reovirus, and introducing the virus in combination with the proteasome inhibitor carfilzomib or the Akt inhibitor perifosine increased antimyeloma activity.
Chandini M. Thirukkumaran, PhD, of The University of Calgary in Canada, and her colleagues presented these results at the meeting as abstract 1709. The study was funded by the Cancer Research Society of Canada.
“Our university, about 15 years ago, found that reovirus can infect all cells, but it will specifically kill cancer cells and not harm normal cells,” Dr Thirukkumaran said. “This is because cancer cells have aberrant Ras signaling pathways, and the virus utilizes that aberrant signaling for its replication.”
“Reovirus kills a lot of myeloma cell lines and cells from patients too, but you always find that therapy-resistant population. So we wondered if we could combine reovirus with common myeloma drugs, like carfilzomib and perifosine, and see whether we could get synergy.”
Dr Thirukkumaran and her colleagues first wanted to quantify the effect of reovirus alone on MM cell lines. So they incubated the cell lines RPMI 8226, MM1.S, NCIH929, U266, INA-6, KMS11, and OPM2 with live reovirus or UV-inactivated reovirus and assessed cell death.
They found that RPMI8226 was highly sensitive to reovirus, and OPM2 was resistant to it. The remaining cell lines were somewhat sensitive to the virus.
The researchers chose RPMI8226, KMS-11, and OPM2 to test reovirus in combination with either carfilzomib or perifosine. They tested the drugs at various concentrations to determine effective dose 50% (ED50) values. They combined ED50 values for each drug and reovirus at various concentrations but with consistent ratios and determined toxicity.
The team used software to generate combination index (CI) values and determine synergism per the Chou-Talalay method. A CI equal to 1 suggested an additive effect, a CI greater than 1 suggested an antagonistic effect, and a CI less than 1 suggested a synergistic effect.
Results showed that reovirus synergized with both carfilzomib and perifosine. Furthermore, the greater a cell line’s resistance to reovirus, the greater the synergy.
For instance, with reovirus and carfilzomib in combination, the ED50 was 1.06 + 0.15 in the reovirus-sensitive RPMI8226 cell line, 0.78 + 0.14 in the moderately sensitive KMS11 cell line, and 0.57 + 0.05 in the resistant OPM2 cell line.
When reovirus and perifosine were combined, the ED50 was 0.97 + 0.19 in the RMI8226 cell line, 0.26 + 0.11 in the KMS11 cell line, and 0.88 + 0.22 in the OPM2 cell line.
The researchers said these results highlight the significance of preclinical studies in evaluating reovirus-drug combinations that could be extrapolated to a clinical setting.
Two phase 2 trials evaluating reovirus in combination therapy for MM are now underway. Meanwhile, Dr Thirukkumaran and her colleagues are hoping to gain more insight into how reovirus-drug combinations work by testing them in mouse models of MM. ![]()
Protective cells are impaired in aggressive CLL

Credit: Monash University
New research may explain why patients with chronic lymphocytic leukemia (CLL) are vulnerable to severe, recurrent infections.
The study showed that plasmacytoid dendritic cells (pDCs), which orchestrate innate and adaptive immune responses, were eliminated in patients with aggressive CLL.
However, patients with a milder form of CLL appeared to have more pDCs, which suggests some protective effect.
Researchers reported these findings in Leukemia.
“These unprecedented findings reveal that these rare but critical cells can be restored at the experiment level, resulting in re-activated immune functions, including the destruction of cancer cells,” said study author Fabienne Mackay, PhD, of Monash University in Melbourne, Victoria, Australia.
“These results provide supporting evidence that a similar approach might have therapeutic benefits in patients with CLL.”
Dr Mackay and her colleagues noted that CLL patients’ vulnerability to infection is caused by a variety of immunological defects. But the initiating events of immunodeficiency in CLL are unclear.
To gain more insight, the researchers studied samples from CLL patients and conducted experiments in mouse models of the disease.
They found that, in progressive CLL, pDC numbers decreased, and their functionality was impaired. As a result, interferon alpha (IFNα) production decreased.
Additional investigation revealed that the decrease in pDCs and reduction in IFNα production resulted from decreased expression of FLT3 and TLR9.
However, the researchers were able to increase FLT3 expression using inhibitors of TGF-β and TNF. And this reduced the tumor load.
The team said these results offer new insight into mechanisms underpinning the immunodeficiency observed in CLL.
And they hope their discoveries will aid the development of new therapeutic strategies that reactivate the immune system and enhance the long-term survival of those CLL patients who are particularly vulnerable to fatal infectious complications. ![]()
Findings could increase use of delayed cord clamping
Credit: Meutia Chaerani
and Indradi Soemardjan
A baby’s position prior to delayed umbilical cord clamping does not affect the volume of placental blood transferred, according to a study published in The Lancet.
Researchers found that placing a baby on the mother’s chest or abdomen before clamping does not decrease the amount of blood transferred when compared to holding the child in the recommended introitus position.
As the chest/abdomen position is more desirable, the researchers believe this discovery could help increase the use of delayed cord clamping, which has been shown to reduce the risk of iron deficiency in infancy.
Current recommendations for delayed cord clamping are based on studies conducted 35 years ago. They suggest that, for effective placental transfusion to occur, a baby must be held at the level of the placenta—the introitus position.
The researchers noted that this position can be uncomfortable for the person holding the baby and interferes with immediate contact between the mother and child. These issues could be contributing to low compliance with delayed cord clamping, ultimately resulting in higher-than-necessary levels of iron deficiency in babies.
So the team decided to examine whether the transfer of blood in delayed cord clamping procedures is affected by the position in which the baby is held immediately after birth.
They conducted the study in 3 university-affiliated hospitals in Argentina, evaluating 197 babies who were held in the introitus position and 194 babies who were immediately placed on the mother’s abdomen or chest.
By measuring the babies’ weights at the point of birth and immediately after the delayed cord clamping procedure, the researchers were able to measure the volume of blood that had transferred from the placenta to the child.
They found no statistically significant difference between the 2 groups in the volume of blood transferred. The mean weight change was 56 g for babies in the introitus group and 53 g for babies in the abdomen/chest group (P=0.45).
“Our study suggests that when umbilical cord clamping is delayed for 2 minutes, holding the baby on the mother’s chest or abdomen is no worse than the currently recommended practice of holding the baby below this level,” said study author Nestor Vain, MD, of the Foundation for Maternal and Child Health (FUNDASAMIN) in Buenos Aires, Argentina.
“Because of the potential of enhanced bonding between mother and baby, increased success of breastfeeding, and the compliance with the procedure, holding the infant by the mother immediately after birth should be strongly recommended.”
Writing in a related comment article, Tonse Raju, MD, of the National Institute of Child Health and Human Development in Bethesda, Maryland, noted that introducing delayed cord clamping into practice has not been easy, and logistical issues might be partly responsible.
“Intuitively, to keep the newborn baby’s position below the level of the placenta in situ should maximize the volume of placental transfusion,” Dr Raju wrote. “However, trying to hold on to a wet, vigorously crying, and wriggling infant at the perineum for 2 minutes, in gloved hands, is awkward and can be risky.”
“[This study] should bring a sigh of relief from those trying to incorporate delayed umbilical cord clamping into practice. The results are convincing and show that gravity did not have an effect on volume of placental transfusion.” ![]()
Crowdsourcing Medical Expertise
The volume of existing knowledge and the pace of discovery in medical science challenge a clinician's ability to access relevant information at the point of care. Knowledge gaps that arise in practice usually involve matters related to diagnosis, drug therapy, or treatment.[1] In the clinical setting, healthcare providers (HCPs) answer questions using a variety of online and print resources. Ironically, HCPs often lack the training required to find details regarding uncommon disorders or complex medical decisions that are not easily found or well represented in the published literature.[2] Instead, HCPs turn to trusted colleagues who possess the necessary expertise.[3]
Closing the knowledge‐to‐practice gap involves a range of factual information and data derived from published evidence, anecdotal experience, as well as organization‐ and region‐specific practices.[4] The inability to codify both explicit and tacit information has been linked to variability in prescription practices, excessive use of surgical services, and delayed decisions involving the appropriate provision of end‐of‐life care.[5] Although electronic medical record systems are not configured to support peer collaboration,[6] alternative strategies including crowdsourcing has been used successfully in other domains to tap collective intelligence of skilled workers.[7] Crowdsourcing allows organizations to explore problems at low cost, gain access a wide range of complementary expertise, and capture large amounts of data for analysis.[8, 9] Although an increasing number of physicians use either smartphones or tablets on the job,[10] peer‐to‐peer medical crowdsourcing has not been investigated, despite the fact that processes involving team‐based clinical decision making are associated with better outcomes.[11] Here we field tested the mobile crowdsourcing application DocCHIRP (Crowdsourcing Health Information Retrieval Protocol for Doctors) and assessed user opinion regarding its utility in the clinical setting.
MATERIALS AND METHODS
DocCHIRP Program Design
The authors (M.W.H., J.B., H.K.) conceptualized and designed DocCHIRP for mobile (iOS [Apple Inc., Cupertino, CA] and Android [Google Inc., Mountain View, CA]) and desktop use. Email prompts and push notifications, which were modeled after the application VizWiz (Rochester Human Computer Interaction Group, University of Rochester, Rochester, NY), supported near real‐time communication between HCPs. According to recent US Food and Drug Administration guidelines, DocCHIRP is considered a medical reference,[12] intended to share domain‐specific knowledge on diagnosis, therapy, and other medically relevant topics. Devices were password protected and encrypted according to university standards. A typical workflow involves an index provider faced with a clinical question that sends a consult question to 1 or more trusted providers. The crowd receiving the notification responds when available using either free‐text responses or agree/disagree prompts (Figure 1A,B). Providers use preference settings to manage crowd membership, notification settings, and demographics describing their expertise.
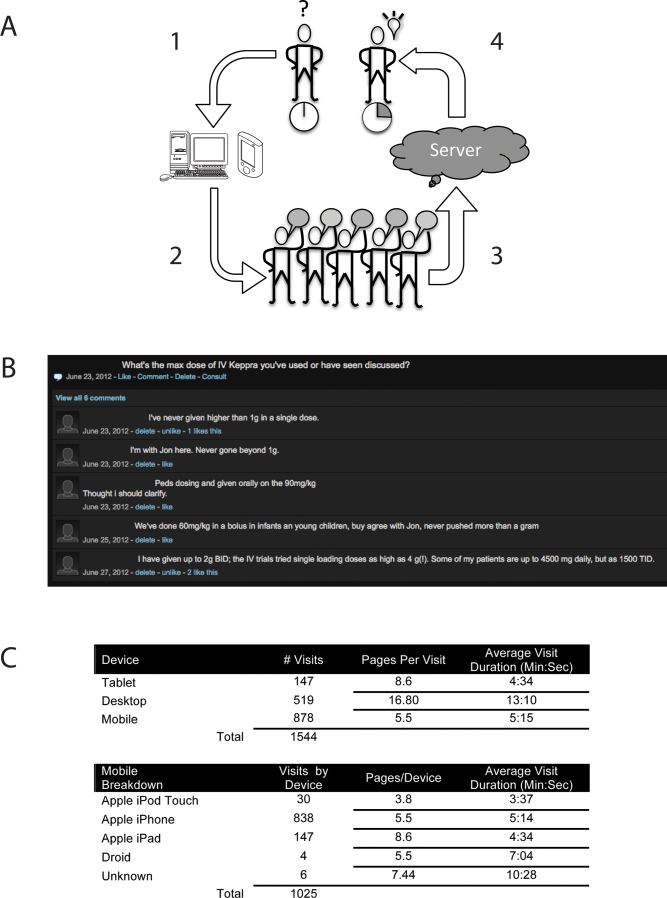
Trial Recruitment
The University of Rochester Research Subjects Review Board approved the study, in which prospective users were required to review and agree to a statement regarding potential liability as part of the consent process. In this pilot study, we invited a cross‐section of providers (n = 145) from the Departments of Neurology (including the Division of Pediatric Neurology), Pediatrics, Neuroradiology, Psychiatry, Orthopedics, Emergency Medicine, Internal Medicine, and Family Medicine to participate. E‐mail invitations were sent to HCPs in 3 phases in April (phase I), June (phase II), and August (phase III) over 244 consecutive days. At the conclusion of the trial, 85 HCPs (59%) had created accounts including attending physicians (n = 63), residents (n = 13), fellows (n = 1), and nurse practitioners (n = 8). We did not seek parity in either age or gender representation.
Data Analysis
Mobile device and network usage data, question and response strings, as well as data regarding hardware and browser identity were collected using Google Analytics (Google Inc.,
RESULTS
Attending and resident physicians represented the majority of DocCHIRP account holders (91%), with nurse practitioners accounting for the remaining sample (9%). There were 50 male and 35 female participants, with an age range of 28 to 78 years (median age, 43 years). Departmental affiliations included Pediatrics (n = 28, 33%), Neurology (n = 27, 32%), Internal Medicine (n = 10, 12%), Psychiatry (n = 4, 5%), the Division of Pediatric Neurology (n = 11, 13%), and others (n = 5, 6%). Of the 1544 total visits to the DocCHIRP site, providers favored using smart phones (56.8%) and tablets (9.5%) over the desktop interface (33.6%; Figure 1C). iPhone use (81.7%) surpassed the other platforms combined. Desktop users visited twice as many pages (16.8 pages/visit) compared to those using smart phones (5.5 pages/visit) or tablets (8.6 pages/visit). Desktop users remained engaged longer than mobile users (13 vs 5 minutes). In the post‐trial user survey, we received 72 valid surveys from 85 potential participants (85% response rate).
We used a tiered enrollment design, sending invitations to potential participants in 3 phases to study the relationship between the size of the HCP crowd and sustained use as reported in other social networks.[13] Using a cutoff of >3 visits per week to demarcate active periods of use, we saw during the initial phase of enrollment that 20 providers generated a total of 170 visits over 22 days (Figure 2A). The addition of 28 members (phase II, n = 48 total) extended active use by 28 days, with a total of 476 page visits. The addition of 32 members (phase III, n = 85 total) resulted in 56 days of active participation with 612 visits to the site. When plotted (Figure 2B), the relationship between crowd size (total number of registered users) and cumulative visits (R2 = 0.951), as well as crowd size and days of high activity (R2 = 0.953) were linear and direct. We also investigated the timing of user engagement by pooling the data and breaking down use by time of day and day of the week (Figure 3A,B). In addition to observing peak engagement during the midmorning and afternoon, times of anticipated physician‐patient contact, we observed a third use peak in the evening. With the exception of sporadic weekend use, DocCHIRP use clustered during midweek.
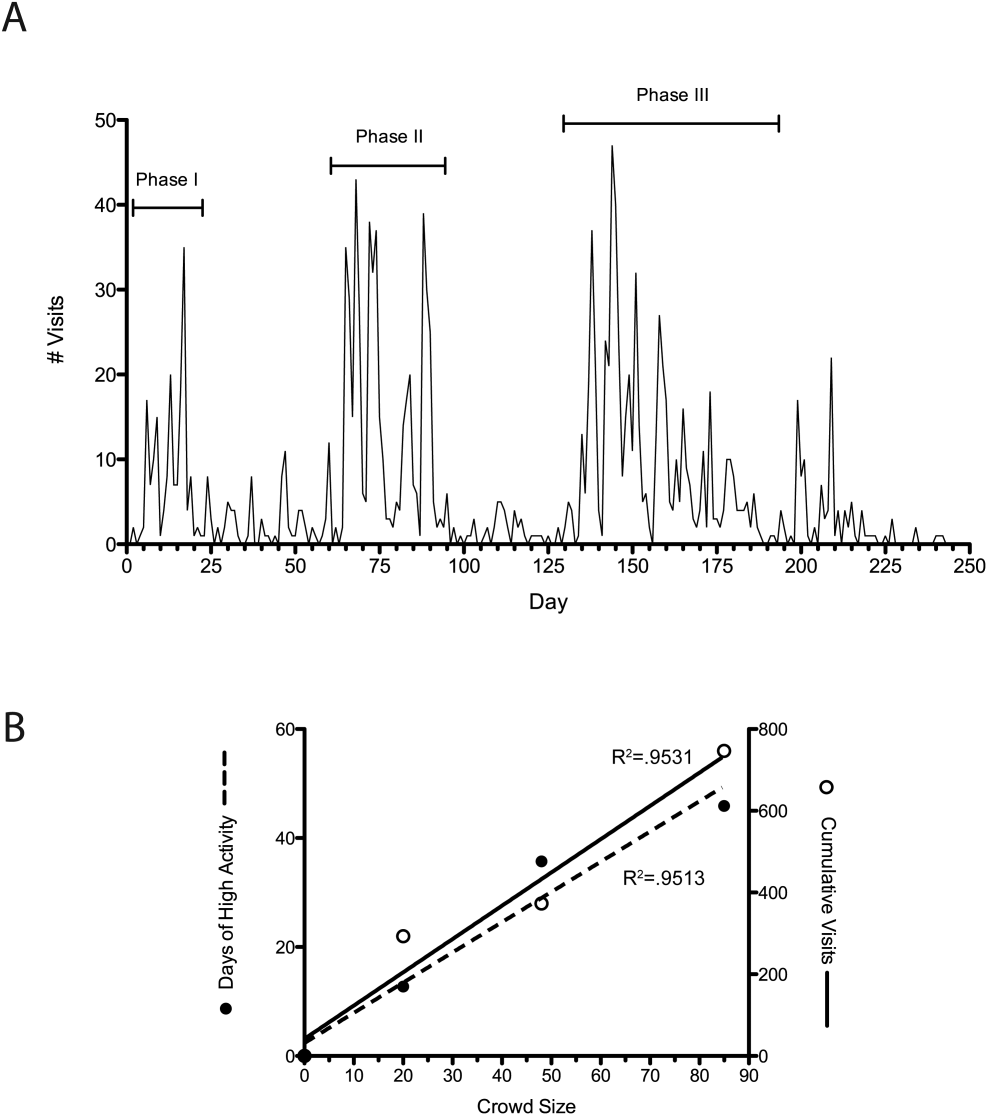
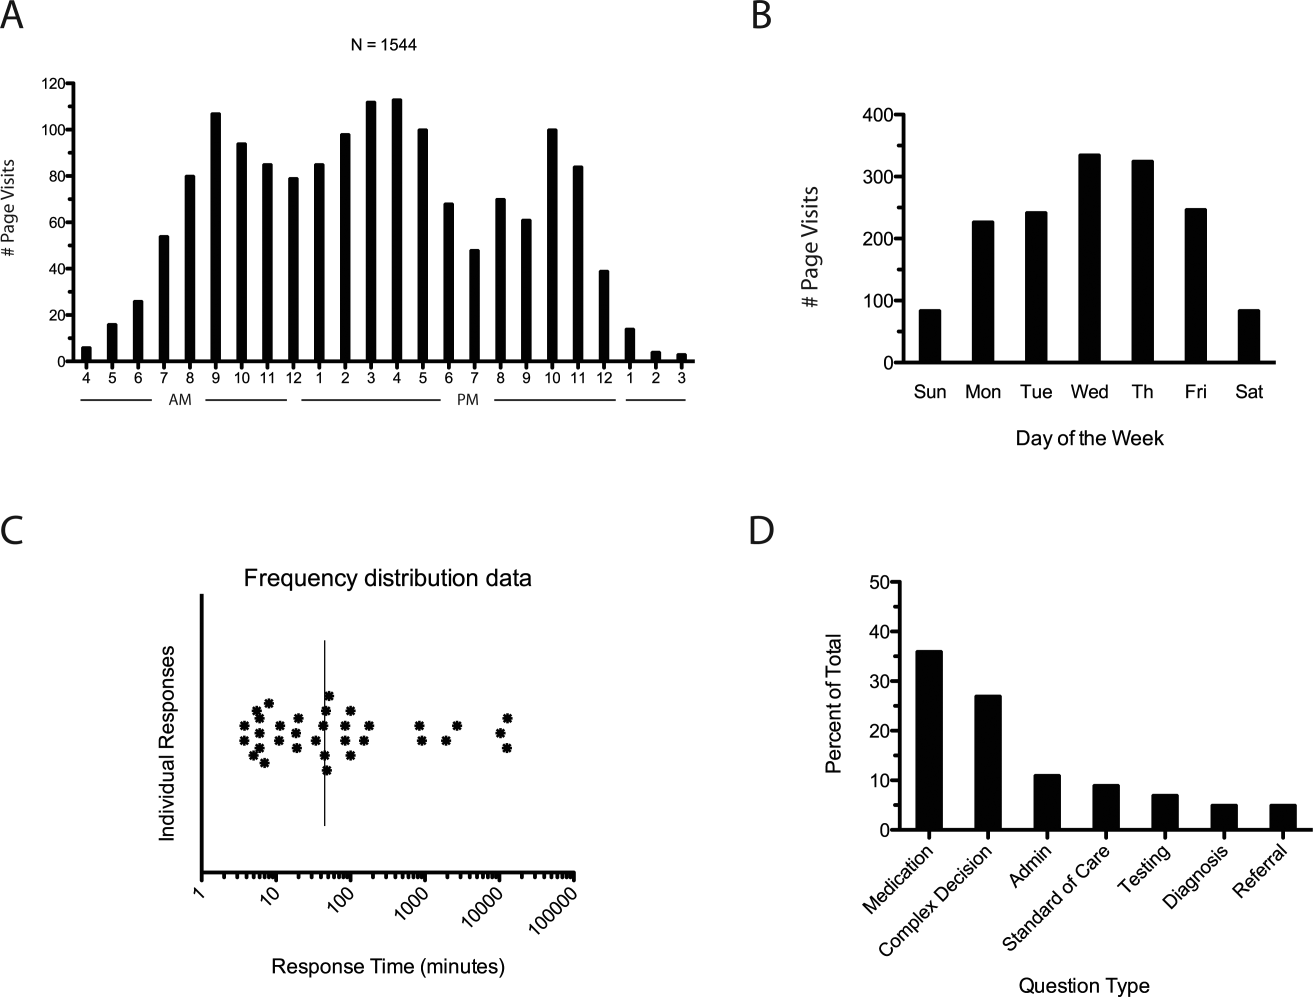
DocCHIRP users generated 45 questions. The fastest first response was returned in less than 4 minutes, with a median first response time of 19 minutes (Figure 3C). Analysis of the consult requests received revealed a clustering of 7 principal question‐response groups: (1) the effective use of medications, (2) complex medical decision making, (3) use of the application itself, (4) guidance regarding the standard of care, (5) selection and interpretation of diagnostic tests, (6) differential diagnosis, and (7) patient referral (Figure 3D). Consults regarding medication use and complex decision making were dominant themes (63%). Several consults generated multiple responses, broadening the scope of the original query or requesting additional information (Table 1).
| Question Type | Consult | Response(s) |
|---|---|---|
| ||
| Medication | How do you treat headache from viral meningitis? | R1: Any analgesic will work; need to clarify that the headache is not post‐LP, which may require blood patch. |
| Anyone know how oral fluconazole (liquid) tastes? We needed to prescribe for a young 13 year old. | R1: We should get a pharmacist on the chat. I would call the pharmacy and see if they can compound it with flavoring. | |
| How frequently do your patients complain of myalgias on statins? Have you prescribed coenzyme Q in this situation? | R1: Did you see the editorial in the Green Journal yesterday?Took the position that statins were not to blame. I usually give a trial off to make sure symptoms resolve. Usually I try them on a different statin.Have not routinely rx'd Q10. | |
| Complex medical decision making | Has anyone seen tapeworm infection from raw pork? Do we need to report this? We treated with mebendazole. | R1: You can check with CDC here: |
| R2: First‐line treatment for Tsolium is praziquantel or albendazole.However, mebendazole has also been used to successfully treat T solium. | ||
| R3: Whipworm is another common pork tapeworm.It is also covered by mebendazole | ||
| What are the current guidelines regarding the use of statins in patients with a history of lobar hemorrhage. | R1: Larger studies (SPARCL, HPS) both showed higher hemorrhage risks in statin treated patients.Cohort studies generally don't show an obvious risk to statins. I've generally taken patients off their statins when they come in with lobar ICH, and more neutral when it's a hypertensive bleed. | |
| Standard of care | How often would someone have to fall before you felt uncomfortable anticoagulating for AFib? | R1: The risk of falls alone should not automatically disqualify a person from being treated with warfarin. |
| R2: I recall reading a meta‐analysis that suggested 300 falls/year would start to favor not anticoagulating, but short of that, falls were not an important factor. | ||
| Anyone used IVIG for any of the following: autoimmune encephalopathy, NMO, paraneoplastic limbic encephalitis, PANDAS? | R1: We had a patient recently with a history of autoimmune encephalopathy who was treated with IVIG. | |
| Administrative | What medical apps do you have on your phone? | R1: DocCHIRP, Epocrates, NIH stroke calculator. |
| R2: I have Merck Medicus, Micromedex drugs, growth charts, and shotsall those are free.I also have Red Book from AAPand Sanford Guide, which I paid for. | ||
| R3: Instant ECG, ACLS Advisor, 10‐Second EM. | ||
| Testing | What would be considered a normal vitamin D level in a 2 year old? | R1: We typically treat at a level less than 30, with likely greater treatment if less than 21. I'm sure our phone nurses would be willing to share [our protocol]. |
| I have an obese 13‐year‐old AA girl with acanthosis nigricans. Do you check HbA1c? | R1: Yes. Sign of insulin resistance. HbA1c along with fasting blood glucose are a good start.Close monitoring indicated regardless. Endo may have more insight as to whether or not other labs are useful, such as fasting C‐peptide. | |
| Referral | Has anyone ever seen preteen or teen patients with ADHD‐like symptoms and poor sleep referred for a sleep study for possible restless leg syndrome? | R1: RLS seen in kids, but criteria are different for children than adults.Sleep studies may be warranted. |
| R2: I've also heard about a link between restless leg and iron deficiency. Is it a girl? | ||
| R3: Checking CBC, ferritin, and iron is a good start. | ||
To better understand factors influencing use of the mobile crowdsourcing application, we surveyed users, receiving 68 comments related to the overall approach and barriers to adoption among other aspects (Table 2). The 40 comments regarding the use of medical crowdsourcing were divided evenly between supporters and critics. Enthusiasm for cross‐discipline collaboration, having tools to codify expert knowledge, and discovering consensus opinion from the expert crowd was offset by concerns that push notifications would distract providers, compromise efficiency, and potentially lead providers to act on inaccurate information.
| Category | Comments | |
|---|---|---|
| Overall approach | Pro | This is a process whose time has come; we need it to adapt to the exponential increase in information content that impacts our clinical decisionmaking |
| I found [the application] it to be both useful and interesting. | ||
| Con | I just don't like these types of thingsemail already takes up too much time. | |
| Curbside consults result in worse outcomes for the patient and the physician. I found myself uncomfortable using this approach. | ||
| My biggest concern is the interruption in one's thinking.distractions are becoming increasingly common. | ||
| I do appreciate colleagues input; but ask for it verbally.I am struggling to learn even texting. | ||
| Barriers to adoption | Pro | I think premise is great, it is just a matter of enough people participating to make it worthwhile to use. |
| There is power in numbers here‐people won't use it unless there is lots of activity or feedback. | ||
| I think it will be very useful if the whole department or sections are involved in promoting and participating. | ||
| Con | I did not test it much since the posts were not very frequent at the time that I tried it. | |
| The barrier to use is quality control; how to substantiate the quality of input provided is key. | ||
| Anonymous posting | Pro | I would not have [posts] always be anonymous, but allow the user the option. |
| Anonymity would be greatI was concerned that some of my questions were "dumb." | ||
| Con | Anonymous posting would increase the risk of trolling. | |
| Suggested uses | I see a role for this app in relaying questions to subspecialty groups for judgment call questions. | |
| Best place to talk about weird cases, odd presentations; to ask have you ever seen anything like this before. | ||
| Consider rolling it out to entire family medicine department and/or primary care network. |
DISCUSSION
In the current study, we developed and field‐tested the application DocCHIRP, which helps HCPs crowdsource information from each other in near real time. The average response latency in this pilot trial was 20 minutes, which was unexpectedly fast given the relatively small size of the participating crowd. Additionally, nearly one‐third of users accessed the server in the evening using the web interface rather than their mobile phone. This suggests that although HCPs liked having direct access to colleagues in near real time, the also valued the opportunity to connect asynchronously after hours.
Relative to the total number of page views, the number of HCPs using the technology for peer‐to‐peer consultation was low. Feedback provided in the post‐trial survey suggested several reasons for this effect. Some providers viewed the application without posting because they were reluctant to disclose knowledge gaps to their peers. Several users suggested implementing a system that supports anonymous posting, but others thought this would undermine the value of the information provided. Additionally, users recognized the potential for crowdsourcing to adversely effect HCP's productivity and daily workflow. This is relevant given growing concerns about distracted doctoring and association with reduced safety and quality of medical care.[14] This concept is further echoed in a paper by Wu et al. demonstrating that frequent interruptions offset the perceived benefit of increased mobility afforded by the use of mobile technology.[15] However, it is worth considering that if implemented properly, study participants believe crowdsourcing could have a net neutral impact on clinical workflow by improving the efficiency of provider communication and saving time otherwise spent problem solving. Participants also felt the approach could infringe on an already threatened work‐life boundary, and could also lead to unprofessional and antisocial behaviors.[16] Collectively, these problems are not unique to medical crowdsourcing, and prior experience in this area may offer several viable solutions. First, because crowd burnout is inversely proportional to crowd size, successful adoption in practice will require growing a provider base of sufficient depth and expertise to handle the consult demand. With the expansion of accountable care organizations across the United States, this will not likely be a limiting factor. And although not implemented here, flexible notification settings, user‐defined identity rules, and other higher‐level software design elements should alleviate the issues related to provider reputation and workflow interruptions.
Overall, HCPs are optimistic that mobile handheld technologies will benefit their practice.[17] Yet, software‐based approaches including expert decision support systems must overcome particular hurdles including lack of provider trust in the algorithms used in these approaches.[18] In the end, trust is ultimately a human phenomena; users will only trust the system if they know the information came from a trusted and highly reputable individual or institution. By tapping the expertise of a network of institutional colleagues, crowdsourcing addresses this issue of trust. Appropriately, providers were also concerned about the legality and personal risk of using crowdsourcing to discuss matters related to patient care. The technology was not intended to share protected health information, and as with other forms of digital communication, providers were cautioned during the consent process to monitor their behavior in this regard. Although soliciting advice from the medical crowd has an inherently higher level of risk compared to the use of crowdsourcing in education, research, or business, the index provider is ultimately responsible for considering all available information before making any treatment decision.
Though our pilot trial was not designed to assess effects on HCP efficiency or on the quality of care delivered, our work provides a unique window on the information‐seeking behaviors HCPs and highlights potential modifications that could enhance the utility of future crowdsourcing programs. Because the trial was performed within the context of an academic health center, it remains to be seen how medical crowdsourcing will translate in private practice, rural clinics, and other clinical environments where peer‐to‐peer consultation is sought. Given the potential for high‐stakes information exchanges, further study regarding the use of medical crowdsourcing in a controlled environment will be required before the technology can be disseminated to a broader audience. If future iterations of the mobile crowdsourcing application can address the aforementioned adoption barriers and support the organic growth of the crowd of HCPs, we believe the approach could have a positive and transformative effect on how providers acquire relevant knowledge and care for patients.
Acknowledgements
The authors thank the physicians and nurse practitioners at the University of Rochester who participated in the trial. The authors also acknowledge Dr. Dan Goldstein at the Microsoft Research Group (New York, NY) for many helpful discussions.
Disclosures: This study was funded in part by grant support from the University of Rochester Robert B. Goergen Reach Fund (M.H.S.). Collaborative Informatics, LLC provided integrated mobile and server software used in this study. Dr. Halterman is co‐owner of Collaborative Informatics, LLC and oversaw the specifications and construction of the software used in this study. Dr. Halterman has provided the necessary conflict of interest documentation in keeping with the requirements of the University of Rochester. The DocCHIRP study was reviewed by the institutional review board at the University of Rochester and received approval posing minimal risk.
- , . The information‐seeking behaviour of doctors: a review of the evidence. Health Info Libr J. 2007;24(2):78–94.
- , , , . Information‐seeking behaviors of practitioners in a primary care practice‐based research network (PBRN). J Med Libr Assoc. 2005;93(2):206–212.
- . Physician use of the curbside consultation to address information needs: report on a collective case study. J Med Libr Assoc. 2006;94(2):137–144.
- , , , , . Uncovering tacit knowledge: a pilot study to broaden the concept of knowledge in knowledge translation. BMC Health Serv Res. 2011;11:198.
- , , , et al. Hospital variation and temporal trends in palliative and end‐of‐life care in the ICU. Crit Care Med. 2013;41(6):1405–1411.
- , , , et al. Comparison of user groups' perspectives of barriers and facilitators to implementing electronic health records: a systematic review. BMC Med. 2011;9:46.
- . The Rise of Crowdsourcing. Wired magazine. 2006;14(6):1–4.
- , , , , , . Novel web‐based tools combining chemistry informatics, biology and social networks for drug discovery. Drug Discov Today. 2009;14(5–6):261–270.
- , , , et al. Crowdsourcing—harnessing the masses to advance health and medicine: a systematic review. J Gen Intern Med. 2014;29(1):187–203.
- , , , . Smartphone use during inpatient attending rounds: prevalence, patterns and potential for distraction. J Hosp Med. 2012;7(8):595–599.
- . Biomedical informatics in the education of physicians. JAMA. 2010;304(11):1227–1228.
- . Mobile medical applications: guidance for industry and Food and Drug Administration staff. Washington, DC: U.S. Department of Health and Human Services, Food and Drug Administration; 2013.
- , , , , , . Limits of social mobilization. Proc Natl Acad Sci U S A. 2013;110(16):6281–6286.
- . the rise of electronic distraction in health care is addiction to devices contributing. J Anesth Clin Res. 2013;4:e112.
- , , , et al. An evaluation of the use of smartphones to communicate between clinicians: a mixed‐methods study. J Med Internet Res. 2011;13(3):e59.
- , . Instant mobile communication, efficiency, and quality of life. JAMA. 2008;299(10):1179–1181.
- , , . The impact of mobile handheld technology on hospital physicians' work practices and patient care: a systematic review. J Am Med Inform Assoc. 2009;16(6):792–801.
- . Issues of trust and ethics in computerized clinical decision support systems. Nurs Adm Q. 2006;30(1):21–29.
The volume of existing knowledge and the pace of discovery in medical science challenge a clinician's ability to access relevant information at the point of care. Knowledge gaps that arise in practice usually involve matters related to diagnosis, drug therapy, or treatment.[1] In the clinical setting, healthcare providers (HCPs) answer questions using a variety of online and print resources. Ironically, HCPs often lack the training required to find details regarding uncommon disorders or complex medical decisions that are not easily found or well represented in the published literature.[2] Instead, HCPs turn to trusted colleagues who possess the necessary expertise.[3]
Closing the knowledge‐to‐practice gap involves a range of factual information and data derived from published evidence, anecdotal experience, as well as organization‐ and region‐specific practices.[4] The inability to codify both explicit and tacit information has been linked to variability in prescription practices, excessive use of surgical services, and delayed decisions involving the appropriate provision of end‐of‐life care.[5] Although electronic medical record systems are not configured to support peer collaboration,[6] alternative strategies including crowdsourcing has been used successfully in other domains to tap collective intelligence of skilled workers.[7] Crowdsourcing allows organizations to explore problems at low cost, gain access a wide range of complementary expertise, and capture large amounts of data for analysis.[8, 9] Although an increasing number of physicians use either smartphones or tablets on the job,[10] peer‐to‐peer medical crowdsourcing has not been investigated, despite the fact that processes involving team‐based clinical decision making are associated with better outcomes.[11] Here we field tested the mobile crowdsourcing application DocCHIRP (Crowdsourcing Health Information Retrieval Protocol for Doctors) and assessed user opinion regarding its utility in the clinical setting.
MATERIALS AND METHODS
DocCHIRP Program Design
The authors (M.W.H., J.B., H.K.) conceptualized and designed DocCHIRP for mobile (iOS [Apple Inc., Cupertino, CA] and Android [Google Inc., Mountain View, CA]) and desktop use. Email prompts and push notifications, which were modeled after the application VizWiz (Rochester Human Computer Interaction Group, University of Rochester, Rochester, NY), supported near real‐time communication between HCPs. According to recent US Food and Drug Administration guidelines, DocCHIRP is considered a medical reference,[12] intended to share domain‐specific knowledge on diagnosis, therapy, and other medically relevant topics. Devices were password protected and encrypted according to university standards. A typical workflow involves an index provider faced with a clinical question that sends a consult question to 1 or more trusted providers. The crowd receiving the notification responds when available using either free‐text responses or agree/disagree prompts (Figure 1A,B). Providers use preference settings to manage crowd membership, notification settings, and demographics describing their expertise.
Trial Recruitment
The University of Rochester Research Subjects Review Board approved the study, in which prospective users were required to review and agree to a statement regarding potential liability as part of the consent process. In this pilot study, we invited a cross‐section of providers (n = 145) from the Departments of Neurology (including the Division of Pediatric Neurology), Pediatrics, Neuroradiology, Psychiatry, Orthopedics, Emergency Medicine, Internal Medicine, and Family Medicine to participate. E‐mail invitations were sent to HCPs in 3 phases in April (phase I), June (phase II), and August (phase III) over 244 consecutive days. At the conclusion of the trial, 85 HCPs (59%) had created accounts including attending physicians (n = 63), residents (n = 13), fellows (n = 1), and nurse practitioners (n = 8). We did not seek parity in either age or gender representation.
Data Analysis
Mobile device and network usage data, question and response strings, as well as data regarding hardware and browser identity were collected using Google Analytics (Google Inc.,
RESULTS
Attending and resident physicians represented the majority of DocCHIRP account holders (91%), with nurse practitioners accounting for the remaining sample (9%). There were 50 male and 35 female participants, with an age range of 28 to 78 years (median age, 43 years). Departmental affiliations included Pediatrics (n = 28, 33%), Neurology (n = 27, 32%), Internal Medicine (n = 10, 12%), Psychiatry (n = 4, 5%), the Division of Pediatric Neurology (n = 11, 13%), and others (n = 5, 6%). Of the 1544 total visits to the DocCHIRP site, providers favored using smart phones (56.8%) and tablets (9.5%) over the desktop interface (33.6%; Figure 1C). iPhone use (81.7%) surpassed the other platforms combined. Desktop users visited twice as many pages (16.8 pages/visit) compared to those using smart phones (5.5 pages/visit) or tablets (8.6 pages/visit). Desktop users remained engaged longer than mobile users (13 vs 5 minutes). In the post‐trial user survey, we received 72 valid surveys from 85 potential participants (85% response rate).
We used a tiered enrollment design, sending invitations to potential participants in 3 phases to study the relationship between the size of the HCP crowd and sustained use as reported in other social networks.[13] Using a cutoff of >3 visits per week to demarcate active periods of use, we saw during the initial phase of enrollment that 20 providers generated a total of 170 visits over 22 days (Figure 2A). The addition of 28 members (phase II, n = 48 total) extended active use by 28 days, with a total of 476 page visits. The addition of 32 members (phase III, n = 85 total) resulted in 56 days of active participation with 612 visits to the site. When plotted (Figure 2B), the relationship between crowd size (total number of registered users) and cumulative visits (R2 = 0.951), as well as crowd size and days of high activity (R2 = 0.953) were linear and direct. We also investigated the timing of user engagement by pooling the data and breaking down use by time of day and day of the week (Figure 3A,B). In addition to observing peak engagement during the midmorning and afternoon, times of anticipated physician‐patient contact, we observed a third use peak in the evening. With the exception of sporadic weekend use, DocCHIRP use clustered during midweek.
DocCHIRP users generated 45 questions. The fastest first response was returned in less than 4 minutes, with a median first response time of 19 minutes (Figure 3C). Analysis of the consult requests received revealed a clustering of 7 principal question‐response groups: (1) the effective use of medications, (2) complex medical decision making, (3) use of the application itself, (4) guidance regarding the standard of care, (5) selection and interpretation of diagnostic tests, (6) differential diagnosis, and (7) patient referral (Figure 3D). Consults regarding medication use and complex decision making were dominant themes (63%). Several consults generated multiple responses, broadening the scope of the original query or requesting additional information (Table 1).
| Question Type | Consult | Response(s) |
|---|---|---|
| ||
| Medication | How do you treat headache from viral meningitis? | R1: Any analgesic will work; need to clarify that the headache is not post‐LP, which may require blood patch. |
| Anyone know how oral fluconazole (liquid) tastes? We needed to prescribe for a young 13 year old. | R1: We should get a pharmacist on the chat. I would call the pharmacy and see if they can compound it with flavoring. | |
| How frequently do your patients complain of myalgias on statins? Have you prescribed coenzyme Q in this situation? | R1: Did you see the editorial in the Green Journal yesterday?Took the position that statins were not to blame. I usually give a trial off to make sure symptoms resolve. Usually I try them on a different statin.Have not routinely rx'd Q10. | |
| Complex medical decision making | Has anyone seen tapeworm infection from raw pork? Do we need to report this? We treated with mebendazole. | R1: You can check with CDC here: |
| R2: First‐line treatment for Tsolium is praziquantel or albendazole.However, mebendazole has also been used to successfully treat T solium. | ||
| R3: Whipworm is another common pork tapeworm.It is also covered by mebendazole | ||
| What are the current guidelines regarding the use of statins in patients with a history of lobar hemorrhage. | R1: Larger studies (SPARCL, HPS) both showed higher hemorrhage risks in statin treated patients.Cohort studies generally don't show an obvious risk to statins. I've generally taken patients off their statins when they come in with lobar ICH, and more neutral when it's a hypertensive bleed. | |
| Standard of care | How often would someone have to fall before you felt uncomfortable anticoagulating for AFib? | R1: The risk of falls alone should not automatically disqualify a person from being treated with warfarin. |
| R2: I recall reading a meta‐analysis that suggested 300 falls/year would start to favor not anticoagulating, but short of that, falls were not an important factor. | ||
| Anyone used IVIG for any of the following: autoimmune encephalopathy, NMO, paraneoplastic limbic encephalitis, PANDAS? | R1: We had a patient recently with a history of autoimmune encephalopathy who was treated with IVIG. | |
| Administrative | What medical apps do you have on your phone? | R1: DocCHIRP, Epocrates, NIH stroke calculator. |
| R2: I have Merck Medicus, Micromedex drugs, growth charts, and shotsall those are free.I also have Red Book from AAPand Sanford Guide, which I paid for. | ||
| R3: Instant ECG, ACLS Advisor, 10‐Second EM. | ||
| Testing | What would be considered a normal vitamin D level in a 2 year old? | R1: We typically treat at a level less than 30, with likely greater treatment if less than 21. I'm sure our phone nurses would be willing to share [our protocol]. |
| I have an obese 13‐year‐old AA girl with acanthosis nigricans. Do you check HbA1c? | R1: Yes. Sign of insulin resistance. HbA1c along with fasting blood glucose are a good start.Close monitoring indicated regardless. Endo may have more insight as to whether or not other labs are useful, such as fasting C‐peptide. | |
| Referral | Has anyone ever seen preteen or teen patients with ADHD‐like symptoms and poor sleep referred for a sleep study for possible restless leg syndrome? | R1: RLS seen in kids, but criteria are different for children than adults.Sleep studies may be warranted. |
| R2: I've also heard about a link between restless leg and iron deficiency. Is it a girl? | ||
| R3: Checking CBC, ferritin, and iron is a good start. | ||
To better understand factors influencing use of the mobile crowdsourcing application, we surveyed users, receiving 68 comments related to the overall approach and barriers to adoption among other aspects (Table 2). The 40 comments regarding the use of medical crowdsourcing were divided evenly between supporters and critics. Enthusiasm for cross‐discipline collaboration, having tools to codify expert knowledge, and discovering consensus opinion from the expert crowd was offset by concerns that push notifications would distract providers, compromise efficiency, and potentially lead providers to act on inaccurate information.
| Category | Comments | |
|---|---|---|
| Overall approach | Pro | This is a process whose time has come; we need it to adapt to the exponential increase in information content that impacts our clinical decisionmaking |
| I found [the application] it to be both useful and interesting. | ||
| Con | I just don't like these types of thingsemail already takes up too much time. | |
| Curbside consults result in worse outcomes for the patient and the physician. I found myself uncomfortable using this approach. | ||
| My biggest concern is the interruption in one's thinking.distractions are becoming increasingly common. | ||
| I do appreciate colleagues input; but ask for it verbally.I am struggling to learn even texting. | ||
| Barriers to adoption | Pro | I think premise is great, it is just a matter of enough people participating to make it worthwhile to use. |
| There is power in numbers here‐people won't use it unless there is lots of activity or feedback. | ||
| I think it will be very useful if the whole department or sections are involved in promoting and participating. | ||
| Con | I did not test it much since the posts were not very frequent at the time that I tried it. | |
| The barrier to use is quality control; how to substantiate the quality of input provided is key. | ||
| Anonymous posting | Pro | I would not have [posts] always be anonymous, but allow the user the option. |
| Anonymity would be greatI was concerned that some of my questions were "dumb." | ||
| Con | Anonymous posting would increase the risk of trolling. | |
| Suggested uses | I see a role for this app in relaying questions to subspecialty groups for judgment call questions. | |
| Best place to talk about weird cases, odd presentations; to ask have you ever seen anything like this before. | ||
| Consider rolling it out to entire family medicine department and/or primary care network. |
DISCUSSION
In the current study, we developed and field‐tested the application DocCHIRP, which helps HCPs crowdsource information from each other in near real time. The average response latency in this pilot trial was 20 minutes, which was unexpectedly fast given the relatively small size of the participating crowd. Additionally, nearly one‐third of users accessed the server in the evening using the web interface rather than their mobile phone. This suggests that although HCPs liked having direct access to colleagues in near real time, the also valued the opportunity to connect asynchronously after hours.
Relative to the total number of page views, the number of HCPs using the technology for peer‐to‐peer consultation was low. Feedback provided in the post‐trial survey suggested several reasons for this effect. Some providers viewed the application without posting because they were reluctant to disclose knowledge gaps to their peers. Several users suggested implementing a system that supports anonymous posting, but others thought this would undermine the value of the information provided. Additionally, users recognized the potential for crowdsourcing to adversely effect HCP's productivity and daily workflow. This is relevant given growing concerns about distracted doctoring and association with reduced safety and quality of medical care.[14] This concept is further echoed in a paper by Wu et al. demonstrating that frequent interruptions offset the perceived benefit of increased mobility afforded by the use of mobile technology.[15] However, it is worth considering that if implemented properly, study participants believe crowdsourcing could have a net neutral impact on clinical workflow by improving the efficiency of provider communication and saving time otherwise spent problem solving. Participants also felt the approach could infringe on an already threatened work‐life boundary, and could also lead to unprofessional and antisocial behaviors.[16] Collectively, these problems are not unique to medical crowdsourcing, and prior experience in this area may offer several viable solutions. First, because crowd burnout is inversely proportional to crowd size, successful adoption in practice will require growing a provider base of sufficient depth and expertise to handle the consult demand. With the expansion of accountable care organizations across the United States, this will not likely be a limiting factor. And although not implemented here, flexible notification settings, user‐defined identity rules, and other higher‐level software design elements should alleviate the issues related to provider reputation and workflow interruptions.
Overall, HCPs are optimistic that mobile handheld technologies will benefit their practice.[17] Yet, software‐based approaches including expert decision support systems must overcome particular hurdles including lack of provider trust in the algorithms used in these approaches.[18] In the end, trust is ultimately a human phenomena; users will only trust the system if they know the information came from a trusted and highly reputable individual or institution. By tapping the expertise of a network of institutional colleagues, crowdsourcing addresses this issue of trust. Appropriately, providers were also concerned about the legality and personal risk of using crowdsourcing to discuss matters related to patient care. The technology was not intended to share protected health information, and as with other forms of digital communication, providers were cautioned during the consent process to monitor their behavior in this regard. Although soliciting advice from the medical crowd has an inherently higher level of risk compared to the use of crowdsourcing in education, research, or business, the index provider is ultimately responsible for considering all available information before making any treatment decision.
Though our pilot trial was not designed to assess effects on HCP efficiency or on the quality of care delivered, our work provides a unique window on the information‐seeking behaviors HCPs and highlights potential modifications that could enhance the utility of future crowdsourcing programs. Because the trial was performed within the context of an academic health center, it remains to be seen how medical crowdsourcing will translate in private practice, rural clinics, and other clinical environments where peer‐to‐peer consultation is sought. Given the potential for high‐stakes information exchanges, further study regarding the use of medical crowdsourcing in a controlled environment will be required before the technology can be disseminated to a broader audience. If future iterations of the mobile crowdsourcing application can address the aforementioned adoption barriers and support the organic growth of the crowd of HCPs, we believe the approach could have a positive and transformative effect on how providers acquire relevant knowledge and care for patients.
Acknowledgements
The authors thank the physicians and nurse practitioners at the University of Rochester who participated in the trial. The authors also acknowledge Dr. Dan Goldstein at the Microsoft Research Group (New York, NY) for many helpful discussions.
Disclosures: This study was funded in part by grant support from the University of Rochester Robert B. Goergen Reach Fund (M.H.S.). Collaborative Informatics, LLC provided integrated mobile and server software used in this study. Dr. Halterman is co‐owner of Collaborative Informatics, LLC and oversaw the specifications and construction of the software used in this study. Dr. Halterman has provided the necessary conflict of interest documentation in keeping with the requirements of the University of Rochester. The DocCHIRP study was reviewed by the institutional review board at the University of Rochester and received approval posing minimal risk.
- , . The information‐seeking behaviour of doctors: a review of the evidence. Health Info Libr J. 2007;24(2):78–94.
- , , , . Information‐seeking behaviors of practitioners in a primary care practice‐based research network (PBRN). J Med Libr Assoc. 2005;93(2):206–212.
- . Physician use of the curbside consultation to address information needs: report on a collective case study. J Med Libr Assoc. 2006;94(2):137–144.
- , , , , . Uncovering tacit knowledge: a pilot study to broaden the concept of knowledge in knowledge translation. BMC Health Serv Res. 2011;11:198.
- , , , et al. Hospital variation and temporal trends in palliative and end‐of‐life care in the ICU. Crit Care Med. 2013;41(6):1405–1411.
- , , , et al. Comparison of user groups' perspectives of barriers and facilitators to implementing electronic health records: a systematic review. BMC Med. 2011;9:46.
- . The Rise of Crowdsourcing. Wired magazine. 2006;14(6):1–4.
- , , , , , . Novel web‐based tools combining chemistry informatics, biology and social networks for drug discovery. Drug Discov Today. 2009;14(5–6):261–270.
- , , , et al. Crowdsourcing—harnessing the masses to advance health and medicine: a systematic review. J Gen Intern Med. 2014;29(1):187–203.
- , , , . Smartphone use during inpatient attending rounds: prevalence, patterns and potential for distraction. J Hosp Med. 2012;7(8):595–599.
- . Biomedical informatics in the education of physicians. JAMA. 2010;304(11):1227–1228.
- . Mobile medical applications: guidance for industry and Food and Drug Administration staff. Washington, DC: U.S. Department of Health and Human Services, Food and Drug Administration; 2013.
- , , , , , . Limits of social mobilization. Proc Natl Acad Sci U S A. 2013;110(16):6281–6286.
- . the rise of electronic distraction in health care is addiction to devices contributing. J Anesth Clin Res. 2013;4:e112.
- , , , et al. An evaluation of the use of smartphones to communicate between clinicians: a mixed‐methods study. J Med Internet Res. 2011;13(3):e59.
- , . Instant mobile communication, efficiency, and quality of life. JAMA. 2008;299(10):1179–1181.
- , , . The impact of mobile handheld technology on hospital physicians' work practices and patient care: a systematic review. J Am Med Inform Assoc. 2009;16(6):792–801.
- . Issues of trust and ethics in computerized clinical decision support systems. Nurs Adm Q. 2006;30(1):21–29.

Type 2 diabetes begins in utero?
A new study1 provides the first evidence of a direct effect of maternal metabolism on fetal brain activity, suggesting that insulin resistance, the precursor to type 2 diabetes, begins its formation prenatally.
DETAILS OF THE STUDY
Dr. Katarzyna Linder from the University Hospital Tübingen in Germany and colleagues included in their study 13 healthy pregnant women with normal, singleton pregnancies of between 27 and 36 weeks. All of the women underwent an oral glucose tolerance test, meaning that after a 5-hour overnight fast, each woman drank a solution containing 75 g glucose. The investigators ascertained blood glucose and plasma insulin levels from blood samples taken at 0, 60, and 120 minutes.
At approximately the same time points, but before they drew each blood sample, the authors obtained a fetal magnetoencephalography (fMEG) measurement in an effort to noninvasively record brain activity in utero. During each measurement, they presented an auditory sequence to the fetus. Most (75%) of the time, the sound presented had a frequency of 500 Hz, but 25% of the time the researchers presented a deviant tone with a frequency of 750 Hz to prevent habituation.
The researchers found that maternal insulin sensitivity significantly correlated with response latency of the fetus at the 60-minute time point, so that the higher the insulin sensitivity of the mother, the shorter the response time of the fetus to the sound. The association remained significant even after the investigators controlled for relative maternal weight gain, gestational age, and the child’s birth weight. No significant correlation existed at baseline or at 120 minutes.
The investigators then split the women into 2 groups: those who were insulin-resistant and those who were insulin-sensitive. They found that the fetuses of the insulin-resistant moms were almost 40% slower to respond to the auditory stimuli than those of the insulin-sensitive moms (mean [SD], 283 [79] ms vs 178 [46] ms; P=.03).
INTERPRETING THE FINDINGS
According to the US Centers for Disease Control and Prevention, almost one-third (30.3%) of US adults between the ages of 20 and 39 years—the primary child-bearing years—are obese,2 as are 17% of our children and adolescents—triple the rate of 1 generation previous.3 Furthermore, 25.8 million people in the United States have diabetes, including 1 in every 400 children and adolescents.4
Experts know that the children of obese or diabetic mothers are at increased risk for obesity and type 2 diabetes as adults, and that the connection is not purely genetic; environmental and epigenetic (environmental elements that affect genetics) factors also play key roles. The latter is the basis for the fetal or developmental origins hypothesis,5 which posits that a pregnant woman’s exposure to certain environmental factors can affect the programming of her unborn child and impact adult health.
The authors of the current study demonstrate that the metabolism of a pregnant woman after a sugar load directly affects the response time and brain activity of her developing fetus. They suggest as a mechanism for the effect that “insulin-resistant mothers have higher glucose levels accompanied by increased insulin levels in the postprandial state. As glucose passes the placenta, these postprandially increased glucose levels induce hyperinsulinaemia in the fetus.” The resulting chronic hyperinsulinemia “might induce insulin resistance in the fetal brain.”
1. Linder K, Schleger F, Ketterer C, et al. Maternal insulin sensitivity is associated with oral glucose-induced changes in fetal brain activity. Diabetologia. 2014. [Epub ahead of print]
2. Adult obesity facts. Centers for Disease Control and Prevention Web site. http://www.cdc.gov/obesity/data/adult.html. Accessed April 12, 2014.
3. Childhood overweight and obesity. Centers for Disease Control and Prevention Web site. http://www.cdc.gov/obesity/childhood/index.html. Accessed April 12, 2014.
4. Statistics about diabetes. American Diabetes Association Web site. http://www.diabetes.org/diabetes-basics/statistics/. Accessed April 12, 2014.
5. Wadhwa PD, Buss C, Entringer S, Swanson JM. Developmental origins of health and disease: brief history of the approach and current focus on epigenetic mechanisms. Semin Reprod Med. 2009;27(5):358–368.
A new study1 provides the first evidence of a direct effect of maternal metabolism on fetal brain activity, suggesting that insulin resistance, the precursor to type 2 diabetes, begins its formation prenatally.
DETAILS OF THE STUDY
Dr. Katarzyna Linder from the University Hospital Tübingen in Germany and colleagues included in their study 13 healthy pregnant women with normal, singleton pregnancies of between 27 and 36 weeks. All of the women underwent an oral glucose tolerance test, meaning that after a 5-hour overnight fast, each woman drank a solution containing 75 g glucose. The investigators ascertained blood glucose and plasma insulin levels from blood samples taken at 0, 60, and 120 minutes.
At approximately the same time points, but before they drew each blood sample, the authors obtained a fetal magnetoencephalography (fMEG) measurement in an effort to noninvasively record brain activity in utero. During each measurement, they presented an auditory sequence to the fetus. Most (75%) of the time, the sound presented had a frequency of 500 Hz, but 25% of the time the researchers presented a deviant tone with a frequency of 750 Hz to prevent habituation.
The researchers found that maternal insulin sensitivity significantly correlated with response latency of the fetus at the 60-minute time point, so that the higher the insulin sensitivity of the mother, the shorter the response time of the fetus to the sound. The association remained significant even after the investigators controlled for relative maternal weight gain, gestational age, and the child’s birth weight. No significant correlation existed at baseline or at 120 minutes.
The investigators then split the women into 2 groups: those who were insulin-resistant and those who were insulin-sensitive. They found that the fetuses of the insulin-resistant moms were almost 40% slower to respond to the auditory stimuli than those of the insulin-sensitive moms (mean [SD], 283 [79] ms vs 178 [46] ms; P=.03).
INTERPRETING THE FINDINGS
According to the US Centers for Disease Control and Prevention, almost one-third (30.3%) of US adults between the ages of 20 and 39 years—the primary child-bearing years—are obese,2 as are 17% of our children and adolescents—triple the rate of 1 generation previous.3 Furthermore, 25.8 million people in the United States have diabetes, including 1 in every 400 children and adolescents.4
Experts know that the children of obese or diabetic mothers are at increased risk for obesity and type 2 diabetes as adults, and that the connection is not purely genetic; environmental and epigenetic (environmental elements that affect genetics) factors also play key roles. The latter is the basis for the fetal or developmental origins hypothesis,5 which posits that a pregnant woman’s exposure to certain environmental factors can affect the programming of her unborn child and impact adult health.
The authors of the current study demonstrate that the metabolism of a pregnant woman after a sugar load directly affects the response time and brain activity of her developing fetus. They suggest as a mechanism for the effect that “insulin-resistant mothers have higher glucose levels accompanied by increased insulin levels in the postprandial state. As glucose passes the placenta, these postprandially increased glucose levels induce hyperinsulinaemia in the fetus.” The resulting chronic hyperinsulinemia “might induce insulin resistance in the fetal brain.”
1. Linder K, Schleger F, Ketterer C, et al. Maternal insulin sensitivity is associated with oral glucose-induced changes in fetal brain activity. Diabetologia. 2014. [Epub ahead of print]
2. Adult obesity facts. Centers for Disease Control and Prevention Web site. http://www.cdc.gov/obesity/data/adult.html. Accessed April 12, 2014.
3. Childhood overweight and obesity. Centers for Disease Control and Prevention Web site. http://www.cdc.gov/obesity/childhood/index.html. Accessed April 12, 2014.
4. Statistics about diabetes. American Diabetes Association Web site. http://www.diabetes.org/diabetes-basics/statistics/. Accessed April 12, 2014.
5. Wadhwa PD, Buss C, Entringer S, Swanson JM. Developmental origins of health and disease: brief history of the approach and current focus on epigenetic mechanisms. Semin Reprod Med. 2009;27(5):358–368.
Frustration Grows with SGR Fix, ICD-10 Transition
Congress has once again delayed implementation of draconian Medicare cuts tied to the sustainable growth rate (SGR) formula, but this time, the vote by lawmakers to patch the ailing physician reimbursement program rather than scrap it also pushes back the pending debut of ICD-10.
And that's frustrating some hospitalists.
"For about 12 hours, I felt relief about the ICD-10 and then I just realized, it's still coming, presumably," says John Nelson, MD, MHM, a co-founder and past president of SHM and medical director of the hospitalist practice at Overlake Hospital in Bellevue, Wash. "[It's] like a patient who needs surgery and finds out it's canceled for the day and he'll have it tomorrow. Well, that's good for right now, but [he] still has to face this eventually."
The SGR extension through year's end means that physicians do not face a 24% cut to physician payments under Medicare. The delay in transitioning healthcare providers from the ICD-9 medical coding classification system to the more complicated ICD-10 could mean the upgraded system may not go into effect until at least Oct. 1, 2015. This comes after the Centers for Medicare & Medicaid Services already pushed back the original implementation date for ICD-10 by one year.
SHM Public Policy Committee member Joshua Lenchus, DO, RPh, SFHM, says he expects the majority of doctors to be content with the delay, particularly in light of some estimates that show only 20% or so of physicians "have actually initiated the ICD-10 transition," but that it's unfair to those health systems that have prepared.
"ICD-9 has a little more than 14,000 diagnostic codes and nearly 4,000 procedural codes. That is to be contrasted to ICD-10, which has more than 68,000 diagnostic codes...and over 72,000 procedural codes," Dr. Lenchus writes in an e-mail to The Hospitalist's eWire. "So, it is not surprising that many take solace in the delay."
"It's distressing and frustrating for hospitalists, but less disruptive than it might be for hospitals," Dr. Nelson says. "And, of course in some places, hospitalists may be the physician leads on ICD-10 efforts, so [they are] very much wrapped up in the problem of 'What do we do now?'"
Visit our website for more information about ICD-10.