User login
ICU Pressure Improves Patient Transfers to the Hospital Floor
Clinical question: Does ICU strain negatively affect the outcomes of patients transferred to the floor?
Background: With healthcare costs increasing and critical care staff shortages projected, ICUs will have to operate under increasing strain. This may influence decisions on discharging patients from ICUs and could affect patient outcomes.
Study design: Retrospective cohort study.
Setting: One hundred fifty-five ICUs in the United States.
Synopsis: Using the Project IMPACT database, 200,730 adult patients from 107 different hospitals were evaluated in times of ICU strain, determined by the current census, new admissions, and acuity level. Outcomes measured were initial ICU length of stay (LOS), readmission within 72 hours, in-hospital mortality rates, and post-ICU discharge LOS.
Increases of the strain variables from the fifth to the 95th percentiles resulted in a 6.3-hour reduction in ICU LOS, a 2.0-hour decrease in post-ICU discharge LOS, and a 1.0% increase in probability of ICU readmission within 72 hours. Mortality rates during the hospital stay and odds of being discharged home showed no significant change. This study was limited because the ICUs participating were not randomly chosen, outcomes of patients transferred to other hospitals were not measured, and no post-hospital data was collected, so no long-term outcomes could be measured.
Bottom line: ICU bed pressures prompt physicians to allocate ICU resources more efficiently without changing short-term patient outcomes.
Citation: Wagner J, Gabler NB, Ratcliffe SJ, Brown SE, Strom BL, Halpern SD. Outcomes among patients discharged from busy intensive care units. Ann Intern Med. 2013;159(7):447-455.
Can coffee reduce weight?
Caffeine in the form of tea and coffee is the most widely consumed, socially acceptable stimulant around the globe. More than 150 million people in the United States drink coffee daily, with an average intake of 2 cups (which contains about 280 mg of caffeine).
Caffeine results in the release of excitatory neurotransmitters. Caffeine may increase energy expenditure and has been associated with reduced body mass. Studies have observed lower body mass index (BMI) in coffee consumers, compared with individuals who don’t consume coffee. Coffee may reduce appetite and dietary intake.
Greek researchers at Harokopio University, Athens, conducted a cross-over study to evaluate the effects of caffeinated coffee on appetite and dietary intake (Obesity 2013;21:1127-32). Sixteen normal-weight and 17 overweight/obese habitual coffee consumers (at least 1 cup of coffee/day) were enrolled. Each participant took part in three trials at least 1 week apart. Participants were required to abstain from caffeine for 24 hours and then reported to the lab to consume a breakfast and 200 mL of one of three experimental beverages: instant coffee with 3 mg caffeine/kg body weight (Coffee 3); instant coffee with 6 mg caffeine/kg (Coffee 6); or water. Participants had to consume the breakfast and the beverage within 5 minutes.
During a 3-hour period following beverage consumption, appetite feelings and participants’ dietary intake the day before the experiment were assessed. After this 3-hour period, participants were offered an ad libitum lunch buffet. The following day, participants reported by telephone their food and fluid intake for the rest of the experiment day.
Normal-weight participants consumed comparable energy in the ad libitum meal and in their total daily intake in the three interventions. However, among overweight/obese individuals, Coffee 6 resulted in significantly reduced energy intake during the ad libitum meal, compared with Coffee 3, and in significantly reduced total day energy intake, compared with both water and Coffee 3.
Doses used in this study for participants were somewhat staggering. The average caffeine content of the beverage in the Coffee 6 group was 526 mg. This is the caffeine content of roughly four 8-ounce cups of brewed coffee. The authors acknowledged that the Coffee 6 beverage was not easily consumed by "most of the volunteers."
We need to be cautious about the use of this dosing in the clinical setting. But as part of comprehensive weight-management strategy, caffeinated coffee may be helpful for reducing energy intake.
Dr. Ebbert is professor of medicine, a general internist at the Mayo Clinic in Rochester, Minn., and a diplomate of the American Board of Addiction Medicine. The opinions expressed are those of the author. He reports no conflicts of interest.

Legislating kindness
Late in February, I drove to Annapolis, Md., to listen to testimony being given to our state’s Senate Finance Committee on a number of proposed bills relating to involuntary treatments. But this article is not going to be about those bills or the fuss that played out around them, but rather about what happened when I arrived a bit early and heard testimony on another piece of legislation that had nothing to do with psychiatry and everything to do with being human.
Ten bills were scheduled for public testimony that afternoon, and I arrived shortly after 1 p.m. to a hearing room in which there was standing room only. There are 11 members of the Senate Finance Committee; 10 were present, and I’m going to guess there were more than100 people in the room waiting to testify. The only other time I had gone to listen to public testimony was last year for Gov. Martin O’Malley’s Firearm Safety Act, and for that piece of legislation, 1,300 people were there to testify, the large majority of them being Second Amendment activists who were there to oppose the bill.
The legislation in question (the one I did not come to hear about) was Senate Bill 654. The description of that bill reads:
"This bill requires the Department of Health and Mental Hygiene to identify up-to-date, evidence-based, written information about Down syndrome. This information must be provided to health care facilities and providers, who must provide the information to expectant parents who receive a prenatal test result for Down syndrome and parents of a child diagnosed with Down syndrome."
My first thought was this is a standard of care issue, something to be addressed by the specialties involved, not something that should be the subject of legislation. We don’t really want to have condition-specific laws mandating what physicians must tell their patients, do we? Where would it stop: Would legislation be written for every disorder? Shouldn’t the clinician who knows the family determine what information is best for each individual and with what timing? Never mind the nuance of figuring out exactly what is "up to date" and what is not. And it’s not as though the parents couldn’t search for the information themselves – certainly there must be resources online.
Then the testimony began. There were women whose children had been diagnosed, generally in utero, before the time when one could Google the condition and search for available resources. They told stories of asking for resources, only to be told that their clinicians didn’t know of any. And they told stories of being counseled to abort after they wanted to continue with the pregnancy. They discussed how shocked and alone they felt, and how insensitive the care they received was. In addition, they talked about the value their children added to the world. And then the adult children with Down syndrome also testified. In a way, I felt like it was testimony for the rights of these people to be here, more so perhaps than testimony to require clinicians to give out the appropriate pamphlets.
Representatives from MedChi (the Maryland State Medical Society) and the Department of Health and Mental Hygiene also testified. While neither was opposed to the creation of lists and websites of resources and educational information, they did object to the mandate that the clinician must give the information at a specific time. What if the clinician felt it was not in that patient’s best interest to distribute the information to a specific patient or at a specific time? Perhaps it wasn’t there, but I heard the unspoken concern that the clinician might be subject to sanctions or accusations of malpractice if they neglected to distribute the information as required by law if the legislation passed. The Down syndrome information supporters said they had already gone office to office to provide pamphlets and information to clinicians, which were then placed in a drawer and not distributed. They objected to language that would change "must" to "may" with the idea that it wasn’t strong enough to move clinicians to action.
Another bill also caught my attention this year, although I was not present for any public testimony. Delegate Robert A. Costa proposed House Bill 279, legislation that would forbid a physician from charging or filing an insurance claim for any appointment that began more than 30 minutes from the scheduled time. The legislation did allow for an exclusion for emergencies, if the doctor presented an "emergency services verification number" to the patient, but it did not take into account that an appointment might start late because the patient was late!
Regardless of whether the legislation proposed by these two bills makes sense as something for lawmakers to address, and regardless of how practical they are in terms of both their intended and unintended consequences, the message of such legislation is clear: They represent distress at insensitive care and an attempt to legislate kindness. The message comes through that clinicians can’t be trusted to do what’s right, and laws must be passed to make sure they practice in a thoughtful and considerate manner. It would be nice to have some reasonable conclusion about how to rectify these situations without having legislators tell medical professionals how to practice. I don’t have an answer here, but I believe that passing more laws will create its own negative fallout, and we need to find a better route to kindness.
Dr. Miller is a coauthor of "Shrink Rap: Three Psychiatrists Explain Their Work" (Baltimore: the Johns Hopkins University Press, 2011).

IHS Takes Aim at HIV
In 2010, American Indians and Alaska Natives (AIANs) accounted for < 1% of the estimated 47,500 new cases of human immunodeficiency virus (HIV) infection in the U.S. However, that proportion is misleading. When population size is taken into account for 2011, AIANs ranked fifth in rates of HIV/AIDS (acquired immunodeficiency syndrome) diagnoses. And the rate of AIDS diagnosis for this group has been higher than that for whites since 1995, according to the Centers for Disease Control and Prevention (CDC).
Also, AIANs diagnosed with HIV/AIDS die sooner: Between 2003 and 2007, only 81% lived longer than 36 months after being diagnosed. In 2010, HIV infection was the ninth leading cause of death among AIAN men and women aged 25 to 34 years.
Race and ethnicity are not, by themselves, risk factors for HIV infection, the CDC says. American Indian and Alaska Natives also have high rates of Chlamydia trachomatis infection, gonorrhea, and syphilis—sexually transmitted diseases are a warning signal of contracting or spreading HIV. Substance abuse is another risk factor: Current illicit drug use is higher among AIANs (12.8%) than in other races or ethnicities.
Lack of access to appropriate health care is another crucial factor, especially in the extremely poor AIAN communities, where between 2002 and 2004 about twice the national average was living in poverty. An estimated 1 in 5 AIAN adults living with HIV/AIDS at the end of 2009 were unaware of their infection. And while 75% of those who found out they were living with HIV in 2010 were linked to medical care within 3 months, this was the lowest proportion of any group surveyed.
Effective prevention interventions, the CDC says, must be tailored to the population. But the AIAN population comprises 562 federally recognized tribes and at least 50 state-recognized tribes, with different culture, beliefs, practices, and languages. Further, at the time of AIDS diagnosis, more AIANs lived in rural areas and may have been less likely to be tested for HIV because of limited access to testing. They also may have been less likely to seek testing because of concerns of confidentiality in a small and close-knit community. More than half of AIANs who responded to the Behavioral Risk Factor Surveillance System survey during 1997-2000 said they had never been tested for HIV.
The Indian Health Service (IHS) created a video to promote testing, “Facing HIV/AIDS in Native Communities,” available at http://www.ihs.gov/hivaids. Promotional materials include radio public service announcements, and training kits. Information on reaching out through social media and other emerging technology can be found at http://www.aids.gov/using-new-media.
“We have shown the positive impact of focused HIV/AIDS screening, education, treatment, and prevention in a group of IHS facilities,” says IHS Chief Clinical Consultant for Infectious Diseases Dr. Jonathan Iralu. “Now is the time to offer the opportunity to have an ‘AIDS Free Generation’ to all American Indian and Alaska Native communities that we serve.”
Electronics workers may have elevated risk of death from NHL

Researchers have found evidence suggesting that men who work in microelectronics and business machine facilities may have an increased risk of dying from certain cancers, including non-Hodgkin lymphoma (NHL).
Their study, published in the American Journal of Industrial Medicine, was designed to assess the effects chemical exposure might have on the incidence of diseases and worker mortality.
The results showed that hourly male workers, who were more likely than other employees to be exposed to the chemicals studied, had a 1.5-fold increased risk of death from NHL.
However, the investigators did not observe a significant relationship between NHL and any of the chemicals studied.
This research originated from concerns about the release of trichloroethylene (TCE), perchlorethylene (PCE), and other industrial chemicals through groundwater and air emissions from several industrial facilities in a town in upstate New York.
Previous studies suggested the chemicals were associated with increases in the incidence of kidney, lung, and testicular cancer in the community. So researchers initiated a study of current and former workers of the local microelectronics and business machine facility.
Patient population
Sharon R. Silver, of the National Institute for Occupational Safety and Health in Cincinnati, Ohio, and her colleagues examined health outcomes among 34,494 former workers employed at the facility for at least 91 days between 1969 and 2001.
Machining workers were exposed to dust, noise, solvents, and metals. And “wet” process workers were exposed to chemical solutions used in manufacturing circuit boards and their substrates. The facility also had employees in non-production roles, including sales and office support, as well as computer programming.
The researchers evaluated the relationship between health outcomes and the estimated cumulative extent of potential chemical exposures, stratified according to gender and pay code.
Of the 34,494 workers, 69.7% were male. Among males, 15,447 were hourly workers, and 8590 were salaried. Among females, 8934 were hourly workers, and 1523 were salaried.
Chemical exposure
A previous study of this population revealed the use of 6 chemical agents (fiberglass, lead, methylene chloride, methyl chloroform, PCE, and TCE), 6 chemical classes (acid-base, aromatic hydrocarbons, chlorinated hydrocarbons, other hydrocarbons, chlorofluorocarbons, and metals), and general chemicals (including unspecified).
The potential for exposure to a chemical agent or class was much more common among hourly workers than salaried workers. Among males, 65.7% of hourly workers and 20% of salaried workers were exposed to at least 1 of the chemicals studied. Among females, exposure rates were 58.5% and 13.9%, respectively.
“Other hydrocarbons” was the chemical class that male hourly workers were potentially exposed to most often (60.5%). At least one-third of workers in this group had potential exposure to chlorinated hydrocarbons, lead, and acids and bases. TCE and PCE were the least common exposure agents among male hourly workers, with 13.9% and 15.1% exposed, respectively.
Cancer mortality, incidence
The investigators used mortality rates from the US population, as well as New York State (excluding New York City), to calculate the number of expected deaths among study participants. The standardized mortality ratio (SMR) is the ratio of observed to expected deaths.
The average follow-up was 25.7 years. By the study end date, 5966 workers (17.3%) had died. Workers employed less than a year at the facility (n=8397) comprised 363 of these deaths.
Both all-cause mortality (SMR=0.67) and all-cancer mortality (SMR=0.74) showed a statistically significant deficit for the entire workforce. Most of the individual cancers and other conditions studied were not associated with an increased risk of death.
There were significant increases in death for certain cancers among males, but there was no significant increase in a specific cause of death among females belonging to either pay code.
There was an increased risk of death from NHL among male hourly workers but not salaried workers, with SMRs of 1.49 and 0.68, respectively. The same pattern occurred for rectal cancer, with SMRs of 1.71 and 0.71, respectively.
The study also revealed an elevated incidence of pleural cancers in salaried males, mesothelioma in hourly workers, and testicular cancer in salaried males.
The increase in mesothelioma and pleural cancers was seen only in workers hired before 1969, which would support a link between the cancers and asbestos exposure. However, the researchers could find no evidence that asbestos was used in manufacturing at the facility.
Similarly, the investigators found no significant link between exposure to specific chemicals and the increased mortality from NHL or rectal cancer. And there was no significant link between exposure and testicular cancer.
Although these results do not suggest a strong role for occupational chemical exposures in cancer incidence and mortality, the researchers said risks from occupational exposures cannot be ruled out due to limitations of this study and the relative youth of this patient cohort. ![]()
Age-adjusted D-dimer cutoff appears safe, effective

embolism; Credit: Medical
College of Georgia
Incorporating age into D-dimer test results can help clinicians more accurately diagnose pulmonary embolism (PE) in older patients, according to a new study.
Adjusting the D-dimer cutoff between abnormal and normal results according to a patient’s age allowed researchers to better differentiate healthy patients from those with PE.
The method did prove ineffective in 1 patient, who was ultimately diagnosed with venous thromboembolism (VTE).
But the remaining 300 patients who had D-dimer levels above the standard cutoff and below their age-adjusted cutoff were VTE-free during follow-up.
And among patients aged 75 and older, the age-adjusted cutoff safely excluded PE in about 30% of patients, whereas the standard cutoff excluded PE in about 6%.
Marc Righini, MD, of Geneva University Hospital in Switzerland, and his colleagues conducted this research and described their results in JAMA.
Previous studies showed that D-dimer levels increase with age. So the proportion of healthy patients with abnormal test results (above 500 µg/L for most tests) increases with age, and this limits the test’s utility in older patients.
Therefore, Dr Righini and his colleagues decided to determine whether an age-adjusted D-dimer threshold could safely exclude the diagnosis of PE in older patients. The team changed the cutoff between abnormal and normal results by multiplying the patient’s age by 10 in those 50 years or older.
The study included 3324 patients with suspected PE who first underwent a clinical probability assessment using either the simplified, revised Geneva score or the 2-level Wells score for PE.
If patients had a high clinical probability of PE (n=426), they underwent computed tomography pulmonary angiography (CTPA) and received treatment according to the results.
If PE was deemed unlikely, patients had a D-dimer test. Of these 2898 patients, 817 had normal results (< 500 μg/L), 337 had D-dimer levels ≥ 500 μg/L but below their age-adjusted cutoff, and 1744 had results higher than their age-adjusted cutoff.
Those 1744 patients joined the group of 426 who underwent CTPA (n=2170), and 631 of them were diagnosed with PE.
Of the 1539 patients who were not diagnosed with PE, 1481 completed the 3-month follow-up without receiving anticoagulant therapy. During that time, 7 of those patients had a confirmed VTE.
Of the 337 patients who had D-dimer levels ≥ 500 μg/L but below their age-adjusted cutoff, 331 completed follow-up without anticoagulation. And 1 of those patients was diagnosed with a VTE during that time.
Similarly, of the 817 patients who had normal D-dimer results, 810 completed follow-up without anticoagulation, and 1 patient was diagnosed with VTE.
So the age-adjusted D-dimer test and clinical probability assessment proved largely effective in identifying those patients at risk of VTE. But it also increased the proportion of elderly patients in whom PE could be safely excluded without further imaging.
Among the 766 patients aged 75 and older, 673 did not have a high clinical probability of PE. And using the age-adjusted cutoff instead of the 500 μg/L cutoff increased the proportion of patients in whom PE could be excluded from 6.4% (43/673) to 29.7% (200/673), without any additional false-negative findings.
The researchers said future studies should assess the utility of the age-adjusted D-dimer cutoff in clinical practice. It remains to be seen whether this method can decrease costs or improve the quality of care. ![]()
NICE wants more info on lenalidomide in MM

Credit: CDC
The UK’s National Institute for Health and Care Excellence (NICE) has issued a draft guidance recommending against the use of lenalidomide (Revlimid) in multiple myeloma (MM) patients who have previously received bortezomib.
Based on current information, NICE has said it cannot recommend the drug for patients who have received bortezomib once and are unable to receive thalidomide or undergo hematopoietic stem cell transplant.
NICE’s previous recommendation regarding lenalidomide in MM has not changed. The drug will still be available through the National Health Service (NHS) for MM patients who have received 2 or more prior therapies.
“We are now looking specifically at how well lenalidomide works after someone has received bortezomib, and whether it provides value for money,” said Sir Andrew Dillon, NICE Chief Executive.
“However, from the information provided by the manufacturer, it was unclear if lenalidomide was as effective as re-treatment with bortezomib, and the manufacturer’s own economic model showed that the drug would not be cost effective at this stage.”
“Because of this, we are unable to recommend the drug in preliminary recommendations. We hope that the manufacturer, Celgene, will look again at their submission.”
NICE also pointed out that, since the organization recommended lenalidomide for MM in 2009, there have been no studies comparing lenalidomide to other treatments in these patients. Celgene has only provided data comparing lenalidomide to placebo.
In addition, for the 2009 guidance, Celgene submitted a patient access scheme, where they bear the costs of the drug beyond 26 cycles (normally for a period of 2 years). And this enabled NICE to recommend the drug. But Celgene has not submitted a patient access scheme for the current appraisal.
NICE considered all the cost effectiveness models Celgene submitted to be fundamentally flawed.
NICE concluded that the most plausible costs per quality-adjusted life-year for lenalidomide compared with bortezomib or standard chemotherapies were more than £30,000, whether bortezomib re-treatment was appropriate or not.
Lenalidomide is available as a 21-capsule pack. The cost per pack varies according to capsule size: £3570 (5 mg), £3780 (10 mg), £3969 (15 mg), and £4368 (25 mg). The recommended starting dose is 25 mg orally, once daily on days 1-21 of repeated 28-day cycles.
The draft guidance is open for public comment until April 4. Until a final guidance is issued, NHS bodies should make decisions locally on the funding of specific treatments. Once NICE issues its final guidance, it replaces local recommendations. ![]()
FDA approves drug for infantile hemangioma

infant’s stomach
The US Food and Drug Administration has approved oral propranolol hydrochloride (Hemangeol) to treat proliferating infantile hemangiomas that require systemic therapy.
The drug, which is also under review in the European Union, will be available in the US in June.
Infantile hemangioma is the most common vascular benign tumor of infancy, affecting 3% to 10% of newborns. The lesions are rarely detectable at birth and start growing noticeably in the first 4 to 6 weeks of life.
While most infantile hemangiomas do not require treatment, approximately 12% do. Depending upon their location, infantile hemangiomas might impair breathing, eating, or vision, or become life-threatening.
Propranolol has long been used in cardiology, but its use in infantile hemangiomas is relatively new. In 2007, Christine Léauté-Labreze, MD, a dermatologist at the Bordeaux University Hospital in France, discovered that propranolol could treat infantile hemangiomas.
Since then, the drug has been used for this indication off-label. And in 2009, Pierre Fabre Dermatologie began developing propranolol hydrochloride for use in infantile hemangiomas.
In a study of 32 children, propranolol slowed the growth of infantile hemangiomas in 100% of patients. Patients had received propranolol at 2 to 3 mg/kg per day for a median of 6.1 months. Side effects were “limited and mild,” according to researchers (V Sans et al. Pediatrics 2009).
Researchers also conducted a randomized, controlled trial of the drug in infants 5 weeks to 5 months old at therapy initiation. The team compared 4 propranolol treatment protocols (1 or 3 mg/kg/day for 3 or 6 months) to placebo.
Propranolol at a daily dose of 3 mg/kg for 6 months had a 60.4% success rate, compared to 3.6% in the placebo group (P<0.0001). Success was defined as complete or nearly complete resolution of the target hemangioma. However, 11.4% of patients needed to be re-treated after stopping propranolol.
The drug is contraindicated in premature infants who have a corrected age of less than 5 weeks, weight less than 2 kg, known hypersensitivity to propranolol or any of its excipients, asthma or a history of bronchospasm, pheochromocytoma, blood pressure less than 50/30 mmHg, a heart rate less than 80 beats per minute, greater than first degree heart block, or decompensated heart failure.
Propranolol hydrochloride can cause serious side effects, including hypoglycemia, bradycardia, hypotension, and bronchospasm. The drug can worsen congestive heart failure and may increase the risk of stroke in children with PHACE syndrome.
The most frequently reported adverse reactions, occurring in more than 10% of infants receiving propranolol hydrochloride, were sleep disorders, diarrhea, vomiting, and aggravated respiratory tract infections, such as bronchitis and bronchiolitis associated with cough and fever. Adverse reactions led to treatment discontinuation in fewer than 2% of treated patients. ![]()
Rehospitalization after Pneumonia
Pneumonia remains a significant problem in the United States, both in terms of mortality as well as cost to the healthcare system. Each year, over 1 million patients are hospitalized for pneumonia, with costs conservatively estimated at more than $7 billion in 2010.[1] One contributing factor for these costs is that pneumonia is the second most frequent reason for rehospitalization.[2] Rehospitalization after admission for pneumonia is now used as a marker for quality of care.
Given the cost and adverse outcomes of pneumonia, it is important to examine early rehospitalization to better understand what factors play a role. Studies have examined factors associated with readmission following an initial pneumonia‐related hospitalization. Adamuz et al. showed that additional healthcare visits and rehospitalizations within 30 days of discharge from the hospital were common and were associated with worsening of signs or symptoms of pneumonia and/or comorbidities.[3] Other studies demonstrated that instability on hospital discharge, as well as treatment failure, were associated with increased risk of rehospitalization.[4, 5] Jasti et al. found rehospitalizations following pneumonia were usually comorbidity related, primarily cardiopulmonary and/or neurologic disease, rather than due to the index pneumonia.[6] Many of these studies, and others looking at age, activity of daily living score, socioeconomic status, and comorbidity characteristics, were performed in relatively small cohorts. Predictors of rehospitalization have not been studied in a large cohort of patients in an integrated healthcare system.
Our study looks at factors not addressed in prior studies that have used administrative claims data to identify factors associated with early readmission. We also evaluated these admission risk factors in a veteran population, whereas prior studies have primarily focused on those who receive Medicare. The purpose of this study was to examine predictors of early (30 days) readmission in the Veterans Affairs (VA) healthcare system for patients age 65 years and older hospitalized for pneumonia. Our a priori hypothesis was that comorbid illnesses, such as congestive heart failure and chronic obstructive pulmonary disease, and patients with high medical complexity, such as high number of medications and/or prior hospitalizations and nursing home residence, are the primary factors associated with increased risk of rehospitalization.
METHODS
For this national cohort study, we used data from the VA healthcare system administrative and clinical databases that serve as repositories of clinical data from more than 150 VA hospitals and 850 outpatient clinics throughout the United States. The institutional review boards of the University of Texas Health Science Center at San Antonio and VA North Texas Health Care System approved this study. Details regarding the study design and methods were previously published.[7]
Inclusion Criteria
Patients included in this study were hospitalized between October 2001 and September 2007, had a primary diagnosis of pneumonia/emnfluenza (International Classification of Diseases, 9th Revision [ICD‐9] codes 480.0483.99 or 485487) or a secondary discharge diagnosis of pneumonia with a primary diagnosis of respiratory failure (ICD‐9 code 518.81) or sepsis (ICD‐9 code 038.xx),[8] and were aged 65 years or older on the date of admission. To ensure patients obtained their care primarily at the VA, at least 1 VA outpatient clinic visit in the year preceding the index admission and at least 1 active and filled outpatient medication from a VA pharmacy within 90 days of admission were required for inclusion.
If a patient was admitted more than once during the study period, only the first hospitalization was included as the index admission.
Exclusion Criteria
Patients who died during the initial hospitalization were not included in this study. Patients admitted to hospitals with fewer than 25 reported hospitalizations during October 2001 to September 2007 were excluded, as these hospitals are neither representative nor generalizable. This resulted in the removal of 59 patients from 5 different hospitals.
Data Sources and Definitions
We used inpatient and outpatient demographic, utilization, and comorbidity data from the National Patient Care Database. Pharmacy data were extracted from the Decision Support System National Data Extracts and Pharmacy Benefits Management. Vital status information was obtained from the Vital Status file, which incorporates data from veterans' death benefits claims, inpatient deaths, Medicare Vital Status files, and the Social Security Administration's death master file. We used encrypted patient identifiers link to information across these databases.
We obtained demographic information (age, sex, race, marital status) from inpatient and outpatient data. We categorized race as white, black, Hispanic, and other/unknown. To infer active smoking and/or tobacco cessation attempts, we identified ICD‐9 codes for tobacco use (305.1, V15.82), smoking cessation clinic use, and/or use of medications for the treatment of nicotine dependence (Zyban, nicotine replacement, or varenicline). We used VA priority status as a proxy for socioeconomic and disability status. VA priority groups are a way for the VA to focus limited funds to those veterans most in need. The highest group (priority group 1) must have at least a 50% service‐connected disability. Priority groups 2 through 6 include veterans with up to 40% service‐connected disability, former prisoners of war, those awarded certain honors, veterans with lower incomes, and the catastrophically disabled. The lowest groups (priority groups 7 and 8) include veterans with relatively higher incomes who agree to pay copayments.[9]
We also obtained information on comorbid conditions from inpatient and outpatient administrative data. We defined alcohol abuse using ICD‐9 codes 291, 303, 305.0, and illicit drug use with ICD‐9 codes 292, 304, 305 excluding 305.0‐.1. We used the Charlson Comorbidity Index to quantify levels of preexisting comorbidity[10] adapted for administrative databases, using ICD‐9 codes for 19 comorbid conditions from prior outpatient and inpatient encounters. We defined cardiovascular events and lung cancer that were diagnosed during the hospitalization as previously described.[11, 12]
Outcomes
Our primary study outcome was readmission within 30 days of hospital discharge for pneumonia from any VA acute care hospital only. Medicare has used 30‐day readmission as a quality indicator, as readmissions that occur closer to discharge are believed to be more likely due to events during the index hospitalization.[13]
Statistical Analyses
We randomly divided patients from our initial cohort into equal derivation or validation cohorts. We assessed differences between the 2 groups using the Student t test for continuous variables and 2 test for categorical variables. We performed univariate logistic regression analyses in the derivation cohort to examine the relationship between 30‐day rehospitalization and each of our potential covariates. We entered covariates that were significant at P<0.10 in the univariate analyses into a multiple regression model. Significant covariates at P<0.10 were then entered into the final model. For this model, we used bootstrapping with replacement in 1000 replications to obtain standard errors of our coefficients and associated P values. Because some subjects had more than 1 index admission, we used robust variancecovariance matrix estimators to compute standard errors for model coefficients.
We used the C statistic to assess the discrimination of our model. Calibration of this model was measured using the Hosmer‐Lemeshow 2 goodness of fit test, using 10 quantiles to group the data. We evaluated differences in discrimination between the derivation and validation cohorts by comparing C statistics.
Last, using the final model in the derivation cohort, 5 categories of severity were created based on subjects' predicted risk values for readmission. Severity categories in both the derivation and validation cohorts were then graphically evaluated.
We defined statistical significance as a 2‐tailed P value of <0.05. We used Stata 12 (StataCorp, College Station, TX) for all analyses.
RESULTS
Patient Characteristics
Of the 45,134 eligible patients, 13.2% were rehospitalized within 30 days, and rates by hospital ranged from 1.6% to 20.7%. Table 1 presents the comparison of baseline difference between the derivation and validation cohorts. There were no statistically significant differences between the 2 groups. Overall, the mean age was 77 years, 98% were male, and 54% were married. Over 90% of the patients received guideline‐concordant antibiotics, and only 10% required a stay in the intensive care unit (ICU). The average length of stay was 7 days (standard deviation of 11 days).
| Characteristics | Derivation Cohort, N=22,567 | Validation Cohort, N=22,567 | P Value |
|---|---|---|---|
| |||
| Sociodemographics | |||
| Age, mean (SD) | 77.3 (6.5) | 77.2 (6.5) | 0.30 |
| Male, no (%) | 22,133 (98.1) | 22,175 (98.3) | 0.14 |
| White, no (%) | 18,858 (83.6) | 18,719 (83.0) | 0.08 |
| Black, no (%) | 2,562 (11.4) | 2,583 (11.5) | 0.76 |
| Hispanic, no (%) | 1,337 (5.9) | 1,414 (6.3) | 0.13 |
| Married, no (%) | 12,166 (53.9) | 12,258 (54.3) | 0.39 |
| VA priority group, no (%) | 0.28 | ||
| 1 | 4,286 (19.0) | 4,281 (19.0) | |
| 26 | 16,306 (72.3) | 16,399 (72.8) | |
| 78 | 1,954 (8.7) | 1,860 (8.3) | |
| Nursing home residence, no (%) | 199 (0.9) | 216 (1.0) | 0.41 |
| Smoker status, no (%) | 8,579 (38.0) | 8,677 (38.5) | 0.34 |
| Index hospitalization factors | |||
| Myocardial infarction during hospitalization, no (%) | 469 (2.1) | 452 (2.0) | 0.57 |
| Heart failure during hospitalization, no (%) | 4,817 (21.4) | 4,772 (21.2) | 0.61 |
| Arrhythmia during hospitalization, no (%) | 4,356 (19.3) | 4,287 (19.0) | 0.41 |
| Length of stay, mean (SD) | 7.2 (10.4) | 7.2 (11.7) | 0.76 |
| Lung cancer diagnosis during hospitalization, no (%) | 31 (0.1) | 31 (0.1) | 1.00 |
| ICU admission, no (%) | 2,282 (10.1) | 2,336 (10.4) | 0.40 |
| Guideline concordant antibiotics, no (%) | 20,724 (91.8) | 20,643 (91.5) | 0.17 |
| Invasive mechanical ventilation, no (%) | 793 (3.5) | 832 (3.7) | 0.32 |
| Vasopressor use, no (%) | 495 (2.2) | 489 (2.2) | 0.85 |
| Hospital complications, no (%) | |||
| Renal organ failure | 2,671 (11.8) | 2,640 (11.7) | 0.65 |
| Cardiac organ failure | 1,004 (4.5) | 959 (4.3) | 0.30 |
| Hepatic organ failure | 33 (0.2) | 40 (0.2) | 0.41 |
| Respiratory organ failure | 1,623 (7.2) | 1,583 (7.0) | 0.46 |
| Comorbid illnesses | |||
| Medical, no (%) | |||
| Myocardial infarction | 1,528 (6.8) | 1,542 (6.8) | 0.79 |
| Congestive heart failure | 5,815 (25.8) | 5,697 (25.2) | 0.20 |
| Peripheral vascular disease | 3,413 (15.1) | 3,454 (15.3) | 0.59 |
| Cerebrovascular disease | 3,993 (17.7) | 4,078 (18.1) | 0.30 |
| Dementia | 1,141 (5.1) | 1,110 (4.9) | 0.50 |
| COPD | 12,168 (53.9) | 12,076 (53.5) | 0.39 |
| Rheumatologic disease | 646 (2.9) | 660 (2.9) | 0.69 |
| Peptic ulcer disease | 795 (3.5) | 723 (3.2) | 0.06 |
| Severe liver disease | 169 (0.8) | 169 (0.8) | 1.00 |
| Mild liver disease | 78 (0.4) | 80 (0.4) | 0.87 |
| Diabetes | 7,310 (32.4) | 7,410 (32.8) | 0.32 |
| Diabetes with complications | 2,229 (9.9) | 2,248 (10.0) | 0.77 |
| Chronic renal disease | 2,836 (12.6) | 2,745 (12.2) | 0.19 |
| Hemi/paraplegia | 319 (1.4) | 338 (1.5) | 0.46 |
| Any prior malignancy | 5,226 (23.2) | 5,269 (23.4) | 0.63 |
| Metastatic solid tumor | 748 (3.3) | 795 (3.5) | 0.22 |
| AIDS | 56 (0.3) | 49 (0.2) | 0.49 |
| HIV | 23 (0.1) | 13 (0.1) | 0.10 |
| Alcohol abuse | 897 (4.0) | 934 (4.1) | 0.38 |
| Drug abuse | 254 (1.1) | 255 (1.1) | 0.96 |
| Psychiatric, no (%) | |||
| Anxiety disorder | 1,692 (7.5) | 1,722 (7.6) | 0.59 |
| Depression indicator | 3,655 (16.2) | 3,718 (16.5) | 0.42 |
| Bipolar disorder | 430 (1.9) | 433 (1.9) | 0.92 |
| Cataract indicator | 6,106 (27.1) | 6,180 (27.4) | 0.43 |
| Prostatitis indicator | 4,680 (20.7) | 4,593 (20.4) | 0.31 |
| Schizophrenia indicator | 685 (3.0) | 676 (3.0) | 0.80 |
| Post‐traumatic stress disorder | 844 (3.7) | 862 (3.8) | 0.66 |
| Medication history within 90 days | |||
| Cardiovascular drugs, mean (SD) | 1.8 (1.6) | 1.8 (1.6) | 0.65 |
| Diabetes drugs, mean (SD) | 0.3 (0.7) | 0.3 (0.7) | 0.60 |
| Inhaled corticosteroids, mean (SD) | 0.4 (0.9) | 0.4 (0.9) | 0.28 |
| Pulmonary drug, mean (SD) | 1.3 (2.0) | 1.3 (2.0) | 0.36 |
| Oral corticosteroids, no (%) | 5,363 (23.8) | 5,505 (24.4) | 0.12 |
| Prior medical utilization | |||
| Number of primary care clinic visits within 1 year, mean (SD) | 4.9 (4.2) | 4.9 (4.2) | 0.67 |
| Number of emergency department visits within 1 year, mean (SD) | 1.2 (2.0) | 1.2 (2.0) | 0.86 |
| Number of outpatient clinic visits within 1 year, mean (SD) | 14.7 (13.1) | 14.6 (13.0) | 0.33 |
| Number of specialty clinic visits within 1 year, mean (SD) | 3.4 (5.5) | 3.3 (5.4) | 0.50 |
| Prior hospital admission within 90 days, no (%) | 5,062 (22.4) | 5,141 (22.8) | 0.37 |
Predictors of 30‐Day Readmission
All variables listed in Table 1 were evaluated. The derivation logistic regression model is shown in Table 2, and only includes predictors associated with rehospitalization. Antibiotic concordance and time in the ICU were evaluated and did not predict readmission. Variables that were significantly associated with rehospitalization in the models included age, marital status, the number of emergency department clinic visits a year prior, prior admission within 90 days, number of nonpharmacy clinic visits in a year prior, and hospital length of stay. The increasing age and number of emergency department and clinic visits were associated with higher odds of readmission. The longer the length of stay and those patients who were married had a lower odds of subsequent readmission. Other variables included were the presence of chronic renal disease, prior malignancy, nursing home residence, congestive heart failure, and prior use of oral corticosteroids. The C statistics for the derivation and validation models were 0.615 and 0.613, respectively. There were no significant differences in any of the variables between the derivation and validation cohorts.
| Predictors | OR | 95% CI | P Value | |
|---|---|---|---|---|
| Lower | Upper | |||
| ||||
| Sociodemographics | ||||
| Age at admission | 1.01 | 1.00 | 1.02 | <0.01 |
| White | 1.14 | 1.02 | 1.28 | 0.02 |
| Nonwhiteb | 1.00 | |||
| Hispanic | 1.26 | 1.07 | 1.47 | 0.01 |
| Not Hispanicc | 1.00 | |||
| Married | 0.89 | 0.82 | 0.96 | <0.01 |
| Not marriedd | 1.00 | |||
| Nursing home residence | 1.68 | 1.18 | 2.39 | <0.01 |
| Comorbid illnesses | ||||
| Peptic ulcer disease | 1.24 | 1.02 | 1.50 | 0.03 |
| Chronic renal disease | 1.18 | 1.06 | 1.33 | <0.01 |
| Any prior malignancy | 1.17 | 1.06 | 1.28 | <0.01 |
| Metastatic solid tumor | 1.20 | 0.98 | 1.47 | 0.08 |
| AIDS | 1.99 | 1.06 | 3.74 | 0.03 |
| Index admission factors | ||||
| Heart failure on initial admission | 1.18 | 1.07 | 1.29 | <0.01 |
| Length of stay (per day) | 0.97 | 0.97 | 0.98 | <0.01 |
| Medication history | ||||
| Cardiovascular drug count 90 days prior | 1.03 | 1.00 | 1.06 | 0.02 |
| Oral corticosteroids 90 days prior | 1.16 | 1.06 | 1.27 | <0.01 |
| Prior medical utilization | ||||
| Number of emergency department visits within 1 year | 1.04 | 1.02 | 1.06 | <0.01 |
| Number of specialty clinic visits within 1 year | 1.01 | 1.00 | 1.02 | 0.01 |
| Prior hospital admission within 90 days | 1.60 | 1.46 | 1.75 | <0.01 |
| Number of nonpharmacy clinic visits within 1 year | 1.00 | 1.00 | 1.01 | <0.01 |
Figure 1 shows that the derivation and validation models are similar in percent rehospitalization group in all severity groups.
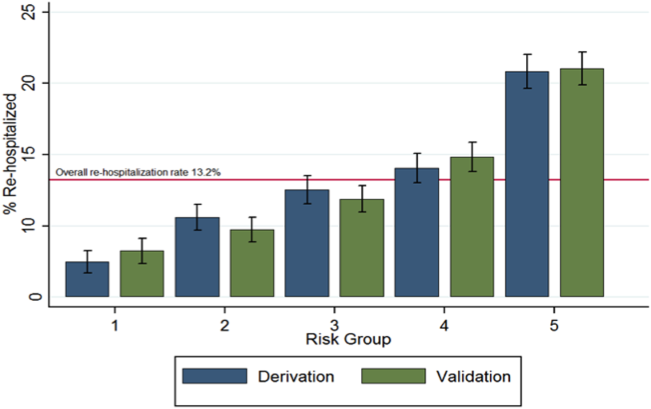
DISCUSSION
Sociodemographics and comorbidities, which are host factors, were significantly associated with rehospitalization of elderly patients admitted for pneumonia and length of hospital stay, the only pneumonia‐specific variable associated with readmission.[6, 14, 15, 16] Higher rates of all types of prior utilization (inpatient, outpatient, emergency department visits) were also associated with higher risk of rehospitalization. Our findings highlight the role that host factors play in rehospitalization of elderly patients with pneumonia and that there are few potentially modifiable targets to help reduce readmissions after pneumonia.
These findings may indicate 2 things: patients in this cohort are sicker than the general population at baseline and therefore require more medical care, and/or they are being evaluated by more providers increasing the chance they will be readmitted. For the former, an example is the association of prior use of oral corticosteroids with rehospitalization, which may demonstrate poorly controlled comorbidities (eg, chronic obstructive lung disease with recent exacerbation) that require steroid use. Given the VA's integrated healthcare system, greater access to primary care providers may lead to more opportunities for patients to voice their complaints, which can lead to more readmissions among severely ill patients. Weinberger et al. found an increase in hospital readmissions with increased access to primary care.[17] The association of readmission and length of stay is less likely related to pneumonia‐related clinical instabilities on discharge, but rather to the ability to address other potential issues related to the patient's underlying comorbidities.[5]
Our study presents a model looking at rehospitalization of patients with pneumonia, including factors not addressed in a prior publication by Lindenauer et al., the model Centers for Medicare and Medicaid Services (CMS) uses to predict early rehospitalization.[18] Lindenauer's model included 39 variables (of which 37 were clinical variables), including vertebral fractures, other injuries, other gastrointestinal disorders, other urinary tract disorders, as well as demographic and comorbidity factors that were similar to some of those included in our study. Their 30‐day rehospitalization medical record and administrative models had a C statistic of 0.59 and 0.63, respectively. A major difference between our presented model and the latter are the data on utilization of medical care. Despite these additional data, the resulting C statistics of 0.615 and 0.613 were not qualitatively better.
The similar C statistics demonstrates that factors playing a significant role in determining rehospitalization have yet to be identified, and it is not clear if researchers will be able to identify potentially modifiable risk factors for rehospitalization. Examples of other potential factors that should be examined in future studies include family/community support, quality of the transition of care back to their residence, and quality of inpatient care. Calvillo‐King et al. found a broad range of social factors that potentially affect the risk of postdischarge readmission for chronic heart failure.[19] For pneumonia, there were few studies that assessed the risk of social factors on readmission, and these were most commonly rather broad categories such as race/ethnicity or nursing home residence. In the publications that studied social factors and readmissions, there were inconsistent associations between hospital readmission with lower education, low income, and unemployment. Future articles may benefit from taking these additional factors into account.
Potential limitations to our study include the overwhelming majority of patients being male and in a VA population, which may limit generalizability. In addition, no data were available on the quality of the transition of care. Furthermore, limitations include the age of the data and the lack of evaluation of outpatient follow‐up and antibiotics on discharge. Though our data are up to 10 years old, this study evaluates risk factors that are still relevant. Finally, some variables noted in the CMS model were not evaluated in our study, such as protein‐calorie malnutrition, skin ulcers, and fracture history. Given these differences, we were unable to directly compare the performance of the 2 models.
Despite examining novel factors related to prior healthcare utilization, our model still performed suboptimally in identifying subjects at risk for rehospitalization after pneumonia. Future studies need to examine other social factors and patient frailty that may increase the risk of readmissions, as well as examine the impact of clinical stability on discharge. It remains to be determined if readmissions after pneumonia are truly preventable or mostly attributable to the patient's prior health status.
Disclosures: The project described was supported by grant number R01NR010828 from the National Institute of Nursing Research. The content is solely the responsibility of the authors and does not necessarily represent the official views of the National Institute of Nursing Research or the National Institutes of Health. This material is the result of work supported with resources and the use of facilities at the VA North Texas Health Care System. Funding agencies had no role in conducting the study, or role in the preparation, review, or approval of the manuscript. The views expressed in this article are those of the authors and do not necessarily represent the views of the Department of Veterans Affairs.
- , , , et al. Incidence and cost of pneumonia in Medicare beneficiaries. Chest. 2012;142(4):973–981.
- , , . Rehospitalizations among patients in the Medicare fee‐for‐service program. N Engl J Med. 2009;360(14):1418–1428.
- , , , et al. A prospective cohort study of healthcare visits and rehospitalizations after discharge of patients with community‐acquired pneumonia. Respirology. 2011;16(7):1119–1126.
- , , , et al. Pneumonia: criteria for patient instability on hospital discharge. Chest. 2008;134(3):595–600.
- , , , et al. Instability on hospital discharge and the risk of adverse outcomes in patients with pneumonia. Arch Intern Med. 2002;162(11):1278–1284.
- , , , et al. Causes and risk factors for rehospitalization of patients hospitalized with community‐acquired pneumonia. Clin Infect Dis. 2008;46(4):550–556.
- , , , et al. Population‐based study of statins, angiotensin II receptor blockers, and angiotensin‐converting enzyme inhibitors on pneumonia‐related outcomes. Clin Infect Dis. 2012;55(11):1466–1473.
- , , , et al. Quality of care, process, and outcomes in elderly patients with pneumonia. JAMA. 1997;278(23):2080–2084.
- U.S. Department of Veterans Affairs. Health benefits. Priority groups table. Available at: http://www.va.gov/healthbenefits/resources/priority_groups.asp. Accessed July 1, 2013.
- , , , et al. Validation of a combined comorbidity index. J Clin Epidemiol. 1994;47(11):1245–1251.
- , , , et al. Incidence of cardiovascular events after hospital admission for pneumonia. Am J Med. 2011;124(3):244–251.
- , , , et al. Diagnosis of pulmonary malignancy after hospitalization for pneumonia. Am J Med. 2010;123(1):66–71.
- MedPAC. 2013 [cited 2013 June 11]; Available from: http://www.hospitalcompare.gov.
- , , . The relationship between hospital admission rates and rehospitalizations. N Engl J Med. 2011;365(24):2287–2295.
- , , , et al. Predictors of short‐term rehospitalization following discharge of patients hospitalized with community‐acquired pneumonia. Chest. 2009;136(4):1079–1085.
- , , , et al. Effects of previous influenza vaccination on subsequent readmission and mortality in elderly patients hospitalized with pneumonia. Am J Med. 2003;115(6):454–461.
- , , . Does increased access to primary care reduce hospital readmissions? N Engl J Med. 1996;334(22):1441–1447.
- , , , et al. Development, validation, and results of a measure of 30‐day readmission following hospitalization for pneumonia. J Hosp Med. 2011;6(3):142–150.
- , , , et al. Impact of social factors on risk of readmission or mortality in pneumonia and heart failure: systematic review. J Gen Intern Med. 2013;28(2):269–282.
Pneumonia remains a significant problem in the United States, both in terms of mortality as well as cost to the healthcare system. Each year, over 1 million patients are hospitalized for pneumonia, with costs conservatively estimated at more than $7 billion in 2010.[1] One contributing factor for these costs is that pneumonia is the second most frequent reason for rehospitalization.[2] Rehospitalization after admission for pneumonia is now used as a marker for quality of care.
Given the cost and adverse outcomes of pneumonia, it is important to examine early rehospitalization to better understand what factors play a role. Studies have examined factors associated with readmission following an initial pneumonia‐related hospitalization. Adamuz et al. showed that additional healthcare visits and rehospitalizations within 30 days of discharge from the hospital were common and were associated with worsening of signs or symptoms of pneumonia and/or comorbidities.[3] Other studies demonstrated that instability on hospital discharge, as well as treatment failure, were associated with increased risk of rehospitalization.[4, 5] Jasti et al. found rehospitalizations following pneumonia were usually comorbidity related, primarily cardiopulmonary and/or neurologic disease, rather than due to the index pneumonia.[6] Many of these studies, and others looking at age, activity of daily living score, socioeconomic status, and comorbidity characteristics, were performed in relatively small cohorts. Predictors of rehospitalization have not been studied in a large cohort of patients in an integrated healthcare system.
Our study looks at factors not addressed in prior studies that have used administrative claims data to identify factors associated with early readmission. We also evaluated these admission risk factors in a veteran population, whereas prior studies have primarily focused on those who receive Medicare. The purpose of this study was to examine predictors of early (30 days) readmission in the Veterans Affairs (VA) healthcare system for patients age 65 years and older hospitalized for pneumonia. Our a priori hypothesis was that comorbid illnesses, such as congestive heart failure and chronic obstructive pulmonary disease, and patients with high medical complexity, such as high number of medications and/or prior hospitalizations and nursing home residence, are the primary factors associated with increased risk of rehospitalization.
METHODS
For this national cohort study, we used data from the VA healthcare system administrative and clinical databases that serve as repositories of clinical data from more than 150 VA hospitals and 850 outpatient clinics throughout the United States. The institutional review boards of the University of Texas Health Science Center at San Antonio and VA North Texas Health Care System approved this study. Details regarding the study design and methods were previously published.[7]
Inclusion Criteria
Patients included in this study were hospitalized between October 2001 and September 2007, had a primary diagnosis of pneumonia/emnfluenza (International Classification of Diseases, 9th Revision [ICD‐9] codes 480.0483.99 or 485487) or a secondary discharge diagnosis of pneumonia with a primary diagnosis of respiratory failure (ICD‐9 code 518.81) or sepsis (ICD‐9 code 038.xx),[8] and were aged 65 years or older on the date of admission. To ensure patients obtained their care primarily at the VA, at least 1 VA outpatient clinic visit in the year preceding the index admission and at least 1 active and filled outpatient medication from a VA pharmacy within 90 days of admission were required for inclusion.
If a patient was admitted more than once during the study period, only the first hospitalization was included as the index admission.
Exclusion Criteria
Patients who died during the initial hospitalization were not included in this study. Patients admitted to hospitals with fewer than 25 reported hospitalizations during October 2001 to September 2007 were excluded, as these hospitals are neither representative nor generalizable. This resulted in the removal of 59 patients from 5 different hospitals.
Data Sources and Definitions
We used inpatient and outpatient demographic, utilization, and comorbidity data from the National Patient Care Database. Pharmacy data were extracted from the Decision Support System National Data Extracts and Pharmacy Benefits Management. Vital status information was obtained from the Vital Status file, which incorporates data from veterans' death benefits claims, inpatient deaths, Medicare Vital Status files, and the Social Security Administration's death master file. We used encrypted patient identifiers link to information across these databases.
We obtained demographic information (age, sex, race, marital status) from inpatient and outpatient data. We categorized race as white, black, Hispanic, and other/unknown. To infer active smoking and/or tobacco cessation attempts, we identified ICD‐9 codes for tobacco use (305.1, V15.82), smoking cessation clinic use, and/or use of medications for the treatment of nicotine dependence (Zyban, nicotine replacement, or varenicline). We used VA priority status as a proxy for socioeconomic and disability status. VA priority groups are a way for the VA to focus limited funds to those veterans most in need. The highest group (priority group 1) must have at least a 50% service‐connected disability. Priority groups 2 through 6 include veterans with up to 40% service‐connected disability, former prisoners of war, those awarded certain honors, veterans with lower incomes, and the catastrophically disabled. The lowest groups (priority groups 7 and 8) include veterans with relatively higher incomes who agree to pay copayments.[9]
We also obtained information on comorbid conditions from inpatient and outpatient administrative data. We defined alcohol abuse using ICD‐9 codes 291, 303, 305.0, and illicit drug use with ICD‐9 codes 292, 304, 305 excluding 305.0‐.1. We used the Charlson Comorbidity Index to quantify levels of preexisting comorbidity[10] adapted for administrative databases, using ICD‐9 codes for 19 comorbid conditions from prior outpatient and inpatient encounters. We defined cardiovascular events and lung cancer that were diagnosed during the hospitalization as previously described.[11, 12]
Outcomes
Our primary study outcome was readmission within 30 days of hospital discharge for pneumonia from any VA acute care hospital only. Medicare has used 30‐day readmission as a quality indicator, as readmissions that occur closer to discharge are believed to be more likely due to events during the index hospitalization.[13]
Statistical Analyses
We randomly divided patients from our initial cohort into equal derivation or validation cohorts. We assessed differences between the 2 groups using the Student t test for continuous variables and 2 test for categorical variables. We performed univariate logistic regression analyses in the derivation cohort to examine the relationship between 30‐day rehospitalization and each of our potential covariates. We entered covariates that were significant at P<0.10 in the univariate analyses into a multiple regression model. Significant covariates at P<0.10 were then entered into the final model. For this model, we used bootstrapping with replacement in 1000 replications to obtain standard errors of our coefficients and associated P values. Because some subjects had more than 1 index admission, we used robust variancecovariance matrix estimators to compute standard errors for model coefficients.
We used the C statistic to assess the discrimination of our model. Calibration of this model was measured using the Hosmer‐Lemeshow 2 goodness of fit test, using 10 quantiles to group the data. We evaluated differences in discrimination between the derivation and validation cohorts by comparing C statistics.
Last, using the final model in the derivation cohort, 5 categories of severity were created based on subjects' predicted risk values for readmission. Severity categories in both the derivation and validation cohorts were then graphically evaluated.
We defined statistical significance as a 2‐tailed P value of <0.05. We used Stata 12 (StataCorp, College Station, TX) for all analyses.
RESULTS
Patient Characteristics
Of the 45,134 eligible patients, 13.2% were rehospitalized within 30 days, and rates by hospital ranged from 1.6% to 20.7%. Table 1 presents the comparison of baseline difference between the derivation and validation cohorts. There were no statistically significant differences between the 2 groups. Overall, the mean age was 77 years, 98% were male, and 54% were married. Over 90% of the patients received guideline‐concordant antibiotics, and only 10% required a stay in the intensive care unit (ICU). The average length of stay was 7 days (standard deviation of 11 days).
| Characteristics | Derivation Cohort, N=22,567 | Validation Cohort, N=22,567 | P Value |
|---|---|---|---|
| |||
| Sociodemographics | |||
| Age, mean (SD) | 77.3 (6.5) | 77.2 (6.5) | 0.30 |
| Male, no (%) | 22,133 (98.1) | 22,175 (98.3) | 0.14 |
| White, no (%) | 18,858 (83.6) | 18,719 (83.0) | 0.08 |
| Black, no (%) | 2,562 (11.4) | 2,583 (11.5) | 0.76 |
| Hispanic, no (%) | 1,337 (5.9) | 1,414 (6.3) | 0.13 |
| Married, no (%) | 12,166 (53.9) | 12,258 (54.3) | 0.39 |
| VA priority group, no (%) | 0.28 | ||
| 1 | 4,286 (19.0) | 4,281 (19.0) | |
| 26 | 16,306 (72.3) | 16,399 (72.8) | |
| 78 | 1,954 (8.7) | 1,860 (8.3) | |
| Nursing home residence, no (%) | 199 (0.9) | 216 (1.0) | 0.41 |
| Smoker status, no (%) | 8,579 (38.0) | 8,677 (38.5) | 0.34 |
| Index hospitalization factors | |||
| Myocardial infarction during hospitalization, no (%) | 469 (2.1) | 452 (2.0) | 0.57 |
| Heart failure during hospitalization, no (%) | 4,817 (21.4) | 4,772 (21.2) | 0.61 |
| Arrhythmia during hospitalization, no (%) | 4,356 (19.3) | 4,287 (19.0) | 0.41 |
| Length of stay, mean (SD) | 7.2 (10.4) | 7.2 (11.7) | 0.76 |
| Lung cancer diagnosis during hospitalization, no (%) | 31 (0.1) | 31 (0.1) | 1.00 |
| ICU admission, no (%) | 2,282 (10.1) | 2,336 (10.4) | 0.40 |
| Guideline concordant antibiotics, no (%) | 20,724 (91.8) | 20,643 (91.5) | 0.17 |
| Invasive mechanical ventilation, no (%) | 793 (3.5) | 832 (3.7) | 0.32 |
| Vasopressor use, no (%) | 495 (2.2) | 489 (2.2) | 0.85 |
| Hospital complications, no (%) | |||
| Renal organ failure | 2,671 (11.8) | 2,640 (11.7) | 0.65 |
| Cardiac organ failure | 1,004 (4.5) | 959 (4.3) | 0.30 |
| Hepatic organ failure | 33 (0.2) | 40 (0.2) | 0.41 |
| Respiratory organ failure | 1,623 (7.2) | 1,583 (7.0) | 0.46 |
| Comorbid illnesses | |||
| Medical, no (%) | |||
| Myocardial infarction | 1,528 (6.8) | 1,542 (6.8) | 0.79 |
| Congestive heart failure | 5,815 (25.8) | 5,697 (25.2) | 0.20 |
| Peripheral vascular disease | 3,413 (15.1) | 3,454 (15.3) | 0.59 |
| Cerebrovascular disease | 3,993 (17.7) | 4,078 (18.1) | 0.30 |
| Dementia | 1,141 (5.1) | 1,110 (4.9) | 0.50 |
| COPD | 12,168 (53.9) | 12,076 (53.5) | 0.39 |
| Rheumatologic disease | 646 (2.9) | 660 (2.9) | 0.69 |
| Peptic ulcer disease | 795 (3.5) | 723 (3.2) | 0.06 |
| Severe liver disease | 169 (0.8) | 169 (0.8) | 1.00 |
| Mild liver disease | 78 (0.4) | 80 (0.4) | 0.87 |
| Diabetes | 7,310 (32.4) | 7,410 (32.8) | 0.32 |
| Diabetes with complications | 2,229 (9.9) | 2,248 (10.0) | 0.77 |
| Chronic renal disease | 2,836 (12.6) | 2,745 (12.2) | 0.19 |
| Hemi/paraplegia | 319 (1.4) | 338 (1.5) | 0.46 |
| Any prior malignancy | 5,226 (23.2) | 5,269 (23.4) | 0.63 |
| Metastatic solid tumor | 748 (3.3) | 795 (3.5) | 0.22 |
| AIDS | 56 (0.3) | 49 (0.2) | 0.49 |
| HIV | 23 (0.1) | 13 (0.1) | 0.10 |
| Alcohol abuse | 897 (4.0) | 934 (4.1) | 0.38 |
| Drug abuse | 254 (1.1) | 255 (1.1) | 0.96 |
| Psychiatric, no (%) | |||
| Anxiety disorder | 1,692 (7.5) | 1,722 (7.6) | 0.59 |
| Depression indicator | 3,655 (16.2) | 3,718 (16.5) | 0.42 |
| Bipolar disorder | 430 (1.9) | 433 (1.9) | 0.92 |
| Cataract indicator | 6,106 (27.1) | 6,180 (27.4) | 0.43 |
| Prostatitis indicator | 4,680 (20.7) | 4,593 (20.4) | 0.31 |
| Schizophrenia indicator | 685 (3.0) | 676 (3.0) | 0.80 |
| Post‐traumatic stress disorder | 844 (3.7) | 862 (3.8) | 0.66 |
| Medication history within 90 days | |||
| Cardiovascular drugs, mean (SD) | 1.8 (1.6) | 1.8 (1.6) | 0.65 |
| Diabetes drugs, mean (SD) | 0.3 (0.7) | 0.3 (0.7) | 0.60 |
| Inhaled corticosteroids, mean (SD) | 0.4 (0.9) | 0.4 (0.9) | 0.28 |
| Pulmonary drug, mean (SD) | 1.3 (2.0) | 1.3 (2.0) | 0.36 |
| Oral corticosteroids, no (%) | 5,363 (23.8) | 5,505 (24.4) | 0.12 |
| Prior medical utilization | |||
| Number of primary care clinic visits within 1 year, mean (SD) | 4.9 (4.2) | 4.9 (4.2) | 0.67 |
| Number of emergency department visits within 1 year, mean (SD) | 1.2 (2.0) | 1.2 (2.0) | 0.86 |
| Number of outpatient clinic visits within 1 year, mean (SD) | 14.7 (13.1) | 14.6 (13.0) | 0.33 |
| Number of specialty clinic visits within 1 year, mean (SD) | 3.4 (5.5) | 3.3 (5.4) | 0.50 |
| Prior hospital admission within 90 days, no (%) | 5,062 (22.4) | 5,141 (22.8) | 0.37 |
Predictors of 30‐Day Readmission
All variables listed in Table 1 were evaluated. The derivation logistic regression model is shown in Table 2, and only includes predictors associated with rehospitalization. Antibiotic concordance and time in the ICU were evaluated and did not predict readmission. Variables that were significantly associated with rehospitalization in the models included age, marital status, the number of emergency department clinic visits a year prior, prior admission within 90 days, number of nonpharmacy clinic visits in a year prior, and hospital length of stay. The increasing age and number of emergency department and clinic visits were associated with higher odds of readmission. The longer the length of stay and those patients who were married had a lower odds of subsequent readmission. Other variables included were the presence of chronic renal disease, prior malignancy, nursing home residence, congestive heart failure, and prior use of oral corticosteroids. The C statistics for the derivation and validation models were 0.615 and 0.613, respectively. There were no significant differences in any of the variables between the derivation and validation cohorts.
| Predictors | OR | 95% CI | P Value | |
|---|---|---|---|---|
| Lower | Upper | |||
| ||||
| Sociodemographics | ||||
| Age at admission | 1.01 | 1.00 | 1.02 | <0.01 |
| White | 1.14 | 1.02 | 1.28 | 0.02 |
| Nonwhiteb | 1.00 | |||
| Hispanic | 1.26 | 1.07 | 1.47 | 0.01 |
| Not Hispanicc | 1.00 | |||
| Married | 0.89 | 0.82 | 0.96 | <0.01 |
| Not marriedd | 1.00 | |||
| Nursing home residence | 1.68 | 1.18 | 2.39 | <0.01 |
| Comorbid illnesses | ||||
| Peptic ulcer disease | 1.24 | 1.02 | 1.50 | 0.03 |
| Chronic renal disease | 1.18 | 1.06 | 1.33 | <0.01 |
| Any prior malignancy | 1.17 | 1.06 | 1.28 | <0.01 |
| Metastatic solid tumor | 1.20 | 0.98 | 1.47 | 0.08 |
| AIDS | 1.99 | 1.06 | 3.74 | 0.03 |
| Index admission factors | ||||
| Heart failure on initial admission | 1.18 | 1.07 | 1.29 | <0.01 |
| Length of stay (per day) | 0.97 | 0.97 | 0.98 | <0.01 |
| Medication history | ||||
| Cardiovascular drug count 90 days prior | 1.03 | 1.00 | 1.06 | 0.02 |
| Oral corticosteroids 90 days prior | 1.16 | 1.06 | 1.27 | <0.01 |
| Prior medical utilization | ||||
| Number of emergency department visits within 1 year | 1.04 | 1.02 | 1.06 | <0.01 |
| Number of specialty clinic visits within 1 year | 1.01 | 1.00 | 1.02 | 0.01 |
| Prior hospital admission within 90 days | 1.60 | 1.46 | 1.75 | <0.01 |
| Number of nonpharmacy clinic visits within 1 year | 1.00 | 1.00 | 1.01 | <0.01 |
Figure 1 shows that the derivation and validation models are similar in percent rehospitalization group in all severity groups.
DISCUSSION
Sociodemographics and comorbidities, which are host factors, were significantly associated with rehospitalization of elderly patients admitted for pneumonia and length of hospital stay, the only pneumonia‐specific variable associated with readmission.[6, 14, 15, 16] Higher rates of all types of prior utilization (inpatient, outpatient, emergency department visits) were also associated with higher risk of rehospitalization. Our findings highlight the role that host factors play in rehospitalization of elderly patients with pneumonia and that there are few potentially modifiable targets to help reduce readmissions after pneumonia.
These findings may indicate 2 things: patients in this cohort are sicker than the general population at baseline and therefore require more medical care, and/or they are being evaluated by more providers increasing the chance they will be readmitted. For the former, an example is the association of prior use of oral corticosteroids with rehospitalization, which may demonstrate poorly controlled comorbidities (eg, chronic obstructive lung disease with recent exacerbation) that require steroid use. Given the VA's integrated healthcare system, greater access to primary care providers may lead to more opportunities for patients to voice their complaints, which can lead to more readmissions among severely ill patients. Weinberger et al. found an increase in hospital readmissions with increased access to primary care.[17] The association of readmission and length of stay is less likely related to pneumonia‐related clinical instabilities on discharge, but rather to the ability to address other potential issues related to the patient's underlying comorbidities.[5]
Our study presents a model looking at rehospitalization of patients with pneumonia, including factors not addressed in a prior publication by Lindenauer et al., the model Centers for Medicare and Medicaid Services (CMS) uses to predict early rehospitalization.[18] Lindenauer's model included 39 variables (of which 37 were clinical variables), including vertebral fractures, other injuries, other gastrointestinal disorders, other urinary tract disorders, as well as demographic and comorbidity factors that were similar to some of those included in our study. Their 30‐day rehospitalization medical record and administrative models had a C statistic of 0.59 and 0.63, respectively. A major difference between our presented model and the latter are the data on utilization of medical care. Despite these additional data, the resulting C statistics of 0.615 and 0.613 were not qualitatively better.
The similar C statistics demonstrates that factors playing a significant role in determining rehospitalization have yet to be identified, and it is not clear if researchers will be able to identify potentially modifiable risk factors for rehospitalization. Examples of other potential factors that should be examined in future studies include family/community support, quality of the transition of care back to their residence, and quality of inpatient care. Calvillo‐King et al. found a broad range of social factors that potentially affect the risk of postdischarge readmission for chronic heart failure.[19] For pneumonia, there were few studies that assessed the risk of social factors on readmission, and these were most commonly rather broad categories such as race/ethnicity or nursing home residence. In the publications that studied social factors and readmissions, there were inconsistent associations between hospital readmission with lower education, low income, and unemployment. Future articles may benefit from taking these additional factors into account.
Potential limitations to our study include the overwhelming majority of patients being male and in a VA population, which may limit generalizability. In addition, no data were available on the quality of the transition of care. Furthermore, limitations include the age of the data and the lack of evaluation of outpatient follow‐up and antibiotics on discharge. Though our data are up to 10 years old, this study evaluates risk factors that are still relevant. Finally, some variables noted in the CMS model were not evaluated in our study, such as protein‐calorie malnutrition, skin ulcers, and fracture history. Given these differences, we were unable to directly compare the performance of the 2 models.
Despite examining novel factors related to prior healthcare utilization, our model still performed suboptimally in identifying subjects at risk for rehospitalization after pneumonia. Future studies need to examine other social factors and patient frailty that may increase the risk of readmissions, as well as examine the impact of clinical stability on discharge. It remains to be determined if readmissions after pneumonia are truly preventable or mostly attributable to the patient's prior health status.
Disclosures: The project described was supported by grant number R01NR010828 from the National Institute of Nursing Research. The content is solely the responsibility of the authors and does not necessarily represent the official views of the National Institute of Nursing Research or the National Institutes of Health. This material is the result of work supported with resources and the use of facilities at the VA North Texas Health Care System. Funding agencies had no role in conducting the study, or role in the preparation, review, or approval of the manuscript. The views expressed in this article are those of the authors and do not necessarily represent the views of the Department of Veterans Affairs.
- , , , et al. Incidence and cost of pneumonia in Medicare beneficiaries. Chest. 2012;142(4):973–981.
- , , . Rehospitalizations among patients in the Medicare fee‐for‐service program. N Engl J Med. 2009;360(14):1418–1428.
- , , , et al. A prospective cohort study of healthcare visits and rehospitalizations after discharge of patients with community‐acquired pneumonia. Respirology. 2011;16(7):1119–1126.
- , , , et al. Pneumonia: criteria for patient instability on hospital discharge. Chest. 2008;134(3):595–600.
- , , , et al. Instability on hospital discharge and the risk of adverse outcomes in patients with pneumonia. Arch Intern Med. 2002;162(11):1278–1284.
- , , , et al. Causes and risk factors for rehospitalization of patients hospitalized with community‐acquired pneumonia. Clin Infect Dis. 2008;46(4):550–556.
- , , , et al. Population‐based study of statins, angiotensin II receptor blockers, and angiotensin‐converting enzyme inhibitors on pneumonia‐related outcomes. Clin Infect Dis. 2012;55(11):1466–1473.
- , , , et al. Quality of care, process, and outcomes in elderly patients with pneumonia. JAMA. 1997;278(23):2080–2084.
- U.S. Department of Veterans Affairs. Health benefits. Priority groups table. Available at: http://www.va.gov/healthbenefits/resources/priority_groups.asp. Accessed July 1, 2013.
- , , , et al. Validation of a combined comorbidity index. J Clin Epidemiol. 1994;47(11):1245–1251.
- , , , et al. Incidence of cardiovascular events after hospital admission for pneumonia. Am J Med. 2011;124(3):244–251.
- , , , et al. Diagnosis of pulmonary malignancy after hospitalization for pneumonia. Am J Med. 2010;123(1):66–71.
- MedPAC. 2013 [cited 2013 June 11]; Available from: http://www.hospitalcompare.gov.
- , , . The relationship between hospital admission rates and rehospitalizations. N Engl J Med. 2011;365(24):2287–2295.
- , , , et al. Predictors of short‐term rehospitalization following discharge of patients hospitalized with community‐acquired pneumonia. Chest. 2009;136(4):1079–1085.
- , , , et al. Effects of previous influenza vaccination on subsequent readmission and mortality in elderly patients hospitalized with pneumonia. Am J Med. 2003;115(6):454–461.
- , , . Does increased access to primary care reduce hospital readmissions? N Engl J Med. 1996;334(22):1441–1447.
- , , , et al. Development, validation, and results of a measure of 30‐day readmission following hospitalization for pneumonia. J Hosp Med. 2011;6(3):142–150.
- , , , et al. Impact of social factors on risk of readmission or mortality in pneumonia and heart failure: systematic review. J Gen Intern Med. 2013;28(2):269–282.
2014 Society of Hospital Medicine. This article is a US government work and, as such, is in the public domain in the United States of America.

Pazopanib helps significant minority of sarcoma patients
MILAN – Pazopanib, which received U.S. approval in 2012 for treating advanced soft-tissue sarcomas, can be very effective for durably halting tumor progression in a significant minority of sarcoma patients but requires close monitoring for adverse effects.
"Although the overall response rate is low, some patients experience important palliation of symptoms and prolonged disease control" from treatment with pazotinib (Votrient), Dr. Ian R. Judson said at Sarcoma and GIST 2014, hosted by the European Society for Medical Oncology.
"We see a number of adverse effects [from pazopanib treatment] that need careful monitoring, particularly fatigue, diarrhea, nausea, and weight loss," adverse effects that had previously been seen in patients with other tumor types treated with the drug, said Dr. Judson, professor of cancer pharmacology and head of the sarcoma unit at the Royal Marsden Hospital, London. Results from the phase III trial of pazopanib in patients with advanced soft-tissue sarcoma with a history of chemotherapy, also showed that the drug can cause other, previously unreported adverse effects: myocardial dysfunction, an increased risk for venous thromboembolism, and the possibility for some patients to develop pneumothorax (Lancet 2012;379:1879-86).
The upside of pazopanib treatment is that it can produce "clear and dramatic" increases in progression-free survival and "durable, stable disease" in certain patients, said Dr. Judson.
Pazopanib became the first tyrosine kinase inhibitor to receive approval from the Food and Drug Administration and other regulatory agencies for treating soft tissue sarcomas (STS), although it has not been proven effective for treating adipocyte STS and is also not indicated for gastrointestinal stromal tumors. But it remains unclear which patients with other types of STS will respond to pazopanib and which won’t. "I wish we knew what the molecular target for this drug really is," Dr. Judson said.

A recently published analysis retrospectively pooled data from 118 STS patients enrolled in a phase II study of pazopanib and 226 patients from the phase III study PALETTE (Pazopanib for Metastatic Soft Tissue Sarcoma). The analysis showed that 36% of the entire group of patients on pazopanib were long-term responders to the drug, defined as having progression-free survival for at least 6 months following the start of pazopanib treatment, and 34% of patients on the drug were long-term survivors on the drug, defined as living for at least 18 months on treatment, noted Dr. Shreyaskumar R. Patel in a talk at the conference (Ann. Oncol. 2014;25:719-24).
During an overall median follow-up of 2.3 years in the two studies, 76 patients (22%) were both long-term responders and long-term survivors. Twelve patients remained on pazopanib treatment for more than 2 years, with a median time on treatment of 2.4 years, and 1 patient from the combined groups stayed on pazopanib for as long as 3.7 years, said Dr. Patel, professor and deputy chair of the department of sarcoma medical oncology at M.D. Anderson Cancer Center, Houston.
"Pazopanib is probably my second-line choice" for treating advanced STS, "particularly synovial sarcomas" after treatment with doxorubicin (Adriamycin) and ifosfamide (Ifex) fails, said Dr. Robert S. Benjamin, professor and chair of sarcoma medical oncology at M.D. Anderson.
The pazopanib trials were sponsored by GlaxoSmithKline, which markets pazopanib. Dr. Judson said that he has received honoraria from GlaxoSmithKline and Novartis, and research support from GlaxoSmithKline, AstraZeneca, and other companies. Dr. Patel said that he has received honoraria or consulting fees from GlaxoSmithKline, Novartis, and Johnson & Johnson, and research support from Johnson & Johnson, PharmaMar, and other companies. Dr. Benjamin said that he has received research support from Johnson & Johnson, Merck, and Pfizer.
mzoler@frontlinemedcom.com Twitter: @mitchelzoler
MILAN – Pazopanib, which received U.S. approval in 2012 for treating advanced soft-tissue sarcomas, can be very effective for durably halting tumor progression in a significant minority of sarcoma patients but requires close monitoring for adverse effects.
"Although the overall response rate is low, some patients experience important palliation of symptoms and prolonged disease control" from treatment with pazotinib (Votrient), Dr. Ian R. Judson said at Sarcoma and GIST 2014, hosted by the European Society for Medical Oncology.
"We see a number of adverse effects [from pazopanib treatment] that need careful monitoring, particularly fatigue, diarrhea, nausea, and weight loss," adverse effects that had previously been seen in patients with other tumor types treated with the drug, said Dr. Judson, professor of cancer pharmacology and head of the sarcoma unit at the Royal Marsden Hospital, London. Results from the phase III trial of pazopanib in patients with advanced soft-tissue sarcoma with a history of chemotherapy, also showed that the drug can cause other, previously unreported adverse effects: myocardial dysfunction, an increased risk for venous thromboembolism, and the possibility for some patients to develop pneumothorax (Lancet 2012;379:1879-86).
The upside of pazopanib treatment is that it can produce "clear and dramatic" increases in progression-free survival and "durable, stable disease" in certain patients, said Dr. Judson.
Pazopanib became the first tyrosine kinase inhibitor to receive approval from the Food and Drug Administration and other regulatory agencies for treating soft tissue sarcomas (STS), although it has not been proven effective for treating adipocyte STS and is also not indicated for gastrointestinal stromal tumors. But it remains unclear which patients with other types of STS will respond to pazopanib and which won’t. "I wish we knew what the molecular target for this drug really is," Dr. Judson said.
A recently published analysis retrospectively pooled data from 118 STS patients enrolled in a phase II study of pazopanib and 226 patients from the phase III study PALETTE (Pazopanib for Metastatic Soft Tissue Sarcoma). The analysis showed that 36% of the entire group of patients on pazopanib were long-term responders to the drug, defined as having progression-free survival for at least 6 months following the start of pazopanib treatment, and 34% of patients on the drug were long-term survivors on the drug, defined as living for at least 18 months on treatment, noted Dr. Shreyaskumar R. Patel in a talk at the conference (Ann. Oncol. 2014;25:719-24).
During an overall median follow-up of 2.3 years in the two studies, 76 patients (22%) were both long-term responders and long-term survivors. Twelve patients remained on pazopanib treatment for more than 2 years, with a median time on treatment of 2.4 years, and 1 patient from the combined groups stayed on pazopanib for as long as 3.7 years, said Dr. Patel, professor and deputy chair of the department of sarcoma medical oncology at M.D. Anderson Cancer Center, Houston.
"Pazopanib is probably my second-line choice" for treating advanced STS, "particularly synovial sarcomas" after treatment with doxorubicin (Adriamycin) and ifosfamide (Ifex) fails, said Dr. Robert S. Benjamin, professor and chair of sarcoma medical oncology at M.D. Anderson.
The pazopanib trials were sponsored by GlaxoSmithKline, which markets pazopanib. Dr. Judson said that he has received honoraria from GlaxoSmithKline and Novartis, and research support from GlaxoSmithKline, AstraZeneca, and other companies. Dr. Patel said that he has received honoraria or consulting fees from GlaxoSmithKline, Novartis, and Johnson & Johnson, and research support from Johnson & Johnson, PharmaMar, and other companies. Dr. Benjamin said that he has received research support from Johnson & Johnson, Merck, and Pfizer.
mzoler@frontlinemedcom.com Twitter: @mitchelzoler
EXPERT ANALYSIS FROM SARCOMA AND GIST 2014
