User login
Complications and Risk Factors for Morbidity in Elective Hip Arthroscopy: A Review of 1325 Cases
Take-Home Points
- Using the NSQIP database, the authors report that the overall complication rate was 1.21% after hip arthroscopy.
- The most common complications cited were bleeding requiring transfusion (0.45%), return to OR (0.23%), superficial infection (0.23%), and thrombophlebitis (0.15).
- Most common 10CPT code was arthroscopic débridement in 50% of cases, reflecting the types of cases being performed in the time period.
- FAI codes were less common in this database–labral repair in 24%, femoral osteochondroplasty in 16%, and acetabuloplasty in 9%.
- Use caution in patients over age 65 years as this appears to be a risk factor for morbidity.
Hip arthroscopy is a well-described method for treating a number of pathologies.1-3 Surgical indications are wide-ranging and include femoral acetabular impingement (FAI), labral tears, loose bodies, osteochondral injuries, ruptured ligamentum teres, and synovitis, as well as extra-articular injuries, including hip abductor tears and sciatic nerve entrapment.2,4-6 Authors have suggested that the advantages of hip arthroscopy over open procedures include less traumatic access to the hip joint and faster recovery,7,8 and hip arthroscopy has been found cost-effective in select groups of patients.9
Overall complications have been reported in 1% to 20% of hip arthroscopy patients,6,8,10,11 and a meta-analysis identified an overall complication rate of 4%.8 Complications include iatrogenic chondrolabral injury, nerve injury, superficial surgical-site infection, deep vein thrombosis (DVT), instrument failure, portal wound bleeding, soft-tissue injury, and intra-abdominal fluid extravasation.6,8,10-13 Rates of major complications are relatively low, 0.3% to 0.58%, according to several recent systematic reviews.8,12 Given the lack of universally accepted definitions, reports of minor complications (eg, iatrogenic chondrolabral injury, neuropraxia) in hip arthroscopy vary widely.8 Furthermore, many of the series with high complication rates represent early experience with the technique, and later authors suggested that complications should decrease with improvements in technique and technology.12,14,15The literature is lacking in reports of risk factors for patient morbidity and large multi-institutional cohorts in the setting of hip arthroscopy. We conducted a study of elective hip arthroscopy patients to determine type and incidence of complications and rates of and risk factors for minor and major morbidity.
Materials and Methods
This retrospective study was deemed compliant with HIPAA (Health Insurance Portability and Accountability Act of 1996) and exempt from the need for Institutional Review Board approval. In the National Surgical Quality Improvement Program (NSQIP), academic and private medical institutions prospectively collect patient preoperative and operative data as well as 30-day outcome data from more than 500 hospitals throughout the United States.16-21 Surgical clinical reviewers, who are responsible for data acquisition, prospectively collect morbidity data for 30 days after surgery through a chart review of patient progress notes, operative notes, and follow-up clinic visits. Patients may be contacted by a surgical clinical reviewer if they have not had a clinic visit within 30 days after a procedure to verify the presence or absence of complications or admissions at outside institutions, and in this way even outpatient complications should be captured. If the medical record is unclear, the reviewer may also contact the surgeon directly. In addition, NSQIP data are routinely audited; the interobserver disagreement rate is 1.56%.22
We used Current Procedural Terminology (CPT) billing codes to retrospectively survey the NSQIP database for hip arthroscopies performed between 2006 and 2013. Excluding cases of compromised surgical wounds, emergent surgeries, surgeries involving fracture, hip dislocations, preoperative sepsis, septic joints, and osteomyelitis, we identified 1325 cases with CPT codes 29861 (hip arthroscopy), 29862 (arthroscopic hip débridement, shaving), 29914 (arthroscopic femoroplasty), 29915 (arthroscopic acetabuloplasty), and 29916 (arthroscopic labral repair). Postoperative outcomes were categorized as major morbidity or mortality, minor morbidity, and any complication. A major complication was a systemic life-threatening event or a substantial threat to a vital organ, whereas a minor complication did not pose a major systemic threat and was localized to the operative extremity (previously used definitions23,24). We have used similar methods to report the rates of and risk factors for complications of knee arthroscopy, shoulder arthroscopy, and total shoulder arthroplasty.16,20,21 For any-complication outcomes, we included both major and minor morbidities, and mortality. NSQIP applies strict definitions (listed in its user file17) to patient comorbidities and complications. Data points collected included patient demographics, medical comorbidities, laboratory values, and surgical characteristics.
Initially, we performed a univariate analysis that considered age, sex, race, body mass index, current alcohol abuse, current smoking status, recent weight loss, dyspnea, chronic obstructive pulmonary disease, CPT code, congestive heart failure, hypertension, diabetes, peripheral vascular disease, esophageal varices, disseminated cancer, steroid use, bleeding disorder, dialysis, chemotherapy within previous 30 days, radiation therapy within previous 90 days, operation within previous 30 days, American Society of Anesthesiologists class, operative time, resident involvement, and patient functional status. We also included mean preoperative sodium, blood urea nitrogen, and albumin levels; white blood cell count; hematocrit; platelet count; and international normalized ratio. The analysis revealed unadjusted differences between patients with and without complications (t test was used for continuous variables, χ2 test for categorical variables). Any variable with P < .2 in the univariate analysis and more than 80% complete data was considered fit for our multivariate model. We controlled for confounders by performing a multivariate logistic regression analysis. Three separate analyses were performed; the outcome variables were major morbidity or mortality, minor morbidity, and any complication. P < .05 was used for statistical significance across all models. We used SAS Version 9.3 (SAS Institute) for statistical analysis. Model quality was evaluated for calibration (Hosmer-Lemeshow test) and discrimination (C statistics). The calibration test yielded a modified χ2 statistic, and P > .05 indicated the model was appropriate and fit the data well. Good discrimination is commonly reported to be between 0.65 and 0.85.
Results
Of the 1325 patients who underwent hip arthroscopy, 60% were female. Regarding age, 52% were younger than 40 years, and 45% were between 45 years and 60 years. The most common diagnoses were articular cartilage disorder involving the pelvic region (15%), enthesopathy of the hip (12%), and joint pain involving the pelvic region or thigh (11%). The most common primary CPT code (50%) was for hip arthroscopic débridement (29862), followed by 24% for arthroscopic labral repair (29916), 16% for arthroscopic femoroplasty (29914), and 9% for arthroscopic acetabuloplasty (29915). Of the 16 complications found, 12 involved hip arthroscopic débridement, and 4 involved hip arthroscopic femoroplasty. There were no complications of arthroscopic acetabuloplasty (29915), arthroscopic labral repair (29916), or hip arthroscopy (29861).
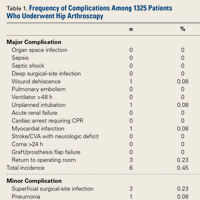
Of the 1325 hip arthroscopy patients, 16 (1.21%) had at least 1 complication (Table 1). 
Univariate analysis identified age (P = .014), CPT code (P = .036), hypertension (P = .128), and steroid use (P = .188) as risk factors for any complication (Table 2). 


Discussion
Earlier reports on hip arthroscopy did not consider risk factors for systemic morbidity and were mainly single-institution case series.3,10,11,13,25 Given a renewed focus on outcomes measurement and quality assessment in orthopedic surgery, we wanted to describe short-term complications of and risk factors for morbidity in hip arthroscopy. In this article, we report baseline data from a large multicenter cohort. For hip arthroscopy, we found low rates of short-term complications (1.21%) and major morbidities (0.45%). We considered many modifiable and nonmodifiable risk factors for complications and found age over 65 years to be an independent risk factor for any complication and minor morbidity. Several of our findings merit further discussion.
Other authors have reported hip arthroscopy complication rates of 1% to 20%, citing both systemic and local complications,6,8,10-12 and major complication rates of 0.3% to 0.58%.8,12 Minor complications of hip arthroscopy vary, and depend on definition, with long-term consequences unknown in some cases.8 Sensory neuropraxia, a relatively common minor complication in hip arthroscopy, is thought to be affected by the amount of traction against a perineal post and by increased operative time, with operative time under 2 hours previously suggested.3,6,10,11,13,25,26
In the present study, the overall rate of any complication of hip arthroscopy was 1.21%, and the most common complications were bleeding resulting in transfusion, return to operating room, superficial surgical-site infection, and DVT/thrombophlebitis. When we excluded bleeding resulting in transfusion, the overall complication rate fell to 0.75%. Operative time was relatively short, <2 hours for 70% of patients. Last, there were no mortalities. As our data set did not include variables encompassing sensory neuropraxia or iatrogenic chondrolabral injury, we were unable to report on these data.
Surgeons and healthcare systems should be advised that rates of systemic complications in hip arthroscopy are low and that hip arthroscopy is a relatively safe procedure. Surgeons and healthcare systems can refer to our reported complication rates and risk factors when assessing quality and performing cost analysis in hip arthroscopy. For our 1325 patients, the major morbidity rate was 0.45%, within the range of previous reports.8,12 There were no nerve injuries in our patient cohort, likely because of the strict NSQIP definitions of nerve injury. We cannot report on sensory neuropraxia and iatrogenic chondrolabral injury. We speculate that lack of these variables may have artificially lowered our minor complication rate.
Some authors have reported clinical benefits of hip arthroscopy in older patients,27-29 whereas others have suggested age may be a negative prognostic factor.27,30 Suggested indications for hip arthroscopy in an elderly population include chondral defects, labral tears, and FAI in the absence of significant arthritic changes.28,29 Larson and colleagues,30 who reported a 52% failure rate for osteoarthritis patients who underwent hip arthroscopy for FAI, concluded that arthroscopy should not be offered to patients with evidence of advanced radiographic joint space narrowing. Others have noted that patients who were under age 55 years and had minimal osteoarthritic changes had a longer interval between hip arthroscopy and total hip arthroplasty in comparison with patients over age 55 years.31 Previous work in knee arthroscopy found older age (40-65 years vs <40 years) was an independent predictor of short-term complications (1.5 times increased risk).21 In the present study, 7.69% of patients who were over age 65 years when they underwent hip arthroscopy had a complication, and we report age over 65 years as an independent risk factor for any complication (OR, 6.52) and minor morbidity (OR, 7.97). Surgeons should be aware that advanced age is an independent risk factor for complications in hip arthroscopy. Potential benefits of hip arthroscopy should be carefully weighed against the increased risk in this patient cohort, and surgeons should ascertain the scope of an elderly patient’s disease to determine if hip arthroscopy is indicated and worth the potential risks.
To our knowledge, bleeding resulting in transfusion was not previously described as a complication of hip arthroscopy. In the present study, bleeding resulting in transfusion was the most common complication (6 patients, 0.45%), and all the affected patients had a primary CPT code for arthroscopic débridement (29862). The 6 primary diagnoses were hip osteoarthrosis (3), thigh/pelvis pain (1), unspecified injury (1), and congenital hip deformity (1). The 6 transfusion patients also tended to be older (ages 30, 53, 64, 67, 76, and 90 years). Although drawing firm conclusions from so few patients would be inappropriate, we acknowledge that the majority who received a transfusion were older, underwent arthroscopic débridement of a hip, and had a primary diagnosis of osteoarthrosis or pain. As transfusion practices can differ between surgeons and groups, we conclude that the risk for bleeding requiring transfusion is low in hip arthroscopy. Patients who are older and who undergo arthroscopic débridement of an osteoarthritic hip may be at elevated risk for transfusion.
This study had several limitations. First, with use of the NSQIP database, follow-up was limited to 30 days. We speculate that longer follow-up might yield higher complication rates and additional risk factors. Second, we could not distinguish individual surgeon or site data and acknowledge complications might differ between surgeons and sites that perform hip arthroscopy more frequently. Third, as data were limited to medical and broadly applicable surgical variables included in the NSQIP database, they might not be specific to hip arthroscopy, and we cannot report on iatrogenic chondrolabral injury and neuropraxia, 2 previously reported minor complications in hip arthroscopy. We speculate that data collection focused on problems specific to hip arthroscopy would yield more complications and risk factors.
Conclusion
According to the NSQIP data, the rate of short-term morbidity after elective hip arthroscopy was low, 1.21%. Surgeons may use our reported complications and risk factors when counseling patients, and healthcare systems may use our data when assessing quality and performance in hip arthroscopy. Surgeons who perform elective hip arthroscopy should be aware that age over 65 years is an independent predictor of complications. Careful attention should be given to this patient group when indicating hip arthroscopy procedures.
Am J Orthop. 2017;46(1):E1-E9. Copyright Frontline Medical Communications Inc. 2017. All rights reserved.
1. Byrd JW. Hip arthroscopy utilizing the supine position. Arthroscopy. 1994;10(3):275-280.
2. Byrd JW, Jones KS. Prospective analysis of hip arthroscopy with 10-year followup. Clin Orthop Relat Res. 2010;468(3):741-746.
3. Griffin DR, Villar RN. Complications of arthroscopy of the hip. J Bone Joint Surg Br. 1999;81(4):604-606.
4. de Sa D, Alradwan H, Cargnelli S, et al. Extra-articular hip impingement: a systematic review examining operative treatment of psoas, subspine, ischiofemoral, and greater trochanteric/pelvic impingement. Arthroscopy. 2014;30(8):1026-1041.
5. de Sa D, Phillips M, Philippon MJ, Letkemann S, Simunovic N, Ayeni OR. Ligamentum teres injuries of the hip: a systematic review examining surgical indications, treatment options, and outcomes. Arthroscopy. 2014;30(12):1634-1641.
6. Oak N, Mendez-Zfass M, Lesniak BP, Larson CM, Kelly BT, Bedi A. Complications in hip arthroscopy. Sports Med Arthrosc. 2013;21(2):97-105.
7. Botser IB, Smith TW Jr, Nasser R, Domb BG. Open surgical dislocation versus arthroscopy for femoroacetabular impingement: a comparison of clinical outcomes. Arthroscopy. 2011;27(2):270-278.
8. Kowalczuk M, Bhandari M, Farrokhyar F, et al. Complications following hip arthroscopy: a systematic review and meta-analysis. Knee Surg Sports Traumatol Arthrosc. 2013;21(7):1669-1675.
9. Shearer DW, Kramer J, Bozic KJ, Feeley BT. Is hip arthroscopy cost-effective for femoroacetabular impingement? Clin Orthop Relat Res. 2012;470(4):1079-1089.
10. Clarke MT, Arora A, Villar RN. Hip arthroscopy: complications in 1054 cases. Clin Orthop Relat Res. 2003;(406):84-88.
11. Pailhé R, Chiron P, Reina N, Cavaignac E, Lafontan V, Laffosse JM. Pudendal nerve neuralgia after hip arthroscopy: retrospective study and literature review. Orthop Traumatol Surg Res. 2013;99(7):785-790.
12. Harris JD, McCormick FM, Abrams GD, et al. Complications and reoperations during and after hip arthroscopy: a systematic review of 92 studies and more than 6,000 patients. Arthroscopy. 2013;29(3):589-595.
13. Sampson TG. Complications of hip arthroscopy. Clin Sports Med. 2001;20(4):831-835.
14. Konan S, Rhee SJ, Haddad FS. Hip arthroscopy: analysis of a single surgeon’s learning experience. J Bone Joint Surg Am. 2011;93(suppl 2):52-56.
15. Souza BG, Dani WS, Honda EK, et al. Do complications in hip arthroscopy change with experience? Arthroscopy. 2010;26(8):1053-1057.
16. Anthony CA, Westermann RW, Gao Y, Pugely AJ, Wolf BR, Hettrich CM. What are risk factors for 30-day morbidity and transfusion in total shoulder arthroplasty? A review of 1922 cases. Clin Orthop Relat Res. 2015;473(6):2099-2105.
17. Daley J, Khuri SF, Henderson W, et al. Risk adjustment of the postoperative morbidity rate for the comparative assessment of the quality of surgical care: results of the National Veterans Affairs Surgical Risk Study. J Am Coll Surg. 1997;185(4):328-340.
18. Fink AS, Campbell DA, Mentzer RM, et al. The National Surgical Quality Improvement Program in non-Veterans Administration hospitals: initial demonstration of feasibility. Ann Surg. 2002;236(3):344-353.
19. Khuri SF, Daley J, Henderson W, et al. The National Veterans Administration Surgical Risk Study: risk adjustment for the comparative assessment of the quality of surgical care. J Am Coll Surg. 1995;180(5):519-531.
20. Martin CT, Gao Y, Pugely AJ, Wolf BR. 30-day morbidity and mortality after elective shoulder arthroscopy: a review of 9410 cases. J Shoulder Elbow Surg. 2013;22(12):1667-1675.
21. Martin CT, Pugely AJ, Gao Y, Wolf BR. Risk factors for thirty-day morbidity and mortality following knee arthroscopy: a review of 12,271 patients from the National Surgical Quality Improvement Program database. J Bone Joint Surg Am. 2013;95(14):e98.
22. Shiloach M, Frencher SK Jr, Steeger JE, et al. Toward robust information: data quality and inter-rater reliability in the American College of Surgeons National Surgical Quality Improvement Program. J Am Coll Surg. 2010;210(1):6-16.
23. Schoenfeld AJ, Ochoa LM, Bader JO, Belmont PJ Jr. Risk factors for immediate postoperative complications and mortality following spine surgery: a study of 3475 patients from the National Surgical Quality Improvement Program. J Bone Joint Surg Am. 2011;93(17):1577-1582.
24. Yadla S, Malone J, Campbell PG, et al. Obesity and spine surgery: reassessment based on a prospective evaluation of perioperative complications in elective degenerative thoracolumbar procedures. Spine J. 2010;10(7):581-587.
25. Lo YP, Chan YS, Lien LC, Lee MS, Hsu KY, Shih CH. Complications of hip arthroscopy: analysis of seventy three cases. Chang Gung Med J. 2006;29(1):86-92.
26. Ilizaliturri VM Jr. Complications of arthroscopic femoroacetabular impingement treatment: a review. Clin Orthop Relat Res. 2009;467(3):760-768.
27. Domb BG, Linder D, Finley Z, et al. Outcomes of hip arthroscopy in patients aged 50 years or older compared with a matched-pair control of patients aged 30 years or younger. Arthroscopy. 2015;31(2):231-238.
28. Javed A, O’Donnell JM. Arthroscopic femoral osteochondroplasty for cam femoroacetabular impingement in patients over 60 years of age. J Bone Joint Surg Br. 2011;93(3):326-331.
29. Philippon MJ, Schroder E Souza BG, Briggs KK. Hip arthroscopy for femoroacetabular impingement in patients aged 50 years or older. Arthroscopy. 2012;28(1):59-65.
30. Larson CM, Giveans MR, Taylor M. Does arthroscopic FAI correction improve function with radiographic arthritis? Clin Orthop Relat Res. 2011;469(6):1667-1676.
31. Haviv B, O’Donnell J. The incidence of total hip arthroplasty after hip arthroscopy in osteoarthritic patients. Sports Med Arthrosc Rehabil Ther Technol. 2010;2:18.
Take-Home Points
- Using the NSQIP database, the authors report that the overall complication rate was 1.21% after hip arthroscopy.
- The most common complications cited were bleeding requiring transfusion (0.45%), return to OR (0.23%), superficial infection (0.23%), and thrombophlebitis (0.15).
- Most common 10CPT code was arthroscopic débridement in 50% of cases, reflecting the types of cases being performed in the time period.
- FAI codes were less common in this database–labral repair in 24%, femoral osteochondroplasty in 16%, and acetabuloplasty in 9%.
- Use caution in patients over age 65 years as this appears to be a risk factor for morbidity.
Hip arthroscopy is a well-described method for treating a number of pathologies.1-3 Surgical indications are wide-ranging and include femoral acetabular impingement (FAI), labral tears, loose bodies, osteochondral injuries, ruptured ligamentum teres, and synovitis, as well as extra-articular injuries, including hip abductor tears and sciatic nerve entrapment.2,4-6 Authors have suggested that the advantages of hip arthroscopy over open procedures include less traumatic access to the hip joint and faster recovery,7,8 and hip arthroscopy has been found cost-effective in select groups of patients.9
Overall complications have been reported in 1% to 20% of hip arthroscopy patients,6,8,10,11 and a meta-analysis identified an overall complication rate of 4%.8 Complications include iatrogenic chondrolabral injury, nerve injury, superficial surgical-site infection, deep vein thrombosis (DVT), instrument failure, portal wound bleeding, soft-tissue injury, and intra-abdominal fluid extravasation.6,8,10-13 Rates of major complications are relatively low, 0.3% to 0.58%, according to several recent systematic reviews.8,12 Given the lack of universally accepted definitions, reports of minor complications (eg, iatrogenic chondrolabral injury, neuropraxia) in hip arthroscopy vary widely.8 Furthermore, many of the series with high complication rates represent early experience with the technique, and later authors suggested that complications should decrease with improvements in technique and technology.12,14,15The literature is lacking in reports of risk factors for patient morbidity and large multi-institutional cohorts in the setting of hip arthroscopy. We conducted a study of elective hip arthroscopy patients to determine type and incidence of complications and rates of and risk factors for minor and major morbidity.
Materials and Methods
This retrospective study was deemed compliant with HIPAA (Health Insurance Portability and Accountability Act of 1996) and exempt from the need for Institutional Review Board approval. In the National Surgical Quality Improvement Program (NSQIP), academic and private medical institutions prospectively collect patient preoperative and operative data as well as 30-day outcome data from more than 500 hospitals throughout the United States.16-21 Surgical clinical reviewers, who are responsible for data acquisition, prospectively collect morbidity data for 30 days after surgery through a chart review of patient progress notes, operative notes, and follow-up clinic visits. Patients may be contacted by a surgical clinical reviewer if they have not had a clinic visit within 30 days after a procedure to verify the presence or absence of complications or admissions at outside institutions, and in this way even outpatient complications should be captured. If the medical record is unclear, the reviewer may also contact the surgeon directly. In addition, NSQIP data are routinely audited; the interobserver disagreement rate is 1.56%.22
We used Current Procedural Terminology (CPT) billing codes to retrospectively survey the NSQIP database for hip arthroscopies performed between 2006 and 2013. Excluding cases of compromised surgical wounds, emergent surgeries, surgeries involving fracture, hip dislocations, preoperative sepsis, septic joints, and osteomyelitis, we identified 1325 cases with CPT codes 29861 (hip arthroscopy), 29862 (arthroscopic hip débridement, shaving), 29914 (arthroscopic femoroplasty), 29915 (arthroscopic acetabuloplasty), and 29916 (arthroscopic labral repair). Postoperative outcomes were categorized as major morbidity or mortality, minor morbidity, and any complication. A major complication was a systemic life-threatening event or a substantial threat to a vital organ, whereas a minor complication did not pose a major systemic threat and was localized to the operative extremity (previously used definitions23,24). We have used similar methods to report the rates of and risk factors for complications of knee arthroscopy, shoulder arthroscopy, and total shoulder arthroplasty.16,20,21 For any-complication outcomes, we included both major and minor morbidities, and mortality. NSQIP applies strict definitions (listed in its user file17) to patient comorbidities and complications. Data points collected included patient demographics, medical comorbidities, laboratory values, and surgical characteristics.
Initially, we performed a univariate analysis that considered age, sex, race, body mass index, current alcohol abuse, current smoking status, recent weight loss, dyspnea, chronic obstructive pulmonary disease, CPT code, congestive heart failure, hypertension, diabetes, peripheral vascular disease, esophageal varices, disseminated cancer, steroid use, bleeding disorder, dialysis, chemotherapy within previous 30 days, radiation therapy within previous 90 days, operation within previous 30 days, American Society of Anesthesiologists class, operative time, resident involvement, and patient functional status. We also included mean preoperative sodium, blood urea nitrogen, and albumin levels; white blood cell count; hematocrit; platelet count; and international normalized ratio. The analysis revealed unadjusted differences between patients with and without complications (t test was used for continuous variables, χ2 test for categorical variables). Any variable with P < .2 in the univariate analysis and more than 80% complete data was considered fit for our multivariate model. We controlled for confounders by performing a multivariate logistic regression analysis. Three separate analyses were performed; the outcome variables were major morbidity or mortality, minor morbidity, and any complication. P < .05 was used for statistical significance across all models. We used SAS Version 9.3 (SAS Institute) for statistical analysis. Model quality was evaluated for calibration (Hosmer-Lemeshow test) and discrimination (C statistics). The calibration test yielded a modified χ2 statistic, and P > .05 indicated the model was appropriate and fit the data well. Good discrimination is commonly reported to be between 0.65 and 0.85.
Results
Of the 1325 patients who underwent hip arthroscopy, 60% were female. Regarding age, 52% were younger than 40 years, and 45% were between 45 years and 60 years. The most common diagnoses were articular cartilage disorder involving the pelvic region (15%), enthesopathy of the hip (12%), and joint pain involving the pelvic region or thigh (11%). The most common primary CPT code (50%) was for hip arthroscopic débridement (29862), followed by 24% for arthroscopic labral repair (29916), 16% for arthroscopic femoroplasty (29914), and 9% for arthroscopic acetabuloplasty (29915). Of the 16 complications found, 12 involved hip arthroscopic débridement, and 4 involved hip arthroscopic femoroplasty. There were no complications of arthroscopic acetabuloplasty (29915), arthroscopic labral repair (29916), or hip arthroscopy (29861).
Of the 1325 hip arthroscopy patients, 16 (1.21%) had at least 1 complication (Table 1).
Univariate analysis identified age (P = .014), CPT code (P = .036), hypertension (P = .128), and steroid use (P = .188) as risk factors for any complication (Table 2).
Discussion
Earlier reports on hip arthroscopy did not consider risk factors for systemic morbidity and were mainly single-institution case series.3,10,11,13,25 Given a renewed focus on outcomes measurement and quality assessment in orthopedic surgery, we wanted to describe short-term complications of and risk factors for morbidity in hip arthroscopy. In this article, we report baseline data from a large multicenter cohort. For hip arthroscopy, we found low rates of short-term complications (1.21%) and major morbidities (0.45%). We considered many modifiable and nonmodifiable risk factors for complications and found age over 65 years to be an independent risk factor for any complication and minor morbidity. Several of our findings merit further discussion.
Other authors have reported hip arthroscopy complication rates of 1% to 20%, citing both systemic and local complications,6,8,10-12 and major complication rates of 0.3% to 0.58%.8,12 Minor complications of hip arthroscopy vary, and depend on definition, with long-term consequences unknown in some cases.8 Sensory neuropraxia, a relatively common minor complication in hip arthroscopy, is thought to be affected by the amount of traction against a perineal post and by increased operative time, with operative time under 2 hours previously suggested.3,6,10,11,13,25,26
In the present study, the overall rate of any complication of hip arthroscopy was 1.21%, and the most common complications were bleeding resulting in transfusion, return to operating room, superficial surgical-site infection, and DVT/thrombophlebitis. When we excluded bleeding resulting in transfusion, the overall complication rate fell to 0.75%. Operative time was relatively short, <2 hours for 70% of patients. Last, there were no mortalities. As our data set did not include variables encompassing sensory neuropraxia or iatrogenic chondrolabral injury, we were unable to report on these data.
Surgeons and healthcare systems should be advised that rates of systemic complications in hip arthroscopy are low and that hip arthroscopy is a relatively safe procedure. Surgeons and healthcare systems can refer to our reported complication rates and risk factors when assessing quality and performing cost analysis in hip arthroscopy. For our 1325 patients, the major morbidity rate was 0.45%, within the range of previous reports.8,12 There were no nerve injuries in our patient cohort, likely because of the strict NSQIP definitions of nerve injury. We cannot report on sensory neuropraxia and iatrogenic chondrolabral injury. We speculate that lack of these variables may have artificially lowered our minor complication rate.
Some authors have reported clinical benefits of hip arthroscopy in older patients,27-29 whereas others have suggested age may be a negative prognostic factor.27,30 Suggested indications for hip arthroscopy in an elderly population include chondral defects, labral tears, and FAI in the absence of significant arthritic changes.28,29 Larson and colleagues,30 who reported a 52% failure rate for osteoarthritis patients who underwent hip arthroscopy for FAI, concluded that arthroscopy should not be offered to patients with evidence of advanced radiographic joint space narrowing. Others have noted that patients who were under age 55 years and had minimal osteoarthritic changes had a longer interval between hip arthroscopy and total hip arthroplasty in comparison with patients over age 55 years.31 Previous work in knee arthroscopy found older age (40-65 years vs <40 years) was an independent predictor of short-term complications (1.5 times increased risk).21 In the present study, 7.69% of patients who were over age 65 years when they underwent hip arthroscopy had a complication, and we report age over 65 years as an independent risk factor for any complication (OR, 6.52) and minor morbidity (OR, 7.97). Surgeons should be aware that advanced age is an independent risk factor for complications in hip arthroscopy. Potential benefits of hip arthroscopy should be carefully weighed against the increased risk in this patient cohort, and surgeons should ascertain the scope of an elderly patient’s disease to determine if hip arthroscopy is indicated and worth the potential risks.
To our knowledge, bleeding resulting in transfusion was not previously described as a complication of hip arthroscopy. In the present study, bleeding resulting in transfusion was the most common complication (6 patients, 0.45%), and all the affected patients had a primary CPT code for arthroscopic débridement (29862). The 6 primary diagnoses were hip osteoarthrosis (3), thigh/pelvis pain (1), unspecified injury (1), and congenital hip deformity (1). The 6 transfusion patients also tended to be older (ages 30, 53, 64, 67, 76, and 90 years). Although drawing firm conclusions from so few patients would be inappropriate, we acknowledge that the majority who received a transfusion were older, underwent arthroscopic débridement of a hip, and had a primary diagnosis of osteoarthrosis or pain. As transfusion practices can differ between surgeons and groups, we conclude that the risk for bleeding requiring transfusion is low in hip arthroscopy. Patients who are older and who undergo arthroscopic débridement of an osteoarthritic hip may be at elevated risk for transfusion.
This study had several limitations. First, with use of the NSQIP database, follow-up was limited to 30 days. We speculate that longer follow-up might yield higher complication rates and additional risk factors. Second, we could not distinguish individual surgeon or site data and acknowledge complications might differ between surgeons and sites that perform hip arthroscopy more frequently. Third, as data were limited to medical and broadly applicable surgical variables included in the NSQIP database, they might not be specific to hip arthroscopy, and we cannot report on iatrogenic chondrolabral injury and neuropraxia, 2 previously reported minor complications in hip arthroscopy. We speculate that data collection focused on problems specific to hip arthroscopy would yield more complications and risk factors.
Conclusion
According to the NSQIP data, the rate of short-term morbidity after elective hip arthroscopy was low, 1.21%. Surgeons may use our reported complications and risk factors when counseling patients, and healthcare systems may use our data when assessing quality and performance in hip arthroscopy. Surgeons who perform elective hip arthroscopy should be aware that age over 65 years is an independent predictor of complications. Careful attention should be given to this patient group when indicating hip arthroscopy procedures.
Am J Orthop. 2017;46(1):E1-E9. Copyright Frontline Medical Communications Inc. 2017. All rights reserved.
1. Byrd JW. Hip arthroscopy utilizing the supine position. Arthroscopy. 1994;10(3):275-280.
2. Byrd JW, Jones KS. Prospective analysis of hip arthroscopy with 10-year followup. Clin Orthop Relat Res. 2010;468(3):741-746.
3. Griffin DR, Villar RN. Complications of arthroscopy of the hip. J Bone Joint Surg Br. 1999;81(4):604-606.
4. de Sa D, Alradwan H, Cargnelli S, et al. Extra-articular hip impingement: a systematic review examining operative treatment of psoas, subspine, ischiofemoral, and greater trochanteric/pelvic impingement. Arthroscopy. 2014;30(8):1026-1041.
5. de Sa D, Phillips M, Philippon MJ, Letkemann S, Simunovic N, Ayeni OR. Ligamentum teres injuries of the hip: a systematic review examining surgical indications, treatment options, and outcomes. Arthroscopy. 2014;30(12):1634-1641.
6. Oak N, Mendez-Zfass M, Lesniak BP, Larson CM, Kelly BT, Bedi A. Complications in hip arthroscopy. Sports Med Arthrosc. 2013;21(2):97-105.
7. Botser IB, Smith TW Jr, Nasser R, Domb BG. Open surgical dislocation versus arthroscopy for femoroacetabular impingement: a comparison of clinical outcomes. Arthroscopy. 2011;27(2):270-278.
8. Kowalczuk M, Bhandari M, Farrokhyar F, et al. Complications following hip arthroscopy: a systematic review and meta-analysis. Knee Surg Sports Traumatol Arthrosc. 2013;21(7):1669-1675.
9. Shearer DW, Kramer J, Bozic KJ, Feeley BT. Is hip arthroscopy cost-effective for femoroacetabular impingement? Clin Orthop Relat Res. 2012;470(4):1079-1089.
10. Clarke MT, Arora A, Villar RN. Hip arthroscopy: complications in 1054 cases. Clin Orthop Relat Res. 2003;(406):84-88.
11. Pailhé R, Chiron P, Reina N, Cavaignac E, Lafontan V, Laffosse JM. Pudendal nerve neuralgia after hip arthroscopy: retrospective study and literature review. Orthop Traumatol Surg Res. 2013;99(7):785-790.
12. Harris JD, McCormick FM, Abrams GD, et al. Complications and reoperations during and after hip arthroscopy: a systematic review of 92 studies and more than 6,000 patients. Arthroscopy. 2013;29(3):589-595.
13. Sampson TG. Complications of hip arthroscopy. Clin Sports Med. 2001;20(4):831-835.
14. Konan S, Rhee SJ, Haddad FS. Hip arthroscopy: analysis of a single surgeon’s learning experience. J Bone Joint Surg Am. 2011;93(suppl 2):52-56.
15. Souza BG, Dani WS, Honda EK, et al. Do complications in hip arthroscopy change with experience? Arthroscopy. 2010;26(8):1053-1057.
16. Anthony CA, Westermann RW, Gao Y, Pugely AJ, Wolf BR, Hettrich CM. What are risk factors for 30-day morbidity and transfusion in total shoulder arthroplasty? A review of 1922 cases. Clin Orthop Relat Res. 2015;473(6):2099-2105.
17. Daley J, Khuri SF, Henderson W, et al. Risk adjustment of the postoperative morbidity rate for the comparative assessment of the quality of surgical care: results of the National Veterans Affairs Surgical Risk Study. J Am Coll Surg. 1997;185(4):328-340.
18. Fink AS, Campbell DA, Mentzer RM, et al. The National Surgical Quality Improvement Program in non-Veterans Administration hospitals: initial demonstration of feasibility. Ann Surg. 2002;236(3):344-353.
19. Khuri SF, Daley J, Henderson W, et al. The National Veterans Administration Surgical Risk Study: risk adjustment for the comparative assessment of the quality of surgical care. J Am Coll Surg. 1995;180(5):519-531.
20. Martin CT, Gao Y, Pugely AJ, Wolf BR. 30-day morbidity and mortality after elective shoulder arthroscopy: a review of 9410 cases. J Shoulder Elbow Surg. 2013;22(12):1667-1675.
21. Martin CT, Pugely AJ, Gao Y, Wolf BR. Risk factors for thirty-day morbidity and mortality following knee arthroscopy: a review of 12,271 patients from the National Surgical Quality Improvement Program database. J Bone Joint Surg Am. 2013;95(14):e98.
22. Shiloach M, Frencher SK Jr, Steeger JE, et al. Toward robust information: data quality and inter-rater reliability in the American College of Surgeons National Surgical Quality Improvement Program. J Am Coll Surg. 2010;210(1):6-16.
23. Schoenfeld AJ, Ochoa LM, Bader JO, Belmont PJ Jr. Risk factors for immediate postoperative complications and mortality following spine surgery: a study of 3475 patients from the National Surgical Quality Improvement Program. J Bone Joint Surg Am. 2011;93(17):1577-1582.
24. Yadla S, Malone J, Campbell PG, et al. Obesity and spine surgery: reassessment based on a prospective evaluation of perioperative complications in elective degenerative thoracolumbar procedures. Spine J. 2010;10(7):581-587.
25. Lo YP, Chan YS, Lien LC, Lee MS, Hsu KY, Shih CH. Complications of hip arthroscopy: analysis of seventy three cases. Chang Gung Med J. 2006;29(1):86-92.
26. Ilizaliturri VM Jr. Complications of arthroscopic femoroacetabular impingement treatment: a review. Clin Orthop Relat Res. 2009;467(3):760-768.
27. Domb BG, Linder D, Finley Z, et al. Outcomes of hip arthroscopy in patients aged 50 years or older compared with a matched-pair control of patients aged 30 years or younger. Arthroscopy. 2015;31(2):231-238.
28. Javed A, O’Donnell JM. Arthroscopic femoral osteochondroplasty for cam femoroacetabular impingement in patients over 60 years of age. J Bone Joint Surg Br. 2011;93(3):326-331.
29. Philippon MJ, Schroder E Souza BG, Briggs KK. Hip arthroscopy for femoroacetabular impingement in patients aged 50 years or older. Arthroscopy. 2012;28(1):59-65.
30. Larson CM, Giveans MR, Taylor M. Does arthroscopic FAI correction improve function with radiographic arthritis? Clin Orthop Relat Res. 2011;469(6):1667-1676.
31. Haviv B, O’Donnell J. The incidence of total hip arthroplasty after hip arthroscopy in osteoarthritic patients. Sports Med Arthrosc Rehabil Ther Technol. 2010;2:18.
Complexity at Hospital Discharge
Patient complexity is associated with greater hospital readmission rates,1,2 poorer quality of care,3 and lower patient satisfaction.4 Improving outcomes for complex patients is a global priority,5 and local initiatives such as Ontario’s Health Links are being developed, yet evidence to inform care is lacking.6-8
The prevalence of patients living with multiple comorbidities is increasing as advances in medicine enable people to live and manage chronic diseases.9-11 However, these medical gains have resulted in an increased burden on both patients and healthcare systems. Socioeconomic status and co-occurring psychosocial challenges further complicate health and healthcare in marginalized populations.12,13
Human immunodeficiency virus/acquired immunodeficiency syndrome (HIV/AIDS) is one example of a disease that medicine has transformed. Individuals living with HIV today, on antiretroviral medications, may be able to manage their chronic illness for decades.14,15 However, in addition to social determinants of health that influence ongoing adherence and engagement in care, these medications do not completely eradicate the impact of HIV and, as a result, HIV-positive individuals are at a greater risk of developing additional comorbidities.15 People living with HIV may, therefore, represent an important patient population in which healthcare interventions and system improvements for complex patients should be explored.
Improving health systems and better supporting complex patients requires a broader understanding of the patient experience and the challenges encountered, especially during high-risk periods such as hospital discharge. Qualitative research approaches are designed to help us understand social phenomena in their “natural” settings,16 and thus suited to achieve this goal, providing critical insight to inform healthcare systems and policies.17,18 This study sought to answer the question, “What are the obstacles and challenges faced by complex patients during hospital discharge and post-discharge transition?” We approached patient complexity holistically, using a unified Complexity Framework6 that connects 5 health dimensions—social capital, mental health, demographics, health and social experiences, and physical health—identified as important to understanding complex patients and their interaction with healthcare. A longitudinal case study approach was used, with multiple sources of data, to understand the clinical context and discharge plans in relation to the lived experience of patients over time, exploring potential misalignment and areas for improvement.
METHODS
This community-based research study was conducted at Casey House, a 13-bed subacute care hospital in Toronto, Canada that provides in-patient and community programs to a complex patient group. All patients are HIV-positive. Inpatient hospital care is provided by an interdisciplinary team, including physicians, social workers, nurses, and healthcare aides. A harm reduction approach is taken to substance use. Twelve beds are for general admission. Patients may be transferred from acute-care hospitals or referred by community-based providers. One bed is reserved for scheduled 2-week respite stays.
The primary research team for this community-based project consisted of clinicians and community and academic researchers. The study was conducted in collaboration with housing, healthcare, and HIV service providers and was advised by 2 individuals with lived experience of discharge from Casey House. Community members with lived experience attended team meetings, provided feedback on all stages of the project (ie, interview guides, recruitment, analysis and dissemination), and helped facilitate community engagement sessions with other patients at the start and the end of the project.
Standard practice for discharge planning involves clinicians determining a tentative discharge date and identifying strategies to support the patient. Planning is informed by knowledge gathered by the interdisciplinary team throughout the admission, including social determinants of health (ie, housing, social support, food security). Patients are encouraged to invite an individual from their social support network to attend a discharge meeting, where the care team reviews goals for admission, course of treatment, referrals, and important follow-up dates.
We used a multi-case study approach to explore the discharge process and post-discharge period. A case was defined as the discharge and transition of a patient from hospital to community. Data were collected through serial interviews with patients (n = 4), medical chart abstraction, and review of discharge summaries. Serial interviews, although not frequently used in clinical research, have been proposed as a strong approach for exploring complex processes and to build trust between researcher and participant,19 both of which were relevant in this study. Patient interviews were conducted by the Master’s trained research coordinator (SM) using tailored semi-structured interview guides for 4 time points: before the discharge meeting (I1); after the discharge meeting but before discharge (I2); within a week of discharge (I3); and approximately 30 days after discharge (I4). Interviews were audio recorded and transcribed verbatim.
Cases were eligible if the patient had a general admission and a planned discharge to the community, and was able to communicate in English and direct his/her own care. Patient-initiated discharges and discharges to another healthcare facility were excluded. Casey House clinical staff approached consecutive potentially eligible patients for their willingness to speak with the researcher coordinator. The research coordinator met with patients to assess eligibility and obtain informed consent to participate. All participants provided informed written consent. The study was approved by the University of Toronto HIV Research Ethics Board.
Interview data, managed with MAXQDA software (VERBI GmbH, Berlin, Germany), were analyzed using a framework analysis approach.20,21 At least 3 authors read each transcript in its entirety. Priority questions/topics identified a priori by stakeholders as important to inform change in care and practices were used as the first draft of the coding framework. The framework was modified through team discussion in the analysis phase to integrate emerging themes. Participant demographic and clinical data were extracted using a structured data collection form.
Preliminary data analysis was completed for the separate data sources including inter- and intra-case comparisons: exploring how experiences and perceptions changed over time and themes that emerged across cases at the same time point. Data sources were combined to strengthen the understanding of the cases and identify relationships and discrepancies across sources.22 Audit trails, reflexive journaling, group coding and analysis meetings and member-checking, were used to enhance analytical rigor.
RESULTS
The results focus on the patient experience of the “discharge plan” and are presented in terms of 3 pre-identified categories: 1) social support; 2) discharge process and transition experience; and 3) post-discharge follow-up and referrals; and 1 emergent theme, patient priorities.

Participants experienced complex medical and psychosocial challenges (Table 1, participant characteristics). All participants were living with HIV plus a mean of 5 additional comorbidities, the most common being hepatitis C (n = 3), chronic obstructive pulmonary disease (n = 2), herpes (n = 2) and opportunistic infections (n = 2). Eight of 9 participants had a history of an Axis 1 diagnosis, most commonly mood disorder (n = 4). Substance use was identified in all participants. An overview of each case is presented in Table 2.

Three patients declined to be considered for the study. Informed consent was obtained for 10 cases. One participant withdrew after interview 1. Data are presented here for 9 cases, including 32 interviews, between October 2013 and June 2014. Interviews 1 (I1) and 2 (I2) were combined for 3 participants. Two participants were lost to follow-up for interview 4.
Social Support
For the purposes of this paper, we define “social support” as the emotional or instrumental assistance an individual perceives and experiences from people in his/her self-identified network (ie, family, friends). Participants’ discharge-related experience of social support did not align, in most cases, with the information from their medical charts or their expectations. At admission, 8 of 9 participants identified at least 1 person in their social support network, yet only 1 participant had someone attend the discharge meeting. One participant said she had expected “my daughter, my mother, my brother, somebody. At least somebody. But they never show up.” (P5, I2).
The complexity of her relationship with her family and her unmet needs for support continued after discharge:
I try and be as independent as possible. I don’t have to call them for nothing. Because, even the other day, I called my mom and I asked her, I said, “Mom, I’m going to give you $400 [to pay back a personal loan] and I’m going to give you an extra $100, you could buy me some food.” And she goes “Okay.” But, I didn’t give it to her yet. I don’t know, she seems money hungry right now, so I’m like no, I’ll wait. (P5, I4)
In the hospital, participants frequently spoke about discharge and transition planning that was inclusive of their social support networks. However, a sense of isolation and loneliness was common post-discharge. Often, friends and family members did not provide the support that participants anticipated, but instead were sources of anxiety and stress. One participant conveyed his experience with a friend he listed as a social support:
I gave him some money to get me some groceries, to make sure I had some food in the house when I got home. He didn’t do that. All of a sudden he was called away to [another city]. He told me his father had a heart attack. He told [others] his father had a slip. I still have yet to receive my money. (P7, I4)
Discharge Process and Transition Experience
While some participants were excited about the thought of freedom of being home, others were anxious about the burdens of returning to life outside of the hospital.
I kind of feel like, yeah, I want to go home, but then I think to myself what am I going to do when I get home. Am I just going to go back to what I’ve been doing? Am I going to really change? Am I going to forget to take my pill one day because I’m home and stuff like that. (P4, I1)
The discharge process was often perceived by participants to be rushed. Some participants found the discharge meetings helpful, while others did not feel the process empowered them to engage in a meaningful conversation with hospital staff.
There was no one there with me to even help me with my brain, to think. But it’s afterwards I’m like why didn’t I say that, like that’s what I meant to say. The brain just doesn’t function that way. (P8, I2).
This participant struggled with the transition. One week after discharge when she was asked how her health was she replied:
Terrible. I’ve got no energy. I haven’t eaten for 3 days. I haven’t drank for 3 days. I’ve got diarrhea galore […] Just no appetite whatsoever. I can’t even make it up the stairs without losing my breath. If I make it up the stairs, I have to sit for 15 or 20 minutes… (P8, I3)
The weight of maintaining activities of daily living was prominent in all post-discharge interviews, in many cases accentuated by declining health. The transition to home was more challenging than participants expected; the experience was strongly influenced by the stability of their health, their environment, and the complexity of their lives.
Follow-up and Referrals
Discharge summaries included a mean of 7 referrals. All participants were referred to a case coordinator, nurse, and family physician. Other referrals included pharmacist (n = 8); personal support worker (n = 6); housing (n = 5); and food-support programs (n = 5).
Several factors led to challenges accessing and receiving services. Participants identified: difficulty with requisite paperwork; mobility and financial constraints; personal and logistical challenges with home-care providers; and competing priorities, such as caring for family. These experiences were frequently accompanied by frustration and anxiety.
Because, if I’m in [city where girlfriend lives], I will not get the support that I get when I’m home. Like my nurse comes. [She] was supposed to come and see me twice and I missed that. I missed like 4 [appointments]. You understand? Certain things I’ve been missing. (P6, I4)
When one participant was asked if she had followed up with the food support program she had been referred to, she responded:
Oh, baby, no. I’ve been so confused. I’ve had ODSP [referring to Ontario Disability Support Program, a government disability program] on my case. I’ve got all the files all mixed up. My worker’s a real bitch. She hates me, big time. I was supposed to go bring in papers today, but I couldn’t get out of bed. I don’t know how much trouble I’m going to be in with ODSP now. (P8, I3)
Despite comprehensive discharge plans and referrals, all participants experienced delays and difficulties in accessing and receiving services. In most cases, there was no single contributing factor to these challenges; the unique experiences were a result of the complex interplay of multiple factors for each individual.
Patient Priorities
In the hospital, participants primarily identified goals of improving physical health and medication adherence. However, these goals often shifted to meeting basic living necessities and supporting others upon discharge. Barriers to adequate food and mobility were prominent themes.
One participant spoke about the challenges of supporting her son while struggling with her own health after discharge:
Well, I’ve been dying, I can’t even walk, and yet I’m the one that still has to go to WalMart, to grab milk and bread for my kid. It’s not like I need any of that stuff, because I don’t even eat. (P8, I3)
Participants were admitted on a mean of 6 medications and discharged with a mean of 14 (Table 1). In the hospital, medications are dispensed directly to patients; however, maintaining optimal adherence at home was complex. When 1 participant was asked about her medications after being home for a week, she said:
My meds, you know I have the cream that I’m supposed to put … and I can’t find it. I lost it yesterday. I used it yesterday morning and all day yesterday I’m looking, like, did it fall behind there? But, obviously, I can’t look over there [because of mobility challenges] … I don’t think I can get it covered [by insurance to replace it]. (P5, I3)
Participants found it difficult to follow a specific dosing schedule, ensure food intake corresponded to medication guidelines, and navigate the impact of substance use. Substance use for some was associated with nonadherence. A participant, explaining his quickly declining health, spoke about the impact of using crack cocaine:
Yeah, when I use I don’t think about medicating, taking my pills or anything like that. That’s not even on your mind. It doesn’t come across your mind. […] I guess, that’s part of the addictive personality. It wants to grab hold of you and say “no, focus on me, focus on me.” (P7, I4)
Others used marijuana as an appetite stimulant and a critical piece of their medication adherence routine.
DISCUSSION
This study followed complex patients through hospital discharge and transition back into the community. In the hospital, participants focused on medical goals, but following discharge basic living needs became the priority. Despite a comprehensive plan to provide support upon discharge, participants found executing and following up with referrals, services, and medication adherence was often overwhelming and not achieved in the month post-hospitalization.
Our study provides depth and context to support and understand the findings of reviews evaluating interventions to improve transitions in care.23,24 A systematic review of interventions to decrease 30-day readmission rates concluded that comprehensive support interventions (with many components) contributed to the greatest reduction in risk of readmission.16 Components that showed the greatest impact were those that were designed to improve patients’ capacity for self-care (including their ability to access and follow through with post-discharge care plans) and those that involved more individuals in the delivery of care.23
Our results also support and expand on other qualitative findings of complex patients. Kangovi et al.25 interviewed patients with low socioeconomic status at a single time point post-discharge to identify common experiences. They summarized their findings in 6 themes: powerlessness during hospitalization; incongruence of patient and clinical team goals; competing issues influencing prominence of health behaviors; socioeconomic constraints on patients’ ability to perform recommended behaviors; sense of abandonment after discharge; and loss of self-efficacy resulting from the “failure” to follow the discharge plan. Our findings tell a very similar story but provide the additional context and understanding of the lived experience over time. We found that the transition experience was most challenging when the home environment was unstable, resulting in a shift in priorities from those set during hospitalization.
While increased support may improve outcomes, there is a need to improve awareness, integration, and support for building capacity within complex patients.26 Capacity is defined here as the sum of resources and abilities that a patient can draw on, and includes physical and mental as well as social, financial, personal, and environmental capabilities and resources.27 This includes understanding the potential negative impact of developing a clinical plan which, in order to operationalize, requires resources in excess of the patient’s capacity at that time.27 Minimally disruptive medicine, a promising theoretical approach for improving the care of complex clients, embodies the awareness of capacity in achieving patient-centered care while “imposing the smallest possible treatment burden on patients’ lives.”28
This study, although not without its limitations, provides an in-depth exploration of the experiences of a small number of patients living with HIV, recruited from a single facility in Toronto, Canada after relatively long hospital stays. There are specific context issues related to HIV, such as stigma and severe consequences for suboptimal medication adherence. Furthermore, this study took place where many urban health resources exist; complex patients in rural settings or in environments less tailored to the needs associated with complex medical, psychiatric, and social conditions may experience greater barriers in the transition process. Although this study captured data from medical charts and documents relevant to the cases, further exploration of the clinician decision-making process in creating the discharge plans and additional sources of data on health outcomes post-discharge would be beneficial.
Despite its limitations, this study provides detail and depth to understand some of the most complex patients who suffer from significant challenges in the health system and who are amongst the highest-cost healthcare users. The case study approach, with serial interviews, is an important strength of this study, enabling meaningful insight into hospital discharge processes and challenges experienced by complex patients that can inform individual-level care practice and the development of new programs and interventions.
This study builds on recent research with complex patients in calling for a new approach to clinical care.6,29,30 In order to support complex patients through discharge, clinical goals and referrals must be made in light of a patient’s capacity in the community. Structural changes may be made to improve coordination and access to services, decreasing the burden and improving the healthcare experience. Albreht et al.31 highlight a number of promising programs across Europe (such as the Clinic for Multimorbidity and Polypharmacy in Denmark) designed to improve the health and healthcare for individuals living with multiple chronic conditions. Small-scale changes are also important such as increasing conversations about the capacity and limitations of individuals listed as social supports, and making appropriate and realistic referrals based on an understanding of a patient’s capacity and motivation for follow-up. Shippee et al.32 identify a list of approaches in line with minimally disruptive medicine that can be integrated into existing systems as part of a developing “toolkit” (eg, elicitation of transcendent patient goals, and integration of patient-reported outcome tracking of challenges and burdens associated with health and daily living). The findings of this study suggest that the elements of the toolkit may provide a foundation for future interventions and research to improve hospital care and discharge outcomes for complex patients.
Disclosures
This project was funded by a Canadian Institutes of Health Research (CIHR) HIV/AIDS Community-based Research Catalyst Grant (#126669). Dr. Brennan’s research is supported by an Ontario HIV Treatment Network (OHTN) Applied HIV Research Chair. Dr. Chan Carusone reports grants from Canadian Institutes of Health Research during the conduct of the study.
1. Allaudeen N, Vidyarthi A, Masselli J, Auerback A. Redefining readmission risk factors for general medicine patients. J Hosp Med. 2011;6:54-60. PubMed
2. Hu J, Gonsahn MD, Nerenz DR. Socioeconomic status and readmissions: evidence from an urban teaching hospital. Health Aff (Millwood). 2014;33:778-785. PubMed
3. Panagioti M, Stokes J, Esmail A, et al. Multimorbidity and patient safety incidents in primary care: a systematic review and meta-analysis. PLoS One. 2015;10:e0135947. PubMed
4. Paddison CA, Saunders CL, Abel GA, Payne RA, Campbell JL, Roland M. Why do patients with multimorbidity in England report worse experiences in primary care? Evidence from the General Practice Patient Survey. BMJ Open. 2015;5:e006172. PubMed
5. Barnett K, Mercer SW, Norbury M, Watt G, Wyke S, Guthrie B. Epidemiology of multimorbidity and implications for health care, research, and medical education: a cross-sectional study. Lancet. 2012;380:37-43. PubMed
6. Schaink AK, Kuluski K, Lyons RF, et al. A scoping review and thematic classification of patient complexity: offering a unifying framework. J Comorbidity. 2012;2:1-9.
7. Roland M, Paddison C. Better management of patients with multimorbidity. BMJ. 2013;346:f2510. PubMed
8. Smith SM, Soubhi H, Fortin M, Hudon C, O’Dowd T. Managing patients with multimorbidity: a systematic review of interventions in primary care and community settings. BMJ. 2012;345:e5205. PubMed
9. Afshar S, Roderick PJ, Kowal P, Dimitrov BD, Hill AG. Multimorbidity and the inequalities of global ageing: a cross-sectional study of 28 countries using the World Health Surveys. BMC Public Health. 2015;15:776. PubMed
10. Pefoyo AJK, Bronskill SE, Gruneir A, et al. The increasing burden and complexity of multimorbidity. BMC Public Health. 2015;15:415. PubMed
11. Ward BW, Schiller JS. Prevalence of multiple chronic conditions among US adults: estimates from the National Health Interview Survey, 2010. Prev Chronic Dis. 2013;10:E65. PubMed
12. World Health Organization. Commission on Social Determinants of Health Final Report: Closing the Gap in a Generation: Health Equity through Action on Social Determinants of Health. Geneva, Switzerland: World Health Organization, 2008.
13. Barnett K, Mercer SW, Norbury M, Watt G, Wyke S, Guthrie B.. Epidemiology of multimorbidity and implications for health care, research and medical education: a cross-sectional study. Lancet. 2012;380:37-43. PubMed
14. Samji H, Cescon A, Hogg RS, et al. Closing the gap: increases in life expectancy among treated HIV-positive individuals in the United States and Canada. PLoS One. 2013;8:e81355. PubMed
15. Deeks SG, Lewin SR, Havlir DV. The end of AIDS: HIV infection as a chronic disease. Lancet. 2013;382:1525-1533. PubMed
16. Mays N, Pope C. Qualitative research: rigour and qualitative research. BMJ. 1995;311:109-112. PubMed
17. Gilson L, Hanson K, Sheikh K, Agyepong IA, Ssengooba F, Bennett S. Building the field of health policy and systems research: social science matters. PLoS Med. 2011;8:e1001079. PubMed
18. Stoto MA, Nelson CD, Klaiman T. Getting from what to why: using qualitative research to conduct public health systems research. AcademyHealth; August 2013. http://www.academyhealth.org/files/publications/qmforph.pdf. Accessed May 24, 2016.
19. Murray SA, Kendall M, Carduff E, et al. Use of serial qualitative interviews to understand patients’ evolving experiences and needs. BMJ. 2009;339:b3702. PubMed
20. Pope C, Ziebland S, Mays N. Qualitative research in health care. Analysing qualitative data. BMJ. 2000;320:114-116. PubMed
21. Dixon-Woods M. Using framework-based synthesis for conducting reviews of qualitative studies. BMC Med. 2011;9:39. PubMed
22. Yin RK. Case Study Research: Design and Methods. 5th ed. Thousand Oaks, CA: Sage Publications, Inc.; 2014.
23. Leppin AL, Gionfriddo MR, Kessler M, et al. Preventing 30-day hospital readmissions: a systematic review and meta-analysis of randomized trials. JAMA Intern Med. 2014;174:1095-1107. PubMed
24. Kansagara D, Chiovaro JC, Kagen D, et al. So many options, where do we start? An overview of the care transitions literature. J Hosp Med. 2016;11:221-230. PubMed
25. Kangovi S, Barg FK, Carter T, et al. Challenges faced by patients with low socioeconomic status during the post-hospital transition. J Gen Intern Med. 2013;29:283-289. PubMed
26. Gill A, Kuluski K, Jaakimainen L, Naganathan G, Upshur R, Wodchis WP. “Where do we go from here?” Health system frustrations expressed by patients with multimorbidity, their caregivers and family physicians. Healthc Policy. 2014;9:73-89. PubMed
27. Shippee ND, Shah ND, May CR, Mair FS, Montori VM. Cumulative complexity: a functional, patient-centered model of patient complexity can improve research and practice. J Clin Epidemiol. 2012;65:1041-1051. PubMed
28. Leppin AL, Montori VM, Gionfriddo MR. Minimally disruptive medicine: a pragmatically comprehensive model for delivering care to patients with multiple chronic conditions. Healthcare (Basel). 2015;3:50-63. PubMed
29. Salisbury C. Multimorbidity: redesigning health care for people who use it. Lancet. 2012;380:7-9. PubMed
30. Upshur R, Tracy S. Chronicity and complexity: is what’s good for the diseases always good for the patients? Can Fam Physician. 2008;54:1655-1658. PubMed
31. Albreht A, Dyakova M, Schellevis FG, Van den Broucke S. Many diseases, one model of care? J Comorbidity. 2016;6:12-20.
32. Shippee ND, Allen SV, Leppin AL, May CR, Montori VM. Attaining minimally disruptive medicine: context, challenges and a roadmap for implementation. J R Coll Physicians Edinb. 2015;45:118-122. PubMed
Patient complexity is associated with greater hospital readmission rates,1,2 poorer quality of care,3 and lower patient satisfaction.4 Improving outcomes for complex patients is a global priority,5 and local initiatives such as Ontario’s Health Links are being developed, yet evidence to inform care is lacking.6-8
The prevalence of patients living with multiple comorbidities is increasing as advances in medicine enable people to live and manage chronic diseases.9-11 However, these medical gains have resulted in an increased burden on both patients and healthcare systems. Socioeconomic status and co-occurring psychosocial challenges further complicate health and healthcare in marginalized populations.12,13
Human immunodeficiency virus/acquired immunodeficiency syndrome (HIV/AIDS) is one example of a disease that medicine has transformed. Individuals living with HIV today, on antiretroviral medications, may be able to manage their chronic illness for decades.14,15 However, in addition to social determinants of health that influence ongoing adherence and engagement in care, these medications do not completely eradicate the impact of HIV and, as a result, HIV-positive individuals are at a greater risk of developing additional comorbidities.15 People living with HIV may, therefore, represent an important patient population in which healthcare interventions and system improvements for complex patients should be explored.
Improving health systems and better supporting complex patients requires a broader understanding of the patient experience and the challenges encountered, especially during high-risk periods such as hospital discharge. Qualitative research approaches are designed to help us understand social phenomena in their “natural” settings,16 and thus suited to achieve this goal, providing critical insight to inform healthcare systems and policies.17,18 This study sought to answer the question, “What are the obstacles and challenges faced by complex patients during hospital discharge and post-discharge transition?” We approached patient complexity holistically, using a unified Complexity Framework6 that connects 5 health dimensions—social capital, mental health, demographics, health and social experiences, and physical health—identified as important to understanding complex patients and their interaction with healthcare. A longitudinal case study approach was used, with multiple sources of data, to understand the clinical context and discharge plans in relation to the lived experience of patients over time, exploring potential misalignment and areas for improvement.
METHODS
This community-based research study was conducted at Casey House, a 13-bed subacute care hospital in Toronto, Canada that provides in-patient and community programs to a complex patient group. All patients are HIV-positive. Inpatient hospital care is provided by an interdisciplinary team, including physicians, social workers, nurses, and healthcare aides. A harm reduction approach is taken to substance use. Twelve beds are for general admission. Patients may be transferred from acute-care hospitals or referred by community-based providers. One bed is reserved for scheduled 2-week respite stays.
The primary research team for this community-based project consisted of clinicians and community and academic researchers. The study was conducted in collaboration with housing, healthcare, and HIV service providers and was advised by 2 individuals with lived experience of discharge from Casey House. Community members with lived experience attended team meetings, provided feedback on all stages of the project (ie, interview guides, recruitment, analysis and dissemination), and helped facilitate community engagement sessions with other patients at the start and the end of the project.
Standard practice for discharge planning involves clinicians determining a tentative discharge date and identifying strategies to support the patient. Planning is informed by knowledge gathered by the interdisciplinary team throughout the admission, including social determinants of health (ie, housing, social support, food security). Patients are encouraged to invite an individual from their social support network to attend a discharge meeting, where the care team reviews goals for admission, course of treatment, referrals, and important follow-up dates.
We used a multi-case study approach to explore the discharge process and post-discharge period. A case was defined as the discharge and transition of a patient from hospital to community. Data were collected through serial interviews with patients (n = 4), medical chart abstraction, and review of discharge summaries. Serial interviews, although not frequently used in clinical research, have been proposed as a strong approach for exploring complex processes and to build trust between researcher and participant,19 both of which were relevant in this study. Patient interviews were conducted by the Master’s trained research coordinator (SM) using tailored semi-structured interview guides for 4 time points: before the discharge meeting (I1); after the discharge meeting but before discharge (I2); within a week of discharge (I3); and approximately 30 days after discharge (I4). Interviews were audio recorded and transcribed verbatim.
Cases were eligible if the patient had a general admission and a planned discharge to the community, and was able to communicate in English and direct his/her own care. Patient-initiated discharges and discharges to another healthcare facility were excluded. Casey House clinical staff approached consecutive potentially eligible patients for their willingness to speak with the researcher coordinator. The research coordinator met with patients to assess eligibility and obtain informed consent to participate. All participants provided informed written consent. The study was approved by the University of Toronto HIV Research Ethics Board.
Interview data, managed with MAXQDA software (VERBI GmbH, Berlin, Germany), were analyzed using a framework analysis approach.20,21 At least 3 authors read each transcript in its entirety. Priority questions/topics identified a priori by stakeholders as important to inform change in care and practices were used as the first draft of the coding framework. The framework was modified through team discussion in the analysis phase to integrate emerging themes. Participant demographic and clinical data were extracted using a structured data collection form.
Preliminary data analysis was completed for the separate data sources including inter- and intra-case comparisons: exploring how experiences and perceptions changed over time and themes that emerged across cases at the same time point. Data sources were combined to strengthen the understanding of the cases and identify relationships and discrepancies across sources.22 Audit trails, reflexive journaling, group coding and analysis meetings and member-checking, were used to enhance analytical rigor.
RESULTS
The results focus on the patient experience of the “discharge plan” and are presented in terms of 3 pre-identified categories: 1) social support; 2) discharge process and transition experience; and 3) post-discharge follow-up and referrals; and 1 emergent theme, patient priorities.
Participants experienced complex medical and psychosocial challenges (Table 1, participant characteristics). All participants were living with HIV plus a mean of 5 additional comorbidities, the most common being hepatitis C (n = 3), chronic obstructive pulmonary disease (n = 2), herpes (n = 2) and opportunistic infections (n = 2). Eight of 9 participants had a history of an Axis 1 diagnosis, most commonly mood disorder (n = 4). Substance use was identified in all participants. An overview of each case is presented in Table 2.
Three patients declined to be considered for the study. Informed consent was obtained for 10 cases. One participant withdrew after interview 1. Data are presented here for 9 cases, including 32 interviews, between October 2013 and June 2014. Interviews 1 (I1) and 2 (I2) were combined for 3 participants. Two participants were lost to follow-up for interview 4.
Social Support
For the purposes of this paper, we define “social support” as the emotional or instrumental assistance an individual perceives and experiences from people in his/her self-identified network (ie, family, friends). Participants’ discharge-related experience of social support did not align, in most cases, with the information from their medical charts or their expectations. At admission, 8 of 9 participants identified at least 1 person in their social support network, yet only 1 participant had someone attend the discharge meeting. One participant said she had expected “my daughter, my mother, my brother, somebody. At least somebody. But they never show up.” (P5, I2).
The complexity of her relationship with her family and her unmet needs for support continued after discharge:
I try and be as independent as possible. I don’t have to call them for nothing. Because, even the other day, I called my mom and I asked her, I said, “Mom, I’m going to give you $400 [to pay back a personal loan] and I’m going to give you an extra $100, you could buy me some food.” And she goes “Okay.” But, I didn’t give it to her yet. I don’t know, she seems money hungry right now, so I’m like no, I’ll wait. (P5, I4)
In the hospital, participants frequently spoke about discharge and transition planning that was inclusive of their social support networks. However, a sense of isolation and loneliness was common post-discharge. Often, friends and family members did not provide the support that participants anticipated, but instead were sources of anxiety and stress. One participant conveyed his experience with a friend he listed as a social support:
I gave him some money to get me some groceries, to make sure I had some food in the house when I got home. He didn’t do that. All of a sudden he was called away to [another city]. He told me his father had a heart attack. He told [others] his father had a slip. I still have yet to receive my money. (P7, I4)
Discharge Process and Transition Experience
While some participants were excited about the thought of freedom of being home, others were anxious about the burdens of returning to life outside of the hospital.
I kind of feel like, yeah, I want to go home, but then I think to myself what am I going to do when I get home. Am I just going to go back to what I’ve been doing? Am I going to really change? Am I going to forget to take my pill one day because I’m home and stuff like that. (P4, I1)
The discharge process was often perceived by participants to be rushed. Some participants found the discharge meetings helpful, while others did not feel the process empowered them to engage in a meaningful conversation with hospital staff.
There was no one there with me to even help me with my brain, to think. But it’s afterwards I’m like why didn’t I say that, like that’s what I meant to say. The brain just doesn’t function that way. (P8, I2).
This participant struggled with the transition. One week after discharge when she was asked how her health was she replied:
Terrible. I’ve got no energy. I haven’t eaten for 3 days. I haven’t drank for 3 days. I’ve got diarrhea galore […] Just no appetite whatsoever. I can’t even make it up the stairs without losing my breath. If I make it up the stairs, I have to sit for 15 or 20 minutes… (P8, I3)
The weight of maintaining activities of daily living was prominent in all post-discharge interviews, in many cases accentuated by declining health. The transition to home was more challenging than participants expected; the experience was strongly influenced by the stability of their health, their environment, and the complexity of their lives.
Follow-up and Referrals
Discharge summaries included a mean of 7 referrals. All participants were referred to a case coordinator, nurse, and family physician. Other referrals included pharmacist (n = 8); personal support worker (n = 6); housing (n = 5); and food-support programs (n = 5).
Several factors led to challenges accessing and receiving services. Participants identified: difficulty with requisite paperwork; mobility and financial constraints; personal and logistical challenges with home-care providers; and competing priorities, such as caring for family. These experiences were frequently accompanied by frustration and anxiety.
Because, if I’m in [city where girlfriend lives], I will not get the support that I get when I’m home. Like my nurse comes. [She] was supposed to come and see me twice and I missed that. I missed like 4 [appointments]. You understand? Certain things I’ve been missing. (P6, I4)
When one participant was asked if she had followed up with the food support program she had been referred to, she responded:
Oh, baby, no. I’ve been so confused. I’ve had ODSP [referring to Ontario Disability Support Program, a government disability program] on my case. I’ve got all the files all mixed up. My worker’s a real bitch. She hates me, big time. I was supposed to go bring in papers today, but I couldn’t get out of bed. I don’t know how much trouble I’m going to be in with ODSP now. (P8, I3)
Despite comprehensive discharge plans and referrals, all participants experienced delays and difficulties in accessing and receiving services. In most cases, there was no single contributing factor to these challenges; the unique experiences were a result of the complex interplay of multiple factors for each individual.
Patient Priorities
In the hospital, participants primarily identified goals of improving physical health and medication adherence. However, these goals often shifted to meeting basic living necessities and supporting others upon discharge. Barriers to adequate food and mobility were prominent themes.
One participant spoke about the challenges of supporting her son while struggling with her own health after discharge:
Well, I’ve been dying, I can’t even walk, and yet I’m the one that still has to go to WalMart, to grab milk and bread for my kid. It’s not like I need any of that stuff, because I don’t even eat. (P8, I3)
Participants were admitted on a mean of 6 medications and discharged with a mean of 14 (Table 1). In the hospital, medications are dispensed directly to patients; however, maintaining optimal adherence at home was complex. When 1 participant was asked about her medications after being home for a week, she said:
My meds, you know I have the cream that I’m supposed to put … and I can’t find it. I lost it yesterday. I used it yesterday morning and all day yesterday I’m looking, like, did it fall behind there? But, obviously, I can’t look over there [because of mobility challenges] … I don’t think I can get it covered [by insurance to replace it]. (P5, I3)
Participants found it difficult to follow a specific dosing schedule, ensure food intake corresponded to medication guidelines, and navigate the impact of substance use. Substance use for some was associated with nonadherence. A participant, explaining his quickly declining health, spoke about the impact of using crack cocaine:
Yeah, when I use I don’t think about medicating, taking my pills or anything like that. That’s not even on your mind. It doesn’t come across your mind. […] I guess, that’s part of the addictive personality. It wants to grab hold of you and say “no, focus on me, focus on me.” (P7, I4)
Others used marijuana as an appetite stimulant and a critical piece of their medication adherence routine.
DISCUSSION
This study followed complex patients through hospital discharge and transition back into the community. In the hospital, participants focused on medical goals, but following discharge basic living needs became the priority. Despite a comprehensive plan to provide support upon discharge, participants found executing and following up with referrals, services, and medication adherence was often overwhelming and not achieved in the month post-hospitalization.
Our study provides depth and context to support and understand the findings of reviews evaluating interventions to improve transitions in care.23,24 A systematic review of interventions to decrease 30-day readmission rates concluded that comprehensive support interventions (with many components) contributed to the greatest reduction in risk of readmission.16 Components that showed the greatest impact were those that were designed to improve patients’ capacity for self-care (including their ability to access and follow through with post-discharge care plans) and those that involved more individuals in the delivery of care.23
Our results also support and expand on other qualitative findings of complex patients. Kangovi et al.25 interviewed patients with low socioeconomic status at a single time point post-discharge to identify common experiences. They summarized their findings in 6 themes: powerlessness during hospitalization; incongruence of patient and clinical team goals; competing issues influencing prominence of health behaviors; socioeconomic constraints on patients’ ability to perform recommended behaviors; sense of abandonment after discharge; and loss of self-efficacy resulting from the “failure” to follow the discharge plan. Our findings tell a very similar story but provide the additional context and understanding of the lived experience over time. We found that the transition experience was most challenging when the home environment was unstable, resulting in a shift in priorities from those set during hospitalization.
While increased support may improve outcomes, there is a need to improve awareness, integration, and support for building capacity within complex patients.26 Capacity is defined here as the sum of resources and abilities that a patient can draw on, and includes physical and mental as well as social, financial, personal, and environmental capabilities and resources.27 This includes understanding the potential negative impact of developing a clinical plan which, in order to operationalize, requires resources in excess of the patient’s capacity at that time.27 Minimally disruptive medicine, a promising theoretical approach for improving the care of complex clients, embodies the awareness of capacity in achieving patient-centered care while “imposing the smallest possible treatment burden on patients’ lives.”28
This study, although not without its limitations, provides an in-depth exploration of the experiences of a small number of patients living with HIV, recruited from a single facility in Toronto, Canada after relatively long hospital stays. There are specific context issues related to HIV, such as stigma and severe consequences for suboptimal medication adherence. Furthermore, this study took place where many urban health resources exist; complex patients in rural settings or in environments less tailored to the needs associated with complex medical, psychiatric, and social conditions may experience greater barriers in the transition process. Although this study captured data from medical charts and documents relevant to the cases, further exploration of the clinician decision-making process in creating the discharge plans and additional sources of data on health outcomes post-discharge would be beneficial.
Despite its limitations, this study provides detail and depth to understand some of the most complex patients who suffer from significant challenges in the health system and who are amongst the highest-cost healthcare users. The case study approach, with serial interviews, is an important strength of this study, enabling meaningful insight into hospital discharge processes and challenges experienced by complex patients that can inform individual-level care practice and the development of new programs and interventions.
This study builds on recent research with complex patients in calling for a new approach to clinical care.6,29,30 In order to support complex patients through discharge, clinical goals and referrals must be made in light of a patient’s capacity in the community. Structural changes may be made to improve coordination and access to services, decreasing the burden and improving the healthcare experience. Albreht et al.31 highlight a number of promising programs across Europe (such as the Clinic for Multimorbidity and Polypharmacy in Denmark) designed to improve the health and healthcare for individuals living with multiple chronic conditions. Small-scale changes are also important such as increasing conversations about the capacity and limitations of individuals listed as social supports, and making appropriate and realistic referrals based on an understanding of a patient’s capacity and motivation for follow-up. Shippee et al.32 identify a list of approaches in line with minimally disruptive medicine that can be integrated into existing systems as part of a developing “toolkit” (eg, elicitation of transcendent patient goals, and integration of patient-reported outcome tracking of challenges and burdens associated with health and daily living). The findings of this study suggest that the elements of the toolkit may provide a foundation for future interventions and research to improve hospital care and discharge outcomes for complex patients.
Disclosures
This project was funded by a Canadian Institutes of Health Research (CIHR) HIV/AIDS Community-based Research Catalyst Grant (#126669). Dr. Brennan’s research is supported by an Ontario HIV Treatment Network (OHTN) Applied HIV Research Chair. Dr. Chan Carusone reports grants from Canadian Institutes of Health Research during the conduct of the study.
1. Allaudeen N, Vidyarthi A, Masselli J, Auerback A. Redefining readmission risk factors for general medicine patients. J Hosp Med. 2011;6:54-60. PubMed
2. Hu J, Gonsahn MD, Nerenz DR. Socioeconomic status and readmissions: evidence from an urban teaching hospital. Health Aff (Millwood). 2014;33:778-785. PubMed
3. Panagioti M, Stokes J, Esmail A, et al. Multimorbidity and patient safety incidents in primary care: a systematic review and meta-analysis. PLoS One. 2015;10:e0135947. PubMed
4. Paddison CA, Saunders CL, Abel GA, Payne RA, Campbell JL, Roland M. Why do patients with multimorbidity in England report worse experiences in primary care? Evidence from the General Practice Patient Survey. BMJ Open. 2015;5:e006172. PubMed
5. Barnett K, Mercer SW, Norbury M, Watt G, Wyke S, Guthrie B. Epidemiology of multimorbidity and implications for health care, research, and medical education: a cross-sectional study. Lancet. 2012;380:37-43. PubMed
6. Schaink AK, Kuluski K, Lyons RF, et al. A scoping review and thematic classification of patient complexity: offering a unifying framework. J Comorbidity. 2012;2:1-9.
7. Roland M, Paddison C. Better management of patients with multimorbidity. BMJ. 2013;346:f2510. PubMed
8. Smith SM, Soubhi H, Fortin M, Hudon C, O’Dowd T. Managing patients with multimorbidity: a systematic review of interventions in primary care and community settings. BMJ. 2012;345:e5205. PubMed
9. Afshar S, Roderick PJ, Kowal P, Dimitrov BD, Hill AG. Multimorbidity and the inequalities of global ageing: a cross-sectional study of 28 countries using the World Health Surveys. BMC Public Health. 2015;15:776. PubMed
10. Pefoyo AJK, Bronskill SE, Gruneir A, et al. The increasing burden and complexity of multimorbidity. BMC Public Health. 2015;15:415. PubMed
11. Ward BW, Schiller JS. Prevalence of multiple chronic conditions among US adults: estimates from the National Health Interview Survey, 2010. Prev Chronic Dis. 2013;10:E65. PubMed
12. World Health Organization. Commission on Social Determinants of Health Final Report: Closing the Gap in a Generation: Health Equity through Action on Social Determinants of Health. Geneva, Switzerland: World Health Organization, 2008.
13. Barnett K, Mercer SW, Norbury M, Watt G, Wyke S, Guthrie B.. Epidemiology of multimorbidity and implications for health care, research and medical education: a cross-sectional study. Lancet. 2012;380:37-43. PubMed
14. Samji H, Cescon A, Hogg RS, et al. Closing the gap: increases in life expectancy among treated HIV-positive individuals in the United States and Canada. PLoS One. 2013;8:e81355. PubMed
15. Deeks SG, Lewin SR, Havlir DV. The end of AIDS: HIV infection as a chronic disease. Lancet. 2013;382:1525-1533. PubMed
16. Mays N, Pope C. Qualitative research: rigour and qualitative research. BMJ. 1995;311:109-112. PubMed
17. Gilson L, Hanson K, Sheikh K, Agyepong IA, Ssengooba F, Bennett S. Building the field of health policy and systems research: social science matters. PLoS Med. 2011;8:e1001079. PubMed
18. Stoto MA, Nelson CD, Klaiman T. Getting from what to why: using qualitative research to conduct public health systems research. AcademyHealth; August 2013. http://www.academyhealth.org/files/publications/qmforph.pdf. Accessed May 24, 2016.
19. Murray SA, Kendall M, Carduff E, et al. Use of serial qualitative interviews to understand patients’ evolving experiences and needs. BMJ. 2009;339:b3702. PubMed
20. Pope C, Ziebland S, Mays N. Qualitative research in health care. Analysing qualitative data. BMJ. 2000;320:114-116. PubMed
21. Dixon-Woods M. Using framework-based synthesis for conducting reviews of qualitative studies. BMC Med. 2011;9:39. PubMed
22. Yin RK. Case Study Research: Design and Methods. 5th ed. Thousand Oaks, CA: Sage Publications, Inc.; 2014.
23. Leppin AL, Gionfriddo MR, Kessler M, et al. Preventing 30-day hospital readmissions: a systematic review and meta-analysis of randomized trials. JAMA Intern Med. 2014;174:1095-1107. PubMed
24. Kansagara D, Chiovaro JC, Kagen D, et al. So many options, where do we start? An overview of the care transitions literature. J Hosp Med. 2016;11:221-230. PubMed
25. Kangovi S, Barg FK, Carter T, et al. Challenges faced by patients with low socioeconomic status during the post-hospital transition. J Gen Intern Med. 2013;29:283-289. PubMed
26. Gill A, Kuluski K, Jaakimainen L, Naganathan G, Upshur R, Wodchis WP. “Where do we go from here?” Health system frustrations expressed by patients with multimorbidity, their caregivers and family physicians. Healthc Policy. 2014;9:73-89. PubMed
27. Shippee ND, Shah ND, May CR, Mair FS, Montori VM. Cumulative complexity: a functional, patient-centered model of patient complexity can improve research and practice. J Clin Epidemiol. 2012;65:1041-1051. PubMed
28. Leppin AL, Montori VM, Gionfriddo MR. Minimally disruptive medicine: a pragmatically comprehensive model for delivering care to patients with multiple chronic conditions. Healthcare (Basel). 2015;3:50-63. PubMed
29. Salisbury C. Multimorbidity: redesigning health care for people who use it. Lancet. 2012;380:7-9. PubMed
30. Upshur R, Tracy S. Chronicity and complexity: is what’s good for the diseases always good for the patients? Can Fam Physician. 2008;54:1655-1658. PubMed
31. Albreht A, Dyakova M, Schellevis FG, Van den Broucke S. Many diseases, one model of care? J Comorbidity. 2016;6:12-20.
32. Shippee ND, Allen SV, Leppin AL, May CR, Montori VM. Attaining minimally disruptive medicine: context, challenges and a roadmap for implementation. J R Coll Physicians Edinb. 2015;45:118-122. PubMed
© 2017 Society of Hospital Medicine
Discharges Against Medical Advice
Patients leave the hospital against medical advice (AMA) for a variety of reasons. The AMA rate is approximately 1% nationally but substantially higher at safety-net hospitals and has rapidly increased over the past decade.1-5 The principle that patients have the right to make choices about their healthcare, up to and including whether to leave the hospital against the advice of medical staff, is well-established law and a foundation of medical ethics.6 In practice, however, AMA discharges are often emotionally charged for both patients and providers, and, in the high-stress setting of AMA discharge, providers may be confused about their roles.7-9
The demographics of patients who leave AMA have been well described. Compared with conventionally discharged patients, AMA patients are younger, more likely to be male, and more likely a marginalized ethnic or racial minority.10-14 Patients with mental illnesses and addiction issues are overrepresented in AMA discharges, and complicated capacity assessments and limited resources may strain providers.7,8,15,16 Studies have repeatedly shown higher rates of readmission and mortality for AMA patients than for conventionally discharged patients.17-21 Whether AMA discharge is a marker for other prognostic factors that bode poorly for patients or contributes to negative outcomes, data suggest this group of patients is vulnerable, having mortality rates up to 40% higher 1 year after discharge, relative to conventionally discharged patients.12
Several models of standardized best practice approaches for AMA have been proposed by bioethicists.6,22,23 Although details of these approaches vary, all involve assessing the patient’s decision-making capacity, clarifying the risks of AMA discharge, addressing factors that might be prompting the discharge, formulating an alternative outpatient treatment plan or “next best” option, and documenting extensively. A recent study found patients often gave advance warning of an AMA discharge, but physicians rarely prepared by arranging follow-up care.8 The investigators hypothesized that providers might not have known what they were permitted to arrange for AMA patients, or might have thought that providing “second best” options went against their principles. The investigators noted that nurses might have become aware of AMA risk sooner than physicians did but could not act on this awareness by preparing medications and arranging follow-up.
Translating models of best practice care for AMA patients into clinical practice requires buy-in from bedside providers, not just bioethicists. Given the study findings that providers have misconceptions about their roles in the AMA discharge,7 it is prudent to investigate providers’ current practices, beliefs, and concerns about AMA discharges before introducing a new approach.
The present authors conducted a mixed-methods cross-sectional study of the state of AMA discharges at Highland Hospital (Oakland, California), a 236-bed county hospital and trauma center serving a primarily underserved urban patient population. The aim of this study was to assess current provider practices for AMA discharges and provider perceptions and knowledge about AMA discharges, ultimately to help direct future educational interventions with medical providers or hospital policy changes needed to improve the quality of AMA discharges.
METHODS
Phase 1 of this study involved identifying AMA patients through a review of data from Highland Hospital’s electronic medical records for 2014. These data included discharge status (eg, AMA vs other discharge types). The hospital’s floor clerk distinguishes between absent without official leave (AWOL; the patient leaves without notifying a provider) and AMA discharge. Discharges designated AWOL were excluded from the analyses.
In phase 2, a structured chart review (Appendix A) was performed for all patients identified during phase 1 as being discharged AMA in 2014. In these reviews, further assessment was made of patient and visit characteristics in hospitalizations that ended in AMA discharge, and of providers’ documentation of AMA discharges—that is, whether several factors were documented (capacity; predischarge indication that patient might leave AMA; reason for AMA; and indications that discharge medications, transportation, and follow-up were arranged). These visit factors were reviewed because the literature has identified them as being important markers for AMA discharge safety.6,8 Two research assistants, under the guidance of Dr. Stearns, reviewed the charts. To ensure agreement across chart reviews with respect to subjective questions (eg, whether capacity was adequately documented), the group reviewed the first 10 consecutive charts together; there was full agreement on how to classify the data of interest. Throughout the study, whenever a research assistant asked how to classify particular patient data, Dr. Stearns reviewed the data, and the research team made a decision together. Additional data, for AMA patients and for all patients admitted to Highland Hospital, were obtained from the hospital’s data warehouse, which pools data from within the health system.
Phase 3 involved surveying healthcare providers who were involved in patient care on the internal medicine and trauma surgery services at the hospital. These providers were selected because chart review revealed that the vast majority of patients who left AMA in 2014 were on one of these services. Surveys (Appendix B) asked participant providers to identify their role at the hospital, to provide a self-assessment of competence in various aspects of AMA discharge, to voice opinions about provider responsibilities in arranging follow-up for AMA patients, and to make suggestions about the AMA process. The authors designed these surveys, which included questions about aspects of care that have been highlighted in the AMA discharge literature as being important for AMA discharge safety.6,8,22,23 Surveys were distributed to providers at internal medicine and trauma surgery department meetings and nursing conferences. Data (without identifying information) were analyzed, and survey responses kept anonymous.
The Alameda Health System Institutional Review Board approved this project. Providers were given the option of writing their name and contact information at the top of the survey in order to be entered into a drawing to receive a prize for completion.
We performed statistical analyses of the patient charts and physician survey data using Stata (version 14.0, Stata Corp., College Station, Texas). We analyzed both patient- and encounter-level data. In demographic analyses, this approach prevented duplicate counting of patients who left AMA multiple times. Patient-level analyses compared the demographic characteristics of AMA patients and patients discharged conventionally from the hospital in 2014. In addition, patients with either 1 or multiple AMA discharges were compared to identify characteristics that might be linked to highest risk of recurrent AMA discharge in the hope that early identification of these patients might facilitate providers’ early awareness and preparation for follow-up care or hospitalization alternatives. We used ANOVAs for continuous variables and tests of proportions for categorical variables. On the encounter level, analyses examined data about each admission (eg, AMA forms signed, follow-up arrangements made, capacity documented, etc.) for all AMA discharges. We employed chi square tests to identify variations in healthcare provider survey responses. A P value < 0.05 was used as the significance cut-off point.
Staged logistic regression analyses, adjusted for demographic characteristics, were performed to assess the association between risk of leaving AMA (yes or no) and demographic characteristics and the association between risk of leaving AMA more than once (yes or no) and health-related characteristics.
RESULTS
Demographic, Clinical, and Utilization Characteristics
Of the 12,036 Highland Hospital admissions in 2014, 319 (2.7%) ended with an AMA discharge. Of the 8207 individual patients discharged, 268 left AMA once, and 29 left AMA multiple times. Further review of the Admissions, Discharges, and Transfers Report generated from the electronic medical record revealed that 15 AWOL discharges were misclassified as AMA discharges.
Compared with patients discharged conventionally, AMA patients were significantly younger; more likely to be male, to self-identify as Black/African American, and to be English-speaking; and less likely to self-identify as Asian/Pacific Islander or Hispanic/Latino or to be Chinese- or Spanish-speaking (Table 1). They were also more likely than all patients admitted to Highland to be homeless (15.7% vs 8.7%; P < 0.01). Multivariate regression analysis revealed persistent age and sex disparities, but racial disparities were mitigated in adjusted analyses (Appendix C). Language disparities persisted only for Spanish speakers, who had a significantly lower rate of AMA discharge, even in adjusted analyses.

The majority of AMA patients were on the internal medicine service (63.5%) or the trauma surgery service (24.8%). Regarding admission diagnosis, 17.2% of AMA patients were admitted for infections, 5.0% for drug or alcohol intoxication or withdrawal, 38.9% for acute noninfectious illnesses, 16.7% for decompensation of chronic disease, 18.4% for injuries or trauma, and 3.8% for pregnancy complications or labor. Compared with patients who left AMA once, patients who left AMA multiple times had higher rates of heavy alcohol use (53.9% vs 30.9%; P = 0.01) and illicit drug use (88.5% vs 53.7%; P < 0.001) (Table 2). In multivariate analyses, the increased odds of leaving AMA more than once persisted for current heavy illicit drug users compared with patients who had never engaged in illicit drug use.

Discharge Characteristics and Documentation
Providers documented a patient’s plan to leave AMA before actual discharge 17.3% of the time. The documented plan to leave had to indicate that the patient was actually considering leaving. For example, “Patient is eager to go home” was not enough to qualify as a plan, but “Patient is thinking of leaving” qualified. For 84.3% of AMA discharges, the hospital’s AMA form was signed and was included in the medical record. Documentation showed that medications were prescribed for AMA patients 21.4% of the time, follow-up was arranged 25.7% of the time, and follow-up was pending arrangement 14.8% of the time. The majority of AMA patients (71.4%) left during daytime hours. In 29.6% of AMA discharges, providers documented AMA patients had decision-making capacity.
Readmission After AMA Discharge
Of the 268 AMA patients, 67.7% were not readmitted within the 6 months after AMA, 24.5% had 1 or 2 readmissions, and the rest had 3 or more readmissions (1 patient had 15). In addition, 35.8% returned to the emergency department within 30 days, and 16.4% were readmitted within 30 days. In 2014, the hospital’s overall 30-day readmission rate was 10.8%. Of the patients readmitted within 6 months after AMA, 23.5% left AMA again at the next visit, 9.4% left AWOL, and 67.1% were discharged conventionally.
Drivers of Premature Discharge
Qualitative analysis of the 35.5% of patient charts documenting a reason for leaving the hospital revealed 3 broad, interrelated themes (Figure 1). The first theme, dissatisfaction with hospital care, included chart notations such as “His wife couldn’t sleep in the hospital room” and “Not satisfied with all-liquid diet.” The second theme, urgent personal issues, included comments such as “He has a very important court date for his children” and “He needed to take care of immigration forms.” The third theme, mental health and substance abuse issues, included notations such as “He wants to go smoke” and “Severe anxiety and prison flashbacks.”

Provider Self-Assessment and Beliefs
The survey was completed by 178 healthcare providers: 49.4% registered nurses, 19.1% trainee physicians, 20.8% attending physicians, and 10.7% other providers, including chaplains, social workers, and clerks. Regarding self-assessment of competency in AMA discharges, 94% of providers agreed they were comfortable assessing capacity, and 94% agreed they were comfortable talking with patients about the risks of leaving AMA (Figure 2). Nurses were more likely than trainee physicians to agree they knew what to do for patients who lacked capacity (74% vs 49%; P = 0.02). Most providers (70%) agreed they usually knew why their patients were leaving AMA; in this self-assessment, there were no significant differences between types of providers.

Regarding follow-up, attending physicians and trainee physicians demonstrated more agreement than nurses that AMA patients should receive medications and follow-up (94% and 84% vs 64%; P < 0.05). Nurses were more likely than attending physicians to say patients should lose their rights to hospital follow-up because of leaving AMA (38% vs 6%; P < 0.01). A minority of providers (37%) agreed transportation should be arranged. Addiction was the most common driver of AMA discharge (35%), followed by familial obligations (19%), dissatisfaction with hospital care (16%), and financial concerns (15%).
DISCUSSION
The demographic characteristics of AMA patients in this study are similar to those identified in other studies, showing overrepresentation of young male patients.12,14 Homeless patients were also overrepresented in the AMA discharge population at Highland Hospital—a finding that has not been consistently reported in prior studies, and that warrants further examination. In adjusted analyses, Spanish speakers had a lower rate of AMA discharge, and there were no racial variations. This is consistent with another study’s finding: that racial disparities in AMA discharge rates were largely attributable to confounders.24 Language differences may result from failure of staff to fully explain the option of AMA discharge to non-English speakers, or from fear of immigration consequences after AMA discharge. Further investigation of patient experiences is needed to identify factors that contribute to demographic variations in AMA discharge rates.25,26
Of the patients who left AMA multiple times, nearly all were actively using illicit drugs. In a recent study conducted at a safety-net hospital in Vancouver, Canada, 43% of patients with illicit drug use and at least 1 hospitalization left AMA at least once during the 6-year study period.11 Many factors might explain this correlation—addiction itself, poor pain control for patients with addiction issues, fears about incarceration, and poor treatment of drug users by healthcare staff.15 Although the medical literature highlights deficits in pain control for patients addicted to opiates, proposed solutions are sparse and focus on perioperative pain control and physician prescribing practices.27,28 At safety-net hospitals in which addiction is a factor in many hospitalizations, there is opportunity for new research in inpatient pain control for patients with substance dependence. In addition, harm reduction strategies—such as methadone maintenance for hospitalized patients with opiate dependence and abscess clinics as hospitalization alternatives for injection-associated infection treatment—may be key in improving safety for patients.11,15,29
Comparing the provider survey and chart review results highlights discordance between provider beliefs and clinical practice. Healthcare providers at Highland Hospital considered themselves competent in assessing capacity and talking with patients about the risks of AMA discharge. In practice, however, capacity was documented in less than a third of AMA discharges. Although the majority of providers thought medications and follow-up should be arranged for patients, arrangements were seldom made. This may be partially attributable to limited resources for making these arrangements. Average time to “third next available” primary care appointment within the county health system that includes Highland was 44.6 days for established patients during the period of study; for new primary care patients, the average wait for an appointment was 2 to 3 months. Highland has a same-day clinic, but inpatient providers are discouraged from using it as a postdischarge clinic for patients who would be better served in primary care. Medications and transportation are easily arranged during daytime hours but are not immediately available at night. In addition, some of this discrepancy may be attributable to the limited documentation rather than to provider failure to achieve their own benchmarks of quality care for AMA patients.
Documentation in AMA discharges is key for multiple reasons. Most AMA patients in this study signed an AMA form, and it could be that the rate of documenting decision-making capacity was low because providers thought a signed AMA form was adequate documentation of capacity and informed consent. In numerous court cases, however, these forms were found to be insufficient evidence of informed consent (lacking other supportive documentation) and possibly to go against the public good.30 In addition, high rates of repeat emergency department visits and readmissions for AMA patients, demonstrated here and in other studies, highlight the importance of careful documentation in informing subsequent providers about hospital returnees’ ongoing issues.17-19
This study also demonstrated differences between nurses and physicians in their beliefs about arranging follow-up for AMA patients. Nurses were less likely than physicians to think follow-up arrangements should be made for AMA patients and more likely to say these patients should lose the right to follow-up because of the AMA discharge. For conventional discharges, nurses provide patients with significantly more discharge education than interns or hospitalists do.31 This discrepancy highlights an urgent need for the education and involvement of nurses as stakeholders in the challenging AMA discharge process. Although the percentage of physicians who thought they were not obligated to provide medications and arrange follow-up for AMA patients was lower than the percentage of nurses, these beliefs contradict best practice guidelines for AMA discharges,22,23 and this finding calls attention to the need for interventions to improve adherence to professional and ethical guidelines in this aspect of clinical practice.
Providers showed a lack of familiarity with practice guidelines regarding certain aspects of the AMA discharge process. For example, most providers thought they should not have to arrange transportation for AMA patients, even though both the California Hospital Association Guidelines and the Highland Hospital internal policy on AMA discharges recommend arranging appropriate transportation.32 This finding suggests a need for educational interventions to ensure providers are informed about state and hospital policies, and a need to include both physicians and nurses in policymaking so theory can be tied to practice.
This study was limited to a single center with healthcare provider and patient populations that might not be generalizable to other settings. In the retrospective chart review, the authors were limited to information documented in the medical record, which might not accurately reflect the AMA discharge process. As they surveyed a limited number of social workers, case managers, and others who play an important role in the AMA discharge process, their data may lack varying viewpoints.
Overall, these data suggest providers at this county hospital generally agreed in principle with the best practice guidelines proposed by bioethicists for AMA discharges. In practice, however, providers were not reliably following these guidelines. Future interventions—including provider education on best practice guidelines for AMA discharge, provider involvement in policymaking, supportive templates for guiding documentation of AMA discharges, and improving access to follow-up care—will be key in improving the safety and health outcomes of AMA patients.
Acknowledgments
The authors thank Kelly Aguilar, Kethia Chheng, Irene Yen, and the Research Advancement and Coordination Initiative at Alameda Health System for important contributions to this project.
Disclosures
Highland Hospital Department of Medicine internal grant 2015.23 helped fund this research. A portion of the data was presented as a poster at the University of California San Francisco Health Disparities Symposium; October 2015; San Francisco, CA. Two posters from the data were presented at Hospital Medicine 2016, March 2016; San Diego, CA.
1. Southern WN, Nahvi S, Arnsten JH. Increased risk of mortality and readmission among patients discharged against medical advice. Am J Med. 2012;125(6):594-602. PubMed
2. Stranges E, Wier L, Merrill C, Steiner C. Hospitalizations in which Patients Leave the Hospital against Medical Advice (AMA), 2007. HCUP Statistical Brief #78. August 2009. Agency for Healthcare Research and Quality, Rockville, MD. http://www.hcup-us.ahrq.gov/reports/statbriefs/sb78.pdf. Accessed November 30, 2016. PubMed
3. Devitt PJ, Devitt AC, Dewan M. Does identifying a discharge as “against medical advice” confer legal protection? J Fam Pract. 2000;49(3):224-227. PubMed
4. O’Hara D, Hart W, McDonald I. Leaving hospital against medical advice. J Qual Clin Pract. 1996;16(3):157-164. PubMed
5. Ibrahim SA, Kwoh CK, Krishnan E. Factors associated with patients who leave acute-care hospitals against medical advice. Am J Public Health. 2007;97(12):2204-2208. PubMed
6. Clark MA, Abbott JT, Adyanthaya T. Ethics seminars: a best-practice approach to navigating the against-medical-advice discharge. Acad Emerg Med. 2014;21(9):1050-1057. PubMed
7. Windish DM, Ratanawongsa N. Providers’ perceptions of relationships and professional roles when caring for patients who leave the hospital against medical advice. J Gen Intern Med. 2008;23(10):1698-1707. PubMed
8. Edwards J, Markert R, Bricker D. Discharge against medical advice: how often do we intervene? J Hosp Med. 2013;8(10):574-577. PubMed
9. Alfandre DJ. “I’m going home”: discharges against medical advice. Mayo Clin Proc. 2009;84(3):255-260. PubMed
10. Katzenellenbogen JM, Sanfilippo FM, Hobbs MS, et al. Voting with their feet—predictors of discharge against medical advice in Aboriginal and non-Aboriginal ischaemic heart disease inpatients in Western Australia: an analytic study using data linkage. BMC Health Serv Res. 2013;13:330. PubMed
11. Ti L, Milloy MJ, Buxton J, et al. Factors associated with leaving hospital against medical advice among people who use illicit drugs in Vancouver, Canada. PLoS One. 2015;10(10):e0141594. PubMed
12. Yong TY, Fok JS, Hakendorf P, Ben-Tovim D, Thompson CH, Li JY. Characteristics and outcomes of discharges against medical advice among hospitalised patients. Intern Med J. 2013;43(7):798-802. PubMed
13. Tabatabaei SM, Sargazi Moakhar Z, Behmanesh Pour F, Shaare Mollashahi S, Zaboli M. Hospitalized pregnant women who leave against medical advice: attributes and reasons. Matern Child Health J. 2016;20(1):128-138. PubMed
14. Aliyu ZY. Discharge against medical advice: sociodemographic, clinical and financial perspectives. Int J Clin Pract. 2002;56(5):325-327. PubMed
15. Ti L, Ti L. Leaving the hospital against medical advice among people who use illicit drugs: a systematic review. Am J Public Health. 2015;105(12):e53-e59. PubMed
16. Targum SD, Capodanno AE, Hoffman HA, Foudraine C. An intervention to reduce the rate of hospital discharges against medical advice. Am J Psychiatry. 1982;139(5):657-659. PubMed
17. Choi M, Kim H, Qian H, Palepu A. Readmission rates of patients discharged against medical advice: a matched cohort study. PLoS One. 2011;6(9):e24459. PubMed
18. Glasgow JM, Vaughn-Sarrazin M, Kaboli PJ. Leaving against medical advice (AMA): risk of 30-day mortality and hospital readmission. J Gen Intern Med. 2010;25(9):926-929. PubMed
19. Garland A, Ramsey CD, Fransoo R, et al. Rates of readmission and death associated with leaving hospital against medical advice: a population-based study. CMAJ. 2013;185(14):1207-1214. PubMed
20. Hwang SW, Li J, Gupta R, Chien V, Martin RE. What happens to patients who leave hospital against medical advice? CMAJ. 2003;168(4):417-420. PubMed
21. Onukwugha E, Mullins CD, Loh FE, Saunders E, Shaya FT, Weir MR. Readmissions after unauthorized discharges in the cardiovascular setting. Med Care. 2011;49(2):215-224. PubMed
22. Alfandre D. Reconsidering against medical advice discharges: embracing patient-centeredness to promote high quality care and a renewed research agenda. J Gen Intern Med. 2013;28(12):1657-1662. PubMed
23. Berger JT. Discharge against medical advice: ethical considerations and professional obligations. J Hosp Med. 2008;3(5):403-408. PubMed
24. Franks P, Meldrum S, Fiscella K. Discharges against medical advice: are race/ethnicity predictors? J Gen Intern Med. 2006;21(9):955-960. PubMed
25. Hicks LS, Ayanian JZ, Orav EJ, et al. Is hospital service associated with racial and ethnic disparities in experiences with hospital care? Am J Med. 2005;118(5):529-535. PubMed
26. Hicks LS, Tovar DA, Orav EJ, Johnson PA. Experiences with hospital care: perspectives of black and Hispanic patients. J Gen Intern Med. 2008;23(8):1234-1240. PubMed
27. McCreaddie M, Lyons I, Watt D, et al. Routines and rituals: a grounded theory of the pain management of drug users in acute care settings. J Clin Nurs. 2010;19(19-20):2730-2740. PubMed
28. Carroll IR, Angst MS, Clark JD. Management of perioperative pain in patients chronically consuming opioids. Reg Anesth Pain Med. 2004;29(6):576-591. PubMed
29. Chan AC, Palepu A, Guh DP, et al. HIV-positive injection drug users who leave the hospital against medical advice: the mitigating role of methadone and social support. J Acquir Immune Defic Syndr. 2004;35(1):56-59. PubMed
30. Levy F, Mareiniss DP, Iacovelli C. The importance of a proper against-medical-advice (AMA) discharge: how signing out AMA may create significant liability protection for providers. J Emerg Med. 2012;43(3):516-520. PubMed
31. Ashbrook L, Mourad M, Sehgal N. Communicating discharge instructions to patients: a survey of nurse, intern, and hospitalist practices. J Hosp Med. 2013;8(1):36-41. PubMed
32. Joint Commission on Accreditation of Healthcare Organizations. Title 22, California Code of Regulations, §70707.3.
Patients leave the hospital against medical advice (AMA) for a variety of reasons. The AMA rate is approximately 1% nationally but substantially higher at safety-net hospitals and has rapidly increased over the past decade.1-5 The principle that patients have the right to make choices about their healthcare, up to and including whether to leave the hospital against the advice of medical staff, is well-established law and a foundation of medical ethics.6 In practice, however, AMA discharges are often emotionally charged for both patients and providers, and, in the high-stress setting of AMA discharge, providers may be confused about their roles.7-9
The demographics of patients who leave AMA have been well described. Compared with conventionally discharged patients, AMA patients are younger, more likely to be male, and more likely a marginalized ethnic or racial minority.10-14 Patients with mental illnesses and addiction issues are overrepresented in AMA discharges, and complicated capacity assessments and limited resources may strain providers.7,8,15,16 Studies have repeatedly shown higher rates of readmission and mortality for AMA patients than for conventionally discharged patients.17-21 Whether AMA discharge is a marker for other prognostic factors that bode poorly for patients or contributes to negative outcomes, data suggest this group of patients is vulnerable, having mortality rates up to 40% higher 1 year after discharge, relative to conventionally discharged patients.12
Several models of standardized best practice approaches for AMA have been proposed by bioethicists.6,22,23 Although details of these approaches vary, all involve assessing the patient’s decision-making capacity, clarifying the risks of AMA discharge, addressing factors that might be prompting the discharge, formulating an alternative outpatient treatment plan or “next best” option, and documenting extensively. A recent study found patients often gave advance warning of an AMA discharge, but physicians rarely prepared by arranging follow-up care.8 The investigators hypothesized that providers might not have known what they were permitted to arrange for AMA patients, or might have thought that providing “second best” options went against their principles. The investigators noted that nurses might have become aware of AMA risk sooner than physicians did but could not act on this awareness by preparing medications and arranging follow-up.
Translating models of best practice care for AMA patients into clinical practice requires buy-in from bedside providers, not just bioethicists. Given the study findings that providers have misconceptions about their roles in the AMA discharge,7 it is prudent to investigate providers’ current practices, beliefs, and concerns about AMA discharges before introducing a new approach.
The present authors conducted a mixed-methods cross-sectional study of the state of AMA discharges at Highland Hospital (Oakland, California), a 236-bed county hospital and trauma center serving a primarily underserved urban patient population. The aim of this study was to assess current provider practices for AMA discharges and provider perceptions and knowledge about AMA discharges, ultimately to help direct future educational interventions with medical providers or hospital policy changes needed to improve the quality of AMA discharges.
METHODS
Phase 1 of this study involved identifying AMA patients through a review of data from Highland Hospital’s electronic medical records for 2014. These data included discharge status (eg, AMA vs other discharge types). The hospital’s floor clerk distinguishes between absent without official leave (AWOL; the patient leaves without notifying a provider) and AMA discharge. Discharges designated AWOL were excluded from the analyses.
In phase 2, a structured chart review (Appendix A) was performed for all patients identified during phase 1 as being discharged AMA in 2014. In these reviews, further assessment was made of patient and visit characteristics in hospitalizations that ended in AMA discharge, and of providers’ documentation of AMA discharges—that is, whether several factors were documented (capacity; predischarge indication that patient might leave AMA; reason for AMA; and indications that discharge medications, transportation, and follow-up were arranged). These visit factors were reviewed because the literature has identified them as being important markers for AMA discharge safety.6,8 Two research assistants, under the guidance of Dr. Stearns, reviewed the charts. To ensure agreement across chart reviews with respect to subjective questions (eg, whether capacity was adequately documented), the group reviewed the first 10 consecutive charts together; there was full agreement on how to classify the data of interest. Throughout the study, whenever a research assistant asked how to classify particular patient data, Dr. Stearns reviewed the data, and the research team made a decision together. Additional data, for AMA patients and for all patients admitted to Highland Hospital, were obtained from the hospital’s data warehouse, which pools data from within the health system.
Phase 3 involved surveying healthcare providers who were involved in patient care on the internal medicine and trauma surgery services at the hospital. These providers were selected because chart review revealed that the vast majority of patients who left AMA in 2014 were on one of these services. Surveys (Appendix B) asked participant providers to identify their role at the hospital, to provide a self-assessment of competence in various aspects of AMA discharge, to voice opinions about provider responsibilities in arranging follow-up for AMA patients, and to make suggestions about the AMA process. The authors designed these surveys, which included questions about aspects of care that have been highlighted in the AMA discharge literature as being important for AMA discharge safety.6,8,22,23 Surveys were distributed to providers at internal medicine and trauma surgery department meetings and nursing conferences. Data (without identifying information) were analyzed, and survey responses kept anonymous.
The Alameda Health System Institutional Review Board approved this project. Providers were given the option of writing their name and contact information at the top of the survey in order to be entered into a drawing to receive a prize for completion.
We performed statistical analyses of the patient charts and physician survey data using Stata (version 14.0, Stata Corp., College Station, Texas). We analyzed both patient- and encounter-level data. In demographic analyses, this approach prevented duplicate counting of patients who left AMA multiple times. Patient-level analyses compared the demographic characteristics of AMA patients and patients discharged conventionally from the hospital in 2014. In addition, patients with either 1 or multiple AMA discharges were compared to identify characteristics that might be linked to highest risk of recurrent AMA discharge in the hope that early identification of these patients might facilitate providers’ early awareness and preparation for follow-up care or hospitalization alternatives. We used ANOVAs for continuous variables and tests of proportions for categorical variables. On the encounter level, analyses examined data about each admission (eg, AMA forms signed, follow-up arrangements made, capacity documented, etc.) for all AMA discharges. We employed chi square tests to identify variations in healthcare provider survey responses. A P value < 0.05 was used as the significance cut-off point.
Staged logistic regression analyses, adjusted for demographic characteristics, were performed to assess the association between risk of leaving AMA (yes or no) and demographic characteristics and the association between risk of leaving AMA more than once (yes or no) and health-related characteristics.
RESULTS
Demographic, Clinical, and Utilization Characteristics
Of the 12,036 Highland Hospital admissions in 2014, 319 (2.7%) ended with an AMA discharge. Of the 8207 individual patients discharged, 268 left AMA once, and 29 left AMA multiple times. Further review of the Admissions, Discharges, and Transfers Report generated from the electronic medical record revealed that 15 AWOL discharges were misclassified as AMA discharges.
Compared with patients discharged conventionally, AMA patients were significantly younger; more likely to be male, to self-identify as Black/African American, and to be English-speaking; and less likely to self-identify as Asian/Pacific Islander or Hispanic/Latino or to be Chinese- or Spanish-speaking (Table 1). They were also more likely than all patients admitted to Highland to be homeless (15.7% vs 8.7%; P < 0.01). Multivariate regression analysis revealed persistent age and sex disparities, but racial disparities were mitigated in adjusted analyses (Appendix C). Language disparities persisted only for Spanish speakers, who had a significantly lower rate of AMA discharge, even in adjusted analyses.
The majority of AMA patients were on the internal medicine service (63.5%) or the trauma surgery service (24.8%). Regarding admission diagnosis, 17.2% of AMA patients were admitted for infections, 5.0% for drug or alcohol intoxication or withdrawal, 38.9% for acute noninfectious illnesses, 16.7% for decompensation of chronic disease, 18.4% for injuries or trauma, and 3.8% for pregnancy complications or labor. Compared with patients who left AMA once, patients who left AMA multiple times had higher rates of heavy alcohol use (53.9% vs 30.9%; P = 0.01) and illicit drug use (88.5% vs 53.7%; P < 0.001) (Table 2). In multivariate analyses, the increased odds of leaving AMA more than once persisted for current heavy illicit drug users compared with patients who had never engaged in illicit drug use.
Discharge Characteristics and Documentation
Providers documented a patient’s plan to leave AMA before actual discharge 17.3% of the time. The documented plan to leave had to indicate that the patient was actually considering leaving. For example, “Patient is eager to go home” was not enough to qualify as a plan, but “Patient is thinking of leaving” qualified. For 84.3% of AMA discharges, the hospital’s AMA form was signed and was included in the medical record. Documentation showed that medications were prescribed for AMA patients 21.4% of the time, follow-up was arranged 25.7% of the time, and follow-up was pending arrangement 14.8% of the time. The majority of AMA patients (71.4%) left during daytime hours. In 29.6% of AMA discharges, providers documented AMA patients had decision-making capacity.
Readmission After AMA Discharge
Of the 268 AMA patients, 67.7% were not readmitted within the 6 months after AMA, 24.5% had 1 or 2 readmissions, and the rest had 3 or more readmissions (1 patient had 15). In addition, 35.8% returned to the emergency department within 30 days, and 16.4% were readmitted within 30 days. In 2014, the hospital’s overall 30-day readmission rate was 10.8%. Of the patients readmitted within 6 months after AMA, 23.5% left AMA again at the next visit, 9.4% left AWOL, and 67.1% were discharged conventionally.
Drivers of Premature Discharge
Qualitative analysis of the 35.5% of patient charts documenting a reason for leaving the hospital revealed 3 broad, interrelated themes (Figure 1). The first theme, dissatisfaction with hospital care, included chart notations such as “His wife couldn’t sleep in the hospital room” and “Not satisfied with all-liquid diet.” The second theme, urgent personal issues, included comments such as “He has a very important court date for his children” and “He needed to take care of immigration forms.” The third theme, mental health and substance abuse issues, included notations such as “He wants to go smoke” and “Severe anxiety and prison flashbacks.”
Provider Self-Assessment and Beliefs
The survey was completed by 178 healthcare providers: 49.4% registered nurses, 19.1% trainee physicians, 20.8% attending physicians, and 10.7% other providers, including chaplains, social workers, and clerks. Regarding self-assessment of competency in AMA discharges, 94% of providers agreed they were comfortable assessing capacity, and 94% agreed they were comfortable talking with patients about the risks of leaving AMA (Figure 2). Nurses were more likely than trainee physicians to agree they knew what to do for patients who lacked capacity (74% vs 49%; P = 0.02). Most providers (70%) agreed they usually knew why their patients were leaving AMA; in this self-assessment, there were no significant differences between types of providers.
Regarding follow-up, attending physicians and trainee physicians demonstrated more agreement than nurses that AMA patients should receive medications and follow-up (94% and 84% vs 64%; P < 0.05). Nurses were more likely than attending physicians to say patients should lose their rights to hospital follow-up because of leaving AMA (38% vs 6%; P < 0.01). A minority of providers (37%) agreed transportation should be arranged. Addiction was the most common driver of AMA discharge (35%), followed by familial obligations (19%), dissatisfaction with hospital care (16%), and financial concerns (15%).
DISCUSSION
The demographic characteristics of AMA patients in this study are similar to those identified in other studies, showing overrepresentation of young male patients.12,14 Homeless patients were also overrepresented in the AMA discharge population at Highland Hospital—a finding that has not been consistently reported in prior studies, and that warrants further examination. In adjusted analyses, Spanish speakers had a lower rate of AMA discharge, and there were no racial variations. This is consistent with another study’s finding: that racial disparities in AMA discharge rates were largely attributable to confounders.24 Language differences may result from failure of staff to fully explain the option of AMA discharge to non-English speakers, or from fear of immigration consequences after AMA discharge. Further investigation of patient experiences is needed to identify factors that contribute to demographic variations in AMA discharge rates.25,26
Of the patients who left AMA multiple times, nearly all were actively using illicit drugs. In a recent study conducted at a safety-net hospital in Vancouver, Canada, 43% of patients with illicit drug use and at least 1 hospitalization left AMA at least once during the 6-year study period.11 Many factors might explain this correlation—addiction itself, poor pain control for patients with addiction issues, fears about incarceration, and poor treatment of drug users by healthcare staff.15 Although the medical literature highlights deficits in pain control for patients addicted to opiates, proposed solutions are sparse and focus on perioperative pain control and physician prescribing practices.27,28 At safety-net hospitals in which addiction is a factor in many hospitalizations, there is opportunity for new research in inpatient pain control for patients with substance dependence. In addition, harm reduction strategies—such as methadone maintenance for hospitalized patients with opiate dependence and abscess clinics as hospitalization alternatives for injection-associated infection treatment—may be key in improving safety for patients.11,15,29
Comparing the provider survey and chart review results highlights discordance between provider beliefs and clinical practice. Healthcare providers at Highland Hospital considered themselves competent in assessing capacity and talking with patients about the risks of AMA discharge. In practice, however, capacity was documented in less than a third of AMA discharges. Although the majority of providers thought medications and follow-up should be arranged for patients, arrangements were seldom made. This may be partially attributable to limited resources for making these arrangements. Average time to “third next available” primary care appointment within the county health system that includes Highland was 44.6 days for established patients during the period of study; for new primary care patients, the average wait for an appointment was 2 to 3 months. Highland has a same-day clinic, but inpatient providers are discouraged from using it as a postdischarge clinic for patients who would be better served in primary care. Medications and transportation are easily arranged during daytime hours but are not immediately available at night. In addition, some of this discrepancy may be attributable to the limited documentation rather than to provider failure to achieve their own benchmarks of quality care for AMA patients.
Documentation in AMA discharges is key for multiple reasons. Most AMA patients in this study signed an AMA form, and it could be that the rate of documenting decision-making capacity was low because providers thought a signed AMA form was adequate documentation of capacity and informed consent. In numerous court cases, however, these forms were found to be insufficient evidence of informed consent (lacking other supportive documentation) and possibly to go against the public good.30 In addition, high rates of repeat emergency department visits and readmissions for AMA patients, demonstrated here and in other studies, highlight the importance of careful documentation in informing subsequent providers about hospital returnees’ ongoing issues.17-19
This study also demonstrated differences between nurses and physicians in their beliefs about arranging follow-up for AMA patients. Nurses were less likely than physicians to think follow-up arrangements should be made for AMA patients and more likely to say these patients should lose the right to follow-up because of the AMA discharge. For conventional discharges, nurses provide patients with significantly more discharge education than interns or hospitalists do.31 This discrepancy highlights an urgent need for the education and involvement of nurses as stakeholders in the challenging AMA discharge process. Although the percentage of physicians who thought they were not obligated to provide medications and arrange follow-up for AMA patients was lower than the percentage of nurses, these beliefs contradict best practice guidelines for AMA discharges,22,23 and this finding calls attention to the need for interventions to improve adherence to professional and ethical guidelines in this aspect of clinical practice.
Providers showed a lack of familiarity with practice guidelines regarding certain aspects of the AMA discharge process. For example, most providers thought they should not have to arrange transportation for AMA patients, even though both the California Hospital Association Guidelines and the Highland Hospital internal policy on AMA discharges recommend arranging appropriate transportation.32 This finding suggests a need for educational interventions to ensure providers are informed about state and hospital policies, and a need to include both physicians and nurses in policymaking so theory can be tied to practice.
This study was limited to a single center with healthcare provider and patient populations that might not be generalizable to other settings. In the retrospective chart review, the authors were limited to information documented in the medical record, which might not accurately reflect the AMA discharge process. As they surveyed a limited number of social workers, case managers, and others who play an important role in the AMA discharge process, their data may lack varying viewpoints.
Overall, these data suggest providers at this county hospital generally agreed in principle with the best practice guidelines proposed by bioethicists for AMA discharges. In practice, however, providers were not reliably following these guidelines. Future interventions—including provider education on best practice guidelines for AMA discharge, provider involvement in policymaking, supportive templates for guiding documentation of AMA discharges, and improving access to follow-up care—will be key in improving the safety and health outcomes of AMA patients.
Acknowledgments
The authors thank Kelly Aguilar, Kethia Chheng, Irene Yen, and the Research Advancement and Coordination Initiative at Alameda Health System for important contributions to this project.
Disclosures
Highland Hospital Department of Medicine internal grant 2015.23 helped fund this research. A portion of the data was presented as a poster at the University of California San Francisco Health Disparities Symposium; October 2015; San Francisco, CA. Two posters from the data were presented at Hospital Medicine 2016, March 2016; San Diego, CA.
1. Southern WN, Nahvi S, Arnsten JH. Increased risk of mortality and readmission among patients discharged against medical advice. Am J Med. 2012;125(6):594-602. PubMed
2. Stranges E, Wier L, Merrill C, Steiner C. Hospitalizations in which Patients Leave the Hospital against Medical Advice (AMA), 2007. HCUP Statistical Brief #78. August 2009. Agency for Healthcare Research and Quality, Rockville, MD. http://www.hcup-us.ahrq.gov/reports/statbriefs/sb78.pdf. Accessed November 30, 2016. PubMed
3. Devitt PJ, Devitt AC, Dewan M. Does identifying a discharge as “against medical advice” confer legal protection? J Fam Pract. 2000;49(3):224-227. PubMed
4. O’Hara D, Hart W, McDonald I. Leaving hospital against medical advice. J Qual Clin Pract. 1996;16(3):157-164. PubMed
5. Ibrahim SA, Kwoh CK, Krishnan E. Factors associated with patients who leave acute-care hospitals against medical advice. Am J Public Health. 2007;97(12):2204-2208. PubMed
6. Clark MA, Abbott JT, Adyanthaya T. Ethics seminars: a best-practice approach to navigating the against-medical-advice discharge. Acad Emerg Med. 2014;21(9):1050-1057. PubMed
7. Windish DM, Ratanawongsa N. Providers’ perceptions of relationships and professional roles when caring for patients who leave the hospital against medical advice. J Gen Intern Med. 2008;23(10):1698-1707. PubMed
8. Edwards J, Markert R, Bricker D. Discharge against medical advice: how often do we intervene? J Hosp Med. 2013;8(10):574-577. PubMed
9. Alfandre DJ. “I’m going home”: discharges against medical advice. Mayo Clin Proc. 2009;84(3):255-260. PubMed
10. Katzenellenbogen JM, Sanfilippo FM, Hobbs MS, et al. Voting with their feet—predictors of discharge against medical advice in Aboriginal and non-Aboriginal ischaemic heart disease inpatients in Western Australia: an analytic study using data linkage. BMC Health Serv Res. 2013;13:330. PubMed
11. Ti L, Milloy MJ, Buxton J, et al. Factors associated with leaving hospital against medical advice among people who use illicit drugs in Vancouver, Canada. PLoS One. 2015;10(10):e0141594. PubMed
12. Yong TY, Fok JS, Hakendorf P, Ben-Tovim D, Thompson CH, Li JY. Characteristics and outcomes of discharges against medical advice among hospitalised patients. Intern Med J. 2013;43(7):798-802. PubMed
13. Tabatabaei SM, Sargazi Moakhar Z, Behmanesh Pour F, Shaare Mollashahi S, Zaboli M. Hospitalized pregnant women who leave against medical advice: attributes and reasons. Matern Child Health J. 2016;20(1):128-138. PubMed
14. Aliyu ZY. Discharge against medical advice: sociodemographic, clinical and financial perspectives. Int J Clin Pract. 2002;56(5):325-327. PubMed
15. Ti L, Ti L. Leaving the hospital against medical advice among people who use illicit drugs: a systematic review. Am J Public Health. 2015;105(12):e53-e59. PubMed
16. Targum SD, Capodanno AE, Hoffman HA, Foudraine C. An intervention to reduce the rate of hospital discharges against medical advice. Am J Psychiatry. 1982;139(5):657-659. PubMed
17. Choi M, Kim H, Qian H, Palepu A. Readmission rates of patients discharged against medical advice: a matched cohort study. PLoS One. 2011;6(9):e24459. PubMed
18. Glasgow JM, Vaughn-Sarrazin M, Kaboli PJ. Leaving against medical advice (AMA): risk of 30-day mortality and hospital readmission. J Gen Intern Med. 2010;25(9):926-929. PubMed
19. Garland A, Ramsey CD, Fransoo R, et al. Rates of readmission and death associated with leaving hospital against medical advice: a population-based study. CMAJ. 2013;185(14):1207-1214. PubMed
20. Hwang SW, Li J, Gupta R, Chien V, Martin RE. What happens to patients who leave hospital against medical advice? CMAJ. 2003;168(4):417-420. PubMed
21. Onukwugha E, Mullins CD, Loh FE, Saunders E, Shaya FT, Weir MR. Readmissions after unauthorized discharges in the cardiovascular setting. Med Care. 2011;49(2):215-224. PubMed
22. Alfandre D. Reconsidering against medical advice discharges: embracing patient-centeredness to promote high quality care and a renewed research agenda. J Gen Intern Med. 2013;28(12):1657-1662. PubMed
23. Berger JT. Discharge against medical advice: ethical considerations and professional obligations. J Hosp Med. 2008;3(5):403-408. PubMed
24. Franks P, Meldrum S, Fiscella K. Discharges against medical advice: are race/ethnicity predictors? J Gen Intern Med. 2006;21(9):955-960. PubMed
25. Hicks LS, Ayanian JZ, Orav EJ, et al. Is hospital service associated with racial and ethnic disparities in experiences with hospital care? Am J Med. 2005;118(5):529-535. PubMed
26. Hicks LS, Tovar DA, Orav EJ, Johnson PA. Experiences with hospital care: perspectives of black and Hispanic patients. J Gen Intern Med. 2008;23(8):1234-1240. PubMed
27. McCreaddie M, Lyons I, Watt D, et al. Routines and rituals: a grounded theory of the pain management of drug users in acute care settings. J Clin Nurs. 2010;19(19-20):2730-2740. PubMed
28. Carroll IR, Angst MS, Clark JD. Management of perioperative pain in patients chronically consuming opioids. Reg Anesth Pain Med. 2004;29(6):576-591. PubMed
29. Chan AC, Palepu A, Guh DP, et al. HIV-positive injection drug users who leave the hospital against medical advice: the mitigating role of methadone and social support. J Acquir Immune Defic Syndr. 2004;35(1):56-59. PubMed
30. Levy F, Mareiniss DP, Iacovelli C. The importance of a proper against-medical-advice (AMA) discharge: how signing out AMA may create significant liability protection for providers. J Emerg Med. 2012;43(3):516-520. PubMed
31. Ashbrook L, Mourad M, Sehgal N. Communicating discharge instructions to patients: a survey of nurse, intern, and hospitalist practices. J Hosp Med. 2013;8(1):36-41. PubMed
32. Joint Commission on Accreditation of Healthcare Organizations. Title 22, California Code of Regulations, §70707.3.
© 2017 Society of Hospital Medicine
Do Clinicians Understand Quality Metric Data?
Central line-associated bloodstream infections (CLABSIs) are common and serious occurrences across healthcare systems, with an attributable mortality of 12% to 25%.1,2 Given this burden,3–5 CLABSI is a focus for both high-profile public reporting and quality improvement interventions. An integral component of such interventions is audit and feedback via quality metrics. These measures are intended to allow decision makers to assess their own performance and appropriately allocate resources. Quality metrics present a substantial cost to health systems, with an estimated $15.4 billion dollars spent annually simply for reporting.6 Despite this toll, “audit and feedback” interventions have proven to be variably successful.7–9 The mechanisms that limit the effectiveness of these interventions remain
poorly understood.
One plausible explanation for limited efficacy of quality metrics is inadequate clinician numeracy—that is, “the ability to understand the quantitative aspects of clinical medicine, original research, quality improvement, and financial matters.”10 Indeed, clinicians are not consistently able to interpret probabilities and or clinical test characteristics. For example, Wegwarth et al. identified shortcomings in physician application of lead-time bias toward cancer screening.11 Additionally, studies have demonstrated systematic misinterpretations of probabilistic information in clinical settings, along with misconceptions regarding the impact of prevalence on post-test probabilities.12,13 Effective interpretation of rates may be a key—if unstated—requirement of many CLABSI quality improvement efforts.14–19 Our broader hypothesis is that clinicians who can more accurately interpret quality data, even if only from their own institution, are more likely to act on it appropriately and persistently than those who feel they must depend on a preprocessed interpretation of that same data by some other expert.
Therefore, we designed a survey to assess the numeracy of clinicians on CLABSI data presented in a prototypical feedback report. We studied 3 domains of comprehension: (1) basic numeracy: numerical tasks related to simple data; (2) risk-adjustment numeracy: numerical tasks related to risk-adjusted data; and (3) risk-adjustment interpretation: inferential tasks concerning risk-adjusted data. We hypothesized that clinician performance would vary substantially across domains, with the poorest performance in risk-
adjusted data.
METHODS
We conducted a cross-sectional survey of clinician numeracy regarding CLABSI feedback data. Respondents were also asked to provide demographic information and opinions regarding the reliability of quality metric data. Survey recruitment occurred on Twitter, a novel approach that leveraged social media to facilitate rapid recruitment of participants. The study instrument was administered using a web survey with randomized question order to preclude any possibility of order effects between questions. The study was deemed Institutional Review Board exempt by the University of Michigan: protocol HUM00106696.
Data Presentation Method
To determine the optimal mode of presenting data, we reviewed the literature on quality metric numeracy and presentation methods. Additionally, we evaluated quality metric presentation methods used by the Centers for Disease Control and Prevention (CDC), Centers for Medicare & Medicaid Services (CMS), and a tertiary academic medical center. After assessing the available literature and options, we adapted a CLABSI data presentation array from a study that had qualitatively validated the format using physician feedback (Appendix).20 We used hypothetical CLABSI data for our survey.
Survey Development
We developed a survey that included an 11-item test regarding CLABSI numeracy and data interpretation. Additional questions related to quality metric reliability and demographic information were included. No preexisting assessment tools existed for our areas of interest. Therefore, we developed a novel instrument using a broad, exploratory approach as others have employed.21
First, we defined 3 conceptual categories related to CLABSI data. Within this conceptual framework, an iterative process of development and revision was used to assemble a question bank from which the survey would be constructed. A series of think-aloud sessions were held to evaluate each prompt for precision, clarity, and accuracy in assessing the conceptual categories. Correct and incorrect answers were defined based on literature review in conjunction with input from methodological and content experts (TJI and VC) (see Appendix for answer explanations).
Within the conceptual categories related to CLABSI risk-adjustment, a key measure is the standardized infection ratio (SIR). This value is defined as the ratio of observed number of CLABSI over the expected number of CLABSIs.22 This is the primary measure to stratify hospital performance, and it was used in our assessment of risk-adjustment comprehension. In total, 54 question prompts were developed and subsequently narrowed to 11 study questions for the initial survey.
The instrument was then pretested in a cohort of 8 hospitalists and intensivists to ensure appropriate comprehension, retrieval, and judgment processes.23 Questions were revised based on feedback from this cognitive testing to constitute the final instrument. During the survey, the data table was reshown on each page directly above each question and so was always on the same screen for the respondents.
Survey Sample
We innovated by using Twitter as an online platform for recruiting participants; we used Survey Monkey to host the electronic instrument. Two authors (TJI, VC) systematically sent out solicitation tweets to their followers. These tweets clearly indicated that the recruitment was for the purpose of a research study, and participants would receive no financial reward/incentive (Appendix). A link to the survey was provided in each tweet, and the period of recruitment was 30 days. To ensure respondents were clinicians, they needed to first answer a screening question recognizing that central lines were placed in the subclavian site but not the aorta, iliac, or radial sites.
To prevent systematic or anchoring biases, the order of questions was electronically randomized for each respondent. The primary outcome was the percentage correct of attempted questions.
Statistical Analysis
Descriptive statistics were calculated for all demographic variables. The primary outcome was evaluated as a dichotomous variable for each question (correct vs. incorrect response), and as a continuous variable when assessing mean percent correct on the overall survey. Demographic and conceptual associations were assessed via t-tests, chi-square, or Fisher exact tests. Point biserial correlations were calculated to assess for associations between response to a single question and overall performance on the survey.
To evaluate the association between various respondent characteristics and responses, logistic regression analyses were performed. An ANOVA was performed to assess the association between self-reported reliability of quality metric data and the overall performance on attempted items. Analyses were conducted using STATA MP 14.0 (College Station, TX); P <0.05 was considered statistically significant.
RESULTS
A total of 97 respondents attempted at least 1 question on the survey, and 72 respondents attempted all 11 questions, yielding 939 unique responses for analysis. Seventy respondents (87%) identified as doctors or nurses, and 44 (55%) reported having 6 to 20 years of experience; the survey cohort also came from 6 nations (Table 1). All respondents answered the CLABSI knowledge filter question correctly.

Primary Outcome
The mean percent correct of attempted questions was 61% (standard deviation 21%, interquartile range 50%-75%) (Figure 1). Of those who answered all 11 CLABSI questions, the mean percent correct was 63% (95% CI, 59%-67%). Some questions were answered correctly more often than others—ranging from 17% to 95% (Table 2). Doctors answered 68% of questions correctly (95% CI, 63%-73%), while nurses and other respondents answered 57% of questions correctly (95% CI, 52%-62%) (P = 0.003). Other demographic variables—including self-reported involvement in a quality improvement committee and being from the United States versus elsewhere—were not associated with survey performance. The point biserial correlations for each individual question with overall performance were all more than 0.2 (range 0.24–0.62) and all statistically significant at P < 0.05.

Concept-Specific Performance
Average percent correct declined across categories as numeracy requirements increased (P < 0.05 for all pairwise comparisons). In the area of basic numeracy, respondents’ mean percent correct was 82% (95% CI, 77%-87%) of attempted. This category had 4 questions, with a performance range of 77% to 90%. For example, on the question, “Which hospital has the lowest CLABSI rate?”, 80% of respondents answered correctly. For risk-adjustment numeracy, the mean percent correct was 70% (95% CI, 64%-76%); 2 items assessed this category. For “Which is better: a higher or lower SIR?”, 95% of the cohort answered correctly. However, on “If hospital B had its number of projected infection halved, what is its SIR?”, only 46% of those who attempted the question answered correctly.
Questions featuring risk-adjustment interpretation had an average percent correct of 43% (95% CI, 37%-49%). Five questions made up this category, with a percent correct range of 17% to 75%. For example, on the question, “Which hospital’s patients are the most predisposed to developing CLABSI?”, only 32% of respondents answered this correctly. In contrast, for the question “Which hospital is most effective at preventing CLABSI?”, 51% answered correctly. Figure 2 illustrates the cohort’s performance on each conceptual category while Table 2 displays question-by-question results.


Opinions Regarding CLABSI Data Reliability
Respondents were also asked about their opinion regarding the reliability of CLABSI quality metric data. Forty-three percent of respondents stated that such data were reliable at best 50% of the time. Notably, 10% of respondents indicated that CLABSI quality metric data were rarely or never reliable. There was no association between perceived reliability of quality metric data and survey performance (P = 0.87).
DISCUSSION
This Twitter-based study found wide variation in clinician interpretation of CLABSI quality data, with low overall performance. In particular, comprehension and interpretation of risk-adjusted data were substantially worse than unadjusted data. Although doctors performed somewhat better than nurses and other respondents, those involved in quality improvement initiatives performed no better than respondents who were not. Collectively, these findings suggest clinicians may not reliably comprehend quality metric data, potentially affecting their ability to utilize audit and feedback data. These results may have important implications for policy efforts that seek to leverage quality metric data to improve patient safety.
An integral component of many contemporary quality improvement initiatives is audit and feedback through metrics.6 Unfortunately, formal audit and feedback, along with other similar methods that benchmark data, have not consistently improved outcomes.24–27 A recent meta-analysis noted that audit and feedback interventions are not becoming more efficacious over time; the study further asserted that “new trials have provided little new knowledge regarding key effect modifiers.”9 Our findings suggest that numeracy and comprehension of quality metrics may be important candidate effect modifiers not previously considered. Simply put: we hypothesize that without intrinsic comprehension of data, impetus or insight to change practice might be diminished. In other words, clinicians may be more apt to act on insights they themselves derive from the data than when they are simply told what the data “mean.”
The present study further demonstrates that clinicians do not understand risk-adjusted data as well as raw data. Risk-adjustment has long been recognized as necessary to compare outcomes among hospitals.28,29 However, risk-adjustment is complex and, by its nature, difficult to understand. Although efforts have focused on improving the statistical reliability of quality metrics, this may represent but one half of the equation. Numeracy and interpretation of the data by decision makers are potentially equally important to effecting change. Because clinicians seem to have difficulty understanding risk-adjusted data, this deficit may be of growing importance as our risk-adjustment techniques become more sophisticated.
We note that clinicians expressed concerns regarding the reliability of quality metric feedback. These findings corroborate recent research that has reported reservations from hospital leaders concerning quality data.30,31 However, as shown in the context of patients and healthcare decisions, the aversion associated with quality metrics may be related to incomplete understanding of the data.32 Whether perceptions of unreliability drive lack of understanding or, conversely, whether lack of understanding fuels perceived unreliability is an important question that requires further study.
This study has several strengths. First, we used rigorous survey development techniques to evaluate the understudied issue of quality metric numeracy. Second, our sample size was sufficient to show statistically significant differences in numeracy and comprehension of CLABSI quality metric data. Third, we leveraged social media to rapidly acquire this sample. Finally, our results provided new insights that may have important implications in the area of quality metrics.
There were also limitations to our study. First, the Twitter-derived sample precludes the calculation of a response rate and may not be representative of individuals engaged in CLABSI prevention. However, respondents were solicited from the Twitter-followers of 2 health services researchers (TJI, VC) who are actively engaged in scholarly activities pertaining to critically ill patients and hospital-acquired complications. Thus, our sample likely represents a highly motivated subset that engages in these topics on a regular basis—potentially making them more numerate than average clinicians. Second, we did not ask whether the respondents had previously seen CLABSI data specifically, so we cannot stratify by exposure to such data. Third, this study assessed only CLABSI quality metric data; generalizations regarding numeracy with other metrics should be made with caution. However, as many such data are presented in similar formats, we suspect our findings are applicable to similar audit-and-feedback initiatives.
The findings of this study serve as a stimulus for further inquiry. Research of this nature needs to be carried out in samples drawn from specific, policy-relevant populations (eg, infection control practitioners, bedside nurses, intensive care unit directors). Such studies should include longitudinal assessments of numeracy that attempt to mechanistically examine its impact on CLABSI prevention efforts and outcomes. The latter is an important issue as the link between numeracy and behavioral response, while plausible, cannot be assumed, particularly given the complexity of issues related to behavioral modification.33 Additionally, whether alternate presentations of quality data affect numeracy, interpretation, and performance is worthy of further testing; indeed, this has been shown to be the case in other forms of communication.34–37 Until data from larger samples are available, it may be prudent for quality improvement leaders to assess the comprehension of local clinicians regarding feedback and whether lack of adequate comprehension is a barrier to deploying quality improvement interventions.
Quality measurement is a cornerstone of patient safety as it seeks to assess and improve the care delivered at the bedside. Rigorous metric development is important; however, ensuring that decision makers understand complex quality metrics may be equally fundamental. Given the cost of examining quality, elucidating the mechanisms of numeracy and interpretation as decision makers engage with quality metric data is necessary, along with whether improved comprehension leads to behavior change. Such inquiry may provide an evidence-base to shape alterations in quality metric deployment that will ensure maximal efficacy in driving practice change.
Disclosures
This work was supported by VA HSR&D IIR-13-079 (TJI). Dr. Chopra is supported by a career development award from the Agency of Healthcare Research and Quality (1-K08-HS022835-01). The views expressed here are the authors’ own and do not necessarily represent the view of the US Government or the Department of Veterans’ Affairs. The authors report no conflicts of interest.
1. Scott RD II. The direct medical costs of healthcare-associated infections in us hospitals and the benefits of prevention. Centers for Disease Control and Prevention. Available at: http://www.cdc.gov/HAI/pdfs/hai/Scott_CostPaper.pdf. Published March 2009. Accessed November 8, 2016.
2. O’Grady NP, Alexander M, Burns LA, et al. Guidelines for the prevention of intravascular catheter-related infections. Am J Infect Control. 2011;39(4 suppl 1)::S1-S34. PubMed
3. Blot K, Bergs J, Vogelaers D, Blot S, Vandijck D. Prevention of central line-associated bloodstream infections through quality improvement interventions: a systematic review and meta-analysis. Clin Infect Dis. 2014;59(1):96-105. PubMed
4. Mermel LA. Prevention of intravascular catheter-related infections. Ann Intern Med. 2000;132(5):391-402. PubMed
5. Siempos II, Kopterides P, Tsangaris I, Dimopoulou I, Armaganidis AE. Impact of catheter-related bloodstream infections on the mortality of critically ill patients: a meta-analysis. Crit Care Med. 2009;37(7):2283-2289. PubMed
6. Casalino LP, Gans D, Weber R, et al. US physician practices spend more than $15.4 billion annually to report quality measures. Health Aff (Millwood). 2016;35(3):401-406. PubMed
7. Hysong SJ. Meta-analysis: audit and feedback features impact effectiveness on care quality. Med Care. 2009;47(3):356-363. PubMed
8. Ilgen DR, Fisher CD, Taylor MS. Consequences of individual feedback on behavior in organizations. J Appl Psychol. 1979;64:349-371.
9. Ivers NM, Grimshaw JM, Jamtvedt G, et al. Growing literature, stagnant science? Systematic review, meta-regression and cumulative analysis of audit and feedback interventions in health care. J Gen Intern Med. 2014;29(11):1534-1541. PubMed
10. Rao G. Physician numeracy: essential skills for practicing evidence-based medicine. Fam Med. 2008;40(5):354-358. PubMed
11. Wegwarth O, Schwartz LM, Woloshin S, Gaissmaier W, Gigerenzer G. Do physicians understand cancer screening statistics? A national survey of primary care physicians in the United States. Ann Intern Med. 2012;156(5):340-349. PubMed
12. Bramwell R, West H, Salmon P. Health professionals’ and service users’ interpretation of screening test results: experimental study. BMJ. 2006;333(7562):284. PubMed
13. Agoritsas T, Courvoisier DS, Combescure C, Deom M, Perneger TV. Does prevalence matter to physicians in estimating post-test probability of disease? A randomized trial. J Gen Intern Med. 2011;26(4):373-378. PubMed
14. Warren DK, Zack JE, Mayfield JL, et al. The effect of an education program on the incidence of central venous catheter-associated bloodstream infection in a medical ICU. Chest. 2004;126(5):1612-1618. PubMed
15. Rinke ML, Bundy DG, Chen AR, et al. Central line maintenance bundles and CLABSIs in ambulatory oncology patients. Pediatrics. 2013;132(5):e1403-e1412. PubMed
16. Pronovost P, Needham D, Berenholtz S, et al. An intervention to decrease catheter-related bloodstream infections in the ICU. N Engl J Med. 2006;355(26):
2725-2732. PubMed
17. Rinke ML, Chen AR, Bundy DG, et al. Implementation of a central line maintenance care bundle in hospitalized pediatric oncology patients. Pediatrics. 2012;130(4):e996-e1004. PubMed
18. Sacks GD, Diggs BS, Hadjizacharia P, Green D, Salim A, Malinoski DJ. Reducing the rate of catheter-associated bloodstream infections in a surgical intensive care unit using the Institute for Healthcare Improvement Central Line Bundle. Am J Surg. 2014;207(6):817-823. PubMed
19. Berenholtz SM, Pronovost PJ, Lipsett PA, et al. Eliminating catheter-related bloodstream infections in the intensive care unit. Crit Care Med. 2004;32(10):2014-2020. PubMed
20. Rajwan YG, Barclay PW, Lee T, Sun IF, Passaretti C, Lehmann H. Visualizing central line-associated blood stream infection (CLABSI) outcome data for decision making by health care consumers and practitioners—an evaluation study. Online J Public Health Inform. 2013;5(2):218. PubMed
21. Fagerlin A, Zikmund-Fisher BJ, Ubel PA, Jankovic A, Derry HA, Smith DM. Measuring numeracy without a math test: development of the Subjective Numeracy Scale. Med Decis Making 2007;27(5):672-680. PubMed
22. HAI progress report FAQ. 2016. Available at: http://www.cdc.gov/hai/surveillance/progress-report/faq.html. Last updated March 2, 2016. Accessed November 8, 2016.
23. Collins D. Pretesting survey instruments: an overview of cognitive methods. Qual Life Res. 2003;12(3):229-238. PubMed
24. Ivers N, Jamtvedt G, Flottorp S, et al. Audit and feedback: effects on professional practice and healthcare outcomes. Cochrane Database Syst Rev. 2012;(6):CD000259. PubMed
25. Chatterjee P, Joynt KE. Do cardiology quality measures actually improve patient outcomes? J Am Heart Assoc. 2014;3(1):e000404. PubMed
26. Joynt KE, Blumenthal DM, Orav EJ, Resnic FS, Jha AK. Association of public reporting for percutaneous coronary intervention with utilization and outcomes among Medicare beneficiaries with acute myocardial infarction. JAMA. 2012;308(14):1460-1468. PubMed
27. Ryan AM, Nallamothu BK, Dimick JB. Medicare’s public reporting initiative on hospital quality had modest or no impact on mortality from three key conditions. Health Aff (Millwood). 2012;31(3):585-592. PubMed
28. Thomas JW. Risk adjustment for measuring health care outcomes, 3rd edition. Int J Qual Health Care. 2004;16(2):181-182.
29. Iezzoni LI. Risk Adjustment for Measuring Health Care Outcomes. Ann Arbor, Michigan: Health Administration Press; 1994.
30. Goff SL, Lagu T, Pekow PS, et al. A qualitative analysis of hospital leaders’ opinions about publicly reported measures of health care quality. Jt Comm J Qual Patient Saf. 2015;41(4):169-176. PubMed
31. Lindenauer PK, Lagu T, Ross JS, et al. Attitudes of hospital leaders toward publicly reported measures of health care quality. JAMA Intern Med. 2014;174(12):
1904-1911. PubMed
32. Peters E, Hibbard J, Slovic P, Dieckmann N. Numeracy skill and the communication, comprehension, and use of risk-benefit information. Health Aff (Millwood). 2007;26(3):741-748. PubMed
33. Montano DE, Kasprzyk D. Theory of reasoned action, theory of planned behavior, and the integrated behavioral model. In: Glanz K, Rimer BK, Viswanath K, eds. Health Behavior and Health Education: Theory, Research and Practice. 5th ed. San Francisco, CA: Jossey-Bass; 2015:95–124.
34. Hamstra DA, Johnson SB, Daignault S, et al. The impact of numeracy on verbatim knowledge of the longitudinal risk for prostate cancer recurrence following radiation therapy. Med Decis Making. 2015;35(1):27-36. PubMed
35. Hawley ST, Zikmund-Fisher B, Ubel P, Jancovic A, Lucas T, Fagerlin A. The impact of the format of graphical presentation on health-related knowledge and treatment choices. Patient Educ Couns. 2008;73(3):448-455. PubMed
36. Zikmund-Fisher BJ, Witteman HO, Dickson M, et al. Blocks, ovals, or people? Icon type affects risk perceptions and recall of pictographs. Med Decis Making. 2014;34(4):443-453. PubMed
37. Korfage IJ, Fuhrel-Forbis A, Ubel PA, et al. Informed choice about breast cancer prevention: randomized controlled trial of an online decision aid intervention. Breast Cancer Res. 2013;15(5):R74. PubMed
Central line-associated bloodstream infections (CLABSIs) are common and serious occurrences across healthcare systems, with an attributable mortality of 12% to 25%.1,2 Given this burden,3–5 CLABSI is a focus for both high-profile public reporting and quality improvement interventions. An integral component of such interventions is audit and feedback via quality metrics. These measures are intended to allow decision makers to assess their own performance and appropriately allocate resources. Quality metrics present a substantial cost to health systems, with an estimated $15.4 billion dollars spent annually simply for reporting.6 Despite this toll, “audit and feedback” interventions have proven to be variably successful.7–9 The mechanisms that limit the effectiveness of these interventions remain
poorly understood.
One plausible explanation for limited efficacy of quality metrics is inadequate clinician numeracy—that is, “the ability to understand the quantitative aspects of clinical medicine, original research, quality improvement, and financial matters.”10 Indeed, clinicians are not consistently able to interpret probabilities and or clinical test characteristics. For example, Wegwarth et al. identified shortcomings in physician application of lead-time bias toward cancer screening.11 Additionally, studies have demonstrated systematic misinterpretations of probabilistic information in clinical settings, along with misconceptions regarding the impact of prevalence on post-test probabilities.12,13 Effective interpretation of rates may be a key—if unstated—requirement of many CLABSI quality improvement efforts.14–19 Our broader hypothesis is that clinicians who can more accurately interpret quality data, even if only from their own institution, are more likely to act on it appropriately and persistently than those who feel they must depend on a preprocessed interpretation of that same data by some other expert.
Therefore, we designed a survey to assess the numeracy of clinicians on CLABSI data presented in a prototypical feedback report. We studied 3 domains of comprehension: (1) basic numeracy: numerical tasks related to simple data; (2) risk-adjustment numeracy: numerical tasks related to risk-adjusted data; and (3) risk-adjustment interpretation: inferential tasks concerning risk-adjusted data. We hypothesized that clinician performance would vary substantially across domains, with the poorest performance in risk-
adjusted data.
METHODS
We conducted a cross-sectional survey of clinician numeracy regarding CLABSI feedback data. Respondents were also asked to provide demographic information and opinions regarding the reliability of quality metric data. Survey recruitment occurred on Twitter, a novel approach that leveraged social media to facilitate rapid recruitment of participants. The study instrument was administered using a web survey with randomized question order to preclude any possibility of order effects between questions. The study was deemed Institutional Review Board exempt by the University of Michigan: protocol HUM00106696.
Data Presentation Method
To determine the optimal mode of presenting data, we reviewed the literature on quality metric numeracy and presentation methods. Additionally, we evaluated quality metric presentation methods used by the Centers for Disease Control and Prevention (CDC), Centers for Medicare & Medicaid Services (CMS), and a tertiary academic medical center. After assessing the available literature and options, we adapted a CLABSI data presentation array from a study that had qualitatively validated the format using physician feedback (Appendix).20 We used hypothetical CLABSI data for our survey.
Survey Development
We developed a survey that included an 11-item test regarding CLABSI numeracy and data interpretation. Additional questions related to quality metric reliability and demographic information were included. No preexisting assessment tools existed for our areas of interest. Therefore, we developed a novel instrument using a broad, exploratory approach as others have employed.21
First, we defined 3 conceptual categories related to CLABSI data. Within this conceptual framework, an iterative process of development and revision was used to assemble a question bank from which the survey would be constructed. A series of think-aloud sessions were held to evaluate each prompt for precision, clarity, and accuracy in assessing the conceptual categories. Correct and incorrect answers were defined based on literature review in conjunction with input from methodological and content experts (TJI and VC) (see Appendix for answer explanations).
Within the conceptual categories related to CLABSI risk-adjustment, a key measure is the standardized infection ratio (SIR). This value is defined as the ratio of observed number of CLABSI over the expected number of CLABSIs.22 This is the primary measure to stratify hospital performance, and it was used in our assessment of risk-adjustment comprehension. In total, 54 question prompts were developed and subsequently narrowed to 11 study questions for the initial survey.
The instrument was then pretested in a cohort of 8 hospitalists and intensivists to ensure appropriate comprehension, retrieval, and judgment processes.23 Questions were revised based on feedback from this cognitive testing to constitute the final instrument. During the survey, the data table was reshown on each page directly above each question and so was always on the same screen for the respondents.
Survey Sample
We innovated by using Twitter as an online platform for recruiting participants; we used Survey Monkey to host the electronic instrument. Two authors (TJI, VC) systematically sent out solicitation tweets to their followers. These tweets clearly indicated that the recruitment was for the purpose of a research study, and participants would receive no financial reward/incentive (Appendix). A link to the survey was provided in each tweet, and the period of recruitment was 30 days. To ensure respondents were clinicians, they needed to first answer a screening question recognizing that central lines were placed in the subclavian site but not the aorta, iliac, or radial sites.
To prevent systematic or anchoring biases, the order of questions was electronically randomized for each respondent. The primary outcome was the percentage correct of attempted questions.
Statistical Analysis
Descriptive statistics were calculated for all demographic variables. The primary outcome was evaluated as a dichotomous variable for each question (correct vs. incorrect response), and as a continuous variable when assessing mean percent correct on the overall survey. Demographic and conceptual associations were assessed via t-tests, chi-square, or Fisher exact tests. Point biserial correlations were calculated to assess for associations between response to a single question and overall performance on the survey.
To evaluate the association between various respondent characteristics and responses, logistic regression analyses were performed. An ANOVA was performed to assess the association between self-reported reliability of quality metric data and the overall performance on attempted items. Analyses were conducted using STATA MP 14.0 (College Station, TX); P <0.05 was considered statistically significant.
RESULTS
A total of 97 respondents attempted at least 1 question on the survey, and 72 respondents attempted all 11 questions, yielding 939 unique responses for analysis. Seventy respondents (87%) identified as doctors or nurses, and 44 (55%) reported having 6 to 20 years of experience; the survey cohort also came from 6 nations (Table 1). All respondents answered the CLABSI knowledge filter question correctly.
Primary Outcome
The mean percent correct of attempted questions was 61% (standard deviation 21%, interquartile range 50%-75%) (Figure 1). Of those who answered all 11 CLABSI questions, the mean percent correct was 63% (95% CI, 59%-67%). Some questions were answered correctly more often than others—ranging from 17% to 95% (Table 2). Doctors answered 68% of questions correctly (95% CI, 63%-73%), while nurses and other respondents answered 57% of questions correctly (95% CI, 52%-62%) (P = 0.003). Other demographic variables—including self-reported involvement in a quality improvement committee and being from the United States versus elsewhere—were not associated with survey performance. The point biserial correlations for each individual question with overall performance were all more than 0.2 (range 0.24–0.62) and all statistically significant at P < 0.05.
Concept-Specific Performance
Average percent correct declined across categories as numeracy requirements increased (P < 0.05 for all pairwise comparisons). In the area of basic numeracy, respondents’ mean percent correct was 82% (95% CI, 77%-87%) of attempted. This category had 4 questions, with a performance range of 77% to 90%. For example, on the question, “Which hospital has the lowest CLABSI rate?”, 80% of respondents answered correctly. For risk-adjustment numeracy, the mean percent correct was 70% (95% CI, 64%-76%); 2 items assessed this category. For “Which is better: a higher or lower SIR?”, 95% of the cohort answered correctly. However, on “If hospital B had its number of projected infection halved, what is its SIR?”, only 46% of those who attempted the question answered correctly.
Questions featuring risk-adjustment interpretation had an average percent correct of 43% (95% CI, 37%-49%). Five questions made up this category, with a percent correct range of 17% to 75%. For example, on the question, “Which hospital’s patients are the most predisposed to developing CLABSI?”, only 32% of respondents answered this correctly. In contrast, for the question “Which hospital is most effective at preventing CLABSI?”, 51% answered correctly. Figure 2 illustrates the cohort’s performance on each conceptual category while Table 2 displays question-by-question results.
Opinions Regarding CLABSI Data Reliability
Respondents were also asked about their opinion regarding the reliability of CLABSI quality metric data. Forty-three percent of respondents stated that such data were reliable at best 50% of the time. Notably, 10% of respondents indicated that CLABSI quality metric data were rarely or never reliable. There was no association between perceived reliability of quality metric data and survey performance (P = 0.87).
DISCUSSION
This Twitter-based study found wide variation in clinician interpretation of CLABSI quality data, with low overall performance. In particular, comprehension and interpretation of risk-adjusted data were substantially worse than unadjusted data. Although doctors performed somewhat better than nurses and other respondents, those involved in quality improvement initiatives performed no better than respondents who were not. Collectively, these findings suggest clinicians may not reliably comprehend quality metric data, potentially affecting their ability to utilize audit and feedback data. These results may have important implications for policy efforts that seek to leverage quality metric data to improve patient safety.
An integral component of many contemporary quality improvement initiatives is audit and feedback through metrics.6 Unfortunately, formal audit and feedback, along with other similar methods that benchmark data, have not consistently improved outcomes.24–27 A recent meta-analysis noted that audit and feedback interventions are not becoming more efficacious over time; the study further asserted that “new trials have provided little new knowledge regarding key effect modifiers.”9 Our findings suggest that numeracy and comprehension of quality metrics may be important candidate effect modifiers not previously considered. Simply put: we hypothesize that without intrinsic comprehension of data, impetus or insight to change practice might be diminished. In other words, clinicians may be more apt to act on insights they themselves derive from the data than when they are simply told what the data “mean.”
The present study further demonstrates that clinicians do not understand risk-adjusted data as well as raw data. Risk-adjustment has long been recognized as necessary to compare outcomes among hospitals.28,29 However, risk-adjustment is complex and, by its nature, difficult to understand. Although efforts have focused on improving the statistical reliability of quality metrics, this may represent but one half of the equation. Numeracy and interpretation of the data by decision makers are potentially equally important to effecting change. Because clinicians seem to have difficulty understanding risk-adjusted data, this deficit may be of growing importance as our risk-adjustment techniques become more sophisticated.
We note that clinicians expressed concerns regarding the reliability of quality metric feedback. These findings corroborate recent research that has reported reservations from hospital leaders concerning quality data.30,31 However, as shown in the context of patients and healthcare decisions, the aversion associated with quality metrics may be related to incomplete understanding of the data.32 Whether perceptions of unreliability drive lack of understanding or, conversely, whether lack of understanding fuels perceived unreliability is an important question that requires further study.
This study has several strengths. First, we used rigorous survey development techniques to evaluate the understudied issue of quality metric numeracy. Second, our sample size was sufficient to show statistically significant differences in numeracy and comprehension of CLABSI quality metric data. Third, we leveraged social media to rapidly acquire this sample. Finally, our results provided new insights that may have important implications in the area of quality metrics.
There were also limitations to our study. First, the Twitter-derived sample precludes the calculation of a response rate and may not be representative of individuals engaged in CLABSI prevention. However, respondents were solicited from the Twitter-followers of 2 health services researchers (TJI, VC) who are actively engaged in scholarly activities pertaining to critically ill patients and hospital-acquired complications. Thus, our sample likely represents a highly motivated subset that engages in these topics on a regular basis—potentially making them more numerate than average clinicians. Second, we did not ask whether the respondents had previously seen CLABSI data specifically, so we cannot stratify by exposure to such data. Third, this study assessed only CLABSI quality metric data; generalizations regarding numeracy with other metrics should be made with caution. However, as many such data are presented in similar formats, we suspect our findings are applicable to similar audit-and-feedback initiatives.
The findings of this study serve as a stimulus for further inquiry. Research of this nature needs to be carried out in samples drawn from specific, policy-relevant populations (eg, infection control practitioners, bedside nurses, intensive care unit directors). Such studies should include longitudinal assessments of numeracy that attempt to mechanistically examine its impact on CLABSI prevention efforts and outcomes. The latter is an important issue as the link between numeracy and behavioral response, while plausible, cannot be assumed, particularly given the complexity of issues related to behavioral modification.33 Additionally, whether alternate presentations of quality data affect numeracy, interpretation, and performance is worthy of further testing; indeed, this has been shown to be the case in other forms of communication.34–37 Until data from larger samples are available, it may be prudent for quality improvement leaders to assess the comprehension of local clinicians regarding feedback and whether lack of adequate comprehension is a barrier to deploying quality improvement interventions.
Quality measurement is a cornerstone of patient safety as it seeks to assess and improve the care delivered at the bedside. Rigorous metric development is important; however, ensuring that decision makers understand complex quality metrics may be equally fundamental. Given the cost of examining quality, elucidating the mechanisms of numeracy and interpretation as decision makers engage with quality metric data is necessary, along with whether improved comprehension leads to behavior change. Such inquiry may provide an evidence-base to shape alterations in quality metric deployment that will ensure maximal efficacy in driving practice change.
Disclosures
This work was supported by VA HSR&D IIR-13-079 (TJI). Dr. Chopra is supported by a career development award from the Agency of Healthcare Research and Quality (1-K08-HS022835-01). The views expressed here are the authors’ own and do not necessarily represent the view of the US Government or the Department of Veterans’ Affairs. The authors report no conflicts of interest.
1. Scott RD II. The direct medical costs of healthcare-associated infections in us hospitals and the benefits of prevention. Centers for Disease Control and Prevention. Available at: http://www.cdc.gov/HAI/pdfs/hai/Scott_CostPaper.pdf. Published March 2009. Accessed November 8, 2016.
2. O’Grady NP, Alexander M, Burns LA, et al. Guidelines for the prevention of intravascular catheter-related infections. Am J Infect Control. 2011;39(4 suppl 1)::S1-S34. PubMed
3. Blot K, Bergs J, Vogelaers D, Blot S, Vandijck D. Prevention of central line-associated bloodstream infections through quality improvement interventions: a systematic review and meta-analysis. Clin Infect Dis. 2014;59(1):96-105. PubMed
4. Mermel LA. Prevention of intravascular catheter-related infections. Ann Intern Med. 2000;132(5):391-402. PubMed
5. Siempos II, Kopterides P, Tsangaris I, Dimopoulou I, Armaganidis AE. Impact of catheter-related bloodstream infections on the mortality of critically ill patients: a meta-analysis. Crit Care Med. 2009;37(7):2283-2289. PubMed
6. Casalino LP, Gans D, Weber R, et al. US physician practices spend more than $15.4 billion annually to report quality measures. Health Aff (Millwood). 2016;35(3):401-406. PubMed
7. Hysong SJ. Meta-analysis: audit and feedback features impact effectiveness on care quality. Med Care. 2009;47(3):356-363. PubMed
8. Ilgen DR, Fisher CD, Taylor MS. Consequences of individual feedback on behavior in organizations. J Appl Psychol. 1979;64:349-371.
9. Ivers NM, Grimshaw JM, Jamtvedt G, et al. Growing literature, stagnant science? Systematic review, meta-regression and cumulative analysis of audit and feedback interventions in health care. J Gen Intern Med. 2014;29(11):1534-1541. PubMed
10. Rao G. Physician numeracy: essential skills for practicing evidence-based medicine. Fam Med. 2008;40(5):354-358. PubMed
11. Wegwarth O, Schwartz LM, Woloshin S, Gaissmaier W, Gigerenzer G. Do physicians understand cancer screening statistics? A national survey of primary care physicians in the United States. Ann Intern Med. 2012;156(5):340-349. PubMed
12. Bramwell R, West H, Salmon P. Health professionals’ and service users’ interpretation of screening test results: experimental study. BMJ. 2006;333(7562):284. PubMed
13. Agoritsas T, Courvoisier DS, Combescure C, Deom M, Perneger TV. Does prevalence matter to physicians in estimating post-test probability of disease? A randomized trial. J Gen Intern Med. 2011;26(4):373-378. PubMed
14. Warren DK, Zack JE, Mayfield JL, et al. The effect of an education program on the incidence of central venous catheter-associated bloodstream infection in a medical ICU. Chest. 2004;126(5):1612-1618. PubMed
15. Rinke ML, Bundy DG, Chen AR, et al. Central line maintenance bundles and CLABSIs in ambulatory oncology patients. Pediatrics. 2013;132(5):e1403-e1412. PubMed
16. Pronovost P, Needham D, Berenholtz S, et al. An intervention to decrease catheter-related bloodstream infections in the ICU. N Engl J Med. 2006;355(26):
2725-2732. PubMed
17. Rinke ML, Chen AR, Bundy DG, et al. Implementation of a central line maintenance care bundle in hospitalized pediatric oncology patients. Pediatrics. 2012;130(4):e996-e1004. PubMed
18. Sacks GD, Diggs BS, Hadjizacharia P, Green D, Salim A, Malinoski DJ. Reducing the rate of catheter-associated bloodstream infections in a surgical intensive care unit using the Institute for Healthcare Improvement Central Line Bundle. Am J Surg. 2014;207(6):817-823. PubMed
19. Berenholtz SM, Pronovost PJ, Lipsett PA, et al. Eliminating catheter-related bloodstream infections in the intensive care unit. Crit Care Med. 2004;32(10):2014-2020. PubMed
20. Rajwan YG, Barclay PW, Lee T, Sun IF, Passaretti C, Lehmann H. Visualizing central line-associated blood stream infection (CLABSI) outcome data for decision making by health care consumers and practitioners—an evaluation study. Online J Public Health Inform. 2013;5(2):218. PubMed
21. Fagerlin A, Zikmund-Fisher BJ, Ubel PA, Jankovic A, Derry HA, Smith DM. Measuring numeracy without a math test: development of the Subjective Numeracy Scale. Med Decis Making 2007;27(5):672-680. PubMed
22. HAI progress report FAQ. 2016. Available at: http://www.cdc.gov/hai/surveillance/progress-report/faq.html. Last updated March 2, 2016. Accessed November 8, 2016.
23. Collins D. Pretesting survey instruments: an overview of cognitive methods. Qual Life Res. 2003;12(3):229-238. PubMed
24. Ivers N, Jamtvedt G, Flottorp S, et al. Audit and feedback: effects on professional practice and healthcare outcomes. Cochrane Database Syst Rev. 2012;(6):CD000259. PubMed
25. Chatterjee P, Joynt KE. Do cardiology quality measures actually improve patient outcomes? J Am Heart Assoc. 2014;3(1):e000404. PubMed
26. Joynt KE, Blumenthal DM, Orav EJ, Resnic FS, Jha AK. Association of public reporting for percutaneous coronary intervention with utilization and outcomes among Medicare beneficiaries with acute myocardial infarction. JAMA. 2012;308(14):1460-1468. PubMed
27. Ryan AM, Nallamothu BK, Dimick JB. Medicare’s public reporting initiative on hospital quality had modest or no impact on mortality from three key conditions. Health Aff (Millwood). 2012;31(3):585-592. PubMed
28. Thomas JW. Risk adjustment for measuring health care outcomes, 3rd edition. Int J Qual Health Care. 2004;16(2):181-182.
29. Iezzoni LI. Risk Adjustment for Measuring Health Care Outcomes. Ann Arbor, Michigan: Health Administration Press; 1994.
30. Goff SL, Lagu T, Pekow PS, et al. A qualitative analysis of hospital leaders’ opinions about publicly reported measures of health care quality. Jt Comm J Qual Patient Saf. 2015;41(4):169-176. PubMed
31. Lindenauer PK, Lagu T, Ross JS, et al. Attitudes of hospital leaders toward publicly reported measures of health care quality. JAMA Intern Med. 2014;174(12):
1904-1911. PubMed
32. Peters E, Hibbard J, Slovic P, Dieckmann N. Numeracy skill and the communication, comprehension, and use of risk-benefit information. Health Aff (Millwood). 2007;26(3):741-748. PubMed
33. Montano DE, Kasprzyk D. Theory of reasoned action, theory of planned behavior, and the integrated behavioral model. In: Glanz K, Rimer BK, Viswanath K, eds. Health Behavior and Health Education: Theory, Research and Practice. 5th ed. San Francisco, CA: Jossey-Bass; 2015:95–124.
34. Hamstra DA, Johnson SB, Daignault S, et al. The impact of numeracy on verbatim knowledge of the longitudinal risk for prostate cancer recurrence following radiation therapy. Med Decis Making. 2015;35(1):27-36. PubMed
35. Hawley ST, Zikmund-Fisher B, Ubel P, Jancovic A, Lucas T, Fagerlin A. The impact of the format of graphical presentation on health-related knowledge and treatment choices. Patient Educ Couns. 2008;73(3):448-455. PubMed
36. Zikmund-Fisher BJ, Witteman HO, Dickson M, et al. Blocks, ovals, or people? Icon type affects risk perceptions and recall of pictographs. Med Decis Making. 2014;34(4):443-453. PubMed
37. Korfage IJ, Fuhrel-Forbis A, Ubel PA, et al. Informed choice about breast cancer prevention: randomized controlled trial of an online decision aid intervention. Breast Cancer Res. 2013;15(5):R74. PubMed
© 2017 Society of Hospital Medicine
Interhospital Transfer Handover Tool
The transfer of inpatients between hospitals for specialized services is common, affecting nearly 10% of all Medicare admissions1 and 4.5% of all critical care hospitalizations.2 At tertiary referral centers, 49% of medical intensive care unit (ICU) admissions are transferred from another hospital.3
Transfer patients have longer length of stay (LOS) than patients admitted directly from the emergency department or clinic. Among patients initially admitted to an ICU, transfer patients spend 1 day to 2.2 more days in the ICU and an additional 2 days to 4 more days total at the receiving hospital.4,5 Furthermore, transfer patients have higher mortality than nontransferred patients by 4% to 8%.3-5 Even after adjustment for case mix and comorbid disease, interhospital transfer is an independent predictor of both ICU death and LOS.6,7 As a result, interhospital transfer has been associated with a $9600 increase (on average) in hospital costs.4
Despite evidence detailing patient handovers as a key time when poor communication can lead to delays in care and significant patient risk, 8-10 most studies have focused on hospital discharge or change of shift, and scant effort has been dedicated to improving the interhospital handover. The process of interhospital transfer is often prolonged and discontinuous,11 commonly including delays of more than 24 hours between initiation and completion. This frequently precludes direct physician-to-physician contact at the time of transfer, and physicians rely on the discharge/transfer summary.12 Yet discharge summaries are frequently absent or incomplete,13 and often lack information for high-risk treatments such as systemic anticoagulation.14 The traditional reliance on discharge summaries for handover communication requires interpretation of unstandardized documentation and increases the risk for miscommunication, delays, and error.
To improve communication, we developed a 1-page handover tool for all inbound adult interhospital transfers to our academic medical center. We sought to determine whether implementation of this standardized handover tool improved the timeliness of initial care, LOS, and mortality among interhospital transfer patients.
METHODS
Study Design, Setting, Population
We conducted a retrospective cohort study of patients transferred into Vanderbilt University Hospital (VUH), an adult 626-bed quaternary care academic medical center in Nashville, Tennessee. The Vanderbilt University Institutional Review Board approved this study.
Population
We selected for inclusion all patients age 18 or older who were transferred into VUH between July 1, 2009 and December 31, 2010. We excluded patients whose transfer was routed outside the main VUH Patient Flow Center as well as patients who did not arrive alive at VUH. We also excluded patients transferred to the emergency department and patients admitted to obstetrics, burn, or trauma services, because these admitting services did not initially use the handover tool. Patients were followed for the duration of their hospitalization at VUH.
Intervention
The 1-page handover tool was developed with multidisciplinary physician input from house staff; medical directors from intensive care, neurology, and surgery; and the chief of staff. The tool was structured on the SBAR model (Situation, Background, Assessment, and Recommendation).15 Fields on the handover tool were limited to those deemed critical for immediate patient care and designed for 1 tool to be used for both ICU and non-ICU transfers. Fields included primary diagnosis; allergies; use and last dose of anticoagulants, vasopressors, sedative/paralytics, and antibiotics; isolation needs; indwelling devices; recent operations/procedures; code status; emergency contact information; problem list; active medication list; vital signs; pertinent exam; imaging; lab findings; and overall reason for transfer.
The handover tool was completed by the physician at the transferring hospital, faxed to VUH, and immediately scanned into the electronic record, allowing the receiving physicians to review information before patient arrival. Use of the tool was piloted first with 2 referring hospitals in April 2010 and universally recommended but not compulsory for all adult patients routed through the main VUH Patient Flow Center beginning July 1, 2010. Immediately before full implementation, the chief of staff sent letters to leadership of the 40 highest volume referral hospitals, highlighting the institutional goal of improving hand-off communication, framing completion of the tool as a step in the transfer acceptance process, and providing contact information for questions, feedback, or concerns. To ensure the tool was a standard part of the transfer process, the VUH Patient Flow Center maintained the responsibility of faxing the form to the outside facility and monitoring its receipt. The tool was processed in the same manner as other faxed patient records and treated as a part of the formal medical record to meet all standards for the Health Insurance Portability and Accountability Act (HIPAA) and medicolegal compliance. The medical center also has a separate cardiac transfer center where the handover tool was not implemented owing to its specialized workflow.
Data Source
The VUH Patient Flow Center maintains a database of all patients for whom transfer to VUH is requested, including information on the requesting hospital and the duration of transfer process. Outcome data and patient characteristics were extracted from the Enterprise Data Warehouse. Data related to comorbid illness were extracted from the Perioperative Data Warehouse, an IRB-approved data registry.
Measures
We evaluated 3 outcomes. First, we defined 2 measures of the timeliness of initial care, the time from arrival at VUH until entry of an admission order, and the time from arrival until entry of the first antibiotic order. Only antibiotics ordered within the first 36 hours of admission were included. Second, we evaluated the total LOS after transfer to VUH and the ICU LOS for patients transferred into an ICU setting. Finally, we examined in-hospital mortality at VUH. These metrics were chosen for their broad applicability across patient groups and feasibility of data capture. Length of stay and mortality also represent final common pathways for avoidance of complications. Specific patient safety indicators and complications were not abstracted due to their low frequency and burden of data collection. Due to system changes in our cost accounting systems, we were not able to obtain cost data pre- and postimplementation that provided meaningful comparisons.
Patient covariates included age, gender, payer, and Elixhauser comorbidity index as modified by van Walraven,16 calculated based on the admission of interest and the previous 365 days. We also examined admission characteristics including location (ICU vs. non-ICU), admitting service (medicine, surgery, neurology, or gynecology), and shift of arrival (day, 7:00 am to 6:00 pm; or night, 6:00 pm to 7:00 pm). Finally, we examined duration of the transfer process (ie, time between transfer request and arrival at VUH) and the volume of the transferring hospital (high was defined as 3 or more transfers to VUH per year).
Statistical analysis
Patient characteristics before and after implementation of the handover tool were compared using Pearson’s chi-square test and Fisher exact test for categorical variables and using Student t test and the Wilcoxon rank sum test for continuous variables. The outcome variables of time to admission order entry, time to antibiotic order entry, LOS, ICU LOS, and in-hospital mortality were compared between the before- and after-intervention time periods, using the Wilcoxon rank sum test for continuous outcomes and Pearson’s chi-square test for in-hospital mortality.
To account for temporal trends, the effect of the handover tool on time-to-admission order entry, hospital LOS, and mortality was measured using an interrupted time-series design with segmented linear regression analysis.17 The study period was divided into 2-week intervals, with 26 time periods in the pre-intervention period and 13 time periods in the postintervention period. Expected rates for the postintervention time periods were projected from the pre-intervention data using a linear regression model. To assess the observed effect of the intervention, rates from the postintervention periods were compared with these projected rates, assuming continuation of the trend. Restricted cubic spline models were also fit for time-to-admission order and hospital LOS; however, the F-statistics for these models were not significant, suggesting the linear regression provided a more appropriate model.
To further account for potential confounding of outcomes by comorbid disease and other patient factors, multivariate linear regression models assessed change in timeliness and LOS with implementation of the intervention. A multivariate logistic regression model was used to assess change in mortality with intervention implementation. All models adjusted for age, gender, payer, comorbid illness, admitting team, shift of arrival (day vs. night), transfer duration, volume of transferring hospital, and ICU status. Outcomes were further adjusted for calendar month to account for temporal trends in house staff efficiency. Because the cardiac transfer center did not adopt the use of the transfer tool, we evaluated adjusted in-hospital mortality for these patients as a concurrent control group.
All statistical testing was 2-sided at a significance level of 0.05. All analyses were conducted using STATA 12.1 statistical software (StataCorp LP, College Station, Texas).
RESULTS
Of 10,325 patients for whom transfer to VUH was requested during the study period, 1715 met inclusion criteria, including 798 patients (46.5%) initially admitted to an ICU setting. Specific patient exclusions are detailed in the Supplemental Figure; the majority of exclusions were due to patients being transferred directly to the emergency department setting. Table 1 summarizes patient characteristics before and after implementation of the handover tool. The median age was 57 years, with 48.6% male patients. Accepting services included medicine (56%), surgery (34%), neurology (9%), and gynecology (1%). The median duration of transfer was 8 hours, and the majority (93%) of patients came from higher volume transferring hospitals. Most (65%) of patients were admitted during night shift. The median modified Elixhauser comorbidity index was 11 (range of possible scores, -19 to 89). A slightly higher proportion of patients admitted postimplementation of the handover tool came from higher volume transferring hospitals; otherwise, there were no significant differences between the pre- and postintervention groups.

Vanderbilt University Hospital received transfers from more than 350 unique facilities in more than 25 U.S. states during the overall study period. During the postintervention period, adherence to the handover process was excellent, with more than 85% of patients having a completed handover tool available in their medical record at the time of transfer. The remaining 15% had either incomplete forms or no form.
Timeliness of Initial Care
There was no change in either the median time-to-admission order entry after implementation (47 vs. 45 minutes, unadjusted P = 0.36) or time to antibiotic order entry (199 vs. 202 minutes; unadjusted P = 0.81; Table 2).
In the time-series analysis, the pre-intervention period did not have a significant temporal trend in median time-to-admission order entry (ß-coefficient = -0.27; 95% confidence interval [CI] -0.85 to 0.31; R2 = 0.04; P = 0.34; Figure 1A). The postintervention period showed a trend toward a reduction in median time-to-admission order entry (ß-coefficient = -1.39; 95% CI -2.92 to 0.15; R2 = 0.27; P = 0.07). There was no significant difference between the actual time-to-admission order entry in the postintervention period when compared to the projected rates from the pre-intervention period (P = 0.18).
After multivariate adjustment, the postintervention time period was not associated with any significant change in the median time-to-admission order entry (P = 0.94, R2 = 0.09) nor time-to-antibiotic order entry (P = 0.91; R2 = 0.08; Table 2).

Length of Stay
Hospital LOS demonstrated a nonstatistically significant decline after implementation of the handover tool from 6.47 days to 5.81 days (unadjusted P = 0.18; Table 2). There was no significant change in ICU LOS postintervention (4.34 days to 4.55 days; P = 0.38).
In time series analysis, hospital LOS did not have a significant temporal trend in either the pre-intervention period (ß-coefficient = 0.00094; 95% CI, -0.07 to 0.07; R2 = 0.00; P = 0.98) or the postintervention period (ß-coefficient = 0.09; 95% CI, -0.07 to 0.25; R2 = 0.13; P = 0.23; Figure 1B). Similarly, there was no significant difference between the actual and projected hospital LOS after implementation of the handover tool (P = 0.31).
After multivariate adjustment, the postintervention time period was associated with a trend toward reduction in overall LOS (P = 0.06; R2 = 0.07) but no significant change in ICU LOS (P = 0.99; R2 = 0.09).

Mortality
In-hospital mortality declined significantly from 12.0% in the pre-intervention period to 8.9% in the postintervention period (P = 0.04; Table 2). In time-series analysis, mortality did not have a significant trend in the pre-intervention period (ß-coefficient = 0.00017, 95% CI, -0.0020 to 0.0024; P = 0.878) and had a trend toward reduction in the postintervention period (ß-coefficient = -0.0032; 95% CI, -0.0091 to 0.0027; P = 0.255; Figure 1C) but did not reach statistical significance due to relatively small numbers of deaths in each individual time period.
After multivariate adjustment, the postintervention period was associated with overall lower odds of mortality among transfer patients when compared with the pre-intervention period (adjusted OR 0.68; 95% CI, 0.47 – 0.99; R2 = 0.21; P = 0.04; Figure 2). Among the concurrent control group of patients routed through the cardiac transfer center, there was no significant change in mortality between the pre- and postintervention periods (adjusted OR 1.31; 95% CI, 0.88 – 1.93; R2 = 0.28; P = 0.18).

DISCUSSION
We developed a simple 1-page handover tool for interhospital transfer patients and aimed to improve timeliness, efficiency, and outcomes of care at the receiving hospital. Implementation of the handover tool was feasible and well accepted by transferring physicians despite a geographically large and diverse transfer network. Although implementation did not substantially improve measures of the timeliness of initial care among transfer patients, we noted a nonsignificant trend toward reduced LOS postintervention.
We observed a substantial and statistically significant reduction in mortality among transfer patients after implementation of the handover tool that persisted after controlling for time trends, comorbid illness, and several other patient factors. This effect was not seen in a concurrent control group of cardiac transfer patients for whom the handover tool was not implemented. Standardizing communication regarding high-risk clinical care processes may be responsible for the observed mortality reduction, similar to improvements seen in other small pilot studies.18 We acknowledge that the magnitude of the improvement in mortality is more than might be expected from the handover tool alone and could be due to chance.
In this initial evaluation, it was not feasible to determine whether information provided in the handover tool helped avert specific complications that could affect mortality, such as complications related to the use of ventilators, high-risk medications, or indwelling devices. Assessment of additional patient safety indices such as code events, unplanned ICU transfers, and medication errors could also help clarify the effect of the handover tool on patient-safety outcomes, and future work should include these metrics as well. Alternately, the improvement in mortality may result from other unmeasured processes that occurred concurrently and verification of this finding should be completed in other settings.
CONCLUSION
More work is needed to determine suitable process and outcome measures for interhospital transfers. Most literature has focused on cost and LOS at the exclusion of more proximal measures of initial care.3-7 The Institute of Medicine has identified timeliness as 1 of the 6 aims for care delivery redesign,19 yet standardized timeliness outcomes do not exist across broad inpatient populations. We chose to monitor the time-to-admission order entry and time-to-antibiotic order entry as 2 indicators of timeliness that would be applicable to a variety of patients. The lack of change in these selected measures should prompt examination for other measures of efficiency, including those that affect nontransferred patients. It is possible that nontransferred patients cared for by the same physician also benefit from fewer delays or disruptions and experience increased efficiency of care if transfer patient communication is improved. Further work is necessary to understand whether other measures of timely initial patient care may be more suitable.
The use of a time-series design to account for temporal trends adds substantial rigor to this study, since the majority of these patients were cared for by house staff whose experience and efficiency vary throughout the academic year. Furthermore, subsequent multivariate analysis demonstrated consistent findings after adjustment for comorbid illness and several other hospital and patient-level confounders.
This study has several limitations. The primary limitation is its nonrandomized design. Patient characteristics were stable across multiple variables before and after implementation, but it is possible that another confounding factor was responsible for observed improvements. Likewise, we collected data for only 6 rather than 12 months during the postintervention time period, which limited our sample size and statistical power. This was chosen because a significant restructuring of resident duty hours occurred in spring 2011 that had the potential to affect all measures studied.20,21 Finally, we did not collect data on accuracy of the information provided in the handover tool or end-user utilization and were unable to account for effects of these.
Since implementation in 2010, this process for interhospital transfers at VUH remains the same, although the volume of incoming transfers has significantly increased. Electronic handover tools with similar structure and content have since been adopted for patients being transferred to the emergency department or directly admitted from clinic. As VUH moves in the coming years from a locally developed electronic medical record to a national vendor, there will be an opportunity to transform this tool into an electronic template that will easily share data between institutions and further enhance communication.
Interhospital transfer patients represent a high-risk population whose unique handover needs have not been adequately measured or addressed. Our investigation demonstrated that a standardized handover aid can be implemented across a broad transfer network and may contribute to reductions in LOS and mortality. Further study is warranted to confirm these findings and assess the effect on other clinical outcomes.
Disclosures
This material is based upon work supported by the Office of Academic Affiliations, Department of Veterans Affairs, VA National Quality Scholars Program, and was made possible by the use of the facilities at VA Tennessee Valley Healthcare System, Nashville, Tennessee. The views expressed in this article are those of the authors and do not necessarily reflect the position or policy of the Department of Veterans Affairs or the US government. Additionally, this publication was supported in part by CTSA award No. UL1TR000445 from the National Center for Advancing Translational Sciences. Its contents are solely the responsibility of the authors and do not necessarily represent official views of the National Center for Advancing Translational Sciences or the National Institutes of Health.
1. Coleman EA, Min SJ, Chomiak A, Kramer AM. Posthospital care transitions: patterns, complications, and risk identification. Health Serv Res. 2004;39:1449-1465. PubMed
2. Iwashyna TJ, Christie JD, Moody J, Kahn JM, Asch DA. The structure of critical care transfer networks. Med Care. 2009;47:787-793. PubMed
3. Durairaj L, Will JG, Torner JC, Doebbeling BN. Prognostic factors for mortality following interhospital transfers to the medical intensive care unit of a tertiary referral center. Crit Care Med. 2003;31:1981-1986. PubMed
4. Golestanian E, Scruggs JE, Gangnon RE, Mak RP, Wood KE. Effect of interhospital transfer on resource utilization and outcomes at a tertiary care referral center. Crit Care Med. 2007;35:1470-1476. PubMed
5. Flabouris A, Hart GK, George C. Outcomes of patients admitted to tertiary intensive care units after interhospital transfer: comparison with patients admitted from emergency departments. Crit Care Resusc. 2008;10:97-105. PubMed
6. Combes A, Luyt CE, Trouillet JL, Chastre J, Gibert C. Adverse effect on a referral intensive care unit’s performance of accepting patients transferred from another intensive care unit. Crit Care Med. 2005;33:705-710. PubMed
7. Rosenberg AL, Hofer TP, Strachan C, Watts CM, Hayward RA. Accepting critically ill transfer patients: adverse effect on a referral center’s outcome and benchmark measures. A Intern Med. 2003;138:882-890. PubMed
8. Horwitz LI, Moin T, Krumholz HM, Wang L, Bradley EH. Consequences of inadequate sign-out for patient care. Arch Intern Med. 2008;168:1755-1760. PubMed
9. Starmer AJ, Sectish TC, Simon DW, et al. Rates of medical errors and preventable adverse events among hospitalized children following implementation of a resident handoff bundle. JAMA. 2013;310:2262-2270. PubMed
10. Arora VM, Manjarrez E, Dressler DD, Basaviah P, Halasyamani L, Kripalani S. Hospitalist handoffs: a systematic review and task force recommendations. J Hosp Med. 2009;4:433-440. PubMed
11. Bosk EA, Veinot T, Iwashyna TJ. Which patients and where: a qualitative study of patient transfers from community hospitals. Med Care. 2011;49:592-598. PubMed
12. Herrigel DJ, Carroll M, Fanning C, Steinberg MB, Parikh A, Usher M. Interhospital transfer handoff practices among US tertiary care centers: a descriptive survey. J Hosp Med. 2016;11:413-417. PubMed
13. Kripalani S, LeFevre F, Phillips CO, Williams MV, Basaviah P, Baker DW. Deficits in communication and information transfer between hospital-based and primary care physicians. JAMA. 2007;297:831-841. PubMed
14. Gandara E, Moniz TT, Ungar J, et al. Deficits in discharge documentation in patients transferred to rehabilitation facilities on anticoagulation: results of a systemwide evaluation. Jt Comm J Qual Patient Saf. 2008;34:460-463. PubMed
15. Haig KM, Sutton S, Whittington J. SBAR: a shared mental model for improving communication between clinicians. Jt Comm J Qual Patient Saf. 2006;32:167-175. PubMed
16. van Walraven C, Austin PC, Jennings A, Quan H, Forster AJ. A modification of the Elixhauser comorbidity measures into a point system for hospital death using administrative data. Med Care. 2009;47:626-633. PubMed
17. Wagner AK, Soumerai SB, Zhang F, Ross-Degnan D. Segmented regression analysis of interrupted time series studies in medication use research. J Clin Pharm Ther. 2002;27:299-309. PubMed
18. Malpass HC, Enfield KB, Keim-Malpass J, Verghese GM. The interhospital medical intensive care unit transfer instrument facilitates early implementation of critical therapies and is associated with fewer emergent procedures upon arrival. J Intensive Care Med. 2015;30:351-357. PubMed
19. National Academy of Sciences. Institute of Medicine. Crossing the Quality Chasm: A New Health System for the 21st Century. March 2005:1–360. Washington, DC. PubMed
20. Theobald CN, Stover DG, Choma NN, et al. The effect of reducing maximum shift lengths to 16 hours on internal medicine interns’ educational opportunities. Acad Med. 2013;88:512-518. PubMed
21. Choma NN, Vasilevskis EE, Sponsler KC, Hathaway J, Kripalani S. Effect of the ACGME 16-hour rule on efficiency and quality of care: duty hours 2.0. JAMA Intern Med. 2013;173:819-821. PubMed
The transfer of inpatients between hospitals for specialized services is common, affecting nearly 10% of all Medicare admissions1 and 4.5% of all critical care hospitalizations.2 At tertiary referral centers, 49% of medical intensive care unit (ICU) admissions are transferred from another hospital.3
Transfer patients have longer length of stay (LOS) than patients admitted directly from the emergency department or clinic. Among patients initially admitted to an ICU, transfer patients spend 1 day to 2.2 more days in the ICU and an additional 2 days to 4 more days total at the receiving hospital.4,5 Furthermore, transfer patients have higher mortality than nontransferred patients by 4% to 8%.3-5 Even after adjustment for case mix and comorbid disease, interhospital transfer is an independent predictor of both ICU death and LOS.6,7 As a result, interhospital transfer has been associated with a $9600 increase (on average) in hospital costs.4
Despite evidence detailing patient handovers as a key time when poor communication can lead to delays in care and significant patient risk, 8-10 most studies have focused on hospital discharge or change of shift, and scant effort has been dedicated to improving the interhospital handover. The process of interhospital transfer is often prolonged and discontinuous,11 commonly including delays of more than 24 hours between initiation and completion. This frequently precludes direct physician-to-physician contact at the time of transfer, and physicians rely on the discharge/transfer summary.12 Yet discharge summaries are frequently absent or incomplete,13 and often lack information for high-risk treatments such as systemic anticoagulation.14 The traditional reliance on discharge summaries for handover communication requires interpretation of unstandardized documentation and increases the risk for miscommunication, delays, and error.
To improve communication, we developed a 1-page handover tool for all inbound adult interhospital transfers to our academic medical center. We sought to determine whether implementation of this standardized handover tool improved the timeliness of initial care, LOS, and mortality among interhospital transfer patients.
METHODS
Study Design, Setting, Population
We conducted a retrospective cohort study of patients transferred into Vanderbilt University Hospital (VUH), an adult 626-bed quaternary care academic medical center in Nashville, Tennessee. The Vanderbilt University Institutional Review Board approved this study.
Population
We selected for inclusion all patients age 18 or older who were transferred into VUH between July 1, 2009 and December 31, 2010. We excluded patients whose transfer was routed outside the main VUH Patient Flow Center as well as patients who did not arrive alive at VUH. We also excluded patients transferred to the emergency department and patients admitted to obstetrics, burn, or trauma services, because these admitting services did not initially use the handover tool. Patients were followed for the duration of their hospitalization at VUH.
Intervention
The 1-page handover tool was developed with multidisciplinary physician input from house staff; medical directors from intensive care, neurology, and surgery; and the chief of staff. The tool was structured on the SBAR model (Situation, Background, Assessment, and Recommendation).15 Fields on the handover tool were limited to those deemed critical for immediate patient care and designed for 1 tool to be used for both ICU and non-ICU transfers. Fields included primary diagnosis; allergies; use and last dose of anticoagulants, vasopressors, sedative/paralytics, and antibiotics; isolation needs; indwelling devices; recent operations/procedures; code status; emergency contact information; problem list; active medication list; vital signs; pertinent exam; imaging; lab findings; and overall reason for transfer.
The handover tool was completed by the physician at the transferring hospital, faxed to VUH, and immediately scanned into the electronic record, allowing the receiving physicians to review information before patient arrival. Use of the tool was piloted first with 2 referring hospitals in April 2010 and universally recommended but not compulsory for all adult patients routed through the main VUH Patient Flow Center beginning July 1, 2010. Immediately before full implementation, the chief of staff sent letters to leadership of the 40 highest volume referral hospitals, highlighting the institutional goal of improving hand-off communication, framing completion of the tool as a step in the transfer acceptance process, and providing contact information for questions, feedback, or concerns. To ensure the tool was a standard part of the transfer process, the VUH Patient Flow Center maintained the responsibility of faxing the form to the outside facility and monitoring its receipt. The tool was processed in the same manner as other faxed patient records and treated as a part of the formal medical record to meet all standards for the Health Insurance Portability and Accountability Act (HIPAA) and medicolegal compliance. The medical center also has a separate cardiac transfer center where the handover tool was not implemented owing to its specialized workflow.
Data Source
The VUH Patient Flow Center maintains a database of all patients for whom transfer to VUH is requested, including information on the requesting hospital and the duration of transfer process. Outcome data and patient characteristics were extracted from the Enterprise Data Warehouse. Data related to comorbid illness were extracted from the Perioperative Data Warehouse, an IRB-approved data registry.
Measures
We evaluated 3 outcomes. First, we defined 2 measures of the timeliness of initial care, the time from arrival at VUH until entry of an admission order, and the time from arrival until entry of the first antibiotic order. Only antibiotics ordered within the first 36 hours of admission were included. Second, we evaluated the total LOS after transfer to VUH and the ICU LOS for patients transferred into an ICU setting. Finally, we examined in-hospital mortality at VUH. These metrics were chosen for their broad applicability across patient groups and feasibility of data capture. Length of stay and mortality also represent final common pathways for avoidance of complications. Specific patient safety indicators and complications were not abstracted due to their low frequency and burden of data collection. Due to system changes in our cost accounting systems, we were not able to obtain cost data pre- and postimplementation that provided meaningful comparisons.
Patient covariates included age, gender, payer, and Elixhauser comorbidity index as modified by van Walraven,16 calculated based on the admission of interest and the previous 365 days. We also examined admission characteristics including location (ICU vs. non-ICU), admitting service (medicine, surgery, neurology, or gynecology), and shift of arrival (day, 7:00 am to 6:00 pm; or night, 6:00 pm to 7:00 pm). Finally, we examined duration of the transfer process (ie, time between transfer request and arrival at VUH) and the volume of the transferring hospital (high was defined as 3 or more transfers to VUH per year).
Statistical analysis
Patient characteristics before and after implementation of the handover tool were compared using Pearson’s chi-square test and Fisher exact test for categorical variables and using Student t test and the Wilcoxon rank sum test for continuous variables. The outcome variables of time to admission order entry, time to antibiotic order entry, LOS, ICU LOS, and in-hospital mortality were compared between the before- and after-intervention time periods, using the Wilcoxon rank sum test for continuous outcomes and Pearson’s chi-square test for in-hospital mortality.
To account for temporal trends, the effect of the handover tool on time-to-admission order entry, hospital LOS, and mortality was measured using an interrupted time-series design with segmented linear regression analysis.17 The study period was divided into 2-week intervals, with 26 time periods in the pre-intervention period and 13 time periods in the postintervention period. Expected rates for the postintervention time periods were projected from the pre-intervention data using a linear regression model. To assess the observed effect of the intervention, rates from the postintervention periods were compared with these projected rates, assuming continuation of the trend. Restricted cubic spline models were also fit for time-to-admission order and hospital LOS; however, the F-statistics for these models were not significant, suggesting the linear regression provided a more appropriate model.
To further account for potential confounding of outcomes by comorbid disease and other patient factors, multivariate linear regression models assessed change in timeliness and LOS with implementation of the intervention. A multivariate logistic regression model was used to assess change in mortality with intervention implementation. All models adjusted for age, gender, payer, comorbid illness, admitting team, shift of arrival (day vs. night), transfer duration, volume of transferring hospital, and ICU status. Outcomes were further adjusted for calendar month to account for temporal trends in house staff efficiency. Because the cardiac transfer center did not adopt the use of the transfer tool, we evaluated adjusted in-hospital mortality for these patients as a concurrent control group.
All statistical testing was 2-sided at a significance level of 0.05. All analyses were conducted using STATA 12.1 statistical software (StataCorp LP, College Station, Texas).
RESULTS
Of 10,325 patients for whom transfer to VUH was requested during the study period, 1715 met inclusion criteria, including 798 patients (46.5%) initially admitted to an ICU setting. Specific patient exclusions are detailed in the Supplemental Figure; the majority of exclusions were due to patients being transferred directly to the emergency department setting. Table 1 summarizes patient characteristics before and after implementation of the handover tool. The median age was 57 years, with 48.6% male patients. Accepting services included medicine (56%), surgery (34%), neurology (9%), and gynecology (1%). The median duration of transfer was 8 hours, and the majority (93%) of patients came from higher volume transferring hospitals. Most (65%) of patients were admitted during night shift. The median modified Elixhauser comorbidity index was 11 (range of possible scores, -19 to 89). A slightly higher proportion of patients admitted postimplementation of the handover tool came from higher volume transferring hospitals; otherwise, there were no significant differences between the pre- and postintervention groups.
Vanderbilt University Hospital received transfers from more than 350 unique facilities in more than 25 U.S. states during the overall study period. During the postintervention period, adherence to the handover process was excellent, with more than 85% of patients having a completed handover tool available in their medical record at the time of transfer. The remaining 15% had either incomplete forms or no form.
Timeliness of Initial Care
There was no change in either the median time-to-admission order entry after implementation (47 vs. 45 minutes, unadjusted P = 0.36) or time to antibiotic order entry (199 vs. 202 minutes; unadjusted P = 0.81; Table 2).
In the time-series analysis, the pre-intervention period did not have a significant temporal trend in median time-to-admission order entry (ß-coefficient = -0.27; 95% confidence interval [CI] -0.85 to 0.31; R2 = 0.04; P = 0.34; Figure 1A). The postintervention period showed a trend toward a reduction in median time-to-admission order entry (ß-coefficient = -1.39; 95% CI -2.92 to 0.15; R2 = 0.27; P = 0.07). There was no significant difference between the actual time-to-admission order entry in the postintervention period when compared to the projected rates from the pre-intervention period (P = 0.18).
After multivariate adjustment, the postintervention time period was not associated with any significant change in the median time-to-admission order entry (P = 0.94, R2 = 0.09) nor time-to-antibiotic order entry (P = 0.91; R2 = 0.08; Table 2).
Length of Stay
Hospital LOS demonstrated a nonstatistically significant decline after implementation of the handover tool from 6.47 days to 5.81 days (unadjusted P = 0.18; Table 2). There was no significant change in ICU LOS postintervention (4.34 days to 4.55 days; P = 0.38).
In time series analysis, hospital LOS did not have a significant temporal trend in either the pre-intervention period (ß-coefficient = 0.00094; 95% CI, -0.07 to 0.07; R2 = 0.00; P = 0.98) or the postintervention period (ß-coefficient = 0.09; 95% CI, -0.07 to 0.25; R2 = 0.13; P = 0.23; Figure 1B). Similarly, there was no significant difference between the actual and projected hospital LOS after implementation of the handover tool (P = 0.31).
After multivariate adjustment, the postintervention time period was associated with a trend toward reduction in overall LOS (P = 0.06; R2 = 0.07) but no significant change in ICU LOS (P = 0.99; R2 = 0.09).
Mortality
In-hospital mortality declined significantly from 12.0% in the pre-intervention period to 8.9% in the postintervention period (P = 0.04; Table 2). In time-series analysis, mortality did not have a significant trend in the pre-intervention period (ß-coefficient = 0.00017, 95% CI, -0.0020 to 0.0024; P = 0.878) and had a trend toward reduction in the postintervention period (ß-coefficient = -0.0032; 95% CI, -0.0091 to 0.0027; P = 0.255; Figure 1C) but did not reach statistical significance due to relatively small numbers of deaths in each individual time period.
After multivariate adjustment, the postintervention period was associated with overall lower odds of mortality among transfer patients when compared with the pre-intervention period (adjusted OR 0.68; 95% CI, 0.47 – 0.99; R2 = 0.21; P = 0.04; Figure 2). Among the concurrent control group of patients routed through the cardiac transfer center, there was no significant change in mortality between the pre- and postintervention periods (adjusted OR 1.31; 95% CI, 0.88 – 1.93; R2 = 0.28; P = 0.18).
DISCUSSION
We developed a simple 1-page handover tool for interhospital transfer patients and aimed to improve timeliness, efficiency, and outcomes of care at the receiving hospital. Implementation of the handover tool was feasible and well accepted by transferring physicians despite a geographically large and diverse transfer network. Although implementation did not substantially improve measures of the timeliness of initial care among transfer patients, we noted a nonsignificant trend toward reduced LOS postintervention.
We observed a substantial and statistically significant reduction in mortality among transfer patients after implementation of the handover tool that persisted after controlling for time trends, comorbid illness, and several other patient factors. This effect was not seen in a concurrent control group of cardiac transfer patients for whom the handover tool was not implemented. Standardizing communication regarding high-risk clinical care processes may be responsible for the observed mortality reduction, similar to improvements seen in other small pilot studies.18 We acknowledge that the magnitude of the improvement in mortality is more than might be expected from the handover tool alone and could be due to chance.
In this initial evaluation, it was not feasible to determine whether information provided in the handover tool helped avert specific complications that could affect mortality, such as complications related to the use of ventilators, high-risk medications, or indwelling devices. Assessment of additional patient safety indices such as code events, unplanned ICU transfers, and medication errors could also help clarify the effect of the handover tool on patient-safety outcomes, and future work should include these metrics as well. Alternately, the improvement in mortality may result from other unmeasured processes that occurred concurrently and verification of this finding should be completed in other settings.
CONCLUSION
More work is needed to determine suitable process and outcome measures for interhospital transfers. Most literature has focused on cost and LOS at the exclusion of more proximal measures of initial care.3-7 The Institute of Medicine has identified timeliness as 1 of the 6 aims for care delivery redesign,19 yet standardized timeliness outcomes do not exist across broad inpatient populations. We chose to monitor the time-to-admission order entry and time-to-antibiotic order entry as 2 indicators of timeliness that would be applicable to a variety of patients. The lack of change in these selected measures should prompt examination for other measures of efficiency, including those that affect nontransferred patients. It is possible that nontransferred patients cared for by the same physician also benefit from fewer delays or disruptions and experience increased efficiency of care if transfer patient communication is improved. Further work is necessary to understand whether other measures of timely initial patient care may be more suitable.
The use of a time-series design to account for temporal trends adds substantial rigor to this study, since the majority of these patients were cared for by house staff whose experience and efficiency vary throughout the academic year. Furthermore, subsequent multivariate analysis demonstrated consistent findings after adjustment for comorbid illness and several other hospital and patient-level confounders.
This study has several limitations. The primary limitation is its nonrandomized design. Patient characteristics were stable across multiple variables before and after implementation, but it is possible that another confounding factor was responsible for observed improvements. Likewise, we collected data for only 6 rather than 12 months during the postintervention time period, which limited our sample size and statistical power. This was chosen because a significant restructuring of resident duty hours occurred in spring 2011 that had the potential to affect all measures studied.20,21 Finally, we did not collect data on accuracy of the information provided in the handover tool or end-user utilization and were unable to account for effects of these.
Since implementation in 2010, this process for interhospital transfers at VUH remains the same, although the volume of incoming transfers has significantly increased. Electronic handover tools with similar structure and content have since been adopted for patients being transferred to the emergency department or directly admitted from clinic. As VUH moves in the coming years from a locally developed electronic medical record to a national vendor, there will be an opportunity to transform this tool into an electronic template that will easily share data between institutions and further enhance communication.
Interhospital transfer patients represent a high-risk population whose unique handover needs have not been adequately measured or addressed. Our investigation demonstrated that a standardized handover aid can be implemented across a broad transfer network and may contribute to reductions in LOS and mortality. Further study is warranted to confirm these findings and assess the effect on other clinical outcomes.
Disclosures
This material is based upon work supported by the Office of Academic Affiliations, Department of Veterans Affairs, VA National Quality Scholars Program, and was made possible by the use of the facilities at VA Tennessee Valley Healthcare System, Nashville, Tennessee. The views expressed in this article are those of the authors and do not necessarily reflect the position or policy of the Department of Veterans Affairs or the US government. Additionally, this publication was supported in part by CTSA award No. UL1TR000445 from the National Center for Advancing Translational Sciences. Its contents are solely the responsibility of the authors and do not necessarily represent official views of the National Center for Advancing Translational Sciences or the National Institutes of Health.
1. Coleman EA, Min SJ, Chomiak A, Kramer AM. Posthospital care transitions: patterns, complications, and risk identification. Health Serv Res. 2004;39:1449-1465. PubMed
2. Iwashyna TJ, Christie JD, Moody J, Kahn JM, Asch DA. The structure of critical care transfer networks. Med Care. 2009;47:787-793. PubMed
3. Durairaj L, Will JG, Torner JC, Doebbeling BN. Prognostic factors for mortality following interhospital transfers to the medical intensive care unit of a tertiary referral center. Crit Care Med. 2003;31:1981-1986. PubMed
4. Golestanian E, Scruggs JE, Gangnon RE, Mak RP, Wood KE. Effect of interhospital transfer on resource utilization and outcomes at a tertiary care referral center. Crit Care Med. 2007;35:1470-1476. PubMed
5. Flabouris A, Hart GK, George C. Outcomes of patients admitted to tertiary intensive care units after interhospital transfer: comparison with patients admitted from emergency departments. Crit Care Resusc. 2008;10:97-105. PubMed
6. Combes A, Luyt CE, Trouillet JL, Chastre J, Gibert C. Adverse effect on a referral intensive care unit’s performance of accepting patients transferred from another intensive care unit. Crit Care Med. 2005;33:705-710. PubMed
7. Rosenberg AL, Hofer TP, Strachan C, Watts CM, Hayward RA. Accepting critically ill transfer patients: adverse effect on a referral center’s outcome and benchmark measures. A Intern Med. 2003;138:882-890. PubMed
8. Horwitz LI, Moin T, Krumholz HM, Wang L, Bradley EH. Consequences of inadequate sign-out for patient care. Arch Intern Med. 2008;168:1755-1760. PubMed
9. Starmer AJ, Sectish TC, Simon DW, et al. Rates of medical errors and preventable adverse events among hospitalized children following implementation of a resident handoff bundle. JAMA. 2013;310:2262-2270. PubMed
10. Arora VM, Manjarrez E, Dressler DD, Basaviah P, Halasyamani L, Kripalani S. Hospitalist handoffs: a systematic review and task force recommendations. J Hosp Med. 2009;4:433-440. PubMed
11. Bosk EA, Veinot T, Iwashyna TJ. Which patients and where: a qualitative study of patient transfers from community hospitals. Med Care. 2011;49:592-598. PubMed
12. Herrigel DJ, Carroll M, Fanning C, Steinberg MB, Parikh A, Usher M. Interhospital transfer handoff practices among US tertiary care centers: a descriptive survey. J Hosp Med. 2016;11:413-417. PubMed
13. Kripalani S, LeFevre F, Phillips CO, Williams MV, Basaviah P, Baker DW. Deficits in communication and information transfer between hospital-based and primary care physicians. JAMA. 2007;297:831-841. PubMed
14. Gandara E, Moniz TT, Ungar J, et al. Deficits in discharge documentation in patients transferred to rehabilitation facilities on anticoagulation: results of a systemwide evaluation. Jt Comm J Qual Patient Saf. 2008;34:460-463. PubMed
15. Haig KM, Sutton S, Whittington J. SBAR: a shared mental model for improving communication between clinicians. Jt Comm J Qual Patient Saf. 2006;32:167-175. PubMed
16. van Walraven C, Austin PC, Jennings A, Quan H, Forster AJ. A modification of the Elixhauser comorbidity measures into a point system for hospital death using administrative data. Med Care. 2009;47:626-633. PubMed
17. Wagner AK, Soumerai SB, Zhang F, Ross-Degnan D. Segmented regression analysis of interrupted time series studies in medication use research. J Clin Pharm Ther. 2002;27:299-309. PubMed
18. Malpass HC, Enfield KB, Keim-Malpass J, Verghese GM. The interhospital medical intensive care unit transfer instrument facilitates early implementation of critical therapies and is associated with fewer emergent procedures upon arrival. J Intensive Care Med. 2015;30:351-357. PubMed
19. National Academy of Sciences. Institute of Medicine. Crossing the Quality Chasm: A New Health System for the 21st Century. March 2005:1–360. Washington, DC. PubMed
20. Theobald CN, Stover DG, Choma NN, et al. The effect of reducing maximum shift lengths to 16 hours on internal medicine interns’ educational opportunities. Acad Med. 2013;88:512-518. PubMed
21. Choma NN, Vasilevskis EE, Sponsler KC, Hathaway J, Kripalani S. Effect of the ACGME 16-hour rule on efficiency and quality of care: duty hours 2.0. JAMA Intern Med. 2013;173:819-821. PubMed
© 2017 Society of Hospital Medicine
Hospital Handoffs and Readmissions in Children
Although much has been written about pediatric discharge and readmissions1-5 over the past several years, surprisingly little is known about which care practices are most effective at preventing postdischarge utilization.5 Major collaborations across the U.S. are currently focused on improving pediatric discharge processes,6-8 although the impact that these efforts will have on readmissions remains to be seen.
Research on handoffs between hospitals and primary care has mixed associations with postdischarge utilization. Although some studies observe positive relationships between specific activities and reduced postdischarge utilization,1 others suggest no relationship9-12 or, paradoxically, more utilization.13,14 Brittan et al15 found that outpatient visits were associated with more readmissions when occurring less than 4 days after discharge, but fewer readmissions when occurring 4 days to 29 days after discharge. Most studies, however, investigate single or limited sets of care activities, such as having an outpatient visit,15 timeliness of that visit,16 or receipt of a discharge summary.11 Inclusion of a more comprehensive set of hospital- to primary-care communication practices may better unravel this complex relationship between discharge care and postdischarge outcomes for children.
The purpose of this study was to characterize a set of traditional discharge handoff practices between hospital and primary care providers (PCPs) and to explore their relationships to readmissions. We hypothesized that handoff practices would be associated with fewer unplanned readmissions.
METHODS
Study Design, Setting, Participants
This project was part of a prospective cohort study with 2 aims: to investigate relationships between medical home experience and postdischarge utilization,17 and to identify relationships between common discharge communication practices and postdischarge utilization. This manuscript is focused on the second aim. Randomly selected pediatric patients and their caregivers were enrolled from any medical or surgical service during an acute hospitalization lasting more than 24 hours from October 1, 2012 to January 1, 2014, at a 100-bed tertiary children’s hospital. Patients who transferred to another facility, died, were older than 18 years or in neonatal care (ie, newborn nursery or neonatal intensive care unit) were excluded since their discharge experiences would be significantly distinct from the population of interest. Patients were enrolled once in the study.
Outcome
The study’s primary outcome was 30-day unplanned readmissions, defined as a hospitalization occurring within 30 days of the index (ie, study enrollment) hospitalization, identified through caregiver report or administrative sources.17 Although the study site is a single hospital system, readmissions could have occurred to any hospital reported by caregivers, (ie, readmissions could have occurred within or outside our health system). Readmissions for chemotherapy, radiation, dialysis, rehabilitation, or labor and delivery were excluded. If caregivers reported an admission as planned or chart review of the index discharge summary noted that a rehospitalization was scheduled in the subsequent 30 days, the readmission was labeled “planned” and excluded.
Discharge Handoff Communication
Transitional care is a set of actions designed to ensure continuity and coordination of healthcare during transfer from 1 location or level of care to another.18,19 The study team, comprised of a division chief of general pediatrics, a division chief of hospital medicine, 2 departmental vice-chairs, and the medical director for quality at the study site, identified 11 common handoff activities and reporting sources. These consensus-based activities were expected by the study team to improve continuity and coordination during hospital-to-home transfer, and included:
- verifying PCP identity during the hospitalization (caregiver report);
- notifying the PCP of admission, discharge, and providing updates during the hospitalization (PCP report);
- PCP follow-up appointment set prior to discharge (caregiver report);
- documenting planned PCP and subspecialty follow-up in the discharge summary (chart review);
- completing the discharge summary within 48 hours (chart review);
- providing a verbal or written handoff to the PCP prior to follow-up (PCP report); and
- having a PCP follow-up visit within 30 days of discharge (caregiver report).
We also asked PCPs whether they thought the follow-up interval was appropriate and whether phone follow-up with the patient would have been as appropriate as a face-to-face visit.
Covariates
Patient demographics that might confound the relationship between handoff practices and readmissions based on pediatric research20,21 were included. Medical complexity was accounted for by length-of-index stay, the number of hospitalizations and emergency department (ED) visits in past 12 months, complex chronic conditions,22,23 and seeing 3 or more subspecialists.24,25 Variables from related work included PCP scope (general pediatrics or subspecialist) and presence of a usual source for well and sick care.17
The Care Transitions Measure-3 (CTM-3), originally developed to assess the patient-centeredness of hospital transition,26,27 can discriminate adult patients at risk for readmission.26 We adapted the original CTM-3 to be answered by caregiver respondents after pilot testing with 5 caregivers not enrolled in the study: 1) “The hospital staff took my preferences and those of my family into account in deciding what my child’s health care needs would be when I left the hospital;” 2) “When I left the hospital, I had a good understanding of the things I was responsible for in managing my child’s health;” and 3) “When I left the hospital, I clearly understood the purpose for giving each of my child’s medications.” We analyzed the adapted CTM-3 on a transformed 0-100 scale as designed,26 initially hypothesizing that the CTM-3 would mediate the relationship between handoff practices and readmissions.
We assessed caregiver confidence to avoid a readmission, based on a strong independent association with readmissions described in Coller et al.17 Using questions developed for this study, caregivers were asked to rate “How confident are you that [child’s name] will stay out of the hospital for the next 30 days?” with instructions to refer to unplanned hospital visits only. Responses were reported on a 4-point Likert scale (1 = very confident, 4 = not very confident). Responses were dichotomized into very confident (ie, “1”) or not very confident (ie, “2-4”).
Enrollment and Data Collection
Computer-generated random numbers were assigned to patients admitted the previous day, and families were enrolled sequentially until the daily enrollment target was reached. Data were obtained from 3 sources: medical record, caregiver report, and PCP report. Trained research assistants systematically extracted chart review data documenting the transitions practices above, while a hospital information technology analyst extracted claims and demographic data to complement what was reported by parents and PCPs. After study conclusion, these medical record data were merged with caregiver and PCP-reported data.
Trained bilingual research assistants collected caregiver- and PCP-reported data using structured questionnaires in English or Spanish, according to preference. Timing of data collection differed by data source; caregiver-reported data were collected immediately after discharge and at 30 days postdischarge; PCP-reported data were collected at 30 days postdischarge.
Caregiver-reported data were collected through 2 separate phone calls following index discharge: immediately after discharge (caregiver confidence and CTM-3 measures) and at 30 days (readmission measures). Caregiver confidence questions were asked after (rather than immediately before) discharge to avoid biasing clinical care and revisit risk, consistent with previous work.28
PCP-reported data were collected using structured questionnaires with the PCP who was identified by the family during study enrollment. PCP-reported data were collected by telephone or fax 30 days after discharge, with up to 5 telephone attempts and 3 fax attempts. At the beginning of the questionnaire, PCPs were asked if they agreed with the designation, although they were asked to complete the questionnaire regardless.
Analyses
Descriptive statistics compared differences in handoff practices and 30-day unplanned readmissions. Exploratory factor analysis assessed whether certain handoff practices were sufficiently correlated to allow grouping of items and construction of scales. Relationships between handoff practices and readmissions were examined using bivariate, followed by multivariate, logistic regression adjusting for the covariates described. Collinearity was tested before constructing final models. Because no relationship was observed between CTM-3 and readmissions, additional mediation analyses were not pursued. All analyses were completed using STATA (SE version 14.0, StataCorp LP, College Station, Texas). This study was approved by the Institutional Review Boards at UCLA (study site) and University of Wisconsin (lead author site).
RESULTS
This study enrolled 701 of 816 eligible participants (85.9%) between October 2012 and January 2014. More than 99% of administrative data and 97% of caregiver questionnaires were complete. Of 685 patients with a reported PCP, we obtained responses from 577 PCPs (84.2%). Patient characteristics and outcomes were not significantly different for patients with and without a responding PCP; however, patients of nonresponding PCPs were more often publicly insured (64.5% vs. 48.2% for responding PCPs, P = 0.004) or seen by a subspecialist as opposed to a generalist (28.1% vs. 13.8% for responding PCPs, P = 0.001).
The overall population characteristics are summarized in Table 1: 27.4% of the cohort was younger 2 years, 49.2% were Hispanic, and the majority (51.1%) had public insurance. The average length of the index hospitalization for the overall population was 4.8 days (standard deviation = 9.6), and 53.5% had at least 1 complex chronic condition. Eighty-four percent of the cohort reported using a generalist (vs. subspecialist) for primary care.

Discharge Handoff Communication
Practices varied widely (Figure 1a). Verbal handoffs between hospital-based and PCPs were least common (10.7%), whereas discharge summary completion within 48 hours was most common (84.9%). Of variables measuring direct communication with PCPs, only notification of admission occurred at least half the time (50.8%).
Exploratory factor analysis identified 5 well-correlated items (Cronbach α = 0.77), which were combined and labeled the Hospital and Primary Care Provider Communication scale (Figure 1b). Items included PCP notification of admission, discharge, and receipt of updates during hospitalization, as well as receipt of verbal and written handoffs prior to follow-up. While these 5 items were analyzed only in this scale, other practices were analyzed as independent variables. In this assessment, 42.1% of patients had a scale score of 0 (no items performed), while 5% had all 5 items completed

Readmissions
The 30-day unplanned readmission rate to any hospital was 12.4%. Demographic characteristics were similar in patients with and without an unplanned readmission (Table 1); however, patients with a readmission were more often younger (P = 0.03) and used a subspecialist for primary care (P = 0.03). Fewer than 60% of those with an unplanned readmission had a usual source of sick and well care compared with 77.5% of those without a readmission (P < 0.001). The length of index stay was nearly 4 days longer for those with an unplanned readmission (9.3 days vs. 4.4 days, P < 0.001). These patients also had more hospitalizations or ED visits in the past year (P = 0.002 and P = 0.04, respectively) and saw more subspecialists (P < 0.001).

Frequencies of communication practices between those with and without an unplanned readmission are illustrated in Table 2. Nearly three-quarters of caregivers whose children were readmitted reported having follow-up appointments scheduled before discharge, compared to 48.9% without a readmission (P < 0.001). In 71% of discharges followed by a readmission, caregivers were not very confident about avoiding readmission, vs. 44.8% of discharges with no readmission (P < 0.001).
Readmissions were largely unrelated to handoff practices in multivariate analyses (Table 3). Having a follow-up visit scheduled prior to discharge was the only activity with a statistically significant association; however, it was actually associated with more than double the odds of readmission (adjusted odds ratio 2.20, 95% confidence interval 1.08-4.46).

DISCUSSION
The complex nature of hospital discharge care has led to general optimism that improved handoff processes might reduce readmissions for pediatric patients. Although the current literature linking transition practices to readmissions in pediatrics has mixed results,1,4,5 most studies are fragmented—investigating a single or small number of transitional care activities, such as outpatient follow-up visits, postdischarge caregiver phone calls, or PCP receipt of discharge summaries. Despite finding limited relationships with readmissions, a strength of our study was its inclusion of a more comprehensive set of traditional communication practices that the study team anticipates many primary care and hospital medicine providers would expect to be carried out for most, if not all, patients during the hospital-to-home transition.
Although our study was developed earlier, the variables in our analyses align with each domain of the conceptual model for readmission risk proposed by the Seamless Transitions and Re(admissions) Network (STARNet).6 This model identifies 7 elements believed to directly impact readmission risk in children: hospital and ED utilization, underlying diseases, ability to care for diseases, access to outpatient care, discharge processes, and discharge readiness. For example, our study included ED and hospital visits in the past year, complex chronic conditions, number of subspecialists, caregiver confidence, having a usual source of care, insurance status, and the 11 consensus-based handoff practices identified by our study team. Therefore, although the included handoff practices we included were a limited set, our models provide a relatively comprehensive analysis of readmission risk, confirming caregiver confidence, usual source of care, and hospitalizations to be associated with unplanned readmissions.
With the exception of having scheduled follow-up appointments before discharge – which was associated with more rather than fewer readmissions—the included care practices were not associated with readmissions. We suspect that these findings likely represent selection bias, with hospital providers taking additional steps in communicating with outpatient providers when they are most concerned about a patient’s vulnerability at discharge, eg, due to severity of illness, sociodemographics, health literacy, access to care, or other factors. Such selection bias could have 2 potential effects: (1) creating associations between the performance of certain handoff practices and higher readmission risk (eg, hospital providers are more likely to set follow-up appointments with the sickest patients who are also most likely to be readmitted, or (2) negating weakly effective communication practices that have small effect sizes. The currently mixed literature suggests that if associations between these handoff practices and postdischarge outcomes exist, they are often opposite to our expectation and likely driven by selection bias. If there are real effects that are hidden by this selection bias, they may be weak or inconsistent.
Recent qualitative research highlights the needs and preferences of caregivers of children with chronic or complex conditions to promote their sense of self-efficacy at discharge.29 Such needs include support from within and beyond the health system, comprehensive discharge education, and written instructions, ultimately leading to confidence and comfort in executing the home-management plan. Consistent with our work,17 a strong independent relationship between caregiver confidence and postdischarge outcomes remained even after accounting for these conventional handoff activities.
Transitions research in pediatrics has started only recently to move beyond traditional handoff communication between hospital and outpatient providers. Over the last several years, more ambitious conceptualizations of hospital discharge care have evolved2 and include constructs such as family-centeredness,4,28,29 discharge readiness,30 and social determinants of health.31 Interventions targeting these constructs are largely missing from the literature and are greatly needed. If transitions are to have an effect on downstream utilization, their focus likely needs to evolve to address such areas.
Finally, our study underscores the need to identify relevant outcomes of improved transitional care. Although the preventability of postdischarge utilization continues to be debated, most would agree that this should not detract from the importance of high-quality transitional care. The STARNet collaborative provides some examples of outcomes potentially impacted through improved transitional care,6 although the authors note that reliability, validity, and feasibility of the measures are not well understood. High-quality transitional care presumably would lead to improvements in patient and family experience and perhaps safer care. Although caregiver experience measured by an adapted CTM-3 was neither a mediator nor a predictor of postdischarge utilization for children in our study, use of more rigorously developed tools for pediatric patients32 may provide a better assessment of caregiver experience. Finally, given the well-described risks of poor communication between hospital and outpatient providers,33-35 safety events may be a better outcome of high-quality transitional care than readmissions. Investment in transitional care initiatives would be well justified if the positive patient, provider, and health system impacts can be better demonstrated through improved outcomes.
Future readmissions research should aim to accomplish several goals. Because observational studies will continue to be challenged by the selection biases described above, more rigorously designed and controlled experimental pediatric studies are needed. Family, social, and primary care characteristics should continue to be incorporated into pediatric readmission analyses given their increasingly recognized critical role. These variables, some of which could be modifiable, might represent potential targets for innovative readmission reduction interventions. Recently published conceptual models6,29,36 provide a useful starting framework.
Limitations
Because of the observational study design, we cannot draw conclusions about causal relationships between handoff practices and the measured outcomes. The tertiary care single-center nature of the study limits generalizability. Response biases are possible given that we often could not verify accuracy of PCP and caregiver responses. As noted above, we suspect that handoff practices were driven by important selection bias, not all of which could be controlled by the measured patient and clinical characteristics. The handoff practices included in this study were a limited set primarily focused on communication between hospital providers and PCPs. Therefore, the study does not rule out the possibility that other aspects of transitional care may reduce readmissions. Subsequent work investigating innovative interventions may find reductions in readmissions and other important outcomes. Additionally, not all practices have standardized definitions, eg, what 1 PCP considers a verbal handoff may be different from that of another provider. Although we assessed whether communication occurred, we were not able to assess the content or quality of communication, which may have important implications for its effectiveness.37,38
CONCLUSION
Improvements in handoffs between hospital and PCPs may have an important impact on postdischarge outcomes, but it is not clear that unplanned 30-day readmissions is among them. Efforts to reduce postdischarge utilization, if possible, likely need to focus on broader constructs such as caregiver self-efficacy, discharge readiness, and social determinants of health.
Disclosures
This study was supported by a grant from the Lucile Packard Foundation for Children’s Health, Palo Alto, California, as well as grant R40MC25677 Maternal and Child Health Research Program, Maternal and Child Health Bureau (Title V, Social Security Act), Health Resources and Services Administration, Department of Health and Human Services. The authors report no financial conflicts of interest.
1. Auger KA, Kenyon CC, Feudtner C, Davis MM. Pediatric hospital discharge interventions to reduce subsequent utilization: a systematic review. J Hosp Med. 2014;9:251-260. PubMed
2. Berry JG, Blaine K, Rogers J, et al. A framework of pediatric hospital discharge care informed by legislation, research, and practice. JAMA Pediatr. 2014;168:955-962; quiz 965-956. PubMed
3. Snow V, Beck D, Budnitz T, et al, American College of Physicians, Society of General Internal Medicine, Society of Hospital Medicine, American Geriatrics Society, American College of Emergency Physicians, Society of Academic Emergency Medicine. Transitions of Care Consensus Policy Statement. American College of Physicians, Society of General Internal Medicine, Society of Hospital Medicine, American Geriatrics Society, American College of Emergency Physicians, Society of Academic Emergency Medicine. J Gen Intern Med. 2009;24:971-976. PubMed
4. Desai AD, Popalisky J, Simon TD, Mangione-Smith RM. The effectiveness of family-centered transition processes from hospital settings to home: a review of the literature. Hosp Pediatr. 2015;5:219-231. PubMed
5. Berry JG, Gay JC. Preventing readmissions in children: how do we do that? Hosp Pediatr. 2015;5:602-604. PubMed
6. Auger KA, Simon TD, Cooperberg D, et al. Summary of STARNet: Seamless Transitions and (Re)admissions Network. Pediatrics. 2015;135:164-175. PubMed
7. Value in inpatient pediatrics network projects. American Academy of Pediatrics. Available at: https://www.aap.org/en-us/professional-resources/quality-improvement/Quality-Improvement-Innovation-Networks/Value-in-Inpatient-Pediatrics-Network/Pages/Value-in-Inpatient-Pediatrics-Network.aspx. Accessed May 18, 2015.
8. Ohio Children’s Hospitals. Solutions for patient safety. Available at: http://www.solutionsforpatientsafety.org/about-us/our-goals/. Accessed May 18, 2015.
9. Bell CM, Schnipper JL, Auerbach AD, et al. Association of communication between hospital-based physicians and primary care providers with patient outcomes. J Gen Intern Med. 2009;24:381-386. PubMed
10. Oduyebo I, Lehmann CU, Pollack CE, et al. Association of self-reported hospital discharge handoffs with 30-day readmissions. JAMA Intern Med. 2013;173:624-629. PubMed
11. van Walraven C, Seth R, Austin PC, Laupacis A. Effect of discharge summary availability during post-discharge visits on hospital readmission. J Gen Intern Med. 2002;17:186-192. PubMed
12. Kashiwagi DT, Burton MC, Kirkland LL, Cha S, Varkey P. Do timely outpatient follow-up visits decrease hospital readmission rates? Am J Med Qual. 2012;27:11-15. PubMed
13. Coller RJ, Klitzner TS, Lerner CF, Chung PJ. Predictors of 30-day readmission and association with primary care follow-up plans. J Pediatr. 2013;163:1027-1033. PubMed
14. Feudtner C, Pati S, Goodman DM, et al. State-level child health system performance and the likelihood of readmission to children’s hospitals. J Pediatr. 2010;157:98-102. PubMed
15. Brittan MS, Sills MR, Fox D, et al. Outpatient follow-up visits and readmission in medically complex children enrolled in Medicaid. J Pediatr. 2015;166:998-1005. PubMed
16. Misky GJ, Wald HL, Coleman EA. Post-hospitalization transitions: Examining the effects of timing of primary care provider follow-up. J Hosp Med. 2010;5:392-397. PubMed
17. Coller RJ, Klitzner TS, Saenz AA, Lerner CF, Nelson BB, Chung PJ. The medical home and hospital readmissions. Pediatrics. 2015;136:e1550-e1560. PubMed
18. Coleman EA, Berenson RA. Lost in transition: challenges and opportunities for improving the quality of transitional care. Ann Intern Med. 2004;141:533-536. PubMed
19. Coleman EA, Boult C; American Geriatrics Society Health Care Systems Committee. Improving the quality of transitional care for persons with complex care needs. J Am Geriatr Soc. 2003;51:556-557. PubMed
20. Berry JG, Hall DE, Kuo DZ, et al. Hospital utilization and characteristics of patients experiencing recurrent readmissions within children’s hospitals. JAMA. 2011;305:682-690. PubMed
21. Feudtner C, Levin JE, Srivastava R, et al. How well can hospital readmission be predicted in a cohort of hospitalized children? A retrospective, multicenter study. Pediatrics. 2009;123:286-293. PubMed
22. Feudtner C, Christakis DA, Connell FA. Pediatric deaths attributable to complex chronic conditions: a population-based study of Washington State, 1980-1997. Pediatrics. 2000;106:205-209. PubMed
23. Feudtner C, Feinstein JA, Zhong W, Hall M, Dai D. Pediatric complex chronic conditions classification system version 2: updated for ICD-10 and complex medical technology dependence and transplantation. BMC Pediatr. 2014;14:199. PubMed
24. Berry JG, Agrawal R, Kuo DZ, et al. Characteristics of hospitalizations for patients who use a structured clinical care program for children with medical complexity. J Pediatr. 2011;159:284-290. PubMed
25. Kuo DZ, Cohen E, Agrawal R, Berry JG, Casey PH. A national profile of caregiver challenges among more medically complex children with special health care needs. Arch Pediatr Adolesc Med. 2011;165:1020-1026. PubMed
26. Parry C, Mahoney E, Chalmers SA, Coleman EA. Assessing the quality of transitional care: further applications of the care transitions measure. Med Care. 2008;46:317-322. PubMed
27. Coleman EA, Mahoney E, Parry C. Assessing the quality of preparation for posthospital care from the patient’s perspective: the care transitions measure. Med Care. 2005;43:246-255. PubMed
28. Berry JG, Ziniel SI, Freeman L, et al. Hospital readmission and parent perceptions of their child’s hospital discharge. Int J Qual Health Care. 2013;25:573-581. PubMed
29. Desai AD, Durkin LK, Jacob-Files EA, Mangione-Smith R. Caregiver perceptions of hospital to home transitions according to medical complexity: a qualitative study. Acad Pediatr. 2016;16:136-144. PubMed
30. Weiss ME, Bobay KL, Bahr SJ, Costa L, Hughes RG, Holland DE. A model for hospital discharge preparation: from case management to care transition. J Nurs Adm. 2015;45:606-614. PubMed
31. Sills MR, Hall M, Colvin JD, et al. Association of social determinants with children’s hospitals’ preventable readmissions performance. JAMA Pediatr. 2016;170:350-358. PubMed
32. Toomey SL, Zaslavsky AM, Elliott MN, et al. The development of a pediatric inpatient experience of care measure: child HCAHPS. Pediatrics. 2015;136:360-369. PubMed
33. Kripalani S, LeFevre F, Phillips CO, Williams MV, Basaviah P, Baker DW. Deficits in communication and information transfer between hospital-based and primary care physicians: implications for patient safety and continuity of care. JAMA. 2007;297:831-841. PubMed
34. Harlan G, Srivastava R, Harrison L, McBride G, Maloney C. Pediatric hospitalists and primary care providers: a communication needs assessment. J Hosp Med. 2009;4:187-193. PubMed
35. Forster AJ, Clark HD, Menard A, et al. Adverse events among medical patients after discharge from hospital. CMAJ. 2004;170:345-349. PubMed
36. Nakamura MM, Toomey SL, Zaslavsky AM, et al. Measuring pediatric hospital readmission rates to drive quality improvement. Acad Pediatr. 2014;14:S39-S46. PubMed
37. Smith K. Effective communication with primary care providers. Pediatr Clin North Am. 2014;61671-679. PubMed
38. Leyenaar JK, Bergert L, Mallory LA, et al. Pediatric primary care providers’ perspectives regarding hospital discharge communication: a mixed methods analysis. Acad Pediatr. 2015;15:61-68. PubMed
Although much has been written about pediatric discharge and readmissions1-5 over the past several years, surprisingly little is known about which care practices are most effective at preventing postdischarge utilization.5 Major collaborations across the U.S. are currently focused on improving pediatric discharge processes,6-8 although the impact that these efforts will have on readmissions remains to be seen.
Research on handoffs between hospitals and primary care has mixed associations with postdischarge utilization. Although some studies observe positive relationships between specific activities and reduced postdischarge utilization,1 others suggest no relationship9-12 or, paradoxically, more utilization.13,14 Brittan et al15 found that outpatient visits were associated with more readmissions when occurring less than 4 days after discharge, but fewer readmissions when occurring 4 days to 29 days after discharge. Most studies, however, investigate single or limited sets of care activities, such as having an outpatient visit,15 timeliness of that visit,16 or receipt of a discharge summary.11 Inclusion of a more comprehensive set of hospital- to primary-care communication practices may better unravel this complex relationship between discharge care and postdischarge outcomes for children.
The purpose of this study was to characterize a set of traditional discharge handoff practices between hospital and primary care providers (PCPs) and to explore their relationships to readmissions. We hypothesized that handoff practices would be associated with fewer unplanned readmissions.
METHODS
Study Design, Setting, Participants
This project was part of a prospective cohort study with 2 aims: to investigate relationships between medical home experience and postdischarge utilization,17 and to identify relationships between common discharge communication practices and postdischarge utilization. This manuscript is focused on the second aim. Randomly selected pediatric patients and their caregivers were enrolled from any medical or surgical service during an acute hospitalization lasting more than 24 hours from October 1, 2012 to January 1, 2014, at a 100-bed tertiary children’s hospital. Patients who transferred to another facility, died, were older than 18 years or in neonatal care (ie, newborn nursery or neonatal intensive care unit) were excluded since their discharge experiences would be significantly distinct from the population of interest. Patients were enrolled once in the study.
Outcome
The study’s primary outcome was 30-day unplanned readmissions, defined as a hospitalization occurring within 30 days of the index (ie, study enrollment) hospitalization, identified through caregiver report or administrative sources.17 Although the study site is a single hospital system, readmissions could have occurred to any hospital reported by caregivers, (ie, readmissions could have occurred within or outside our health system). Readmissions for chemotherapy, radiation, dialysis, rehabilitation, or labor and delivery were excluded. If caregivers reported an admission as planned or chart review of the index discharge summary noted that a rehospitalization was scheduled in the subsequent 30 days, the readmission was labeled “planned” and excluded.
Discharge Handoff Communication
Transitional care is a set of actions designed to ensure continuity and coordination of healthcare during transfer from 1 location or level of care to another.18,19 The study team, comprised of a division chief of general pediatrics, a division chief of hospital medicine, 2 departmental vice-chairs, and the medical director for quality at the study site, identified 11 common handoff activities and reporting sources. These consensus-based activities were expected by the study team to improve continuity and coordination during hospital-to-home transfer, and included:
- verifying PCP identity during the hospitalization (caregiver report);
- notifying the PCP of admission, discharge, and providing updates during the hospitalization (PCP report);
- PCP follow-up appointment set prior to discharge (caregiver report);
- documenting planned PCP and subspecialty follow-up in the discharge summary (chart review);
- completing the discharge summary within 48 hours (chart review);
- providing a verbal or written handoff to the PCP prior to follow-up (PCP report); and
- having a PCP follow-up visit within 30 days of discharge (caregiver report).
We also asked PCPs whether they thought the follow-up interval was appropriate and whether phone follow-up with the patient would have been as appropriate as a face-to-face visit.
Covariates
Patient demographics that might confound the relationship between handoff practices and readmissions based on pediatric research20,21 were included. Medical complexity was accounted for by length-of-index stay, the number of hospitalizations and emergency department (ED) visits in past 12 months, complex chronic conditions,22,23 and seeing 3 or more subspecialists.24,25 Variables from related work included PCP scope (general pediatrics or subspecialist) and presence of a usual source for well and sick care.17
The Care Transitions Measure-3 (CTM-3), originally developed to assess the patient-centeredness of hospital transition,26,27 can discriminate adult patients at risk for readmission.26 We adapted the original CTM-3 to be answered by caregiver respondents after pilot testing with 5 caregivers not enrolled in the study: 1) “The hospital staff took my preferences and those of my family into account in deciding what my child’s health care needs would be when I left the hospital;” 2) “When I left the hospital, I had a good understanding of the things I was responsible for in managing my child’s health;” and 3) “When I left the hospital, I clearly understood the purpose for giving each of my child’s medications.” We analyzed the adapted CTM-3 on a transformed 0-100 scale as designed,26 initially hypothesizing that the CTM-3 would mediate the relationship between handoff practices and readmissions.
We assessed caregiver confidence to avoid a readmission, based on a strong independent association with readmissions described in Coller et al.17 Using questions developed for this study, caregivers were asked to rate “How confident are you that [child’s name] will stay out of the hospital for the next 30 days?” with instructions to refer to unplanned hospital visits only. Responses were reported on a 4-point Likert scale (1 = very confident, 4 = not very confident). Responses were dichotomized into very confident (ie, “1”) or not very confident (ie, “2-4”).
Enrollment and Data Collection
Computer-generated random numbers were assigned to patients admitted the previous day, and families were enrolled sequentially until the daily enrollment target was reached. Data were obtained from 3 sources: medical record, caregiver report, and PCP report. Trained research assistants systematically extracted chart review data documenting the transitions practices above, while a hospital information technology analyst extracted claims and demographic data to complement what was reported by parents and PCPs. After study conclusion, these medical record data were merged with caregiver and PCP-reported data.
Trained bilingual research assistants collected caregiver- and PCP-reported data using structured questionnaires in English or Spanish, according to preference. Timing of data collection differed by data source; caregiver-reported data were collected immediately after discharge and at 30 days postdischarge; PCP-reported data were collected at 30 days postdischarge.
Caregiver-reported data were collected through 2 separate phone calls following index discharge: immediately after discharge (caregiver confidence and CTM-3 measures) and at 30 days (readmission measures). Caregiver confidence questions were asked after (rather than immediately before) discharge to avoid biasing clinical care and revisit risk, consistent with previous work.28
PCP-reported data were collected using structured questionnaires with the PCP who was identified by the family during study enrollment. PCP-reported data were collected by telephone or fax 30 days after discharge, with up to 5 telephone attempts and 3 fax attempts. At the beginning of the questionnaire, PCPs were asked if they agreed with the designation, although they were asked to complete the questionnaire regardless.
Analyses
Descriptive statistics compared differences in handoff practices and 30-day unplanned readmissions. Exploratory factor analysis assessed whether certain handoff practices were sufficiently correlated to allow grouping of items and construction of scales. Relationships between handoff practices and readmissions were examined using bivariate, followed by multivariate, logistic regression adjusting for the covariates described. Collinearity was tested before constructing final models. Because no relationship was observed between CTM-3 and readmissions, additional mediation analyses were not pursued. All analyses were completed using STATA (SE version 14.0, StataCorp LP, College Station, Texas). This study was approved by the Institutional Review Boards at UCLA (study site) and University of Wisconsin (lead author site).
RESULTS
This study enrolled 701 of 816 eligible participants (85.9%) between October 2012 and January 2014. More than 99% of administrative data and 97% of caregiver questionnaires were complete. Of 685 patients with a reported PCP, we obtained responses from 577 PCPs (84.2%). Patient characteristics and outcomes were not significantly different for patients with and without a responding PCP; however, patients of nonresponding PCPs were more often publicly insured (64.5% vs. 48.2% for responding PCPs, P = 0.004) or seen by a subspecialist as opposed to a generalist (28.1% vs. 13.8% for responding PCPs, P = 0.001).
The overall population characteristics are summarized in Table 1: 27.4% of the cohort was younger 2 years, 49.2% were Hispanic, and the majority (51.1%) had public insurance. The average length of the index hospitalization for the overall population was 4.8 days (standard deviation = 9.6), and 53.5% had at least 1 complex chronic condition. Eighty-four percent of the cohort reported using a generalist (vs. subspecialist) for primary care.
Discharge Handoff Communication
Practices varied widely (Figure 1a). Verbal handoffs between hospital-based and PCPs were least common (10.7%), whereas discharge summary completion within 48 hours was most common (84.9%). Of variables measuring direct communication with PCPs, only notification of admission occurred at least half the time (50.8%).
Exploratory factor analysis identified 5 well-correlated items (Cronbach α = 0.77), which were combined and labeled the Hospital and Primary Care Provider Communication scale (Figure 1b). Items included PCP notification of admission, discharge, and receipt of updates during hospitalization, as well as receipt of verbal and written handoffs prior to follow-up. While these 5 items were analyzed only in this scale, other practices were analyzed as independent variables. In this assessment, 42.1% of patients had a scale score of 0 (no items performed), while 5% had all 5 items completed
Readmissions
The 30-day unplanned readmission rate to any hospital was 12.4%. Demographic characteristics were similar in patients with and without an unplanned readmission (Table 1); however, patients with a readmission were more often younger (P = 0.03) and used a subspecialist for primary care (P = 0.03). Fewer than 60% of those with an unplanned readmission had a usual source of sick and well care compared with 77.5% of those without a readmission (P < 0.001). The length of index stay was nearly 4 days longer for those with an unplanned readmission (9.3 days vs. 4.4 days, P < 0.001). These patients also had more hospitalizations or ED visits in the past year (P = 0.002 and P = 0.04, respectively) and saw more subspecialists (P < 0.001).
Frequencies of communication practices between those with and without an unplanned readmission are illustrated in Table 2. Nearly three-quarters of caregivers whose children were readmitted reported having follow-up appointments scheduled before discharge, compared to 48.9% without a readmission (P < 0.001). In 71% of discharges followed by a readmission, caregivers were not very confident about avoiding readmission, vs. 44.8% of discharges with no readmission (P < 0.001).
Readmissions were largely unrelated to handoff practices in multivariate analyses (Table 3). Having a follow-up visit scheduled prior to discharge was the only activity with a statistically significant association; however, it was actually associated with more than double the odds of readmission (adjusted odds ratio 2.20, 95% confidence interval 1.08-4.46).
DISCUSSION
The complex nature of hospital discharge care has led to general optimism that improved handoff processes might reduce readmissions for pediatric patients. Although the current literature linking transition practices to readmissions in pediatrics has mixed results,1,4,5 most studies are fragmented—investigating a single or small number of transitional care activities, such as outpatient follow-up visits, postdischarge caregiver phone calls, or PCP receipt of discharge summaries. Despite finding limited relationships with readmissions, a strength of our study was its inclusion of a more comprehensive set of traditional communication practices that the study team anticipates many primary care and hospital medicine providers would expect to be carried out for most, if not all, patients during the hospital-to-home transition.
Although our study was developed earlier, the variables in our analyses align with each domain of the conceptual model for readmission risk proposed by the Seamless Transitions and Re(admissions) Network (STARNet).6 This model identifies 7 elements believed to directly impact readmission risk in children: hospital and ED utilization, underlying diseases, ability to care for diseases, access to outpatient care, discharge processes, and discharge readiness. For example, our study included ED and hospital visits in the past year, complex chronic conditions, number of subspecialists, caregiver confidence, having a usual source of care, insurance status, and the 11 consensus-based handoff practices identified by our study team. Therefore, although the included handoff practices we included were a limited set, our models provide a relatively comprehensive analysis of readmission risk, confirming caregiver confidence, usual source of care, and hospitalizations to be associated with unplanned readmissions.
With the exception of having scheduled follow-up appointments before discharge – which was associated with more rather than fewer readmissions—the included care practices were not associated with readmissions. We suspect that these findings likely represent selection bias, with hospital providers taking additional steps in communicating with outpatient providers when they are most concerned about a patient’s vulnerability at discharge, eg, due to severity of illness, sociodemographics, health literacy, access to care, or other factors. Such selection bias could have 2 potential effects: (1) creating associations between the performance of certain handoff practices and higher readmission risk (eg, hospital providers are more likely to set follow-up appointments with the sickest patients who are also most likely to be readmitted, or (2) negating weakly effective communication practices that have small effect sizes. The currently mixed literature suggests that if associations between these handoff practices and postdischarge outcomes exist, they are often opposite to our expectation and likely driven by selection bias. If there are real effects that are hidden by this selection bias, they may be weak or inconsistent.
Recent qualitative research highlights the needs and preferences of caregivers of children with chronic or complex conditions to promote their sense of self-efficacy at discharge.29 Such needs include support from within and beyond the health system, comprehensive discharge education, and written instructions, ultimately leading to confidence and comfort in executing the home-management plan. Consistent with our work,17 a strong independent relationship between caregiver confidence and postdischarge outcomes remained even after accounting for these conventional handoff activities.
Transitions research in pediatrics has started only recently to move beyond traditional handoff communication between hospital and outpatient providers. Over the last several years, more ambitious conceptualizations of hospital discharge care have evolved2 and include constructs such as family-centeredness,4,28,29 discharge readiness,30 and social determinants of health.31 Interventions targeting these constructs are largely missing from the literature and are greatly needed. If transitions are to have an effect on downstream utilization, their focus likely needs to evolve to address such areas.
Finally, our study underscores the need to identify relevant outcomes of improved transitional care. Although the preventability of postdischarge utilization continues to be debated, most would agree that this should not detract from the importance of high-quality transitional care. The STARNet collaborative provides some examples of outcomes potentially impacted through improved transitional care,6 although the authors note that reliability, validity, and feasibility of the measures are not well understood. High-quality transitional care presumably would lead to improvements in patient and family experience and perhaps safer care. Although caregiver experience measured by an adapted CTM-3 was neither a mediator nor a predictor of postdischarge utilization for children in our study, use of more rigorously developed tools for pediatric patients32 may provide a better assessment of caregiver experience. Finally, given the well-described risks of poor communication between hospital and outpatient providers,33-35 safety events may be a better outcome of high-quality transitional care than readmissions. Investment in transitional care initiatives would be well justified if the positive patient, provider, and health system impacts can be better demonstrated through improved outcomes.
Future readmissions research should aim to accomplish several goals. Because observational studies will continue to be challenged by the selection biases described above, more rigorously designed and controlled experimental pediatric studies are needed. Family, social, and primary care characteristics should continue to be incorporated into pediatric readmission analyses given their increasingly recognized critical role. These variables, some of which could be modifiable, might represent potential targets for innovative readmission reduction interventions. Recently published conceptual models6,29,36 provide a useful starting framework.
Limitations
Because of the observational study design, we cannot draw conclusions about causal relationships between handoff practices and the measured outcomes. The tertiary care single-center nature of the study limits generalizability. Response biases are possible given that we often could not verify accuracy of PCP and caregiver responses. As noted above, we suspect that handoff practices were driven by important selection bias, not all of which could be controlled by the measured patient and clinical characteristics. The handoff practices included in this study were a limited set primarily focused on communication between hospital providers and PCPs. Therefore, the study does not rule out the possibility that other aspects of transitional care may reduce readmissions. Subsequent work investigating innovative interventions may find reductions in readmissions and other important outcomes. Additionally, not all practices have standardized definitions, eg, what 1 PCP considers a verbal handoff may be different from that of another provider. Although we assessed whether communication occurred, we were not able to assess the content or quality of communication, which may have important implications for its effectiveness.37,38
CONCLUSION
Improvements in handoffs between hospital and PCPs may have an important impact on postdischarge outcomes, but it is not clear that unplanned 30-day readmissions is among them. Efforts to reduce postdischarge utilization, if possible, likely need to focus on broader constructs such as caregiver self-efficacy, discharge readiness, and social determinants of health.
Disclosures
This study was supported by a grant from the Lucile Packard Foundation for Children’s Health, Palo Alto, California, as well as grant R40MC25677 Maternal and Child Health Research Program, Maternal and Child Health Bureau (Title V, Social Security Act), Health Resources and Services Administration, Department of Health and Human Services. The authors report no financial conflicts of interest.
1. Auger KA, Kenyon CC, Feudtner C, Davis MM. Pediatric hospital discharge interventions to reduce subsequent utilization: a systematic review. J Hosp Med. 2014;9:251-260. PubMed
2. Berry JG, Blaine K, Rogers J, et al. A framework of pediatric hospital discharge care informed by legislation, research, and practice. JAMA Pediatr. 2014;168:955-962; quiz 965-956. PubMed
3. Snow V, Beck D, Budnitz T, et al, American College of Physicians, Society of General Internal Medicine, Society of Hospital Medicine, American Geriatrics Society, American College of Emergency Physicians, Society of Academic Emergency Medicine. Transitions of Care Consensus Policy Statement. American College of Physicians, Society of General Internal Medicine, Society of Hospital Medicine, American Geriatrics Society, American College of Emergency Physicians, Society of Academic Emergency Medicine. J Gen Intern Med. 2009;24:971-976. PubMed
4. Desai AD, Popalisky J, Simon TD, Mangione-Smith RM. The effectiveness of family-centered transition processes from hospital settings to home: a review of the literature. Hosp Pediatr. 2015;5:219-231. PubMed
5. Berry JG, Gay JC. Preventing readmissions in children: how do we do that? Hosp Pediatr. 2015;5:602-604. PubMed
6. Auger KA, Simon TD, Cooperberg D, et al. Summary of STARNet: Seamless Transitions and (Re)admissions Network. Pediatrics. 2015;135:164-175. PubMed
7. Value in inpatient pediatrics network projects. American Academy of Pediatrics. Available at: https://www.aap.org/en-us/professional-resources/quality-improvement/Quality-Improvement-Innovation-Networks/Value-in-Inpatient-Pediatrics-Network/Pages/Value-in-Inpatient-Pediatrics-Network.aspx. Accessed May 18, 2015.
8. Ohio Children’s Hospitals. Solutions for patient safety. Available at: http://www.solutionsforpatientsafety.org/about-us/our-goals/. Accessed May 18, 2015.
9. Bell CM, Schnipper JL, Auerbach AD, et al. Association of communication between hospital-based physicians and primary care providers with patient outcomes. J Gen Intern Med. 2009;24:381-386. PubMed
10. Oduyebo I, Lehmann CU, Pollack CE, et al. Association of self-reported hospital discharge handoffs with 30-day readmissions. JAMA Intern Med. 2013;173:624-629. PubMed
11. van Walraven C, Seth R, Austin PC, Laupacis A. Effect of discharge summary availability during post-discharge visits on hospital readmission. J Gen Intern Med. 2002;17:186-192. PubMed
12. Kashiwagi DT, Burton MC, Kirkland LL, Cha S, Varkey P. Do timely outpatient follow-up visits decrease hospital readmission rates? Am J Med Qual. 2012;27:11-15. PubMed
13. Coller RJ, Klitzner TS, Lerner CF, Chung PJ. Predictors of 30-day readmission and association with primary care follow-up plans. J Pediatr. 2013;163:1027-1033. PubMed
14. Feudtner C, Pati S, Goodman DM, et al. State-level child health system performance and the likelihood of readmission to children’s hospitals. J Pediatr. 2010;157:98-102. PubMed
15. Brittan MS, Sills MR, Fox D, et al. Outpatient follow-up visits and readmission in medically complex children enrolled in Medicaid. J Pediatr. 2015;166:998-1005. PubMed
16. Misky GJ, Wald HL, Coleman EA. Post-hospitalization transitions: Examining the effects of timing of primary care provider follow-up. J Hosp Med. 2010;5:392-397. PubMed
17. Coller RJ, Klitzner TS, Saenz AA, Lerner CF, Nelson BB, Chung PJ. The medical home and hospital readmissions. Pediatrics. 2015;136:e1550-e1560. PubMed
18. Coleman EA, Berenson RA. Lost in transition: challenges and opportunities for improving the quality of transitional care. Ann Intern Med. 2004;141:533-536. PubMed
19. Coleman EA, Boult C; American Geriatrics Society Health Care Systems Committee. Improving the quality of transitional care for persons with complex care needs. J Am Geriatr Soc. 2003;51:556-557. PubMed
20. Berry JG, Hall DE, Kuo DZ, et al. Hospital utilization and characteristics of patients experiencing recurrent readmissions within children’s hospitals. JAMA. 2011;305:682-690. PubMed
21. Feudtner C, Levin JE, Srivastava R, et al. How well can hospital readmission be predicted in a cohort of hospitalized children? A retrospective, multicenter study. Pediatrics. 2009;123:286-293. PubMed
22. Feudtner C, Christakis DA, Connell FA. Pediatric deaths attributable to complex chronic conditions: a population-based study of Washington State, 1980-1997. Pediatrics. 2000;106:205-209. PubMed
23. Feudtner C, Feinstein JA, Zhong W, Hall M, Dai D. Pediatric complex chronic conditions classification system version 2: updated for ICD-10 and complex medical technology dependence and transplantation. BMC Pediatr. 2014;14:199. PubMed
24. Berry JG, Agrawal R, Kuo DZ, et al. Characteristics of hospitalizations for patients who use a structured clinical care program for children with medical complexity. J Pediatr. 2011;159:284-290. PubMed
25. Kuo DZ, Cohen E, Agrawal R, Berry JG, Casey PH. A national profile of caregiver challenges among more medically complex children with special health care needs. Arch Pediatr Adolesc Med. 2011;165:1020-1026. PubMed
26. Parry C, Mahoney E, Chalmers SA, Coleman EA. Assessing the quality of transitional care: further applications of the care transitions measure. Med Care. 2008;46:317-322. PubMed
27. Coleman EA, Mahoney E, Parry C. Assessing the quality of preparation for posthospital care from the patient’s perspective: the care transitions measure. Med Care. 2005;43:246-255. PubMed
28. Berry JG, Ziniel SI, Freeman L, et al. Hospital readmission and parent perceptions of their child’s hospital discharge. Int J Qual Health Care. 2013;25:573-581. PubMed
29. Desai AD, Durkin LK, Jacob-Files EA, Mangione-Smith R. Caregiver perceptions of hospital to home transitions according to medical complexity: a qualitative study. Acad Pediatr. 2016;16:136-144. PubMed
30. Weiss ME, Bobay KL, Bahr SJ, Costa L, Hughes RG, Holland DE. A model for hospital discharge preparation: from case management to care transition. J Nurs Adm. 2015;45:606-614. PubMed
31. Sills MR, Hall M, Colvin JD, et al. Association of social determinants with children’s hospitals’ preventable readmissions performance. JAMA Pediatr. 2016;170:350-358. PubMed
32. Toomey SL, Zaslavsky AM, Elliott MN, et al. The development of a pediatric inpatient experience of care measure: child HCAHPS. Pediatrics. 2015;136:360-369. PubMed
33. Kripalani S, LeFevre F, Phillips CO, Williams MV, Basaviah P, Baker DW. Deficits in communication and information transfer between hospital-based and primary care physicians: implications for patient safety and continuity of care. JAMA. 2007;297:831-841. PubMed
34. Harlan G, Srivastava R, Harrison L, McBride G, Maloney C. Pediatric hospitalists and primary care providers: a communication needs assessment. J Hosp Med. 2009;4:187-193. PubMed
35. Forster AJ, Clark HD, Menard A, et al. Adverse events among medical patients after discharge from hospital. CMAJ. 2004;170:345-349. PubMed
36. Nakamura MM, Toomey SL, Zaslavsky AM, et al. Measuring pediatric hospital readmission rates to drive quality improvement. Acad Pediatr. 2014;14:S39-S46. PubMed
37. Smith K. Effective communication with primary care providers. Pediatr Clin North Am. 2014;61671-679. PubMed
38. Leyenaar JK, Bergert L, Mallory LA, et al. Pediatric primary care providers’ perspectives regarding hospital discharge communication: a mixed methods analysis. Acad Pediatr. 2015;15:61-68. PubMed
© 2017 Society of Hospital Medicine
Basal Cell Carcinoma Arising in Outdoor Workers Versus Indoor Workers: A Retrospective Study
Basal cell carcinoma (BCC) is the most prevalent malignancy in white individuals and its incidence is rapidly increasing. Despite its low mortality rate, BCC can cause severe morbidity and remains a serious health problem with a high economic burden for health care systems. The incidence of BCC is higher in individuals who have red or blonde hair, light eye color, and/or Fitzpatrick skin types I and II. The risk for developing BCC also increases with age, and men are more frequently affected than women.1,2 Although several factors have been implicated in the etiology of this condition, such as exposure to ionizing radiation, trauma, chemical carcinogenesis, immunosuppression, predisposing syndromes, and host factors (eg, traits that affect susceptibility to disease),3-5 exposure to UV radiation is considered to be a major risk factor, with most BCCs presenting in sun-exposed areas of the body (eg, face, neck). Prolongate suberythrodermal UV doses, which do not burn the skin but cause erythema in the histological level, can lead to formation of pyrimidine dimers in the dermal and epidermal tissues and cause DNA mutation with potential carcinogenic effects. Due to a large number of outdoor occupations, it is likely that outdoor workers (OWs) with a history of UV exposure may develop BCCs with different features than those seen in indoor workers (IWs). However, there has been debate about the relevance of occupational UV exposure as a risk factor for BCC development.6,7 The aim of this study was to compare the clinical and histological features of BCCs in OWs versus IWs at a referral hospital in southern Spain.
Methods
Using the electronic pathology records at a referral hospital in southern Spain, we identified medical records between May 1, 2010, and May 1, 2011, of specimens containing the term skin in the specimen box and basal cell carcinoma in the diagnosis box. We excluded patients with a history of or concomitant squamous cell carcinoma. Reexcision of incompletely excised lesions; punch, shave or incisional biopsies; and palliative excisions also were excluded. The specimens were reviewed and classified according to the differentiation pattern of BCC (ie, nodular, superficial, morpheic, micronodular). Basal cell carcinomas with mixed features were classified according to the most predominant subtype.
We also gathered information regarding the patients’ work history (ie, any job held during their lifetime with a minimum duration of 6 months). Patients were asked about the type of work and start/end dates. In patients who performed OW, we evaluated hours per day and months as well as the type of clothing worn (eg, head covering, socks/stockings during work in the summer months).
Each patient was classified as an OW or IW based on his/her stated occupation. The OWs included those who performed all or most of their work (≥6 hours per day for at least 6 months) outdoors in direct sunlight. Most patients in this group included farmers and fishermen. Indoor workers were those who performed most of their work in an indoor environment (eg, shop, factory, office, hospital, library, bank, school, laboratory). Most patients in this group included mechanics and shop assistants. A small group of individuals could not be classified as OWs or IWs and therefore were excluded from the study. Individuals with a history of exposure to ionizing radiation, chemical carcinogenesis, immunosuppression, or predisposing syndromes also were excluded.
We included variables that could be considered independent risk factors for BCC, including age, sex, eye color, natural hair color, Fitzpatrick skin type, history of sunburns, and family history. All data were collected via a personal interview performed by a single dermatologist (H.H-E.) during the follow-up with the patients conducted after obtaining all medical records and contacting eligible patients; none of the patients were lost on follow-up.
The study was approved by the hospital’s ethics committee and written consent was obtained from all recruited patients for analyzing the data acquired and accessing the relevant diagnostic documents (eg, pathology reports).
The cohorts were compared by a χ2 test and Student t test, which were performed using the SPSS software version 15. Statistical significance was determined using α=.05, and all tests were 2-sided.
Results
A total of 308 patients were included in the study, comprising 178 (58%) OWs and 130 (42%) IWs. Table 1 summarizes the characteristics of each cohort with the statistical outcomes.
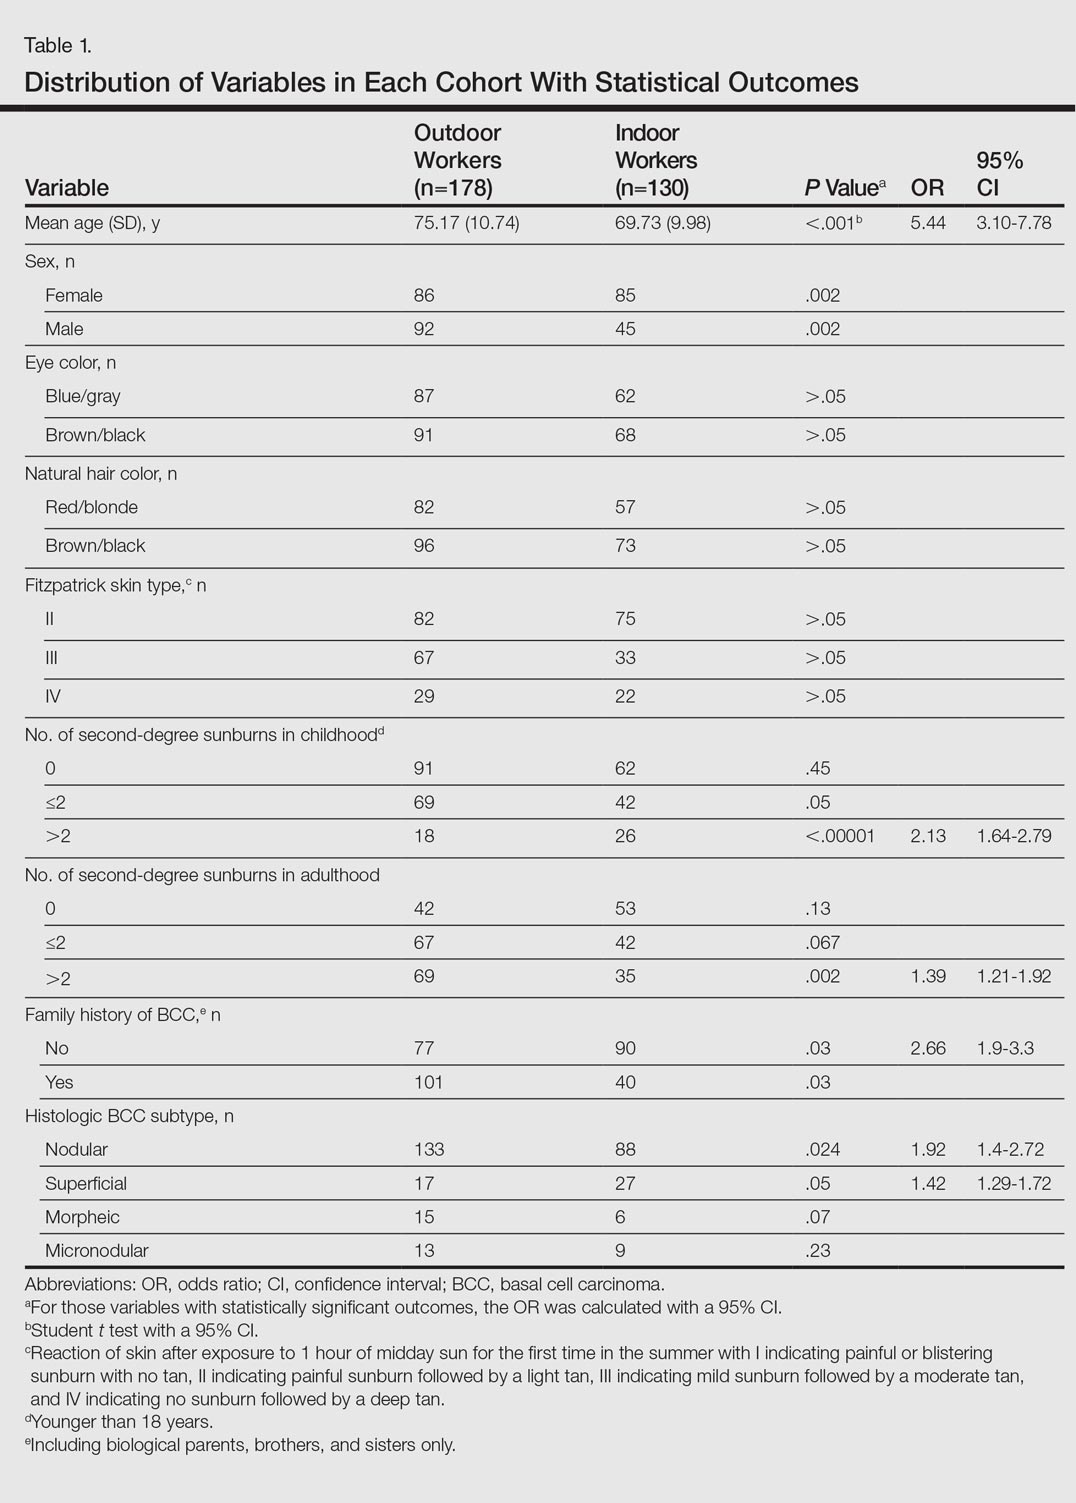
The mean age (SD) of the OWs was significantly higher than the IWs (75.17 [10.74] vs 69.73 [9.98] years; P<.001). The sex distribution among the 2 cohorts was significantly different (P=.002); the OW group featured a slightly higher proportion of men than women (92 [52%] vs 86 [48%]), whereas women were clearly more prevalent in the IW group than men (85 [65%] vs 45 [35%]).
No significant differences regarding eye color (blue/gray vs brown/black) between the 2 cohorts were found (P>.05). In the same way, the 2 cohorts did not show differences in the natural hair color (red/blonde vs brown/black)(P>.05).
Fitzpatrick skin type II was the most common between both cohorts (82 [46%] OWs and 75 [58%] IWs), but no statistical differences regarding the proportions of each skin type were found (P>.05).
History of sunburns (>2 episodes) was significantly different between the 2 cohorts. The incidence of second-degree sunburns in childhood was higher in IWs (P<.00001), while the incidence of second-degree sunburns in adulthood was higher in OWs (P=.002).
Most OWs had a positive family history of BCC (101 [57%]), while the majority of IWs had a negative family history of BCC (90 [69%]). This difference was statistically significant (P=.03).
Table 2 shows the distribution of anatomic sites of BCCs in OWs and IWs. The nose was the most frequently affected area in OWs (35 cases [20%]), while the cheek was the most common location (23 [18%]) in IWs. Comparison of the frequency of BCC incidence for each anatomic location revealed that only the rate for truncal BCC was significantly different; IWs had a higher incidence of truncal BCCs than OWs (P=.0035). Although the differences between groups were not statistically significant, there was a trend toward a higher incidence of BCCs on the forehead in OW (P=.06).
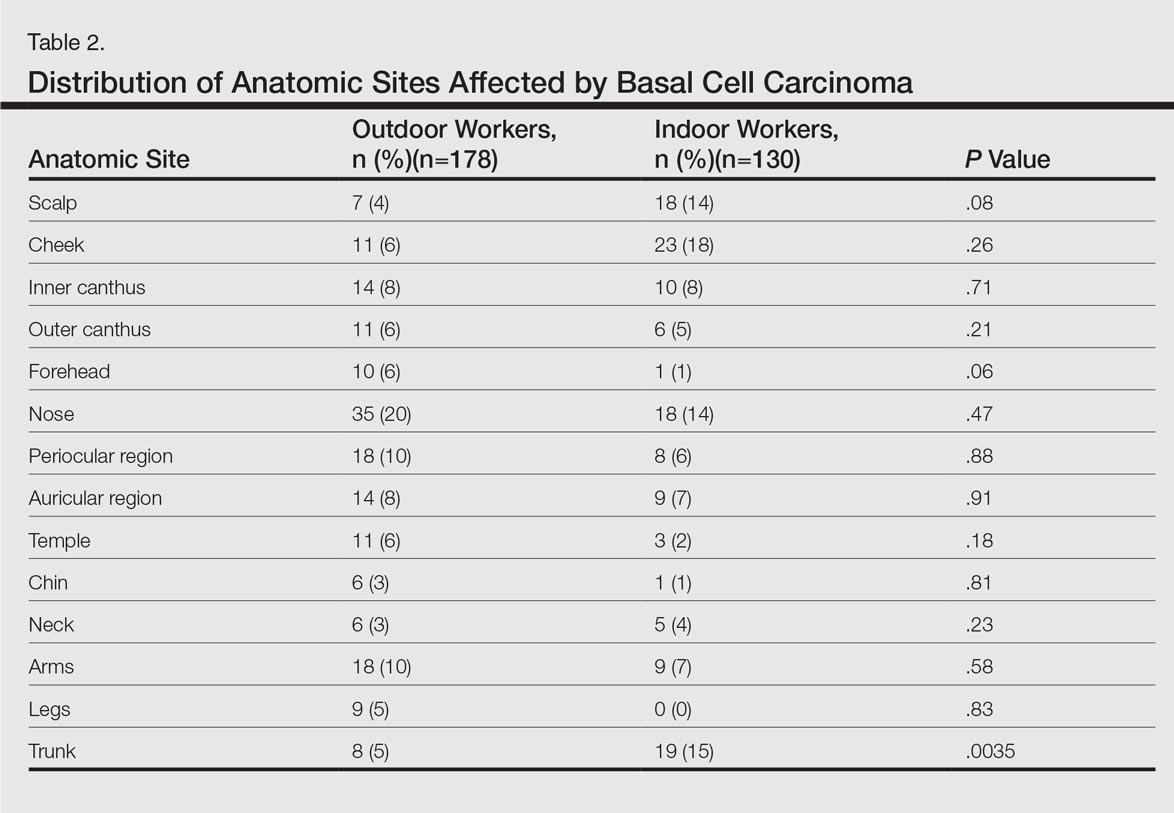
In both cohorts, the most prevalent histologic subtype was nodular BCC (133 [75%] OWs and 88 [68%] IWs), followed by superficial BCC (17 [10%] OWs and 27 [21%] IWs). The incidence rate of nodular BCCs was statistically different between the 2 cohorts, with OWs showing a higher incidence compared to IWs (P=.024). Regarding the superficial subtype, the opposite was observed: IWs had significantly increased risk compared to OWs (P=.05). There was a trend toward a higher incidence of morpheic BCCs in OWs than IWs, but the difference was not statistically significant (P=.07).
Comment
Skin cancer due to occupational UV exposure is more common than is generally recognized,6,7 but occupational UV exposure as a risk factor for BCC is still an ongoing debate. In this study, we analyzed the different clinical and histological features of BCC in OWs versus IWs.
The geographic area where this study was performed is characterized by a subtropical Mediterranean climate with irregular rainfall; a short, cool to mild winter; and long, dry, hot summers. Summer temperatures usually are hot and regularly exceed 35°C (95°F). UV index (UVI) is a measure of the amount of skin-damaging UV radiation expected to reach the earth’s surface when the sun is highest in the sky (around midday) and ranges from 1 (low risk) to 10 (maximum risk). In southern Spain, the mean UVI is approximately 6 and can reach up to 9 or sometimes 10 in the summer months. Although Fitzpatrick skin types II and III are most common, the elevated UVI indicates that the general population in southern Spain is at a high risk for developing skin cancer.
In our study the mean age of IWs was lower than OWs, which suggests that IWs may develop BCC at a younger age than OWs. This finding is consistent with studies showing that cumulative occupational UV exposure has been associated with development of BCCs in older age groups, while acute intermittent recreational sun exposure, particularly sustained in childhood and adolescence, is linked with BCC in younger patients.6
The role of sex as a risk factor for BCC remains unclear. Some reports show that BCC is more common in men than in women.8-10 In our study, sex distribution was statistically significant (P=.002); there were more women in the IW cohort and more men in the OW cohort. These differences may be explained by cultural and lifestyle patterns, as women who are IWs tend to have office jobs in urban settings and wear modern fashion clothes at work and for recreation. In rural settings, women have agricultural jobs and tend to wear more traditional clothes that offer sun protection.
Positive family history has been suggested to be a constitutional risk factor for BCC development.8,11,12 In our study, we observed that positive family history was more common in OWs, while most IWs had a negative family history. These differences were significant (P=.03), and OWs had a 2.6-fold increased likelihood of having a positive family history of BCC compared to IWs. Cultural and lifestyle patterns may partially explain this finding. In rural settings, workers tend to have the same job as their parents as a traditional way of life and therefore have similar patterns of UV exposure; in urban settings, individuals may have different jobs than their parents and therefore the pattern of UV exposure may be different. However, a genetic predisposition for developing BCC cannot be excluded. In addition, we have to consider that the information on family history of BCC in the patients was self-reported and not validated, which may limit the results.
The difference in history of second-degree sunburn in childhood was significantly higher in IWs than in OWs (P<.00001). The OW group had a significant rate of sunburns in adulthood (P=.002). The relationship between UV radiation and BCC is complex, and the patterns of sun exposure and their occurrence in different periods of lifetime (ie, childhood vs adulthood) remain controversial.13 The overall history of severe sunburns seems to be more important than simply the tendency to burn or tan,14,15 and a history of sunburns in childhood and adolescence has been associated with early-onset BCC.6 Our findings were consistent in that the age of onset of BCCs was lower in IWs who had a history of sunburns in childhood. Basal cell carcinomas developed at older ages in OWs who had a higher incidence of sunburns in adulthood. However, we have to consider that the retrospective nature of the data collection on sunburns in childhood and adulthood was potentially limited, as the information was based on the patients’ memory. Additionally, other non-UV risk factors for BCC, such as ionizing radiation exposure, were not analyzed.
The majority of BCCs developed in sun-exposed areas of the head and neck in both cohorts, and only 35 (20%) and 28 (22%) BCCs were located on the trunk, arms, or legs in OWs and IWs, respectively. In our study, the rate of BCCs on the trunk was significantly lower in OWs than in IWs (P=.0035). Basal cell carcinomas on the trunk have been suggested to be linked to genetic susceptibility16,17 and reduced DNA repair capacity18 rather than sun exposure. Our findings support this hypothesis and suggest that occupational sun exposure has no direct relation with truncal BCC. This outcome is consistent with the result of a case-control study conducted by Pelucchi et al19 (N=1040). The authors concluded that occupational UV exposure was not associated with truncal BCC development but with head/neck BCC, indicating that there may be different etiological mechanisms between truncal and head/neck BCC.19 In the largest BCC case series published in the literature with 13,457 specimens, the authors stated that tumors on the trunk may represent a particular variant of BCC, in which the theory of chronic versus intermittent UV exposure cannot be simply extrapolated as it is for the rest of BCC sites. Other factors such as genetic predisposition could be involved in the development of truncal BCC.20 Similarly, Ramos et al21 suggested that nonmelanoma skin cancers in sun-protected anatomic sites may occur in individuals with impairment in the DNA repair process.
The classification of histological subtypes of BCC helps to predict tumor behavior,22 which can impact the prognosis. In our study, nodular BCC was the most common subtype in both cohorts, followed by superficial BCC. The nodular subtype was increased in OWs compared to IWs, while the superficial subtype was most common in IWs. Bastiaens et al23 and McCormack et al24 have suggested that the most frequent subtypes of BCC (nodular and superficial) may represent different tumors with distinct causal factors. According to these authors, nodular subtypes are associated with cumulative UV exposure, while superficial subtypes are associated with more intense and intermittent UV exposure. The results of the current study support this hypothesis, as the OW cohort with cumulative UV exposure showed more incidence of nodular BCC than IWs, while the patients with intense and intermittent sun exposure (the IWs) showed more risk of superficial BCC.
The importance of occupational UV exposure in OWs as a risk factor for BCC is still an ongoing discussion. Our data show that occupational UV exposure may be considered an etiological factor for BCC according to histological subtype and anatomic site. Our study is limited by the retrospective nature of the data collection regarding occupation and childhood sunburns, which were based on the patients’ memory and therefore potentially biased. Data regarding family history of BCC also was self-reported and not validated. Another limiting factor was that other non-UV risk factors for BCC, such as ionizing radiation exposure, were not considered. The limited sample size also may have impacted the study results. Among the strengths of the study are the complete response rate, the similar catchment area of OWs and IWs, the common hospital setting of the 2 cohorts, and the similar attention to medical history. All patients were obtained from the practice of a single referral dermatologist and are felt to be representative of our working area. The use of a single dermatologist reduces provider-associated variability.
Conclusion
According to the results of this study, OWs are more likely to develop nodular BCCs with no increased risk for superficial BCCs. The age of onset in OWs is older than in IWs. Some anatomical sites such as the trunk are more commonly affected in IWs. Truncal BCCs may have etiological factors other than UV exposure, such as a genetic predisposition. This study is useful to occupational safety representatives and physicians to stimulate the implementation of prevention strategies for this easily preventable malignancy and may encourage further research.
- de Vries E, van de Poll-Franse LV, Louwman WJ, et al. Predictions of skin cancer incidence in the Netherlands up to 2015. Br J Dermatol. 2005;152:481-488.
- Miller DL, Weinstock MA. Nonmelanoma skin cancer in the United States: incidence. J Am Acad Dermatol. 1994;30:774-778.
- Diepgen TL, Mahler V. The epidemiology of skin cancer. Br J Dermatol. 2002;146(suppl 61):1-6.
- Netscher DT, Spira M. Basal cell carcinoma: an overview of tumor biology and treatment. Plast Reconstr Surg. 2004;113:e74-e94.
- Miller SJ. Etiology and pathogenesis of basal cell carcinoma. Clin Dermatol. 1995;13:527-536.
- Dessinioti C, Tzannis K, Sypsa V, et al. Epidemiologic risk factors of basal cell carcinoma development and age at onset in a Southern European population from Greece. Exp Dermatol. 2011;20:622-626.
- Bauer A, Diepgen TL, Schmitt J. Is occupational solar UV-irradiation a relevant risk factor for basal cell carcinoma? a systematic review and meta-analysis of the epidemiologic literature. Br J Dermatol. 2011;165:612-625.
- Tran H, Chen K, Shumack S. Epidemiology and aetiology of basal cell carcinoma. Br J Dermatol. 2003;149(suppl 66):50-52.
- Armstrong BK, Kricker A. The epidemiology of UV induced skin cancer. J Photochem Photobiol B. 2001;63:8-18.
- Stern RS. The mysteries of geographic variability in nonmelanoma skin cancer incidence. Arch Dermatol. 1999;135:843-844.
- Chinem VP, Miot HA. Epidemiology of basal cell carcinoma. An Bras Dermatol. 2011;86:292-305.
- Wong CS, Strange RC, Lear JT. Basal cell carcinoma. Br Med J. 2003;327:794-798.
- Dessinioti C, Antoniou C, Katsambas AD, et al. Basal cell carcinoma: what’s new under the sun. Photochem Photobiol. 2010;86:481-491.
- Van Dam RM, Huang Z, Rimm EB, et al. Risk factors for basal cell carcinoma of the skin in men: results from the health professionals follow-up study. Am J Epidemiol. 1999;150:459-468.
- Hunter DJ, Colditz GA, Stampfer MJ, et al. Risk factors for basal cell carcinoma in a prospective cohort of women. Ann Epidemiol. 1990;1:13-23.
- Ramachandran S, Fryer AA, Smith A, et al. Cutaneous basal cell carcinomas: distinct host factors are associated with the development of tumors on the trunk and on the head and neck. Cancer. 2001;92:354-358.
- Ramachandran S, Lear JT, Ramsay H, et al. Presentation with multiple cutaneous basal cell carcinomas: association of glutathione S-transferase and cytochrome P450 genotypes with clinical phenotype. Cancer Epidemiol Biomarkers Prev. 1999;8:61-67.
- Wei Q, Matanoski GM, Farmer ER, et al. DNA repair and aging in basal cell carcinoma: a molecular epidemiology study. Proc Natl Acad Sci USA. 1993;90:1614-1618.
- Pelucchi C, Di Landro A, Naldi L, et al. Risk factors for histological types and anatomic sites of cutaneous basal-cell carcinoma: an Italian case-control study [published online ahead of print Oct 19, 2006]. J Invest Dermatol. 2007;127:935-944.
- Scrivener Y, Grosshans E, Cribier B. Variations of basal cell carcinomas according to gender, age, location and histopathological subtype. Br J Dermatol. 2002;147:41-47.
- Ramos J, Villa J, Ruiz A, et al. UV dose determines key characteristics of nonmelanoma skin cancer. Cancer Epidemiol Biomarkers Prev. 2004;13:2006-2011.
- Rippey JJ. Why classify basal cell carcinomas? Histopathology. 1998;32:393-398.
- Bastiaens MT, Hoefnagel JJ, Bruijn JA, et al. Differences in age, site distribution and sex between nodular and superficial basal cell carcinomas indicate different type of tumors. J Invest Dermatol. 1998;110:880-884.
- McCormack CJ, Kelly JW, Dorevitch AP. Differences in age and body site distribution of histological subtypes of basal cell carcinoma. a possible indicator of different causes. Arch Dermatol. 1997;133:593-596.
Basal cell carcinoma (BCC) is the most prevalent malignancy in white individuals and its incidence is rapidly increasing. Despite its low mortality rate, BCC can cause severe morbidity and remains a serious health problem with a high economic burden for health care systems. The incidence of BCC is higher in individuals who have red or blonde hair, light eye color, and/or Fitzpatrick skin types I and II. The risk for developing BCC also increases with age, and men are more frequently affected than women.1,2 Although several factors have been implicated in the etiology of this condition, such as exposure to ionizing radiation, trauma, chemical carcinogenesis, immunosuppression, predisposing syndromes, and host factors (eg, traits that affect susceptibility to disease),3-5 exposure to UV radiation is considered to be a major risk factor, with most BCCs presenting in sun-exposed areas of the body (eg, face, neck). Prolongate suberythrodermal UV doses, which do not burn the skin but cause erythema in the histological level, can lead to formation of pyrimidine dimers in the dermal and epidermal tissues and cause DNA mutation with potential carcinogenic effects. Due to a large number of outdoor occupations, it is likely that outdoor workers (OWs) with a history of UV exposure may develop BCCs with different features than those seen in indoor workers (IWs). However, there has been debate about the relevance of occupational UV exposure as a risk factor for BCC development.6,7 The aim of this study was to compare the clinical and histological features of BCCs in OWs versus IWs at a referral hospital in southern Spain.
Methods
Using the electronic pathology records at a referral hospital in southern Spain, we identified medical records between May 1, 2010, and May 1, 2011, of specimens containing the term skin in the specimen box and basal cell carcinoma in the diagnosis box. We excluded patients with a history of or concomitant squamous cell carcinoma. Reexcision of incompletely excised lesions; punch, shave or incisional biopsies; and palliative excisions also were excluded. The specimens were reviewed and classified according to the differentiation pattern of BCC (ie, nodular, superficial, morpheic, micronodular). Basal cell carcinomas with mixed features were classified according to the most predominant subtype.
We also gathered information regarding the patients’ work history (ie, any job held during their lifetime with a minimum duration of 6 months). Patients were asked about the type of work and start/end dates. In patients who performed OW, we evaluated hours per day and months as well as the type of clothing worn (eg, head covering, socks/stockings during work in the summer months).
Each patient was classified as an OW or IW based on his/her stated occupation. The OWs included those who performed all or most of their work (≥6 hours per day for at least 6 months) outdoors in direct sunlight. Most patients in this group included farmers and fishermen. Indoor workers were those who performed most of their work in an indoor environment (eg, shop, factory, office, hospital, library, bank, school, laboratory). Most patients in this group included mechanics and shop assistants. A small group of individuals could not be classified as OWs or IWs and therefore were excluded from the study. Individuals with a history of exposure to ionizing radiation, chemical carcinogenesis, immunosuppression, or predisposing syndromes also were excluded.
We included variables that could be considered independent risk factors for BCC, including age, sex, eye color, natural hair color, Fitzpatrick skin type, history of sunburns, and family history. All data were collected via a personal interview performed by a single dermatologist (H.H-E.) during the follow-up with the patients conducted after obtaining all medical records and contacting eligible patients; none of the patients were lost on follow-up.
The study was approved by the hospital’s ethics committee and written consent was obtained from all recruited patients for analyzing the data acquired and accessing the relevant diagnostic documents (eg, pathology reports).
The cohorts were compared by a χ2 test and Student t test, which were performed using the SPSS software version 15. Statistical significance was determined using α=.05, and all tests were 2-sided.
Results
A total of 308 patients were included in the study, comprising 178 (58%) OWs and 130 (42%) IWs. Table 1 summarizes the characteristics of each cohort with the statistical outcomes.
The mean age (SD) of the OWs was significantly higher than the IWs (75.17 [10.74] vs 69.73 [9.98] years; P<.001). The sex distribution among the 2 cohorts was significantly different (P=.002); the OW group featured a slightly higher proportion of men than women (92 [52%] vs 86 [48%]), whereas women were clearly more prevalent in the IW group than men (85 [65%] vs 45 [35%]).
No significant differences regarding eye color (blue/gray vs brown/black) between the 2 cohorts were found (P>.05). In the same way, the 2 cohorts did not show differences in the natural hair color (red/blonde vs brown/black)(P>.05).
Fitzpatrick skin type II was the most common between both cohorts (82 [46%] OWs and 75 [58%] IWs), but no statistical differences regarding the proportions of each skin type were found (P>.05).
History of sunburns (>2 episodes) was significantly different between the 2 cohorts. The incidence of second-degree sunburns in childhood was higher in IWs (P<.00001), while the incidence of second-degree sunburns in adulthood was higher in OWs (P=.002).
Most OWs had a positive family history of BCC (101 [57%]), while the majority of IWs had a negative family history of BCC (90 [69%]). This difference was statistically significant (P=.03).
Table 2 shows the distribution of anatomic sites of BCCs in OWs and IWs. The nose was the most frequently affected area in OWs (35 cases [20%]), while the cheek was the most common location (23 [18%]) in IWs. Comparison of the frequency of BCC incidence for each anatomic location revealed that only the rate for truncal BCC was significantly different; IWs had a higher incidence of truncal BCCs than OWs (P=.0035). Although the differences between groups were not statistically significant, there was a trend toward a higher incidence of BCCs on the forehead in OW (P=.06).
In both cohorts, the most prevalent histologic subtype was nodular BCC (133 [75%] OWs and 88 [68%] IWs), followed by superficial BCC (17 [10%] OWs and 27 [21%] IWs). The incidence rate of nodular BCCs was statistically different between the 2 cohorts, with OWs showing a higher incidence compared to IWs (P=.024). Regarding the superficial subtype, the opposite was observed: IWs had significantly increased risk compared to OWs (P=.05). There was a trend toward a higher incidence of morpheic BCCs in OWs than IWs, but the difference was not statistically significant (P=.07).
Comment
Skin cancer due to occupational UV exposure is more common than is generally recognized,6,7 but occupational UV exposure as a risk factor for BCC is still an ongoing debate. In this study, we analyzed the different clinical and histological features of BCC in OWs versus IWs.
The geographic area where this study was performed is characterized by a subtropical Mediterranean climate with irregular rainfall; a short, cool to mild winter; and long, dry, hot summers. Summer temperatures usually are hot and regularly exceed 35°C (95°F). UV index (UVI) is a measure of the amount of skin-damaging UV radiation expected to reach the earth’s surface when the sun is highest in the sky (around midday) and ranges from 1 (low risk) to 10 (maximum risk). In southern Spain, the mean UVI is approximately 6 and can reach up to 9 or sometimes 10 in the summer months. Although Fitzpatrick skin types II and III are most common, the elevated UVI indicates that the general population in southern Spain is at a high risk for developing skin cancer.
In our study the mean age of IWs was lower than OWs, which suggests that IWs may develop BCC at a younger age than OWs. This finding is consistent with studies showing that cumulative occupational UV exposure has been associated with development of BCCs in older age groups, while acute intermittent recreational sun exposure, particularly sustained in childhood and adolescence, is linked with BCC in younger patients.6
The role of sex as a risk factor for BCC remains unclear. Some reports show that BCC is more common in men than in women.8-10 In our study, sex distribution was statistically significant (P=.002); there were more women in the IW cohort and more men in the OW cohort. These differences may be explained by cultural and lifestyle patterns, as women who are IWs tend to have office jobs in urban settings and wear modern fashion clothes at work and for recreation. In rural settings, women have agricultural jobs and tend to wear more traditional clothes that offer sun protection.
Positive family history has been suggested to be a constitutional risk factor for BCC development.8,11,12 In our study, we observed that positive family history was more common in OWs, while most IWs had a negative family history. These differences were significant (P=.03), and OWs had a 2.6-fold increased likelihood of having a positive family history of BCC compared to IWs. Cultural and lifestyle patterns may partially explain this finding. In rural settings, workers tend to have the same job as their parents as a traditional way of life and therefore have similar patterns of UV exposure; in urban settings, individuals may have different jobs than their parents and therefore the pattern of UV exposure may be different. However, a genetic predisposition for developing BCC cannot be excluded. In addition, we have to consider that the information on family history of BCC in the patients was self-reported and not validated, which may limit the results.
The difference in history of second-degree sunburn in childhood was significantly higher in IWs than in OWs (P<.00001). The OW group had a significant rate of sunburns in adulthood (P=.002). The relationship between UV radiation and BCC is complex, and the patterns of sun exposure and their occurrence in different periods of lifetime (ie, childhood vs adulthood) remain controversial.13 The overall history of severe sunburns seems to be more important than simply the tendency to burn or tan,14,15 and a history of sunburns in childhood and adolescence has been associated with early-onset BCC.6 Our findings were consistent in that the age of onset of BCCs was lower in IWs who had a history of sunburns in childhood. Basal cell carcinomas developed at older ages in OWs who had a higher incidence of sunburns in adulthood. However, we have to consider that the retrospective nature of the data collection on sunburns in childhood and adulthood was potentially limited, as the information was based on the patients’ memory. Additionally, other non-UV risk factors for BCC, such as ionizing radiation exposure, were not analyzed.
The majority of BCCs developed in sun-exposed areas of the head and neck in both cohorts, and only 35 (20%) and 28 (22%) BCCs were located on the trunk, arms, or legs in OWs and IWs, respectively. In our study, the rate of BCCs on the trunk was significantly lower in OWs than in IWs (P=.0035). Basal cell carcinomas on the trunk have been suggested to be linked to genetic susceptibility16,17 and reduced DNA repair capacity18 rather than sun exposure. Our findings support this hypothesis and suggest that occupational sun exposure has no direct relation with truncal BCC. This outcome is consistent with the result of a case-control study conducted by Pelucchi et al19 (N=1040). The authors concluded that occupational UV exposure was not associated with truncal BCC development but with head/neck BCC, indicating that there may be different etiological mechanisms between truncal and head/neck BCC.19 In the largest BCC case series published in the literature with 13,457 specimens, the authors stated that tumors on the trunk may represent a particular variant of BCC, in which the theory of chronic versus intermittent UV exposure cannot be simply extrapolated as it is for the rest of BCC sites. Other factors such as genetic predisposition could be involved in the development of truncal BCC.20 Similarly, Ramos et al21 suggested that nonmelanoma skin cancers in sun-protected anatomic sites may occur in individuals with impairment in the DNA repair process.
The classification of histological subtypes of BCC helps to predict tumor behavior,22 which can impact the prognosis. In our study, nodular BCC was the most common subtype in both cohorts, followed by superficial BCC. The nodular subtype was increased in OWs compared to IWs, while the superficial subtype was most common in IWs. Bastiaens et al23 and McCormack et al24 have suggested that the most frequent subtypes of BCC (nodular and superficial) may represent different tumors with distinct causal factors. According to these authors, nodular subtypes are associated with cumulative UV exposure, while superficial subtypes are associated with more intense and intermittent UV exposure. The results of the current study support this hypothesis, as the OW cohort with cumulative UV exposure showed more incidence of nodular BCC than IWs, while the patients with intense and intermittent sun exposure (the IWs) showed more risk of superficial BCC.
The importance of occupational UV exposure in OWs as a risk factor for BCC is still an ongoing discussion. Our data show that occupational UV exposure may be considered an etiological factor for BCC according to histological subtype and anatomic site. Our study is limited by the retrospective nature of the data collection regarding occupation and childhood sunburns, which were based on the patients’ memory and therefore potentially biased. Data regarding family history of BCC also was self-reported and not validated. Another limiting factor was that other non-UV risk factors for BCC, such as ionizing radiation exposure, were not considered. The limited sample size also may have impacted the study results. Among the strengths of the study are the complete response rate, the similar catchment area of OWs and IWs, the common hospital setting of the 2 cohorts, and the similar attention to medical history. All patients were obtained from the practice of a single referral dermatologist and are felt to be representative of our working area. The use of a single dermatologist reduces provider-associated variability.
Conclusion
According to the results of this study, OWs are more likely to develop nodular BCCs with no increased risk for superficial BCCs. The age of onset in OWs is older than in IWs. Some anatomical sites such as the trunk are more commonly affected in IWs. Truncal BCCs may have etiological factors other than UV exposure, such as a genetic predisposition. This study is useful to occupational safety representatives and physicians to stimulate the implementation of prevention strategies for this easily preventable malignancy and may encourage further research.
- de Vries E, van de Poll-Franse LV, Louwman WJ, et al. Predictions of skin cancer incidence in the Netherlands up to 2015. Br J Dermatol. 2005;152:481-488.
- Miller DL, Weinstock MA. Nonmelanoma skin cancer in the United States: incidence. J Am Acad Dermatol. 1994;30:774-778.
- Diepgen TL, Mahler V. The epidemiology of skin cancer. Br J Dermatol. 2002;146(suppl 61):1-6.
- Netscher DT, Spira M. Basal cell carcinoma: an overview of tumor biology and treatment. Plast Reconstr Surg. 2004;113:e74-e94.
- Miller SJ. Etiology and pathogenesis of basal cell carcinoma. Clin Dermatol. 1995;13:527-536.
- Dessinioti C, Tzannis K, Sypsa V, et al. Epidemiologic risk factors of basal cell carcinoma development and age at onset in a Southern European population from Greece. Exp Dermatol. 2011;20:622-626.
- Bauer A, Diepgen TL, Schmitt J. Is occupational solar UV-irradiation a relevant risk factor for basal cell carcinoma? a systematic review and meta-analysis of the epidemiologic literature. Br J Dermatol. 2011;165:612-625.
- Tran H, Chen K, Shumack S. Epidemiology and aetiology of basal cell carcinoma. Br J Dermatol. 2003;149(suppl 66):50-52.
- Armstrong BK, Kricker A. The epidemiology of UV induced skin cancer. J Photochem Photobiol B. 2001;63:8-18.
- Stern RS. The mysteries of geographic variability in nonmelanoma skin cancer incidence. Arch Dermatol. 1999;135:843-844.
- Chinem VP, Miot HA. Epidemiology of basal cell carcinoma. An Bras Dermatol. 2011;86:292-305.
- Wong CS, Strange RC, Lear JT. Basal cell carcinoma. Br Med J. 2003;327:794-798.
- Dessinioti C, Antoniou C, Katsambas AD, et al. Basal cell carcinoma: what’s new under the sun. Photochem Photobiol. 2010;86:481-491.
- Van Dam RM, Huang Z, Rimm EB, et al. Risk factors for basal cell carcinoma of the skin in men: results from the health professionals follow-up study. Am J Epidemiol. 1999;150:459-468.
- Hunter DJ, Colditz GA, Stampfer MJ, et al. Risk factors for basal cell carcinoma in a prospective cohort of women. Ann Epidemiol. 1990;1:13-23.
- Ramachandran S, Fryer AA, Smith A, et al. Cutaneous basal cell carcinomas: distinct host factors are associated with the development of tumors on the trunk and on the head and neck. Cancer. 2001;92:354-358.
- Ramachandran S, Lear JT, Ramsay H, et al. Presentation with multiple cutaneous basal cell carcinomas: association of glutathione S-transferase and cytochrome P450 genotypes with clinical phenotype. Cancer Epidemiol Biomarkers Prev. 1999;8:61-67.
- Wei Q, Matanoski GM, Farmer ER, et al. DNA repair and aging in basal cell carcinoma: a molecular epidemiology study. Proc Natl Acad Sci USA. 1993;90:1614-1618.
- Pelucchi C, Di Landro A, Naldi L, et al. Risk factors for histological types and anatomic sites of cutaneous basal-cell carcinoma: an Italian case-control study [published online ahead of print Oct 19, 2006]. J Invest Dermatol. 2007;127:935-944.
- Scrivener Y, Grosshans E, Cribier B. Variations of basal cell carcinomas according to gender, age, location and histopathological subtype. Br J Dermatol. 2002;147:41-47.
- Ramos J, Villa J, Ruiz A, et al. UV dose determines key characteristics of nonmelanoma skin cancer. Cancer Epidemiol Biomarkers Prev. 2004;13:2006-2011.
- Rippey JJ. Why classify basal cell carcinomas? Histopathology. 1998;32:393-398.
- Bastiaens MT, Hoefnagel JJ, Bruijn JA, et al. Differences in age, site distribution and sex between nodular and superficial basal cell carcinomas indicate different type of tumors. J Invest Dermatol. 1998;110:880-884.
- McCormack CJ, Kelly JW, Dorevitch AP. Differences in age and body site distribution of histological subtypes of basal cell carcinoma. a possible indicator of different causes. Arch Dermatol. 1997;133:593-596.
Practice Points
- Basal cell carcinoma (BCC) is the most common cancer in white individuals with rapidly increasing incidence rates and a high economic burden.
- Despite a large number of epidemiologic studies and the known importance of UV exposure in BCC carcinogenesis, there are no clear conclusions regarding the role of chronic and acute sun exposure related to BCC subtypes.
- It is reasonable to assume that outdoor workers with a history of UV exposure may develop BCCs with different features than those observed in indoor workers.

How in-office and ambulatory BP monitoring compare: A systematic review and meta-analysis
ABSTRACT
Purpose We performed a literature review and meta-analysis to ascertain the validity of office blood pressure (BP) measurement in a primary care setting, using ambulatory blood pressure measurement (ABPM) as a benchmark in the monitoring of hypertensive patients receiving treatment.
Methods We conducted a literature search for studies published up to December 2013 that included hypertensive patients receiving treatment in a primary care setting. We compared the mean office BP with readings obtained by ABPM. We summarized the diagnostic accuracy of office BP with respect to ABPM in terms of sensitivity, specificity, and positive and negative likelihood ratios (LR), with a 95% confidence interval (CI).
Results Only 12 studies met the inclusion criteria and contained data to calculate the differences between the means of office and ambulatory BP measurements. Five were suitable for calculating sensitivity, specificity, and likelihood ratios, and 4 contained sufficient extractable data for meta-analysis. Compared with ABPM (thresholds of 140/90 mm Hg for office BP; 130/80 mmHg for ABPM) in diagnosing uncontrolled BP, office BP measurement had a sensitivity of 81.9% (95% CI, 74.8%-87%) and specificity of 41.1% (95% CI, 35.1%-48.4%). Positive LR was 1.35 (95% CI, 1.32-1.38), and the negative LR was 0.44 (95% CI, 0.37-0.53).
Conclusion Likelihood ratios show that isolated BP measurement in the office does not confirm or rule out the presence of poor BP control. Likelihood of underestimating or overestimating BP control is high when relying on in-office BP measurement alone.
A growing body of evidence supports more frequent use of ambulatory blood pressure monitoring (ABPM) to confirm a diagnosis of hypertension1 and to monitor blood pressure (BP) response to treatment.2 The Joint National Committee on Prevention, Detection, Evaluation, and Treatment of High Blood Pressure has long accepted ABPM for diagnosis of hypertension,3 and many clinicians consider ABPM the reference standard for diagnosing true hypertension and for accurately assessing associated cardiovascular risk in adults, regardless of office BP readings.4 The US Preventive Services Task Force (USPSTF) recommends obtaining BP measurements outside the clinical setting to confirm a diagnosis of hypertension before starting treatment.5 The USPSTF also asserts that elevated 24-hour ambulatory systolic BP is consistently and significantly associated with stroke and other cardiovascular events independent of office BP readings and has greater predictive value than office monitoring.5 The USPSTF concludes that ABPM, because of its large evidence base, is the best confirmatory test for hypertension.6 The recommendation of the American Academy of Family Physicians is similar to that of the USPSTF.7
The challenge. Despite the considerable support for ABPM, this method of BP measurement is still not sufficiently integrated into primary care. And some guidelines, such as those of
But ABPM’s advantages are numerous. Ambulatory monitors, which can record BP for 24 hours, are typically programmed to take readings every 15 to 30 minutes, providing estimates of mean daytime and nighttime BP and revealing an individual’s circadian pattern of BP.8-10 Ambulatory BP values usually considered the uppermost limit of normal are 135/85 mm Hg (day), 120/70 mm Hg (night), and 130/80 mm Hg (24 hour).8
Office BP monitoring, usually performed manually by medical staff, has 2 main drawbacks: the well-known white-coat effect experienced by many patients, and the relatively small number of possible measurements. A more reliable in-office BP estimation of BP would require repeated measurements at each of several visits.
By comparing ABPM and office measurements, 4 clinical findings are possible: isolated clinic or office (white-coat) hypertension (ICH); isolated ambulatory (masked) hypertension (IAH); consistent normotension; or sustained hypertension. With ICH, BP is high in the office and normal with ABPM. With IAH, BP is normal in the office and high with ABPM. With consistent normotension and sustained hypertension, BP readings with both types of measurement agree.8,9
In patients being treated for hypertension, ICH leads to an overestimation of uncontrolled BP and may result in overtreatment. The cardiovascular risk, although controversial, is usually lower than in patients diagnosed with sustained hypertension.11 IAH leads to an underestimation of uncontrolled BP and may result in undertreatment; its associated cardiovascular risk is similar to that of sustained hypertension.12
Our research objective. We recently published a study conducted with 137 hypertensive patients in a primary care center.13 Our conclusion was that in-office measurement of BP had insufficient clinical validity to be recommended as a sole method of monitoring BP control. In accurately classifying BP as controlled or uncontrolled, clinic measurement agreed with 24h-ABPM in just 64.2% of cases.13
In our present study, we performed a literature review and meta-analysis to ascertain the validity of office BP measurement in a primary care setting, using ABPM as a benchmark in the monitoring of hypertensive patients receiving treatment.
METHODS
Most published studies comparing conventional office BP measurement with ABPM have been conducted with patients not taking antihypertensive medication. We excluded these studies and conducted a literature search for studies published up to December 2013 that included hypertensive patients receiving treatment in a primary care setting.
We searched Medline (from 1950 onward) and the Cochrane Database of Systematic Reviews. For the Medline search, we combined keywords for office BP, hypertension, and ambulatory BP with keywords for outpatient setting and primary care, using the following syntax: (((“clinic blood pressure” OR “office blood pressure” OR “casual blood pressure”))) AND (“hypertension” AND ((((“24-h ambulatory blood pressure”) OR “24 h ambulatory blood pressure”) OR “24 hour ambulatory blood pressure”) OR “blood pressure monitoring, ambulatory”[Mesh]) AND ((((((“outpatient setting”) OR “primary care”) OR “family care”) OR “family physician”) OR “family practice”) OR “general practice”)). We chose studies published in English and reviewed the titles and abstracts of identified articles.
With the aim of identifying additional candidate studies, we reviewed the reference lists of eligible primary studies, narrative reviews, and systematic reviews. The studies were generally of good quality and used appropriate statistical methods. Only primary studies qualified for meta-analysis.
Inclusion and exclusion criteria
Acceptable studies had to be conducted in a primary care setting with patients being treated for hypertension, and had to provide data comparing office BP measurement with ABPM. We excluded studies in which participants were treated in the hospital, were untreated, or had not been diagnosed with hypertension.
The quality of the studies included in the meta-analysis was judged by 2 independent observers according to the following criteria: the clear classification and initial comparison of both measurements; explicit and defined diagnostic criteria; compliance with the inclusion/exclusion criteria; and clear and precise definition of outcome variables.
Data extraction
We extracted the following data from each included study: study population, number of patients included, age, gender distribution, number of measurements (ambulatory and office BP), equipment validation, mean office and ambulatory BP, and the period of ambulatory BP measurement. We included adult patients of all ages, and we compared the mean office BP with those obtained by ABPM in hypertensive patients.
STATISTICAL ANALYSIS
For each study, we summarized the diagnostic accuracy of office BP with respect to ABPM in terms of sensitivity, specificity, and positive and negative likelihood ratios (LRs), with the 95% confidence interval (CI), if available. If these rates were not directly reported in the original papers, we used the published data to calculate them.
We used the R v2.15.1 software with the “mada” package for meta-analysis.14 Although a bivariate approach is preferred for the meta-analysis of diagnostic accuracy, it cannot be recommended if the number of primary studies to pool is too small,14 as happened in our case. Therefore, we used a univariate approach and pooled summary statistics for positive LR, negative LR, and the diagnostic odds ratio (DOR) with their 95% confidence intervals. We used the DerSimonian-Laird method to perform a random-effect meta-analysis. To explore heterogeneity between the studies, we used the Cochran’s Q heterogeneity test, I2 index, and Galbraith and L’Abbé plots.
RESULTS
Our search identified 237 studies, only 12 of which met the inclusion criteria and contained data to calculate the differences between the means of office and ambulatory BP measurements (TABLES 1 AND 2).15-26 Of these 12 studies, 5 were suitable for calculating sensitivity, specificity, and LR (TABLE 3),16,18,22,24,26 and 4 contained sufficient extractable data for meta-analysis. The study by Little et al18 was not included in the meta-analysis, as the number of true-positive, true-negative, false-positive, and false-negative results could not be deduced from published data.
The studies differed in sample size (40-31,530), patient ages (mean, 55-72.8 years), sex (percentage of men, 31%-52.9%), and number of measurements for office BP (1-9) and ABPM (32-96) (TABLE 1),15-26 as well as in daytime and nighttime periods for ABPM and BP thresholds, and in differences between the mean office and ambulatory BPs (TABLE 2).15-26
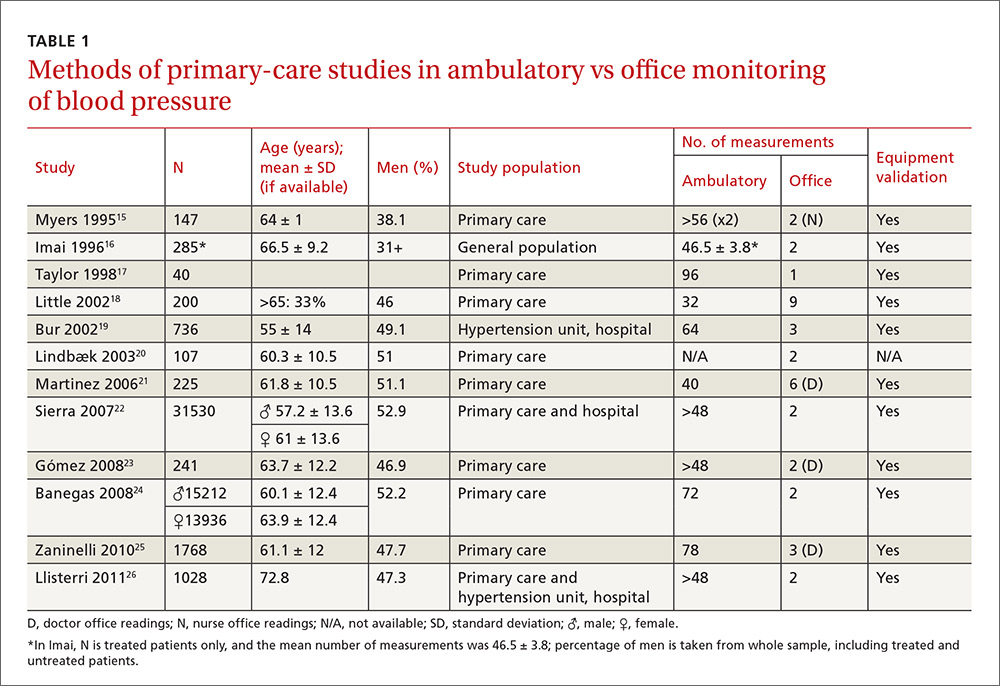
In general, the mean office BP measurements were higher than those obtained with ABPM in any period—from 5/0 mm Hg to 27.4/10.1 mm Hg in the day, and from 7.9/6.3 mm Hg to 31.2/13.7 mm Hg over 24 hours (TABLE 2).15-26
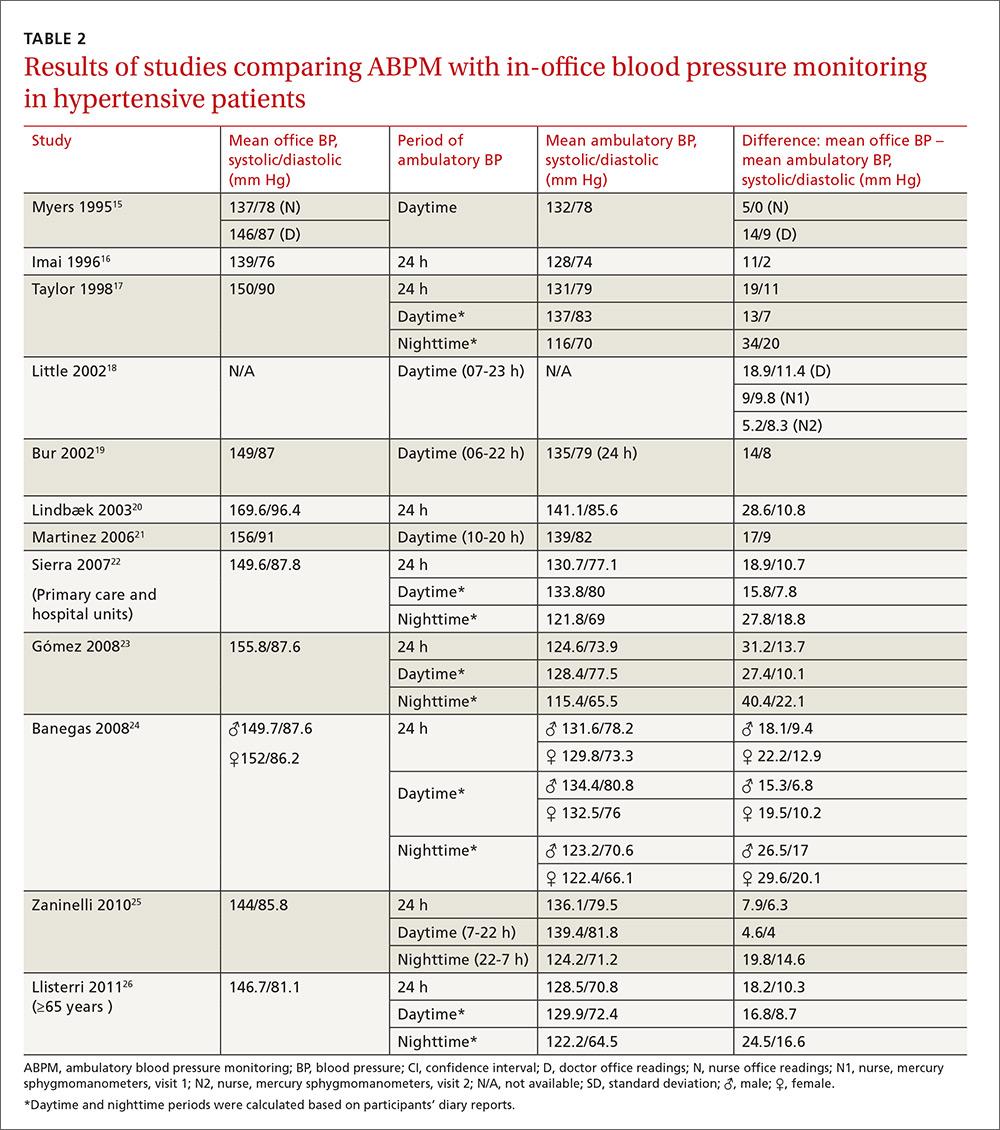
Compared with ABPM in diagnosing uncontrolled BP, office BP measurement had a sensitivity of 55.7% to 91.2% and a specificity of 25.8% to 61.8% (depending on whether the measure was carried out by the doctor or nurse18); positive LR ranged from 1.2 to 1.4, and negative LR from 0.3 to 0.72 (TABLE 3).16,18,22,24,26
For meta-analysis, we pooled studies with the same thresholds (140/90 mm Hg for office BP; 130/80 mm Hg for ABPM), with diagnostic accuracy of office BP expressed as pooled positive and negative LR, and as pooled DOR. The meta-analysis revealed that the pooled positive LR was 1.35 (95% CI, 1.32-1.38), and the pooled negative LR was 0.44 (95% CI, 0.37-0.53). The pooled DOR was 3.47 (95% CI, 3.02-3.98). Sensitivity was 81.9% (95% CI, 74.8%-87%) and specificity was 41.1% (95% CI, 35.1%-48.4%).
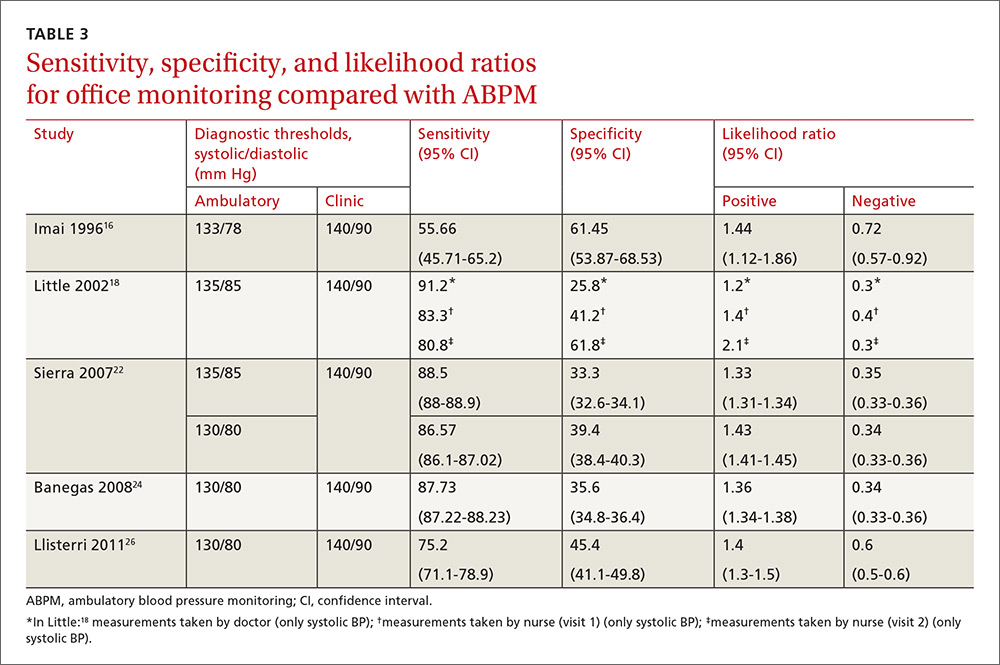
One study16 had a slightly different ambulatory diagnostic threshold (133/78 mm Hg), so we excluded it from a second meta-analysis. Results after the exclusion did not change significantly: positive LR was 1.39 (95% CI, 1.34-1.45); negative LR was 0.38 (95% CI, 0.33-0.44); and DOR was 3.77 (95% CI, 3.31-4.43).
In conclusion, the use of office-based BP readings in the outpatient clinic does not correlate well with ABPM. Therefore, caution must be used when making management decisions based solely on in-office readings of BP.
DISCUSSION
The European Society of Hypertension still regards office BP measurement as the gold standard in screening for, diagnosing, and managing hypertension. As previously mentioned, though, office measurements are usually handled by medical staff and can be compromised by the white-coat effect and a small number of measurements. The USPSTF now considers ABPM the reference standard in primary care to diagnose hypertension in adults, to corroborate or contradict office-based determinations of elevated BP (whether based on single or repeated-interval measurements), and to avoid overtreatment of individuals displaying elevated office BP yet proven normotensive by ABPM.4,7 The recommendation of the American Academy of Family Physicians is similar to that of the USPSTF.7 Therefore, evidence supports ABPM as the reference standard for confirming elevated office BP screening results to avoid misdiagnosis and overtreatment of individuals with isolated clinic hypertension.7
How office measurements stack up against ABPM
Checking the validity of decisions in clinical practice is extremely important for patient management. One of the tools used for decision-making is an estimate of the LR. We used the LR to assess the value of office BP measurement in determining controlled or uncontrolled BP. A high LR (eg, >10) indicates that the office BP can be used to rule in the disease (uncontrolled BP) with a high probability, while a low LR (eg, <0.1) could rule it out. An LR of around one indicates that the office BP measurement cannot rule the diagnosis of uncontrolled BP in or out.27 In our meta-analysis, the positive LR is 1.35 and negative LR is 0.44. Therefore, in treated hypertensive patients, an indication of uncontrolled BP as measured in the clinic does not confirm a diagnosis of uncontrolled BP (as judged by the reference standard of ABPM). On the other hand, the negative LR means that normal office BP does not rule out uncontrolled BP, which may be detected with ABPM. Consequently, the measurement of BP in the office does not change the degree of (un)certainty of adequate control of BP. This knowledge is important, to avoid overtreatment of white coat hypertension and undertreatment of masked cases.
As previously mentioned, we reported similar results in a study designed to determine the validity of office BP measurement in a primary care setting compared with ABPM.13 In that paper, the level of agreement between both methods was poor, indicating that clinic measurements could not be recommended as a single method of BP control in hypertensive patients.
The use of ABPM in diagnosing hypertension is likely to increase as a consequence of some guideline updates.2 Our study emphasizes the importance of their use in the control of hypertensive patients.
Another published meta-analysis1 investigated the validity of office BP for the diagnosis of hypertension in untreated patients, with diagnostic thresholds for arterial hypertension set at 140/90 mm Hg for office measurement, and 135/85 mm Hg for ABPM. In that paper, the sensitivity of office BP was 74.6% (95% CI, 60.7-84.8) and the specificity was 74.6% (95% CI, 47.9-90.4).
In our present study carried out with hypertensive patients receiving treatment, we obtained a slightly higher sensitivity value of 81.9% (within the CI of this meta-analysis) and a lower specificity of 41.1%. Therefore, the discordance between office BP and ABPM seems to be similar for the diagnosis of hypertension and the classification of hypertension as being well or poorly controlled. This confirms the low validity of the office BP, both for diagnosis and monitoring of hypertensive patients.
Strengths of our study. The study focused on (treated) hypertensive patients in a primary care setting, where hypertension is most often managed. It confirms that ABPM is indispensable to a good clinical practice.
Limitations of our study are those inherent to meta-analyses. The main weakness of our study is the paucity of data available regarding the utility of ABPM for monitoring BP control with treatment in a primary care setting. Other limitations are the variability in BP thresholds used, the number of measurements performed, and the ambulatory BP devices used. These differences could contribute to the observed heterogeneity.
Application of our results must take into account that we included only those studies performed in a primary care setting with treated hypertensive patients.
Moreover, this study was not designed to evaluate the consequences of over- and undertreatment of blood pressure, nor to address the accuracy of automated blood pressure machines or newer health and fitness devices.
Implications for practice, policy, or future research. Alternative monitoring methods are home BP self-measurement and automated 30-minute clinic BP measurement.28 However, ABPM provides us with unique information about the BP pattern (dipping or non-dipping), BP variability, and mean nighttime BP. This paper establishes that the measurement of BP in the office is not an accurate method to monitor BP control. ABPM should be incorporated in usual clinical practice in primary care. Although the consequences of ambulatory monitoring are not the focus of this study, we acknowledge that the decision to incorporate ABPM in clinical practice depends on the availability of ambulatory devices, proper training of health care workers, and a cost-effectiveness analysis of its use.
CORRESPONDENCE
Sergio Reino-González, MD, PhD, Adormideras Primary Health Center, Poligono de Adormideras s/n. 15002 A Coruña, Spain; sergio.nelson.reino.gonzalez@sergas.es.
1. Hodgkinson J, Mant J, Martin U, et al. Relative effectiveness of clinic and home blood pressure monitoring compared with ambulatory blood pressure monitoring in diagnosis of hypertension: systematic review. BMJ. 2011;342:d3621.
2. National Institute for Health and Clinical Excellence. Hypertension in adults: diagnosis and management. Available at: http://www.nice.org.uk/guidance/CG127. Accessed November 15, 2016.
3. Chobanian AV, Bakris GL, Black HR, et al. Seventh report of the Joint National Committee on Prevention, Detection, Evaluation, and Treatment of High Blood Pressure. Hypertension. 2003;42:1206-1252.
4. Hermida RC, Smolensky MH, Ayala DE, et al. Ambulatory Blood Pressure Monitoring (ABPM) as the reference standard for diagnosis of hypertension and assessment of vascular risk in adults. Chronobiol Int. 2015;32:1329-1342.
5. Siu AL; U.S. Preventive Services Task Force. Screening for high blood pressure in adults: U.S. Preventive Services Task Force recommendation statement. Ann Intern Med. 2015;163:778-786.
6. Piper MA, Evans CV
7. American Academy of Family Physicians. Hypertension. Available at: www.aafp.org/patient-care/clinical-recommendations/all/hypertension.html. Accessed February 10, 2016.
8. Mancia G, Fagard R, Narkiewicz K, et al. 2013 ESH/ESC Practice Guidelines for the Management of Arterial Hypertension. Blood Press. 2013;23:3-16.
9. Marin R, de la Sierra A, Armario P, et al. 2005 Spanish guidelines in diagnosis and treatment of arterial hypertension. Medicina Clínica. 2005;125:24-34.
10. Fagard RH, Celis H, Thijs L, et al. Daytime and nighttime blood pressure as predictors of death and cause-specific cardiovascular events in hypertension. Hypertension. 2008;51:55-61.
11. Sega R, Trocino G, Lanzarotti A, et al. Alterations of cardiac structure in patients with isolated office, ambulatory, or home hypertension: Data from the general population (Pressione Arteriose Monitorate E Loro Associazioni [PAMELA] Study). Circulation. 2001;104:1385-1392.
12. Verberk WJ, Kessels AG, de Leeuw PW. Prevalence, causes, and consequences of masked hypertension: a meta-analysis. Am J Hypertens. 2008;21:969-975.
13. Reino-González S, Pita-Fernández S, Cibiriain-Sola M, et al. Validity of clinic blood pressure compared to ambulatory monitoring in hypertensive patients in a primary care setting. Blood Press. 2015;24:111-118.
14. Doebler P, Holling H. Meta-analysis of diagnostic accuracy with mada. Available at: https://cran.r-project.org/web/packages/mada/vignettes/mada.pdf. Accessed October 5, 2015.
15. Myers MG, Oh PI, Reeves RA, et al. Prevalence of white coat effect in treated hypertensive patients in the community. Am J Hypertens. 1995;8:591-597.
16. Imai Y, Tsuji I, Nagai K, et al. Ambulatory blood pressure monitoring in evaluating the prevalence of hypertension in adults in Ohasama, a rural Japanese community. Hypertens Res. 1996;19:207-212.
17. Taylor RS, Stockman J, Kernick D, et al. Ambulatory blood pressure monitoring for hypertension in general practice. J R Soc Med. 1998;91:301-304.
18. Little P, Barnett J, Barnsley L, et al. Comparison of agreement between different measures of blood pressure in primary care and daytime ambulatory blood pressure. BMJ. 2002;325:254.
19. Bur A, Herkner H, Vlcek M, et al. Classification of blood pressure levels by ambulatory blood pressure in hypertension. Hypertension. 2002;40:817-822.
20. Lindbaek M, Sandvik E, Liodden K, et al. Predictors for the white coat effect in general practice patients with suspected and treated hypertension. Br J Gen Pract. 2003;53:790-793.
21. Martínez MA, Sancho T, García P, et al. Home blood pressure in poorly controlled hypertension: relationship with ambulatory blood pressure and organ damage. Blood Press Monit. 2006;11:207-213.
22. Sierra BC, de la Sierra IA, Sobrino J, et al. Monitorización ambulatoria de la presión arterial (MAPA): características clínicas de 31.530 pacientes. Medicina Clínica. 2007;129:1-5.
23. Gómez MA, García L, Sánchez Á, et al. Agreement and disagreement between different methods of measuring blood pressure. Hipertensión (Madr). 2008;25:231-239.
24. Banegas JR, Segura J, De la Sierra A, et al. Gender differences in office and ambulatory control of hypertension. Am J Med. 2008;121:1078-1084.
25. Zaninelli A, Parati G, Cricelli C, et al. Office and 24-h ambulatory blood pressure control by treatment in general practice: the ‘Monitoraggio della pressione ARteriosa nella medicina TErritoriale’ study. J Hypertens. 2010;28:910-917.
26. Llisterri JL, Morillas P, Pallarés V, et al. Differences in the degree of control of arterial hypertension according to the measurement procedure of blood pressure in patients ≥ 65 years. FAPRES study. Rev Clin Esp. 2011;211:76-84.
27. Straus SE, Richardson WS, Glasziou P, et al. Evidence-Based Medicine: How to practice and teach it. 4th ed. Edinburgh, Scotland: Churchill Livingstone; 2010.
28. Van der Wel MC, Buunk IE, van Weel C, et al. A novel approach to office blood pressure measurement: 30-minute office blood pressure vs daytime ambulatory blood pressure. Ann Fam Med. 2011;9:128-135.
ABSTRACT
Purpose We performed a literature review and meta-analysis to ascertain the validity of office blood pressure (BP) measurement in a primary care setting, using ambulatory blood pressure measurement (ABPM) as a benchmark in the monitoring of hypertensive patients receiving treatment.
Methods We conducted a literature search for studies published up to December 2013 that included hypertensive patients receiving treatment in a primary care setting. We compared the mean office BP with readings obtained by ABPM. We summarized the diagnostic accuracy of office BP with respect to ABPM in terms of sensitivity, specificity, and positive and negative likelihood ratios (LR), with a 95% confidence interval (CI).
Results Only 12 studies met the inclusion criteria and contained data to calculate the differences between the means of office and ambulatory BP measurements. Five were suitable for calculating sensitivity, specificity, and likelihood ratios, and 4 contained sufficient extractable data for meta-analysis. Compared with ABPM (thresholds of 140/90 mm Hg for office BP; 130/80 mmHg for ABPM) in diagnosing uncontrolled BP, office BP measurement had a sensitivity of 81.9% (95% CI, 74.8%-87%) and specificity of 41.1% (95% CI, 35.1%-48.4%). Positive LR was 1.35 (95% CI, 1.32-1.38), and the negative LR was 0.44 (95% CI, 0.37-0.53).
Conclusion Likelihood ratios show that isolated BP measurement in the office does not confirm or rule out the presence of poor BP control. Likelihood of underestimating or overestimating BP control is high when relying on in-office BP measurement alone.
A growing body of evidence supports more frequent use of ambulatory blood pressure monitoring (ABPM) to confirm a diagnosis of hypertension1 and to monitor blood pressure (BP) response to treatment.2 The Joint National Committee on Prevention, Detection, Evaluation, and Treatment of High Blood Pressure has long accepted ABPM for diagnosis of hypertension,3 and many clinicians consider ABPM the reference standard for diagnosing true hypertension and for accurately assessing associated cardiovascular risk in adults, regardless of office BP readings.4 The US Preventive Services Task Force (USPSTF) recommends obtaining BP measurements outside the clinical setting to confirm a diagnosis of hypertension before starting treatment.5 The USPSTF also asserts that elevated 24-hour ambulatory systolic BP is consistently and significantly associated with stroke and other cardiovascular events independent of office BP readings and has greater predictive value than office monitoring.5 The USPSTF concludes that ABPM, because of its large evidence base, is the best confirmatory test for hypertension.6 The recommendation of the American Academy of Family Physicians is similar to that of the USPSTF.7
The challenge. Despite the considerable support for ABPM, this method of BP measurement is still not sufficiently integrated into primary care. And some guidelines, such as those of
But ABPM’s advantages are numerous. Ambulatory monitors, which can record BP for 24 hours, are typically programmed to take readings every 15 to 30 minutes, providing estimates of mean daytime and nighttime BP and revealing an individual’s circadian pattern of BP.8-10 Ambulatory BP values usually considered the uppermost limit of normal are 135/85 mm Hg (day), 120/70 mm Hg (night), and 130/80 mm Hg (24 hour).8
Office BP monitoring, usually performed manually by medical staff, has 2 main drawbacks: the well-known white-coat effect experienced by many patients, and the relatively small number of possible measurements. A more reliable in-office BP estimation of BP would require repeated measurements at each of several visits.
By comparing ABPM and office measurements, 4 clinical findings are possible: isolated clinic or office (white-coat) hypertension (ICH); isolated ambulatory (masked) hypertension (IAH); consistent normotension; or sustained hypertension. With ICH, BP is high in the office and normal with ABPM. With IAH, BP is normal in the office and high with ABPM. With consistent normotension and sustained hypertension, BP readings with both types of measurement agree.8,9
In patients being treated for hypertension, ICH leads to an overestimation of uncontrolled BP and may result in overtreatment. The cardiovascular risk, although controversial, is usually lower than in patients diagnosed with sustained hypertension.11 IAH leads to an underestimation of uncontrolled BP and may result in undertreatment; its associated cardiovascular risk is similar to that of sustained hypertension.12
Our research objective. We recently published a study conducted with 137 hypertensive patients in a primary care center.13 Our conclusion was that in-office measurement of BP had insufficient clinical validity to be recommended as a sole method of monitoring BP control. In accurately classifying BP as controlled or uncontrolled, clinic measurement agreed with 24h-ABPM in just 64.2% of cases.13
In our present study, we performed a literature review and meta-analysis to ascertain the validity of office BP measurement in a primary care setting, using ABPM as a benchmark in the monitoring of hypertensive patients receiving treatment.
METHODS
Most published studies comparing conventional office BP measurement with ABPM have been conducted with patients not taking antihypertensive medication. We excluded these studies and conducted a literature search for studies published up to December 2013 that included hypertensive patients receiving treatment in a primary care setting.
We searched Medline (from 1950 onward) and the Cochrane Database of Systematic Reviews. For the Medline search, we combined keywords for office BP, hypertension, and ambulatory BP with keywords for outpatient setting and primary care, using the following syntax: (((“clinic blood pressure” OR “office blood pressure” OR “casual blood pressure”))) AND (“hypertension” AND ((((“24-h ambulatory blood pressure”) OR “24 h ambulatory blood pressure”) OR “24 hour ambulatory blood pressure”) OR “blood pressure monitoring, ambulatory”[Mesh]) AND ((((((“outpatient setting”) OR “primary care”) OR “family care”) OR “family physician”) OR “family practice”) OR “general practice”)). We chose studies published in English and reviewed the titles and abstracts of identified articles.
With the aim of identifying additional candidate studies, we reviewed the reference lists of eligible primary studies, narrative reviews, and systematic reviews. The studies were generally of good quality and used appropriate statistical methods. Only primary studies qualified for meta-analysis.
Inclusion and exclusion criteria
Acceptable studies had to be conducted in a primary care setting with patients being treated for hypertension, and had to provide data comparing office BP measurement with ABPM. We excluded studies in which participants were treated in the hospital, were untreated, or had not been diagnosed with hypertension.
The quality of the studies included in the meta-analysis was judged by 2 independent observers according to the following criteria: the clear classification and initial comparison of both measurements; explicit and defined diagnostic criteria; compliance with the inclusion/exclusion criteria; and clear and precise definition of outcome variables.
Data extraction
We extracted the following data from each included study: study population, number of patients included, age, gender distribution, number of measurements (ambulatory and office BP), equipment validation, mean office and ambulatory BP, and the period of ambulatory BP measurement. We included adult patients of all ages, and we compared the mean office BP with those obtained by ABPM in hypertensive patients.
STATISTICAL ANALYSIS
For each study, we summarized the diagnostic accuracy of office BP with respect to ABPM in terms of sensitivity, specificity, and positive and negative likelihood ratios (LRs), with the 95% confidence interval (CI), if available. If these rates were not directly reported in the original papers, we used the published data to calculate them.
We used the R v2.15.1 software with the “mada” package for meta-analysis.14 Although a bivariate approach is preferred for the meta-analysis of diagnostic accuracy, it cannot be recommended if the number of primary studies to pool is too small,14 as happened in our case. Therefore, we used a univariate approach and pooled summary statistics for positive LR, negative LR, and the diagnostic odds ratio (DOR) with their 95% confidence intervals. We used the DerSimonian-Laird method to perform a random-effect meta-analysis. To explore heterogeneity between the studies, we used the Cochran’s Q heterogeneity test, I2 index, and Galbraith and L’Abbé plots.
RESULTS
Our search identified 237 studies, only 12 of which met the inclusion criteria and contained data to calculate the differences between the means of office and ambulatory BP measurements (TABLES 1 AND 2).15-26 Of these 12 studies, 5 were suitable for calculating sensitivity, specificity, and LR (TABLE 3),16,18,22,24,26 and 4 contained sufficient extractable data for meta-analysis. The study by Little et al18 was not included in the meta-analysis, as the number of true-positive, true-negative, false-positive, and false-negative results could not be deduced from published data.
The studies differed in sample size (40-31,530), patient ages (mean, 55-72.8 years), sex (percentage of men, 31%-52.9%), and number of measurements for office BP (1-9) and ABPM (32-96) (TABLE 1),15-26 as well as in daytime and nighttime periods for ABPM and BP thresholds, and in differences between the mean office and ambulatory BPs (TABLE 2).15-26
In general, the mean office BP measurements were higher than those obtained with ABPM in any period—from 5/0 mm Hg to 27.4/10.1 mm Hg in the day, and from 7.9/6.3 mm Hg to 31.2/13.7 mm Hg over 24 hours (TABLE 2).15-26
Compared with ABPM in diagnosing uncontrolled BP, office BP measurement had a sensitivity of 55.7% to 91.2% and a specificity of 25.8% to 61.8% (depending on whether the measure was carried out by the doctor or nurse18); positive LR ranged from 1.2 to 1.4, and negative LR from 0.3 to 0.72 (TABLE 3).16,18,22,24,26
For meta-analysis, we pooled studies with the same thresholds (140/90 mm Hg for office BP; 130/80 mm Hg for ABPM), with diagnostic accuracy of office BP expressed as pooled positive and negative LR, and as pooled DOR. The meta-analysis revealed that the pooled positive LR was 1.35 (95% CI, 1.32-1.38), and the pooled negative LR was 0.44 (95% CI, 0.37-0.53). The pooled DOR was 3.47 (95% CI, 3.02-3.98). Sensitivity was 81.9% (95% CI, 74.8%-87%) and specificity was 41.1% (95% CI, 35.1%-48.4%).
One study16 had a slightly different ambulatory diagnostic threshold (133/78 mm Hg), so we excluded it from a second meta-analysis. Results after the exclusion did not change significantly: positive LR was 1.39 (95% CI, 1.34-1.45); negative LR was 0.38 (95% CI, 0.33-0.44); and DOR was 3.77 (95% CI, 3.31-4.43).
In conclusion, the use of office-based BP readings in the outpatient clinic does not correlate well with ABPM. Therefore, caution must be used when making management decisions based solely on in-office readings of BP.
DISCUSSION
The European Society of Hypertension still regards office BP measurement as the gold standard in screening for, diagnosing, and managing hypertension. As previously mentioned, though, office measurements are usually handled by medical staff and can be compromised by the white-coat effect and a small number of measurements. The USPSTF now considers ABPM the reference standard in primary care to diagnose hypertension in adults, to corroborate or contradict office-based determinations of elevated BP (whether based on single or repeated-interval measurements), and to avoid overtreatment of individuals displaying elevated office BP yet proven normotensive by ABPM.4,7 The recommendation of the American Academy of Family Physicians is similar to that of the USPSTF.7 Therefore, evidence supports ABPM as the reference standard for confirming elevated office BP screening results to avoid misdiagnosis and overtreatment of individuals with isolated clinic hypertension.7
How office measurements stack up against ABPM
Checking the validity of decisions in clinical practice is extremely important for patient management. One of the tools used for decision-making is an estimate of the LR. We used the LR to assess the value of office BP measurement in determining controlled or uncontrolled BP. A high LR (eg, >10) indicates that the office BP can be used to rule in the disease (uncontrolled BP) with a high probability, while a low LR (eg, <0.1) could rule it out. An LR of around one indicates that the office BP measurement cannot rule the diagnosis of uncontrolled BP in or out.27 In our meta-analysis, the positive LR is 1.35 and negative LR is 0.44. Therefore, in treated hypertensive patients, an indication of uncontrolled BP as measured in the clinic does not confirm a diagnosis of uncontrolled BP (as judged by the reference standard of ABPM). On the other hand, the negative LR means that normal office BP does not rule out uncontrolled BP, which may be detected with ABPM. Consequently, the measurement of BP in the office does not change the degree of (un)certainty of adequate control of BP. This knowledge is important, to avoid overtreatment of white coat hypertension and undertreatment of masked cases.
As previously mentioned, we reported similar results in a study designed to determine the validity of office BP measurement in a primary care setting compared with ABPM.13 In that paper, the level of agreement between both methods was poor, indicating that clinic measurements could not be recommended as a single method of BP control in hypertensive patients.
The use of ABPM in diagnosing hypertension is likely to increase as a consequence of some guideline updates.2 Our study emphasizes the importance of their use in the control of hypertensive patients.
Another published meta-analysis1 investigated the validity of office BP for the diagnosis of hypertension in untreated patients, with diagnostic thresholds for arterial hypertension set at 140/90 mm Hg for office measurement, and 135/85 mm Hg for ABPM. In that paper, the sensitivity of office BP was 74.6% (95% CI, 60.7-84.8) and the specificity was 74.6% (95% CI, 47.9-90.4).
In our present study carried out with hypertensive patients receiving treatment, we obtained a slightly higher sensitivity value of 81.9% (within the CI of this meta-analysis) and a lower specificity of 41.1%. Therefore, the discordance between office BP and ABPM seems to be similar for the diagnosis of hypertension and the classification of hypertension as being well or poorly controlled. This confirms the low validity of the office BP, both for diagnosis and monitoring of hypertensive patients.
Strengths of our study. The study focused on (treated) hypertensive patients in a primary care setting, where hypertension is most often managed. It confirms that ABPM is indispensable to a good clinical practice.
Limitations of our study are those inherent to meta-analyses. The main weakness of our study is the paucity of data available regarding the utility of ABPM for monitoring BP control with treatment in a primary care setting. Other limitations are the variability in BP thresholds used, the number of measurements performed, and the ambulatory BP devices used. These differences could contribute to the observed heterogeneity.
Application of our results must take into account that we included only those studies performed in a primary care setting with treated hypertensive patients.
Moreover, this study was not designed to evaluate the consequences of over- and undertreatment of blood pressure, nor to address the accuracy of automated blood pressure machines or newer health and fitness devices.
Implications for practice, policy, or future research. Alternative monitoring methods are home BP self-measurement and automated 30-minute clinic BP measurement.28 However, ABPM provides us with unique information about the BP pattern (dipping or non-dipping), BP variability, and mean nighttime BP. This paper establishes that the measurement of BP in the office is not an accurate method to monitor BP control. ABPM should be incorporated in usual clinical practice in primary care. Although the consequences of ambulatory monitoring are not the focus of this study, we acknowledge that the decision to incorporate ABPM in clinical practice depends on the availability of ambulatory devices, proper training of health care workers, and a cost-effectiveness analysis of its use.
CORRESPONDENCE
Sergio Reino-González, MD, PhD, Adormideras Primary Health Center, Poligono de Adormideras s/n. 15002 A Coruña, Spain; sergio.nelson.reino.gonzalez@sergas.es.
1. Hodgkinson J, Mant J, Martin U, et al. Relative effectiveness of clinic and home blood pressure monitoring compared with ambulatory blood pressure monitoring in diagnosis of hypertension: systematic review. BMJ. 2011;342:d3621.
2. National Institute for Health and Clinical Excellence. Hypertension in adults: diagnosis and management. Available at: http://www.nice.org.uk/guidance/CG127. Accessed November 15, 2016.
3. Chobanian AV, Bakris GL, Black HR, et al. Seventh report of the Joint National Committee on Prevention, Detection, Evaluation, and Treatment of High Blood Pressure. Hypertension. 2003;42:1206-1252.
4. Hermida RC, Smolensky MH, Ayala DE, et al. Ambulatory Blood Pressure Monitoring (ABPM) as the reference standard for diagnosis of hypertension and assessment of vascular risk in adults. Chronobiol Int. 2015;32:1329-1342.
5. Siu AL; U.S. Preventive Services Task Force. Screening for high blood pressure in adults: U.S. Preventive Services Task Force recommendation statement. Ann Intern Med. 2015;163:778-786.
6. Piper MA, Evans CV
7. American Academy of Family Physicians. Hypertension. Available at: www.aafp.org/patient-care/clinical-recommendations/all/hypertension.html. Accessed February 10, 2016.
8. Mancia G, Fagard R, Narkiewicz K, et al. 2013 ESH/ESC Practice Guidelines for the Management of Arterial Hypertension. Blood Press. 2013;23:3-16.
9. Marin R, de la Sierra A, Armario P, et al. 2005 Spanish guidelines in diagnosis and treatment of arterial hypertension. Medicina Clínica. 2005;125:24-34.
10. Fagard RH, Celis H, Thijs L, et al. Daytime and nighttime blood pressure as predictors of death and cause-specific cardiovascular events in hypertension. Hypertension. 2008;51:55-61.
11. Sega R, Trocino G, Lanzarotti A, et al. Alterations of cardiac structure in patients with isolated office, ambulatory, or home hypertension: Data from the general population (Pressione Arteriose Monitorate E Loro Associazioni [PAMELA] Study). Circulation. 2001;104:1385-1392.
12. Verberk WJ, Kessels AG, de Leeuw PW. Prevalence, causes, and consequences of masked hypertension: a meta-analysis. Am J Hypertens. 2008;21:969-975.
13. Reino-González S, Pita-Fernández S, Cibiriain-Sola M, et al. Validity of clinic blood pressure compared to ambulatory monitoring in hypertensive patients in a primary care setting. Blood Press. 2015;24:111-118.
14. Doebler P, Holling H. Meta-analysis of diagnostic accuracy with mada. Available at: https://cran.r-project.org/web/packages/mada/vignettes/mada.pdf. Accessed October 5, 2015.
15. Myers MG, Oh PI, Reeves RA, et al. Prevalence of white coat effect in treated hypertensive patients in the community. Am J Hypertens. 1995;8:591-597.
16. Imai Y, Tsuji I, Nagai K, et al. Ambulatory blood pressure monitoring in evaluating the prevalence of hypertension in adults in Ohasama, a rural Japanese community. Hypertens Res. 1996;19:207-212.
17. Taylor RS, Stockman J, Kernick D, et al. Ambulatory blood pressure monitoring for hypertension in general practice. J R Soc Med. 1998;91:301-304.
18. Little P, Barnett J, Barnsley L, et al. Comparison of agreement between different measures of blood pressure in primary care and daytime ambulatory blood pressure. BMJ. 2002;325:254.
19. Bur A, Herkner H, Vlcek M, et al. Classification of blood pressure levels by ambulatory blood pressure in hypertension. Hypertension. 2002;40:817-822.
20. Lindbaek M, Sandvik E, Liodden K, et al. Predictors for the white coat effect in general practice patients with suspected and treated hypertension. Br J Gen Pract. 2003;53:790-793.
21. Martínez MA, Sancho T, García P, et al. Home blood pressure in poorly controlled hypertension: relationship with ambulatory blood pressure and organ damage. Blood Press Monit. 2006;11:207-213.
22. Sierra BC, de la Sierra IA, Sobrino J, et al. Monitorización ambulatoria de la presión arterial (MAPA): características clínicas de 31.530 pacientes. Medicina Clínica. 2007;129:1-5.
23. Gómez MA, García L, Sánchez Á, et al. Agreement and disagreement between different methods of measuring blood pressure. Hipertensión (Madr). 2008;25:231-239.
24. Banegas JR, Segura J, De la Sierra A, et al. Gender differences in office and ambulatory control of hypertension. Am J Med. 2008;121:1078-1084.
25. Zaninelli A, Parati G, Cricelli C, et al. Office and 24-h ambulatory blood pressure control by treatment in general practice: the ‘Monitoraggio della pressione ARteriosa nella medicina TErritoriale’ study. J Hypertens. 2010;28:910-917.
26. Llisterri JL, Morillas P, Pallarés V, et al. Differences in the degree of control of arterial hypertension according to the measurement procedure of blood pressure in patients ≥ 65 years. FAPRES study. Rev Clin Esp. 2011;211:76-84.
27. Straus SE, Richardson WS, Glasziou P, et al. Evidence-Based Medicine: How to practice and teach it. 4th ed. Edinburgh, Scotland: Churchill Livingstone; 2010.
28. Van der Wel MC, Buunk IE, van Weel C, et al. A novel approach to office blood pressure measurement: 30-minute office blood pressure vs daytime ambulatory blood pressure. Ann Fam Med. 2011;9:128-135.