User login
Congenital Hemangioma
Hemangiomas are the most common benign tumors of childhood. In recent years, subsets of hemangiomas that are fully formed at birth have been recognized as clinically and biologically distinct from the classic infantile hemangioma (IH). Congenital hemangiomas (CHs) are classified based on clinical course as rapidly involuting CHs (RICHs) or noninvoluting CHs (NICHs). The aim of this retrospective study was to describe the epidemiology, clinical aspects, and clinical outcome of CH over a 5-year period.
Methods
Using electronic medical records from the department of dermatology (Hedi Chaker Hospital, Sfax, Tunisia) for a 5-year period (2008-2012), we searched for hemangioma. After collecting those records, we identified patients with CHs. We studied the epidemiologic (eg, sex, age), clinical course (eg, location, size, number, color, surrounding skin), and evolutionary aspects in these patients.
Results
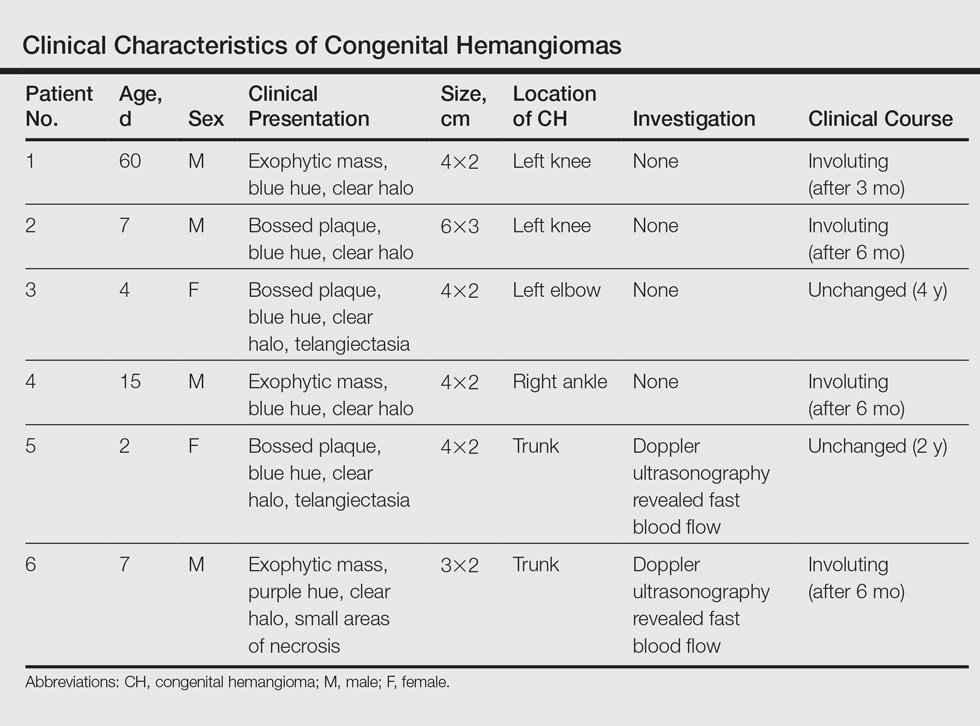
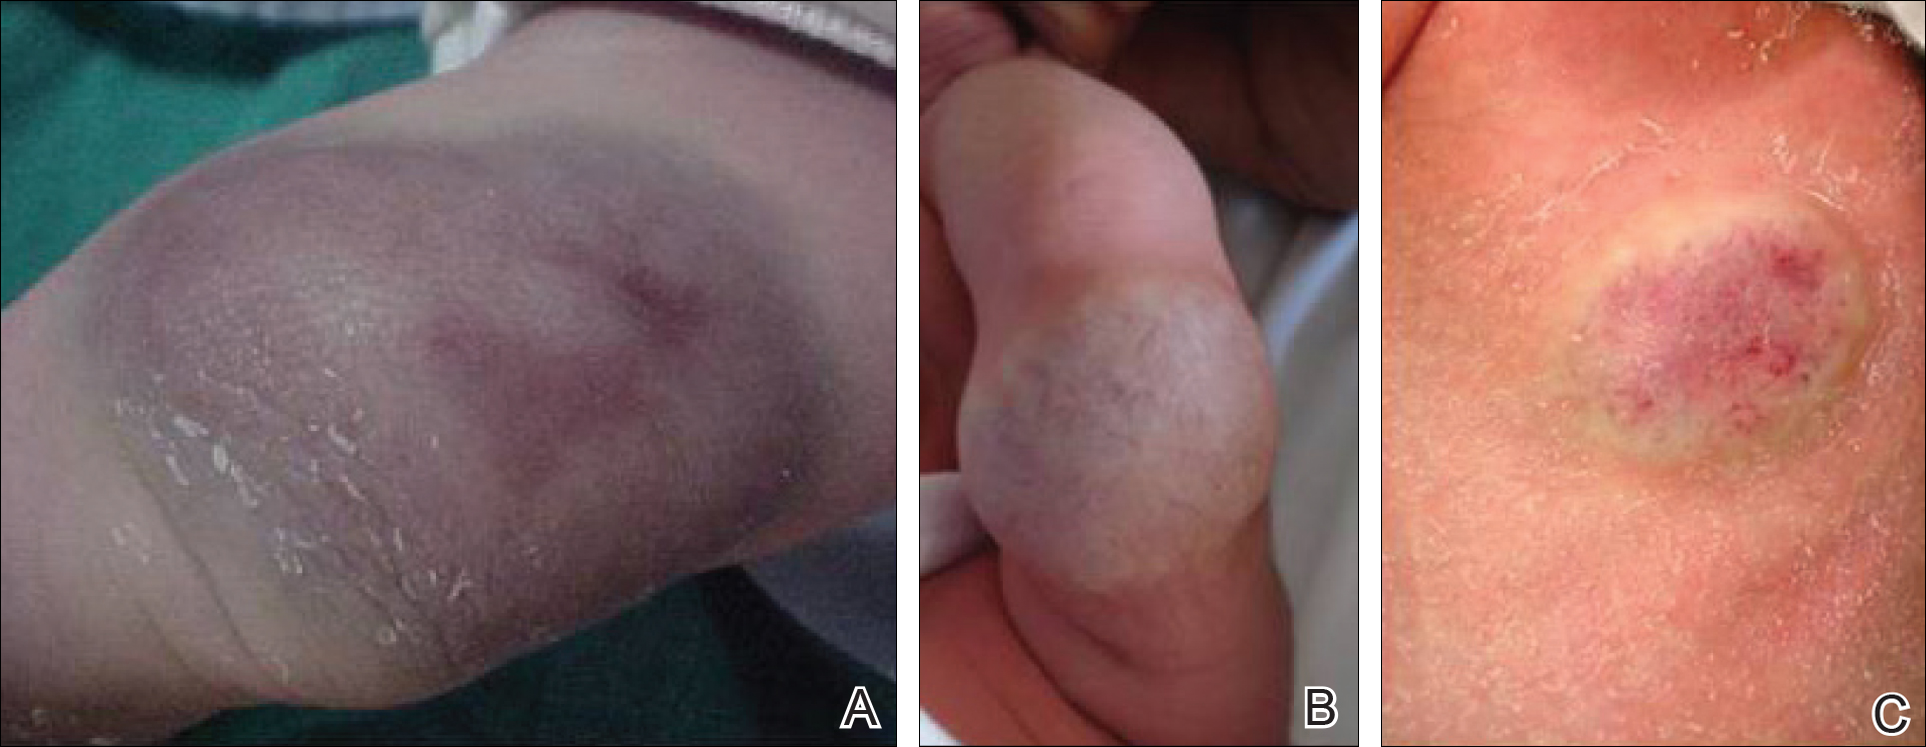
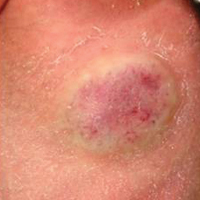
Twenty IHs were identified, 6 (30%) of which were considered CHs. The clinical characteristics of the 6 patients are summarized in the Table. We identified 2 females and 4 males aged 2 to 60 days (mean age, 16 days). Four patients had CHs involving the limbs (knee [n=2]; ankle [n=1]; elbow [n=1]) and 2 patients had CHs involving the trunk. Congenital hemangiomas were singular, oval shaped, and surrounded by a clear halo in all 6 patients. They presented as exophytic masses (n=3) or bossed plaques (n=3). A blue hue was noted in 5 patients and a purple hue in 1 patient. In some cases, telangiectasia (n=2) or small areas of necrosis (n=1) were noted at the center of the CHs. The CHs ranged in size from 3 to 6 cm (mean, 4 cm). Doppler ultrasonography was performed in 2 patients and showed fast blood flow. It is well known that manipulating a CH when it is ulcerative may cause a fatal hemorrhage. Thus, parents/guardians should be cautious when cleaning and dressing the lesions. Regular follow-up was recommended to all patients as noted in the medical records. The lesion involuted in4 patients after a mean period of 6 months, which allowed us to classify the lesions as RICHs (Figure, A). Two CHs were persistent after 2-year (Figure, B) and 4-year (Figure, C) follow-up, which was consistent with NICH classification.
Comment
Since 1996, vascular anomalies have been classified either as tumors or malformations.1 Infantile hemangioma is the most common vascular tumor and presents as an endothelial cellular proliferation that develops within days after birth. Congenital hemangiomas are fully developed at birth2,3 and are classified as RICHs and NICHs according to their clinical outcome.
As expected, our analysis revealed that CH usually is solitary and may present as a small lesion (eg, a few millimeters) but also may be large in size.4 Congenital hemangioma has an equal sex distribution and a predilection for the head and limbs near a joint. In contrast, IH exhibits female predilection and can occur anywhere on the body.4-6 In our study, CHs were more common in males and had a predilection for the limbs. Three patients presented with exophytic masses with a clear halo and overlying telangiectasia, which are commonly described features in CH.4,6
In the classification of vascular anomalies, RICHs and NICHs are fast-flow lesions that are indistinguishable at birth.7,8 Untreated, RICHs usually resolve in the first 14 months of life, often resulting in an area of atrophic or excess skin.8,9 Noninvoluting CHs persist and grow in proportion with the patient.10-12
When Doppler ultrasonography findings are inconsistent with a CH, an early biopsy from the periphery of the lesion may be performed to exclude an uncommon soft-tissue tumor such as infantile myofibromatosis or sarcoma.8,9,12 Because of the presence of a clear halo in all cases and mainly rapid involution of CHs, these differential diagnoses were dismissed. The histologic appearance of RICH differed from NICH and common IH, but some overlap was noted among the 3 lesions. Rapidly involuting CH was composed of small to large lobules of capillaries with moderately plump endothelial cells and pericytes; the lobules were surrounded by abundant fibrous tissue.9
Despite the notable differences in natural history between RICHs and NICHs, as RICHs regress within months while NICHs do not, both classes of CH share an important immunohistochemical phenotype; they do not express glucose transporter 1, the marker of IH.13 Tests for this marker were not performed in our study. The prognosis of CH generally is good, and special management is not required.
Conclusion
Rapidly involuting CHs and NICHs have many similarities, such as appearance, location, and sex distribution. The obvious differences in behavior serve to differentiate RICHs, NICHs, and common IHs. Infantile hemangiomas are not fully developed at birth and need many years to regress.
- Boon LM, Enjolras O, Mulliken JB. Congenital hemangioma: evidence of accelerated involution. J Pediatr. 1996;128:329-335.
- Neri I, Balestri R, Patrizi A. Hemangiomas: new insight and medical treatment. Dermatol Ther. 2012;25:322-334.
- Enjolras O, Mulliken JB. Vascular tumors and vascular malformations (new issues). Adv Dermatol. 1997;13:375-423.
- Mulliken JB, Enjolras O. Congenital hemangiomas and infantile hemangioma: missing links. J Am Acad Dermatol. 2004:50:875-882.
- Frieden IJ, Haggstrom AN, Drolet BA, et al. Infantile hemangiomas: current knowledge, future directions. proceedings of a research workshop on infantile hemangiomas, April 7-9, 2005, Bethesda, Maryland, USA. Pediatr Dermatol. 2005;22:383-406.
- Enjolras O, Picard A, Soupre V. Congenital haemangiomas and other rare infantile vascular tumours [in French]. Ann Chir Plast Esthet. 2006;51:339-346.
- Gorincour G, Kokta V, Rypens F, et al. Imaging characteristics of two subtypes of congenital hemangiomas: rapidly involuting congenital hemangiomas and non-involuting congenital hemangiomas. Pediatr Radiol. 2005;35:1178-1185.
- Rogers M, Lam A, Fischer G. Sonographic findings in a series of rapidly involuting congenital hemangiomas (RICH). Pediatr Dermatol. 2002;19:5-11.
- Berenguer B, Mulliken JB, Enjolras O, et al. Rapidly involuting congenital hemangioma: clinical and histopathologic features. Pediatr Dev Pathol. 2003;6:495-510.
- North PE, Waner M, James CA, et al. Congenital nonprogressive hemangioma: a distinct clinicopathologic entity unlike infantile hemangioma. Arch Dermatol. 2001;137:1607-1620.
- Chiavérini C, Kurzenne JY, Rogopoulos A, et al. Noninvoluting congenital hemangioma: 2 cases [in French]. Ann Dermatol Venerol. 2002;129:735-737.
- Enjolras O, Mulliken JB, Boon LM, et al. Noninvoluting congenital hemangioma: a rare cutaneous vascular anomaly. Plast Reconstr Surg. 2001;107:1647-1654.
- North PE, Waner M, Mizeracki A, et al. GLUT1: a newly discovered immunohistochemical marker for juvenile hemangiomas. Hum Pathol. 2000;31:11-22.
Hemangiomas are the most common benign tumors of childhood. In recent years, subsets of hemangiomas that are fully formed at birth have been recognized as clinically and biologically distinct from the classic infantile hemangioma (IH). Congenital hemangiomas (CHs) are classified based on clinical course as rapidly involuting CHs (RICHs) or noninvoluting CHs (NICHs). The aim of this retrospective study was to describe the epidemiology, clinical aspects, and clinical outcome of CH over a 5-year period.
Methods
Using electronic medical records from the department of dermatology (Hedi Chaker Hospital, Sfax, Tunisia) for a 5-year period (2008-2012), we searched for hemangioma. After collecting those records, we identified patients with CHs. We studied the epidemiologic (eg, sex, age), clinical course (eg, location, size, number, color, surrounding skin), and evolutionary aspects in these patients.
Results
Twenty IHs were identified, 6 (30%) of which were considered CHs. The clinical characteristics of the 6 patients are summarized in the Table. We identified 2 females and 4 males aged 2 to 60 days (mean age, 16 days). Four patients had CHs involving the limbs (knee [n=2]; ankle [n=1]; elbow [n=1]) and 2 patients had CHs involving the trunk. Congenital hemangiomas were singular, oval shaped, and surrounded by a clear halo in all 6 patients. They presented as exophytic masses (n=3) or bossed plaques (n=3). A blue hue was noted in 5 patients and a purple hue in 1 patient. In some cases, telangiectasia (n=2) or small areas of necrosis (n=1) were noted at the center of the CHs. The CHs ranged in size from 3 to 6 cm (mean, 4 cm). Doppler ultrasonography was performed in 2 patients and showed fast blood flow. It is well known that manipulating a CH when it is ulcerative may cause a fatal hemorrhage. Thus, parents/guardians should be cautious when cleaning and dressing the lesions. Regular follow-up was recommended to all patients as noted in the medical records. The lesion involuted in4 patients after a mean period of 6 months, which allowed us to classify the lesions as RICHs (Figure, A). Two CHs were persistent after 2-year (Figure, B) and 4-year (Figure, C) follow-up, which was consistent with NICH classification.
Comment
Since 1996, vascular anomalies have been classified either as tumors or malformations.1 Infantile hemangioma is the most common vascular tumor and presents as an endothelial cellular proliferation that develops within days after birth. Congenital hemangiomas are fully developed at birth2,3 and are classified as RICHs and NICHs according to their clinical outcome.
As expected, our analysis revealed that CH usually is solitary and may present as a small lesion (eg, a few millimeters) but also may be large in size.4 Congenital hemangioma has an equal sex distribution and a predilection for the head and limbs near a joint. In contrast, IH exhibits female predilection and can occur anywhere on the body.4-6 In our study, CHs were more common in males and had a predilection for the limbs. Three patients presented with exophytic masses with a clear halo and overlying telangiectasia, which are commonly described features in CH.4,6
In the classification of vascular anomalies, RICHs and NICHs are fast-flow lesions that are indistinguishable at birth.7,8 Untreated, RICHs usually resolve in the first 14 months of life, often resulting in an area of atrophic or excess skin.8,9 Noninvoluting CHs persist and grow in proportion with the patient.10-12
When Doppler ultrasonography findings are inconsistent with a CH, an early biopsy from the periphery of the lesion may be performed to exclude an uncommon soft-tissue tumor such as infantile myofibromatosis or sarcoma.8,9,12 Because of the presence of a clear halo in all cases and mainly rapid involution of CHs, these differential diagnoses were dismissed. The histologic appearance of RICH differed from NICH and common IH, but some overlap was noted among the 3 lesions. Rapidly involuting CH was composed of small to large lobules of capillaries with moderately plump endothelial cells and pericytes; the lobules were surrounded by abundant fibrous tissue.9
Despite the notable differences in natural history between RICHs and NICHs, as RICHs regress within months while NICHs do not, both classes of CH share an important immunohistochemical phenotype; they do not express glucose transporter 1, the marker of IH.13 Tests for this marker were not performed in our study. The prognosis of CH generally is good, and special management is not required.
Conclusion
Rapidly involuting CHs and NICHs have many similarities, such as appearance, location, and sex distribution. The obvious differences in behavior serve to differentiate RICHs, NICHs, and common IHs. Infantile hemangiomas are not fully developed at birth and need many years to regress.
- Boon LM, Enjolras O, Mulliken JB. Congenital hemangioma: evidence of accelerated involution. J Pediatr. 1996;128:329-335.
- Neri I, Balestri R, Patrizi A. Hemangiomas: new insight and medical treatment. Dermatol Ther. 2012;25:322-334.
- Enjolras O, Mulliken JB. Vascular tumors and vascular malformations (new issues). Adv Dermatol. 1997;13:375-423.
- Mulliken JB, Enjolras O. Congenital hemangiomas and infantile hemangioma: missing links. J Am Acad Dermatol. 2004:50:875-882.
- Frieden IJ, Haggstrom AN, Drolet BA, et al. Infantile hemangiomas: current knowledge, future directions. proceedings of a research workshop on infantile hemangiomas, April 7-9, 2005, Bethesda, Maryland, USA. Pediatr Dermatol. 2005;22:383-406.
- Enjolras O, Picard A, Soupre V. Congenital haemangiomas and other rare infantile vascular tumours [in French]. Ann Chir Plast Esthet. 2006;51:339-346.
- Gorincour G, Kokta V, Rypens F, et al. Imaging characteristics of two subtypes of congenital hemangiomas: rapidly involuting congenital hemangiomas and non-involuting congenital hemangiomas. Pediatr Radiol. 2005;35:1178-1185.
- Rogers M, Lam A, Fischer G. Sonographic findings in a series of rapidly involuting congenital hemangiomas (RICH). Pediatr Dermatol. 2002;19:5-11.
- Berenguer B, Mulliken JB, Enjolras O, et al. Rapidly involuting congenital hemangioma: clinical and histopathologic features. Pediatr Dev Pathol. 2003;6:495-510.
- North PE, Waner M, James CA, et al. Congenital nonprogressive hemangioma: a distinct clinicopathologic entity unlike infantile hemangioma. Arch Dermatol. 2001;137:1607-1620.
- Chiavérini C, Kurzenne JY, Rogopoulos A, et al. Noninvoluting congenital hemangioma: 2 cases [in French]. Ann Dermatol Venerol. 2002;129:735-737.
- Enjolras O, Mulliken JB, Boon LM, et al. Noninvoluting congenital hemangioma: a rare cutaneous vascular anomaly. Plast Reconstr Surg. 2001;107:1647-1654.
- North PE, Waner M, Mizeracki A, et al. GLUT1: a newly discovered immunohistochemical marker for juvenile hemangiomas. Hum Pathol. 2000;31:11-22.
Practice Points
- Congenital hemangiomas (CHs) are fully developed hemangiomas that are present at birth.
- In our study, CHs were more common in males, with a predilection for the limbs.
- Infantile hemangiomas are not fully developed at birth and need many years to regress.
The association of geriatric syndromes with hospital outcomes
Geriatric syndromes are multifactorial health conditions that affect older people and include dementia, delirium, impaired mobility, falls, frailty, poor nutrition, weight loss, incontinence, and difficulties with activities of daily living.1 These syndromes are highly prevalent among older patients admitted to acute-care hospitals2,3 and often add complexity to the clinical status of hospitalized older adults with multiple comorbid conditions.4 In the English National Health Service (NHS), the proportion of older people admitted to acute-care hospitals with geriatric syndromes has increased dramatically.5
The recognition and management of geriatric syndromes by hospitalists requires specific knowledge and skill sets.6 However, geriatricians are a scarce resource in many settings, including the NHS. A challenge for service evaluation and research is the generally poor capture of information about geriatric syndromes compared to specific comorbidities in discharge summaries and hospital coding.7 Steps are being taken in the NHS to address this issue, and in 2013 our center started the routine collection of data on clinical frailty, history of dementia (HoD) and acute confusional state (ACS) in all patients 75 years or older admitted nonelectively to the hospital.8The presence of geriatric syndromes in older inpatients is an important driver of adverse outcomes, particularly length of stay (LOS) and admission to institutional care.9 However, acute illness severity (AIS) is also an important determinant of poor outcomes in the inpatient population and may drive disproportionate changes in health status in the most vulnerable.10 Research studies with geriatric syndromes in acute settings have not been able to simultaneously consider AIS.11 In addition, comorbidity is not always associated with an increased number of geriatric syndromes.12
We aimed to study the association of geriatric syndromes such as frailty, HoD and ACS that are measured in routine clinical care with hospital outcomes (prolonged LOS, inpatient mortality, delayed discharge, institutionalization, and 30-day readmission), while controlling for demographics (age, gender), AIS, comorbidity, and discharging specialty (general medicine, geriatric medicine, surgery).
PATIENTS AND METHODS
Study Design and Setting
This retrospective observational study was conducted in a large tertiary university hospital in England with 1000 acute beds receiving more than 102,000 visits to the emergency department (ED) and admitting over 73,000 patients per year; among the latter, more than 12,000 are 75 years and older.
Sample
We analyzed all first nonelective inpatient episodes (ie, from ED admission to discharge) of people 75 years and older (all specialties) between the October 26, 2014 and the October 26, 2015. Data were obtained via the hospital’s information systems following the implementation of a new electronic patient record on October 26, 2014.

Patients’ Characteristics
The following anonymized variables were extracted:
- Age and gender
- AIS information is routinely collected in our ED using a Modified Early Warning Score (ED-MEWS). The components and scoring of ED-MEWS are shown in Table 1. Where more than 1 ED-MEWS was collected, the highest was used in the analyses.
- Charlson Comorbidity Index (CCI, without age adjustment).13 The CCI is based on the discharge diagnoses, as coded according to WHO International Classification of Diseases, v 10 (ICD-10). The CCI was calculated retrospectively and would have not been available to clinicians early during the patients’ admission.
- Clinical Frailty Scale (CFS). The scoring of CFS is based on a global assessment of patients’ comorbidity symptoms, and their level of physical activity and dependency on activities of daily living, estimated to reflect the status immediately before the onset of the acute illness leading to hospitalization. The possible scores are: 1 (very fit), 2 (well), 3 (managing well), 4 (vulnerable), 5 (mildly frail), 6 (moderately frail), 7 (severely frail), 8 (very severely frail), and 9 (terminally ill) ().14 The use of the CFS in admissions of people 75 years and older was introduced in our center in 2013 under a local Commissioning for Quality and Innovation (CQUIN) scheme.8 The CQUIN required that all patients 75 years and older admitted to the hospital, via the ED, be screened for frailty using the CFS within 72 hours of admission. The admitting doctor usually scores the CFS on the electronic admission record, but it can also be completed by ED nurses or by nursing or therapy staff from the trust-wide Specialist Advice for the Frail Elderly team. Training on CFS scoring is provided to staff at a hiring orientation and at regular educational meetings. Permission to use CFS for clinical purposes was obtained from the principal investigator at Geriatric Medicine Research, Dalhousie University, Halifax, Canada.
- Cognitive variables were collected early during the admission in patients 75 years and older, thanks to a parallel local CQUIN scheme. The cognitive CQUIN variables are screening variables, not gold standard. The admission clerking is designed to clinically classify patients within 72 hours of admission into the following 3 mutually exclusive categories:
○ Known HoD (in the database: no = 0; yes = 1)
○ ACS, without HoD (in the database: no = 0; yes = 1)
○ Neither HoD nor ACS
- The cognitive CQUIN assessment does not intend to diagnose dementia in those who are not known to have it, but tries to separate the dementias that general practitioners (GPs) know from hospital-identified acute cognitive concerns that GPs may need to assess or investigate after discharge. The latter may include delirium and/or undiagnosed dementia.
- In our routine hospital practice, the initial cognitive assessment is performed by a clinician in the following fashion: if the patient is known to have dementia (ie, based on clinical history and/or chart review), the clinician selects the “known history of dementia” option in the admission navigator, and no further cognitive screening is conducted. If the patient has no known dementia, the clinician administers the 4-item Abbreviated Mental Test (AMT4): (1) age, (2) date of birth, (3) place, and (4) year, with impaired cognition indicated by an AMT4 of less than 4 and triggering the selection of “ACS without known HoD” option. If the AMT4 is normal, the clinician selects the “neither HoD nor ACS” option.
- Due to the service evaluation nature of our work, these measures could not be assessed for reliability within the electronic medical records system (eg, regarding sensitivity and specificity against a gold standard or inter-rater reliability).
- Discharged from geriatric medicine (no = 0; yes = 1). Every year, our hospital admits over 12,000 patients 75 years and older, of which 25% are managed by the Department of Medicine for the Elderly (DME). The DME specialist bed base consists of 5 core wards, which specialize in ward-based comprehensive geriatric assessment (CGA) and are supported by dedicated nursing, physiotherapy, occupational therapy, and social work teams, as well as by readily available input from speech and language therapy, clinical nutrition, psychogeriatric, pharmacy and palliative care teams. Formal multidisciplinary team meetings occur at least twice weekly. A sixth specialist DME ward with a more acute perspective has been operational for 7 years; this ward was renamed the Frailty and Acute Medicine for the Elderly (FAME) ward in 2014 and has daily multidisciplinary team meetings. Although admission to FAME is through the ED, admission to core DME wards can occur from FAME (ie, within-DME transfer), via the ED, or from other inpatient specialty areas if older patients are perceived to be in high need of CGA after screening by the Specialist Advice for the Frail Elderly team. An audit in our center showed that up to 20% of patients discharged by DME were not initially admitted by DME, underscoring the significant role of core specialist DME wards in absorbing complex cases, especially from the general medical wards.8
- Discharged from general medicine (no = 0; yes = 1). In our setting, virtually all patients discharged by general medicine were first admitted by general medicine.8
- Discharged by a surgical specialty (no = 0; yes = 1)
Hospital Outcomes
The following anonymized variables were identified:
- LOS (days). Prolonged LOS was defined as 10 or more days (no = 0; yes = 1)
- Inpatient mortality (no = 0; yes = 1)
- Delayed discharge (no = 0; yes = 1). This was defined as the total LOS being at least 1 day longer than the LOS up to the last recorded clinically fit date. This date is used in NHS hospitals to indicate that the acute medical episode has finished and discharge-planning arrangements (often via social care providers) can commence.
- Institutionalization (no = 0; yes = 1). This was defined as the discharge destination being a care home, when a care home was not the usual place of residence.
- 30-day readmission (no = 0; yes = 1)
Statistical Analyses
Anonymized data were analyzed with IBM SPSS Statistics (v 22, Armonk, New York) software. Descriptive statistics were given as count (with percentage) or mean (with standard deviation.
To avoid potential problems with multicollinearity in the multivariate regression models, the correlations among the predictor variables were checked using a correlation matrix of 2-sided Spearman’s rho correlation coefficients. Correlations of 0.50 or more were considered large.15,16
Because all outcomes in the study were binary, multivariate binary logistic regression models were computed. In these models, the odds ratio (OR) reflects the effect size of each predictor; 95% confidence intervals (CI) were requested for each OR. Predictors with P < 0.01 were considered as statistically significant. The classification performance of each logistic regression model was assessed calculating its area under the curve (AUC).
Sensitivity analyses were conducted after imputing missing data (SPSS multiple imputation procedure) and after fitting interaction terms between geriatric syndromes and discharge by geriatric medicine.
RESULTS
The initial database contained 12,282 nonelective admission and discharge episodes (all specialties) of patients 75 years and older between October 26, 2014 and October 26, 2015. Among those, 8202 (66.8%) were first episodes. Table 2 shows the sample descriptives, and Table 3 shows the breakdown of geriatric syndromes (single and multiple) in the total sample (n = 8282), including missing frailty data.

In the correlation matrix of 2-sided Spearman’s rho correlation coefficients, no correlations with large-effect size were found to suggest issues with multicollinearity; the largest correlation coefficients were between age and CFS (rho = 0.35), HoD and CFS (rho = 0.32), and CCI and CFS (rho = 0.26).
The results of the multivariate regression models are shown in Table 4. The best performing models were the ones for inpatient mortality (AUC = 0.80), followed by institutionalization (AUC = 0.76), and prolonged LOS (AUC = 0.71). After full adjustment, clinical frailty was an independent predictor of prolonged LOS, inpatient mortality, delayed discharge, and institutionalization. HoD was an independent predictor of prolonged LOS, delayed discharge, and institutionalization; and ACS was an independent predictor of prolonged LOS, delayed discharge, institutionalization, and 30-day readmission (Table 4). Results did not significantly change in sensitivity analyses conducted after multiple imputation of missing data and after inclusion of interaction terms (see Supplemental Table 1 and Supplemental Table

DISCUSSION
Our aim was to study the association of geriatric syndromes (measured in routine clinical care) with hospital outcomes. We found that geriatric syndromes such as clinical frailty, HoD, and ACS were strong independent predictors. Concerning prolonged LOS, delayed discharge, and institutionalization, geriatric syndromes had ORs that were greater than those of traditionally measured factors such as demographics, comorbidity and acute illness severity. Our findings add to the body of knowledge in this area because we accounted for the latter effects. Our experience shows that metrics on geriatric syndromes can be successfully collected in the routine hospital setting and add clear value to the prediction of operational outcomes. This may encourage other hospitals to do the same.
Our findings are consistent with suggestions that accounting for chronic conditions alone may be less informative than also accounting for the co-occurrence of geriatric syndromes.17 The focus of CFS is on the pre-admission level of physical activity and dependency on activities of daily living, and poorer scores may confer vulnerability to adverse outcomes due to reduced physiological reserve and ability to withstand acute stressors.18 Other studies have also found CFS to be a good predictor of inpatient outcomes,19-22 and it has been recommended as a possible means to identify vulnerable older adults in acute-care settings.23
HoD and ACS had independent effects beyond frailty, particularly in prolonging LOS, delaying discharge, and requiring institutionalization. Dementia prolongs LOS,24 and delirium prolongs hospitalization for persons with dementia.25 Older people with cognitive impairment may have an increased risk of acquiring new geriatric syndromes during hospitalization, particularly if it is prolonged.26 One study showed that the risk of poor functional recovery can be as high as 70% in complex delirious patients in hospital.27 All too often, delirium is neither benign nor reversible, with a significant proportion of patients not experiencing restoration ad integrum of cognition and function.28
Our results are consistent with observations that geriatric syndromes are associated with higher risk of institutionalization.29 It was interesting that female gender seemed to be an independent predictor of institutionalization, which is consistent with the results of a systematic review showing that the male-to-female ratio of admission rates ranged between 1 to 1.4 and 1 to 1.6.30
Discharge by general medicine appeared to be associated with a lower likelihood of prolonged LOS, and discharge by geriatric medicine seemed to be associated with a higher likelihood of delayed discharge and institutionalization. Unsurprisingly, geriatric medicine wards tend to absorb the most complex cases, often with complex discharge planning needs.8 In that light, CGA in geriatric wards may not be associated with reduced LOS (and it is possible that the LOS of complex patients might have been higher in nongeriatric wards). In addition, inpatient CGA increases frail patients’ likelihood of survival.31
Our study suggests that routinely collected metrics on frailty, HoD and ACS may be helpful to better adapt hospital care to the real requirements of aged people. The proportion of older people admitted to acute hospitals with geriatric syndromes continues to increase5 and geriatricians are a scarce resource. It will be increasingly important to upskill nongeriatric hospitalists in the recognition and management of geriatric syndromes. Frail older people are becoming the core business of acute hospitals,32 making geriatrics “too important to be left to geriatricians.”33 Therefore, easily collected metrics on geriatric syndromes may help nongeriatricians identify these syndromes and address them early during admission.
Our study has important limitations. Firstly, geriatric syndromes were not identified with gold-standard measures. For example, ACS in the absence of known dementia should be seen only as a surrogate for delirium. ACS as a proxy measure is likely to underestimate the diagnosis of delirium, because the hypoactive type is commonly missed without valid measures. In addition, a patient with delirium superimposed upon dementia would have been coded as a ‘known dementia.’ The geriatric syndromes’ measures could not be assessed for reliability within the electronic medical records system (eg, regarding sensitivity and specificity against a gold standard, or interrater reliability).
About the potential limitations of CFS, there have been concerns that an interobserver discrepancy in CFS scoring may occur between health professionals. However, 1 study investigated the interrater reliability of CFS between clinicians in 107 community-dwelling older adults 75 years and older, finding a substantial agreement with a weighted
Another limitation of our study is that we treated geriatric syndromes and the other predictors in the models as independent variables. However, many of the factors may be interrelated, and they present simultaneously in many patients. Indeed, the bivariate correlation between CFS and HoD was of moderate strength, because worsening cognition should score higher on CFS according to the scoring protocol. As expected, there was also a medium-sized correlation between CFS and CCI. It has been suggested that physical and cognitive frailty may be more informative as a single complex phenotype.36 Indeed, the problems of old age tend to come as a package.37
For 30-day readmission, the AUC of the model was small, suggesting the existence of unmeasured explanatory variables. For example, although our results agree that AIS and chronic illness predict readmission,38 the latter still remains an elusive outcome, and a more accurate prediction may be attained by adding socioeconomic variables to models.39Our study echoes the potential utility of incorporating common geriatric clinical features in routine clinical examination and disposition planning for older patients in acute settings.40 Hospitals may find it informative to undertake large-scale screening for geriatric syndromes including frailty, dementia, and delirium in all older adults admitted via the ED. When combined with other routinely collected variables such as demographics, AIS, and comorbidity data, this process may provide hospitals with information that will help define the acute needs of the local population and aid in the development of care pathways for the growing population of older adults.
Acknowledgments
The authors wish to thank all members of the acute teams in our hospital, without which this initiative would have not been possible. Licensed access to the NHS Foundation Trust’s information systems is also gratefully acknowledged.
Disclosure
The authors report no financial conflicts of interest.
1. Inouye SK, Studenski S, Tinetti ME, Kuchel GA. Geriatric syndromes: clinical, research, and policy implications of a core geriatric concept. J Am Geriatr Soc. 2007;55:780-791. PubMed
2. Lakhan P, Jones M, Wilson A, Courtney M, Hirdes J, Gray LC. A prospective cohort study of geriatric syndromes among older medical patients admitted to acute care hospitals. J Am Geriatr Soc. 2011;59:2001-2008. PubMed
3. Flood KL, Rohlfing A, Le CV, Carr DB, Rich MW. Geriatric syndromes in elderly patients admitted to an inpatient cardiology ward. J Hosp Med. 2007;2:394-400. PubMed
4. Clerencia-Sierra M, Calderon-Larranaga A, Martinez-Velilla N, et al. Multimorbidity patterns in hospitalized older patients: associations among chronic diseases and geriatric syndromes. PLoS One. 2015;10:e0132909. PubMed
5. Soong J, Poots AJ, Scott S, et al. Quantifying the prevalence of frailty in English hospitals. BMJ Open. 2015;5:e008456. PubMed
6. Warshaw GA, Bragg EJ, Fried LP, Hall WJ. Which patients benefit the most from a geriatrician’s care? Consensus among directors of geriatrics academic programs. J Am Geriatr Soc. 2008;56:1796-1801. PubMed
7. Ugboma I, Syddall HE, Cox V, Cooper C, Briggs R, Sayer AA. Coding geriatric syndromes: How good are we? CME J Geriatr Med. 2008;10:34-36. PubMed
8. Wallis SJ, Wall J, Biram RW, Romero-Ortuno R. Association of the clinical frailty scale with hospital outcomes. QJM. 2015;108:943-949. PubMed
9. Anpalahan M, Gibson SJ. Geriatric syndromes as predictors of adverse outcomes of hospitalization. Intern Med J. 2008;38:16-23. PubMed
10. Cournane S, Byrne D, O’Riordan D, Fitzgerald B, Silke B. Chronic disabling disease--impact on outcomes and costs in emergency medical admissions. QJM. 2015;108:387-396. PubMed
11. Soong J, Poots AJ, Scott S, Donald K, Bell D. Developing and validating a risk prediction model for acute care based on frailty syndromes. BMJ Open. 2015;5:e008457. PubMed
12. Vetrano DL, Foebel AD, Marengoni A, et al. Chronic diseases and geriatric syndromes: The different weight of comorbidity. Eur J Intern Med. 2016;27:62-67. PubMed
13. Charlson ME, Pompei P, Ales KL, MacKenzie CR. A new method of classifying prognostic comorbidity in longitudinal studies: development and validation. J Chronic Dis. 1987;40:373-383. PubMed
14. Rockwood K, Song X, MacKnight C, et al. A global clinical measure of fitness and frailty in elderly people. CMAJ. 2005;173:489-495. PubMed
15. Fritz CO, Morris PE, Richler JJ. Effect size estimates: current use, calculations, and interpretation. J Exp Psychol Gen. 2012;141:2-18. PubMed
16. Cohen J. Statistical Power Analysis for the Behavioral Sciences. 2nd ed. Hillsdale, NJ: Lawrence Erlbaum Associates; 1988.
17. Koroukian SM, Schiltz N, Warner DF, et al. Combinations of chronic conditions, functional limitations, and geriatric syndromes that predict health outcomes. J Gen Intern Med. 2016;31:630-637. PubMed
18. Clegg A, Young J, Iliffe S, Rikkert MO, Rockwood K. Frailty in elderly people. Lancet. 2013;381:752-762. PubMed
19. Romanowski KS, Barsun A, Pamlieri TL, Greenhalgh DG, Sen S. Frailty score on admission predicts outcomes in elderly burn injury. J Burn Care Res. 2015;36:1-6. PubMed
20. Ritt M, Schwarz C, Kronawitter V, et al. Analysis of Rockwood et al’s clinical frailty scale and Fried et al’s frailty phenotype as predictors of mortality and other clinical outcomes in older patients who were admitted to a geriatric ward. J Nutr Health Aging. 2015;19:1043-1048. PubMed
21. Murali-Krishnan R, Iqbal J, Rowe R, et al. Impact of frailty on outcomes after percutaneous coronary intervention: a prospective cohort study. Open Heart. 2015;2:e000294. PubMed
22. Kang L, Zhang SY, Zhu WL, et al. Is frailty associated with short-term outcomes for elderly patients with acute coronary syndrome? J Geriatr Cardiol. 2015;12:662-667.
23. Conroy S, Chikura G. Emergency care for frail older people-urgent AND important-but what works? Age Ageing. 2015;44:724-725. PubMed
24. Connolly S, O’Shea E. The impact of dementia on length of stay in acute hospitals in Ireland. Dementia (London). 2015;14:650-658. PubMed
25. Fick DM, Steis MR, Waller JL, Inouye SK. Delirium superimposed on dementia is associated with prolonged length of stay and poor outcomes in hospitalized older adults. J Hosp Med. 2013;8:500-505. PubMed
26. Mecocci P, von Strauss E, Cherubini A, et al. Cognitive impairment is the major risk factor for development of geriatric syndromes during hospitalization: results from the GIFA study. Dement Geriatr Cogn Disord. 2005;20:262-269. PubMed
27. Dasgupta M, Brymer C. Poor functional recovery after delirium is associated with other geriatric syndromes and additional illnesses. Int Psychogeriatr. 2015;27:793-802. PubMed
28. Saczynski JS, Marcantonio ER, Quach L, et al. Cognitive trajectories after postoperative delirium. N Engl J Med. 2012;367:30-39.
29. Wang SY, Shamliyan TA, Talley KM, Ramakrishnan R, Kane RL. Not just specific diseases: systematic review of the association of geriatric syndromes with hospitalization or nursing home admission. Arch Gerontol Geriatr. 2013;57:16-26. PubMed
30. Luppa M, Luck T, Weyerer S, Konig HH, Riedel-Heller SG. Gender differences in predictors of nursing home placement in the elderly: a systematic review. Int Psychogeriatr. 2009;21:1015-1025. PubMed
31. Ellis G, Whitehead MA, O’Neill D, Langhorne P, Robinson D. Comprehensive geriatric assessment for older adults admitted to hospital. Cochrane Database Syst Rev. 2011;(7):CD006211. PubMed
32. HSJ/SERCO. Commission on Hospital Care for Frail Older People. Main Report. Available at: http://www.hsj.co.uk/Journals/2014/11/18/l/q/r/HSJ141121_FRAILOLDERPEOPLE_LO-RES.pdf. 2014.
33. Coni N. The unlikely geriatricians. J R Soc Med. 1996;89:587-589. PubMed
34. Islam A. Gait variability is an independent marker of frailty. Electronic thesis and dissertation repository, the University of Western Ontario, 2012. Available at: http://ir.lib.uwo.ca/etd/558. Accessed July 23, 2016.
35. Grossman D, Rootenberg M, Perri GA, et al. Enhancing communication in end-of-life care: a clinical tool translating between the Clinical Frailty Scale and the Palliative Performance Scale. J Am Geriatr Soc. 2014;62:1562-1567. PubMed
36. Panza F, Seripa D, Solfrizzi V, et al. Targeting cognitive frailty: clinical and neurobiological roadmap for a single complex phenotype. J Alzheimers Dis. 2015;47:793-813. PubMed
37. Fontana L, Kennedy BK, Longo VD, Seals D, Melov S. Medical research: treat ageing. Nature. 2014;511:405-407. PubMed
38. Conway R, Byrne D, O’Riordan D, Silke B. Emergency readmissions are substantially determined by acute illness severity and chronic debilitating illness: a single centre cohort study. Eur J Intern Med. 2015;26:12-17. PubMed
39. Cournane S, Byrne D, Conway R, O’Riordan D, Coveney S, Silke B. Social deprivation and hospital admission rates, length of stay and readmissions in emergency medical admissions. Eur J Intern Med. 2015;26:766-771. PubMed
40. Costa AP, Hirdes JP, Heckman GA, et al. Geriatric syndromes predict postdischarge outcomes among older emergency department patients: findings from the interRAI Multinational Emergency Department Study. Acad Emerg Med. 2014;21:422-433. PubMed
Geriatric syndromes are multifactorial health conditions that affect older people and include dementia, delirium, impaired mobility, falls, frailty, poor nutrition, weight loss, incontinence, and difficulties with activities of daily living.1 These syndromes are highly prevalent among older patients admitted to acute-care hospitals2,3 and often add complexity to the clinical status of hospitalized older adults with multiple comorbid conditions.4 In the English National Health Service (NHS), the proportion of older people admitted to acute-care hospitals with geriatric syndromes has increased dramatically.5
The recognition and management of geriatric syndromes by hospitalists requires specific knowledge and skill sets.6 However, geriatricians are a scarce resource in many settings, including the NHS. A challenge for service evaluation and research is the generally poor capture of information about geriatric syndromes compared to specific comorbidities in discharge summaries and hospital coding.7 Steps are being taken in the NHS to address this issue, and in 2013 our center started the routine collection of data on clinical frailty, history of dementia (HoD) and acute confusional state (ACS) in all patients 75 years or older admitted nonelectively to the hospital.8The presence of geriatric syndromes in older inpatients is an important driver of adverse outcomes, particularly length of stay (LOS) and admission to institutional care.9 However, acute illness severity (AIS) is also an important determinant of poor outcomes in the inpatient population and may drive disproportionate changes in health status in the most vulnerable.10 Research studies with geriatric syndromes in acute settings have not been able to simultaneously consider AIS.11 In addition, comorbidity is not always associated with an increased number of geriatric syndromes.12
We aimed to study the association of geriatric syndromes such as frailty, HoD and ACS that are measured in routine clinical care with hospital outcomes (prolonged LOS, inpatient mortality, delayed discharge, institutionalization, and 30-day readmission), while controlling for demographics (age, gender), AIS, comorbidity, and discharging specialty (general medicine, geriatric medicine, surgery).
PATIENTS AND METHODS
Study Design and Setting
This retrospective observational study was conducted in a large tertiary university hospital in England with 1000 acute beds receiving more than 102,000 visits to the emergency department (ED) and admitting over 73,000 patients per year; among the latter, more than 12,000 are 75 years and older.
Sample
We analyzed all first nonelective inpatient episodes (ie, from ED admission to discharge) of people 75 years and older (all specialties) between the October 26, 2014 and the October 26, 2015. Data were obtained via the hospital’s information systems following the implementation of a new electronic patient record on October 26, 2014.
Patients’ Characteristics
The following anonymized variables were extracted:
- Age and gender
- AIS information is routinely collected in our ED using a Modified Early Warning Score (ED-MEWS). The components and scoring of ED-MEWS are shown in Table 1. Where more than 1 ED-MEWS was collected, the highest was used in the analyses.
- Charlson Comorbidity Index (CCI, without age adjustment).13 The CCI is based on the discharge diagnoses, as coded according to WHO International Classification of Diseases, v 10 (ICD-10). The CCI was calculated retrospectively and would have not been available to clinicians early during the patients’ admission.
- Clinical Frailty Scale (CFS). The scoring of CFS is based on a global assessment of patients’ comorbidity symptoms, and their level of physical activity and dependency on activities of daily living, estimated to reflect the status immediately before the onset of the acute illness leading to hospitalization. The possible scores are: 1 (very fit), 2 (well), 3 (managing well), 4 (vulnerable), 5 (mildly frail), 6 (moderately frail), 7 (severely frail), 8 (very severely frail), and 9 (terminally ill) ().14 The use of the CFS in admissions of people 75 years and older was introduced in our center in 2013 under a local Commissioning for Quality and Innovation (CQUIN) scheme.8 The CQUIN required that all patients 75 years and older admitted to the hospital, via the ED, be screened for frailty using the CFS within 72 hours of admission. The admitting doctor usually scores the CFS on the electronic admission record, but it can also be completed by ED nurses or by nursing or therapy staff from the trust-wide Specialist Advice for the Frail Elderly team. Training on CFS scoring is provided to staff at a hiring orientation and at regular educational meetings. Permission to use CFS for clinical purposes was obtained from the principal investigator at Geriatric Medicine Research, Dalhousie University, Halifax, Canada.
- Cognitive variables were collected early during the admission in patients 75 years and older, thanks to a parallel local CQUIN scheme. The cognitive CQUIN variables are screening variables, not gold standard. The admission clerking is designed to clinically classify patients within 72 hours of admission into the following 3 mutually exclusive categories:
○ Known HoD (in the database: no = 0; yes = 1)
○ ACS, without HoD (in the database: no = 0; yes = 1)
○ Neither HoD nor ACS
- The cognitive CQUIN assessment does not intend to diagnose dementia in those who are not known to have it, but tries to separate the dementias that general practitioners (GPs) know from hospital-identified acute cognitive concerns that GPs may need to assess or investigate after discharge. The latter may include delirium and/or undiagnosed dementia.
- In our routine hospital practice, the initial cognitive assessment is performed by a clinician in the following fashion: if the patient is known to have dementia (ie, based on clinical history and/or chart review), the clinician selects the “known history of dementia” option in the admission navigator, and no further cognitive screening is conducted. If the patient has no known dementia, the clinician administers the 4-item Abbreviated Mental Test (AMT4): (1) age, (2) date of birth, (3) place, and (4) year, with impaired cognition indicated by an AMT4 of less than 4 and triggering the selection of “ACS without known HoD” option. If the AMT4 is normal, the clinician selects the “neither HoD nor ACS” option.
- Due to the service evaluation nature of our work, these measures could not be assessed for reliability within the electronic medical records system (eg, regarding sensitivity and specificity against a gold standard or inter-rater reliability).
- Discharged from geriatric medicine (no = 0; yes = 1). Every year, our hospital admits over 12,000 patients 75 years and older, of which 25% are managed by the Department of Medicine for the Elderly (DME). The DME specialist bed base consists of 5 core wards, which specialize in ward-based comprehensive geriatric assessment (CGA) and are supported by dedicated nursing, physiotherapy, occupational therapy, and social work teams, as well as by readily available input from speech and language therapy, clinical nutrition, psychogeriatric, pharmacy and palliative care teams. Formal multidisciplinary team meetings occur at least twice weekly. A sixth specialist DME ward with a more acute perspective has been operational for 7 years; this ward was renamed the Frailty and Acute Medicine for the Elderly (FAME) ward in 2014 and has daily multidisciplinary team meetings. Although admission to FAME is through the ED, admission to core DME wards can occur from FAME (ie, within-DME transfer), via the ED, or from other inpatient specialty areas if older patients are perceived to be in high need of CGA after screening by the Specialist Advice for the Frail Elderly team. An audit in our center showed that up to 20% of patients discharged by DME were not initially admitted by DME, underscoring the significant role of core specialist DME wards in absorbing complex cases, especially from the general medical wards.8
- Discharged from general medicine (no = 0; yes = 1). In our setting, virtually all patients discharged by general medicine were first admitted by general medicine.8
- Discharged by a surgical specialty (no = 0; yes = 1)
Hospital Outcomes
The following anonymized variables were identified:
- LOS (days). Prolonged LOS was defined as 10 or more days (no = 0; yes = 1)
- Inpatient mortality (no = 0; yes = 1)
- Delayed discharge (no = 0; yes = 1). This was defined as the total LOS being at least 1 day longer than the LOS up to the last recorded clinically fit date. This date is used in NHS hospitals to indicate that the acute medical episode has finished and discharge-planning arrangements (often via social care providers) can commence.
- Institutionalization (no = 0; yes = 1). This was defined as the discharge destination being a care home, when a care home was not the usual place of residence.
- 30-day readmission (no = 0; yes = 1)
Statistical Analyses
Anonymized data were analyzed with IBM SPSS Statistics (v 22, Armonk, New York) software. Descriptive statistics were given as count (with percentage) or mean (with standard deviation.
To avoid potential problems with multicollinearity in the multivariate regression models, the correlations among the predictor variables were checked using a correlation matrix of 2-sided Spearman’s rho correlation coefficients. Correlations of 0.50 or more were considered large.15,16
Because all outcomes in the study were binary, multivariate binary logistic regression models were computed. In these models, the odds ratio (OR) reflects the effect size of each predictor; 95% confidence intervals (CI) were requested for each OR. Predictors with P < 0.01 were considered as statistically significant. The classification performance of each logistic regression model was assessed calculating its area under the curve (AUC).
Sensitivity analyses were conducted after imputing missing data (SPSS multiple imputation procedure) and after fitting interaction terms between geriatric syndromes and discharge by geriatric medicine.
RESULTS
The initial database contained 12,282 nonelective admission and discharge episodes (all specialties) of patients 75 years and older between October 26, 2014 and October 26, 2015. Among those, 8202 (66.8%) were first episodes. Table 2 shows the sample descriptives, and Table 3 shows the breakdown of geriatric syndromes (single and multiple) in the total sample (n = 8282), including missing frailty data.
In the correlation matrix of 2-sided Spearman’s rho correlation coefficients, no correlations with large-effect size were found to suggest issues with multicollinearity; the largest correlation coefficients were between age and CFS (rho = 0.35), HoD and CFS (rho = 0.32), and CCI and CFS (rho = 0.26).
The results of the multivariate regression models are shown in Table 4. The best performing models were the ones for inpatient mortality (AUC = 0.80), followed by institutionalization (AUC = 0.76), and prolonged LOS (AUC = 0.71). After full adjustment, clinical frailty was an independent predictor of prolonged LOS, inpatient mortality, delayed discharge, and institutionalization. HoD was an independent predictor of prolonged LOS, delayed discharge, and institutionalization; and ACS was an independent predictor of prolonged LOS, delayed discharge, institutionalization, and 30-day readmission (Table 4). Results did not significantly change in sensitivity analyses conducted after multiple imputation of missing data and after inclusion of interaction terms (see Supplemental Table 1 and Supplemental Table
DISCUSSION
Our aim was to study the association of geriatric syndromes (measured in routine clinical care) with hospital outcomes. We found that geriatric syndromes such as clinical frailty, HoD, and ACS were strong independent predictors. Concerning prolonged LOS, delayed discharge, and institutionalization, geriatric syndromes had ORs that were greater than those of traditionally measured factors such as demographics, comorbidity and acute illness severity. Our findings add to the body of knowledge in this area because we accounted for the latter effects. Our experience shows that metrics on geriatric syndromes can be successfully collected in the routine hospital setting and add clear value to the prediction of operational outcomes. This may encourage other hospitals to do the same.
Our findings are consistent with suggestions that accounting for chronic conditions alone may be less informative than also accounting for the co-occurrence of geriatric syndromes.17 The focus of CFS is on the pre-admission level of physical activity and dependency on activities of daily living, and poorer scores may confer vulnerability to adverse outcomes due to reduced physiological reserve and ability to withstand acute stressors.18 Other studies have also found CFS to be a good predictor of inpatient outcomes,19-22 and it has been recommended as a possible means to identify vulnerable older adults in acute-care settings.23
HoD and ACS had independent effects beyond frailty, particularly in prolonging LOS, delaying discharge, and requiring institutionalization. Dementia prolongs LOS,24 and delirium prolongs hospitalization for persons with dementia.25 Older people with cognitive impairment may have an increased risk of acquiring new geriatric syndromes during hospitalization, particularly if it is prolonged.26 One study showed that the risk of poor functional recovery can be as high as 70% in complex delirious patients in hospital.27 All too often, delirium is neither benign nor reversible, with a significant proportion of patients not experiencing restoration ad integrum of cognition and function.28
Our results are consistent with observations that geriatric syndromes are associated with higher risk of institutionalization.29 It was interesting that female gender seemed to be an independent predictor of institutionalization, which is consistent with the results of a systematic review showing that the male-to-female ratio of admission rates ranged between 1 to 1.4 and 1 to 1.6.30
Discharge by general medicine appeared to be associated with a lower likelihood of prolonged LOS, and discharge by geriatric medicine seemed to be associated with a higher likelihood of delayed discharge and institutionalization. Unsurprisingly, geriatric medicine wards tend to absorb the most complex cases, often with complex discharge planning needs.8 In that light, CGA in geriatric wards may not be associated with reduced LOS (and it is possible that the LOS of complex patients might have been higher in nongeriatric wards). In addition, inpatient CGA increases frail patients’ likelihood of survival.31
Our study suggests that routinely collected metrics on frailty, HoD and ACS may be helpful to better adapt hospital care to the real requirements of aged people. The proportion of older people admitted to acute hospitals with geriatric syndromes continues to increase5 and geriatricians are a scarce resource. It will be increasingly important to upskill nongeriatric hospitalists in the recognition and management of geriatric syndromes. Frail older people are becoming the core business of acute hospitals,32 making geriatrics “too important to be left to geriatricians.”33 Therefore, easily collected metrics on geriatric syndromes may help nongeriatricians identify these syndromes and address them early during admission.
Our study has important limitations. Firstly, geriatric syndromes were not identified with gold-standard measures. For example, ACS in the absence of known dementia should be seen only as a surrogate for delirium. ACS as a proxy measure is likely to underestimate the diagnosis of delirium, because the hypoactive type is commonly missed without valid measures. In addition, a patient with delirium superimposed upon dementia would have been coded as a ‘known dementia.’ The geriatric syndromes’ measures could not be assessed for reliability within the electronic medical records system (eg, regarding sensitivity and specificity against a gold standard, or interrater reliability).
About the potential limitations of CFS, there have been concerns that an interobserver discrepancy in CFS scoring may occur between health professionals. However, 1 study investigated the interrater reliability of CFS between clinicians in 107 community-dwelling older adults 75 years and older, finding a substantial agreement with a weighted
Another limitation of our study is that we treated geriatric syndromes and the other predictors in the models as independent variables. However, many of the factors may be interrelated, and they present simultaneously in many patients. Indeed, the bivariate correlation between CFS and HoD was of moderate strength, because worsening cognition should score higher on CFS according to the scoring protocol. As expected, there was also a medium-sized correlation between CFS and CCI. It has been suggested that physical and cognitive frailty may be more informative as a single complex phenotype.36 Indeed, the problems of old age tend to come as a package.37
For 30-day readmission, the AUC of the model was small, suggesting the existence of unmeasured explanatory variables. For example, although our results agree that AIS and chronic illness predict readmission,38 the latter still remains an elusive outcome, and a more accurate prediction may be attained by adding socioeconomic variables to models.39Our study echoes the potential utility of incorporating common geriatric clinical features in routine clinical examination and disposition planning for older patients in acute settings.40 Hospitals may find it informative to undertake large-scale screening for geriatric syndromes including frailty, dementia, and delirium in all older adults admitted via the ED. When combined with other routinely collected variables such as demographics, AIS, and comorbidity data, this process may provide hospitals with information that will help define the acute needs of the local population and aid in the development of care pathways for the growing population of older adults.
Acknowledgments
The authors wish to thank all members of the acute teams in our hospital, without which this initiative would have not been possible. Licensed access to the NHS Foundation Trust’s information systems is also gratefully acknowledged.
Disclosure
The authors report no financial conflicts of interest.
1. Inouye SK, Studenski S, Tinetti ME, Kuchel GA. Geriatric syndromes: clinical, research, and policy implications of a core geriatric concept. J Am Geriatr Soc. 2007;55:780-791. PubMed
2. Lakhan P, Jones M, Wilson A, Courtney M, Hirdes J, Gray LC. A prospective cohort study of geriatric syndromes among older medical patients admitted to acute care hospitals. J Am Geriatr Soc. 2011;59:2001-2008. PubMed
3. Flood KL, Rohlfing A, Le CV, Carr DB, Rich MW. Geriatric syndromes in elderly patients admitted to an inpatient cardiology ward. J Hosp Med. 2007;2:394-400. PubMed
4. Clerencia-Sierra M, Calderon-Larranaga A, Martinez-Velilla N, et al. Multimorbidity patterns in hospitalized older patients: associations among chronic diseases and geriatric syndromes. PLoS One. 2015;10:e0132909. PubMed
5. Soong J, Poots AJ, Scott S, et al. Quantifying the prevalence of frailty in English hospitals. BMJ Open. 2015;5:e008456. PubMed
6. Warshaw GA, Bragg EJ, Fried LP, Hall WJ. Which patients benefit the most from a geriatrician’s care? Consensus among directors of geriatrics academic programs. J Am Geriatr Soc. 2008;56:1796-1801. PubMed
7. Ugboma I, Syddall HE, Cox V, Cooper C, Briggs R, Sayer AA. Coding geriatric syndromes: How good are we? CME J Geriatr Med. 2008;10:34-36. PubMed
8. Wallis SJ, Wall J, Biram RW, Romero-Ortuno R. Association of the clinical frailty scale with hospital outcomes. QJM. 2015;108:943-949. PubMed
9. Anpalahan M, Gibson SJ. Geriatric syndromes as predictors of adverse outcomes of hospitalization. Intern Med J. 2008;38:16-23. PubMed
10. Cournane S, Byrne D, O’Riordan D, Fitzgerald B, Silke B. Chronic disabling disease--impact on outcomes and costs in emergency medical admissions. QJM. 2015;108:387-396. PubMed
11. Soong J, Poots AJ, Scott S, Donald K, Bell D. Developing and validating a risk prediction model for acute care based on frailty syndromes. BMJ Open. 2015;5:e008457. PubMed
12. Vetrano DL, Foebel AD, Marengoni A, et al. Chronic diseases and geriatric syndromes: The different weight of comorbidity. Eur J Intern Med. 2016;27:62-67. PubMed
13. Charlson ME, Pompei P, Ales KL, MacKenzie CR. A new method of classifying prognostic comorbidity in longitudinal studies: development and validation. J Chronic Dis. 1987;40:373-383. PubMed
14. Rockwood K, Song X, MacKnight C, et al. A global clinical measure of fitness and frailty in elderly people. CMAJ. 2005;173:489-495. PubMed
15. Fritz CO, Morris PE, Richler JJ. Effect size estimates: current use, calculations, and interpretation. J Exp Psychol Gen. 2012;141:2-18. PubMed
16. Cohen J. Statistical Power Analysis for the Behavioral Sciences. 2nd ed. Hillsdale, NJ: Lawrence Erlbaum Associates; 1988.
17. Koroukian SM, Schiltz N, Warner DF, et al. Combinations of chronic conditions, functional limitations, and geriatric syndromes that predict health outcomes. J Gen Intern Med. 2016;31:630-637. PubMed
18. Clegg A, Young J, Iliffe S, Rikkert MO, Rockwood K. Frailty in elderly people. Lancet. 2013;381:752-762. PubMed
19. Romanowski KS, Barsun A, Pamlieri TL, Greenhalgh DG, Sen S. Frailty score on admission predicts outcomes in elderly burn injury. J Burn Care Res. 2015;36:1-6. PubMed
20. Ritt M, Schwarz C, Kronawitter V, et al. Analysis of Rockwood et al’s clinical frailty scale and Fried et al’s frailty phenotype as predictors of mortality and other clinical outcomes in older patients who were admitted to a geriatric ward. J Nutr Health Aging. 2015;19:1043-1048. PubMed
21. Murali-Krishnan R, Iqbal J, Rowe R, et al. Impact of frailty on outcomes after percutaneous coronary intervention: a prospective cohort study. Open Heart. 2015;2:e000294. PubMed
22. Kang L, Zhang SY, Zhu WL, et al. Is frailty associated with short-term outcomes for elderly patients with acute coronary syndrome? J Geriatr Cardiol. 2015;12:662-667.
23. Conroy S, Chikura G. Emergency care for frail older people-urgent AND important-but what works? Age Ageing. 2015;44:724-725. PubMed
24. Connolly S, O’Shea E. The impact of dementia on length of stay in acute hospitals in Ireland. Dementia (London). 2015;14:650-658. PubMed
25. Fick DM, Steis MR, Waller JL, Inouye SK. Delirium superimposed on dementia is associated with prolonged length of stay and poor outcomes in hospitalized older adults. J Hosp Med. 2013;8:500-505. PubMed
26. Mecocci P, von Strauss E, Cherubini A, et al. Cognitive impairment is the major risk factor for development of geriatric syndromes during hospitalization: results from the GIFA study. Dement Geriatr Cogn Disord. 2005;20:262-269. PubMed
27. Dasgupta M, Brymer C. Poor functional recovery after delirium is associated with other geriatric syndromes and additional illnesses. Int Psychogeriatr. 2015;27:793-802. PubMed
28. Saczynski JS, Marcantonio ER, Quach L, et al. Cognitive trajectories after postoperative delirium. N Engl J Med. 2012;367:30-39.
29. Wang SY, Shamliyan TA, Talley KM, Ramakrishnan R, Kane RL. Not just specific diseases: systematic review of the association of geriatric syndromes with hospitalization or nursing home admission. Arch Gerontol Geriatr. 2013;57:16-26. PubMed
30. Luppa M, Luck T, Weyerer S, Konig HH, Riedel-Heller SG. Gender differences in predictors of nursing home placement in the elderly: a systematic review. Int Psychogeriatr. 2009;21:1015-1025. PubMed
31. Ellis G, Whitehead MA, O’Neill D, Langhorne P, Robinson D. Comprehensive geriatric assessment for older adults admitted to hospital. Cochrane Database Syst Rev. 2011;(7):CD006211. PubMed
32. HSJ/SERCO. Commission on Hospital Care for Frail Older People. Main Report. Available at: http://www.hsj.co.uk/Journals/2014/11/18/l/q/r/HSJ141121_FRAILOLDERPEOPLE_LO-RES.pdf. 2014.
33. Coni N. The unlikely geriatricians. J R Soc Med. 1996;89:587-589. PubMed
34. Islam A. Gait variability is an independent marker of frailty. Electronic thesis and dissertation repository, the University of Western Ontario, 2012. Available at: http://ir.lib.uwo.ca/etd/558. Accessed July 23, 2016.
35. Grossman D, Rootenberg M, Perri GA, et al. Enhancing communication in end-of-life care: a clinical tool translating between the Clinical Frailty Scale and the Palliative Performance Scale. J Am Geriatr Soc. 2014;62:1562-1567. PubMed
36. Panza F, Seripa D, Solfrizzi V, et al. Targeting cognitive frailty: clinical and neurobiological roadmap for a single complex phenotype. J Alzheimers Dis. 2015;47:793-813. PubMed
37. Fontana L, Kennedy BK, Longo VD, Seals D, Melov S. Medical research: treat ageing. Nature. 2014;511:405-407. PubMed
38. Conway R, Byrne D, O’Riordan D, Silke B. Emergency readmissions are substantially determined by acute illness severity and chronic debilitating illness: a single centre cohort study. Eur J Intern Med. 2015;26:12-17. PubMed
39. Cournane S, Byrne D, Conway R, O’Riordan D, Coveney S, Silke B. Social deprivation and hospital admission rates, length of stay and readmissions in emergency medical admissions. Eur J Intern Med. 2015;26:766-771. PubMed
40. Costa AP, Hirdes JP, Heckman GA, et al. Geriatric syndromes predict postdischarge outcomes among older emergency department patients: findings from the interRAI Multinational Emergency Department Study. Acad Emerg Med. 2014;21:422-433. PubMed
© 2017 Society of Hospital Medicine
Short-Term Projected Use of Reverse Total Shoulder Arthroplasty in Proximal Humerus Fracture Cases Recorded in Humana’s National Private-Payer Database
Take-Home Points
- RTSA is projected to triple by 2020.
- RTSA for fracture indication anticipates a 4.9% compound quarterly growth rate.
- RTSA is gaining in popularity likely due to unpredictable results of hemiarthroplasty in select patients.
Reverse total shoulder arthroplasty (RTSA) is an accepted treatment option for the pain and dysfunction associated with glenohumeral arthritis and severe rotator cuff pathology.1-3 Recently, it has been gaining acceptance as an alternative to hemiarthroplasty (HA) and open reduction and internal fixation (ORIF) in the surgical management of complex proximal humerus fractures (PHFs) in elderly patients.4-6 The advantages of RTSA over other PHF treatment options include a lower revision rate and superior range of motion.4,5
PHF remains one of the most common fracture pathologies in the United States.7 Given the country’s aging patient population, the popularity of RTSA likely will continue to increase.4-6 The release of supercomputer data from individual private-payer insurance providers provides an opportunity to investigate trends in the surgical management of PHFs and to formulate models for predicting use. In this study, we used a large private-payer database to analyze these trends over the period 2010 to 2014 and project RTSA use through 2020.
Methods
We used PearlDiver’s supercomputer application to search the Humana private-payer database to retrospectively identify cases of PHF treated with the index procedure of RTSA. PearlDiver, a publicly available national database compliant with HIPAA (Health Insurance Portability and Accountability Act of 1996), compiles private-payer records submitted by Humana. These records represent 100% of the orthopedics-related payer records within the dataset. The database includes International Classification of Diseases, Ninth Revision (ICD-9) codes and Current Procedural Terminology (CPT) codes from 2007 to 2014.
RTSA cases were identified by ICD-9 codes 81.80 and 81.88 and CPT code 23472. PHFs were identified by ICD-9, Clinical Modification (ICD-9-CM) codes 812.00, 812.01, 812.02, 812.03, 812.09, 812.10, 812.11, 812.12, 812.13, 812.19, and 812.20. Holt-Winters quarterly (Q) projection analysis was performed on the RTSA-PHF data from Q1-2010 through Q4-2020 (Figure). 
Results
For the known study period Q1-2010 through Q3-2014, our search yielded 46,106 PHF cases, 4057 (8.8%) of which were surgically treated with RTSAs (Table 1). 

Age-based subgroup analysis revealed RTSA was performed primarily in the older-than-65 years patient population, with the highest percentage in the 70-to-74 years age group (24.4%), followed by the 75-to-79 years age group (21.6%) (Table 2).
Discussion
Use of RTSA for the management of complex PHFs has increased tremendously over the past several years. The primary results of our study showed an upward trend in RTSA use in the Humana population. CQGR was 6.5% from Q1-2010 through Q3-2014 (the number of RTSAs increased to 294 from 95). Based on the Holt-Winters projection analysis, CQGR was projected to be 2.8% through 2020 (339 RTSAs in Q4-2014 increasing to 664 RTSAs in Q4-2020), resulting in an overall 10-year CQGR of 4.6%.
Recent studies have shown RTSA to be a viable alternative to HA in patients with PHFs. It has been suggested that RTSAs may have more reliable clinical outcomes without a comparative increase in complication rates.1,8,9 HA has been associated with unpredictable motion, higher complication rates, and high rates of unsatisfactory results in patients older than 65 years.10-12 In addition, studies have found that, compared with HA and ORIF, RTSA produces superior range of motion.8,9 The reliability of clinical outcomes in the early transition to use of RTSA for complex fractures suggests that use of RTSA for PHF management is trending upward. Results of the present study showed a steady increase in RTSA use. This trend is further supported by a recent study finding on national trends in RTSA use in PHF cases: 12.3% annual growth during the period 2000 to 2008.6Our study results showed a continued steady quarterly increase in use of RTSA for PHFs, projected to triple by Q4-2020 (Table 1). The increasing popularity of RTSA may be attributable to its better clinical outcomes and to the procedural instruction given to newly trained orthopedic surgeons during residency. A recent study found a substantial increase in the use of RTSA for PHFs—from 2% in 2005 to 38% in 2012—among newly trained orthopedic surgeons.13 Another possible driver of the increase is cost. Although RTSA implant costs are often a multiple of the costs of other treatment options, different findings were reported in 2 recent studies that used quality-adjusted life-years (QALY) to determine RTSA cost-effectiveness. Coe and colleagues14 compared RTSA with HA and found RTSA to be cost-effective but highly dependent on implant cost. They determined that an implant cost of over $13,000 put RTSA cost-effectiveness at just under $100,000 QALY, whereas an implant cost of under $7000 brought QALY down to under $50,000. Renfree and colleagues15 used the same QALY benchmark but found RTSA to be at the highly cost-effective threshold of under $25,000 QALY.
Current literature recommends RTSA be performed primarily for elderly patients.1,2,16,17 Guery and colleagues2 suggested limiting RTSA to patients who are older than 70 years and have low functional demands. In 2 studies of RTSA use in complex humeral fractures, Gallinet and colleagues16,18 found an increased rate of scapular notching in younger patients and recommended restricting RTSA to patients 70 years or older. PHFs in patients older than 70 years often have more complex fracture patterns and poor-quality bone, which makes fracture healing more challenging in HA and ORIF settings. As tuberosity healing is crucial to functional outcomes of surgically treated PHFs, RTSA has been advanced as a more reliable option in patients in whom tuberosity healing is expected to be unreliable. The present study’s finding that 68.5% of the RTSA patients in the Humana population were older than 70 years further supports the literature’s emphasis on reserving RTSA for patients over 70 years.
This study had its limitations. The PearlDiver database depends on accurate ICD-9 and CPT coding, and there was potential for reporting bias. In addition, a new, specific ICD-9 code for RTSA was introduced in 2010 and may not have been immediately used; data reported during this time could have been affected. Furthermore, the data were primarily represented by a single private-payer organization (Humana) and therefore may not have fully encapsulated the entire US trend. Projection in this study did not account for US Census–predicted population growth and therefore may have underestimated the true projected use of RTSA for PHFs.
This study benefited from the completeness of the data used. PearlDiver represents 100% of Humana claims data, providing a large patient population for analysis and capturing data as recent as 2014. To our knowledge, no other large database studies have used such up-to-date data.
Conclusion
RTSA is becoming an increasingly popular treatment option for PHFs. Modest overall quarterly growth in use of RTSA for PHFs (CQGR, 4.6%) is predicted through Q4-2020. Number of RTSAs performed for PHF management is projected to more than triple by 2020.
Am J Orthop. 2017;46(1):E28-E31. Copyright Frontline Medical Communications Inc. 2017. All rights reserved.
1. Cuff DJ, Pupello DR. Comparison of hemiarthroplasty and reverse shoulder arthroplasty for the treatment of proximal humeral fractures in elderly patients. J Bone Joint Surg Am. 2013;95(22):2050-2055.
2. Guery J, Favard L, Sirveaux F, Oudet D, Mole D, Walch G. Reverse total shoulder arthroplasty. J Bone Joint Surg Am. 2006;88(8):1742-1747.
3. Lawrence TM, Ahmadi S, Sanchez-Sotelo J, Sperling JW, Cofield RH. Patient reported activities after reverse shoulder arthroplasty: part II. J Shoulder Elbow Surg. 2012;21(11):1464-1469.
4. Anakwenze OA, Zoller S, Ahmad CS, Levine WN. Reverse shoulder arthroplasty for acute proximal humerus fractures: a systematic review. J Shoulder Elbow Surg. 2014;23(4):e73-e80.
5. Sebastiá-Forcada E, Cebrián-Gómez R, Lizaur-Utrilla A, Gil-Guillén V. Reverse shoulder arthroplasty versus hemiarthroplasty for acute proximal humeral fractures. A blinded, randomized, controlled, prospective study. J Shoulder Elbow Surg. 2014;23(10):1419-1426.
6. Schairer WW, Nwachukwu BU, Lyman S, Craig EV, Gulotta LV. National utilization of reverse total shoulder arthroplasty in the United States. J Shoulder Elbow Surg. 2015;24(1):91-97.
7. Bell JE, Leung BC, Spratt KF, et al. Trends and variation in incidence, surgical treatment, and repeat surgery of proximal humeral fractures in the elderly. J Bone Joint Surg Am. 2011;93(2):121-131.
8. Chalmers PN, Slikker W 3rd, Mall NA, et al. Reverse total shoulder arthroplasty for acute proximal humeral fracture: comparison to open reduction-internal fixation and hemiarthroplasty. J Shoulder Elbow Surg. 2014;23(2):197-204.
9. Jones KJ, Dines DM, Gulotta L, Dines JS. Management of proximal humerus fractures utilizing reverse total shoulder arthroplasty. Curr Rev Musculoskelet Med. 2013;6(1):63-70.
10. Antuña SA, Sperling JW, Cofield RH. Shoulder hemiarthroplasty for acute fractures of the proximal humerus: a minimum five-year follow-up. J Shoulder Elbow Surg. 2008;17(2):202-209.
11. Boileau P, Krishnan SG, Tinsi L, Walch G, Coste JS, Molé D. Tuberosity malposition and migration: reasons for poor outcomes after hemiarthroplasty for displaced fractures of the proximal humerus. J Shoulder Elbow Surg. 2002;11(5):401-412.
12. Goldman RT, Koval KJ, Cuomo F, Gallagher MA, Zuckerman JD. Functional outcome after humeral head replacement for acute three- and four-part proximal humeral fractures. J Shoulder Elbow Surg. 1995;4(2):81-86.
13. Acevedo DC, Mann T, Abboud JA, Getz C, Baumhauer JF, Voloshin I. Reverse total shoulder arthroplasty for the treatment of proximal humeral fractures: patterns of use among newly trained orthopedic surgeons. J Shoulder Elbow Surg. 2014;23(9):1363-1367.
14. Coe MP, Greiwe RM, Joshi R, et al. The cost-effectiveness of reverse total shoulder arthroplasty compared with hemiarthroplasty for rotator cuff tear arthropathy. J Shoulder Elbow Surg. 2012;21(10):1278-1288.
15. Renfree KJ, Hattrup SJ, Chang YH. Cost utility analysis of reverse total shoulder arthroplasty. J Shoulder Elbow Surg. 2013;22(12):1656-1661.
16. Gallinet D, Adam A, Gasse N, Rochet S, Obert L. Improvement in shoulder rotation in complex shoulder fractures treated by reverse shoulder arthroplasty. J Shoulder Elbow Surg. 2013;22(1):38-44.
17. Walch G, Bacle G, Lädermann A, Nové-Josserand L, Smithers CJ. Do the indications, results, and complications of reverse shoulder arthroplasty change with surgeon’s experience? J Shoulder Elbow Surg. 2012;21(11):1470-1477.
18. Gallinet D, Clappaz P, Garbuio P, Tropet Y, Obert L. Three or four parts complex proximal humerus fractures: hemiarthroplasty versus reverse prosthesis: a comparative study of 40 cases. Orthop Traumatol Surg Res. 2009;95(1):48-55.
Take-Home Points
- RTSA is projected to triple by 2020.
- RTSA for fracture indication anticipates a 4.9% compound quarterly growth rate.
- RTSA is gaining in popularity likely due to unpredictable results of hemiarthroplasty in select patients.
Reverse total shoulder arthroplasty (RTSA) is an accepted treatment option for the pain and dysfunction associated with glenohumeral arthritis and severe rotator cuff pathology.1-3 Recently, it has been gaining acceptance as an alternative to hemiarthroplasty (HA) and open reduction and internal fixation (ORIF) in the surgical management of complex proximal humerus fractures (PHFs) in elderly patients.4-6 The advantages of RTSA over other PHF treatment options include a lower revision rate and superior range of motion.4,5
PHF remains one of the most common fracture pathologies in the United States.7 Given the country’s aging patient population, the popularity of RTSA likely will continue to increase.4-6 The release of supercomputer data from individual private-payer insurance providers provides an opportunity to investigate trends in the surgical management of PHFs and to formulate models for predicting use. In this study, we used a large private-payer database to analyze these trends over the period 2010 to 2014 and project RTSA use through 2020.
Methods
We used PearlDiver’s supercomputer application to search the Humana private-payer database to retrospectively identify cases of PHF treated with the index procedure of RTSA. PearlDiver, a publicly available national database compliant with HIPAA (Health Insurance Portability and Accountability Act of 1996), compiles private-payer records submitted by Humana. These records represent 100% of the orthopedics-related payer records within the dataset. The database includes International Classification of Diseases, Ninth Revision (ICD-9) codes and Current Procedural Terminology (CPT) codes from 2007 to 2014.
RTSA cases were identified by ICD-9 codes 81.80 and 81.88 and CPT code 23472. PHFs were identified by ICD-9, Clinical Modification (ICD-9-CM) codes 812.00, 812.01, 812.02, 812.03, 812.09, 812.10, 812.11, 812.12, 812.13, 812.19, and 812.20. Holt-Winters quarterly (Q) projection analysis was performed on the RTSA-PHF data from Q1-2010 through Q4-2020 (Figure).
Results
For the known study period Q1-2010 through Q3-2014, our search yielded 46,106 PHF cases, 4057 (8.8%) of which were surgically treated with RTSAs (Table 1).
Age-based subgroup analysis revealed RTSA was performed primarily in the older-than-65 years patient population, with the highest percentage in the 70-to-74 years age group (24.4%), followed by the 75-to-79 years age group (21.6%) (Table 2).
Discussion
Use of RTSA for the management of complex PHFs has increased tremendously over the past several years. The primary results of our study showed an upward trend in RTSA use in the Humana population. CQGR was 6.5% from Q1-2010 through Q3-2014 (the number of RTSAs increased to 294 from 95). Based on the Holt-Winters projection analysis, CQGR was projected to be 2.8% through 2020 (339 RTSAs in Q4-2014 increasing to 664 RTSAs in Q4-2020), resulting in an overall 10-year CQGR of 4.6%.
Recent studies have shown RTSA to be a viable alternative to HA in patients with PHFs. It has been suggested that RTSAs may have more reliable clinical outcomes without a comparative increase in complication rates.1,8,9 HA has been associated with unpredictable motion, higher complication rates, and high rates of unsatisfactory results in patients older than 65 years.10-12 In addition, studies have found that, compared with HA and ORIF, RTSA produces superior range of motion.8,9 The reliability of clinical outcomes in the early transition to use of RTSA for complex fractures suggests that use of RTSA for PHF management is trending upward. Results of the present study showed a steady increase in RTSA use. This trend is further supported by a recent study finding on national trends in RTSA use in PHF cases: 12.3% annual growth during the period 2000 to 2008.6Our study results showed a continued steady quarterly increase in use of RTSA for PHFs, projected to triple by Q4-2020 (Table 1). The increasing popularity of RTSA may be attributable to its better clinical outcomes and to the procedural instruction given to newly trained orthopedic surgeons during residency. A recent study found a substantial increase in the use of RTSA for PHFs—from 2% in 2005 to 38% in 2012—among newly trained orthopedic surgeons.13 Another possible driver of the increase is cost. Although RTSA implant costs are often a multiple of the costs of other treatment options, different findings were reported in 2 recent studies that used quality-adjusted life-years (QALY) to determine RTSA cost-effectiveness. Coe and colleagues14 compared RTSA with HA and found RTSA to be cost-effective but highly dependent on implant cost. They determined that an implant cost of over $13,000 put RTSA cost-effectiveness at just under $100,000 QALY, whereas an implant cost of under $7000 brought QALY down to under $50,000. Renfree and colleagues15 used the same QALY benchmark but found RTSA to be at the highly cost-effective threshold of under $25,000 QALY.
Current literature recommends RTSA be performed primarily for elderly patients.1,2,16,17 Guery and colleagues2 suggested limiting RTSA to patients who are older than 70 years and have low functional demands. In 2 studies of RTSA use in complex humeral fractures, Gallinet and colleagues16,18 found an increased rate of scapular notching in younger patients and recommended restricting RTSA to patients 70 years or older. PHFs in patients older than 70 years often have more complex fracture patterns and poor-quality bone, which makes fracture healing more challenging in HA and ORIF settings. As tuberosity healing is crucial to functional outcomes of surgically treated PHFs, RTSA has been advanced as a more reliable option in patients in whom tuberosity healing is expected to be unreliable. The present study’s finding that 68.5% of the RTSA patients in the Humana population were older than 70 years further supports the literature’s emphasis on reserving RTSA for patients over 70 years.
This study had its limitations. The PearlDiver database depends on accurate ICD-9 and CPT coding, and there was potential for reporting bias. In addition, a new, specific ICD-9 code for RTSA was introduced in 2010 and may not have been immediately used; data reported during this time could have been affected. Furthermore, the data were primarily represented by a single private-payer organization (Humana) and therefore may not have fully encapsulated the entire US trend. Projection in this study did not account for US Census–predicted population growth and therefore may have underestimated the true projected use of RTSA for PHFs.
This study benefited from the completeness of the data used. PearlDiver represents 100% of Humana claims data, providing a large patient population for analysis and capturing data as recent as 2014. To our knowledge, no other large database studies have used such up-to-date data.
Conclusion
RTSA is becoming an increasingly popular treatment option for PHFs. Modest overall quarterly growth in use of RTSA for PHFs (CQGR, 4.6%) is predicted through Q4-2020. Number of RTSAs performed for PHF management is projected to more than triple by 2020.
Am J Orthop. 2017;46(1):E28-E31. Copyright Frontline Medical Communications Inc. 2017. All rights reserved.
1. Cuff DJ, Pupello DR. Comparison of hemiarthroplasty and reverse shoulder arthroplasty for the treatment of proximal humeral fractures in elderly patients. J Bone Joint Surg Am. 2013;95(22):2050-2055.
2. Guery J, Favard L, Sirveaux F, Oudet D, Mole D, Walch G. Reverse total shoulder arthroplasty. J Bone Joint Surg Am. 2006;88(8):1742-1747.
3. Lawrence TM, Ahmadi S, Sanchez-Sotelo J, Sperling JW, Cofield RH. Patient reported activities after reverse shoulder arthroplasty: part II. J Shoulder Elbow Surg. 2012;21(11):1464-1469.
4. Anakwenze OA, Zoller S, Ahmad CS, Levine WN. Reverse shoulder arthroplasty for acute proximal humerus fractures: a systematic review. J Shoulder Elbow Surg. 2014;23(4):e73-e80.
5. Sebastiá-Forcada E, Cebrián-Gómez R, Lizaur-Utrilla A, Gil-Guillén V. Reverse shoulder arthroplasty versus hemiarthroplasty for acute proximal humeral fractures. A blinded, randomized, controlled, prospective study. J Shoulder Elbow Surg. 2014;23(10):1419-1426.
6. Schairer WW, Nwachukwu BU, Lyman S, Craig EV, Gulotta LV. National utilization of reverse total shoulder arthroplasty in the United States. J Shoulder Elbow Surg. 2015;24(1):91-97.
7. Bell JE, Leung BC, Spratt KF, et al. Trends and variation in incidence, surgical treatment, and repeat surgery of proximal humeral fractures in the elderly. J Bone Joint Surg Am. 2011;93(2):121-131.
8. Chalmers PN, Slikker W 3rd, Mall NA, et al. Reverse total shoulder arthroplasty for acute proximal humeral fracture: comparison to open reduction-internal fixation and hemiarthroplasty. J Shoulder Elbow Surg. 2014;23(2):197-204.
9. Jones KJ, Dines DM, Gulotta L, Dines JS. Management of proximal humerus fractures utilizing reverse total shoulder arthroplasty. Curr Rev Musculoskelet Med. 2013;6(1):63-70.
10. Antuña SA, Sperling JW, Cofield RH. Shoulder hemiarthroplasty for acute fractures of the proximal humerus: a minimum five-year follow-up. J Shoulder Elbow Surg. 2008;17(2):202-209.
11. Boileau P, Krishnan SG, Tinsi L, Walch G, Coste JS, Molé D. Tuberosity malposition and migration: reasons for poor outcomes after hemiarthroplasty for displaced fractures of the proximal humerus. J Shoulder Elbow Surg. 2002;11(5):401-412.
12. Goldman RT, Koval KJ, Cuomo F, Gallagher MA, Zuckerman JD. Functional outcome after humeral head replacement for acute three- and four-part proximal humeral fractures. J Shoulder Elbow Surg. 1995;4(2):81-86.
13. Acevedo DC, Mann T, Abboud JA, Getz C, Baumhauer JF, Voloshin I. Reverse total shoulder arthroplasty for the treatment of proximal humeral fractures: patterns of use among newly trained orthopedic surgeons. J Shoulder Elbow Surg. 2014;23(9):1363-1367.
14. Coe MP, Greiwe RM, Joshi R, et al. The cost-effectiveness of reverse total shoulder arthroplasty compared with hemiarthroplasty for rotator cuff tear arthropathy. J Shoulder Elbow Surg. 2012;21(10):1278-1288.
15. Renfree KJ, Hattrup SJ, Chang YH. Cost utility analysis of reverse total shoulder arthroplasty. J Shoulder Elbow Surg. 2013;22(12):1656-1661.
16. Gallinet D, Adam A, Gasse N, Rochet S, Obert L. Improvement in shoulder rotation in complex shoulder fractures treated by reverse shoulder arthroplasty. J Shoulder Elbow Surg. 2013;22(1):38-44.
17. Walch G, Bacle G, Lädermann A, Nové-Josserand L, Smithers CJ. Do the indications, results, and complications of reverse shoulder arthroplasty change with surgeon’s experience? J Shoulder Elbow Surg. 2012;21(11):1470-1477.
18. Gallinet D, Clappaz P, Garbuio P, Tropet Y, Obert L. Three or four parts complex proximal humerus fractures: hemiarthroplasty versus reverse prosthesis: a comparative study of 40 cases. Orthop Traumatol Surg Res. 2009;95(1):48-55.
Poorer Arthroscopic Outcomes of Mild Dysplasia With Cam Femoroacetabular Impingement Versus Mixed Femoroacetabular Impingement in Absence of Capsular Repair
Take-Home Points
- Cam deformity often occurs with dysplasia.
- Borderline or mild dysplasia has been treated with isolated hip arthroscopy.
- Avoid rim trimming that can make mild dysplasia more severe.
- Labral preservation, cam decompression, and capsular repair or plication are currently suggested.
- Poorer outcomes occurred in borderline or mild dysplasia with cam impingement relative to controls following hip arthroscopy without capsular repair.
- Initial clinical improvement may be followed by clinical deterioration suggesting close long-term follow-up with prompt addition of reorientation acetabular osteotomy if indicated.
- It is unknown whether small capsulotomies may yield comparable outcomes with larger capsulotomies plus repair.
It is unknown whether small capsulotomies may yield comparable outcomes with larger capsulotomies plus repair. There is growing interest in hip preservation surgery in general and arthroscopic hip preservation in particular. Chondrolabral pathology leading to symptoms and degenerative progression typically is caused by structural abnormalities, mainly femoroacetabular impingement (FAI) and developmental dysplasia of the hip. Unlike the bony overcoverage of pincer FAI, developmental dysplasia of the hip typically exhibits insufficient anterolateral coverage of the femoral head.
The role of hip arthroscopy in the treatment of dysplasia remains undefined. Emerging evidence shows a high incidence of dysplasia with associated cam deformity,1,2 but there is a paucity of evidence-based information for this specific patient population. Clinical outcomes of hip arthroscopy in the setting of dysplasia are conflicting: some poor3-5 and others successful.1,6-9 Although reorientation periacetabular osteotomy (PAO) is considered a mainstay in the treatment of dysplasia—providing improvement in symptoms, deficient anterolateral acetabular coverage, and hip biomechanics—midterm failure rates approaching 24% have been reported.10-12 Many young patients with symptomatic dysplasia want a surgical option that is less invasive than open PAO.4 Intra-articular central compartment pathology and cam FAI commonly occur with dysplasia and are amenable to arthroscopic treatment.1,13,14 Moreover, staged PAO may be successful in cases in which arthroscopic intervention fails to provide clinical improvement.5,15
Emerging evidence suggests beneficial effects of arthroscopic capsular repair or plication in the setting of borderline or mild dysplasia.7,9 However, the literature provides little information on arthroscopic outcomes without capsular repair. One study found poor outcomes of arthroscopic surgery for dysplasia, but its patients underwent labral débridement, not repair.3 Two patients in a case report demonstrated rapidly progressive osteoarthritis after arthroscopic labral repairs and concurrent femoroplasties for cam FAI, but each had marked dysplasia with a lateral center-edge angle (LCEA) of <15°.4
Arthroscopy with capsular repair has been assumed to provide better outcomes than arthroscopy without repair, but to our knowledge there are no studies that have compared outcomes of mild dysplasia with cam FAI and outcomes of mixed FAI treated without capsular repair. Clinical equipoise makes it ethically challenging to perform a prospective study comparing dysplasia treated with and without capsular repair. We conducted a study to compare outcomes of mild dysplasia with cam FAI and outcomes of mixed FAI treated with arthroscopic surgery and to fill the knowledge gap regarding outcomes of mild dysplasia treated without capsular repair.
Methods
In this study, which received Institutional Review Board approval, we retrospectively reviewed radiographs and data from a prospective 3-center study of arthroscopic outcomes of FAI in 150 patients (159 hips) who underwent arthroscopic surgery by 1 of 3 surgeons between March 2009 and June 2010. In all cases, digital images of anteroposterior pelvic radiographs were used for radiographic measurements. On these images, the LCEA is formed by the intersection of the vertical line (corrected for obliquity using a horizontal reference line connecting the inferior extents of both radiographic teardrops) through the center of the femoral head (determined with a digital centering tool) with the line extending to the lateral edge of the sourcil (radiographic eyebrow of the weight-bearing region or roof of the acetabulum). Measurements were made in blinded fashion (by a nonsurgeon coauthor, Dr. Nikhil Gupta, who completed training modules) and were confirmed without alteration by the principal investigator Dr. Dean K. Matsuda. Inclusion criteria were mild acetabular dysplasia (LCEA, 15°-24°) and mixed FAI including focal pincer component (LCEA, 25°-39°), radiographic crossover sign, and successful completion of patient-reported outcome (PRO) measures at minimum 2-year follow-up. Exclusion criteria were severe dysplasia (LCEA, <15°), hip subluxation, broken Shenton line, global pincer FAI (LCEA, ≥40°), Tönnis grade 3 osteoarthritis, Legg-Calvé-Perthes disease, osteonecrosis, prior hip surgery, and unsuccessful completion of PRO measures. Outcome measures included investigator-blinded preoperative and postoperative Nonarthritic Hip Score (NAHS) and 5-point Likert satisfaction score. Complications, revision surgeries, and conversion arthroplasties were recorded.
Statistical Analysis
We examined outcomes with descriptive statistics for each of the candidate covariates in the model classified by femoroacetabular subtype: focal pincer and cam (mixed FAI) and dysplasia with cam. We examined the variables of sex, age, weight, height, body mass index, preoperative NAHS, presence of dysplasia (yes/no), presence of osteoarthritis (yes/no), Tönnis osteoarthritis grade, Outerbridge class, American Society of Anesthesiologists (ASA) score, months of pain, bilateral procedure (yes/no), and pincer involvement with cam FAI (yes/no). Before beginning linear regression modeling, we screened the candidate variables for strong correlations with other variables and looked for those variables with minimal missing data. For all these covariates, we then performed linear regression with a selection process—both a stepwise selection method and a backward elimination method—to verify we determined the same model for 24-month NAHS, or to understand why we could not. Finally, we ran the model we found from the linear regression as a linear mixed model of 24-month NAHS with the dichotomous variables taken as fixed effects and the other variables taken as random effects, using variance-components representation for the random effects. We then examined 3-month and 12-month NAHS with the same variables selected for the 24-month model.
To further examine and verify the effects of dysplasia on outcomes found in our linear mixed model, we performed a nested case–control analysis matching each member of cohort D (cases) with 2 members of cohort M (controls). We used an optimal-matching algorithm to match focal patients in the linear regression dataset with dysplasia patients in the linear regression dataset in such a way as to minimize the overall differences between the datasets. We matched cases and controls on preoperative NAHS, age, sex, presence of osteoarthritis, months of pain, ASA score, and body mass index. The differences between the matched cases and controls (control value minus case value) were compared using Wilcoxon rank sum tests for statistical significance of differences from 0 (with differences generated for each control group member, 2 differences per case) to examine the quality of the match. Finally, we examined the statistical significance of the difference of the outcome variables (3-, 12-, and 24-month NAHS) from 0, again using Wilcoxon rank sum tests. Statistical significance was set at P < .05 using SAS Version 9.3 (SAS Institute).
Surgical Procedure
In all cases, supine outpatient hip arthroscopy was performed under general anesthesia. Anterolateral and modified midanterior portals16 were used. T-capsulotomies were performed in both cohorts. Cohort M underwent anterosuperior acetabuloplasty with a motorized burr. Labral refixation or selective débridement was performed in cohort M, whereas labral repair (with limited freshening of acetabular rim attachment site) or selective débridement (but no segmental resection) was performed in cohort D. Arthroscopic femoroplasty was performed with similar endpoints of 120° minimum hip flexion and 30° minimum flexed hip internal rotation with retention of the labral fluid seal. Capsular repair or plication was not performed for either cohort during the study period.
The cohorts underwent similar postoperative protocols: 2 weeks of protected ambulation using 2 crutches, exercise cycling without resistance beginning postoperative day 1, swimming at 2 weeks, elliptical machine workouts at 6 weeks, jogging at 12 weeks, and return to unrestricted athletics at 5 months.
Results
In cohort D, which consisted of 8 patients (5 female), mean age was 49.6 years, and mean LCEA was 19° (range, 16°-24°). 
In cohort D, mean (SD) change in NAHS was +20.00 (6.24) (P = .25) at 3 months (n = 3), +14.33 (9.77) (P = .03) at 12 months (n = 6), and –0.75 (19.86) (P = .74) at 24 months (n = 8). 

In cohort M, mean (SD) change in NAHS was +12.09 (18.98) (P < .0001) at 3 months (n = 45), +20.39 (16.49) (P < .0001) at 12 months (n = 57), and +21.99 (17.32) (P < .0001) at 24 months (n = 69). 
In a pairwise case–control comparison, the mean (SD) change-from-baseline difference between cohorts D and M was +8.2 (12.85) (P = .31) at 3 months (n = 5), –8.7 (11.52) (P = .03) at 12 months (n = 10), and –31.06 (23.55) (P = .0002) at 24 months (n = 16). Dysplasia had an impact of –23.4 points on 24-month NAHS (standard error = 5.35 points; P < .0001), which corresponds to a 95% confidence interval of –12.9 to –33.9 points on NAHS.

Compared with cohort M, cohort D had significantly less NAHS improvement (P = .002), less satisfaction (P = .15) and more hip arthroplasty conversions (P = .22, not statistically significant).
There were no statistically significant differences between cohorts in demographics, preoperative variables, intraoperative findings, or surgical procedures in the regression analysis. Of the investigated variables, only group membership (cohort D) was a statistically significant predictor of poorer outcomes in the model of change from preoperative to 24 months. However, older age was associated with cohort D (older patients with dysplasia, P = .07), and therefore in the nested case–control analysis we were able to match on all variables except age (8.74 years older in cohort D, P = .0013) to a level of statistical nonsignificance.
Discussion
The principal finding of this study is the significantly poorer outcomes of mild dysplasia and cam FAI relative to mixed FAI after hip arthroscopy without capsular repair. Study group (cohort D) and control group (cohort M) had associated cam deformities treated with femoroplasty with similar decompression endpoints and labral preservation in the form of selective débridement or labral repair (no labral resections in either cohort) with similar rehabilitation protocols.
Our study findings suggest short-term improvement may be followed by midterm worsening in patients with mild dysplasia and sustained improvement in patients with mixed FAI. These findings have practical clinical applications. Jackson and colleagues5 reported on a patient who, after undergoing “successful” arthroscopic surgery for mild dysplasia, clinically deteriorated after 13 months and eventually required PAO. Patients undergoing isolated hip arthroscopy for mild dysplasia with cam FAI should be informed of the possible need for secondary PAO or even hip arthroplasty, be followed up more often and longer than comparable patients with FAI, and have follow-up supplemented with interval radiographs.4 If even subtle subluxation or joint narrowing occurs, we suggest resumption of protected weight-bearing and prompt progression to PAO in younger patients with joint congruency or eventual conversion arthroplasty in older ones.
Although mean preoperative NAHS (52.88) and mean 24-month postoperative NAHS (52.13) suggest essentially no change in PROs for cohort D, all patients with dysplasia either worsened or improved, though those who improved did so at a lesser relative magnitude than those with mixed FAI (cohort M). This finding may help explain the divergent outcomes reported in the literature on dysplasia treated with hip arthroscopy.
Cohort D was older than cohort M, but the difference was not statistically significant. Age may still be a confounding variable, and it may have contributed in part to the poorer outcomes for the patients with dysplasia. However, emerging studies demonstrate select older patients with FAI and/or labral tears may have successful outcomes with arthroscopic intervention.17,18 Our findings support mild dysplasia as the main contributor to the poor outcomes observed in this study.
With identical postoperative rehabilitation protocols, patients in both cohorts typically were ambulating without crutches by the end of postoperative week 2. Delayed weight-bearing has been suggested as contributing to successful outcomes in the setting of dysplasia7,19,20 but has not been shown to adversely affect nondysplastic hips.21 Whether delayed weight-bearing contributed to the poor outcomes in our dysplasia cohort is unknown, but the early successful outcomes may discount its influence.
Our findings support successful outcomes of arthroscopic treatment of mixed FAI (specifically focal pincer plus cam FAI) without capsular repair. Perhaps more important, we found inferior outcomes of arthroscopic treatment of mild dysplasia plus cam FAI without capsular repair—filling the knowledge gap regarding the need for arthroscopic capsular repair for mild dysplasia. Although a recent study demonstrated no significant difference in outcomes between hip arthroscopy with and without capsular repair,22 2 studies specific to mild dysplasia demonstrated successful outcomes of capsular repair.7,9 One found that mild dysplasia treated with arthroscopy, including capsular plication, resulted in 77% good/excellent outcomes and LCEA as low as 18° at minimum 2-year follow-up.7 The other found clinical improvement in mild dysplasia (LCEA, 15°-19°) when capsular repair was performed as part of arthroscopic treatment.9 In the present study, we retrospectively reviewed outcomes from a prospective study performed in 2009 to 2010, before the era of common capsular repair. It appears that capsular repair9 or plication7 in the setting of mild dysplasia may yield improved outcomes approaching those of arthroscopic FAI surgery. Our study results showed that, despite labral preservation and cam decompression, mild dysplasia without the closure of T-capsulotomy had inferior outcomes at 2 years. However, we do not know if outcomes would have been better with capsular repair or plication and/or smaller capsulotomies, perhaps with minimal violation of the iliofemoral ligament in this specific subset of patients. Furthermore, we do not know if optimal outcomes can best be achieved with arthroscopic and/or open surgery, with or without acetabular reorientation, in patients with mild dysplasia and cam FAI.
Dysplasia with cam FAI is an emerging common condition for which patients may seek less invasive treatment in the form of hip arthroscopy. The findings of this study suggest caution in using hip arthroscopy without capsular repair in the treatment of mild dysplasia with cam FAI, even in the presence of cam decompression and labral and acetabular rim preservation.
Study Strengths and Limitations
One strength was the relative lack of surgeon bias. When the surgeries were performed (2009-2010), we recognized cam and pincer FAI but did not discriminate for mild dysplasia, because at that time it was not known to be a potential predictor of poorer outcomes. Another strength was the strict methodology, with blinding of all investigator surgeons to PROs and stringent retention of all PROs, including “failures” (eg, total hip arthroplasty conversions and complications), in both cohorts. Moreover, the crucial case-control analysis matched on multiple variables verified statistically significant results demonstrating poorer outcomes at minimum 2-year follow-up, despite more improvement in the dysplasia cohort at 3 months. The latter, we think, is also valuable new information; it emphasizes the need for close and prolonged follow-up of patients with mild dysplasia despite early improvement.
Limitations include the small number of study patients, the retrospective study design (using prospectively collected data), and the isolated use of LCEA to define dysplasia. Pereira and colleagues23 recommended using LCEA with Tönnis angle to define minor dysplasia. Although dysplasia cannot be precisely defined with only this radiographic measurement, LCEA has been shown to be a reliable, clinically relevant measure.24 In addition, LCEA has been used in most reports on arthroscopic management of dysplastic hips and thus allows for comparison. Furthermore, other studies have used LCEA of <15° as a threshold between mild and severe dysplasia, and we did as well. This broad inclusion criterion allowed for heterogeneity in our mild dysplasia cohort and was a study limitation. Interobserver reliability of measured LCEA was not assessed and is another limitation.
The initial prospective study (2009) did not record α angles to quantify cam FAI. This is a study limitation. However, the surgical range-of-motion endpoints considered sufficient for cam decompression were the same in both cohorts. In addition, femoral version was not assessed in the original database (2009-2010), as this aspect of hip anatomy was not thought significant during initial data collection. These areas of interest merit further investigation.
Use of a focal pincer cohort may be challenged as a suboptimal control group. However, there were very few completely normal acetabulae with pure cam FAI in the original prospective study, and the focal pincer cohort was used as a control cohort in previous studies.25
Conclusion
The common combination of mild dysplasia and cam FAI has poorer outcomes than mixed FAI after arthroscopic surgery without capsular repair.
Am J Orthop. 2017;46(1):E47-E53. Copyright Frontline Medical Communications Inc. 2017. All rights reserved.
1. Paliobeis CP, Villar RN. The prevalence of dysplasia in femoroacetabular impingement. Hip Int. 2011;21(2):141-145.
2. Clohisy JC, Nunley RM, Carlisle JC, Schoenecker PL. Incidence and characteristics of femoral deformities in the dysplastic hip. Clin Orthop Relat Res. 2009;467(1):128-134.
3. Parvizi J, Bican O, Bender B, et al. Arthroscopy for labral tears in patients with developmental dysplasia of the hip: a cautionary note. J Arthroplasty. 2009;24(6 suppl):110-113.
4. Matsuda DK, Khatod M. Rapidly progressive osteoarthritis after arthroscopic labral repair in patients with hip dysplasia. Arthroscopy. 2012;28(11):1738-1743.
5. Jackson TJ, Watson J, LaReau JM, Domb BG. Periacetabular osteotomy and arthroscopic labral repair after failed hip arthroscopy due to iatrogenic aggravation of hip dysplasia. Knee Surg Sports Traumatol Arthrosc. 2014;22(4):911-914.
6. Byrd JW, Jones KS. Hip arthroscopy in the presence of dysplasia. Arthroscopy. 2003;19(10):1055-1060.
7. Domb BG, Stake CE, Lindner D, El-Bitar Y, Jackson TJ. Arthroscopic capsular plication and labral preservation in borderline hip dysplasia: two-year clinical outcomes of a surgical approach to a challenging problem. Am J Sports Med. 2013;41(11):2591-2598.
8. Jayasekera N, Aprato A, Villar RN. Hip arthroscopy in the presence of acetabular dysplasia. Open Orthop J. 2015;9:185-187.
9. Fukui K, Briggs KK, Trindade CA, Philippon MJ. Outcomes after labral repair in patients with femoroacetabular impingement and borderline dysplasia. Arthroscopy. 2015;31(12):2371-2379.
10. Siebenrock KA, Leunig M, Ganz R. Periacetabular osteotomy: the Bernese experience. Instr Course Lect. 2001;50:239-245.
11. Garras DN, Crowder TT, Olson SA. Medium-term results of the Bernese periacetabular osteotomy in the treatment of symptomatic developmental dysplasia of the hip. J Bone Joint Surg Br. 2007;89(6):721-724.
12. Biedermann R, Donnan L, Gabriel A, Wachter R, Krismer M, Behensky H. Complications and patient satisfaction after periacetabular pelvic osteotomy. Int Orthop. 2008;32(5):611-617.
13. Ross JR, Zaltz I, Nepple JJ, Schoenecker PL, Clohisy JC. Arthroscopic disease classification and interventions as an adjunct in the treatment of acetabular dysplasia. Am J Sports Med. 2011;39(suppl):72S-78S.
14. Domb BG, LaReau JM, Baydoun H, Botser I, Millis MB, Yen YM. Is intraarticular pathology common in patients with hip dysplasia undergoing periacetabular osteotomy? Clin Orthop Relat Res. 2014;472(2):674-680.
15. Kain MS, Novais EN, Vallim C, Millis MB, Kim YJ. Periacetabular osteotomy after failed hip arthroscopy for labral tears in patients with acetabular dysplasia. J Bone Joint Surg Am. 2011;93(suppl 2):57-61.
16. Matsuda DK, Villamor A. The modified mid-anterior portal for hip arthroscopy. Arthrosc Tech. 2014;3(4):e469-e474.
17. Javed A, O’Donnell JM. Arthroscopic femoral osteochondroplasty for cam femoroacetabular impingement in patients over 60 years of age. J Bone Joint Surg Br. 2011;93(3):326-331.
18. Redmond JM, Gupta A, Cregar WM, Hammarstedt JE, Gui C, Domb BG. Arthroscopic treatment of labral tears in patients aged 60 years or older. Arthroscopy. 2015;31(10):1921-1927.
19. Mei-Dan O, McConkey MO, Brick M. Catastrophic failure of hip arthroscopy due to iatrogenic instability: can partial division of the ligamentum teres and iliofemoral ligament cause subluxation? Arthroscopy. 2012;28(3):440-445.
20. Benali Y, Katthagen BD. Hip subluxation as a complication of arthroscopic debridement. Arthroscopy. 2009;25(4):405-407.
21. Jayasekera N, Aprato A, Villar RN. Are crutches required after hip arthroscopy? A case–control study. Hip Int. 2013;23(3):269-273.
22. Domb BG, Stake CE, Finley ZJ, Chen T, Giordano BD. Influence of capsular repair versus unrepaired capsulotomy on 2-year clinical outcomes after arthroscopic hip preservation surgery. Arthroscopy. 2015;31(4):643-650.
23. Pereira F, Giles A, Wood G, Board TN. Recognition of minor adult hip dysplasia: which anatomical indices are important? Hip Int. 2014;24(2):175-179.
24. Murphy SB, Ganz R, Müller ME. The prognosis in untreated dysplasia of the hip. A study of radiographic factors that predict the outcome. J Bone Joint Surg Am. 1995;77(7):985-989.
25. Matsuda DK, Gupta N, Burchette R, Sehgal B. Arthroscopic surgery for global versus focal pincer femoroacetabular impingement: are the outcomes different? J Hip Preserv Surg. 2015;2(1):42-50.
Take-Home Points
- Cam deformity often occurs with dysplasia.
- Borderline or mild dysplasia has been treated with isolated hip arthroscopy.
- Avoid rim trimming that can make mild dysplasia more severe.
- Labral preservation, cam decompression, and capsular repair or plication are currently suggested.
- Poorer outcomes occurred in borderline or mild dysplasia with cam impingement relative to controls following hip arthroscopy without capsular repair.
- Initial clinical improvement may be followed by clinical deterioration suggesting close long-term follow-up with prompt addition of reorientation acetabular osteotomy if indicated.
- It is unknown whether small capsulotomies may yield comparable outcomes with larger capsulotomies plus repair.
It is unknown whether small capsulotomies may yield comparable outcomes with larger capsulotomies plus repair. There is growing interest in hip preservation surgery in general and arthroscopic hip preservation in particular. Chondrolabral pathology leading to symptoms and degenerative progression typically is caused by structural abnormalities, mainly femoroacetabular impingement (FAI) and developmental dysplasia of the hip. Unlike the bony overcoverage of pincer FAI, developmental dysplasia of the hip typically exhibits insufficient anterolateral coverage of the femoral head.
The role of hip arthroscopy in the treatment of dysplasia remains undefined. Emerging evidence shows a high incidence of dysplasia with associated cam deformity,1,2 but there is a paucity of evidence-based information for this specific patient population. Clinical outcomes of hip arthroscopy in the setting of dysplasia are conflicting: some poor3-5 and others successful.1,6-9 Although reorientation periacetabular osteotomy (PAO) is considered a mainstay in the treatment of dysplasia—providing improvement in symptoms, deficient anterolateral acetabular coverage, and hip biomechanics—midterm failure rates approaching 24% have been reported.10-12 Many young patients with symptomatic dysplasia want a surgical option that is less invasive than open PAO.4 Intra-articular central compartment pathology and cam FAI commonly occur with dysplasia and are amenable to arthroscopic treatment.1,13,14 Moreover, staged PAO may be successful in cases in which arthroscopic intervention fails to provide clinical improvement.5,15
Emerging evidence suggests beneficial effects of arthroscopic capsular repair or plication in the setting of borderline or mild dysplasia.7,9 However, the literature provides little information on arthroscopic outcomes without capsular repair. One study found poor outcomes of arthroscopic surgery for dysplasia, but its patients underwent labral débridement, not repair.3 Two patients in a case report demonstrated rapidly progressive osteoarthritis after arthroscopic labral repairs and concurrent femoroplasties for cam FAI, but each had marked dysplasia with a lateral center-edge angle (LCEA) of <15°.4
Arthroscopy with capsular repair has been assumed to provide better outcomes than arthroscopy without repair, but to our knowledge there are no studies that have compared outcomes of mild dysplasia with cam FAI and outcomes of mixed FAI treated without capsular repair. Clinical equipoise makes it ethically challenging to perform a prospective study comparing dysplasia treated with and without capsular repair. We conducted a study to compare outcomes of mild dysplasia with cam FAI and outcomes of mixed FAI treated with arthroscopic surgery and to fill the knowledge gap regarding outcomes of mild dysplasia treated without capsular repair.
Methods
In this study, which received Institutional Review Board approval, we retrospectively reviewed radiographs and data from a prospective 3-center study of arthroscopic outcomes of FAI in 150 patients (159 hips) who underwent arthroscopic surgery by 1 of 3 surgeons between March 2009 and June 2010. In all cases, digital images of anteroposterior pelvic radiographs were used for radiographic measurements. On these images, the LCEA is formed by the intersection of the vertical line (corrected for obliquity using a horizontal reference line connecting the inferior extents of both radiographic teardrops) through the center of the femoral head (determined with a digital centering tool) with the line extending to the lateral edge of the sourcil (radiographic eyebrow of the weight-bearing region or roof of the acetabulum). Measurements were made in blinded fashion (by a nonsurgeon coauthor, Dr. Nikhil Gupta, who completed training modules) and were confirmed without alteration by the principal investigator Dr. Dean K. Matsuda. Inclusion criteria were mild acetabular dysplasia (LCEA, 15°-24°) and mixed FAI including focal pincer component (LCEA, 25°-39°), radiographic crossover sign, and successful completion of patient-reported outcome (PRO) measures at minimum 2-year follow-up. Exclusion criteria were severe dysplasia (LCEA, <15°), hip subluxation, broken Shenton line, global pincer FAI (LCEA, ≥40°), Tönnis grade 3 osteoarthritis, Legg-Calvé-Perthes disease, osteonecrosis, prior hip surgery, and unsuccessful completion of PRO measures. Outcome measures included investigator-blinded preoperative and postoperative Nonarthritic Hip Score (NAHS) and 5-point Likert satisfaction score. Complications, revision surgeries, and conversion arthroplasties were recorded.
Statistical Analysis
We examined outcomes with descriptive statistics for each of the candidate covariates in the model classified by femoroacetabular subtype: focal pincer and cam (mixed FAI) and dysplasia with cam. We examined the variables of sex, age, weight, height, body mass index, preoperative NAHS, presence of dysplasia (yes/no), presence of osteoarthritis (yes/no), Tönnis osteoarthritis grade, Outerbridge class, American Society of Anesthesiologists (ASA) score, months of pain, bilateral procedure (yes/no), and pincer involvement with cam FAI (yes/no). Before beginning linear regression modeling, we screened the candidate variables for strong correlations with other variables and looked for those variables with minimal missing data. For all these covariates, we then performed linear regression with a selection process—both a stepwise selection method and a backward elimination method—to verify we determined the same model for 24-month NAHS, or to understand why we could not. Finally, we ran the model we found from the linear regression as a linear mixed model of 24-month NAHS with the dichotomous variables taken as fixed effects and the other variables taken as random effects, using variance-components representation for the random effects. We then examined 3-month and 12-month NAHS with the same variables selected for the 24-month model.
To further examine and verify the effects of dysplasia on outcomes found in our linear mixed model, we performed a nested case–control analysis matching each member of cohort D (cases) with 2 members of cohort M (controls). We used an optimal-matching algorithm to match focal patients in the linear regression dataset with dysplasia patients in the linear regression dataset in such a way as to minimize the overall differences between the datasets. We matched cases and controls on preoperative NAHS, age, sex, presence of osteoarthritis, months of pain, ASA score, and body mass index. The differences between the matched cases and controls (control value minus case value) were compared using Wilcoxon rank sum tests for statistical significance of differences from 0 (with differences generated for each control group member, 2 differences per case) to examine the quality of the match. Finally, we examined the statistical significance of the difference of the outcome variables (3-, 12-, and 24-month NAHS) from 0, again using Wilcoxon rank sum tests. Statistical significance was set at P < .05 using SAS Version 9.3 (SAS Institute).
Surgical Procedure
In all cases, supine outpatient hip arthroscopy was performed under general anesthesia. Anterolateral and modified midanterior portals16 were used. T-capsulotomies were performed in both cohorts. Cohort M underwent anterosuperior acetabuloplasty with a motorized burr. Labral refixation or selective débridement was performed in cohort M, whereas labral repair (with limited freshening of acetabular rim attachment site) or selective débridement (but no segmental resection) was performed in cohort D. Arthroscopic femoroplasty was performed with similar endpoints of 120° minimum hip flexion and 30° minimum flexed hip internal rotation with retention of the labral fluid seal. Capsular repair or plication was not performed for either cohort during the study period.
The cohorts underwent similar postoperative protocols: 2 weeks of protected ambulation using 2 crutches, exercise cycling without resistance beginning postoperative day 1, swimming at 2 weeks, elliptical machine workouts at 6 weeks, jogging at 12 weeks, and return to unrestricted athletics at 5 months.
Results
In cohort D, which consisted of 8 patients (5 female), mean age was 49.6 years, and mean LCEA was 19° (range, 16°-24°).
In cohort D, mean (SD) change in NAHS was +20.00 (6.24) (P = .25) at 3 months (n = 3), +14.33 (9.77) (P = .03) at 12 months (n = 6), and –0.75 (19.86) (P = .74) at 24 months (n = 8).
In cohort M, mean (SD) change in NAHS was +12.09 (18.98) (P < .0001) at 3 months (n = 45), +20.39 (16.49) (P < .0001) at 12 months (n = 57), and +21.99 (17.32) (P < .0001) at 24 months (n = 69).
In a pairwise case–control comparison, the mean (SD) change-from-baseline difference between cohorts D and M was +8.2 (12.85) (P = .31) at 3 months (n = 5), –8.7 (11.52) (P = .03) at 12 months (n = 10), and –31.06 (23.55) (P = .0002) at 24 months (n = 16). Dysplasia had an impact of –23.4 points on 24-month NAHS (standard error = 5.35 points; P < .0001), which corresponds to a 95% confidence interval of –12.9 to –33.9 points on NAHS.
Compared with cohort M, cohort D had significantly less NAHS improvement (P = .002), less satisfaction (P = .15) and more hip arthroplasty conversions (P = .22, not statistically significant).
There were no statistically significant differences between cohorts in demographics, preoperative variables, intraoperative findings, or surgical procedures in the regression analysis. Of the investigated variables, only group membership (cohort D) was a statistically significant predictor of poorer outcomes in the model of change from preoperative to 24 months. However, older age was associated with cohort D (older patients with dysplasia, P = .07), and therefore in the nested case–control analysis we were able to match on all variables except age (8.74 years older in cohort D, P = .0013) to a level of statistical nonsignificance.
Discussion
The principal finding of this study is the significantly poorer outcomes of mild dysplasia and cam FAI relative to mixed FAI after hip arthroscopy without capsular repair. Study group (cohort D) and control group (cohort M) had associated cam deformities treated with femoroplasty with similar decompression endpoints and labral preservation in the form of selective débridement or labral repair (no labral resections in either cohort) with similar rehabilitation protocols.
Our study findings suggest short-term improvement may be followed by midterm worsening in patients with mild dysplasia and sustained improvement in patients with mixed FAI. These findings have practical clinical applications. Jackson and colleagues5 reported on a patient who, after undergoing “successful” arthroscopic surgery for mild dysplasia, clinically deteriorated after 13 months and eventually required PAO. Patients undergoing isolated hip arthroscopy for mild dysplasia with cam FAI should be informed of the possible need for secondary PAO or even hip arthroplasty, be followed up more often and longer than comparable patients with FAI, and have follow-up supplemented with interval radiographs.4 If even subtle subluxation or joint narrowing occurs, we suggest resumption of protected weight-bearing and prompt progression to PAO in younger patients with joint congruency or eventual conversion arthroplasty in older ones.
Although mean preoperative NAHS (52.88) and mean 24-month postoperative NAHS (52.13) suggest essentially no change in PROs for cohort D, all patients with dysplasia either worsened or improved, though those who improved did so at a lesser relative magnitude than those with mixed FAI (cohort M). This finding may help explain the divergent outcomes reported in the literature on dysplasia treated with hip arthroscopy.
Cohort D was older than cohort M, but the difference was not statistically significant. Age may still be a confounding variable, and it may have contributed in part to the poorer outcomes for the patients with dysplasia. However, emerging studies demonstrate select older patients with FAI and/or labral tears may have successful outcomes with arthroscopic intervention.17,18 Our findings support mild dysplasia as the main contributor to the poor outcomes observed in this study.
With identical postoperative rehabilitation protocols, patients in both cohorts typically were ambulating without crutches by the end of postoperative week 2. Delayed weight-bearing has been suggested as contributing to successful outcomes in the setting of dysplasia7,19,20 but has not been shown to adversely affect nondysplastic hips.21 Whether delayed weight-bearing contributed to the poor outcomes in our dysplasia cohort is unknown, but the early successful outcomes may discount its influence.
Our findings support successful outcomes of arthroscopic treatment of mixed FAI (specifically focal pincer plus cam FAI) without capsular repair. Perhaps more important, we found inferior outcomes of arthroscopic treatment of mild dysplasia plus cam FAI without capsular repair—filling the knowledge gap regarding the need for arthroscopic capsular repair for mild dysplasia. Although a recent study demonstrated no significant difference in outcomes between hip arthroscopy with and without capsular repair,22 2 studies specific to mild dysplasia demonstrated successful outcomes of capsular repair.7,9 One found that mild dysplasia treated with arthroscopy, including capsular plication, resulted in 77% good/excellent outcomes and LCEA as low as 18° at minimum 2-year follow-up.7 The other found clinical improvement in mild dysplasia (LCEA, 15°-19°) when capsular repair was performed as part of arthroscopic treatment.9 In the present study, we retrospectively reviewed outcomes from a prospective study performed in 2009 to 2010, before the era of common capsular repair. It appears that capsular repair9 or plication7 in the setting of mild dysplasia may yield improved outcomes approaching those of arthroscopic FAI surgery. Our study results showed that, despite labral preservation and cam decompression, mild dysplasia without the closure of T-capsulotomy had inferior outcomes at 2 years. However, we do not know if outcomes would have been better with capsular repair or plication and/or smaller capsulotomies, perhaps with minimal violation of the iliofemoral ligament in this specific subset of patients. Furthermore, we do not know if optimal outcomes can best be achieved with arthroscopic and/or open surgery, with or without acetabular reorientation, in patients with mild dysplasia and cam FAI.
Dysplasia with cam FAI is an emerging common condition for which patients may seek less invasive treatment in the form of hip arthroscopy. The findings of this study suggest caution in using hip arthroscopy without capsular repair in the treatment of mild dysplasia with cam FAI, even in the presence of cam decompression and labral and acetabular rim preservation.
Study Strengths and Limitations
One strength was the relative lack of surgeon bias. When the surgeries were performed (2009-2010), we recognized cam and pincer FAI but did not discriminate for mild dysplasia, because at that time it was not known to be a potential predictor of poorer outcomes. Another strength was the strict methodology, with blinding of all investigator surgeons to PROs and stringent retention of all PROs, including “failures” (eg, total hip arthroplasty conversions and complications), in both cohorts. Moreover, the crucial case-control analysis matched on multiple variables verified statistically significant results demonstrating poorer outcomes at minimum 2-year follow-up, despite more improvement in the dysplasia cohort at 3 months. The latter, we think, is also valuable new information; it emphasizes the need for close and prolonged follow-up of patients with mild dysplasia despite early improvement.
Limitations include the small number of study patients, the retrospective study design (using prospectively collected data), and the isolated use of LCEA to define dysplasia. Pereira and colleagues23 recommended using LCEA with Tönnis angle to define minor dysplasia. Although dysplasia cannot be precisely defined with only this radiographic measurement, LCEA has been shown to be a reliable, clinically relevant measure.24 In addition, LCEA has been used in most reports on arthroscopic management of dysplastic hips and thus allows for comparison. Furthermore, other studies have used LCEA of <15° as a threshold between mild and severe dysplasia, and we did as well. This broad inclusion criterion allowed for heterogeneity in our mild dysplasia cohort and was a study limitation. Interobserver reliability of measured LCEA was not assessed and is another limitation.
The initial prospective study (2009) did not record α angles to quantify cam FAI. This is a study limitation. However, the surgical range-of-motion endpoints considered sufficient for cam decompression were the same in both cohorts. In addition, femoral version was not assessed in the original database (2009-2010), as this aspect of hip anatomy was not thought significant during initial data collection. These areas of interest merit further investigation.
Use of a focal pincer cohort may be challenged as a suboptimal control group. However, there were very few completely normal acetabulae with pure cam FAI in the original prospective study, and the focal pincer cohort was used as a control cohort in previous studies.25
Conclusion
The common combination of mild dysplasia and cam FAI has poorer outcomes than mixed FAI after arthroscopic surgery without capsular repair.
Am J Orthop. 2017;46(1):E47-E53. Copyright Frontline Medical Communications Inc. 2017. All rights reserved.
1. Paliobeis CP, Villar RN. The prevalence of dysplasia in femoroacetabular impingement. Hip Int. 2011;21(2):141-145.
2. Clohisy JC, Nunley RM, Carlisle JC, Schoenecker PL. Incidence and characteristics of femoral deformities in the dysplastic hip. Clin Orthop Relat Res. 2009;467(1):128-134.
3. Parvizi J, Bican O, Bender B, et al. Arthroscopy for labral tears in patients with developmental dysplasia of the hip: a cautionary note. J Arthroplasty. 2009;24(6 suppl):110-113.
4. Matsuda DK, Khatod M. Rapidly progressive osteoarthritis after arthroscopic labral repair in patients with hip dysplasia. Arthroscopy. 2012;28(11):1738-1743.
5. Jackson TJ, Watson J, LaReau JM, Domb BG. Periacetabular osteotomy and arthroscopic labral repair after failed hip arthroscopy due to iatrogenic aggravation of hip dysplasia. Knee Surg Sports Traumatol Arthrosc. 2014;22(4):911-914.
6. Byrd JW, Jones KS. Hip arthroscopy in the presence of dysplasia. Arthroscopy. 2003;19(10):1055-1060.
7. Domb BG, Stake CE, Lindner D, El-Bitar Y, Jackson TJ. Arthroscopic capsular plication and labral preservation in borderline hip dysplasia: two-year clinical outcomes of a surgical approach to a challenging problem. Am J Sports Med. 2013;41(11):2591-2598.
8. Jayasekera N, Aprato A, Villar RN. Hip arthroscopy in the presence of acetabular dysplasia. Open Orthop J. 2015;9:185-187.
9. Fukui K, Briggs KK, Trindade CA, Philippon MJ. Outcomes after labral repair in patients with femoroacetabular impingement and borderline dysplasia. Arthroscopy. 2015;31(12):2371-2379.
10. Siebenrock KA, Leunig M, Ganz R. Periacetabular osteotomy: the Bernese experience. Instr Course Lect. 2001;50:239-245.
11. Garras DN, Crowder TT, Olson SA. Medium-term results of the Bernese periacetabular osteotomy in the treatment of symptomatic developmental dysplasia of the hip. J Bone Joint Surg Br. 2007;89(6):721-724.
12. Biedermann R, Donnan L, Gabriel A, Wachter R, Krismer M, Behensky H. Complications and patient satisfaction after periacetabular pelvic osteotomy. Int Orthop. 2008;32(5):611-617.
13. Ross JR, Zaltz I, Nepple JJ, Schoenecker PL, Clohisy JC. Arthroscopic disease classification and interventions as an adjunct in the treatment of acetabular dysplasia. Am J Sports Med. 2011;39(suppl):72S-78S.
14. Domb BG, LaReau JM, Baydoun H, Botser I, Millis MB, Yen YM. Is intraarticular pathology common in patients with hip dysplasia undergoing periacetabular osteotomy? Clin Orthop Relat Res. 2014;472(2):674-680.
15. Kain MS, Novais EN, Vallim C, Millis MB, Kim YJ. Periacetabular osteotomy after failed hip arthroscopy for labral tears in patients with acetabular dysplasia. J Bone Joint Surg Am. 2011;93(suppl 2):57-61.
16. Matsuda DK, Villamor A. The modified mid-anterior portal for hip arthroscopy. Arthrosc Tech. 2014;3(4):e469-e474.
17. Javed A, O’Donnell JM. Arthroscopic femoral osteochondroplasty for cam femoroacetabular impingement in patients over 60 years of age. J Bone Joint Surg Br. 2011;93(3):326-331.
18. Redmond JM, Gupta A, Cregar WM, Hammarstedt JE, Gui C, Domb BG. Arthroscopic treatment of labral tears in patients aged 60 years or older. Arthroscopy. 2015;31(10):1921-1927.
19. Mei-Dan O, McConkey MO, Brick M. Catastrophic failure of hip arthroscopy due to iatrogenic instability: can partial division of the ligamentum teres and iliofemoral ligament cause subluxation? Arthroscopy. 2012;28(3):440-445.
20. Benali Y, Katthagen BD. Hip subluxation as a complication of arthroscopic debridement. Arthroscopy. 2009;25(4):405-407.
21. Jayasekera N, Aprato A, Villar RN. Are crutches required after hip arthroscopy? A case–control study. Hip Int. 2013;23(3):269-273.
22. Domb BG, Stake CE, Finley ZJ, Chen T, Giordano BD. Influence of capsular repair versus unrepaired capsulotomy on 2-year clinical outcomes after arthroscopic hip preservation surgery. Arthroscopy. 2015;31(4):643-650.
23. Pereira F, Giles A, Wood G, Board TN. Recognition of minor adult hip dysplasia: which anatomical indices are important? Hip Int. 2014;24(2):175-179.
24. Murphy SB, Ganz R, Müller ME. The prognosis in untreated dysplasia of the hip. A study of radiographic factors that predict the outcome. J Bone Joint Surg Am. 1995;77(7):985-989.
25. Matsuda DK, Gupta N, Burchette R, Sehgal B. Arthroscopic surgery for global versus focal pincer femoroacetabular impingement: are the outcomes different? J Hip Preserv Surg. 2015;2(1):42-50.
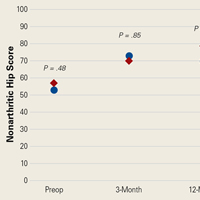
Postpartum Recovery Trends in Women with Hypertensive Disorders of Pregnancy
From the Department of Obstetrics and Gynecology, Kasturba Medical College, Manipal, Karnataka, India.
Abstracts
- Objective: To examine the association of the patient’s obstetric profile and time to normalization of blood pressure in the postnatal period among women with hypertensive disorders in pregnancy.
- Methods: We conducted a prospective cohort study at a tertiary level hospital between November 2014 and May 2015. Women with pregnancy hypertension who required antihypertensive treatment were recruited after delivery. The normalization trends in blood pressure were tested for associations with patient demographic data and details of pregnancy hypertension.
- Results: Among 109 women included in the study, earlier gestational age at onset of hypertension and earlier gestational age at delivery was correlated with slower resolution of hypertension. Time to resolution also was correlated with age, BMI, severity of hypertension, associated complications, and the number of antihypertensive medications received. There was no correlation with highest recorded systolic or diastolic blood pressures. Only 15% of women with gestational hypertension had persistent hypertension beyond 6 weeks. In the groups with nonsevere preeclampsia, severe preeclampsia, and eclampsia, blood pressure remained high after 6 weeks in 26%, 14%, and 50% of women, respectively.
- Conclusion: Women with advanced age, higher body mass index, early gestational age at the onset of hypertension, severe hypertension and who had complications of hypertension require prolonged monitoring and treatment when indicated for hypertension in postnatal period.
Key words: intensive care unit; communication; family meeting; critical illness; decision making; end of life care.
Hypertension is the most common medical problem encountered during pregnancy, complicating up to 10% of pregnancies worldwide [1]. The disorders of hypertension in pregnancy are generally classified as chronic hypertension, preeclampsia–eclampsia, preeclampsia superimposed on chronic hypertension, and gestational hypertension. The hypertensive disorders of pregnancy are a leading cause of mortality and morbidity in the perinatal period.
Women with hypertensive disorders in pregnancy show varying trends of blood pressure normalization, with the recovery period ranging from a few hours to several months after delivery. In one study, nearly one-fourth of women with preeclampsia/eclampsia had persistent high blood pressure after puerperium [2]. Identifying the obstetric risk factors for persistent hypertension will help in focusing care and research in this group of patients.
We undertook a prospective study to assess possible correlations of obstetric profile with time to normalization of blood pressure in the postnatal period among women with hypertensive disorders in pregnancy.
Methods
Setting
This prospective cohort study was conducted in the department of obstetrics and gynecology at Kasturba Hospital, Manipal, between November 2014 and May 2015. Permission for the study was obtained from the Institution Ethical Committee (IEC264/2015).
Patients
Women who had hypertension in pregnancy and required antihypertensive treatment were approached on the first postnatal day and invited to participate in the study. Women with chronic hypertension (women with known pre-pregnancy hypertension and with hypertension diagnosed before 20 weeks gestation) or secondary hypertension were excluded. After granting informed consent, enrolled women were followed until the time they no longer required antihypertensive medication (“reversion of hypertension”) or until 10 weeks postpartum, whichever came first.
During the hospital stay in the postnatal period, women had their blood pressure monitored and antihypertensives were adjusted as needed. After discharge from the hospital, blood pressure was monitored by the family physician who also made decisions regarding antihypertensive management. All women had a follow-up visit in the hospital in the 6th postnatal week as per the postnatal clinic protocol.
Definitions
Hypertension was defined as BP ≥ 140/90 mm Hg. The hypertension disorders of pregnancy were defined as follows:
- Gestational hypertension: hypertension after 20 weeks gestation on two occasions 4 hours apart without meeting criteria for preeclampsia.
- Preeclampsia: hypertension after 20 weeks gestation on two occasions 4 hours apart with proteinuria (≥ 300 mg/24 hour) or, in the absence of proteinuria, new onset of any of the following: thrombocytopenia, renal insufficiency, impaired liver function, pulmonary edema, or cerebral or visual symptoms [1]. Severe preeclampsia was defined as preeclampsia with any of the following: systolic blood pressure > 160 mm Hg diastolic BP > 110 mm Hg or more on 2 occasions 4 hours apart, thrombocytopenia (platelet count < 100,00/mL), renal insufficiency, impaired liver function, pulmonary edema, or cerebral or visual symptoms. Preeclampsia without any of these features was considered nonsevere preeclampsia.
- Eclampsia: Women with hypertension with epigastric pain, headache, vomiting, and blurring of vision were diagnosed with imminent eclampsia and those with hypertension-related convulsions were diagnosed with eclampsia.
- Complications of preeclampsia included eclampsia, placental abruption, pulmonary edema, thrombocytopenia, HELLP syndrome, disseminated intravascular coagulation, multiorgan failure, severe intrauterine growth restriction, and fetal demise.
Main Outcome Measure
Time to reversion of hypertension was the main outcome measure. We defined the reversion date as the day that hypertension medications were stopped. This information was obtained via in-person questioning on the 2nd postpartum day and at the 6-week postnatal visit and via telephonic survey on the 10th postnatal day and at 10 weeks postdelivery. Women who missed the 6-week postnatal visit were also followed up by telephone.
Data Collection
Demographic details (age, parity, BMI) as well as information regarding gestational age at onset of hypertension, severity, highest systolic and diastolic blood pressure recordings, treatment received, complications related to hypertension, pregnancy termination and delivery was obtained from the medical charts and/or via telephonic follow-up.
Analysis
We used Pearson’s chi-square test to assess the association between recovery trends in blood pressure and the patient’s demographic profile and details of pregnancy hypertension. Statistical analysis was done using SPSS16.
Results
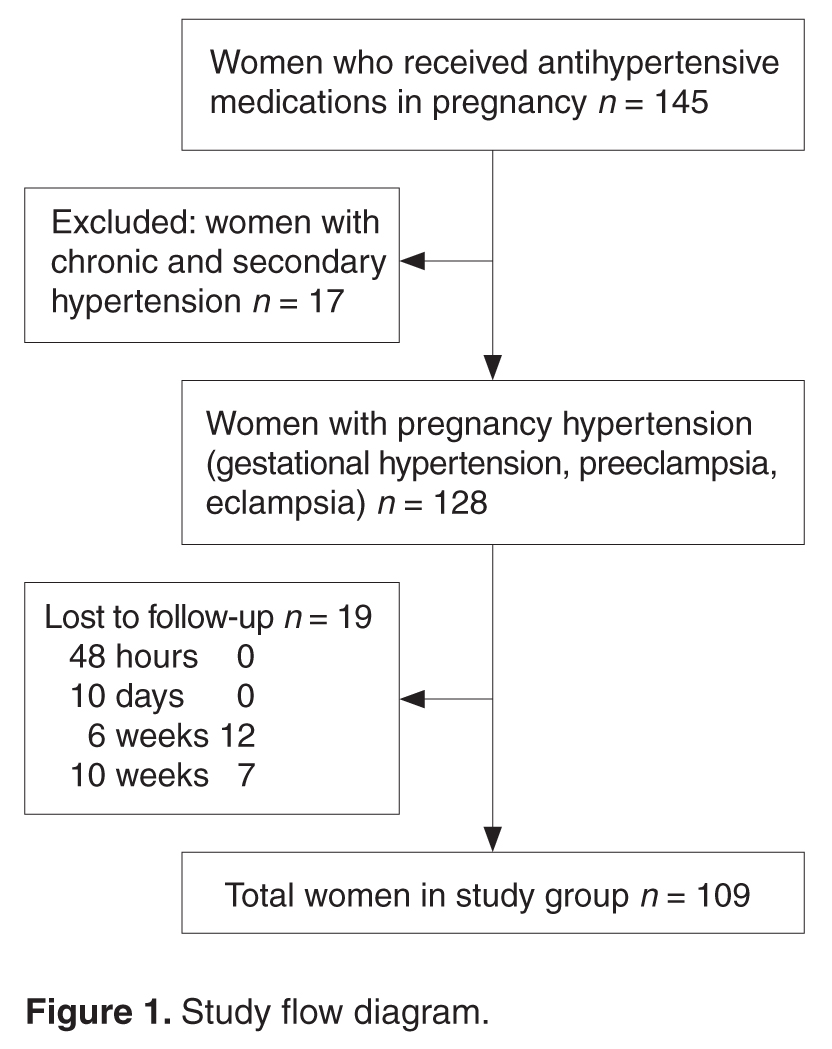
In our study, earlier the gestational age at onset of hypertension and earlier gestation at delivery was associated with slower recovery from hypertension (Table 2). Time taken for recovery also was associated with age, BMI, severity of hypertension, associated complications, and the number of antihypertensive medications received (Table 2). Among women who received more than 3 antiphypertensives in pregnancy, nearly 50% continued to have hypertension beyond 6 weeks (Table 2). 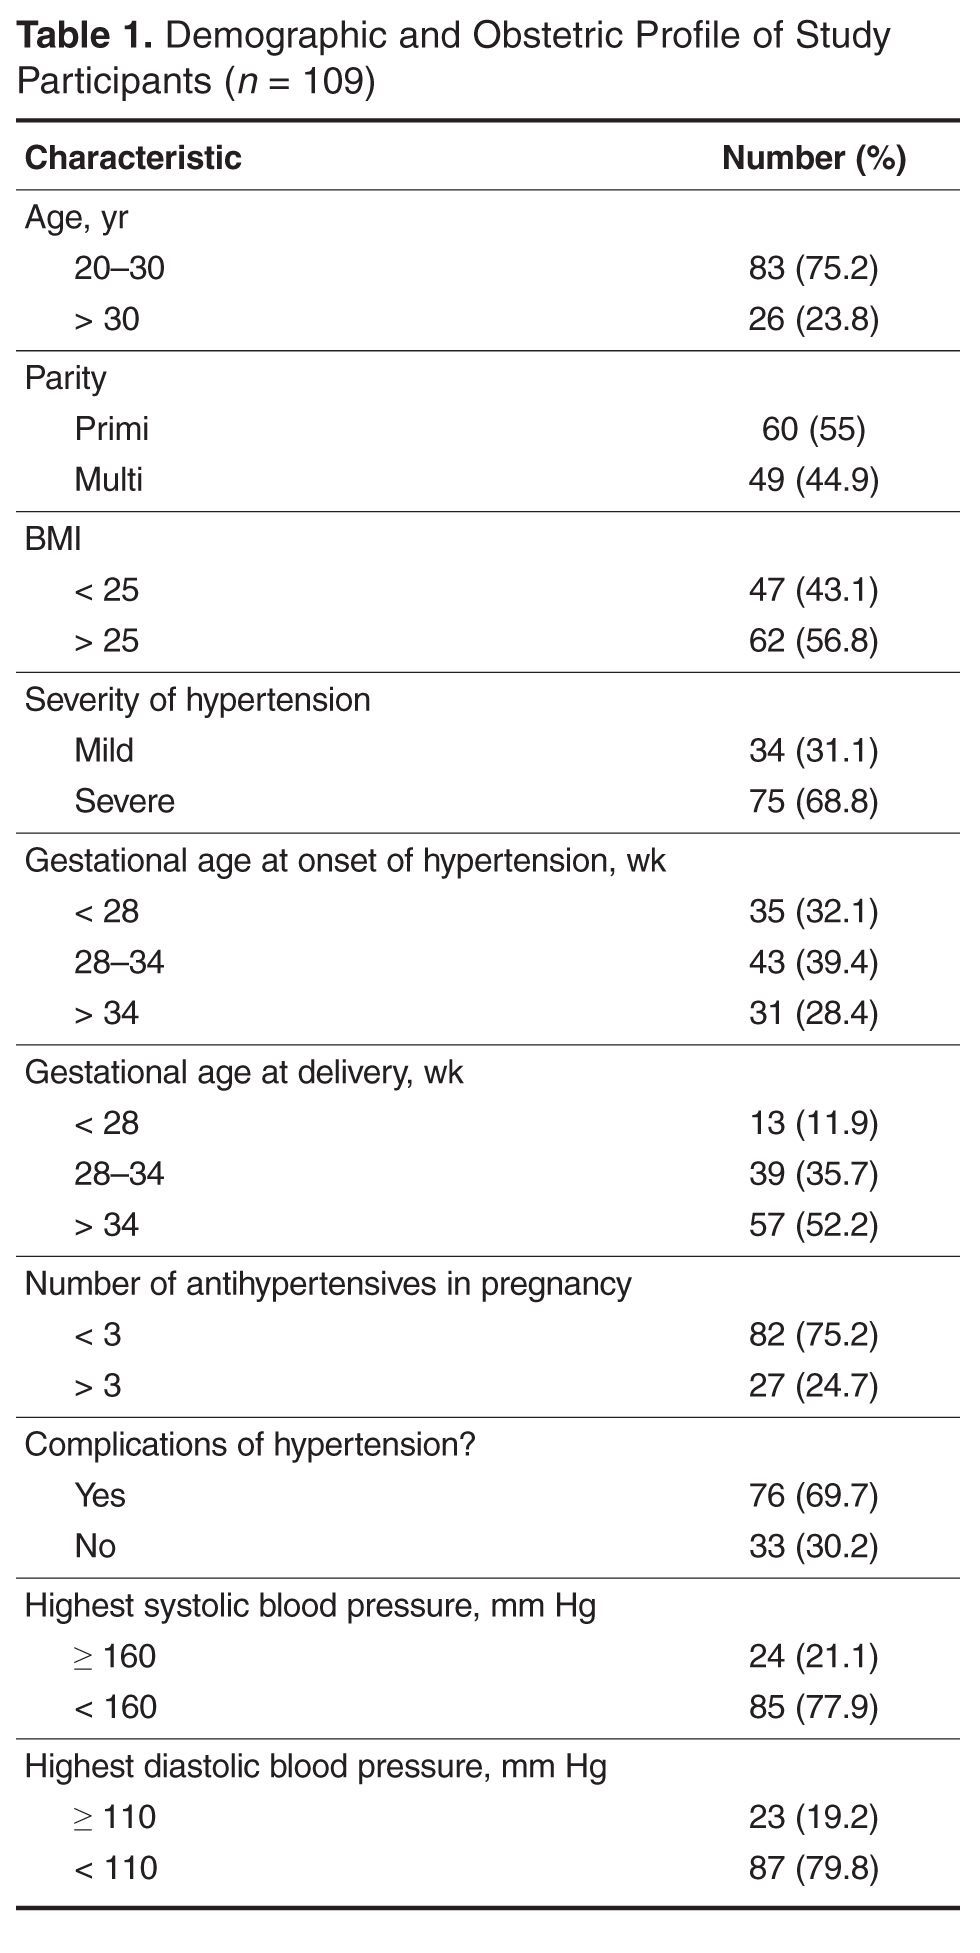
On testing for strength of correlation, it was found that body mass index and time to blood pressure normalization had a strong positive correlation (r = 0.8). The remaining parameters (ie, gestational age at onset, gestational age at delivery, severity and complications of hypertension and number of antihypertensive medications) and time to recovery were weakly correlated (r = 0.3 to 0.5 [+/–]).
Women with gestational hypertension and mild preeclampsia had faster normalization of blood pressure compared to those with severe preeclampsia and eclampsia (Figure 2). Only 15% of women with gestational hypertension had persistent hypertension beyond 6 weeks, whereas in the groups with nonsevere preeclampsia, severe preeclampsia, and eclampsia, blood pressure 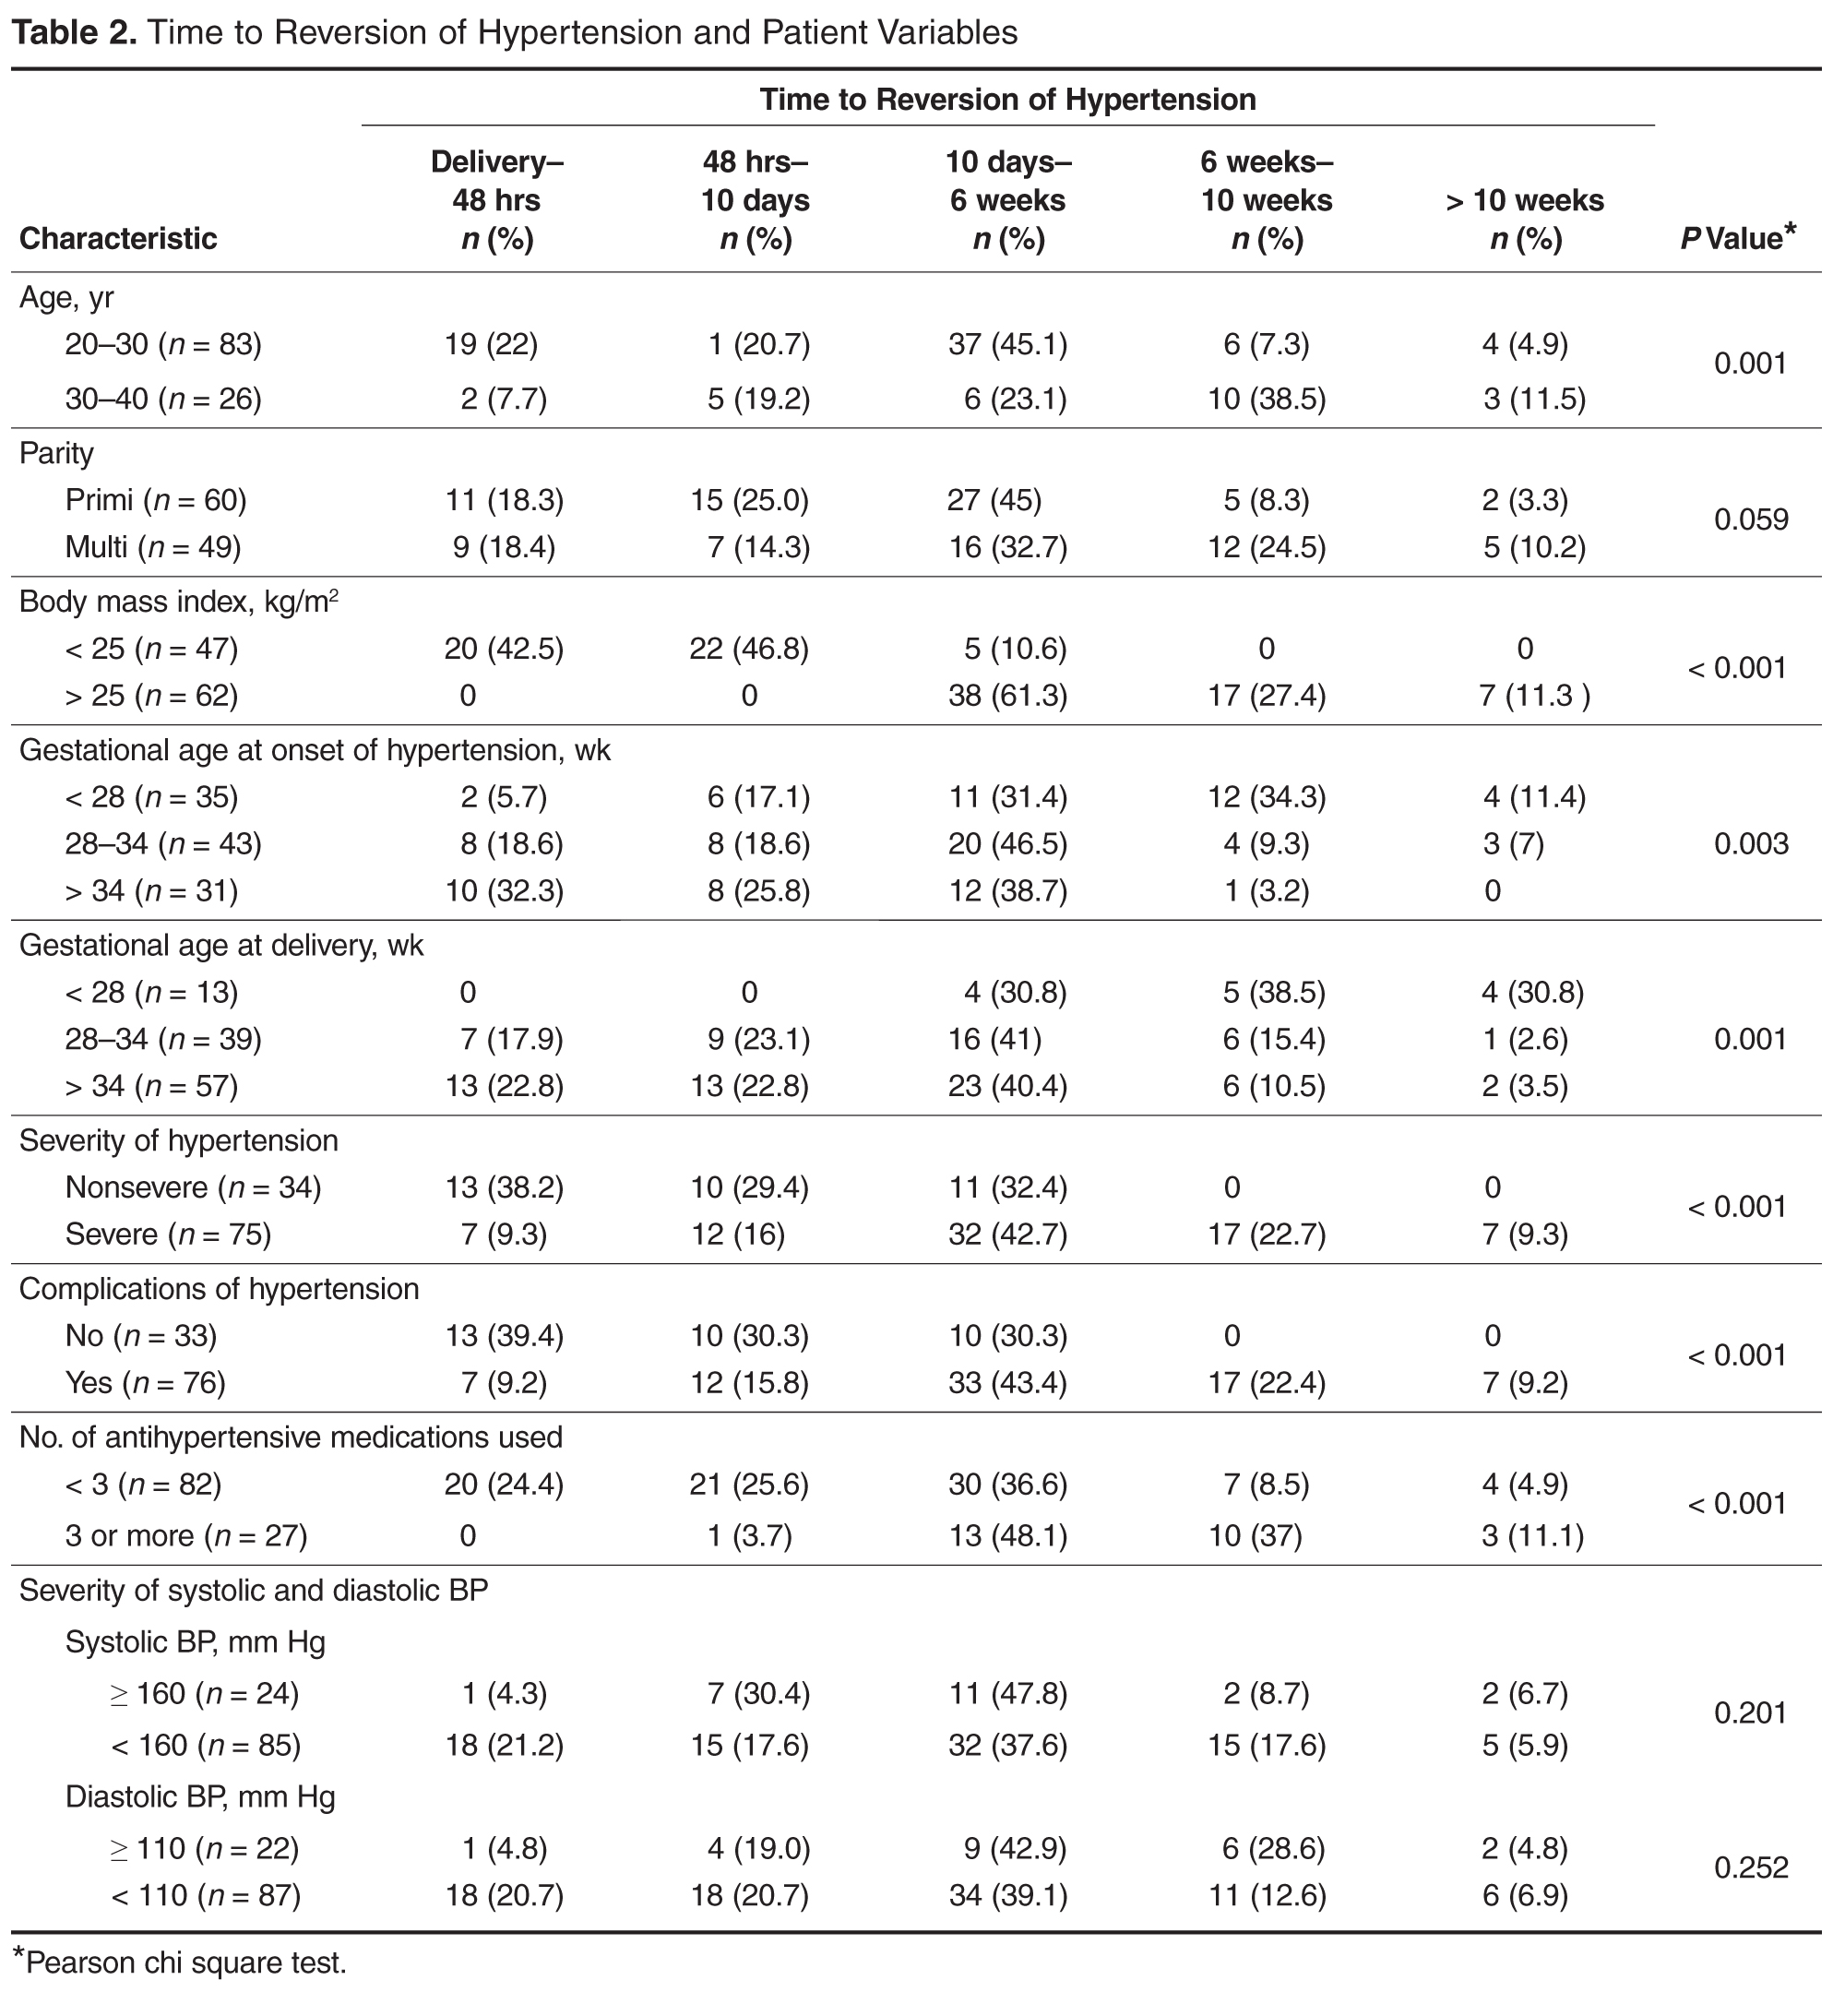
Eighteen women had additional medical problems: gestational diabetes (n = 5), anemia (n = 3), hypothyroidism (n = 4), rheumatic heart disease (n = 2), antiphospholipid antibody syndrome (n = 1) chronic kidney disease (n = 1), post atrial septal defect closure (n = 1), and tricuspid valve prolapse (TVP) with regurgitation and pulmonary arterial hypertension (n = 1). With the exception of the woman with chronic kidney disease, all reverted to normal blood pressure by 6 weeks; the woman with TVP reverted after corrective cardiac surgery in puerperium.
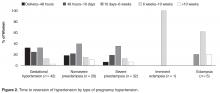
Discussion
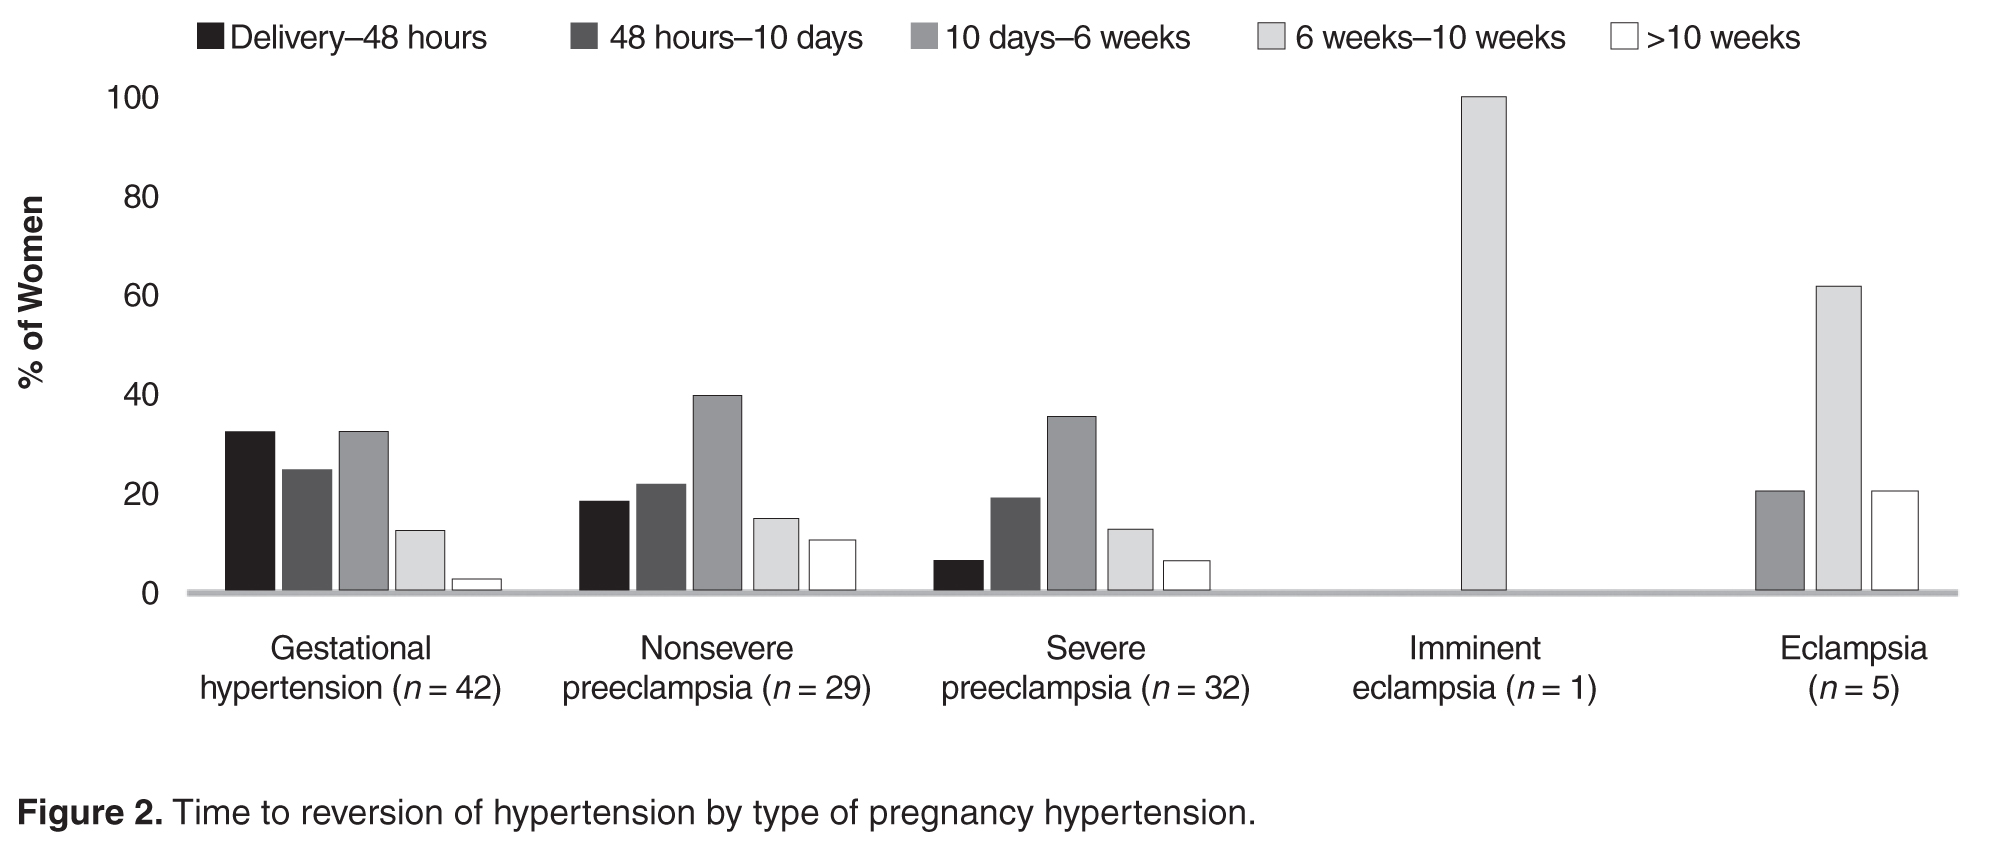
In the present study we assessed possible correlations of obstetric profile with time to postpartum recovery of blood pressure in women with pregnancy hypertension. Women with advanced age, higher body mass index, early gestational age at the onset of hypertension, early gestational age at delivery, severe hypertension, and those with complications of hypertension took longer time in the postnatal period for normalization of blood pressure.
The strength of this study was its prospective design and high rate of follow-up. Those who missed a visit were followed up over telephone. However, 19 women were not available even by phone. A limitation of this study is that the information regarding when the antihypertensive was stopped was obtained by patient recall, raising the possibility of recall bias. However, as the range of recovery times was wide, an error of few days may not be significant.
In the study we noted that women with preeclampsia took a longer time to recovery compared with women with gestational hypertension. Earlier and more severe disease was associated with delay to recovery or persistence of hypertension beyond 10 weeks postpartum.
Similar to our observation, other authors have observed a consistent association of time to reversion of hypertension and early-onset hypertension in pregnancy [3–5]. Ferrazzani explained the longer time to normalization of blood pressure in preeclampsia compared to gestational hypertension as the recovery time of the endothelial damage in preeclampsia [4].
Berks et al [6] found a correlation of maximum diastolic blood pressure, maximum proteinuria in pregnancy, and diagnosis-to-delivery interval with time taken for resolution of hypertension; however, they did not find that time to resolution was correlated with gestational age at onset of preeclampsia. They opined that their observations reflected endothelial recovery after preeclampsia. They also suggested further research in the area of temporizing management of preeclampsia to determine if a conservative approach increases remote cardiovascular risk [6]. We did not study the diagnosis-to-delivery interval, but those with early delivery in our group had late postpartum recovery, indicating that they had severe/complicated preeclampsia that demanded early termination.
In conclusion, women with advanced age, higher body mass index, early gestational age at the onset of hypertension, severe and with complications of hypertension require prolonged monitoring and treatment when indicated for hypertension in the postnatal period. Women with a history of pregnancy hypertension have increased risk of stroke, cardiac ischemia, venous thrombosis within 10 to 20 years after pregnancy and higher risk of hypertension and type 2 diabetes mellitus [7–9]. Extended postnatal follow-up and regular monitoring is recommended to address the needs of these high-risk women.
Corresponding author: Dr. Shyamala Guruvare, 1-167 (C4), Lahari, Eshakripa Road, Parkala, Udupi District, Karnataka, India 576107, shyamaladoc@gmail.com.
Financial disclosures: None reported.
1. American College of Obstetricians and Gynecologists; Task Force on Hypertension in Pregnancy. Hypertension in pregnancy. Report of the American College of Obstetricians and Gynecologists’ Task Force on Hypertension in Pregnancy. Obstet Gynecol 2013;122:1122–31.
2. Ndayambagye EB, Nakalembe M, Kaye DK. Factors associated with persistent hypertension after puerperium among women with preeclampsia/ eclampsia in Mulago Hospital, Uganda. BMC Pregnancy Childbirth 2010;10:12.
3. Mikami Y,Takagi K, Itaya Y, et al. Post-partum recovery course in patients with gestational hypertension and preeclampsia. J Obstet Gynaecol Res 2014;40:919–25.
4. Ferrazzini S, Carolis SD, Pomini F, et al. The duration of hypertension in the puerperium of preeclamptic women: Relationship with renal impairment and week of delivery. Am J Obstet Gynecol 1994;171:506–12.
5. Kaze FF, Njukeng FA , Kengne A, et al. Post-partum trend in blood pressure levels, renal function and proteinuria in women with severe preeclampsia and eclampsia in Sub-Saharan Africa: a 6-months cohort study.BMC Pregnancy Childbirth 2014;14:134
6. Berks D, Steegers EA, Molas M, Visser W. Resolution of hypertension and proteinuria after preeclampsia. Obstet Gynecol 2009;114:1307–14.
7. Gongora MC, Wenger NK. Cardiovascular complications of pregnancy. Int J Mol Sci 2015;16:23905–28.
8. Garovic VD, August P. Preeclampsia and the future risk of hypertension: the pregnant evidence. Curr Hypertens Rep 2013;114–21.
9. Zandstra M, Stekkinger E, van der Vlugt MJ, et al. Cardiac diastolic dysfunction and metabolic syndrome in young women after placental syndrome. Obstet Gynecol 2010;115:101–8.
From the Department of Obstetrics and Gynecology, Kasturba Medical College, Manipal, Karnataka, India.
Abstracts
- Objective: To examine the association of the patient’s obstetric profile and time to normalization of blood pressure in the postnatal period among women with hypertensive disorders in pregnancy.
- Methods: We conducted a prospective cohort study at a tertiary level hospital between November 2014 and May 2015. Women with pregnancy hypertension who required antihypertensive treatment were recruited after delivery. The normalization trends in blood pressure were tested for associations with patient demographic data and details of pregnancy hypertension.
- Results: Among 109 women included in the study, earlier gestational age at onset of hypertension and earlier gestational age at delivery was correlated with slower resolution of hypertension. Time to resolution also was correlated with age, BMI, severity of hypertension, associated complications, and the number of antihypertensive medications received. There was no correlation with highest recorded systolic or diastolic blood pressures. Only 15% of women with gestational hypertension had persistent hypertension beyond 6 weeks. In the groups with nonsevere preeclampsia, severe preeclampsia, and eclampsia, blood pressure remained high after 6 weeks in 26%, 14%, and 50% of women, respectively.
- Conclusion: Women with advanced age, higher body mass index, early gestational age at the onset of hypertension, severe hypertension and who had complications of hypertension require prolonged monitoring and treatment when indicated for hypertension in postnatal period.
Key words: intensive care unit; communication; family meeting; critical illness; decision making; end of life care.
Hypertension is the most common medical problem encountered during pregnancy, complicating up to 10% of pregnancies worldwide [1]. The disorders of hypertension in pregnancy are generally classified as chronic hypertension, preeclampsia–eclampsia, preeclampsia superimposed on chronic hypertension, and gestational hypertension. The hypertensive disorders of pregnancy are a leading cause of mortality and morbidity in the perinatal period.
Women with hypertensive disorders in pregnancy show varying trends of blood pressure normalization, with the recovery period ranging from a few hours to several months after delivery. In one study, nearly one-fourth of women with preeclampsia/eclampsia had persistent high blood pressure after puerperium [2]. Identifying the obstetric risk factors for persistent hypertension will help in focusing care and research in this group of patients.
We undertook a prospective study to assess possible correlations of obstetric profile with time to normalization of blood pressure in the postnatal period among women with hypertensive disorders in pregnancy.
Methods
Setting
This prospective cohort study was conducted in the department of obstetrics and gynecology at Kasturba Hospital, Manipal, between November 2014 and May 2015. Permission for the study was obtained from the Institution Ethical Committee (IEC264/2015).
Patients
Women who had hypertension in pregnancy and required antihypertensive treatment were approached on the first postnatal day and invited to participate in the study. Women with chronic hypertension (women with known pre-pregnancy hypertension and with hypertension diagnosed before 20 weeks gestation) or secondary hypertension were excluded. After granting informed consent, enrolled women were followed until the time they no longer required antihypertensive medication (“reversion of hypertension”) or until 10 weeks postpartum, whichever came first.
During the hospital stay in the postnatal period, women had their blood pressure monitored and antihypertensives were adjusted as needed. After discharge from the hospital, blood pressure was monitored by the family physician who also made decisions regarding antihypertensive management. All women had a follow-up visit in the hospital in the 6th postnatal week as per the postnatal clinic protocol.
Definitions
Hypertension was defined as BP ≥ 140/90 mm Hg. The hypertension disorders of pregnancy were defined as follows:
- Gestational hypertension: hypertension after 20 weeks gestation on two occasions 4 hours apart without meeting criteria for preeclampsia.
- Preeclampsia: hypertension after 20 weeks gestation on two occasions 4 hours apart with proteinuria (≥ 300 mg/24 hour) or, in the absence of proteinuria, new onset of any of the following: thrombocytopenia, renal insufficiency, impaired liver function, pulmonary edema, or cerebral or visual symptoms [1]. Severe preeclampsia was defined as preeclampsia with any of the following: systolic blood pressure > 160 mm Hg diastolic BP > 110 mm Hg or more on 2 occasions 4 hours apart, thrombocytopenia (platelet count < 100,00/mL), renal insufficiency, impaired liver function, pulmonary edema, or cerebral or visual symptoms. Preeclampsia without any of these features was considered nonsevere preeclampsia.
- Eclampsia: Women with hypertension with epigastric pain, headache, vomiting, and blurring of vision were diagnosed with imminent eclampsia and those with hypertension-related convulsions were diagnosed with eclampsia.
- Complications of preeclampsia included eclampsia, placental abruption, pulmonary edema, thrombocytopenia, HELLP syndrome, disseminated intravascular coagulation, multiorgan failure, severe intrauterine growth restriction, and fetal demise.
Main Outcome Measure
Time to reversion of hypertension was the main outcome measure. We defined the reversion date as the day that hypertension medications were stopped. This information was obtained via in-person questioning on the 2nd postpartum day and at the 6-week postnatal visit and via telephonic survey on the 10th postnatal day and at 10 weeks postdelivery. Women who missed the 6-week postnatal visit were also followed up by telephone.
Data Collection
Demographic details (age, parity, BMI) as well as information regarding gestational age at onset of hypertension, severity, highest systolic and diastolic blood pressure recordings, treatment received, complications related to hypertension, pregnancy termination and delivery was obtained from the medical charts and/or via telephonic follow-up.
Analysis
We used Pearson’s chi-square test to assess the association between recovery trends in blood pressure and the patient’s demographic profile and details of pregnancy hypertension. Statistical analysis was done using SPSS16.
Results
In our study, earlier the gestational age at onset of hypertension and earlier gestation at delivery was associated with slower recovery from hypertension (Table 2). Time taken for recovery also was associated with age, BMI, severity of hypertension, associated complications, and the number of antihypertensive medications received (Table 2). Among women who received more than 3 antiphypertensives in pregnancy, nearly 50% continued to have hypertension beyond 6 weeks (Table 2).
On testing for strength of correlation, it was found that body mass index and time to blood pressure normalization had a strong positive correlation (r = 0.8). The remaining parameters (ie, gestational age at onset, gestational age at delivery, severity and complications of hypertension and number of antihypertensive medications) and time to recovery were weakly correlated (r = 0.3 to 0.5 [+/–]).
Women with gestational hypertension and mild preeclampsia had faster normalization of blood pressure compared to those with severe preeclampsia and eclampsia (Figure 2). Only 15% of women with gestational hypertension had persistent hypertension beyond 6 weeks, whereas in the groups with nonsevere preeclampsia, severe preeclampsia, and eclampsia, blood pressure
Eighteen women had additional medical problems: gestational diabetes (n = 5), anemia (n = 3), hypothyroidism (n = 4), rheumatic heart disease (n = 2), antiphospholipid antibody syndrome (n = 1) chronic kidney disease (n = 1), post atrial septal defect closure (n = 1), and tricuspid valve prolapse (TVP) with regurgitation and pulmonary arterial hypertension (n = 1). With the exception of the woman with chronic kidney disease, all reverted to normal blood pressure by 6 weeks; the woman with TVP reverted after corrective cardiac surgery in puerperium.
Discussion
In the present study we assessed possible correlations of obstetric profile with time to postpartum recovery of blood pressure in women with pregnancy hypertension. Women with advanced age, higher body mass index, early gestational age at the onset of hypertension, early gestational age at delivery, severe hypertension, and those with complications of hypertension took longer time in the postnatal period for normalization of blood pressure.
The strength of this study was its prospective design and high rate of follow-up. Those who missed a visit were followed up over telephone. However, 19 women were not available even by phone. A limitation of this study is that the information regarding when the antihypertensive was stopped was obtained by patient recall, raising the possibility of recall bias. However, as the range of recovery times was wide, an error of few days may not be significant.
In the study we noted that women with preeclampsia took a longer time to recovery compared with women with gestational hypertension. Earlier and more severe disease was associated with delay to recovery or persistence of hypertension beyond 10 weeks postpartum.
Similar to our observation, other authors have observed a consistent association of time to reversion of hypertension and early-onset hypertension in pregnancy [3–5]. Ferrazzani explained the longer time to normalization of blood pressure in preeclampsia compared to gestational hypertension as the recovery time of the endothelial damage in preeclampsia [4].
Berks et al [6] found a correlation of maximum diastolic blood pressure, maximum proteinuria in pregnancy, and diagnosis-to-delivery interval with time taken for resolution of hypertension; however, they did not find that time to resolution was correlated with gestational age at onset of preeclampsia. They opined that their observations reflected endothelial recovery after preeclampsia. They also suggested further research in the area of temporizing management of preeclampsia to determine if a conservative approach increases remote cardiovascular risk [6]. We did not study the diagnosis-to-delivery interval, but those with early delivery in our group had late postpartum recovery, indicating that they had severe/complicated preeclampsia that demanded early termination.
In conclusion, women with advanced age, higher body mass index, early gestational age at the onset of hypertension, severe and with complications of hypertension require prolonged monitoring and treatment when indicated for hypertension in the postnatal period. Women with a history of pregnancy hypertension have increased risk of stroke, cardiac ischemia, venous thrombosis within 10 to 20 years after pregnancy and higher risk of hypertension and type 2 diabetes mellitus [7–9]. Extended postnatal follow-up and regular monitoring is recommended to address the needs of these high-risk women.
Corresponding author: Dr. Shyamala Guruvare, 1-167 (C4), Lahari, Eshakripa Road, Parkala, Udupi District, Karnataka, India 576107, shyamaladoc@gmail.com.
Financial disclosures: None reported.
1. American College of Obstetricians and Gynecologists; Task Force on Hypertension in Pregnancy. Hypertension in pregnancy. Report of the American College of Obstetricians and Gynecologists’ Task Force on Hypertension in Pregnancy. Obstet Gynecol 2013;122:1122–31.
2. Ndayambagye EB, Nakalembe M, Kaye DK. Factors associated with persistent hypertension after puerperium among women with preeclampsia/ eclampsia in Mulago Hospital, Uganda. BMC Pregnancy Childbirth 2010;10:12.
3. Mikami Y,Takagi K, Itaya Y, et al. Post-partum recovery course in patients with gestational hypertension and preeclampsia. J Obstet Gynaecol Res 2014;40:919–25.
4. Ferrazzini S, Carolis SD, Pomini F, et al. The duration of hypertension in the puerperium of preeclamptic women: Relationship with renal impairment and week of delivery. Am J Obstet Gynecol 1994;171:506–12.
5. Kaze FF, Njukeng FA , Kengne A, et al. Post-partum trend in blood pressure levels, renal function and proteinuria in women with severe preeclampsia and eclampsia in Sub-Saharan Africa: a 6-months cohort study.BMC Pregnancy Childbirth 2014;14:134
6. Berks D, Steegers EA, Molas M, Visser W. Resolution of hypertension and proteinuria after preeclampsia. Obstet Gynecol 2009;114:1307–14.
7. Gongora MC, Wenger NK. Cardiovascular complications of pregnancy. Int J Mol Sci 2015;16:23905–28.
8. Garovic VD, August P. Preeclampsia and the future risk of hypertension: the pregnant evidence. Curr Hypertens Rep 2013;114–21.
9. Zandstra M, Stekkinger E, van der Vlugt MJ, et al. Cardiac diastolic dysfunction and metabolic syndrome in young women after placental syndrome. Obstet Gynecol 2010;115:101–8.
Acute kidney injury in patients treated with vancomycin and piperacillin-tazobactam: A retrospective cohort analysis
Empiric antimicrobial therapy often consists of the combination of gram-positive coverage with vancomycin (VAN) and gram-negative coverage, specifically an antipseudomonal beta-lactam such as piperacillin-tazobactam (PTZ). Literature from a variety of patient populations reports nephrotoxicity associated with VAN, targeting troughs greater than 15 µg/mL, that occur in 5% to 43% of patients.1 In a study of critically ill patients, acute kidney injury (AKI) was found in 21% of patients receiving VAN, with increasing duration of VAN treatment, greater VAN levels, concomitant vasoactive medication administration, and intermittent infusion methods being associated with higher odds of AKI.2 A recent report from adult internal medicine patients estimated the incidence of VAN-associated nephrotoxicity at 13.6% and implicated concomitant PTZ therapy as a key factor in these patients.3
Further studies have explored the interaction between empiric beta-lactam and VAN therapy, showing mixed results. Reports of AKI associated with the combination of VAN and PTZ range from 16.3% to 34.8%,4-8 while the cefepime-VAN combination is reported to range from 12.5% to 13.3%.5,6 While VAN monotherapy groups were well represented, only 1 study7 compared the PTZ-VAN combination to a control group of PTZ monotherapy.
The primary objective of this study was to evaluate the differences in AKI incidence between patients treated with VAN and with PTZ, alone and in combination.
METHODS
This is a retrospective cohort study of adult patients conducted at the University of Kentucky Chandler Medical Center (UKMC) from September 1, 2010 through August 31, 2014. Patients were included if they were at least 18 years of age on admission; remained hospitalized for at least 48 hours; received VAN combined with PTZ (VAN/PTZ), VAN alone, or PTZ alone; and had at least 48 hours of therapy (and 48 hours of overlapping therapy in the VAN/PTZ group). Patients were excluded if they had underlying diagnosis of chronic kidney disease according to the International Classification of Diseases 9 (ICD-9) code, were receiving renal replacement therapy before admission, had a diagnosis of cystic fibrosis, or were pregnant. Additionally, patients were excluded if they presented with AKI, defined as an initial creatinine clearance less than 30 mL/min, or if baseline creatinine clearance was greater than 4 times the standard deviation from the mean; serum creatinine values were not obtained during admission; and if AKI occurred prior to therapy initiation, within 48 hours of initiation, or more than 7 days after treatment was discontinued. Patients were followed throughout their stay until time of discharge.
Data Source
Patient data were collected from the University of Kentucky Center for Clinical and Translational Science Enterprise Data Trust (EDT). The EDT contains clinical data from the inpatient population of UKMC from 2006 to present. Data stored and updated nightly by the EDT includes: demographics, financial classification (Medicare, Medicaid, private insurance), provider-level detail (service line), medical diagnosis (ICD-9 codes), medical procedures (Current Procedural Terminology [CPT] codes), lab tests and results, medication administration details, visit details (age, length of stay, etc), and vital signs. This study was approved by the UKMC Institutional Review Board.
Data collected for each patient included: demographic data, visit details (length of stay, admitting and primary diagnosis codes, etc.), severity of underlying illness as defined by the Charlson Comorbidity Index (CCI), all serum creatinine levels drawn per visit, medication administration information (dose, date, and time administered), all VAN trough levels, receipt of other nephrotoxic agents, blood pressures, and receipt of vasopressors.
Outcome Ascertainment
The definition of AKI was based on the RIFLE (Risk, Injury, Failure, Loss, End-stage) criteria,9 with risk defined as a 25% to 50% decrease in estimated glomerular filtration rate (GFR), injury as a 50% to 75% decrease in estimated GFR, and failure defined as a greater than 75% decrease in estimated GFR. Loss and end-stage classifications were not assessed because of this study’s follow-up period. The adjusted Cockcroft and Gault equation10 was used to estimate GFR due to the inconsistency of weight availability in the dataset and concordance with the institution’s practice. Baseline creatinine clearance was calculated with the first serum creatinine obtained, and the minimum creatinine clearance was calculated using the maximum serum creatinine during each patient’s visit. The percent decrease in creatinine clearance was calculated from these 2 values. AKI status was defined as meeting any of the RIFLE criteria. Mortality was assessed for all patients and defined as the composite of inhospital mortality and discharge or transfer to hospice care.
Exposure Ascertainment
Hypotension exposure was defined as experiencing 1 of the following: mean arterial blood pressure less than 60 mm Hg, a diagnosis of hypotension by a physician, or receipt of vasopressors or inotropic agents. Days of therapy for each drug were obtained and combination days of therapy were calculated by including only those days in which the patient received both medications. Total days of therapy were calculated by the sum of all days receiving at least 1 study agent. Exposure to other nephrotoxic agents (eg, acyclovir, angiotensin converting enzyme [ACE] inhibitors, angiotensin II receptor antagonists, aminoglycosides, amphotericin B, cyclosporine, foscarnet, loop diuretics, nonsteroidal anti-inflammatory drugs, sulfonamides, tacrolimus, and tenofovir) were defined as receipt of at least 1 dose of the agent during hospitalization.
Statistical Analysis
Characteristics between groups were described with basic descriptive statistics. Continuous variables were compared with 1-way analysis of variance (ANOVA) or the Kruskal-Wallis test. Categorical variables were compared with chi-square or Fisher exact test. Yearly AKI trends were assessed with Pearson correlation coefficient. To control for differences in underlying severity of illness between groups, a subanalysis was performed in which the cohort was split into 4 groups (0, 1, 2 to 4, and ≥5 points) based on CCI. Univariate models for all covariates were created with probability of AKI as the outcome. Covariates significant after univariate were incorporated into the multivariate model, which was subsequently adjusted to achieve the highest predictive accuracy by minimizing the Akaike information criterion (AIC). Nephrotoxic agent exposures were included in the final multivariate model regardless of statistical significance in univariate analysis. Model fit was assessed with a standardized Hosmer-Lemeshow goodness-of-fit test.11 All statistical analyses were completed with RStudio v 0.98 running R v 3.1.2 (R Foundation for Statistical Computing, Vienna, Austria).12 All tests were 2-tailed and significance was defined at an alpha of 0.05.
RESULTS
Of 17,879 patients initially screened, 11,650 patients were evaluated, of which 5,497 received VAN and PTZ (VAN/PTZ), 3,055 received VAN alone, and 3,098 received PTZ alone. Table 1 contains basic demographic information. The mean age of patients was 52.5 years ± 16.8 years with 6,242 (53.6%) males. Patients receiving VAN/PTZ had higher CCIs than either monotherapy group and had significantly increased length of hospitalization. While patients in the combination therapy group were more likely to experience hypotension, concomitant nephrotoxic agent exposure was more common in the VAN monotherapy group.

RIFLE-defined AKI occurred in 1,647 (14.1%) across the entire cohort. AKI occurred in 21% of VAN/PTZ patients, 8.3% of VAN patients, and 7.8% of PTZ patients (P < 0.0001). RIFLE-defined risk, injury, and failure occurred more frequently in the VAN/PTZ cohort compared to the VAN and PTZ monotherapy groups (Figure). There were no differences in AKI rates between years studied (r2 = 0.4732, P = 0.2). Patients in the VAN/PTZ group experienced AKI on average of 8.0 days after treatment initiation, compared to 8.7 days and 5.2 days for VAN and PTZ monotherapy groups, respectively. The composite of inhospital mortality and transfer-to-hospice care was more common in VAN/PTZ patients (9.6%) compared to monotherapy groups (VAN, 3.9%; PTZ, 3.4%), most likely due to the increased severity of illness.

In the subgroup analysis of patients with similar CCI, AKI incidence increased with severity of illness. When CCI was 0, 7.5% of patients experienced AKI compared to 11.2%, 16.4%, and 18.9% of patients when CCI was 1, 2 to 4, and ≥5, respectively (P < 0.0001). VAN/PTZ (range = 12.1% to 26.5%) was associated with greater AKI incidence than either VAN (range = 4.8% to 11.5%) or PTZ (range = 3.8% to 10.4%) alone in each subgroup (P < 0.0001 for all subgroups).
Factors associated with AKI in univariate analyses included treatment with VAN/PTZ, days of therapy, baseline creatinine clearance, transfer from outside hospitals, CCI, admission type, length of hospitalization, dehydration exposure, and hypotension exposure. Exposure to aminoglycosides, amphotericin B, ACE inhibitors, nonsteroidal anti-inflammatory drugs, tacrolimus, foscarnet, loop diuretics, sulfonamides, and tenofovir were all associated with increased odds of AKI in simple univariate logistic regression. Gender, age, year of treatment, angiotensin II receptor antagonist exposure, and cyclosporine exposure were not significantly associated with AKI incidence.
After multivariate logistic regression, monotherapy with VAN or PTZ was associated with decreased odds of AKI compared to VAN/PTZ therapy (aORVAN,0.48; 95% CIVAN,0.41-0.57; aORPTZ, 0.43; 95% CIPTZ, 0.37-0.50). No difference in AKI incidence was observed between VAN and PTZ groups (aORPTZ:VAN, 0.88; 95% CI, 0.73-1.08). Table 2 describes the relationship between AKI and other covariates included in the model. Increased odds of AKI were seen with concomitant administration of ACE inhibitors, amphotericin B, tacrolimus, loop diuretics, and tenofovir. Radio-contrast dye administration was associated with lower odds of AKI. Patients admitted urgently and emergently were at higher risk of AKI, while those admitted via the trauma center were less likely to experience AKI compared to patients who were electively admitted. Increased length of stay and duration of therapy were both associated with increased likelihood of AKI, independent of treatment group; however, durations of therapy beyond 12 days was not associated with increased AKI. Hypotension, as defined, and diagnosed dehydration both independently increased AKI odds. Aside from those older than 80 years of age, increasing age was not associated with increased AKI risk. Male gender was associated with a slight decrease in AKI rate. No evidence of overfitting was observed with the standardized Hosmer-Lemeshow P-value of 0.683, and the model provides good predictive accuracy with a C-statistic of 0.788.

CONCLUSIONS
Acute kidney injury secondary to VAN therapy is a well-characterized adverse effect, while AKI incidence secondary to PTZ is less understood. Additionally, there appears to be an additive effect when these agents are used in combination. This is the largest review of AKI in patients receiving VAN,PTZ, or the combination of both agents.
There is increasing evidence suggesting greater nephrotoxicity in patients treated with the combination of VAN and antipseudomonal beta-lactams. The mechanism for the apparent increase in nephrotoxicity with this drug combination is not well understood and needs further study in both animal models and humans.
Acute kidney injury rates related to VAN vary widely, with recent studies in critically ill and internal medicine patients estimated at 21% and 13.6%, respectively.2,3 In our VAN monotherapy cohort, the AKI rate was 8.3%, with 2.3% of patients experiencing a greater than 50% decrease in creatinine clearance. Piperacillin-tazobactam-related AKI rates are not well characterized; however, a small retrospective analysis estimated that 11.1% of PTZ patients experienced acute renal failure (defined as either increase in serum creatinine greater than 0.5 mg/dL or 50% increase from baseline).13 In the present study, we found the PTZ-related AKI rate to be 7.8%, which may be due to a more stringent definition of AKI. Additionally, Hellwig et al13 found that PTZ monotherapy was associated with higher AKI rates compared to VAN monotherapy (11.1% vs 4.9%; P = 0.014). This was not replicated in our study, with VAN and PTZ monotherapy having similar AKI rates (8.3% and 7.8%, respectively) and an adjusted aOR of 0.88 (95% CI 0.0.73-1.08) for AKI in PTZ- compared to VAN-treated patients. The estimated AKI incidence of 21% in the combination therapy group at our institution is consistent with literature that ranges from 16.3% to 34.8%.4-8,13
To control for differences in baseline severity of illness, we performed a subgroup analysis of patients with similar CCI scores. The finding of increased AKI in patients receiving combination VAN and PTZ was consistent in each subgroup, suggesting that the increase in AKI is independent of illness severity.
This study is not without limitations. As with all retrospective studies, it is difficult to determine a causal link between VAN and PTZ combination therapy and increased AKI incidence due to confounding. We employed a rigorous study design that controlled for major confounders of AKI, such as concomitant nephrotoxic exposure, hypotension, and renal disease. Severity of illness was measured with CCI, which may not accurately capture the severity of illness at treatment initiation. Alternatives, such as acute physiology and chronic health evaluation (APACHE) and sequential organ failure assessment (SOFA) scores, may more accurately reflect critical illness on presentation; however, this study was not focused specifically on critically ill patients. In addition to baseline comorbidity, we controlled for hypotension and dehydration as a surrogate marker for critical illness. In the subgroup analysis of patients with similar CCI, the effect of VAN/PTZ on AKI compared to VAN or PTZ monotherapy was consistent in each group. Nephrotoxic potential of agents was assumed to be equal, which is not necessarily true. Additionally, the binary representation of nephrotoxic exposure does not describe the amount of the agent received; as such, our estimations of AKI odds may be artificially elevated. Approximately one-quarter of the patients in this study were transferred from an outside hospital, for which no data regarding initial treatment are available. This may lead to exposure misclassification. We attempted to control for this factor in the regression model and found that, after controlling for other covariates, hospital transfer was associated with increasing odds of AKI. Finally, data were collected retrospectively from the electronic medical record and are subject to inaccuracies documented in the chart; however, any bias introduced should be nondifferential.
In our large retrospective study of combination empiric therapy with VAN and PTZ, we found that combination therapy was associated with more than double the odds of AKI occurring compared to either monotherapy with VAN or PTZ. Increasing duration of therapy was also associated with increases in AKI. These findings demonstrate the need for judicious use of combination therapy and strengthen the need for antimicrobial de-escalation when appropriate to avoid deleterious effects.
Acknowledgments
The authors thank Chantal Le Rutter, MPA, for copyediting services.
Disclosures
This project was supported by the National Center for Advancing Translational Sciences, National Institutes of Health, through grant numbers UL1TR000117 and UL1TR001998. The content is solely the responsibility of the authors and does not necessarily represent the official views of the NIH. The authors report no conflicts of interest.
1. van Hal SJ, Paterson DL, Lodise TP. Systematic review and meta-analysis of vancomycin-induced nephrotoxicity associated with dosing schedules that maintain troughs between 15 and 20 milligrams per liter. Antimicrob Agents Chemother. 2013;57:734-744. PubMed
2. Hanrahan TP, Harlow G, Hutchinson J, et al. Vancomycin-associated nephrotoxicity in the critically ill: a retrospective multivariate regression analysis. Crit Care Med. 2014;42:2527-2536. PubMed
3. Meaney CJ, Hynicka LM, Tsoukleris MG. Vancomycin-associated nephrotoxicity in adult medicine patients: incidence, outcomes, and risk factors. Pharmacotherapy. 2014;34:653-661. PubMed
4. Burgess LD, Drew RH. Comparison of the incidence of vancomycin-induced nephrotoxicity in hospitalized patients with and without concomitant piperacillin-tazobactam. Pharmacotherapy. 2014;34:670-676. PubMed
5. Moenster RP, Linneman TW, Finnegan PM, Hand S, Thomas Z, McDonald JR. Acute renal failure associated with vancomycin and β-lactams for the treatment of osteomyelitis in diabetics: piperacillin-tazobactam as compared with cefepime. Clin Microbiol Infect. 2014;20:O384-O389. PubMed
6. Gomes DM, Smotherman C, Birch A, et al. Comparison of acute kidney injury during treatment with vancomycin in combination with piperacillin-tazobactam or cefepime. Pharmacotherapy. 2014;34:662-669. PubMed
7. Kim T, Kandiah S, Patel M, et al. Risk factors for kidney injury during vancomycin and piperacillin/tazobactam administration, including increased odds of injury with combination therapy. BMC Res Notes. 2015;8:579. PubMed
8. Davies SW, Efird JT, Guidry CA, et al. Top guns: the “Maverick” and “Goose” of empiric therapy. Surg Infect (Larchmt). 2016;17:38-47. PubMed
9. Bellomo R, Ronco C, Kellum JA, Mehta RL, Palevsky P; Acute Dialysis Quality Initiative workgroup. Acute renal failure - definition, outcome measures, animal models, fluid therapy and information technology needs: the Second International Consensus Conference of the Acute Dialysis Quality Initiative (ADQI) Group. Crit Care. 2004;8:R204-R212. PubMed
10. Wilhelm SM, Kale-Pradhan PB. Estimating creatinine clearance: a meta-analysis. Pharmacotherapy. 2011;31:658-664. PubMed
11. Paul P, Pennell ML, Lemeshow S. Standardizing the power of the Hosmer-Lemeshow goodness of fit test in large data sets. Stat Med. 2013;32:67-80. PubMed
12. R Core Team (2014). R: A language and environment for statistical computing. R Foundation for Statistical Computing, Vienna, Austria. Available at: http://www.R-project.org/.
13. Hellwig T, Hammerquist R, Loecker B, Shields J. Retrospective evaluation of the incidence of vancomycin and/or piperacillin-tazobactam induced acute renal failure. Abstracts of the Society of Critical Care Medicine 41st Critical Care Congress. February 4-8, 2012. Houston, Texas. Crit Care Med. 2011;39:1-264.
Empiric antimicrobial therapy often consists of the combination of gram-positive coverage with vancomycin (VAN) and gram-negative coverage, specifically an antipseudomonal beta-lactam such as piperacillin-tazobactam (PTZ). Literature from a variety of patient populations reports nephrotoxicity associated with VAN, targeting troughs greater than 15 µg/mL, that occur in 5% to 43% of patients.1 In a study of critically ill patients, acute kidney injury (AKI) was found in 21% of patients receiving VAN, with increasing duration of VAN treatment, greater VAN levels, concomitant vasoactive medication administration, and intermittent infusion methods being associated with higher odds of AKI.2 A recent report from adult internal medicine patients estimated the incidence of VAN-associated nephrotoxicity at 13.6% and implicated concomitant PTZ therapy as a key factor in these patients.3
Further studies have explored the interaction between empiric beta-lactam and VAN therapy, showing mixed results. Reports of AKI associated with the combination of VAN and PTZ range from 16.3% to 34.8%,4-8 while the cefepime-VAN combination is reported to range from 12.5% to 13.3%.5,6 While VAN monotherapy groups were well represented, only 1 study7 compared the PTZ-VAN combination to a control group of PTZ monotherapy.
The primary objective of this study was to evaluate the differences in AKI incidence between patients treated with VAN and with PTZ, alone and in combination.
METHODS
This is a retrospective cohort study of adult patients conducted at the University of Kentucky Chandler Medical Center (UKMC) from September 1, 2010 through August 31, 2014. Patients were included if they were at least 18 years of age on admission; remained hospitalized for at least 48 hours; received VAN combined with PTZ (VAN/PTZ), VAN alone, or PTZ alone; and had at least 48 hours of therapy (and 48 hours of overlapping therapy in the VAN/PTZ group). Patients were excluded if they had underlying diagnosis of chronic kidney disease according to the International Classification of Diseases 9 (ICD-9) code, were receiving renal replacement therapy before admission, had a diagnosis of cystic fibrosis, or were pregnant. Additionally, patients were excluded if they presented with AKI, defined as an initial creatinine clearance less than 30 mL/min, or if baseline creatinine clearance was greater than 4 times the standard deviation from the mean; serum creatinine values were not obtained during admission; and if AKI occurred prior to therapy initiation, within 48 hours of initiation, or more than 7 days after treatment was discontinued. Patients were followed throughout their stay until time of discharge.
Data Source
Patient data were collected from the University of Kentucky Center for Clinical and Translational Science Enterprise Data Trust (EDT). The EDT contains clinical data from the inpatient population of UKMC from 2006 to present. Data stored and updated nightly by the EDT includes: demographics, financial classification (Medicare, Medicaid, private insurance), provider-level detail (service line), medical diagnosis (ICD-9 codes), medical procedures (Current Procedural Terminology [CPT] codes), lab tests and results, medication administration details, visit details (age, length of stay, etc), and vital signs. This study was approved by the UKMC Institutional Review Board.
Data collected for each patient included: demographic data, visit details (length of stay, admitting and primary diagnosis codes, etc.), severity of underlying illness as defined by the Charlson Comorbidity Index (CCI), all serum creatinine levels drawn per visit, medication administration information (dose, date, and time administered), all VAN trough levels, receipt of other nephrotoxic agents, blood pressures, and receipt of vasopressors.
Outcome Ascertainment
The definition of AKI was based on the RIFLE (Risk, Injury, Failure, Loss, End-stage) criteria,9 with risk defined as a 25% to 50% decrease in estimated glomerular filtration rate (GFR), injury as a 50% to 75% decrease in estimated GFR, and failure defined as a greater than 75% decrease in estimated GFR. Loss and end-stage classifications were not assessed because of this study’s follow-up period. The adjusted Cockcroft and Gault equation10 was used to estimate GFR due to the inconsistency of weight availability in the dataset and concordance with the institution’s practice. Baseline creatinine clearance was calculated with the first serum creatinine obtained, and the minimum creatinine clearance was calculated using the maximum serum creatinine during each patient’s visit. The percent decrease in creatinine clearance was calculated from these 2 values. AKI status was defined as meeting any of the RIFLE criteria. Mortality was assessed for all patients and defined as the composite of inhospital mortality and discharge or transfer to hospice care.
Exposure Ascertainment
Hypotension exposure was defined as experiencing 1 of the following: mean arterial blood pressure less than 60 mm Hg, a diagnosis of hypotension by a physician, or receipt of vasopressors or inotropic agents. Days of therapy for each drug were obtained and combination days of therapy were calculated by including only those days in which the patient received both medications. Total days of therapy were calculated by the sum of all days receiving at least 1 study agent. Exposure to other nephrotoxic agents (eg, acyclovir, angiotensin converting enzyme [ACE] inhibitors, angiotensin II receptor antagonists, aminoglycosides, amphotericin B, cyclosporine, foscarnet, loop diuretics, nonsteroidal anti-inflammatory drugs, sulfonamides, tacrolimus, and tenofovir) were defined as receipt of at least 1 dose of the agent during hospitalization.
Statistical Analysis
Characteristics between groups were described with basic descriptive statistics. Continuous variables were compared with 1-way analysis of variance (ANOVA) or the Kruskal-Wallis test. Categorical variables were compared with chi-square or Fisher exact test. Yearly AKI trends were assessed with Pearson correlation coefficient. To control for differences in underlying severity of illness between groups, a subanalysis was performed in which the cohort was split into 4 groups (0, 1, 2 to 4, and ≥5 points) based on CCI. Univariate models for all covariates were created with probability of AKI as the outcome. Covariates significant after univariate were incorporated into the multivariate model, which was subsequently adjusted to achieve the highest predictive accuracy by minimizing the Akaike information criterion (AIC). Nephrotoxic agent exposures were included in the final multivariate model regardless of statistical significance in univariate analysis. Model fit was assessed with a standardized Hosmer-Lemeshow goodness-of-fit test.11 All statistical analyses were completed with RStudio v 0.98 running R v 3.1.2 (R Foundation for Statistical Computing, Vienna, Austria).12 All tests were 2-tailed and significance was defined at an alpha of 0.05.
RESULTS
Of 17,879 patients initially screened, 11,650 patients were evaluated, of which 5,497 received VAN and PTZ (VAN/PTZ), 3,055 received VAN alone, and 3,098 received PTZ alone. Table 1 contains basic demographic information. The mean age of patients was 52.5 years ± 16.8 years with 6,242 (53.6%) males. Patients receiving VAN/PTZ had higher CCIs than either monotherapy group and had significantly increased length of hospitalization. While patients in the combination therapy group were more likely to experience hypotension, concomitant nephrotoxic agent exposure was more common in the VAN monotherapy group.
RIFLE-defined AKI occurred in 1,647 (14.1%) across the entire cohort. AKI occurred in 21% of VAN/PTZ patients, 8.3% of VAN patients, and 7.8% of PTZ patients (P < 0.0001). RIFLE-defined risk, injury, and failure occurred more frequently in the VAN/PTZ cohort compared to the VAN and PTZ monotherapy groups (Figure). There were no differences in AKI rates between years studied (r2 = 0.4732, P = 0.2). Patients in the VAN/PTZ group experienced AKI on average of 8.0 days after treatment initiation, compared to 8.7 days and 5.2 days for VAN and PTZ monotherapy groups, respectively. The composite of inhospital mortality and transfer-to-hospice care was more common in VAN/PTZ patients (9.6%) compared to monotherapy groups (VAN, 3.9%; PTZ, 3.4%), most likely due to the increased severity of illness.
In the subgroup analysis of patients with similar CCI, AKI incidence increased with severity of illness. When CCI was 0, 7.5% of patients experienced AKI compared to 11.2%, 16.4%, and 18.9% of patients when CCI was 1, 2 to 4, and ≥5, respectively (P < 0.0001). VAN/PTZ (range = 12.1% to 26.5%) was associated with greater AKI incidence than either VAN (range = 4.8% to 11.5%) or PTZ (range = 3.8% to 10.4%) alone in each subgroup (P < 0.0001 for all subgroups).
Factors associated with AKI in univariate analyses included treatment with VAN/PTZ, days of therapy, baseline creatinine clearance, transfer from outside hospitals, CCI, admission type, length of hospitalization, dehydration exposure, and hypotension exposure. Exposure to aminoglycosides, amphotericin B, ACE inhibitors, nonsteroidal anti-inflammatory drugs, tacrolimus, foscarnet, loop diuretics, sulfonamides, and tenofovir were all associated with increased odds of AKI in simple univariate logistic regression. Gender, age, year of treatment, angiotensin II receptor antagonist exposure, and cyclosporine exposure were not significantly associated with AKI incidence.
After multivariate logistic regression, monotherapy with VAN or PTZ was associated with decreased odds of AKI compared to VAN/PTZ therapy (aORVAN,0.48; 95% CIVAN,0.41-0.57; aORPTZ, 0.43; 95% CIPTZ, 0.37-0.50). No difference in AKI incidence was observed between VAN and PTZ groups (aORPTZ:VAN, 0.88; 95% CI, 0.73-1.08). Table 2 describes the relationship between AKI and other covariates included in the model. Increased odds of AKI were seen with concomitant administration of ACE inhibitors, amphotericin B, tacrolimus, loop diuretics, and tenofovir. Radio-contrast dye administration was associated with lower odds of AKI. Patients admitted urgently and emergently were at higher risk of AKI, while those admitted via the trauma center were less likely to experience AKI compared to patients who were electively admitted. Increased length of stay and duration of therapy were both associated with increased likelihood of AKI, independent of treatment group; however, durations of therapy beyond 12 days was not associated with increased AKI. Hypotension, as defined, and diagnosed dehydration both independently increased AKI odds. Aside from those older than 80 years of age, increasing age was not associated with increased AKI risk. Male gender was associated with a slight decrease in AKI rate. No evidence of overfitting was observed with the standardized Hosmer-Lemeshow P-value of 0.683, and the model provides good predictive accuracy with a C-statistic of 0.788.
CONCLUSIONS
Acute kidney injury secondary to VAN therapy is a well-characterized adverse effect, while AKI incidence secondary to PTZ is less understood. Additionally, there appears to be an additive effect when these agents are used in combination. This is the largest review of AKI in patients receiving VAN,PTZ, or the combination of both agents.
There is increasing evidence suggesting greater nephrotoxicity in patients treated with the combination of VAN and antipseudomonal beta-lactams. The mechanism for the apparent increase in nephrotoxicity with this drug combination is not well understood and needs further study in both animal models and humans.
Acute kidney injury rates related to VAN vary widely, with recent studies in critically ill and internal medicine patients estimated at 21% and 13.6%, respectively.2,3 In our VAN monotherapy cohort, the AKI rate was 8.3%, with 2.3% of patients experiencing a greater than 50% decrease in creatinine clearance. Piperacillin-tazobactam-related AKI rates are not well characterized; however, a small retrospective analysis estimated that 11.1% of PTZ patients experienced acute renal failure (defined as either increase in serum creatinine greater than 0.5 mg/dL or 50% increase from baseline).13 In the present study, we found the PTZ-related AKI rate to be 7.8%, which may be due to a more stringent definition of AKI. Additionally, Hellwig et al13 found that PTZ monotherapy was associated with higher AKI rates compared to VAN monotherapy (11.1% vs 4.9%; P = 0.014). This was not replicated in our study, with VAN and PTZ monotherapy having similar AKI rates (8.3% and 7.8%, respectively) and an adjusted aOR of 0.88 (95% CI 0.0.73-1.08) for AKI in PTZ- compared to VAN-treated patients. The estimated AKI incidence of 21% in the combination therapy group at our institution is consistent with literature that ranges from 16.3% to 34.8%.4-8,13
To control for differences in baseline severity of illness, we performed a subgroup analysis of patients with similar CCI scores. The finding of increased AKI in patients receiving combination VAN and PTZ was consistent in each subgroup, suggesting that the increase in AKI is independent of illness severity.
This study is not without limitations. As with all retrospective studies, it is difficult to determine a causal link between VAN and PTZ combination therapy and increased AKI incidence due to confounding. We employed a rigorous study design that controlled for major confounders of AKI, such as concomitant nephrotoxic exposure, hypotension, and renal disease. Severity of illness was measured with CCI, which may not accurately capture the severity of illness at treatment initiation. Alternatives, such as acute physiology and chronic health evaluation (APACHE) and sequential organ failure assessment (SOFA) scores, may more accurately reflect critical illness on presentation; however, this study was not focused specifically on critically ill patients. In addition to baseline comorbidity, we controlled for hypotension and dehydration as a surrogate marker for critical illness. In the subgroup analysis of patients with similar CCI, the effect of VAN/PTZ on AKI compared to VAN or PTZ monotherapy was consistent in each group. Nephrotoxic potential of agents was assumed to be equal, which is not necessarily true. Additionally, the binary representation of nephrotoxic exposure does not describe the amount of the agent received; as such, our estimations of AKI odds may be artificially elevated. Approximately one-quarter of the patients in this study were transferred from an outside hospital, for which no data regarding initial treatment are available. This may lead to exposure misclassification. We attempted to control for this factor in the regression model and found that, after controlling for other covariates, hospital transfer was associated with increasing odds of AKI. Finally, data were collected retrospectively from the electronic medical record and are subject to inaccuracies documented in the chart; however, any bias introduced should be nondifferential.
In our large retrospective study of combination empiric therapy with VAN and PTZ, we found that combination therapy was associated with more than double the odds of AKI occurring compared to either monotherapy with VAN or PTZ. Increasing duration of therapy was also associated with increases in AKI. These findings demonstrate the need for judicious use of combination therapy and strengthen the need for antimicrobial de-escalation when appropriate to avoid deleterious effects.
Acknowledgments
The authors thank Chantal Le Rutter, MPA, for copyediting services.
Disclosures
This project was supported by the National Center for Advancing Translational Sciences, National Institutes of Health, through grant numbers UL1TR000117 and UL1TR001998. The content is solely the responsibility of the authors and does not necessarily represent the official views of the NIH. The authors report no conflicts of interest.
1. van Hal SJ, Paterson DL, Lodise TP. Systematic review and meta-analysis of vancomycin-induced nephrotoxicity associated with dosing schedules that maintain troughs between 15 and 20 milligrams per liter. Antimicrob Agents Chemother. 2013;57:734-744. PubMed
2. Hanrahan TP, Harlow G, Hutchinson J, et al. Vancomycin-associated nephrotoxicity in the critically ill: a retrospective multivariate regression analysis. Crit Care Med. 2014;42:2527-2536. PubMed
3. Meaney CJ, Hynicka LM, Tsoukleris MG. Vancomycin-associated nephrotoxicity in adult medicine patients: incidence, outcomes, and risk factors. Pharmacotherapy. 2014;34:653-661. PubMed
4. Burgess LD, Drew RH. Comparison of the incidence of vancomycin-induced nephrotoxicity in hospitalized patients with and without concomitant piperacillin-tazobactam. Pharmacotherapy. 2014;34:670-676. PubMed
5. Moenster RP, Linneman TW, Finnegan PM, Hand S, Thomas Z, McDonald JR. Acute renal failure associated with vancomycin and β-lactams for the treatment of osteomyelitis in diabetics: piperacillin-tazobactam as compared with cefepime. Clin Microbiol Infect. 2014;20:O384-O389. PubMed
6. Gomes DM, Smotherman C, Birch A, et al. Comparison of acute kidney injury during treatment with vancomycin in combination with piperacillin-tazobactam or cefepime. Pharmacotherapy. 2014;34:662-669. PubMed
7. Kim T, Kandiah S, Patel M, et al. Risk factors for kidney injury during vancomycin and piperacillin/tazobactam administration, including increased odds of injury with combination therapy. BMC Res Notes. 2015;8:579. PubMed
8. Davies SW, Efird JT, Guidry CA, et al. Top guns: the “Maverick” and “Goose” of empiric therapy. Surg Infect (Larchmt). 2016;17:38-47. PubMed
9. Bellomo R, Ronco C, Kellum JA, Mehta RL, Palevsky P; Acute Dialysis Quality Initiative workgroup. Acute renal failure - definition, outcome measures, animal models, fluid therapy and information technology needs: the Second International Consensus Conference of the Acute Dialysis Quality Initiative (ADQI) Group. Crit Care. 2004;8:R204-R212. PubMed
10. Wilhelm SM, Kale-Pradhan PB. Estimating creatinine clearance: a meta-analysis. Pharmacotherapy. 2011;31:658-664. PubMed
11. Paul P, Pennell ML, Lemeshow S. Standardizing the power of the Hosmer-Lemeshow goodness of fit test in large data sets. Stat Med. 2013;32:67-80. PubMed
12. R Core Team (2014). R: A language and environment for statistical computing. R Foundation for Statistical Computing, Vienna, Austria. Available at: http://www.R-project.org/.
13. Hellwig T, Hammerquist R, Loecker B, Shields J. Retrospective evaluation of the incidence of vancomycin and/or piperacillin-tazobactam induced acute renal failure. Abstracts of the Society of Critical Care Medicine 41st Critical Care Congress. February 4-8, 2012. Houston, Texas. Crit Care Med. 2011;39:1-264.
© 2017 Society of Hospital Medicine
The Effect of Ligament Injuries on Outcomes of Operatively Treated Distal Radius Fractures
Take-Home Points
- Patients sustaining DRFs commonly have associated ligament injuries and chondral damage as well.
- Many of these associated injuries do not seem to affect outcomes up to 1 year after surgery.
- Plain radiographs have a 74% sensitivity and 73% specificity for detecting intra-articular fractures.
- ”Minor” injuries identified incidentally by arthroscopy during fixation of DRFs may not require dedicated treatment.
- The optimal treatment for high-grade ligament or chondral injuries in patients with DRFs remains incompletely understood.
Distal radius fracture (DRF) is one of the most common upper extremity injuries, with up to 20% to 50% requiring surgical fixation.1 With increasing use of wrist arthroscopy to assist in managing these fractures,2-6 it has become easier to accurately assess concomitant wrist ligament injuries. Reported injury rates are 18% to 86% for the scapholunate interosseous ligament (SLIL),7,8 5% to 29% for the lunotriquetral ligament (LTL),8,9 and 17% to 60% for the triangular fibrocartilage complex (TFCC).10,11 Reported chondral injury rates range from 18% to 60%.7,9,12 Despite the common occurrence of these injuries, it is unclear how they affect outcomes and how aggressively they should be treated when detected during fracture surgery.
As the use of arthroscopy in DRF management becomes more common, surgeons often must decide how to treat ligamentous/chondral injuries incidentally discovered during surgery. To date, only 1 study prospectively evaluated how these injuries affect DRF outcomes,8 though it did not use a validated, patient-based outcome measure.
We conducted a study to address a common clinical scenario: When arthroscopy is used to assist with intra-articular reduction during DRF fixation, how should the surgeon respond to incidentally identified ligament and chondral injuries? Specifically, we wanted to address 3 questions: What is the overall incidence of SLIL, TFCC, and chondral surface injuries in patients undergoing operative fracture fixation? On initial injury films, do any radiographic parameters predict specific soft-tissue injuries or ultimate functional outcomes? Do wrist ligament and chondral injuries affect patient-rated outcomes (disability, pain) and objective measures (range of motion [ROM], grip strength, pinch strength) up to 1 year after fracture surgery?
Materials and Methods
Patient Selection/Population
This observational, prognostic study was approved by our Institutional Review Board. Inclusion criteria were age over 18 years, isolated acute operatively treated DRF (surgery within 14 days of injury), and informed consent. All patients were treated by the same surgeon. Exclusion criteria were open DRF, dorsal shear pattern, fractures requiring dorsal arthrotomy for reduction because of significant intra-articular damage, prior ipsilateral DRF, and prior SLIL or TFCC injury.
Surgery was indicated according to general radiographic parameters as measured on postreduction films: radial height, <8 mm; radial inclination, <15°; positive ulnar variance, >3 mm, or 3 mm more than contralateral side; dorsal tilt, >10°; and volar tilt, >15°. With these parameters within acceptable limits, surgery was also indicated when fractures were deemed unstable and likely to displace because of dorsal tilt >20°, dorsal comminution, intra-articular step-off of ≥2 mm on the posterior-anterior (PA) film, associated ulnar fracture, and age >60 years.13Over a 2-year period, 42 patients (12 male, 30 female) met the inclusion criteria and were enrolled in the study. The dominant arm was affected in 17 patients (40%). Mean (SD) age at time of injury was 56.6 (16.4) years (median, 54 years; range, 20-85 years).
Operative Technique
During surgery, damage to the SLIL, the TFCC, and chondral surfaces (scaphoid, lunate, scaphoid fossa, lunate fossa) and to the intra-articular extension of the DRF was assessed and recorded. Wrist arthroscopy was performed with the 3, 4 portal as the primary portal. When significant damage to the TFCC warranted débridement, the 6R (radial) portal was used as an accessory portal. As a midcarpal portal was not used for SLIL assessment, we used a novel classification system: 0 = no injury, normal-appearing ligament without hemorrhage and smooth transition from scaphoid to lunate surface except for slight concave indentation at the ligament; 1 = attenuation, no visible tear with convex shape of ligament with or without hemorrhage; 2 = partial tear with or without step-off at junction between scaphoid and lunate, but 2.7-mm arthroscope cannot “drive through” to midcarpal joint; and 3 = complete tear with positive “drive-through” sign. TFCC injuries were classified according to the system described by Palmer14: Avulsions were central (1A), ulnar (1B), distal (1C), or radial (1D). The trampoline test was performed through a 6R portal by using a probe to evaluate ligament tension/laxity. In some cases, a 6R portal was deemed unnecessary, and a modified trampoline test was performed—tension/laxity/displacement was evaluated by manually palpating at the fovea and observing TFCC motion with the arthroscope. When appropriate, the TFCC was débrided with a shaver through the 6R portal. In cases of significant instability at the SLIL interval, two 0.062-inch K-wires were placed percutaneously through the scaphoid and lunate, and one was placed from the scaphoid to the capitate.
All DRFs underwent internal fixation with a locked volar plate. When necessary, K-wires and/or a locked radial column plate was used for additional fixation. External fixation was not used. The postoperative protocol began with a dorsal wrist splint placed on the patient in the operating room and worn for 10 to 14 days. At the first postoperative visit, the patient received a removable splint that was to be worn at all times except during showers, therapy, and home exercises. Occupational therapy, initiated the week of the first postoperative visit, consisted of active and passive ROM exercises. At 6 weeks, the splint was removed and strengthening initiated.
Outcome Measures
Our primary outcome measure was the Disabilities of the Arm, Shoulder, and Hand (DASH) questionnaire at 1 year.15 Secondary outcome measures were visual analog scale (VAS) pain rating, ROM, and radiographic measurements. Patients returned for evaluation 2, 6, 12, 24, and 52 weeks after surgery. At each follow-up visit, the DASH questionnaire and the pain VAS were administered, and ROM and strength were measured. Patient-reported pain was recorded on a standard VAS and measured on a scale from 0 (no pain) to 10 (worst possible pain). Wrist flexion and extension and radioulnar deviation were assessed with a goniometer. Forearm supination and pronation were assessed with the elbow flexed 90° at the patient’s side. Grip strength was measured with a calibrated Jamar dynamometer (Sammons Preston Rolyan), and lateral pinch strength was measured with a hydraulic pinch gauge (Sammons Preston Rolyan). The average of 3 trials for both hands was recorded for all strength measurements.
Radiographs were obtained on presentation. When appropriate, the fracture was manually reduced with a hematoma block, and postreduction radiographs were obtained. Then, radiographs were obtained at each postoperative visit until union. Radial height, radial inclination, tilt, and ulnar variance were measured on preoperative and postoperative radiographs according to standard methods.16 Radiographs were used to classify the fracture patterns according to the AO/ASIF (Arbeitsgemeinschaft für Osteosynthesefragen/Association for the Study of Internal Fixation) classification. Union was determined by radiographic healing, absence of tenderness to palpation, absence of pain with motion, and continued functional improvement.
Data Analysis
To evaluate for relationships between patient injury parameters and outcome measures, we used a 1-way analysis of variance seeking statistically significant differences between groups. Patients were divided into 4 groups: no ligament injuries; isolated SLIL injuries; isolated TFCC injuries; and both SLIL and TFCC injuries. These injury classification categories were then evaluated independently against our chosen outcome measures, which included DASH and VAS pain scores, ROM, and grip/pinch strength.
To determine the optimal sample size, we performed a power analysis to estimate the number of patients required to detect a clinically significant difference in DASH scores at 1 year among the 4 groups. According to the literature, standard deviations of DASH scores in healthy volunteers range from 10 to 15,17 consistent with values found in other recent trials of patients with DRFs.18 The recent literature on DASH construct validity has established a DASH score difference of 19 as representing a disability change being “much better or much worse.”19 As such, power analysis for a 1-way analysis of variance among 4 categories, detecting a DASH score difference of 19 with a standard deviation ranging from 10 to 15, would require 28 to 60 patients to detect a difference with an α of 0.05 and a power of 0.8.
In addition, radiographic parameters at time of injury were compared with injury characteristics to assess for significant relationships. Multivariate linear regression analysis was performed to evaluate radial height, radial inclination, and volar tilt as possible predictors of SLIL injury, TFCC injury, and chondral surface damage. A statistically significant result was defined as a correlation with P < .05.
Results
Of the 42 patients included in the study, 11 (26%) had no ligament injuries, 10 (24%) had isolated SLIL injuries, 12 (29%) had isolated TFCC injuries, and 9 (21%) had injuries to both the SLIL and the TFCC. In addition, in 12 patients (29%), the articular cartilage had visible damage (Table 1). 
In all patients, bony union occurred. After union, 1 patient underwent hardware removal for hardware-related pain. The same patient had a dorsal ulnar cutaneous nerve neurolysis at the ulnar styloid fixation site. Another patient developed a partial extensor pollicis longus tear from a prominent dorsal screw tip.
All patients returned for their 2- and 6-week follow-ups. At 1 year, 30 patients (71%) returned for follow-up, 11 could not be contacted, and 1 was removed because of an olecranon fracture from a subsequent fall.
Regarding the primary outcome measure, mean DASH score at 1-year follow-up was 30.8 for the group without injuries, 10.8 for the group with SLIL injuries, 14.7 for the group with TFCC injuries, and 21.9 for the group with SLIL and TFCC injuries (Table 2). 
Radiographic parameters were restored to acceptable limits in all patients (Table 3). 
Discussion
Use of wrist arthroscopy in DRF management has allowed assessment of the incidence of intra-articular injuries, including ligament and chondral surface injuries. Although the literature on the incidence of these injuries has been expanding, their clinical significance remains unclear.
Authors have postulated that some patients do not do well after DRF repair because of undetected ligament injuries. With the current trend of internal fixation, locked plating, and early motion—contrasting with older trends of prolonged immobilization in a cast or external fixation—concerns have been raised that early mobilization results in inadequate treatment of ligament injuries. However, data from the present study suggest no significant morbidity from early mobilization despite the presence of ligament injuries in more than half of all operatively treated DRFs. It is possible morbidity was not appreciated, as most patients with DRFs end up with some stiffness, which masks the effects of ligament injuries during healing.
We found no correlation between injury radiographic parameters, observed soft-tissue injuries, or final subjective outcomes. Interestingly, in this study, there was some discordance between the appearance of intra-articular fractures on radiographs and the direct arthroscopic observation of intra-articular fracture extension. With the present data and with arthroscopic visualization as the gold standard, radiographs had 74% sensitivity and 73% specificity for detecting intra-articular fractures (the corresponding positive predictive value was 83%, and the negative predictive value was 61%). As we typically rely on radiographs as the primary tool in assessing the articular component of a fracture, these results should be taken into account when basing management decisions exclusively on static injury films.
Observational studies of arthroscopy in DRFs have revealed a wide range of injury rates: For SLILs, the average injury rate was 44%; for LTLs, 13%; for TFCCs, 43%; and for chondral surfaces, 32% (Table 4). 
This study had several limitations, including loss to follow-up at the primary endpoint (we were unable to contact 29% of patients). In addition, because of resource limitations, we were able to enroll only a limited number of patients, and as a result were able to power the study to detect only major effects on DASH scores. Therefore, although our 32 patients with long-term follow-up are within the range dictated by the power analysis, this study was not powered to capture more subtle differences in disability. Furthermore, because we used 1 year as the longest follow-up point, the long-term sequelae (eg, arthritis) of these injuries may not have been captured. Last, despite the high incidence of soft-tissue injuries overall, the number of patients with severe ligament injuries was relatively low, which makes it difficult to make definitive statements about their contribution to outcomes. A likely explanation is that patients with high-energy injuries and significant intra-articular displacement requiring open arthrotomies were excluded.
At 1-year follow-up, with use of DASH as the gold standard for disability, we found no major difference in subjective or objective outcome measures between patients with and without ligament injuries. Radiographs did not predict soft-tissue injury or ultimate outcome. Rates of ligament injuries in our operatively treated DRFs were similar to those in the literature. Overall, these findings suggest that “minor” injuries incidentally discovered with arthroscopy during DRF surgery may not have a significant effect on outcomes, with the caveat that the significance of very severe injuries (eg, Geissler grade 4 injuries with frank scapholunate diastasis) remains incompletely understood. The decision by the treating surgeon to perform arthroscopy and/or to repair soft-tissue injuries should be made on a case-by-case basis.
Am J Orthop. 2017;46(1):E41-E46. Copyright Frontline Medical Communications Inc. 2017. All rights reserved.
1. Róbertsson GO, Jónsson GT, Sigurjónsson K. Epidemiology of distal radius fractures in Iceland in 1985. Acta Orthop Scand. 1990;61(5):457-459.
2. Geissler WB. Arthroscopically assisted reduction of intra-articular fractures of the distal radius. Hand Clin. 1995;11(1):19-29.
3. Trybus M, Guzik P. The economic impact of hand injury [in Polish]. Chir Narzadow Ruchu Ortop Pol. 2003;68(4):269-273.
4. Wolfe SW, Easterling KJ, Yoo HH. Arthroscopic-assisted reduction of distal radius fractures. Arthroscopy. 1995;11(6):706-714.
5. Chung KC, Spilson SV. The frequency and epidemiology of hand and forearm fractures in the United States. J Hand Surg Am. 2001;26(5):908-915.
6. Doi K, Hattori Y, Otsuka K, Abe Y, Yamamoto H. Intra-articular fractures of the distal aspect of the radius: arthroscopically assisted reduction compared with open reduction and internal fixation. J Bone Joint Surg Am. 1999;81(8):1093-1110.
7. Shih JT, Lee HM, Hou YT, Tan CM. Arthroscopically-assisted reduction of intra-articular fractures and soft tissue management of distal radius. Hand Surg. 2001;6(2):127-135.
8. Forward DP, Lindau TR, Melsom DS. Intercarpal ligament injuries associated with fractures of the distal part of the radius. J Bone Joint Surg Am. 2007;89(11):2334-2340.
9. Espinosa-Gutiérrez A, Rivas-Montero JA, Elias-Escobedo A, Alisedo-Ochoa PG. Wrist arthroscopy for fractures of the distal end of the radius [in Spanish]. Acta Ortop Mex. 2009;23(6):358-365.
10. Hardy P, Gomes N, Chebil M, Bauer T. Wrist arthroscopy and intra-articular fractures of the distal radius in young adults. Knee Surg Sports Traumatol Arthrosc. 2006;14(11):1225-1230.
11. Varitimidis SE, Basdekis GK, Dailiana ZH, Hantes ME, Bargiotas K, Malizos K. Treatment of intra-articular fractures of the distal radius: fluoroscopic or arthroscopic reduction? J Bone Joint Surg Br. 2008;90(6):778-785.
12. Kordasiewicz B, Pomianowski S, Rylski W, Antolak L, Marczak D. Intraarticular distal radius fractures—arthroscopic assessment of injuries [in Polish]. Chir Narzadow Ruchu Ortop Pol. 2006;71(2):113-116.
13. Lafontaine M, Hardy D, Delince P. Stability assessment of distal radius fractures. Injury. 1989;20(4):208-210.
14. Palmer AK. Triangular fibrocartilage complex lesions: a classification. J Hand Surg Am. 1989;14(4):594-606.
15. Hudak PL, Amadio PC, Bombardier C. Development of an upper extremity outcome measure: the DASH (Disabilities of the Arm, Shoulder and Hand) [corrected]. The Upper Extremity Collaborative Group (UECG) [published correction appears in Am J Ind Med. 1996;30(3):372]. Am J Ind Med. 1996;29(6):602-608.
16. Fernandez DL, Jupiter JB. Fractures of the Distal Radius: A Practical Approach to Management. New York, NY: Springer; 1996.
17. Jester A, Harth A, Wind G, Germann G, Sauerbier M. Does the Disability of Shoulder, Arm and Hand questionnaire (DASH) replace grip strength and range of motion in outcome-evaluation? [in German]. Handchir Mikrochir Plast Chir. 2005;37(2):126-130.
18. Wei DH, Raizman NM, Bottino CJ, Jobin CM, Strauch RJ, Rosenwasser MP. Unstable distal radial fractures treated with external fixation, a radial column plate, or a volar plate. A prospective randomized trial. J Bone Joint Surg Am. 2009;91(7):1568-1577.
19. Gummesson C, Atroshi I, Ekdahl C. The Disabilities of the Arm, Shoulder and Hand (DASH) outcome questionnaire: longitudinal construct validity and measuring self-rated health change after surgery. BMC Musculoskelet Disord. 2003;4:11.
20. Richards RS, Bennett JD, Roth JH, Milne K Jr. Arthroscopic diagnosis of intra-articular soft tissue injuries associated with distal radial fractures. J Hand Surg Am. 1997;22(5):772-776.
21. Peicha G, Seibert F, Fellinger M, Grechenig W. Midterm results of arthroscopic treatment of scapholunate ligament lesions associated with intra-articular distal radius fractures. Knee Surg Sports Traumatol Arthrosc. 1999;7(5):327-333.
22. Schädel-Höpfner M, Böhringer G, Junge A, Celik I, Gotzen L. [Arthroscopic diagnosis of concomitant scapholunate ligament injuries in fractures of the distal radius]. Handchir Mikrochir Plast Chir. 2001;33(4):229-233.
23. Ruch DS, Yang CC, Smith BP. Results of acute arthroscopically repaired triangular fibrocartilage complex injuries associated with intra-articular distal radius fractures. Arthroscopy. 2003;19(5):511-516.
24. Hattori Y, Doi K, Estrella EP, Chen G. Arthroscopically assisted reduction with volar plating or external fixation for displaced intra-articular fractures of the distal radius in the elderly patients. Hand Surg. 2007;12(1):1-12.
25. Hohendorff B, Eck M, Mühldorfer M, Fodor S, Schmitt R, Prommersberger KJ. [Palmar wrist arthroscopy for evaluation of concomitant carpal lesions in operative treatment of distal intraarticular radius fractures]. Handchir Mikrochir Plast Chir. 2009;41(5):295-299.
Take-Home Points
- Patients sustaining DRFs commonly have associated ligament injuries and chondral damage as well.
- Many of these associated injuries do not seem to affect outcomes up to 1 year after surgery.
- Plain radiographs have a 74% sensitivity and 73% specificity for detecting intra-articular fractures.
- ”Minor” injuries identified incidentally by arthroscopy during fixation of DRFs may not require dedicated treatment.
- The optimal treatment for high-grade ligament or chondral injuries in patients with DRFs remains incompletely understood.
Distal radius fracture (DRF) is one of the most common upper extremity injuries, with up to 20% to 50% requiring surgical fixation.1 With increasing use of wrist arthroscopy to assist in managing these fractures,2-6 it has become easier to accurately assess concomitant wrist ligament injuries. Reported injury rates are 18% to 86% for the scapholunate interosseous ligament (SLIL),7,8 5% to 29% for the lunotriquetral ligament (LTL),8,9 and 17% to 60% for the triangular fibrocartilage complex (TFCC).10,11 Reported chondral injury rates range from 18% to 60%.7,9,12 Despite the common occurrence of these injuries, it is unclear how they affect outcomes and how aggressively they should be treated when detected during fracture surgery.
As the use of arthroscopy in DRF management becomes more common, surgeons often must decide how to treat ligamentous/chondral injuries incidentally discovered during surgery. To date, only 1 study prospectively evaluated how these injuries affect DRF outcomes,8 though it did not use a validated, patient-based outcome measure.
We conducted a study to address a common clinical scenario: When arthroscopy is used to assist with intra-articular reduction during DRF fixation, how should the surgeon respond to incidentally identified ligament and chondral injuries? Specifically, we wanted to address 3 questions: What is the overall incidence of SLIL, TFCC, and chondral surface injuries in patients undergoing operative fracture fixation? On initial injury films, do any radiographic parameters predict specific soft-tissue injuries or ultimate functional outcomes? Do wrist ligament and chondral injuries affect patient-rated outcomes (disability, pain) and objective measures (range of motion [ROM], grip strength, pinch strength) up to 1 year after fracture surgery?
Materials and Methods
Patient Selection/Population
This observational, prognostic study was approved by our Institutional Review Board. Inclusion criteria were age over 18 years, isolated acute operatively treated DRF (surgery within 14 days of injury), and informed consent. All patients were treated by the same surgeon. Exclusion criteria were open DRF, dorsal shear pattern, fractures requiring dorsal arthrotomy for reduction because of significant intra-articular damage, prior ipsilateral DRF, and prior SLIL or TFCC injury.
Surgery was indicated according to general radiographic parameters as measured on postreduction films: radial height, <8 mm; radial inclination, <15°; positive ulnar variance, >3 mm, or 3 mm more than contralateral side; dorsal tilt, >10°; and volar tilt, >15°. With these parameters within acceptable limits, surgery was also indicated when fractures were deemed unstable and likely to displace because of dorsal tilt >20°, dorsal comminution, intra-articular step-off of ≥2 mm on the posterior-anterior (PA) film, associated ulnar fracture, and age >60 years.13Over a 2-year period, 42 patients (12 male, 30 female) met the inclusion criteria and were enrolled in the study. The dominant arm was affected in 17 patients (40%). Mean (SD) age at time of injury was 56.6 (16.4) years (median, 54 years; range, 20-85 years).
Operative Technique
During surgery, damage to the SLIL, the TFCC, and chondral surfaces (scaphoid, lunate, scaphoid fossa, lunate fossa) and to the intra-articular extension of the DRF was assessed and recorded. Wrist arthroscopy was performed with the 3, 4 portal as the primary portal. When significant damage to the TFCC warranted débridement, the 6R (radial) portal was used as an accessory portal. As a midcarpal portal was not used for SLIL assessment, we used a novel classification system: 0 = no injury, normal-appearing ligament without hemorrhage and smooth transition from scaphoid to lunate surface except for slight concave indentation at the ligament; 1 = attenuation, no visible tear with convex shape of ligament with or without hemorrhage; 2 = partial tear with or without step-off at junction between scaphoid and lunate, but 2.7-mm arthroscope cannot “drive through” to midcarpal joint; and 3 = complete tear with positive “drive-through” sign. TFCC injuries were classified according to the system described by Palmer14: Avulsions were central (1A), ulnar (1B), distal (1C), or radial (1D). The trampoline test was performed through a 6R portal by using a probe to evaluate ligament tension/laxity. In some cases, a 6R portal was deemed unnecessary, and a modified trampoline test was performed—tension/laxity/displacement was evaluated by manually palpating at the fovea and observing TFCC motion with the arthroscope. When appropriate, the TFCC was débrided with a shaver through the 6R portal. In cases of significant instability at the SLIL interval, two 0.062-inch K-wires were placed percutaneously through the scaphoid and lunate, and one was placed from the scaphoid to the capitate.
All DRFs underwent internal fixation with a locked volar plate. When necessary, K-wires and/or a locked radial column plate was used for additional fixation. External fixation was not used. The postoperative protocol began with a dorsal wrist splint placed on the patient in the operating room and worn for 10 to 14 days. At the first postoperative visit, the patient received a removable splint that was to be worn at all times except during showers, therapy, and home exercises. Occupational therapy, initiated the week of the first postoperative visit, consisted of active and passive ROM exercises. At 6 weeks, the splint was removed and strengthening initiated.
Outcome Measures
Our primary outcome measure was the Disabilities of the Arm, Shoulder, and Hand (DASH) questionnaire at 1 year.15 Secondary outcome measures were visual analog scale (VAS) pain rating, ROM, and radiographic measurements. Patients returned for evaluation 2, 6, 12, 24, and 52 weeks after surgery. At each follow-up visit, the DASH questionnaire and the pain VAS were administered, and ROM and strength were measured. Patient-reported pain was recorded on a standard VAS and measured on a scale from 0 (no pain) to 10 (worst possible pain). Wrist flexion and extension and radioulnar deviation were assessed with a goniometer. Forearm supination and pronation were assessed with the elbow flexed 90° at the patient’s side. Grip strength was measured with a calibrated Jamar dynamometer (Sammons Preston Rolyan), and lateral pinch strength was measured with a hydraulic pinch gauge (Sammons Preston Rolyan). The average of 3 trials for both hands was recorded for all strength measurements.
Radiographs were obtained on presentation. When appropriate, the fracture was manually reduced with a hematoma block, and postreduction radiographs were obtained. Then, radiographs were obtained at each postoperative visit until union. Radial height, radial inclination, tilt, and ulnar variance were measured on preoperative and postoperative radiographs according to standard methods.16 Radiographs were used to classify the fracture patterns according to the AO/ASIF (Arbeitsgemeinschaft für Osteosynthesefragen/Association for the Study of Internal Fixation) classification. Union was determined by radiographic healing, absence of tenderness to palpation, absence of pain with motion, and continued functional improvement.
Data Analysis
To evaluate for relationships between patient injury parameters and outcome measures, we used a 1-way analysis of variance seeking statistically significant differences between groups. Patients were divided into 4 groups: no ligament injuries; isolated SLIL injuries; isolated TFCC injuries; and both SLIL and TFCC injuries. These injury classification categories were then evaluated independently against our chosen outcome measures, which included DASH and VAS pain scores, ROM, and grip/pinch strength.
To determine the optimal sample size, we performed a power analysis to estimate the number of patients required to detect a clinically significant difference in DASH scores at 1 year among the 4 groups. According to the literature, standard deviations of DASH scores in healthy volunteers range from 10 to 15,17 consistent with values found in other recent trials of patients with DRFs.18 The recent literature on DASH construct validity has established a DASH score difference of 19 as representing a disability change being “much better or much worse.”19 As such, power analysis for a 1-way analysis of variance among 4 categories, detecting a DASH score difference of 19 with a standard deviation ranging from 10 to 15, would require 28 to 60 patients to detect a difference with an α of 0.05 and a power of 0.8.
In addition, radiographic parameters at time of injury were compared with injury characteristics to assess for significant relationships. Multivariate linear regression analysis was performed to evaluate radial height, radial inclination, and volar tilt as possible predictors of SLIL injury, TFCC injury, and chondral surface damage. A statistically significant result was defined as a correlation with P < .05.
Results
Of the 42 patients included in the study, 11 (26%) had no ligament injuries, 10 (24%) had isolated SLIL injuries, 12 (29%) had isolated TFCC injuries, and 9 (21%) had injuries to both the SLIL and the TFCC. In addition, in 12 patients (29%), the articular cartilage had visible damage (Table 1).
In all patients, bony union occurred. After union, 1 patient underwent hardware removal for hardware-related pain. The same patient had a dorsal ulnar cutaneous nerve neurolysis at the ulnar styloid fixation site. Another patient developed a partial extensor pollicis longus tear from a prominent dorsal screw tip.
All patients returned for their 2- and 6-week follow-ups. At 1 year, 30 patients (71%) returned for follow-up, 11 could not be contacted, and 1 was removed because of an olecranon fracture from a subsequent fall.
Regarding the primary outcome measure, mean DASH score at 1-year follow-up was 30.8 for the group without injuries, 10.8 for the group with SLIL injuries, 14.7 for the group with TFCC injuries, and 21.9 for the group with SLIL and TFCC injuries (Table 2).
Radiographic parameters were restored to acceptable limits in all patients (Table 3).
Discussion
Use of wrist arthroscopy in DRF management has allowed assessment of the incidence of intra-articular injuries, including ligament and chondral surface injuries. Although the literature on the incidence of these injuries has been expanding, their clinical significance remains unclear.
Authors have postulated that some patients do not do well after DRF repair because of undetected ligament injuries. With the current trend of internal fixation, locked plating, and early motion—contrasting with older trends of prolonged immobilization in a cast or external fixation—concerns have been raised that early mobilization results in inadequate treatment of ligament injuries. However, data from the present study suggest no significant morbidity from early mobilization despite the presence of ligament injuries in more than half of all operatively treated DRFs. It is possible morbidity was not appreciated, as most patients with DRFs end up with some stiffness, which masks the effects of ligament injuries during healing.
We found no correlation between injury radiographic parameters, observed soft-tissue injuries, or final subjective outcomes. Interestingly, in this study, there was some discordance between the appearance of intra-articular fractures on radiographs and the direct arthroscopic observation of intra-articular fracture extension. With the present data and with arthroscopic visualization as the gold standard, radiographs had 74% sensitivity and 73% specificity for detecting intra-articular fractures (the corresponding positive predictive value was 83%, and the negative predictive value was 61%). As we typically rely on radiographs as the primary tool in assessing the articular component of a fracture, these results should be taken into account when basing management decisions exclusively on static injury films.
Observational studies of arthroscopy in DRFs have revealed a wide range of injury rates: For SLILs, the average injury rate was 44%; for LTLs, 13%; for TFCCs, 43%; and for chondral surfaces, 32% (Table 4).
This study had several limitations, including loss to follow-up at the primary endpoint (we were unable to contact 29% of patients). In addition, because of resource limitations, we were able to enroll only a limited number of patients, and as a result were able to power the study to detect only major effects on DASH scores. Therefore, although our 32 patients with long-term follow-up are within the range dictated by the power analysis, this study was not powered to capture more subtle differences in disability. Furthermore, because we used 1 year as the longest follow-up point, the long-term sequelae (eg, arthritis) of these injuries may not have been captured. Last, despite the high incidence of soft-tissue injuries overall, the number of patients with severe ligament injuries was relatively low, which makes it difficult to make definitive statements about their contribution to outcomes. A likely explanation is that patients with high-energy injuries and significant intra-articular displacement requiring open arthrotomies were excluded.
At 1-year follow-up, with use of DASH as the gold standard for disability, we found no major difference in subjective or objective outcome measures between patients with and without ligament injuries. Radiographs did not predict soft-tissue injury or ultimate outcome. Rates of ligament injuries in our operatively treated DRFs were similar to those in the literature. Overall, these findings suggest that “minor” injuries incidentally discovered with arthroscopy during DRF surgery may not have a significant effect on outcomes, with the caveat that the significance of very severe injuries (eg, Geissler grade 4 injuries with frank scapholunate diastasis) remains incompletely understood. The decision by the treating surgeon to perform arthroscopy and/or to repair soft-tissue injuries should be made on a case-by-case basis.
Am J Orthop. 2017;46(1):E41-E46. Copyright Frontline Medical Communications Inc. 2017. All rights reserved.
1. Róbertsson GO, Jónsson GT, Sigurjónsson K. Epidemiology of distal radius fractures in Iceland in 1985. Acta Orthop Scand. 1990;61(5):457-459.
2. Geissler WB. Arthroscopically assisted reduction of intra-articular fractures of the distal radius. Hand Clin. 1995;11(1):19-29.
3. Trybus M, Guzik P. The economic impact of hand injury [in Polish]. Chir Narzadow Ruchu Ortop Pol. 2003;68(4):269-273.
4. Wolfe SW, Easterling KJ, Yoo HH. Arthroscopic-assisted reduction of distal radius fractures. Arthroscopy. 1995;11(6):706-714.
5. Chung KC, Spilson SV. The frequency and epidemiology of hand and forearm fractures in the United States. J Hand Surg Am. 2001;26(5):908-915.
6. Doi K, Hattori Y, Otsuka K, Abe Y, Yamamoto H. Intra-articular fractures of the distal aspect of the radius: arthroscopically assisted reduction compared with open reduction and internal fixation. J Bone Joint Surg Am. 1999;81(8):1093-1110.
7. Shih JT, Lee HM, Hou YT, Tan CM. Arthroscopically-assisted reduction of intra-articular fractures and soft tissue management of distal radius. Hand Surg. 2001;6(2):127-135.
8. Forward DP, Lindau TR, Melsom DS. Intercarpal ligament injuries associated with fractures of the distal part of the radius. J Bone Joint Surg Am. 2007;89(11):2334-2340.
9. Espinosa-Gutiérrez A, Rivas-Montero JA, Elias-Escobedo A, Alisedo-Ochoa PG. Wrist arthroscopy for fractures of the distal end of the radius [in Spanish]. Acta Ortop Mex. 2009;23(6):358-365.
10. Hardy P, Gomes N, Chebil M, Bauer T. Wrist arthroscopy and intra-articular fractures of the distal radius in young adults. Knee Surg Sports Traumatol Arthrosc. 2006;14(11):1225-1230.
11. Varitimidis SE, Basdekis GK, Dailiana ZH, Hantes ME, Bargiotas K, Malizos K. Treatment of intra-articular fractures of the distal radius: fluoroscopic or arthroscopic reduction? J Bone Joint Surg Br. 2008;90(6):778-785.
12. Kordasiewicz B, Pomianowski S, Rylski W, Antolak L, Marczak D. Intraarticular distal radius fractures—arthroscopic assessment of injuries [in Polish]. Chir Narzadow Ruchu Ortop Pol. 2006;71(2):113-116.
13. Lafontaine M, Hardy D, Delince P. Stability assessment of distal radius fractures. Injury. 1989;20(4):208-210.
14. Palmer AK. Triangular fibrocartilage complex lesions: a classification. J Hand Surg Am. 1989;14(4):594-606.
15. Hudak PL, Amadio PC, Bombardier C. Development of an upper extremity outcome measure: the DASH (Disabilities of the Arm, Shoulder and Hand) [corrected]. The Upper Extremity Collaborative Group (UECG) [published correction appears in Am J Ind Med. 1996;30(3):372]. Am J Ind Med. 1996;29(6):602-608.
16. Fernandez DL, Jupiter JB. Fractures of the Distal Radius: A Practical Approach to Management. New York, NY: Springer; 1996.
17. Jester A, Harth A, Wind G, Germann G, Sauerbier M. Does the Disability of Shoulder, Arm and Hand questionnaire (DASH) replace grip strength and range of motion in outcome-evaluation? [in German]. Handchir Mikrochir Plast Chir. 2005;37(2):126-130.
18. Wei DH, Raizman NM, Bottino CJ, Jobin CM, Strauch RJ, Rosenwasser MP. Unstable distal radial fractures treated with external fixation, a radial column plate, or a volar plate. A prospective randomized trial. J Bone Joint Surg Am. 2009;91(7):1568-1577.
19. Gummesson C, Atroshi I, Ekdahl C. The Disabilities of the Arm, Shoulder and Hand (DASH) outcome questionnaire: longitudinal construct validity and measuring self-rated health change after surgery. BMC Musculoskelet Disord. 2003;4:11.
20. Richards RS, Bennett JD, Roth JH, Milne K Jr. Arthroscopic diagnosis of intra-articular soft tissue injuries associated with distal radial fractures. J Hand Surg Am. 1997;22(5):772-776.
21. Peicha G, Seibert F, Fellinger M, Grechenig W. Midterm results of arthroscopic treatment of scapholunate ligament lesions associated with intra-articular distal radius fractures. Knee Surg Sports Traumatol Arthrosc. 1999;7(5):327-333.
22. Schädel-Höpfner M, Böhringer G, Junge A, Celik I, Gotzen L. [Arthroscopic diagnosis of concomitant scapholunate ligament injuries in fractures of the distal radius]. Handchir Mikrochir Plast Chir. 2001;33(4):229-233.
23. Ruch DS, Yang CC, Smith BP. Results of acute arthroscopically repaired triangular fibrocartilage complex injuries associated with intra-articular distal radius fractures. Arthroscopy. 2003;19(5):511-516.
24. Hattori Y, Doi K, Estrella EP, Chen G. Arthroscopically assisted reduction with volar plating or external fixation for displaced intra-articular fractures of the distal radius in the elderly patients. Hand Surg. 2007;12(1):1-12.
25. Hohendorff B, Eck M, Mühldorfer M, Fodor S, Schmitt R, Prommersberger KJ. [Palmar wrist arthroscopy for evaluation of concomitant carpal lesions in operative treatment of distal intraarticular radius fractures]. Handchir Mikrochir Plast Chir. 2009;41(5):295-299.
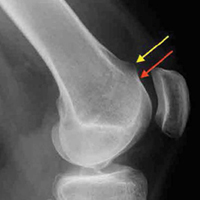
Rates of Deep Vein Thrombosis Occurring After Osteotomy About the Knee
Take-Home Points
- DVT and PE are uncommon complications following osteotomies about the knee.
- Use of oral contraceptives can increase the risk of a patient sustaining a postoperative DVT and PE following osteotomies about the knee.
- In the absence of significant risk factors, postoperative chemical DVT prophylaxis may be unnecessary in patients undergoing osteotomies about the knee.
High tibial osteotomy (HTO), distal femoral osteotomy (DFO), and tibial tubercle osteotomy (TTO) are viable treatment options for deformities about the knee and patella maltracking.1-4 Although TTO can be performed in many ways (eg, anteriorization, anteromedialization, medialization), the basic idea is to move the tibial tubercle to improve patellar tracking or to offload a patellar facet that has sustained trauma or degenerated.2 DFO is a surgical option for treating a valgus knee deformity (the lateral tibiofemoral compartment is offloaded) or for protecting a knee compartment after cartilage or meniscal restoration (medial closing wedge or lateral opening wedge).1 Similarly, HTO is an option for treating a varus knee deformity or isolated medial compartment arthritis; the diseased compartment is offloaded, and any malalignment is corrected. Akin to DFO, HTO is often performed to protect a knee compartment, typically the medial tibiofemoral compartment, after cartilage or meniscal restoration.2-4
Compared to most arthroscopic knee surgeries, these osteotomies are much more involved, have longer operative times, and restrict postoperative weight-bearing and range of motion.2-4 The rates of deep vein thrombosis (DVT) and pulmonary embolism (PE) after these osteotomies are not well documented. In addition, there is no documentation of the risks in patients who smoke, are obese, or are using oral contraceptives (OCs) at time of surgery, despite the increased DVT and PE risks posed by smoking, obesity, and OC use in other surgical procedures.5-7 Although the American Academy of Orthopaedic Surgeons (AAOS) issued clinical practice guidelines for DVT/PE prophylaxis after hip and knee arthroplasty, there is no standard prophylaxis guidelines for DVT/PE prevention after HTO, DFO, or TTO.8,9 Last, rates of DVT after total knee arthroplasty (TKA) are well defined; they range from 2% to 12%.10,11 These rates may be surrogates for osteotomies about the knee, but this is only conjecture.
We conducted a study to determine the rates of symptomatic DVT and PE after HTO, DFO, or TTO in patients who did not receive postoperative DVT/PE prophylaxis. We also wanted to determine if age, body mass index (BMI), and smoking status have associations with the risk of developing either DVT or PE after HTO, DFO, or TTO. We hypothesized that the DVT and PE rates would both be <1%.
Methods
After this study was approved by our university’s Institutional Review Board, we searched the surgical database of Dr. Cole, a sports medicine fellowship–trained surgeon, to identify all patients who had HTO, DFO, or TTO performed between September 1, 2009 and September 30, 2014. Current Procedural Terminology (CPT) codes were used for the search. The code for HTO was 27457: osteotomy, proximal tibia, including fibular excision or osteotomy (includes correction of genu varus [bowleg] or genu valgus [knock-knee]); after epiphyseal closure). The code for DFO was 27450: osteotomy, femur, shaft or supracondylar; with fixation. Last, the code for TTO was 27418: anterior tibial tubercleplasty (eg, Maquet-type procedure). The 141 patients identified in the search were treated by Dr. Cole at a single institution and were included in the study. Study inclusion did not require a minimum follow-up. Follow-up duration was defined as the time between surgery and the final clinic note in the patient chart. No patient was excluded for lack of follow-up clinic visits, and none was lost to follow-up.
Age, BMI, smoking status, and OC use were recorded for all patients. For each procedure, the surgeon’s technique remained the same throughout the study period: HTO, medial opening-wedge osteotomy with plate-and-screw fixation; DFO, lateral opening-wedge osteotomy with plate-and-screw fixation; and TTO, mostly anteromedialization with screw fixation (though this was dictated by patellar contact pressures). A tourniquet was used in all cases. Each patient’s hospital electronic medical record and outpatient office notes were reviewed to determine if symptomatic DVT or PE developed after surgery. The diagnosis of symptomatic DVT was based on clinical symptoms and confirmatory ultrasound, and the PE diagnosis was based on computed tomography. Doppler ultrasound was performed only in symptomatic patients (ie, it was not routinely performed).
Per surgeon protocol, postoperative DVT prophylaxis was not administered. Patients were encouraged to begin dorsiflexion and plantar flexion of the ankle (ankle pumps) immediately and to mobilize as soon as comfortable. Each patient received a cold therapy machine with compression sleeve. Patients were allowed toe-touch weight-bearing for 6 weeks, and then progressed 25% per week for 4 weeks to full weight-bearing by 10 weeks. After surgery, each patient was placed in a brace, which was kept locked in extension for 10 days; when the brace was unlocked, the patient was allowed to range the knee.
Continuous variable data are reported as weighted means and weighted standard deviations. Categorical variable data are reported as frequencies and percentages.
Results
Our database search identified 141 patients (44% male, 56% female) who underwent HTO (47 patients, 33.3%), DFO (13 patients, 9.2%), or TTO (81 patients, 57.5%). Mean (SD) age was 34.28 (9.86) years, mean (SD) BMI was 26.88 (5.11) kg/m2, and mean (SD) follow-up was 17.1 (4.1) months. Of the female patients, 36.7% were using OCs at time of surgery. Of all patients, 13.48% were smokers.
Two patients (1.42%) had clinical symptoms consistent with DVT. In each case, the diagnosis was confirmed with Doppler ultrasound. The below-knee DVT was unilateral in 1 case and bilateral in the other. 
The unilateral DVT occurred in a patient who underwent anteromedialization of the tibial tubercle and osteochondral allograft transfer to the lateral femoral condyle for patellar maltracking and a focal trochlear defect. The DVT was diagnosed 8 days after surgery and was treated with warfarin. Low-molecular-weight heparin (LMWH) was used as a bridge until the warfarin level was therapeutic (4 days). This male patient had no significant medical history.
The bilateral DVT with PE occurred in a patient who underwent a medial opening-wedge HTO for a varus deformity with right medial compartment osteoarthritis and a meniscal tear. The DVT and PE were diagnosed 48 hours after surgery, when the patient complained of lightheadedness and lost consciousness. She had no medical problems but was using OCs at time of surgery. The patient died 3 days after surgery and subsequently was found to have a maternal-side family history of DVT (the patient and her family physician had been unaware of this history).
Discussion
As the rates of DVT and PE after osteotomies about the knee have not been well studied, we wanted to determine these rates after HTO, DFO, and TTO in patients who did not receive postoperative DVT prophylaxis. We hypothesized that DVT and PE rates would both be <1%, and this hypothesis was partly confirmed: The rate of PE after HTO, DFO, and TTO was <1%, and the rate of symptomatic DVT was >1%. Similarly, the patients who developed these complications were nonsmokers and had a BMI no higher than that of the patients who did not develop DVT or PE. In addition, only 1 patient developed DVT and PE, and she was using OCs and had a family history of DVT. Last, the patients who developed these complications were on average 14 years older than the patients who did not develop DVT or PE.
Although there is a plethora of reports on the incidence of DVT and PE after TKA, there is little on the incidence after osteotomies about the knee.8,12 The rate of DVT after TKA varies, but many studies place it between 2% and 12%, and routinely find a PE rate of <0.5%.10,11,13,14 Although the AAOS issued a clinical practice guideline for postoperative DVT prophylaxis after TKA, and evaluated the best available evidence, it could not reach consensus on a specific type of DVT prophylaxis, though the workgroup did recommend that patients be administered postoperative DVT prophylaxis of some kind.8,9 Similarly, the American College of Chest Physicians (ACCP) issued clinical practice guidelines for preventing DVT and PE after elective TKA and total hip arthroplasty.15 According to the ACCP guidelines, patients should receive prophylaxis—LMWH, fondaparinux, apixaban, dabigatran, rivaroxaban, low-dose unfractionated heparin, adjusted-dose vitamin K antagonist, aspirin, or an intermittent pneumatic compression device—for a minimum of 14 days. Unfortunately, though there are similarities between TKAs and peri-knee osteotomies, these procedures are markedly different, and it is difficult to extrapolate and adapt recommendations and produce a consensus statement for knee arthroplasties. In addition, guidelines exist for hospitalized patients who are being treated for medical conditions or have undergone surgery, but all the patients in the present study had their osteotomies performed on an outpatient basis.
Martin and colleagues16 reviewed 323 cases of medial opening-wedge HTO and found a DVT rate of 1.4% in the absence of routine DVT prophylaxis, except in patients with a history of DVT. Their rate is almost identical to ours, but we also included other osteotomies in our study. Miller and colleagues17 reviewed 46 cases of medial opening-wedge HTO and found a 4.3% DVT rate, despite routine prophylaxis with once-daily 325-mg aspirin and ankle pumps. This finding contrasts with our 1.42% DVT rate in the absence of postoperative chemical DVT prophylaxis. Motycka and colleagues18 reviewed 65 HTO cases in which DVT prophylaxis (oral anticoagulant) was given for 6 weeks, and they found a DVT rate of 9.7%. Turner and colleagues19 performed venous ultrasound on 81 consecutive patients who underwent HTO and received DVT prophylaxis (twice-daily subcutaneous heparin), and they found a DVT rate of 41% and a PE rate of 1.2%, though only 8.6% of the DVT cases were symptomatic. Of note, whereas the lowest postoperative DVT rate was for patients who did not receive postoperative DVT prophylaxis, the rate of symptomatic DVT after these osteotomies ranged from 1.4% to 8.6% in patients who received prophylaxis.16,19 Given this evidence and our study results, it appears routine chemical DVT prophylaxis after osteotomies about the knee may not be necessary, though higher level evidence is needed in order to make definitive recommendations.
In the present study, the 2 patients who developed symptomatic DVT (1 subsequently developed PE) were nonsmokers in good health. The female patient (DVT plus PE) was using OCs at time of surgery. Studies have shown that patients who smoke and who use OCs are at increased risk for developing DVT or PE after surgery.5,6,12 Given that only 2 of our patients developed DVT/PE, and neither was a smoker, smoking was not associated with increased DVT or PE risk in this study population, in which 13.48% of patients were smokers at time of surgery. In addition, given that the 1 female patient who developed DVT/PE was using OCs and that 36.7% of all female patients in the study were using OCs, it is difficult to conclude whether OC use increased the female patient’s risk for DVT or PE. Furthermore, neither the literature nor the AAOS consensus statement supports discontinuing OCs for this surgical procedure.
Patients in this study did not receive chemical or mechanical DVT prophylaxis after surgery. Regarding various post-TKA DVT prophylaxis regimens, aspirin is as effective as LMWH in preventing DVT, and the risk for postoperative blood loss and wound complications is lower with aspirin than with rivaroxaban.20,21 Given that the present study’s postoperative rates of DVT (1.42%) and PE (0.71%) are equal to or less than rates already reported in the literature, routine DVT prophylaxis after osteotomies about the knee may be unnecessary in the absence of other significant risk factors.16,19 However, our study considered only symptomatic DVT and PE, so it is possible that the number of asymptomatic DVT cases is higher in this patient population. Definitively answering our study’s clinical question will require a multicenter registry study (prospective cohort study).
Study Limitations
The strengths of this study include the large number of patients treated by a single surgeon using the same postoperative protocol. Limitations of this study include the lack of a control group. Although we found a DVT rate of 1.42% and a PE rate of 0.71%, the literature on the accepted risks for DVT and PE after HTO, DFO, and TTO is unclear. With our results stratified by procedure, the DVT rate was 2% in the HTO group, 0% in the DFO group, and 1% in the TTO group. However, we were unable to reliably stratify these results by each specific procedure, as the number of patients in each group would be too low. This study involved reviewing charts; as patients were not contacted, it is possible a patient developed DVT or PE, was treated at an outside facility, and then never followed up with the treating surgeon. Patients were identified by CPT codes, so, if a patient underwent HTO, DFO, or TTO that was recorded under a different CPT code, it is possible the patient was missed by our search. All patients were seen after surgery, and we reviewed the outpatient office notes that were taken, so unless the DVT or PE occurred after a patient’s final postoperative visit, it would have been recorded. Similarly, the DVT and PE rates reported here cannot be extrapolated to overall risks for DVT and PE after osteotomies about the knee in all patients—only in patients who did not receive DVT prophylaxis after surgery.
Conclusion
The rates of DVT and PE after HTO, DFO, and TTO in patients who did not receive chemical prophylaxis are low: 1.42% and 0.71%, respectively. After these osteotomies, DVT/PE prophylaxis in the absence of known risk factors may not be warranted.
Am J Orthop. 2017;46(1):E23-E27. Copyright Frontline Medical Communications Inc. 2017. All rights reserved.
1. Rossi R, Bonasia DE, Amendola A. The role of high tibial osteotomy in the varus knee. J Am Acad Orthop Surg. 2011;19(10):590-599.
2. Sherman SL, Erickson BJ, Cvetanovich GL, et al. Tibial tuberosity osteotomy: indications, techniques, and outcomes. Am J Sports Med. 2014;42(8):2006-2017.
3. Wright JM, Crockett HC, Slawski DP, Madsen MW, Windsor RE. High tibial osteotomy. J Am Acad Orthop Surg. 2005;13(4):279-289.
4. Cameron JI, McCauley JC, Kermanshahi AY, Bugbee WD. Lateral opening-wedge distal femoral osteotomy: pain relief, functional improvement, and survivorship at 5 years. Clin Orthop Relat Res. 2015;473(6):2009-2015.
5. Ng WM, Chan KY, Lim AB, Gan EC. The incidence of deep venous thrombosis following arthroscopic knee surgery. Med J Malaysia. 2005;60(suppl C):14-16.
6. Platzer P, Thalhammer G, Jaindl M, et al. Thromboembolic complications after spinal surgery in trauma patients. Acta Orthop. 2006;77(5):755-760.
7. Wallace G, Judge A, Prieto-Alhambra D, de Vries F, Arden NK, Cooper C. The effect of body mass index on the risk of post-operative complications during the 6 months following total hip replacement or total knee replacement surgery. Osteoarthritis Cartilage. 2014;22(7):918-927.
8. Lieberman JR, Pensak MJ. Prevention of venous thromboembolic disease after total hip and knee arthroplasty. J Bone Joint Surg Am. 2013;95(19):1801-1811.
9. Mont MA, Jacobs JJ. AAOS clinical practice guideline: preventing venous thromboembolic disease in patients undergoing elective hip and knee arthroplasty. J Am Acad Orthop Surg. 2011;19(12):777-778.
10. Kim YH, Kulkarni SS, Park JW, Kim JS. Prevalence of deep vein thrombosis and pulmonary embolism treated with mechanical compression device after total knee arthroplasty in Asian patients. J Arthroplasty. 2015;30(9):1633-1637.
11. Kim YH, Yoo JH, Kim JS. Factors leading to decreased rates of deep vein thrombosis and pulmonary embolism after total knee arthroplasty. J Arthroplasty. 2007;22(7):974-980.
12. Raphael IJ, Tischler EH, Huang R, Rothman RH, Hozack WJ, Parvizi J. Aspirin: an alternative for pulmonary embolism prophylaxis after arthroplasty? Clin Orthop Relat Res. 2014;472(2):482-488.
13. Won MH, Lee GW, Lee TJ, Moon KH. Prevalence and risk factors of thromboembolism after joint arthroplasty without chemical thromboprophylaxis in an Asian population. J Arthroplasty. 2011;26(7):1106-1111.
14. Bozic KJ, Vail TP, Pekow PS, Maselli JH, Lindenauer PK, Auerbach AD. Does aspirin have a role in venous thromboembolism prophylaxis in total knee arthroplasty patients? J Arthroplasty. 2010;25(7):1053-1060.
15. Falck-Ytter Y, Francis CW, Johanson NA, et al; American College of Chest Physicians. Prevention of VTE in orthopedic surgery patients: Antithrombotic Therapy and Prevention of Thrombosis, 9th ed: American College of Chest Physicians Evidence-Based Clinical Practice Guidelines. Chest. 2012;141(2 suppl):e278S-e325S.
16. Martin R, Birmingham TB, Willits K, Litchfield R, Lebel ME, Giffin JR. Adverse event rates and classifications in medial opening wedge high tibial osteotomy. Am J Sports Med. 2014;42(5):1118-1126.
17. Miller BS, Downie B, McDonough EB, Wojtys EM. Complications after medial opening wedge high tibial osteotomy. Arthroscopy. 2009;25(6):639-646.
18. Motycka T, Eggerth G, Landsiedl F. The incidence of thrombosis in high tibial osteotomies with and without the use of a tourniquet. Arch Orthop Trauma Surg. 2000;120(3-4):157-159.
19. Turner RS, Griffiths H, Heatley FW. The incidence of deep-vein thrombosis after upper tibial osteotomy. A venographic study. J Bone Joint Surg Br. 1993;75(6):942-944.
20. Jiang Y, Du H, Liu J, Zhou Y. Aspirin combined with mechanical measures to prevent venous thromboembolism after total knee arthroplasty: a randomized controlled trial. Chin Med J (Engl). 2014;127(12):2201-2205.
21. Zou Y, Tian S, Wang Y, Sun K. Administering aspirin, rivaroxaban and low-molecular-weight heparin to prevent deep venous thrombosis after total knee arthroplasty. Blood Coagul Fibrinolysis. 2014;25(7):660-664.
Take-Home Points
- DVT and PE are uncommon complications following osteotomies about the knee.
- Use of oral contraceptives can increase the risk of a patient sustaining a postoperative DVT and PE following osteotomies about the knee.
- In the absence of significant risk factors, postoperative chemical DVT prophylaxis may be unnecessary in patients undergoing osteotomies about the knee.
High tibial osteotomy (HTO), distal femoral osteotomy (DFO), and tibial tubercle osteotomy (TTO) are viable treatment options for deformities about the knee and patella maltracking.1-4 Although TTO can be performed in many ways (eg, anteriorization, anteromedialization, medialization), the basic idea is to move the tibial tubercle to improve patellar tracking or to offload a patellar facet that has sustained trauma or degenerated.2 DFO is a surgical option for treating a valgus knee deformity (the lateral tibiofemoral compartment is offloaded) or for protecting a knee compartment after cartilage or meniscal restoration (medial closing wedge or lateral opening wedge).1 Similarly, HTO is an option for treating a varus knee deformity or isolated medial compartment arthritis; the diseased compartment is offloaded, and any malalignment is corrected. Akin to DFO, HTO is often performed to protect a knee compartment, typically the medial tibiofemoral compartment, after cartilage or meniscal restoration.2-4
Compared to most arthroscopic knee surgeries, these osteotomies are much more involved, have longer operative times, and restrict postoperative weight-bearing and range of motion.2-4 The rates of deep vein thrombosis (DVT) and pulmonary embolism (PE) after these osteotomies are not well documented. In addition, there is no documentation of the risks in patients who smoke, are obese, or are using oral contraceptives (OCs) at time of surgery, despite the increased DVT and PE risks posed by smoking, obesity, and OC use in other surgical procedures.5-7 Although the American Academy of Orthopaedic Surgeons (AAOS) issued clinical practice guidelines for DVT/PE prophylaxis after hip and knee arthroplasty, there is no standard prophylaxis guidelines for DVT/PE prevention after HTO, DFO, or TTO.8,9 Last, rates of DVT after total knee arthroplasty (TKA) are well defined; they range from 2% to 12%.10,11 These rates may be surrogates for osteotomies about the knee, but this is only conjecture.
We conducted a study to determine the rates of symptomatic DVT and PE after HTO, DFO, or TTO in patients who did not receive postoperative DVT/PE prophylaxis. We also wanted to determine if age, body mass index (BMI), and smoking status have associations with the risk of developing either DVT or PE after HTO, DFO, or TTO. We hypothesized that the DVT and PE rates would both be <1%.
Methods
After this study was approved by our university’s Institutional Review Board, we searched the surgical database of Dr. Cole, a sports medicine fellowship–trained surgeon, to identify all patients who had HTO, DFO, or TTO performed between September 1, 2009 and September 30, 2014. Current Procedural Terminology (CPT) codes were used for the search. The code for HTO was 27457: osteotomy, proximal tibia, including fibular excision or osteotomy (includes correction of genu varus [bowleg] or genu valgus [knock-knee]); after epiphyseal closure). The code for DFO was 27450: osteotomy, femur, shaft or supracondylar; with fixation. Last, the code for TTO was 27418: anterior tibial tubercleplasty (eg, Maquet-type procedure). The 141 patients identified in the search were treated by Dr. Cole at a single institution and were included in the study. Study inclusion did not require a minimum follow-up. Follow-up duration was defined as the time between surgery and the final clinic note in the patient chart. No patient was excluded for lack of follow-up clinic visits, and none was lost to follow-up.
Age, BMI, smoking status, and OC use were recorded for all patients. For each procedure, the surgeon’s technique remained the same throughout the study period: HTO, medial opening-wedge osteotomy with plate-and-screw fixation; DFO, lateral opening-wedge osteotomy with plate-and-screw fixation; and TTO, mostly anteromedialization with screw fixation (though this was dictated by patellar contact pressures). A tourniquet was used in all cases. Each patient’s hospital electronic medical record and outpatient office notes were reviewed to determine if symptomatic DVT or PE developed after surgery. The diagnosis of symptomatic DVT was based on clinical symptoms and confirmatory ultrasound, and the PE diagnosis was based on computed tomography. Doppler ultrasound was performed only in symptomatic patients (ie, it was not routinely performed).
Per surgeon protocol, postoperative DVT prophylaxis was not administered. Patients were encouraged to begin dorsiflexion and plantar flexion of the ankle (ankle pumps) immediately and to mobilize as soon as comfortable. Each patient received a cold therapy machine with compression sleeve. Patients were allowed toe-touch weight-bearing for 6 weeks, and then progressed 25% per week for 4 weeks to full weight-bearing by 10 weeks. After surgery, each patient was placed in a brace, which was kept locked in extension for 10 days; when the brace was unlocked, the patient was allowed to range the knee.
Continuous variable data are reported as weighted means and weighted standard deviations. Categorical variable data are reported as frequencies and percentages.
Results
Our database search identified 141 patients (44% male, 56% female) who underwent HTO (47 patients, 33.3%), DFO (13 patients, 9.2%), or TTO (81 patients, 57.5%). Mean (SD) age was 34.28 (9.86) years, mean (SD) BMI was 26.88 (5.11) kg/m2, and mean (SD) follow-up was 17.1 (4.1) months. Of the female patients, 36.7% were using OCs at time of surgery. Of all patients, 13.48% were smokers.
Two patients (1.42%) had clinical symptoms consistent with DVT. In each case, the diagnosis was confirmed with Doppler ultrasound. The below-knee DVT was unilateral in 1 case and bilateral in the other.
The unilateral DVT occurred in a patient who underwent anteromedialization of the tibial tubercle and osteochondral allograft transfer to the lateral femoral condyle for patellar maltracking and a focal trochlear defect. The DVT was diagnosed 8 days after surgery and was treated with warfarin. Low-molecular-weight heparin (LMWH) was used as a bridge until the warfarin level was therapeutic (4 days). This male patient had no significant medical history.
The bilateral DVT with PE occurred in a patient who underwent a medial opening-wedge HTO for a varus deformity with right medial compartment osteoarthritis and a meniscal tear. The DVT and PE were diagnosed 48 hours after surgery, when the patient complained of lightheadedness and lost consciousness. She had no medical problems but was using OCs at time of surgery. The patient died 3 days after surgery and subsequently was found to have a maternal-side family history of DVT (the patient and her family physician had been unaware of this history).
Discussion
As the rates of DVT and PE after osteotomies about the knee have not been well studied, we wanted to determine these rates after HTO, DFO, and TTO in patients who did not receive postoperative DVT prophylaxis. We hypothesized that DVT and PE rates would both be <1%, and this hypothesis was partly confirmed: The rate of PE after HTO, DFO, and TTO was <1%, and the rate of symptomatic DVT was >1%. Similarly, the patients who developed these complications were nonsmokers and had a BMI no higher than that of the patients who did not develop DVT or PE. In addition, only 1 patient developed DVT and PE, and she was using OCs and had a family history of DVT. Last, the patients who developed these complications were on average 14 years older than the patients who did not develop DVT or PE.
Although there is a plethora of reports on the incidence of DVT and PE after TKA, there is little on the incidence after osteotomies about the knee.8,12 The rate of DVT after TKA varies, but many studies place it between 2% and 12%, and routinely find a PE rate of <0.5%.10,11,13,14 Although the AAOS issued a clinical practice guideline for postoperative DVT prophylaxis after TKA, and evaluated the best available evidence, it could not reach consensus on a specific type of DVT prophylaxis, though the workgroup did recommend that patients be administered postoperative DVT prophylaxis of some kind.8,9 Similarly, the American College of Chest Physicians (ACCP) issued clinical practice guidelines for preventing DVT and PE after elective TKA and total hip arthroplasty.15 According to the ACCP guidelines, patients should receive prophylaxis—LMWH, fondaparinux, apixaban, dabigatran, rivaroxaban, low-dose unfractionated heparin, adjusted-dose vitamin K antagonist, aspirin, or an intermittent pneumatic compression device—for a minimum of 14 days. Unfortunately, though there are similarities between TKAs and peri-knee osteotomies, these procedures are markedly different, and it is difficult to extrapolate and adapt recommendations and produce a consensus statement for knee arthroplasties. In addition, guidelines exist for hospitalized patients who are being treated for medical conditions or have undergone surgery, but all the patients in the present study had their osteotomies performed on an outpatient basis.
Martin and colleagues16 reviewed 323 cases of medial opening-wedge HTO and found a DVT rate of 1.4% in the absence of routine DVT prophylaxis, except in patients with a history of DVT. Their rate is almost identical to ours, but we also included other osteotomies in our study. Miller and colleagues17 reviewed 46 cases of medial opening-wedge HTO and found a 4.3% DVT rate, despite routine prophylaxis with once-daily 325-mg aspirin and ankle pumps. This finding contrasts with our 1.42% DVT rate in the absence of postoperative chemical DVT prophylaxis. Motycka and colleagues18 reviewed 65 HTO cases in which DVT prophylaxis (oral anticoagulant) was given for 6 weeks, and they found a DVT rate of 9.7%. Turner and colleagues19 performed venous ultrasound on 81 consecutive patients who underwent HTO and received DVT prophylaxis (twice-daily subcutaneous heparin), and they found a DVT rate of 41% and a PE rate of 1.2%, though only 8.6% of the DVT cases were symptomatic. Of note, whereas the lowest postoperative DVT rate was for patients who did not receive postoperative DVT prophylaxis, the rate of symptomatic DVT after these osteotomies ranged from 1.4% to 8.6% in patients who received prophylaxis.16,19 Given this evidence and our study results, it appears routine chemical DVT prophylaxis after osteotomies about the knee may not be necessary, though higher level evidence is needed in order to make definitive recommendations.
In the present study, the 2 patients who developed symptomatic DVT (1 subsequently developed PE) were nonsmokers in good health. The female patient (DVT plus PE) was using OCs at time of surgery. Studies have shown that patients who smoke and who use OCs are at increased risk for developing DVT or PE after surgery.5,6,12 Given that only 2 of our patients developed DVT/PE, and neither was a smoker, smoking was not associated with increased DVT or PE risk in this study population, in which 13.48% of patients were smokers at time of surgery. In addition, given that the 1 female patient who developed DVT/PE was using OCs and that 36.7% of all female patients in the study were using OCs, it is difficult to conclude whether OC use increased the female patient’s risk for DVT or PE. Furthermore, neither the literature nor the AAOS consensus statement supports discontinuing OCs for this surgical procedure.
Patients in this study did not receive chemical or mechanical DVT prophylaxis after surgery. Regarding various post-TKA DVT prophylaxis regimens, aspirin is as effective as LMWH in preventing DVT, and the risk for postoperative blood loss and wound complications is lower with aspirin than with rivaroxaban.20,21 Given that the present study’s postoperative rates of DVT (1.42%) and PE (0.71%) are equal to or less than rates already reported in the literature, routine DVT prophylaxis after osteotomies about the knee may be unnecessary in the absence of other significant risk factors.16,19 However, our study considered only symptomatic DVT and PE, so it is possible that the number of asymptomatic DVT cases is higher in this patient population. Definitively answering our study’s clinical question will require a multicenter registry study (prospective cohort study).
Study Limitations
The strengths of this study include the large number of patients treated by a single surgeon using the same postoperative protocol. Limitations of this study include the lack of a control group. Although we found a DVT rate of 1.42% and a PE rate of 0.71%, the literature on the accepted risks for DVT and PE after HTO, DFO, and TTO is unclear. With our results stratified by procedure, the DVT rate was 2% in the HTO group, 0% in the DFO group, and 1% in the TTO group. However, we were unable to reliably stratify these results by each specific procedure, as the number of patients in each group would be too low. This study involved reviewing charts; as patients were not contacted, it is possible a patient developed DVT or PE, was treated at an outside facility, and then never followed up with the treating surgeon. Patients were identified by CPT codes, so, if a patient underwent HTO, DFO, or TTO that was recorded under a different CPT code, it is possible the patient was missed by our search. All patients were seen after surgery, and we reviewed the outpatient office notes that were taken, so unless the DVT or PE occurred after a patient’s final postoperative visit, it would have been recorded. Similarly, the DVT and PE rates reported here cannot be extrapolated to overall risks for DVT and PE after osteotomies about the knee in all patients—only in patients who did not receive DVT prophylaxis after surgery.
Conclusion
The rates of DVT and PE after HTO, DFO, and TTO in patients who did not receive chemical prophylaxis are low: 1.42% and 0.71%, respectively. After these osteotomies, DVT/PE prophylaxis in the absence of known risk factors may not be warranted.
Am J Orthop. 2017;46(1):E23-E27. Copyright Frontline Medical Communications Inc. 2017. All rights reserved.
1. Rossi R, Bonasia DE, Amendola A. The role of high tibial osteotomy in the varus knee. J Am Acad Orthop Surg. 2011;19(10):590-599.
2. Sherman SL, Erickson BJ, Cvetanovich GL, et al. Tibial tuberosity osteotomy: indications, techniques, and outcomes. Am J Sports Med. 2014;42(8):2006-2017.
3. Wright JM, Crockett HC, Slawski DP, Madsen MW, Windsor RE. High tibial osteotomy. J Am Acad Orthop Surg. 2005;13(4):279-289.
4. Cameron JI, McCauley JC, Kermanshahi AY, Bugbee WD. Lateral opening-wedge distal femoral osteotomy: pain relief, functional improvement, and survivorship at 5 years. Clin Orthop Relat Res. 2015;473(6):2009-2015.
5. Ng WM, Chan KY, Lim AB, Gan EC. The incidence of deep venous thrombosis following arthroscopic knee surgery. Med J Malaysia. 2005;60(suppl C):14-16.
6. Platzer P, Thalhammer G, Jaindl M, et al. Thromboembolic complications after spinal surgery in trauma patients. Acta Orthop. 2006;77(5):755-760.
7. Wallace G, Judge A, Prieto-Alhambra D, de Vries F, Arden NK, Cooper C. The effect of body mass index on the risk of post-operative complications during the 6 months following total hip replacement or total knee replacement surgery. Osteoarthritis Cartilage. 2014;22(7):918-927.
8. Lieberman JR, Pensak MJ. Prevention of venous thromboembolic disease after total hip and knee arthroplasty. J Bone Joint Surg Am. 2013;95(19):1801-1811.
9. Mont MA, Jacobs JJ. AAOS clinical practice guideline: preventing venous thromboembolic disease in patients undergoing elective hip and knee arthroplasty. J Am Acad Orthop Surg. 2011;19(12):777-778.
10. Kim YH, Kulkarni SS, Park JW, Kim JS. Prevalence of deep vein thrombosis and pulmonary embolism treated with mechanical compression device after total knee arthroplasty in Asian patients. J Arthroplasty. 2015;30(9):1633-1637.
11. Kim YH, Yoo JH, Kim JS. Factors leading to decreased rates of deep vein thrombosis and pulmonary embolism after total knee arthroplasty. J Arthroplasty. 2007;22(7):974-980.
12. Raphael IJ, Tischler EH, Huang R, Rothman RH, Hozack WJ, Parvizi J. Aspirin: an alternative for pulmonary embolism prophylaxis after arthroplasty? Clin Orthop Relat Res. 2014;472(2):482-488.
13. Won MH, Lee GW, Lee TJ, Moon KH. Prevalence and risk factors of thromboembolism after joint arthroplasty without chemical thromboprophylaxis in an Asian population. J Arthroplasty. 2011;26(7):1106-1111.
14. Bozic KJ, Vail TP, Pekow PS, Maselli JH, Lindenauer PK, Auerbach AD. Does aspirin have a role in venous thromboembolism prophylaxis in total knee arthroplasty patients? J Arthroplasty. 2010;25(7):1053-1060.
15. Falck-Ytter Y, Francis CW, Johanson NA, et al; American College of Chest Physicians. Prevention of VTE in orthopedic surgery patients: Antithrombotic Therapy and Prevention of Thrombosis, 9th ed: American College of Chest Physicians Evidence-Based Clinical Practice Guidelines. Chest. 2012;141(2 suppl):e278S-e325S.
16. Martin R, Birmingham TB, Willits K, Litchfield R, Lebel ME, Giffin JR. Adverse event rates and classifications in medial opening wedge high tibial osteotomy. Am J Sports Med. 2014;42(5):1118-1126.
17. Miller BS, Downie B, McDonough EB, Wojtys EM. Complications after medial opening wedge high tibial osteotomy. Arthroscopy. 2009;25(6):639-646.
18. Motycka T, Eggerth G, Landsiedl F. The incidence of thrombosis in high tibial osteotomies with and without the use of a tourniquet. Arch Orthop Trauma Surg. 2000;120(3-4):157-159.
19. Turner RS, Griffiths H, Heatley FW. The incidence of deep-vein thrombosis after upper tibial osteotomy. A venographic study. J Bone Joint Surg Br. 1993;75(6):942-944.
20. Jiang Y, Du H, Liu J, Zhou Y. Aspirin combined with mechanical measures to prevent venous thromboembolism after total knee arthroplasty: a randomized controlled trial. Chin Med J (Engl). 2014;127(12):2201-2205.
21. Zou Y, Tian S, Wang Y, Sun K. Administering aspirin, rivaroxaban and low-molecular-weight heparin to prevent deep venous thrombosis after total knee arthroplasty. Blood Coagul Fibrinolysis. 2014;25(7):660-664.
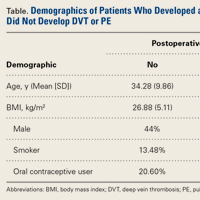
Cost of acute kidney injury in hospitalized patients
Acute kidney injury (AKI) is a common complication that affects as many as 20% of hospitalized patients, depending on the definition employed.1-3 AKI is associated with significant morbidity and mortality; hospitalized patients with AKI require more investigations and medications,4 develop more postoperative complications,5 and spend more time in the intensive care unit than do patients without AKI.6 Inhospital mortality for patients with AKI has recently been estimated between 20-25%,3,7 and critically ill patients with AKI requiring dialysis experience mortality rates in excess of 50%.8,9 AKI and its accompanying complications may continue to rise, as the incidence of AKI and AKI requiring dialysis is increasing at a rate of approximately 10% per year.10-12
Owing to poor outcomes and rising incidence, AKI has emerged as a major public health concern with high human and financial costs; however, the costs related to AKI have been excluded from recent United States Renal Data System estimates.13 Most studies that have explored the costs related to hospitalizations complicated by AKI have been single-center or local studies in specialized patient populations.4,5,14-18 Very few studies have used data after the year 2000, when the incidence of AKI began to increase, likely related to a combination of patient age, comorbidity burden, sepsis, heart failure, and nephrotoxic medications.10,11 Moreover, it is unclear which patient and hospital characteristics contribute most to the cost of an AKI hospitalization, and how the costs of AKI compare to those for other acute medical conditions. Such information is important for hospitals, policymakers, and researchers to target prevention and management strategies for high-risk and high-cost patient groups.
The main objectives of this study were to determine the costs of AKI-related hospitalization, and patient and hospital factors associated with these costs. We hypothesized that costs related to AKI would add several thousand dollars to each hospitalization and would eclipse the cost of many higher profile acute medical conditions.
METHODS
Study Population
We extracted data from the National Inpatient Sample (NIS), a nationally representative administrative database of hospitalizations in the United States (U.S.) created by the Agency for Healthcare Research and Quality as part of the Healthcare Cost and Utilization Project.19 The NIS is the largest all-payer inpatient-care database, and contains a 20% stratified sample of yearly discharge data from short-term, non-Federal, nonrehabilitation hospitals. Data are stratified according to geographic region, location (urban/rural), teaching status, ownership, and hospital bed number. Each hospitalization is treated as an individual entry in the database (ie, individual patients who are hospitalized multiple times may be present in the NIS multiple times). The NIS includes demographic variables, diagnoses, procedures, LOS, and hospital charges. Sample weights are provided to allow for the generation of national estimates, along with information necessary to calculate the variance of estimates.
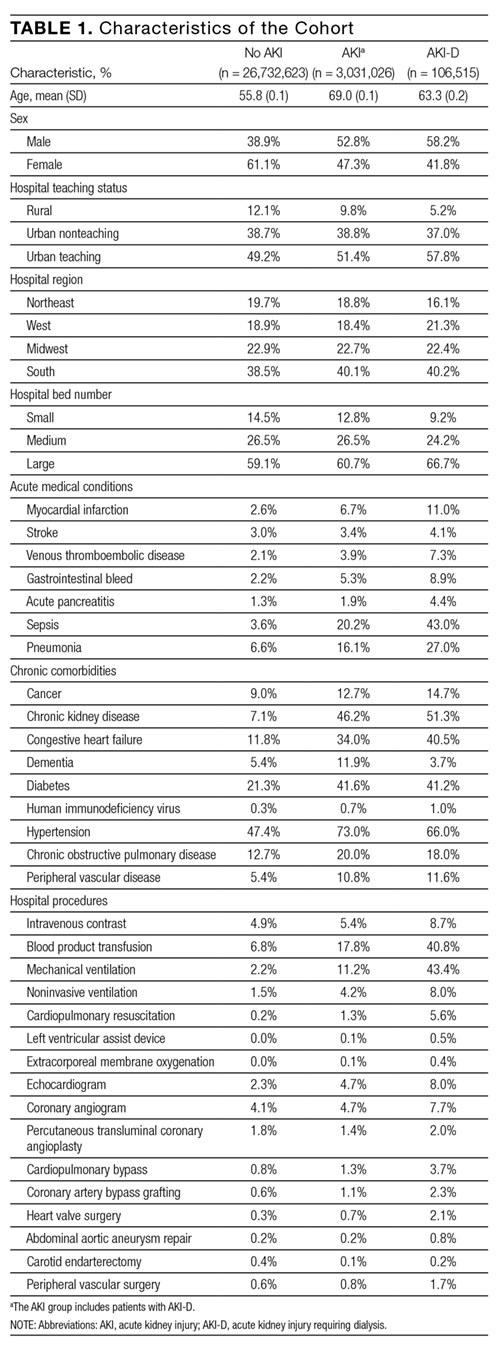
We utilized the 2012 NIS subset, the most recent year available at the time of data analysis. The 2012 NIS subset contained administrative data from over 7 million hospitalizations, representing more than 4000 hospitals, 44 states, and 95% of the US population. We excluded patients under 18 years of age and patients with end-stage renal disease (ESRD). We identified patients with ESRD using diagnosis codes and procedure codes from the International Classification of Diseases, Ninth Revision, Clinical Modification (ICD-9-CM, Supplemental Table 1). We also excluded hospitalizations with an ICD-9 diagnosis or procedure code for dialysis but without a diagnosis code for AKI, assuming that these patients were treated with dialysis for ESRD. We and others have used this approach,11,20,21 which has been shown to produce high sensitivity and specificity, as well as high positive and negative predictive values (all equal to or greater than 90%) for differentiating dialysis-requiring AKI (AKI-D) from chronic dialysis.21
Primary and Secondary Exposures
Episodes of AKI were identified using the ICD-9 diagnosis code 584.x. This administrative code for AKI has low sensitivity, but high specificity of approximately 99%: our cohort includes few false positives, and identifies a more severe spectrum of AKI compared to serum creatinine criteria.21,22 For example, the median (25th, 75th percentile) change in serum creatinine from baseline is estimated at 1.2 (0.7 to 2.1) mg/dL compared with 0.2 (0.1 to 0.2) mg/dL for patients without an administrative code for AKI.21 We defined AKI-D as the presence of an AKI diagnosis code and a diagnosis or procedure code for dialysis. This algorithm for AKI-D has been shown to yield high sensitivity and specificity.21 Secondary exposures included several acute medical conditions (myocardial infarction, stroke, venous thromboembolic disease, gastrointestinal bleed, acute pancreatitis, sepsis, and pneumonia) whose incremental costs and LOS could be compared to AKI (Supplemental Table 1).
Covariates
We assessed patient comorbidities from the 25 diagnoses listed in the NIS for each record (Supplemental Table 1). Hospital-level variables included geographic region, bed number, and teaching status using predetermined NIS definitions.19
Outcomes
The primary outcome was the inpatient cost of each hospital record in 2012 dollars. We estimated costs from the total charge for each hospitalization by applying hospital-specific charge-to-cost ratios. The NIS obtained cost information from the hospital accounting reports collected by the Centers for Medicare and Medicaid Services.19 The secondary outcome was hospital LOS.
Statistical Analysis
We summarized baseline characteristics of the study participants using descriptive statistics. Normally distributed continuous variables were expressed as mean (standard deviation [SD]), and nonparametric continuous variables were expressed as median (25th, 75th percentile). Categorical variables were expressed as proportions. We calculated the mean increase in cost and LOS of each hospital record, comparing hospital records with AKI and AKI-D to hospital records without AKI. We took the same approach when examining incremental costs and LOS associated with other acute medical conditions. Due to the skewness of cost and LOS data, we used a generalized linear model with a gamma distribution and a log link fitted to the primary or secondary exposure to obtain the unadjusted mean increase in cost and LOS.23,24 We incorporated demographics, hospital differences, comorbidities (including AKI when it was compared to the other acute medical conditions), and procedures into the generalized linear model to calculate the adjusted mean increase in cost and LOS. This method also provides the adjusted percentage change in hospital costs and LOS from the estimated beta-coefficients in the multivariable model. We calculated the proportion of variation in the outcomes explained by the generalized linear models using pseudo R-squared measured by the Kullback-Leibler divergence.25 As a companion analysis, we repeated estimates for AKI-D when dialysis was initiated within 7 days of hospital admission because subsequent events during the hospital stay would more likely be attributable to the AKI episode. All analyses presented account for the NIS survey design (weighting and stratification) and subpopulation measurements to generate national estimates. We created the cohort using the Statistical Analysis System software, version 9.4 (SAS Institute, Cary, North Carolina) and conducted the analyses using StataMP, version 14.0 (Stata Corporation, College Station, Texas).
RESULTS
Patient Characteristics
Between January 1 and December 31, 2012, there were 36,484,846 hospitalization records available in the NIS; 948,875 adult records (2.6%) were classified as having ESRD and 29,763,649 (81.6%) were included in the final cohort. Within the final cohort, 3,031,026 (10.2%) hospitalizations were complicated by AKI, of which 106,515 (3.5%) required dialysis (corresponding to 0.36% of the analytic cohort) (Figure 1).

Compared to patients without AKI, patients with AKI were older (69.0 years vs. 55.8 years) and a larger proportion were male (52.8% vs. 38.9%). All measured comorbidities were more prevalent in patients with AKI. Patients with AKI also underwent more hospital procedures than patients without AKI (Table 1).
Hospitalization Costs
Figures 2A and 2B show unadjusted and multivariable-adjusted mean increases in cost of a hospitalization with AKI and AKI-D compared to a hospitalization without AKI. Extrapolating to the 2012 population estimates in Table 1 for AKI and AKI-D, increases in cost related to AKI ranged from $24.0 billion (unadjusted) to $5.4 billion (adjusted) and for AKI-D ranged from $4.5 billion (unadjusted) to $1.2 billion (adjusted).
Mean increases in the cost of a hospitalization for AKI exceeded costs associated with other acute medical conditions such as myocardial infarction and gastrointestinal bleeding. Costs associated with AKI were similar to hospitalizations for stroke, acute pancreatitis, and pneumonia. Costs of AKI-D exceeded those related to sepsis and venous thromboembolic disease (Table 2). AKI was the most common of the acute medical conditions examined (3,031,026 patients, 10.2%).
Major drivers of cost included urban and teaching hospitals, hospitals in the Southern US (relative to other regions), hospitals with a larger number of beds, most acute medical conditions, cancer, and hospital procedures. Older age was associated with higher costs with non-AKI hospitalizations but lower costs with AKI hospitalizations (0.67% vs. -0.44%, per year of age). Determinants of hospital costs are shown in Supplemental Table 2. Generally, hospital procedures accounted for the largest relative increases in cost.
Length of Stay
Figures 2A and 2B show unadjusted and multivariable-adjusted mean increases in LOS for a hospitalization with AKI and AKI-D compared to a hospitalization without AKI. Extrapolating to the 2012 population estimates in Table 1 for AKI and AKI-D, increases in LOS related to AKI ranged from 9.8 million days (unadjusted) to 3.3 million days (adjusted) and for AKI-D ranged from 1.2 million days (unadjusted) to 0.4 million days (adjusted).
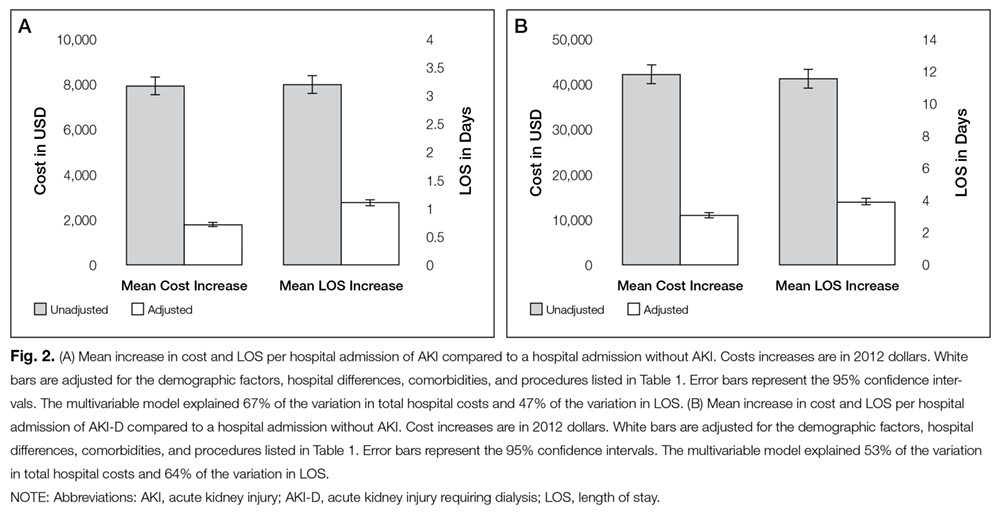
When compared to other acute medical conditions, the mean increase in LOS of an AKI hospitalization resembled the order for mean increases in cost (Table 2). Major drivers of LOS also resembled drivers of costs, with the exception of some common cardiovascular procedures (percutaneous transluminal coronary angioplasty, abdominal aortic aneurysm repair, and carotid endarterectomy) that were associated only with prolonged LOS in the AKI and AKI-D groups (Supplemental Table 3).
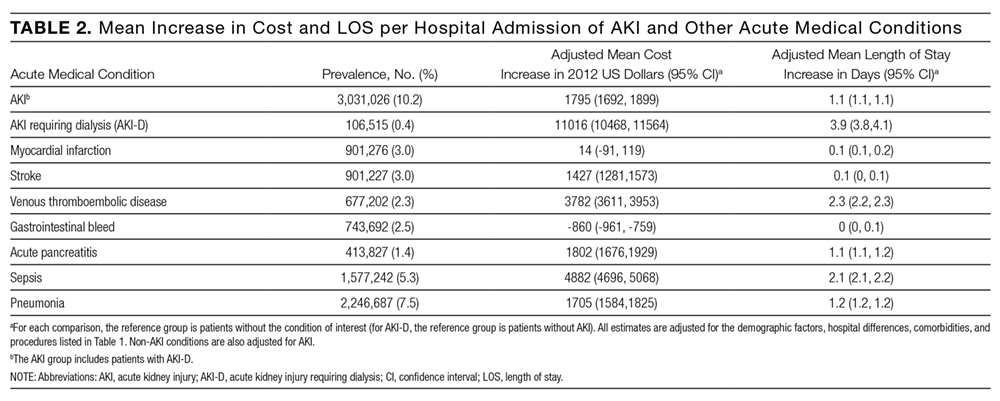
Companion Analysis
In an analysis of 78,220 patients who developed AKI-D within 7 days of hospital admission (73% of AKI-D cases), increases in cost ranged from $32,133 (unadjusted) to $8594 (adjusted) and increases in LOS ranged from 8.4 days (unadjusted) to 2.9 days (adjusted) compared to patients without AKI.
DISCUSSION
We found that hospitalizations complicated by AKI were more costly—between $1800 and $7900—than hospitalizations that did not involve AKI, which indicates that AKI could be responsible for billions of dollars of annual healthcare spending. Relative to several other acute medical conditions, AKI was more common and expensive; when AKI was severe enough to require dialysis, costs of AKI exceeded all other acute medical conditions by a large margin.
Several single-center and regional studies have highlighted the association of AKI with hospital costs and LOS. In a single-center study conducted in the late 1990s, Chertow et al14 described mean cost increases between $4900 (adjusted) and $8900 (unadjusted) and LOS increases of 3.5 days (adjusted) using serum creatinine criteria to define AKI.14 These higher adjusted estimates may result because their multivariable models did not adjust for several major determinants of cost, including several procedures and hospital-level variables. A study at the same academic center in 2010, which adjusted for some procedures, found AKI was associated with a 2.8-day increase in LOS and a $7082 increase in costs;2 however, this study also could not adjust for hospital-level variables because of the single-center design. Fischer et al15 were able to adjust for hospital teaching status in their study that included 23 local hospitals. Similar to our results, teaching hospitals were associated with an approximately17% increase in cost compared to nonacademic hospitals. However, this study excluded patients who required critical care or mechanical ventilation, which limits the generalizability of their cost estimates. Another limitation of these 3 studies is that they were all conducted in Massachusetts. Beyond the US, the economic burden of AKI has been studied in England where the annual cost of AKI-related inpatient care has been estimated at $1.4 billion.16 In addition to incomplete procedure and hospital-level adjustment, this study is limited by its ascertainment of AKI and costs, which was extrapolated from 1 hospital region to the rest of England.
Our study adds to the existing evidence in a number of ways. It uses nationally representative data to determine a lower and an upper limit of increases in cost and LOS attributable to AKI. The adjusted value is likely overly conservative; it minimizes the influence of events that are attributable to AKI and does not account for complications that may be caused by, or otherwise related to, AKI. The unadjusted value is likely an overestimate, attributing events during an AKI hospitalization to the AKI episode, even if they precede AKI. In clinical practice, most patients fall between these 2 extremes. Therefore, we suggest using the adjusted and unadjusted estimates to provide a range of the cost and LOS increases that are attributable to AKI. This interpretation is also supported by the companion analysis that minimizes the effect of pre-AKI events, where the unadjusted cost and LOS estimates for AKI-D occurring early during a hospitalization fell between the unadjusted and adjusted estimates for the main AKI-D analysis. Therefore, our data suggest that each hospitalization complicated by AKI is associated with a cost increase between $1800 and $7900 and an LOS increase between 1.1 days and 3.2 days. Not surprisingly, the burden of AKI-D was more pronounced with a cost increase between $11,000 and $42,100 and an LOS increase between 3.9 days and 11.5 days.
Unlike previous studies, these analyses are fully adjusted for procedures and multiple hospital-level variables (such as teaching status, region, and bed number). These adjustments are important because procedures account for much of the incremental cost and LOS associated with AKI, and each hospital-level variable may increase the cost and LOS of an AKI hospitalization by 10% to 25% (Supplemental Tables 2 and 3). Even though the relative increases in cost and LOS associated with different comorbidities and procedures were largely similar between patients with and without AKI, the absolute increases were usually larger in patients with AKI rather than without AKI because of their higher baseline estimates. We also observed that each year of age was associated with increased costs in patients without AKI, but decreased costs in patients with AKI. We suspect this difference is due to the lesser (and ultimately less costly) injury required to induce AKI in elderly patients who have less physiologic reserve.26 Moreover, we placed the burden of AKI in relation to other acute medical conditions, where its total estimated annual costs of $5.4 billion were exceeded only by the $7.7 billion attributed to sepsis.
Our results emphasize that AKI is an important contributor to hospital costs and LOS. Despite these consequences, there have been very few innovations in the prevention and management of AKI over the last decade.27,28 The primary treatment for severe AKI remains dialysis, and recent clinical trials suggest that we may have reached a dose plateau in the value of dialytic therapy.8,29 Several opportunities, such as advances in basic science and clinical care, may improve the care of patients with AKI. Translational research challenges in AKI have been reviewed, with treatment strategies that include hemodynamic, inflammatory, and regenerative mechanisms.28, 30 In a recent report from the National Confidential Enquiry into Patient Outcome and Death in the United Kingdom, 30% of AKI episodes that occurred inhospital were preventable, and only 50% of patients with AKI were deemed to have received good care.31 Our results suggest that even small progress in these areas could yield significant cost savings. One starting point suggested by our findings is a better understanding of the reasons underlying the association between hospital-level variables and differences in cost and LOS. Notably, there have been few efforts to improve AKI care processes on the same scale as sepsis,32 myocardial infarction,33,34 stroke,35 and venous thromboembolic disease.36
Strengths of this study include cost and LOS estimates of AKI from different hospitals across the US, including academic and community institutions. As a result, our study is significantly larger and more representative of the US population than previously published studies. Moreover, we utilized data from 2012, which accounts for the increasing incidence of AKI and recent advances in critical care medicine. We were also able to adjust for comorbid conditions, procedures, severity of illness, and hospital-level variables, which provide a conservative lower limit of the burden of AKI on hospitalized patients.
Our study has limitations. First, we used administrative codes to identify patients with AKI. The low sensitivity of these codes suggests that many patients with milder forms of AKI were probably not coded as such. Accordingly, our findings should be generally applicable to patients with moderate to severe AKI rather than to those with mild AKI.21,22 Second, the NIS lacks granularity on the details and sequence of events during a hospitalization. As a result, we could not determine the timing of an AKI episode during a hospitalization or whether a diagnosis or procedure was the cause or consequence of an AKI episode (ie, day 1 as the reason for admission vs. day 20 as a complication of surgery). Both the timing and cause of an AKI episode may influence cost and LOS, which should be considered when applying our results to patient care. We did not attempt to estimate the costs associated with comorbidities such as congestive heart failure and chronic obstructive pulmonary disease because we could not determine the acuity of disease in the NIS. Third, despite our efforts, residual confounding is likely, especially since administrative data limit our ability to capture the severity of comorbid conditions and the underlying illness. Fourth, the NIS does not contain individual patient identifiers, so multiple hospitalizations from the same patient may be represented.
Even our most conservative estimates still attribute $5.4 billion and 3.3 million hospital-days to AKI in 2012. These findings highlight the need for hospitals, policymakers, and researchers to recognize the economic burden of AKI. Future work should focus on understanding hospital-level differences in AKI care and the effect on patient morbidity and mortality. National and hospital-wide quality improvement programs are also needed. Such initiatives have commenced in the United Kingdom,37 and similar efforts are needed in North America to develop and coordinate cost-effective strategies to care for patients with AKI.
Disclosures
Samuel A. Silver, MD, MSc, is supported by a Kidney Research Scientist Core Education and National Training Program Post-Doctoral Fellowship (co-funded by the Kidney Foundation of Canada, Canadian Society of Nephrology, and Canadian Institutes of Health Research). Glenn M. Chertow, MD, MPH, is supported by a K24 mid-career mentoring award from NIDDK (K24 DK085446). These funders had no role in the design and conduct of the study; collection, management, analysis, and interpretation of the data; preparation, or approval of the manuscript; or decision to submit the manuscript for publication. The authors report no financial conflicts of interest.
1. Waikar SS, Liu KD, Chertow GM. Diagnosis, epidemiology and outcomes of acute kidney injury. Clin J Am Soc Nephrol. 2008;3:844-861. PubMed
2. Zeng X, McMahon GM, Brunelli SM, Bates DW, Waikar SS. Incidence, outcomes, and comparisons across definitions of AKI in hospitalized individuals. Clin J Am Soc Nephrol. 2014;9:12-20. PubMed
3. Susantitaphong P, Cruz DN, Cerda J, et al. Acute Kidney Injury Advisory Group of the American Society of Nephrology. World incidence of AKI: a meta-analysis. Clin J Am Soc Nephrol. 2013;8:1482-1493. PubMed
4. Dasta JF, Kane-Gill SL, Durtschi AJ, Pathak DS, Kellum JA. Costs and outcomes of acute kidney injury (AKI) following cardiac surgery. Nephrol Dial Transplant. 2008;23:1970-1974. PubMed
5. Hobson C, Ozrazgat-Baslanti T, Kuxhausen A, et al. Cost and mortality associated with postoperative acute kidney injury. Ann Surg. 2015;261:1207-1214. PubMed
6. Vieira JM Jr, Castro I, Curvello-Neto A, et al. Effect of acute kidney injury on weaning from mechanical ventilation in critically ill patients. Crit Care Med. 2007;35:184-191. PubMed
7. Selby NM, Kolhe NV, McIntyre CW, et al. Defining the cause of death in hospitalised patients with acute kidney injury. PLoS One. 2012;7:e48580. PubMed
8. Palevsky PM, Zhang JH, O’Connor TZ, et al. Intensity of renal support in critically ill patients with acute kidney injury. N Engl J Med. 2008;359(1):7-20. PubMed
9. Uchino S, Bellomo R, Morimatsu H, et al. Continuous renal replacement therapy: a worldwide practice survey. The beginning and ending supportive therapy for the kidney (B.E.S.T. kidney) investigators. Intensive Care Med. 2007;33:1563-1570. PubMed
10. Siew ED, Davenport A. The growth of acute kidney injury: a rising tide or just closer attention to detail? Kidney Int. 2015;87:46-61. PubMed
11. Hsu RK, McCulloch CE, Dudley RA, Lo LJ, Hsu CY. Temporal changes in incidence of dialysis-requiring AKI. J Am Soc Nephrol. 2013;24:37-42. PubMed
12. Xue JL, Daniels F, Star RA, et al. Incidence and mortality of acute renal failure in Medicare beneficiaries, 1992 to 2001. J Am Soc Nephrol. 2006;17:1135-1142. PubMed
13. Saran R, Li Y, Robinson B, et al. US Renal Data System 2015 annual data report: epidemiology of kidney disease in the United States. Am J Kidney Dis. 2016;67(3 suppl 1):S1-S434. PubMed
14. Chertow GM, Burdick E, Honour M, Bonventre JV, Bates DW. Acute kidney injury, mortality, length of stay, and costs in hospitalized patients. J Am Soc Nephrol. 2005;16:3365-3370. PubMed
15. Fischer MJ, Brimhall BB, Lezotte DC, Glazner JE, Parikh CR. Uncomplicated acute renal failure and hospital resource utilization: a retrospective multicenter analysis. Am J Kidney Dis. 2005;46:1049-1057. PubMed
16. Kerr M, Bedford M, Matthews B, O’Donoghue D. The economic impact of acute kidney injury in England. Nephrol Dial Transplant. 2014;29:1362-1368. PubMed
17. De Smedt DM, Elseviers MM, Lins RL, Annemans L. Economic evaluation of different treatment modalities in acute kidney injury. Nephrol Dial Transplant. 2012;27:4095-5101. PubMed
18. Srisawat N, Lawsin L, Uchino S, Bellomo R, Kellum JA; BEST Kidney Investigators. Cost of acute renal replacement therapy in the intensive care unit: results from The Beginning and Ending Supportive Therapy for the Kidney (BEST Kidney) study. Crit Care. 2010;14:R46. PubMed
19. Agency for Healthcare Research and Quality. Healthcare Cost and Utilization Project (HCUP). Overview of the National (Nationwide) Inpatient Sample (NIS). Available at: http://www.hcup-us.ahrq.gov/nisoverview.jsp. Accessed January 10, 2016.
20. Lenihan CR, Montez-Rath ME, Mora Mangano CT, Chertow GM, Winkelmayer WC. Trends in acute kidney injury, associated use of dialysis, and mortality after cardiac surgery, 1999 to 2008. Ann Thorac Surg. 2013;95:20-28. PubMed
21. Waikar SS, Wald R, Chertow GM, et al. Validity of international classification of diseases, ninth revision, clinical modification codes for acute renal failure. J Am Soc Nephrol. 2006;17:1688-1694. PubMed
22. Grams ME, Waikar SS, MacMahon B, Whelton S, Ballew SH, Coresh J. Performance and limitations of administrative data in the identification of AKI. Clin J Am Soc Nephrol. 2014;9:682-689. PubMed
23. Blough DK, Madden CW, Hornbrook MC. Modeling risk using generalized linear models. J Health Econ. 1999;18:153-171. PubMed
24. Malehi AS, Pourmotahari F, Angali KA. Statistical models for the analysis of skewed healthcare cost data: a simulation study. Health Econ Rev. 2015;5:11. PubMed
25. Cameron AC, Windmeijer FA. An R-squared measure of goodness of fit for some common nonlinear regression models. J Econometrics. 1997(77):329-342.
26. Coca SG. Acute kidney injury in elderly persons. Am J Kidney Dis. 2010;56:122-131. PubMed
27. Bonventre JV, Basile D, Liu KD, et al; Kidney Research National Dialogue (KRND). AKI: a path forward. Clin J Am Soc Nephrol. 2013;8:1606-1608. PubMed
28. Okusa MD, Rosner MH, Kellum JA, Ronco C; Acute Dialysis Quality Initiative XIII Workgroup. Therapeutic targets of human AKI: harmonizing human and animal AKI. J Am Soc Nephrol. 2016;27:44-48. PubMed
29. Pannu N, Klarenbach S, Wiebe N, Manns B, Tonelli M; Alberta Kidney Disease Network. Renal replacement therapy in patients with acute renal failure: a systematic review. JAMA. 2008;299:793-805. PubMed
30. Silver SA, Cardinal H, Colwell K, Burger D, Dickhout JG. Acute kidney injury: preclinical innovations, challenges, and opportunities for translation. Can J Kidney Health Dis. 2015;2:30. PubMed
31. Stewart J, Findlay G, Smith N, Kelly K, Mason M. Adding insult to injury: a review of the care of patients who died in hospital with a primary diagnosis of acute kidney injury (acute renal failure). A report by the National Confidential Enquiry into Patient Outcome and Death 2009. Available at: http://www.ncepod.org.uk/2009aki.html. Accessed April 4, 2016.
32. Society of Critical Care Medicine. Surviving Sepsis Campaign. Available at: http://www.survivingsepsis.org /Pages/default.aspx. Accessed April 3, 2016.
33. Mehta RH, Montoye CK, Gallogly M, et al; GAP Steering Committee of the American College of Cardiology. Improving quality of care for acute myocardial infarction: The Guidelines Applied in Practice (GAP) Initiative. JAMA. 2002;287:1269-1276. PubMed
34. Lewis WR, Peterson ED, Cannon CP, et al. An organized approach to improvement in guideline adherence for acute myocardial infarction: results with the Get With The Guidelines quality improvement program. Arch Intern Med. 2008;168:1813-1819. PubMed
35. Schwamm LH, Fonarow GC, Reeves MJ, et al. Get With the Guidelines–stroke is associated with sustained improvement in care for patients hospitalized with acute stroke or transient ischemic attack. Circulation. 2009;119:107-115. PubMed
36. Maynard G. Preventing Hospital-associated Venous Thromboembolism: A Guide for Effective Quality Improvement. 2nd ed. Rockville, MD: Agency for Healthcare Research and Quality; October 2015. AHRQ Publication No. 16-0001-EF.
37. NHS England: Acute kidney injury programme. Available at: http://www.Thinkkidneys.nhs.uk. Accessed April 3, 2016.
Acute kidney injury (AKI) is a common complication that affects as many as 20% of hospitalized patients, depending on the definition employed.1-3 AKI is associated with significant morbidity and mortality; hospitalized patients with AKI require more investigations and medications,4 develop more postoperative complications,5 and spend more time in the intensive care unit than do patients without AKI.6 Inhospital mortality for patients with AKI has recently been estimated between 20-25%,3,7 and critically ill patients with AKI requiring dialysis experience mortality rates in excess of 50%.8,9 AKI and its accompanying complications may continue to rise, as the incidence of AKI and AKI requiring dialysis is increasing at a rate of approximately 10% per year.10-12
Owing to poor outcomes and rising incidence, AKI has emerged as a major public health concern with high human and financial costs; however, the costs related to AKI have been excluded from recent United States Renal Data System estimates.13 Most studies that have explored the costs related to hospitalizations complicated by AKI have been single-center or local studies in specialized patient populations.4,5,14-18 Very few studies have used data after the year 2000, when the incidence of AKI began to increase, likely related to a combination of patient age, comorbidity burden, sepsis, heart failure, and nephrotoxic medications.10,11 Moreover, it is unclear which patient and hospital characteristics contribute most to the cost of an AKI hospitalization, and how the costs of AKI compare to those for other acute medical conditions. Such information is important for hospitals, policymakers, and researchers to target prevention and management strategies for high-risk and high-cost patient groups.
The main objectives of this study were to determine the costs of AKI-related hospitalization, and patient and hospital factors associated with these costs. We hypothesized that costs related to AKI would add several thousand dollars to each hospitalization and would eclipse the cost of many higher profile acute medical conditions.
METHODS
Study Population
We extracted data from the National Inpatient Sample (NIS), a nationally representative administrative database of hospitalizations in the United States (U.S.) created by the Agency for Healthcare Research and Quality as part of the Healthcare Cost and Utilization Project.19 The NIS is the largest all-payer inpatient-care database, and contains a 20% stratified sample of yearly discharge data from short-term, non-Federal, nonrehabilitation hospitals. Data are stratified according to geographic region, location (urban/rural), teaching status, ownership, and hospital bed number. Each hospitalization is treated as an individual entry in the database (ie, individual patients who are hospitalized multiple times may be present in the NIS multiple times). The NIS includes demographic variables, diagnoses, procedures, LOS, and hospital charges. Sample weights are provided to allow for the generation of national estimates, along with information necessary to calculate the variance of estimates.
We utilized the 2012 NIS subset, the most recent year available at the time of data analysis. The 2012 NIS subset contained administrative data from over 7 million hospitalizations, representing more than 4000 hospitals, 44 states, and 95% of the US population. We excluded patients under 18 years of age and patients with end-stage renal disease (ESRD). We identified patients with ESRD using diagnosis codes and procedure codes from the International Classification of Diseases, Ninth Revision, Clinical Modification (ICD-9-CM, Supplemental Table 1). We also excluded hospitalizations with an ICD-9 diagnosis or procedure code for dialysis but without a diagnosis code for AKI, assuming that these patients were treated with dialysis for ESRD. We and others have used this approach,11,20,21 which has been shown to produce high sensitivity and specificity, as well as high positive and negative predictive values (all equal to or greater than 90%) for differentiating dialysis-requiring AKI (AKI-D) from chronic dialysis.21
Primary and Secondary Exposures
Episodes of AKI were identified using the ICD-9 diagnosis code 584.x. This administrative code for AKI has low sensitivity, but high specificity of approximately 99%: our cohort includes few false positives, and identifies a more severe spectrum of AKI compared to serum creatinine criteria.21,22 For example, the median (25th, 75th percentile) change in serum creatinine from baseline is estimated at 1.2 (0.7 to 2.1) mg/dL compared with 0.2 (0.1 to 0.2) mg/dL for patients without an administrative code for AKI.21 We defined AKI-D as the presence of an AKI diagnosis code and a diagnosis or procedure code for dialysis. This algorithm for AKI-D has been shown to yield high sensitivity and specificity.21 Secondary exposures included several acute medical conditions (myocardial infarction, stroke, venous thromboembolic disease, gastrointestinal bleed, acute pancreatitis, sepsis, and pneumonia) whose incremental costs and LOS could be compared to AKI (Supplemental Table 1).
Covariates
We assessed patient comorbidities from the 25 diagnoses listed in the NIS for each record (Supplemental Table 1). Hospital-level variables included geographic region, bed number, and teaching status using predetermined NIS definitions.19
Outcomes
The primary outcome was the inpatient cost of each hospital record in 2012 dollars. We estimated costs from the total charge for each hospitalization by applying hospital-specific charge-to-cost ratios. The NIS obtained cost information from the hospital accounting reports collected by the Centers for Medicare and Medicaid Services.19 The secondary outcome was hospital LOS.
Statistical Analysis
We summarized baseline characteristics of the study participants using descriptive statistics. Normally distributed continuous variables were expressed as mean (standard deviation [SD]), and nonparametric continuous variables were expressed as median (25th, 75th percentile). Categorical variables were expressed as proportions. We calculated the mean increase in cost and LOS of each hospital record, comparing hospital records with AKI and AKI-D to hospital records without AKI. We took the same approach when examining incremental costs and LOS associated with other acute medical conditions. Due to the skewness of cost and LOS data, we used a generalized linear model with a gamma distribution and a log link fitted to the primary or secondary exposure to obtain the unadjusted mean increase in cost and LOS.23,24 We incorporated demographics, hospital differences, comorbidities (including AKI when it was compared to the other acute medical conditions), and procedures into the generalized linear model to calculate the adjusted mean increase in cost and LOS. This method also provides the adjusted percentage change in hospital costs and LOS from the estimated beta-coefficients in the multivariable model. We calculated the proportion of variation in the outcomes explained by the generalized linear models using pseudo R-squared measured by the Kullback-Leibler divergence.25 As a companion analysis, we repeated estimates for AKI-D when dialysis was initiated within 7 days of hospital admission because subsequent events during the hospital stay would more likely be attributable to the AKI episode. All analyses presented account for the NIS survey design (weighting and stratification) and subpopulation measurements to generate national estimates. We created the cohort using the Statistical Analysis System software, version 9.4 (SAS Institute, Cary, North Carolina) and conducted the analyses using StataMP, version 14.0 (Stata Corporation, College Station, Texas).
RESULTS
Patient Characteristics
Between January 1 and December 31, 2012, there were 36,484,846 hospitalization records available in the NIS; 948,875 adult records (2.6%) were classified as having ESRD and 29,763,649 (81.6%) were included in the final cohort. Within the final cohort, 3,031,026 (10.2%) hospitalizations were complicated by AKI, of which 106,515 (3.5%) required dialysis (corresponding to 0.36% of the analytic cohort) (Figure 1).
Compared to patients without AKI, patients with AKI were older (69.0 years vs. 55.8 years) and a larger proportion were male (52.8% vs. 38.9%). All measured comorbidities were more prevalent in patients with AKI. Patients with AKI also underwent more hospital procedures than patients without AKI (Table 1).
Hospitalization Costs
Figures 2A and 2B show unadjusted and multivariable-adjusted mean increases in cost of a hospitalization with AKI and AKI-D compared to a hospitalization without AKI. Extrapolating to the 2012 population estimates in Table 1 for AKI and AKI-D, increases in cost related to AKI ranged from $24.0 billion (unadjusted) to $5.4 billion (adjusted) and for AKI-D ranged from $4.5 billion (unadjusted) to $1.2 billion (adjusted).
Mean increases in the cost of a hospitalization for AKI exceeded costs associated with other acute medical conditions such as myocardial infarction and gastrointestinal bleeding. Costs associated with AKI were similar to hospitalizations for stroke, acute pancreatitis, and pneumonia. Costs of AKI-D exceeded those related to sepsis and venous thromboembolic disease (Table 2). AKI was the most common of the acute medical conditions examined (3,031,026 patients, 10.2%).
Major drivers of cost included urban and teaching hospitals, hospitals in the Southern US (relative to other regions), hospitals with a larger number of beds, most acute medical conditions, cancer, and hospital procedures. Older age was associated with higher costs with non-AKI hospitalizations but lower costs with AKI hospitalizations (0.67% vs. -0.44%, per year of age). Determinants of hospital costs are shown in Supplemental Table 2. Generally, hospital procedures accounted for the largest relative increases in cost.
Length of Stay
Figures 2A and 2B show unadjusted and multivariable-adjusted mean increases in LOS for a hospitalization with AKI and AKI-D compared to a hospitalization without AKI. Extrapolating to the 2012 population estimates in Table 1 for AKI and AKI-D, increases in LOS related to AKI ranged from 9.8 million days (unadjusted) to 3.3 million days (adjusted) and for AKI-D ranged from 1.2 million days (unadjusted) to 0.4 million days (adjusted).
When compared to other acute medical conditions, the mean increase in LOS of an AKI hospitalization resembled the order for mean increases in cost (Table 2). Major drivers of LOS also resembled drivers of costs, with the exception of some common cardiovascular procedures (percutaneous transluminal coronary angioplasty, abdominal aortic aneurysm repair, and carotid endarterectomy) that were associated only with prolonged LOS in the AKI and AKI-D groups (Supplemental Table 3).
Companion Analysis
In an analysis of 78,220 patients who developed AKI-D within 7 days of hospital admission (73% of AKI-D cases), increases in cost ranged from $32,133 (unadjusted) to $8594 (adjusted) and increases in LOS ranged from 8.4 days (unadjusted) to 2.9 days (adjusted) compared to patients without AKI.
DISCUSSION
We found that hospitalizations complicated by AKI were more costly—between $1800 and $7900—than hospitalizations that did not involve AKI, which indicates that AKI could be responsible for billions of dollars of annual healthcare spending. Relative to several other acute medical conditions, AKI was more common and expensive; when AKI was severe enough to require dialysis, costs of AKI exceeded all other acute medical conditions by a large margin.
Several single-center and regional studies have highlighted the association of AKI with hospital costs and LOS. In a single-center study conducted in the late 1990s, Chertow et al14 described mean cost increases between $4900 (adjusted) and $8900 (unadjusted) and LOS increases of 3.5 days (adjusted) using serum creatinine criteria to define AKI.14 These higher adjusted estimates may result because their multivariable models did not adjust for several major determinants of cost, including several procedures and hospital-level variables. A study at the same academic center in 2010, which adjusted for some procedures, found AKI was associated with a 2.8-day increase in LOS and a $7082 increase in costs;2 however, this study also could not adjust for hospital-level variables because of the single-center design. Fischer et al15 were able to adjust for hospital teaching status in their study that included 23 local hospitals. Similar to our results, teaching hospitals were associated with an approximately17% increase in cost compared to nonacademic hospitals. However, this study excluded patients who required critical care or mechanical ventilation, which limits the generalizability of their cost estimates. Another limitation of these 3 studies is that they were all conducted in Massachusetts. Beyond the US, the economic burden of AKI has been studied in England where the annual cost of AKI-related inpatient care has been estimated at $1.4 billion.16 In addition to incomplete procedure and hospital-level adjustment, this study is limited by its ascertainment of AKI and costs, which was extrapolated from 1 hospital region to the rest of England.
Our study adds to the existing evidence in a number of ways. It uses nationally representative data to determine a lower and an upper limit of increases in cost and LOS attributable to AKI. The adjusted value is likely overly conservative; it minimizes the influence of events that are attributable to AKI and does not account for complications that may be caused by, or otherwise related to, AKI. The unadjusted value is likely an overestimate, attributing events during an AKI hospitalization to the AKI episode, even if they precede AKI. In clinical practice, most patients fall between these 2 extremes. Therefore, we suggest using the adjusted and unadjusted estimates to provide a range of the cost and LOS increases that are attributable to AKI. This interpretation is also supported by the companion analysis that minimizes the effect of pre-AKI events, where the unadjusted cost and LOS estimates for AKI-D occurring early during a hospitalization fell between the unadjusted and adjusted estimates for the main AKI-D analysis. Therefore, our data suggest that each hospitalization complicated by AKI is associated with a cost increase between $1800 and $7900 and an LOS increase between 1.1 days and 3.2 days. Not surprisingly, the burden of AKI-D was more pronounced with a cost increase between $11,000 and $42,100 and an LOS increase between 3.9 days and 11.5 days.
Unlike previous studies, these analyses are fully adjusted for procedures and multiple hospital-level variables (such as teaching status, region, and bed number). These adjustments are important because procedures account for much of the incremental cost and LOS associated with AKI, and each hospital-level variable may increase the cost and LOS of an AKI hospitalization by 10% to 25% (Supplemental Tables 2 and 3). Even though the relative increases in cost and LOS associated with different comorbidities and procedures were largely similar between patients with and without AKI, the absolute increases were usually larger in patients with AKI rather than without AKI because of their higher baseline estimates. We also observed that each year of age was associated with increased costs in patients without AKI, but decreased costs in patients with AKI. We suspect this difference is due to the lesser (and ultimately less costly) injury required to induce AKI in elderly patients who have less physiologic reserve.26 Moreover, we placed the burden of AKI in relation to other acute medical conditions, where its total estimated annual costs of $5.4 billion were exceeded only by the $7.7 billion attributed to sepsis.
Our results emphasize that AKI is an important contributor to hospital costs and LOS. Despite these consequences, there have been very few innovations in the prevention and management of AKI over the last decade.27,28 The primary treatment for severe AKI remains dialysis, and recent clinical trials suggest that we may have reached a dose plateau in the value of dialytic therapy.8,29 Several opportunities, such as advances in basic science and clinical care, may improve the care of patients with AKI. Translational research challenges in AKI have been reviewed, with treatment strategies that include hemodynamic, inflammatory, and regenerative mechanisms.28, 30 In a recent report from the National Confidential Enquiry into Patient Outcome and Death in the United Kingdom, 30% of AKI episodes that occurred inhospital were preventable, and only 50% of patients with AKI were deemed to have received good care.31 Our results suggest that even small progress in these areas could yield significant cost savings. One starting point suggested by our findings is a better understanding of the reasons underlying the association between hospital-level variables and differences in cost and LOS. Notably, there have been few efforts to improve AKI care processes on the same scale as sepsis,32 myocardial infarction,33,34 stroke,35 and venous thromboembolic disease.36
Strengths of this study include cost and LOS estimates of AKI from different hospitals across the US, including academic and community institutions. As a result, our study is significantly larger and more representative of the US population than previously published studies. Moreover, we utilized data from 2012, which accounts for the increasing incidence of AKI and recent advances in critical care medicine. We were also able to adjust for comorbid conditions, procedures, severity of illness, and hospital-level variables, which provide a conservative lower limit of the burden of AKI on hospitalized patients.
Our study has limitations. First, we used administrative codes to identify patients with AKI. The low sensitivity of these codes suggests that many patients with milder forms of AKI were probably not coded as such. Accordingly, our findings should be generally applicable to patients with moderate to severe AKI rather than to those with mild AKI.21,22 Second, the NIS lacks granularity on the details and sequence of events during a hospitalization. As a result, we could not determine the timing of an AKI episode during a hospitalization or whether a diagnosis or procedure was the cause or consequence of an AKI episode (ie, day 1 as the reason for admission vs. day 20 as a complication of surgery). Both the timing and cause of an AKI episode may influence cost and LOS, which should be considered when applying our results to patient care. We did not attempt to estimate the costs associated with comorbidities such as congestive heart failure and chronic obstructive pulmonary disease because we could not determine the acuity of disease in the NIS. Third, despite our efforts, residual confounding is likely, especially since administrative data limit our ability to capture the severity of comorbid conditions and the underlying illness. Fourth, the NIS does not contain individual patient identifiers, so multiple hospitalizations from the same patient may be represented.
Even our most conservative estimates still attribute $5.4 billion and 3.3 million hospital-days to AKI in 2012. These findings highlight the need for hospitals, policymakers, and researchers to recognize the economic burden of AKI. Future work should focus on understanding hospital-level differences in AKI care and the effect on patient morbidity and mortality. National and hospital-wide quality improvement programs are also needed. Such initiatives have commenced in the United Kingdom,37 and similar efforts are needed in North America to develop and coordinate cost-effective strategies to care for patients with AKI.
Disclosures
Samuel A. Silver, MD, MSc, is supported by a Kidney Research Scientist Core Education and National Training Program Post-Doctoral Fellowship (co-funded by the Kidney Foundation of Canada, Canadian Society of Nephrology, and Canadian Institutes of Health Research). Glenn M. Chertow, MD, MPH, is supported by a K24 mid-career mentoring award from NIDDK (K24 DK085446). These funders had no role in the design and conduct of the study; collection, management, analysis, and interpretation of the data; preparation, or approval of the manuscript; or decision to submit the manuscript for publication. The authors report no financial conflicts of interest.
1. Waikar SS, Liu KD, Chertow GM. Diagnosis, epidemiology and outcomes of acute kidney injury. Clin J Am Soc Nephrol. 2008;3:844-861. PubMed
2. Zeng X, McMahon GM, Brunelli SM, Bates DW, Waikar SS. Incidence, outcomes, and comparisons across definitions of AKI in hospitalized individuals. Clin J Am Soc Nephrol. 2014;9:12-20. PubMed
3. Susantitaphong P, Cruz DN, Cerda J, et al. Acute Kidney Injury Advisory Group of the American Society of Nephrology. World incidence of AKI: a meta-analysis. Clin J Am Soc Nephrol. 2013;8:1482-1493. PubMed
4. Dasta JF, Kane-Gill SL, Durtschi AJ, Pathak DS, Kellum JA. Costs and outcomes of acute kidney injury (AKI) following cardiac surgery. Nephrol Dial Transplant. 2008;23:1970-1974. PubMed
5. Hobson C, Ozrazgat-Baslanti T, Kuxhausen A, et al. Cost and mortality associated with postoperative acute kidney injury. Ann Surg. 2015;261:1207-1214. PubMed
6. Vieira JM Jr, Castro I, Curvello-Neto A, et al. Effect of acute kidney injury on weaning from mechanical ventilation in critically ill patients. Crit Care Med. 2007;35:184-191. PubMed
7. Selby NM, Kolhe NV, McIntyre CW, et al. Defining the cause of death in hospitalised patients with acute kidney injury. PLoS One. 2012;7:e48580. PubMed
8. Palevsky PM, Zhang JH, O’Connor TZ, et al. Intensity of renal support in critically ill patients with acute kidney injury. N Engl J Med. 2008;359(1):7-20. PubMed
9. Uchino S, Bellomo R, Morimatsu H, et al. Continuous renal replacement therapy: a worldwide practice survey. The beginning and ending supportive therapy for the kidney (B.E.S.T. kidney) investigators. Intensive Care Med. 2007;33:1563-1570. PubMed
10. Siew ED, Davenport A. The growth of acute kidney injury: a rising tide or just closer attention to detail? Kidney Int. 2015;87:46-61. PubMed
11. Hsu RK, McCulloch CE, Dudley RA, Lo LJ, Hsu CY. Temporal changes in incidence of dialysis-requiring AKI. J Am Soc Nephrol. 2013;24:37-42. PubMed
12. Xue JL, Daniels F, Star RA, et al. Incidence and mortality of acute renal failure in Medicare beneficiaries, 1992 to 2001. J Am Soc Nephrol. 2006;17:1135-1142. PubMed
13. Saran R, Li Y, Robinson B, et al. US Renal Data System 2015 annual data report: epidemiology of kidney disease in the United States. Am J Kidney Dis. 2016;67(3 suppl 1):S1-S434. PubMed
14. Chertow GM, Burdick E, Honour M, Bonventre JV, Bates DW. Acute kidney injury, mortality, length of stay, and costs in hospitalized patients. J Am Soc Nephrol. 2005;16:3365-3370. PubMed
15. Fischer MJ, Brimhall BB, Lezotte DC, Glazner JE, Parikh CR. Uncomplicated acute renal failure and hospital resource utilization: a retrospective multicenter analysis. Am J Kidney Dis. 2005;46:1049-1057. PubMed
16. Kerr M, Bedford M, Matthews B, O’Donoghue D. The economic impact of acute kidney injury in England. Nephrol Dial Transplant. 2014;29:1362-1368. PubMed
17. De Smedt DM, Elseviers MM, Lins RL, Annemans L. Economic evaluation of different treatment modalities in acute kidney injury. Nephrol Dial Transplant. 2012;27:4095-5101. PubMed
18. Srisawat N, Lawsin L, Uchino S, Bellomo R, Kellum JA; BEST Kidney Investigators. Cost of acute renal replacement therapy in the intensive care unit: results from The Beginning and Ending Supportive Therapy for the Kidney (BEST Kidney) study. Crit Care. 2010;14:R46. PubMed
19. Agency for Healthcare Research and Quality. Healthcare Cost and Utilization Project (HCUP). Overview of the National (Nationwide) Inpatient Sample (NIS). Available at: http://www.hcup-us.ahrq.gov/nisoverview.jsp. Accessed January 10, 2016.
20. Lenihan CR, Montez-Rath ME, Mora Mangano CT, Chertow GM, Winkelmayer WC. Trends in acute kidney injury, associated use of dialysis, and mortality after cardiac surgery, 1999 to 2008. Ann Thorac Surg. 2013;95:20-28. PubMed
21. Waikar SS, Wald R, Chertow GM, et al. Validity of international classification of diseases, ninth revision, clinical modification codes for acute renal failure. J Am Soc Nephrol. 2006;17:1688-1694. PubMed
22. Grams ME, Waikar SS, MacMahon B, Whelton S, Ballew SH, Coresh J. Performance and limitations of administrative data in the identification of AKI. Clin J Am Soc Nephrol. 2014;9:682-689. PubMed
23. Blough DK, Madden CW, Hornbrook MC. Modeling risk using generalized linear models. J Health Econ. 1999;18:153-171. PubMed
24. Malehi AS, Pourmotahari F, Angali KA. Statistical models for the analysis of skewed healthcare cost data: a simulation study. Health Econ Rev. 2015;5:11. PubMed
25. Cameron AC, Windmeijer FA. An R-squared measure of goodness of fit for some common nonlinear regression models. J Econometrics. 1997(77):329-342.
26. Coca SG. Acute kidney injury in elderly persons. Am J Kidney Dis. 2010;56:122-131. PubMed
27. Bonventre JV, Basile D, Liu KD, et al; Kidney Research National Dialogue (KRND). AKI: a path forward. Clin J Am Soc Nephrol. 2013;8:1606-1608. PubMed
28. Okusa MD, Rosner MH, Kellum JA, Ronco C; Acute Dialysis Quality Initiative XIII Workgroup. Therapeutic targets of human AKI: harmonizing human and animal AKI. J Am Soc Nephrol. 2016;27:44-48. PubMed
29. Pannu N, Klarenbach S, Wiebe N, Manns B, Tonelli M; Alberta Kidney Disease Network. Renal replacement therapy in patients with acute renal failure: a systematic review. JAMA. 2008;299:793-805. PubMed
30. Silver SA, Cardinal H, Colwell K, Burger D, Dickhout JG. Acute kidney injury: preclinical innovations, challenges, and opportunities for translation. Can J Kidney Health Dis. 2015;2:30. PubMed
31. Stewart J, Findlay G, Smith N, Kelly K, Mason M. Adding insult to injury: a review of the care of patients who died in hospital with a primary diagnosis of acute kidney injury (acute renal failure). A report by the National Confidential Enquiry into Patient Outcome and Death 2009. Available at: http://www.ncepod.org.uk/2009aki.html. Accessed April 4, 2016.
32. Society of Critical Care Medicine. Surviving Sepsis Campaign. Available at: http://www.survivingsepsis.org /Pages/default.aspx. Accessed April 3, 2016.
33. Mehta RH, Montoye CK, Gallogly M, et al; GAP Steering Committee of the American College of Cardiology. Improving quality of care for acute myocardial infarction: The Guidelines Applied in Practice (GAP) Initiative. JAMA. 2002;287:1269-1276. PubMed
34. Lewis WR, Peterson ED, Cannon CP, et al. An organized approach to improvement in guideline adherence for acute myocardial infarction: results with the Get With The Guidelines quality improvement program. Arch Intern Med. 2008;168:1813-1819. PubMed
35. Schwamm LH, Fonarow GC, Reeves MJ, et al. Get With the Guidelines–stroke is associated with sustained improvement in care for patients hospitalized with acute stroke or transient ischemic attack. Circulation. 2009;119:107-115. PubMed
36. Maynard G. Preventing Hospital-associated Venous Thromboembolism: A Guide for Effective Quality Improvement. 2nd ed. Rockville, MD: Agency for Healthcare Research and Quality; October 2015. AHRQ Publication No. 16-0001-EF.
37. NHS England: Acute kidney injury programme. Available at: http://www.Thinkkidneys.nhs.uk. Accessed April 3, 2016.
© 2017 Society of Hospital Medicine
Music Therapy Increases Comfort and Reduces Pain in Patients Recovering From Spine Surgery
Take-Home Points
- Music therapists use patient-preferred live music, increasing neurologic cues that enhance movement—a seminal recovery function in postoperative spine patients.
- Music therapy is an evidence-based, integrative treatment addressing body, mind, and spirit.
- Tension release through music therapy can serve as a critical mechanism for building resilience related to pain management.
- Music therapy and music medicine are distinct forms of clinical practice that focus on mind-body integration in the healing process.
- Music therapists, board-certified and licensed by the state as recognized healthcare professionals, address pain management, which is an increasing subspecialty in postoperative care.
About 70% of people in the United States experience at least 1 episode of back pain in their lifetime,1 and more than 5 million are temporarily or permanently disabled by spinal disorders.2-4 Some require surgery, which may rectify injury, but pain during recovery is often inevitable, and the road to recovery is not guaranteed to be smooth.5-20
Postoperative spine patients are at major risk for pain management challenges.14,15,18,20 Treatment is primarily pharmacologic and based on the surgical team’s pain management orders. Nursing care consists of monitoring the airway, vital signs, and neurovascular status and having patients rate their pain on a visual analog scale (VAS; 0 = no pain, 10 = worst pain imaginable). Nurses have the challenge of monitoring and continually assessing to make sure patients are achieving the optimal outcomes, particularly during the immediate postoperative period, when pain and anxiety are prominently increased.
Variability in spine surgery outcomes can be explained at least partly on the basis of prognostic psychological factors, including hypochondriasis, hysteria, depression, and poor pain coping strategies (eg, catastrophizing).21 In spine surgery patients, kinesiophobia (fear of moving) is a common component of distress that can impede recuperation.21-23
Rationale for Live Music
Pain is subjective and personal, and warrants an individualized approach to care. There is a body of music medicine research on the use of recorded music in modulating psychological and physiological factors in pain perception.30,32,34-54 This research supports the unique relationship of music to well-being, and the understanding that controlling any of these factors affects the duration, intensity, and quality of that experience.41,43,52
These findings provide incentive for breathing-entrained music therapy interventions, which enhance the relaxation response and release of pain-related tension;32,55-58 empower patients to unlock physical and emotional tension;32,57,58 provide a channel for expression and body movement; and enhance blood flow and/or alleviate pain by activating neurologic areas involved in the experience of pain.59-62Studies have found that physical endurance may be enhanced when movement is rhythmically coordinated with a musical stimulus.63-66 Music may prolong physical endurance by inhibiting psychological feedback associated with physical exertion related to fatigue, which may translate into accelerated recovery periods. When we listen to a rhythmic sound, our brains tend to automatically synchronize, or entrain, to external rhythmic cues that can stimulate increased motor control and coordination.63 Sound can arouse and raise the excitability of spinal motor neurons mediated by auditory-motor neuronal connections on the brain stem and spinal cord level.64-66 Rhythmically organized sounds serve as a neurological function in our capacity to organize predictable timing cues that are apparent in music, and may result in an effective treatment intervention in recovery.63,64
Music Therapy in Recovery From Spine Surgery
In music therapy, music is used within a therapeutic relationship to support or affect change in the patient and the treatment regimen.32,33,56-58 Research on music therapy with patients who are recovering from spine surgery is scant.67-69 Kleiber and Adamek67 studied perceptions of music therapy in 8 adolescents after spinal fusion surgery. In their study, a music therapist provided patients with a postoperative music therapy session focusing on the use of patient-preferred live music for relaxation and expression. Although their qualitative query was based on a therapeutic approach similar to that used in the present study, only 1 session was offered during the recovery period, and follow-up was conducted by survey invitation and telephone. In addition, the number of participants was small, and there was no quantitative measure of pain or other symptoms.
Another study focused on the effects of listening to music on pain intensity and distress after spine surgery.68 Patients in the study’s music group made their selections from prerecorded classical music and domestic and international popular songs from various genres and listened to their chosen recordings 30 minutes a day. Although the study was not a music therapy study per se, it showed a positive impact of listening to music on anxiety and pain perception in 60 adults who were randomly assigned to the music group or to a non-music control group (n = 30 in each). Differences between the music and control groups’ VAS ratings of anxiety (Ps = .018-.001) and pain (P = .001) were statistically significant.
Different from our study, the aforementioned studies did not include tension release–focused live music offered within a therapeutic relationship. Our 1.5-year pilot study, conducted prior to the present study indicated that music therapy led to increased resilience and recovery mechanisms.58
Methods
Our mixed-methods study design combined standard medical treatment with integrative music therapy interventions based on pain assessments to better understand the effects of music therapy on the recovery of patients after spine surgery.
The Spine Institute of New York within the Department of Orthopedic Surgery at Mount Sinai Beth Israel provides surgical treatment of common spinal cord conditions. Prioritizing patient satisfaction and positive outcomes,27,28 the institute integrates music therapy through the Louis Armstrong Center for Music and Medicine to enhance treatment of pain symptoms.
Patients were recruited by the research team as per the daily surgical schedule, or through referral by the medical team or patient care navigator. Sixty patients (35 female, 25 male) ranging in age from 40 to 55 years underwent anterior, posterior, or anterior-posterior spinal fusion and were enrolled in the study after signing a participation consent form. Minorities, women, and patients with Medicaid and Medicare were included. Patients who received a diagnosis of clinical psychosis or depression prior to spine injury were excluded.
The experimental group received music therapy plus standard care (medical and nursing care with scheduled pharmacologic pain intervention), and a wait-listed control group received standard care only. A randomization chart created by a blinded statistician who did not have access to the patient census determined the intervention–nonintervention schedule. Patients in the music therapy group received one 30-minute music therapy session during an 8-hour period within 72 hours after surgery.
For both groups, measurements were completed before and after the study window. Control patients were offered music therapy after completion of the post-intervention surveys in order to minimize the ethical dilemma of denying potentially helpful pain intervention. For this same reason, both groups were given the option of receiving follow-up music therapy sessions for the duration of their hospitalization.
The research team consisted of 2 licensed, board-certified music therapists. In addition, Master’s-level music therapy interns completing clinical hours as part of the trajectory for board certification served on the research team over the 5-year period 2009 to 2014, and 13 blinded research assistants helped with enrolling and collecting data on patients.
Intervention
Each music therapy session included a warm-up phase of verbal or musical discourse. Next was the treatment phase, which was based on patient need as assessed during warm-up. Treatment options included use of patient-preferred live music that supported tension release/relaxation through incentive-based clinical improvisation, singing, and/or rhythmic drumming or through breathwork and visualization. Psychoeducation about mind–body awareness through the use of breath and imagery was introduced and explained by the therapist at this time.
The improvised music intervention was focused on making salient the natural harmonic tension-resolution cycles that occur in music and that were entrained to the patient’s presentation (respiratory rate, verbal report, clinical presentation). When patient-preferred precomposed songs were used, tension resolution was achieved by sustaining cadence and resolution, also entrained to the patient’s respiratory cycles.32,57,58
After the music therapy intervention, a period of closure or integration was facilitated by the therapist contingent on the patient’s degree of alertness. If awake, the patient was supported in a reflexive process of thoughts, impressions, or issues that may have contributed to the overall experience. If the patient was asleep, the researcher returned within 30 minutes for post-intervention interviewing. Interview information was recorded in a qualitative post-participation survey. To prevent bias, researchers who were not the treating clinicians conducted the surveys.
Outcome Measures
Both primary and secondary outcome measures were collected before and after the intervention. The primary outcome measure was VAS pain ratings, and the secondary outcome measures were scores on the Hospital Anxiety and Depression Scale (HADS), the Tampa Scale for Kinesiophobia (TSK), and the Color Analysis Scale (CAS).
VAS. With the VAS, images are used to rate pain. The scale has points labeled 0 to 10 and corresponding faces representing progression in pain intensity. The scale is quickly rendered and can be interpreted according to the patient’s recovery phase at time of rendering.
HADS. The HADS70 provides a specific baseline for anxiety and depression as an indicator of how the patient might fare during hospitalization (admission through recovery and discharge).
TSK. The TSK71 provides insight into the patient’s perception of fear-related movement, which is an important factor in this study because of the movement required for rehabilitation. We used a shortened version of the TSK to accommodate the sensitive threshold for pain tolerance and pharmacologic side effects commonly experienced by spine patients.
CAS. The CAS was developed at the Louis Armstrong Center for Music and Medicine to assess comorbidities and dynamic aspects of pain. Through a coloring exercise, patients illustrate their pain experience, which gives tangible form to the abstract experience of pain.
Coding
We collected patients’ demographic data, including age, sex, and diagnoses. Clinical indicators of the preoperative baseline included lifestyle, surgical history, and prior experience with music or other mind–body strategies for self-regulation.
As fundamental to qualitative methodology,72,73 the reported responses to questions were grouped into themes that were peer-tested with members of the research team before and during the coding process. 
VAS, HADS, and TSK data were tabulated by blinded research assistants and analyzed by a statistician. Patients were identified by number assignment, and their data and personal information were kept confidentially stored.
Statistical Methods
Means and standard deviations were used for continuous variables, and frequencies (percentages) for categorical variables. All outcomes were analyzed on an intent-to-treat basis. Repeated-measures analysis of variance was used to compare changes in outcomes from before to after intervention for the music and control groups. In particular, a statistically significant Group (music vs control) × Time (before vs after intervention) interaction would support the hypothesis that there would be more benefit (less pain) in the music group as a result of the music therapy. For all tests, significance was set at P < .05. SPSS Version 20 (IBM) was used for all statistical analyses. Based on previously found differences in heart rate and mobility,31 we assumed an effect size of 0.71 for the difference between music and control (no music), which would require 32 patients per group to achieve a power of 0.8 with an α of 0.05.
Results
Of the 136 patients who were asked to participate in the study, 76 were not enrolled; the other 60 were equally assigned to either the control group or the music therapy group (n = 30 in each) according to randomization indicated by a blinded statistician (Figure 1). 

Table 2 lists the pre-intervention and post-intervention comparisons of the main outcomes between groups. 

The emerging themes of the responses are listed in Tables 3 and 4 and are explained here:
Relationship with music was coded for significance and included reports of music as a resource accessed for stimulation and/or relaxation through listening; direct involvement with instrument playing; and history of music training. 
Perceptions of surgical outcome in patients’ responses were coded across 3 themes: (1) optimistic (belief and hope in returning to original baseline of functionality), (2) indifferent (neither hopeful nor cynical about results of surgery), and (3) pessimistic (belief that nothing will restore the quality of life that existed before the spinal condition).
The CAS helped us better understand the diversity and complexity of the pain experience.
Discussion
Our hospital has the unique capability of providing music therapy to postoperative and other hospitalized patients. In this study, we compared the impact of a structured postoperative music therapy program on spine patients relative to control patients who did not receive music therapy after spine surgery.
We found a significant benefit in VAS pain levels (>1 point) but no statistically significant differences in HADS Anxiety, HADS Depression, or TSK scores. Although a 2-point difference is usually considered clinically significant, the degree of change in the music group is notable for having been achieved by nonpharmacologic means with scant chance of adverse effects. We suspect the lack of significant change in HADS Anxiety, HADS Depression, and TSK scores is attributable to the narrow study window. Given the observational data from our pilot study58 and ongoing results with spine patients,32 it seems clear that both mood state and resilience in coping are enhanced through an ongoing relationship with music therapy.
The study of a population as vulnerable as patients recovering from spine surgery raises many issues for providers and researchers. Although it is worthwhile to determine the efficacy of integrative modalities in serving these patients, the request for participation in a protocol at such a vulnerable time was often resisted. During our pilot work, it became clear that the ability of potential subjects to comprehend and complete protocol surveys was impacted by adverse effects, including sedation drowsiness; respiratory depression; nausea and vomiting; pruritus; and urinary retention caused by the medications used for postoperative pain management. Consequently, after piloting 5 cases before the main study, we extended the enrollment window to 72 hours.
Other unforeseen intrinsic or external obstacles were identified: Patient-related issues—including availability, level of interest in participation, and inability to participate because of the medication adverse effects mentioned.
Staff investment/education—addressed over the first 3 study years with several in-services, starting with the surgical team and continuing with nursing and support staff in various combinations. These meetings led to the creation of an Institutional Review Board (IRB) approved educational sheet for inclusion in the information packet given to surgical patients on registration.
Programming interruptions—caused by the convergence of several unanticipated factors, including a delay in expedited review of the IRB renewal during the year of Hurricane Sandy and an interruption in the spine team’s service for administrative and program modification.
Conclusion
Music therapy interventions (eg, use of patient-preferred live music) offered within a therapeutic relationship favorably affected pain perceptions in patients recovering from spine surgery. This effect was achieved through several therapeutic entry points, including support of expression and opportunities for emotional catharsis.
At the core of music therapy’s efficacy is individualized treatment, through which patients are supported in their recovery of “self.” Measurable benefits—including increased comfort; reduced pain; improved gait; increased range of motion, endurance, and ability to relax; and empowerment to actively participate in one’s own care through daily activities imbued with an enhanced sense of agency—are of cardinal importance, as they may lead to quicker recovery perceptions and enhanced quality of life.
Am J Orthop. 2017;46(1):E13-E22. Copyright Frontline Medical Communications Inc. 2017. All rights reserved.
1. Miller B, Gatchel RJ, Lou L, Stowell A, Robinson R, Polatin PB. Interdisciplinary treatment of failed back surgery syndrome (FBSS): a comparison of FBSS and non-FBSS patients. Pain Pract. 2005;5(3):190-202.
2. Aebi M. The adult scoliosis. Eur Spine J. 2005;14(10):925-948.
3. Engstrom JW, Deyo, RA. Back and neck pain. In: Kasper DL, Braunwald E, Fauci AS, et al, eds. Harrison’s Principles of Internal Medicine, 19th edition. New York, NY: McGraw-Hill; 2007:207-214.
4. Cavanaugh JM, Lu Y, Chen C, Kallakuri S. Pain generation in lumbar and cervical facet joints. J Bone Joint Surg Am. 2006;88(suppl 2):63-67.
5. Hart RA, Prendergast MA. Spine surgery for lumbar degenerative disease in elderly and osteoporotic patients. Instr Course Lect. 2007;56:257-272.
6. Boswell MV, Trescot AM, Datta S, et al; American Society of Interventional Pain Physicians. Interventional techniques: evidence-based practice guidelines in the management of chronic spinal pain. Pain Physician. 2007;10(1):7-111.
7. Weinstein JN, Lurie JD, Tosteson TD, et al. Surgical versus nonsurgical treatment for lumbar degenerative spondylolisthesis. N Engl J Med. 2007;356(22):2257-2270.
8. Weinstein JN, Tosteson TD, Lurie JD, et al. Surgical vs nonoperative treatment for lumbar disk herniation: the Spine Patient Outcomes Research Trial (SPORT): A randomized trial. JAMA. 2006;296(20):2441-2450.
9. Malmivaara A, Slätis P, Heliövaara M, et al; Finnish Lumbar Spinal Research Group. Surgical or nonoperative treatment for lumbar spinal stenosis? A randomized controlled trial. Spine. 2007;32(1):1-8.
10. Chang Y, Singer DE, Wu YA, Keller RB, Atlas SJ. The effect of surgical and nonsurgical treatment on longitudinal outcomes of lumbar spinal stenosis over 10 years. J Am Geriatr Soc. 2005;53(5):785-792.
11. Cowan JA Jr, Dimick JB, Wainess R, Upchurch GR Jr, Chandler WF, La Marca F. Changes in the utilization of spinal fusion in the United States. Neurosurgery. 2006;59(1):15-20.
12. Lonner BS, Scharf CS, Antonacci D, Goldstein Y, Panagopoulos G. The learning curve associated with thoracoscopic spinal instrumentation. Spine. 2005;30(24):2835-2840.
13. Lonner BS, Kondrachov D, Siddiqi F, Hayes V, Scharf C. Thoracoscopic spinal fusion compared with posterior spinal fusion for the treatment of thoracic adolescent idiopathic scoliosis. J Bone Joint Surg Am. 2006;88(5):1022-1034.
14. Boakye M, Patil CG, Santarelli J, Ho C, Tian W, Lad SP. Cervical spondylotic myelopathy: complications and outcomes after spinal fusion. Neurosurgery. 2008;62(2):455-461.
15. Boakye M, Patil CG, Santarelli J, Ho C, Tian W, Lad SP. Laminectomy and fusion after spinal cord injury: national inpatient complications and outcomes. J Neurotrauma. 2008;25(3):173-183.
16. Dekutoski MB, Norvell DC, Dettori JR, Fehlings MG, Chapman JR. Surgeon perceptions and reported complications in spine surgery. Spine. 2010;35(9 suppl):S9-S21.
17. Nasser R, Yadla S, Maltenfort MG, et al. Complications in spine surgery. J Neurosurg Spine. 2010;13(2):144-157.
18. Patil CG, Santarelli J, Lad SP, Ho C, Tian W, Boakye M. Inpatient complications, mortality, and discharge disposition after surgical correction of idiopathic scoliosis: a national perspective. Spine J. 2008;8(6):904-910.
19. Rampersaud YR, Moro ER, Neary MA, et al. Intraoperative adverse events and related postoperative complications in spine surgery: implications for enhancing patient safety founded on evidence-based protocols. Spine. 2006;31(13):1503-1510.
20. Shen Y, Silverstein JC, Roth S. In-hospital complications and mortality after elective spinal fusion surgery in the United States: a study of the Nationwide Inpatient Sample from 2001 to 2005. J Neurosurg Anesthesiol. 2009;21(1):21-30.
21. Picavet HSJ, Vlaeyen JWS, Schouten JSAG. Pain catastrophizing and kinesiophobia: predictors of chronic low back pain. Am J Epidemiol. 2002;156(11):1028-1034.
22. French DJ, France CR, Vigneau F, French JA, Evans RT. Fear of movement/(re)injury in chronic pain: a psychometric assessment of the original English version of the Tampa Scale for Kinesiophobia (TSK). Pain. 2007;127(1-2):42-51.
23. Goubert L, Crombez G, Van Damme S, Vlaeyen JW, Bijttebier P, Roelofs J. Confirmatory factor analysis of the Tampa Scale for Kinesiophobia: invariant two-factor model across low back pain patients and fibromyalgia patients. Clin J Pain. 2004;20(2):103-110.
24. Selimen D, Andsoy II. The importance of a holistic approach during the perioperative period. AORN J. 2011;93(4):482-487.
25. Zheng Z. Xue CC. Pain research in complementary and alternative medicine in Australia: a critical review. J Altern Complement Med. 2013;19(2):81-91.
26. Wright J, Adams D, Vohra S. Complementary, holistic, and integrative medicine: music for procedural pain. Pediatr Rev. 2013;34(11):e42-e46.
27. McCann PD. Orthopedic surgery and integrative medicine—strange bedfellows. Am J Orthop. 2009;38(2):66, 71.
28. McCann PD. Customer satisfaction: are hospitals “hospitable”? Am J Orthop. 2006;35(2):59.
29. Joanna Briggs Institute. The Joanna Briggs Institute best practice information sheet: music as an intervention in hospitals. Nurs Health Sci. 2011;13(1):99-102.
30. Spintge R. Thirty-five years of anxiolytic music (AAM) in pain and aversive clinical settings. In: Mondanaro J, Sara G, eds. Music and Medicine: Integrative Models in the Treatment of Pain. New York, NY: Satchnote Press; 2013:29-42.
31. Cepeda MS, Carr DB, Lau J, Alvarez H. Music for pain relief. Cochrane Database Syst Rev. 2006;(2):CD004843.
32. Mondanaro J. Music therapy based release strategies in the treatment of acute and chronic pain: an individualized approach. In: Mondanaro J, Sara G, eds. Music and Medicine: Integrative Models in the Treatment of Pain. New York, NY: Satchnote Press; 2013:133-148.
33. Quentzel S. Music has charms to soothe a savage breast. In: Mondanaro J, Sara G, eds. Music and Medicine: Integrative Models in the Treatment of Pain. New York, NY: Satchnote Press; 2013:11-28.
34. Ko YL. Lin PC. The effect of using a relaxation tape on pulse, respiration, blood pressure and anxiety levels of surgical patients. J Clin Nurs. 2012;21(5-6):689-697.
35. Roy M, Lebuis A, Hugueville L, Peretz I, Rainville P. Spinal modulation of nociception by music. Eur J Pain. 2012;16(6):870-877.
36. Roy M, Peretz I, Rainville P. Emotional valence contributes to music-induced analgesia. Pain. 2008;134(1-2):140-147.
37. Schröter T. Medicine needs music! Music therapy for chronic pain [in German]. Rev Med Suisse. 2014;10(415):286.
38. Bellieni CV, Cioncoloni D, Mazzanti S, et al. Music provided through a portable media player (iPod) blunts pain during physical therapy. Pain Manag Nurs. 2013;14(4):e151-e155.
39. Bernatzky G, Presch M, Anderson M, Panksepp J. Emotional foundations of music as a non-pharmacological pain management tool in modern medicine. Neurosci Biobehav Rev. 2011;35(9):1989-1999.
40. Bradshaw DH, Chapman CR, Jacobson RC, Donaldson GW. Effects of music engagement on response to painful stimulation. Clin J Pain. 2012;28(5):418-427.
41. Bradshaw DH, Donaldson GW, Jacobson RC, Nakamura Y, Chapman CR. Individual differences in the effects of music engagement on responses to painful stimulation. J Pain. 2011;12(12):1262-1273.
42. Chlan L, Halm MA. Does music ease pain and anxiety in the critically ill? Am J Crit Care. 2013;22(6):528-532.
43. Guétin S, Giniès P, Siou DK, et al. The effects of music intervention in the management of chronic pain: a single-blind, randomized, controlled trial. Clin J Pain. 2012;28(4):329-337.
44. Matsota P, Christodoulopoulou T, Smyrnioti ME, et al. Music’s use for anesthesia and analgesia. J Altern Complement Med. 2013;19(4):298-307.
45. Gooding L, Swezey S, Zwischenberger JB. Using music interventions in perioperative care. South Med J. 2012;105(9):486-490.
46. Graversen M, Sommer T. Perioperative music may reduce pain and fatigue in patients undergoing laparoscopic cholecystectomy. Acta Anaesthesiol Scand. 2013;57(8):1010-1016.
47. Ni CH, Tsai WH, Lee LM, Kao CC, Chen YC. Minimising preoperative anxiety with music for day surgery patients—a randomised clinical trial. J Clin Nurs. 2012;21(5-6):620-625.
48. Good M, Albert JM, Anderson GC, et al. Supplementing relaxation and music for pain after surgery. Nurs Res. 2010;59(4):259-269.
49. Moris DN, Linos D. Music meets surgery: two sides to the art of “healing.” Surg Endosc. 2013;27(3):719-723.
50. Nilsson U, Rawal N, Unosson M. A comparison of intra-operative or postoperative exposure to music—a controlled trial of the effects on postoperative pain. Anaesthesia. 2003;58(7):699-703.
51. Özer N, Karaman Özlü Z, Arslan S, Günes N. Effect of music on postoperative pain and physiologic parameters of patients after open heart surgery. Pain Manag Nurs. 2013;14(1):20-28.
52. Sen H, Yanarateş O, Sızlan A, Kılıç E, Ozkan S, Dağlı G. The efficiency and duration of the analgesic effects of musical therapy on postoperative pain. Agri. 2010;22(4):145-150.
53. Vaajoki A, Pietilä AM, Kankkunen P, Vehviläinen-Julkunen K. Music intervention study in abdominal surgery patients: challenges of an intervention study in clinical practice. Int J Nurs Pract. 2013;19(2):206-213.
54. Vaajoki A, Pietilä AM, Kankkunen P, Vehviläinen-Julkunen K. Effects of listening to music on pain intensity and pain distress after surgery: an intervention. J Clin Nurs. 2012;21(5-6):708-717.
55. Whitaker MH. Sounds soothing: music therapy for postoperative pain. Nursing. 2010;40(12):53-54.
56. Edwards J. Developing pain management approaches in music therapy with hospitalized children. In: Loewy J, Dileo C, eds. Music Therapy at the End of Life. Cherry Hill, NJ: Jeffrey Books; 2005:57-76.
57. Loewy J. The quiet soldier: pain and sickle cell anemia. In: Hibben J, ed. Inside Music Therapy: Client Experiences. Gilsum, NH: Barcelona; 1999:69-76.
58. Lichtensztejn M. The clinical use of piano with patients suffering from breathing distress related to pain. In: Azoulay R, Loewy JV, eds. Music, the Breath and Health: Advances in Integrative Music Therapy. New York, NY: Satchnote Press; 2009:213-222.
59. Kwon IS, Kim J, Park KM. Effects of music therapy on pain, discomfort, and depression for patients with leg fractures. Taehan Kanho Hakhoe Chi. 2006;36(4):630-636.
60. Zengin S, Kabul S, Al B, Sarcan E, Doğan M, Yildirim C. Effects of music therapy on pain and anxiety in patients undergoing port catheter placement procedure. Complement Ther Med. 2013;21(6):689-696.
61. Boso M, Politi P, Barale F, Emanuele E. Neurophysiology and neurobiology of the musical experience. Funct Neurol. 2006;21(4):187-191.
62. Salimpoor VN, Benovoy M, Larcher K, Dagher A, Zatorre RJ. Anatomically distinct dopamine release during anticipation and experience of peak emotion to music. Nat Neurosci. 2011;14(2):257-262.
63. Tomaino CM. Using rhythm for rehabilitation. Institute for Music and Neurologic Function website. http://musictherapy.imnf.org/images/uploads/rhythm.pdf. Published 2006. Accessed August 21, 2007.
64. Molinari M, Leggio MG, De Martin M, Cerasa A, Thaut M. Neurobiology of rhythmic motor entrainment. Ann N Y Acad Sci. 2003;999:313-321.
65. Thaut M. Neuropsychological processes in music perception. In: Unkefer R, ed. Music Therapy in the Treatment of Adults With Mental Disorders: Theoretical Bases and Clinical Interventions. Toronto, Canada: Schirmer Books; 2002:2-32.
66. Thaut M. Physiological and motor responses to music stimuli. In: Unkefer R, ed. Music Therapy in the Treatment of Adults With Mental Disorders: Theoretical Bases and Clinical Interventions. Toronto, Canada: Schimer Books; 2002:33-41.
67. Kleiber C, Adamek MS. Adolescents’ perceptions of music therapy following spinal fusion surgery. J Clin Nurs. 2013;22(3-4):414-422.
68. Lin PC, Lin ML, Huang LC, Hsu HC, Lin CC. Music therapy for patients receiving spine surgery. J Clin Nurs. 2011;20(7-8):960-968.
69. Maeyama A, Kodaka M, Miyao H. Effect of the music-therapy under spinal anesthesia [in Japanese]. Masui. 2009;58(6):684-691.
70. Golden J, Conroy RM, O’Dwyer AM. Reliability and validity of the Hospital Anxiety and Depression Scale and the Beck Depression Inventory (Full and FastScreen scales) in detecting depression in persons with hepatitis C. J Affect Disord. 2006;100(1-3):265-269.
71. Woby SR, Roach NK, Urmston M, Watson PJ. Psychometric properties of the TSK-11: a shortened version of the Tampa Scale for Kinesiophobia. Pain. 2005;117(1-2):137-144.
72. Humrichouse J, Chmielewski M, McDade-Montez EA, Watson D. Affect assessment through self-report methods. In: Rottenberg J, Johnson SL, eds. Emotion and Psychopathology: Bridging Affective and Clinical Science. Washington, DC: American Psychological Association; 2007:13-34.
73. Lincoln YS, Guba EG. Naturalistic Inquiry. Beverly Hills, CA: Sage; 1985.
Take-Home Points
- Music therapists use patient-preferred live music, increasing neurologic cues that enhance movement—a seminal recovery function in postoperative spine patients.
- Music therapy is an evidence-based, integrative treatment addressing body, mind, and spirit.
- Tension release through music therapy can serve as a critical mechanism for building resilience related to pain management.
- Music therapy and music medicine are distinct forms of clinical practice that focus on mind-body integration in the healing process.
- Music therapists, board-certified and licensed by the state as recognized healthcare professionals, address pain management, which is an increasing subspecialty in postoperative care.
About 70% of people in the United States experience at least 1 episode of back pain in their lifetime,1 and more than 5 million are temporarily or permanently disabled by spinal disorders.2-4 Some require surgery, which may rectify injury, but pain during recovery is often inevitable, and the road to recovery is not guaranteed to be smooth.5-20
Postoperative spine patients are at major risk for pain management challenges.14,15,18,20 Treatment is primarily pharmacologic and based on the surgical team’s pain management orders. Nursing care consists of monitoring the airway, vital signs, and neurovascular status and having patients rate their pain on a visual analog scale (VAS; 0 = no pain, 10 = worst pain imaginable). Nurses have the challenge of monitoring and continually assessing to make sure patients are achieving the optimal outcomes, particularly during the immediate postoperative period, when pain and anxiety are prominently increased.
Variability in spine surgery outcomes can be explained at least partly on the basis of prognostic psychological factors, including hypochondriasis, hysteria, depression, and poor pain coping strategies (eg, catastrophizing).21 In spine surgery patients, kinesiophobia (fear of moving) is a common component of distress that can impede recuperation.21-23
Rationale for Live Music
Pain is subjective and personal, and warrants an individualized approach to care. There is a body of music medicine research on the use of recorded music in modulating psychological and physiological factors in pain perception.30,32,34-54 This research supports the unique relationship of music to well-being, and the understanding that controlling any of these factors affects the duration, intensity, and quality of that experience.41,43,52
These findings provide incentive for breathing-entrained music therapy interventions, which enhance the relaxation response and release of pain-related tension;32,55-58 empower patients to unlock physical and emotional tension;32,57,58 provide a channel for expression and body movement; and enhance blood flow and/or alleviate pain by activating neurologic areas involved in the experience of pain.59-62Studies have found that physical endurance may be enhanced when movement is rhythmically coordinated with a musical stimulus.63-66 Music may prolong physical endurance by inhibiting psychological feedback associated with physical exertion related to fatigue, which may translate into accelerated recovery periods. When we listen to a rhythmic sound, our brains tend to automatically synchronize, or entrain, to external rhythmic cues that can stimulate increased motor control and coordination.63 Sound can arouse and raise the excitability of spinal motor neurons mediated by auditory-motor neuronal connections on the brain stem and spinal cord level.64-66 Rhythmically organized sounds serve as a neurological function in our capacity to organize predictable timing cues that are apparent in music, and may result in an effective treatment intervention in recovery.63,64
Music Therapy in Recovery From Spine Surgery
In music therapy, music is used within a therapeutic relationship to support or affect change in the patient and the treatment regimen.32,33,56-58 Research on music therapy with patients who are recovering from spine surgery is scant.67-69 Kleiber and Adamek67 studied perceptions of music therapy in 8 adolescents after spinal fusion surgery. In their study, a music therapist provided patients with a postoperative music therapy session focusing on the use of patient-preferred live music for relaxation and expression. Although their qualitative query was based on a therapeutic approach similar to that used in the present study, only 1 session was offered during the recovery period, and follow-up was conducted by survey invitation and telephone. In addition, the number of participants was small, and there was no quantitative measure of pain or other symptoms.
Another study focused on the effects of listening to music on pain intensity and distress after spine surgery.68 Patients in the study’s music group made their selections from prerecorded classical music and domestic and international popular songs from various genres and listened to their chosen recordings 30 minutes a day. Although the study was not a music therapy study per se, it showed a positive impact of listening to music on anxiety and pain perception in 60 adults who were randomly assigned to the music group or to a non-music control group (n = 30 in each). Differences between the music and control groups’ VAS ratings of anxiety (Ps = .018-.001) and pain (P = .001) were statistically significant.
Different from our study, the aforementioned studies did not include tension release–focused live music offered within a therapeutic relationship. Our 1.5-year pilot study, conducted prior to the present study indicated that music therapy led to increased resilience and recovery mechanisms.58
Methods
Our mixed-methods study design combined standard medical treatment with integrative music therapy interventions based on pain assessments to better understand the effects of music therapy on the recovery of patients after spine surgery.
The Spine Institute of New York within the Department of Orthopedic Surgery at Mount Sinai Beth Israel provides surgical treatment of common spinal cord conditions. Prioritizing patient satisfaction and positive outcomes,27,28 the institute integrates music therapy through the Louis Armstrong Center for Music and Medicine to enhance treatment of pain symptoms.
Patients were recruited by the research team as per the daily surgical schedule, or through referral by the medical team or patient care navigator. Sixty patients (35 female, 25 male) ranging in age from 40 to 55 years underwent anterior, posterior, or anterior-posterior spinal fusion and were enrolled in the study after signing a participation consent form. Minorities, women, and patients with Medicaid and Medicare were included. Patients who received a diagnosis of clinical psychosis or depression prior to spine injury were excluded.
The experimental group received music therapy plus standard care (medical and nursing care with scheduled pharmacologic pain intervention), and a wait-listed control group received standard care only. A randomization chart created by a blinded statistician who did not have access to the patient census determined the intervention–nonintervention schedule. Patients in the music therapy group received one 30-minute music therapy session during an 8-hour period within 72 hours after surgery.
For both groups, measurements were completed before and after the study window. Control patients were offered music therapy after completion of the post-intervention surveys in order to minimize the ethical dilemma of denying potentially helpful pain intervention. For this same reason, both groups were given the option of receiving follow-up music therapy sessions for the duration of their hospitalization.
The research team consisted of 2 licensed, board-certified music therapists. In addition, Master’s-level music therapy interns completing clinical hours as part of the trajectory for board certification served on the research team over the 5-year period 2009 to 2014, and 13 blinded research assistants helped with enrolling and collecting data on patients.
Intervention
Each music therapy session included a warm-up phase of verbal or musical discourse. Next was the treatment phase, which was based on patient need as assessed during warm-up. Treatment options included use of patient-preferred live music that supported tension release/relaxation through incentive-based clinical improvisation, singing, and/or rhythmic drumming or through breathwork and visualization. Psychoeducation about mind–body awareness through the use of breath and imagery was introduced and explained by the therapist at this time.
The improvised music intervention was focused on making salient the natural harmonic tension-resolution cycles that occur in music and that were entrained to the patient’s presentation (respiratory rate, verbal report, clinical presentation). When patient-preferred precomposed songs were used, tension resolution was achieved by sustaining cadence and resolution, also entrained to the patient’s respiratory cycles.32,57,58
After the music therapy intervention, a period of closure or integration was facilitated by the therapist contingent on the patient’s degree of alertness. If awake, the patient was supported in a reflexive process of thoughts, impressions, or issues that may have contributed to the overall experience. If the patient was asleep, the researcher returned within 30 minutes for post-intervention interviewing. Interview information was recorded in a qualitative post-participation survey. To prevent bias, researchers who were not the treating clinicians conducted the surveys.
Outcome Measures
Both primary and secondary outcome measures were collected before and after the intervention. The primary outcome measure was VAS pain ratings, and the secondary outcome measures were scores on the Hospital Anxiety and Depression Scale (HADS), the Tampa Scale for Kinesiophobia (TSK), and the Color Analysis Scale (CAS).
VAS. With the VAS, images are used to rate pain. The scale has points labeled 0 to 10 and corresponding faces representing progression in pain intensity. The scale is quickly rendered and can be interpreted according to the patient’s recovery phase at time of rendering.
HADS. The HADS70 provides a specific baseline for anxiety and depression as an indicator of how the patient might fare during hospitalization (admission through recovery and discharge).
TSK. The TSK71 provides insight into the patient’s perception of fear-related movement, which is an important factor in this study because of the movement required for rehabilitation. We used a shortened version of the TSK to accommodate the sensitive threshold for pain tolerance and pharmacologic side effects commonly experienced by spine patients.
CAS. The CAS was developed at the Louis Armstrong Center for Music and Medicine to assess comorbidities and dynamic aspects of pain. Through a coloring exercise, patients illustrate their pain experience, which gives tangible form to the abstract experience of pain.
Coding
We collected patients’ demographic data, including age, sex, and diagnoses. Clinical indicators of the preoperative baseline included lifestyle, surgical history, and prior experience with music or other mind–body strategies for self-regulation.
As fundamental to qualitative methodology,72,73 the reported responses to questions were grouped into themes that were peer-tested with members of the research team before and during the coding process.
VAS, HADS, and TSK data were tabulated by blinded research assistants and analyzed by a statistician. Patients were identified by number assignment, and their data and personal information were kept confidentially stored.
Statistical Methods
Means and standard deviations were used for continuous variables, and frequencies (percentages) for categorical variables. All outcomes were analyzed on an intent-to-treat basis. Repeated-measures analysis of variance was used to compare changes in outcomes from before to after intervention for the music and control groups. In particular, a statistically significant Group (music vs control) × Time (before vs after intervention) interaction would support the hypothesis that there would be more benefit (less pain) in the music group as a result of the music therapy. For all tests, significance was set at P < .05. SPSS Version 20 (IBM) was used for all statistical analyses. Based on previously found differences in heart rate and mobility,31 we assumed an effect size of 0.71 for the difference between music and control (no music), which would require 32 patients per group to achieve a power of 0.8 with an α of 0.05.
Results
Of the 136 patients who were asked to participate in the study, 76 were not enrolled; the other 60 were equally assigned to either the control group or the music therapy group (n = 30 in each) according to randomization indicated by a blinded statistician (Figure 1).
Table 2 lists the pre-intervention and post-intervention comparisons of the main outcomes between groups.
The emerging themes of the responses are listed in Tables 3 and 4 and are explained here:
Relationship with music was coded for significance and included reports of music as a resource accessed for stimulation and/or relaxation through listening; direct involvement with instrument playing; and history of music training.
Perceptions of surgical outcome in patients’ responses were coded across 3 themes: (1) optimistic (belief and hope in returning to original baseline of functionality), (2) indifferent (neither hopeful nor cynical about results of surgery), and (3) pessimistic (belief that nothing will restore the quality of life that existed before the spinal condition).
The CAS helped us better understand the diversity and complexity of the pain experience.
Discussion
Our hospital has the unique capability of providing music therapy to postoperative and other hospitalized patients. In this study, we compared the impact of a structured postoperative music therapy program on spine patients relative to control patients who did not receive music therapy after spine surgery.
We found a significant benefit in VAS pain levels (>1 point) but no statistically significant differences in HADS Anxiety, HADS Depression, or TSK scores. Although a 2-point difference is usually considered clinically significant, the degree of change in the music group is notable for having been achieved by nonpharmacologic means with scant chance of adverse effects. We suspect the lack of significant change in HADS Anxiety, HADS Depression, and TSK scores is attributable to the narrow study window. Given the observational data from our pilot study58 and ongoing results with spine patients,32 it seems clear that both mood state and resilience in coping are enhanced through an ongoing relationship with music therapy.
The study of a population as vulnerable as patients recovering from spine surgery raises many issues for providers and researchers. Although it is worthwhile to determine the efficacy of integrative modalities in serving these patients, the request for participation in a protocol at such a vulnerable time was often resisted. During our pilot work, it became clear that the ability of potential subjects to comprehend and complete protocol surveys was impacted by adverse effects, including sedation drowsiness; respiratory depression; nausea and vomiting; pruritus; and urinary retention caused by the medications used for postoperative pain management. Consequently, after piloting 5 cases before the main study, we extended the enrollment window to 72 hours.
Other unforeseen intrinsic or external obstacles were identified: Patient-related issues—including availability, level of interest in participation, and inability to participate because of the medication adverse effects mentioned.
Staff investment/education—addressed over the first 3 study years with several in-services, starting with the surgical team and continuing with nursing and support staff in various combinations. These meetings led to the creation of an Institutional Review Board (IRB) approved educational sheet for inclusion in the information packet given to surgical patients on registration.
Programming interruptions—caused by the convergence of several unanticipated factors, including a delay in expedited review of the IRB renewal during the year of Hurricane Sandy and an interruption in the spine team’s service for administrative and program modification.
Conclusion
Music therapy interventions (eg, use of patient-preferred live music) offered within a therapeutic relationship favorably affected pain perceptions in patients recovering from spine surgery. This effect was achieved through several therapeutic entry points, including support of expression and opportunities for emotional catharsis.
At the core of music therapy’s efficacy is individualized treatment, through which patients are supported in their recovery of “self.” Measurable benefits—including increased comfort; reduced pain; improved gait; increased range of motion, endurance, and ability to relax; and empowerment to actively participate in one’s own care through daily activities imbued with an enhanced sense of agency—are of cardinal importance, as they may lead to quicker recovery perceptions and enhanced quality of life.
Am J Orthop. 2017;46(1):E13-E22. Copyright Frontline Medical Communications Inc. 2017. All rights reserved.
1. Miller B, Gatchel RJ, Lou L, Stowell A, Robinson R, Polatin PB. Interdisciplinary treatment of failed back surgery syndrome (FBSS): a comparison of FBSS and non-FBSS patients. Pain Pract. 2005;5(3):190-202.
2. Aebi M. The adult scoliosis. Eur Spine J. 2005;14(10):925-948.
3. Engstrom JW, Deyo, RA. Back and neck pain. In: Kasper DL, Braunwald E, Fauci AS, et al, eds. Harrison’s Principles of Internal Medicine, 19th edition. New York, NY: McGraw-Hill; 2007:207-214.
4. Cavanaugh JM, Lu Y, Chen C, Kallakuri S. Pain generation in lumbar and cervical facet joints. J Bone Joint Surg Am. 2006;88(suppl 2):63-67.
5. Hart RA, Prendergast MA. Spine surgery for lumbar degenerative disease in elderly and osteoporotic patients. Instr Course Lect. 2007;56:257-272.
6. Boswell MV, Trescot AM, Datta S, et al; American Society of Interventional Pain Physicians. Interventional techniques: evidence-based practice guidelines in the management of chronic spinal pain. Pain Physician. 2007;10(1):7-111.
7. Weinstein JN, Lurie JD, Tosteson TD, et al. Surgical versus nonsurgical treatment for lumbar degenerative spondylolisthesis. N Engl J Med. 2007;356(22):2257-2270.
8. Weinstein JN, Tosteson TD, Lurie JD, et al. Surgical vs nonoperative treatment for lumbar disk herniation: the Spine Patient Outcomes Research Trial (SPORT): A randomized trial. JAMA. 2006;296(20):2441-2450.
9. Malmivaara A, Slätis P, Heliövaara M, et al; Finnish Lumbar Spinal Research Group. Surgical or nonoperative treatment for lumbar spinal stenosis? A randomized controlled trial. Spine. 2007;32(1):1-8.
10. Chang Y, Singer DE, Wu YA, Keller RB, Atlas SJ. The effect of surgical and nonsurgical treatment on longitudinal outcomes of lumbar spinal stenosis over 10 years. J Am Geriatr Soc. 2005;53(5):785-792.
11. Cowan JA Jr, Dimick JB, Wainess R, Upchurch GR Jr, Chandler WF, La Marca F. Changes in the utilization of spinal fusion in the United States. Neurosurgery. 2006;59(1):15-20.
12. Lonner BS, Scharf CS, Antonacci D, Goldstein Y, Panagopoulos G. The learning curve associated with thoracoscopic spinal instrumentation. Spine. 2005;30(24):2835-2840.
13. Lonner BS, Kondrachov D, Siddiqi F, Hayes V, Scharf C. Thoracoscopic spinal fusion compared with posterior spinal fusion for the treatment of thoracic adolescent idiopathic scoliosis. J Bone Joint Surg Am. 2006;88(5):1022-1034.
14. Boakye M, Patil CG, Santarelli J, Ho C, Tian W, Lad SP. Cervical spondylotic myelopathy: complications and outcomes after spinal fusion. Neurosurgery. 2008;62(2):455-461.
15. Boakye M, Patil CG, Santarelli J, Ho C, Tian W, Lad SP. Laminectomy and fusion after spinal cord injury: national inpatient complications and outcomes. J Neurotrauma. 2008;25(3):173-183.
16. Dekutoski MB, Norvell DC, Dettori JR, Fehlings MG, Chapman JR. Surgeon perceptions and reported complications in spine surgery. Spine. 2010;35(9 suppl):S9-S21.
17. Nasser R, Yadla S, Maltenfort MG, et al. Complications in spine surgery. J Neurosurg Spine. 2010;13(2):144-157.
18. Patil CG, Santarelli J, Lad SP, Ho C, Tian W, Boakye M. Inpatient complications, mortality, and discharge disposition after surgical correction of idiopathic scoliosis: a national perspective. Spine J. 2008;8(6):904-910.
19. Rampersaud YR, Moro ER, Neary MA, et al. Intraoperative adverse events and related postoperative complications in spine surgery: implications for enhancing patient safety founded on evidence-based protocols. Spine. 2006;31(13):1503-1510.
20. Shen Y, Silverstein JC, Roth S. In-hospital complications and mortality after elective spinal fusion surgery in the United States: a study of the Nationwide Inpatient Sample from 2001 to 2005. J Neurosurg Anesthesiol. 2009;21(1):21-30.
21. Picavet HSJ, Vlaeyen JWS, Schouten JSAG. Pain catastrophizing and kinesiophobia: predictors of chronic low back pain. Am J Epidemiol. 2002;156(11):1028-1034.
22. French DJ, France CR, Vigneau F, French JA, Evans RT. Fear of movement/(re)injury in chronic pain: a psychometric assessment of the original English version of the Tampa Scale for Kinesiophobia (TSK). Pain. 2007;127(1-2):42-51.
23. Goubert L, Crombez G, Van Damme S, Vlaeyen JW, Bijttebier P, Roelofs J. Confirmatory factor analysis of the Tampa Scale for Kinesiophobia: invariant two-factor model across low back pain patients and fibromyalgia patients. Clin J Pain. 2004;20(2):103-110.
24. Selimen D, Andsoy II. The importance of a holistic approach during the perioperative period. AORN J. 2011;93(4):482-487.
25. Zheng Z. Xue CC. Pain research in complementary and alternative medicine in Australia: a critical review. J Altern Complement Med. 2013;19(2):81-91.
26. Wright J, Adams D, Vohra S. Complementary, holistic, and integrative medicine: music for procedural pain. Pediatr Rev. 2013;34(11):e42-e46.
27. McCann PD. Orthopedic surgery and integrative medicine—strange bedfellows. Am J Orthop. 2009;38(2):66, 71.
28. McCann PD. Customer satisfaction: are hospitals “hospitable”? Am J Orthop. 2006;35(2):59.
29. Joanna Briggs Institute. The Joanna Briggs Institute best practice information sheet: music as an intervention in hospitals. Nurs Health Sci. 2011;13(1):99-102.
30. Spintge R. Thirty-five years of anxiolytic music (AAM) in pain and aversive clinical settings. In: Mondanaro J, Sara G, eds. Music and Medicine: Integrative Models in the Treatment of Pain. New York, NY: Satchnote Press; 2013:29-42.
31. Cepeda MS, Carr DB, Lau J, Alvarez H. Music for pain relief. Cochrane Database Syst Rev. 2006;(2):CD004843.
32. Mondanaro J. Music therapy based release strategies in the treatment of acute and chronic pain: an individualized approach. In: Mondanaro J, Sara G, eds. Music and Medicine: Integrative Models in the Treatment of Pain. New York, NY: Satchnote Press; 2013:133-148.
33. Quentzel S. Music has charms to soothe a savage breast. In: Mondanaro J, Sara G, eds. Music and Medicine: Integrative Models in the Treatment of Pain. New York, NY: Satchnote Press; 2013:11-28.
34. Ko YL. Lin PC. The effect of using a relaxation tape on pulse, respiration, blood pressure and anxiety levels of surgical patients. J Clin Nurs. 2012;21(5-6):689-697.
35. Roy M, Lebuis A, Hugueville L, Peretz I, Rainville P. Spinal modulation of nociception by music. Eur J Pain. 2012;16(6):870-877.
36. Roy M, Peretz I, Rainville P. Emotional valence contributes to music-induced analgesia. Pain. 2008;134(1-2):140-147.
37. Schröter T. Medicine needs music! Music therapy for chronic pain [in German]. Rev Med Suisse. 2014;10(415):286.
38. Bellieni CV, Cioncoloni D, Mazzanti S, et al. Music provided through a portable media player (iPod) blunts pain during physical therapy. Pain Manag Nurs. 2013;14(4):e151-e155.
39. Bernatzky G, Presch M, Anderson M, Panksepp J. Emotional foundations of music as a non-pharmacological pain management tool in modern medicine. Neurosci Biobehav Rev. 2011;35(9):1989-1999.
40. Bradshaw DH, Chapman CR, Jacobson RC, Donaldson GW. Effects of music engagement on response to painful stimulation. Clin J Pain. 2012;28(5):418-427.
41. Bradshaw DH, Donaldson GW, Jacobson RC, Nakamura Y, Chapman CR. Individual differences in the effects of music engagement on responses to painful stimulation. J Pain. 2011;12(12):1262-1273.
42. Chlan L, Halm MA. Does music ease pain and anxiety in the critically ill? Am J Crit Care. 2013;22(6):528-532.
43. Guétin S, Giniès P, Siou DK, et al. The effects of music intervention in the management of chronic pain: a single-blind, randomized, controlled trial. Clin J Pain. 2012;28(4):329-337.
44. Matsota P, Christodoulopoulou T, Smyrnioti ME, et al. Music’s use for anesthesia and analgesia. J Altern Complement Med. 2013;19(4):298-307.
45. Gooding L, Swezey S, Zwischenberger JB. Using music interventions in perioperative care. South Med J. 2012;105(9):486-490.
46. Graversen M, Sommer T. Perioperative music may reduce pain and fatigue in patients undergoing laparoscopic cholecystectomy. Acta Anaesthesiol Scand. 2013;57(8):1010-1016.
47. Ni CH, Tsai WH, Lee LM, Kao CC, Chen YC. Minimising preoperative anxiety with music for day surgery patients—a randomised clinical trial. J Clin Nurs. 2012;21(5-6):620-625.
48. Good M, Albert JM, Anderson GC, et al. Supplementing relaxation and music for pain after surgery. Nurs Res. 2010;59(4):259-269.
49. Moris DN, Linos D. Music meets surgery: two sides to the art of “healing.” Surg Endosc. 2013;27(3):719-723.
50. Nilsson U, Rawal N, Unosson M. A comparison of intra-operative or postoperative exposure to music—a controlled trial of the effects on postoperative pain. Anaesthesia. 2003;58(7):699-703.
51. Özer N, Karaman Özlü Z, Arslan S, Günes N. Effect of music on postoperative pain and physiologic parameters of patients after open heart surgery. Pain Manag Nurs. 2013;14(1):20-28.
52. Sen H, Yanarateş O, Sızlan A, Kılıç E, Ozkan S, Dağlı G. The efficiency and duration of the analgesic effects of musical therapy on postoperative pain. Agri. 2010;22(4):145-150.
53. Vaajoki A, Pietilä AM, Kankkunen P, Vehviläinen-Julkunen K. Music intervention study in abdominal surgery patients: challenges of an intervention study in clinical practice. Int J Nurs Pract. 2013;19(2):206-213.
54. Vaajoki A, Pietilä AM, Kankkunen P, Vehviläinen-Julkunen K. Effects of listening to music on pain intensity and pain distress after surgery: an intervention. J Clin Nurs. 2012;21(5-6):708-717.
55. Whitaker MH. Sounds soothing: music therapy for postoperative pain. Nursing. 2010;40(12):53-54.
56. Edwards J. Developing pain management approaches in music therapy with hospitalized children. In: Loewy J, Dileo C, eds. Music Therapy at the End of Life. Cherry Hill, NJ: Jeffrey Books; 2005:57-76.
57. Loewy J. The quiet soldier: pain and sickle cell anemia. In: Hibben J, ed. Inside Music Therapy: Client Experiences. Gilsum, NH: Barcelona; 1999:69-76.
58. Lichtensztejn M. The clinical use of piano with patients suffering from breathing distress related to pain. In: Azoulay R, Loewy JV, eds. Music, the Breath and Health: Advances in Integrative Music Therapy. New York, NY: Satchnote Press; 2009:213-222.
59. Kwon IS, Kim J, Park KM. Effects of music therapy on pain, discomfort, and depression for patients with leg fractures. Taehan Kanho Hakhoe Chi. 2006;36(4):630-636.
60. Zengin S, Kabul S, Al B, Sarcan E, Doğan M, Yildirim C. Effects of music therapy on pain and anxiety in patients undergoing port catheter placement procedure. Complement Ther Med. 2013;21(6):689-696.
61. Boso M, Politi P, Barale F, Emanuele E. Neurophysiology and neurobiology of the musical experience. Funct Neurol. 2006;21(4):187-191.
62. Salimpoor VN, Benovoy M, Larcher K, Dagher A, Zatorre RJ. Anatomically distinct dopamine release during anticipation and experience of peak emotion to music. Nat Neurosci. 2011;14(2):257-262.
63. Tomaino CM. Using rhythm for rehabilitation. Institute for Music and Neurologic Function website. http://musictherapy.imnf.org/images/uploads/rhythm.pdf. Published 2006. Accessed August 21, 2007.
64. Molinari M, Leggio MG, De Martin M, Cerasa A, Thaut M. Neurobiology of rhythmic motor entrainment. Ann N Y Acad Sci. 2003;999:313-321.
65. Thaut M. Neuropsychological processes in music perception. In: Unkefer R, ed. Music Therapy in the Treatment of Adults With Mental Disorders: Theoretical Bases and Clinical Interventions. Toronto, Canada: Schirmer Books; 2002:2-32.
66. Thaut M. Physiological and motor responses to music stimuli. In: Unkefer R, ed. Music Therapy in the Treatment of Adults With Mental Disorders: Theoretical Bases and Clinical Interventions. Toronto, Canada: Schimer Books; 2002:33-41.
67. Kleiber C, Adamek MS. Adolescents’ perceptions of music therapy following spinal fusion surgery. J Clin Nurs. 2013;22(3-4):414-422.
68. Lin PC, Lin ML, Huang LC, Hsu HC, Lin CC. Music therapy for patients receiving spine surgery. J Clin Nurs. 2011;20(7-8):960-968.
69. Maeyama A, Kodaka M, Miyao H. Effect of the music-therapy under spinal anesthesia [in Japanese]. Masui. 2009;58(6):684-691.
70. Golden J, Conroy RM, O’Dwyer AM. Reliability and validity of the Hospital Anxiety and Depression Scale and the Beck Depression Inventory (Full and FastScreen scales) in detecting depression in persons with hepatitis C. J Affect Disord. 2006;100(1-3):265-269.
71. Woby SR, Roach NK, Urmston M, Watson PJ. Psychometric properties of the TSK-11: a shortened version of the Tampa Scale for Kinesiophobia. Pain. 2005;117(1-2):137-144.
72. Humrichouse J, Chmielewski M, McDade-Montez EA, Watson D. Affect assessment through self-report methods. In: Rottenberg J, Johnson SL, eds. Emotion and Psychopathology: Bridging Affective and Clinical Science. Washington, DC: American Psychological Association; 2007:13-34.
73. Lincoln YS, Guba EG. Naturalistic Inquiry. Beverly Hills, CA: Sage; 1985.