User login
GOC Discussions Among LTC Residents
Hospitalizations of long‐term care (LTC) residents are known to be frequent, costly, often preventable,[1, 2, 3] and potentially associated with negative health outcomes.[4] Often, an advance directive (AD) is made at LTC admission and updated annually when residents are in relatively stable health. An AD is a document that helps to inform a substitute decision maker (SDM) about the consent process for life‐sustaining treatments and is a resource that supports advance care planning (ACP). ACP is a process that allows individuals to consider, express, and plan for future healthcare in the event that they lack capacity to make their own decisions. When an LTC resident's health deteriorates and hospitalization is required, there is an opportunity to update prognosis, discuss risks and benefits of previously held treatment preferences, as well as reassess goals of care (GOC).
Engaging in ACP discussions during relatively stable health can help ensure patient preferences are followed.[5, 6] These discussions, however, are often insufficient, as they involve decision making for hypothetical situations that may not cover all potential scenarios, and may not reflect a patient's reality at the time of health status decline. Discussions held in the moment more authentically reflect the decisions of patients and/or SDM based on the specific needs and clinical realities particular to the patient at that time.[7] GOC discussions, defined in this context as ACP discussions occurring during hospitalization, have the potential to better align patient wishes with care received,[6] improve quality of life and satisfaction,[8, 9, 10] and reduce unwanted extra care.[11, 12] Although in‐the‐moment GOC discussions are recommended for all hospitalized patients who are seriously ill with a high risk of dying,[13] research suggests that this occurs infrequently for elderly patients. A recent multicenter survey of seriously ill hospitalized elderly patients found that only 25% of patients and 32% of family members reported that they had been asked about prior ACP or AD.[14] Another study of hospitalized LTC residents found that resuscitation status and family discussion was documented in only 55% and 42% of admissions, respectively.[15]
Further investigation is required to determine how often LTC patients have GOC discussions, what prompts these discussions, and what are the outcomes. Previous studies have focused on barriers to performing GOC discussions, rather than the factors that are associated with them.[16] By understanding why these discussions currently happen, we can potentially improve how often they occur and the quality of their outcomes.
The objectives of this study were to determine the rate of documented GOC discussions among hospitalized LTC residents, identify factors that were associated with documentation, and examine the association between documentation and outcomes of care.
METHODS
Study Population
We conducted a retrospective chart review of a random convenience sample of hospitalized patients admitted via the emergency department (ED) to the general internal medicine (GIM) service from January 1, 2012 through December 31, 2012, at 2 academic teaching hospitals in Toronto, Canada. Patients were identified through a search of each hospitals' electronic patient record (EPR). Patients were eligible for inclusion if they were (1) a LTC resident and (2) at least 65 years of age. For patients with multiple admissions to the GIM service during the specified 12‐month period, we only included data from the first hospitalization (index hospitalization). The hospital's research ethics board approved this study.
Our primary variable of interest was documentation in the hospital medical record of a discussion between physicians and the patient/family/SDM regarding GOC. A GOC discussion was considered to have taken place if there was documentation of (1) understanding/expectation of treatment options or (2) patient's preferences for life‐sustaining measures. Examples illustrating each criterion are provided in the Supporting Information, Appendix 1, in the online version of this article.
Factors Associated With GOC Documentation
From the EPR, we obtained visit‐level data including age, gender, Canadian Emergency Department Triage and Acuity Scale, vital signs at ED admission including temperature, respiratory rate, oxygen saturation, Glasgow Coma Scale (GCS) and shock index (defined as heart rate divided by systolic blood pressure), admission and discharge dates/times, discharge diagnosis, transfer to intensive care unit (ICU), and hospital use (number of ED visits and hospitalizations to the 2 study hospitals in the 1‐year period prior to index hospitalization).
Trained study personnel (J.W.) used a structured abstraction form to collect data from the hospital medical record that were not available through the EPR, including years living in LTC, contents of LTC AD forms, presence of SDM (identified as immediate family or surrogate with whom the care team communicated), dementia diagnosis (defined as documentation of dementia in the patient's past medical history and/or history of present illness), and measures of functional status. When available, we extracted the AD from LTC; they consisted of 4 levels (level 1: comfort careno transfer to hospital, no cardiopulmonary resuscitation [CPR]; level 2: supportive careadministration of antibiotics and/or other procedures that can be provided within LTC, no transfer to the hospital, no CPR; level 3: transfer to the hospitalno CPR; level 4: aggressive interventiontransfer to hospital for aggressive treatment, CPR).
GOC Documentation in the Discharge Summary
For the subset of patients who survived hospitalization and were discharged back to LTC, we examined whether the ADs ordered during hospitalization were communicated back to LTC via the discharge summary. We additionally assessed if the ADs determined during hospitalization differed from preferences documented prior to hospitalization. Physician orders for ADs were categorized as level 1: comfort measures only, level 3: no CPR, or level 4: full code. LTC level 2 was considered equivalent to physician‐ordered level 3 at admission; a patient with an LTC level 2 with no CPR (level 3) documented during hospitalized would be considered to have no change in the AD. An increase or decrease in the AD was determined by comparing LTC levels 1, 3, and 4 to physician‐ordered level 1, 3, and 4.
Outcomes of GOC Documentation
From the EPR, we obtained visit‐level outcome data including length of stay (LOS), resource intensity weight (RIW) (calculated based on patient case‐mix, severity, age, and procedures performed), visit disposition, number of ED visits and hospitalizations to the 2 study hospitals in the year following index hospitalization, in‐hospital death, and 1‐year mortality. We determined 1‐year mortality by following up with the LTC homes to determine whether the resident had died within the year following index hospitalization; only patients from LTC homes that responded to our request for data were included in 1‐year mortality analyses. We collected physician orders for the AD from chart review.
Statistical Analysis
Patients with and without documented GOC discussions were compared. Descriptive statistics including frequencies and percentages were used to characterize study variables. Differences between the study groups were assessed using Pearson 2/Fisher exact test. Multivariate logistic regression, which included variables that were significant in the bivariate analysis, was used to identify independent predictors of GOC discussion. Adjusted odds ratios (AOR) and 95% confidence intervals (CI) were presented for the logistic model. Patients with missing predictor data were excluded.
We also examined whether there was a correlation between GOC discussion and outcomes of care using Pearson 2/Fisher exact test. Outcomes included orders for the AD, LOS in days (stratified into quartiles), RIW (stratified into quartiles), visit disposition, hospital use in the year following index hospitalization, and 1‐year mortality following discharge back to LTC.
Lastly, to better understand the independent predictors of in‐hospital and 1‐year mortality, we used Pearson 2/Fisher exact test followed by logistic regression that included significant variables from the bivariate analyses.
All analyses were 2‐sided, and a P value of <0.05 was considered statistically significant. We used SPSS version 22.0 (SPSS Inc., Chicago, IL).
RESULTS
We identified a total of 7084 hospitalizations to GIM between January 1, 2012 and December 31, 2012, of which 665 (9.4%) met inclusion criteria of residence in LTC and age 65 years. Of these 665 hospitalizations, 512 were unique patients. We randomly selected a convenience sample of 200 index hospitalizations of the 512 eligible hospitalizations (39%) to perform the chart review.
Predictors of GOC Documentation
Of the 200 randomly sampled charts that were reviewed, 75 (37.5%) had a documented GOC discussion.
Characteristics of the study patients and results of bivariate analysis of the association between patient characteristics and GOC discussion are summarized in Table 1. No significant differences in demographic and baseline characteristics were seen between patients with and without discussion. However, a number of visit characteristics were found to be significantly associated with discussion. Forty percent of patients in the GOC discussion group had GCS scores 11 compared to 15.2% in the no‐discussion group. Higher respiratory rate, lower oxygen saturation, and ICU transfer were also significantly associated with discussions.
| Goals of Care Discussion Documented in Medical Chart | |||||
|---|---|---|---|---|---|
| No, N = 125 | Yes, N = 75 | P Value | |||
| |||||
| Baseline characteristics | |||||
| Gender, n (%) | 0.88 | ||||
| Male | 48 | (38.4) | 30 | (40.0) | |
| Female | 77 | (61.6) | 45 | (60.0) | |
| Age, y, n (%) | 0.85 | ||||
| 6579 | 36 | (28.8) | 19 | (25.3) | |
| 8084 | 30 | (24.0) | 19 | (25.3) | |
| 8589 | 30 | (24.0) | 16 | (21.3) | |
| 90101 | 29 | (23.2) | 21 | (28.0) | |
| Years living in long‐term care, n (%)* | 0.65 | ||||
| [0, 1) | 28 | (22.4) | 12 | (16.0) | |
| [1, 3) | 31 | (24.8) | 22 | (29.3) | |
| [3, 6) | 33 | (26.4) | 22 | (29.3) | |
| [6, 22) | 25 | (20.0) | 13 | (17.3) | |
| Unknown | 8 | (6.4) | 6 | (8.0) | |
| AD from long‐term care, n (%) | 0.14 | ||||
| Comfort measures only | 2 | (1.6) | 1 | (1.3) | |
| Supportive care with no transfer to hospital | 0 | (0.0) | 3 | (4.0) | |
| Supportive care with transfer to hospital | 70 | (56.0) | 44 | (58.7) | |
| Aggressive care | 53 | (42.4) | 27 | (36.0) | |
| Years since most recent AD signed, n (%)* | 0.12 | ||||
| [0, 1) | 79 | (63.2) | 48 | (64.0) | |
| [1, 2) | 21 | (16.8) | 6 | (8.0) | |
| [2, 6) | 9 | (7.2) | 10 | (13.3) | |
| Unknown | 16 | (12.8) | 11 | (14.7) | |
| Substitute decision maker, n (%) | 0.06 | ||||
| Child | 81 | (64.8) | 44 | (58.7) | |
| Spouse | 9 | (7.2) | 15 | (20.0) | |
| Other | 26 | (20.8) | 13 | (17.3) | |
| Public guardian trustee | 6 | (4.8) | 2 | (2.7) | |
| Unknown | 3 | (2.4) | 1 | (1.3) | |
| Dementia, n (%) | 1.00 | ||||
| No | 47 | (37.6) | 28 | (37.3) | |
| Yes | 78 | (62.4) | 47 | (62.7) | |
| Mobility, n (%) | 0.26 | ||||
| Walk without assistance | 5 | (4.0) | 3 | (4.0) | |
| Walker | 16 | (12.8) | 3 | (4.0) | |
| Wheelchair | 43 | (34.4) | 29 | (38.7) | |
| Bedridden | 7 | (5.6) | 4 | (5.3) | |
| Unknown | 54 | (43.2) | 36 | (48.0) | |
| Continence, n (%) | 0.05 | ||||
| Mostly continent | 16 | (12.8) | 3 | (4.0) | |
| Incontinent | 49 | (39.2) | 34 | (45.3) | |
| Catheter/stoma | 7 | (5.6) | 1 | (1.3) | |
| Unknown | 53 | (42.4) | 37 | (49.3) | |
| Feeding, n (%) | 0.17 | ||||
| Mostly feeds self | 38 | (30.4) | 13 | (17.3) | |
| Needs to be fed | 17 | (13.6) | 14 | (18.7) | |
| Gastrostomy tube | 8 | (6.4) | 5 | (6.7) | |
| Unknown | 62 | (49.6) | 43 | (57.3) | |
| Diet, n (%) | 0.68 | ||||
| Normal | 43 | (34.4) | 16 | (21.3) | |
| Dysphagic | 32 | (25.6) | 15 | (20.0) | |
| Gastrostomy tube | 8 | (6.4) | 5 | (6.7) | |
| Unknown | 42 | (33.6) | 39 | (52.0) | |
| Previous ED visits in last year, n (%) | 0.43 | ||||
| 0 | 70 | (56.0) | 41 | (54.7) | |
| 1 | 35 | (28.0) | 17 | (22.7) | |
| 2+ | 20 | (16.0) | 17 | (22.7) | |
| Previous hospitalizations in last year, n (%) | 0.19 | ||||
| 0 | 98 | (78.4) | 54 | (72.0) | |
| 1 | 23 | (18.4) | 14 | (18.7) | |
| 2+ | 4 | (3.2) | 7 | (9.3) | |
| Visit characteristics | |||||
| Glasgow Coma Scale, n (%) | <0.001 | ||||
| <7 | 4 | (3.2) | 4 | (5.3) | |
| 711 | 15 | (12.0) | 26 | (34.7) | |
| 1213 | 7 | (5.6) | 8 | (10.7) | |
| 1415 | 85 | (68.0) | 32 | (42.7) | |
| Unknown | 14 | (11.2) | 5 | (6.7) | |
| Shock index, n (%) | 0.13 | ||||
| 1 | 105 | (84.0) | 54 | (72.0) | |
| >1 | 19 | (15.2) | 18 | (24.0) | |
| Unknown | 1 | (0.8) | 3 | (4.0) | |
| Respiratory rate, n (%) | 0.02 | ||||
| <20 | 59 | (47.2) | 21 | (28.0) | |
| 20 | 66 | (52.8) | 52 | (69.3) | |
| Unknown | 0 | (0.0) | 2 | (2.7) | |
| Oxygen saturation, n (%) | 0.03 | ||||
| <88 | 2 | (1.6) | 6 | (8.0) | |
| 88 | 122 | (97.6) | 65 | (86.7) | |
| Unknown | 1 | (0.8) | 4 | (5.3) | |
| Temperature, n (%) | 0.09 | ||||
| <38.0 | 100 | (80.0) | 51 | (68.0) | |
| 38.0 | 25 | (20.0) | 23 | (30.7) | |
| Unknown | 0 | (0.0) | 1 | (1.3) | |
| Canadian Triage and Acuity Scale, n (%) | 0.13 | ||||
| Resuscitation | 1 | (0.8) | 3 | (4.0) | |
| Emergent | 70 | (56.0) | 49 | (65.3) | |
| Urgent | 52 | (41.6) | 22 | (29.3) | |
| Less urgent and nonurgent | 2 | (1.6) | 1 | (1.3) | |
| Discharge diagnosis, n (%) | 0.29 | ||||
| Aspiration pneumonia | 12 | (9.6) | 12 | (16.0) | |
| Chronic obstructive pulmonary disease | 15 | (12.0) | 3 | (4.0) | |
| Dehydration/disorders fluid/electrolytes | 9 | (7.2) | 5 | (6.7) | |
| Gastrointestinal hemorrhage | 4 | (3.2) | 3 | (4.0) | |
| Heart failure | 11 | (8.8) | 2 | (2.7) | |
| Infection (other or not identified) | 9 | (7.2) | 9 | (12.0) | |
| Influenza/pneumonia | 14 | (11.2) | 11 | (14.7) | |
| Lower urinary tract infection | 11 | (8.8) | 6 | (8.0) | |
| Other | 40 | (32.0) | 24 | (32.0) | |
| Hospitalization included ICU stay, n (%) | 0.01 | ||||
| No | 124 | (99.2) | 69 | (92.0) | |
| Yes | 1 | (0.8) | 6 | (8.0) | |
When these 4 significant clinical and visit characteristics were tested together in a logistic regression analysis, 2 remained statistically significant (Table 2). Patients with lower GCS scores (GCS 1213 and 711) were more likely to have discussions (AOR: 4.4 [95% CI: 1.4‐13.9] and AOR: 5.9 [95% CI: 2.6‐13.2], respectively) and patients with higher respiratory rates were also more likely to have discussions (AOR: 2.3 [95% CI: 1.1‐4.8]).
| Characteristic | Adjusted Odds Ratio | 95% Confidence Interval | P Value |
|---|---|---|---|
| |||
| Glasgow Coma Scale | <0.001 | ||
| <7 | 1.77 | 0.33‐9.58 | 0.51 |
| 711 | 5.90 | 2.64‐13.22 | <0.001 |
| 1213 | 4.43 | 1.41‐13.91 | 0.01 |
| 1415 | Reference | ||
| Respiration | |||
| <20 | Reference | ||
| 20 | 2.32 | 1.12‐4.78 | 0.02 |
| Oxygen saturation | |||
| <88 | 3.35 | 0.55‐20.56 | 0.19 |
| 88 | Reference | 0.05‐1.83 | |
| Hospitalization included ICU stay | |||
| No | Reference | ||
| Yes | 7.87 | 0.83‐74.73 | 0.07 |
GOC Documentation in the Discharge Summary
For the subset of patients who survived index hospitalization and were discharged back to LTC (176 patients or 88%), we also investigated whether the ADs were documented in the discharge summary back to LTC (data not shown). Of the 42 patients (23.9%) who had a change in the AD (18 patients had an AD increase in care intensity due to hospitalization; 24 had a decrease), only 11 (26%) had this AD change documented in the discharge summary.
Outcomes of GOC Documentation
A number of outcomes differed significantly between patients with and without GOC discussions in unadjusted comparisons (Table 3). Patients with discussions had higher rates of orders for no CPR (80% vs 55%) and orders for comfort measures only (7% vs 0%). They also had higher rates of in‐hospital death (29% vs 1%), 1‐year mortality (63% vs 28%), and longer LOS. However, RIW and subsequent hospital use were not found to be significant.
| Variable | Goals of Care Discussion Documented in Medical Chart | ||||
|---|---|---|---|---|---|
| No, N = 125 | Yes, N = 75 | P Value | |||
| |||||
| Physician orders, n (%) | <0.001 | ||||
| Comfort measures only | 0 | (0.0) | 5 | (6.7) | |
| No cardiopulmonary resuscitation | 69 | (55.2) | 60 | (80.0) | |
| Full code | 56 | (44.8) | 10 | (13.3) | |
| Visit disposition, n (%) | <0.001 | ||||
| Long‐term care home | 124 | (99.2) | 52 | (69.3) | |
| Died | 1 | (0.8) | 22 | (29.3) | |
| Transfer to palliative care facility | 0 | (0.0) | 1 | (1.3) | |
| Resource intensity weight, n (%) | 0.43 | ||||
| 0.250.75 | 35 | (28.0) | 19 | (25.3) | |
| 0.761.14 | 29 | (23.2) | 16 | (21.3) | |
| 1.151.60 | 34 | (27.2) | 16 | (21.3) | |
| 1.6125.5 | 27 | (21.6) | 24 | (32.0) | |
| Length of stay, d, n (%) | 0.01 | ||||
| 0.672.97 | 30 | (24.0) | 20 | (26.7) | |
| 2.984.60 | 40 | (32.0) | 10 | (13.3) | |
| 4.618.65 | 30 | (24.0) | 20 | (26.7) | |
| 8.66+ | 25 | (20.0) | 25 | (33.3) | |
| Subsequent emergency department visits in next year, n (% of applicable) | 0.38 | ||||
| 0 | 66 | (53.2) | 32 | (61.5) | |
| 1 | 30 | (24.2) | 13 | (25.0) | |
| 2+ | 28 | (22.6) | 7 | (13.5) | |
| Not applicable (died during index hospitalization or transfer to palliative care) | 1 | 23 | |||
| Subsequent hospitalizations in next year, n (% of applicable) | 0.87 | ||||
| 0 | 87 | (70.2) | 38 | (73.1) | |
| 1 | 24 | (19.4) | 10 | (19.2) | |
| 2+ | 13 | (10.5) | 4 | (7.7) | |
| Not applicable (died during index hospitalization or transfer to palliative care) | 1 | 23 | |||
| 1‐year mortality, n (% of applicable) | <0.001 | ||||
| Alive | 82 | (71.9) | 15 | (37.5) | |
| Dead | 32 | (28.1) | 25 | (62.5) | |
| Not applicable (died during index hospitalization or transfer to palliative care) | 1 | 23 | |||
| Not applicable (unsuccessful follow‐up with long‐term care home) | 10 | 12 | |||
Predictors of In‐hospital Death and 1‐Year Mortality
Given the significant positive associations between discussions and in‐hospital death and 1‐year mortality, we performed separate logistic regression analyses to test whether discussions independently predicted in‐hospital death and 1‐year mortality (Table 4). After adjusting for variables significant in their respective bivariate analyses, patients with discussions continued to have higher odds of in‐hospital death (AOR: 52.0 [95% CI: 6.2‐440.4]) and 1‐year mortality (AOR: 4.1 [95% CI: 1.7‐9.6]). Of note, the presence of dementia had significantly lower adjusted odds of in‐hospital death compared to the reference group of no dementia (AOR: 0.3 [95% CI: 0.1‐0.8]).
| Characteristic | Adjusted Odds Ratio | 95% Confidence Interval | P Value |
|---|---|---|---|
| |||
| In‐hospital death odds ratios | |||
| Advance directives from long‐term care | 0.91 | ||
| Comfort measures only | Reference | ||
| Supportive care no transfer | 3.43E +18 | 0‐. | 1.00 |
| Transfer to hospital | 3.10E +8 | 0‐. | 1.00 |
| Aggressive care | 4.85E +8 | 0‐. | 1.00 |
| Dementia | |||
| No | Reference | ||
| Yes | .25 | 0.08‐0.79 | 0.02 |
| Previous hospitalizations in last year | 0.05 | ||
| 0 | Reference | ||
| 1 | 0.43 | 0.08‐2.38 | 0.34 |
| 2+ | 6.30 | 1.10‐36.06 | 0.04 |
| Respiration | |||
| <20 | Reference | ||
| 20 | 3.64 | 0.82‐16.24 | 0.09 |
| Documented goals of care discussion | |||
| No | Reference | ||
| Yes | 52.04 | 6.15‐440.40 | <0.001 |
| 1‐year mortality odds ratios | |||
| Oxygen saturation, n (%) | |||
| <88 | 12.15 | 1.18‐124.97 | 0.04 |
| 88 | Reference | ||
| Previous ED visits in last year | 0.06 | ||
| 0 | Reference | ||
| 1 | 3.07 | 1.15‐8.17 | 0.03 |
| 2+ | 3.21 | 0.87‐11.81 | 0.08 |
| Previous hospitalizations in last year | 0.55 | ||
| 0 | Reference | ||
| 1 | 1.66 | 0.57‐4.86 | 0.36 |
| 2+ | 2.52 | 0.30‐20.89 | 0.39 |
| Documented goals of care discussion | |||
| No | Reference | ||
| Yes | 4.07 | 1.73‐9.56 | 0.001 |
DISCUSSION
Our retrospective study of LTC residents admitted to the GIM service showed that these admissions comprised 9.4% of all admissions and that GOC discussions occurred infrequently (37.5%). Our study revealed no differences in baseline patient characteristics associated with discussions, whereas patient acuity at hospital presentation independently contributed to the likelihood of discussions. We found strong associations between documentation and certain outcomes of care, including orders for AD, LOS, in‐hospital death, and 1‐year mortality. No significant associations were found between documentation and subsequent hospital use. Lastly, we found that consistent communication back to the LTC home when there was a change in AD was very poor; only 26% of discharge summaries included this documentation.
Our finding of infrequent GOC discussions during hospitalization aligns with prior studies. A study that identified code status discussions in transcripts of audio‐recorded admission encounters found that code status was discussed in only 24% of seriously ill patient admissions.[17] Furthermore, in a study specific to LTC residents, only 42% of admissions longer than 48 hours had a documented GOC discussion.[15]
We found visit‐level, but not baseline, characteristics were associated with discussions. These findings are supported by a recent study that found that whether GOC discussions took place largely depended on the acute condition presented on admission.[15] Although these results suggest that clinicians are appropriately prioritizing sicker patients who might have the most pressing need for GOC discussions, they also highlight the gap in care for less‐sick patients and the need to broaden clinical practice and consider underlying conditions and functional status. Of note, although the GCS score was found to be significantly associated with discussions, patients in the lowest GCS range did not have significantly different odds of discussions compared to the reference level (highest GCS range). A recent study by You et al. may offer some insight into this finding. They found that patients lacking capacity to make GOC decisions was ranked fifth, whereas lack of SDM availability was eighth among 21 barriers to GOC discussions, as perceived by hospital‐based clinicians.[16]
A major finding of this study was that both in‐hospital and 1‐year mortality were strongly associated with having a GOC discussion, suggesting that patients at higher risk of dying are more likely to have discussions. This is reflected by illness severity measured at initial assessment and by persistence of the association between discussions and mortality after discharge back to LTC. To the best of our knowledge, no previous studies have reported these findings. There are likely some unmeasured clinical factors such as clinical deterioration during hospitalization that contributed to this strong association. Interestingly, in our logistic regression analysis for independent predictors of in‐hospital death, we found that having dementia was associated with lower odds of in‐hospital death. One interpretation of this finding is that perhaps only patients with mild dementia were hospitalized, and those with more advanced dementia had an AD established in LTC that allowed them to remain in their LTC home. This possibility is supported by a systematic review of factors associated with LTC home hospitalization, which found that dementia was shown to be associated with less hospitalization.[18]
For patients who survived hospitalization, we did not find an association between GOC discussions and hospital use in the year following index hospitalization. In both groups, nearly 30% of patients had 1 or more subsequent hospitalizations. This is relevant especially in light of the finding that among patients where GOC discussions resulted in an AD change, only 26% of discharge summaries back to LTC included this documentation. We can only speculate that had these discussions been properly documented, subsequent hospitalizations would have decreased in the GOC group. Previous research has found that omissions of critical information in discharge summaries were common. In a study of hip fracture and stroke patients discharged from a large Midwestern academic medical center in the United States, code status was included in the discharge summary only 7% of the time.[19] The discharge summary is the primary means of sharing patient information between the hospital and LTC home. If GOC discussions are not included in the discharge summary, it is very unlikely that this information will be subsequently updated in the LTC medical record and impact the care the patient receives. A key recommendation for hospital‐based providers is ensuring that GOC discussions are clearly, consistently, and completely documented in the discharge summary so that the care provided is based on the patients' wishes.
Our study has several limitations. Our analysis was based on chart review, and although our analyses take into account a number of patient characteristics, we did not capture other characteristics that might influence GOC discussions such as culture/religion, language barriers, SDM availability, or whether patients clinically deteriorated during the index admission. Additionally, provider‐level predictors, including seniority, previous GOC training, and time available to conduct these discussions, were not captured. We also did not capture the timing or number of occasions that GOC discussions took place during hospitalization. Due to the retrospective nature of our study, we were able to only look at documented GOC discussions. GOC discussions may have happened but were never documented. However, the standard of care is to document these discussions as part of the medical record, and if they are not documented, it can be considered not to have happened and indicates a lower quality of practice. A recent survey of Canadian hospital‐based healthcare providers identified standardized GOC documentation as an effective practice to improve GOC communication.[20] Finally, because our study was conducted in 2 academic hospitals, our results may be less generalizable to other community hospitals. However, our hospitals' catchment areas capture a diverse population, both culturally and in terms of their socioeconomic status.
CONCLUSION
GOC discussions occurred infrequently, appeared to be triggered by illness severity, and were poorly communicated back to LTC. Important outcomes of care, including in‐hospital death and 1‐year mortality, were associated with discussions. This study serves to identify gaps in who might benefit from GOC discussions and illustrates opportunities for improvement including implementing standardized documentation practices.
Disclosures
Hannah J. Wong, PhD, and Robert C. Wu, MD, had full access to all of the data in the study and take responsibility for the integrity of the data and the accuracy of the data analysis. Robert C. Wu, MD, Hannah J. Wong, PhD, and Michelle Grinman, MD, were responsible for the conception and design of the study. Robert C. Wu, MD, Hannah J. Wong, PhD, and Jamie Wang were responsible for the acquisition of the data. All of the authors were responsible for the analysis and interpretation of the data, drafting of the manuscript, critical revision of the manuscript for important intellectual content, and final approval of the manuscript. Hannah J. Wong, PhD obtained the funding. Hannah J. Wong, PhD, and Robert C. Wu, MD, supervised the study. The authors report no conflicts of interest.
- , , , , . Trends in emergency department visits for ambulatory care sensitive conditions by elderly nursing home residents, 2001 to 2010. JAMA Intern Med. 2014;174(1):156–158.
- , , , . Hospital transfers of nursing home residents with advanced dementia. J Am Geriatr Soc. 2012;60(5):905–909.
- , , , , . Potentially avoidable hospitalizations for elderly long‐stay residents in nursing homes. Med Care. 2013;51(8):673–681.
- , . Reducing unnecessary hospitalizations of nursing home residents. N Engl J Med. 2011;365(13):1165–1167.
- , , . Advance directives and outcomes of surrogate decision making before death. N Engl J Med. 2010;362(13):1211–1218.
- , , , , , . The consistency between treatments provided to nursing facility residents and orders on the physician orders for life‐sustaining treatment form. J Am Geriatr Soc. 2011;59(11):2091–2099.
- , , . What should be the goal of advance care planning? JAMA Intern Med. 2014;174(7):1093–1094.
- , , , et al. Associations between end‐of‐life discussions, patient mental health, medical care near death, and caregiver bereavement adjustment. JAMA. 2008;300(14):1665–1673.
- , , , et al. Systematic implementation of an advance directive program in nursing homes: a randomized controlled trial. JAMA. 2000;283(11):1437–1444.
- , . Communication about serious illness care goals: a review and synthesis of best practices. JAMA Intern Med. 2014;174(12):1994–2003.
- , , . Predictors of nursing home residents' time to hospitalization. Health Serv Res. 2011;46(1 pt 1):82–104.
- , , , . Regional variation in the association between advance directives and end‐of‐life Medicare expenditures. JAMA. 2011;306(13):1447–1453.
- , , . Just ask: discussing goals of care with patients in hospital with serious illness. CMAJ. 2014;186(6):425–432.
- , , , et al. Failure to engage hospitalized elderly patients and their families in advance care planning. JAMA Intern Med. 2013;173(9):778–787.
- , , , . Hospitalisation of high‐care residents of aged care facilities: are goals of care discussed? Intern Med J. 2013;43(2):144–149.
- , , , et al. Barriers to goals of care discussions with seriously ill hospitalized patients and their families: a multicenter survey of clinicians. JAMA Intern Med. 2015;175(4):549–556.
- , , , , . Code status discussions between attending hospitalist physicians and medical patients at hospital admission. J Gen Intern Med. 2011;26(4):359–366.
- , , , . Predictors of nursing home hospitalization: a review of the literature. Med Care Res Rev. 2008;65(1):3–39.
- , , , , . Provider characteristics, clinical‐work processes and their relationship to discharge summary quality for sub‐acute care patients. J Gen Intern Med. 2012;27(1):78–84.
- , , , . Strategies for effective goals of care discussions and decision‐making: perspectives from a multi‐centre survey of Canadian hospital‐based healthcare providers. BMC Palliat Care. 2015;14:38.
Hospitalizations of long‐term care (LTC) residents are known to be frequent, costly, often preventable,[1, 2, 3] and potentially associated with negative health outcomes.[4] Often, an advance directive (AD) is made at LTC admission and updated annually when residents are in relatively stable health. An AD is a document that helps to inform a substitute decision maker (SDM) about the consent process for life‐sustaining treatments and is a resource that supports advance care planning (ACP). ACP is a process that allows individuals to consider, express, and plan for future healthcare in the event that they lack capacity to make their own decisions. When an LTC resident's health deteriorates and hospitalization is required, there is an opportunity to update prognosis, discuss risks and benefits of previously held treatment preferences, as well as reassess goals of care (GOC).
Engaging in ACP discussions during relatively stable health can help ensure patient preferences are followed.[5, 6] These discussions, however, are often insufficient, as they involve decision making for hypothetical situations that may not cover all potential scenarios, and may not reflect a patient's reality at the time of health status decline. Discussions held in the moment more authentically reflect the decisions of patients and/or SDM based on the specific needs and clinical realities particular to the patient at that time.[7] GOC discussions, defined in this context as ACP discussions occurring during hospitalization, have the potential to better align patient wishes with care received,[6] improve quality of life and satisfaction,[8, 9, 10] and reduce unwanted extra care.[11, 12] Although in‐the‐moment GOC discussions are recommended for all hospitalized patients who are seriously ill with a high risk of dying,[13] research suggests that this occurs infrequently for elderly patients. A recent multicenter survey of seriously ill hospitalized elderly patients found that only 25% of patients and 32% of family members reported that they had been asked about prior ACP or AD.[14] Another study of hospitalized LTC residents found that resuscitation status and family discussion was documented in only 55% and 42% of admissions, respectively.[15]
Further investigation is required to determine how often LTC patients have GOC discussions, what prompts these discussions, and what are the outcomes. Previous studies have focused on barriers to performing GOC discussions, rather than the factors that are associated with them.[16] By understanding why these discussions currently happen, we can potentially improve how often they occur and the quality of their outcomes.
The objectives of this study were to determine the rate of documented GOC discussions among hospitalized LTC residents, identify factors that were associated with documentation, and examine the association between documentation and outcomes of care.
METHODS
Study Population
We conducted a retrospective chart review of a random convenience sample of hospitalized patients admitted via the emergency department (ED) to the general internal medicine (GIM) service from January 1, 2012 through December 31, 2012, at 2 academic teaching hospitals in Toronto, Canada. Patients were identified through a search of each hospitals' electronic patient record (EPR). Patients were eligible for inclusion if they were (1) a LTC resident and (2) at least 65 years of age. For patients with multiple admissions to the GIM service during the specified 12‐month period, we only included data from the first hospitalization (index hospitalization). The hospital's research ethics board approved this study.
Our primary variable of interest was documentation in the hospital medical record of a discussion between physicians and the patient/family/SDM regarding GOC. A GOC discussion was considered to have taken place if there was documentation of (1) understanding/expectation of treatment options or (2) patient's preferences for life‐sustaining measures. Examples illustrating each criterion are provided in the Supporting Information, Appendix 1, in the online version of this article.
Factors Associated With GOC Documentation
From the EPR, we obtained visit‐level data including age, gender, Canadian Emergency Department Triage and Acuity Scale, vital signs at ED admission including temperature, respiratory rate, oxygen saturation, Glasgow Coma Scale (GCS) and shock index (defined as heart rate divided by systolic blood pressure), admission and discharge dates/times, discharge diagnosis, transfer to intensive care unit (ICU), and hospital use (number of ED visits and hospitalizations to the 2 study hospitals in the 1‐year period prior to index hospitalization).
Trained study personnel (J.W.) used a structured abstraction form to collect data from the hospital medical record that were not available through the EPR, including years living in LTC, contents of LTC AD forms, presence of SDM (identified as immediate family or surrogate with whom the care team communicated), dementia diagnosis (defined as documentation of dementia in the patient's past medical history and/or history of present illness), and measures of functional status. When available, we extracted the AD from LTC; they consisted of 4 levels (level 1: comfort careno transfer to hospital, no cardiopulmonary resuscitation [CPR]; level 2: supportive careadministration of antibiotics and/or other procedures that can be provided within LTC, no transfer to the hospital, no CPR; level 3: transfer to the hospitalno CPR; level 4: aggressive interventiontransfer to hospital for aggressive treatment, CPR).
GOC Documentation in the Discharge Summary
For the subset of patients who survived hospitalization and were discharged back to LTC, we examined whether the ADs ordered during hospitalization were communicated back to LTC via the discharge summary. We additionally assessed if the ADs determined during hospitalization differed from preferences documented prior to hospitalization. Physician orders for ADs were categorized as level 1: comfort measures only, level 3: no CPR, or level 4: full code. LTC level 2 was considered equivalent to physician‐ordered level 3 at admission; a patient with an LTC level 2 with no CPR (level 3) documented during hospitalized would be considered to have no change in the AD. An increase or decrease in the AD was determined by comparing LTC levels 1, 3, and 4 to physician‐ordered level 1, 3, and 4.
Outcomes of GOC Documentation
From the EPR, we obtained visit‐level outcome data including length of stay (LOS), resource intensity weight (RIW) (calculated based on patient case‐mix, severity, age, and procedures performed), visit disposition, number of ED visits and hospitalizations to the 2 study hospitals in the year following index hospitalization, in‐hospital death, and 1‐year mortality. We determined 1‐year mortality by following up with the LTC homes to determine whether the resident had died within the year following index hospitalization; only patients from LTC homes that responded to our request for data were included in 1‐year mortality analyses. We collected physician orders for the AD from chart review.
Statistical Analysis
Patients with and without documented GOC discussions were compared. Descriptive statistics including frequencies and percentages were used to characterize study variables. Differences between the study groups were assessed using Pearson 2/Fisher exact test. Multivariate logistic regression, which included variables that were significant in the bivariate analysis, was used to identify independent predictors of GOC discussion. Adjusted odds ratios (AOR) and 95% confidence intervals (CI) were presented for the logistic model. Patients with missing predictor data were excluded.
We also examined whether there was a correlation between GOC discussion and outcomes of care using Pearson 2/Fisher exact test. Outcomes included orders for the AD, LOS in days (stratified into quartiles), RIW (stratified into quartiles), visit disposition, hospital use in the year following index hospitalization, and 1‐year mortality following discharge back to LTC.
Lastly, to better understand the independent predictors of in‐hospital and 1‐year mortality, we used Pearson 2/Fisher exact test followed by logistic regression that included significant variables from the bivariate analyses.
All analyses were 2‐sided, and a P value of <0.05 was considered statistically significant. We used SPSS version 22.0 (SPSS Inc., Chicago, IL).
RESULTS
We identified a total of 7084 hospitalizations to GIM between January 1, 2012 and December 31, 2012, of which 665 (9.4%) met inclusion criteria of residence in LTC and age 65 years. Of these 665 hospitalizations, 512 were unique patients. We randomly selected a convenience sample of 200 index hospitalizations of the 512 eligible hospitalizations (39%) to perform the chart review.
Predictors of GOC Documentation
Of the 200 randomly sampled charts that were reviewed, 75 (37.5%) had a documented GOC discussion.
Characteristics of the study patients and results of bivariate analysis of the association between patient characteristics and GOC discussion are summarized in Table 1. No significant differences in demographic and baseline characteristics were seen between patients with and without discussion. However, a number of visit characteristics were found to be significantly associated with discussion. Forty percent of patients in the GOC discussion group had GCS scores 11 compared to 15.2% in the no‐discussion group. Higher respiratory rate, lower oxygen saturation, and ICU transfer were also significantly associated with discussions.
| Goals of Care Discussion Documented in Medical Chart | |||||
|---|---|---|---|---|---|
| No, N = 125 | Yes, N = 75 | P Value | |||
| |||||
| Baseline characteristics | |||||
| Gender, n (%) | 0.88 | ||||
| Male | 48 | (38.4) | 30 | (40.0) | |
| Female | 77 | (61.6) | 45 | (60.0) | |
| Age, y, n (%) | 0.85 | ||||
| 6579 | 36 | (28.8) | 19 | (25.3) | |
| 8084 | 30 | (24.0) | 19 | (25.3) | |
| 8589 | 30 | (24.0) | 16 | (21.3) | |
| 90101 | 29 | (23.2) | 21 | (28.0) | |
| Years living in long‐term care, n (%)* | 0.65 | ||||
| [0, 1) | 28 | (22.4) | 12 | (16.0) | |
| [1, 3) | 31 | (24.8) | 22 | (29.3) | |
| [3, 6) | 33 | (26.4) | 22 | (29.3) | |
| [6, 22) | 25 | (20.0) | 13 | (17.3) | |
| Unknown | 8 | (6.4) | 6 | (8.0) | |
| AD from long‐term care, n (%) | 0.14 | ||||
| Comfort measures only | 2 | (1.6) | 1 | (1.3) | |
| Supportive care with no transfer to hospital | 0 | (0.0) | 3 | (4.0) | |
| Supportive care with transfer to hospital | 70 | (56.0) | 44 | (58.7) | |
| Aggressive care | 53 | (42.4) | 27 | (36.0) | |
| Years since most recent AD signed, n (%)* | 0.12 | ||||
| [0, 1) | 79 | (63.2) | 48 | (64.0) | |
| [1, 2) | 21 | (16.8) | 6 | (8.0) | |
| [2, 6) | 9 | (7.2) | 10 | (13.3) | |
| Unknown | 16 | (12.8) | 11 | (14.7) | |
| Substitute decision maker, n (%) | 0.06 | ||||
| Child | 81 | (64.8) | 44 | (58.7) | |
| Spouse | 9 | (7.2) | 15 | (20.0) | |
| Other | 26 | (20.8) | 13 | (17.3) | |
| Public guardian trustee | 6 | (4.8) | 2 | (2.7) | |
| Unknown | 3 | (2.4) | 1 | (1.3) | |
| Dementia, n (%) | 1.00 | ||||
| No | 47 | (37.6) | 28 | (37.3) | |
| Yes | 78 | (62.4) | 47 | (62.7) | |
| Mobility, n (%) | 0.26 | ||||
| Walk without assistance | 5 | (4.0) | 3 | (4.0) | |
| Walker | 16 | (12.8) | 3 | (4.0) | |
| Wheelchair | 43 | (34.4) | 29 | (38.7) | |
| Bedridden | 7 | (5.6) | 4 | (5.3) | |
| Unknown | 54 | (43.2) | 36 | (48.0) | |
| Continence, n (%) | 0.05 | ||||
| Mostly continent | 16 | (12.8) | 3 | (4.0) | |
| Incontinent | 49 | (39.2) | 34 | (45.3) | |
| Catheter/stoma | 7 | (5.6) | 1 | (1.3) | |
| Unknown | 53 | (42.4) | 37 | (49.3) | |
| Feeding, n (%) | 0.17 | ||||
| Mostly feeds self | 38 | (30.4) | 13 | (17.3) | |
| Needs to be fed | 17 | (13.6) | 14 | (18.7) | |
| Gastrostomy tube | 8 | (6.4) | 5 | (6.7) | |
| Unknown | 62 | (49.6) | 43 | (57.3) | |
| Diet, n (%) | 0.68 | ||||
| Normal | 43 | (34.4) | 16 | (21.3) | |
| Dysphagic | 32 | (25.6) | 15 | (20.0) | |
| Gastrostomy tube | 8 | (6.4) | 5 | (6.7) | |
| Unknown | 42 | (33.6) | 39 | (52.0) | |
| Previous ED visits in last year, n (%) | 0.43 | ||||
| 0 | 70 | (56.0) | 41 | (54.7) | |
| 1 | 35 | (28.0) | 17 | (22.7) | |
| 2+ | 20 | (16.0) | 17 | (22.7) | |
| Previous hospitalizations in last year, n (%) | 0.19 | ||||
| 0 | 98 | (78.4) | 54 | (72.0) | |
| 1 | 23 | (18.4) | 14 | (18.7) | |
| 2+ | 4 | (3.2) | 7 | (9.3) | |
| Visit characteristics | |||||
| Glasgow Coma Scale, n (%) | <0.001 | ||||
| <7 | 4 | (3.2) | 4 | (5.3) | |
| 711 | 15 | (12.0) | 26 | (34.7) | |
| 1213 | 7 | (5.6) | 8 | (10.7) | |
| 1415 | 85 | (68.0) | 32 | (42.7) | |
| Unknown | 14 | (11.2) | 5 | (6.7) | |
| Shock index, n (%) | 0.13 | ||||
| 1 | 105 | (84.0) | 54 | (72.0) | |
| >1 | 19 | (15.2) | 18 | (24.0) | |
| Unknown | 1 | (0.8) | 3 | (4.0) | |
| Respiratory rate, n (%) | 0.02 | ||||
| <20 | 59 | (47.2) | 21 | (28.0) | |
| 20 | 66 | (52.8) | 52 | (69.3) | |
| Unknown | 0 | (0.0) | 2 | (2.7) | |
| Oxygen saturation, n (%) | 0.03 | ||||
| <88 | 2 | (1.6) | 6 | (8.0) | |
| 88 | 122 | (97.6) | 65 | (86.7) | |
| Unknown | 1 | (0.8) | 4 | (5.3) | |
| Temperature, n (%) | 0.09 | ||||
| <38.0 | 100 | (80.0) | 51 | (68.0) | |
| 38.0 | 25 | (20.0) | 23 | (30.7) | |
| Unknown | 0 | (0.0) | 1 | (1.3) | |
| Canadian Triage and Acuity Scale, n (%) | 0.13 | ||||
| Resuscitation | 1 | (0.8) | 3 | (4.0) | |
| Emergent | 70 | (56.0) | 49 | (65.3) | |
| Urgent | 52 | (41.6) | 22 | (29.3) | |
| Less urgent and nonurgent | 2 | (1.6) | 1 | (1.3) | |
| Discharge diagnosis, n (%) | 0.29 | ||||
| Aspiration pneumonia | 12 | (9.6) | 12 | (16.0) | |
| Chronic obstructive pulmonary disease | 15 | (12.0) | 3 | (4.0) | |
| Dehydration/disorders fluid/electrolytes | 9 | (7.2) | 5 | (6.7) | |
| Gastrointestinal hemorrhage | 4 | (3.2) | 3 | (4.0) | |
| Heart failure | 11 | (8.8) | 2 | (2.7) | |
| Infection (other or not identified) | 9 | (7.2) | 9 | (12.0) | |
| Influenza/pneumonia | 14 | (11.2) | 11 | (14.7) | |
| Lower urinary tract infection | 11 | (8.8) | 6 | (8.0) | |
| Other | 40 | (32.0) | 24 | (32.0) | |
| Hospitalization included ICU stay, n (%) | 0.01 | ||||
| No | 124 | (99.2) | 69 | (92.0) | |
| Yes | 1 | (0.8) | 6 | (8.0) | |
When these 4 significant clinical and visit characteristics were tested together in a logistic regression analysis, 2 remained statistically significant (Table 2). Patients with lower GCS scores (GCS 1213 and 711) were more likely to have discussions (AOR: 4.4 [95% CI: 1.4‐13.9] and AOR: 5.9 [95% CI: 2.6‐13.2], respectively) and patients with higher respiratory rates were also more likely to have discussions (AOR: 2.3 [95% CI: 1.1‐4.8]).
| Characteristic | Adjusted Odds Ratio | 95% Confidence Interval | P Value |
|---|---|---|---|
| |||
| Glasgow Coma Scale | <0.001 | ||
| <7 | 1.77 | 0.33‐9.58 | 0.51 |
| 711 | 5.90 | 2.64‐13.22 | <0.001 |
| 1213 | 4.43 | 1.41‐13.91 | 0.01 |
| 1415 | Reference | ||
| Respiration | |||
| <20 | Reference | ||
| 20 | 2.32 | 1.12‐4.78 | 0.02 |
| Oxygen saturation | |||
| <88 | 3.35 | 0.55‐20.56 | 0.19 |
| 88 | Reference | 0.05‐1.83 | |
| Hospitalization included ICU stay | |||
| No | Reference | ||
| Yes | 7.87 | 0.83‐74.73 | 0.07 |
GOC Documentation in the Discharge Summary
For the subset of patients who survived index hospitalization and were discharged back to LTC (176 patients or 88%), we also investigated whether the ADs were documented in the discharge summary back to LTC (data not shown). Of the 42 patients (23.9%) who had a change in the AD (18 patients had an AD increase in care intensity due to hospitalization; 24 had a decrease), only 11 (26%) had this AD change documented in the discharge summary.
Outcomes of GOC Documentation
A number of outcomes differed significantly between patients with and without GOC discussions in unadjusted comparisons (Table 3). Patients with discussions had higher rates of orders for no CPR (80% vs 55%) and orders for comfort measures only (7% vs 0%). They also had higher rates of in‐hospital death (29% vs 1%), 1‐year mortality (63% vs 28%), and longer LOS. However, RIW and subsequent hospital use were not found to be significant.
| Variable | Goals of Care Discussion Documented in Medical Chart | ||||
|---|---|---|---|---|---|
| No, N = 125 | Yes, N = 75 | P Value | |||
| |||||
| Physician orders, n (%) | <0.001 | ||||
| Comfort measures only | 0 | (0.0) | 5 | (6.7) | |
| No cardiopulmonary resuscitation | 69 | (55.2) | 60 | (80.0) | |
| Full code | 56 | (44.8) | 10 | (13.3) | |
| Visit disposition, n (%) | <0.001 | ||||
| Long‐term care home | 124 | (99.2) | 52 | (69.3) | |
| Died | 1 | (0.8) | 22 | (29.3) | |
| Transfer to palliative care facility | 0 | (0.0) | 1 | (1.3) | |
| Resource intensity weight, n (%) | 0.43 | ||||
| 0.250.75 | 35 | (28.0) | 19 | (25.3) | |
| 0.761.14 | 29 | (23.2) | 16 | (21.3) | |
| 1.151.60 | 34 | (27.2) | 16 | (21.3) | |
| 1.6125.5 | 27 | (21.6) | 24 | (32.0) | |
| Length of stay, d, n (%) | 0.01 | ||||
| 0.672.97 | 30 | (24.0) | 20 | (26.7) | |
| 2.984.60 | 40 | (32.0) | 10 | (13.3) | |
| 4.618.65 | 30 | (24.0) | 20 | (26.7) | |
| 8.66+ | 25 | (20.0) | 25 | (33.3) | |
| Subsequent emergency department visits in next year, n (% of applicable) | 0.38 | ||||
| 0 | 66 | (53.2) | 32 | (61.5) | |
| 1 | 30 | (24.2) | 13 | (25.0) | |
| 2+ | 28 | (22.6) | 7 | (13.5) | |
| Not applicable (died during index hospitalization or transfer to palliative care) | 1 | 23 | |||
| Subsequent hospitalizations in next year, n (% of applicable) | 0.87 | ||||
| 0 | 87 | (70.2) | 38 | (73.1) | |
| 1 | 24 | (19.4) | 10 | (19.2) | |
| 2+ | 13 | (10.5) | 4 | (7.7) | |
| Not applicable (died during index hospitalization or transfer to palliative care) | 1 | 23 | |||
| 1‐year mortality, n (% of applicable) | <0.001 | ||||
| Alive | 82 | (71.9) | 15 | (37.5) | |
| Dead | 32 | (28.1) | 25 | (62.5) | |
| Not applicable (died during index hospitalization or transfer to palliative care) | 1 | 23 | |||
| Not applicable (unsuccessful follow‐up with long‐term care home) | 10 | 12 | |||
Predictors of In‐hospital Death and 1‐Year Mortality
Given the significant positive associations between discussions and in‐hospital death and 1‐year mortality, we performed separate logistic regression analyses to test whether discussions independently predicted in‐hospital death and 1‐year mortality (Table 4). After adjusting for variables significant in their respective bivariate analyses, patients with discussions continued to have higher odds of in‐hospital death (AOR: 52.0 [95% CI: 6.2‐440.4]) and 1‐year mortality (AOR: 4.1 [95% CI: 1.7‐9.6]). Of note, the presence of dementia had significantly lower adjusted odds of in‐hospital death compared to the reference group of no dementia (AOR: 0.3 [95% CI: 0.1‐0.8]).
| Characteristic | Adjusted Odds Ratio | 95% Confidence Interval | P Value |
|---|---|---|---|
| |||
| In‐hospital death odds ratios | |||
| Advance directives from long‐term care | 0.91 | ||
| Comfort measures only | Reference | ||
| Supportive care no transfer | 3.43E +18 | 0‐. | 1.00 |
| Transfer to hospital | 3.10E +8 | 0‐. | 1.00 |
| Aggressive care | 4.85E +8 | 0‐. | 1.00 |
| Dementia | |||
| No | Reference | ||
| Yes | .25 | 0.08‐0.79 | 0.02 |
| Previous hospitalizations in last year | 0.05 | ||
| 0 | Reference | ||
| 1 | 0.43 | 0.08‐2.38 | 0.34 |
| 2+ | 6.30 | 1.10‐36.06 | 0.04 |
| Respiration | |||
| <20 | Reference | ||
| 20 | 3.64 | 0.82‐16.24 | 0.09 |
| Documented goals of care discussion | |||
| No | Reference | ||
| Yes | 52.04 | 6.15‐440.40 | <0.001 |
| 1‐year mortality odds ratios | |||
| Oxygen saturation, n (%) | |||
| <88 | 12.15 | 1.18‐124.97 | 0.04 |
| 88 | Reference | ||
| Previous ED visits in last year | 0.06 | ||
| 0 | Reference | ||
| 1 | 3.07 | 1.15‐8.17 | 0.03 |
| 2+ | 3.21 | 0.87‐11.81 | 0.08 |
| Previous hospitalizations in last year | 0.55 | ||
| 0 | Reference | ||
| 1 | 1.66 | 0.57‐4.86 | 0.36 |
| 2+ | 2.52 | 0.30‐20.89 | 0.39 |
| Documented goals of care discussion | |||
| No | Reference | ||
| Yes | 4.07 | 1.73‐9.56 | 0.001 |
DISCUSSION
Our retrospective study of LTC residents admitted to the GIM service showed that these admissions comprised 9.4% of all admissions and that GOC discussions occurred infrequently (37.5%). Our study revealed no differences in baseline patient characteristics associated with discussions, whereas patient acuity at hospital presentation independently contributed to the likelihood of discussions. We found strong associations between documentation and certain outcomes of care, including orders for AD, LOS, in‐hospital death, and 1‐year mortality. No significant associations were found between documentation and subsequent hospital use. Lastly, we found that consistent communication back to the LTC home when there was a change in AD was very poor; only 26% of discharge summaries included this documentation.
Our finding of infrequent GOC discussions during hospitalization aligns with prior studies. A study that identified code status discussions in transcripts of audio‐recorded admission encounters found that code status was discussed in only 24% of seriously ill patient admissions.[17] Furthermore, in a study specific to LTC residents, only 42% of admissions longer than 48 hours had a documented GOC discussion.[15]
We found visit‐level, but not baseline, characteristics were associated with discussions. These findings are supported by a recent study that found that whether GOC discussions took place largely depended on the acute condition presented on admission.[15] Although these results suggest that clinicians are appropriately prioritizing sicker patients who might have the most pressing need for GOC discussions, they also highlight the gap in care for less‐sick patients and the need to broaden clinical practice and consider underlying conditions and functional status. Of note, although the GCS score was found to be significantly associated with discussions, patients in the lowest GCS range did not have significantly different odds of discussions compared to the reference level (highest GCS range). A recent study by You et al. may offer some insight into this finding. They found that patients lacking capacity to make GOC decisions was ranked fifth, whereas lack of SDM availability was eighth among 21 barriers to GOC discussions, as perceived by hospital‐based clinicians.[16]
A major finding of this study was that both in‐hospital and 1‐year mortality were strongly associated with having a GOC discussion, suggesting that patients at higher risk of dying are more likely to have discussions. This is reflected by illness severity measured at initial assessment and by persistence of the association between discussions and mortality after discharge back to LTC. To the best of our knowledge, no previous studies have reported these findings. There are likely some unmeasured clinical factors such as clinical deterioration during hospitalization that contributed to this strong association. Interestingly, in our logistic regression analysis for independent predictors of in‐hospital death, we found that having dementia was associated with lower odds of in‐hospital death. One interpretation of this finding is that perhaps only patients with mild dementia were hospitalized, and those with more advanced dementia had an AD established in LTC that allowed them to remain in their LTC home. This possibility is supported by a systematic review of factors associated with LTC home hospitalization, which found that dementia was shown to be associated with less hospitalization.[18]
For patients who survived hospitalization, we did not find an association between GOC discussions and hospital use in the year following index hospitalization. In both groups, nearly 30% of patients had 1 or more subsequent hospitalizations. This is relevant especially in light of the finding that among patients where GOC discussions resulted in an AD change, only 26% of discharge summaries back to LTC included this documentation. We can only speculate that had these discussions been properly documented, subsequent hospitalizations would have decreased in the GOC group. Previous research has found that omissions of critical information in discharge summaries were common. In a study of hip fracture and stroke patients discharged from a large Midwestern academic medical center in the United States, code status was included in the discharge summary only 7% of the time.[19] The discharge summary is the primary means of sharing patient information between the hospital and LTC home. If GOC discussions are not included in the discharge summary, it is very unlikely that this information will be subsequently updated in the LTC medical record and impact the care the patient receives. A key recommendation for hospital‐based providers is ensuring that GOC discussions are clearly, consistently, and completely documented in the discharge summary so that the care provided is based on the patients' wishes.
Our study has several limitations. Our analysis was based on chart review, and although our analyses take into account a number of patient characteristics, we did not capture other characteristics that might influence GOC discussions such as culture/religion, language barriers, SDM availability, or whether patients clinically deteriorated during the index admission. Additionally, provider‐level predictors, including seniority, previous GOC training, and time available to conduct these discussions, were not captured. We also did not capture the timing or number of occasions that GOC discussions took place during hospitalization. Due to the retrospective nature of our study, we were able to only look at documented GOC discussions. GOC discussions may have happened but were never documented. However, the standard of care is to document these discussions as part of the medical record, and if they are not documented, it can be considered not to have happened and indicates a lower quality of practice. A recent survey of Canadian hospital‐based healthcare providers identified standardized GOC documentation as an effective practice to improve GOC communication.[20] Finally, because our study was conducted in 2 academic hospitals, our results may be less generalizable to other community hospitals. However, our hospitals' catchment areas capture a diverse population, both culturally and in terms of their socioeconomic status.
CONCLUSION
GOC discussions occurred infrequently, appeared to be triggered by illness severity, and were poorly communicated back to LTC. Important outcomes of care, including in‐hospital death and 1‐year mortality, were associated with discussions. This study serves to identify gaps in who might benefit from GOC discussions and illustrates opportunities for improvement including implementing standardized documentation practices.
Disclosures
Hannah J. Wong, PhD, and Robert C. Wu, MD, had full access to all of the data in the study and take responsibility for the integrity of the data and the accuracy of the data analysis. Robert C. Wu, MD, Hannah J. Wong, PhD, and Michelle Grinman, MD, were responsible for the conception and design of the study. Robert C. Wu, MD, Hannah J. Wong, PhD, and Jamie Wang were responsible for the acquisition of the data. All of the authors were responsible for the analysis and interpretation of the data, drafting of the manuscript, critical revision of the manuscript for important intellectual content, and final approval of the manuscript. Hannah J. Wong, PhD obtained the funding. Hannah J. Wong, PhD, and Robert C. Wu, MD, supervised the study. The authors report no conflicts of interest.
- , , , , . Trends in emergency department visits for ambulatory care sensitive conditions by elderly nursing home residents, 2001 to 2010. JAMA Intern Med. 2014;174(1):156–158.
- , , , . Hospital transfers of nursing home residents with advanced dementia. J Am Geriatr Soc. 2012;60(5):905–909.
- , , , , . Potentially avoidable hospitalizations for elderly long‐stay residents in nursing homes. Med Care. 2013;51(8):673–681.
- , . Reducing unnecessary hospitalizations of nursing home residents. N Engl J Med. 2011;365(13):1165–1167.
- , , . Advance directives and outcomes of surrogate decision making before death. N Engl J Med. 2010;362(13):1211–1218.
- , , , , , . The consistency between treatments provided to nursing facility residents and orders on the physician orders for life‐sustaining treatment form. J Am Geriatr Soc. 2011;59(11):2091–2099.
- , , . What should be the goal of advance care planning? JAMA Intern Med. 2014;174(7):1093–1094.
- , , , et al. Associations between end‐of‐life discussions, patient mental health, medical care near death, and caregiver bereavement adjustment. JAMA. 2008;300(14):1665–1673.
- , , , et al. Systematic implementation of an advance directive program in nursing homes: a randomized controlled trial. JAMA. 2000;283(11):1437–1444.
- , . Communication about serious illness care goals: a review and synthesis of best practices. JAMA Intern Med. 2014;174(12):1994–2003.
- , , . Predictors of nursing home residents' time to hospitalization. Health Serv Res. 2011;46(1 pt 1):82–104.
- , , , . Regional variation in the association between advance directives and end‐of‐life Medicare expenditures. JAMA. 2011;306(13):1447–1453.
- , , . Just ask: discussing goals of care with patients in hospital with serious illness. CMAJ. 2014;186(6):425–432.
- , , , et al. Failure to engage hospitalized elderly patients and their families in advance care planning. JAMA Intern Med. 2013;173(9):778–787.
- , , , . Hospitalisation of high‐care residents of aged care facilities: are goals of care discussed? Intern Med J. 2013;43(2):144–149.
- , , , et al. Barriers to goals of care discussions with seriously ill hospitalized patients and their families: a multicenter survey of clinicians. JAMA Intern Med. 2015;175(4):549–556.
- , , , , . Code status discussions between attending hospitalist physicians and medical patients at hospital admission. J Gen Intern Med. 2011;26(4):359–366.
- , , , . Predictors of nursing home hospitalization: a review of the literature. Med Care Res Rev. 2008;65(1):3–39.
- , , , , . Provider characteristics, clinical‐work processes and their relationship to discharge summary quality for sub‐acute care patients. J Gen Intern Med. 2012;27(1):78–84.
- , , , . Strategies for effective goals of care discussions and decision‐making: perspectives from a multi‐centre survey of Canadian hospital‐based healthcare providers. BMC Palliat Care. 2015;14:38.
The Relationship Between Sustained Gripping and the Development of Carpal Tunnel Syndrome
The dominant limb is the limb preferred for performing an activity that requires one hand or for performing the more demanding part of an activity that requires both hands. For example, most playing card dealers use their dominant limb to distribute cards (the more demanding part of the activity) and their nondominant limb to hold the rest of the pack (the less demanding activity). Although a relationship between nocturnal hand paresthesias and daily hand activities has been known for more than a century, it was not until more recently that it was recognized that unilateral carpal tunnel syndrome (CTS) more commonly involves the dominant limb.1,2
Among people with CTS, the dominant limb tends to be affected earlier and, in the setting of bilateral involvement, more severely.3,4 This relationship, however, is not absolute. In 1983, Falck and Aarnio reported that CTS could be more pronounced on the nondominant side whenever upper extremity usage requirements, especially occupational requirements, stressed that limb to a greater extent than they stressed the dominant limb.5
Regarding occupation, particular CTS risk factors and associations have been reported. One study found that the most common work-related risk factor was repetitive bending and twisting of the hands and wrists.6 In another study, the incidence of CTS was almost 10-fold higher among workers performing high force, high repetition jobs than among those performing low force, low repetition jobs.7-10 A meta-analysis identified a strong causal relationship between forceful, repetitive work and development of CTS.11 A more recent and controversial study found no association between heavy use of computers and CTS.12 In 1911, Hart reported an association between repetitive gripping and thenar atrophy.13 Although he misattributed the association to trauma of the recurrent thenar motor branch, 2 of the 3 described patients reported a period of episodic hand paresthesias preceding the development of thenar eminence atrophy and thus more likely had typical CTS.
Background
The present study was prompted by the clinical and electrodiagnostic (EDX) features of a 27-year-old right-hand–dominant man who presented to the EDX laboratory for assessment of bilateral hand paresthesias. The patient reported episodic bilateral hand tingling that was much more pronounced on the left (nondominant) side. Consistent with his report, EDX assessment revealed bilateral CTS that involved the nondominant limb to a much greater extent than that of the dominant limb. As a blackjack dealer, the patient was using his nondominant hand to “tightly grip 2 decks of cards” and the dominant hand to distribute those cards.
Similar history and EDX patterns (bilateral CTS more pronounced on nondominant side) were subsequently noted in 2 other patients, both of whom were using their nondominant limb to perform an activity that required sustained gripping. One of these patients was a minnow counter. He was using his nondominant hand to firmly grip the top of a bucket and the dominant hand to “deal” the fish into separate tanks. The other patient was a mason. He was using his nondominant hand to firmly hold a brick or stone in place and the dominant hand to apply cement. The clinical and EDX features of these 3 patients suggested that sustained gripping might be a significant risk factor for development of CTS. That all 3 of these patients were using their dominant hand for a repetitive activity (dealing) further suggested that, compared with repetitive activity, sustained gripping was more significant as a risk factor for development of CTS.
As unilateral CTS typically occurs on the dominant side, and bilateral CTS typically is more pronounced on the dominant side, the term backward CTS is applied to cases in which unilateral CTS occurs on the nondominant side or bilateral CTS involves the nondominant side to a greater extent than the dominant side.
Although many investigators have purported an association between CTS and a particular upper extremity activity, their conclusions are limited by use of poorly validated symptom surveys, use of faulty epidemiologic methods, selection of a specific basis for clinical diagnosis (eg, isolated hand pain), or lack of EDX confirmation. Associations between a particular activity and development of CTS are best addressed by studies that include both clinical and EDX assessments and that fully characterize the individual hand usage patterns.
Methods
This study identified the upper extremity usage patterns associated with development of CTS among patients found in the EDX laboratory to have backward CTS (unilateral CTS in nondominant limb or bilateral CTS involving nondominant limb more than dominant limb). Thus, whenever patients who were referred to the EDX laboratory for upper extremity studies were noted to have backward CTS, an extensive upper extremity usage assessment was immediately performed. Both the EDX studies and the upper extremity usage assessments were performed by the author during the same encounter.
All patients had initial screening sensory and motor nerve conduction studies performed: median sensory, recording the second digit; ulnar sensory, recording the fifth digit; superficial radial, recording the dorsum of hand; median motor, recording the thenar eminence; and ulnar motor, recording the hypothenar eminence. As CTS was suspected in all cases, median and ulnar palmar nerve conduction studies were performed as well. All these studies were performed using previously reported techniques, and all collected values were compared with EMG laboratory control values.14,15 In all patients, the median nerve conduction studies were performed bilaterally. Approval from an ethics board or an institutional review board was not needed because this study did not involve personal information or identifiable images.
To avoid identifying small, chance asymmetries related to hypothyroidism and other conditions that produce bilateral CTS, the author predefined the degree of asymmetry required for study inclusion to identify only large asymmetries. Because the EDX manifestations of CTS typically reflect features of demyelination before those of axon loss, the required asymmetries were predefined using peak sensory and distal motor latency values. For study inclusion, the median nerve latency value recorded from the nondominant limb needed to exceed the value recorded from the dominant limb by 0.6 msec for the median palmar responses, 1.0 msec for the median digital sensory responses, or 1.0 msec for the median motor responses.
Excluded from the study were patients who reported being ambidextrous, those who had changed hand dominance at any age and for any reason, those with a history of upper extremity trauma or surgery, and those with EDX findings indicating a concomitant neuromuscular disorder. In addition, patients with diabetes mellitus or any other condition associated with bilateral CTS were excluded.
Results
From the approximately 2,000 upper extremity EDX studies performed over a 30-month period, the author identified 21 patients who met the inclusion criteria (Table 1). Of these 21 patients, 15 (71%) had bilateral CTS and 6 (29%) had unilateral CTS. Sixteen of the 21 patients used their nondominant hand, through a significant portion of the day, to perform an activity that required sustained gripping (Table 2).


Of these 16 patients, 14 reported that the sustained gripping activity was related to their occupation: pipe fitter (4 patients), card dealer (4), professional driver (2), grocery store clerk (1), wire stripper (1), bakery worker (1), and motel room cleaner (1). In their jobs, the pipe fitters were continually cutting pipe during their entire 8-hour shift—using the nondominant hand to tightly grip a pipe while using the dominant hand to direct an electrically powered blade through it. Of the card dealers, 1 was a professional playing card dealer (not the dealer whose case prompted this study), 1 distributed store coupons into containers, and 2 distributed pieces of mail into bins (referred to as casing the mail). All the card dealers used their nondominant hand to tightly grip items that the dominant limb distributed. The professional drivers used their nondominant hand to grip the steering wheel. The grocery store clerk used her nondominant hand to grip shopping items while moving them across a barcode detector. The wire stripper used her nondominant hand to tightly grip bundles of wire while holding a tool in the dominant hand to snip or strip them. The bakery worker continually used her nondominant hand to squeeze off pieces of dough from a mound. And the motel room cleaner used her nondominant hand to grip the side of a bathtub while scrubbing the tub with her dominant hand (she estimated she cleaned bathtubs for about 25% of her 8-hour shift).
Of the 2 patients who reported sustained gripping unrelated to occupation, 1 was baby-sitting her grandson 5 days per week. She carried him, grasping his buttock with her nondominant hand, while performing her daily activities. She estimated she carried the child a minimum of 2 hours a day. After several weeks, she noted episodic tingling in the nondominant hand, yet she continued carrying him for another 7 months, at which point she sought medical care. The other patient, a student in a stress relief class, was instructed to repetitively open and tightly close her nondominant hand for 10 minutes 4 or more times per day. After several weeks, she noted episodic tingling in the exercised, nondominant hand.
Of the 5 patients who denied performing an activity that required sustained gripping, 2 used their nondominant limb to enter data into a computer while turning pages with the dominant limb. A piano teacher, used her nondominant limb to strike piano keys while sitting to the right of her pupils; and a typist, consistently slept with the dorsal aspect of the nondominant hand pressed into her cheek, resulting in sustained wrist flexion throughout the night. One patient could not identify an activity performed with her nondominant limb both frequently and for prolonged periods.
Discussion
As with other syndromic disorders, CTS is associated with several clinical features, the presence of which correlates with the severity of median nerve involvement. During the earliest stage of CTS, episodic hand tingling (a positive symptom) is commonly reported. This tingling typically is more pronounced at night and during relaxation. In addition, many patients come to recognize that their hand tingling is precipitated by activities that involve sustained upper extremity elevation (eg, driving with a limb resting on upper portion of steering wheel; reading with upper extremities maintained in forward abduction) and that lowering a symptomatic limb relieves its tingling.
With progression, negative symptoms appear (eg, numbness and then weakness and wasting). Unfortunately, as the negative symptoms replace the positive ones, affected individuals may become less symptomatic and mistakenly believe their condition is improving. Features of autonomic fiber involvement may also be present but are less reliably elicited. Isolated hand pain is an uncommon manifestation of CTS because pain more commonly occurs later in the course and for this reason tends to be accompanied by other features of CTS.
The clinical features of CTS correlate with its underlying pathology. As demyelination precedes axon disruption pathologically, the clinical features of demyelination (episodic paresthesias) precede those of axon loss (numbness, weakness, wasting). However, clinical features may go unrecognized or be dismissed by the patient. Moreover, there is substantial variation in type, intensity, and frequency of symptoms.16,17
The EDX features of CTS correlate with its underlying pathology and pathophysiology. As demyelination (loss of insulation) increases the capacitance of the membrane and increases internodal current leakage, conduction velocity is reduced. As severity worsens and pathology changes from predominantly demyelination to predominantly axon loss, the individual nerve fiber action potentials, which make up the compound responses being recorded, are lost. As a result the amplitude and negative area under the curve values decrease. Thus, the EDX features of demyelination (eg, prolonged latencies) precede those of axon loss (eg, amplitude, negative area under the curve reduction).
As with other focal mononeuropathies, the sensory responses tend to be affected earlier and to a greater degree than do the motor responses. Consequently, the EDX features of CTS typically follow a standard progression. The median palmar responses are involved sooner and to a greater degree than the median sensory responses recorded from the digits, which in turn tend to be involved earlier and to a greater degree than are the median motor responses.
Awareness of this relationship dictates the severity of the lesion and helps in the recognition of a cool limb and in the avoidance of a false-positive study interpretation. In a cool limb, the fingers are cooler than the wrists. Thus, the peak latency of the median digital sensory response is delayed to a greater extent than the ipsilateral median palmar response (the opposite of the CTS pattern). Accordingly, whenever this pattern is identified, the hand must be warmed or rewarmed and the studies repeated. The hand is also warmed or rewarmed whenever the median motor response is delayed out of proportion to that of the median palmar response.
Conclusion
Cases of CTS mainly in the nondominant limb provide an opportunity to identify particular limb usage patterns that might be associated with CTS. Of the present study’s 21 affected patients, 16 were using their nondominant limb to perform activities that required sustained gripping. Fourteen of the 16 activities were related to occupation. These findings strongly suggest an association between activities that require sustained gripping and development of CTS.
That the card dealers simultaneously used their nondominant hand for sustained gripping and the dominant hand for the repetitive activity of dealing suggests that sustained gripping is a stronger risk factor than repetitive activity for the development of CTS—an unanticipated finding. Interestingly, in a 2001 study that suggested repetitive activity might not be a CTS risk factor, there was a higher incidence of CTS among computer users working with a mouse—an activity that requires sustained gripping.12
Episodic hand tingling during mouse use likely reflects impaired blood flow to the median nerve, which occurs when carpal tunnel pressure approaches or exceeds 20 to 30 mm Hg.18 Placement of a hand on a mouse increases intracarpal pressure from 3 to 5 mm Hg (wrist in neutral position) to 16 to 21 mm Hg, whereas mouse use increases intracarpal pressure to 28 to 33 mm Hg.18-20
1. Ormerod JA. On a peculiar numbness and paresis of the hands. St Barts Hosp Rep. 1883;19:17-26.
2. Rosenbaum RB, Ochoa JL. Carpal Tunnel Syndrome and Other Disorders of the Median Nerve. 2nd ed. Boston, MA: Butterworth-Heineman; 2002.
3. Gainer JV Jr, Nugent GR. Carpal tunnel syndrome: report of 430 operations. South Med J. 1977;70(3):325-328.
4. Reinstein L. Hand dominance in carpal tunnel syndrome. Arch Phys Med Rehabil. 1981;62(5):202-203.
5. Falck B, Aarnio P. Left-sided carpal tunnel syndrome in butchers. Scand J Work Environ Health. 1983;9(3):291-297.
6. Tanaka S, Wild DK, Seligman PJ, Halperin WE, Behrens VJ, Putz-Anerson V. Prevalence and work-relatedness of self-reported carpal tunnel syndrome among U.S. workers: analysis of the Occupational Health Supplement data of 1988 National Health Interview Survey. Am J Ind Med. 1995;27(4):451-470.
7. Silverstein BA, Fine LJ, Armstrong TJ. Occupational factors and carpal tunnel syndrome. Am J Ind Med. 1987;11(3):343-358.
8. de Krom MC, Kester AD, Knipschild PG, Spaans F. Risk factors for carpal tunnel syndrome. Am J Epidemiol. 1990;132(6):1102-1110.
9. Hales TR, Bernard BP. Epidemiology of work-related musculoskeletal disorders. Orthop Clin North Am. 1996;27(4):679-709.
10. Roquelaure Y, Ha C, Pelier-Cady MC, et al. Work increases the incidence of carpal tunnel syndrome in the general population. Muscle Nerve. 2008;37(4):477-482.
11. Stock SR. Workplace ergonomic factors and the development of musculoskeletal disorders of the neck and upper limbs: a meta-analysis. Am J Ind Med. 1991;19(1):87-107.
12. Stevens JC, Witt JC, Smith BE, Weaver AL. The frequency of carpal tunnel syndrome in computer users at a medical facility. Neurology. 2001;56(11):1568-1570.
13. Hart JR. The thenar and hypothenar types of neural atrophy of the hand. Am J Med Sci. 1911;141:224-241.
14. Ferrante MA, Parry GJ, Wilbourn AJ. Sensory nerve conduction studies. Paper presented at: 51st Annual Meeting of the American Academy of Neurology; April 1999; Toronto, Canada.
15. Litchy WJ, Miller RG, Shields RW. Motor nerve conduction studies. Paper presented at: 51st Annual Meeting of the American Academy of Neurology; April 1999; Toronto, Canada.
16. Nunez F, Vranceanu AM, Ring D. Determinants of pain in patients with carpal tunnel syndrome. Clin Orthop Relat Res. 2010;468(12):3328-3332.
17. van Suchtelen M, Beck SJ, Gruber JS, Ring D. Progression of carpal tunnel syndrome according to electrodiagnostic testing in nonoperatively treated patients. Arch Bone Jt Surg. 2014;2(3):185-191.
18. Ghasemi-Rad M, Nosair E, Vegh A, et al. A handy review of carpal tunnel syndrome: from anatomy to diagnosis and treatment. World J Radiol. 2014;6(6):284-300.
19. Rydevik B, Lundborg G, Bagge U. Effects of graded compression on intraneural blood flow. An in vivo study on rabbit tibial nerve. J Hand Surg Am. 1981;6(1):3-12.
20. Keir PJ, Bach JM, Rempel D. Effects of computer mouse design and task on carpal tunnel pressure. Ergonomics. 1999;42(10):1350-1360.=
Dr. Ferrante is a professor in the department of neurology at the University of Tennessee Health Science Center in Memphis and chief of the neurophysiology section at the Memphis VAMC.
Author disclosure
The author reports no actual or potential conflicts of interest with regard to this article.

Disclaimer
The opinions expressed herein are those of the author and do not necessarily reflect those of Federal Practitioner, Frontline Medical Communications Inc., the U.S. Government, or any of its agencies. This article may discuss unlabeled or investigational use of certain drugs. Please review the complete prescribing information for specific drugs or drug combinations—including indications, contraindications, warnings, and adverse effects—before administering pharmacologic therapy to patients.
Dr. Ferrante is a professor in the department of neurology at the University of Tennessee Health Science Center in Memphis and chief of the neurophysiology section at the Memphis VAMC.
Author disclosure
The author reports no actual or potential conflicts of interest with regard to this article.
Disclaimer
The opinions expressed herein are those of the author and do not necessarily reflect those of Federal Practitioner, Frontline Medical Communications Inc., the U.S. Government, or any of its agencies. This article may discuss unlabeled or investigational use of certain drugs. Please review the complete prescribing information for specific drugs or drug combinations—including indications, contraindications, warnings, and adverse effects—before administering pharmacologic therapy to patients.
The dominant limb is the limb preferred for performing an activity that requires one hand or for performing the more demanding part of an activity that requires both hands. For example, most playing card dealers use their dominant limb to distribute cards (the more demanding part of the activity) and their nondominant limb to hold the rest of the pack (the less demanding activity). Although a relationship between nocturnal hand paresthesias and daily hand activities has been known for more than a century, it was not until more recently that it was recognized that unilateral carpal tunnel syndrome (CTS) more commonly involves the dominant limb.1,2
Among people with CTS, the dominant limb tends to be affected earlier and, in the setting of bilateral involvement, more severely.3,4 This relationship, however, is not absolute. In 1983, Falck and Aarnio reported that CTS could be more pronounced on the nondominant side whenever upper extremity usage requirements, especially occupational requirements, stressed that limb to a greater extent than they stressed the dominant limb.5
Regarding occupation, particular CTS risk factors and associations have been reported. One study found that the most common work-related risk factor was repetitive bending and twisting of the hands and wrists.6 In another study, the incidence of CTS was almost 10-fold higher among workers performing high force, high repetition jobs than among those performing low force, low repetition jobs.7-10 A meta-analysis identified a strong causal relationship between forceful, repetitive work and development of CTS.11 A more recent and controversial study found no association between heavy use of computers and CTS.12 In 1911, Hart reported an association between repetitive gripping and thenar atrophy.13 Although he misattributed the association to trauma of the recurrent thenar motor branch, 2 of the 3 described patients reported a period of episodic hand paresthesias preceding the development of thenar eminence atrophy and thus more likely had typical CTS.
Background
The present study was prompted by the clinical and electrodiagnostic (EDX) features of a 27-year-old right-hand–dominant man who presented to the EDX laboratory for assessment of bilateral hand paresthesias. The patient reported episodic bilateral hand tingling that was much more pronounced on the left (nondominant) side. Consistent with his report, EDX assessment revealed bilateral CTS that involved the nondominant limb to a much greater extent than that of the dominant limb. As a blackjack dealer, the patient was using his nondominant hand to “tightly grip 2 decks of cards” and the dominant hand to distribute those cards.
Similar history and EDX patterns (bilateral CTS more pronounced on nondominant side) were subsequently noted in 2 other patients, both of whom were using their nondominant limb to perform an activity that required sustained gripping. One of these patients was a minnow counter. He was using his nondominant hand to firmly grip the top of a bucket and the dominant hand to “deal” the fish into separate tanks. The other patient was a mason. He was using his nondominant hand to firmly hold a brick or stone in place and the dominant hand to apply cement. The clinical and EDX features of these 3 patients suggested that sustained gripping might be a significant risk factor for development of CTS. That all 3 of these patients were using their dominant hand for a repetitive activity (dealing) further suggested that, compared with repetitive activity, sustained gripping was more significant as a risk factor for development of CTS.
As unilateral CTS typically occurs on the dominant side, and bilateral CTS typically is more pronounced on the dominant side, the term backward CTS is applied to cases in which unilateral CTS occurs on the nondominant side or bilateral CTS involves the nondominant side to a greater extent than the dominant side.
Although many investigators have purported an association between CTS and a particular upper extremity activity, their conclusions are limited by use of poorly validated symptom surveys, use of faulty epidemiologic methods, selection of a specific basis for clinical diagnosis (eg, isolated hand pain), or lack of EDX confirmation. Associations between a particular activity and development of CTS are best addressed by studies that include both clinical and EDX assessments and that fully characterize the individual hand usage patterns.
Methods
This study identified the upper extremity usage patterns associated with development of CTS among patients found in the EDX laboratory to have backward CTS (unilateral CTS in nondominant limb or bilateral CTS involving nondominant limb more than dominant limb). Thus, whenever patients who were referred to the EDX laboratory for upper extremity studies were noted to have backward CTS, an extensive upper extremity usage assessment was immediately performed. Both the EDX studies and the upper extremity usage assessments were performed by the author during the same encounter.
All patients had initial screening sensory and motor nerve conduction studies performed: median sensory, recording the second digit; ulnar sensory, recording the fifth digit; superficial radial, recording the dorsum of hand; median motor, recording the thenar eminence; and ulnar motor, recording the hypothenar eminence. As CTS was suspected in all cases, median and ulnar palmar nerve conduction studies were performed as well. All these studies were performed using previously reported techniques, and all collected values were compared with EMG laboratory control values.14,15 In all patients, the median nerve conduction studies were performed bilaterally. Approval from an ethics board or an institutional review board was not needed because this study did not involve personal information or identifiable images.
To avoid identifying small, chance asymmetries related to hypothyroidism and other conditions that produce bilateral CTS, the author predefined the degree of asymmetry required for study inclusion to identify only large asymmetries. Because the EDX manifestations of CTS typically reflect features of demyelination before those of axon loss, the required asymmetries were predefined using peak sensory and distal motor latency values. For study inclusion, the median nerve latency value recorded from the nondominant limb needed to exceed the value recorded from the dominant limb by 0.6 msec for the median palmar responses, 1.0 msec for the median digital sensory responses, or 1.0 msec for the median motor responses.
Excluded from the study were patients who reported being ambidextrous, those who had changed hand dominance at any age and for any reason, those with a history of upper extremity trauma or surgery, and those with EDX findings indicating a concomitant neuromuscular disorder. In addition, patients with diabetes mellitus or any other condition associated with bilateral CTS were excluded.
Results
From the approximately 2,000 upper extremity EDX studies performed over a 30-month period, the author identified 21 patients who met the inclusion criteria (Table 1). Of these 21 patients, 15 (71%) had bilateral CTS and 6 (29%) had unilateral CTS. Sixteen of the 21 patients used their nondominant hand, through a significant portion of the day, to perform an activity that required sustained gripping (Table 2).
Of these 16 patients, 14 reported that the sustained gripping activity was related to their occupation: pipe fitter (4 patients), card dealer (4), professional driver (2), grocery store clerk (1), wire stripper (1), bakery worker (1), and motel room cleaner (1). In their jobs, the pipe fitters were continually cutting pipe during their entire 8-hour shift—using the nondominant hand to tightly grip a pipe while using the dominant hand to direct an electrically powered blade through it. Of the card dealers, 1 was a professional playing card dealer (not the dealer whose case prompted this study), 1 distributed store coupons into containers, and 2 distributed pieces of mail into bins (referred to as casing the mail). All the card dealers used their nondominant hand to tightly grip items that the dominant limb distributed. The professional drivers used their nondominant hand to grip the steering wheel. The grocery store clerk used her nondominant hand to grip shopping items while moving them across a barcode detector. The wire stripper used her nondominant hand to tightly grip bundles of wire while holding a tool in the dominant hand to snip or strip them. The bakery worker continually used her nondominant hand to squeeze off pieces of dough from a mound. And the motel room cleaner used her nondominant hand to grip the side of a bathtub while scrubbing the tub with her dominant hand (she estimated she cleaned bathtubs for about 25% of her 8-hour shift).
Of the 2 patients who reported sustained gripping unrelated to occupation, 1 was baby-sitting her grandson 5 days per week. She carried him, grasping his buttock with her nondominant hand, while performing her daily activities. She estimated she carried the child a minimum of 2 hours a day. After several weeks, she noted episodic tingling in the nondominant hand, yet she continued carrying him for another 7 months, at which point she sought medical care. The other patient, a student in a stress relief class, was instructed to repetitively open and tightly close her nondominant hand for 10 minutes 4 or more times per day. After several weeks, she noted episodic tingling in the exercised, nondominant hand.
Of the 5 patients who denied performing an activity that required sustained gripping, 2 used their nondominant limb to enter data into a computer while turning pages with the dominant limb. A piano teacher, used her nondominant limb to strike piano keys while sitting to the right of her pupils; and a typist, consistently slept with the dorsal aspect of the nondominant hand pressed into her cheek, resulting in sustained wrist flexion throughout the night. One patient could not identify an activity performed with her nondominant limb both frequently and for prolonged periods.
Discussion
As with other syndromic disorders, CTS is associated with several clinical features, the presence of which correlates with the severity of median nerve involvement. During the earliest stage of CTS, episodic hand tingling (a positive symptom) is commonly reported. This tingling typically is more pronounced at night and during relaxation. In addition, many patients come to recognize that their hand tingling is precipitated by activities that involve sustained upper extremity elevation (eg, driving with a limb resting on upper portion of steering wheel; reading with upper extremities maintained in forward abduction) and that lowering a symptomatic limb relieves its tingling.
With progression, negative symptoms appear (eg, numbness and then weakness and wasting). Unfortunately, as the negative symptoms replace the positive ones, affected individuals may become less symptomatic and mistakenly believe their condition is improving. Features of autonomic fiber involvement may also be present but are less reliably elicited. Isolated hand pain is an uncommon manifestation of CTS because pain more commonly occurs later in the course and for this reason tends to be accompanied by other features of CTS.
The clinical features of CTS correlate with its underlying pathology. As demyelination precedes axon disruption pathologically, the clinical features of demyelination (episodic paresthesias) precede those of axon loss (numbness, weakness, wasting). However, clinical features may go unrecognized or be dismissed by the patient. Moreover, there is substantial variation in type, intensity, and frequency of symptoms.16,17
The EDX features of CTS correlate with its underlying pathology and pathophysiology. As demyelination (loss of insulation) increases the capacitance of the membrane and increases internodal current leakage, conduction velocity is reduced. As severity worsens and pathology changes from predominantly demyelination to predominantly axon loss, the individual nerve fiber action potentials, which make up the compound responses being recorded, are lost. As a result the amplitude and negative area under the curve values decrease. Thus, the EDX features of demyelination (eg, prolonged latencies) precede those of axon loss (eg, amplitude, negative area under the curve reduction).
As with other focal mononeuropathies, the sensory responses tend to be affected earlier and to a greater degree than do the motor responses. Consequently, the EDX features of CTS typically follow a standard progression. The median palmar responses are involved sooner and to a greater degree than the median sensory responses recorded from the digits, which in turn tend to be involved earlier and to a greater degree than are the median motor responses.
Awareness of this relationship dictates the severity of the lesion and helps in the recognition of a cool limb and in the avoidance of a false-positive study interpretation. In a cool limb, the fingers are cooler than the wrists. Thus, the peak latency of the median digital sensory response is delayed to a greater extent than the ipsilateral median palmar response (the opposite of the CTS pattern). Accordingly, whenever this pattern is identified, the hand must be warmed or rewarmed and the studies repeated. The hand is also warmed or rewarmed whenever the median motor response is delayed out of proportion to that of the median palmar response.
Conclusion
Cases of CTS mainly in the nondominant limb provide an opportunity to identify particular limb usage patterns that might be associated with CTS. Of the present study’s 21 affected patients, 16 were using their nondominant limb to perform activities that required sustained gripping. Fourteen of the 16 activities were related to occupation. These findings strongly suggest an association between activities that require sustained gripping and development of CTS.
That the card dealers simultaneously used their nondominant hand for sustained gripping and the dominant hand for the repetitive activity of dealing suggests that sustained gripping is a stronger risk factor than repetitive activity for the development of CTS—an unanticipated finding. Interestingly, in a 2001 study that suggested repetitive activity might not be a CTS risk factor, there was a higher incidence of CTS among computer users working with a mouse—an activity that requires sustained gripping.12
Episodic hand tingling during mouse use likely reflects impaired blood flow to the median nerve, which occurs when carpal tunnel pressure approaches or exceeds 20 to 30 mm Hg.18 Placement of a hand on a mouse increases intracarpal pressure from 3 to 5 mm Hg (wrist in neutral position) to 16 to 21 mm Hg, whereas mouse use increases intracarpal pressure to 28 to 33 mm Hg.18-20
1. Ormerod JA. On a peculiar numbness and paresis of the hands. St Barts Hosp Rep. 1883;19:17-26.
2. Rosenbaum RB, Ochoa JL. Carpal Tunnel Syndrome and Other Disorders of the Median Nerve. 2nd ed. Boston, MA: Butterworth-Heineman; 2002.
3. Gainer JV Jr, Nugent GR. Carpal tunnel syndrome: report of 430 operations. South Med J. 1977;70(3):325-328.
4. Reinstein L. Hand dominance in carpal tunnel syndrome. Arch Phys Med Rehabil. 1981;62(5):202-203.
5. Falck B, Aarnio P. Left-sided carpal tunnel syndrome in butchers. Scand J Work Environ Health. 1983;9(3):291-297.
6. Tanaka S, Wild DK, Seligman PJ, Halperin WE, Behrens VJ, Putz-Anerson V. Prevalence and work-relatedness of self-reported carpal tunnel syndrome among U.S. workers: analysis of the Occupational Health Supplement data of 1988 National Health Interview Survey. Am J Ind Med. 1995;27(4):451-470.
7. Silverstein BA, Fine LJ, Armstrong TJ. Occupational factors and carpal tunnel syndrome. Am J Ind Med. 1987;11(3):343-358.
8. de Krom MC, Kester AD, Knipschild PG, Spaans F. Risk factors for carpal tunnel syndrome. Am J Epidemiol. 1990;132(6):1102-1110.
9. Hales TR, Bernard BP. Epidemiology of work-related musculoskeletal disorders. Orthop Clin North Am. 1996;27(4):679-709.
10. Roquelaure Y, Ha C, Pelier-Cady MC, et al. Work increases the incidence of carpal tunnel syndrome in the general population. Muscle Nerve. 2008;37(4):477-482.
11. Stock SR. Workplace ergonomic factors and the development of musculoskeletal disorders of the neck and upper limbs: a meta-analysis. Am J Ind Med. 1991;19(1):87-107.
12. Stevens JC, Witt JC, Smith BE, Weaver AL. The frequency of carpal tunnel syndrome in computer users at a medical facility. Neurology. 2001;56(11):1568-1570.
13. Hart JR. The thenar and hypothenar types of neural atrophy of the hand. Am J Med Sci. 1911;141:224-241.
14. Ferrante MA, Parry GJ, Wilbourn AJ. Sensory nerve conduction studies. Paper presented at: 51st Annual Meeting of the American Academy of Neurology; April 1999; Toronto, Canada.
15. Litchy WJ, Miller RG, Shields RW. Motor nerve conduction studies. Paper presented at: 51st Annual Meeting of the American Academy of Neurology; April 1999; Toronto, Canada.
16. Nunez F, Vranceanu AM, Ring D. Determinants of pain in patients with carpal tunnel syndrome. Clin Orthop Relat Res. 2010;468(12):3328-3332.
17. van Suchtelen M, Beck SJ, Gruber JS, Ring D. Progression of carpal tunnel syndrome according to electrodiagnostic testing in nonoperatively treated patients. Arch Bone Jt Surg. 2014;2(3):185-191.
18. Ghasemi-Rad M, Nosair E, Vegh A, et al. A handy review of carpal tunnel syndrome: from anatomy to diagnosis and treatment. World J Radiol. 2014;6(6):284-300.
19. Rydevik B, Lundborg G, Bagge U. Effects of graded compression on intraneural blood flow. An in vivo study on rabbit tibial nerve. J Hand Surg Am. 1981;6(1):3-12.
20. Keir PJ, Bach JM, Rempel D. Effects of computer mouse design and task on carpal tunnel pressure. Ergonomics. 1999;42(10):1350-1360.=
The Cost of Oncology Drugs: A Pharmacy Perspective, Part 2
The Cost of Oncology Drugs: A Pharmacy Perspective, Part 1, appeared in the Federal Practitioner February 2016 special issue “Best Practices in Hematology and Oncology” and can be accessed here.
Health care costs are the fastest growing financial segment of the U.S. economy. The cost of medications, especially those for treating cancer, is the leading cause of increased health care spending.1 Until recently, the discussion of the high costs of cancer treatment was rarely made public.
Part 1 of this article focused on the emerging discussion of the financial impact of high-cost drugs in the U.S. Part 2 will focus on the drivers of increasing oncology drug costs and the challenges high-cost medications pose for the VA. The article also will review the role of the VA Pharmacy Benefits Management Service (PBM) in evaluating new oncology agents. Also presented are the clinical guidance tools designed to aid the clinician in the cost-effective use of these agents and results of a nationwide survey of VA oncology pharmacists regarding the use of cost-containment strategies.
Cost Drivers
Many factors are driving increased oncology drug costs within the VA. Although the cost of individual drugs has the largest impact on the accelerating cost of treating each patient, other clinical and social factors may play a role.
Increasing Cost of Individual Drugs
Drug pricing is not announced until after FDA approval. Oncology drugs at the high end of the cost spectrum are rarely curative and often add only weeks or months to overall survival (OS), the gold standard. Current clinical trial design often uses progression free survival (PFS) as the primary endpoint, which makes the use of traditional pharmacoeconomic determinations of value difficult. In addition, many new drugs are first in class and/or have narrow indications that preclude competition from other drugs. Although addressing the issue of the market price for drugs seems to be one that is not controllable, there is increasing demand for drug pricing reform.2
Many believe drug prices should be linked directly to clinical benefit. In a recent article, Goldstein and colleagues proposed establishing a value-based price for necitumumab based on clinical benefit, prior to FDA approval.3 When this analysis was done, necitumumab was pending FDA approval in combination with cisplatin and gemcitabine for the treatment of squamous carcinoma of the lung. Using clinical data from the SQUIRE trial on which FDA approval was based, the addition of necitumumab to the chemotherapy regimen led to an incremental survival benefit of 0.15 life-years and 0.11 quality-adjusted life-years (QALY).4 Using a Markov model to evaluate cost-effectiveness, these authors established that the price of necitumumab should be from $563 to $1,309 per cycle. Necitumumab was approved by the FDA on November 24, 2015, with the VA acquisition cost, as of May 2016, at $6,100 per cycle.
Lack of Generic Products
The approval of generic alternatives for targeted oncology agents should reduce the cost of treating oncology patients. However, since imatinib was approved in May 2001, no single targeted agent had become available as a generic until February 1, 2016, when generic imatinib was made available in the U.S. following approval by the FDA. Currently, generic imatinib is not used in the VA due to lack of Federal Supply Schedule (FSS) contract pricing, which leads to a generic cost that is much higher than the brand-name drug, Gleevec ($6,127 per month vs $9,472 per month for the generic). The reality is that many older agents have steadily increased in price, outpacing inflation (Table 1).5
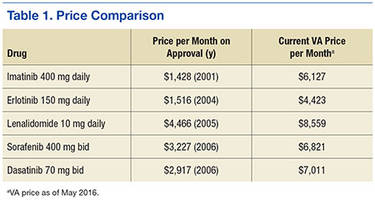
Aging U.S. Population
Advancing age is the most common risk factor for cancer, leading to an increase in the incidence and treatment of cancer. Because many newer agents are considered easier to tolerate than are traditional cytotoxic chemotherapy, clinicians have become more comfortable treating elderly patients, and geriatric oncology has become an established subspecialty within oncology.
Changing Treatment Paradigms
The use of targeted therapies is changing the paradigm from the acute treatment of cancer to chronic cancer management. Most targeted therapies are continued until disease progression or toxicity, leading to chronic, open-ended treatment. This approach is in contrast to older treatment approaches such as chemotherapy, which is often given for a limited duration followed by observation. When successful, chronic treatment with targeted agents can lead to unanticipated high costs. The following current cases at the VA San Diego Healthcare System illustrate this point:
- Renal cell carcinoma: 68-year-old man diagnosed in 2005 with a recurrence in 2012
- High-dose interleukin-2 (2 cycles); sunitinib (3.3 years); pazopanib (2 months); everolimus (2 months); sorafenib (3 months); axitinib (7 months)
- Cutaneous T-cell lymphoma: 68-year-old man started romidepsin September 22, 2010
The rate of FDA approval for oncology drugs has been accelerating rapidly in the past 15 years. Sequential therapies beyond second-line therapy are common as more agents become available. Table 2 shows FDA approval for all cancer drugs by decade.
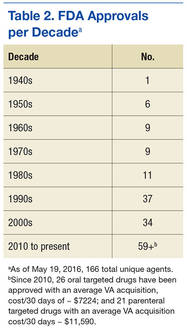
As researchers continue to better understand the many pathways involved with the development and progression of cancer, they are beginning to combine multiple targeted agents to augment response rates, prolong survival, and reduce the potential for resistance. Recent combination regimens approved by the FDA include dabrafenib plus trametinib (January 2014), and ipilimumab plus nivolumab (October 2015), both for the treatment of melanoma. In November 2015, ixazomib was FDA approved to be used in combination with lenalidomide for multiple myeloma. Many more combination regimens are currently in clinical trials, and more combinations are expected to receive FDA approval. It is easy to see how the combination of multiple expensive agents with the prospect of prolonged therapy has the potential to increase the cost of many regimens to well over $100,000 per year.
Maintenance therapy is used to prolong PFS for patients receiving an excellent response to primary therapy. For example, VA costs for maintenance regimens include lenalidomide 10 mg daily: $8,314 for 28 days equals $216,177 for 2 years; bortezomib 1.3 mg/m2 (2.6 mg) q: 2 weeks equals $60,730 for 2 years (includes waste as bortezomib 3.5-mg vials do not a contain preservative and must be discarded within 8 hours of preparation); and rituximab 800 mg q: 2 months equals $47,635 for 2 years.
Until recently, immunotherapy for cancer was limited to melanoma and renal cell carcinoma using interleukin-2 (aldesleukin) and interferon alfa. However, the immergence of new immunotherapies, such as anti-PD-1 and anti-CTLA-4 monoclonal antibodies, have expanded the role of immunotherapy to many other, more common, malignancies, such as lung cancer, breast cancer, prostate cancer, head and neck cancer, and many more.
Most randomized clinical trials study drugs as second- or occasionally third-line therapy. However, many patients continue to be treated beyond the third-line setting, often without evidence-based data to support potential benefit. Patients often place value on treatments unlikely to work so as not to give up hope. These “hopeful gambles,” even with the potential of significant toxicity and decreased quality of life (QOL), are common in cancer treatment.6 In addition, oncologists often overestimate the clinical benefit when considering additional therapy in this setting.7
Influx of New Patients
Outside the VHA setting, the financial burden of cancer treatment has led to an influx of new patients transferring care to the VHA to reduce out-of-pocket expenses. Because private insurance copays for oral agents are increasing, many reaching 20% to 30%, out-of-pocket expenses for medications can reach several thousand dollars per month. Patients often change insurance plans due to changing jobs or to decrease cost, or employers may change plans to save money, which may significantly alter or discontinue coverage. Patients often request that the VA provide medication while continuing to see only their private oncologist. This practice should be discouraged because the VA, without clinical involvement, may supply drugs for inappropriate indications. In addition, VA providers writing prescriptions for medications without personally following patients may be liable for poor outcomes.
VA PBM Services
Prior to 1995, the VA was a much criticized and poorly performing health care system that had experienced significant budget cuts, forcing many veterans to seek care outside the VA. Then beginning in 1995, a remarkable transformation occurred, which modernized and improved the VA into a system that consistently outperforms the private sector in quality of care, patient safety, patient satisfaction, all at a lower cost.8 The story of the VA’s transformation has been well chronicled by Phillip Longman.9
Under the direction of VA Under Secretary for Health Kenneth Kizer, MD, MPH, VA established PBM Clinical Services to develop and maintain the National Drug Formulary, create clinical guidance documents, and manage drug costs and utilization. A recent article by Heron and Geraci examined the functions and role of the VA PBM in controlling oncology drug costs.10 The following is a brief review of several documents and VA PBM responsibilities as reviewed by Heron and Geraci.
VA National Formulary
Prior to the establishment of the VA National Formulary in 1995, each VA maintained its own formulary, which led to extreme variability in drug access across the country. When a patient accessed care at different VAMCs, it was common for the patient’s medications to be changed based on the specific facility formulary. This practice led to many potential problems, such as lack of clinical benefit and potentially increased or new toxicities, and led to extra hospital visits for monitoring and adjustment of medications.
In contrast, the VA National Formulary now offers a uniform pharmacy benefit to all veterans by reducing variation in access to drugs. In addition, using preferred agents in each drug class provides VA with additional leverage when contracting with drug suppliers to reduce prices across the entire VA system.
Many oncology agents are not included on the VA National Formulary due to cost and the potential for off-label use. However, the formulary status of oncology agents in no way limits access or the availability of any oncology drug for appropriate patients. In fact, nonformulary approval requests work as a mechanism for review to ensure that these agents are used properly in the subset of patients who are most likely to benefit.
The PBM assesses all new oncology drugs for value and potential use within the VA, as well as cost impact. Following this assessment, various clinical guidance documents may be developed that are intended to guide clinicians in the proper use of medications for veterans. All documents prepared by the PBM undergo an extensive peer review by the Medical Advisory Panel and other experts in the field.
Drug Monographs
A drug monograph is a comprehensive, evidence-based drug review that summarizes efficacy and safety based on clinical trial data published in peer-reviewed journals, abstracts, and/or FDA Medical Review transcripts. Cost-effectiveness analysis is included if available.
Criteria for Use
Criteria for Use (CFU) are developed for drugs considered to be at high risk for inappropriate use or with safety concerns. The purpose of the CFU is to select patients most likely to benefit from these agents by using clinical criteria, which may qualify or eliminate a patient for treatment. National CFUs are available on the national PBM website. Local CFUs are often written and shared among oncology pharmacists via the VA oncology pharmacist listserv.
Abbreviated Reviews
Similar to drug monographs, abbreviated reviews are much shorter and focus on the relevant clinical sections of the drug monograph necessary for clinical or formulary decision making.
National Acquisition Center
The National Acquisition Center (NAC) is the pharmaceutical contracting mechanism for the VA and works closely with the PBM.5 The NAC pursues significant drug price reductions for the VA based on many strategies. Public Law 102-585 ensures that certain government agencies, including the VA, receive special discounts on pharmaceuticals, which is at least a 24% discount from the nonfederal Average Manufacturer Price. This is known as the Federal Supply Schedule (FSS) and/or Big 4 pricing. In addition, bulk purchases and performance-based incentive agreements can lead to substantial local discounts. By working with specific drug distribution and warehouse contractors, the NAC assures ready access to drugs for VA patients. The NAC also allows for an efficient drug inventory process, thus reducing inventory management costs.
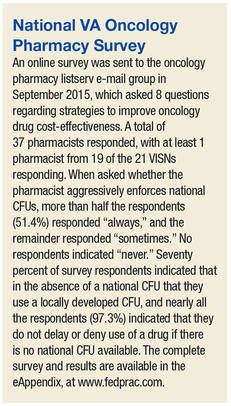
Guidance Documents
In 2012, the VA Oncology Field Advisory Committee (FAC) created the High Cost Oncology Drug Work Group to address the impact of high-cost oncology drugs within the VA.11 This work group was composed of VA oncologists and pharmacists whose efforts resulted in 5 guidance documents designed to reduce drug costs by optimizing therapy and reducing waste: (1) Dose Rounding in Oncology; (2) Oral Anticancer Drugs Dispensing and Monitoring; (3) Oncology Drug Table: Recommended Dispensing and Monitoring; (4) Chemotherapy Review Committee Process; and (5) Determining Clinical Benefit of High Cost Oncology Drugs. Reviews of 2 of these documents follows.
Determining Clinical Benefit of High Cost Oncology Drugs provides a decision tool to aid members of the oncology health care team in optimizing patient outcomes while attempting to obtain the greatest value from innovative therapies. When a high-cost or off-label request is made for a particular patient, using this process encourages thoughtful and evidence-based use of the drug by considering all clinical evidence in addition to the FDA-approved indication. Finally, a drug’s safety profile in relation to the indication, therapeutic goal, and specific patient characteristics and desires are integrated into a final decision to determine the appropriateness of the therapeutic intervention for the patient.
Oncology Drug Table: Recommended Dispensing and Monitoring contains a list of oral oncology drugs and includes recommendations for dispensing amount, adverse effects, laboratory monitoring, formulary status, approval requirements, and monthly cost of each agent based on the current NAC pricing.5 Cost awareness is critical when comparing alternative treatment options to minimize cost when treatments with similar benefits are considered. Most VA oncologists do not have easy access to the cost of various treatments and can be surprised about how expensive many common regimens cost. The costs listed in this document are updated about every 3 months.
Conclusion
Using newer, expensive targeted oncology agents in a cost-effective manner must be a proactive, collaborative, and multidisciplinary process. Pharmacists should not be solely responsible for monitoring and controlling high-cost treatments. Well-informed, evidence-based decisions are needed to ensure expensive agents are used in the subset of patients who are most likely to benefit. Clinical tools addressing value should be used to aid in appropriate and cost-effective treatment plans using drug monographs and CFUs, VHA Guidance on Determining Clinical Benefit of High Cost Oncology Drugs, and the Oral Chemotherapy Dispensing and Monitoring Reference, among other resources. Due to the subjective nature of value in medicine, agreeing on policy will have many challenges, such as how to place a value on various gains in overall survival, progression free survival, response rates, and QOL.
eAppendix
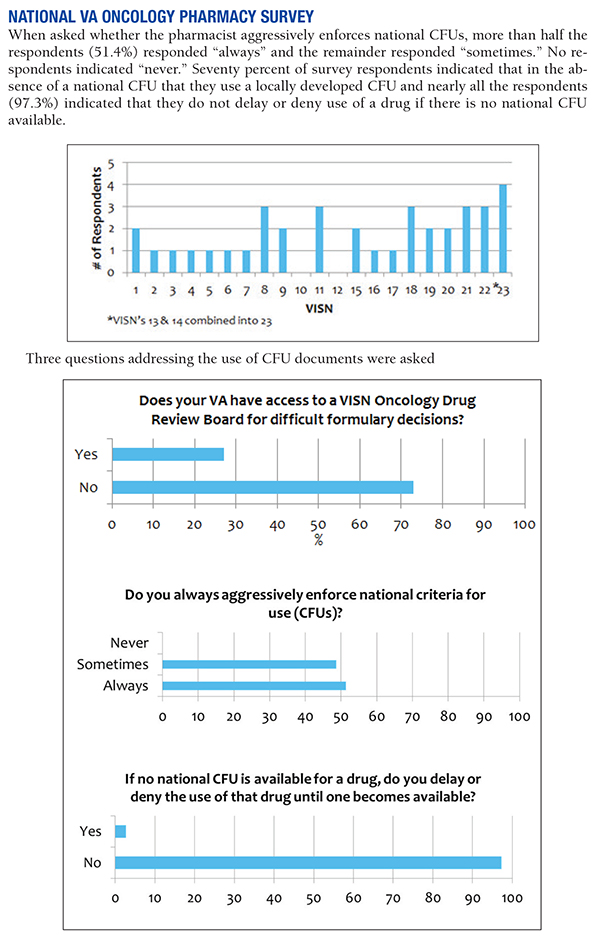
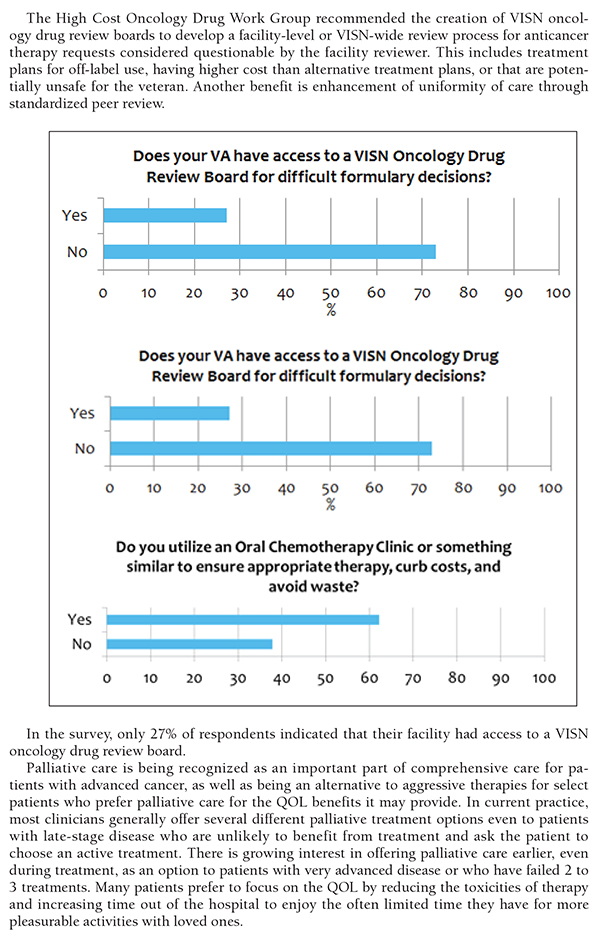
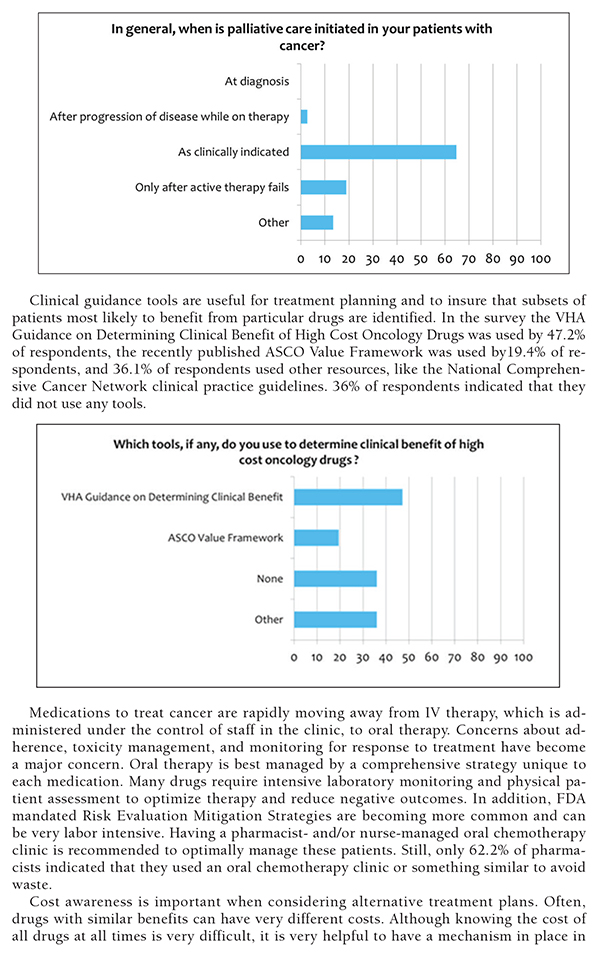
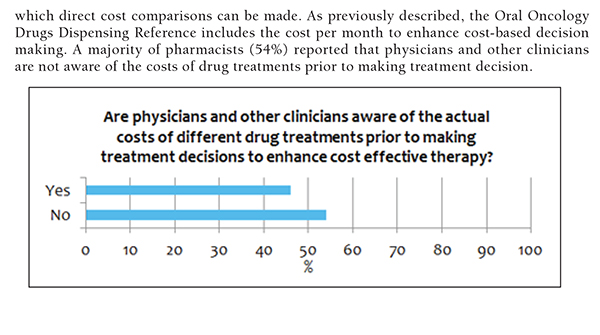
1. Bach PB. Limits on Medicare's ability to control rising spending on cancer drugs. N Engl J Med. 2009;360(6):626-633.
2. Kantarjian H, Steensma D, Rius Sanjuan J, Eishaug A, Light D. High cancer drug prices in the United States: reasons and proposed solutions. J Oncol Pract. 2014;10(4):e208-e211.
3. Goldstein DA, Chen Q, Ayer T, et al. Necitumumab in metastatic squamous cell lung cancer: establishing a value-based cost. JAMA Oncol. 2015;1(9):1293-1300.
4. Thatcher N, Hirsch FR, Luft AV, et al; SQUIRE Investigators. Necitumumab plus gemcitabine and cisplatin versus gemcitabine and cisplatin alone as first-line therapy in patients with stage IV squamous non-small-cell lung cancer (SQUIRE): an open-label, randomised, controlled phase 3 trial. Lancet Oncol. 2015;16(7):763-774.
5. U.S. Department of Veterans Affairs, National Acquisition Center, Pharmaceutical Catalog Search. U.S. Department of Veterans Affairs, National Acquisition Center website. http://www1.va.gov/nac/index.cfm?template=Search_Pharmaceutical_Catalog. Updated June 13, 2016. Accessed June 13, 2016.
6. Lakdawalla DN, Romley JA, Sanchez Y, Maclean JR, Penrod JR, Philipson T. How cancer patients value hope and the implications for cost-effectiveness assessments of high-cost cancer therapies. Health Aff (Millwood). 2012;31(4):676-682.
7. Ubel PA, Berry SR, Nadler E, et al. In a survey, marked inconsistency in how oncologists judged value of high-cost cancer drugs in relation to gains in survival. Health Aff (Millwood). 2012;31(4):709-717.
8. Asch SM, McGlynn EA, Hogan MM, et al. Comparison of quality of care for patients in the Veterans Health Administration and patients in a national sample. Ann Intern Med. 2004;141(12):938-945. 9. Longman P. Best Care Anywhere: Why VA Health Care Would Work for Everyone. 3rd ed. San Francisco, CA: Berrett-Koehler Publishers; 2012. 10. Heron BB, Geraci MC. Controlling the cost of oncology drugs within the VA: a national perspective. Fed Pract. 2015;32(suppl 1):18S-22S.
11. U.S. Department of Veterans Affairs. Pharmacy Benefits Management Services Intranet, Documents and Lists. https://vaww.cmopnational.va.gov/cmop/PBM/Clinical%20Guidance/Forms/AllItems.aspx. Accessed May 19, 2016.
The Cost of Oncology Drugs: A Pharmacy Perspective, Part 1, appeared in the Federal Practitioner February 2016 special issue “Best Practices in Hematology and Oncology” and can be accessed here.
Health care costs are the fastest growing financial segment of the U.S. economy. The cost of medications, especially those for treating cancer, is the leading cause of increased health care spending.1 Until recently, the discussion of the high costs of cancer treatment was rarely made public.
Part 1 of this article focused on the emerging discussion of the financial impact of high-cost drugs in the U.S. Part 2 will focus on the drivers of increasing oncology drug costs and the challenges high-cost medications pose for the VA. The article also will review the role of the VA Pharmacy Benefits Management Service (PBM) in evaluating new oncology agents. Also presented are the clinical guidance tools designed to aid the clinician in the cost-effective use of these agents and results of a nationwide survey of VA oncology pharmacists regarding the use of cost-containment strategies.
Cost Drivers
Many factors are driving increased oncology drug costs within the VA. Although the cost of individual drugs has the largest impact on the accelerating cost of treating each patient, other clinical and social factors may play a role.
Increasing Cost of Individual Drugs
Drug pricing is not announced until after FDA approval. Oncology drugs at the high end of the cost spectrum are rarely curative and often add only weeks or months to overall survival (OS), the gold standard. Current clinical trial design often uses progression free survival (PFS) as the primary endpoint, which makes the use of traditional pharmacoeconomic determinations of value difficult. In addition, many new drugs are first in class and/or have narrow indications that preclude competition from other drugs. Although addressing the issue of the market price for drugs seems to be one that is not controllable, there is increasing demand for drug pricing reform.2
Many believe drug prices should be linked directly to clinical benefit. In a recent article, Goldstein and colleagues proposed establishing a value-based price for necitumumab based on clinical benefit, prior to FDA approval.3 When this analysis was done, necitumumab was pending FDA approval in combination with cisplatin and gemcitabine for the treatment of squamous carcinoma of the lung. Using clinical data from the SQUIRE trial on which FDA approval was based, the addition of necitumumab to the chemotherapy regimen led to an incremental survival benefit of 0.15 life-years and 0.11 quality-adjusted life-years (QALY).4 Using a Markov model to evaluate cost-effectiveness, these authors established that the price of necitumumab should be from $563 to $1,309 per cycle. Necitumumab was approved by the FDA on November 24, 2015, with the VA acquisition cost, as of May 2016, at $6,100 per cycle.
Lack of Generic Products
The approval of generic alternatives for targeted oncology agents should reduce the cost of treating oncology patients. However, since imatinib was approved in May 2001, no single targeted agent had become available as a generic until February 1, 2016, when generic imatinib was made available in the U.S. following approval by the FDA. Currently, generic imatinib is not used in the VA due to lack of Federal Supply Schedule (FSS) contract pricing, which leads to a generic cost that is much higher than the brand-name drug, Gleevec ($6,127 per month vs $9,472 per month for the generic). The reality is that many older agents have steadily increased in price, outpacing inflation (Table 1).5
Aging U.S. Population
Advancing age is the most common risk factor for cancer, leading to an increase in the incidence and treatment of cancer. Because many newer agents are considered easier to tolerate than are traditional cytotoxic chemotherapy, clinicians have become more comfortable treating elderly patients, and geriatric oncology has become an established subspecialty within oncology.
Changing Treatment Paradigms
The use of targeted therapies is changing the paradigm from the acute treatment of cancer to chronic cancer management. Most targeted therapies are continued until disease progression or toxicity, leading to chronic, open-ended treatment. This approach is in contrast to older treatment approaches such as chemotherapy, which is often given for a limited duration followed by observation. When successful, chronic treatment with targeted agents can lead to unanticipated high costs. The following current cases at the VA San Diego Healthcare System illustrate this point:
- Renal cell carcinoma: 68-year-old man diagnosed in 2005 with a recurrence in 2012
- High-dose interleukin-2 (2 cycles); sunitinib (3.3 years); pazopanib (2 months); everolimus (2 months); sorafenib (3 months); axitinib (7 months)
- Cutaneous T-cell lymphoma: 68-year-old man started romidepsin September 22, 2010
The rate of FDA approval for oncology drugs has been accelerating rapidly in the past 15 years. Sequential therapies beyond second-line therapy are common as more agents become available. Table 2 shows FDA approval for all cancer drugs by decade.
As researchers continue to better understand the many pathways involved with the development and progression of cancer, they are beginning to combine multiple targeted agents to augment response rates, prolong survival, and reduce the potential for resistance. Recent combination regimens approved by the FDA include dabrafenib plus trametinib (January 2014), and ipilimumab plus nivolumab (October 2015), both for the treatment of melanoma. In November 2015, ixazomib was FDA approved to be used in combination with lenalidomide for multiple myeloma. Many more combination regimens are currently in clinical trials, and more combinations are expected to receive FDA approval. It is easy to see how the combination of multiple expensive agents with the prospect of prolonged therapy has the potential to increase the cost of many regimens to well over $100,000 per year.
Maintenance therapy is used to prolong PFS for patients receiving an excellent response to primary therapy. For example, VA costs for maintenance regimens include lenalidomide 10 mg daily: $8,314 for 28 days equals $216,177 for 2 years; bortezomib 1.3 mg/m2 (2.6 mg) q: 2 weeks equals $60,730 for 2 years (includes waste as bortezomib 3.5-mg vials do not a contain preservative and must be discarded within 8 hours of preparation); and rituximab 800 mg q: 2 months equals $47,635 for 2 years.
Until recently, immunotherapy for cancer was limited to melanoma and renal cell carcinoma using interleukin-2 (aldesleukin) and interferon alfa. However, the immergence of new immunotherapies, such as anti-PD-1 and anti-CTLA-4 monoclonal antibodies, have expanded the role of immunotherapy to many other, more common, malignancies, such as lung cancer, breast cancer, prostate cancer, head and neck cancer, and many more.
Most randomized clinical trials study drugs as second- or occasionally third-line therapy. However, many patients continue to be treated beyond the third-line setting, often without evidence-based data to support potential benefit. Patients often place value on treatments unlikely to work so as not to give up hope. These “hopeful gambles,” even with the potential of significant toxicity and decreased quality of life (QOL), are common in cancer treatment.6 In addition, oncologists often overestimate the clinical benefit when considering additional therapy in this setting.7
Influx of New Patients
Outside the VHA setting, the financial burden of cancer treatment has led to an influx of new patients transferring care to the VHA to reduce out-of-pocket expenses. Because private insurance copays for oral agents are increasing, many reaching 20% to 30%, out-of-pocket expenses for medications can reach several thousand dollars per month. Patients often change insurance plans due to changing jobs or to decrease cost, or employers may change plans to save money, which may significantly alter or discontinue coverage. Patients often request that the VA provide medication while continuing to see only their private oncologist. This practice should be discouraged because the VA, without clinical involvement, may supply drugs for inappropriate indications. In addition, VA providers writing prescriptions for medications without personally following patients may be liable for poor outcomes.
VA PBM Services
Prior to 1995, the VA was a much criticized and poorly performing health care system that had experienced significant budget cuts, forcing many veterans to seek care outside the VA. Then beginning in 1995, a remarkable transformation occurred, which modernized and improved the VA into a system that consistently outperforms the private sector in quality of care, patient safety, patient satisfaction, all at a lower cost.8 The story of the VA’s transformation has been well chronicled by Phillip Longman.9
Under the direction of VA Under Secretary for Health Kenneth Kizer, MD, MPH, VA established PBM Clinical Services to develop and maintain the National Drug Formulary, create clinical guidance documents, and manage drug costs and utilization. A recent article by Heron and Geraci examined the functions and role of the VA PBM in controlling oncology drug costs.10 The following is a brief review of several documents and VA PBM responsibilities as reviewed by Heron and Geraci.
VA National Formulary
Prior to the establishment of the VA National Formulary in 1995, each VA maintained its own formulary, which led to extreme variability in drug access across the country. When a patient accessed care at different VAMCs, it was common for the patient’s medications to be changed based on the specific facility formulary. This practice led to many potential problems, such as lack of clinical benefit and potentially increased or new toxicities, and led to extra hospital visits for monitoring and adjustment of medications.
In contrast, the VA National Formulary now offers a uniform pharmacy benefit to all veterans by reducing variation in access to drugs. In addition, using preferred agents in each drug class provides VA with additional leverage when contracting with drug suppliers to reduce prices across the entire VA system.
Many oncology agents are not included on the VA National Formulary due to cost and the potential for off-label use. However, the formulary status of oncology agents in no way limits access or the availability of any oncology drug for appropriate patients. In fact, nonformulary approval requests work as a mechanism for review to ensure that these agents are used properly in the subset of patients who are most likely to benefit.
The PBM assesses all new oncology drugs for value and potential use within the VA, as well as cost impact. Following this assessment, various clinical guidance documents may be developed that are intended to guide clinicians in the proper use of medications for veterans. All documents prepared by the PBM undergo an extensive peer review by the Medical Advisory Panel and other experts in the field.
Drug Monographs
A drug monograph is a comprehensive, evidence-based drug review that summarizes efficacy and safety based on clinical trial data published in peer-reviewed journals, abstracts, and/or FDA Medical Review transcripts. Cost-effectiveness analysis is included if available.
Criteria for Use
Criteria for Use (CFU) are developed for drugs considered to be at high risk for inappropriate use or with safety concerns. The purpose of the CFU is to select patients most likely to benefit from these agents by using clinical criteria, which may qualify or eliminate a patient for treatment. National CFUs are available on the national PBM website. Local CFUs are often written and shared among oncology pharmacists via the VA oncology pharmacist listserv.
Abbreviated Reviews
Similar to drug monographs, abbreviated reviews are much shorter and focus on the relevant clinical sections of the drug monograph necessary for clinical or formulary decision making.
National Acquisition Center
The National Acquisition Center (NAC) is the pharmaceutical contracting mechanism for the VA and works closely with the PBM.5 The NAC pursues significant drug price reductions for the VA based on many strategies. Public Law 102-585 ensures that certain government agencies, including the VA, receive special discounts on pharmaceuticals, which is at least a 24% discount from the nonfederal Average Manufacturer Price. This is known as the Federal Supply Schedule (FSS) and/or Big 4 pricing. In addition, bulk purchases and performance-based incentive agreements can lead to substantial local discounts. By working with specific drug distribution and warehouse contractors, the NAC assures ready access to drugs for VA patients. The NAC also allows for an efficient drug inventory process, thus reducing inventory management costs.
Guidance Documents
In 2012, the VA Oncology Field Advisory Committee (FAC) created the High Cost Oncology Drug Work Group to address the impact of high-cost oncology drugs within the VA.11 This work group was composed of VA oncologists and pharmacists whose efforts resulted in 5 guidance documents designed to reduce drug costs by optimizing therapy and reducing waste: (1) Dose Rounding in Oncology; (2) Oral Anticancer Drugs Dispensing and Monitoring; (3) Oncology Drug Table: Recommended Dispensing and Monitoring; (4) Chemotherapy Review Committee Process; and (5) Determining Clinical Benefit of High Cost Oncology Drugs. Reviews of 2 of these documents follows.
Determining Clinical Benefit of High Cost Oncology Drugs provides a decision tool to aid members of the oncology health care team in optimizing patient outcomes while attempting to obtain the greatest value from innovative therapies. When a high-cost or off-label request is made for a particular patient, using this process encourages thoughtful and evidence-based use of the drug by considering all clinical evidence in addition to the FDA-approved indication. Finally, a drug’s safety profile in relation to the indication, therapeutic goal, and specific patient characteristics and desires are integrated into a final decision to determine the appropriateness of the therapeutic intervention for the patient.
Oncology Drug Table: Recommended Dispensing and Monitoring contains a list of oral oncology drugs and includes recommendations for dispensing amount, adverse effects, laboratory monitoring, formulary status, approval requirements, and monthly cost of each agent based on the current NAC pricing.5 Cost awareness is critical when comparing alternative treatment options to minimize cost when treatments with similar benefits are considered. Most VA oncologists do not have easy access to the cost of various treatments and can be surprised about how expensive many common regimens cost. The costs listed in this document are updated about every 3 months.
Conclusion
Using newer, expensive targeted oncology agents in a cost-effective manner must be a proactive, collaborative, and multidisciplinary process. Pharmacists should not be solely responsible for monitoring and controlling high-cost treatments. Well-informed, evidence-based decisions are needed to ensure expensive agents are used in the subset of patients who are most likely to benefit. Clinical tools addressing value should be used to aid in appropriate and cost-effective treatment plans using drug monographs and CFUs, VHA Guidance on Determining Clinical Benefit of High Cost Oncology Drugs, and the Oral Chemotherapy Dispensing and Monitoring Reference, among other resources. Due to the subjective nature of value in medicine, agreeing on policy will have many challenges, such as how to place a value on various gains in overall survival, progression free survival, response rates, and QOL.
eAppendix
1. Bach PB. Limits on Medicare's ability to control rising spending on cancer drugs. N Engl J Med. 2009;360(6):626-633.
2. Kantarjian H, Steensma D, Rius Sanjuan J, Eishaug A, Light D. High cancer drug prices in the United States: reasons and proposed solutions. J Oncol Pract. 2014;10(4):e208-e211.
3. Goldstein DA, Chen Q, Ayer T, et al. Necitumumab in metastatic squamous cell lung cancer: establishing a value-based cost. JAMA Oncol. 2015;1(9):1293-1300.
4. Thatcher N, Hirsch FR, Luft AV, et al; SQUIRE Investigators. Necitumumab plus gemcitabine and cisplatin versus gemcitabine and cisplatin alone as first-line therapy in patients with stage IV squamous non-small-cell lung cancer (SQUIRE): an open-label, randomised, controlled phase 3 trial. Lancet Oncol. 2015;16(7):763-774.
5. U.S. Department of Veterans Affairs, National Acquisition Center, Pharmaceutical Catalog Search. U.S. Department of Veterans Affairs, National Acquisition Center website. http://www1.va.gov/nac/index.cfm?template=Search_Pharmaceutical_Catalog. Updated June 13, 2016. Accessed June 13, 2016.
6. Lakdawalla DN, Romley JA, Sanchez Y, Maclean JR, Penrod JR, Philipson T. How cancer patients value hope and the implications for cost-effectiveness assessments of high-cost cancer therapies. Health Aff (Millwood). 2012;31(4):676-682.
7. Ubel PA, Berry SR, Nadler E, et al. In a survey, marked inconsistency in how oncologists judged value of high-cost cancer drugs in relation to gains in survival. Health Aff (Millwood). 2012;31(4):709-717.
8. Asch SM, McGlynn EA, Hogan MM, et al. Comparison of quality of care for patients in the Veterans Health Administration and patients in a national sample. Ann Intern Med. 2004;141(12):938-945. 9. Longman P. Best Care Anywhere: Why VA Health Care Would Work for Everyone. 3rd ed. San Francisco, CA: Berrett-Koehler Publishers; 2012. 10. Heron BB, Geraci MC. Controlling the cost of oncology drugs within the VA: a national perspective. Fed Pract. 2015;32(suppl 1):18S-22S.
11. U.S. Department of Veterans Affairs. Pharmacy Benefits Management Services Intranet, Documents and Lists. https://vaww.cmopnational.va.gov/cmop/PBM/Clinical%20Guidance/Forms/AllItems.aspx. Accessed May 19, 2016.
Diabetic Peripheral Neuropathy: The Learning Curve
When R was a 19-year-old sailor heading out to sea, he had no idea of the forthcoming medical diagnosis that would change his life. R was like any other young seaman: ready to do his assigned tasks and ready to serve his country. He was stationed on a Los Angeles class, nuclear-powered, fast attack submarine. R was living his lifelong dream of serving in the U.S. Navy. The submarine was conducting sound trials and tactical readiness exams off the southeast U.S. coast near Bermuda. The days were long, but he loved what he was doing, so he ignored his symptoms of fatigue, attributing it to his busy schedule. He was enjoying his time in the navy and looking forward to a long career.
Diagnosis
R was assigned watch duty during the day, but he couldn’t understand why he felt so fatigued during his watch or his ability to fall asleep while standing. R didn’t complain because he knew everyone was working hard, long hours. He knew he was not sleeping well, mainly due to the frequent trips to the bathroom to urinate, and at first attributed it to drinking large amounts of coffee and sugar to stay awake during the drills. He also knew he was constantly hungry, thirsty, and tired. After falling asleep while on duty during the exercise, R found himself facing possible disciplinary action. He had no idea what was happening but realized it was not in his nature to fail at a task and certainly not to fall asleep on duty. Having a chronic disease that would affect him for the rest of his life was certainly not on his mind. He recalled, “At the time I didn’t even know what diabetes was.”
R finally admitted his array of symptoms to one of the corpsman. He often urinated every 20 minutes and at times did not make it to the bathroom. His vision was blurred to the point he could not make out faces just a few feet away from him, and the lethargy was overwhelming.
The corpsman immediately knew something was wrong with R and instructed R to report to the boat’s sick bay. Fortunately for R, the classic symptoms of hunger, thirst, frequent urination, and fatigue struck a chord with the corpsman who also noticed that R had lost a great amount of weight, a fact R had not noticed. Labs were drawn, and a urine specimen was obtained. R had a blood glucose level of > 1,000 mg/dL, was in severe ketoacidosis, and was diagnosed with type 1 diabetes mellitus (T1DM). The corpsman was surprised he was even coherent at this point. He was given IV infusions in both arms. The boat’s mission was halted. The immediate thought was to send for a medical evacuation helicopter. The weather conditions were too severe at the time to arrange for air evacuation, so the captain decided to head back to port and transfer R to the Portsmouth Naval Medical Center. R will never forget that day; however, the days and weeks following became somewhat of a blur. R recalls, “Time seemed to standstill some days, then others were on fast forward.” He was hospitalized for the next 2 weeks. His condition was stabilized, and he learned how to care for himself.
Learning About Diabetes
The following weeks and months while on medical hold and being processed for discharge, R was assigned a variety of duties. He felt well prepared to manage his disease on a daily basis and at first had hopes of continuing his navy career. He recalls now, he had no clue what the diagnosis would mean in the years to come. R learned he would eventually be medically retired from the navy and rejoined civilian life.
Initial Complications
After leaving the navy, R decided to become a law enforcement officer. He joined a local police department and quickly rose through the ranks. He began to settle into a routine, learning to manage his insulin, control his diet, and enjoy his new career. For the next several years, he experienced few complications, although he never regained the 50 pounds he had lost when he was first diagnosed. Around 25 years old, he began to notice pain in the bottom of his feet. He was still able to run, had great balance, and didn’t think his symptoms of sore feet were attributable to his diabetes. He did notice that without shoes on, his feet were extremely sensitive to any texture.
Over the next year, R experienced worsening pain and increased sensitivity in his feet. He started to spend more time in his patrol car instead of on foot patrol because of the pain. He was no longer able to enjoy one of his favorite pastimes, walking barefoot on the beach. During the next several years, R would gradually begin to realize he had no sensation in his feet. He noted this affected his balance and gait. He loved his career in law enforcement, but often the complications of his disease would impact his daily work. He felt he was no longer fulfilling his responsibilities as an officer because of his inability to complete daily assignments due to the neuropathy in his feet. He left his law enforcement career and spent most of his time in an office, which was much less taxing on his body.
Foot Ulcers
In 2011, 15 years after the T1DM diagnosis, R experienced his first foot wound. After a day of hiking and walking in creek beds, he realized he had essentially rubbed off the skin on the ball of his foot. He cleaned it like he normally would; however, the area failed to heal. He developed a hard callus around the wound, but the center remained open. At the time, he did not realize the significance of this type of wound for a diabetic patient.
The foot ulcer was discovered while in the emergency department for an unrelated issue. It was then he was referred to the Greenville VA Outpatient Clinic wound healing center in South Carolina for further treatment. At 36 years old, he was far younger than most of the veterans being treated for diabetic foot ulcers. Per the CDC Report Card, about 90% to 95% of patients with diabetes have type 2 diabetes mellitus (T2DM).1,2 Most persons diagnosed with diabetes are in the fifth and sixth decades of life.1,2 For R, patient education had consisted of learning to manage his diet and insulin therapy. He has no recollection of education about future complications and reported feeling “clueless” about the potential complications of foot ulcerations.
During the patient’s first visit to the wound healing center, R was educated about diabetic foot health, complications, the healing process, and the importance of diabetes management. The center is staffed by a nurse practitioner (NP) certified in wound care with extensive experience in diabetic foot ulcers and by several wound care nurses. Each staff member incorporates patient education and positive reinforcement into every patient visit. According to Jeffrey Frenchman, DPM, director of limb preservation at the Atlanta VAMC in Georgia, “Patient education and positive reinforcement cost nothing to provide and offer great return on patient adherence.” (Jeffrey Frenchman, April 12, 2014, oral interview).
R visited the center once or twice weekly, depending on the appearance of the wound and the type of treatment he was receiving. He noted that having frequent contact with the wound center staff made him feel as though he was making progress. For the staff, ensuring R could adhere to the treatment regimen was paramount. If a patient is unable to follow home care instructions or lacks understanding of the importance of following wound care instructions, then the likelihood of adherence is less.
Continued Complications
R was unprepared for the months of healing. He learned about the importance of offloading (the reduction of pressure), noting that during the weeks he spent more time on his feet, ulcer healing failed to progress or worsened.3 Eventually, the ulcer healed, and he felt better prepared to prevent future problems as a result of having been educated about foot care. Unfortunately, he experienced his next complication a few months later after wearing new boots. When removing his boots at the end of the workday, he noticed blood on his sock. He realized the boots had caused blisters that had ruptured on the third, fourth, and fifth toes. Once again, having T1DM and totally insensate feet caused further problems with delayed healing. Since his first foot ulcer in 2011, R continued to have problems with foot ulcers. Some ulcers were caused by shoe pressure, blisters from hot beach sand, or from a typical neuropathic foot ulcer, which first develops as a preulcerative callus and rapidly progresses to an ulcer. Despite his daily astute monitoring of his feet he noted, “Problems just seem to occur overnight.”
Quality of Life
The greatest impact of diabetes for R was on his quality of life (QOL). He noted that the frustrations of dealing with foot wounds had a profound negative impact on QOL. As an avid outdoor enthusiast, the months he spent on crutches, wearing off-loading shoes, attending numerous wound clinic visits, and being unable to take part in the activities he loved greatly impacted his mental and physical well-being. “Having to change my daily routine such as bathing, driving, and even going out to dinner is hard enough. Having to give up hiking, camping, and swimming changes my entire outlook on life.” R also noted the unintended isolation from friends had a profound impact on his feelings. “They want to include you, but know they can’t. You want to go, but know you can’t keep up. Sometimes being alone is the worst feeling.”
Receiving care from wound care professionals offered R hope that his wounds would heal and he would return to the activities he enjoyed. He noted that the education and support he received from the wound center staff made him feel more confident not only in caring for current wounds, but also in preventing wounds in the future. He also realized that prompt treatment for even the smallest of wounds was essential.
R was able to contact the wound center staff either by phone or by secure messaging e-mail anytime he had a concern or question. When he developed new foot wounds, he could contact the staff and be evaluated within 72 hours of notification. He noted that being able to talk with the staff as soon as a problem developed offered him reassurance that he was properly taking care of his feet.
During his treatment, R needed to wear offloading shoes to minimize the weight-bearing pressure.3 The wound center staff took care to ensure that R could ambulate safely with these shoes and avoid further injury. They also reinforced the importance of wearing these shoes, despite their unfashionable appearance.
Given the depth of some of R’s foot ulcers, the staff used negative pressure dressings to enhance healing. Negative pressure dressings provide a vacuum source to create continuous or intermittent negative pressure inside a wound to remove fluid, exudates, and infectious materials and prepare the wound for healing and closure. A mechanically powered, negative pressure dressing with a 125 mm Hg cartridge device was used during R’s treatment. This type of negative pressure dressing offered the benefit of dressing changes twice weekly vs 3 times weekly with other electric-powered negative pressure devices.4
Another important aspect of R’s care was the use of human amniotic tissue allografts. When R’s wounds did not show healing progression during the first 4 weeks of traditional treatment, amniotic tissue allografts were added to his plan of care. This type of product for the wound bed provides critical growth factors and collagen to promote effective, enhanced wound healing. Patient education again is critical when using human amniotic tissue allografts so that the patient learns to keep dressings intact and undisturbed.5
Future Implications
Diabetic foot ulcers are a preventable complication of diabetic peripheral neuropathy. Patient education about foot health should not only be incorporated in diabetic education, but also reinforced by the health care staff at each visit. When a patient presents with a diabetic foot ulcer, early, prompt treatment is vital to ensure a favorable outcome.
For health care providers, cognizance of the impact that wounds have on patients’ QOL is an essential aspect of care. Identification of factors that promote expedient and effective wound healing is vital. Patient education that is focused on engaging the patient to actively participate in the healing process is paramount. Involving R in every aspect of his care was the focus of the wound center staff. Explaining the purpose of each product used and why it was chosen was not only interesting for R, but also allowed him to actively participate in his appointments and care. As the leader of the wound treatment team, the NP may order, guide, and direct care, but empowering patients to be active participants in their care enhances adherence to the plan of care.6
Conclusion
Focusing on these critical aspects of patient-centered wound healing must be at the forefront when treating patients with diabetic foot ulcers. Although a price cannot be placed on QOL, the cost of diabetic foot ulcers and its complications is astounding. In 2007, nearly $116 billion was spent on diabetes treatment, and more than one-third was for the care of diabetic foot ulcers and complications from those ulcers.7
Finally, the incidence of T2DM is rising: The average age of patients at the onset of T2DM is becoming younger, the development of T2DM in children is rising, and treatment costs are rising.1 Given the alarming statistics of T2DM and its complications in the U.S., focusing on prevention, patient education, and effective treatment of diabetic foot ulcers is important.
1. Diabetes Report Card 2014. Centers for Disease Control and Prevention website. http://www.cdc.gov/diabetes/pdfs/library/diabetesreportcard2014.pdf. Published 2012. Accessed June 1, 2016.
2. National diabetes fact sheet: national estimates and general information on diabetes and prediabetes in the United States. Centers for Disease Control and Prevention website. http://www.cdc.gov/diabetes/pubs/statsreport14/national-diabetes-report-web.pdf. Published 2012. Accessed June 1, 2016.
3. Wu SC, Jensen JL, Weber AK, Robinson DE, Armstrong DG. Use of pressure offloading devices in diabetic foot ulcers: do we practice what we preach? Diabetes Care. 2008;31(11):2118-2119. Armstrong DG, Marston WA, Reyzelman AM. Kirsner RS.
4. Comparative effectiveness of mechanically and electrically powered negative pressure wound therapy devices: a multicenter randomized controlled trial. Wound Repair Regen. 2012;20(3):332-341.
5. Zelen CM, Serena TE, Fetterolf DE. Dehydrated human amnion/chorion membrane allografts in patients with chronic diabetic foot ulcers: a long-term follow-up study. Wound Med. 2014;4:1-4.
6. Boulton AJ, Kirsner RS, Vileikyte L. Clinical Practice. Neuropathic diabetic foot ulcers. N Engl J Med. 2004;351(1):48-55.
7. Driver VR, Fabbi M, Lavery LA, Gibbons G. The costs of diabetic foot: the economic case for the limb salvage team. J Vasc Surg. 2010;52(3)(suppl):17S-22S.
When R was a 19-year-old sailor heading out to sea, he had no idea of the forthcoming medical diagnosis that would change his life. R was like any other young seaman: ready to do his assigned tasks and ready to serve his country. He was stationed on a Los Angeles class, nuclear-powered, fast attack submarine. R was living his lifelong dream of serving in the U.S. Navy. The submarine was conducting sound trials and tactical readiness exams off the southeast U.S. coast near Bermuda. The days were long, but he loved what he was doing, so he ignored his symptoms of fatigue, attributing it to his busy schedule. He was enjoying his time in the navy and looking forward to a long career.
Diagnosis
R was assigned watch duty during the day, but he couldn’t understand why he felt so fatigued during his watch or his ability to fall asleep while standing. R didn’t complain because he knew everyone was working hard, long hours. He knew he was not sleeping well, mainly due to the frequent trips to the bathroom to urinate, and at first attributed it to drinking large amounts of coffee and sugar to stay awake during the drills. He also knew he was constantly hungry, thirsty, and tired. After falling asleep while on duty during the exercise, R found himself facing possible disciplinary action. He had no idea what was happening but realized it was not in his nature to fail at a task and certainly not to fall asleep on duty. Having a chronic disease that would affect him for the rest of his life was certainly not on his mind. He recalled, “At the time I didn’t even know what diabetes was.”
R finally admitted his array of symptoms to one of the corpsman. He often urinated every 20 minutes and at times did not make it to the bathroom. His vision was blurred to the point he could not make out faces just a few feet away from him, and the lethargy was overwhelming.
The corpsman immediately knew something was wrong with R and instructed R to report to the boat’s sick bay. Fortunately for R, the classic symptoms of hunger, thirst, frequent urination, and fatigue struck a chord with the corpsman who also noticed that R had lost a great amount of weight, a fact R had not noticed. Labs were drawn, and a urine specimen was obtained. R had a blood glucose level of > 1,000 mg/dL, was in severe ketoacidosis, and was diagnosed with type 1 diabetes mellitus (T1DM). The corpsman was surprised he was even coherent at this point. He was given IV infusions in both arms. The boat’s mission was halted. The immediate thought was to send for a medical evacuation helicopter. The weather conditions were too severe at the time to arrange for air evacuation, so the captain decided to head back to port and transfer R to the Portsmouth Naval Medical Center. R will never forget that day; however, the days and weeks following became somewhat of a blur. R recalls, “Time seemed to standstill some days, then others were on fast forward.” He was hospitalized for the next 2 weeks. His condition was stabilized, and he learned how to care for himself.
Learning About Diabetes
The following weeks and months while on medical hold and being processed for discharge, R was assigned a variety of duties. He felt well prepared to manage his disease on a daily basis and at first had hopes of continuing his navy career. He recalls now, he had no clue what the diagnosis would mean in the years to come. R learned he would eventually be medically retired from the navy and rejoined civilian life.
Initial Complications
After leaving the navy, R decided to become a law enforcement officer. He joined a local police department and quickly rose through the ranks. He began to settle into a routine, learning to manage his insulin, control his diet, and enjoy his new career. For the next several years, he experienced few complications, although he never regained the 50 pounds he had lost when he was first diagnosed. Around 25 years old, he began to notice pain in the bottom of his feet. He was still able to run, had great balance, and didn’t think his symptoms of sore feet were attributable to his diabetes. He did notice that without shoes on, his feet were extremely sensitive to any texture.
Over the next year, R experienced worsening pain and increased sensitivity in his feet. He started to spend more time in his patrol car instead of on foot patrol because of the pain. He was no longer able to enjoy one of his favorite pastimes, walking barefoot on the beach. During the next several years, R would gradually begin to realize he had no sensation in his feet. He noted this affected his balance and gait. He loved his career in law enforcement, but often the complications of his disease would impact his daily work. He felt he was no longer fulfilling his responsibilities as an officer because of his inability to complete daily assignments due to the neuropathy in his feet. He left his law enforcement career and spent most of his time in an office, which was much less taxing on his body.
Foot Ulcers
In 2011, 15 years after the T1DM diagnosis, R experienced his first foot wound. After a day of hiking and walking in creek beds, he realized he had essentially rubbed off the skin on the ball of his foot. He cleaned it like he normally would; however, the area failed to heal. He developed a hard callus around the wound, but the center remained open. At the time, he did not realize the significance of this type of wound for a diabetic patient.
The foot ulcer was discovered while in the emergency department for an unrelated issue. It was then he was referred to the Greenville VA Outpatient Clinic wound healing center in South Carolina for further treatment. At 36 years old, he was far younger than most of the veterans being treated for diabetic foot ulcers. Per the CDC Report Card, about 90% to 95% of patients with diabetes have type 2 diabetes mellitus (T2DM).1,2 Most persons diagnosed with diabetes are in the fifth and sixth decades of life.1,2 For R, patient education had consisted of learning to manage his diet and insulin therapy. He has no recollection of education about future complications and reported feeling “clueless” about the potential complications of foot ulcerations.
During the patient’s first visit to the wound healing center, R was educated about diabetic foot health, complications, the healing process, and the importance of diabetes management. The center is staffed by a nurse practitioner (NP) certified in wound care with extensive experience in diabetic foot ulcers and by several wound care nurses. Each staff member incorporates patient education and positive reinforcement into every patient visit. According to Jeffrey Frenchman, DPM, director of limb preservation at the Atlanta VAMC in Georgia, “Patient education and positive reinforcement cost nothing to provide and offer great return on patient adherence.” (Jeffrey Frenchman, April 12, 2014, oral interview).
R visited the center once or twice weekly, depending on the appearance of the wound and the type of treatment he was receiving. He noted that having frequent contact with the wound center staff made him feel as though he was making progress. For the staff, ensuring R could adhere to the treatment regimen was paramount. If a patient is unable to follow home care instructions or lacks understanding of the importance of following wound care instructions, then the likelihood of adherence is less.
Continued Complications
R was unprepared for the months of healing. He learned about the importance of offloading (the reduction of pressure), noting that during the weeks he spent more time on his feet, ulcer healing failed to progress or worsened.3 Eventually, the ulcer healed, and he felt better prepared to prevent future problems as a result of having been educated about foot care. Unfortunately, he experienced his next complication a few months later after wearing new boots. When removing his boots at the end of the workday, he noticed blood on his sock. He realized the boots had caused blisters that had ruptured on the third, fourth, and fifth toes. Once again, having T1DM and totally insensate feet caused further problems with delayed healing. Since his first foot ulcer in 2011, R continued to have problems with foot ulcers. Some ulcers were caused by shoe pressure, blisters from hot beach sand, or from a typical neuropathic foot ulcer, which first develops as a preulcerative callus and rapidly progresses to an ulcer. Despite his daily astute monitoring of his feet he noted, “Problems just seem to occur overnight.”
Quality of Life
The greatest impact of diabetes for R was on his quality of life (QOL). He noted that the frustrations of dealing with foot wounds had a profound negative impact on QOL. As an avid outdoor enthusiast, the months he spent on crutches, wearing off-loading shoes, attending numerous wound clinic visits, and being unable to take part in the activities he loved greatly impacted his mental and physical well-being. “Having to change my daily routine such as bathing, driving, and even going out to dinner is hard enough. Having to give up hiking, camping, and swimming changes my entire outlook on life.” R also noted the unintended isolation from friends had a profound impact on his feelings. “They want to include you, but know they can’t. You want to go, but know you can’t keep up. Sometimes being alone is the worst feeling.”
Receiving care from wound care professionals offered R hope that his wounds would heal and he would return to the activities he enjoyed. He noted that the education and support he received from the wound center staff made him feel more confident not only in caring for current wounds, but also in preventing wounds in the future. He also realized that prompt treatment for even the smallest of wounds was essential.
R was able to contact the wound center staff either by phone or by secure messaging e-mail anytime he had a concern or question. When he developed new foot wounds, he could contact the staff and be evaluated within 72 hours of notification. He noted that being able to talk with the staff as soon as a problem developed offered him reassurance that he was properly taking care of his feet.
During his treatment, R needed to wear offloading shoes to minimize the weight-bearing pressure.3 The wound center staff took care to ensure that R could ambulate safely with these shoes and avoid further injury. They also reinforced the importance of wearing these shoes, despite their unfashionable appearance.
Given the depth of some of R’s foot ulcers, the staff used negative pressure dressings to enhance healing. Negative pressure dressings provide a vacuum source to create continuous or intermittent negative pressure inside a wound to remove fluid, exudates, and infectious materials and prepare the wound for healing and closure. A mechanically powered, negative pressure dressing with a 125 mm Hg cartridge device was used during R’s treatment. This type of negative pressure dressing offered the benefit of dressing changes twice weekly vs 3 times weekly with other electric-powered negative pressure devices.4
Another important aspect of R’s care was the use of human amniotic tissue allografts. When R’s wounds did not show healing progression during the first 4 weeks of traditional treatment, amniotic tissue allografts were added to his plan of care. This type of product for the wound bed provides critical growth factors and collagen to promote effective, enhanced wound healing. Patient education again is critical when using human amniotic tissue allografts so that the patient learns to keep dressings intact and undisturbed.5
Future Implications
Diabetic foot ulcers are a preventable complication of diabetic peripheral neuropathy. Patient education about foot health should not only be incorporated in diabetic education, but also reinforced by the health care staff at each visit. When a patient presents with a diabetic foot ulcer, early, prompt treatment is vital to ensure a favorable outcome.
For health care providers, cognizance of the impact that wounds have on patients’ QOL is an essential aspect of care. Identification of factors that promote expedient and effective wound healing is vital. Patient education that is focused on engaging the patient to actively participate in the healing process is paramount. Involving R in every aspect of his care was the focus of the wound center staff. Explaining the purpose of each product used and why it was chosen was not only interesting for R, but also allowed him to actively participate in his appointments and care. As the leader of the wound treatment team, the NP may order, guide, and direct care, but empowering patients to be active participants in their care enhances adherence to the plan of care.6
Conclusion
Focusing on these critical aspects of patient-centered wound healing must be at the forefront when treating patients with diabetic foot ulcers. Although a price cannot be placed on QOL, the cost of diabetic foot ulcers and its complications is astounding. In 2007, nearly $116 billion was spent on diabetes treatment, and more than one-third was for the care of diabetic foot ulcers and complications from those ulcers.7
Finally, the incidence of T2DM is rising: The average age of patients at the onset of T2DM is becoming younger, the development of T2DM in children is rising, and treatment costs are rising.1 Given the alarming statistics of T2DM and its complications in the U.S., focusing on prevention, patient education, and effective treatment of diabetic foot ulcers is important.
1. Diabetes Report Card 2014. Centers for Disease Control and Prevention website. http://www.cdc.gov/diabetes/pdfs/library/diabetesreportcard2014.pdf. Published 2012. Accessed June 1, 2016.
2. National diabetes fact sheet: national estimates and general information on diabetes and prediabetes in the United States. Centers for Disease Control and Prevention website. http://www.cdc.gov/diabetes/pubs/statsreport14/national-diabetes-report-web.pdf. Published 2012. Accessed June 1, 2016.
3. Wu SC, Jensen JL, Weber AK, Robinson DE, Armstrong DG. Use of pressure offloading devices in diabetic foot ulcers: do we practice what we preach? Diabetes Care. 2008;31(11):2118-2119. Armstrong DG, Marston WA, Reyzelman AM. Kirsner RS.
4. Comparative effectiveness of mechanically and electrically powered negative pressure wound therapy devices: a multicenter randomized controlled trial. Wound Repair Regen. 2012;20(3):332-341.
5. Zelen CM, Serena TE, Fetterolf DE. Dehydrated human amnion/chorion membrane allografts in patients with chronic diabetic foot ulcers: a long-term follow-up study. Wound Med. 2014;4:1-4.
6. Boulton AJ, Kirsner RS, Vileikyte L. Clinical Practice. Neuropathic diabetic foot ulcers. N Engl J Med. 2004;351(1):48-55.
7. Driver VR, Fabbi M, Lavery LA, Gibbons G. The costs of diabetic foot: the economic case for the limb salvage team. J Vasc Surg. 2010;52(3)(suppl):17S-22S.
Data‐Driven Pediatric Alarm Limits
The management of alarms in the hospital setting is a significant patient safety issue. In 2013, the Joint Commission issued Sentinel Event Alert #50 to draw attention to the fact that tens of thousands of alarms occur daily throughout individual hospitals, and 85% to 99% are false or not clinically actionable.[1] These alarms, designed to be a safety net in patient care, have the unintended consequence of causing provider desensitization, also known as alarm fatigue, which contributes to adverse events as severe as patient mortality.[1, 2] For this reason, a 2014 Joint Commission National Patient Safety Goal urged hospitals to prioritize alarm system safety and to develop policies and procedures to manage alarms and alarm fatigue.[3]
Multiple efforts have been made to address alarm fatigue in hospitalized adults. Studies have quantified the frequency and types of medical device alarms,[4, 5, 6, 7, 8, 9] and some proposed solutions to decrease excess alarms.[10, 11, 12, 13, 14, 15] One such solution is to change alarm limit settings, an intervention shown to be efficacious in the literature.[5, 6, 16, 17] Although no adverse patient outcomes are reported in these studies, none of them included a formal safety evaluation to evaluate whether alarm rate reduction occurred at the expense of clinically significant alarms.
Specific to pediatrics, frameworks to address alarm fatigue have been proposed,[18] and the relationship between nurse response time and frequency of exposure to nonactionable alarms has been reported.[19] However, efforts to address alarm fatigue in the pediatric setting are less well studied overall, and there is little guidance regarding optimization of pediatric alarm parameters. Although multiple established reference ranges exist for pediatric vital signs,[20, 21, 22] a systematic review in 2011 found that only 2 of 5 published heart rate (HR) and 6 respiratory rate (RR) guidelines cited any references, and even these had weak underpinning evidence.[23] Consequently, ranges defining normal pediatric vital signs are derived either from small sample observational data in healthy outpatient children or consensus opinion. In a 2013 study by Bonafide et al.,[24] charted vital sign data from hospitalized children were used to develop percentile curves for HR and RR, and from these it was estimated that 54% of vital sign measurements in hospitalized children are out of range using currently accepted normal vital sign parameters.[24] Although these calculated vital sign parameters were not implemented clinically, they called into question reference ranges that are currently widely accepted and used as parameters for electronic health record (EHR) alerts, early warning scoring systems, and physiologic monitor alarms.
With the goal of safely decreasing the number of out‐of‐range vital sign measurements that result from current, often nonevidence‐based pediatric vital sign reference ranges, we used data from noncritically ill pediatric inpatients to derive HR and RR percentile charts for hospitalized children. In anticipation of local implementation of these data‐driven vital sign ranges as physiologic monitor parameters, we performed a retrospective safety analysis by evaluating the effect of data‐driven alarm limit modification on identification of cardiorespiratory arrests (CRA) and rapid response team (RRT) activations.
METHODS
We performed a cross‐sectional study of children less than 18 years of age hospitalized on general medical and surgical units at Lucile Packard Children's Hospital Stanford, a 311‐bed quaternary‐care academic hospital with a full complement of pediatric medical and surgical subspecialties and transplant programs. During the study period, the hospital used the Cerner EHR (Millennium; Cerner, Kansas City, MO) and Philips IntelliVue bedside monitors (Koninklijke Philips N.V., Amsterdam, the Netherlands). The Stanford University Institutional Review Board approved this study.
Establishing Data‐Driven HR and RR Parameters
Vital sign documentation in the EHR at our institution is performed primarily by nurses and facilitated by bedside monitor biomedical device integration. We extracted vital signs data from the institution's EHR for all general medical and surgical patients discharged between January 1, 2013 and May 3, 2014. To be most conservative in the definition of normal vital sign ranges for pediatric inpatients, we excluded critically ill children (those who spent any part of their hospitalization in an intensive care unit [ICU]). Physiologically implausible vital sign values were excluded as per the methods of Bonafide et al.[24] The data were separated into 2 different sets: a training set (patients discharged between January 1, 2013 and December 31, 2013) and a test set for validation (patients discharged between January 1, 2014 and May 3, 2014). To avoid oversampling from both particular time periods and individual patients in the training set, we randomly selected 1 HR and RR pair from each 4‐hour interval during a hospitalization, and then randomly sampled a maximum of 10 HR and RR pairs per patient. Using these vital sign measurements, we calculated age‐stratified 1st, 5th, 10th, 50th, 90th, 95th, and 99th percentiles for both HR and RR.
Based on a combination of expert opinion and local consensus from our Medical Executive and Patient Safety Committees, we selected the 5th and 95th percentile values as proposed data‐driven parameter limits and compared them to the 5th and 95th percentile values generated in the 2013 study[24] and to the 2004 National Institutes of Health (NIH)adapted vital sign reference ranges currently used at our hospital.[25] Using 1 randomly selected HR and RR pair from every 4‐hour interval in the validation set, we compared the proportion of out‐of‐range HR and RR observations with the proposed 5th and 95th percentile data‐driven parameters versus the current NIH reference ranges. We also calculated average differences between our data‐driven 5th and 95th percentile values and the calculated HR and RR values in the 2013 study.[24]
Safety Analysis
To assess the safety of the newly created 5th and 95th percentile HR and RR parameters prior to clinical adoption, we retrospectively reviewed data associated with all RRT and CRA events on the hospital's medical/surgical units from March 4, 2013 until March 3, 2014. The RRT/CRA event data were obtained from logs kept by the hospital's code committee. We excluded events that lacked a documented patient identifier, occurred in locations other than the acute medical/surgical units, or occurred in patients >18 years old. The resulting charts were manually reviewed to determine the date and time of RRT or CRA event activation. Because evidence exists that hospitalized pediatric patients with CRA show signs of vital sign decompensation as early as 12 hours prior to the event,[26, 27, 28, 29] we extracted all EHR‐charted HR and RR data in the 12 hours preceding RRT and CRA events from the institution's clinical data warehouse for analysis, excluding patients without charted vital sign data in this time period. The sets of patients with any out‐of‐range HR or RR measurements in the 12‐hours prior to an event were compared according to the current NIH reference ranges[25] versus data‐driven parameters. Additionally, manual chart review was performed to assess the reason for code or RRT activation, and to determine the role that out‐of‐range vital signs played in alerting clinical staff of patient decompensation.
Statistical Analysis
All analysis was performed using R statistical package software (version 0.98.1062 for Mac OS X 10_9_5; The R Foundation for Statistical Computing, Vienna, Austria) with an SQL database (MySQL 2015; Oracle Corp., Redwood City, CA).
RESULTS
Data‐Driven HR and RR Parameters
We established a training set of 62,508 vital sign measurements for 7202 unique patients to calculate 1st, 5th, 10th, 50th, 90th, 95th, and 99th percentiles for HR and RR among the 14 age groups (see Supporting Information, Appendix 1, in the online version of this article). Figures 1 and 2 compare the proposed data‐driven vital sign ranges with (1) our current HR and RR reference ranges and (2) the 5th and 95th percentile values created in the similar 2013 study.[24] The greatest difference between our study and the 2013 study was across data‐driven 95th percentile RR parameters, which were an average of 4.8 points lower in our study.

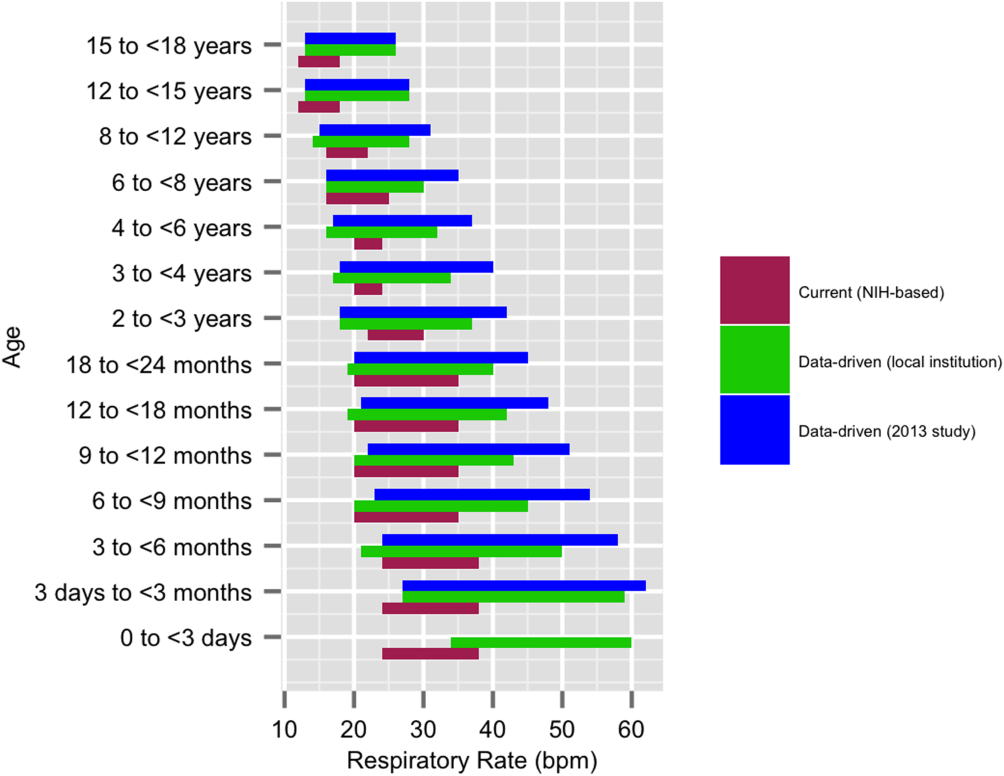
Our validation set consisted of 82,993 vital sign measurements for 2287 unique patients. Application of data‐driven HR and RR 5th and 95th percentile limits resulted in 24,045 (55.6%) fewer out‐of‐range measurements compared to current NIH reference ranges (19,240 vs 43,285). Forty‐five percent fewer HR values and 61% fewer RR values were considered out of range using the proposed data‐driven parameters (see Supporting Information, Appendix 2, in the online version of this article).
Safety
Of the 218 unique out‐of‐ICU RRT and CRA events logged from March 4, 2013 to March 3, 2014, 63 patients were excluded from analysis: 10 lacked identifying information, 33 occurred outside of medical/surgical units, and 20 occurred in patients >18 years of age. The remaining 155 patient charts were reviewed. Seven patients were subsequently excluded because they lacked EHR‐documented vital signs data in the 12 hours prior to RRT or CRA team activation, yielding a cohort of 148 patients (128 RRT events, 20 CRA events).
Table 1 describes the analysis of vital signs in the 12 hours leading up to the 148 RRT and CRA events. All 121 patients with out‐of‐range HR values using NIH reference ranges also had out‐of‐range HR values with the proposed data‐driven parameters; an additional 8 patients had low HR values using the data‐driven parameters. Of the 137 patients with an out‐of‐range RR value using NIH reference ranges, 33 (24.1%) were not considered out of range by the data‐driven parameters. Of these, 28 had high RR and 5 had low RR according to NIH reference ranges.
| No. Patients With HR Out of Range* | No. Patients With RR Out of Range* | No. Patients With HR or RR Out of Range* | |
|---|---|---|---|
| |||
| NIH ranges | 121 | 137 | 144 |
| Data‐driven ranges | 129 | 104 | 138 |
| Difference (causal threshold) | +8 (low HR) | 28 (high RR), 5 (low RR) | +2 (low HR), 8 (high RR) |
After evaluating out‐of‐range HR and RR individually, the 148 RRT and CRA events were analyzed for either out‐of‐range HR values or RR values. In doing so, 144 (97.3%) patients had either HR or RR measurements that were considered out of range using our current NIH reference ranges. One hundred thirty‐eight (93.2%) had either HR or RR measurements that were considered out of range with the proposed parameters. One hundred thirty‐six (94.4%) of the 144 patients with out‐of‐range HR or RR measurements according to NIH reference ranges were also considered out of range using proposed parameters. The data‐driven parameters identified 2 additional patients with low HR who did not have out‐of‐range HR or RR values using the current NIH reference ranges. Manual chart review of the RRT/CRA events in the 8 patients who had normal HR or RR using the data‐driven parameters revealed that RRT or CRA team interventions occurred for clinical indications that did not rely upon HR or RR measurement (eg, laboratory testing abnormalities, desaturation events) (Table 2).
| Indication for event | Patient Age |
|---|---|
| |
| 1. Desaturation and apnea | 10 months |
| 2. Hyperammonemia (abnormal lab result) | 5 years |
| 3. Acute hematemesis | 16 years |
| 4. Lightheadedness, feeling faint | 17 years |
| 5. Desaturation with significant oxygen requirement | 17 years |
| 6. Desaturation with significant oxygen requirement | 17 years |
| 7. Patient stated difficulty breathing | 18 years |
| 8. Difficulty breathing (anaphylactic shock)* | 18 years |
DISCUSSION
This is the first published study to analyze the safety of implementing data‐driven HR and RR parameters in hospitalized children. Based on retrospective analysis of a 12‐month cohort of patients requiring RRT or CRA team activation, our data‐driven HR and RR parameters were at least as safe as the NIH‐published reference ranges employed at our children's hospital. In addition to maintaining sensitivity to RRT and CRA events, the data‐driven parameters resulted in an estimated 55.6% fewer out‐of‐range measurements among medical/surgical pediatric inpatients.
Improper alarm settings are 1 of 4 major contributing factors to reported alarm‐related events,[1] and data‐driven HR and RR parameters provide a means by which to address the Joint Commission Sentinel Event Alert[1] and National Patient Safety Goal[3] regarding alarm management safety for hospitalized pediatric patients. Our results suggest that this evidence‐based approach may reduce the frequency of false alarms (thereby mitigating alarm fatigue), and should be studied prospectively for implementation in the clinical setting.
The selection of percentile values to define the new data‐driven parameter ranges involved various considerations. In an effort to minimize alarm fatigue, we considered using the 1st and 99th percentile values. However, our Medical Executive and Patient Safety Committees determined that the 99th percentile values for HR and RR for many of the age groups exceeded those that would raise clinical concern. A more conservative approach, applying the 5th and 95th percentile values, was deemed clinically appropriate and consistent with recommendations from the only other study to calculate data‐driven HR and RR parameters for hospitalized children.[24]
When taken in total, Bonafide et al.'s 2013 study demonstrated that up to 54% of vital sign values were abnormal according to textbook reference ranges.[24] Similarly, we estimated 55.6% fewer out‐of‐range HR and RR measurements with our data‐driven parameters. Although our 5th and 95th HR percentile and 5th percentile RR values are strikingly similar to those developed in the 2013 study,[24] the difference in 95th percentile RR values between the studies was potentially clinically significant, with our data‐driven upper RR values being 4.8 breaths per minute lower (more conservative) on average. Bonafide et al. transformed the RR values to fit a normal distribution, which might account for this difference. Ultimately, our safety analysis demonstrated that 24% fewer patients were considered out of range for high RR prior to RRT/CRA events with the data‐driven parameters compared to NIH norms. Even fewer RRT/CRA patients would have been considered out of range per Bonafide's less conservative 95% RR limits.
Importantly, all 8 patients in our safety analysis without abnormal vital sign measurements in the 12 hours preceding their clinical events according to the proposed data‐driven parameters (but identified as having high RR per current reference ranges) had RRT or CRA events triggered due to other significant clinical manifestations or vital sign abnormalities (eg, hypoxia). This finding is supported by the literature, which suggests that RRTs are rarely activated due to single vital sign abnormality alone. Prior analysis of RRT activations in our pediatric hospital demonstrated that only approximately 10% of RRTs were activated primarily on the basis of HR or RR vital sign abnormalities (5.6% tachycardia, 2.8% tachypnea, 1.4% bradycardia), whereas 36% were activated due to respiratory distress.[30] The clinical relevance of high RR in isolation is questionable given a recent pediatric study that raised all RR limits and decreased alarm frequency without adverse patient safety consequences.[31] Our results suggest that modifying HR and RR alarm parameters using data‐driven 5th and 95th percentile limits to decrease alarm frequency does not pose additional safety risk related to identification of RRT and CRA events. We encourage continued work toward development of multivariate or smart alarms that analyze multiple simultaneous vital sign measurements and trends to determine whether an alarm should be triggered.[32, 33]
The ability to demonstrate the safety of data‐driven HR and RR parameters is a precursor to hospital‐wide implementation. We believe it is crucial to perform a safety analysis prior to implementation due to the role vital signs play in clinical assessment and detection of patient deterioration.[30, 34, 35, 36, 37] Though a few studies have shown that modification of alarm parameters decreases alarm frequency,[5, 6, 10, 16, 17] to our knowledge no formal safety evaluations have ever been published. This study provides the first published safety evaluation of data‐driven HR and RR parameters.
By decreasing the quantity of out‐of‐range vital sign values while preserving the ability to detect patient deterioration, data‐driven vital sign alarm limits have the potential to decrease false monitor alarms, alarm‐generated noise, and alarm fatigue. Future work includes prospectively studying the impact of adoption of data‐driven vital sign parameters on monitor alarm burden and monitoring the safety of the changes. Additional safety analysis could include comparing the sensitivity and specificity of early warning score systems when data‐driven vital sign ranges are substituted for traditional physiologic parameters. Further personalization of vital sign parameters will involve incorporating patient‐specific characteristics (eg, demographics, diagnoses) into the data‐driven analysis to further decrease alarm burden while enhancing patient safety. Ultimately, using a patient's own physiologic data to define highly personalized vital sign parameter limits represents a truly precision approach, and could revolutionize the way hospitalized patients are monitored.
Numerous relevant issues are not yet addressed in this initial, single‐institution study. First, although the biomedical device integration facilitated the direct import of monitor data into the EHR (decreasing transcription errors), our analysis was performed using EHR‐charted data. As such, the effect on bedside monitor alarms was not directly evaluated in our study, including those due to technical alarms or patient artifact. Second, our overall sample size for the training set was quite large; however, in some cases the number of patients per age category was limited. Third, although we evaluated the identification of severe deterioration leading to RRT or CRA events, the sensitivity of the new limits to the need for other interventions (eg, fluid bolus for dehydration or escalation of respiratory support for asthma exacerbation) or unplanned transfers to the ICU was not assessed. Fourth, the analysis was retrospective, and so the impact of data‐driven alarm limits on length of stay and readmission could not be defined. Fifth, excluding all vital sign measurements from patients who spent any time in the ICU setting decreased the amount of data available for analysis. However, excluding sicker patients probably resulted in narrower data‐driven HR and RR ranges, leading to more conservative proposed parameters that are more likely to identify patient decompensation in our safety analysis. Finally, this was a single‐site study. We believe our data‐driven limits are applicable to other tertiary or quaternary care facilities given the similarity to those generated in a study performed in a comparable setting,[24] but generalizability to other settings may be limited if the local population is sufficiently different. Furthermore, because institutional policies (eg, indications for care escalation) differ, individual institutions should determine whether our analysis is applicable to their setting or if local safety evaluation is necessary.
CONCLUSION
A large proportion of HR and RR values for hospitalized children at our institution are out of range according to current vital sign reference ranges. Our new data‐driven alarm parameters for hospitalized children provide a potentially safe means by which to modify physiologic bedside monitor alarm limits, a first step toward customization of alarm limit settings in an effort to mitigate alarm fatigue.
Acknowledgements
The authors thank Debby Huang and Joshua Glandorf in the Information Services Department at Stanford Children's Health for assistance with data acquisition. No compensation was received for their contributions.
Disclosures: All authors gave approval of the final manuscript version submitted for publication and agreed to be accountable for all aspects of the work. Dr. Veena V. Goel conceptualized and designed the study; collected, managed, analyzed and interpreted the data; prepared and reviewed the initial manuscript; and approved the final manuscript as submitted. Ms. Sarah F. Poole contributed to the design of the study and performed the primary data analysis for the study. Ms. Poole critically revised the manuscript for important intellectual content and approved the final manuscript as submitted. Dr. Goel and Ms. Poole had full access to all of the data in the study and take responsibility for the integrity of the data and the accuracy of the data analysis. Dr. Paul J. Sharek and Dr. Jonathan P. Palma contributed to the study design and data interpretation. Drs. Sharek and Palma critically revised the manuscript for important intellectual content and approved the final manuscript as submitted. Dr. Terry S. Platchek, Dr. Natalie M. Pageler, and Dr. Christopher A. Longhurst contributed to the study design. Drs. Platchek, Pageler, and Longhurst critically revised the manuscript for important intellectual content and approved the final manuscript as submitted. Ms. Poole is supported by the Stanford Biosciences Graduate Program through a Fulbright New Zealand Science and Innovation Graduate Award and through the J.R. Templin Trust Scholarship. The authors report no conflicts of interest.
- The Joint Commission. Medical device alarm safety in hospitals. Sentinel Event Alert. 2013;(50):1–3. Available at: https://www.jointcommission.org/sea_issue_50/. Accessed October 12, 2013.
- . “Alarm fatigue” a factor in 2d death: UMass hospital cited for violations. The Boston Globe. September 21, 2011. Available at: https://www.bostonglobe.com/2011/09/20/umass/qSOhm8dYmmaq4uTHZb7FNM/story.html. Accessed December 19, 2014
- The Joint Commission. Alarm system safety. Available at: https://www.jointcommission.org/assets/1/18/R3_Report_Issue_5_12_2_13_Final.pdf. Published December 11, 2013. Accessed October 12, 2013.
- , , , , . ALARMED: adverse events in low‐risk patients with chest pain receiving continuous electrocardiographic monitoring in the emergency department. A pilot study. Am J Emerg Med. 2006;24(1):62–67.
- , . Monitor alarm fatigue: standardizing use of physiological monitors and decreasing nuisance alarms. Am J Crit Care. 2010;19(1):28–34; quiz 35.
- , , . Physiologic monitoring alarm load on medical/surgical floors of a community hospital. Biomed Instrum Technol. 2011;(suppl):29–36.
- , , , , , . Multicentric study of monitoring alarms in the adult intensive care unit (ICU): a descriptive analysis. Intensive Care Med. 1999;25(12):1360–1366.
- . Crying wolf: false alarms in a pediatric intensive care unit. Crit Care Med. 1994;22(6):981–985.
- , , , et al. Cardiopulmonary monitors and clinically significant events in critically ill children. Biomed Instrum Technol. 2011;(suppl):38–45.
- , , , et al. Systematic review of physiologic monitor alarm characteristics and pragmatic interventions to reduce alarm frequency. J Hosp Med. 2016;11(2):136–144.
- . Alarm fatigue. Nurs Clin North Am. 2012;47(3):375–382.
- . Monitor alarm fatigue: an integrative review. Biomed Instrum Technol. 2012;46(4):268–277.
- , , , . Use of pagers with an alarm escalation system to reduce cardiac monitor alarm signals. J Nurs Care Qual. 2014;29(1):9–18.
- . An evidence‐based approach to reduce nuisance alarms and alarm fatigue. Biomed Instrum Technol. 2011;(suppl):46–52.
- , , , et al. Insights into the problem of alarm fatigue with physiologic monitor devices: a comprehensive observational study of consecutive intensive care unit patients. PLoS One. 2014;9(10):e110274.
- , , , , , . Effect of altering alarm settings: a randomized controlled study. Biomed Instrum Technol. 2015;49(3):214–222.
- , , , , . Alarm limit settings for early warning systems to identify at‐risk patients. J Adv Nurs. 2009;65(9):1844–1852.
- , . A framework for reducing alarm fatigue on pediatric inpatient units. Hosp Pediatr. 2015;5(3):160–163.
- , , , et al. Association between exposure to nonactionable physiologic monitor alarms and response time in a children's hospital. J Hosp Med. 2015;10(6):345–351.
- The Johns Hopkins Hospital, , . The Harriet Lane Handbook. 20th ed. Philadelphia, PA: Elsevier Saunders; 2014.
- , . Nelson Textbook of Pediatrics. 19th ed. Philadelphia, PA.: Elsevier Saunders; 2011.
- , , , . Pediatric assessment. In: Pediatric Advanced Life Support: Provider Manual. Dallas, TX: American Heart Association; 2006:9–16.
- , , , et al. Normal ranges of heart rate and respiratory rate in children from birth to 18 years of age: a systematic review of observational studies. Lancet. 2011;377(9770):1011–1018.
- , , , , , . Development of heart and respiratory rate percentile curves for hospitalized children. Pediatrics. 2013;131(4):e1150–e1157.
- National Institutes of Health. Age‐appropriate vital signs. Available at: https://web.archive.org/web/20041101222327/http://www.cc.nih.gov/ccc/pedweb/pedsstaff/age.html. Accessed July 26, 2015.
- Guidelines 2000 for cardiopulmonary resuscitation and emergency cardiovascular care. Part 9: pediatric basic life support. The American Heart Association in collaboration with the International Liaison Committee on Resuscitation. Circulation. 2000;102(8 suppl):I253–I290.
- , , , , , . Recognising clinical instability in hospital patients before cardiac arrest or unplanned admission to intensive care. A pilot study in a tertiary‐care hospital. Med J Aust. 1999;171(1):22–25.
- , , , et al. Duration of life‐threatening antecedents prior to intensive care admission. Intensive Care Med. 2002;28(11):1629–1634.
- , . Pediatric cardiopulmonary resuscitation: a collective review. Ann Emerg Med. 1999;33(2):195–205.
- , , , et al. Effect of a rapid response team on hospital‐wide mortality and code rates outside the ICU in a Children's Hospital. JAMA. 2007;298(19):2267–2274.
- , , , et al. A team‐based approach to reducing cardiac monitor alarms. Pediatrics. 2014;134(6):e1686–e1694.
- , , , et al. Collection of annotated data in a clinical validation study for alarm algorithms in intensive care—a methodologic framework. J Crit Care. 2010;25(1):128–135.
- , , . Making ICU alarms meaningful: a comparison of traditional vs. trend‐based algorithms. Proc AMIA Symp. 1999:379–383.
- , , , et al. Implementation of a medical emergency team in a large pediatric teaching hospital prevents respiratory and cardiopulmonary arrests outside the intensive care unit. Pediatr Crit Care Med. 2007;8(3):236–246; quiz 247.
- . Centile‐based Early Warning Scores derived from statistical distributions of vital signs. Resuscitation. 2011;82(8):969–970.
- , , , , , . Centile‐based early warning scores derived from statistical distributions of vital signs. Resuscitation. 2011;82(8):1013–1018.
- , , , , . Reduction of paediatric in‐patient cardiac arrest and death with a medical emergency team: preliminary results. Arch Dis Child. 2005;90(11):1148–1152.
The management of alarms in the hospital setting is a significant patient safety issue. In 2013, the Joint Commission issued Sentinel Event Alert #50 to draw attention to the fact that tens of thousands of alarms occur daily throughout individual hospitals, and 85% to 99% are false or not clinically actionable.[1] These alarms, designed to be a safety net in patient care, have the unintended consequence of causing provider desensitization, also known as alarm fatigue, which contributes to adverse events as severe as patient mortality.[1, 2] For this reason, a 2014 Joint Commission National Patient Safety Goal urged hospitals to prioritize alarm system safety and to develop policies and procedures to manage alarms and alarm fatigue.[3]
Multiple efforts have been made to address alarm fatigue in hospitalized adults. Studies have quantified the frequency and types of medical device alarms,[4, 5, 6, 7, 8, 9] and some proposed solutions to decrease excess alarms.[10, 11, 12, 13, 14, 15] One such solution is to change alarm limit settings, an intervention shown to be efficacious in the literature.[5, 6, 16, 17] Although no adverse patient outcomes are reported in these studies, none of them included a formal safety evaluation to evaluate whether alarm rate reduction occurred at the expense of clinically significant alarms.
Specific to pediatrics, frameworks to address alarm fatigue have been proposed,[18] and the relationship between nurse response time and frequency of exposure to nonactionable alarms has been reported.[19] However, efforts to address alarm fatigue in the pediatric setting are less well studied overall, and there is little guidance regarding optimization of pediatric alarm parameters. Although multiple established reference ranges exist for pediatric vital signs,[20, 21, 22] a systematic review in 2011 found that only 2 of 5 published heart rate (HR) and 6 respiratory rate (RR) guidelines cited any references, and even these had weak underpinning evidence.[23] Consequently, ranges defining normal pediatric vital signs are derived either from small sample observational data in healthy outpatient children or consensus opinion. In a 2013 study by Bonafide et al.,[24] charted vital sign data from hospitalized children were used to develop percentile curves for HR and RR, and from these it was estimated that 54% of vital sign measurements in hospitalized children are out of range using currently accepted normal vital sign parameters.[24] Although these calculated vital sign parameters were not implemented clinically, they called into question reference ranges that are currently widely accepted and used as parameters for electronic health record (EHR) alerts, early warning scoring systems, and physiologic monitor alarms.
With the goal of safely decreasing the number of out‐of‐range vital sign measurements that result from current, often nonevidence‐based pediatric vital sign reference ranges, we used data from noncritically ill pediatric inpatients to derive HR and RR percentile charts for hospitalized children. In anticipation of local implementation of these data‐driven vital sign ranges as physiologic monitor parameters, we performed a retrospective safety analysis by evaluating the effect of data‐driven alarm limit modification on identification of cardiorespiratory arrests (CRA) and rapid response team (RRT) activations.
METHODS
We performed a cross‐sectional study of children less than 18 years of age hospitalized on general medical and surgical units at Lucile Packard Children's Hospital Stanford, a 311‐bed quaternary‐care academic hospital with a full complement of pediatric medical and surgical subspecialties and transplant programs. During the study period, the hospital used the Cerner EHR (Millennium; Cerner, Kansas City, MO) and Philips IntelliVue bedside monitors (Koninklijke Philips N.V., Amsterdam, the Netherlands). The Stanford University Institutional Review Board approved this study.
Establishing Data‐Driven HR and RR Parameters
Vital sign documentation in the EHR at our institution is performed primarily by nurses and facilitated by bedside monitor biomedical device integration. We extracted vital signs data from the institution's EHR for all general medical and surgical patients discharged between January 1, 2013 and May 3, 2014. To be most conservative in the definition of normal vital sign ranges for pediatric inpatients, we excluded critically ill children (those who spent any part of their hospitalization in an intensive care unit [ICU]). Physiologically implausible vital sign values were excluded as per the methods of Bonafide et al.[24] The data were separated into 2 different sets: a training set (patients discharged between January 1, 2013 and December 31, 2013) and a test set for validation (patients discharged between January 1, 2014 and May 3, 2014). To avoid oversampling from both particular time periods and individual patients in the training set, we randomly selected 1 HR and RR pair from each 4‐hour interval during a hospitalization, and then randomly sampled a maximum of 10 HR and RR pairs per patient. Using these vital sign measurements, we calculated age‐stratified 1st, 5th, 10th, 50th, 90th, 95th, and 99th percentiles for both HR and RR.
Based on a combination of expert opinion and local consensus from our Medical Executive and Patient Safety Committees, we selected the 5th and 95th percentile values as proposed data‐driven parameter limits and compared them to the 5th and 95th percentile values generated in the 2013 study[24] and to the 2004 National Institutes of Health (NIH)adapted vital sign reference ranges currently used at our hospital.[25] Using 1 randomly selected HR and RR pair from every 4‐hour interval in the validation set, we compared the proportion of out‐of‐range HR and RR observations with the proposed 5th and 95th percentile data‐driven parameters versus the current NIH reference ranges. We also calculated average differences between our data‐driven 5th and 95th percentile values and the calculated HR and RR values in the 2013 study.[24]
Safety Analysis
To assess the safety of the newly created 5th and 95th percentile HR and RR parameters prior to clinical adoption, we retrospectively reviewed data associated with all RRT and CRA events on the hospital's medical/surgical units from March 4, 2013 until March 3, 2014. The RRT/CRA event data were obtained from logs kept by the hospital's code committee. We excluded events that lacked a documented patient identifier, occurred in locations other than the acute medical/surgical units, or occurred in patients >18 years old. The resulting charts were manually reviewed to determine the date and time of RRT or CRA event activation. Because evidence exists that hospitalized pediatric patients with CRA show signs of vital sign decompensation as early as 12 hours prior to the event,[26, 27, 28, 29] we extracted all EHR‐charted HR and RR data in the 12 hours preceding RRT and CRA events from the institution's clinical data warehouse for analysis, excluding patients without charted vital sign data in this time period. The sets of patients with any out‐of‐range HR or RR measurements in the 12‐hours prior to an event were compared according to the current NIH reference ranges[25] versus data‐driven parameters. Additionally, manual chart review was performed to assess the reason for code or RRT activation, and to determine the role that out‐of‐range vital signs played in alerting clinical staff of patient decompensation.
Statistical Analysis
All analysis was performed using R statistical package software (version 0.98.1062 for Mac OS X 10_9_5; The R Foundation for Statistical Computing, Vienna, Austria) with an SQL database (MySQL 2015; Oracle Corp., Redwood City, CA).
RESULTS
Data‐Driven HR and RR Parameters
We established a training set of 62,508 vital sign measurements for 7202 unique patients to calculate 1st, 5th, 10th, 50th, 90th, 95th, and 99th percentiles for HR and RR among the 14 age groups (see Supporting Information, Appendix 1, in the online version of this article). Figures 1 and 2 compare the proposed data‐driven vital sign ranges with (1) our current HR and RR reference ranges and (2) the 5th and 95th percentile values created in the similar 2013 study.[24] The greatest difference between our study and the 2013 study was across data‐driven 95th percentile RR parameters, which were an average of 4.8 points lower in our study.
Our validation set consisted of 82,993 vital sign measurements for 2287 unique patients. Application of data‐driven HR and RR 5th and 95th percentile limits resulted in 24,045 (55.6%) fewer out‐of‐range measurements compared to current NIH reference ranges (19,240 vs 43,285). Forty‐five percent fewer HR values and 61% fewer RR values were considered out of range using the proposed data‐driven parameters (see Supporting Information, Appendix 2, in the online version of this article).
Safety
Of the 218 unique out‐of‐ICU RRT and CRA events logged from March 4, 2013 to March 3, 2014, 63 patients were excluded from analysis: 10 lacked identifying information, 33 occurred outside of medical/surgical units, and 20 occurred in patients >18 years of age. The remaining 155 patient charts were reviewed. Seven patients were subsequently excluded because they lacked EHR‐documented vital signs data in the 12 hours prior to RRT or CRA team activation, yielding a cohort of 148 patients (128 RRT events, 20 CRA events).
Table 1 describes the analysis of vital signs in the 12 hours leading up to the 148 RRT and CRA events. All 121 patients with out‐of‐range HR values using NIH reference ranges also had out‐of‐range HR values with the proposed data‐driven parameters; an additional 8 patients had low HR values using the data‐driven parameters. Of the 137 patients with an out‐of‐range RR value using NIH reference ranges, 33 (24.1%) were not considered out of range by the data‐driven parameters. Of these, 28 had high RR and 5 had low RR according to NIH reference ranges.
| No. Patients With HR Out of Range* | No. Patients With RR Out of Range* | No. Patients With HR or RR Out of Range* | |
|---|---|---|---|
| |||
| NIH ranges | 121 | 137 | 144 |
| Data‐driven ranges | 129 | 104 | 138 |
| Difference (causal threshold) | +8 (low HR) | 28 (high RR), 5 (low RR) | +2 (low HR), 8 (high RR) |
After evaluating out‐of‐range HR and RR individually, the 148 RRT and CRA events were analyzed for either out‐of‐range HR values or RR values. In doing so, 144 (97.3%) patients had either HR or RR measurements that were considered out of range using our current NIH reference ranges. One hundred thirty‐eight (93.2%) had either HR or RR measurements that were considered out of range with the proposed parameters. One hundred thirty‐six (94.4%) of the 144 patients with out‐of‐range HR or RR measurements according to NIH reference ranges were also considered out of range using proposed parameters. The data‐driven parameters identified 2 additional patients with low HR who did not have out‐of‐range HR or RR values using the current NIH reference ranges. Manual chart review of the RRT/CRA events in the 8 patients who had normal HR or RR using the data‐driven parameters revealed that RRT or CRA team interventions occurred for clinical indications that did not rely upon HR or RR measurement (eg, laboratory testing abnormalities, desaturation events) (Table 2).
| Indication for event | Patient Age |
|---|---|
| |
| 1. Desaturation and apnea | 10 months |
| 2. Hyperammonemia (abnormal lab result) | 5 years |
| 3. Acute hematemesis | 16 years |
| 4. Lightheadedness, feeling faint | 17 years |
| 5. Desaturation with significant oxygen requirement | 17 years |
| 6. Desaturation with significant oxygen requirement | 17 years |
| 7. Patient stated difficulty breathing | 18 years |
| 8. Difficulty breathing (anaphylactic shock)* | 18 years |
DISCUSSION
This is the first published study to analyze the safety of implementing data‐driven HR and RR parameters in hospitalized children. Based on retrospective analysis of a 12‐month cohort of patients requiring RRT or CRA team activation, our data‐driven HR and RR parameters were at least as safe as the NIH‐published reference ranges employed at our children's hospital. In addition to maintaining sensitivity to RRT and CRA events, the data‐driven parameters resulted in an estimated 55.6% fewer out‐of‐range measurements among medical/surgical pediatric inpatients.
Improper alarm settings are 1 of 4 major contributing factors to reported alarm‐related events,[1] and data‐driven HR and RR parameters provide a means by which to address the Joint Commission Sentinel Event Alert[1] and National Patient Safety Goal[3] regarding alarm management safety for hospitalized pediatric patients. Our results suggest that this evidence‐based approach may reduce the frequency of false alarms (thereby mitigating alarm fatigue), and should be studied prospectively for implementation in the clinical setting.
The selection of percentile values to define the new data‐driven parameter ranges involved various considerations. In an effort to minimize alarm fatigue, we considered using the 1st and 99th percentile values. However, our Medical Executive and Patient Safety Committees determined that the 99th percentile values for HR and RR for many of the age groups exceeded those that would raise clinical concern. A more conservative approach, applying the 5th and 95th percentile values, was deemed clinically appropriate and consistent with recommendations from the only other study to calculate data‐driven HR and RR parameters for hospitalized children.[24]
When taken in total, Bonafide et al.'s 2013 study demonstrated that up to 54% of vital sign values were abnormal according to textbook reference ranges.[24] Similarly, we estimated 55.6% fewer out‐of‐range HR and RR measurements with our data‐driven parameters. Although our 5th and 95th HR percentile and 5th percentile RR values are strikingly similar to those developed in the 2013 study,[24] the difference in 95th percentile RR values between the studies was potentially clinically significant, with our data‐driven upper RR values being 4.8 breaths per minute lower (more conservative) on average. Bonafide et al. transformed the RR values to fit a normal distribution, which might account for this difference. Ultimately, our safety analysis demonstrated that 24% fewer patients were considered out of range for high RR prior to RRT/CRA events with the data‐driven parameters compared to NIH norms. Even fewer RRT/CRA patients would have been considered out of range per Bonafide's less conservative 95% RR limits.
Importantly, all 8 patients in our safety analysis without abnormal vital sign measurements in the 12 hours preceding their clinical events according to the proposed data‐driven parameters (but identified as having high RR per current reference ranges) had RRT or CRA events triggered due to other significant clinical manifestations or vital sign abnormalities (eg, hypoxia). This finding is supported by the literature, which suggests that RRTs are rarely activated due to single vital sign abnormality alone. Prior analysis of RRT activations in our pediatric hospital demonstrated that only approximately 10% of RRTs were activated primarily on the basis of HR or RR vital sign abnormalities (5.6% tachycardia, 2.8% tachypnea, 1.4% bradycardia), whereas 36% were activated due to respiratory distress.[30] The clinical relevance of high RR in isolation is questionable given a recent pediatric study that raised all RR limits and decreased alarm frequency without adverse patient safety consequences.[31] Our results suggest that modifying HR and RR alarm parameters using data‐driven 5th and 95th percentile limits to decrease alarm frequency does not pose additional safety risk related to identification of RRT and CRA events. We encourage continued work toward development of multivariate or smart alarms that analyze multiple simultaneous vital sign measurements and trends to determine whether an alarm should be triggered.[32, 33]
The ability to demonstrate the safety of data‐driven HR and RR parameters is a precursor to hospital‐wide implementation. We believe it is crucial to perform a safety analysis prior to implementation due to the role vital signs play in clinical assessment and detection of patient deterioration.[30, 34, 35, 36, 37] Though a few studies have shown that modification of alarm parameters decreases alarm frequency,[5, 6, 10, 16, 17] to our knowledge no formal safety evaluations have ever been published. This study provides the first published safety evaluation of data‐driven HR and RR parameters.
By decreasing the quantity of out‐of‐range vital sign values while preserving the ability to detect patient deterioration, data‐driven vital sign alarm limits have the potential to decrease false monitor alarms, alarm‐generated noise, and alarm fatigue. Future work includes prospectively studying the impact of adoption of data‐driven vital sign parameters on monitor alarm burden and monitoring the safety of the changes. Additional safety analysis could include comparing the sensitivity and specificity of early warning score systems when data‐driven vital sign ranges are substituted for traditional physiologic parameters. Further personalization of vital sign parameters will involve incorporating patient‐specific characteristics (eg, demographics, diagnoses) into the data‐driven analysis to further decrease alarm burden while enhancing patient safety. Ultimately, using a patient's own physiologic data to define highly personalized vital sign parameter limits represents a truly precision approach, and could revolutionize the way hospitalized patients are monitored.
Numerous relevant issues are not yet addressed in this initial, single‐institution study. First, although the biomedical device integration facilitated the direct import of monitor data into the EHR (decreasing transcription errors), our analysis was performed using EHR‐charted data. As such, the effect on bedside monitor alarms was not directly evaluated in our study, including those due to technical alarms or patient artifact. Second, our overall sample size for the training set was quite large; however, in some cases the number of patients per age category was limited. Third, although we evaluated the identification of severe deterioration leading to RRT or CRA events, the sensitivity of the new limits to the need for other interventions (eg, fluid bolus for dehydration or escalation of respiratory support for asthma exacerbation) or unplanned transfers to the ICU was not assessed. Fourth, the analysis was retrospective, and so the impact of data‐driven alarm limits on length of stay and readmission could not be defined. Fifth, excluding all vital sign measurements from patients who spent any time in the ICU setting decreased the amount of data available for analysis. However, excluding sicker patients probably resulted in narrower data‐driven HR and RR ranges, leading to more conservative proposed parameters that are more likely to identify patient decompensation in our safety analysis. Finally, this was a single‐site study. We believe our data‐driven limits are applicable to other tertiary or quaternary care facilities given the similarity to those generated in a study performed in a comparable setting,[24] but generalizability to other settings may be limited if the local population is sufficiently different. Furthermore, because institutional policies (eg, indications for care escalation) differ, individual institutions should determine whether our analysis is applicable to their setting or if local safety evaluation is necessary.
CONCLUSION
A large proportion of HR and RR values for hospitalized children at our institution are out of range according to current vital sign reference ranges. Our new data‐driven alarm parameters for hospitalized children provide a potentially safe means by which to modify physiologic bedside monitor alarm limits, a first step toward customization of alarm limit settings in an effort to mitigate alarm fatigue.
Acknowledgements
The authors thank Debby Huang and Joshua Glandorf in the Information Services Department at Stanford Children's Health for assistance with data acquisition. No compensation was received for their contributions.
Disclosures: All authors gave approval of the final manuscript version submitted for publication and agreed to be accountable for all aspects of the work. Dr. Veena V. Goel conceptualized and designed the study; collected, managed, analyzed and interpreted the data; prepared and reviewed the initial manuscript; and approved the final manuscript as submitted. Ms. Sarah F. Poole contributed to the design of the study and performed the primary data analysis for the study. Ms. Poole critically revised the manuscript for important intellectual content and approved the final manuscript as submitted. Dr. Goel and Ms. Poole had full access to all of the data in the study and take responsibility for the integrity of the data and the accuracy of the data analysis. Dr. Paul J. Sharek and Dr. Jonathan P. Palma contributed to the study design and data interpretation. Drs. Sharek and Palma critically revised the manuscript for important intellectual content and approved the final manuscript as submitted. Dr. Terry S. Platchek, Dr. Natalie M. Pageler, and Dr. Christopher A. Longhurst contributed to the study design. Drs. Platchek, Pageler, and Longhurst critically revised the manuscript for important intellectual content and approved the final manuscript as submitted. Ms. Poole is supported by the Stanford Biosciences Graduate Program through a Fulbright New Zealand Science and Innovation Graduate Award and through the J.R. Templin Trust Scholarship. The authors report no conflicts of interest.
- The Joint Commission. Medical device alarm safety in hospitals. Sentinel Event Alert. 2013;(50):1–3. Available at: https://www.jointcommission.org/sea_issue_50/. Accessed October 12, 2013.
- . “Alarm fatigue” a factor in 2d death: UMass hospital cited for violations. The Boston Globe. September 21, 2011. Available at: https://www.bostonglobe.com/2011/09/20/umass/qSOhm8dYmmaq4uTHZb7FNM/story.html. Accessed December 19, 2014
- The Joint Commission. Alarm system safety. Available at: https://www.jointcommission.org/assets/1/18/R3_Report_Issue_5_12_2_13_Final.pdf. Published December 11, 2013. Accessed October 12, 2013.
- , , , , . ALARMED: adverse events in low‐risk patients with chest pain receiving continuous electrocardiographic monitoring in the emergency department. A pilot study. Am J Emerg Med. 2006;24(1):62–67.
- , . Monitor alarm fatigue: standardizing use of physiological monitors and decreasing nuisance alarms. Am J Crit Care. 2010;19(1):28–34; quiz 35.
- , , . Physiologic monitoring alarm load on medical/surgical floors of a community hospital. Biomed Instrum Technol. 2011;(suppl):29–36.
- , , , , , . Multicentric study of monitoring alarms in the adult intensive care unit (ICU): a descriptive analysis. Intensive Care Med. 1999;25(12):1360–1366.
- . Crying wolf: false alarms in a pediatric intensive care unit. Crit Care Med. 1994;22(6):981–985.
- , , , et al. Cardiopulmonary monitors and clinically significant events in critically ill children. Biomed Instrum Technol. 2011;(suppl):38–45.
- , , , et al. Systematic review of physiologic monitor alarm characteristics and pragmatic interventions to reduce alarm frequency. J Hosp Med. 2016;11(2):136–144.
- . Alarm fatigue. Nurs Clin North Am. 2012;47(3):375–382.
- . Monitor alarm fatigue: an integrative review. Biomed Instrum Technol. 2012;46(4):268–277.
- , , , . Use of pagers with an alarm escalation system to reduce cardiac monitor alarm signals. J Nurs Care Qual. 2014;29(1):9–18.
- . An evidence‐based approach to reduce nuisance alarms and alarm fatigue. Biomed Instrum Technol. 2011;(suppl):46–52.
- , , , et al. Insights into the problem of alarm fatigue with physiologic monitor devices: a comprehensive observational study of consecutive intensive care unit patients. PLoS One. 2014;9(10):e110274.
- , , , , , . Effect of altering alarm settings: a randomized controlled study. Biomed Instrum Technol. 2015;49(3):214–222.
- , , , , . Alarm limit settings for early warning systems to identify at‐risk patients. J Adv Nurs. 2009;65(9):1844–1852.
- , . A framework for reducing alarm fatigue on pediatric inpatient units. Hosp Pediatr. 2015;5(3):160–163.
- , , , et al. Association between exposure to nonactionable physiologic monitor alarms and response time in a children's hospital. J Hosp Med. 2015;10(6):345–351.
- The Johns Hopkins Hospital, , . The Harriet Lane Handbook. 20th ed. Philadelphia, PA: Elsevier Saunders; 2014.
- , . Nelson Textbook of Pediatrics. 19th ed. Philadelphia, PA.: Elsevier Saunders; 2011.
- , , , . Pediatric assessment. In: Pediatric Advanced Life Support: Provider Manual. Dallas, TX: American Heart Association; 2006:9–16.
- , , , et al. Normal ranges of heart rate and respiratory rate in children from birth to 18 years of age: a systematic review of observational studies. Lancet. 2011;377(9770):1011–1018.
- , , , , , . Development of heart and respiratory rate percentile curves for hospitalized children. Pediatrics. 2013;131(4):e1150–e1157.
- National Institutes of Health. Age‐appropriate vital signs. Available at: https://web.archive.org/web/20041101222327/http://www.cc.nih.gov/ccc/pedweb/pedsstaff/age.html. Accessed July 26, 2015.
- Guidelines 2000 for cardiopulmonary resuscitation and emergency cardiovascular care. Part 9: pediatric basic life support. The American Heart Association in collaboration with the International Liaison Committee on Resuscitation. Circulation. 2000;102(8 suppl):I253–I290.
- , , , , , . Recognising clinical instability in hospital patients before cardiac arrest or unplanned admission to intensive care. A pilot study in a tertiary‐care hospital. Med J Aust. 1999;171(1):22–25.
- , , , et al. Duration of life‐threatening antecedents prior to intensive care admission. Intensive Care Med. 2002;28(11):1629–1634.
- , . Pediatric cardiopulmonary resuscitation: a collective review. Ann Emerg Med. 1999;33(2):195–205.
- , , , et al. Effect of a rapid response team on hospital‐wide mortality and code rates outside the ICU in a Children's Hospital. JAMA. 2007;298(19):2267–2274.
- , , , et al. A team‐based approach to reducing cardiac monitor alarms. Pediatrics. 2014;134(6):e1686–e1694.
- , , , et al. Collection of annotated data in a clinical validation study for alarm algorithms in intensive care—a methodologic framework. J Crit Care. 2010;25(1):128–135.
- , , . Making ICU alarms meaningful: a comparison of traditional vs. trend‐based algorithms. Proc AMIA Symp. 1999:379–383.
- , , , et al. Implementation of a medical emergency team in a large pediatric teaching hospital prevents respiratory and cardiopulmonary arrests outside the intensive care unit. Pediatr Crit Care Med. 2007;8(3):236–246; quiz 247.
- . Centile‐based Early Warning Scores derived from statistical distributions of vital signs. Resuscitation. 2011;82(8):969–970.
- , , , , , . Centile‐based early warning scores derived from statistical distributions of vital signs. Resuscitation. 2011;82(8):1013–1018.
- , , , , . Reduction of paediatric in‐patient cardiac arrest and death with a medical emergency team: preliminary results. Arch Dis Child. 2005;90(11):1148–1152.
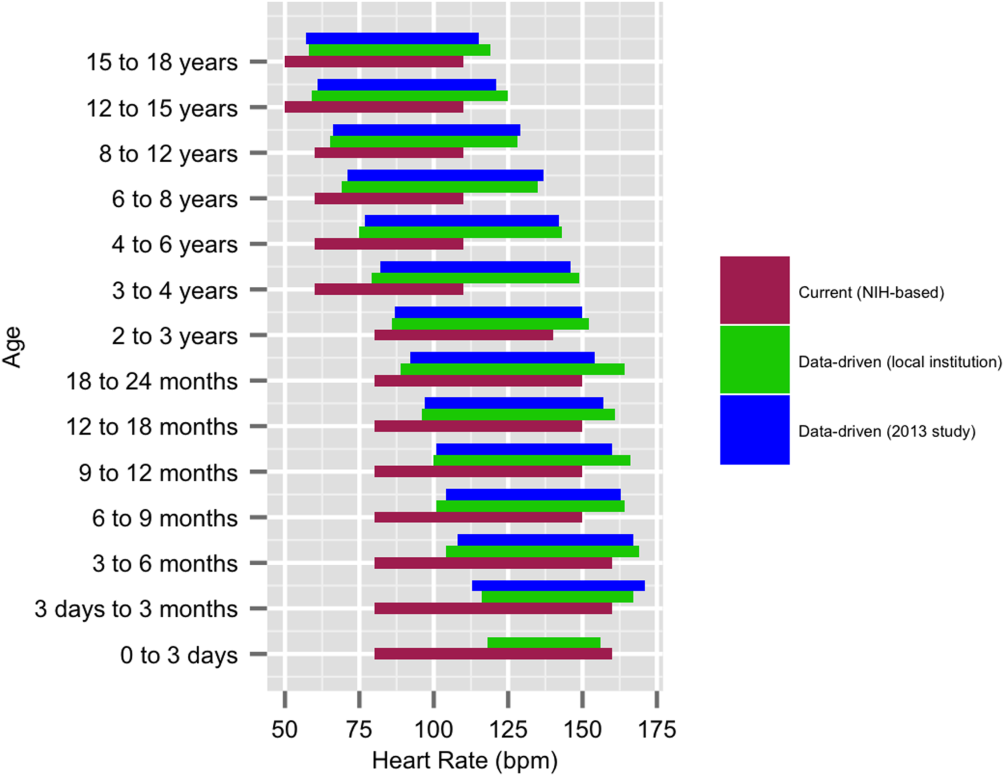
Clinical Outcomes of Anatomical Total Shoulder Arthroplasty in a Young, Active Population
Although total shoulder arthroplasty (TSA) has proved to be a reliable solution in older patients, treatment in younger patients with glenohumeral arthritis remains controversial, and there are still few reliable long-term surgical options.1-8 These options include abrasion arthroplasty and arthroscopic management,9,10 biologic glenoid resurfacing,11,12 and humeral hemiarthroplasty with13 or without14,15 glenoid treatment and anatomical TSA.
In the younger cohort, 20-year TSA survivorship rates up to 84% have been reported, and unsatisfactory subjective outcomes have been unacceptably high.16 In addition, there is a paucity of literature addressing the impact of TSA on return to sport. Recommendations on returning to an athletic life style are based largely on surveys of expert opinion17,18 and heterogeneous studies of either older patients (eg, age >50-55 years) who are active19-21 or younger patients with no defined level of activity.5,7,8,16,22-24
To our knowledge, no one has evaluated the short-term morbidity and clinical outcomes within a young, high-demand patient population, such as the US military. Therefore, we conducted a study to evaluate the clinical success and complications of TSA performed for glenohumeral arthritis in a young, active population. We hypothesized that patients who had undergone TSA would have a low rate of return to duty, an increased rate of component failure, and a higher reoperation rate because of increased upper extremity demands.
Materials and Methods
After obtaining protocol approval from the William Beaumont Army Medical Center Institutional Review Board, we searched the Military Health System (MHS) Management Analysis and Reporting Tool (M2) database to retrospectively review the cases of all tri-service US military service members who had undergone primary anatomical TSA (Current Procedural Terminology code 23472) between January 1, 2007 and June 31, 2014. This was a multisurgeon, multicenter study. Patient exclusion criteria were nonmilitary or retired status at time of surgery; primary surgery consisting of limited glenohumeral resurfacing procedure, hemiarthroplasty, or reverse TSA; surgery for acute proximal humerus fracture; rotator cuff deficiency diagnosed before or during surgery; and insufficient follow-up (eg, <12 months, unless medically separated beforehand).
The M2 database is an established tool that has been used for clinical outcomes research on treatment of a variety of orthopedic conditions.25,26 The Medical Data Repository, which is operated by MHS, is populated by its military healthcare providers. The MHS, which offers worldwide coverage for all beneficiaries either at Department of Defense facilities or purchased using civilian providers, is among the largest known closed healthcare systems.
All active-duty US military service members are uniformly required to adhere to stringent and regularly evaluated physical fitness standards, which typically exceed those of average civilians. Routine physical training is required in the form of aerobic fitness, weight training, tactical field exercises, and core military tasks, such as the ability to march at least 2 miles while carrying heavy fighting loads. In addition to satisfying required height and weight standards, all service members are subject to semiannual service-specific physical fitness evaluations inclusive of timed push-ups, sit-ups, and an aerobic event. Service members may also be required to maintain a level of physical training above these baseline standards, contingent on their branch of service, rank, and military occupational specialty. If a service member is unable to maintain these standards, medical separation may be initiated.
Demographic and occupational data were extracted from the database. These data included age, sex, military rank, and branch of service. Line-by-line analysis of the Armed Forces Health Longitudinal Technology Application (Version 22; 3M) electronic medical record was then performed to confirm the underlying diagnosis, surgical procedure, and surgery date. Further chart review yielded additional patient-based factors (eg, laterality, hand dominance, presence and type of prior shoulder surgeries) and surgical factors (eg, surgery indication, implant design). We evaluated clinical and functional outcomes as well as perioperative complications, including both major and minor systemic and local complications as previously described27,28; preoperative and postoperative range of motion (ROM) and self-reported pain score (SRPS, scale 1-10) as measured by physical therapist and surgeon at follow-up; secondary surgical interventions; timing of return to duty; and postoperative deployment history. The primary outcome measures were revision reoperation after index procedure, and military discharge for persistent shoulder-related disability. Clinical failure was defined as component failure or reoperation. Medical Evaluation Board (MEB) is a formal separation from the military in which it is deemed that a service member is no longer able to fulfill his or her duty because of a medical condition.
Statistical Analysis
Continuous variables were compared using statistical means with 95% confidence intervals (CIs) and/or SDs. Categorical data were reported as frequencies or percentages. Univariate analysis was performed to assess the correlation between possible risk factors and the primary outcome measures. P < .05 was considered statistically significant.
Results
Demographics
We identified 24 service members (26 shoulders) who had undergone anatomical TSA during the study period (Table 1). Mean (SD) age was 45.8 (4.5) years (range, 35-54 years), and the cohort was predominately male (25/26 shoulders; 96.2%). Most cohort members were of senior enlisted rank (14, 58.3%), and the US Army was the predominant branch of military service (13, 54.2%). The right side was the operative extremity in 7 cases (26.9%), and the dominant shoulder was involved in 6 cases (23.1%). Two patients (8.3%) underwent staged bilateral TSA. Most patients (76.9%) underwent TSA on the nondominant extremity.
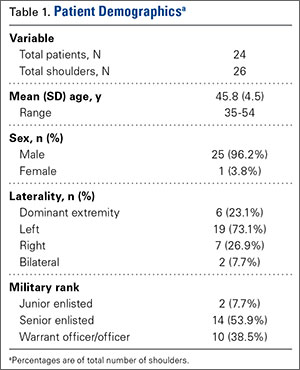
Surgical Variables
TSA was indicated for post-instability arthropathy in 13 cases (50.0%), posttraumatic osteoarthritis in 7 cases (26.9%), and unspecified glenohumeral arthritis, which includes primary glenohumeral osteoarthritis, in 5 cases (19.2%) (Table 2). One case was attributed to iatrogenically induced chondrolysis secondary to intra-articular lidocaine pump. Twelve patients (46.2%) had at least 1 previous surgery. Of the shoulders with instability, 10 (76.9%) had undergone a total of 14 surgical stabilization procedures—10 anterior labral repairs, 2 posterior labral repairs, and 2 capsular plications. The other shoulders had undergone a total of 18 procedures, which included 4 rotator cuff repairs and 3 cartilage restoration procedures.
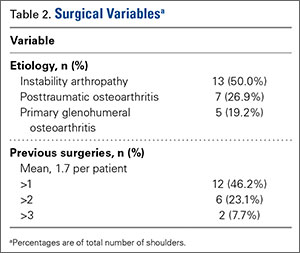
Clinical Outcomes
Mean (SD) follow-up was 41.0 (21.3) months (range, 11.6-97.6 months). All but 1 shoulder (96.2%) had follow-up of 12 months or more (the only patient with shorter follow-up was because of MEB), and 76.9% of patients had follow-up of 24 months or more (4 of the 6 patients with follow-up under 24 months were medically separated) (Table 3). In all cases, mean ROM improved with respect to flexion, abduction, and external rotation. At final follow-up, mean (SD) ROM was 138° (36°) forward flexion (range, 60°-180°), 125° (39°) abduction (range, 45°-180°), 48° (19°) external rotation at 0° abduction (range, 20°-90°), and 80° (9.4°) external rotation at 90° abduction (range, 70°-90°). Preoperative flexion, abduction, and external rotation at 0° and 90° abduction were all improved at final follow-up. The most improvement in ROM occurred within 6 months after surgery.
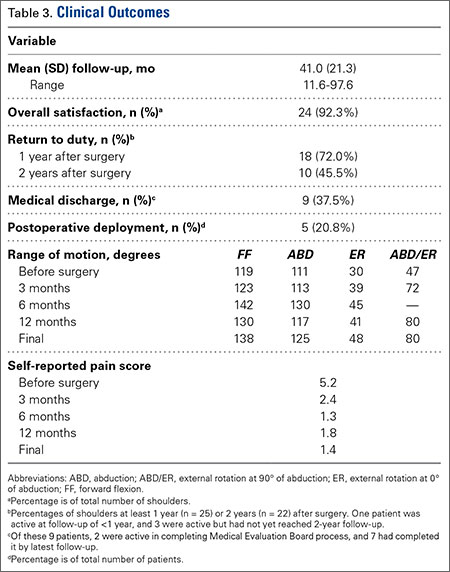
Overall patient satisfaction with surgery was 92.3% (n = 24). Ultimately, 18 (72.0%) of 25 shoulders with follow-up of 1 year or more were able to return to active duty within 1 year after surgery, though only 10 (45.5%) of 22 with follow-up of 2 years or more remained active 2 years after surgery. Furthermore, 5 patients (20.8%) were deployed after surgery, and all were still on active duty at final follow-up. By final follow-up, 9 (37.5%) of 24 service members were unable to return to military function; 7 had been medically discharged from the military for persistent shoulder disability, and 2 were in the process of being medically discharged.
In all cases, SRPS improved from before surgery (5.2 out of 10) to final follow-up (1.4). At final follow-up, 22 patients (88.0%) reported mild pain (0-3), and no one had pain above 6.
Complications
Nine patients had a total of 12 postoperative complications (46.2%): 6 component failures (23.1%), 2 neurologic injuries (7.7%; 1 permanent axillary nerve injury, 1 transient brachial plexus neuritis), 2 cases of adhesive capsulitis (7.7%), and 2 episodes of venous thrombosis (7.7%; 1 superficial, 1 deep) (Table 4). There were no documented infections. Six reoperations (23.1%) were performed for the 6 component failures (2 traumatic dislocations of prosthesis resulting in acute glenoid component failure, 3 cases of atraumatic glenoid loosening, 1 case of humeral stem loosening after periprosthetic fracture). Atraumatic glenoid component loosening occurred a mean (SD) of 40.6 (14.2) months after surgery (range, 20.8-54.2 months).
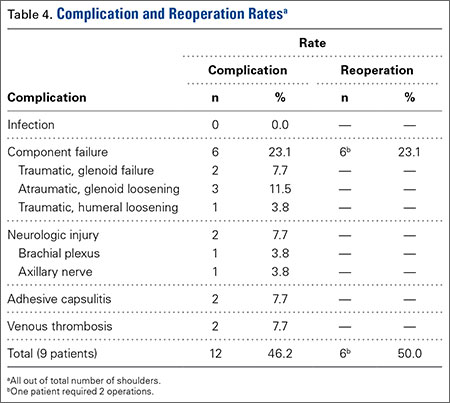
Surgical Failures
Eight service members underwent MEB. Six patients experienced component failure. Factors contributing to both clinical failure and separation from active duty by means of MEB were evaluated with univariate analysis (Table 5). No statistically significant risk factors, including surgical revision and presence of perioperative complications, were identified.
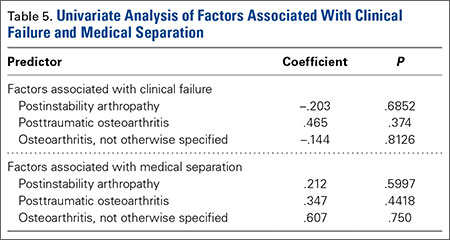
Discussion
We confirmed that our cohort of young service members (mean age, 45.8 years), who had undergone TSA for glenohumeral arthritis, had a relatively higher rate of component failure (23.1%) and a higher reoperation rate (23.1%) with low rates of return to military duty at short-term to midterm follow-up. Our results parallel those of a limited series with a younger cohort (Table 6).7,16,19,21,23,24 The high demand and increased life expectancy of the younger patients with glenohumeral arthritis potentiates the risk of complications, component loosening, and ultimate failure.29 To our knowledge, the present article is the first to report clinical and functional outcomes and perioperative risk profiles in a homogenously young, active military cohort after TSA.
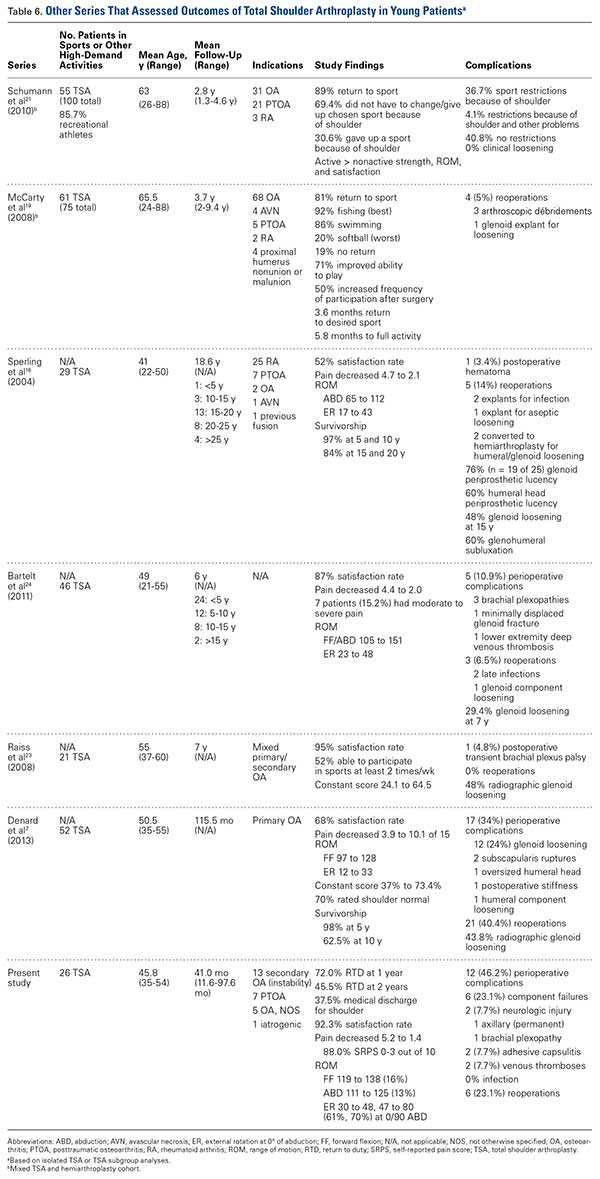
The mean age of our study population (46 years) is one of the lowest in the literature. TSA in younger patients (age, <50-55 years) and older, active patients (>55 years) has received increased attention as a result of the expanding indications and growing popularity of TSA in these groups. Other studies have upheld the efficacy of TSA in achieving predictable pain relief and functional improvement in a diverse and predominantly elderly population.15,30-34 Alternative treatments, including humeral head resurfacing15,30,35 and soft-tissue interposition,15,36-40 have also shown inferior short- and long-term results in terms of longevity and degree of clinical or functional improvement.31-34,41 In addition, the ream-and-run technique has had promising early results by improving glenohumeral kinematics, pain relief, and shoulder function.13,42,43 However, although implantation of a glenoid component is avoided in young, active people because of reduced longevity and higher rates of component failure, the trade-offs are inadequately treated glenoid disease, suboptimal pain relief, and progression of glenoid arthritis eventually requiring revision. Furthermore, midterm and long-term survivorship of TSA in general is unknown, and there remain few good options for treating end-stage arthritis in young, active patients.
Our cohort had high rates of complications (46.2%) and revisions (23.1%). Two in 5 patients had postoperative complications, most commonly component failure resulting in reoperation. In the literature, complication rates among young patients who underwent TSA are much lower (4.8%-10.9%).16,23,24 Our cohort’s most common complication was component failure (23.1%), which was most often attributed to atraumatic, aseptic glenoid component loosening and required reoperation. Previously reported revision rates in a young population that underwent TSA (0%-11%)16,23,24 were also significantly lower than those in the present analysis (23.1%), underscoring the impact of operative indications, postoperative activity levels, and occupational demands on ultimate failure rates. Interestingly, all revisions in our study were for component failure, whereas previous reports have described a higher rate for infection.22 However, the same studies also found glenoid lucency rates as high as 76% at 10-year follow-up.16 Furthermore, in a review of 136 TSAs with unsatisfactory outcomes, glenoid loosening was the most common reason for presenting to clinic after surgery.44 Specifically, our population had a high rate of glenohumeral arthritis secondary to instability (50.0%) and posttraumatic osteoarthritis (26.9%). For many reasons, outcomes were worse in younger patients with a history of glenohumeral instability33 than in older patients without a high incidence of instability.45 This young cohort with higher demands may have had accelerated polyethylene wear patterns caused by repetitive overhead activity, which may have arisen because of a higher functional profile after surgery and greater patient expectations after arthroplasty. In addition, patients with a history of instability may have altered glenohumeral anatomy, especially with previous arthroscopic or open stabilization procedures. Anatomical changes include excessive posterior glenoid wear, internal rotation contracture, patulous capsular tissue, static or dynamic posterior humeral subluxation, and possible overconstraint after prior stabilization procedures. Almost half of our population had a previous surgery; our patients averaged 1.7 previous surgeries each.
Although estimates of component survivorship at a high-volume civilian tertiary-referral center were as high as 97% at 10 years and 84% at 20 years,7,16 10-year survivorship in patients with a history of instability was only 61%.3 TSA survivorship in our young, active cohort is already foreseeably dramatically reduced, given the 23.1% revision rate at 28.5-month follow-up. This consideration must be addressed during preoperative counseling with the young patient with glenohumeral arthritis and a history of shoulder instability.
Despite the high rates of complications and revisions in our study, 92.3% of patients were satisfied with surgery, 88.0% experienced minimal persistence of pain (mean 3.8-point decrease on SRPS), and 100% maintained improved ROM at final follow-up. Satisfaction in the young population has varied significantly, from 52% to 95%, generally on the basis of physical activity.16,22-24 The reasonable rate of postoperative satisfaction in the present analysis is comparable to what has been reported in patients of a similar age (Table 6).7,16,22 However, despite high satisfaction and pain relief, patients were inconsistently able to return to the upper limits of physical activity required of active-duty military service. In addition, we cannot exclude secondary gain motivations for pursuing medical retirement, similar to that seen in patients receiving worker’s compensation.
Other authors have conversely found more favorable functional outcomes and survivorship rates.23,24 In a retrospective review of 46 TSAs in patients 55 years or younger, Bartelt and colleagues24 found sustained improvements in pain, ROM, and satisfaction at 7-year follow-up.24 Raiss and colleagues23 conducted a prospective study of TSA outcomes in 21 patients with a mean age of 55 years and a mean follow-up of 7 years and reported no revisions and only 1 minor complication, a transient brachial plexus palsy.23 The discrepancy between these studies may reflect different activity levels and underlying pathology between cohorts. The present population is unique in that it represents a particularly difficult confluence of factors for shoulder arthroplasty surgeons. The high activity, significant overhead and lifting occupational demands, and discordant patient expectations of this military cohort place a significant functional burden on the implants, the glenoid component in particular. Furthermore, this patient group has a higher incidence of more complex glenohumeral pathology resulting in instability, posttraumatic, or capsulorrhaphy arthropathy, and multiple prior arthroscopic and open stabilization procedures.
At final follow-up, only 33% of our patients were still on activity duty, 37.5% had completed or were completing medical separation from the military after surgery for persistent shoulder disability, and 37.5% were retired from the military. Five patients (20.8%) deployed after surgery. This young, active cohort of service members who had TSA for glenohumeral arthritis faced a unique set of tremendous physical demands. A retrospective case series investigated return to sport in 100 consecutive patients (mean age, 68.9 years) who were participating in recreational and competitive athletics and underwent unilateral TSA.21 The patients were engaged most commonly in swimming (20.4%), golf (16.3%), cycling (16.3%), and fitness training (16.3%). The authors found that, at a mean follow-up of 2.8 years, 49 patients (89%) were able to continue in sports, though 36.7% thought their sport activity was restricted after TSA. In another retrospective case series (61 TSAs), McCarty and colleagues19 found that 48 patients (71%) were improved in their sports participation, and 50% increased their frequency of participation after surgery.
There are no specific recommendations on returning to military service or high-level sport after surgery. Recommendations on returning to sport after TSA have been based largely on small case series involving specific sports46,47 and surveys of expert opinion.17,18 In a survey on postoperative physical activity in young patients after TSA conducted by Healy and colleagues,17 35 American Shoulder and Elbow Surgeons members recommended avoiding contact and impact sports while permitting return to nonimpact sports, such as swimming, which may still impart significant stress to the glenohumeral joint. In an international survey of 101 shoulder and elbow surgeons, Magnussen and colleagues18 also found that most recommended avoiding a return to impact sports that require intensive upper extremity demands and permitting full return to sports at preoperative levels. This likely is a result of the perception that most of these patients having TSA are older and have less rigorous involvement in sports at the outset and a lower propensity for adverse patient outcomes. However, these recommendations may place a younger, more high-demand patient at significantly greater risk. The active-duty cohort engages in daily physical training, including push-ups and frequent overhead lifting, which could account for the high failure rates and low incidence of postoperative deployment. Although TSA seems to demonstrate good initial results in terms of return to high-demand activities, the return-to-duty profile in our study highlights the potential pitfalls of TSA in active individuals attempting to return to high-demand preoperative function.
Our analysis was limited by the fact that we used a small patient cohort, contributing to underpowered analysis of the potential risk factors predictive of reoperation and medical discharge. Although our minimum follow-up was 12 months, with the exception of 1 patient who was medically separated at 11.6 months because of shoulder disability, we captured 5 patients (19.2%) who underwent medical separation but who would otherwise be excluded. Therefore, this limitation is not major in that, with a longer minimum follow-up, we would be excluding a significant number of patients with such persistent disability after TSA that they would not be able to return to duty at anywhere near their previous level. In this retrospective study, we were additionally limited to analysis of the data in the medical records and could not control for variables such as surgeon technique, implant choice, and experience. Complete radiographic images were not available, limiting analysis of radiographic outcomes. Given the lack of a standardized preoperative imaging protocol, we could not evaluate glenoid version on axial imaging. It is possible that some patients with early aseptic glenoid loosening had posterior subluxation or a Walch B2 glenoid, which has a higher failure rate.48 The strengths of this study include its unique analysis of a homogeneous young, active, high-risk patient cohort within a closed healthcare system. In the military, these patients are subject to intense daily physical and occupational demands. In addition, the clinical and functional outcomes we studied are patient-centered and therefore relevant during preoperative counseling. Further investigations might focus on validated outcome measures and on midterm to long-term TSA outcomes in an active military population vis-à-vis other alternatives for clinical management.
Conclusion
By a mean follow-up of 3.5 years, only a third of the service members had returned to active duty, roughly a third had retired, and more than a third had been medically discharged because of persistent disability attributable to the shoulder. Despite initial improvements in ROM and pain, midterm outcomes were poor. The short-term complication rate (46.2%) and the rate of reoperation for component failure (23.1%) should be emphasized during preoperative counseling.
1. Tokish JM. The mature athlete’s shoulder. Sports Health. 2014;6(1):31-35.
2. Sperling JW, Cofield RH. Revision total shoulder arthroplasty for the treatment of glenoid arthrosis. J Bone Joint Surg Am. 1998;80(6):860-867.
3. Sperling JW, Antuna SA, Sanchez-Sotelo J, Schleck C, Cofield RH. Shoulder arthroplasty for arthritis after instability surgery. J Bone Joint Surg Am. 2002;84(10):1775-1781.
4. Izquierdo R, Voloshin I, Edwards S, et al; American Academy of Orthopaedic Surgeons. Treatment of glenohumeral osteoarthritis. J Am Acad Orthop Surg. 2010;18(6):375-382.
5. Johnson MH, Paxton ES, Green A. Shoulder arthroplasty options in young (<50 years old) patients: review of current concepts. J Shoulder Elbow Surg. 2015;24(2):317-325.
6. Cole BJ, Yanke A, Provencher MT. Nonarthroplasty alternatives for the treatment of glenohumeral arthritis. J Shoulder Elbow Surg. 2007;16(5 suppl):S231-S240.
7. Denard PJ, Raiss P, Sowa B, Walch G. Mid- to long-term follow-up of total shoulder arthroplasty using a keeled glenoid in young adults with primary glenohumeral arthritis. J Shoulder Elbow Surg. 2013;22(7):894-900.
8. Denard PJ, Wirth MA, Orfaly RM. Management of glenohumeral arthritis in the young adult. J Bone Joint Surg Am. 2011;93(9):885-892.
9. Millett PJ, Horan MP, Pennock AT, Rios D. Comprehensive arthroscopic management (CAM) procedure: clinical results of a joint-preserving arthroscopic treatment for young, active patients with advanced shoulder osteoarthritis. Arthroscopy. 2013;29(3):440-448.
10 Millett PJ, Gaskill TR. Arthroscopic management of glenohumeral arthrosis: humeral osteoplasty, capsular release, and arthroscopic axillary nerve release as a joint-preserving approach. Arthroscopy. 2011;27(9):1296-1303.
11. Savoie FH 3rd, Brislin KJ, Argo D. Arthroscopic glenoid resurfacing as a surgical treatment for glenohumeral arthritis in the young patient: midterm results. Arthroscopy. 2009;25(8):864-871.
12. Strauss EJ, Verma NN, Salata MJ, et al. The high failure rate of biologic resurfacing of the glenoid in young patients with glenohumeral arthritis. J Shoulder Elbow Surg. 2014;23(3):409-419.
13. Matsen FA 3rd, Warme WJ, Jackins SE. Can the ream and run procedure improve glenohumeral relationships and function for shoulders with the arthritic triad? Clin Orthop Relat Res. 2015;473(6):2088-2096.
14. Lo IK, Litchfield RB, Griffin S, Faber K, Patterson SD, Kirkley A. Quality-of-life outcome following hemiarthroplasty or total shoulder arthroplasty in patients with osteoarthritis. A prospective, randomized trial. J Bone Joint Surg Am. 2005;87(10):2178-2185.
15. Wirth M, Tapscott RS, Southworth C, Rockwood CA Jr. Treatment of glenohumeral arthritis with a hemiarthroplasty: a minimum five-year follow-up outcome study. J Bone Joint Surg Am. 2006;88(5):964-973.
16. Sperling JW, Cofield RH, Rowland CM. Minimum fifteen-year follow-up of Neer hemiarthroplasty and total shoulder arthroplasty in patients aged fifty years or younger. J Shoulder Elbow Surg. 2004;13(6):604-613.
17. Healy WL, Iorio R, Lemos MJ. Athletic activity after joint replacement. Am J Sports Med. 2001;29(3):377-388.
18. Magnussen RA, Mallon WJ, Willems WJ, Moorman CT 3rd. Long-term activity restrictions after shoulder arthroplasty: an international survey of experienced shoulder surgeons. J Shoulder Elbow Surg. 2011;20(2):281-289.
19. McCarty EC, Marx RG, Maerz D, Altchek D, Warren RF. Sports participation after shoulder replacement surgery. Am J Sports Med. 2008;36(8):1577-1581.
20. Schmidt-Wiethoff R, Wolf P, Lehmann M, Habermeyer P. Physical activity after shoulder arthroplasty [in German]. Sportverletz Sportschaden. 2002;16(1):26-30.
21. Schumann K, Flury MP, Schwyzer HK, Simmen BR, Drerup S, Goldhahn J. Sports activity after anatomical total shoulder arthroplasty. Am J Sports Med. 2010;38(10):2097-2105.
22. Sperling JW, Cofield RH, Rowland CM. Neer hemiarthroplasty and Neer total shoulder arthroplasty in patients fifty years old or less. Long-term results. J Bone Joint Surg Am. 1998;80(4):464-473.
23. Raiss P, Aldinger PR, Kasten P, Rickert M, Loew M. Total shoulder replacement in young and middle-aged patients with glenohumeral osteoarthritis. J Bone Joint Surg Br. 2008;90(6):764-769.
24. Bartelt R, Sperling JW, Schleck CD, Cofield RH. Shoulder arthroplasty in patients aged fifty-five years or younger with osteoarthritis. J Shoulder Elbow Surg. 2011;20(1):123-130.
25. Waterman BR, Burns TC, McCriskin B, Kilcoyne K, Cameron KL, Owens BD. Outcomes after Bankart repair in a military population: predictors for surgical revision and long-term disability. Arthroscopy. 2014;30(2):172-177.
26. Waterman BR, Liu J, Newcomb R, Schoenfeld AJ, Orr JD, Belmont PJ Jr. Risk factors for chronic exertional compartment syndrome in a physically active military population. Am J Sports Med. 2013;41(11):2545-2549.
27. Chalmers PN, Gupta AK, Rahman Z, Bruce B, Romeo AA, Nicholson GP. Predictors of early complications of total shoulder arthroplasty. J Arthroplasty. 2014;29(4):856-860.
28. Dunn JC, Lanzi J, Kusnezov N, Bader J, Waterman BR, Belmont PJ Jr. Predictors of length of stay after elective total shoulder arthroplasty in the United States. J Shoulder Elbow Surg. 2015;24(5):754-759.
29. Hayes PR, Flatow EL. Total shoulder arthroplasty in the young patient. Instr Course Lect. 2001;50;73-88.
30. Rispoli DM, Sperling JW, Athwal GS, Schleck CD, Cofield RH. Humeral head replacement for the treatment of osteoarthritis. J Bone Joint Surg Am. 2006;88(12):2637-2644.
31. Radnay CS, Setter KJ, Chambers L, Levine WN, Bigliani LU, Ahmad CS. Total shoulder replacement compared with humeral head replacement for the treatment of primary glenohumeral osteoarthritis: a systematic review. J Shoulder Elbow Surg. 2007;16(4):396-402.
32. Gartsman GM, Roddey TS, Hammerman SM. Shoulder arthroplasty with or without resurfacing of the glenoid in patients who have osteoarthritis. J Bone Joint Surg Am. 2000;82(1):26-34.
33. Edwards TB, Kadakia NR, Boulahia A, et al. A comparison of hemiarthroplasty and total shoulder arthroplasty in the treatment of primary glenohumeral osteoarthritis: results of a multicenter study. J Shoulder Elbow Surg. 2003;12(3):
207-213.
34. Bryant D, Litchfield R, Sandow M, Gartsman GM, Guyatt G, Kirkley A. A comparison of pain, strength, range of motion, and functional outcomes after hemiarthroplasty and total shoulder arthroplasty in patients with osteoarthritis of the shoulder. A systematic review and meta-analysis. J Bone Joint Surg Am. 2005;87(9):1947-1956.
35. Bailie DS, Llinas PJ, Ellenbecker TS. Cementless humeral resurfacing arthroplasty in active patients less than fifty-five years of age. J Bone Joint Surg Am. 2008;90(1):110-117.
36. Ball CM, Galatz LM, Yamaguchi K. Meniscal allograft interposition arthroplasty for the arthritic shoulder: description of a new surgical technique. Tech Shoulder Elbow Surg. 2001;2:247-254.
37. Elhassan B, Ozbaydar M, Diller D, Higgins LD, Warner JJ. Soft-tissue resurfacing of the glenoid in the treatment of glenohumeral arthritis in active patients less than fifty years old. J Bone Joint Surg Am. 2009;91(2):419-424.
38. Krishnan SG, Nowinski RJ, Harrison D, Burkhead WZ. Humeral hemiarthroplasty with biologic resurfacing of the glenoid for glenohumeral arthritis. Two to fifteen-year outcomes. J Bone Joint Surg Am. 2007;89(4):727-734.
39. Lee KT, Bell S, Salmon J. Cementless surface replacement arthroplasty of the shoulder with biologic resurfacing of the glenoid. J Shoulder Elbow Surg. 2009;18(6):915-919.
40. Nicholson GP, Goldstein JL, Romeo AA, et al. Lateral meniscus allograft biologic glenoid arthroplasty in total shoulder arthroplasty for young shoulders with degenerative joint disease. J Shoulder Elbow Surg. 2007;16(5 suppl):S261-S266.
41. Carroll RM, Izquierdo R, Vazquez M, Blaine TA, Levine WN, Bigliani LU. Conversion of painful hemiarthroplasty to total shoulder arthroplasty: long-term results. J Shoulder Elbow Surg. 2004;13(6):599-603.
42. Clinton J, Franta AK, Lenters TR, Mounce D, Matsen FA 3rd. Nonprosthetic glenoid arthroplasty with humeral hemiarthroplasty and total shoulder arthroplasty yield similar self-assessed outcomes in the management of comparable patients with glenohumeral arthritis. J Shoulder Elbow Surg. 2007;16(5):534-538.
43. Gilmer BB, Comstock BA, Jette JL, Warme WJ, Jackins SE, Matsen FA. The prognosis for improvement in comfort and function after the ream-and-run arthroplasty for glenohumeral arthritis: an analysis of 176 consecutive cases. J Bone Joint Surg Am. 2012;94(14):e102.
44. Franta AK, Lenters TR, Mounce D, Neradilek B, Matsen FA 3rd. The complex characteristics of 282 unsatisfactory shoulder arthroplasties. J Shoulder Elbow Surg. 2007;16(5):555-562.
45. Godenèche A, Boileau P, Favard L, et al. Prosthetic replacement in the treatment of osteoarthritis of the shoulder: early results of 268 cases. J Shoulder Elbow Surg. 2002;11(1):11-18.
46. Jensen KL, Rockwood CA Jr. Shoulder arthroplasty in recreational golfers. J Shoulder Elbow Surg. 1998;7(4):362-367.
47. Kirchhoff C, Imhoff AB, Hinterwimmer S. Winter sports and shoulder arthroplasty [in German]. Sportverletz Sportschaden. 2008;22(3):153-158.
48. Raiss P, Edwards TB, Deutsch A, et al. Radiographic changes around humeral components in shoulder arthroplasty. J Bone Joint Surg Am. 2014;96(7):e54.
Although total shoulder arthroplasty (TSA) has proved to be a reliable solution in older patients, treatment in younger patients with glenohumeral arthritis remains controversial, and there are still few reliable long-term surgical options.1-8 These options include abrasion arthroplasty and arthroscopic management,9,10 biologic glenoid resurfacing,11,12 and humeral hemiarthroplasty with13 or without14,15 glenoid treatment and anatomical TSA.
In the younger cohort, 20-year TSA survivorship rates up to 84% have been reported, and unsatisfactory subjective outcomes have been unacceptably high.16 In addition, there is a paucity of literature addressing the impact of TSA on return to sport. Recommendations on returning to an athletic life style are based largely on surveys of expert opinion17,18 and heterogeneous studies of either older patients (eg, age >50-55 years) who are active19-21 or younger patients with no defined level of activity.5,7,8,16,22-24
To our knowledge, no one has evaluated the short-term morbidity and clinical outcomes within a young, high-demand patient population, such as the US military. Therefore, we conducted a study to evaluate the clinical success and complications of TSA performed for glenohumeral arthritis in a young, active population. We hypothesized that patients who had undergone TSA would have a low rate of return to duty, an increased rate of component failure, and a higher reoperation rate because of increased upper extremity demands.
Materials and Methods
After obtaining protocol approval from the William Beaumont Army Medical Center Institutional Review Board, we searched the Military Health System (MHS) Management Analysis and Reporting Tool (M2) database to retrospectively review the cases of all tri-service US military service members who had undergone primary anatomical TSA (Current Procedural Terminology code 23472) between January 1, 2007 and June 31, 2014. This was a multisurgeon, multicenter study. Patient exclusion criteria were nonmilitary or retired status at time of surgery; primary surgery consisting of limited glenohumeral resurfacing procedure, hemiarthroplasty, or reverse TSA; surgery for acute proximal humerus fracture; rotator cuff deficiency diagnosed before or during surgery; and insufficient follow-up (eg, <12 months, unless medically separated beforehand).
The M2 database is an established tool that has been used for clinical outcomes research on treatment of a variety of orthopedic conditions.25,26 The Medical Data Repository, which is operated by MHS, is populated by its military healthcare providers. The MHS, which offers worldwide coverage for all beneficiaries either at Department of Defense facilities or purchased using civilian providers, is among the largest known closed healthcare systems.
All active-duty US military service members are uniformly required to adhere to stringent and regularly evaluated physical fitness standards, which typically exceed those of average civilians. Routine physical training is required in the form of aerobic fitness, weight training, tactical field exercises, and core military tasks, such as the ability to march at least 2 miles while carrying heavy fighting loads. In addition to satisfying required height and weight standards, all service members are subject to semiannual service-specific physical fitness evaluations inclusive of timed push-ups, sit-ups, and an aerobic event. Service members may also be required to maintain a level of physical training above these baseline standards, contingent on their branch of service, rank, and military occupational specialty. If a service member is unable to maintain these standards, medical separation may be initiated.
Demographic and occupational data were extracted from the database. These data included age, sex, military rank, and branch of service. Line-by-line analysis of the Armed Forces Health Longitudinal Technology Application (Version 22; 3M) electronic medical record was then performed to confirm the underlying diagnosis, surgical procedure, and surgery date. Further chart review yielded additional patient-based factors (eg, laterality, hand dominance, presence and type of prior shoulder surgeries) and surgical factors (eg, surgery indication, implant design). We evaluated clinical and functional outcomes as well as perioperative complications, including both major and minor systemic and local complications as previously described27,28; preoperative and postoperative range of motion (ROM) and self-reported pain score (SRPS, scale 1-10) as measured by physical therapist and surgeon at follow-up; secondary surgical interventions; timing of return to duty; and postoperative deployment history. The primary outcome measures were revision reoperation after index procedure, and military discharge for persistent shoulder-related disability. Clinical failure was defined as component failure or reoperation. Medical Evaluation Board (MEB) is a formal separation from the military in which it is deemed that a service member is no longer able to fulfill his or her duty because of a medical condition.
Statistical Analysis
Continuous variables were compared using statistical means with 95% confidence intervals (CIs) and/or SDs. Categorical data were reported as frequencies or percentages. Univariate analysis was performed to assess the correlation between possible risk factors and the primary outcome measures. P < .05 was considered statistically significant.
Results
Demographics
We identified 24 service members (26 shoulders) who had undergone anatomical TSA during the study period (Table 1). Mean (SD) age was 45.8 (4.5) years (range, 35-54 years), and the cohort was predominately male (25/26 shoulders; 96.2%). Most cohort members were of senior enlisted rank (14, 58.3%), and the US Army was the predominant branch of military service (13, 54.2%). The right side was the operative extremity in 7 cases (26.9%), and the dominant shoulder was involved in 6 cases (23.1%). Two patients (8.3%) underwent staged bilateral TSA. Most patients (76.9%) underwent TSA on the nondominant extremity.
Surgical Variables
TSA was indicated for post-instability arthropathy in 13 cases (50.0%), posttraumatic osteoarthritis in 7 cases (26.9%), and unspecified glenohumeral arthritis, which includes primary glenohumeral osteoarthritis, in 5 cases (19.2%) (Table 2). One case was attributed to iatrogenically induced chondrolysis secondary to intra-articular lidocaine pump. Twelve patients (46.2%) had at least 1 previous surgery. Of the shoulders with instability, 10 (76.9%) had undergone a total of 14 surgical stabilization procedures—10 anterior labral repairs, 2 posterior labral repairs, and 2 capsular plications. The other shoulders had undergone a total of 18 procedures, which included 4 rotator cuff repairs and 3 cartilage restoration procedures.
Clinical Outcomes
Mean (SD) follow-up was 41.0 (21.3) months (range, 11.6-97.6 months). All but 1 shoulder (96.2%) had follow-up of 12 months or more (the only patient with shorter follow-up was because of MEB), and 76.9% of patients had follow-up of 24 months or more (4 of the 6 patients with follow-up under 24 months were medically separated) (Table 3). In all cases, mean ROM improved with respect to flexion, abduction, and external rotation. At final follow-up, mean (SD) ROM was 138° (36°) forward flexion (range, 60°-180°), 125° (39°) abduction (range, 45°-180°), 48° (19°) external rotation at 0° abduction (range, 20°-90°), and 80° (9.4°) external rotation at 90° abduction (range, 70°-90°). Preoperative flexion, abduction, and external rotation at 0° and 90° abduction were all improved at final follow-up. The most improvement in ROM occurred within 6 months after surgery.
Overall patient satisfaction with surgery was 92.3% (n = 24). Ultimately, 18 (72.0%) of 25 shoulders with follow-up of 1 year or more were able to return to active duty within 1 year after surgery, though only 10 (45.5%) of 22 with follow-up of 2 years or more remained active 2 years after surgery. Furthermore, 5 patients (20.8%) were deployed after surgery, and all were still on active duty at final follow-up. By final follow-up, 9 (37.5%) of 24 service members were unable to return to military function; 7 had been medically discharged from the military for persistent shoulder disability, and 2 were in the process of being medically discharged.
In all cases, SRPS improved from before surgery (5.2 out of 10) to final follow-up (1.4). At final follow-up, 22 patients (88.0%) reported mild pain (0-3), and no one had pain above 6.
Complications
Nine patients had a total of 12 postoperative complications (46.2%): 6 component failures (23.1%), 2 neurologic injuries (7.7%; 1 permanent axillary nerve injury, 1 transient brachial plexus neuritis), 2 cases of adhesive capsulitis (7.7%), and 2 episodes of venous thrombosis (7.7%; 1 superficial, 1 deep) (Table 4). There were no documented infections. Six reoperations (23.1%) were performed for the 6 component failures (2 traumatic dislocations of prosthesis resulting in acute glenoid component failure, 3 cases of atraumatic glenoid loosening, 1 case of humeral stem loosening after periprosthetic fracture). Atraumatic glenoid component loosening occurred a mean (SD) of 40.6 (14.2) months after surgery (range, 20.8-54.2 months).
Surgical Failures
Eight service members underwent MEB. Six patients experienced component failure. Factors contributing to both clinical failure and separation from active duty by means of MEB were evaluated with univariate analysis (Table 5). No statistically significant risk factors, including surgical revision and presence of perioperative complications, were identified.
Discussion
We confirmed that our cohort of young service members (mean age, 45.8 years), who had undergone TSA for glenohumeral arthritis, had a relatively higher rate of component failure (23.1%) and a higher reoperation rate (23.1%) with low rates of return to military duty at short-term to midterm follow-up. Our results parallel those of a limited series with a younger cohort (Table 6).7,16,19,21,23,24 The high demand and increased life expectancy of the younger patients with glenohumeral arthritis potentiates the risk of complications, component loosening, and ultimate failure.29 To our knowledge, the present article is the first to report clinical and functional outcomes and perioperative risk profiles in a homogenously young, active military cohort after TSA.
The mean age of our study population (46 years) is one of the lowest in the literature. TSA in younger patients (age, <50-55 years) and older, active patients (>55 years) has received increased attention as a result of the expanding indications and growing popularity of TSA in these groups. Other studies have upheld the efficacy of TSA in achieving predictable pain relief and functional improvement in a diverse and predominantly elderly population.15,30-34 Alternative treatments, including humeral head resurfacing15,30,35 and soft-tissue interposition,15,36-40 have also shown inferior short- and long-term results in terms of longevity and degree of clinical or functional improvement.31-34,41 In addition, the ream-and-run technique has had promising early results by improving glenohumeral kinematics, pain relief, and shoulder function.13,42,43 However, although implantation of a glenoid component is avoided in young, active people because of reduced longevity and higher rates of component failure, the trade-offs are inadequately treated glenoid disease, suboptimal pain relief, and progression of glenoid arthritis eventually requiring revision. Furthermore, midterm and long-term survivorship of TSA in general is unknown, and there remain few good options for treating end-stage arthritis in young, active patients.
Our cohort had high rates of complications (46.2%) and revisions (23.1%). Two in 5 patients had postoperative complications, most commonly component failure resulting in reoperation. In the literature, complication rates among young patients who underwent TSA are much lower (4.8%-10.9%).16,23,24 Our cohort’s most common complication was component failure (23.1%), which was most often attributed to atraumatic, aseptic glenoid component loosening and required reoperation. Previously reported revision rates in a young population that underwent TSA (0%-11%)16,23,24 were also significantly lower than those in the present analysis (23.1%), underscoring the impact of operative indications, postoperative activity levels, and occupational demands on ultimate failure rates. Interestingly, all revisions in our study were for component failure, whereas previous reports have described a higher rate for infection.22 However, the same studies also found glenoid lucency rates as high as 76% at 10-year follow-up.16 Furthermore, in a review of 136 TSAs with unsatisfactory outcomes, glenoid loosening was the most common reason for presenting to clinic after surgery.44 Specifically, our population had a high rate of glenohumeral arthritis secondary to instability (50.0%) and posttraumatic osteoarthritis (26.9%). For many reasons, outcomes were worse in younger patients with a history of glenohumeral instability33 than in older patients without a high incidence of instability.45 This young cohort with higher demands may have had accelerated polyethylene wear patterns caused by repetitive overhead activity, which may have arisen because of a higher functional profile after surgery and greater patient expectations after arthroplasty. In addition, patients with a history of instability may have altered glenohumeral anatomy, especially with previous arthroscopic or open stabilization procedures. Anatomical changes include excessive posterior glenoid wear, internal rotation contracture, patulous capsular tissue, static or dynamic posterior humeral subluxation, and possible overconstraint after prior stabilization procedures. Almost half of our population had a previous surgery; our patients averaged 1.7 previous surgeries each.
Although estimates of component survivorship at a high-volume civilian tertiary-referral center were as high as 97% at 10 years and 84% at 20 years,7,16 10-year survivorship in patients with a history of instability was only 61%.3 TSA survivorship in our young, active cohort is already foreseeably dramatically reduced, given the 23.1% revision rate at 28.5-month follow-up. This consideration must be addressed during preoperative counseling with the young patient with glenohumeral arthritis and a history of shoulder instability.
Despite the high rates of complications and revisions in our study, 92.3% of patients were satisfied with surgery, 88.0% experienced minimal persistence of pain (mean 3.8-point decrease on SRPS), and 100% maintained improved ROM at final follow-up. Satisfaction in the young population has varied significantly, from 52% to 95%, generally on the basis of physical activity.16,22-24 The reasonable rate of postoperative satisfaction in the present analysis is comparable to what has been reported in patients of a similar age (Table 6).7,16,22 However, despite high satisfaction and pain relief, patients were inconsistently able to return to the upper limits of physical activity required of active-duty military service. In addition, we cannot exclude secondary gain motivations for pursuing medical retirement, similar to that seen in patients receiving worker’s compensation.
Other authors have conversely found more favorable functional outcomes and survivorship rates.23,24 In a retrospective review of 46 TSAs in patients 55 years or younger, Bartelt and colleagues24 found sustained improvements in pain, ROM, and satisfaction at 7-year follow-up.24 Raiss and colleagues23 conducted a prospective study of TSA outcomes in 21 patients with a mean age of 55 years and a mean follow-up of 7 years and reported no revisions and only 1 minor complication, a transient brachial plexus palsy.23 The discrepancy between these studies may reflect different activity levels and underlying pathology between cohorts. The present population is unique in that it represents a particularly difficult confluence of factors for shoulder arthroplasty surgeons. The high activity, significant overhead and lifting occupational demands, and discordant patient expectations of this military cohort place a significant functional burden on the implants, the glenoid component in particular. Furthermore, this patient group has a higher incidence of more complex glenohumeral pathology resulting in instability, posttraumatic, or capsulorrhaphy arthropathy, and multiple prior arthroscopic and open stabilization procedures.
At final follow-up, only 33% of our patients were still on activity duty, 37.5% had completed or were completing medical separation from the military after surgery for persistent shoulder disability, and 37.5% were retired from the military. Five patients (20.8%) deployed after surgery. This young, active cohort of service members who had TSA for glenohumeral arthritis faced a unique set of tremendous physical demands. A retrospective case series investigated return to sport in 100 consecutive patients (mean age, 68.9 years) who were participating in recreational and competitive athletics and underwent unilateral TSA.21 The patients were engaged most commonly in swimming (20.4%), golf (16.3%), cycling (16.3%), and fitness training (16.3%). The authors found that, at a mean follow-up of 2.8 years, 49 patients (89%) were able to continue in sports, though 36.7% thought their sport activity was restricted after TSA. In another retrospective case series (61 TSAs), McCarty and colleagues19 found that 48 patients (71%) were improved in their sports participation, and 50% increased their frequency of participation after surgery.
There are no specific recommendations on returning to military service or high-level sport after surgery. Recommendations on returning to sport after TSA have been based largely on small case series involving specific sports46,47 and surveys of expert opinion.17,18 In a survey on postoperative physical activity in young patients after TSA conducted by Healy and colleagues,17 35 American Shoulder and Elbow Surgeons members recommended avoiding contact and impact sports while permitting return to nonimpact sports, such as swimming, which may still impart significant stress to the glenohumeral joint. In an international survey of 101 shoulder and elbow surgeons, Magnussen and colleagues18 also found that most recommended avoiding a return to impact sports that require intensive upper extremity demands and permitting full return to sports at preoperative levels. This likely is a result of the perception that most of these patients having TSA are older and have less rigorous involvement in sports at the outset and a lower propensity for adverse patient outcomes. However, these recommendations may place a younger, more high-demand patient at significantly greater risk. The active-duty cohort engages in daily physical training, including push-ups and frequent overhead lifting, which could account for the high failure rates and low incidence of postoperative deployment. Although TSA seems to demonstrate good initial results in terms of return to high-demand activities, the return-to-duty profile in our study highlights the potential pitfalls of TSA in active individuals attempting to return to high-demand preoperative function.
Our analysis was limited by the fact that we used a small patient cohort, contributing to underpowered analysis of the potential risk factors predictive of reoperation and medical discharge. Although our minimum follow-up was 12 months, with the exception of 1 patient who was medically separated at 11.6 months because of shoulder disability, we captured 5 patients (19.2%) who underwent medical separation but who would otherwise be excluded. Therefore, this limitation is not major in that, with a longer minimum follow-up, we would be excluding a significant number of patients with such persistent disability after TSA that they would not be able to return to duty at anywhere near their previous level. In this retrospective study, we were additionally limited to analysis of the data in the medical records and could not control for variables such as surgeon technique, implant choice, and experience. Complete radiographic images were not available, limiting analysis of radiographic outcomes. Given the lack of a standardized preoperative imaging protocol, we could not evaluate glenoid version on axial imaging. It is possible that some patients with early aseptic glenoid loosening had posterior subluxation or a Walch B2 glenoid, which has a higher failure rate.48 The strengths of this study include its unique analysis of a homogeneous young, active, high-risk patient cohort within a closed healthcare system. In the military, these patients are subject to intense daily physical and occupational demands. In addition, the clinical and functional outcomes we studied are patient-centered and therefore relevant during preoperative counseling. Further investigations might focus on validated outcome measures and on midterm to long-term TSA outcomes in an active military population vis-à-vis other alternatives for clinical management.
Conclusion
By a mean follow-up of 3.5 years, only a third of the service members had returned to active duty, roughly a third had retired, and more than a third had been medically discharged because of persistent disability attributable to the shoulder. Despite initial improvements in ROM and pain, midterm outcomes were poor. The short-term complication rate (46.2%) and the rate of reoperation for component failure (23.1%) should be emphasized during preoperative counseling.
1. Tokish JM. The mature athlete’s shoulder. Sports Health. 2014;6(1):31-35.
2. Sperling JW, Cofield RH. Revision total shoulder arthroplasty for the treatment of glenoid arthrosis. J Bone Joint Surg Am. 1998;80(6):860-867.
3. Sperling JW, Antuna SA, Sanchez-Sotelo J, Schleck C, Cofield RH. Shoulder arthroplasty for arthritis after instability surgery. J Bone Joint Surg Am. 2002;84(10):1775-1781.
4. Izquierdo R, Voloshin I, Edwards S, et al; American Academy of Orthopaedic Surgeons. Treatment of glenohumeral osteoarthritis. J Am Acad Orthop Surg. 2010;18(6):375-382.
5. Johnson MH, Paxton ES, Green A. Shoulder arthroplasty options in young (<50 years old) patients: review of current concepts. J Shoulder Elbow Surg. 2015;24(2):317-325.
6. Cole BJ, Yanke A, Provencher MT. Nonarthroplasty alternatives for the treatment of glenohumeral arthritis. J Shoulder Elbow Surg. 2007;16(5 suppl):S231-S240.
7. Denard PJ, Raiss P, Sowa B, Walch G. Mid- to long-term follow-up of total shoulder arthroplasty using a keeled glenoid in young adults with primary glenohumeral arthritis. J Shoulder Elbow Surg. 2013;22(7):894-900.
8. Denard PJ, Wirth MA, Orfaly RM. Management of glenohumeral arthritis in the young adult. J Bone Joint Surg Am. 2011;93(9):885-892.
9. Millett PJ, Horan MP, Pennock AT, Rios D. Comprehensive arthroscopic management (CAM) procedure: clinical results of a joint-preserving arthroscopic treatment for young, active patients with advanced shoulder osteoarthritis. Arthroscopy. 2013;29(3):440-448.
10 Millett PJ, Gaskill TR. Arthroscopic management of glenohumeral arthrosis: humeral osteoplasty, capsular release, and arthroscopic axillary nerve release as a joint-preserving approach. Arthroscopy. 2011;27(9):1296-1303.
11. Savoie FH 3rd, Brislin KJ, Argo D. Arthroscopic glenoid resurfacing as a surgical treatment for glenohumeral arthritis in the young patient: midterm results. Arthroscopy. 2009;25(8):864-871.
12. Strauss EJ, Verma NN, Salata MJ, et al. The high failure rate of biologic resurfacing of the glenoid in young patients with glenohumeral arthritis. J Shoulder Elbow Surg. 2014;23(3):409-419.
13. Matsen FA 3rd, Warme WJ, Jackins SE. Can the ream and run procedure improve glenohumeral relationships and function for shoulders with the arthritic triad? Clin Orthop Relat Res. 2015;473(6):2088-2096.
14. Lo IK, Litchfield RB, Griffin S, Faber K, Patterson SD, Kirkley A. Quality-of-life outcome following hemiarthroplasty or total shoulder arthroplasty in patients with osteoarthritis. A prospective, randomized trial. J Bone Joint Surg Am. 2005;87(10):2178-2185.
15. Wirth M, Tapscott RS, Southworth C, Rockwood CA Jr. Treatment of glenohumeral arthritis with a hemiarthroplasty: a minimum five-year follow-up outcome study. J Bone Joint Surg Am. 2006;88(5):964-973.
16. Sperling JW, Cofield RH, Rowland CM. Minimum fifteen-year follow-up of Neer hemiarthroplasty and total shoulder arthroplasty in patients aged fifty years or younger. J Shoulder Elbow Surg. 2004;13(6):604-613.
17. Healy WL, Iorio R, Lemos MJ. Athletic activity after joint replacement. Am J Sports Med. 2001;29(3):377-388.
18. Magnussen RA, Mallon WJ, Willems WJ, Moorman CT 3rd. Long-term activity restrictions after shoulder arthroplasty: an international survey of experienced shoulder surgeons. J Shoulder Elbow Surg. 2011;20(2):281-289.
19. McCarty EC, Marx RG, Maerz D, Altchek D, Warren RF. Sports participation after shoulder replacement surgery. Am J Sports Med. 2008;36(8):1577-1581.
20. Schmidt-Wiethoff R, Wolf P, Lehmann M, Habermeyer P. Physical activity after shoulder arthroplasty [in German]. Sportverletz Sportschaden. 2002;16(1):26-30.
21. Schumann K, Flury MP, Schwyzer HK, Simmen BR, Drerup S, Goldhahn J. Sports activity after anatomical total shoulder arthroplasty. Am J Sports Med. 2010;38(10):2097-2105.
22. Sperling JW, Cofield RH, Rowland CM. Neer hemiarthroplasty and Neer total shoulder arthroplasty in patients fifty years old or less. Long-term results. J Bone Joint Surg Am. 1998;80(4):464-473.
23. Raiss P, Aldinger PR, Kasten P, Rickert M, Loew M. Total shoulder replacement in young and middle-aged patients with glenohumeral osteoarthritis. J Bone Joint Surg Br. 2008;90(6):764-769.
24. Bartelt R, Sperling JW, Schleck CD, Cofield RH. Shoulder arthroplasty in patients aged fifty-five years or younger with osteoarthritis. J Shoulder Elbow Surg. 2011;20(1):123-130.
25. Waterman BR, Burns TC, McCriskin B, Kilcoyne K, Cameron KL, Owens BD. Outcomes after Bankart repair in a military population: predictors for surgical revision and long-term disability. Arthroscopy. 2014;30(2):172-177.
26. Waterman BR, Liu J, Newcomb R, Schoenfeld AJ, Orr JD, Belmont PJ Jr. Risk factors for chronic exertional compartment syndrome in a physically active military population. Am J Sports Med. 2013;41(11):2545-2549.
27. Chalmers PN, Gupta AK, Rahman Z, Bruce B, Romeo AA, Nicholson GP. Predictors of early complications of total shoulder arthroplasty. J Arthroplasty. 2014;29(4):856-860.
28. Dunn JC, Lanzi J, Kusnezov N, Bader J, Waterman BR, Belmont PJ Jr. Predictors of length of stay after elective total shoulder arthroplasty in the United States. J Shoulder Elbow Surg. 2015;24(5):754-759.
29. Hayes PR, Flatow EL. Total shoulder arthroplasty in the young patient. Instr Course Lect. 2001;50;73-88.
30. Rispoli DM, Sperling JW, Athwal GS, Schleck CD, Cofield RH. Humeral head replacement for the treatment of osteoarthritis. J Bone Joint Surg Am. 2006;88(12):2637-2644.
31. Radnay CS, Setter KJ, Chambers L, Levine WN, Bigliani LU, Ahmad CS. Total shoulder replacement compared with humeral head replacement for the treatment of primary glenohumeral osteoarthritis: a systematic review. J Shoulder Elbow Surg. 2007;16(4):396-402.
32. Gartsman GM, Roddey TS, Hammerman SM. Shoulder arthroplasty with or without resurfacing of the glenoid in patients who have osteoarthritis. J Bone Joint Surg Am. 2000;82(1):26-34.
33. Edwards TB, Kadakia NR, Boulahia A, et al. A comparison of hemiarthroplasty and total shoulder arthroplasty in the treatment of primary glenohumeral osteoarthritis: results of a multicenter study. J Shoulder Elbow Surg. 2003;12(3):
207-213.
34. Bryant D, Litchfield R, Sandow M, Gartsman GM, Guyatt G, Kirkley A. A comparison of pain, strength, range of motion, and functional outcomes after hemiarthroplasty and total shoulder arthroplasty in patients with osteoarthritis of the shoulder. A systematic review and meta-analysis. J Bone Joint Surg Am. 2005;87(9):1947-1956.
35. Bailie DS, Llinas PJ, Ellenbecker TS. Cementless humeral resurfacing arthroplasty in active patients less than fifty-five years of age. J Bone Joint Surg Am. 2008;90(1):110-117.
36. Ball CM, Galatz LM, Yamaguchi K. Meniscal allograft interposition arthroplasty for the arthritic shoulder: description of a new surgical technique. Tech Shoulder Elbow Surg. 2001;2:247-254.
37. Elhassan B, Ozbaydar M, Diller D, Higgins LD, Warner JJ. Soft-tissue resurfacing of the glenoid in the treatment of glenohumeral arthritis in active patients less than fifty years old. J Bone Joint Surg Am. 2009;91(2):419-424.
38. Krishnan SG, Nowinski RJ, Harrison D, Burkhead WZ. Humeral hemiarthroplasty with biologic resurfacing of the glenoid for glenohumeral arthritis. Two to fifteen-year outcomes. J Bone Joint Surg Am. 2007;89(4):727-734.
39. Lee KT, Bell S, Salmon J. Cementless surface replacement arthroplasty of the shoulder with biologic resurfacing of the glenoid. J Shoulder Elbow Surg. 2009;18(6):915-919.
40. Nicholson GP, Goldstein JL, Romeo AA, et al. Lateral meniscus allograft biologic glenoid arthroplasty in total shoulder arthroplasty for young shoulders with degenerative joint disease. J Shoulder Elbow Surg. 2007;16(5 suppl):S261-S266.
41. Carroll RM, Izquierdo R, Vazquez M, Blaine TA, Levine WN, Bigliani LU. Conversion of painful hemiarthroplasty to total shoulder arthroplasty: long-term results. J Shoulder Elbow Surg. 2004;13(6):599-603.
42. Clinton J, Franta AK, Lenters TR, Mounce D, Matsen FA 3rd. Nonprosthetic glenoid arthroplasty with humeral hemiarthroplasty and total shoulder arthroplasty yield similar self-assessed outcomes in the management of comparable patients with glenohumeral arthritis. J Shoulder Elbow Surg. 2007;16(5):534-538.
43. Gilmer BB, Comstock BA, Jette JL, Warme WJ, Jackins SE, Matsen FA. The prognosis for improvement in comfort and function after the ream-and-run arthroplasty for glenohumeral arthritis: an analysis of 176 consecutive cases. J Bone Joint Surg Am. 2012;94(14):e102.
44. Franta AK, Lenters TR, Mounce D, Neradilek B, Matsen FA 3rd. The complex characteristics of 282 unsatisfactory shoulder arthroplasties. J Shoulder Elbow Surg. 2007;16(5):555-562.
45. Godenèche A, Boileau P, Favard L, et al. Prosthetic replacement in the treatment of osteoarthritis of the shoulder: early results of 268 cases. J Shoulder Elbow Surg. 2002;11(1):11-18.
46. Jensen KL, Rockwood CA Jr. Shoulder arthroplasty in recreational golfers. J Shoulder Elbow Surg. 1998;7(4):362-367.
47. Kirchhoff C, Imhoff AB, Hinterwimmer S. Winter sports and shoulder arthroplasty [in German]. Sportverletz Sportschaden. 2008;22(3):153-158.
48. Raiss P, Edwards TB, Deutsch A, et al. Radiographic changes around humeral components in shoulder arthroplasty. J Bone Joint Surg Am. 2014;96(7):e54.