User login
Comparison of Pneumatic Broadband Light Plus Adapalene Gel 0.3% Versus Adapalene Gel 0.3% Monotherapy in the Treatment of Mild to Moderate Acne
Acne is a common and distressing condition that typically presents in adolescents and young adults and has been associated with not only medical but also emotional and aesthetic consequences. Acne treatments that offer faster improvement are the coveted goal. Although clinical studies support the use of combination therapy with topical retinoids and antibiotics, the overuse of antibiotics raises caution for bacterial resistance.1 Therefore, adjunctive treatments such as chemical peels, light therapy, and laser treatments can hasten the response to traditional acne treatments and in some cases may potentially decrease use of both oral and topical antibiotics.
Light therapy, particularly with visible light, may improve acne outcomes. Pneumatic broadband light (PBBL) is a light treatment in the broadband range (400–1200 nm) combined with a vacuum. The suction created by the vacuum has several effects on acne lesions, such as creating a mechanical lysis of thin-walled pustules and dislodging pore impaction. The blue light with a wavelength of 410 nm targets endogenous porphyrins in Propionibacterium acnes and elicits singlet oxygen production, resulting in bacterial destruction.2,3 Studies showed that PBBL alone was effective in most patients with mild to moderate acne and caused minimal side effects.2-4
We sought to determine if PBBL combined with a topical retinoid can accelerate and prolong acne improvement. We evaluated the efficacy, safety, and tolerability of PBBL plus adapalene gel 0.3% versus adapalene gel 0.3% monotherapy in patients with mild to moderate acne.
METHODSPatient Population
Patients with mild to moderate acne were eligible for the study if they were 18 years or older at screening, in good health, had stopped oral isotretinoin for at least 1 year prior to treatment initiation, and were not taking oral or topical antibiotics or using any topical retinoid derivatives for at least 1 month prior to treatment initiation. Inclusion criteria included at least 10 acne lesions on the face. Patients were excluded if they had a history of receiving PBBL treatment; had a history of scarring, hypopigmentation, or hyperpigmentation from laser or light treatments; and/or were pregnant or refused use of contraception during the study period.
Study Design
This single-blind, randomized, split-face study was approved by the institutional review board of the University of Pennsylvania (Philadelphia, Pennsylvania). All participants provided informed consent before entering the study. Each participant was randomly assigned to receive PBBL on one side of the face for 6 consecutive weeks and apply adapalene gel 0.3% to both sides of the face nightly for 10 weeks. Pneumatic broadband light treatment was performed using the following settings: starting power 2 (approximately 4–6 J/cm2) and vacuum setting 3 (negative pressure, approximately 3 lb/in2). The power setting was increased to a maximum of 6 (12–14 J/cm2) at subsequent visits depending on tolerability of the participants.
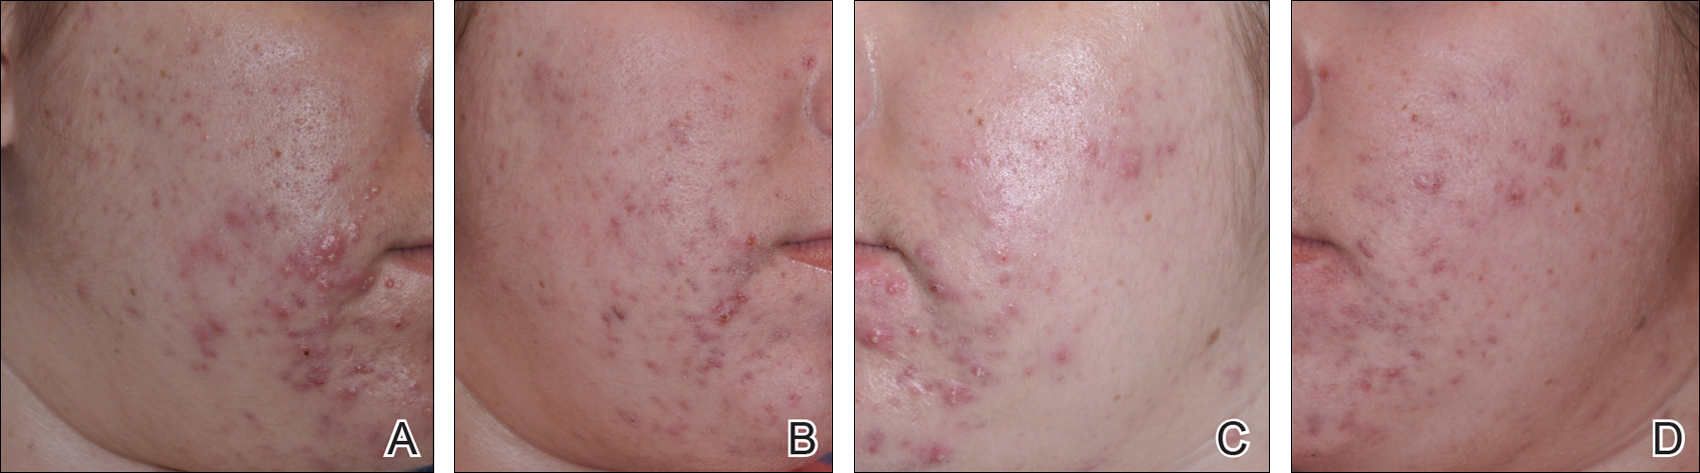
All participants visited the clinic weekly for 6 weeks and also returned for follow-up at week 10 (4 weeks following last PBBL treatment). At each visit, the participants completed satisfaction questionnaires and were assessed by a dermatologist evaluator using several parameters including the modified Global Acne Grading Score (mGAGS), clinical photography, participant self-assessment, physician assessment, and Wong Baker FACES Pain Rating Scale (WBPRS). The physician evaluator was blinded to the side of the face receiving PBBL treatment. Clinical photographs were taken to compare the clinical outcome at each visit versus baseline.
Efficacy Evaluation
Acne Counts
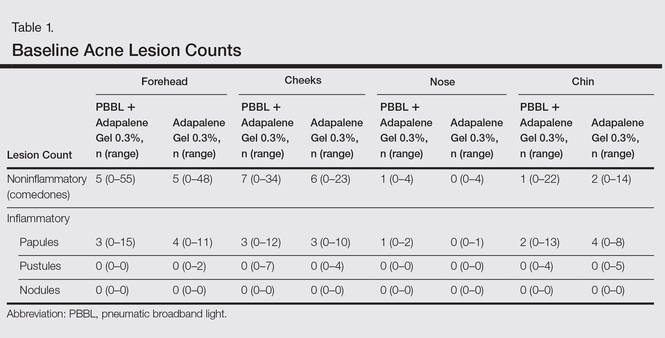
The blinded evaluator counted acne lesions and assessed the mGAGS at each visit prior to administration of the PBBL treatment. Acne lesions were counted separately as noninflammatory (comedones) and inflammatory (papules, pustules, nodules) on the forehead, cheeks, nose, and chin.
Modified Global Acne Grading Score
The modified Global Acne Grading Score was modified from the Global Acne Grading Scale (GAGS) that has previously been used to evaluate acne severity.5 The original GAGS used the type and location of the acne lesions. The GAGS considers 6 locations on the face, chest, and upper back, with a grading factor for each location (forehead=2; cheeks=2; nose=1; chin=1). Another grading factor represented the lesion type (0=no lesion; 1=comedone; 2=papule; 3=pustule; 4=nodule). The local score was calculated by multiplying the location grading factor by the lesion type grading factor. The total score was the sum of the individual local scores for the 4 locations.
Given that the number of acne lesions is important, we modified the GAGS by adding a grading factor that represented the number of lesions to improve the accuracy of the test (1=0–10 lesions; 2=11–20 lesions; 3=21–30 lesions; 4=≥31 lesions). The local score of mGAGS was calculated by multiplying the grading factors for location, lesion type, and number of lesions. Each local score was then added to yield a total score. The mGAGS may be useful and more accurate to determine the severity of acne (0=none; 1–44=mild; 45–80=moderate; 81–132=severe; 133–176=very severe).
Participant Self-assessment
Participants assessed their acne lesions using an 11-point rating scale (–5=100% worsening; –4=76%–99% worsening; –3=51%–75% worsening; –2=26%–50% worsening; –1=1%–25% worsening; 0=no improvement; 1=1%–25% improvement; 2=26%–50% improvement; 3=51%–75% improvement; 4=76%–99% improvement; 5=100% acne clear) to compare their acne at each treatment visit and week 10 follow-up with a baseline photograph.
Physician Assessment
The blinded evaluator assessed acne lesions on the face using the same 11-point rating scale that was used for participant self-assessment. For each participant, assessments were made at each treatment visit and week 10 follow-up by comparing baseline photographs.
Safety Evaluation
The WBPRS score, a standardized 6-point scale (0=no pain; 1=hurts a little bit; 2=hurts a little bit more; 3=hurts even more; 4=hurts whole lot; 5=hurt worst),6 was used to evaluate pain toleration during PBBL treatments and was recorded along with adverse events throughout the study.
Statistical Analysis
Based on data from 2 prior studies,3,7 we expected that the favorable clinical outcome of adapalene gel 0.3% and PBBL therapy would be 23% and 78%, respectively. If the adjunctive therapy with PBBL was beneficial, the favorable outcome would be higher than 78%. To be able to detect this difference, the sample size of 11 patients was needed when 5% type I error and 20% type II error were accepted.
Categorical variables were expressed as percentages, while continuous variables were expressed in terms of median (range). The clinical outcomes between both treatment groups were compared using the Wilcoxon signed rank test. A 2-tailed P value of ≤.05 was considered statistically significant. All statistical calculations were performed using STATA software version 10.0.
RESULTS
Baseline Characteristics
Four male and 7 female patients aged 18 to 35 years (median, 23 years) with mild to moderate acne were enrolled in the study. Of the 11 participants, 7 were white, 2 were black, 1 was Asian, and 1 was Latin American. Baseline characteristics of both sides of the face were comparable in all participants (Table 1). Eight participants (73%) completed the study. Two black participants withdrew from the study due to hyperpigmentation following PBBL treatment; 1 participant did not return for follow-up at week 10, as she was out of the country.
Lesion Counts
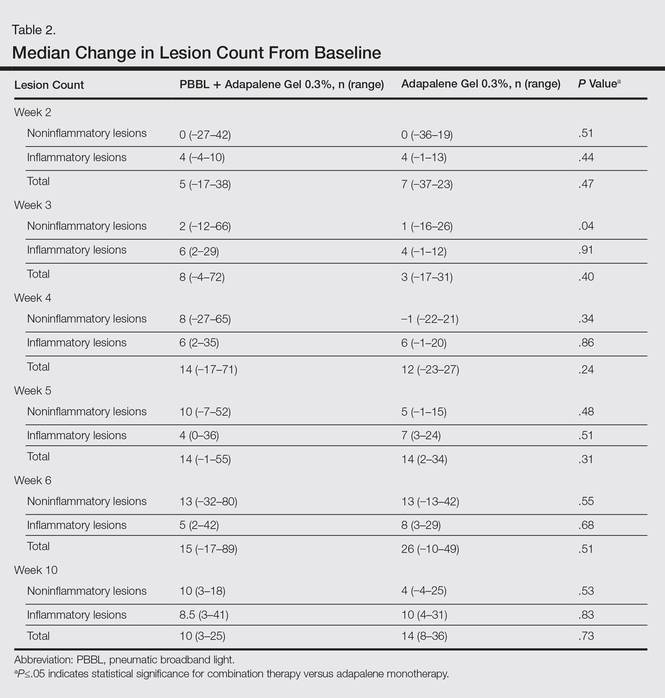
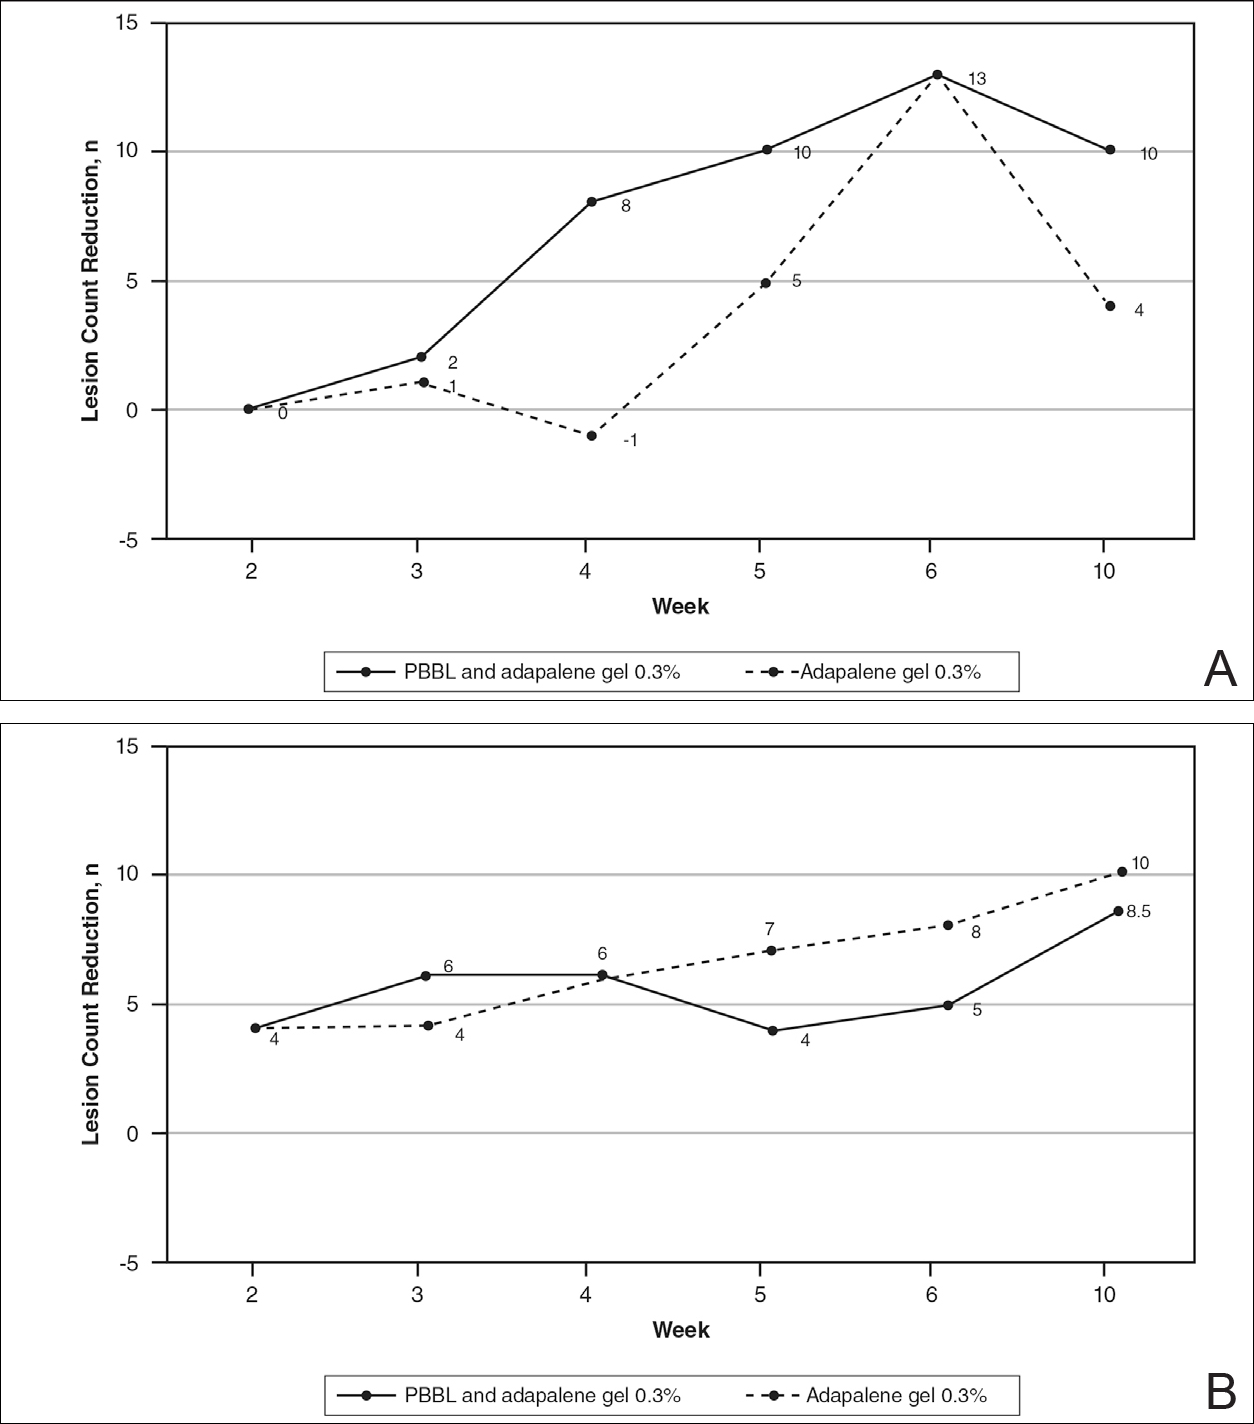
At week 3, reduction in noninflammatory lesions was significantly greater on the side receiving the combination therapy compared to the monotherapy side (P=.04)(Table 2). However, there was no significant difference between the combination therapy and the adapalene monotherapy sides in the reduction of noninflammatory and inflammatory lesions at week 4 (Figure 1). There was a remarkable improvement of the combination therapy and adapalene monotherapy sides in acne lesions, but there was no significant difference between the combination therapy and the adapalene monotherapy sides (Figure 2).
Modified Global Acne Grading Score
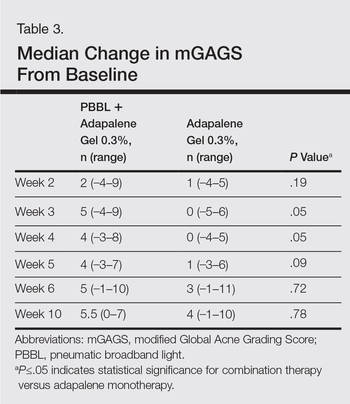
At weeks 3 and 4, the improvement of mGAGS was significantly greater on the side treated with the combination therapy (P=.05). However, this significant difference was not sustained (Table 3).
Participant Self-assessment and Physician Assessment
The rate of acne improvement according to participant self-assessment was slightly higher on the side receiving the combination therapy compared to the monotherapy side at week 2 (26%–50% vs 1%–25%) and week 6 (76%–99% vs 51%–75%). However, there was no statistically significant difference. For the physician assessment, there was no significant difference between the monotherapy and combination therapy sides.
Safety
The median WBPRS score was 1 (hurts a little bit) throughout all PBBL treatment visits. The maximum score was highest at week 1 (4=hurts whole lot) and subsequently decreased to 2 (hurts a little bit more) at week 6.
After the PBBL treatment, all participants experienced transient erythema in the treatment area. All participants noted their skin had become drier than usual from adapalene, except 1 participant (11%) who reported very dry skin on areas where adapalene gel 0.3% had been applied. However, the dryness was tolerable and relief was reported following application of a moisturizer. No participants withdrew from the study due to skin dryness.
Both black participants experienced hyperpigmentation caused by PBBL (1 on the treatment sites, the other on the test spot) and withdrew from the study. The hyperpigmentation resolved over time following application of a topical bleaching cream. One patient experienced purpura following PBBL treatment at week 4, which was associated with an increase in PBBL power. No other side effects (eg, scaling, stinging, burning, vesicle formation, blistering, crusting, scarring) were observed.
COMMENT
This 10-week study demonstrated that PBBL initially improved the appearance of acne in the first month of treatment, as determined by the significantly greater reduction in mGAGS for the combination side versus the adapalene monotherapy side. Differences in the reduction of acne lesions were not significant between the 2 treatments, except for noninflammatory lesion reduction at week 3. Analysis of physician assessment with photographs revealed acne improvement from baseline in the first month but no additional effects with the PBBL treatment at the end of study. Similarly, participant assessment indicated an improvement by week 2 with the combination therapy compared to adapalene monotherapy in their assessment of acne lesion reductions from baseline. By the end of the study, there was no significant difference between monotherapy and combination therapy.
These findings illustrate that combination therapy with PBBL plus adapalene improved the appearance of acne lesions within the first month of treatment, but there were no further signs of improvement at weeks 5 and 6. These results are consistent with at least 2 other studies that demonstrated acne reduction within the first 3 weeks of PBBL treatment.2,4 The current study was completed as planned with 6 weeks of combination therapy and patients continued adapalene application until the last follow-up visit in week 10. The length of the combination treatment was enough to determine that extension of treatment would not be necessary to gain any further benefits in this study. Because of the small sample size, we would not be able to detect any significant differences, as the difference between the combination therapy and the adapalene monotherapy was less than 55%. Therefore, a future study with a larger sample size is needed to draw a better conclusion.
Pneumatic broadband light has shown impressive results in acne treatment. However, some side effects need to be considered. Minimal adverse events have been reported such as erythema, dryness, peeling, burning, and itching.2-4 In this study, we found that all patients experienced transient erythema during and after PBBL treatment, but this effect disappeared in minutes. Purpura can occur if a higher power of PBBL is performed (6 or greater). Black patients experienced hyperpigmentation that can occur in darker skin types, as reported when light therapy is performed despite using the correct skin type tips.8 Therefore, care must be used in darker skin types, and we advocate a skin test in this population prior to general use.
Our study showed that PBBL can be safely combined with adapalene gel 0.3% and is well tolerated in the treatment of mild to moderate facial acne vulgaris for patients with Fitzpatrick skin types I to III. The combination of PBBL and adapalene reduces acne severity, as shown by the reduction in mGAGS during the first month of treatment. Patients noted faster improvement in their acne lesions with this combination. Although this study was limited by a relatively small sample size, this information may be useful in getting patients to be compliant overall, as they appeared to see results sooner, giving other therapies time to initiate their effect. It appears that 4 consecutive weekly treatments are enough to see that effect. Additionally, this combination therapy provides results without having to resort to oral antibiotics, as many patients today are concerned about creating future antibiotic resistance.
Conclusion
Adapalene gel 0.3% can be safely combined with PBBL for treatment of mild to moderate acne. Although the benefits of this combination therapy can be seen after 4 consecutive weekly treatments, the beneficial effect is not sustained.
Acknowledgment
The authors would like to thank Joyce Okawa, RN (Philadelphia, Pennsylvania), for her assistance in the submission to the University of Pennsylvania institutional review board.
- Thiboutot D, Gollnick H, Bettoli V, et al. New insights into the management of acne: an update from the Global Alliance to Improve Outcomes in Acne group. J Am Acad Dermatol. 2009;60(5 suppl):S1-S50.
- Gold MH, Biron J. Efficacy of a novel combination of pneumatic energy and broadband light for the treatment of acne. J Drugs Dermatol. 2008;7:639-642.
- Shamban AT, Enokibori M, Narurkar V, et al. Photopneumatic technology for the treatment of acne vulgaris. J Drugs Dermatol. 2008;7:139-145.
- Wanitphakdeedecha R, Tanzi EL, Alster TS. Photopneumatic therapy for the treatment of acne. J Drugs Dermatol. 2009;8:239-241.
- Doshi A, Zaheer A, Stiller MJ. A comparison of current acne grading systems and proposal of a novel system. Int J Dermatol. 1997;36:416-418.
- Wong DL, Baker CM. Pain in children: comparison of assessment scales. Pediatr Nurs. 1988;14:9-17.
- Thiboutot D, Pariser DM, Egan N, et al. Adapalene gel 0.3% for the treatment of acne vulgaris: a multicenter, randomized, double-blind, controlled, phase III trial. J Am Acad Dermatol. 2006;54:242-250.
- Yeung CK, Shek SY, Bjerring P, et al. A comparative study of intense pulsed light alone and its combination with photodynamic therapy for the treatment of facial acne in Asian skin. Lasers Surg Med. 2007;39:1-6.
Acne is a common and distressing condition that typically presents in adolescents and young adults and has been associated with not only medical but also emotional and aesthetic consequences. Acne treatments that offer faster improvement are the coveted goal. Although clinical studies support the use of combination therapy with topical retinoids and antibiotics, the overuse of antibiotics raises caution for bacterial resistance.1 Therefore, adjunctive treatments such as chemical peels, light therapy, and laser treatments can hasten the response to traditional acne treatments and in some cases may potentially decrease use of both oral and topical antibiotics.
Light therapy, particularly with visible light, may improve acne outcomes. Pneumatic broadband light (PBBL) is a light treatment in the broadband range (400–1200 nm) combined with a vacuum. The suction created by the vacuum has several effects on acne lesions, such as creating a mechanical lysis of thin-walled pustules and dislodging pore impaction. The blue light with a wavelength of 410 nm targets endogenous porphyrins in Propionibacterium acnes and elicits singlet oxygen production, resulting in bacterial destruction.2,3 Studies showed that PBBL alone was effective in most patients with mild to moderate acne and caused minimal side effects.2-4
We sought to determine if PBBL combined with a topical retinoid can accelerate and prolong acne improvement. We evaluated the efficacy, safety, and tolerability of PBBL plus adapalene gel 0.3% versus adapalene gel 0.3% monotherapy in patients with mild to moderate acne.
METHODSPatient Population
Patients with mild to moderate acne were eligible for the study if they were 18 years or older at screening, in good health, had stopped oral isotretinoin for at least 1 year prior to treatment initiation, and were not taking oral or topical antibiotics or using any topical retinoid derivatives for at least 1 month prior to treatment initiation. Inclusion criteria included at least 10 acne lesions on the face. Patients were excluded if they had a history of receiving PBBL treatment; had a history of scarring, hypopigmentation, or hyperpigmentation from laser or light treatments; and/or were pregnant or refused use of contraception during the study period.
Study Design
This single-blind, randomized, split-face study was approved by the institutional review board of the University of Pennsylvania (Philadelphia, Pennsylvania). All participants provided informed consent before entering the study. Each participant was randomly assigned to receive PBBL on one side of the face for 6 consecutive weeks and apply adapalene gel 0.3% to both sides of the face nightly for 10 weeks. Pneumatic broadband light treatment was performed using the following settings: starting power 2 (approximately 4–6 J/cm2) and vacuum setting 3 (negative pressure, approximately 3 lb/in2). The power setting was increased to a maximum of 6 (12–14 J/cm2) at subsequent visits depending on tolerability of the participants.
All participants visited the clinic weekly for 6 weeks and also returned for follow-up at week 10 (4 weeks following last PBBL treatment). At each visit, the participants completed satisfaction questionnaires and were assessed by a dermatologist evaluator using several parameters including the modified Global Acne Grading Score (mGAGS), clinical photography, participant self-assessment, physician assessment, and Wong Baker FACES Pain Rating Scale (WBPRS). The physician evaluator was blinded to the side of the face receiving PBBL treatment. Clinical photographs were taken to compare the clinical outcome at each visit versus baseline.
Efficacy Evaluation
Acne Counts
The blinded evaluator counted acne lesions and assessed the mGAGS at each visit prior to administration of the PBBL treatment. Acne lesions were counted separately as noninflammatory (comedones) and inflammatory (papules, pustules, nodules) on the forehead, cheeks, nose, and chin.
Modified Global Acne Grading Score
The modified Global Acne Grading Score was modified from the Global Acne Grading Scale (GAGS) that has previously been used to evaluate acne severity.5 The original GAGS used the type and location of the acne lesions. The GAGS considers 6 locations on the face, chest, and upper back, with a grading factor for each location (forehead=2; cheeks=2; nose=1; chin=1). Another grading factor represented the lesion type (0=no lesion; 1=comedone; 2=papule; 3=pustule; 4=nodule). The local score was calculated by multiplying the location grading factor by the lesion type grading factor. The total score was the sum of the individual local scores for the 4 locations.
Given that the number of acne lesions is important, we modified the GAGS by adding a grading factor that represented the number of lesions to improve the accuracy of the test (1=0–10 lesions; 2=11–20 lesions; 3=21–30 lesions; 4=≥31 lesions). The local score of mGAGS was calculated by multiplying the grading factors for location, lesion type, and number of lesions. Each local score was then added to yield a total score. The mGAGS may be useful and more accurate to determine the severity of acne (0=none; 1–44=mild; 45–80=moderate; 81–132=severe; 133–176=very severe).
Participant Self-assessment
Participants assessed their acne lesions using an 11-point rating scale (–5=100% worsening; –4=76%–99% worsening; –3=51%–75% worsening; –2=26%–50% worsening; –1=1%–25% worsening; 0=no improvement; 1=1%–25% improvement; 2=26%–50% improvement; 3=51%–75% improvement; 4=76%–99% improvement; 5=100% acne clear) to compare their acne at each treatment visit and week 10 follow-up with a baseline photograph.
Physician Assessment
The blinded evaluator assessed acne lesions on the face using the same 11-point rating scale that was used for participant self-assessment. For each participant, assessments were made at each treatment visit and week 10 follow-up by comparing baseline photographs.
Safety Evaluation
The WBPRS score, a standardized 6-point scale (0=no pain; 1=hurts a little bit; 2=hurts a little bit more; 3=hurts even more; 4=hurts whole lot; 5=hurt worst),6 was used to evaluate pain toleration during PBBL treatments and was recorded along with adverse events throughout the study.
Statistical Analysis
Based on data from 2 prior studies,3,7 we expected that the favorable clinical outcome of adapalene gel 0.3% and PBBL therapy would be 23% and 78%, respectively. If the adjunctive therapy with PBBL was beneficial, the favorable outcome would be higher than 78%. To be able to detect this difference, the sample size of 11 patients was needed when 5% type I error and 20% type II error were accepted.
Categorical variables were expressed as percentages, while continuous variables were expressed in terms of median (range). The clinical outcomes between both treatment groups were compared using the Wilcoxon signed rank test. A 2-tailed P value of ≤.05 was considered statistically significant. All statistical calculations were performed using STATA software version 10.0.
RESULTS
Baseline Characteristics
Four male and 7 female patients aged 18 to 35 years (median, 23 years) with mild to moderate acne were enrolled in the study. Of the 11 participants, 7 were white, 2 were black, 1 was Asian, and 1 was Latin American. Baseline characteristics of both sides of the face were comparable in all participants (Table 1). Eight participants (73%) completed the study. Two black participants withdrew from the study due to hyperpigmentation following PBBL treatment; 1 participant did not return for follow-up at week 10, as she was out of the country.
Lesion Counts
At week 3, reduction in noninflammatory lesions was significantly greater on the side receiving the combination therapy compared to the monotherapy side (P=.04)(Table 2). However, there was no significant difference between the combination therapy and the adapalene monotherapy sides in the reduction of noninflammatory and inflammatory lesions at week 4 (Figure 1). There was a remarkable improvement of the combination therapy and adapalene monotherapy sides in acne lesions, but there was no significant difference between the combination therapy and the adapalene monotherapy sides (Figure 2).
Modified Global Acne Grading Score
At weeks 3 and 4, the improvement of mGAGS was significantly greater on the side treated with the combination therapy (P=.05). However, this significant difference was not sustained (Table 3).
Participant Self-assessment and Physician Assessment
The rate of acne improvement according to participant self-assessment was slightly higher on the side receiving the combination therapy compared to the monotherapy side at week 2 (26%–50% vs 1%–25%) and week 6 (76%–99% vs 51%–75%). However, there was no statistically significant difference. For the physician assessment, there was no significant difference between the monotherapy and combination therapy sides.
Safety
The median WBPRS score was 1 (hurts a little bit) throughout all PBBL treatment visits. The maximum score was highest at week 1 (4=hurts whole lot) and subsequently decreased to 2 (hurts a little bit more) at week 6.
After the PBBL treatment, all participants experienced transient erythema in the treatment area. All participants noted their skin had become drier than usual from adapalene, except 1 participant (11%) who reported very dry skin on areas where adapalene gel 0.3% had been applied. However, the dryness was tolerable and relief was reported following application of a moisturizer. No participants withdrew from the study due to skin dryness.
Both black participants experienced hyperpigmentation caused by PBBL (1 on the treatment sites, the other on the test spot) and withdrew from the study. The hyperpigmentation resolved over time following application of a topical bleaching cream. One patient experienced purpura following PBBL treatment at week 4, which was associated with an increase in PBBL power. No other side effects (eg, scaling, stinging, burning, vesicle formation, blistering, crusting, scarring) were observed.
COMMENT
This 10-week study demonstrated that PBBL initially improved the appearance of acne in the first month of treatment, as determined by the significantly greater reduction in mGAGS for the combination side versus the adapalene monotherapy side. Differences in the reduction of acne lesions were not significant between the 2 treatments, except for noninflammatory lesion reduction at week 3. Analysis of physician assessment with photographs revealed acne improvement from baseline in the first month but no additional effects with the PBBL treatment at the end of study. Similarly, participant assessment indicated an improvement by week 2 with the combination therapy compared to adapalene monotherapy in their assessment of acne lesion reductions from baseline. By the end of the study, there was no significant difference between monotherapy and combination therapy.
These findings illustrate that combination therapy with PBBL plus adapalene improved the appearance of acne lesions within the first month of treatment, but there were no further signs of improvement at weeks 5 and 6. These results are consistent with at least 2 other studies that demonstrated acne reduction within the first 3 weeks of PBBL treatment.2,4 The current study was completed as planned with 6 weeks of combination therapy and patients continued adapalene application until the last follow-up visit in week 10. The length of the combination treatment was enough to determine that extension of treatment would not be necessary to gain any further benefits in this study. Because of the small sample size, we would not be able to detect any significant differences, as the difference between the combination therapy and the adapalene monotherapy was less than 55%. Therefore, a future study with a larger sample size is needed to draw a better conclusion.
Pneumatic broadband light has shown impressive results in acne treatment. However, some side effects need to be considered. Minimal adverse events have been reported such as erythema, dryness, peeling, burning, and itching.2-4 In this study, we found that all patients experienced transient erythema during and after PBBL treatment, but this effect disappeared in minutes. Purpura can occur if a higher power of PBBL is performed (6 or greater). Black patients experienced hyperpigmentation that can occur in darker skin types, as reported when light therapy is performed despite using the correct skin type tips.8 Therefore, care must be used in darker skin types, and we advocate a skin test in this population prior to general use.
Our study showed that PBBL can be safely combined with adapalene gel 0.3% and is well tolerated in the treatment of mild to moderate facial acne vulgaris for patients with Fitzpatrick skin types I to III. The combination of PBBL and adapalene reduces acne severity, as shown by the reduction in mGAGS during the first month of treatment. Patients noted faster improvement in their acne lesions with this combination. Although this study was limited by a relatively small sample size, this information may be useful in getting patients to be compliant overall, as they appeared to see results sooner, giving other therapies time to initiate their effect. It appears that 4 consecutive weekly treatments are enough to see that effect. Additionally, this combination therapy provides results without having to resort to oral antibiotics, as many patients today are concerned about creating future antibiotic resistance.
Conclusion
Adapalene gel 0.3% can be safely combined with PBBL for treatment of mild to moderate acne. Although the benefits of this combination therapy can be seen after 4 consecutive weekly treatments, the beneficial effect is not sustained.
Acknowledgment
The authors would like to thank Joyce Okawa, RN (Philadelphia, Pennsylvania), for her assistance in the submission to the University of Pennsylvania institutional review board.
- Thiboutot D, Gollnick H, Bettoli V, et al. New insights into the management of acne: an update from the Global Alliance to Improve Outcomes in Acne group. J Am Acad Dermatol. 2009;60(5 suppl):S1-S50.
- Gold MH, Biron J. Efficacy of a novel combination of pneumatic energy and broadband light for the treatment of acne. J Drugs Dermatol. 2008;7:639-642.
- Shamban AT, Enokibori M, Narurkar V, et al. Photopneumatic technology for the treatment of acne vulgaris. J Drugs Dermatol. 2008;7:139-145.
- Wanitphakdeedecha R, Tanzi EL, Alster TS. Photopneumatic therapy for the treatment of acne. J Drugs Dermatol. 2009;8:239-241.
- Doshi A, Zaheer A, Stiller MJ. A comparison of current acne grading systems and proposal of a novel system. Int J Dermatol. 1997;36:416-418.
- Wong DL, Baker CM. Pain in children: comparison of assessment scales. Pediatr Nurs. 1988;14:9-17.
- Thiboutot D, Pariser DM, Egan N, et al. Adapalene gel 0.3% for the treatment of acne vulgaris: a multicenter, randomized, double-blind, controlled, phase III trial. J Am Acad Dermatol. 2006;54:242-250.
- Yeung CK, Shek SY, Bjerring P, et al. A comparative study of intense pulsed light alone and its combination with photodynamic therapy for the treatment of facial acne in Asian skin. Lasers Surg Med. 2007;39:1-6.
Practice Points
- Compliance is achieved when patients can see improvements with their acne treatments quickly.
- Combination therapy achieves the goal of a quicker visual improvement of acneform pustules and papules with pneumatic broadband light while topical acne treatments have a chance to work, thus increasing compliance.

LOS in Children With Medical Complexity
Children with medical complexity (CMC) have complex and chronic health conditions that often involve multiple organ systems and severely affect cognitive and physical functioning. Although the prevalence of CMC is low (1% of all children), they account for nearly one‐fifth of all pediatric admissions and one‐half of all hospital days and charges in the United States.[1] Over the last decade, CMC have had a particularly large and increasing impact in tertiary‐care children's hospitals.[1, 2] The Institute of Medicine has identified CMC as a priority population for a revised healthcare system.[3]
Medical homes, hospitals, health plans, states, federal agencies, and others are striving to reduce excessive hospital use in CMC because of its high cost.[4, 5, 6] Containing length of stay (LOS)an increasingly used indicator of the time sensitiveness and efficiency of hospital careis a common aim across these initiatives. CMC have longer hospitalizations than children without medical complexity. Speculated reasons for this are that CMC tend to have (1) higher severity of acute illnesses (eg, pneumonia, cellulitis), (2) prolonged recovery time in the hospital, and (3) higher risk of adverse events in the hospital. Moreover, hospital clinicians caring for CMC often find it difficult to determine discharge readiness, given that many CMC do not return to a completely healthy baseline.[7]
Little is known about long LOS in CMC, including which CMC have the highest risk of experiencing such stays and which stays might have the greatest opportunity to be shortened. Patient characteristics associated with prolonged length of stay have been studied extensively for many pediatric conditions (eg, asthma).[8, 9, 10, 11, 12, 13, 14] However, most of these studies excluded CMC. Therefore, the objectives of this study were to examine (1) the prevalence of long LOS in CMC, (2) patient characteristics associated with long LOS, and (3) hospital‐to‐hospital variation in prevalence of long LOS hospitalizations.
METHODS
Study Design and Data Source
This study is a multicenter, retrospective cohort analysis of the Pediatric Health Information System (PHIS). PHIS is an administrative database of 44 not for profit, tertiary care pediatric hospitals affiliated with the Children's Hospital Association (CHA) (Overland Park, KS). PHIS contains data regarding patient demographics, diagnoses, and procedures (with International Classification of Diseases, 9th Revision, Clinical Modification [ICD‐9‐CM] codes), All‐Patient Refined Diagnostic Related Groups version 30 (APR‐DRGs) (3M Health Information Systems, Salt Lake City, UT), and service lines that aggregate the APR‐DRGs into 38 distinct groups. Data quality and reliability are assured through CHA and participating hospitals. In accordance with the policies of the Cincinnati Children's Hospital Medical Center Institutional Review Board, this study of deidentified data was not considered human subjects research.
Study Population
Inclusion Criteria
Children discharged following an observation or inpatient admission from a hospital participating in the PHIS database between January 1, 2013 and December 31, 2014 were eligible for inclusion if they were considered medically complex. Medical complexity was defined using Clinical Risk Groups (CRGs) version 1.8, developed by 3M Health Information Systems and the National Association of Children's Hospitals and Related Institutions. CRGs were used to assign each hospitalized patient to 1 of 9 mutually exclusive chronicity groups according to the presence, type, and severity of chronic conditions.[15, 16, 17, 18] Each patient's CRG designation was based on 2 years of previous hospital encounters.
As defined in prior studies and definitional frameworks of CMC,[1] patients belonging to CRG group 6 (significant chronic disease in 2 organ systems), CRG group 7 (dominant chronic disease in 3 organ systems), and CRG group 9 (catastrophic condition) were considered medically complex.[17, 19] Patients with malignancies (CRG group 8) were not included for analysis because they are a unique population with anticipated, long hospital stays. Patients with CRG group 5, representing those with chronic conditions affecting a single body system, were also not included because most do not have attributes consistent with medical complexity.
Exclusion Criteria
We used the APR‐DRG system, which leverages ICD‐9‐CM codes to identify the health problem most responsible for the hospitalization, to refine the study cohort. We excluded hospitalizations that were classified by the APR‐DRG system as neonatal, as we did not wish to focus on LOS in the neonatal intensive care unit (ICU) or for birth admissions. Similarly, hospitalizations for chemotherapy (APR‐DRG 693) or malignancy (identified with previously used ICD‐9‐CM codes)[20] were also excluded because long LOS is anticipated. We also excluded hospitalizations for medical rehabilitation (APR‐DRG 860).
Outcome Measures
The primary outcome measure was long LOS, defined as LOS 10 days. The cut point of LOS 10 days represents the 90th percentile of LOS for all children, with and without medical complexity, hospitalized during 2013 to 2014. LOS 10 days has previously been used as a threshold of long LOS.[21] For hospitalizations involving transfer at admission from another acute care facility, LOS was measured from the date of transfer. We also assessed hospitals' cost attributable to long LOS admissions.
Patient Demographics and Clinical Characteristics
We measured demographic characteristics including age, gender, race/ethnicity, insurance type, and distance traveled (the linear distance between the centroid of the patient's home ZIP code and the centroid of the hospital's ZIP code). Clinical characteristics included CRG classification, complex chronic condition (CCC), and dependence on medical technology. CCCs are defined as any medical condition that can be reasonably expected to last at least 12 months (unless death intervenes) and to involve either several different organ systems or 1 system severely enough to require specialty pediatric care and probably some period of hospitalization in a tertiary care center.[20] Medical technology included devices used to optimize the health and functioning of the child (eg, gastrostomy, tracheostomy, cerebrospinal fluid shunt).[22]
Hospitalization Characteristics
Characteristics of the hospitalization included transfer from an outside facility, ICU admission, surgical procedure (using surgical APR‐DRGs), and discharge disposition (home, skilled nursing facility, home health services, death, other). Cost of the hospitalization was estimated in the PHIS from charges using hospital and year‐specific ratios of cost to charge.
Statistical Analysis
Continuous data (eg, distance from hospital to home residence) were described with median and interquartile ranges (IQR) because they were not normally distributed. Categorical data (eg, type of chronic condition) were described with counts and frequencies. In bivariate analyses, demographic, clinical, and hospitalization characteristics were stratified by LOS (long LOS vs LOS <10 days), and compared using 2 statistics or Wilcoxon rank sum tests as appropriate.
We modeled the likelihood of experiencing a long LOS using generalized linear mixed effects models with a random hospital intercept and discharge‐level fixed effects for age, gender, payor, CCC type, ICU utilization, transfer status, a medical/surgical admission indicator derived from the APR‐DRG, and CRG assigned to each hospitalization. To examine hospital‐to‐hospital variability, we generated hospital risk‐adjusted rates of long LOS from these models. Similar models and hospital risk‐adjusted rates were built for a post hoc correlational analysis of 30‐day all cause readmission, where hospitals' rates and percent of long LOS were compared with a Pearson correlation coefficient. Also, for our multivariable models, we performed a sensitivity analysis using an alternative definition of long LOS as 4 days (the 75th percentile of LOS for all children, with and without medical complexity, hospitalized during 20132014). All analyses were performed using SAS version 9.4 (SAS Institute, Cary, NC), and P values <0.05 were considered statistically significant.
RESULTS
Study Population
There were 954,018 hospitalizations of 217,163 CMC at 44 children's hospitals included for analysis. Forty‐seven percent of hospitalizations were for females, 49.4% for non‐Hispanic whites, and 61.1% for children with government insurance. Fifteen percent (n = 142,082) had a long LOS of 10 days. The median (IQR) LOS of hospitalizations <10 days versus 10 days were 2 (IQR, 14) and 16 days (IQR, 1226), respectively. Long LOS hospitalizations accounted for 61.1% (3.7 million) hospital days and 61.8% ($13.7 billion) of total hospitalization costs for all CMC in the cohort (Table 1).
| Characteristic | Overall (n = 954,018) | Length of Stay | |
|---|---|---|---|
| <10 Days (n = 811,936) | 10 Days (n = 142,082) | ||
| |||
| Age at admission, y, % | |||
| <1 | 14.6 | 12.7 | 25.7 |
| 14 | 27.1 | 27.9 | 22.4 |
| 59 | 20.1 | 21.0 | 14.9 |
| 1018 | 33.6 | 34.0 | 31.7 |
| 18+ | 4.6 | 4.4 | 5.4 |
| Gender, % | |||
| Female | 47.0 | 46.9 | 47.5 |
| Race/ethnicity, % | |||
| Non‐Hispanic white | 49.4 | 49.4 | 49.4 |
| Non‐Hispanic black | 23.1 | 23.8 | 19.3 |
| Hispanic | 18.2 | 17.8 | 20.4 |
| Asian | 2.0 | 1.9 | 2.3 |
| Other | 7.4 | 7.1 | 8.6 |
| Complex chronic condition, % | |||
| Any | 79.5 | 77.3 | 91.8 |
| Technology assistance | 37.1 | 34.1 | 54.2 |
| Gastrointestinal | 30.0 | 27.2 | 45.9 |
| Neuromuscular | 28.2 | 27.7 | 30.9 |
| Cardiovascular | 16.8 | 14.5 | 29.9 |
| Respiratory | 14.1 | 11.5 | 29.4 |
| Congenital/genetic defect | 17.2 | 16.7 | 20.2 |
| Metabolic | 9.9 | 8.9 | 15.4 |
| Renal | 10.1 | 9.5 | 13.8 |
| Hematology/emmmunodeficiency | 11.7 | 12.0 | 10.0 |
| Neonatal | 3.8 | 3.1 | 7.7 |
| Transplantation | 4.5 | 4.2 | 6.7 |
| Clinical risk group, % | |||
| Chronic condition in 2 systems | 68.4 | 71.2 | 53.9 |
| Catastrophic chronic condition | 31.4 | 28.8 | 46.1 |
| Distance from hospital to home residence in miles, median [IQR] | 16.2 [7.440.4] | 15.8 [7.338.7] | 19.1 [8.552.6] |
| Transferred from outside hospital (%) | 6.5 | 5.3 | 13.6 |
| Admitted for surgery, % | 23.4 | 20.7 | 38.7 |
| Use of intensive care, % | 19.6 | 14.9 | 46.5 |
| Discharge disposition, % | |||
| Home | 91.2 | 92.9 | 81.4 |
| Home healthcare | 4.5 | 3.5 | 9.9 |
| Other | 2.9 | 2.6 | 4.5 |
| Postacute care facility | 1.1 | 0.8 | 3.1 |
| Died | 0.4 | 0.3 | 1.1 |
| Payor, % | |||
| Government | 61.1 | 60.6 | 63.5 |
| Private | 33.2 | 33.6 | 30.9 |
| Other | 5.7 | 5.7 | 5.7 |
| Hospital resource use | |||
| Median length of stay [IQR] | 3 [16] | 2 [14] | 16 [1226] |
| Median hospital cost [IQR] | $8,144 [$4,122$18,447] | $6,689 [$3,685$12,395] | $49,207 [$29,444$95,738] |
| Total hospital cost, $, billions | $22.2 | $8.5 | $13.7 |
Demographics and Clinical Characteristics of Children With and Without Long LOS
Compared with hospitalized CMC with LOS <10 days, a higher percentage of hospitalizations with LOS 10 days were CMC age <1 year (25.7% vs 12.7%, P < 0.001) and Hispanic (20.4% vs 17.8%, P < 0.001). CMC hospitalizations with a long LOS had a higher percentage of any CCC (91.8% vs 77.3%, P < 0.001); the most common CCCs were gastrointestinal (45.9%), neuromuscular (30.9%), and cardiovascular (29.9%). Hospitalizations of CMC with a long LOS had a higher percentage of a catastrophic chronic condition (46.1% vs 28.8%, P < 0.001) and technology dependence (46.1% vs 28.8%, P < 0.001) (Table 1).
Hospitalization Characteristics of Children With and Without Long LOS
Compared with hospitalizations of CMC with LOS <10 days, hospitalizations of CMC with a long LOS more often involved transfer in from another hospital at admission (13.6% vs 5.3%, P < 0.001). CMC hospital stays with a long LOS more often involved surgery (38.7% vs 20.7%, P < 0.001) and use of intensive care (46.5% vs 14.9%; P < 0.001). A higher percentage of CMC with long LOS were discharged with home health services (9.9% vs 3.5%; P < 0.001) (Table 1).
The most common admitting diagnoses and CCCs for hospitalizations of CMC with long LOS are presented in Table 2. The two most prevalent APR‐DRGs in CMC hospitalizations lasting 10 days or longer were cystic fibrosis (10.7%) and respiratory system disease with ventilator support (5.5%). The two most common chronic condition characteristics represented among long CMC hospitalizations were gastrointestinal devices (eg, gastrostomy tube) (39.7%) and heart and great vessel malformations (eg, tetralogy of Fallot) (12.8%). The 5 most common CCC subcategories, as listed in Table 2, account for nearly 100% of the patients with long LOS hospitalizations.
| |
| Most common reason for admission* | |
| Cystic fibrosis | 10.7% |
| Respiratory system diagnosis with ventilator support 96+ hours | 5.5% |
| Malfunction, reaction, and complication of cardiac or vascular device or procedure | 2.8% |
| Craniotomy except for trauma | 2.6% |
| Major small and large bowel procedures | 2.3% |
| Most common complex chronic condition | |
| Gastrointestinal devices | 39.7% |
| Heart and great vessel malformations | 12.8% |
| Cystic fibrosis | 12.5% |
| Dysrhythmias | 11.0% |
| Respiratory devices | 10.7% |
Multivariable Analysis of Characteristics Associated With Long LOS
In multivariable analysis, the highest likelihood of long LOS was experienced by children who received care in the ICU (odds ratio [OR]: 3.5, 95% confidence interval [CI]: 3.43.5), who had a respiratory CCC (OR: 2.7, 95% CI: 2.62.7), and who were transferred from another acute care hospital at admission (OR: 2.1, 95% CI: 2.0, 2.1). The likelihood of long LOS was also higher in children <1 year of age (OR: 1.2, 95% CI: 1.21.3), and Hispanic children (OR: 1.1, 95% CI 1.0‐1.10) (Table 3). Similar multivariable findings were observed in sensitivity analysis using the 75th percentile of LOS (4 days) as the model outcome.
| Characteristic | Odds Ratio (95% CI) of LOS 10 Days | P Value |
|---|---|---|
| ||
| Use of intensive care | 3.5 (3.4‐3.5) | <0.001 |
| Transfer from another acute‐care hospital | 2.1 (2.0‐2.1) | <0.001 |
| Procedure/surgery | 1.8 (1.8‐1.9) | <0.001 |
| Complex chronic condition | ||
| Respiratory | 2.7 (2.6‐2.7) | <0.001 |
| Gastrointestinal | 1.8 (1.8‐1.8) | <0.001 |
| Metabolic | 1.7 (1.7‐1.7) | <0.001 |
| Cardiovascular | 1.6 (1.5‐1.6) | <0.001 |
| Neonatal | 1.5 (1.5‐1.5) | <0.001 |
| Renal | 1.4 (1.4‐1.4) | <0.001 |
| Transplant | 1.4 (1.4‐1.4) | <0.001 |
| Hematology and immunodeficiency | 1.3 (1.3‐1.3) | <0.001 |
| Technology assistance | 1.1 (1.1, 1.1) | <0.001 |
| Neuromuscular | 0.9 (0.9‐0.9) | <0.001 |
| Congenital or genetic defect | 0.8 (0.8‐0.8) | <0.001 |
| Age at admission, y | ||
| <1 | 1.2 (1.2‐1.3) | <0.001 |
| 14 | 0.5 (0.5‐0.5) | <0.001 |
| 59 | 0.6 (0.6‐0.6) | <0.001 |
| 1018 | 0.9 (0.9‐0.9) | <0.001 |
| 18+ | Reference | |
| Male | 0.9 (0.9‐0.9) | <0.001 |
| Race/ethnicity | ||
| Non‐Hispanic black | 0.9 (0.9‐0.9) | <0.001 |
| Hispanic | 1.1 (1.0‐1.1) | <0.001 |
| Asian | 1.0 (1.0‐1.1) | 0.3 |
| Other | 1.1 (1.1‐1.1) | <0.001 |
| Non‐Hispanic white | Reference | |
| Payor | ||
| Private | 0.9 (0.8 0.9) | <0.001 |
| Other | 1.0 (1.0‐1.0) | 0.4 |
| Government | Reference | |
| Season | ||
| Spring | 1.0 (1.0 1.0) | <0.001 |
| Summer | 0.9 (0.9‐0.9) | <0.001 |
| Fall | 1.0 (0.9‐1.0) | <0.001 |
| Winter | Reference | |
Variation in the Prevalence of Long LOS Across Children's Hospitals
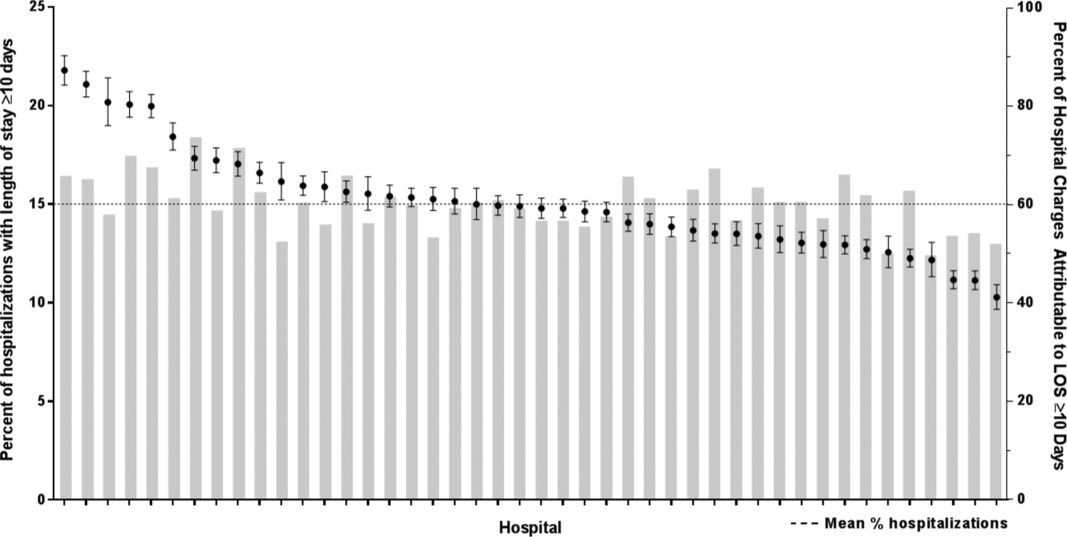
After controlling for demographic, clinical, and hospital characteristics associated with long LOS, there was significant (P < 0.001) variation in the prevalence of long LOS for CMC across children's hospitals in the cohort (range, 10.3%21.8%) (Figure 1). Twelve (27%) hospitals had a significantly (P < 0.001) higher prevalence of long LOS for their hospitalized CMC, compared to the mean. Eighteen (41%) had a significantly (P < 0.001) lower prevalence of long LOS for their hospitalized CMC. There was also significant variation across hospitals with respect to cost, with 49.7% to 73.7% of all hospital costs of CMC attributed to long LOS hospitalizations. Finally, there was indirect correlation with the prevalence of LOS across hospitals and the hospitals' 30‐day readmission rate ( = 0.3; P = 0.04). As the prevalence of long LOS increased, the readmission rate decreased.
DISCUSSION
The main findings from this study suggest that a small percentage of CMC experiencing long LOS account for the majority of hospital bed days and cost of all hospitalized CMC in children's hospitals. The likelihood of long LOS varies significantly by CMC's age, race/ethnicity, and payor as well as by type and number of chronic conditions. Among CMC with long LOS, the use of gastrointestinal devices such as gastrostomy tubes, as well as congenital heart disease, were highly prevalent. In multivariable analysis, the characteristics most strongly associated with LOS 10 days were use of the ICU, respiratory complex chronic condition, and transfer from another medical facility at admission. After adjusting for these factors, there was significant variation in the prevalence of LOS 10 days for CMC across children's hospitals.
Although it is well known that CMC as a whole have a major impact on resource use in children's hospitals, this study reveals that 15% of hospitalizations of CMC account for 62% of all hospital costs of CMC. That is, a small fraction of hospitalizations of CMC is largely responsible for the significant financial impact of hospital resource use. To date, most clinical efforts and policies striving to reduce hospital use in CMC have focused on avoiding readmissions or index hospital admissions entirely, rather than improving the efficiency of hospital care after admission occurs.[23, 24, 25, 26] In the adult population, the impact of long LOS on hospital costs has been recognized, and several Medicare incentive programs have focused on in‐hospital timeliness and efficiency. As a result, LOS in Medicare beneficiaries has decreased dramatically over the past 2 decades.[27, 28, 29, 30] Optimizing the efficiency of hospital care for CMC may be an important goal to pursue, especially with precedent set in the adult literature.
Perhaps the substantial variation across hospitals in the prevalence of long LOS in CMC indicates opportunity to improve the efficiency of their inpatient care. This variation was not due to differences across hospitals' case mix of CMC. Further investigation is needed to determine how much of it is due to differences in quality of care. Clinical practice guidelines for hospital treatment of common illnesses usually exclude CMC. In our clinical experience across 9 children's hospitals, we have experienced varying approaches to setting discharge goals (ie, parameters on how healthy the child needs to be to ensure a successful hospital discharge) for CMC.[31] When the goals are absent or not clearly articulated, they can contribute to a prolonged hospitalization. Some families of CMC report significant issues when working with pediatric hospital staff to assess their child's discharge readiness.[7, 32, 33] In addition, there is significant variation across states and regions in access to and quality of post‐discharge health services (eg, home nursing, postacute care, durable medical equipment).[34, 35] In some areas, many CMC are not actively involved with their primary care physician.[5] These issues might also influence the ability of some children's hospitals to efficiently discharge CMC to a safe and supportive post‐discharge environment. Further examination of hospital outliersthose with the lowest and highest percentage of CMC hospitalizations with long LOSmay reveal opportunities to identify and spread best practices.
The demographic and clinical factors associated with long LOS in the present study, including age, ICU use, and transfer from another hospital, might help hospitals target which CMC have the greatest risk for experiencing long LOS. We found that infants age <1 year had longer LOS when compared with older children. Similar to our findings, younger‐aged children hospitalized with bronchiolitis have longer LOS.[36] Certainly, infants with medical complexity, in general, are a high‐acuity population with the potential for rapid clinical deterioration during an acute illness. Prolonged hospitalization for treatment and stabilization may be expected for many of them. Additional investigation is warranted to examine ICU use in CMC, and whether ICU admission or duration can be safely prevented or abbreviated. Opportunities to assess the quality of transfers into children's hospitals of CMC admitted to outside hospitals may be necessary. A study of pediatric burn patients reported that patients initially stabilized at a facility that was not a burn center and subsequently transferred to a burn center had a longer LOS than patients solely treated at a designated burn center.[37] Furthermore, events during transport itself may adversely impact the stability of an already fragile patient. Interventions to optimize the quality of care provided by transport teams have resulted in decreased LOS at the receiving hospital.[38]
This study's findings should be considered in the context of several limitations. Absent a gold‐standard definition of long LOS, we used the distribution of LOS across patients to inform our methods; LOS at the 90th percentile was selected as long. Although our sensitivity analysis using LOS at the 75th percentile produced similar findings, other cut points in LOS might be associated with different results. The study is not positioned to determine how much of the reported LOS was excessive, unnecessary, or preventable. The study findings may not generalize to types of hospitals not contained in PHIS (eg, nonchildren's hospitals and community hospitals). We did not focus on the impact of a new diagnosis (eg, new chronic illness) or acute in‐hospital event (eg, nosocomial infection) on prolonged LOS; future studies should investigate these clinical events with LOS.
PHIS does not contain information regarding characteristics that could influence LOS, including the children's social and familial attributes, transportation availability, home equipment needs, and local availability of postacute care facilities. Moreover, PHIS does not contain information about the hospital discharge procedures, process, or personnel across hospitals, which could influence LOS. Future studies on prolonged LOS should consider assessing this information. Because of the large sample size of hospitalizations included, the statistical power for the analyses was strong, rendering it possible that some findings that were statistically significant might have modest clinical significance (eg, relationship of Hispanic ethnicity with prolonged LOS). We could not determine why a positive correlation was not observed between hospitals' long LOS prevalence and their percentage of cost associated with long LOS; future studies should investigate the reasons for this finding.
Despite these limitations, the findings of the present study highlight the significance of long LOS in hospitalized CMC. These long hospitalizations account for a significant proportion of all hospital costs for this important population of children. The prevalence of long LOS for CMC varies considerably across children's hospitals, even after accounting for the case mix. Efforts to curtail hospital resource use and costs for CMC may benefit from focus on long LOS.
- , , , et al. Inpatient growth and resource use in 28 children's hospitals: a longitudinal, multi‐institutional study. JAMA Pediatr. 2013;167(2):170–177.
- , , , et al. Children with complex chronic conditions in inpatient hospital settings in the united states. Pediatrics. 2010;126(4):647–655.
- , . Meeting the health care needs of persons with disabilities. Milbank Q. 2002;80(2):381–391.
- , , , et al. Effect of an enhanced medical home on serious illness and cost of care among high‐risk children with chronic illness: a randomized clinical trial. JAMA. 2014;312(24):2640–2648.
- , , , et al. Children with medical complexity and Medicaid: spending and cost savings. Health Aff Proj Hope. 2014;33(12):2199–2206.
- Children's Hospital Association. CARE Award. Available at: https://www.childrenshospitals.org/Programs‐and‐Services/Quality‐Improvement‐and‐Measurement/CARE‐Award. Accessed December 18, 2015.
- , , , et al. Hospital readmission and parent perceptions of their child's hospital discharge. Int J Qual Health Care. 2013;25(5):573–581.
- , , , et al. Weekend matters: Friday and Saturday admissions are associated with prolonged hospitalization of children. Clin Pediatr (Phila). 2013;52(9):875–878.
- , , , . Attributable cost and length of stay for central line‐associated bloodstream infections. Pediatrics. 2014;133(6):e1525–e1532.
- , , , et al. Effect of healthcare‐acquired infection on length of hospital stay and cost. Infect Control Hosp Epidemiol. 2007;28(3):280–292.
- , , , , . Hospital utilization and costs among children with influenza, 2003. Am J Prev Med. 2009;36(4):292–296.
- , , , . Charges and lengths of stay attributable to adverse patient‐care events using pediatric‐specific quality indicators: a multicenter study of freestanding children's hospitals. Pediatrics. 2008;121(6):e1653–e1659.
- , , , , . Variation in resource utilization for the management of uncomplicated community‐acquired pneumonia across community and children's hospitals. J Pediatr. 2014;165(3):585–591.
- , , , , . Variation and outcomes associated with direct hospital admission among children with pneumonia in the United States. JAMA Pediatr. 2014;168(9):829–836.
- , , , et al. Clinical Risk Groups (CRGs): a classification system for risk‐adjusted capitation‐based payment and health care management. Med Care. 2004;42(1):81–90.
- , , , et al. Identifying children with lifelong chronic conditions for care coordination by using hospital discharge data. Acad Pediatr. 2010;10(6):417–423.
- , , , , . Profile of medical charges for children by health status group and severity level in a Washington State Health Plan. Health Serv Res. 2004;39(1):73–89.
- , , , . Using medical billing data to evaluate chronically ill children over time. J Ambulatory Care Manage. 2006;29(4):283–290.
- , , , , , . Medical complexity and pediatric emergency department and inpatient utilization. Pediatrics. 2013;131(2):e559–e565.
- , , , , . Pediatric complex chronic conditions classification system version 2: updated for ICD‐10 and complex medical technology dependence and transplantation. BMC Pediatr. 2014;14:199.
- . Analyzing intensive care unit length of stay data: problems and possible solutions. Crit Care Med. 1997;25(9):1594–1600.
- , , , et al. Hospital utilization and characteristics of patients experiencing recurrent readmissions within children's hospitals. JAMA. 2011;305(7):682–690.
- . Hospital readmissions and repeat emergency department visits among children with medical complexity: an integrative review. J Pediatr Nurs. 2013;28(4):316–339.
- , , , . Hospital readmission in children with complex chronic conditions discharged from subacute care. Hosp Pediatr. 2014;4(3):153–158.
- , , , et al. Preventing hospitalizations in children with medical complexity: a systematic review. Pediatrics. 2014;134(6):e1628–e1647.
- , , , . Hospital readmissions for newly discharged pediatric home mechanical ventilation patients. Pediatr Pulmonol. 2012;47(4):409–414.
- , , , et al. Clinical characteristics and outcomes of Medicare patients undergoing total hip arthroplasty, 1991–2008. JAMA. 2011;305(15):1560–1567.
- , , , et al. Trends in length of stay and short‐term outcomes among Medicare patients hospitalized for heart failure, 1993–2006. JAMA. 2010;303(21):2141–2147.
- U.S. Department of Health and Human Services. CMS Statistics 2013. Available at: https://www.cms.gov/Research‐Statistics‐Data‐and‐Systems/Statistics‐Trends‐and‐Reports/CMS‐Statistics‐Reference‐Booklet/Downloads/CMS_Stats_2013_final.pdf. Published August 2013. Accessed October 6, 2015.
- Centers for Medicare and Medicaid Services. Evaluation of the premier hospital quality incentive demonstration. Available at: https://www.cms.gov/Research‐Statistics‐Data‐and‐Systems/Statistics‐Trends‐and‐Reports/Reports/downloads/Premier_ExecSum_2010.pdf. Published March 3, 2009. Accessed September 18, 2015.
- , , , et al. A framework of pediatric hospital discharge care informed by legislation, research, and practice. JAMA Pediatr. 2014;168(10):955–962; quiz 965–966.
- , , , , . Parent and provider perspectives on pediatric readmissions: what can we learn about readiness for discharge? Hosp Pediatr. 2015;5(11):559–565.
- , . Preventing readmissions in children: how do we do that? Hosp Pediatr. 2015;5(11):602–604.
- , , . Pediatric post‐acute hospital care: striving for identity and value. Hosp Pediatr. 2015;5(10):548–551.
- , , , et al. Pediatric hospital discharges to home health and postacute facility care: a national study. JAMA Pediatr. 2016;170(4):326–333.
- , , , et al. Bronchiolitis: clinical characteristics associated with hospitalization and length of stay. Pediatr Emerg Care. 2012;28(2):99–103.
- , , , , . The effect of transfers between health care facilities on costs and length of stay for pediatric burn patients. J Burn Care Res. 2015;36(1):178–183.
- , , , et al. Goal‐directed resuscitative interventions during pediatric interfacility transport. Crit Care Med. 2015;43(8):1692–1698.
Children with medical complexity (CMC) have complex and chronic health conditions that often involve multiple organ systems and severely affect cognitive and physical functioning. Although the prevalence of CMC is low (1% of all children), they account for nearly one‐fifth of all pediatric admissions and one‐half of all hospital days and charges in the United States.[1] Over the last decade, CMC have had a particularly large and increasing impact in tertiary‐care children's hospitals.[1, 2] The Institute of Medicine has identified CMC as a priority population for a revised healthcare system.[3]
Medical homes, hospitals, health plans, states, federal agencies, and others are striving to reduce excessive hospital use in CMC because of its high cost.[4, 5, 6] Containing length of stay (LOS)an increasingly used indicator of the time sensitiveness and efficiency of hospital careis a common aim across these initiatives. CMC have longer hospitalizations than children without medical complexity. Speculated reasons for this are that CMC tend to have (1) higher severity of acute illnesses (eg, pneumonia, cellulitis), (2) prolonged recovery time in the hospital, and (3) higher risk of adverse events in the hospital. Moreover, hospital clinicians caring for CMC often find it difficult to determine discharge readiness, given that many CMC do not return to a completely healthy baseline.[7]
Little is known about long LOS in CMC, including which CMC have the highest risk of experiencing such stays and which stays might have the greatest opportunity to be shortened. Patient characteristics associated with prolonged length of stay have been studied extensively for many pediatric conditions (eg, asthma).[8, 9, 10, 11, 12, 13, 14] However, most of these studies excluded CMC. Therefore, the objectives of this study were to examine (1) the prevalence of long LOS in CMC, (2) patient characteristics associated with long LOS, and (3) hospital‐to‐hospital variation in prevalence of long LOS hospitalizations.
METHODS
Study Design and Data Source
This study is a multicenter, retrospective cohort analysis of the Pediatric Health Information System (PHIS). PHIS is an administrative database of 44 not for profit, tertiary care pediatric hospitals affiliated with the Children's Hospital Association (CHA) (Overland Park, KS). PHIS contains data regarding patient demographics, diagnoses, and procedures (with International Classification of Diseases, 9th Revision, Clinical Modification [ICD‐9‐CM] codes), All‐Patient Refined Diagnostic Related Groups version 30 (APR‐DRGs) (3M Health Information Systems, Salt Lake City, UT), and service lines that aggregate the APR‐DRGs into 38 distinct groups. Data quality and reliability are assured through CHA and participating hospitals. In accordance with the policies of the Cincinnati Children's Hospital Medical Center Institutional Review Board, this study of deidentified data was not considered human subjects research.
Study Population
Inclusion Criteria
Children discharged following an observation or inpatient admission from a hospital participating in the PHIS database between January 1, 2013 and December 31, 2014 were eligible for inclusion if they were considered medically complex. Medical complexity was defined using Clinical Risk Groups (CRGs) version 1.8, developed by 3M Health Information Systems and the National Association of Children's Hospitals and Related Institutions. CRGs were used to assign each hospitalized patient to 1 of 9 mutually exclusive chronicity groups according to the presence, type, and severity of chronic conditions.[15, 16, 17, 18] Each patient's CRG designation was based on 2 years of previous hospital encounters.
As defined in prior studies and definitional frameworks of CMC,[1] patients belonging to CRG group 6 (significant chronic disease in 2 organ systems), CRG group 7 (dominant chronic disease in 3 organ systems), and CRG group 9 (catastrophic condition) were considered medically complex.[17, 19] Patients with malignancies (CRG group 8) were not included for analysis because they are a unique population with anticipated, long hospital stays. Patients with CRG group 5, representing those with chronic conditions affecting a single body system, were also not included because most do not have attributes consistent with medical complexity.
Exclusion Criteria
We used the APR‐DRG system, which leverages ICD‐9‐CM codes to identify the health problem most responsible for the hospitalization, to refine the study cohort. We excluded hospitalizations that were classified by the APR‐DRG system as neonatal, as we did not wish to focus on LOS in the neonatal intensive care unit (ICU) or for birth admissions. Similarly, hospitalizations for chemotherapy (APR‐DRG 693) or malignancy (identified with previously used ICD‐9‐CM codes)[20] were also excluded because long LOS is anticipated. We also excluded hospitalizations for medical rehabilitation (APR‐DRG 860).
Outcome Measures
The primary outcome measure was long LOS, defined as LOS 10 days. The cut point of LOS 10 days represents the 90th percentile of LOS for all children, with and without medical complexity, hospitalized during 2013 to 2014. LOS 10 days has previously been used as a threshold of long LOS.[21] For hospitalizations involving transfer at admission from another acute care facility, LOS was measured from the date of transfer. We also assessed hospitals' cost attributable to long LOS admissions.
Patient Demographics and Clinical Characteristics
We measured demographic characteristics including age, gender, race/ethnicity, insurance type, and distance traveled (the linear distance between the centroid of the patient's home ZIP code and the centroid of the hospital's ZIP code). Clinical characteristics included CRG classification, complex chronic condition (CCC), and dependence on medical technology. CCCs are defined as any medical condition that can be reasonably expected to last at least 12 months (unless death intervenes) and to involve either several different organ systems or 1 system severely enough to require specialty pediatric care and probably some period of hospitalization in a tertiary care center.[20] Medical technology included devices used to optimize the health and functioning of the child (eg, gastrostomy, tracheostomy, cerebrospinal fluid shunt).[22]
Hospitalization Characteristics
Characteristics of the hospitalization included transfer from an outside facility, ICU admission, surgical procedure (using surgical APR‐DRGs), and discharge disposition (home, skilled nursing facility, home health services, death, other). Cost of the hospitalization was estimated in the PHIS from charges using hospital and year‐specific ratios of cost to charge.
Statistical Analysis
Continuous data (eg, distance from hospital to home residence) were described with median and interquartile ranges (IQR) because they were not normally distributed. Categorical data (eg, type of chronic condition) were described with counts and frequencies. In bivariate analyses, demographic, clinical, and hospitalization characteristics were stratified by LOS (long LOS vs LOS <10 days), and compared using 2 statistics or Wilcoxon rank sum tests as appropriate.
We modeled the likelihood of experiencing a long LOS using generalized linear mixed effects models with a random hospital intercept and discharge‐level fixed effects for age, gender, payor, CCC type, ICU utilization, transfer status, a medical/surgical admission indicator derived from the APR‐DRG, and CRG assigned to each hospitalization. To examine hospital‐to‐hospital variability, we generated hospital risk‐adjusted rates of long LOS from these models. Similar models and hospital risk‐adjusted rates were built for a post hoc correlational analysis of 30‐day all cause readmission, where hospitals' rates and percent of long LOS were compared with a Pearson correlation coefficient. Also, for our multivariable models, we performed a sensitivity analysis using an alternative definition of long LOS as 4 days (the 75th percentile of LOS for all children, with and without medical complexity, hospitalized during 20132014). All analyses were performed using SAS version 9.4 (SAS Institute, Cary, NC), and P values <0.05 were considered statistically significant.
RESULTS
Study Population
There were 954,018 hospitalizations of 217,163 CMC at 44 children's hospitals included for analysis. Forty‐seven percent of hospitalizations were for females, 49.4% for non‐Hispanic whites, and 61.1% for children with government insurance. Fifteen percent (n = 142,082) had a long LOS of 10 days. The median (IQR) LOS of hospitalizations <10 days versus 10 days were 2 (IQR, 14) and 16 days (IQR, 1226), respectively. Long LOS hospitalizations accounted for 61.1% (3.7 million) hospital days and 61.8% ($13.7 billion) of total hospitalization costs for all CMC in the cohort (Table 1).
| Characteristic | Overall (n = 954,018) | Length of Stay | |
|---|---|---|---|
| <10 Days (n = 811,936) | 10 Days (n = 142,082) | ||
| |||
| Age at admission, y, % | |||
| <1 | 14.6 | 12.7 | 25.7 |
| 14 | 27.1 | 27.9 | 22.4 |
| 59 | 20.1 | 21.0 | 14.9 |
| 1018 | 33.6 | 34.0 | 31.7 |
| 18+ | 4.6 | 4.4 | 5.4 |
| Gender, % | |||
| Female | 47.0 | 46.9 | 47.5 |
| Race/ethnicity, % | |||
| Non‐Hispanic white | 49.4 | 49.4 | 49.4 |
| Non‐Hispanic black | 23.1 | 23.8 | 19.3 |
| Hispanic | 18.2 | 17.8 | 20.4 |
| Asian | 2.0 | 1.9 | 2.3 |
| Other | 7.4 | 7.1 | 8.6 |
| Complex chronic condition, % | |||
| Any | 79.5 | 77.3 | 91.8 |
| Technology assistance | 37.1 | 34.1 | 54.2 |
| Gastrointestinal | 30.0 | 27.2 | 45.9 |
| Neuromuscular | 28.2 | 27.7 | 30.9 |
| Cardiovascular | 16.8 | 14.5 | 29.9 |
| Respiratory | 14.1 | 11.5 | 29.4 |
| Congenital/genetic defect | 17.2 | 16.7 | 20.2 |
| Metabolic | 9.9 | 8.9 | 15.4 |
| Renal | 10.1 | 9.5 | 13.8 |
| Hematology/emmmunodeficiency | 11.7 | 12.0 | 10.0 |
| Neonatal | 3.8 | 3.1 | 7.7 |
| Transplantation | 4.5 | 4.2 | 6.7 |
| Clinical risk group, % | |||
| Chronic condition in 2 systems | 68.4 | 71.2 | 53.9 |
| Catastrophic chronic condition | 31.4 | 28.8 | 46.1 |
| Distance from hospital to home residence in miles, median [IQR] | 16.2 [7.440.4] | 15.8 [7.338.7] | 19.1 [8.552.6] |
| Transferred from outside hospital (%) | 6.5 | 5.3 | 13.6 |
| Admitted for surgery, % | 23.4 | 20.7 | 38.7 |
| Use of intensive care, % | 19.6 | 14.9 | 46.5 |
| Discharge disposition, % | |||
| Home | 91.2 | 92.9 | 81.4 |
| Home healthcare | 4.5 | 3.5 | 9.9 |
| Other | 2.9 | 2.6 | 4.5 |
| Postacute care facility | 1.1 | 0.8 | 3.1 |
| Died | 0.4 | 0.3 | 1.1 |
| Payor, % | |||
| Government | 61.1 | 60.6 | 63.5 |
| Private | 33.2 | 33.6 | 30.9 |
| Other | 5.7 | 5.7 | 5.7 |
| Hospital resource use | |||
| Median length of stay [IQR] | 3 [16] | 2 [14] | 16 [1226] |
| Median hospital cost [IQR] | $8,144 [$4,122$18,447] | $6,689 [$3,685$12,395] | $49,207 [$29,444$95,738] |
| Total hospital cost, $, billions | $22.2 | $8.5 | $13.7 |
Demographics and Clinical Characteristics of Children With and Without Long LOS
Compared with hospitalized CMC with LOS <10 days, a higher percentage of hospitalizations with LOS 10 days were CMC age <1 year (25.7% vs 12.7%, P < 0.001) and Hispanic (20.4% vs 17.8%, P < 0.001). CMC hospitalizations with a long LOS had a higher percentage of any CCC (91.8% vs 77.3%, P < 0.001); the most common CCCs were gastrointestinal (45.9%), neuromuscular (30.9%), and cardiovascular (29.9%). Hospitalizations of CMC with a long LOS had a higher percentage of a catastrophic chronic condition (46.1% vs 28.8%, P < 0.001) and technology dependence (46.1% vs 28.8%, P < 0.001) (Table 1).
Hospitalization Characteristics of Children With and Without Long LOS
Compared with hospitalizations of CMC with LOS <10 days, hospitalizations of CMC with a long LOS more often involved transfer in from another hospital at admission (13.6% vs 5.3%, P < 0.001). CMC hospital stays with a long LOS more often involved surgery (38.7% vs 20.7%, P < 0.001) and use of intensive care (46.5% vs 14.9%; P < 0.001). A higher percentage of CMC with long LOS were discharged with home health services (9.9% vs 3.5%; P < 0.001) (Table 1).
The most common admitting diagnoses and CCCs for hospitalizations of CMC with long LOS are presented in Table 2. The two most prevalent APR‐DRGs in CMC hospitalizations lasting 10 days or longer were cystic fibrosis (10.7%) and respiratory system disease with ventilator support (5.5%). The two most common chronic condition characteristics represented among long CMC hospitalizations were gastrointestinal devices (eg, gastrostomy tube) (39.7%) and heart and great vessel malformations (eg, tetralogy of Fallot) (12.8%). The 5 most common CCC subcategories, as listed in Table 2, account for nearly 100% of the patients with long LOS hospitalizations.
| |
| Most common reason for admission* | |
| Cystic fibrosis | 10.7% |
| Respiratory system diagnosis with ventilator support 96+ hours | 5.5% |
| Malfunction, reaction, and complication of cardiac or vascular device or procedure | 2.8% |
| Craniotomy except for trauma | 2.6% |
| Major small and large bowel procedures | 2.3% |
| Most common complex chronic condition | |
| Gastrointestinal devices | 39.7% |
| Heart and great vessel malformations | 12.8% |
| Cystic fibrosis | 12.5% |
| Dysrhythmias | 11.0% |
| Respiratory devices | 10.7% |
Multivariable Analysis of Characteristics Associated With Long LOS
In multivariable analysis, the highest likelihood of long LOS was experienced by children who received care in the ICU (odds ratio [OR]: 3.5, 95% confidence interval [CI]: 3.43.5), who had a respiratory CCC (OR: 2.7, 95% CI: 2.62.7), and who were transferred from another acute care hospital at admission (OR: 2.1, 95% CI: 2.0, 2.1). The likelihood of long LOS was also higher in children <1 year of age (OR: 1.2, 95% CI: 1.21.3), and Hispanic children (OR: 1.1, 95% CI 1.0‐1.10) (Table 3). Similar multivariable findings were observed in sensitivity analysis using the 75th percentile of LOS (4 days) as the model outcome.
| Characteristic | Odds Ratio (95% CI) of LOS 10 Days | P Value |
|---|---|---|
| ||
| Use of intensive care | 3.5 (3.4‐3.5) | <0.001 |
| Transfer from another acute‐care hospital | 2.1 (2.0‐2.1) | <0.001 |
| Procedure/surgery | 1.8 (1.8‐1.9) | <0.001 |
| Complex chronic condition | ||
| Respiratory | 2.7 (2.6‐2.7) | <0.001 |
| Gastrointestinal | 1.8 (1.8‐1.8) | <0.001 |
| Metabolic | 1.7 (1.7‐1.7) | <0.001 |
| Cardiovascular | 1.6 (1.5‐1.6) | <0.001 |
| Neonatal | 1.5 (1.5‐1.5) | <0.001 |
| Renal | 1.4 (1.4‐1.4) | <0.001 |
| Transplant | 1.4 (1.4‐1.4) | <0.001 |
| Hematology and immunodeficiency | 1.3 (1.3‐1.3) | <0.001 |
| Technology assistance | 1.1 (1.1, 1.1) | <0.001 |
| Neuromuscular | 0.9 (0.9‐0.9) | <0.001 |
| Congenital or genetic defect | 0.8 (0.8‐0.8) | <0.001 |
| Age at admission, y | ||
| <1 | 1.2 (1.2‐1.3) | <0.001 |
| 14 | 0.5 (0.5‐0.5) | <0.001 |
| 59 | 0.6 (0.6‐0.6) | <0.001 |
| 1018 | 0.9 (0.9‐0.9) | <0.001 |
| 18+ | Reference | |
| Male | 0.9 (0.9‐0.9) | <0.001 |
| Race/ethnicity | ||
| Non‐Hispanic black | 0.9 (0.9‐0.9) | <0.001 |
| Hispanic | 1.1 (1.0‐1.1) | <0.001 |
| Asian | 1.0 (1.0‐1.1) | 0.3 |
| Other | 1.1 (1.1‐1.1) | <0.001 |
| Non‐Hispanic white | Reference | |
| Payor | ||
| Private | 0.9 (0.8 0.9) | <0.001 |
| Other | 1.0 (1.0‐1.0) | 0.4 |
| Government | Reference | |
| Season | ||
| Spring | 1.0 (1.0 1.0) | <0.001 |
| Summer | 0.9 (0.9‐0.9) | <0.001 |
| Fall | 1.0 (0.9‐1.0) | <0.001 |
| Winter | Reference | |
Variation in the Prevalence of Long LOS Across Children's Hospitals
After controlling for demographic, clinical, and hospital characteristics associated with long LOS, there was significant (P < 0.001) variation in the prevalence of long LOS for CMC across children's hospitals in the cohort (range, 10.3%21.8%) (Figure 1). Twelve (27%) hospitals had a significantly (P < 0.001) higher prevalence of long LOS for their hospitalized CMC, compared to the mean. Eighteen (41%) had a significantly (P < 0.001) lower prevalence of long LOS for their hospitalized CMC. There was also significant variation across hospitals with respect to cost, with 49.7% to 73.7% of all hospital costs of CMC attributed to long LOS hospitalizations. Finally, there was indirect correlation with the prevalence of LOS across hospitals and the hospitals' 30‐day readmission rate ( = 0.3; P = 0.04). As the prevalence of long LOS increased, the readmission rate decreased.
DISCUSSION
The main findings from this study suggest that a small percentage of CMC experiencing long LOS account for the majority of hospital bed days and cost of all hospitalized CMC in children's hospitals. The likelihood of long LOS varies significantly by CMC's age, race/ethnicity, and payor as well as by type and number of chronic conditions. Among CMC with long LOS, the use of gastrointestinal devices such as gastrostomy tubes, as well as congenital heart disease, were highly prevalent. In multivariable analysis, the characteristics most strongly associated with LOS 10 days were use of the ICU, respiratory complex chronic condition, and transfer from another medical facility at admission. After adjusting for these factors, there was significant variation in the prevalence of LOS 10 days for CMC across children's hospitals.
Although it is well known that CMC as a whole have a major impact on resource use in children's hospitals, this study reveals that 15% of hospitalizations of CMC account for 62% of all hospital costs of CMC. That is, a small fraction of hospitalizations of CMC is largely responsible for the significant financial impact of hospital resource use. To date, most clinical efforts and policies striving to reduce hospital use in CMC have focused on avoiding readmissions or index hospital admissions entirely, rather than improving the efficiency of hospital care after admission occurs.[23, 24, 25, 26] In the adult population, the impact of long LOS on hospital costs has been recognized, and several Medicare incentive programs have focused on in‐hospital timeliness and efficiency. As a result, LOS in Medicare beneficiaries has decreased dramatically over the past 2 decades.[27, 28, 29, 30] Optimizing the efficiency of hospital care for CMC may be an important goal to pursue, especially with precedent set in the adult literature.
Perhaps the substantial variation across hospitals in the prevalence of long LOS in CMC indicates opportunity to improve the efficiency of their inpatient care. This variation was not due to differences across hospitals' case mix of CMC. Further investigation is needed to determine how much of it is due to differences in quality of care. Clinical practice guidelines for hospital treatment of common illnesses usually exclude CMC. In our clinical experience across 9 children's hospitals, we have experienced varying approaches to setting discharge goals (ie, parameters on how healthy the child needs to be to ensure a successful hospital discharge) for CMC.[31] When the goals are absent or not clearly articulated, they can contribute to a prolonged hospitalization. Some families of CMC report significant issues when working with pediatric hospital staff to assess their child's discharge readiness.[7, 32, 33] In addition, there is significant variation across states and regions in access to and quality of post‐discharge health services (eg, home nursing, postacute care, durable medical equipment).[34, 35] In some areas, many CMC are not actively involved with their primary care physician.[5] These issues might also influence the ability of some children's hospitals to efficiently discharge CMC to a safe and supportive post‐discharge environment. Further examination of hospital outliersthose with the lowest and highest percentage of CMC hospitalizations with long LOSmay reveal opportunities to identify and spread best practices.
The demographic and clinical factors associated with long LOS in the present study, including age, ICU use, and transfer from another hospital, might help hospitals target which CMC have the greatest risk for experiencing long LOS. We found that infants age <1 year had longer LOS when compared with older children. Similar to our findings, younger‐aged children hospitalized with bronchiolitis have longer LOS.[36] Certainly, infants with medical complexity, in general, are a high‐acuity population with the potential for rapid clinical deterioration during an acute illness. Prolonged hospitalization for treatment and stabilization may be expected for many of them. Additional investigation is warranted to examine ICU use in CMC, and whether ICU admission or duration can be safely prevented or abbreviated. Opportunities to assess the quality of transfers into children's hospitals of CMC admitted to outside hospitals may be necessary. A study of pediatric burn patients reported that patients initially stabilized at a facility that was not a burn center and subsequently transferred to a burn center had a longer LOS than patients solely treated at a designated burn center.[37] Furthermore, events during transport itself may adversely impact the stability of an already fragile patient. Interventions to optimize the quality of care provided by transport teams have resulted in decreased LOS at the receiving hospital.[38]
This study's findings should be considered in the context of several limitations. Absent a gold‐standard definition of long LOS, we used the distribution of LOS across patients to inform our methods; LOS at the 90th percentile was selected as long. Although our sensitivity analysis using LOS at the 75th percentile produced similar findings, other cut points in LOS might be associated with different results. The study is not positioned to determine how much of the reported LOS was excessive, unnecessary, or preventable. The study findings may not generalize to types of hospitals not contained in PHIS (eg, nonchildren's hospitals and community hospitals). We did not focus on the impact of a new diagnosis (eg, new chronic illness) or acute in‐hospital event (eg, nosocomial infection) on prolonged LOS; future studies should investigate these clinical events with LOS.
PHIS does not contain information regarding characteristics that could influence LOS, including the children's social and familial attributes, transportation availability, home equipment needs, and local availability of postacute care facilities. Moreover, PHIS does not contain information about the hospital discharge procedures, process, or personnel across hospitals, which could influence LOS. Future studies on prolonged LOS should consider assessing this information. Because of the large sample size of hospitalizations included, the statistical power for the analyses was strong, rendering it possible that some findings that were statistically significant might have modest clinical significance (eg, relationship of Hispanic ethnicity with prolonged LOS). We could not determine why a positive correlation was not observed between hospitals' long LOS prevalence and their percentage of cost associated with long LOS; future studies should investigate the reasons for this finding.
Despite these limitations, the findings of the present study highlight the significance of long LOS in hospitalized CMC. These long hospitalizations account for a significant proportion of all hospital costs for this important population of children. The prevalence of long LOS for CMC varies considerably across children's hospitals, even after accounting for the case mix. Efforts to curtail hospital resource use and costs for CMC may benefit from focus on long LOS.
- , , , et al. Inpatient growth and resource use in 28 children's hospitals: a longitudinal, multi‐institutional study. JAMA Pediatr. 2013;167(2):170–177.
- , , , et al. Children with complex chronic conditions in inpatient hospital settings in the united states. Pediatrics. 2010;126(4):647–655.
- , . Meeting the health care needs of persons with disabilities. Milbank Q. 2002;80(2):381–391.
- , , , et al. Effect of an enhanced medical home on serious illness and cost of care among high‐risk children with chronic illness: a randomized clinical trial. JAMA. 2014;312(24):2640–2648.
- , , , et al. Children with medical complexity and Medicaid: spending and cost savings. Health Aff Proj Hope. 2014;33(12):2199–2206.
- Children's Hospital Association. CARE Award. Available at: https://www.childrenshospitals.org/Programs‐and‐Services/Quality‐Improvement‐and‐Measurement/CARE‐Award. Accessed December 18, 2015.
- , , , et al. Hospital readmission and parent perceptions of their child's hospital discharge. Int J Qual Health Care. 2013;25(5):573–581.
- , , , et al. Weekend matters: Friday and Saturday admissions are associated with prolonged hospitalization of children. Clin Pediatr (Phila). 2013;52(9):875–878.
- , , , . Attributable cost and length of stay for central line‐associated bloodstream infections. Pediatrics. 2014;133(6):e1525–e1532.
- , , , et al. Effect of healthcare‐acquired infection on length of hospital stay and cost. Infect Control Hosp Epidemiol. 2007;28(3):280–292.
- , , , , . Hospital utilization and costs among children with influenza, 2003. Am J Prev Med. 2009;36(4):292–296.
- , , , . Charges and lengths of stay attributable to adverse patient‐care events using pediatric‐specific quality indicators: a multicenter study of freestanding children's hospitals. Pediatrics. 2008;121(6):e1653–e1659.
- , , , , . Variation in resource utilization for the management of uncomplicated community‐acquired pneumonia across community and children's hospitals. J Pediatr. 2014;165(3):585–591.
- , , , , . Variation and outcomes associated with direct hospital admission among children with pneumonia in the United States. JAMA Pediatr. 2014;168(9):829–836.
- , , , et al. Clinical Risk Groups (CRGs): a classification system for risk‐adjusted capitation‐based payment and health care management. Med Care. 2004;42(1):81–90.
- , , , et al. Identifying children with lifelong chronic conditions for care coordination by using hospital discharge data. Acad Pediatr. 2010;10(6):417–423.
- , , , , . Profile of medical charges for children by health status group and severity level in a Washington State Health Plan. Health Serv Res. 2004;39(1):73–89.
- , , , . Using medical billing data to evaluate chronically ill children over time. J Ambulatory Care Manage. 2006;29(4):283–290.
- , , , , , . Medical complexity and pediatric emergency department and inpatient utilization. Pediatrics. 2013;131(2):e559–e565.
- , , , , . Pediatric complex chronic conditions classification system version 2: updated for ICD‐10 and complex medical technology dependence and transplantation. BMC Pediatr. 2014;14:199.
- . Analyzing intensive care unit length of stay data: problems and possible solutions. Crit Care Med. 1997;25(9):1594–1600.
- , , , et al. Hospital utilization and characteristics of patients experiencing recurrent readmissions within children's hospitals. JAMA. 2011;305(7):682–690.
- . Hospital readmissions and repeat emergency department visits among children with medical complexity: an integrative review. J Pediatr Nurs. 2013;28(4):316–339.
- , , , . Hospital readmission in children with complex chronic conditions discharged from subacute care. Hosp Pediatr. 2014;4(3):153–158.
- , , , et al. Preventing hospitalizations in children with medical complexity: a systematic review. Pediatrics. 2014;134(6):e1628–e1647.
- , , , . Hospital readmissions for newly discharged pediatric home mechanical ventilation patients. Pediatr Pulmonol. 2012;47(4):409–414.
- , , , et al. Clinical characteristics and outcomes of Medicare patients undergoing total hip arthroplasty, 1991–2008. JAMA. 2011;305(15):1560–1567.
- , , , et al. Trends in length of stay and short‐term outcomes among Medicare patients hospitalized for heart failure, 1993–2006. JAMA. 2010;303(21):2141–2147.
- U.S. Department of Health and Human Services. CMS Statistics 2013. Available at: https://www.cms.gov/Research‐Statistics‐Data‐and‐Systems/Statistics‐Trends‐and‐Reports/CMS‐Statistics‐Reference‐Booklet/Downloads/CMS_Stats_2013_final.pdf. Published August 2013. Accessed October 6, 2015.
- Centers for Medicare and Medicaid Services. Evaluation of the premier hospital quality incentive demonstration. Available at: https://www.cms.gov/Research‐Statistics‐Data‐and‐Systems/Statistics‐Trends‐and‐Reports/Reports/downloads/Premier_ExecSum_2010.pdf. Published March 3, 2009. Accessed September 18, 2015.
- , , , et al. A framework of pediatric hospital discharge care informed by legislation, research, and practice. JAMA Pediatr. 2014;168(10):955–962; quiz 965–966.
- , , , , . Parent and provider perspectives on pediatric readmissions: what can we learn about readiness for discharge? Hosp Pediatr. 2015;5(11):559–565.
- , . Preventing readmissions in children: how do we do that? Hosp Pediatr. 2015;5(11):602–604.
- , , . Pediatric post‐acute hospital care: striving for identity and value. Hosp Pediatr. 2015;5(10):548–551.
- , , , et al. Pediatric hospital discharges to home health and postacute facility care: a national study. JAMA Pediatr. 2016;170(4):326–333.
- , , , et al. Bronchiolitis: clinical characteristics associated with hospitalization and length of stay. Pediatr Emerg Care. 2012;28(2):99–103.
- , , , , . The effect of transfers between health care facilities on costs and length of stay for pediatric burn patients. J Burn Care Res. 2015;36(1):178–183.
- , , , et al. Goal‐directed resuscitative interventions during pediatric interfacility transport. Crit Care Med. 2015;43(8):1692–1698.

Pediatric Hospitalization Epidemiology
Improvement in the quality of hospital care in the United States is a national priority, both to advance patient safety and because our expenditures exceed any other nation's, but our health outcomes lag behind.[1, 2] Healthcare spending for children is growing at a faster rate than any other age group, with hospital care accounting for more than 40% of pediatric healthcare expenditures.[3] Inpatient healthcare comprises a greater proportion of healthcare costs for children than for adults, yet we have limited knowledge about where this care is provided.[4]
There is substantial variability in the settings in which children are hospitalized. Children may be hospitalized in freestanding children's hospitals, where all services are designed for children and which operate independently of adult‐focused institutions. They may also be hospitalized in general hospitals where care may be provided in a general inpatient bed, on a dedicated pediatric ward, or in a children's hospital nested within a hospital, which may have specialized nursing and physician care but often shares other resources such as laboratory and radiology with the primarily adult‐focused institution. Medical students and residents may be trained in all of these settings. We know little about how these hospital types differ with respect to patient populations, disease volumes, and resource utilization, and this knowledge is important to inform clinical programs, implementation research, and quality improvement (QI) priorities. To this end, we aimed to describe the volume and characteristics of pediatric hospitalizations at acute care general hospitals and freestanding children's hospitals in the United States.
METHODS
Study Design and Eligibility
The data source for this analysis was the Healthcare Cost and Utilization Project's (HCUP) 2012 Kids' Inpatient Database (KID). We conducted a cross‐sectional study of hospitalizations in children and adolescents less than 18 years of age, excluding in‐hospital births and hospitalizations for pregnancy and delivery (identified using All Patient Refined‐Diagnostic Related Groups [APR‐DRGs]).[5] Neonatal hospitalizations not representing in‐hospital births but resulting from transfers or new admissions were retained. Because the dataset does not contain identifiable information, the institutional review board at Baystate Medical Center determined that our study did not constitute human subjects research.
The KID is released every 3 years and is the only publicly available, nationally representative database developed to study pediatric hospitalizations, including an 80% sample of noninborn pediatric discharges from all community, nonrehabilitation hospitals from 44 participating states.[6] Short‐term rehabilitation hospitals, long‐term nonacute care hospitals, psychiatric hospitals, and alcoholism/chemical dependency treatment facilities are excluded. The KID contains information on all patients, regardless of payer, and provides discharge weights to calculate national estimates.[6] It contains both hospital‐level and patient‐level variables, including demographic characteristics, charges, and other clinical and resource use data available from discharge abstracts. Beginning in 2012, freestanding children's hospitals (FCHs) are assigned to a separate stratum in the KID, with data from the Children's Hospital Association used by HCUP to verify the American Hospital Association's (AHA) list of FCHs.[6] Hospitals that are not FCHs were categorized as general hospitals (GHs). We were interested in examining patterns of care at acute care hospitals and not specialty hospitals; unlike previous years, the KID 2012 does not include a specialty hospital identifier.[6] Therefore, as a proxy for specialty hospital status, we excluded hospitals that had 2% hospitalizations for 12 common medical conditions (pneumonia, asthma, bronchiolitis, cellulitis, dehydration, urinary tract infection, neonatal hyperbilirubinemia, fever, upper respiratory infection, infectious gastroenteritis, unspecified viral infection, and croup). These medical conditions were the 12 most common reasons for medical hospitalizations identified using Keren's pediatric diagnosis code grouper,[7] excluding chronic diseases, and represented 26.2% of all pediatric hospitalizations. This 2% threshold was developed empirically, based on visual analysis of the distribution of cases across hospitals and was limited to hospitals with total pediatric volumes >25/year, allowing for stable case‐mix estimates.
Descriptor Variables
Hospital level characteristics included US Census region; teaching status classified in the KID based on results of the AHA Annual Survey; urban/rural location; hospital ownership, classified as public, private nonprofit and private investor‐owned; and total volume of pediatric hospitalizations, in deciles.[6] At the patient level, we examined age, gender, race/ethnicity, expected primary payer, and median household income (in quartiles) for patient's zip code. Medical complexity was categorized as (1) nonchronic disease, (2) complex chronic disease, or (3) noncomplex chronic disease, using the previously validated Pediatric Medical Complexity Algorithm (PMCA) based on International Classification of Diseases, 9th Revision, Clinical Modification (ICD‐9‐CM) codes.[8] Disease severity was classified based on APR‐DRG severity of illness coding, which classifies illnesses severity as minor, moderate, major, or extreme.[9]
We examined the following characteristics of the hospitalizations: (1) length of hospital stay (LOS) measured in calendar days; (2) high‐turnover hospitalization defined as LOS less than 2 days[10, 11, 12]; (3) long LOS, defined as greater than 4 days, equivalent to LOS greater than the 75th percentile; (4) neonatal versus non‐neonatal hospitalization, identified using APR‐DRGs; (5) admission type categorized as elective and nonelective; (6) admission source, categorized as transfer from another acute care hospital, admission from the emergency department, or direct admission; (7) discharge status, categorized as routine discharge, transfer to another hospital or healthcare facility, and discharge against medical advice; and (8) total hospital costs, calculated by applying the cost‐to‐charge ratios available in the KID to total hospital charges.
Reasons for hospitalization were categorized using the pediatric diagnosis code grouper by Keren, which uses ICD‐9‐CM codes to group common and costly principal diagnoses into distinct conditions (eg, pneumonia, idiopathic scoliosis), excluding children who have ICD‐9‐CM principal procedure codes unlikely related to their principal diagnosis (for example, appendectomy for a child with a principal diagnosis of pneumonia).[7] This pediatric grouper classifies diagnoses as medical, surgical, or medical‐surgical based on whether <20% (medical), >80% (surgical) or between 20% and 80% (medical‐surgical) of encounters for the condition had an ICD‐9‐CM principal procedure code for a surgery related to that condition. We further characterized medical hospitalizations as either medical or mental health hospitalizations.
Statistical Analysis
We categorized each discharge record as a hospitalization at a GH or an FCH. We then calculated patient‐level summary statistics, applying weights to calculate national estimates with an associated standard deviation (SD). We assessed differences in characteristics of hospitalizations at GHs and FCHs using Rao‐Scott 2 tests for categorical variables and Wald F tests for continuous variables.[6] We identified the most common reasons for hospitalization, including those responsible for at least 2% of all medical or surgical hospitalizations and at least 0.5% of medical hospitalizations for mental health diagnoses, given the lower prevalence of these conditions and our desire to include mental health diagnoses in our analysis. For these common conditions, we calculated the proportion of condition‐specific hospitalizations and aggregate hospital costs at GHs and FCHs. We also determined the number of hospitalizations at each hospital and calculated the median and interquartile range for the number of hospitalizations for each of these conditions according to hospital type, assessing for differences using Kruskal‐Wallis tests. Finally, we identified the most common and costly conditions at GHs and FCHs by ranking frequency and aggregate costs for each condition according to hospital type, limited to the 20 most costly and/or prevalent pediatric diagnoses. Because we used a novel method to identify specialty hospitals in this dataset, we repeated these analyses using all hospitals classified as a GH and FCH as a sensitivity analysis.
RESULTS
Overall, 3866 hospitals were categorized as a GH, whereas 70 hospitals were categorized as FCHs. Following exclusion of specialty hospitals, 3758 GHs and 50 FCHs were retained in this study. The geographic distribution of hospitals was similar, but although GHs included those in both urban and rural regions, all FCHs were located in urban regions (Table 1).
| General Hospitals, n = 3,758 | Children's Hospitals, n = 50 | ||||
|---|---|---|---|---|---|
| Hospital characteristics | n | % | n | % | P Value |
| |||||
| Geographic region | |||||
| Northeast | 458 | 12.2 | 4 | 8.0 | 0.50 |
| Midwest | 1,209 | 32.2 | 15 | 30.0 | |
| South | 1,335 | 35.6 | 17 | 34.0 | |
| West | 753 | 20.1 | 14 | 28.0 | |
| Location and teaching status | |||||
| Rural | 1,524 | 40.6 | 0 | 0 | <0.0001 |
| Urban nonteaching | 1,506 | 40.1 | 7 | 14.0 | |
| Urban teaching | 725 | 19.3 | 43 | 86.0 | |
| Hospital ownership | |||||
| Government, nonfederal | 741 | 19.7 | 0 | 0 | <0.0001 |
| Private, nonprofit | 2,364 | 63.0 | 48 | 96.0 | |
| Private, investor‐owned | 650 | 17.3 | 2 | 4.0 | |
| Volume of pediatric hospitalizations (deciles) | |||||
| <185 hospitalizations/year (<8th decile) | 2,664 | 71.0 | 0 | 0 | <0.0001 |
| 186375 hospitalizations/year (8th decile) | 378 | 10.1 | 2 | 4.0 | |
| 376996 hospitalizations/year (9th decile) | 380 | 10.1 | 1 | 2.0 | |
| >986 hospitalizations/year (10th decile) | 333 | 8.9 | 47 | 94.0 | |
| Volume of pediatric hospitalizations, median [IQR] | 56 | [14240] | 12,001 | [5,83815,448] | <0.0001 |
A total of 1,407,822 (SD 50,456) hospitalizations occurred at GHs, representing 71.7% of pediatric hospitalizations, whereas 554,458 (SD 45,046) hospitalizations occurred at FCHs. Hospitalizations at GHs accounted for 63.6% of days in hospital and 50.0% of pediatric inpatient healthcare costs. Eighty percent of the GHs had total pediatric patient volumes of less than 375 hospitalizations yearly; 11.1% of pediatric hospitalizations occurred at these lower‐volume centers. At FCHs, the median volume of pediatric hospitalizations was 12,001 (interquartile range [IQR]: 583815,448). A total of 36 GHs had pediatric hospitalization volumes in this IQR.
The median age for pediatric patients was slightly higher at GHs, whereas gender, race/ethnicity, primary payer, and median household income for zip code did not differ significantly between hospital types (Table 2). Medical complexity differed between hospital types: children with complex chronic diseases represented 20.2% of hospitalizations at GHs and 35.6% of hospitalizations at FCHs. Severity of illness differed between hospital types, with fewer hospitalizations categorized at the highest level of severity at GHs than FCHs. There were no significant differences between hospital types with respect to the proportion of hospitalizations categorized as neonatal hospitalizations or as elective hospitalizations. The median LOS was shorter at GHs than FCHs. Approximately 1 in 5 children hospitalized at GHs had LOS greater than 4 days, whereas almost 30% of children hospitalized at FCHs had LOS of this duration.
| Patient Characteristics |
General Hospitals,1,407,822 (50,456), 71.7% |
Children's Hospitals,554,458 (45,046), 28.3% |
P Value | ||||
|---|---|---|---|---|---|---|---|
| n | (SD Weighted Frequency) | (%) | n | (SD Weighted Frequency) | % | ||
| |||||||
| Age, y, median [IQR] | 3.6 [011.7] | 3.4 [010.8] | 0.001 | ||||
| Gender (% female) | 644,250 | (23,089) | 45.8 | 254,505 | (20,688) | 45.9 | 0.50 |
| Race* | |||||||
| White | 668,876 | (27,741) | 47.5 | 233,930 | (26,349) | 42.2 | 0.05 |
| Black | 231,586 | (12,890) | 16.5 | 80,568 | (11,739) | 14.5 | |
| Hispanic | 279,021 | (16,843) | 19.8 | 12,1425 | (21,183) | 21.9 | |
| Other | 133,062 | (8,572) | 9.5 | 41,190 | (6,394) | 7.4 | |
| Insurance status | |||||||
| Public | 740,033 | (28,675) | 52.6 | 284,795 | (25,324) | 51.4 | 0.90 |
| Private | 563,562 | (21,930) | 40.0 | 224,042 | (21,613) | 40.4 | |
| Uninsured | 37,265 | (1,445) | 2.7 | 16,355 | (3,804) | 3.0 | |
| No charge/other/unknown | 66,962 | (5,807) | 4.8 | 29,266 | (6,789) | 5.3 | |
| Median household income for zip code, quartiles | |||||||
| <$38,999 | 457,139 | (19,725) | 33.3 | 164,831 | (17,016) | 30.1 | 0.07 |
| $39,000$47,999 | 347,229 | (14,104) | 25.3 | 125,105 | (10,712) | 22.9 | |
| $48,000$62,999 | 304,795 | (13,427) | 22.2 | 134,915 | (13,999) | 24.7 | |
| >$63,000 | 263,171 | (15,418) | 19.2 | 122,164 | (16,279) | 22.3 | |
| Medical complexity | |||||||
| Nonchronic disease | 717,009 | (21,807) | 50.9 | 211,089 | (17,023) | 38.1 | <0.001 |
| Noncomplex chronic disease | 406,070 | (14,951) | 28.8 | 146,077 | (12,442) | 26.4 | |
| Complex chronic disease | 284,742 | (17,111) | 20.2 | 197,292 | (18,236) | 35.6 | |
| APR‐DRG severity of illness | |||||||
| 1 (lowest severity) | 730,134 | (23,162) | 51.9 | 217,202 | (18,433) | 39.2 | <0.001 |
| 2 | 486,748 | (18,395) | 34.6 | 202,931 | (16,864) | 36.6 | |
| 3 | 146,921 | (8,432) | 10.4 | 100,566 | (9,041) | 18.1 | |
| 4 (highest severity) | 41,749 | (3,002) | 3.0 | 33,340 | (3,199) | 6.0 | |
| Hospitalization characteristics | |||||||
| Neonatal hospitalization | 98,512 | (3,336) | 7.0 | 39,584 | (4,274) | 7.1 | 0.84 |
| Admission type | |||||||
| Elective | 255,774 | (12,285) | 18.3 | 109,854 | (13,061) | 19.8 | 0.05 |
| Length of stay, d, (median [IQR]) | 1.8 (0.01) [0.8‐3.6] | 2.2 (0.06) [1.1‐4.7] | <0.001 | ||||
| High turnover hospitalizations | 416,790 | (14,995) | 29.6 | 130,441 | (12,405) | 23.5 | <0.001 |
| Length of stay >4 days | 298,315 | (14,421) | 21.2 | 161,804 | (14,354) | 29.2 | <0.001 |
| Admission source | |||||||
| Transfer from another acute care hospital | 154,058 | (10,067) | 10.9 | 82,118 | (8,952) | 14.8 | 0.05 |
| Direct admission | 550,123 | (21,954) | 39.1 | 211,117 | (20,203) | 38.1 | |
| Admission from ED | 703,641 | (26,155) | 50.0 | 261,223 | (28,708) | 47.1 | |
| Discharge status | |||||||
| Routine | 1,296,638 | (46,012) | 92.1 | 519,785 | (42,613) | 93.8 | <0.01 |
| Transfer to another hospital or healthcare facility | 56,115 | (1,922) | 4.0 | 13,035 | (1,437) | 2.4 | |
| Discharge against medical advice | 2,792 | (181) | 0.2 | 382 | (70) | 0.1 | |
| Other | 52,276 | (4,223) | 3.7 | 21,256 | (4,501) | 3.8 | |
The most common pediatric medical, mental health, and surgical conditions are shown in Figure 1, together representing 32% of pediatric hospitalizations during the study period. For these medical conditions, 77.9% of hospitalizations occurred at GHs, ranging from 52.6% of chemotherapy hospitalizations to 89.0% of hospitalizations for neonatal hyperbilirubinemia. Sixty‐two percent of total hospital costs for these conditions were incurred at GHs. For the common mental health hospitalizations, 86% of hospitalizations occurred at GHs. The majority of hospitalizations and aggregate hospital costs for common surgical conditions also occurred at GHs.

Whereas pneumonia, asthma, and bronchiolitis were the most common reasons for hospitalization at both GHs and FCHs, the most costly conditions differed (see Supporting Table 1 in the online version of this article). At GHs, these respiratory diseases were responsible for the highest condition‐specific total hospital costs. At FCHs, the highest aggregate costs were due to respiratory distress syndrome and chemotherapy. Congenital heart diseases, including hypoplastic left heart syndrome, transposition of the great vessels, tetralogy of Fallot, endocardial cushion defects, coarctation of the aorta and ventricular septal defects accounted for 6 of the 20 most costly conditions at FCHs.
Figure 2 illustrates the volume of hospitalizations, per hospital, at GHs and FCHs for the most common medical hospitalizations. The median number of hospitalizations, per hospital, was consistently significantly lower at GHs than at FCHs (all P values <0.001). Similar results for surgical and mental health hospitalizations are shown as Supporting Figures 1 and 2 in the online version of this article. In our sensitivity analyses that included all hospitals classified as GH and FCH, all results were essentially unchanged.
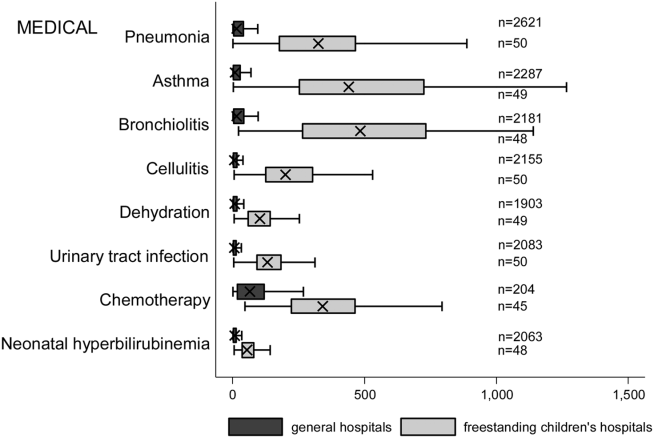
Recognizing the wide range of pediatric volumes at GHs (Table 1) and our inability to differentiate children's hospitals nested within GHs from GHs with pediatric beds, we examined differences in patient and hospitalization characteristics at GHs with volumes 5838 hospitalizations (the 25th percentile for FCH volume) and GHs with pediatric volumes <5838/year (see Supporting Table 2 in the online version of this article). We also compared patient and hospitalization characteristics at FCHs and the higher‐volume GHs. A total of 36 GHs had pediatric volumes 5838, with hospitalizations at these sites together accounting for 15.4% of all pediatric hospitalizations. Characteristics of patients hospitalized at these higher‐volume GHs were similar to patients hospitalized at FCHs, but they had significantly lower disease severity, fewer neonatal hospitalizations, shorter LOS, and more high‐turnover hospitalizations than patients hospitalized at FCHs. We also observed several differences between children hospitalized at higher‐ and lower‐volume GHs (see Supporting Table 2 in the online version of this article). Children hospitalized at the lower‐volume GHs were more likely to have public health insurance and less likely to have complex chronic diseases, although overall, 39.0% of all hospitalizations for children with complex chronic diseases occurred at these lower‐volume GHs. Compared to children hospitalized at higher‐volume GHs, children hospitalized at the lower‐volume hospitals had significantly lower disease severity, shorter LOS, more direct admissions, and a greater proportion of routine discharges.
DISCUSSION
Of the 2 million pediatric hospitalizations in the United States in 2012, more than 70% occurred at GHs. We observed considerable heterogeneity in pediatric volumes across GHs, with 11% of pediatric hospitalizations occurring at hospitals with pediatric volumes of <375 hospitalizations annually, whereas 15% of pediatric hospitalizations occurred at GHs with volumes similar to those observed at FCHs. The remaining pediatric hospitalizations at GHs occurred at centers with intermediate volumes. The most common reasons for hospitalization were similar at GHs and FCHs, but the most costly conditions differed substantially. These findings have important implications for pediatric clinical care programs, research, and QI efforts.
Our finding that more than 70% of pediatric hospitalizations occurred at GHs speaks to the importance of quality measurement at these hospitals, whereas low per‐hospital pediatric volumes at the majority of GHs makes such measurement particularly challenging. Several previous studies have illustrated that volumes of pediatric hospitalizations are too small to detect meaningful differences in quality between hospitals using established condition‐specific metrics.[13, 14, 15] Our finding that more than 10% of pediatric hospitalizations occurred at GHs with pediatric volumes <375 year supports previous research suggesting that cross‐cutting, all‐condition quality metrics, composite measures, and/or multihospital reporting networks may be needed to enable quality measurement at these sites. In addition, the heterogeneity in patient volumes and characteristics across GHs raise questions about the applicability of quality metrics developed and validated at FCHs to the many GH settings. Field‐testing quality measures to ensure their validity at diverse GHs, particularly those with patient volumes and infrastructure different from FCHs, will be important to meaningful pediatric quality measurement.
Our results illustrating differences in the most common and costly conditions at GHs and FCHs have further implications for prioritization and implementation of research and QI efforts. Implementation research and QI efforts focused on cardiac and neurosurgical procedures, as well as neonatal intensive care, may have considerable impact on cost and quality at FCHs. At GHs, research and QI efforts focused on common conditions are needed to increase our knowledge of contextually relevant barriers to and facilitators of high‐quality pediatric care. This, however, can be made more difficult by small sample sizes, limited resources, and infrastructure, and competing priorities in adult‐focused GH settings.[16, 17, 18] Multihospital learning collaboratives and partnerships between FCHs and GHs can begin to address these challenges, but their success is contingent upon national advocacy and funding to support pediatric research and quality measures at GHs.
One of the most notable differences in the characteristics of pediatric hospitalizations at GHs and FCHs was the proportion of hospitalizations attributable to children with medical complexity (CMC); more than one‐third of hospitalizations at FCHs were for CMC compared to 1 in 5 at GHs. These findings align with the results of several previous studies describing the substantial resource utilization attributed to CMC, and with growing research, innovation, and quality metrics focused on improving both inpatient and outpatient care for these vulnerable children.[19, 20, 21, 22] Structured complex care programs, developed to improve care coordination and healthcare quality for CMC, are common at FCHs, and have been associated with decreased resource utilization and improved outcomes.[23, 24, 25] Notably, however, more than half of all hospitalizations for CMC, exceeding 250,000 annually, occurred at GHs, and almost 40% of hospitalizations for CMC occurred at the lower‐volume GHs. These findings speak to the importance of translating effective and innovative programs of care for CMC to GHs as resources allow, accompanied by robust evaluations of their effectiveness. Lower patient volume at most GHs, however, may be a barrier to dedicated CMC programs. As a result, decentralized community‐based programs of care for CMC, linking primary care programs with regional and tertiary care hospitals, warrant further consideration.[26, 27, 28]
This analysis should be interpreted in light of several limitations. First, we were unable to distinguish between GHs with scant pediatric‐specific resources from those with a large volume of dedicated pediatric resources, such as children's hospitals nested within GHs. We did identify 36 GHs with pediatric volumes similar to those observed at FCHs (see Supporting Table 2 in the online version of this article); patient and hospitalization characteristics at these higher‐volume GHs were similar in many ways to children hospitalized at FCHs. Several of these higher‐volume GHs may have considerable resources dedicated to the care of children, including subspecialty care, and may represent children's hospitals nested within GHs. Because nested children's hospitals are included in the GH categorization, our results may have underestimated the proportion of children cared for at children's hospitals. Further work is needed to identify the health systems challenges and opportunities that may be unique to these institutions. Second, because the 2012 KID does not include a specialty hospital indicator, we developed a proxy method for identifying these hospitals, which may have resulted in some misclassification. We are reassured that the results of our analyses did not change substantively when we included all hospitals. Similarly, although we are reassured that the number of hospitals classified in our analysis as acute care FCHs aligns, approximately, with the number of hospitals classified as such by the Children's Hospital Association, we were unable to assess the validity of this variable within the KID. Third, the KID does not link records at the patient level, so we are unable to report the number of unique children included in this analysis. In addition, the KID includes only inpatient stays with exclusion of observation status stays; potential differences between GH and FCH in the use of observation status could have biased our findings. Fifth, we used the PMCA to identify CMC; although this algorithm has been shown to have excellent sensitivity in identifying children with chronic diseases, using up to 3 years of Medicaid claims data, the sensitivity using the KID, where only 1 inpatient stay is available for assessment, is unknown.[8, 29] Similarly, use of Keren's pediatric diagnosis grouper to classify reasons for hospitalization may have resulted in misclassification, though there are few other nonproprietary pediatric‐specific diagnostic groupers available.
In 2012, more than 70% of pediatric hospitalizations occurred at GHs in the United States. The considerably higher pediatric volumes at FCHs makes these institutions well suited for research, innovation, and the development and application of disease‐specific QI initiatives. Recognizing that the majority of pediatric hospitalizations occurred at GHs, there is a clear need for implementation research, program development, and quality metrics that align with the characteristics of hospitalizations at these centers. National support for research and quality improvement that reflects the diverse hospital settings where children receive their hospital care is critical to further our nation's goal of improving hospital quality for children.
Disclosures
Dr. Leyenaar was supported by grant number K08HS024133 from the Agency for Healthcare Research and Quality. The content is solely the responsibility of the authors and does not necessarily represent the official views of the Agency for Healthcare Research and Quality. The authors have no conflicts of interest relevant to this article to disclose.
- , , , . Mirror, Mirror on the wall: how the performance of the US health care system compares internationally. The Commonwealth Fund. Available at: http://www.commonwealthfund.org/publications/fund‐reports/2014/jun/mirror‐mirror. Published June 16, 2014. Accessed August 26, 2015.
- , , , , , . Higher cost, but poorer outcomes: the US health disadvantage and implications for pediatrics. Pediatrics. 2015;135(6):961–964.
- , , , , . US health spending trends by age and gender: selected years 2002–10. Health Aff (Millwood). 2014;33(5):815–822.
- , , . Costs for hospital stays in the United States, 2012. Healthcare Cost and Utilization Project 181. Available at: http://www.hcup‐us.ahrq.gov/reports/statbriefs/sb181‐Hospital‐Costs‐United‐States‐2012.pdf. Published October 2014. Accessed September 2015.
- , , , et al. All Patient Refined Diagnosis Related Groups: Methodology Overview. 3M Health Information Systems. Available at: https://www.hcup‐us.ahrq.gov/db/nation/nis/APR‐DRGsV20MethodologyOverviewandBibliography.pdf. Accessed February 8, 2016.
- Agency for Healthcare Research and Quality. Healthcare Cost and Utilization Project. Introduction to the HCUP Kids' Inpatient Database (KID) 2012. Available at: https://www.hcup‐us.ahrq.gov/db/nation/kid/kid_2012_introduction.jsp. Published Issued July 2014. Accessed February 8, 2016.
- . Prioritization of comparative effectiveness research topics in hospital pediatrics. Arch Pediatr Adolesc Med. 2012;166(12):1155.
- , , , et al. Pediatric medical complexity algorithm: a new method to stratify children by medical complexity. Pediatrics. 2014;133(6):e1647–e1654.
- , , , et al. 3M APR DRG Classification System. 3M Health Information Systems. Available at: http://www.hcup‐us.ahrq.gov/db/nation/nis/v261_aprdrg_meth_ovrview.pdf. Accessed August 7, 2015.
- , , , , , . Trends in high‐turnover stays among children hospitalized in the United States, 1993–2003. Pediatrics. 2009;123(3):996–1002.
- , , , . High turnover stays for pediatric asthma in the United States. Med Care. 2010;48(9):827–833.
- , , , , . Variation and outcomes associated with direct admission among children with pneumonia in the United States. JAMA Pediatr. 2014;168(9):829–836.
- , , , et al. Recognizing differences in hospital quality performance for pediatric inpatient care. Pediatrics. 2015;136(2):251–262.
- , , . Small numbers limit the use of the inpatient pediatric quality indicators for hospital comparison. Acad Pediatr. 2010;10(4):266–273.
- , , , et al. Statistical uncertainty of mortality rates and rankings for children's hospitals. Pediatrics. 2011;128(4):e966–e972.
- , , , , . Determinants of career satisfaction among pediatric hospitalists: a qualitative exploration. Acad Pediatr. 2014;14(4):361–368.
- , , , et al. Quality improvement research in pediatric hospital medicine and the role of the Pediatric Research in Inpatient Settings (PRIS) network. Acad Pediatr. 2013;13(6 suppl):S54–S60.
- . Roles for children's hospitals in pediatric collaborative improvement networks. Pediatrics. 2013;131(suppl 4):S215–S218.
- , , , et al. Children with medical complexity: an emerging population for clinical and research initiatives. Pediatrics. 2011;127(3):529–538.
- , , , et al. Children with complex chronic conditions in inpatient hospital settings in the United States. Pediatrics. 2010;126(4):647–655.
- , , , , , . Patterns and costs of health care use of children with medical complexity. Pediatrics. 2012;130(6):e1463–e1470.
- , , , , , . Hospital utilization and characteristics of patients experiencing recurrent readmissions within children's hospitals. JAMA. 2011;305(7):682–690.
- , , , et al. Characteristics of hospitalizations for patients who use a structured clinical care program for children with medical complexity. J Pediatr. 2011;159(2):284–290.
- , , , . Hospital‐based comprehensive care programs for children with special health care needs: a systematic review. Arch Pediatr Adolesc Med. 2011;165(6):554–561.
- , , , , , . A tertiary care–primary care partnership model for medically complex and fragile children and youth with special health care needs. Arch Pediatr Adolesc Med. 2007;161(10):937–944.
- , , , et al. Integrated complex care coordination for children with medical complexity: a mixed‐methods evaluation of tertiary care‐community collaboration. BMC Health Serv Res. 2012;12:366.
- , , , . Medical transport of children with complex chronic conditions. Emerg Med Int. 2012;2012:837020.
- , , . Comanagement of medically complex children by subspecialists, generalists, and care coordinators. Pediatrics. 2014;134(2):203–205.
- , , , , . Ways to identify children with medical complexity and the importance of why. J Pediatr. 2015;167(2):229–237.
Improvement in the quality of hospital care in the United States is a national priority, both to advance patient safety and because our expenditures exceed any other nation's, but our health outcomes lag behind.[1, 2] Healthcare spending for children is growing at a faster rate than any other age group, with hospital care accounting for more than 40% of pediatric healthcare expenditures.[3] Inpatient healthcare comprises a greater proportion of healthcare costs for children than for adults, yet we have limited knowledge about where this care is provided.[4]
There is substantial variability in the settings in which children are hospitalized. Children may be hospitalized in freestanding children's hospitals, where all services are designed for children and which operate independently of adult‐focused institutions. They may also be hospitalized in general hospitals where care may be provided in a general inpatient bed, on a dedicated pediatric ward, or in a children's hospital nested within a hospital, which may have specialized nursing and physician care but often shares other resources such as laboratory and radiology with the primarily adult‐focused institution. Medical students and residents may be trained in all of these settings. We know little about how these hospital types differ with respect to patient populations, disease volumes, and resource utilization, and this knowledge is important to inform clinical programs, implementation research, and quality improvement (QI) priorities. To this end, we aimed to describe the volume and characteristics of pediatric hospitalizations at acute care general hospitals and freestanding children's hospitals in the United States.
METHODS
Study Design and Eligibility
The data source for this analysis was the Healthcare Cost and Utilization Project's (HCUP) 2012 Kids' Inpatient Database (KID). We conducted a cross‐sectional study of hospitalizations in children and adolescents less than 18 years of age, excluding in‐hospital births and hospitalizations for pregnancy and delivery (identified using All Patient Refined‐Diagnostic Related Groups [APR‐DRGs]).[5] Neonatal hospitalizations not representing in‐hospital births but resulting from transfers or new admissions were retained. Because the dataset does not contain identifiable information, the institutional review board at Baystate Medical Center determined that our study did not constitute human subjects research.
The KID is released every 3 years and is the only publicly available, nationally representative database developed to study pediatric hospitalizations, including an 80% sample of noninborn pediatric discharges from all community, nonrehabilitation hospitals from 44 participating states.[6] Short‐term rehabilitation hospitals, long‐term nonacute care hospitals, psychiatric hospitals, and alcoholism/chemical dependency treatment facilities are excluded. The KID contains information on all patients, regardless of payer, and provides discharge weights to calculate national estimates.[6] It contains both hospital‐level and patient‐level variables, including demographic characteristics, charges, and other clinical and resource use data available from discharge abstracts. Beginning in 2012, freestanding children's hospitals (FCHs) are assigned to a separate stratum in the KID, with data from the Children's Hospital Association used by HCUP to verify the American Hospital Association's (AHA) list of FCHs.[6] Hospitals that are not FCHs were categorized as general hospitals (GHs). We were interested in examining patterns of care at acute care hospitals and not specialty hospitals; unlike previous years, the KID 2012 does not include a specialty hospital identifier.[6] Therefore, as a proxy for specialty hospital status, we excluded hospitals that had 2% hospitalizations for 12 common medical conditions (pneumonia, asthma, bronchiolitis, cellulitis, dehydration, urinary tract infection, neonatal hyperbilirubinemia, fever, upper respiratory infection, infectious gastroenteritis, unspecified viral infection, and croup). These medical conditions were the 12 most common reasons for medical hospitalizations identified using Keren's pediatric diagnosis code grouper,[7] excluding chronic diseases, and represented 26.2% of all pediatric hospitalizations. This 2% threshold was developed empirically, based on visual analysis of the distribution of cases across hospitals and was limited to hospitals with total pediatric volumes >25/year, allowing for stable case‐mix estimates.
Descriptor Variables
Hospital level characteristics included US Census region; teaching status classified in the KID based on results of the AHA Annual Survey; urban/rural location; hospital ownership, classified as public, private nonprofit and private investor‐owned; and total volume of pediatric hospitalizations, in deciles.[6] At the patient level, we examined age, gender, race/ethnicity, expected primary payer, and median household income (in quartiles) for patient's zip code. Medical complexity was categorized as (1) nonchronic disease, (2) complex chronic disease, or (3) noncomplex chronic disease, using the previously validated Pediatric Medical Complexity Algorithm (PMCA) based on International Classification of Diseases, 9th Revision, Clinical Modification (ICD‐9‐CM) codes.[8] Disease severity was classified based on APR‐DRG severity of illness coding, which classifies illnesses severity as minor, moderate, major, or extreme.[9]
We examined the following characteristics of the hospitalizations: (1) length of hospital stay (LOS) measured in calendar days; (2) high‐turnover hospitalization defined as LOS less than 2 days[10, 11, 12]; (3) long LOS, defined as greater than 4 days, equivalent to LOS greater than the 75th percentile; (4) neonatal versus non‐neonatal hospitalization, identified using APR‐DRGs; (5) admission type categorized as elective and nonelective; (6) admission source, categorized as transfer from another acute care hospital, admission from the emergency department, or direct admission; (7) discharge status, categorized as routine discharge, transfer to another hospital or healthcare facility, and discharge against medical advice; and (8) total hospital costs, calculated by applying the cost‐to‐charge ratios available in the KID to total hospital charges.
Reasons for hospitalization were categorized using the pediatric diagnosis code grouper by Keren, which uses ICD‐9‐CM codes to group common and costly principal diagnoses into distinct conditions (eg, pneumonia, idiopathic scoliosis), excluding children who have ICD‐9‐CM principal procedure codes unlikely related to their principal diagnosis (for example, appendectomy for a child with a principal diagnosis of pneumonia).[7] This pediatric grouper classifies diagnoses as medical, surgical, or medical‐surgical based on whether <20% (medical), >80% (surgical) or between 20% and 80% (medical‐surgical) of encounters for the condition had an ICD‐9‐CM principal procedure code for a surgery related to that condition. We further characterized medical hospitalizations as either medical or mental health hospitalizations.
Statistical Analysis
We categorized each discharge record as a hospitalization at a GH or an FCH. We then calculated patient‐level summary statistics, applying weights to calculate national estimates with an associated standard deviation (SD). We assessed differences in characteristics of hospitalizations at GHs and FCHs using Rao‐Scott 2 tests for categorical variables and Wald F tests for continuous variables.[6] We identified the most common reasons for hospitalization, including those responsible for at least 2% of all medical or surgical hospitalizations and at least 0.5% of medical hospitalizations for mental health diagnoses, given the lower prevalence of these conditions and our desire to include mental health diagnoses in our analysis. For these common conditions, we calculated the proportion of condition‐specific hospitalizations and aggregate hospital costs at GHs and FCHs. We also determined the number of hospitalizations at each hospital and calculated the median and interquartile range for the number of hospitalizations for each of these conditions according to hospital type, assessing for differences using Kruskal‐Wallis tests. Finally, we identified the most common and costly conditions at GHs and FCHs by ranking frequency and aggregate costs for each condition according to hospital type, limited to the 20 most costly and/or prevalent pediatric diagnoses. Because we used a novel method to identify specialty hospitals in this dataset, we repeated these analyses using all hospitals classified as a GH and FCH as a sensitivity analysis.
RESULTS
Overall, 3866 hospitals were categorized as a GH, whereas 70 hospitals were categorized as FCHs. Following exclusion of specialty hospitals, 3758 GHs and 50 FCHs were retained in this study. The geographic distribution of hospitals was similar, but although GHs included those in both urban and rural regions, all FCHs were located in urban regions (Table 1).
| General Hospitals, n = 3,758 | Children's Hospitals, n = 50 | ||||
|---|---|---|---|---|---|
| Hospital characteristics | n | % | n | % | P Value |
| |||||
| Geographic region | |||||
| Northeast | 458 | 12.2 | 4 | 8.0 | 0.50 |
| Midwest | 1,209 | 32.2 | 15 | 30.0 | |
| South | 1,335 | 35.6 | 17 | 34.0 | |
| West | 753 | 20.1 | 14 | 28.0 | |
| Location and teaching status | |||||
| Rural | 1,524 | 40.6 | 0 | 0 | <0.0001 |
| Urban nonteaching | 1,506 | 40.1 | 7 | 14.0 | |
| Urban teaching | 725 | 19.3 | 43 | 86.0 | |
| Hospital ownership | |||||
| Government, nonfederal | 741 | 19.7 | 0 | 0 | <0.0001 |
| Private, nonprofit | 2,364 | 63.0 | 48 | 96.0 | |
| Private, investor‐owned | 650 | 17.3 | 2 | 4.0 | |
| Volume of pediatric hospitalizations (deciles) | |||||
| <185 hospitalizations/year (<8th decile) | 2,664 | 71.0 | 0 | 0 | <0.0001 |
| 186375 hospitalizations/year (8th decile) | 378 | 10.1 | 2 | 4.0 | |
| 376996 hospitalizations/year (9th decile) | 380 | 10.1 | 1 | 2.0 | |
| >986 hospitalizations/year (10th decile) | 333 | 8.9 | 47 | 94.0 | |
| Volume of pediatric hospitalizations, median [IQR] | 56 | [14240] | 12,001 | [5,83815,448] | <0.0001 |
A total of 1,407,822 (SD 50,456) hospitalizations occurred at GHs, representing 71.7% of pediatric hospitalizations, whereas 554,458 (SD 45,046) hospitalizations occurred at FCHs. Hospitalizations at GHs accounted for 63.6% of days in hospital and 50.0% of pediatric inpatient healthcare costs. Eighty percent of the GHs had total pediatric patient volumes of less than 375 hospitalizations yearly; 11.1% of pediatric hospitalizations occurred at these lower‐volume centers. At FCHs, the median volume of pediatric hospitalizations was 12,001 (interquartile range [IQR]: 583815,448). A total of 36 GHs had pediatric hospitalization volumes in this IQR.
The median age for pediatric patients was slightly higher at GHs, whereas gender, race/ethnicity, primary payer, and median household income for zip code did not differ significantly between hospital types (Table 2). Medical complexity differed between hospital types: children with complex chronic diseases represented 20.2% of hospitalizations at GHs and 35.6% of hospitalizations at FCHs. Severity of illness differed between hospital types, with fewer hospitalizations categorized at the highest level of severity at GHs than FCHs. There were no significant differences between hospital types with respect to the proportion of hospitalizations categorized as neonatal hospitalizations or as elective hospitalizations. The median LOS was shorter at GHs than FCHs. Approximately 1 in 5 children hospitalized at GHs had LOS greater than 4 days, whereas almost 30% of children hospitalized at FCHs had LOS of this duration.
| Patient Characteristics |
General Hospitals,1,407,822 (50,456), 71.7% |
Children's Hospitals,554,458 (45,046), 28.3% |
P Value | ||||
|---|---|---|---|---|---|---|---|
| n | (SD Weighted Frequency) | (%) | n | (SD Weighted Frequency) | % | ||
| |||||||
| Age, y, median [IQR] | 3.6 [011.7] | 3.4 [010.8] | 0.001 | ||||
| Gender (% female) | 644,250 | (23,089) | 45.8 | 254,505 | (20,688) | 45.9 | 0.50 |
| Race* | |||||||
| White | 668,876 | (27,741) | 47.5 | 233,930 | (26,349) | 42.2 | 0.05 |
| Black | 231,586 | (12,890) | 16.5 | 80,568 | (11,739) | 14.5 | |
| Hispanic | 279,021 | (16,843) | 19.8 | 12,1425 | (21,183) | 21.9 | |
| Other | 133,062 | (8,572) | 9.5 | 41,190 | (6,394) | 7.4 | |
| Insurance status | |||||||
| Public | 740,033 | (28,675) | 52.6 | 284,795 | (25,324) | 51.4 | 0.90 |
| Private | 563,562 | (21,930) | 40.0 | 224,042 | (21,613) | 40.4 | |
| Uninsured | 37,265 | (1,445) | 2.7 | 16,355 | (3,804) | 3.0 | |
| No charge/other/unknown | 66,962 | (5,807) | 4.8 | 29,266 | (6,789) | 5.3 | |
| Median household income for zip code, quartiles | |||||||
| <$38,999 | 457,139 | (19,725) | 33.3 | 164,831 | (17,016) | 30.1 | 0.07 |
| $39,000$47,999 | 347,229 | (14,104) | 25.3 | 125,105 | (10,712) | 22.9 | |
| $48,000$62,999 | 304,795 | (13,427) | 22.2 | 134,915 | (13,999) | 24.7 | |
| >$63,000 | 263,171 | (15,418) | 19.2 | 122,164 | (16,279) | 22.3 | |
| Medical complexity | |||||||
| Nonchronic disease | 717,009 | (21,807) | 50.9 | 211,089 | (17,023) | 38.1 | <0.001 |
| Noncomplex chronic disease | 406,070 | (14,951) | 28.8 | 146,077 | (12,442) | 26.4 | |
| Complex chronic disease | 284,742 | (17,111) | 20.2 | 197,292 | (18,236) | 35.6 | |
| APR‐DRG severity of illness | |||||||
| 1 (lowest severity) | 730,134 | (23,162) | 51.9 | 217,202 | (18,433) | 39.2 | <0.001 |
| 2 | 486,748 | (18,395) | 34.6 | 202,931 | (16,864) | 36.6 | |
| 3 | 146,921 | (8,432) | 10.4 | 100,566 | (9,041) | 18.1 | |
| 4 (highest severity) | 41,749 | (3,002) | 3.0 | 33,340 | (3,199) | 6.0 | |
| Hospitalization characteristics | |||||||
| Neonatal hospitalization | 98,512 | (3,336) | 7.0 | 39,584 | (4,274) | 7.1 | 0.84 |
| Admission type | |||||||
| Elective | 255,774 | (12,285) | 18.3 | 109,854 | (13,061) | 19.8 | 0.05 |
| Length of stay, d, (median [IQR]) | 1.8 (0.01) [0.8‐3.6] | 2.2 (0.06) [1.1‐4.7] | <0.001 | ||||
| High turnover hospitalizations | 416,790 | (14,995) | 29.6 | 130,441 | (12,405) | 23.5 | <0.001 |
| Length of stay >4 days | 298,315 | (14,421) | 21.2 | 161,804 | (14,354) | 29.2 | <0.001 |
| Admission source | |||||||
| Transfer from another acute care hospital | 154,058 | (10,067) | 10.9 | 82,118 | (8,952) | 14.8 | 0.05 |
| Direct admission | 550,123 | (21,954) | 39.1 | 211,117 | (20,203) | 38.1 | |
| Admission from ED | 703,641 | (26,155) | 50.0 | 261,223 | (28,708) | 47.1 | |
| Discharge status | |||||||
| Routine | 1,296,638 | (46,012) | 92.1 | 519,785 | (42,613) | 93.8 | <0.01 |
| Transfer to another hospital or healthcare facility | 56,115 | (1,922) | 4.0 | 13,035 | (1,437) | 2.4 | |
| Discharge against medical advice | 2,792 | (181) | 0.2 | 382 | (70) | 0.1 | |
| Other | 52,276 | (4,223) | 3.7 | 21,256 | (4,501) | 3.8 | |
The most common pediatric medical, mental health, and surgical conditions are shown in Figure 1, together representing 32% of pediatric hospitalizations during the study period. For these medical conditions, 77.9% of hospitalizations occurred at GHs, ranging from 52.6% of chemotherapy hospitalizations to 89.0% of hospitalizations for neonatal hyperbilirubinemia. Sixty‐two percent of total hospital costs for these conditions were incurred at GHs. For the common mental health hospitalizations, 86% of hospitalizations occurred at GHs. The majority of hospitalizations and aggregate hospital costs for common surgical conditions also occurred at GHs.
Whereas pneumonia, asthma, and bronchiolitis were the most common reasons for hospitalization at both GHs and FCHs, the most costly conditions differed (see Supporting Table 1 in the online version of this article). At GHs, these respiratory diseases were responsible for the highest condition‐specific total hospital costs. At FCHs, the highest aggregate costs were due to respiratory distress syndrome and chemotherapy. Congenital heart diseases, including hypoplastic left heart syndrome, transposition of the great vessels, tetralogy of Fallot, endocardial cushion defects, coarctation of the aorta and ventricular septal defects accounted for 6 of the 20 most costly conditions at FCHs.
Figure 2 illustrates the volume of hospitalizations, per hospital, at GHs and FCHs for the most common medical hospitalizations. The median number of hospitalizations, per hospital, was consistently significantly lower at GHs than at FCHs (all P values <0.001). Similar results for surgical and mental health hospitalizations are shown as Supporting Figures 1 and 2 in the online version of this article. In our sensitivity analyses that included all hospitals classified as GH and FCH, all results were essentially unchanged.
Recognizing the wide range of pediatric volumes at GHs (Table 1) and our inability to differentiate children's hospitals nested within GHs from GHs with pediatric beds, we examined differences in patient and hospitalization characteristics at GHs with volumes 5838 hospitalizations (the 25th percentile for FCH volume) and GHs with pediatric volumes <5838/year (see Supporting Table 2 in the online version of this article). We also compared patient and hospitalization characteristics at FCHs and the higher‐volume GHs. A total of 36 GHs had pediatric volumes 5838, with hospitalizations at these sites together accounting for 15.4% of all pediatric hospitalizations. Characteristics of patients hospitalized at these higher‐volume GHs were similar to patients hospitalized at FCHs, but they had significantly lower disease severity, fewer neonatal hospitalizations, shorter LOS, and more high‐turnover hospitalizations than patients hospitalized at FCHs. We also observed several differences between children hospitalized at higher‐ and lower‐volume GHs (see Supporting Table 2 in the online version of this article). Children hospitalized at the lower‐volume GHs were more likely to have public health insurance and less likely to have complex chronic diseases, although overall, 39.0% of all hospitalizations for children with complex chronic diseases occurred at these lower‐volume GHs. Compared to children hospitalized at higher‐volume GHs, children hospitalized at the lower‐volume hospitals had significantly lower disease severity, shorter LOS, more direct admissions, and a greater proportion of routine discharges.
DISCUSSION
Of the 2 million pediatric hospitalizations in the United States in 2012, more than 70% occurred at GHs. We observed considerable heterogeneity in pediatric volumes across GHs, with 11% of pediatric hospitalizations occurring at hospitals with pediatric volumes of <375 hospitalizations annually, whereas 15% of pediatric hospitalizations occurred at GHs with volumes similar to those observed at FCHs. The remaining pediatric hospitalizations at GHs occurred at centers with intermediate volumes. The most common reasons for hospitalization were similar at GHs and FCHs, but the most costly conditions differed substantially. These findings have important implications for pediatric clinical care programs, research, and QI efforts.
Our finding that more than 70% of pediatric hospitalizations occurred at GHs speaks to the importance of quality measurement at these hospitals, whereas low per‐hospital pediatric volumes at the majority of GHs makes such measurement particularly challenging. Several previous studies have illustrated that volumes of pediatric hospitalizations are too small to detect meaningful differences in quality between hospitals using established condition‐specific metrics.[13, 14, 15] Our finding that more than 10% of pediatric hospitalizations occurred at GHs with pediatric volumes <375 year supports previous research suggesting that cross‐cutting, all‐condition quality metrics, composite measures, and/or multihospital reporting networks may be needed to enable quality measurement at these sites. In addition, the heterogeneity in patient volumes and characteristics across GHs raise questions about the applicability of quality metrics developed and validated at FCHs to the many GH settings. Field‐testing quality measures to ensure their validity at diverse GHs, particularly those with patient volumes and infrastructure different from FCHs, will be important to meaningful pediatric quality measurement.
Our results illustrating differences in the most common and costly conditions at GHs and FCHs have further implications for prioritization and implementation of research and QI efforts. Implementation research and QI efforts focused on cardiac and neurosurgical procedures, as well as neonatal intensive care, may have considerable impact on cost and quality at FCHs. At GHs, research and QI efforts focused on common conditions are needed to increase our knowledge of contextually relevant barriers to and facilitators of high‐quality pediatric care. This, however, can be made more difficult by small sample sizes, limited resources, and infrastructure, and competing priorities in adult‐focused GH settings.[16, 17, 18] Multihospital learning collaboratives and partnerships between FCHs and GHs can begin to address these challenges, but their success is contingent upon national advocacy and funding to support pediatric research and quality measures at GHs.
One of the most notable differences in the characteristics of pediatric hospitalizations at GHs and FCHs was the proportion of hospitalizations attributable to children with medical complexity (CMC); more than one‐third of hospitalizations at FCHs were for CMC compared to 1 in 5 at GHs. These findings align with the results of several previous studies describing the substantial resource utilization attributed to CMC, and with growing research, innovation, and quality metrics focused on improving both inpatient and outpatient care for these vulnerable children.[19, 20, 21, 22] Structured complex care programs, developed to improve care coordination and healthcare quality for CMC, are common at FCHs, and have been associated with decreased resource utilization and improved outcomes.[23, 24, 25] Notably, however, more than half of all hospitalizations for CMC, exceeding 250,000 annually, occurred at GHs, and almost 40% of hospitalizations for CMC occurred at the lower‐volume GHs. These findings speak to the importance of translating effective and innovative programs of care for CMC to GHs as resources allow, accompanied by robust evaluations of their effectiveness. Lower patient volume at most GHs, however, may be a barrier to dedicated CMC programs. As a result, decentralized community‐based programs of care for CMC, linking primary care programs with regional and tertiary care hospitals, warrant further consideration.[26, 27, 28]
This analysis should be interpreted in light of several limitations. First, we were unable to distinguish between GHs with scant pediatric‐specific resources from those with a large volume of dedicated pediatric resources, such as children's hospitals nested within GHs. We did identify 36 GHs with pediatric volumes similar to those observed at FCHs (see Supporting Table 2 in the online version of this article); patient and hospitalization characteristics at these higher‐volume GHs were similar in many ways to children hospitalized at FCHs. Several of these higher‐volume GHs may have considerable resources dedicated to the care of children, including subspecialty care, and may represent children's hospitals nested within GHs. Because nested children's hospitals are included in the GH categorization, our results may have underestimated the proportion of children cared for at children's hospitals. Further work is needed to identify the health systems challenges and opportunities that may be unique to these institutions. Second, because the 2012 KID does not include a specialty hospital indicator, we developed a proxy method for identifying these hospitals, which may have resulted in some misclassification. We are reassured that the results of our analyses did not change substantively when we included all hospitals. Similarly, although we are reassured that the number of hospitals classified in our analysis as acute care FCHs aligns, approximately, with the number of hospitals classified as such by the Children's Hospital Association, we were unable to assess the validity of this variable within the KID. Third, the KID does not link records at the patient level, so we are unable to report the number of unique children included in this analysis. In addition, the KID includes only inpatient stays with exclusion of observation status stays; potential differences between GH and FCH in the use of observation status could have biased our findings. Fifth, we used the PMCA to identify CMC; although this algorithm has been shown to have excellent sensitivity in identifying children with chronic diseases, using up to 3 years of Medicaid claims data, the sensitivity using the KID, where only 1 inpatient stay is available for assessment, is unknown.[8, 29] Similarly, use of Keren's pediatric diagnosis grouper to classify reasons for hospitalization may have resulted in misclassification, though there are few other nonproprietary pediatric‐specific diagnostic groupers available.
In 2012, more than 70% of pediatric hospitalizations occurred at GHs in the United States. The considerably higher pediatric volumes at FCHs makes these institutions well suited for research, innovation, and the development and application of disease‐specific QI initiatives. Recognizing that the majority of pediatric hospitalizations occurred at GHs, there is a clear need for implementation research, program development, and quality metrics that align with the characteristics of hospitalizations at these centers. National support for research and quality improvement that reflects the diverse hospital settings where children receive their hospital care is critical to further our nation's goal of improving hospital quality for children.
Disclosures
Dr. Leyenaar was supported by grant number K08HS024133 from the Agency for Healthcare Research and Quality. The content is solely the responsibility of the authors and does not necessarily represent the official views of the Agency for Healthcare Research and Quality. The authors have no conflicts of interest relevant to this article to disclose.
- , , , . Mirror, Mirror on the wall: how the performance of the US health care system compares internationally. The Commonwealth Fund. Available at: http://www.commonwealthfund.org/publications/fund‐reports/2014/jun/mirror‐mirror. Published June 16, 2014. Accessed August 26, 2015.
- , , , , , . Higher cost, but poorer outcomes: the US health disadvantage and implications for pediatrics. Pediatrics. 2015;135(6):961–964.
- , , , , . US health spending trends by age and gender: selected years 2002–10. Health Aff (Millwood). 2014;33(5):815–822.
- , , . Costs for hospital stays in the United States, 2012. Healthcare Cost and Utilization Project 181. Available at: http://www.hcup‐us.ahrq.gov/reports/statbriefs/sb181‐Hospital‐Costs‐United‐States‐2012.pdf. Published October 2014. Accessed September 2015.
- , , , et al. All Patient Refined Diagnosis Related Groups: Methodology Overview. 3M Health Information Systems. Available at: https://www.hcup‐us.ahrq.gov/db/nation/nis/APR‐DRGsV20MethodologyOverviewandBibliography.pdf. Accessed February 8, 2016.
- Agency for Healthcare Research and Quality. Healthcare Cost and Utilization Project. Introduction to the HCUP Kids' Inpatient Database (KID) 2012. Available at: https://www.hcup‐us.ahrq.gov/db/nation/kid/kid_2012_introduction.jsp. Published Issued July 2014. Accessed February 8, 2016.
- . Prioritization of comparative effectiveness research topics in hospital pediatrics. Arch Pediatr Adolesc Med. 2012;166(12):1155.
- , , , et al. Pediatric medical complexity algorithm: a new method to stratify children by medical complexity. Pediatrics. 2014;133(6):e1647–e1654.
- , , , et al. 3M APR DRG Classification System. 3M Health Information Systems. Available at: http://www.hcup‐us.ahrq.gov/db/nation/nis/v261_aprdrg_meth_ovrview.pdf. Accessed August 7, 2015.
- , , , , , . Trends in high‐turnover stays among children hospitalized in the United States, 1993–2003. Pediatrics. 2009;123(3):996–1002.
- , , , . High turnover stays for pediatric asthma in the United States. Med Care. 2010;48(9):827–833.
- , , , , . Variation and outcomes associated with direct admission among children with pneumonia in the United States. JAMA Pediatr. 2014;168(9):829–836.
- , , , et al. Recognizing differences in hospital quality performance for pediatric inpatient care. Pediatrics. 2015;136(2):251–262.
- , , . Small numbers limit the use of the inpatient pediatric quality indicators for hospital comparison. Acad Pediatr. 2010;10(4):266–273.
- , , , et al. Statistical uncertainty of mortality rates and rankings for children's hospitals. Pediatrics. 2011;128(4):e966–e972.
- , , , , . Determinants of career satisfaction among pediatric hospitalists: a qualitative exploration. Acad Pediatr. 2014;14(4):361–368.
- , , , et al. Quality improvement research in pediatric hospital medicine and the role of the Pediatric Research in Inpatient Settings (PRIS) network. Acad Pediatr. 2013;13(6 suppl):S54–S60.
- . Roles for children's hospitals in pediatric collaborative improvement networks. Pediatrics. 2013;131(suppl 4):S215–S218.
- , , , et al. Children with medical complexity: an emerging population for clinical and research initiatives. Pediatrics. 2011;127(3):529–538.
- , , , et al. Children with complex chronic conditions in inpatient hospital settings in the United States. Pediatrics. 2010;126(4):647–655.
- , , , , , . Patterns and costs of health care use of children with medical complexity. Pediatrics. 2012;130(6):e1463–e1470.
- , , , , , . Hospital utilization and characteristics of patients experiencing recurrent readmissions within children's hospitals. JAMA. 2011;305(7):682–690.
- , , , et al. Characteristics of hospitalizations for patients who use a structured clinical care program for children with medical complexity. J Pediatr. 2011;159(2):284–290.
- , , , . Hospital‐based comprehensive care programs for children with special health care needs: a systematic review. Arch Pediatr Adolesc Med. 2011;165(6):554–561.
- , , , , , . A tertiary care–primary care partnership model for medically complex and fragile children and youth with special health care needs. Arch Pediatr Adolesc Med. 2007;161(10):937–944.
- , , , et al. Integrated complex care coordination for children with medical complexity: a mixed‐methods evaluation of tertiary care‐community collaboration. BMC Health Serv Res. 2012;12:366.
- , , , . Medical transport of children with complex chronic conditions. Emerg Med Int. 2012;2012:837020.
- , , . Comanagement of medically complex children by subspecialists, generalists, and care coordinators. Pediatrics. 2014;134(2):203–205.
- , , , , . Ways to identify children with medical complexity and the importance of why. J Pediatr. 2015;167(2):229–237.
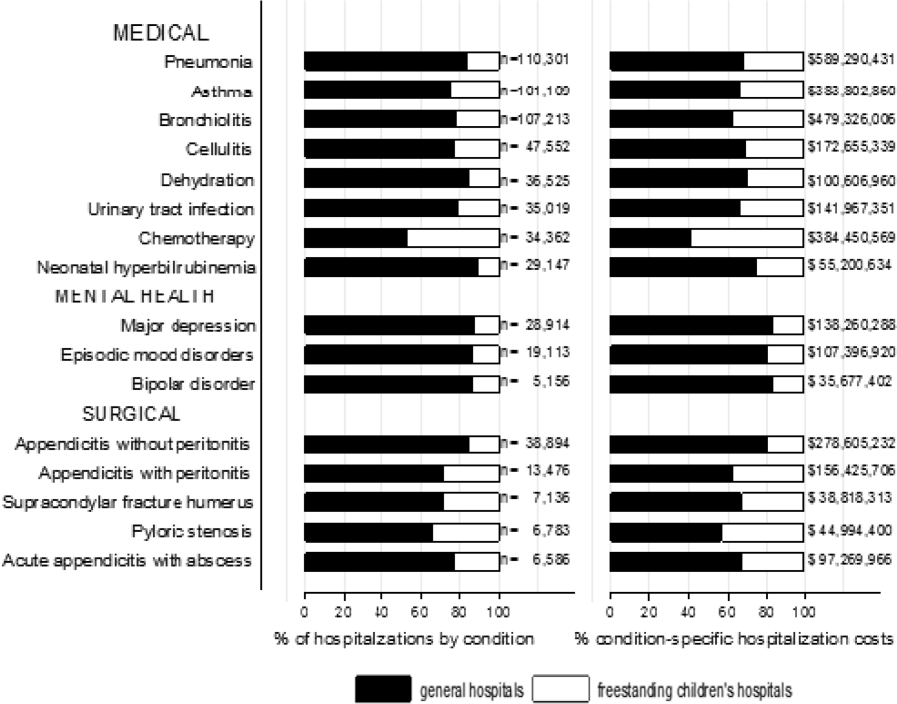
ICU Transfer Delay and Outcome
Patients on hospital wards may become critically ill due to worsening of the underlying condition that was the cause of their admission or acquisition of a new hospital‐acquired illness. Once physiologic deterioration occurs, some patients are evaluated and quickly transferred to the intensive care unit (ICU), whereas others are left on the wards until further deterioration occurs. Because many critical illness syndromes benefit from early intervention, such as sepsis and respiratory failure, early transfer to the ICU for treatment may improve patient outcomes, and conversely, delays in ICU transfer may lead to increased mortality and length of stay (LOS) in critically ill ward patients.[1, 2] However, the timeliness of that transfer is dependent on numerous changing variables, such as ICU bed availability, clinician identification of the deterioration, and clinical judgment regarding the appropriate transfer thresholds.[2, 3, 4, 5, 6, 7] As a result, there is a large degree of heterogeneity in the severity of illness of patients at the time of ICU transfer and in patient outcomes.[6, 8]
Previous studies investigating the association between delayed ICU transfer and patient outcomes have typically utilized the time of consultation by the ICU team to denote the onset of critical illness.[5, 6, 9, 10] However, the decision to transfer a patient to the ICU is often subjective, and previous studies have found an alarmingly high rate of errors in diagnosis and management of critically ill ward patients, including the failure to call for help.[2, 11] Therefore, a more objective tool for quantifying critical illness is necessary for determining the onset of critical illness and quantifying the association of transfer delay with patient outcomes.
Early warning scores, which are designed to detect critical illness on the wards, represent objective measures of critical illness that can be easily calculated in ward patients.[12] The aim of this study was to utilize the electronic Cardiac Arrest Risk Triage (eCART) score, a previously published, statistically derived early warning score that utilizes demographic, vital sign, and laboratory data, as an objective measure of critical illness to estimate the effect of delayed ICU transfer on patient outcomes in a large, multicenter database.[13] We chose 6 hours as the cutoff for delay in this study a priori because it is a threshold noted to be an important time period in critical illness syndromes, such as sepsis.[14, 15]
METHODS
All patients admitted to the medical‐surgical wards at 5 hospitals between November 2008 and January 2013 were eligible for inclusion in this observational cohort study. Further details of the hospital populations have been previously described.[13] A waiver of consent was granted by NorthShore University HealthSystem (IRB #EH11‐258) and the University of Chicago Institutional Review Board (IRB #16995A) based on general impracticability and minimal harm. Collection of patient information was designed to comply with the Health Insurance Portability and Accountability Act of 1996 (HIPAA) regulations.
Defining the Onset of Critical Illness
The eCART score, a statistically derived early warning score that is calculated based on patient demographic, vital sign, and laboratory data, was used as an objective measure of critical illness.[13] Score calculation was performed utilizing demographic information from administrative databases and time‐ and location‐stamped vital signs and laboratory results from data warehouses at the respective institutions. In this study, a score was calculated for each time‐stamped point in the entire dataset. Of note, eCART was not used in this population for patient care as this was a retrospective observational study. An eCART score at the 95% specificity cutoff for ICU transfer from the entire dataset defined a ward patient as critically ill, a definition created a priori and before any data analysis was performed.
Defining ICU Transfer Delay and Study Outcomes
The period of time from when a patient first reached this predefined eCART score to ICU transfer was calculated for each patient, up to a maximum of 24 hours. Transfer to the ICU greater than 6 hours after reaching the critical eCART score was defined a priori as a delayed transfer to allow comparisons between patients with nondelayed and delayed transfer. A patient who suffered a ward cardiac arrest with attempted resuscitation was counted as an ICU transfer at the time of arrest. If a patient experienced more than 1 ICU transfer during the admission, then only the first ward to ICU transfer was used. The primary outcome of the study was in‐hospital mortality, and secondary outcomes were ICU mortality and hospital LOS.
Statistical Analysis
Patient characteristics were compared between patients who experienced delayed and nondelayed ICU transfers using t tests, Wilcoxon rank sums, and [2] tests, as appropriate. The association between length of transfer delay and in‐hospital mortality was calculated using logistic regression, with adjustment for age, sex, and surgical status. In a post hoc sensitivity analysis, additional adjustments were made using each patient's first eCART score on the ward, the individual vital signs and laboratory variables from eCART, and whether the ICU transfer was due to a cardiac arrest on the wards. In addition, an interaction term between time to transfer and the initial eCART on the ward was added to determine if the association between delay and mortality varied by baseline severity. The change in eCART score over time was plotted from 12 hours before the time of first reaching the critical value until ICU transfer for those in the delayed and nondelayed groups using restricted cubic splines to compare the trajectories of severity of illness between these 2 groups. In addition, a linear regression model was fit to investigate the association between the eCART slope in the 8 hours prior to the critical eCART value until ICU transfer and the timing of ICU transfer delay. Statistical analyses were performed using Stata version 12.1 (StataCorp, College Station, TX), and all tests of significance used a 2‐sided P<0.05.
RESULTS
A total of 269,999 admissions had documented vital signs on the hospital wards during the study period, including 11,995 patients who were either transferred from the wards to the ICU (n=11,636) or who suffered a cardiac arrest on the wards (n=359) during their initial ward stay. Of these patients, 3789 reached an eCART score at the 95% specificity cutoff (critical eCART score of 60) within 24 hours of transfer. The median time from first critical eCART value to ICU transfer was 5.4 hours (interquartile range (IQR), 214 hours; mean, 8 hours). Compared to patients without delayed ICU transfer, those with delayed transfer were slightly older (median age, 73 [IQR, 6083] years vs 71 [IQR, 5882] years; P=0.002), whereas all other characteristics were similar (Table 1). Table 2 shows comparisons of vital sign and laboratory results for delayed and nondelayed transfers at the time of ICU transfer. As shown, patients with delayed transfer had lower median respiratory rate, blood pressure, heart rate, and hemoglobin, but higher median white blood cell count and creatinine.
| Characteristic | Transferred Within 6 Hours, n=2,055 | Transfer Delayed, n=1,734 | P Value |
|---|---|---|---|
| |||
| Age, median (IQR), y | 71 (5882) | 73 (6083) | 0.002 |
| Female sex, n (%) | 1,018 (49.5) | 847 (48.8) | 0.67 |
| Race, n (%) | 0.72 | ||
| Black | 467 (22.7) | 374 (21.6) | |
| White | 1,141 (55.5) | 971 (56.0) | |
| Other/unknown | 447 (21.8) | 389 (22.4) | |
| Surgical patient, n (%) | 572 (27.8) | 438 (25.2) | 0.07 |
| Hospital LOS prior to first critical eCART, median (IQR), d | 1.5 (0.33.7) | 1.6 (0.43.9) | 0.04 |
| Total hospital LOS, median (IQR), d* | 11 (719) | 13 (821) | <0.001 |
| Died during admission, n (%) | 503 (24.5) | 576 (33.2) | <0.001 |
| Transferred Within 6 Hours, n=2,055 | Transfer Delayed, n=1,734 | P Value | |
|---|---|---|---|
| |||
| Respiratory rate, breaths/min | 23 (1830) | 22 (1828) | <0.001 |
| Systolic blood pressure, mm Hg | 111 (92134) | 109 (92128) | 0.002 |
| Diastolic blood pressure, mm Hg | 61 (5075) | 59 (4971) | <0.001 |
| Heart rate, beats/min | 106 (88124) | 101 (85117) | <0.001 |
| Oxygen saturation, median (IQR), % | 97 (9499) | 97 (9599) | 0.15 |
| Temperature, F | 98.0 (97.299.1) | 98.0 (97.199.0) | 0.001 |
| Alert mental status, number of observations (%) | 1,749 (85%) | 1,431 (83%) | <0.001 |
| eCART score at time of ICU transfer | 61 (26122) | 48 (21121) | 0.914 |
| WBC | 10.3 (7.514.5) | 11.7 (8.117.0) | <0.001 |
| Hemoglobin | 10.7 (9.312.0) | 10.3 (9.111.6) | <0.001 |
| Platelet | 215 (137275) | 195 (120269) | 0.017 |
| Sodium | 137 (134140) | 137 (134141) | 0.70 |
| K+ | 4.1 (3.84.6) | 4.2 (3.84.7) | 0.006 |
| Anion Gap | 10 (813) | 10 (814) | <0.001 |
| CO2 | 24 (2026) | 23 (1826) | <0.001 |
| BUN | 24 (1640) | 32 (1853) | <0.001 |
| Cr | 1.2 (0.92.0) | 1.5 (1.02.7) | <0.001 |
| GFR | 70 (7070) | 70 (5170) | <0.001 |
| Glucose | 123 (106161) | 129 (105164) | 0.48 |
| Calcium | 8.5 (7.98.8) | 8.2 (7.78.7) | <0.001 |
| SGOT | 26 (2635) | 26 (2644) | 0.001 |
| SGPT | 21 (2127) | 21 (2033) | 0.002 |
| Total bilirubin | 0.7 (0.71.0) | 0.7 (0.71.3) | <0.001 |
| Alk phos | 80 (8096) | 80 (79111) | 0.175 |
| Albumin | 3.0 (2.73.0) | 3.0 (2.43.0) | <0.001 |
Delayed transfer occurred in 46% of patients (n=1734) and was associated with increased in‐hospital mortality (33.2% vs 24.5%, P<0.001). This relationship was linear, with each 1‐hour increase in transfer delay associated with a 3% increase in the odds of in‐hospital death (P<0.001) (Figure 1). The association between length of transfer delay and hospital mortality remained unchanged after controlling for age, sex, surgical status, initial eCART score on the wards, vital signs, laboratory values, and whether the ICU transfer was due to a cardiac arrest (3% increase per hour, P<0.001). This association did not vary based on the initial eCART score on the wards (P=0.71 for interaction). Additionally, despite having similar median hospital lengths of stay prior to first critical eCART score (1.6 vs 1.5 days, P=0.04), patients experiencing delayed ICU transfer who survived to discharge had a longer median hospital LOS by 2 days compared to those with nondelayed transfer who survived to discharge (median LOS, 13 (821) days vs 11 (719) days, P=0.01). The change in eCART score over time in the 12 hours before first reaching the critical eCART score until ICU transfer is shown in Figure 2 for patients with delayed and nondelayed transfer. As shown, patients transferred within 6 hours had a more rapid rise in eCART score prior to ICU transfer compared to those with a delayed transfer. This difference in trajectories between delayed and nondelayed patients was similar in patients with low (<13), intermediate (1359), and high (60) initial eCART scores on the wards. A regression model investigating the association between eCART slope prior to ICU transfer and time to ICU transfer demonstrated that a steeper slope was significantly associated with a decreased time to ICU transfer (P<0.01).
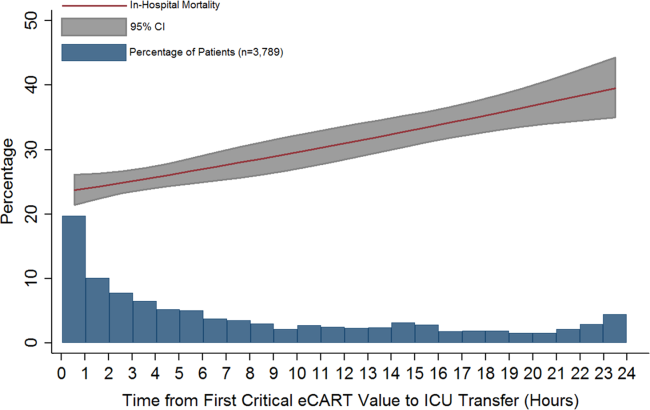
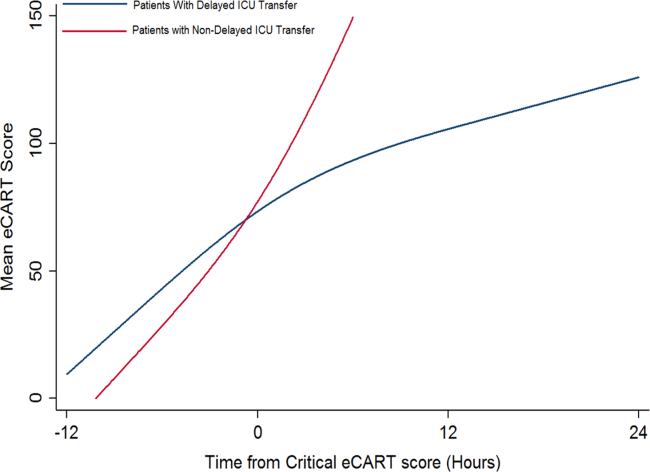
DISCUSSION
We found that a delay in transfer to the ICU after reaching a predefined objective threshold of critical illness was associated with a significant increase in hospital mortality and hospital LOS. We also discovered a significant association between critical illness trajectory and delays in transfer, suggesting that caregivers may not recognize more subtle trends in critical illness. This work highlights the importance of timely transfer to the ICU for critically ill ward patients, which can be affected by several factors such as ICU bed availability and caregiver recognition and triage decisions. Our findings have significant implications for patient safety on the wards and provide further evidence for implementing early warning scores into practice to aid with clinical decision making.
Our findings of increased mortality with delayed ICU transfer are consistent with previous studies.[1, 5, 9] For example, Young et al. compared ICU mortality between delayed and nondelayed transfers in 91 consecutive patients with noncardiac diagnoses at a community hospital.[1] They also used predefined criteria for critical illness, and found that delayed transfers had a higher ICU mortality than nondelayed patients (41% vs 11%). However, their criteria for critical illness only had a specificity of 13% for predicting ICU transfer, compared to 95% in our study, suggesting that our threshold is more consistent with critical illness. Another study, by Cardoso and colleagues, investigated the impact of delayed ICU admission due to bed shortages on ICU mortality in 401 patients at a university hospital.[9] Of those patients deemed appropriate for transfer to the ICU but who had to wait for a bed to become available, the median wait time for a bed was 18 hours. They found that each hour of waiting was associated with a 1.5% increase in ICU death. A similar study by Robert and colleagues investigated the impact of delayed or refused ICU admission due to a lack of bed availability.[5] Patients deemed too sick (or too well) to benefit from ICU transfer were excluded. Twenty‐eightday and 60‐day mortality were higher in the admitted group compared to those not admitted, although this finding was not statistically significant. In addition, patients later admitted to the ICU once a bed became available (median wait time, 6 hours; n=89) had higher 28‐day mortality than those admitted immediately (adjusted odds ratio, 1.78; P=0.05). Several other studies have investigated the impact of ICU refusal for reasons that included bed shortages, and found increased mortality in those not admitted to the ICU.[16, 17] However, many of these studies included patients deemed too sick or too well to be transferred to the ICU in the group of nonadmitted patients. Our study adds to this literature by utilizing a highly specific objective measure of critical illness and by including all patients on the wards who reached this threshold, rather than only those for whom a consult was requested.
There are several potential explanations for our finding of increased mortality with delayed ICU transfer. First, those with delayed transfer might be different in some way from those transferred immediately. For example, we found that those with delayed transfer were older. The finding that increasing age is associated with a delay in ICU transfer is interesting, and may reflect physiologic differences in older patients compared to younger ones. For example, older patients have a lower maximum heart rate and thus may not develop the same level of vital sign abnormalities that younger patients do, causing them to be inappropriately left on the wards for too long.[18] In addition, patients with delayed transfer had more deranged renal function and lower blood pressure. It is unknown whether these organ dysfunctions would have been prevented by earlier transfer and to what degree they were related to chronic conditions. However, delayed transfer was still associated with increased mortality even after controlling for age, vital sign and laboratory values, and eCART on ward admission. It may also be possible that patients with delayed transfer received early and appropriate treatment on the wards but failed to improve and thus required ICU transfer. We did not have access to orders in this large database, so this theory will need to be investigated in future work. Finally, the most likely explanation for our findings is that earlier identification and treatment improves outcomes of critically ill patients on the wards, which is consistent with the findings of previous studies.[1, 5, 9, 10] Our study demonstrates that early identification of critical illness is crucial, and that delayed treatment can rapidly lead to increased mortality and LOS.
Our comparison of eCART score trajectory showed that patients transferred within 6 hours of onset of critical illness had a more rapid rise in eCART score over the preceding time period, whereas patients who experienced transfer delay showed a slower increase in eCART score. One explanation for this finding is that patients who decompensate more rapidly are in turn more readily recognizable to providers, whereas patients who experience a more insidious clinical deterioration are recognized later in the process, which then leads to a delay in escalation of care. This hypothesis underlines the importance of utilizing an objective marker of illness that is calculated longitudinally and in real time, as opposed to relying upon provider recognition alone. In fact, we have recently demonstrated that eCART is more accurate and identifies patients earlier than standard rapid response team activation.[19]
There are several important implications of our findings. First, it highlights the potential impact that early warning scores, particular those that are evidence based, can have on the outcomes of hospitalized patients. Second, it suggests that it is important to include age in early warning scores. Previous studies have been mixed as to whether the inclusion of age improves detection of outcomes on the wards, although the method of inclusion of age has been variable in terms of its weighting.[20, 21, 22] Our study found that older patients were more likely to be left on the wards longer prior to ICU transfer after becoming critically ill. By incorporating age into early warning scores, both accuracy and early recognition of critical illness may be improved. Finally, our finding that the trends of the eCART score differed among patients who were immediately transferred to the ICU, and who had a delay in their transfer, suggests that adding vital sign trends to early warning scores may further improve their accuracy and ability to serve as clinical decision support tools.
Our study is unique in that we used an objective measure of critical illness and then examined outcomes after patients reached this threshold on the wards. This overcomes the subjectivity of using evaluation by the ICU team or rapid response team as the starting point, as previous studies have shown a failure to call for help when patients become critically ill on the wards.[2, 11, 23] By using the eCART score, which contains commonly collected electronic health record data and can be calculated electronically in real time, we were able to calculate the score for patients on the wards and in the ICU. This allowed us to examine trends in the eCART score over time to find clues as to why some patients are transferred late to the ICU and why these late transfers have worse outcomes than those transferred earlier. Another strength is the large multicenter database used for the analysis, which included an urban tertiary care hospital, suburban teaching hospitals, and a community nonteaching hospital.
Our study has several limitations. First, we utilized just 1 of many potential measures of critical illness and a cutoff that only included one‐third of patients ultimately transferred to the ICU. However, by using the eCART score, we were able to track a patient's physiologic status over time and remove the variability that comes with using subjective definitions of critical illness. Furthermore, we utilized a high‐specificity cutoff for eCART to ensure that transferred patients had significantly deranged physiology and to avoid including planned transfers to the ICU. It is likely that some patients who were critically ill with less deranged physiology that would have benefitted from earlier transfer were excluded from the study. Second, we were unable to determine the cause of physiologic deterioration for patients in our study due to the large number of included patients. In addition, we did not have code status, comorbidities, or reason for ICU admission available in the dataset. It is likely that the impact of delayed transfer varies by the indication for ICU admission and chronic disease burden. It is also possible that controlling for these unmeasured factors could negate the beneficial association seen for earlier ICU admission. However, our finding of such a strong relationship between time to transfer and mortality after controlling for several important variables suggests that early recognition of critical illness is beneficial to many patients on the wards. Third, due to its observational nature, our study cannot estimate the true impact of timely ICU transfer on critically ill ward patient outcomes. Future clinical trials will be needed to determine the impact of electronic early warning scores on patient outcomes.
In conclusion, delayed ICU transfer is associated with significantly increased hospital LOS and mortality. This association highlights the need for ongoing work toward both the implementation of an evidence‐based risk stratification tool as well as development of effective critical care outreach resources for patients decompensating on the wards. Real‐time use of a validated early warning score, such as eCART, could potentially lead to more timely ICU transfer for critically ill patients and reduced rates of preventable in‐hospital death.
Acknowledgements
The authors thank Timothy Holper, Justin Lakeman, and Contessa Hsu for assistance with data extraction and technical support; Poome Chamnankit, MS, CNP, Kelly Bhatia, MSN, ACNP, and Audrey Seitman, MSN, ACNP for performing manual chart review of cardiac arrest patients; and Nicole Twu for administrative support.
Disclosures: This research was funded in part by an institutional Clinical and Translational Science Award grant (UL1 RR024999, PI: Dr. Julian Solway). Dr. Churpek is supported by a career development award from the National Heart, Lung, and Blood Institute (K08 HL121080). Drs. Churpek and Edelson have a patent pending (ARCD. P0535US.P2) for risk stratification algorithms for hospitalized patients. In addition, Dr. Edelson has received research support from Philips Healthcare (Andover, MA), the American Heart Association (Dallas, TX), and Laerdal Medical (Stavanger, Norway). She has ownership interest in Quant HC (Chicago, IL), which is developing products for risk stratification of hospitalized patients. Drs. Churpek and Wendlandt had full access to all the data in the study and take responsibility for the integrity of the data and the accuracy of the data analysis. Preliminary versions of these data were presented at the 2015 meeting of the Society of Hospital Medicine (March 31, 2015, National Harbor, MD).
- , , , , . Inpatient transfers to the intensive care unit: delays are associated with increased mortality and morbidity. J Gen Intern Med. 2003;18(2):77–83.
- , , , et al. Confidential inquiry into quality of care before admission to intensive care. BMJ. 1998;316(7148):1853–1858.
- , , , , , . Relationship between ICU bed availability, ICU readmission, and cardiac arrest in the general wards. Crit Care Med. 2014;42(9):2037–2041.
- , , , et al. Survival of critically ill patients hospitalized in and out of intensive care units under paucity of intensive care unit beds. Crit Care Med. 2004;32(8):1654–1661.
- , , , et al. Refusal of intensive care unit admission due to a full unit: impact on mortality. Am J Respir Crit Care Med. 2012;185(10):1081–1087.
- , , , et al. Evaluation of triage decisions for intensive care admission. Crit Care Med. 1999;27(6):1073–1079.
- , , , et al. Predictors of intensive care unit refusal in French intensive care units: a multiple‐center study. Crit Care Med. 2005;33(4):750–755.
- , , , . Acute Physiology and Chronic Health Evaluation (APACHE) IV: hospital mortality assessment for today's critically ill patients. Crit Care Med. 2006;34(5):1297–1310.
- , , , et al. Impact of delayed admission to intensive care units on mortality of critically ill patients: a cohort study. Crit Care. 2011;15(1):R28.
- , , , et al. Reasons for refusal of admission to intensive care and impact on mortality. Intensive Care Med. 2010;36(10):1772–1779.
- , , , et al. Incidence, location and reasons for avoidable in‐hospital cardiac arrest in a district general hospital. Resuscitation. 2002;54(2):115–123.
- , , . Risk stratification of hospitalized patients on the wards. Chest. 2013;143(6):1758–1765.
- , , , et al. Multicenter development and validation of a risk stratification tool for ward patients. Am J Respir Crit Care Med. 2014;190(6):649–655.
- , , , et al. Early goal‐directed therapy in the treatment of severe sepsis and septic shock. N Engl J Med. 2001;345(19):1368–1377.
- , , , et al. Surviving sepsis campaign: international guidelines for management of severe sepsis and septic shock: 2012. Crit Care Med. 2013;41(2):580–637.
- , , , et al. Outcomes of patients considered for, but not admitted to, the intensive care unit. Crit Care Med. 2008;36(3):812–817.
- , , . Mortality among appropriately referred patients refused admission to intensive‐care units. Lancet. 1997;350(9070):7–11.
- , , , , . Differences in vital signs between elderly and nonelderly patients prior to ward cardiac arrest. Crit Care Med. 2015;43(4):816–822.
- , , , , , . Real‐time risk prediction on the wards: a feasibility study [published April 13, 2016]. Crit Care Med. doi: 10.1097/CCM.0000000000001716.
- , , , et al. Should age be included as a component of track and trigger systems used to identify sick adult patients? Resuscitation. 2008;78(2):109–115.
- , , , et al. Worthing physiological scoring system: derivation and validation of a physiological early‐warning system for medical admissions. An observational, population‐based single‐centre study. Br J Anaesth. 2007;98(6):769–774.
- , , , . Validation of a modified Early Warning Score in medical admissions. QJM. 2001;94(10):521–526.
- , , , et al. Introduction of the medical emergency team (MET) system: a cluster‐randomised controlled trial. Lancet. 2005;365(9477):2091–2097.
Patients on hospital wards may become critically ill due to worsening of the underlying condition that was the cause of their admission or acquisition of a new hospital‐acquired illness. Once physiologic deterioration occurs, some patients are evaluated and quickly transferred to the intensive care unit (ICU), whereas others are left on the wards until further deterioration occurs. Because many critical illness syndromes benefit from early intervention, such as sepsis and respiratory failure, early transfer to the ICU for treatment may improve patient outcomes, and conversely, delays in ICU transfer may lead to increased mortality and length of stay (LOS) in critically ill ward patients.[1, 2] However, the timeliness of that transfer is dependent on numerous changing variables, such as ICU bed availability, clinician identification of the deterioration, and clinical judgment regarding the appropriate transfer thresholds.[2, 3, 4, 5, 6, 7] As a result, there is a large degree of heterogeneity in the severity of illness of patients at the time of ICU transfer and in patient outcomes.[6, 8]
Previous studies investigating the association between delayed ICU transfer and patient outcomes have typically utilized the time of consultation by the ICU team to denote the onset of critical illness.[5, 6, 9, 10] However, the decision to transfer a patient to the ICU is often subjective, and previous studies have found an alarmingly high rate of errors in diagnosis and management of critically ill ward patients, including the failure to call for help.[2, 11] Therefore, a more objective tool for quantifying critical illness is necessary for determining the onset of critical illness and quantifying the association of transfer delay with patient outcomes.
Early warning scores, which are designed to detect critical illness on the wards, represent objective measures of critical illness that can be easily calculated in ward patients.[12] The aim of this study was to utilize the electronic Cardiac Arrest Risk Triage (eCART) score, a previously published, statistically derived early warning score that utilizes demographic, vital sign, and laboratory data, as an objective measure of critical illness to estimate the effect of delayed ICU transfer on patient outcomes in a large, multicenter database.[13] We chose 6 hours as the cutoff for delay in this study a priori because it is a threshold noted to be an important time period in critical illness syndromes, such as sepsis.[14, 15]
METHODS
All patients admitted to the medical‐surgical wards at 5 hospitals between November 2008 and January 2013 were eligible for inclusion in this observational cohort study. Further details of the hospital populations have been previously described.[13] A waiver of consent was granted by NorthShore University HealthSystem (IRB #EH11‐258) and the University of Chicago Institutional Review Board (IRB #16995A) based on general impracticability and minimal harm. Collection of patient information was designed to comply with the Health Insurance Portability and Accountability Act of 1996 (HIPAA) regulations.
Defining the Onset of Critical Illness
The eCART score, a statistically derived early warning score that is calculated based on patient demographic, vital sign, and laboratory data, was used as an objective measure of critical illness.[13] Score calculation was performed utilizing demographic information from administrative databases and time‐ and location‐stamped vital signs and laboratory results from data warehouses at the respective institutions. In this study, a score was calculated for each time‐stamped point in the entire dataset. Of note, eCART was not used in this population for patient care as this was a retrospective observational study. An eCART score at the 95% specificity cutoff for ICU transfer from the entire dataset defined a ward patient as critically ill, a definition created a priori and before any data analysis was performed.
Defining ICU Transfer Delay and Study Outcomes
The period of time from when a patient first reached this predefined eCART score to ICU transfer was calculated for each patient, up to a maximum of 24 hours. Transfer to the ICU greater than 6 hours after reaching the critical eCART score was defined a priori as a delayed transfer to allow comparisons between patients with nondelayed and delayed transfer. A patient who suffered a ward cardiac arrest with attempted resuscitation was counted as an ICU transfer at the time of arrest. If a patient experienced more than 1 ICU transfer during the admission, then only the first ward to ICU transfer was used. The primary outcome of the study was in‐hospital mortality, and secondary outcomes were ICU mortality and hospital LOS.
Statistical Analysis
Patient characteristics were compared between patients who experienced delayed and nondelayed ICU transfers using t tests, Wilcoxon rank sums, and [2] tests, as appropriate. The association between length of transfer delay and in‐hospital mortality was calculated using logistic regression, with adjustment for age, sex, and surgical status. In a post hoc sensitivity analysis, additional adjustments were made using each patient's first eCART score on the ward, the individual vital signs and laboratory variables from eCART, and whether the ICU transfer was due to a cardiac arrest on the wards. In addition, an interaction term between time to transfer and the initial eCART on the ward was added to determine if the association between delay and mortality varied by baseline severity. The change in eCART score over time was plotted from 12 hours before the time of first reaching the critical value until ICU transfer for those in the delayed and nondelayed groups using restricted cubic splines to compare the trajectories of severity of illness between these 2 groups. In addition, a linear regression model was fit to investigate the association between the eCART slope in the 8 hours prior to the critical eCART value until ICU transfer and the timing of ICU transfer delay. Statistical analyses were performed using Stata version 12.1 (StataCorp, College Station, TX), and all tests of significance used a 2‐sided P<0.05.
RESULTS
A total of 269,999 admissions had documented vital signs on the hospital wards during the study period, including 11,995 patients who were either transferred from the wards to the ICU (n=11,636) or who suffered a cardiac arrest on the wards (n=359) during their initial ward stay. Of these patients, 3789 reached an eCART score at the 95% specificity cutoff (critical eCART score of 60) within 24 hours of transfer. The median time from first critical eCART value to ICU transfer was 5.4 hours (interquartile range (IQR), 214 hours; mean, 8 hours). Compared to patients without delayed ICU transfer, those with delayed transfer were slightly older (median age, 73 [IQR, 6083] years vs 71 [IQR, 5882] years; P=0.002), whereas all other characteristics were similar (Table 1). Table 2 shows comparisons of vital sign and laboratory results for delayed and nondelayed transfers at the time of ICU transfer. As shown, patients with delayed transfer had lower median respiratory rate, blood pressure, heart rate, and hemoglobin, but higher median white blood cell count and creatinine.
| Characteristic | Transferred Within 6 Hours, n=2,055 | Transfer Delayed, n=1,734 | P Value |
|---|---|---|---|
| |||
| Age, median (IQR), y | 71 (5882) | 73 (6083) | 0.002 |
| Female sex, n (%) | 1,018 (49.5) | 847 (48.8) | 0.67 |
| Race, n (%) | 0.72 | ||
| Black | 467 (22.7) | 374 (21.6) | |
| White | 1,141 (55.5) | 971 (56.0) | |
| Other/unknown | 447 (21.8) | 389 (22.4) | |
| Surgical patient, n (%) | 572 (27.8) | 438 (25.2) | 0.07 |
| Hospital LOS prior to first critical eCART, median (IQR), d | 1.5 (0.33.7) | 1.6 (0.43.9) | 0.04 |
| Total hospital LOS, median (IQR), d* | 11 (719) | 13 (821) | <0.001 |
| Died during admission, n (%) | 503 (24.5) | 576 (33.2) | <0.001 |
| Transferred Within 6 Hours, n=2,055 | Transfer Delayed, n=1,734 | P Value | |
|---|---|---|---|
| |||
| Respiratory rate, breaths/min | 23 (1830) | 22 (1828) | <0.001 |
| Systolic blood pressure, mm Hg | 111 (92134) | 109 (92128) | 0.002 |
| Diastolic blood pressure, mm Hg | 61 (5075) | 59 (4971) | <0.001 |
| Heart rate, beats/min | 106 (88124) | 101 (85117) | <0.001 |
| Oxygen saturation, median (IQR), % | 97 (9499) | 97 (9599) | 0.15 |
| Temperature, F | 98.0 (97.299.1) | 98.0 (97.199.0) | 0.001 |
| Alert mental status, number of observations (%) | 1,749 (85%) | 1,431 (83%) | <0.001 |
| eCART score at time of ICU transfer | 61 (26122) | 48 (21121) | 0.914 |
| WBC | 10.3 (7.514.5) | 11.7 (8.117.0) | <0.001 |
| Hemoglobin | 10.7 (9.312.0) | 10.3 (9.111.6) | <0.001 |
| Platelet | 215 (137275) | 195 (120269) | 0.017 |
| Sodium | 137 (134140) | 137 (134141) | 0.70 |
| K+ | 4.1 (3.84.6) | 4.2 (3.84.7) | 0.006 |
| Anion Gap | 10 (813) | 10 (814) | <0.001 |
| CO2 | 24 (2026) | 23 (1826) | <0.001 |
| BUN | 24 (1640) | 32 (1853) | <0.001 |
| Cr | 1.2 (0.92.0) | 1.5 (1.02.7) | <0.001 |
| GFR | 70 (7070) | 70 (5170) | <0.001 |
| Glucose | 123 (106161) | 129 (105164) | 0.48 |
| Calcium | 8.5 (7.98.8) | 8.2 (7.78.7) | <0.001 |
| SGOT | 26 (2635) | 26 (2644) | 0.001 |
| SGPT | 21 (2127) | 21 (2033) | 0.002 |
| Total bilirubin | 0.7 (0.71.0) | 0.7 (0.71.3) | <0.001 |
| Alk phos | 80 (8096) | 80 (79111) | 0.175 |
| Albumin | 3.0 (2.73.0) | 3.0 (2.43.0) | <0.001 |
Delayed transfer occurred in 46% of patients (n=1734) and was associated with increased in‐hospital mortality (33.2% vs 24.5%, P<0.001). This relationship was linear, with each 1‐hour increase in transfer delay associated with a 3% increase in the odds of in‐hospital death (P<0.001) (Figure 1). The association between length of transfer delay and hospital mortality remained unchanged after controlling for age, sex, surgical status, initial eCART score on the wards, vital signs, laboratory values, and whether the ICU transfer was due to a cardiac arrest (3% increase per hour, P<0.001). This association did not vary based on the initial eCART score on the wards (P=0.71 for interaction). Additionally, despite having similar median hospital lengths of stay prior to first critical eCART score (1.6 vs 1.5 days, P=0.04), patients experiencing delayed ICU transfer who survived to discharge had a longer median hospital LOS by 2 days compared to those with nondelayed transfer who survived to discharge (median LOS, 13 (821) days vs 11 (719) days, P=0.01). The change in eCART score over time in the 12 hours before first reaching the critical eCART score until ICU transfer is shown in Figure 2 for patients with delayed and nondelayed transfer. As shown, patients transferred within 6 hours had a more rapid rise in eCART score prior to ICU transfer compared to those with a delayed transfer. This difference in trajectories between delayed and nondelayed patients was similar in patients with low (<13), intermediate (1359), and high (60) initial eCART scores on the wards. A regression model investigating the association between eCART slope prior to ICU transfer and time to ICU transfer demonstrated that a steeper slope was significantly associated with a decreased time to ICU transfer (P<0.01).
DISCUSSION
We found that a delay in transfer to the ICU after reaching a predefined objective threshold of critical illness was associated with a significant increase in hospital mortality and hospital LOS. We also discovered a significant association between critical illness trajectory and delays in transfer, suggesting that caregivers may not recognize more subtle trends in critical illness. This work highlights the importance of timely transfer to the ICU for critically ill ward patients, which can be affected by several factors such as ICU bed availability and caregiver recognition and triage decisions. Our findings have significant implications for patient safety on the wards and provide further evidence for implementing early warning scores into practice to aid with clinical decision making.
Our findings of increased mortality with delayed ICU transfer are consistent with previous studies.[1, 5, 9] For example, Young et al. compared ICU mortality between delayed and nondelayed transfers in 91 consecutive patients with noncardiac diagnoses at a community hospital.[1] They also used predefined criteria for critical illness, and found that delayed transfers had a higher ICU mortality than nondelayed patients (41% vs 11%). However, their criteria for critical illness only had a specificity of 13% for predicting ICU transfer, compared to 95% in our study, suggesting that our threshold is more consistent with critical illness. Another study, by Cardoso and colleagues, investigated the impact of delayed ICU admission due to bed shortages on ICU mortality in 401 patients at a university hospital.[9] Of those patients deemed appropriate for transfer to the ICU but who had to wait for a bed to become available, the median wait time for a bed was 18 hours. They found that each hour of waiting was associated with a 1.5% increase in ICU death. A similar study by Robert and colleagues investigated the impact of delayed or refused ICU admission due to a lack of bed availability.[5] Patients deemed too sick (or too well) to benefit from ICU transfer were excluded. Twenty‐eightday and 60‐day mortality were higher in the admitted group compared to those not admitted, although this finding was not statistically significant. In addition, patients later admitted to the ICU once a bed became available (median wait time, 6 hours; n=89) had higher 28‐day mortality than those admitted immediately (adjusted odds ratio, 1.78; P=0.05). Several other studies have investigated the impact of ICU refusal for reasons that included bed shortages, and found increased mortality in those not admitted to the ICU.[16, 17] However, many of these studies included patients deemed too sick or too well to be transferred to the ICU in the group of nonadmitted patients. Our study adds to this literature by utilizing a highly specific objective measure of critical illness and by including all patients on the wards who reached this threshold, rather than only those for whom a consult was requested.
There are several potential explanations for our finding of increased mortality with delayed ICU transfer. First, those with delayed transfer might be different in some way from those transferred immediately. For example, we found that those with delayed transfer were older. The finding that increasing age is associated with a delay in ICU transfer is interesting, and may reflect physiologic differences in older patients compared to younger ones. For example, older patients have a lower maximum heart rate and thus may not develop the same level of vital sign abnormalities that younger patients do, causing them to be inappropriately left on the wards for too long.[18] In addition, patients with delayed transfer had more deranged renal function and lower blood pressure. It is unknown whether these organ dysfunctions would have been prevented by earlier transfer and to what degree they were related to chronic conditions. However, delayed transfer was still associated with increased mortality even after controlling for age, vital sign and laboratory values, and eCART on ward admission. It may also be possible that patients with delayed transfer received early and appropriate treatment on the wards but failed to improve and thus required ICU transfer. We did not have access to orders in this large database, so this theory will need to be investigated in future work. Finally, the most likely explanation for our findings is that earlier identification and treatment improves outcomes of critically ill patients on the wards, which is consistent with the findings of previous studies.[1, 5, 9, 10] Our study demonstrates that early identification of critical illness is crucial, and that delayed treatment can rapidly lead to increased mortality and LOS.
Our comparison of eCART score trajectory showed that patients transferred within 6 hours of onset of critical illness had a more rapid rise in eCART score over the preceding time period, whereas patients who experienced transfer delay showed a slower increase in eCART score. One explanation for this finding is that patients who decompensate more rapidly are in turn more readily recognizable to providers, whereas patients who experience a more insidious clinical deterioration are recognized later in the process, which then leads to a delay in escalation of care. This hypothesis underlines the importance of utilizing an objective marker of illness that is calculated longitudinally and in real time, as opposed to relying upon provider recognition alone. In fact, we have recently demonstrated that eCART is more accurate and identifies patients earlier than standard rapid response team activation.[19]
There are several important implications of our findings. First, it highlights the potential impact that early warning scores, particular those that are evidence based, can have on the outcomes of hospitalized patients. Second, it suggests that it is important to include age in early warning scores. Previous studies have been mixed as to whether the inclusion of age improves detection of outcomes on the wards, although the method of inclusion of age has been variable in terms of its weighting.[20, 21, 22] Our study found that older patients were more likely to be left on the wards longer prior to ICU transfer after becoming critically ill. By incorporating age into early warning scores, both accuracy and early recognition of critical illness may be improved. Finally, our finding that the trends of the eCART score differed among patients who were immediately transferred to the ICU, and who had a delay in their transfer, suggests that adding vital sign trends to early warning scores may further improve their accuracy and ability to serve as clinical decision support tools.
Our study is unique in that we used an objective measure of critical illness and then examined outcomes after patients reached this threshold on the wards. This overcomes the subjectivity of using evaluation by the ICU team or rapid response team as the starting point, as previous studies have shown a failure to call for help when patients become critically ill on the wards.[2, 11, 23] By using the eCART score, which contains commonly collected electronic health record data and can be calculated electronically in real time, we were able to calculate the score for patients on the wards and in the ICU. This allowed us to examine trends in the eCART score over time to find clues as to why some patients are transferred late to the ICU and why these late transfers have worse outcomes than those transferred earlier. Another strength is the large multicenter database used for the analysis, which included an urban tertiary care hospital, suburban teaching hospitals, and a community nonteaching hospital.
Our study has several limitations. First, we utilized just 1 of many potential measures of critical illness and a cutoff that only included one‐third of patients ultimately transferred to the ICU. However, by using the eCART score, we were able to track a patient's physiologic status over time and remove the variability that comes with using subjective definitions of critical illness. Furthermore, we utilized a high‐specificity cutoff for eCART to ensure that transferred patients had significantly deranged physiology and to avoid including planned transfers to the ICU. It is likely that some patients who were critically ill with less deranged physiology that would have benefitted from earlier transfer were excluded from the study. Second, we were unable to determine the cause of physiologic deterioration for patients in our study due to the large number of included patients. In addition, we did not have code status, comorbidities, or reason for ICU admission available in the dataset. It is likely that the impact of delayed transfer varies by the indication for ICU admission and chronic disease burden. It is also possible that controlling for these unmeasured factors could negate the beneficial association seen for earlier ICU admission. However, our finding of such a strong relationship between time to transfer and mortality after controlling for several important variables suggests that early recognition of critical illness is beneficial to many patients on the wards. Third, due to its observational nature, our study cannot estimate the true impact of timely ICU transfer on critically ill ward patient outcomes. Future clinical trials will be needed to determine the impact of electronic early warning scores on patient outcomes.
In conclusion, delayed ICU transfer is associated with significantly increased hospital LOS and mortality. This association highlights the need for ongoing work toward both the implementation of an evidence‐based risk stratification tool as well as development of effective critical care outreach resources for patients decompensating on the wards. Real‐time use of a validated early warning score, such as eCART, could potentially lead to more timely ICU transfer for critically ill patients and reduced rates of preventable in‐hospital death.
Acknowledgements
The authors thank Timothy Holper, Justin Lakeman, and Contessa Hsu for assistance with data extraction and technical support; Poome Chamnankit, MS, CNP, Kelly Bhatia, MSN, ACNP, and Audrey Seitman, MSN, ACNP for performing manual chart review of cardiac arrest patients; and Nicole Twu for administrative support.
Disclosures: This research was funded in part by an institutional Clinical and Translational Science Award grant (UL1 RR024999, PI: Dr. Julian Solway). Dr. Churpek is supported by a career development award from the National Heart, Lung, and Blood Institute (K08 HL121080). Drs. Churpek and Edelson have a patent pending (ARCD. P0535US.P2) for risk stratification algorithms for hospitalized patients. In addition, Dr. Edelson has received research support from Philips Healthcare (Andover, MA), the American Heart Association (Dallas, TX), and Laerdal Medical (Stavanger, Norway). She has ownership interest in Quant HC (Chicago, IL), which is developing products for risk stratification of hospitalized patients. Drs. Churpek and Wendlandt had full access to all the data in the study and take responsibility for the integrity of the data and the accuracy of the data analysis. Preliminary versions of these data were presented at the 2015 meeting of the Society of Hospital Medicine (March 31, 2015, National Harbor, MD).
- , , , , . Inpatient transfers to the intensive care unit: delays are associated with increased mortality and morbidity. J Gen Intern Med. 2003;18(2):77–83.
- , , , et al. Confidential inquiry into quality of care before admission to intensive care. BMJ. 1998;316(7148):1853–1858.
- , , , , , . Relationship between ICU bed availability, ICU readmission, and cardiac arrest in the general wards. Crit Care Med. 2014;42(9):2037–2041.
- , , , et al. Survival of critically ill patients hospitalized in and out of intensive care units under paucity of intensive care unit beds. Crit Care Med. 2004;32(8):1654–1661.
- , , , et al. Refusal of intensive care unit admission due to a full unit: impact on mortality. Am J Respir Crit Care Med. 2012;185(10):1081–1087.
- , , , et al. Evaluation of triage decisions for intensive care admission. Crit Care Med. 1999;27(6):1073–1079.
- , , , et al. Predictors of intensive care unit refusal in French intensive care units: a multiple‐center study. Crit Care Med. 2005;33(4):750–755.
- , , , . Acute Physiology and Chronic Health Evaluation (APACHE) IV: hospital mortality assessment for today's critically ill patients. Crit Care Med. 2006;34(5):1297–1310.
- , , , et al. Impact of delayed admission to intensive care units on mortality of critically ill patients: a cohort study. Crit Care. 2011;15(1):R28.
- , , , et al. Reasons for refusal of admission to intensive care and impact on mortality. Intensive Care Med. 2010;36(10):1772–1779.
- , , , et al. Incidence, location and reasons for avoidable in‐hospital cardiac arrest in a district general hospital. Resuscitation. 2002;54(2):115–123.
- , , . Risk stratification of hospitalized patients on the wards. Chest. 2013;143(6):1758–1765.
- , , , et al. Multicenter development and validation of a risk stratification tool for ward patients. Am J Respir Crit Care Med. 2014;190(6):649–655.
- , , , et al. Early goal‐directed therapy in the treatment of severe sepsis and septic shock. N Engl J Med. 2001;345(19):1368–1377.
- , , , et al. Surviving sepsis campaign: international guidelines for management of severe sepsis and septic shock: 2012. Crit Care Med. 2013;41(2):580–637.
- , , , et al. Outcomes of patients considered for, but not admitted to, the intensive care unit. Crit Care Med. 2008;36(3):812–817.
- , , . Mortality among appropriately referred patients refused admission to intensive‐care units. Lancet. 1997;350(9070):7–11.
- , , , , . Differences in vital signs between elderly and nonelderly patients prior to ward cardiac arrest. Crit Care Med. 2015;43(4):816–822.
- , , , , , . Real‐time risk prediction on the wards: a feasibility study [published April 13, 2016]. Crit Care Med. doi: 10.1097/CCM.0000000000001716.
- , , , et al. Should age be included as a component of track and trigger systems used to identify sick adult patients? Resuscitation. 2008;78(2):109–115.
- , , , et al. Worthing physiological scoring system: derivation and validation of a physiological early‐warning system for medical admissions. An observational, population‐based single‐centre study. Br J Anaesth. 2007;98(6):769–774.
- , , , . Validation of a modified Early Warning Score in medical admissions. QJM. 2001;94(10):521–526.
- , , , et al. Introduction of the medical emergency team (MET) system: a cluster‐randomised controlled trial. Lancet. 2005;365(9477):2091–2097.

Efficacy of Unloader Bracing in Reducing Symptoms of Knee Osteoarthritis
Knee osteoarthritis (OA) is a progressive, degenerative joint disease characterized by pain and dysfunction. OA is a leading cause of disability in middle-aged and older adults,1 affecting an estimated 27 million Americans.2 With the continued aging of the baby boomer population and rising obesity rates, the incidence of OA is estimated to increase by 40% by 2025.3 The clinical and economic burdens of OA on our society—medical costs and workdays lost—are significant and will continue to be a problem for years to come.4
Total knee arthroplasty (TKA) is an option for severe end-stage OA. Most patients with mild to moderate OA follow nonsurgical strategies in an attempt to avoid invasive procedures. As there is no established cure, initial treatment of knee OA is geared toward alleviating pain and improving function. A multimodal approach is typically used and recommended.5,6 Nonsteroidal anti-inflammatory drugs (NSAIDs), acetaminophen, and narcotic analgesics are commonly prescribed. NSAIDs can be effective7 but have well-known cardiovascular, renal, and gastrointestinal risks. If possible, narcotic analgesics should be avoided because of the risk of addiction and the problems associated with dependence. Intra-articular injections of corticosteroids or hyaluronic acid (viscosupplementation) are often recommended to reduce pain associated with arthritis. Braces designed to “off-load” the more diseased medial or lateral compartment of the knee have also been used in an effort to provide symptomatic relief. These low-risk, noninvasive unloader braces have increasingly been advanced as a conservative treatment modality for knee OA,6,8-10despite modest evidence and lack of appropriately powered randomized controlled trials.11 As more research on the efficacy of these braces is needed, we conducted a study to determine whether an unloader brace is an acceptable and valid treatment modality for knee OA.
Patients and Methods
This was a prospective, randomized, controlled trial of patients with symptomatic, predominantly unicompartmental OA involving the medial compartment of the knee. The study protocol was approved by the Institutional Review Board at Baptist Hospital in Pensacola, Florida. Patients were excluded if they had a rheumatologic disorder other than OA; a history of knee surgery other than a routine arthroscopic procedure; any soft-tissue, neurologic, or vascular compromise preventing long-term brace use; or obesity preventing effective or comfortable brace use. It is generally felt that unloader bracing may not be effective for patients with severe contractures or significant knee deformity; therefore, those lacking more than 10° of extension or 20° of flexion, or those who had a varus deformity of more than 8° of varus, were not offered enrollment.
Ideal sizes for the proposed study groups were determined through power analysis using standard deviations from prior similar investigations. The target was 30 patients per group.
Patients gave informed consent to the work. A computer-generated randomization schedule was used to randomize patients either to receive a medial unloader brace (Fusion OA; Breg, Inc) or not to receive a brace. Patients in these brace and control groups were allowed to continue their standard conservative OA treatment modalities, including NSAID use, home exercises, and joint supplement use. Patients were restricted from receiving any injection therapy or narcotic pain medication in an effort to isolate the effects of bracing on relief of pain and other symptoms.
All patients were examined by an orthopedic surgeon or fellowship-trained primary care sports medicine specialist. Age, sex, height, and weight data were recorded. Body mass index was calculated. Anteroposterior, lateral, flexion weight-bearing, and long-leg standing radiographs were obtained. Two orthopedic surgeons blindly graded OA12 and calculated knee varus angles.13 Values were averaged, and intraobserver reliability and interobserver reliability were calculated.
Prospective subjective outcomes were evaluated with the Knee Injury and Osteoarthritis Outcome Score (KOOS), administered on study entry and at 4, 8, 16, and 24 weeks during the study. The KOOS has 5 subscales: Pain, Symptoms, Function in Daily Living, Function in Sport and Recreation, and Knee-Related Quality of Life. Each subscale is scored separately. Items are rated 0 (extreme problems) to 100 (no problems). Patients were also asked to complete a weekly diary, which included visual analog scale (VAS) ratings of pain, NSAID use, sleep, and activity level. VAS items were rated 1 (extreme problems) to 100 (no problems). For brace-group patients, hours of brace use per day were recorded. Patients were required to use the brace for a minimum of 4 hours per day.
KOOS and VAS data were analyzed with repeated-measures analysis of variance. Significance level was set at P < .05.
Results
Of the 50 patients randomized, 31 (16 brace, 15 control) completed the study. Of the 19 dropouts, 10 were in the brace group (4 dropped out because of brace discomfort) and 9 in the control group (5 dropped out because of significant pain and the desire for more aggressive treatment with injections). The target patient numbers based on the power analysis were not achieved because of patient enrollment difficulties resulting from the strict criteria established in the study design.
The brace group consisted of 8 men and 8 women. Braces were worn an average of 6.7 hours per day. The control group consisted of 8 men and 7 women. The groups were not significantly different in age, height, weight, body mass index, measured varus knee angle, or arthritis grade (Table 1).
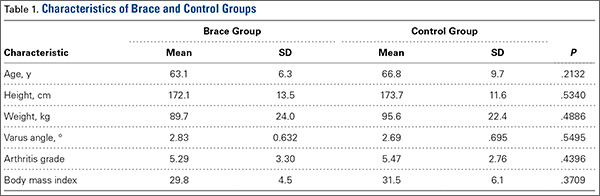
Radiographs were assessed by 2 orthopedic surgeons. Varus angle measurements showed high interobserver reliability (.904, P = .03) and high intraobserver reliability (.969, P = .05); arthritis grades showed low interobserver reliability (.469, P = .59) and high intraobserver reliability (.810, P = .001).
KOOS results showed that, compared with control patients, brace patients had significantly less pain (P < .001), fewer arthritis symptoms (P = .007), better ability to engage in activities of daily living (ADLs) (P = .008), and better total knee function (P = .004) (Figures 1-4). The groups did not differ in ability to engage in sport and recreation (P = .402) or in knee-related quality of life (P = .718), but each parameter showed a trend to be better in the brace group. There was no effect of time in any KOOS subscale. Confidence intervals for these data are listed in Table 2.
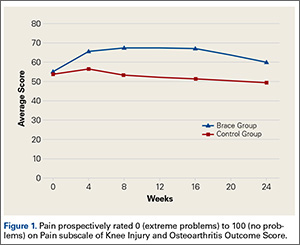
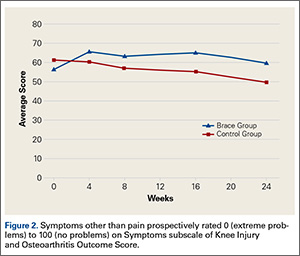
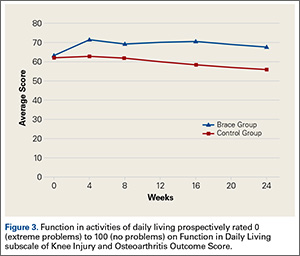
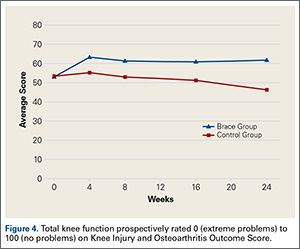
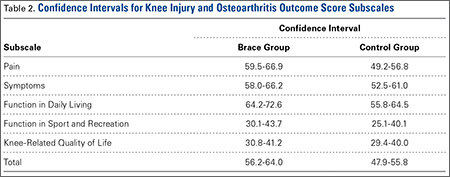
VAS results showed that, compared with control patients, brace patients had significantly less pain throughout the day (P = .021) and better activity levels (P = .035) (Figures 5, 6). The groups did not differ in ability to sleep (P = .117) or NSAID use (P = .138), but each parameter showed a trend to be better in the brace group. There was no effect of time in either VAS.
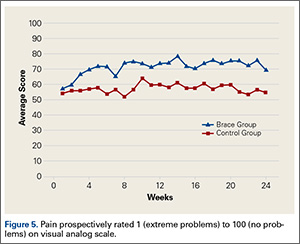
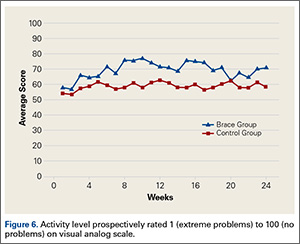
Discussion
We conducted this study to determine the efficacy of a medial unloader brace in reducing the pain and symptoms associated with varus knee OA.
Although TKA is an option for patients with significant end-stage knee OA, mild OA and moderate OA typically are managed with nonoperative modalities. These modalities can be effective and may delay or eliminate the need for surgery, which poses a small but definite risk. Delaying surgery, especially in younger, active patients, has the potential to reduce the number of wear-related revision surgeries.14
Braces designed to off-load the more diseased medial or lateral compartment of the knee have been used in an effort to provide relief from symptomatic OA. There is a lack of appropriately powered, randomized controlled studies on the efficacy of these braces. With the evidence being inconclusive, the American Academy of Orthopaedic Surgeons is unable to recommend for or against use of a brace in medial unicompartmental OA.11 More research on the efficacy of these braces is needed. In the present study, we asked 2 questions: Does use of an unloader brace lessen the pain associated with knee OA? Is the unloader brace an acceptable and valid treatment modality for knee OA?
The 2 clinical outcome tools used in this study showed significant improvement in pain in brace patients compared with control patients. KOOS results showed reduced pain and arthritis symptoms. VAS results showed less pain experienced throughout the day. Pain reduction is probably the most important benefit of any nonoperative modality for knee OA. Pain typically is the driving force and the major indication for TKA. Other investigators have found pain reduced with use of unloader braces, but few long-term prospective randomized trials have been conducted. Ramsey and colleagues15 compared a neutral stabilizing brace with a medial unloading brace and found that both helped reduce pain and functional disability. This led to discussion about the 2 major potential mechanisms for symptom relief. One theory holds that bracing unloads the diseased portion of the joint and thereby helps improve symptoms.16-18 According to the other theory, bracing stabilizes the knee, reducing muscle cocontractions and joint compression.15,19,20 Draganich and colleagues21 found that both off-the-shelf and adjustable unloader braces reduced pain. In a short-term (8-week) study, Barnes and colleagues22 found substantial improvement in knee pain with use of an unloader brace. In one of the larger, better designed, prospective studies, Brouwer and colleagues23 found borderline but significant improvements in pain. Larsen and colleagues,24 in another short-term study, found no improvement in pain but did report improved activity levels with use of a medial unloader brace.
In addition to demonstrating pain reduction, our results showed that, compared with control patients, brace patients had fewer arthritis symptoms, better ability to engage in ADLs, and increased activity levels. Other studies have identified additional benefits of bracing for knee arthritis. Larsen and colleagues24 found that valgus bracing for medial compartment knee OA improved walking and sit-to-stand activities. Although pain relief results were modest, Brouwer and colleagues23 found significantly better knee function and longer walking distances for patients who used a medial unloader brace. Hewett and colleagues25 found that pain, ADLs, and walking distance were all improved after 9 weeks of brace wear.
Our study had a few limitations. Although injections and narcotic pain medications were not allowed, NSAIDs, home exercises, and other modalities were permitted. We did not think it was reasonable to eliminate every nonoperative modality during the 6-month study period. Therefore, it is possible that some of the study population’s improvements are attributable to these other modalities, which were not rigidly controlled.
Patient enrollment was difficult because of the strict inclusion and exclusion criteria used. The result was a smaller than anticipated patient population. Although there were many excellent study candidates, most declined enrollment when they learned they could be randomized to the control group. These patients were not willing to forgo injections or bracing for 6 months. We thought it was important to maintain our study design because it allowed us to evaluate the true effect of brace use while eliminating confounding variables. Nearly equal numbers of brace and control patients dropped out of the study. The majority of control group dropouts wanted more treatment options, indicating that NSAIDs and exercises alone were not controlling patients’ symptoms. This finding supports recommendations for a multimodal approach to treatment. As expected, some patients dropped out because their brace was uncomfortable—an important finding that should be considered when counseling patients about treatment options for OA.
Not all patients are candidates for braces. Braces can be irritating and uncomfortable for obese patients and patients with skin or vascular issues. Some patients find braces inconvenient. As discussed, a multimodal OA treatment approach is encouraged, but not every mode fits every patient. Physician and patient should thoroughly discuss the benefits and potential problems of brace use before prescribing. Our study results showed trends toward better improvements for brace patients (compared with control patients) in quality of life, ability to engage in sport and recreation, ability to sleep, and need for NSAIDs. Had we enrolled more patients, we might have found statistical significance for these trends. Despite the challenges with patient enrollment and study population size, the data make clear that unloader braces can benefit appropriate patients.
Our findings support use of a medial unloader brace as an acceptable and valid treatment modality for mild and moderate knee OA. The medial unloader brace should be considered a reasonable alternative, as part of a multimodal approach, to more invasive options, such as TKA.
1. Michaud C, McKenna M, Begg S, et al. The burden of disease and injury in the United States 1996. Popul Health Metr. 2006;4:11.
2. Lawrence RC, Felson DT, Helmick CG, et al; National Arthritis Data Workgroup. Estimates of the prevalence of arthritis and other rheumatic conditions in the United States. Part II. Arthritis Rheum. 2008;58(1):26-35.
3. Woolf AD, Pfleger B. Burden of major musculoskeletal conditions. Bull World Health Organ. 2003;81(9):646-656.
4. London NJ, Miller LE, Block JE. Clinical and economic consequences of the treatment gap in knee osteoarthritis management. Med Hypotheses. 2011;76(6):887-892.
5. Hochberg MC, Altman RD, April KT, et al; American College of Rheumatology. American College of Rheumatology 2012 recommendations for the use of nonpharmacologic and pharmacologic therapies in osteoarthritis of the hand, hip, and knee. Arthritis Care Res. 2012;64(4):465-474.
6. McAlindon TE, Bannuru RR, Sullivan MC, et al. OARSI guidelines for the non-surgical management of knee osteoarthritis. Osteoarthritis Cartilage. 2014;22(3):363-388.
7. Gallelli L, Galasso O, Falcone D, et al. The effects of nonsteroidal anti-inflammatory drugs on clinical outcomes, synovial fluid cytokine concentration and signal transduction pathways in knee osteoarthritis. A randomized open label trial. Osteoarthritis Cartilage. 2013;21(9):1400-1408.
8. Pollo FE, Jackson RW. Knee bracing for unicompartmental osteoarthritis. J Am Acad Orthop Surg. 2006;14(1):5-11.
9. Ramsey DK, Russell ME. Unloader braces for medial compartment knee osteoarthritis: implications on mediating progression. Sports Health. 2009;1(5):416-426.
10. Zhang W, Moskowitz RW, Nuki G, et al. OARSI recommendations for the management of hip and knee osteoarthritis, part II: OARSI evidence-based, expert consensus guidelines. Osteoarthritis Cartilage. 2008;16(2):137-162.
11. Richmond J, Hunter D, Irrgang J, et al; American Academy of Orthopaedic Surgeons. American Academy of Orthopaedic Surgeons clinical practice guideline on the treatment of osteoarthritis (OA) of the knee. J Bone Joint Surg Am. 2010;92(4):990-993.
12. Kellgren JH, Lawrence JS. Radiological assessment of osteo-arthrosis. Ann Rheum Dis. 1957;16(4):494-502.
13. Dugdale TW, Noyes FR, Styer D. Preoperative planning for high tibial osteotomy. The effect of lateral tibiofemoral separation and tibiofemoral length. Clin Orthop Relat Res. 1992;(274):248-264.
14. Weinstein AM, Rome BN, Reichmann WM, et al. Estimating the burden of total knee replacement in the United States. J Bone Joint Surg Am. 2013;95(5):385-392.
15. Ramsey DK, Briem K, Axe MJ, Snyder-Mackler L. A mechanical theory for the effectiveness of bracing for medial compartment osteoarthritis of the knee. J Bone Joint Surg Am. 2007;89(11):2398-2407.
16. Haim A, Wolf A, Rubin G, Genis Y, Khoury M, Rozen N. Effect of center of pressure modulation on knee adduction moment in medial compartment knee osteoarthritis. J Orthop Res. 2011;29(11):1668-1674.
17. Pollo FE, Otis JC, Backus SI, Warren RF, Wickiewicz TL. Reduction of medial compartment loads with valgus bracing of the osteoarthritic knee. Am J Sports Med. 2002;30(3):414-421.
18. Shelburne KB, Torry MR, Steadman JR, Pandy MG. Effects of foot orthoses and valgus bracing on the knee adduction moment and medial joint load during gait. Clin Biomech. 2008;23(6):814-821.
19. Lewek MD, Ramsey DK, Snyder-Mackler L, Rudolph KS. Knee stabilization in patients with medial compartment knee osteoarthritis. Arthritis Rheum. 2005;52(9):2845-2853.
20. Lewek MD, Rudolph KS, Snyder-Mackler L. Control of frontal plane knee laxity during gait in patients with medial compartment knee osteoarthritis. Osteoarthritis Cartilage. 2004;12(9):745-751.
21. Draganich L, Reider B, Rimington T, Piotrowski G, Mallik K, Nasson S. The effectiveness of self-adjustable custom and off-the-shelf bracing in the treatment of varus gonarthrosis. J Bone Joint Surg Am. 2006;88(12):2645-2652.
22. Barnes CL, Cawley PW, Hederman B. Effect of CounterForce brace on symptomatic relief in a group of patients with symptomatic unicompartmental osteoarthritis: a prospective 2-year investigation. Am J Orthop. 2002;31(7):396-401.
23. Brouwer RW, van Raaij TM, Verhaar JA, Coene LN, Bierma-Zeinstra SM. Brace treatment for osteoarthritis of the knee: a prospective randomized multi-centre trial. Osteoarthritis Cartilage. 2006;14(8):777-783.
24. Larsen BL, Jacofsky MC, Brown JA, Jacofsky DJ. Valgus bracing affords short-term treatment solution across walking and sit-to-stand activities. J Arthroplasty. 2013;28(5):792-797.
25. Hewett TE, Noyes FR, Barber-Westin SD, Heckmann TP. Decrease in knee joint pain and increase in function in patients with medial compartment arthrosis: a prospective analysis of valgus bracing. Orthopedics. 1998;21(2):131-138.
Knee osteoarthritis (OA) is a progressive, degenerative joint disease characterized by pain and dysfunction. OA is a leading cause of disability in middle-aged and older adults,1 affecting an estimated 27 million Americans.2 With the continued aging of the baby boomer population and rising obesity rates, the incidence of OA is estimated to increase by 40% by 2025.3 The clinical and economic burdens of OA on our society—medical costs and workdays lost—are significant and will continue to be a problem for years to come.4
Total knee arthroplasty (TKA) is an option for severe end-stage OA. Most patients with mild to moderate OA follow nonsurgical strategies in an attempt to avoid invasive procedures. As there is no established cure, initial treatment of knee OA is geared toward alleviating pain and improving function. A multimodal approach is typically used and recommended.5,6 Nonsteroidal anti-inflammatory drugs (NSAIDs), acetaminophen, and narcotic analgesics are commonly prescribed. NSAIDs can be effective7 but have well-known cardiovascular, renal, and gastrointestinal risks. If possible, narcotic analgesics should be avoided because of the risk of addiction and the problems associated with dependence. Intra-articular injections of corticosteroids or hyaluronic acid (viscosupplementation) are often recommended to reduce pain associated with arthritis. Braces designed to “off-load” the more diseased medial or lateral compartment of the knee have also been used in an effort to provide symptomatic relief. These low-risk, noninvasive unloader braces have increasingly been advanced as a conservative treatment modality for knee OA,6,8-10despite modest evidence and lack of appropriately powered randomized controlled trials.11 As more research on the efficacy of these braces is needed, we conducted a study to determine whether an unloader brace is an acceptable and valid treatment modality for knee OA.
Patients and Methods
This was a prospective, randomized, controlled trial of patients with symptomatic, predominantly unicompartmental OA involving the medial compartment of the knee. The study protocol was approved by the Institutional Review Board at Baptist Hospital in Pensacola, Florida. Patients were excluded if they had a rheumatologic disorder other than OA; a history of knee surgery other than a routine arthroscopic procedure; any soft-tissue, neurologic, or vascular compromise preventing long-term brace use; or obesity preventing effective or comfortable brace use. It is generally felt that unloader bracing may not be effective for patients with severe contractures or significant knee deformity; therefore, those lacking more than 10° of extension or 20° of flexion, or those who had a varus deformity of more than 8° of varus, were not offered enrollment.
Ideal sizes for the proposed study groups were determined through power analysis using standard deviations from prior similar investigations. The target was 30 patients per group.
Patients gave informed consent to the work. A computer-generated randomization schedule was used to randomize patients either to receive a medial unloader brace (Fusion OA; Breg, Inc) or not to receive a brace. Patients in these brace and control groups were allowed to continue their standard conservative OA treatment modalities, including NSAID use, home exercises, and joint supplement use. Patients were restricted from receiving any injection therapy or narcotic pain medication in an effort to isolate the effects of bracing on relief of pain and other symptoms.
All patients were examined by an orthopedic surgeon or fellowship-trained primary care sports medicine specialist. Age, sex, height, and weight data were recorded. Body mass index was calculated. Anteroposterior, lateral, flexion weight-bearing, and long-leg standing radiographs were obtained. Two orthopedic surgeons blindly graded OA12 and calculated knee varus angles.13 Values were averaged, and intraobserver reliability and interobserver reliability were calculated.
Prospective subjective outcomes were evaluated with the Knee Injury and Osteoarthritis Outcome Score (KOOS), administered on study entry and at 4, 8, 16, and 24 weeks during the study. The KOOS has 5 subscales: Pain, Symptoms, Function in Daily Living, Function in Sport and Recreation, and Knee-Related Quality of Life. Each subscale is scored separately. Items are rated 0 (extreme problems) to 100 (no problems). Patients were also asked to complete a weekly diary, which included visual analog scale (VAS) ratings of pain, NSAID use, sleep, and activity level. VAS items were rated 1 (extreme problems) to 100 (no problems). For brace-group patients, hours of brace use per day were recorded. Patients were required to use the brace for a minimum of 4 hours per day.
KOOS and VAS data were analyzed with repeated-measures analysis of variance. Significance level was set at P < .05.
Results
Of the 50 patients randomized, 31 (16 brace, 15 control) completed the study. Of the 19 dropouts, 10 were in the brace group (4 dropped out because of brace discomfort) and 9 in the control group (5 dropped out because of significant pain and the desire for more aggressive treatment with injections). The target patient numbers based on the power analysis were not achieved because of patient enrollment difficulties resulting from the strict criteria established in the study design.
The brace group consisted of 8 men and 8 women. Braces were worn an average of 6.7 hours per day. The control group consisted of 8 men and 7 women. The groups were not significantly different in age, height, weight, body mass index, measured varus knee angle, or arthritis grade (Table 1).
Radiographs were assessed by 2 orthopedic surgeons. Varus angle measurements showed high interobserver reliability (.904, P = .03) and high intraobserver reliability (.969, P = .05); arthritis grades showed low interobserver reliability (.469, P = .59) and high intraobserver reliability (.810, P = .001).
KOOS results showed that, compared with control patients, brace patients had significantly less pain (P < .001), fewer arthritis symptoms (P = .007), better ability to engage in activities of daily living (ADLs) (P = .008), and better total knee function (P = .004) (Figures 1-4). The groups did not differ in ability to engage in sport and recreation (P = .402) or in knee-related quality of life (P = .718), but each parameter showed a trend to be better in the brace group. There was no effect of time in any KOOS subscale. Confidence intervals for these data are listed in Table 2.
VAS results showed that, compared with control patients, brace patients had significantly less pain throughout the day (P = .021) and better activity levels (P = .035) (Figures 5, 6). The groups did not differ in ability to sleep (P = .117) or NSAID use (P = .138), but each parameter showed a trend to be better in the brace group. There was no effect of time in either VAS.
Discussion
We conducted this study to determine the efficacy of a medial unloader brace in reducing the pain and symptoms associated with varus knee OA.
Although TKA is an option for patients with significant end-stage knee OA, mild OA and moderate OA typically are managed with nonoperative modalities. These modalities can be effective and may delay or eliminate the need for surgery, which poses a small but definite risk. Delaying surgery, especially in younger, active patients, has the potential to reduce the number of wear-related revision surgeries.14
Braces designed to off-load the more diseased medial or lateral compartment of the knee have been used in an effort to provide relief from symptomatic OA. There is a lack of appropriately powered, randomized controlled studies on the efficacy of these braces. With the evidence being inconclusive, the American Academy of Orthopaedic Surgeons is unable to recommend for or against use of a brace in medial unicompartmental OA.11 More research on the efficacy of these braces is needed. In the present study, we asked 2 questions: Does use of an unloader brace lessen the pain associated with knee OA? Is the unloader brace an acceptable and valid treatment modality for knee OA?
The 2 clinical outcome tools used in this study showed significant improvement in pain in brace patients compared with control patients. KOOS results showed reduced pain and arthritis symptoms. VAS results showed less pain experienced throughout the day. Pain reduction is probably the most important benefit of any nonoperative modality for knee OA. Pain typically is the driving force and the major indication for TKA. Other investigators have found pain reduced with use of unloader braces, but few long-term prospective randomized trials have been conducted. Ramsey and colleagues15 compared a neutral stabilizing brace with a medial unloading brace and found that both helped reduce pain and functional disability. This led to discussion about the 2 major potential mechanisms for symptom relief. One theory holds that bracing unloads the diseased portion of the joint and thereby helps improve symptoms.16-18 According to the other theory, bracing stabilizes the knee, reducing muscle cocontractions and joint compression.15,19,20 Draganich and colleagues21 found that both off-the-shelf and adjustable unloader braces reduced pain. In a short-term (8-week) study, Barnes and colleagues22 found substantial improvement in knee pain with use of an unloader brace. In one of the larger, better designed, prospective studies, Brouwer and colleagues23 found borderline but significant improvements in pain. Larsen and colleagues,24 in another short-term study, found no improvement in pain but did report improved activity levels with use of a medial unloader brace.
In addition to demonstrating pain reduction, our results showed that, compared with control patients, brace patients had fewer arthritis symptoms, better ability to engage in ADLs, and increased activity levels. Other studies have identified additional benefits of bracing for knee arthritis. Larsen and colleagues24 found that valgus bracing for medial compartment knee OA improved walking and sit-to-stand activities. Although pain relief results were modest, Brouwer and colleagues23 found significantly better knee function and longer walking distances for patients who used a medial unloader brace. Hewett and colleagues25 found that pain, ADLs, and walking distance were all improved after 9 weeks of brace wear.
Our study had a few limitations. Although injections and narcotic pain medications were not allowed, NSAIDs, home exercises, and other modalities were permitted. We did not think it was reasonable to eliminate every nonoperative modality during the 6-month study period. Therefore, it is possible that some of the study population’s improvements are attributable to these other modalities, which were not rigidly controlled.
Patient enrollment was difficult because of the strict inclusion and exclusion criteria used. The result was a smaller than anticipated patient population. Although there were many excellent study candidates, most declined enrollment when they learned they could be randomized to the control group. These patients were not willing to forgo injections or bracing for 6 months. We thought it was important to maintain our study design because it allowed us to evaluate the true effect of brace use while eliminating confounding variables. Nearly equal numbers of brace and control patients dropped out of the study. The majority of control group dropouts wanted more treatment options, indicating that NSAIDs and exercises alone were not controlling patients’ symptoms. This finding supports recommendations for a multimodal approach to treatment. As expected, some patients dropped out because their brace was uncomfortable—an important finding that should be considered when counseling patients about treatment options for OA.
Not all patients are candidates for braces. Braces can be irritating and uncomfortable for obese patients and patients with skin or vascular issues. Some patients find braces inconvenient. As discussed, a multimodal OA treatment approach is encouraged, but not every mode fits every patient. Physician and patient should thoroughly discuss the benefits and potential problems of brace use before prescribing. Our study results showed trends toward better improvements for brace patients (compared with control patients) in quality of life, ability to engage in sport and recreation, ability to sleep, and need for NSAIDs. Had we enrolled more patients, we might have found statistical significance for these trends. Despite the challenges with patient enrollment and study population size, the data make clear that unloader braces can benefit appropriate patients.
Our findings support use of a medial unloader brace as an acceptable and valid treatment modality for mild and moderate knee OA. The medial unloader brace should be considered a reasonable alternative, as part of a multimodal approach, to more invasive options, such as TKA.
1. Michaud C, McKenna M, Begg S, et al. The burden of disease and injury in the United States 1996. Popul Health Metr. 2006;4:11.
2. Lawrence RC, Felson DT, Helmick CG, et al; National Arthritis Data Workgroup. Estimates of the prevalence of arthritis and other rheumatic conditions in the United States. Part II. Arthritis Rheum. 2008;58(1):26-35.
3. Woolf AD, Pfleger B. Burden of major musculoskeletal conditions. Bull World Health Organ. 2003;81(9):646-656.
4. London NJ, Miller LE, Block JE. Clinical and economic consequences of the treatment gap in knee osteoarthritis management. Med Hypotheses. 2011;76(6):887-892.
5. Hochberg MC, Altman RD, April KT, et al; American College of Rheumatology. American College of Rheumatology 2012 recommendations for the use of nonpharmacologic and pharmacologic therapies in osteoarthritis of the hand, hip, and knee. Arthritis Care Res. 2012;64(4):465-474.
6. McAlindon TE, Bannuru RR, Sullivan MC, et al. OARSI guidelines for the non-surgical management of knee osteoarthritis. Osteoarthritis Cartilage. 2014;22(3):363-388.
7. Gallelli L, Galasso O, Falcone D, et al. The effects of nonsteroidal anti-inflammatory drugs on clinical outcomes, synovial fluid cytokine concentration and signal transduction pathways in knee osteoarthritis. A randomized open label trial. Osteoarthritis Cartilage. 2013;21(9):1400-1408.
8. Pollo FE, Jackson RW. Knee bracing for unicompartmental osteoarthritis. J Am Acad Orthop Surg. 2006;14(1):5-11.
9. Ramsey DK, Russell ME. Unloader braces for medial compartment knee osteoarthritis: implications on mediating progression. Sports Health. 2009;1(5):416-426.
10. Zhang W, Moskowitz RW, Nuki G, et al. OARSI recommendations for the management of hip and knee osteoarthritis, part II: OARSI evidence-based, expert consensus guidelines. Osteoarthritis Cartilage. 2008;16(2):137-162.
11. Richmond J, Hunter D, Irrgang J, et al; American Academy of Orthopaedic Surgeons. American Academy of Orthopaedic Surgeons clinical practice guideline on the treatment of osteoarthritis (OA) of the knee. J Bone Joint Surg Am. 2010;92(4):990-993.
12. Kellgren JH, Lawrence JS. Radiological assessment of osteo-arthrosis. Ann Rheum Dis. 1957;16(4):494-502.
13. Dugdale TW, Noyes FR, Styer D. Preoperative planning for high tibial osteotomy. The effect of lateral tibiofemoral separation and tibiofemoral length. Clin Orthop Relat Res. 1992;(274):248-264.
14. Weinstein AM, Rome BN, Reichmann WM, et al. Estimating the burden of total knee replacement in the United States. J Bone Joint Surg Am. 2013;95(5):385-392.
15. Ramsey DK, Briem K, Axe MJ, Snyder-Mackler L. A mechanical theory for the effectiveness of bracing for medial compartment osteoarthritis of the knee. J Bone Joint Surg Am. 2007;89(11):2398-2407.
16. Haim A, Wolf A, Rubin G, Genis Y, Khoury M, Rozen N. Effect of center of pressure modulation on knee adduction moment in medial compartment knee osteoarthritis. J Orthop Res. 2011;29(11):1668-1674.
17. Pollo FE, Otis JC, Backus SI, Warren RF, Wickiewicz TL. Reduction of medial compartment loads with valgus bracing of the osteoarthritic knee. Am J Sports Med. 2002;30(3):414-421.
18. Shelburne KB, Torry MR, Steadman JR, Pandy MG. Effects of foot orthoses and valgus bracing on the knee adduction moment and medial joint load during gait. Clin Biomech. 2008;23(6):814-821.
19. Lewek MD, Ramsey DK, Snyder-Mackler L, Rudolph KS. Knee stabilization in patients with medial compartment knee osteoarthritis. Arthritis Rheum. 2005;52(9):2845-2853.
20. Lewek MD, Rudolph KS, Snyder-Mackler L. Control of frontal plane knee laxity during gait in patients with medial compartment knee osteoarthritis. Osteoarthritis Cartilage. 2004;12(9):745-751.
21. Draganich L, Reider B, Rimington T, Piotrowski G, Mallik K, Nasson S. The effectiveness of self-adjustable custom and off-the-shelf bracing in the treatment of varus gonarthrosis. J Bone Joint Surg Am. 2006;88(12):2645-2652.
22. Barnes CL, Cawley PW, Hederman B. Effect of CounterForce brace on symptomatic relief in a group of patients with symptomatic unicompartmental osteoarthritis: a prospective 2-year investigation. Am J Orthop. 2002;31(7):396-401.
23. Brouwer RW, van Raaij TM, Verhaar JA, Coene LN, Bierma-Zeinstra SM. Brace treatment for osteoarthritis of the knee: a prospective randomized multi-centre trial. Osteoarthritis Cartilage. 2006;14(8):777-783.
24. Larsen BL, Jacofsky MC, Brown JA, Jacofsky DJ. Valgus bracing affords short-term treatment solution across walking and sit-to-stand activities. J Arthroplasty. 2013;28(5):792-797.
25. Hewett TE, Noyes FR, Barber-Westin SD, Heckmann TP. Decrease in knee joint pain and increase in function in patients with medial compartment arthrosis: a prospective analysis of valgus bracing. Orthopedics. 1998;21(2):131-138.
Platelet-Rich Plasma Can Be Used to Successfully Treat Elbow Ulnar Collateral Ligament Insufficiency in High-Level Throwers
For overhead athletes, elbow ulnar collateral ligament (UCL) insufficiency is a potential career-ending injury. Baseball players with UCL insufficiency typically complain of medial-sided elbow pain that affects their ability to throw. Loss of velocity, loss of control, difficulty warming up, and pain while throwing are all symptoms of UCL injury.
Classically, nonoperative treatment of UCL injuries involves activity modification, use of anti-inflammatory medication, and a structured physical therapy program. Asymptomatic players can return to throwing after a structured interval throwing program. Rettig and colleagues1 found a 42% rate of success in conservatively treating UCL injuries in throwing athletes. UCL reconstruction is reserved for players with complete tears of the UCL or with partial tears after failed conservative treatment. Several techniques have been used to reconstruct the ligament, but successful outcomes depend on a long rehabilitation process. According to most published series, 85% to 90% of athletes who had UCL reconstruction returned to their previous level of play, but it took, on average, 9 to 12 months.2,3 This prolonged recovery period is one reason that some older professional baseball players, as well as casual high school and college players, elect to forgo surgery.
Over the past few years, platelet-rich plasma (PRP) has garnered attention as a bridge between conservative treatment and surgery. PRP refers to a sample of autologous blood that contains a platelet concentration higher than baseline levels. This sample often has a 3 to 5 times increase in growth factor concentration.4-6 Initial studies focused on its ability to successfully treat lateral epicondylitis.7-9 More recent clinical work has shown that PRP can potentially enhance healing after anterior cruciate ligament reconstruction,10-14 rotator cuff repair,15-17 and subacromial decompression.11,18-23 If PRP could be used to successfully treat UCL insufficiency that is refractory to conservative treatment, then year-long recovery periods could be avoided. This could potentially prolong certain athletes’ careers or, at the very least, allow them to return to play much sooner. In the present case series, we hypothesized that PRP injections could be used to successfully treat partial UCL tears in high-level throwing athletes, obviating the need for surgery and its associated prolonged recovery period.
Materials and Methods
Institutional Review Board approval was obtained for this retrospective study of 44 baseball players treated with PRP injections for partial-thickness UCL tears.
Patients provided written informed consent. They were diagnosed with UCL insufficiency by physical examination, and findings were confirmed by magnetic resonance imaging (MRI). After diagnosis, all throwers underwent a trial of conservative treatment that included rest, activity modification, use of anti-inflammatory medication, and physical therapy followed by an attempt to return to throwing using an interval throwing program.
Study inclusion criteria were physical examinations and MRI results consistent with UCL insufficiency, and failure of the conservative treatment plan described.
Patients were injected using the Autologous Conditioned Plasma system (Arthrex). PRP solutions were prepared according to manufacturer guidelines. After the elbow was prepared sterilely, the UCL was injected at the location of the tear. Typically, 3 mL of PRP was injected into the elbow. Sixteen patients had 1 injection, 6 had 2, and 22 had 3. Repeat injections were considered for recalcitrant pain after 3 weeks.
After injection, patients used acetaminophen and ice for pain control. Anti-inflammatory medications were avoided for a minimum of 2 weeks after injection. Typical postinjection therapy protocol consisted of rest followed by progressive stretching and strengthening for about 4 to 6 weeks before the start of an interval throwing program. Although there is no well-defined postinjection recovery protocol, as a general rule rest was prescribed for the first 2 weeks, followed by a progressive stretching and strengthening program for the next month. Patients who were asymptomatic subjectively and clinically—negative moving valgus stress test, negative milking maneuver, no pain with valgus stress—were started on an interval throwing program.
Final follow-up involved a physical examination. Results were classified according to a modified version of the Conway Scale12,24-26: excellent (return to preinjury level of competition or performance), good (return to play at a lower level of competition or performance or, specifically for baseball players, ability to throw in daily batting practice), fair (able to play recreationally), and poor (unable to return to previous sport at any level).
By final follow-up, all patients had completed their postoperative rehabilitation protocol, and all had at least tried to return to their previous activities. No patients were lost to follow-up.
Results
Of the 44 baseball players, 6 were professional, 14 were in college, and 24 were in high school. There were 36 pitchers and 8 position players. Mean age was 17.3 years (range, 16-28 years). All patients were available for follow-up after injection (mean, 11 months). Fifteen of the 44 players had an excellent outcome (34%), 17 had a good outcome, 2 had a fair outcome, and 10 had a poor outcome. After injection, 4 (67%) of the 6 professional baseball players returned to professional play. Five (36%) of the 14 college players had an excellent outcome, and 4 (17%) of the 24 high school players had an excellent outcome. Of the 8 position players, 4 had an excellent outcome, 3 had a good outcome, and 1 had a poor outcome.
Before treatment, all patients had medial-sided elbow pain over the UCL inhibiting their ability to throw. Mean duration of symptoms before injection was 8.8 months (range, 1-36 months). There was no correlation between symptom duration and any outcome measure. On MRI, 29 patients showed partial tears: 22 proximally based and 7 distally based. The other 15 patients had diffuse signal without partial tear. All 7 patients with distally based partial tears and 3 of the patients with proximally based partial tears had a poor outcome. Overall, there were 6 excellent, 7 good, and 2 fair outcomes in the partial-tear group. In the patients with diffuse signal without partial tear, there were 9 excellent and 10 good outcomes.
Mean time from injection to return to throwing was 5 weeks, and mean time to return to competition was 12 weeks (range, 5-24 weeks). The 1 player who returned at 5 weeks was a professional relief pitcher whose team was in the playoffs. He has now pitched for an additional 2 baseball seasons without elbow difficulty.
There were no injection-related complications.
Discussion
To our knowledge, this is the first report documenting successful PRP treatment of UCL insufficiency. In this study, 73% of players who had failed a course of conservative treatment had good to excellent outcomes with PRP injection.
Data on successful nonoperative treatment of UCL injuries are limited. Rettig and colleagues1 treated 31 throwing athletes’ UCL injuries with a supervised rehabilitation program. Treatment included rest, use of anti-inflammatory medication, progressive strengthening, and an interval throwing program. Only 41% of the athletes returned to their previous level of play, and it took, on average, 24.5 weeks. There was no significant difference in age or in duration or acuity of symptoms between those who returned to play and those whose conservative treatment failed.
Surgical reconstruction of UCL injuries has been very successful, with upward of 90% of athletes returning to previous level of play.3,27The procedure, however, is not without associated complications, including retear of the ligament, stiffness, ulnar nerve injury, and fracture.27-29 In addition, even when successful, the procedure requires that athletes take 9 to 12 months to recover before returning to competition at their previous level.
Savoie and colleagues,30 in their recent study on UCL repairs, highlighted an important fact that is often overlooked when reviewing the literature on UCL tears. Most of the literature on these injuries focuses on college and professional baseball players in whom ligament damage is often extensive, precluding repair. In contrast to prior reports, Savoie and colleagues30 found excellent results in 93% of their young athletes who underwent UCL repair. It is possible that their results can be attributed to the fact that many of their athletes had tears isolated to one area of the ligament, as opposed to generalized ligament incompetence. Our improved results vis-à-vis other reports on conservative management may be attributable to the same phenomenon.
PRP has garnered much attention in the literature and media because of its potential to enhance healing of tendons and ligaments; in some cases, it can obviate the need for surgery. After failure of other nonoperative measures in 15 patients with elbow epicondylitis, Mishra and Pavelko8 treated each patient with a single PRP injection. They prepared the PRP using the GPS III system (Biomet). At final follow-up, 93% improvement was seen. Clearly, their experiment had design flaws: It was nonblinded, and 3 of the 5 patients in the control group treated with bupivacaine injection withdrew from the experiment. Despite its shortcomings, their study became the impetus for several other studies.
A larger, double-blinded, randomized controlled trial comparing PRP and cortisone injections for lateral epicondylitis in 100 patients is under way, and preliminary results have been published.9 A minimum of 6 months after injection, patients who received PRP showed more improvement in visual analog scale (VAS) pain scores and Disabilities of the Arm, Shoulder, and Hand (DASH) questionnaire scores. In another large, double-blinded, randomized controlled trial, patients with chronic lateral epicondylitis had significant improvements in VAS pain scores and DASH scores relative to patients injected with corticosteroids with a 2-year follow-up.31 Similarly, Thanasas and colleagues32 found significantly reduced VAS pain scores in patients injected with PRP versus autologous whole blood. Another study demonstrated improved tendon morphology using ultrasound imaging 6 months after PRP injection.33
Contrary to these positive results, Krogh and colleagues34 found that a single injection of PRP or glucocorticoid was not significantly superior to a saline injection for reducing pain and disability over a 3-month period in patients with lateral epicondylitis. Their study, however, had major flaws. Its original design called for a 12-month follow-up, but there was massive dropout in all 3 treatment arms, necessitating reporting of only 3-month data. In addition, 60% of the patients in the glucocorticoid group were not naïve to this treatment, so definitive conclusions about the efficacy of glucocorticoids could not be made.
In the present study, we successfully treated partial ligament tears with PRP injections. Sixty-seven percent of our baseball players returned to play at a mean of 4 months, much earlier than the 9 to 12 months typically required after ligament reconstruction. Many athletes, such as high school baseball players or aging veteran professional baseball players, do not have the luxury of 12 months for recovery. Therefore, this select group of patients clearly has a limited window of opportunity to return to play. In fact, these patients might be ideal candidates for PRP injections for UCL injuries. Return-to-play rates, however, differed significantly among professional players and nonprofessional players. The difference may be attributable to professional players’ conditioning, quality of physical therapy, extrinsic motivation, and other intangible factors. Four (67%) of our 6 professional baseball players returned to professional play after injection, whereas only 36% of college players and 17% of high school players had excellent outcomes.
Limitations
The present study had several weaknesses, several of which are inherent to PRP studies conducted so far. It was not a prospective, randomized controlled trial. It is important to note that PRP treatment in diseased tissue may have some drawbacks, as its success depends on the ability of healing tissue to use concentrated growth factors and cytokines to proliferate.35 Thus, a chronically injured ligament with depleted active cells may have a diminished response to PRP. Another limitation of this study is that we evaluated outcomes based on return to play using the Conway Scale, which is well reported but not validated. Despite the potential weaknesses of this outcome scale, it has become the benchmark for measuring the success of outcomes of UCL reconstruction. Furthermore, we did not measure patients’ satisfaction with the treatment. Players who could not return to their preinjury level of play may have considered the treatment a failure regardless of their ability to continue throwing. Last, MRI was not repeated to document ligament healing. We did not routinely perform a second MRI because we thought it would not affect treatment. Several series have found a high incidence of abnormal signal in baseball players’ UCLs. In this group of patients, the most important outcome is return to previous level of competition.
This study raised several questions. Is one PRP brand better than another? Should more than 1 injection be given? What is the ideal postinjection protocol? Clearly, larger, prospective, randomized controlled studies are needed to truly elucidate the potential role of PRP in the treatment algorithm for UCL injury. Nevertheless, in certain cases in which traditional conservative measures have failed and patients do not have the luxury of rehabilitating for 9 to 12 months after surgery, PRP may be a viable treatment option.
Conclusion
In this study, use of PRP in the treatment of UCL insufficiency produced outcomes much better than earlier reported outcomes of conservative treatment of these injuries. PRP injections may be particularly beneficial in young athletes who have sustained acute damage to an isolated part of the ligament and in athletes unwilling or unable to undergo the extended rehabilitation required after surgical reconstruction of the ligament.
1. Rettig AC, Sherrill C, Snead DS, Mendler JC, Mieling P. Nonoperative treatment of ulnar collateral ligament injuries in throwing athletes. Am J Sports Med. 2001;29(1):15-17.
2. Eygendaal D, Rahussen FT, Diercks RL. Biomechanics of the elbow joint in tennis players and relation to pathology. Br J Sports Med. 2007;41(11):820-823.
3. Bowers AL, Dines JS, Dines DM, Altchek DW. Elbow medial ulnar collateral ligament reconstruction: clinical relevance and the docking technique. J Shoulder Elbow Surg. 2010;19(2):110-117.
5. Kibler WB. Biomechanical analysis of the shoulder during tennis activities. Clin Sports Med. 1995;14(1):79-85.
5. Marx RE. Platelet-rich plasma: evidence to support its use. J Oral Maxillofac Surg. 2004;62(4):489-496.
6. Marx RE. Platelet-rich plasma (PRP): what is PRP and what is not PRP? Implant Dent. 2001;10(4):225-228.
7. Elliott B, Fleisig G, Nicholls R, Escamilia R. Technique effects on upper limb loading in the tennis serve. J Sci Med Sport. 2003;6(1):76-87.
8. Mishra A, Pavelko T. Treatment of chronic elbow tendinosis with buffered platelet-rich plasma. Am J Sports Med. 2006;34(11):1774-1778.
9. Mishra A, Woodall J Jr, Vieira A. Treatment of tendon and muscle using platelet-rich plasma. Clin Sports Med. 2009;28(1):113-125.
10. Kovacs MS. Applied physiology of tennis performance. Br J Sports Med. 2006;40(5):381-386.
11. Xie X, Wu H, Zhao S, Xie G, Huangfu X, Zhao J. The effect of platelet-rich plasma on patterns of gene expression in a dog model of anterior cruciate ligament reconstruction. J Surg Res. 2013;180(1):80-88.
12. Pluim BM, Staal JB, Windler GE, Jayanthi N. Tennis injuries: occurrence, aetiology, and prevention. Br J Sports Med. 2006;40(5):415-423.
13. Xie X, Zhao S, Wu H, et al. Platelet-rich plasma enhances autograft revascularization and reinnervation in a dog model of anterior cruciate ligament reconstruction. J Surg Res. 2013;183(1):214-222.
14. Lopez-Vidriero E, Goulding KA, Simon DA, Sanchez M, Johnson DH. The use of platelet-rich plasma in arthroscopy and sports medicine: optimizing the healing environment. Arthroscopy. 2010;26(2):269-278.
15. Jo CH, Shin JS, Shin WH, Lee SY, Yoon KS, Shin S. Platelet-rich plasma for arthroscopic repair of medium to large rotator cuff tears: a randomized controlled trial. Am J Sports Med. 2015;43(9):2102-2110.
16. Jo CH, Shin JS, Lee YG, et al. Platelet-rich plasma for arthroscopic repair of large to massive rotator cuff tears: a randomized, single-blinded, parallel-group trial. Am J Sports Med. 2013;41(10):2240-2248.
17. Randelli P, Arrigoni P, Ragone V, Aliprandi A, Cabitza P. Platelet-rich plasma in arthroscopic rotator cuff repair: a prospective RCT study, 2-year follow-up. J Shoulder Elbow Surg. 2011;20(4):518-528.
18. Randelli P, Arrigoni P, Ragone V, Aliprandi A, Cabitza P. Platelet rich plasma in arthroscopic rotator cuff repair: a prospective RCT study, 2-year follow-up. J Shoulder Elbow Surg. 2011;20(4):518-528.
19. Barber FA, Hrnack SA, Snyder SJ, Hapa O. Rotator cuff repair healing influenced by platelet-rich plasma construct augmentation. Arthroscopy. 2011;27(8):1029-1035.
20. Jo CH, Kim JE, Yoon KS, et al. Does platelet-rich plasma accelerate recovery after rotator cuff repair? A prospective cohort study. Am J Sports Med. 2011;39(10):2082-2090.
21. Jo CH, Kim JE, Yoon KS, Shin S. Platelet-rich plasma stimulates cell proliferation and enhances matrix gene expression and synthesis in tenocytes from human rotator cuff tendons with degenerative tears. Am J Sports Med. 2012;40(5):1035-1045.
22. Chahal J, Van Thiel GS, Mall N, et al. The role of platelet-rich plasma in arthroscopic rotator cuff repair: a systematic review with quantitative synthesis. Arthroscopy. 2012;28(11):1718-1727.
23. Mei-Dan O, Carmont MR. The role of platelet-rich plasma in rotator cuff repair. Sports Med Arthrosc Rev. 2011;19(3):244-250.
24. Dines JS, ElAttrache NS, Conway JE, Smith W, Ahmad CS. Clinical outcomes of the DANE TJ technique to treat ulnar collateral ligament insufficiency of the elbow. Am J Sports Med. 2007;35(12):2039-2044.
25. Hutchinson MR, Laprade RF, Burnett QM 2nd, Moss R, Terpstra J. Injury surveillance at the USTA boys’ tennis championships: a 6-yr study. Med Sci Sports Exerc. 1995;27(6):826-830.
26. Winge S, Jørgensen U, Nielsen A. Epidemiology of injuries in Danish championship tennis. Int J Sports Med. 1989;10(5):368-371.
27. Safran MR, Hutchinson MR, Moss R, Albrandt J. A comparison of injuries in elite boys and girls tennis players. Paper presented at: 9th Annual Meeting of the Society of Tennis Medicine and Science; March 1999; Indian Wells, CA.
28. Cain EL, Andrews JR, Dugas JR, et al. Outcome of ulnar collateral ligament reconstruction of the elbow in 1281 athletes: results in 743 athletes with minimum 2-year follow-up. Am J Sports Med. 2010;38(12):2426-2434.
29. Dines JS, Yocum LA, Frank JB, ElAttrache NS, Gambardella RA, Jobe FW. Revision surgery for failed elbow medial collateral ligament reconstruction. Am J Sports Med. 2008;36(6):1061-1065.
30. Savoie FH, Trenhaile SW, Roberts J, Field LD, Ramsey JR. Primary repair of ulnar collateral ligament injuries of the elbow in young athletes: a case series of injuries to the proximal and distal ends of the ligament. Am J Sports Med. 2008;36(6):1066-1072.
31. Gosens T, Peerbooms JC, van Laar W, Oudsten den BL. Ongoing positive effect of platelet-rich plasma versus corticosteroid injection in lateral epicondylitis: a double-blind randomized controlled trial with 2-year follow-up. Am J Sports Med. 2011;39(6):1200-1208.
32. Thanasas C, Papadimitriou G, Charalambidis C, Paraskevopoulos I, Papanikolaou A. Platelet-rich plasma versus autologous whole blood for the treatment of chronic lateral elbow epicondylitis: a randomized controlled clinical trial. Am J Sports Med. 2011;39(10):2130-2134.
33. Chaudhury S, La Lama de M, Adler RS, et al. Platelet-rich plasma for the treatment of lateral epicondylitis: sonographic assessment of tendon morphology and vascularity (pilot study). Skeletal Radiol. 2013;42(1):91-97.
34. Krogh TP, Fredberg U, Stengaard-Pedersen K, Christensen R, Jensen P, Ellingsen T. Treatment of lateral epicondylitis with platelet-rich plasma, glucocorticoid, or saline: a randomized, double-blind, placebo-controlled trial. Am J Sports Med. 2013;41(3):625-635.
35. Anz AW, Hackel JG, Nilssen EC, Andrews JR. Application of biologics in the treatment of the rotator cuff, meniscus, cartilage, and osteoarthritis. J Am Acad Orthop Surg. 2014;22(2):68-79.
For overhead athletes, elbow ulnar collateral ligament (UCL) insufficiency is a potential career-ending injury. Baseball players with UCL insufficiency typically complain of medial-sided elbow pain that affects their ability to throw. Loss of velocity, loss of control, difficulty warming up, and pain while throwing are all symptoms of UCL injury.
Classically, nonoperative treatment of UCL injuries involves activity modification, use of anti-inflammatory medication, and a structured physical therapy program. Asymptomatic players can return to throwing after a structured interval throwing program. Rettig and colleagues1 found a 42% rate of success in conservatively treating UCL injuries in throwing athletes. UCL reconstruction is reserved for players with complete tears of the UCL or with partial tears after failed conservative treatment. Several techniques have been used to reconstruct the ligament, but successful outcomes depend on a long rehabilitation process. According to most published series, 85% to 90% of athletes who had UCL reconstruction returned to their previous level of play, but it took, on average, 9 to 12 months.2,3 This prolonged recovery period is one reason that some older professional baseball players, as well as casual high school and college players, elect to forgo surgery.
Over the past few years, platelet-rich plasma (PRP) has garnered attention as a bridge between conservative treatment and surgery. PRP refers to a sample of autologous blood that contains a platelet concentration higher than baseline levels. This sample often has a 3 to 5 times increase in growth factor concentration.4-6 Initial studies focused on its ability to successfully treat lateral epicondylitis.7-9 More recent clinical work has shown that PRP can potentially enhance healing after anterior cruciate ligament reconstruction,10-14 rotator cuff repair,15-17 and subacromial decompression.11,18-23 If PRP could be used to successfully treat UCL insufficiency that is refractory to conservative treatment, then year-long recovery periods could be avoided. This could potentially prolong certain athletes’ careers or, at the very least, allow them to return to play much sooner. In the present case series, we hypothesized that PRP injections could be used to successfully treat partial UCL tears in high-level throwing athletes, obviating the need for surgery and its associated prolonged recovery period.
Materials and Methods
Institutional Review Board approval was obtained for this retrospective study of 44 baseball players treated with PRP injections for partial-thickness UCL tears.
Patients provided written informed consent. They were diagnosed with UCL insufficiency by physical examination, and findings were confirmed by magnetic resonance imaging (MRI). After diagnosis, all throwers underwent a trial of conservative treatment that included rest, activity modification, use of anti-inflammatory medication, and physical therapy followed by an attempt to return to throwing using an interval throwing program.
Study inclusion criteria were physical examinations and MRI results consistent with UCL insufficiency, and failure of the conservative treatment plan described.
Patients were injected using the Autologous Conditioned Plasma system (Arthrex). PRP solutions were prepared according to manufacturer guidelines. After the elbow was prepared sterilely, the UCL was injected at the location of the tear. Typically, 3 mL of PRP was injected into the elbow. Sixteen patients had 1 injection, 6 had 2, and 22 had 3. Repeat injections were considered for recalcitrant pain after 3 weeks.
After injection, patients used acetaminophen and ice for pain control. Anti-inflammatory medications were avoided for a minimum of 2 weeks after injection. Typical postinjection therapy protocol consisted of rest followed by progressive stretching and strengthening for about 4 to 6 weeks before the start of an interval throwing program. Although there is no well-defined postinjection recovery protocol, as a general rule rest was prescribed for the first 2 weeks, followed by a progressive stretching and strengthening program for the next month. Patients who were asymptomatic subjectively and clinically—negative moving valgus stress test, negative milking maneuver, no pain with valgus stress—were started on an interval throwing program.
Final follow-up involved a physical examination. Results were classified according to a modified version of the Conway Scale12,24-26: excellent (return to preinjury level of competition or performance), good (return to play at a lower level of competition or performance or, specifically for baseball players, ability to throw in daily batting practice), fair (able to play recreationally), and poor (unable to return to previous sport at any level).
By final follow-up, all patients had completed their postoperative rehabilitation protocol, and all had at least tried to return to their previous activities. No patients were lost to follow-up.
Results
Of the 44 baseball players, 6 were professional, 14 were in college, and 24 were in high school. There were 36 pitchers and 8 position players. Mean age was 17.3 years (range, 16-28 years). All patients were available for follow-up after injection (mean, 11 months). Fifteen of the 44 players had an excellent outcome (34%), 17 had a good outcome, 2 had a fair outcome, and 10 had a poor outcome. After injection, 4 (67%) of the 6 professional baseball players returned to professional play. Five (36%) of the 14 college players had an excellent outcome, and 4 (17%) of the 24 high school players had an excellent outcome. Of the 8 position players, 4 had an excellent outcome, 3 had a good outcome, and 1 had a poor outcome.
Before treatment, all patients had medial-sided elbow pain over the UCL inhibiting their ability to throw. Mean duration of symptoms before injection was 8.8 months (range, 1-36 months). There was no correlation between symptom duration and any outcome measure. On MRI, 29 patients showed partial tears: 22 proximally based and 7 distally based. The other 15 patients had diffuse signal without partial tear. All 7 patients with distally based partial tears and 3 of the patients with proximally based partial tears had a poor outcome. Overall, there were 6 excellent, 7 good, and 2 fair outcomes in the partial-tear group. In the patients with diffuse signal without partial tear, there were 9 excellent and 10 good outcomes.
Mean time from injection to return to throwing was 5 weeks, and mean time to return to competition was 12 weeks (range, 5-24 weeks). The 1 player who returned at 5 weeks was a professional relief pitcher whose team was in the playoffs. He has now pitched for an additional 2 baseball seasons without elbow difficulty.
There were no injection-related complications.
Discussion
To our knowledge, this is the first report documenting successful PRP treatment of UCL insufficiency. In this study, 73% of players who had failed a course of conservative treatment had good to excellent outcomes with PRP injection.
Data on successful nonoperative treatment of UCL injuries are limited. Rettig and colleagues1 treated 31 throwing athletes’ UCL injuries with a supervised rehabilitation program. Treatment included rest, use of anti-inflammatory medication, progressive strengthening, and an interval throwing program. Only 41% of the athletes returned to their previous level of play, and it took, on average, 24.5 weeks. There was no significant difference in age or in duration or acuity of symptoms between those who returned to play and those whose conservative treatment failed.
Surgical reconstruction of UCL injuries has been very successful, with upward of 90% of athletes returning to previous level of play.3,27The procedure, however, is not without associated complications, including retear of the ligament, stiffness, ulnar nerve injury, and fracture.27-29 In addition, even when successful, the procedure requires that athletes take 9 to 12 months to recover before returning to competition at their previous level.
Savoie and colleagues,30 in their recent study on UCL repairs, highlighted an important fact that is often overlooked when reviewing the literature on UCL tears. Most of the literature on these injuries focuses on college and professional baseball players in whom ligament damage is often extensive, precluding repair. In contrast to prior reports, Savoie and colleagues30 found excellent results in 93% of their young athletes who underwent UCL repair. It is possible that their results can be attributed to the fact that many of their athletes had tears isolated to one area of the ligament, as opposed to generalized ligament incompetence. Our improved results vis-à-vis other reports on conservative management may be attributable to the same phenomenon.
PRP has garnered much attention in the literature and media because of its potential to enhance healing of tendons and ligaments; in some cases, it can obviate the need for surgery. After failure of other nonoperative measures in 15 patients with elbow epicondylitis, Mishra and Pavelko8 treated each patient with a single PRP injection. They prepared the PRP using the GPS III system (Biomet). At final follow-up, 93% improvement was seen. Clearly, their experiment had design flaws: It was nonblinded, and 3 of the 5 patients in the control group treated with bupivacaine injection withdrew from the experiment. Despite its shortcomings, their study became the impetus for several other studies.
A larger, double-blinded, randomized controlled trial comparing PRP and cortisone injections for lateral epicondylitis in 100 patients is under way, and preliminary results have been published.9 A minimum of 6 months after injection, patients who received PRP showed more improvement in visual analog scale (VAS) pain scores and Disabilities of the Arm, Shoulder, and Hand (DASH) questionnaire scores. In another large, double-blinded, randomized controlled trial, patients with chronic lateral epicondylitis had significant improvements in VAS pain scores and DASH scores relative to patients injected with corticosteroids with a 2-year follow-up.31 Similarly, Thanasas and colleagues32 found significantly reduced VAS pain scores in patients injected with PRP versus autologous whole blood. Another study demonstrated improved tendon morphology using ultrasound imaging 6 months after PRP injection.33
Contrary to these positive results, Krogh and colleagues34 found that a single injection of PRP or glucocorticoid was not significantly superior to a saline injection for reducing pain and disability over a 3-month period in patients with lateral epicondylitis. Their study, however, had major flaws. Its original design called for a 12-month follow-up, but there was massive dropout in all 3 treatment arms, necessitating reporting of only 3-month data. In addition, 60% of the patients in the glucocorticoid group were not naïve to this treatment, so definitive conclusions about the efficacy of glucocorticoids could not be made.
In the present study, we successfully treated partial ligament tears with PRP injections. Sixty-seven percent of our baseball players returned to play at a mean of 4 months, much earlier than the 9 to 12 months typically required after ligament reconstruction. Many athletes, such as high school baseball players or aging veteran professional baseball players, do not have the luxury of 12 months for recovery. Therefore, this select group of patients clearly has a limited window of opportunity to return to play. In fact, these patients might be ideal candidates for PRP injections for UCL injuries. Return-to-play rates, however, differed significantly among professional players and nonprofessional players. The difference may be attributable to professional players’ conditioning, quality of physical therapy, extrinsic motivation, and other intangible factors. Four (67%) of our 6 professional baseball players returned to professional play after injection, whereas only 36% of college players and 17% of high school players had excellent outcomes.
Limitations
The present study had several weaknesses, several of which are inherent to PRP studies conducted so far. It was not a prospective, randomized controlled trial. It is important to note that PRP treatment in diseased tissue may have some drawbacks, as its success depends on the ability of healing tissue to use concentrated growth factors and cytokines to proliferate.35 Thus, a chronically injured ligament with depleted active cells may have a diminished response to PRP. Another limitation of this study is that we evaluated outcomes based on return to play using the Conway Scale, which is well reported but not validated. Despite the potential weaknesses of this outcome scale, it has become the benchmark for measuring the success of outcomes of UCL reconstruction. Furthermore, we did not measure patients’ satisfaction with the treatment. Players who could not return to their preinjury level of play may have considered the treatment a failure regardless of their ability to continue throwing. Last, MRI was not repeated to document ligament healing. We did not routinely perform a second MRI because we thought it would not affect treatment. Several series have found a high incidence of abnormal signal in baseball players’ UCLs. In this group of patients, the most important outcome is return to previous level of competition.
This study raised several questions. Is one PRP brand better than another? Should more than 1 injection be given? What is the ideal postinjection protocol? Clearly, larger, prospective, randomized controlled studies are needed to truly elucidate the potential role of PRP in the treatment algorithm for UCL injury. Nevertheless, in certain cases in which traditional conservative measures have failed and patients do not have the luxury of rehabilitating for 9 to 12 months after surgery, PRP may be a viable treatment option.
Conclusion
In this study, use of PRP in the treatment of UCL insufficiency produced outcomes much better than earlier reported outcomes of conservative treatment of these injuries. PRP injections may be particularly beneficial in young athletes who have sustained acute damage to an isolated part of the ligament and in athletes unwilling or unable to undergo the extended rehabilitation required after surgical reconstruction of the ligament.
1. Rettig AC, Sherrill C, Snead DS, Mendler JC, Mieling P. Nonoperative treatment of ulnar collateral ligament injuries in throwing athletes. Am J Sports Med. 2001;29(1):15-17.
2. Eygendaal D, Rahussen FT, Diercks RL. Biomechanics of the elbow joint in tennis players and relation to pathology. Br J Sports Med. 2007;41(11):820-823.
3. Bowers AL, Dines JS, Dines DM, Altchek DW. Elbow medial ulnar collateral ligament reconstruction: clinical relevance and the docking technique. J Shoulder Elbow Surg. 2010;19(2):110-117.
5. Kibler WB. Biomechanical analysis of the shoulder during tennis activities. Clin Sports Med. 1995;14(1):79-85.
5. Marx RE. Platelet-rich plasma: evidence to support its use. J Oral Maxillofac Surg. 2004;62(4):489-496.
6. Marx RE. Platelet-rich plasma (PRP): what is PRP and what is not PRP? Implant Dent. 2001;10(4):225-228.
7. Elliott B, Fleisig G, Nicholls R, Escamilia R. Technique effects on upper limb loading in the tennis serve. J Sci Med Sport. 2003;6(1):76-87.
8. Mishra A, Pavelko T. Treatment of chronic elbow tendinosis with buffered platelet-rich plasma. Am J Sports Med. 2006;34(11):1774-1778.
9. Mishra A, Woodall J Jr, Vieira A. Treatment of tendon and muscle using platelet-rich plasma. Clin Sports Med. 2009;28(1):113-125.
10. Kovacs MS. Applied physiology of tennis performance. Br J Sports Med. 2006;40(5):381-386.
11. Xie X, Wu H, Zhao S, Xie G, Huangfu X, Zhao J. The effect of platelet-rich plasma on patterns of gene expression in a dog model of anterior cruciate ligament reconstruction. J Surg Res. 2013;180(1):80-88.
12. Pluim BM, Staal JB, Windler GE, Jayanthi N. Tennis injuries: occurrence, aetiology, and prevention. Br J Sports Med. 2006;40(5):415-423.
13. Xie X, Zhao S, Wu H, et al. Platelet-rich plasma enhances autograft revascularization and reinnervation in a dog model of anterior cruciate ligament reconstruction. J Surg Res. 2013;183(1):214-222.
14. Lopez-Vidriero E, Goulding KA, Simon DA, Sanchez M, Johnson DH. The use of platelet-rich plasma in arthroscopy and sports medicine: optimizing the healing environment. Arthroscopy. 2010;26(2):269-278.
15. Jo CH, Shin JS, Shin WH, Lee SY, Yoon KS, Shin S. Platelet-rich plasma for arthroscopic repair of medium to large rotator cuff tears: a randomized controlled trial. Am J Sports Med. 2015;43(9):2102-2110.
16. Jo CH, Shin JS, Lee YG, et al. Platelet-rich plasma for arthroscopic repair of large to massive rotator cuff tears: a randomized, single-blinded, parallel-group trial. Am J Sports Med. 2013;41(10):2240-2248.
17. Randelli P, Arrigoni P, Ragone V, Aliprandi A, Cabitza P. Platelet-rich plasma in arthroscopic rotator cuff repair: a prospective RCT study, 2-year follow-up. J Shoulder Elbow Surg. 2011;20(4):518-528.
18. Randelli P, Arrigoni P, Ragone V, Aliprandi A, Cabitza P. Platelet rich plasma in arthroscopic rotator cuff repair: a prospective RCT study, 2-year follow-up. J Shoulder Elbow Surg. 2011;20(4):518-528.
19. Barber FA, Hrnack SA, Snyder SJ, Hapa O. Rotator cuff repair healing influenced by platelet-rich plasma construct augmentation. Arthroscopy. 2011;27(8):1029-1035.
20. Jo CH, Kim JE, Yoon KS, et al. Does platelet-rich plasma accelerate recovery after rotator cuff repair? A prospective cohort study. Am J Sports Med. 2011;39(10):2082-2090.
21. Jo CH, Kim JE, Yoon KS, Shin S. Platelet-rich plasma stimulates cell proliferation and enhances matrix gene expression and synthesis in tenocytes from human rotator cuff tendons with degenerative tears. Am J Sports Med. 2012;40(5):1035-1045.
22. Chahal J, Van Thiel GS, Mall N, et al. The role of platelet-rich plasma in arthroscopic rotator cuff repair: a systematic review with quantitative synthesis. Arthroscopy. 2012;28(11):1718-1727.
23. Mei-Dan O, Carmont MR. The role of platelet-rich plasma in rotator cuff repair. Sports Med Arthrosc Rev. 2011;19(3):244-250.
24. Dines JS, ElAttrache NS, Conway JE, Smith W, Ahmad CS. Clinical outcomes of the DANE TJ technique to treat ulnar collateral ligament insufficiency of the elbow. Am J Sports Med. 2007;35(12):2039-2044.
25. Hutchinson MR, Laprade RF, Burnett QM 2nd, Moss R, Terpstra J. Injury surveillance at the USTA boys’ tennis championships: a 6-yr study. Med Sci Sports Exerc. 1995;27(6):826-830.
26. Winge S, Jørgensen U, Nielsen A. Epidemiology of injuries in Danish championship tennis. Int J Sports Med. 1989;10(5):368-371.
27. Safran MR, Hutchinson MR, Moss R, Albrandt J. A comparison of injuries in elite boys and girls tennis players. Paper presented at: 9th Annual Meeting of the Society of Tennis Medicine and Science; March 1999; Indian Wells, CA.
28. Cain EL, Andrews JR, Dugas JR, et al. Outcome of ulnar collateral ligament reconstruction of the elbow in 1281 athletes: results in 743 athletes with minimum 2-year follow-up. Am J Sports Med. 2010;38(12):2426-2434.
29. Dines JS, Yocum LA, Frank JB, ElAttrache NS, Gambardella RA, Jobe FW. Revision surgery for failed elbow medial collateral ligament reconstruction. Am J Sports Med. 2008;36(6):1061-1065.
30. Savoie FH, Trenhaile SW, Roberts J, Field LD, Ramsey JR. Primary repair of ulnar collateral ligament injuries of the elbow in young athletes: a case series of injuries to the proximal and distal ends of the ligament. Am J Sports Med. 2008;36(6):1066-1072.
31. Gosens T, Peerbooms JC, van Laar W, Oudsten den BL. Ongoing positive effect of platelet-rich plasma versus corticosteroid injection in lateral epicondylitis: a double-blind randomized controlled trial with 2-year follow-up. Am J Sports Med. 2011;39(6):1200-1208.
32. Thanasas C, Papadimitriou G, Charalambidis C, Paraskevopoulos I, Papanikolaou A. Platelet-rich plasma versus autologous whole blood for the treatment of chronic lateral elbow epicondylitis: a randomized controlled clinical trial. Am J Sports Med. 2011;39(10):2130-2134.
33. Chaudhury S, La Lama de M, Adler RS, et al. Platelet-rich plasma for the treatment of lateral epicondylitis: sonographic assessment of tendon morphology and vascularity (pilot study). Skeletal Radiol. 2013;42(1):91-97.
34. Krogh TP, Fredberg U, Stengaard-Pedersen K, Christensen R, Jensen P, Ellingsen T. Treatment of lateral epicondylitis with platelet-rich plasma, glucocorticoid, or saline: a randomized, double-blind, placebo-controlled trial. Am J Sports Med. 2013;41(3):625-635.
35. Anz AW, Hackel JG, Nilssen EC, Andrews JR. Application of biologics in the treatment of the rotator cuff, meniscus, cartilage, and osteoarthritis. J Am Acad Orthop Surg. 2014;22(2):68-79.
Visiting Professor in Hospital Medicine
Hospital medicine is an emerging specialty comprised predominantly of early‐career faculty, often less than 5 years postresidency and predominately at instructor or assistant professor level.[1] Effective mentoring has been identified as a critical component of academic success.[2, 3] Published data suggest that most academic hospitalists do not have a mentor, and when they do, the majority of them spend less than 4 hours per year with their mentor.[2] The reasons for this are multifactorial but largely result from the lack of structure, opportunities, and local senior academic hospitalists.[1, 4] Early‐career faculty have difficulty establishing external mentoring relationships, and new models beyond the traditional intrainstitutional dyad are needed.[3, 4] The need for mentors and structured mentorship networks may be particularly high in hospital medicine.[5]
The Visiting Professorship in Hospital Medicine Program was designed to promote cross‐institutional mentorship, share hospitalist innovations, and facilitate academic collaboration between hospitalist groups. We describe the design and early experience with this program across 5 academic hospital medicine programs.
PROGRAM DESIGN
Objectives
The program was designed to promote mentoring relationships between early‐career hospitalist faculty and a visiting professor from another academic hospital medicine group. The program sought to provide immediate career advice during the visits, but also create opportunities for long‐term mentorship and collaboration between institutions. Goals for each visiting professorship included: (1) follow‐up contact between early‐career faculty and visiting professor in the 6 months following the visit, (2) long‐term mentoring relationship with at least 1 early‐career faculty at the visited institution, and (3) identification of opportunities for interinstitutional collaboration to disseminate innovations.
Selection of Sites and Faculty
The first 2 academic medical centers (AMCs) for the visiting professorship exchange designed the program (University of Colorado and University of New Mexico). In subsequent years, each participating AMC was able to solicit additional sites for faculty exchange. This model can expand without requiring ongoing central direction. No criteria were set for selection of AMCs. Visiting professors in hospital medicine were explicitly targeted to be at midcareer stage of late assistant professor or early associate professor and within 1 to 2 years of promotion. It was felt that this group would gain the maximal career benefit from delivering an invited visit to an external AMC, yet have a sufficient track record to deliver effective mentoring advice to early‐career hospitalists. The hospitalist group sending the visiting professor would propose a few candidates, with the innovations they would be able to present, and the hosting site would select 1 for the visit. Early‐career faculty at the hosting institution were generally instructor to early assistant professors.
Visit Itinerary
The visit itinerary was set up as follows:
- Visiting professor delivers a formal 1‐hour presentation to hospitalist faculty, describing an innovation in clinical care, quality improvement, patient safety, or education.
- Individual meetings with 3 to 5 early‐career hospitalists to review faculty portfolios and provide career advice.
- Group lunch between the visiting professor and faculty with similar interests to promote cross‐institutional networking and spark potential collaborations.
- Meeting with hospital medicine program leadership.
- Visiting professor receives exposure to an innovation developed at the hosting institution.
- Dinner with the hosting faculty including the senior hospitalist coordinating the visit.
In advance of the visit, both early‐career faculty and visiting professors receive written materials describing the program, its objectives, and tips to prepare for the visit (see Supporting Information in the online version of this article). The curricula vitae of early‐career faculty at the hosting institution were provided to the visiting professor. Visit costs were covered by the visiting professor's institution. Honoraria were not offered.
Program Evaluation
Within a month of each visit, a paper survey was administered to the visiting professor and the faculty with whom she/he met. In addition to demographic data including gender, self‐reported minority status, academic rank, years at rank, and total years in academic medicine, the survey asked faculty to rate on a 5‐point Likert scale their assessment of the usefulness of the visit to accomplish the 4 core goals of the program: (1) cross‐institutional dissemination of innovations in clinical medicine, education, or research; (2) advancing the respondent's academic career; (3) fostering cross‐institutional mentor‐mentee relationships; and (4) promoting cross‐institutional collaborations. Free‐text responses for overall impression of program and suggestions for improvement were solicited.
At the time of this writing, 1 year has passed from the initial visits for the first 3 visiting professorships. A 1‐year follow‐up survey was administered assessing (1) total number of contacts with the visiting professor in the year following the visit, (2) whether a letter of recommendation resulted from the visit, (3) whether the respondent had seen evidence of spread of innovative ideas as a result of the program, (4) participation in a cross‐institutional collaboration as a result of the program, and (5) assessment of benefit in continuing the program in the next year. The respondents were also asked to rate the global utility of the program to their professional development on a 5‐point scale ranging from not at all useful to very useful (Thinking about what has happened to you since the visit a year ago, please rate the usefulness of the entire program to your professional life: overall usefulness for my professional development.). Domain‐specific utility in improving clinical, research, quality improvement, and administrative skills were also elicited (results not shown). Finally, suggestions to improve the program for the future were solicited. The Colorado Multiple Institutional Review Board determined that the study of this faculty development program did not qualify as human subjects research, and subjects were therefore not asked to provide informed consent for participation.
RESULTS
To date, 5 academic medical centers have participated in the visiting professorship program, with 7 visiting professors interacting with 29 early‐career faculty. Of the 29 early‐career faculty, 72% (21/29) were at the rank of assistant professor, 17% (5/29) instructor, 7% (2/29) residents with plans to hire, and 3% (1/29) associate professor. The median was 2 years in academic medicine and 1 year at current academic rank. Forty‐one percent (12/29) were women and 7% (2/29) identified as ethnic minority. Of the 7 visiting professors, 57% (4/7) were assistant professor and 43% (3/7) were associate professors. The median was 5 years in academic medicine, 29% (2/7) were women, and none identified as ethnic minority.
Immediate postvisit survey response was obtained for all participating faculty. In the immediate postvisit survey, on a 5‐point Likert scale, the 29 early‐career faculty rated the visit: 4.4 for promoting cross‐institutional dissemination of innovations, 4.2 for advancing my academic career, 4.2 for fostering cross‐institutional mentor‐mentee relationships, and 4.4 for promoting cross‐institutional collaborations. Ninety‐three percent (26/28 accounting for 1 nonresponse to this question) reported the visiting professorship had high potential to disseminate innovation (rated greater than 3 on the 5‐point Likert score). Eighty‐three percent (24/29) of the early‐career faculty rated the visit highly useful in advancing their career, 76% (22/29) responded that the visit was highly likely to foster external mentorship relationships, and 90% (26/29) reported the visit highly effective in promoting cross‐institutional collaborations. In the immediate postvisit survey, the 7 visiting professors rated the visit 4.9 for promoting cross‐institutional dissemination of innovations, 4.3 for advancing my academic career, 4.0 for fostering cross‐institutional mentor‐mentee relationships, and 4.3 for promoting cross‐institutional collaborations.
Free‐text comments from both visiting professors and early‐career faculty were generally favorable (Table 1). Some comments offered constructive input on appropriate matching of faculty, previsit preparation, or desire for more time in sessions (Table 1).
| Visiting Professors (n = 7) | Early‐Career Faculty (n = 29) |
|---|---|
| I was very impressed with the degree of organization, preparation, and structure from [host institution]. The project is a great concept and may well lead to similar and even more developed ones in the future. It is very helpful to get the pulse on another program and to hear of some of the same struggles and successes of another hospitalist program. The potential for cross‐site mentor‐mentee relationships and collaborations is a win‐win for both programs. | I really enjoyed my individual meeting with [visiting professor]. She was helpful in reviewing current projects from another perspective and very helpful in making suggestions for future projects. Also enjoyed her Grand Rounds and plan to follow‐up on this issue for possible cross‐institutional collaboration. |
| Overall, this exchange is a great program. It is fun, promotes idea exchange, and is immensely helpful to the visiting professor for promotion. Every meeting I had with faculty at [host institution] was interesting and worthwhile. The primary challenge is maintaining mentorship ties and momentum after the visit. I personally e‐mailed every person I met and received many responses, including several explicit requests for ongoing advising and collaboration. | I think this is a great program. It definitely gives us the opportunity to meet people outside of the [host institution] community and foster relationships, mentorship, and possible collaborations with projects and programs. |
| I liked multidisciplinary rounding. Research club. Meeting with faculty and trying to find common areas of interest. | I think this is a fantastic program so far. [Visiting professor] was very energetic and interested in making the most of the day. She contacted me after the visit and offered to keep in touch in the future. Right now I can see the program as being most useful in establishing new mentor/mentee relationships. |
| Most of the faculty I met with see value in being involved in systems/quality improvement, but most do not express interest in specific projects. Areas needing improvement were identified by everyone I met with so developing projects around these areas should be doable. They might benefit from access to mentoring in quality improvement. | It was fantastic to meet with [visiting professor] and get a sense for his work and also brainstorm about how we might do similar work here in the future (eg, in high‐value care). It was also great to then see him 2 days later at [national conference]. I feel this is a great program to improve our connections cross‐institutionally and hopefully to spark some future collaborations. |
| Very worthwhile. Was really helpful to meet with various faculty and leadership to see similarities and differences between our institutions. Generated several ideas for collaborative activities already. Also really helpful to have a somewhat structured way to share my work at an outside institution, as well as to create opportunities for mentor‐mentee relationships outside my home institution. | Incredibly valuable to promote this kind of cross‐pollination for both collaboration and innovation. |
| Wonderful, inspiring, professionally advantageous. | |
| Good idea. Good way to help midcareer faculty with advancement. Offers promise for collaboration of research/workshops. | |
| Suggestions for Improvement | |
| Please have e‐mails of the folks we meet available immediately after the visit. It is hard to know if anyone felt enough of a connection to want mentorship from me. | I feel like I may be a bit early on to benefit as much as I could have. |
| Develop a mentorship program for quality improvement. As part of this exchange, consider treating visits as similar to a consultation. Have visitor with specific focus that they can offer help with. | Nice to have personal access to accomplished faculty from other institutions. Their perspective and career trajectory don't always align due to differences in institution culture, specifics of promotion process, and so on, but still a useful experience. |
| Share any possible more‐formal topics for discussion with leadership prior to the visit so can prepare ahead of time (eg, gather information they may have questions on). Otherwise it was great! | For early career faculty, more discussions prior in regard to what to expect. |
| A question is who should continue to push? Is it the prospective mentee, the mentee's institution, an so on? | Great idea. Would have loved to be involved in more aspects. More time for discussion would have been good. Did not get to discuss collaboration in person. |
| Great to get to talk to someone from totally different system. Wish we had more time to talk. | |
One‐year follow‐up was obtained for all but 1 early‐career faculty member receiving the follow‐up survey, and all 3 visiting professors. Of the 3 visiting professorships that occurred more than 1 year ago, 16 mentorship contacts occurred in total (phone, e‐mail, or in person) between 13 early‐career faculty and 3 visiting professors in the year after the initial visits (range, 04 contacts). Follow‐up contact occurred for 3 of 4 early‐career faculty from the first visiting professorship, 3 of 5 from the second visiting professorship, and 2 of 4 from the third visiting professorship. One early‐career faculty member from each host academic medical center had 3 or more additional contacts with the visiting professor in the year following the initial visit. Overall, 8/13 (62%) of early‐career faculty had at least 1 follow‐up mentoring discussion. On 1‐year follow‐up, overall utility for professional development was rated an average of 3.5 by early‐career faculty (with a trend of higher ratings of efficacy with increasing number of follow‐up contacts) and 4.7 by visiting professors. Half (8/16) of the involved faculty report having seen evidence of cross‐institutional dissemination of innovation. Ninety‐four percent (15/16) of participants at 1‐year follow‐up felt there was benefit to their institution in continuing the program for the next year.
Objective evidence of cross‐institutional scholarship, assessed by email query of both visiting professors and senior hospitalists coordinating the visits, includes 2 collaborative peer reviewed publications including mentors and mentees participating in the visiting professorship.[6, 7] Joint educational curriculum development on high‐value care between sites is planned. The Visiting Professorship in Hospital Medicine Program has resulted in 1 external letter to support a visiting professor's promotion to date.
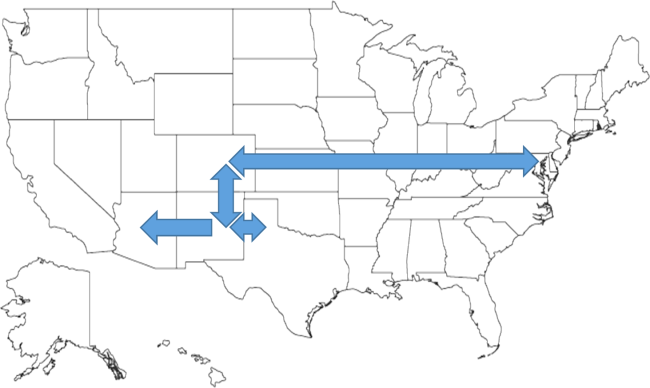
DISCUSSION
Hospital Medicine is a young, rapidly growing field, hence the number of experienced academic hospitalist mentors with expertise in successfully navigating an academic career is limited. A national study of hospitalist leaders found that 75% of clinician‐educators and 58% of research faculty feel that lack of mentorship is a major issue.[1] Mentorship for hospitalist clinician‐investigators is often delivered by nonhospitalists.[2, 8] There is little evidence of external mentorship for academic clinician‐educators in hospital medicine.[1] Without explicit programmatic support, many faculty may find this to be a barrier to career advancement. A study of successfully promoted hospitalists identified difficulty identifying external senior hospitalists to write letters in support of promotion as an obstacle.[9] Our study of the Visiting Professorship in Hospital Medicine Program found that early‐career faculty rated the visit as useful in advancing their career and fostered external mentorship relationships. Subsequent experience suggests more than half of the early‐career faculty will maintain contact with the visiting professor over the year following the visit. Visiting professors rate the experience particularly highly in their own career advancement.
The hospitalist movement is built on a foundation of innovation. The focus of each presentation was on an innovation developed by the visiting professor, and each visit showcased an innovation of the visited institution. This is distinct from traditional Hospital Grand Rounds, which more often focus on basic science research or clinical pathophysiology/disease management based on subspecialty topics.[10] The Visiting Professorship in Hospital Medicine Program was judged by participants to be an effective means of spreading innovation.
Insights from experience with the Visiting Professorship in Hospital Medicine Program include the importance of preliminary work prior to each visit. Program directors need to attend closely to the fit between the interests and career path of the visiting professor and those of the early‐career faculty. The innovations being shared should be aligned with organizational interests to maximize the chance of subsequent spread of the innovation and future collaboration. Providing faculty information about the objectives of the program in advance of the visit and arranging an exchange of curricula vitae between the early‐career faculty and the visiting professor allows participants to prepare for the in‐person coaching. Based on comments from participants, prompting contact from the visiting professor after the visit may be helpful to initiate the longitudinal relationship. We also found that early‐career faculty may not be aware of how to effectively use a mentoring relationship with an external faculty member. Training sessions for both mentors and mentees on effective mentorship relationships before visiting professorships might improve early‐career faculty confidence in initiating relationships and maximize value from mentor coaching.
A key issue is finding the right level of career maturity for the visiting professor. Our approach in selecting visiting professors was congruent with utilization of midcareer peer coaches employed by intrainstitutional hospital medicine mentoring programs.[11] The visiting professor should have sufficient experience and accomplishments to be able to effectively counsel junior faculty. However, it is important that the visiting professor also has sufficient time and interest to take on additional mentees and to be a full participant in shared scholarship projects emerging from the experience.
This study represents the experience of 5 mature academic hospitalist groups, and results may not be generalizable to dissimilar institutions or if only the most senior faculty are selected to perform visits. There is an inherent selection bias in the choice of both visiting professor and early‐career faculty. The small sample size of the faculty exposed to this program is a limitation to generalizability of the results of this evaluation. Whether this program will result in greater success in promotion of academic hospitalists cannot be assessed based on the follow‐up available. The Visiting Professorship in Hospital Medicine Program has continued to be sustained with an additional academic medical center enrolled and 2 additional site visits planned. The costs of the program are low, largely air travel and a night of lodging, as well as nominal administrative logistical support. Perceived benefits by participants and academic medical centers make this modest investment worth considering for academic hospitalist groups.
CONCLUSIONS
The Visiting Professorship in Hospital Medicine Program offers structure, opportunities, and access to senior mentors to advance the development of early‐career hospitalists while spreading innovation to distant sites. It is assessed by participants to facilitate external mentoring relationships and has the potential to advance the careers of both early‐career faculty as well as the visiting professors.
Disclosure
Nothing to report.
- , , , . Survey of US academic hospitalist leaders about mentorship and academic activities in hospitalist groups. J Hosp Med. 2011;6:5–9.
- , , , , , . Mentorship, productivity, and promotion among academic hospitalists. J Gen Intern Med. 2012;27(1):23–27.
- , . Mentoring faculty in academic medicine: a new paradigm? J Gen Intern Med. 2005;20(9):866–870.
- , , , , , . Challenges and opportunities in academic hospital medicine: report from the Academic Hospital Medicine Summit. J Hosp Med. 2009;4:240–246.
- , . The need for mentors in the odyssey of the academic hospitalist. J Hosp Med. 2011;6:1–2.
- , , , . Procedural skills for hospitalists. Hosp Med Clin. 2016;5:114–136.
- , , . Cedecea davisae' s role in a polymicrobial lung infection in a cystic fibrosis patient. Case reports in infectious diseases. Case Rep Infect Dis. 2012;2012:176864.
- , , , . Innovative approach to supporting hospitalist physicians towards academic success. J Hosp Med. 2008;3:314–318.
- , , , , . Tried and true: a survey of successfully promoted academic hospitalists. J Hosp Med. 2011;6:411–415.
- , , , , . A case study of medical grand rounds: are we using effective methods? Acad Med. 2009;84(8):1144–1151.
- , , , . Investing in the future: building an academic hospitalist faculty development program. J Hosp Med. 2011;6:161–166.
Hospital medicine is an emerging specialty comprised predominantly of early‐career faculty, often less than 5 years postresidency and predominately at instructor or assistant professor level.[1] Effective mentoring has been identified as a critical component of academic success.[2, 3] Published data suggest that most academic hospitalists do not have a mentor, and when they do, the majority of them spend less than 4 hours per year with their mentor.[2] The reasons for this are multifactorial but largely result from the lack of structure, opportunities, and local senior academic hospitalists.[1, 4] Early‐career faculty have difficulty establishing external mentoring relationships, and new models beyond the traditional intrainstitutional dyad are needed.[3, 4] The need for mentors and structured mentorship networks may be particularly high in hospital medicine.[5]
The Visiting Professorship in Hospital Medicine Program was designed to promote cross‐institutional mentorship, share hospitalist innovations, and facilitate academic collaboration between hospitalist groups. We describe the design and early experience with this program across 5 academic hospital medicine programs.
PROGRAM DESIGN
Objectives
The program was designed to promote mentoring relationships between early‐career hospitalist faculty and a visiting professor from another academic hospital medicine group. The program sought to provide immediate career advice during the visits, but also create opportunities for long‐term mentorship and collaboration between institutions. Goals for each visiting professorship included: (1) follow‐up contact between early‐career faculty and visiting professor in the 6 months following the visit, (2) long‐term mentoring relationship with at least 1 early‐career faculty at the visited institution, and (3) identification of opportunities for interinstitutional collaboration to disseminate innovations.
Selection of Sites and Faculty
The first 2 academic medical centers (AMCs) for the visiting professorship exchange designed the program (University of Colorado and University of New Mexico). In subsequent years, each participating AMC was able to solicit additional sites for faculty exchange. This model can expand without requiring ongoing central direction. No criteria were set for selection of AMCs. Visiting professors in hospital medicine were explicitly targeted to be at midcareer stage of late assistant professor or early associate professor and within 1 to 2 years of promotion. It was felt that this group would gain the maximal career benefit from delivering an invited visit to an external AMC, yet have a sufficient track record to deliver effective mentoring advice to early‐career hospitalists. The hospitalist group sending the visiting professor would propose a few candidates, with the innovations they would be able to present, and the hosting site would select 1 for the visit. Early‐career faculty at the hosting institution were generally instructor to early assistant professors.
Visit Itinerary
The visit itinerary was set up as follows:
- Visiting professor delivers a formal 1‐hour presentation to hospitalist faculty, describing an innovation in clinical care, quality improvement, patient safety, or education.
- Individual meetings with 3 to 5 early‐career hospitalists to review faculty portfolios and provide career advice.
- Group lunch between the visiting professor and faculty with similar interests to promote cross‐institutional networking and spark potential collaborations.
- Meeting with hospital medicine program leadership.
- Visiting professor receives exposure to an innovation developed at the hosting institution.
- Dinner with the hosting faculty including the senior hospitalist coordinating the visit.
In advance of the visit, both early‐career faculty and visiting professors receive written materials describing the program, its objectives, and tips to prepare for the visit (see Supporting Information in the online version of this article). The curricula vitae of early‐career faculty at the hosting institution were provided to the visiting professor. Visit costs were covered by the visiting professor's institution. Honoraria were not offered.
Program Evaluation
Within a month of each visit, a paper survey was administered to the visiting professor and the faculty with whom she/he met. In addition to demographic data including gender, self‐reported minority status, academic rank, years at rank, and total years in academic medicine, the survey asked faculty to rate on a 5‐point Likert scale their assessment of the usefulness of the visit to accomplish the 4 core goals of the program: (1) cross‐institutional dissemination of innovations in clinical medicine, education, or research; (2) advancing the respondent's academic career; (3) fostering cross‐institutional mentor‐mentee relationships; and (4) promoting cross‐institutional collaborations. Free‐text responses for overall impression of program and suggestions for improvement were solicited.
At the time of this writing, 1 year has passed from the initial visits for the first 3 visiting professorships. A 1‐year follow‐up survey was administered assessing (1) total number of contacts with the visiting professor in the year following the visit, (2) whether a letter of recommendation resulted from the visit, (3) whether the respondent had seen evidence of spread of innovative ideas as a result of the program, (4) participation in a cross‐institutional collaboration as a result of the program, and (5) assessment of benefit in continuing the program in the next year. The respondents were also asked to rate the global utility of the program to their professional development on a 5‐point scale ranging from not at all useful to very useful (Thinking about what has happened to you since the visit a year ago, please rate the usefulness of the entire program to your professional life: overall usefulness for my professional development.). Domain‐specific utility in improving clinical, research, quality improvement, and administrative skills were also elicited (results not shown). Finally, suggestions to improve the program for the future were solicited. The Colorado Multiple Institutional Review Board determined that the study of this faculty development program did not qualify as human subjects research, and subjects were therefore not asked to provide informed consent for participation.
RESULTS
To date, 5 academic medical centers have participated in the visiting professorship program, with 7 visiting professors interacting with 29 early‐career faculty. Of the 29 early‐career faculty, 72% (21/29) were at the rank of assistant professor, 17% (5/29) instructor, 7% (2/29) residents with plans to hire, and 3% (1/29) associate professor. The median was 2 years in academic medicine and 1 year at current academic rank. Forty‐one percent (12/29) were women and 7% (2/29) identified as ethnic minority. Of the 7 visiting professors, 57% (4/7) were assistant professor and 43% (3/7) were associate professors. The median was 5 years in academic medicine, 29% (2/7) were women, and none identified as ethnic minority.
Immediate postvisit survey response was obtained for all participating faculty. In the immediate postvisit survey, on a 5‐point Likert scale, the 29 early‐career faculty rated the visit: 4.4 for promoting cross‐institutional dissemination of innovations, 4.2 for advancing my academic career, 4.2 for fostering cross‐institutional mentor‐mentee relationships, and 4.4 for promoting cross‐institutional collaborations. Ninety‐three percent (26/28 accounting for 1 nonresponse to this question) reported the visiting professorship had high potential to disseminate innovation (rated greater than 3 on the 5‐point Likert score). Eighty‐three percent (24/29) of the early‐career faculty rated the visit highly useful in advancing their career, 76% (22/29) responded that the visit was highly likely to foster external mentorship relationships, and 90% (26/29) reported the visit highly effective in promoting cross‐institutional collaborations. In the immediate postvisit survey, the 7 visiting professors rated the visit 4.9 for promoting cross‐institutional dissemination of innovations, 4.3 for advancing my academic career, 4.0 for fostering cross‐institutional mentor‐mentee relationships, and 4.3 for promoting cross‐institutional collaborations.
Free‐text comments from both visiting professors and early‐career faculty were generally favorable (Table 1). Some comments offered constructive input on appropriate matching of faculty, previsit preparation, or desire for more time in sessions (Table 1).
| Visiting Professors (n = 7) | Early‐Career Faculty (n = 29) |
|---|---|
| I was very impressed with the degree of organization, preparation, and structure from [host institution]. The project is a great concept and may well lead to similar and even more developed ones in the future. It is very helpful to get the pulse on another program and to hear of some of the same struggles and successes of another hospitalist program. The potential for cross‐site mentor‐mentee relationships and collaborations is a win‐win for both programs. | I really enjoyed my individual meeting with [visiting professor]. She was helpful in reviewing current projects from another perspective and very helpful in making suggestions for future projects. Also enjoyed her Grand Rounds and plan to follow‐up on this issue for possible cross‐institutional collaboration. |
| Overall, this exchange is a great program. It is fun, promotes idea exchange, and is immensely helpful to the visiting professor for promotion. Every meeting I had with faculty at [host institution] was interesting and worthwhile. The primary challenge is maintaining mentorship ties and momentum after the visit. I personally e‐mailed every person I met and received many responses, including several explicit requests for ongoing advising and collaboration. | I think this is a great program. It definitely gives us the opportunity to meet people outside of the [host institution] community and foster relationships, mentorship, and possible collaborations with projects and programs. |
| I liked multidisciplinary rounding. Research club. Meeting with faculty and trying to find common areas of interest. | I think this is a fantastic program so far. [Visiting professor] was very energetic and interested in making the most of the day. She contacted me after the visit and offered to keep in touch in the future. Right now I can see the program as being most useful in establishing new mentor/mentee relationships. |
| Most of the faculty I met with see value in being involved in systems/quality improvement, but most do not express interest in specific projects. Areas needing improvement were identified by everyone I met with so developing projects around these areas should be doable. They might benefit from access to mentoring in quality improvement. | It was fantastic to meet with [visiting professor] and get a sense for his work and also brainstorm about how we might do similar work here in the future (eg, in high‐value care). It was also great to then see him 2 days later at [national conference]. I feel this is a great program to improve our connections cross‐institutionally and hopefully to spark some future collaborations. |
| Very worthwhile. Was really helpful to meet with various faculty and leadership to see similarities and differences between our institutions. Generated several ideas for collaborative activities already. Also really helpful to have a somewhat structured way to share my work at an outside institution, as well as to create opportunities for mentor‐mentee relationships outside my home institution. | Incredibly valuable to promote this kind of cross‐pollination for both collaboration and innovation. |
| Wonderful, inspiring, professionally advantageous. | |
| Good idea. Good way to help midcareer faculty with advancement. Offers promise for collaboration of research/workshops. | |
| Suggestions for Improvement | |
| Please have e‐mails of the folks we meet available immediately after the visit. It is hard to know if anyone felt enough of a connection to want mentorship from me. | I feel like I may be a bit early on to benefit as much as I could have. |
| Develop a mentorship program for quality improvement. As part of this exchange, consider treating visits as similar to a consultation. Have visitor with specific focus that they can offer help with. | Nice to have personal access to accomplished faculty from other institutions. Their perspective and career trajectory don't always align due to differences in institution culture, specifics of promotion process, and so on, but still a useful experience. |
| Share any possible more‐formal topics for discussion with leadership prior to the visit so can prepare ahead of time (eg, gather information they may have questions on). Otherwise it was great! | For early career faculty, more discussions prior in regard to what to expect. |
| A question is who should continue to push? Is it the prospective mentee, the mentee's institution, an so on? | Great idea. Would have loved to be involved in more aspects. More time for discussion would have been good. Did not get to discuss collaboration in person. |
| Great to get to talk to someone from totally different system. Wish we had more time to talk. | |
One‐year follow‐up was obtained for all but 1 early‐career faculty member receiving the follow‐up survey, and all 3 visiting professors. Of the 3 visiting professorships that occurred more than 1 year ago, 16 mentorship contacts occurred in total (phone, e‐mail, or in person) between 13 early‐career faculty and 3 visiting professors in the year after the initial visits (range, 04 contacts). Follow‐up contact occurred for 3 of 4 early‐career faculty from the first visiting professorship, 3 of 5 from the second visiting professorship, and 2 of 4 from the third visiting professorship. One early‐career faculty member from each host academic medical center had 3 or more additional contacts with the visiting professor in the year following the initial visit. Overall, 8/13 (62%) of early‐career faculty had at least 1 follow‐up mentoring discussion. On 1‐year follow‐up, overall utility for professional development was rated an average of 3.5 by early‐career faculty (with a trend of higher ratings of efficacy with increasing number of follow‐up contacts) and 4.7 by visiting professors. Half (8/16) of the involved faculty report having seen evidence of cross‐institutional dissemination of innovation. Ninety‐four percent (15/16) of participants at 1‐year follow‐up felt there was benefit to their institution in continuing the program for the next year.
Objective evidence of cross‐institutional scholarship, assessed by email query of both visiting professors and senior hospitalists coordinating the visits, includes 2 collaborative peer reviewed publications including mentors and mentees participating in the visiting professorship.[6, 7] Joint educational curriculum development on high‐value care between sites is planned. The Visiting Professorship in Hospital Medicine Program has resulted in 1 external letter to support a visiting professor's promotion to date.
DISCUSSION
Hospital Medicine is a young, rapidly growing field, hence the number of experienced academic hospitalist mentors with expertise in successfully navigating an academic career is limited. A national study of hospitalist leaders found that 75% of clinician‐educators and 58% of research faculty feel that lack of mentorship is a major issue.[1] Mentorship for hospitalist clinician‐investigators is often delivered by nonhospitalists.[2, 8] There is little evidence of external mentorship for academic clinician‐educators in hospital medicine.[1] Without explicit programmatic support, many faculty may find this to be a barrier to career advancement. A study of successfully promoted hospitalists identified difficulty identifying external senior hospitalists to write letters in support of promotion as an obstacle.[9] Our study of the Visiting Professorship in Hospital Medicine Program found that early‐career faculty rated the visit as useful in advancing their career and fostered external mentorship relationships. Subsequent experience suggests more than half of the early‐career faculty will maintain contact with the visiting professor over the year following the visit. Visiting professors rate the experience particularly highly in their own career advancement.
The hospitalist movement is built on a foundation of innovation. The focus of each presentation was on an innovation developed by the visiting professor, and each visit showcased an innovation of the visited institution. This is distinct from traditional Hospital Grand Rounds, which more often focus on basic science research or clinical pathophysiology/disease management based on subspecialty topics.[10] The Visiting Professorship in Hospital Medicine Program was judged by participants to be an effective means of spreading innovation.
Insights from experience with the Visiting Professorship in Hospital Medicine Program include the importance of preliminary work prior to each visit. Program directors need to attend closely to the fit between the interests and career path of the visiting professor and those of the early‐career faculty. The innovations being shared should be aligned with organizational interests to maximize the chance of subsequent spread of the innovation and future collaboration. Providing faculty information about the objectives of the program in advance of the visit and arranging an exchange of curricula vitae between the early‐career faculty and the visiting professor allows participants to prepare for the in‐person coaching. Based on comments from participants, prompting contact from the visiting professor after the visit may be helpful to initiate the longitudinal relationship. We also found that early‐career faculty may not be aware of how to effectively use a mentoring relationship with an external faculty member. Training sessions for both mentors and mentees on effective mentorship relationships before visiting professorships might improve early‐career faculty confidence in initiating relationships and maximize value from mentor coaching.
A key issue is finding the right level of career maturity for the visiting professor. Our approach in selecting visiting professors was congruent with utilization of midcareer peer coaches employed by intrainstitutional hospital medicine mentoring programs.[11] The visiting professor should have sufficient experience and accomplishments to be able to effectively counsel junior faculty. However, it is important that the visiting professor also has sufficient time and interest to take on additional mentees and to be a full participant in shared scholarship projects emerging from the experience.
This study represents the experience of 5 mature academic hospitalist groups, and results may not be generalizable to dissimilar institutions or if only the most senior faculty are selected to perform visits. There is an inherent selection bias in the choice of both visiting professor and early‐career faculty. The small sample size of the faculty exposed to this program is a limitation to generalizability of the results of this evaluation. Whether this program will result in greater success in promotion of academic hospitalists cannot be assessed based on the follow‐up available. The Visiting Professorship in Hospital Medicine Program has continued to be sustained with an additional academic medical center enrolled and 2 additional site visits planned. The costs of the program are low, largely air travel and a night of lodging, as well as nominal administrative logistical support. Perceived benefits by participants and academic medical centers make this modest investment worth considering for academic hospitalist groups.
CONCLUSIONS
The Visiting Professorship in Hospital Medicine Program offers structure, opportunities, and access to senior mentors to advance the development of early‐career hospitalists while spreading innovation to distant sites. It is assessed by participants to facilitate external mentoring relationships and has the potential to advance the careers of both early‐career faculty as well as the visiting professors.
Disclosure
Nothing to report.
- , , , . Survey of US academic hospitalist leaders about mentorship and academic activities in hospitalist groups. J Hosp Med. 2011;6:5–9.
- , , , , , . Mentorship, productivity, and promotion among academic hospitalists. J Gen Intern Med. 2012;27(1):23–27.
- , . Mentoring faculty in academic medicine: a new paradigm? J Gen Intern Med. 2005;20(9):866–870.
- , , , , , . Challenges and opportunities in academic hospital medicine: report from the Academic Hospital Medicine Summit. J Hosp Med. 2009;4:240–246.
- , . The need for mentors in the odyssey of the academic hospitalist. J Hosp Med. 2011;6:1–2.
- , , , . Procedural skills for hospitalists. Hosp Med Clin. 2016;5:114–136.
- , , . Cedecea davisae' s role in a polymicrobial lung infection in a cystic fibrosis patient. Case reports in infectious diseases. Case Rep Infect Dis. 2012;2012:176864.
- , , , . Innovative approach to supporting hospitalist physicians towards academic success. J Hosp Med. 2008;3:314–318.
- , , , , . Tried and true: a survey of successfully promoted academic hospitalists. J Hosp Med. 2011;6:411–415.
- , , , , . A case study of medical grand rounds: are we using effective methods? Acad Med. 2009;84(8):1144–1151.
- , , , . Investing in the future: building an academic hospitalist faculty development program. J Hosp Med. 2011;6:161–166.

Survival After Long-Term Residence in an Intensive Care Unit
Admission to an intensive care unit (ICU) is lifesaving for some patients, but for many, the admission carries high expectations and financial costs and fails to provide desirable outcomes. Patients who receive intensive care have a mortality rate of about 20%, and the costs of this care comprise about 4% of the U.S. health care budget.1,2 In a study of Medicare recipients, treatment intensity and expenses increased between the mid-1980s and 1999 but without any increase in survivorship; per capita ICU expenses were higher for patients who did not survive the ICU.3 Use of the ICU in patients’ final stages of life has increased in proportion since then, and the demand for critical care is likely to continue as the relative proportion of elderly patients in the population rises.2,4,5
Physicians and nurses who responded to a European survey on the inappropriateness of intensive care overwhelmingly endorsed the problems of “too much care” (89%) and “other patients would benefit more” (38%).6 Receiving terminal care in the ICU runs counter to the preferences of most patients.7 Therefore, the challenges are to define the true beneficiaries of critical care and to minimize the discomfort and unrealistic expectations of patients who will not benefit from intensive care.
For ICU patients, morbidity and mortality depend on the interaction of an acute insult (or a surgery), major comorbidities, and physiologic reserve. Aside from those with objective criteria of extreme illness, many patients have an indeterminate prognosis that is difficult to reliably predict.8,9 Several prognostic scores, including the APACHE (Acute Physiologic Assessment and Chronic Health Evaluation) and SOFA (Sequential Organ Failure Assessment) scores, have proved useful in understanding the illness burden of a population when comparing outcomes in different ICUs. Yet their use in assessing the survival of individual patients has not been advocated.10-15 The utility of such models is further challenged by the significant differences in survival between patients with similar illness scores; by the sometimes poor applicability of a model’s derivation cohort to other ICU populations (surgical in particular); by cases of huge disparities between actual and predicted mortality; and by the periodic need to recalibrate models according to advances in care.16-20
Physician intuition regarding prognosis is highly variable. In a series of medical (floor and ICU) admissions, resident physician estimates of illness severity and postdischarge status were associated with stepwise differences in mortality and APACHE scores.21,22 However, in a pure ICU population, in most cases seasoned providers could not accurately predict a patient’s chance of survival.23 Physicians are likewise poor in predicting family preferences regarding aggressive care vs alternatives, and often, survival is couched in terms of ICU survival, which for family members may not be as meaningful as long-term survival or functional recovery. Further, quality of life and patient preferences are not discussed in most cases, even those associated with poor outcomes.24 There also is a large amount of heterogeneity in the end of-life care of ICU patients. For example, cardiopulmonary resuscitation was attempted in up to 70% of dying patients in some ICUs and in as little as 4% in other ICUs.25 Thus, the limitations of predictive models, combined with misperceptions of patient preference, poor communication, and local traditions, lead to aggressive care being given to patients who might not benefit from or desire such care.
It has been stated that the trajectory of most critical illness is unclear enough so that patients should be admitted to the ICU for a trial of therapy, and that in outcome predictions, the response to intensive treatment may be more useful than laboratory and other data comprising illness severity scores.15,26 However, there is no consensus as to what constitutes a trial of intensive care therapy—vs a round of chemotherapy, a course of antibiotics, or a palliative ileostomy—yet this is the basis of many ICU admissions. Slight corrections in laboratory or physiologic findings often lead to continuation of aggressive care, often without any discussion of expected outcomes and the process of identifying and caring for patients who do not respond to therapy. Intensive care also may be prolonged because of several medical, personal, and social factors (Table 1).
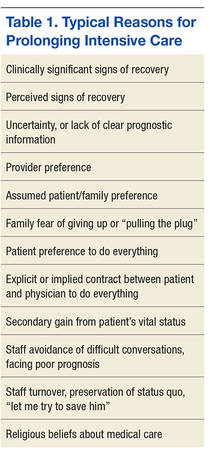
At best, deciding how long to provide intensive care involves a synthesis of information about the trajectory, physiologic reserve, beliefs, values, and preferences of the patient. Any or all of these elements may not be known to the care decision-makers.
The authors conducted a study to determine whether a particular duration of care exists that represents a reasonable trial of therapy. As the VA Palo Alto Health Care System (VAPAHCS) ICU treats both medical and surgical patients, the authors were able to compare these subpopulations’ outcomes while providing the same standard of care. They analyzed the aggregate of patients as well as the medical and surgical subpopulations.
Methods
The VA Research and Development Committee and the Stanford Panel on Human Subjects approved the authors’ data collection and reporting.The study was conducted at the 15-bed mixed-medical/surgical VAPAHCS ICU. Analyzed data were drawn from all patients admitted during a 19-month period (July 14, 2008, to January 28, 2010). A serial log was used to prospectively capture basic data regarding each admission. Medical patients received care from the ICU service, and surgical patients were comanaged by the surgical and ICU teams.
A mortality database was constructed with data from the Decedent Affairs Office and from the national VistA database. The data included all deaths recorded either inside or outside the hospital or systemwide nursing facility. Mortality reported in the Computerized Patient Record System (CPRS) was queried further for patients with a length of stay (LOS) of more than 14 days.
Statistical Analysis
Calculations were based on denominators of individual patients or on number of admissions. All mortality calculations were based on a denominator of individual patients. For mortality analysis, only the last admission was included, unless a patient survived a full year between admissions. The Kruskal-Wallis test for nonnormally distributed data and the Dunn posttest for multiple comparisons were used for continuous variables (eg, age, LOS, risk scores); the Fisher exact test was used for categorical data; and the log-rank test was used to compare survival curves. For all analyses, P < .05 was considered statistically significant.
Mortality and Functional Status
Mortality risk scores on ICU admission were calculated with the Mortality Prediction Model–Admission III (MPM-III), using data from the CPRS. Specifics on this calculation are described in the eAppendix.
Current survival status of patients who were in the ICU more than 14 days was determined from the CPRS and telephone discussions with the patient or with relatives. Functional status was evaluated with the 36-Item Short Form Health Survey (SF-36), which has been used in comparable studies.27,28 Disposition at 6 months and 1 year was established by inspecting the CPRS for dates corresponding to these exact periods. For example, a patient in the hospital about 1 year after ICU discharge would be considered to be at home if discharged 1 day before the 365-day anniversary. In a few cases, progress notes indicated that the patient was receiving around-the-clock nursing care at home; in the analysis, these cases were included with those of patients known to be in traditional nursing facilities. In cases in which the CPRS lacked mortality information, the patient was presumed to be alive even if there were no records of clinic visits or other medical attention. Serial admission data from a mixed-medical/surgical ICU were collected over a 19-month period (July 14, 2008, to January 28, 2010) and analyzed.
Results
The final data set consisted of 1,113 admissions and 976 patients (one-third medical, two-thirds surgical). In this cohort, 12% of all patients studied were readmitted to the ICU at least once, and 12% of all ICU admissions were repeat admissions. The medical/surgical proportion was similar for readmitted patients. Demographics and other data are available in eTable 1.

Length of Stay
The distribution of all patients by LOS in the study period is shown in eFigure 1A. Data are skewed rightward toward longer LOS. The median LOS of 3 days for the entire population differed according to specialty, with a median of 3 days for medical patients (interquartile range, 2-7 days) and a median of 2 days for surgical patients (interquartile range, 1-5 days; P < .01 for medical vs surgical patients).

The LOS differed between ICU patients admitted for the first time and those readmitted within the 19-month study period. For both admission categories, LOS was longer for medical patients than for surgical patients. However, there were no significant differences between percentages of medical and surgical patients who were readmitted (Table 2). Despite comprising about 12% of the population, patients with more than 1 admission accounted for 23% of admissions and 25% of all bed occupancies during the study period.

Figure e1B shows ICU bed occupancy for different LOS intervals (calculated as bed days) and indicates that despite accounting for a small percentage of admissions, patients with long LOS accounted for a significant portion of total occupancy (32% for more than 1 month, 45% for more than 14 days). The medical and surgical contributions of these long-LOS patients were about equal. The figures indicate that more than half of medical ICU patient occupancy involved LOS of more than 14 days, while surgical patients tended to have shorter LOS.
Mortality
Of all the patients in this study, 5.1% died in the ICU; the mortality rate was 11% for medical patients and 2.1% for surgical patients. Thirty days after discharge, overall mortality was 10.4%, or 23.5% for medical patients and 3.9% for surgical patients. Finally, 1 year after discharge, mortality rates were 21.5% (overall), 39.4% (medical patients), and 12.5% (surgical patients) (Table 3). Survival curves demonstrated the difference between medical and surgical patients at 30 days and 1 year (Figures 1A & 1B).


Impact of LOS on Mortality
One-year mortality was 17% for patients who were in the ICU less than 14 days and 40% for those in the ICU more than 14 days (relative risk [RR] = 2.35; P < .01) (Table 4). 

Mortality also was higher in patients with more than 1 ICU admission. For the aggregate of ICU patients, readmission status was significantly associated with a 10% increase in mortality. For both single- and multiple-admission status, the mortality rate was 2.5-fold higher for medical patients than for surgical patients. The increased mortality associated with readmission status was not significantly different for either medical or surgical patients analyzed as subgroups (eAppendix Table.)
Impact of Age on Mortality
Figures 4A and 4B shows 30-day and 1-year mortality associated with age; regression analysis indicated that age is an independent predictor of ICU mortality. For 30-day mortality, increased age was positively associated with mortality in medical patients but not in surgical patients (r2 = 0.91; P < .0001). Age had a significant impact on 1-year mortality for both medical and surgical patients but less so in the latter (r2 = 0.95 and 0.65, respectively; P < .001 for both). Although increased mortality was associated with both LOS and age, there was no clear association between the latter 2 variables.
Survival of Chronic Critical Illness
As eTable 2 shows, 21.5% of all patients died either in the ICU or within the first year after ICU discharge. To evaluate the survival of chronic ICU residence, the authors performed a detailed analysis of functional status and mortality of patients with LOS of more than 14 days. Seventy-one patients fit that profile (their mean LOS was 41 days; median, 28 days). Of these patients, 11 died in the ICU, and another 17 died within 6 months (including 2 in a stepdown unit and 7 in hospice). Overall, 28 (39%) of the 71 patients died either in the ICU or within 6 months (35% aggregate, 53% of medical patients, and 27% of surgical patients in ICU > 2 weeks). Another 8 patients (11%) died between 6 and 12 months after discharge. One-year mortality among patients in the ICU more than 14 days was 40% overall, 50% for medical patients, and 29% for surgical patients—or twice that predicted by the MPM-III model, which figured mortality rates of 25% and 12% for medical and surgical patients, respectively. In this cohort, the mean MPM-III score was 18.6% for 1-year survivors and 29.3% for nonsurvivors (P = .016, Mann-Whitney U test). Mortality was associated with a trend toward higher MPM-III scores in both medical and surgical patients but did not reach statistical significance.

Of the cohort patients who lived at least 6 months after ICU discharge, 45% were still in a hospital or were in a nursing facility at 6 months. Of the patients who lived at least 1 year, 33% were still in a hospital or were in a nursing facility (Figure 5). At 1 year, mean age was 63 years for survivors and 69 years for the deceased (P < .01 by Student t test). 
Quality-of-Life Survey
The authors successfully contacted 32 of the 39 patients who lived at least 1 year after discharge after an ICU stay of more than 14 days. The subgroups’ median SF-36 scores were similar: 57 for medical patients and 51 for surgical patients. These average scores over 8 domains are similar to those reported by Graf and colleagues for 9 months after ICU discharge (53.7) and are lower than the normative data reported by those authors for the German population (mean, 66.5).29
Discussion
The goals of the present study were 2-fold—to gain a better understanding of the survival and functioning of patients after ICU residence and to define what may constitute a trial of therapy in ICU, or specifically to determine whether there is a particular ICU interval or point at which further care fails to improve survival. The study also compared medical and surgical subpopulations.
The main finding of this study was a 4-fold difference between ICU mortality and 1-year mortality. This mortality increase occurred in both medical and surgical patients, but there were large differences in magnitude between these groups. The survival rates generally were better than those of other general intensive care populations, though such a comparison should be made with caution, as survival differs by country, population, admitting practices, and a variety of other hospital characteristics.30,31 Although some findings of the present study may relate to its largely male U.S. veteran population, the authors believe they have provided a data-collection-and-analysis model that can be used by any hospital trying to understand the course and outcome of its ICU patients and recognizing the value of this knowledge in discussions on goals of care.
Mortality and LOS
As each interval of ICU residence was associated with a stepwise increase in mortality, there was no clear cutoff for diminishing return. To create a reference point, the authors analyzed the data of patients who were in an ICU more than 14 days—thinking that this duration may represent an outer limit of a reasonable trial of therapy and a measure that probably distinguishes acute from chronic critical illness.32 Use of this interval represented a conservative approach, as only 6.5% of the patients in this cohort had a LOS of more than 14 days. This small percentage of patients accounted for 45% of total bed occupancy in this study and 54% of all medical bed occupancy. In the more-than-14-days group, mortality was 37.5% for surgical patients and 46.3% for medical patients. Thus, LOS may be a dynamic measure of physiologic reserve and disease severity—reflecting variables such as response to therapy, severity of comorbidities, resistance to new problems, and rebound from chronic stress, inflammation, and catabolism. This view is supported by the nearly 2-fold higher mortality in medical patients and nearly 3-fold higher mortality in surgical patients in comparison with MPM-III predictions.
Twelve percent of all patients were admitted to ICU multiple times, and these admissions accounted for 25% of all bed occupancies. Multiple admissions indicate a high disease burden or a low physiologic reserve that prevents full recovery from critical illness. As mortality was higher in patients with multiple admissions, ICU readmission should be regarded as a marker for poor overall recovery and should prompt consideration of both initial discharge criteria and trajectory as well as goals of care.
Medical vs Surgical Patients
In this cohort, medical and surgical patients were distinguished on several grounds. Despite the similar mean age of these subpopulations, medical patients had longer LOS and higher short- and long-term mortality. These findings are not surprising, as medical patients in the ICU have high rates of end-stage disease, malignancy, and high comorbidity burden and are often admitted to have potentially life-ending conditions stabilized. Surgical patients generally are selected on their ability to withstand major systemic perturbations—palliative and emergency operations excepted—and generally have medical conditions optimized before surgery. As the expectation of postoperative survival likely biases clinician behavior toward aggressive care, some short-term survival may reflect this behavior.
In contrast, such biased behavior is not an issue in 1-year survival, which instead accurately reflects underlying health. The different slopes of medical and surgical patients on age-vs-mortality in Figures 4A & 4B indicate the different physiologic makeups of these ICU patients. With short and long LOS compared, the difference between surgical and medical patients in the ICU is striking: Sixty-one percent of all surgical bed days vs 45% of all medical bed days are for LOS less than 14 days. Nevertheless, chronic critical illness has a significant impact on both medical and surgical patients and tends to equalize some of the survival differences between these groups. These populations had similar ICU readmission rates as well as similar higher mortality rates for LOS of more than 14 days and especially for LOS of more than 1 month. With longer LOS, the survival curve of surgical patients begins to resemble that of medical patients—suggesting that the phenotype of chronic critical illness becomes the dominant force influencing survival and function (Figures 3A & 3B). Indeed, for surgical patients, the highest mortality categories were ICU readmission and LOS of more than 30 days.
The mortality rate was significantly lower for surgical patients than it was for medical patients at all intervals studied, with the largest separation in the short-term categories of ICU and 30-day mortality. The post-ICU mortality rates for medical and surgical patients are similar to those reported in several other studies, including a study of veterans.14-16,33,34 Among the present patients with LOS of more than 14 days, surviving surgical patients were significantly younger than nonsurviving surgical patients and both surviving and nonsurviving medical patients.


The few SF-36 responses collected revealed no differences between medical and surgical patients.
A Trial of Therapy
The present data are useful in describing the landscape of post-ICU survival to patients and their families. The data demonstrated a higher mortality trend that correlated with increases in age and increases in ICU duration and readmission. Within this continuum, there was no break point at which survivors and nonsurvivors clearly separated. The data therefore lack a boundary that can be used to define a trial of therapy. However, the added risks of age and recovery longer than 1 week are clear and should be included in care decisions. The generally better survival of surgical patients (nearly all of whom had elective surgery) in comparison with medical patients suggests these populations should be considered separately.
In the absence of a point distinguishing survivors from nonsurvivors, the authors performed a more detailed analysis of patients in the ICU for more than 14 days to provide some perspective on health care dependence in the subsequent year. That ICU survival does not necessarily equate to overall survival and independence long after ICU residence is an important matter for patients and families to consider when making decisions about critical care residence. The 14-day LOS data, though using a fairly arbitrary time point, suggest that patients who cannot recover from critical illness in less than 14 days should be advised of the range of short- and long-term mortality and the likelihood of high dependence on medical care within the subsequent year.
The concepts of hospital-dependent patient and persistent inflammation, immunosuppression, and catabolism syndrome have been introduced to describe the condition of progressive deterioration and inability to regain full independence after illness.32,35 These illness patterns deserve attention in prognosis discussions. The present study focused not on ICU survival but on 1-year mortality and functional independence, and it is these longer term outcomes that critical care professionals should consider. Intensive care units are successful in improving short-term survival, but a long line of successful ICU discharges may lead an intensivist to think that longer term survival is important as well and convey this impression to patients and their families.
Study Strengths
This study is one of a few to investigate the short- and long-term survival of an unselected cohort of critically ill patients and is unique in its inclusion of both medical and surgical patients receiving care in the same environment. Medical and surgical patients have different survival profiles that may necessitate separate studies of these subpopulations. However, the finding of different survival profiles under the same care highlights the intrinsic differences between these groups. Use of a 1.5-year study period allowed the authors to capture ICU patients with long LOS and to include multiple episodes of care provided by more than 10 different attending physicians. Therefore, these data likely were not influenced by any rare events or idiosyncrasies in practice styles. Further, the same teams of physicians and nurses cared for all the medical and surgical patients, and all unit-based protocols and quality improvement activities were applied to all patients.
Study Limitations
The intensive care patients come from a large catchment area; however, conditions seen in tertiary referral centers, such as bone marrow transplants, cerebrovascular, transplant surgery, and ventricular-assist devices are not represented in this population.
In this study, bed days were used as a crude measure of care burden. From a nursing perspective, however, the workload may be higher with quick-turnover beds than with long-term residents. On the other hand, long-term ICU residents are visited by multiple consultants and receive a much larger set of interventions, including weeks of ventilation and hemodialysis, line changes, and family meetings. A comparison of the costs involved for different ICU subpopulations would add valuable information to this discussion.
The authors took a conservative approach in establishing the mortality and residence of patients 1 year after their ICU stays. At 6 months, 1-year patients without evidence of hospital or nursing facility residence were assumed to be home. In reality, nearly all these patients had multiple admissions or emergency department stays, or there was other evidence of intensive care. Some patients who were assumed to be home may have left the area and become untraceable. All estimates of care dependence and mortality should therefore be considered minimums. The authors cannot envision how any of their estimates could overstate the morbidity and mortality.
The concept of hospital dependence is applicable to the majority of the ICU survivors, though the authors did not attempt to create a quantitative measure of this status.36 Another study limitation is that absence of hospitalization does not equal functional independence. A better definition of this status, and its application to a broad spectrum of LOS, would be a valuable adjunct to ICU decision making.
The convention by which the authors considered the first day of their study period a “fresh slate” did not adjust for the situation that some first admissions actually were readmissions. Assuming the validity of the finding that readmitted patients had a higher burden of morbidity and mortality, misclassification of admission status would tend to inflate the mortality of single-admission patients and minimize the magnitude of the differences found in this study. Similarly, an admission near the end of the study period may have been analyzed as a single admission, even if the patient was readmitted and died the next year. The latter situation also would tend to inflate the mortality of the single-admission category. None of these possible mathematical errors negates the fact that a second ICU admission should be regarded as a marker for poor recovery.
A more accurate estimate of short- and long-term prognosis likely can be obtained by examining laboratory studies and interventions such as vasopressors, dialysis, and ventilation at defined time points. Although the authors did not attempt it, development of such a model would be a valuable undertaking. They focused on describing the expected course of ICU patients and determining what patterns emerged from care duration. As this study found that the prognosis for long-term ICU residents remained guarded a long time after discharge, survival models of patients with 1- to 2-week ICU residences likely would be valuable in clinical decision making.
A quality-of-life survey was administered only to patients in the ICU longer than 2 weeks. This limited study was conducted to explore the feasibility of assessing outcomes other than survival and to determine the staffing requirements needed to research this further. A more meaningful analysis would come from a broader analysis of scores from 3 or 4 different ICU lengths of stay.
Clinician and family behavior can influence some of the outcomes measured in this study—particularly in cases in which an illness is poorly characterized and an evidence basis for decision making is lacking. In these situations, values and individual clinician judgment likely predominate, possibly introducing variability to care duration. Nevertheless, cumulative mortality 1 month or more after ICU residence would eliminate biased clinician behavior. The heterogeneity of care providers’ and families’ decision making, captured in this analysis, likely is a normal phenomenon that should help inform physicians’ understanding of prolonged ICU residence.


1. Halpern NA. Can the costs of critical care be controlled? Curr Opin Crit Care. 2009;15(6):591-596.
2. Angus DC, Barnato AE, Linde-Zwirble WT, et al; Robert Wood Johnson Foundation ICU End-of-Life Peer Group. Use of intensive care at the end of life in the United States: an epidemiologic study. Crit Care Med. 2004;32(3):638-643.
3. Barnato AE, McClellan MB, Kagay CR, Garber AM. Trends in inpatient treatment intensity among Medicare beneficiaries at the end of life. Health Serv Res. 2004;39(2):363-375.
4. Teno JM, Gozalo PL, Bynum JP, et al. Change in end-of-life care for Medicare beneficiaries: site of death, place of care, and health care transitions in 2000, 2005, and 2009. JAMA. 2013;309(5):470-477.
5. Zilberberg MD, Shorr AF. Economics at the end of life: hospital and ICU perspectives. Semin Respir Crit Care Med. 2012;33(4):362-369.
6. Piers RD, Azoulay E, Ricou B, et al; APPROPRICUS Study Group of the Ethics Section of the ESICM. Perceptions of appropriateness of care among European and Israeli intensive care unit nurses and physicians. JAMA. 2011;306(24):2694-2703.
7. Higginson IJ, Sen-Gupta GJ. Place of care in advanced cancer: a qualitative systematic literature review of patient p. J Palliat Med. 2000;3(3):287-300.
8. McClish DK, Powell SH. How well can physicians estimate mortality in a medical intensive care unit? Med Decis Making. 1989;9(2):125-132.
9. Barrera R, Nygard S, Sogoloff H, Groeger J, Wilson R. Accuracy of predictions of survival at admission to the intensive care unit. J Crit Care. 2001;16(1):32-35.
10. Johnson AE, Kramer AA, Clifford GD. A new severity of illness scale using a subset of Acute Physiology and Chronic Health Evaluation data elements shows comparable predictive accuracy. Crit Care Med. 2013;41(7):1711-1718.
11. D'Hoore W, Bouckaert A, Tilquin C. Practical considerations on the use of the Charlson comorbidity index with administrative data bases. J Clin Epidemiol. 1996;49(12):1429-1433.
12. Knaus WA, Wagner DP, Zimmerman JE, Draper EA. Variations in mortality and length of stay in intensive care units. Ann Intern Med. 1993;118(10):753-761.
13. Lemeshow S, Teres D, Klar J, Avrunin JS, Gehlbach SH, Rapoport J. Mortality Probability Models (MPM II) based on an international cohort of intensive care unit patients. JAMA. 1993;270(20):2478-2486.
14. Render ML, Kim HM, Welsh DE, et al; VA ICU Project (VIP) Investigators. Automated intensive care unit risk adjustment: results from a national Veterans Affairs study. Crit Care Med. 2003;31(6):1638-1646.
15. Viviand X, Gouvernet J, Granthil C, François G. Simplification of the SAPS by selecting independent variables. Intensive Care Med. 1991;17(3):164-168.
16. Higgins TL, Teres D, Copes WS, Nathanson BH, Stark M, Kramer AA. Assessing contemporary intensive care unit outcome: an updated Mortality Probability Admission Model (MPM0-III). Crit Care Med. 2007;35(3):827-835.
17. Knaus WA, Draper EA, Wagner DP, Zimmerman JE. APACHE II: a severity of disease classification system. Crit Care Med. 1985;13(10):818-829.
18. Poses RM, McClish DK, Smith WR, et al. Results of report cards for patients with congestive heart failure depend on the method used to adjust for severity. Ann Intern Med. 2000;133(1):10-20.
19. Schuster DP. Predicting outcome after ICU admission. The art and science of assessing risk. Chest. 1992;102(6):1861-1870.
20. Teno JM, Fisher E, Hamel MB, et al. Decision-making and outcomes of prolonged ICU stays in seriously ill patients. J Am Geriatr Soc. 2000;48(suppl 5):S70-S74.
21. Charlson M, Szatrowski TP, Peterson J, Gold J. Validation of a combined comorbidity index. J Clin Epidemiol. 1994;47(11):1245-1251.
22. Pompei P, Charlson ME, Ales K, MacKenzie CR, Norton M. Relating patient characteristics at the time of admission to outcomes of hospitalization. J Clin Epidemiol. 1991;44(10):1063-1069.
23. Meadow W, Pohlman A, Frain L, et al. Power and limitations of daily prognostications of death in the medical intensive care unit. Crit Care Med. 2011;39(3):474-479.
24. Douglas SL, Daly BJ, Lipson AR. Neglect of quality-of-life considerations in intensive care unit family meetings for long-stay intensive care unit patients. Crit Care Med. 2012;40(2):461-467.
25. Prendergast TJ, Claessens MT, Luce JM. A national survey of end-of-life care for critically ill patients. Am J Respir Crit Care Med. 1998;158(4):1163-1167.
26. Luce JM. A history of resolving conflicts over end-of-life care in intensive care units in the United States. Crit Care Med. 2010;38(8):1623-1629.
27. Bashour CA, Yared JP, Ryan TA, et al. Long-term survival and functional capacity in cardiac surgery patients after prolonged intensive care. Crit Care Med. 2000;28(12):3847-3853.
28. Eddleston JM, White P, Guthrie E. Survival, morbidity, and quality of life after discharge from intensive care. Crit Care Med. 2000;28(7):2293-2299.
29. Graf J, Koch M, Dujardin R, Kersten A, Janssens U. Health-related quality of life before, 1 month after, and 9 months after intensive care in medical cardiovascular and pulmonary patients. Crit Care Med. 2003;31(8):2163-2169.
30. Montuclard L, Garrouste-Orgeas M, Timsit JF, Misset B, De Jonghe B, Carlet J. Outcome, functional autonomy, and quality of life of elderly patients with a long-term intensive care unit stay. Crit Care Med. 2000;28(10):3389-3395.
31. Teno JM, Harrell FE Jr, Knaus W, et al. Prediction of survival for older hospitalized patients: the HELP survival model. Hospitalized Elderly Longitudinal Project. J Am Geriatr Soc. 2000;48(suppl 5):S16-S24.
32. Lamas D. Chronic critical illness. N Engl J Med. 2014;370(2):175-177.
33. Konopad E, Noseworthy TW, Johnston R, Shustack A, Grace M. Quality of life measures before and one year after admission to an intensive care unit. Crit Care Med. 1995;23(10):1653-1659.
34. Render ML, Kim HM, Deddens J, et al. Variation in outcomes in Veterans Affairs intensive care units with a computerized severity measure. Crit Care Med. 2005;33(5):930-939.
35. Gentile LF, Cuenca AG, Efron PA, et al. Persistent inflammation and immunosuppression: a common syndrome and new horizon for surgical intensive care. J Trauma Acute Care Surg. 2012;72(6):1491-1501.
36. Reuben DB, Tinetti ME. The hospital-dependent patient. N Engl J Med. 2014;370(8):694-697.
Admission to an intensive care unit (ICU) is lifesaving for some patients, but for many, the admission carries high expectations and financial costs and fails to provide desirable outcomes. Patients who receive intensive care have a mortality rate of about 20%, and the costs of this care comprise about 4% of the U.S. health care budget.1,2 In a study of Medicare recipients, treatment intensity and expenses increased between the mid-1980s and 1999 but without any increase in survivorship; per capita ICU expenses were higher for patients who did not survive the ICU.3 Use of the ICU in patients’ final stages of life has increased in proportion since then, and the demand for critical care is likely to continue as the relative proportion of elderly patients in the population rises.2,4,5
Physicians and nurses who responded to a European survey on the inappropriateness of intensive care overwhelmingly endorsed the problems of “too much care” (89%) and “other patients would benefit more” (38%).6 Receiving terminal care in the ICU runs counter to the preferences of most patients.7 Therefore, the challenges are to define the true beneficiaries of critical care and to minimize the discomfort and unrealistic expectations of patients who will not benefit from intensive care.
For ICU patients, morbidity and mortality depend on the interaction of an acute insult (or a surgery), major comorbidities, and physiologic reserve. Aside from those with objective criteria of extreme illness, many patients have an indeterminate prognosis that is difficult to reliably predict.8,9 Several prognostic scores, including the APACHE (Acute Physiologic Assessment and Chronic Health Evaluation) and SOFA (Sequential Organ Failure Assessment) scores, have proved useful in understanding the illness burden of a population when comparing outcomes in different ICUs. Yet their use in assessing the survival of individual patients has not been advocated.10-15 The utility of such models is further challenged by the significant differences in survival between patients with similar illness scores; by the sometimes poor applicability of a model’s derivation cohort to other ICU populations (surgical in particular); by cases of huge disparities between actual and predicted mortality; and by the periodic need to recalibrate models according to advances in care.16-20
Physician intuition regarding prognosis is highly variable. In a series of medical (floor and ICU) admissions, resident physician estimates of illness severity and postdischarge status were associated with stepwise differences in mortality and APACHE scores.21,22 However, in a pure ICU population, in most cases seasoned providers could not accurately predict a patient’s chance of survival.23 Physicians are likewise poor in predicting family preferences regarding aggressive care vs alternatives, and often, survival is couched in terms of ICU survival, which for family members may not be as meaningful as long-term survival or functional recovery. Further, quality of life and patient preferences are not discussed in most cases, even those associated with poor outcomes.24 There also is a large amount of heterogeneity in the end of-life care of ICU patients. For example, cardiopulmonary resuscitation was attempted in up to 70% of dying patients in some ICUs and in as little as 4% in other ICUs.25 Thus, the limitations of predictive models, combined with misperceptions of patient preference, poor communication, and local traditions, lead to aggressive care being given to patients who might not benefit from or desire such care.
It has been stated that the trajectory of most critical illness is unclear enough so that patients should be admitted to the ICU for a trial of therapy, and that in outcome predictions, the response to intensive treatment may be more useful than laboratory and other data comprising illness severity scores.15,26 However, there is no consensus as to what constitutes a trial of intensive care therapy—vs a round of chemotherapy, a course of antibiotics, or a palliative ileostomy—yet this is the basis of many ICU admissions. Slight corrections in laboratory or physiologic findings often lead to continuation of aggressive care, often without any discussion of expected outcomes and the process of identifying and caring for patients who do not respond to therapy. Intensive care also may be prolonged because of several medical, personal, and social factors (Table 1).
At best, deciding how long to provide intensive care involves a synthesis of information about the trajectory, physiologic reserve, beliefs, values, and preferences of the patient. Any or all of these elements may not be known to the care decision-makers.
The authors conducted a study to determine whether a particular duration of care exists that represents a reasonable trial of therapy. As the VA Palo Alto Health Care System (VAPAHCS) ICU treats both medical and surgical patients, the authors were able to compare these subpopulations’ outcomes while providing the same standard of care. They analyzed the aggregate of patients as well as the medical and surgical subpopulations.
Methods
The VA Research and Development Committee and the Stanford Panel on Human Subjects approved the authors’ data collection and reporting.The study was conducted at the 15-bed mixed-medical/surgical VAPAHCS ICU. Analyzed data were drawn from all patients admitted during a 19-month period (July 14, 2008, to January 28, 2010). A serial log was used to prospectively capture basic data regarding each admission. Medical patients received care from the ICU service, and surgical patients were comanaged by the surgical and ICU teams.
A mortality database was constructed with data from the Decedent Affairs Office and from the national VistA database. The data included all deaths recorded either inside or outside the hospital or systemwide nursing facility. Mortality reported in the Computerized Patient Record System (CPRS) was queried further for patients with a length of stay (LOS) of more than 14 days.
Statistical Analysis
Calculations were based on denominators of individual patients or on number of admissions. All mortality calculations were based on a denominator of individual patients. For mortality analysis, only the last admission was included, unless a patient survived a full year between admissions. The Kruskal-Wallis test for nonnormally distributed data and the Dunn posttest for multiple comparisons were used for continuous variables (eg, age, LOS, risk scores); the Fisher exact test was used for categorical data; and the log-rank test was used to compare survival curves. For all analyses, P < .05 was considered statistically significant.
Mortality and Functional Status
Mortality risk scores on ICU admission were calculated with the Mortality Prediction Model–Admission III (MPM-III), using data from the CPRS. Specifics on this calculation are described in the eAppendix.
Current survival status of patients who were in the ICU more than 14 days was determined from the CPRS and telephone discussions with the patient or with relatives. Functional status was evaluated with the 36-Item Short Form Health Survey (SF-36), which has been used in comparable studies.27,28 Disposition at 6 months and 1 year was established by inspecting the CPRS for dates corresponding to these exact periods. For example, a patient in the hospital about 1 year after ICU discharge would be considered to be at home if discharged 1 day before the 365-day anniversary. In a few cases, progress notes indicated that the patient was receiving around-the-clock nursing care at home; in the analysis, these cases were included with those of patients known to be in traditional nursing facilities. In cases in which the CPRS lacked mortality information, the patient was presumed to be alive even if there were no records of clinic visits or other medical attention. Serial admission data from a mixed-medical/surgical ICU were collected over a 19-month period (July 14, 2008, to January 28, 2010) and analyzed.
Results
The final data set consisted of 1,113 admissions and 976 patients (one-third medical, two-thirds surgical). In this cohort, 12% of all patients studied were readmitted to the ICU at least once, and 12% of all ICU admissions were repeat admissions. The medical/surgical proportion was similar for readmitted patients. Demographics and other data are available in eTable 1.
Length of Stay
The distribution of all patients by LOS in the study period is shown in eFigure 1A. Data are skewed rightward toward longer LOS. The median LOS of 3 days for the entire population differed according to specialty, with a median of 3 days for medical patients (interquartile range, 2-7 days) and a median of 2 days for surgical patients (interquartile range, 1-5 days; P < .01 for medical vs surgical patients).
The LOS differed between ICU patients admitted for the first time and those readmitted within the 19-month study period. For both admission categories, LOS was longer for medical patients than for surgical patients. However, there were no significant differences between percentages of medical and surgical patients who were readmitted (Table 2). Despite comprising about 12% of the population, patients with more than 1 admission accounted for 23% of admissions and 25% of all bed occupancies during the study period.
Figure e1B shows ICU bed occupancy for different LOS intervals (calculated as bed days) and indicates that despite accounting for a small percentage of admissions, patients with long LOS accounted for a significant portion of total occupancy (32% for more than 1 month, 45% for more than 14 days). The medical and surgical contributions of these long-LOS patients were about equal. The figures indicate that more than half of medical ICU patient occupancy involved LOS of more than 14 days, while surgical patients tended to have shorter LOS.
Mortality
Of all the patients in this study, 5.1% died in the ICU; the mortality rate was 11% for medical patients and 2.1% for surgical patients. Thirty days after discharge, overall mortality was 10.4%, or 23.5% for medical patients and 3.9% for surgical patients. Finally, 1 year after discharge, mortality rates were 21.5% (overall), 39.4% (medical patients), and 12.5% (surgical patients) (Table 3). Survival curves demonstrated the difference between medical and surgical patients at 30 days and 1 year (Figures 1A & 1B).
Impact of LOS on Mortality
One-year mortality was 17% for patients who were in the ICU less than 14 days and 40% for those in the ICU more than 14 days (relative risk [RR] = 2.35; P < .01) (Table 4).
Mortality also was higher in patients with more than 1 ICU admission. For the aggregate of ICU patients, readmission status was significantly associated with a 10% increase in mortality. For both single- and multiple-admission status, the mortality rate was 2.5-fold higher for medical patients than for surgical patients. The increased mortality associated with readmission status was not significantly different for either medical or surgical patients analyzed as subgroups (eAppendix Table.)
Impact of Age on Mortality
Figures 4A and 4B shows 30-day and 1-year mortality associated with age; regression analysis indicated that age is an independent predictor of ICU mortality. For 30-day mortality, increased age was positively associated with mortality in medical patients but not in surgical patients (r2 = 0.91; P < .0001). Age had a significant impact on 1-year mortality for both medical and surgical patients but less so in the latter (r2 = 0.95 and 0.65, respectively; P < .001 for both). Although increased mortality was associated with both LOS and age, there was no clear association between the latter 2 variables.
Survival of Chronic Critical Illness
As eTable 2 shows, 21.5% of all patients died either in the ICU or within the first year after ICU discharge. To evaluate the survival of chronic ICU residence, the authors performed a detailed analysis of functional status and mortality of patients with LOS of more than 14 days. Seventy-one patients fit that profile (their mean LOS was 41 days; median, 28 days). Of these patients, 11 died in the ICU, and another 17 died within 6 months (including 2 in a stepdown unit and 7 in hospice). Overall, 28 (39%) of the 71 patients died either in the ICU or within 6 months (35% aggregate, 53% of medical patients, and 27% of surgical patients in ICU > 2 weeks). Another 8 patients (11%) died between 6 and 12 months after discharge. One-year mortality among patients in the ICU more than 14 days was 40% overall, 50% for medical patients, and 29% for surgical patients—or twice that predicted by the MPM-III model, which figured mortality rates of 25% and 12% for medical and surgical patients, respectively. In this cohort, the mean MPM-III score was 18.6% for 1-year survivors and 29.3% for nonsurvivors (P = .016, Mann-Whitney U test). Mortality was associated with a trend toward higher MPM-III scores in both medical and surgical patients but did not reach statistical significance.
Of the cohort patients who lived at least 6 months after ICU discharge, 45% were still in a hospital or were in a nursing facility at 6 months. Of the patients who lived at least 1 year, 33% were still in a hospital or were in a nursing facility (Figure 5). At 1 year, mean age was 63 years for survivors and 69 years for the deceased (P < .01 by Student t test).
Quality-of-Life Survey
The authors successfully contacted 32 of the 39 patients who lived at least 1 year after discharge after an ICU stay of more than 14 days. The subgroups’ median SF-36 scores were similar: 57 for medical patients and 51 for surgical patients. These average scores over 8 domains are similar to those reported by Graf and colleagues for 9 months after ICU discharge (53.7) and are lower than the normative data reported by those authors for the German population (mean, 66.5).29
Discussion
The goals of the present study were 2-fold—to gain a better understanding of the survival and functioning of patients after ICU residence and to define what may constitute a trial of therapy in ICU, or specifically to determine whether there is a particular ICU interval or point at which further care fails to improve survival. The study also compared medical and surgical subpopulations.
The main finding of this study was a 4-fold difference between ICU mortality and 1-year mortality. This mortality increase occurred in both medical and surgical patients, but there were large differences in magnitude between these groups. The survival rates generally were better than those of other general intensive care populations, though such a comparison should be made with caution, as survival differs by country, population, admitting practices, and a variety of other hospital characteristics.30,31 Although some findings of the present study may relate to its largely male U.S. veteran population, the authors believe they have provided a data-collection-and-analysis model that can be used by any hospital trying to understand the course and outcome of its ICU patients and recognizing the value of this knowledge in discussions on goals of care.
Mortality and LOS
As each interval of ICU residence was associated with a stepwise increase in mortality, there was no clear cutoff for diminishing return. To create a reference point, the authors analyzed the data of patients who were in an ICU more than 14 days—thinking that this duration may represent an outer limit of a reasonable trial of therapy and a measure that probably distinguishes acute from chronic critical illness.32 Use of this interval represented a conservative approach, as only 6.5% of the patients in this cohort had a LOS of more than 14 days. This small percentage of patients accounted for 45% of total bed occupancy in this study and 54% of all medical bed occupancy. In the more-than-14-days group, mortality was 37.5% for surgical patients and 46.3% for medical patients. Thus, LOS may be a dynamic measure of physiologic reserve and disease severity—reflecting variables such as response to therapy, severity of comorbidities, resistance to new problems, and rebound from chronic stress, inflammation, and catabolism. This view is supported by the nearly 2-fold higher mortality in medical patients and nearly 3-fold higher mortality in surgical patients in comparison with MPM-III predictions.
Twelve percent of all patients were admitted to ICU multiple times, and these admissions accounted for 25% of all bed occupancies. Multiple admissions indicate a high disease burden or a low physiologic reserve that prevents full recovery from critical illness. As mortality was higher in patients with multiple admissions, ICU readmission should be regarded as a marker for poor overall recovery and should prompt consideration of both initial discharge criteria and trajectory as well as goals of care.
Medical vs Surgical Patients
In this cohort, medical and surgical patients were distinguished on several grounds. Despite the similar mean age of these subpopulations, medical patients had longer LOS and higher short- and long-term mortality. These findings are not surprising, as medical patients in the ICU have high rates of end-stage disease, malignancy, and high comorbidity burden and are often admitted to have potentially life-ending conditions stabilized. Surgical patients generally are selected on their ability to withstand major systemic perturbations—palliative and emergency operations excepted—and generally have medical conditions optimized before surgery. As the expectation of postoperative survival likely biases clinician behavior toward aggressive care, some short-term survival may reflect this behavior.
In contrast, such biased behavior is not an issue in 1-year survival, which instead accurately reflects underlying health. The different slopes of medical and surgical patients on age-vs-mortality in Figures 4A & 4B indicate the different physiologic makeups of these ICU patients. With short and long LOS compared, the difference between surgical and medical patients in the ICU is striking: Sixty-one percent of all surgical bed days vs 45% of all medical bed days are for LOS less than 14 days. Nevertheless, chronic critical illness has a significant impact on both medical and surgical patients and tends to equalize some of the survival differences between these groups. These populations had similar ICU readmission rates as well as similar higher mortality rates for LOS of more than 14 days and especially for LOS of more than 1 month. With longer LOS, the survival curve of surgical patients begins to resemble that of medical patients—suggesting that the phenotype of chronic critical illness becomes the dominant force influencing survival and function (Figures 3A & 3B). Indeed, for surgical patients, the highest mortality categories were ICU readmission and LOS of more than 30 days.
The mortality rate was significantly lower for surgical patients than it was for medical patients at all intervals studied, with the largest separation in the short-term categories of ICU and 30-day mortality. The post-ICU mortality rates for medical and surgical patients are similar to those reported in several other studies, including a study of veterans.14-16,33,34 Among the present patients with LOS of more than 14 days, surviving surgical patients were significantly younger than nonsurviving surgical patients and both surviving and nonsurviving medical patients.
The few SF-36 responses collected revealed no differences between medical and surgical patients.
A Trial of Therapy
The present data are useful in describing the landscape of post-ICU survival to patients and their families. The data demonstrated a higher mortality trend that correlated with increases in age and increases in ICU duration and readmission. Within this continuum, there was no break point at which survivors and nonsurvivors clearly separated. The data therefore lack a boundary that can be used to define a trial of therapy. However, the added risks of age and recovery longer than 1 week are clear and should be included in care decisions. The generally better survival of surgical patients (nearly all of whom had elective surgery) in comparison with medical patients suggests these populations should be considered separately.
In the absence of a point distinguishing survivors from nonsurvivors, the authors performed a more detailed analysis of patients in the ICU for more than 14 days to provide some perspective on health care dependence in the subsequent year. That ICU survival does not necessarily equate to overall survival and independence long after ICU residence is an important matter for patients and families to consider when making decisions about critical care residence. The 14-day LOS data, though using a fairly arbitrary time point, suggest that patients who cannot recover from critical illness in less than 14 days should be advised of the range of short- and long-term mortality and the likelihood of high dependence on medical care within the subsequent year.
The concepts of hospital-dependent patient and persistent inflammation, immunosuppression, and catabolism syndrome have been introduced to describe the condition of progressive deterioration and inability to regain full independence after illness.32,35 These illness patterns deserve attention in prognosis discussions. The present study focused not on ICU survival but on 1-year mortality and functional independence, and it is these longer term outcomes that critical care professionals should consider. Intensive care units are successful in improving short-term survival, but a long line of successful ICU discharges may lead an intensivist to think that longer term survival is important as well and convey this impression to patients and their families.
Study Strengths
This study is one of a few to investigate the short- and long-term survival of an unselected cohort of critically ill patients and is unique in its inclusion of both medical and surgical patients receiving care in the same environment. Medical and surgical patients have different survival profiles that may necessitate separate studies of these subpopulations. However, the finding of different survival profiles under the same care highlights the intrinsic differences between these groups. Use of a 1.5-year study period allowed the authors to capture ICU patients with long LOS and to include multiple episodes of care provided by more than 10 different attending physicians. Therefore, these data likely were not influenced by any rare events or idiosyncrasies in practice styles. Further, the same teams of physicians and nurses cared for all the medical and surgical patients, and all unit-based protocols and quality improvement activities were applied to all patients.
Study Limitations
The intensive care patients come from a large catchment area; however, conditions seen in tertiary referral centers, such as bone marrow transplants, cerebrovascular, transplant surgery, and ventricular-assist devices are not represented in this population.
In this study, bed days were used as a crude measure of care burden. From a nursing perspective, however, the workload may be higher with quick-turnover beds than with long-term residents. On the other hand, long-term ICU residents are visited by multiple consultants and receive a much larger set of interventions, including weeks of ventilation and hemodialysis, line changes, and family meetings. A comparison of the costs involved for different ICU subpopulations would add valuable information to this discussion.
The authors took a conservative approach in establishing the mortality and residence of patients 1 year after their ICU stays. At 6 months, 1-year patients without evidence of hospital or nursing facility residence were assumed to be home. In reality, nearly all these patients had multiple admissions or emergency department stays, or there was other evidence of intensive care. Some patients who were assumed to be home may have left the area and become untraceable. All estimates of care dependence and mortality should therefore be considered minimums. The authors cannot envision how any of their estimates could overstate the morbidity and mortality.
The concept of hospital dependence is applicable to the majority of the ICU survivors, though the authors did not attempt to create a quantitative measure of this status.36 Another study limitation is that absence of hospitalization does not equal functional independence. A better definition of this status, and its application to a broad spectrum of LOS, would be a valuable adjunct to ICU decision making.
The convention by which the authors considered the first day of their study period a “fresh slate” did not adjust for the situation that some first admissions actually were readmissions. Assuming the validity of the finding that readmitted patients had a higher burden of morbidity and mortality, misclassification of admission status would tend to inflate the mortality of single-admission patients and minimize the magnitude of the differences found in this study. Similarly, an admission near the end of the study period may have been analyzed as a single admission, even if the patient was readmitted and died the next year. The latter situation also would tend to inflate the mortality of the single-admission category. None of these possible mathematical errors negates the fact that a second ICU admission should be regarded as a marker for poor recovery.
A more accurate estimate of short- and long-term prognosis likely can be obtained by examining laboratory studies and interventions such as vasopressors, dialysis, and ventilation at defined time points. Although the authors did not attempt it, development of such a model would be a valuable undertaking. They focused on describing the expected course of ICU patients and determining what patterns emerged from care duration. As this study found that the prognosis for long-term ICU residents remained guarded a long time after discharge, survival models of patients with 1- to 2-week ICU residences likely would be valuable in clinical decision making.
A quality-of-life survey was administered only to patients in the ICU longer than 2 weeks. This limited study was conducted to explore the feasibility of assessing outcomes other than survival and to determine the staffing requirements needed to research this further. A more meaningful analysis would come from a broader analysis of scores from 3 or 4 different ICU lengths of stay.
Clinician and family behavior can influence some of the outcomes measured in this study—particularly in cases in which an illness is poorly characterized and an evidence basis for decision making is lacking. In these situations, values and individual clinician judgment likely predominate, possibly introducing variability to care duration. Nevertheless, cumulative mortality 1 month or more after ICU residence would eliminate biased clinician behavior. The heterogeneity of care providers’ and families’ decision making, captured in this analysis, likely is a normal phenomenon that should help inform physicians’ understanding of prolonged ICU residence.
1. Halpern NA. Can the costs of critical care be controlled? Curr Opin Crit Care. 2009;15(6):591-596.
2. Angus DC, Barnato AE, Linde-Zwirble WT, et al; Robert Wood Johnson Foundation ICU End-of-Life Peer Group. Use of intensive care at the end of life in the United States: an epidemiologic study. Crit Care Med. 2004;32(3):638-643.
3. Barnato AE, McClellan MB, Kagay CR, Garber AM. Trends in inpatient treatment intensity among Medicare beneficiaries at the end of life. Health Serv Res. 2004;39(2):363-375.
4. Teno JM, Gozalo PL, Bynum JP, et al. Change in end-of-life care for Medicare beneficiaries: site of death, place of care, and health care transitions in 2000, 2005, and 2009. JAMA. 2013;309(5):470-477.
5. Zilberberg MD, Shorr AF. Economics at the end of life: hospital and ICU perspectives. Semin Respir Crit Care Med. 2012;33(4):362-369.
6. Piers RD, Azoulay E, Ricou B, et al; APPROPRICUS Study Group of the Ethics Section of the ESICM. Perceptions of appropriateness of care among European and Israeli intensive care unit nurses and physicians. JAMA. 2011;306(24):2694-2703.
7. Higginson IJ, Sen-Gupta GJ. Place of care in advanced cancer: a qualitative systematic literature review of patient p. J Palliat Med. 2000;3(3):287-300.
8. McClish DK, Powell SH. How well can physicians estimate mortality in a medical intensive care unit? Med Decis Making. 1989;9(2):125-132.
9. Barrera R, Nygard S, Sogoloff H, Groeger J, Wilson R. Accuracy of predictions of survival at admission to the intensive care unit. J Crit Care. 2001;16(1):32-35.
10. Johnson AE, Kramer AA, Clifford GD. A new severity of illness scale using a subset of Acute Physiology and Chronic Health Evaluation data elements shows comparable predictive accuracy. Crit Care Med. 2013;41(7):1711-1718.
11. D'Hoore W, Bouckaert A, Tilquin C. Practical considerations on the use of the Charlson comorbidity index with administrative data bases. J Clin Epidemiol. 1996;49(12):1429-1433.
12. Knaus WA, Wagner DP, Zimmerman JE, Draper EA. Variations in mortality and length of stay in intensive care units. Ann Intern Med. 1993;118(10):753-761.
13. Lemeshow S, Teres D, Klar J, Avrunin JS, Gehlbach SH, Rapoport J. Mortality Probability Models (MPM II) based on an international cohort of intensive care unit patients. JAMA. 1993;270(20):2478-2486.
14. Render ML, Kim HM, Welsh DE, et al; VA ICU Project (VIP) Investigators. Automated intensive care unit risk adjustment: results from a national Veterans Affairs study. Crit Care Med. 2003;31(6):1638-1646.
15. Viviand X, Gouvernet J, Granthil C, François G. Simplification of the SAPS by selecting independent variables. Intensive Care Med. 1991;17(3):164-168.
16. Higgins TL, Teres D, Copes WS, Nathanson BH, Stark M, Kramer AA. Assessing contemporary intensive care unit outcome: an updated Mortality Probability Admission Model (MPM0-III). Crit Care Med. 2007;35(3):827-835.
17. Knaus WA, Draper EA, Wagner DP, Zimmerman JE. APACHE II: a severity of disease classification system. Crit Care Med. 1985;13(10):818-829.
18. Poses RM, McClish DK, Smith WR, et al. Results of report cards for patients with congestive heart failure depend on the method used to adjust for severity. Ann Intern Med. 2000;133(1):10-20.
19. Schuster DP. Predicting outcome after ICU admission. The art and science of assessing risk. Chest. 1992;102(6):1861-1870.
20. Teno JM, Fisher E, Hamel MB, et al. Decision-making and outcomes of prolonged ICU stays in seriously ill patients. J Am Geriatr Soc. 2000;48(suppl 5):S70-S74.
21. Charlson M, Szatrowski TP, Peterson J, Gold J. Validation of a combined comorbidity index. J Clin Epidemiol. 1994;47(11):1245-1251.
22. Pompei P, Charlson ME, Ales K, MacKenzie CR, Norton M. Relating patient characteristics at the time of admission to outcomes of hospitalization. J Clin Epidemiol. 1991;44(10):1063-1069.
23. Meadow W, Pohlman A, Frain L, et al. Power and limitations of daily prognostications of death in the medical intensive care unit. Crit Care Med. 2011;39(3):474-479.
24. Douglas SL, Daly BJ, Lipson AR. Neglect of quality-of-life considerations in intensive care unit family meetings for long-stay intensive care unit patients. Crit Care Med. 2012;40(2):461-467.
25. Prendergast TJ, Claessens MT, Luce JM. A national survey of end-of-life care for critically ill patients. Am J Respir Crit Care Med. 1998;158(4):1163-1167.
26. Luce JM. A history of resolving conflicts over end-of-life care in intensive care units in the United States. Crit Care Med. 2010;38(8):1623-1629.
27. Bashour CA, Yared JP, Ryan TA, et al. Long-term survival and functional capacity in cardiac surgery patients after prolonged intensive care. Crit Care Med. 2000;28(12):3847-3853.
28. Eddleston JM, White P, Guthrie E. Survival, morbidity, and quality of life after discharge from intensive care. Crit Care Med. 2000;28(7):2293-2299.
29. Graf J, Koch M, Dujardin R, Kersten A, Janssens U. Health-related quality of life before, 1 month after, and 9 months after intensive care in medical cardiovascular and pulmonary patients. Crit Care Med. 2003;31(8):2163-2169.
30. Montuclard L, Garrouste-Orgeas M, Timsit JF, Misset B, De Jonghe B, Carlet J. Outcome, functional autonomy, and quality of life of elderly patients with a long-term intensive care unit stay. Crit Care Med. 2000;28(10):3389-3395.
31. Teno JM, Harrell FE Jr, Knaus W, et al. Prediction of survival for older hospitalized patients: the HELP survival model. Hospitalized Elderly Longitudinal Project. J Am Geriatr Soc. 2000;48(suppl 5):S16-S24.
32. Lamas D. Chronic critical illness. N Engl J Med. 2014;370(2):175-177.
33. Konopad E, Noseworthy TW, Johnston R, Shustack A, Grace M. Quality of life measures before and one year after admission to an intensive care unit. Crit Care Med. 1995;23(10):1653-1659.
34. Render ML, Kim HM, Deddens J, et al. Variation in outcomes in Veterans Affairs intensive care units with a computerized severity measure. Crit Care Med. 2005;33(5):930-939.
35. Gentile LF, Cuenca AG, Efron PA, et al. Persistent inflammation and immunosuppression: a common syndrome and new horizon for surgical intensive care. J Trauma Acute Care Surg. 2012;72(6):1491-1501.
36. Reuben DB, Tinetti ME. The hospital-dependent patient. N Engl J Med. 2014;370(8):694-697.

Disease-Modifying Therapies in Multiple Sclerosis: Overview and Treatment Considerations
Multiple sclerosis (MS) is a disorder characterized by inflammation, demyelination, and degeneration of the central nervous system (CNS). The hallmark of the disorder is relapses and remissions of neurologic symptoms occurring early in the disease course, which are often associated with areas of CNS inflammation and myelin loss.1-3 The inciting cause for this inflammation is unknown but is believed to be multifactorial, with environmental and genetic influences creating an adaptive, T cell-mediated autoimmune response against the CNS.4 Separate from the acute attacks, progressive neurodegeneration can occur more chronically and is characterized by axonal loss and grey matter atrophy thought to be due to direct cytotoxic activity of the innate immune system as well as toxic intermediates, such as nitric oxide.4,5 Despite the multiple insults early on, neurologic disability typically becomes more apparent over time.6 The disability threshold theory argues that neurologic function compensates for brain tissue loss until a threshold of accumulated damage is exceeded.7
Background
The incidence of MS follows a geographic gradient; rates rise as the distance from the equator increases.8,9 This is thought to be due to the gradient of relative sun exposure and its role in the production of vitamin D, which plays an important role in immune regulation when converted to its active hormonal form. Multiple sclerosis is more prevalent in non-Hispanic white patients than it is in other racial groups, and women are affected nearly 2 to 3 times more often than are men.10 About 450,000 individuals in the U.S. and more than 2 million worldwide have MS.11-14
Multiple sclerosis is the most common cause of nontraumatic neurologic disability in young adults. It is typically diagnosed in the third and fourth decades of life, and those who are diagnosed after age 50 years often can recount neurologic symptoms that began years before. However, pediatric-onset and new-onset cases in the elderly have been reported. It has been estimated that up to 10% of patients with MS have onset before 18 years of age.15-17 Compared with adult-onset MS, pediatric-onset is associated with a longer period between initial attack and physical disability, although the average age of disability onset is about 10 years younger.17,18
Disease Courses
Relapsing-remitting MS (RRMS) is the most common disease course overall, and this pattern affects 97% of individuals with disease onset before age 18 years.15-17 The clinically isolated syndrome disease course leads to clinically definite MS in one-third of patients within 1 year and in one-half of patients within 2 years.19 In the majority of cases, the RRMS course transitions over time to secondary-progressive MS (SPMS), which is a disease pattern of progressively worsening disability with few neurologic relapses. Although inflammation is present at all stages, the difference is in the predominance of cell types involved.5 Why the shift from active to chronic inflammation occurs and how to prevent it remain central questions in MS research.4 Regardless, tentative evidence suggests that prevention of relapses may reduce disability accumulation and risk of conversion to progressive MS.20
A minority of patients with MS are diagnosed with primary-progressive MS (PPMS) at onset, which is characterized by a disease pattern that follows a relatively steady progression of neurologic symptoms over time, without clear relapses or remissions of these symptoms, though phases of stability or fluctuations in disability may still occur.21 It is typically diagnosed at an older age than is RRMS, and it is rare in children; suspicion of PPMS in this age group should prompt detailed assessment of alternative diagnoses.17,22 Primary-progressive MS is more equally distributed in men and women than is RRMS.
Regardless of onset type, disability progression seems to occur at the same rate among all patients with MS after a certain threshold is reached. The established assessment scale for disability progression in MS is the Kurtzke Expanded Disability Status scale (EDSS), which has a scoring range from 0 to 10. Data from several patient registries have shown that once EDSS step 4 is reached, progression thereafter occurs at a predictable rate that is similar across MS phenotypes.23 The time it takes patients to subsequently reach higher EDSS steps may be independent of preceding factors.23
MS Symptom Burden
The neurologic symptoms that patients experience are fluctuating and disabling throughout the disease course, irrespective of onset type. Typical MS symptoms include mobility impairment, changes in cognition and mood, pain and other sensation disturbances, bowel and bladder dysfunction, fatigue, and visual disturbances. The burden of these symptoms can significantly impact quality of life (QOL) for patients and their families. The symptom burden can pose a direct threat to a patient’s autonomy, necessitating adaptation to an unpredictable disease that requires frequent health care visits to many different health care providers (eg, neurologists; primary care providers; physiatrists; urologists; ophthalmologists; and speech, physical, and occupational therapists), periodic testing, and often costly medications.24
Compared with patients who have other chronic conditions, patients with MS experience diminished societal roles, along with decreased assessments in health, energy, and physical functions.25 These often lead to early exit from the workforce and limitations in household responsibilities, which further impact QOL.26 Including both direct and indirect costs of the disease, a patient with MS can expect a lifetime financial burden of nearly $1.2 million.27
Large population cohort studies in MS, along with MS registry studies of patients untreated with disease-modifying therapies, have shown reduced survival rates by an average of 7 to 14 years.23,28 Multiple sclerosis is the main cause of death in about 50% of cases (EDSS step 10), which is defined as “acute death due to brain stem involvement or to respiratory failure, or death consequent to the chronic bedridden state with terminal pneumonia, sepsis, uremia, or cardiorespiratory failure [and excluding] intercurrent causes of death.”23 For the remaining patients with MS, cause of death is similar to those of the general population, such as cardiovascular disease and cancer.23 However, the incidence of suicide is higher among patients with MS.23
All these factors underscore the importance of early diagnosis as well as early initiation of effective disease-modifying therapy. 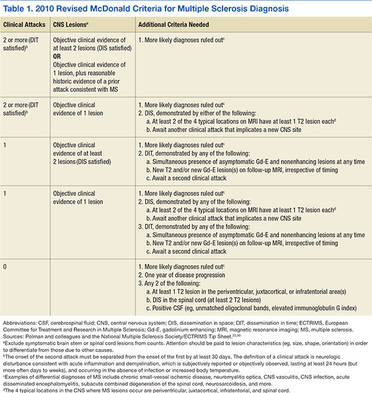
Disease-Modifying Therapies
The goal of MS disease-modifying therapy is to reduce the early clinical and subclinical disease activity that eventually contributes to long-term disability.31,32 There are currently 13 FDA-approved disease-modifying therapies for MS. These include 7 self-injecting therapies, 3 oral therapies, and 3 infusion therapies. These 13 medications have 8 different mechanisms of action (MOA) that target distinct areas of the immune-mediated disease process. They also differ in their frequencies and routes of administration in addition to their adverse effect (AE) profiles (Tables 2, 3, and 4).
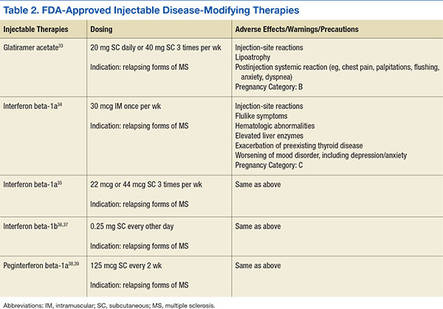
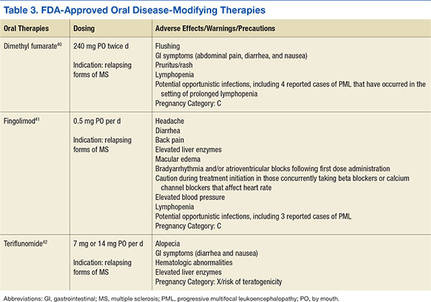
Treatment Considerations
In 1993, interferon beta-1b became the first FDA-approved MS medication. In the following 2 decades, there became 12 additional FDA-approved medications for MS, beginning with other injectables. The first infusion therapy was introduced in 2004, followed by various oral medications. The treatment landscape continues to change rapidly. This therapeutic revolution has occurred largely due to the improved understanding of the pathophysiology of MS and unquestionably has improved the prognosis and overall QOL for patients. The question is no longer how to treat MS but rather how to personalize and optimize treatment for each patient.20
Despite all available treatment options, none are curative, and none have been proven to offer neuroprotection or contribute to neural repair. To date, no studies have led to FDA-approved therapies for PPMS. Further, the efficacy of any of these medications varies from patient to patient. Due largely to the lack of biomarkers for disease activity and treatment response, drug efficacy continues to be measured according to the current gold standard, which is identification of gadolinium-enhancing lesions in the white matter on magnetic resonance imaging (MRI), combined with other markers of disease, including clinical relapse rate and confirmed disability progression.19 In general, the injectable therapies are expected to protect against about 20% to 35% of relapses; the oral agents, 50% to 55%; and the infusion therapies, > 60%.2
In conjunction with a medication’s efficacy rate and safety profile, the frequency and route of administration also must be considered. In general, MS medications are exceedingly expensive, some costing up to tens-of-thousands of dollars per year.48 All these factors have the real potential to negatively impact patient adherence. Nonadherence and gaps in treatment have been correlated with increased rates of relapses and progression of disability as well as negative MRI outcomes.49-53
When to Initiate Treatment
Once a patient is diagnosed, a common question is, when is the right time to initiate treatment? The primary target of the current MS medications is to decrease CNS inflammation (relapses). The ideal time to start treatment is as promptly as possible after confirmation of the diagnosis to combat the early inflammatory relapsing phase of the disease. There seems to be an early window in the disease course when achieving disease control can have a profound impact on long-term disability. Disease control is typically defined as decreasing relapses, slowing the accumulation of lesions visualized on MRI, and preventing the disability that occurs from both incomplete recovery after relapses and overall disease progression.54,55
Certain clinical indicators, such as higher relapse rates early in the disease course and MRI characteristics, including total lesion burden and the location of lesions within the CNS, seem to be associated with a higher risk of disease progression.56 These are potential prognostic indicators that can help tailor the choice of disease-modifying therapy for patients.57 Those with highly inflammatory and potentially aggressive disease at onset, for example, may benefit from early initiation of higher efficacy therapies, whereas those with more benign forms of MS at onset may fare well on lower efficacy therapies. In general, when it comes to currently available MS treatments, higher efficacy is often tied to riskier AE profiles, so the best medication may be the “least efficacious” one that can still control the disease.20
Hauser and colleagues suggested a treatment decision-making model that identifies the interferons, glatiramer acetate, dimethyl fumarate, and teriflunomide as acceptable first-line therapies; fingolimod and natalizumab as acceptable second-line options; and mitoxantrone and alemtuzumab as acceptable third-line therapeutic options.20 The authors generally agree with Hauser and colleagues’ model, and it is important to consider individual patient factors (eg, comorbidities, concurrent medications, life circumstances) and disease severity when deciding on a treatment plan.
Perhaps an even more difficult question is, when is the right time to switch therapies? There remains a dearth of either guidelines or comparative studies for treatment management decisions. Further, without reliable biomarkers, the clinical and pathologic heterogeneity of MS makes treatment difficult.4,19 In practice, there is general consensus that 1 year of treatment monitoring for effects on clinical and radiologic outcomes is an acceptable time frame to evaluate effectiveness of a disease-modifying treatment. If adherence is maintained and there is still evidence of clinical or MRI activity (suggesting a suboptimal response), an alternative therapy, particularly one with a different MOA, should be strongly considered. This highlights the importance of broad access to all available MS therapies to allow for early selection of a correct therapy that patients will remain adherent to and that controls their disease.
Conclusion
Multiple sclerosis remains a highly unpredictable disease, and relapses have the ability to produce a measurable and sustained impact on the level of disability.58 Still, the influence of reduced relapses on preventing disability in an individual patient remains unclear. Large, long-term, prospective cohort studies may clarify whether early treatment affects disease progression and disability.20 However, it is quite evident that effective relapse reduction decreases discomfort, reduces days lost from work and other important activities of daily life, and improves QOL.58,59
There is still much to learn about this unique disease, but emerging evidence in the medical literature highlights the importance of setting treatment goals that include targeting disease activity to achieve early and effective control. Attaining control with a MS medication seems to be a key component of slowing the physical and emotional disability that can accumulate, helping patients remain active and maintain the highest QOL possible for as long as possible.
1. Lublin FD, Reingold SC. Defining the clinical course of multiple sclerosis: results of an international survey. National Multiple Sclerosis Society (USA) Advisory Committee on Clinical Trials of New Agents in Multiple Sclerosis. Neurology. 1996;46(4):907-911.
2. Frischer JM, Bramow S, Dal-Bianco A, et al. The relation between inflammation and neurodegeneration in multiple sclerosis brains. Brain. 2009;132(pt 5):1175-1189.
3. Charil A, Filippi M. Inflammatory demyelination and neurodegeneration in early multiple sclerosis. J Neurol Sci. 2007;259(1-2):7-15.
4. Weiner HL. The challenge of multiple sclerosis: how do we cure a chronic heterogeneous disease? Ann Neurol. 2009;65(3):239-248.
5. Grigoriadis N, van Pesch V; ParadigMS Group. A basic overview of multiple sclerosis immunopathology. Eur J Neurol. 2015;22(suppl 2):3-13.
6. Lassmann H, van Horssen J, Mahad D. Progressive multiple sclerosis: pathology and pathogenesis. Nat Rev Neurol. 2012;8(11):647-656.
7. Rudick RA, Lee JC, Simon J, Fisher E. Significance of T2 lesions in multiple sclerosis: a 13-year longitudinal study. Ann Neurol. 2006;60(2):236-242.
8. Alla S, Mason DF. Multiple sclerosis in New Zealand. J Clin Neurosci. 2014;21(8):1288-1291.
9. Simpson S Jr, Blizzard L, Otahal P, Van der Mei I, Taylor B. Latitude is significantly associated with the prevalence of multiple sclerosis: a meta-analysis. J Neurol Neurosurg Psychiatry. 2011;82(10):1132-1141.
10. Evans C, Beland SG, Kulaga S, et al. Incidence and prevalence of multiple sclerosis in the Americas: a systematic review. Neuroepidemiology. 2013;40(3):195-210.
11. Giesser BS. Diagnosis of multiple sclerosis. Neurol Clin. 2011;29(2):381-388.
12. Noseworthy JH, Lucchinetti C, Rodriguez M, Weinshenker BG. Multiple sclerosis. N Engl J Med. 2000;343(13):938-952.
13. Weinshenker BG. The natural history of multiple sclerosis. Neurol Clin. 1995;13(1):119-146.
14. Weinshenker BG. The natural history of multiple sclerosis: update 1998. Semin Neurol. 1998;18(3):301-307.
15. Simone IL, Carrara D, Tortorella C, Ceccarelli A, Livrea P. Early onset multiple sclerosis. Neurol Sci. 2000;21(4)(suppl 2):S861-S863.
16. Reinhardt K, Weiss S, Rosenbauer J, Gärtner J, von Kries R. Multiple sclerosis in children and adolescents: incidence and clinical picture--new insights from the nationwide German surveillance (2009-2011). Eur J Neurol. 2014;21(4):654-659.
17. Waldman A, Ghezzi A, Bar-Or A, Mikaeloff Y, Tardieu M, Banwell B. Multiple sclerosis in children: an update on clinical diagnosis, therapeutic strategies, and research. Lancet Neurol. 2014;13(9):936-948.
18. Renoux C, Vukusic S, Mikaeloff Y, et al; Adult Neurology Departments KIDMUS Study Group. Natural history of multiple sclerosis with childhood onset. N Engl J Med. 2007;356(25):2603-2613.
19. D'Ambrosio A, Pontecorvo S, Colastanti T, Zamboni S, Francia A, Margutti P. Peripheral blood biomarkers in multiple sclerosis. Autoimmun Rev. 2015;14(12):1097-1110.
20. Hauser SL, Chan JR, Oksenberg JR. Multiple sclerosis: prospects and promise. Ann Neurol. 2013;74(3):317-327.
21. Lublin FD, Reingold SC, Cohen JA, et al. Defining the clinical course of multiple sclerosis: the 2013 revisions. Neurology. 2014;83(3):278-286.
22. Polman CH, Reingold SC, Banwell B, et al. Diagnostic criteria for multiple sclerosis: 2010 revisions to the McDonald criteria. Ann Neurol. 2011;69(2):292-302.
23. Hurwitz BJ. Analysis of current multiple sclerosis registries. Neurology. 2011;76(1)(suppl 1):S7-S13.
24. Boeije HR, Duijnstee MS, Grypdonck MH, Pool A. Encountering the downward phase: biographical work in people with multiple sclerosis living at home. Soc Sci Med. 2002;55(6):881-893.
25. Sprangers MA, de Regt EB, Andries F, et al. Which chronic conditions are associated with better or poorer quality of life? J Clin Epidemiol. 2000;53(9):895-907.
26. Julian LJ, Vella L, Vollmer T, Hadjimichael O, Mohr DC. Employment in multiple sclerosis. Exiting and re-entering the work force. J Neurol. 2008;255(9):1354-1360.
27. Trisolini M, Honeycutt A, Wiener J, Lesesne S. Global economic impact of multiple sclerosis. Multiple Sclerosis International Federation website. http://www.msif.org/wp-content/uploads/2014/09/Global_economic_impact_of_MS.pdf. Published May 2010. Accessed May 6, 2016
28. Scalfari A, Knappertz V, Cutter G, Goodin DS, Ashton R, Ebers GC. Mortality in patients with multiple sclerosis. Neurology. 2013;81(2):184-192.
29. Gurevich M, Miron G, Achiron A. Optimizing multiple sclerosis diagnosis: gene expression and genomic association. Ann Clin Transl Neurol. 2015;2(3):271-277.
30. National Multiple Sclerosis Society, European Committee for Treatment and Research in Multiple Sclerosis. Tip sheet: 2010 revised McDonald diagnostic criteria for MS. National Multiple Sclerosis Society website. http://www.nationalmssociety.org/NationalMSSociety/media/MSNationalFiles/Brochures/Paper-TipSheet_-2010-Revisions-to-the-McDonald-Criteria-for-the-Diagnosis-of-MS.pdf. Accessed April 22, 2016.
31. Freedman MS, Selchen D, Arnold DL, et al; Canadian Multiple Sclerosis Working Group. Treatment optimization in MS: Canadian MS Working Group updated recommendations. Can J Neurol Sci. 2013;40(3):307-323.
32. Gold R, Wolinsky JS, Amato MP, Comi G. Evolving expectations around early management of multiple sclerosis. Ther Adv Neurol Disord. 2010;3(6):351-367.
33. Copaxone [package insert]. Overland Park, KS: Teva Neuroscience, Inc; 2014.
34. Avonex [package insert]. Cambridge, MA: Biogen Idec Inc; 1996.
35. Rebif [package insert]. Rockland, MA: EMD Serono, Inc; New York, NY: Pfizer, Inc; 2012.
36. Betaseron [package insert]. Montville, NJ: Bayer HealthCare Pharmaceuticals Inc; 2012.
37. Extavia [package insert]. East Hanover, NJ: Novartis Pharmaceuticals Corp; 2014.
38. Plegridy [package insert]. Cambridge, MA: Biogen Idec Inc; 2013.
39. Calabresi PA, Kieseier BC, Arnold DL, et al. Pegylated interferon ß-1a for relapsing-remitting multiple sclerosis (ADVANCE): a randomised, phase 3, double-blind study. Lancet Neurol. 2014;13(7):657-665.
40. Tecfidera [package insert]. Cambridge, MA: Biogen Idec Inc; 2015.
41. Gilenya [package insert]. East Hanover, NJ: Novartis Pharmaceuticals Corp; 2016.
42. Aubagio [package insert]. Cambridge, MA: Genzyme Corp; 2012.
43. Lemtrada [package insert]. Cambridge, MA: Genzyme Corp; 2014.
44. Cohen JA, Coles AJ, Arnold DL, et al; CARE-MS I investigators. Alemtuzumab versus interferon beta 1a as first-line treatment for patients with relapsing-remitting multiple sclerosis: a randomised controlled phase 3 trial. Lancet. 2012;380(9856):1819-1828.
45. Coles AJ, Twyman CL, Arnold DL, et al; CARE-MS II investigators. Alemtuzumab for patients with relapsing multiple sclerosis after disease-modifying therapy: a randomised controlled phase 3 trial. Lancet. 2012;380(9856):1829-1839.
46. Novantrone [package insert]. Rockland, MA: EMD Serono, Inc; 2008.
47. Tysabri [medication guide]. Cambridge, MA: Biogen Idec Inc; 2015.
48. Hartung DM, Bourdette DN, Ahmed SM, Whitham RH. The cost of multiple sclerosis drugs in the US and the pharmaceutical industry: too big to fail. Neurology. 2015;84(21):2185-2192.
49. Cohen BA, Coyle PK, Leist T, Oleen-Burkey MA, Schwartz M, Zwibel H. Therapy Optimization in Multiple Sclerosis: a cohort study of therapy adherence and risk of relapse. Mult Scler Relat Disord. 2015;4(1):75-82.
50. Cohen B, Leist T, Coyle P, Zwibel H, Markowitz C, Tullman M. MS therapy adherence and relapse risk. Neurology. 2013;80(7) (suppl):P01.193.
51. Richert ND, Zierak MC, Bash CN, Lewis BK, McFarland HF, Frank JA. MRI and clinical activity in MS patients after terminating treatment with interferon beta-1b. Mult Scler. 2000;6(2):86-90.
52. Siger M, Durko A, Nicpan A, Konarska M, Grudziecka M, Selmaj K. Discontinuation of interferon beta therapy in multiple sclerosis patients with high pre-treatment disease activity leads to prompt return to previous disease activity. J Neurol Sci. 2011;303(1-2):50-52.
53. Wu X, Dastidar P, Kuusisto H, Ukkonen M, Huhtala H, Elovaara I. Increased disability and MRI lesions after discontinuation of IFN-beta-1a in secondary progressive MS. Acta Neurol Scand. 2005;112(4):242-247.
54. Scalfari A, Neuhaus A, Degenhardt A, et al. The natural history of multiple sclerosis: a geographically based study 10: relapses and long-term disability. Brain. 2010;133(pt 7):1914-1929.
55. Bates D. Treatment effects of immunomodulatory therapies at different stages of multiple sclerosis in short-term trials. Neurology. 2011;76(1)(suppl 1):S14-S25.
56. Fisniku LK, Brex PA, Altmann DR, et al. Disability and T2 MRI lesions: a 20-year follow-up of patients with relapse onset of multiple sclerosis. Brain. 2008;131(pt 3):808-817.
57. Cross AH, Naismith RT. Established and novel disease-modifying treatments in multiple sclerosis. J Intern Med. 2014;275(4):350-363.
58. Lublin FD, Baier M, Cutter G. Effect of relapses on development of residual deficit in multiple sclerosis. Neurology. 2003;61(11):1528-1532.
59. Kalb R. The emotional and psychological impact of multiple sclerosis relapses. J Neurol Sci. 2007;256(suppl 1):S29-S33.
Multiple sclerosis (MS) is a disorder characterized by inflammation, demyelination, and degeneration of the central nervous system (CNS). The hallmark of the disorder is relapses and remissions of neurologic symptoms occurring early in the disease course, which are often associated with areas of CNS inflammation and myelin loss.1-3 The inciting cause for this inflammation is unknown but is believed to be multifactorial, with environmental and genetic influences creating an adaptive, T cell-mediated autoimmune response against the CNS.4 Separate from the acute attacks, progressive neurodegeneration can occur more chronically and is characterized by axonal loss and grey matter atrophy thought to be due to direct cytotoxic activity of the innate immune system as well as toxic intermediates, such as nitric oxide.4,5 Despite the multiple insults early on, neurologic disability typically becomes more apparent over time.6 The disability threshold theory argues that neurologic function compensates for brain tissue loss until a threshold of accumulated damage is exceeded.7
Background
The incidence of MS follows a geographic gradient; rates rise as the distance from the equator increases.8,9 This is thought to be due to the gradient of relative sun exposure and its role in the production of vitamin D, which plays an important role in immune regulation when converted to its active hormonal form. Multiple sclerosis is more prevalent in non-Hispanic white patients than it is in other racial groups, and women are affected nearly 2 to 3 times more often than are men.10 About 450,000 individuals in the U.S. and more than 2 million worldwide have MS.11-14
Multiple sclerosis is the most common cause of nontraumatic neurologic disability in young adults. It is typically diagnosed in the third and fourth decades of life, and those who are diagnosed after age 50 years often can recount neurologic symptoms that began years before. However, pediatric-onset and new-onset cases in the elderly have been reported. It has been estimated that up to 10% of patients with MS have onset before 18 years of age.15-17 Compared with adult-onset MS, pediatric-onset is associated with a longer period between initial attack and physical disability, although the average age of disability onset is about 10 years younger.17,18
Disease Courses
Relapsing-remitting MS (RRMS) is the most common disease course overall, and this pattern affects 97% of individuals with disease onset before age 18 years.15-17 The clinically isolated syndrome disease course leads to clinically definite MS in one-third of patients within 1 year and in one-half of patients within 2 years.19 In the majority of cases, the RRMS course transitions over time to secondary-progressive MS (SPMS), which is a disease pattern of progressively worsening disability with few neurologic relapses. Although inflammation is present at all stages, the difference is in the predominance of cell types involved.5 Why the shift from active to chronic inflammation occurs and how to prevent it remain central questions in MS research.4 Regardless, tentative evidence suggests that prevention of relapses may reduce disability accumulation and risk of conversion to progressive MS.20
A minority of patients with MS are diagnosed with primary-progressive MS (PPMS) at onset, which is characterized by a disease pattern that follows a relatively steady progression of neurologic symptoms over time, without clear relapses or remissions of these symptoms, though phases of stability or fluctuations in disability may still occur.21 It is typically diagnosed at an older age than is RRMS, and it is rare in children; suspicion of PPMS in this age group should prompt detailed assessment of alternative diagnoses.17,22 Primary-progressive MS is more equally distributed in men and women than is RRMS.
Regardless of onset type, disability progression seems to occur at the same rate among all patients with MS after a certain threshold is reached. The established assessment scale for disability progression in MS is the Kurtzke Expanded Disability Status scale (EDSS), which has a scoring range from 0 to 10. Data from several patient registries have shown that once EDSS step 4 is reached, progression thereafter occurs at a predictable rate that is similar across MS phenotypes.23 The time it takes patients to subsequently reach higher EDSS steps may be independent of preceding factors.23
MS Symptom Burden
The neurologic symptoms that patients experience are fluctuating and disabling throughout the disease course, irrespective of onset type. Typical MS symptoms include mobility impairment, changes in cognition and mood, pain and other sensation disturbances, bowel and bladder dysfunction, fatigue, and visual disturbances. The burden of these symptoms can significantly impact quality of life (QOL) for patients and their families. The symptom burden can pose a direct threat to a patient’s autonomy, necessitating adaptation to an unpredictable disease that requires frequent health care visits to many different health care providers (eg, neurologists; primary care providers; physiatrists; urologists; ophthalmologists; and speech, physical, and occupational therapists), periodic testing, and often costly medications.24
Compared with patients who have other chronic conditions, patients with MS experience diminished societal roles, along with decreased assessments in health, energy, and physical functions.25 These often lead to early exit from the workforce and limitations in household responsibilities, which further impact QOL.26 Including both direct and indirect costs of the disease, a patient with MS can expect a lifetime financial burden of nearly $1.2 million.27
Large population cohort studies in MS, along with MS registry studies of patients untreated with disease-modifying therapies, have shown reduced survival rates by an average of 7 to 14 years.23,28 Multiple sclerosis is the main cause of death in about 50% of cases (EDSS step 10), which is defined as “acute death due to brain stem involvement or to respiratory failure, or death consequent to the chronic bedridden state with terminal pneumonia, sepsis, uremia, or cardiorespiratory failure [and excluding] intercurrent causes of death.”23 For the remaining patients with MS, cause of death is similar to those of the general population, such as cardiovascular disease and cancer.23 However, the incidence of suicide is higher among patients with MS.23
All these factors underscore the importance of early diagnosis as well as early initiation of effective disease-modifying therapy.
Disease-Modifying Therapies
The goal of MS disease-modifying therapy is to reduce the early clinical and subclinical disease activity that eventually contributes to long-term disability.31,32 There are currently 13 FDA-approved disease-modifying therapies for MS. These include 7 self-injecting therapies, 3 oral therapies, and 3 infusion therapies. These 13 medications have 8 different mechanisms of action (MOA) that target distinct areas of the immune-mediated disease process. They also differ in their frequencies and routes of administration in addition to their adverse effect (AE) profiles (Tables 2, 3, and 4).
Treatment Considerations
In 1993, interferon beta-1b became the first FDA-approved MS medication. In the following 2 decades, there became 12 additional FDA-approved medications for MS, beginning with other injectables. The first infusion therapy was introduced in 2004, followed by various oral medications. The treatment landscape continues to change rapidly. This therapeutic revolution has occurred largely due to the improved understanding of the pathophysiology of MS and unquestionably has improved the prognosis and overall QOL for patients. The question is no longer how to treat MS but rather how to personalize and optimize treatment for each patient.20
Despite all available treatment options, none are curative, and none have been proven to offer neuroprotection or contribute to neural repair. To date, no studies have led to FDA-approved therapies for PPMS. Further, the efficacy of any of these medications varies from patient to patient. Due largely to the lack of biomarkers for disease activity and treatment response, drug efficacy continues to be measured according to the current gold standard, which is identification of gadolinium-enhancing lesions in the white matter on magnetic resonance imaging (MRI), combined with other markers of disease, including clinical relapse rate and confirmed disability progression.19 In general, the injectable therapies are expected to protect against about 20% to 35% of relapses; the oral agents, 50% to 55%; and the infusion therapies, > 60%.2
In conjunction with a medication’s efficacy rate and safety profile, the frequency and route of administration also must be considered. In general, MS medications are exceedingly expensive, some costing up to tens-of-thousands of dollars per year.48 All these factors have the real potential to negatively impact patient adherence. Nonadherence and gaps in treatment have been correlated with increased rates of relapses and progression of disability as well as negative MRI outcomes.49-53
When to Initiate Treatment
Once a patient is diagnosed, a common question is, when is the right time to initiate treatment? The primary target of the current MS medications is to decrease CNS inflammation (relapses). The ideal time to start treatment is as promptly as possible after confirmation of the diagnosis to combat the early inflammatory relapsing phase of the disease. There seems to be an early window in the disease course when achieving disease control can have a profound impact on long-term disability. Disease control is typically defined as decreasing relapses, slowing the accumulation of lesions visualized on MRI, and preventing the disability that occurs from both incomplete recovery after relapses and overall disease progression.54,55
Certain clinical indicators, such as higher relapse rates early in the disease course and MRI characteristics, including total lesion burden and the location of lesions within the CNS, seem to be associated with a higher risk of disease progression.56 These are potential prognostic indicators that can help tailor the choice of disease-modifying therapy for patients.57 Those with highly inflammatory and potentially aggressive disease at onset, for example, may benefit from early initiation of higher efficacy therapies, whereas those with more benign forms of MS at onset may fare well on lower efficacy therapies. In general, when it comes to currently available MS treatments, higher efficacy is often tied to riskier AE profiles, so the best medication may be the “least efficacious” one that can still control the disease.20
Hauser and colleagues suggested a treatment decision-making model that identifies the interferons, glatiramer acetate, dimethyl fumarate, and teriflunomide as acceptable first-line therapies; fingolimod and natalizumab as acceptable second-line options; and mitoxantrone and alemtuzumab as acceptable third-line therapeutic options.20 The authors generally agree with Hauser and colleagues’ model, and it is important to consider individual patient factors (eg, comorbidities, concurrent medications, life circumstances) and disease severity when deciding on a treatment plan.
Perhaps an even more difficult question is, when is the right time to switch therapies? There remains a dearth of either guidelines or comparative studies for treatment management decisions. Further, without reliable biomarkers, the clinical and pathologic heterogeneity of MS makes treatment difficult.4,19 In practice, there is general consensus that 1 year of treatment monitoring for effects on clinical and radiologic outcomes is an acceptable time frame to evaluate effectiveness of a disease-modifying treatment. If adherence is maintained and there is still evidence of clinical or MRI activity (suggesting a suboptimal response), an alternative therapy, particularly one with a different MOA, should be strongly considered. This highlights the importance of broad access to all available MS therapies to allow for early selection of a correct therapy that patients will remain adherent to and that controls their disease.
Conclusion
Multiple sclerosis remains a highly unpredictable disease, and relapses have the ability to produce a measurable and sustained impact on the level of disability.58 Still, the influence of reduced relapses on preventing disability in an individual patient remains unclear. Large, long-term, prospective cohort studies may clarify whether early treatment affects disease progression and disability.20 However, it is quite evident that effective relapse reduction decreases discomfort, reduces days lost from work and other important activities of daily life, and improves QOL.58,59
There is still much to learn about this unique disease, but emerging evidence in the medical literature highlights the importance of setting treatment goals that include targeting disease activity to achieve early and effective control. Attaining control with a MS medication seems to be a key component of slowing the physical and emotional disability that can accumulate, helping patients remain active and maintain the highest QOL possible for as long as possible.
1. Lublin FD, Reingold SC. Defining the clinical course of multiple sclerosis: results of an international survey. National Multiple Sclerosis Society (USA) Advisory Committee on Clinical Trials of New Agents in Multiple Sclerosis. Neurology. 1996;46(4):907-911.
2. Frischer JM, Bramow S, Dal-Bianco A, et al. The relation between inflammation and neurodegeneration in multiple sclerosis brains. Brain. 2009;132(pt 5):1175-1189.
3. Charil A, Filippi M. Inflammatory demyelination and neurodegeneration in early multiple sclerosis. J Neurol Sci. 2007;259(1-2):7-15.
4. Weiner HL. The challenge of multiple sclerosis: how do we cure a chronic heterogeneous disease? Ann Neurol. 2009;65(3):239-248.
5. Grigoriadis N, van Pesch V; ParadigMS Group. A basic overview of multiple sclerosis immunopathology. Eur J Neurol. 2015;22(suppl 2):3-13.
6. Lassmann H, van Horssen J, Mahad D. Progressive multiple sclerosis: pathology and pathogenesis. Nat Rev Neurol. 2012;8(11):647-656.
7. Rudick RA, Lee JC, Simon J, Fisher E. Significance of T2 lesions in multiple sclerosis: a 13-year longitudinal study. Ann Neurol. 2006;60(2):236-242.
8. Alla S, Mason DF. Multiple sclerosis in New Zealand. J Clin Neurosci. 2014;21(8):1288-1291.
9. Simpson S Jr, Blizzard L, Otahal P, Van der Mei I, Taylor B. Latitude is significantly associated with the prevalence of multiple sclerosis: a meta-analysis. J Neurol Neurosurg Psychiatry. 2011;82(10):1132-1141.
10. Evans C, Beland SG, Kulaga S, et al. Incidence and prevalence of multiple sclerosis in the Americas: a systematic review. Neuroepidemiology. 2013;40(3):195-210.
11. Giesser BS. Diagnosis of multiple sclerosis. Neurol Clin. 2011;29(2):381-388.
12. Noseworthy JH, Lucchinetti C, Rodriguez M, Weinshenker BG. Multiple sclerosis. N Engl J Med. 2000;343(13):938-952.
13. Weinshenker BG. The natural history of multiple sclerosis. Neurol Clin. 1995;13(1):119-146.
14. Weinshenker BG. The natural history of multiple sclerosis: update 1998. Semin Neurol. 1998;18(3):301-307.
15. Simone IL, Carrara D, Tortorella C, Ceccarelli A, Livrea P. Early onset multiple sclerosis. Neurol Sci. 2000;21(4)(suppl 2):S861-S863.
16. Reinhardt K, Weiss S, Rosenbauer J, Gärtner J, von Kries R. Multiple sclerosis in children and adolescents: incidence and clinical picture--new insights from the nationwide German surveillance (2009-2011). Eur J Neurol. 2014;21(4):654-659.
17. Waldman A, Ghezzi A, Bar-Or A, Mikaeloff Y, Tardieu M, Banwell B. Multiple sclerosis in children: an update on clinical diagnosis, therapeutic strategies, and research. Lancet Neurol. 2014;13(9):936-948.
18. Renoux C, Vukusic S, Mikaeloff Y, et al; Adult Neurology Departments KIDMUS Study Group. Natural history of multiple sclerosis with childhood onset. N Engl J Med. 2007;356(25):2603-2613.
19. D'Ambrosio A, Pontecorvo S, Colastanti T, Zamboni S, Francia A, Margutti P. Peripheral blood biomarkers in multiple sclerosis. Autoimmun Rev. 2015;14(12):1097-1110.
20. Hauser SL, Chan JR, Oksenberg JR. Multiple sclerosis: prospects and promise. Ann Neurol. 2013;74(3):317-327.
21. Lublin FD, Reingold SC, Cohen JA, et al. Defining the clinical course of multiple sclerosis: the 2013 revisions. Neurology. 2014;83(3):278-286.
22. Polman CH, Reingold SC, Banwell B, et al. Diagnostic criteria for multiple sclerosis: 2010 revisions to the McDonald criteria. Ann Neurol. 2011;69(2):292-302.
23. Hurwitz BJ. Analysis of current multiple sclerosis registries. Neurology. 2011;76(1)(suppl 1):S7-S13.
24. Boeije HR, Duijnstee MS, Grypdonck MH, Pool A. Encountering the downward phase: biographical work in people with multiple sclerosis living at home. Soc Sci Med. 2002;55(6):881-893.
25. Sprangers MA, de Regt EB, Andries F, et al. Which chronic conditions are associated with better or poorer quality of life? J Clin Epidemiol. 2000;53(9):895-907.
26. Julian LJ, Vella L, Vollmer T, Hadjimichael O, Mohr DC. Employment in multiple sclerosis. Exiting and re-entering the work force. J Neurol. 2008;255(9):1354-1360.
27. Trisolini M, Honeycutt A, Wiener J, Lesesne S. Global economic impact of multiple sclerosis. Multiple Sclerosis International Federation website. http://www.msif.org/wp-content/uploads/2014/09/Global_economic_impact_of_MS.pdf. Published May 2010. Accessed May 6, 2016
28. Scalfari A, Knappertz V, Cutter G, Goodin DS, Ashton R, Ebers GC. Mortality in patients with multiple sclerosis. Neurology. 2013;81(2):184-192.
29. Gurevich M, Miron G, Achiron A. Optimizing multiple sclerosis diagnosis: gene expression and genomic association. Ann Clin Transl Neurol. 2015;2(3):271-277.
30. National Multiple Sclerosis Society, European Committee for Treatment and Research in Multiple Sclerosis. Tip sheet: 2010 revised McDonald diagnostic criteria for MS. National Multiple Sclerosis Society website. http://www.nationalmssociety.org/NationalMSSociety/media/MSNationalFiles/Brochures/Paper-TipSheet_-2010-Revisions-to-the-McDonald-Criteria-for-the-Diagnosis-of-MS.pdf. Accessed April 22, 2016.
31. Freedman MS, Selchen D, Arnold DL, et al; Canadian Multiple Sclerosis Working Group. Treatment optimization in MS: Canadian MS Working Group updated recommendations. Can J Neurol Sci. 2013;40(3):307-323.
32. Gold R, Wolinsky JS, Amato MP, Comi G. Evolving expectations around early management of multiple sclerosis. Ther Adv Neurol Disord. 2010;3(6):351-367.
33. Copaxone [package insert]. Overland Park, KS: Teva Neuroscience, Inc; 2014.
34. Avonex [package insert]. Cambridge, MA: Biogen Idec Inc; 1996.
35. Rebif [package insert]. Rockland, MA: EMD Serono, Inc; New York, NY: Pfizer, Inc; 2012.
36. Betaseron [package insert]. Montville, NJ: Bayer HealthCare Pharmaceuticals Inc; 2012.
37. Extavia [package insert]. East Hanover, NJ: Novartis Pharmaceuticals Corp; 2014.
38. Plegridy [package insert]. Cambridge, MA: Biogen Idec Inc; 2013.
39. Calabresi PA, Kieseier BC, Arnold DL, et al. Pegylated interferon ß-1a for relapsing-remitting multiple sclerosis (ADVANCE): a randomised, phase 3, double-blind study. Lancet Neurol. 2014;13(7):657-665.
40. Tecfidera [package insert]. Cambridge, MA: Biogen Idec Inc; 2015.
41. Gilenya [package insert]. East Hanover, NJ: Novartis Pharmaceuticals Corp; 2016.
42. Aubagio [package insert]. Cambridge, MA: Genzyme Corp; 2012.
43. Lemtrada [package insert]. Cambridge, MA: Genzyme Corp; 2014.
44. Cohen JA, Coles AJ, Arnold DL, et al; CARE-MS I investigators. Alemtuzumab versus interferon beta 1a as first-line treatment for patients with relapsing-remitting multiple sclerosis: a randomised controlled phase 3 trial. Lancet. 2012;380(9856):1819-1828.
45. Coles AJ, Twyman CL, Arnold DL, et al; CARE-MS II investigators. Alemtuzumab for patients with relapsing multiple sclerosis after disease-modifying therapy: a randomised controlled phase 3 trial. Lancet. 2012;380(9856):1829-1839.
46. Novantrone [package insert]. Rockland, MA: EMD Serono, Inc; 2008.
47. Tysabri [medication guide]. Cambridge, MA: Biogen Idec Inc; 2015.
48. Hartung DM, Bourdette DN, Ahmed SM, Whitham RH. The cost of multiple sclerosis drugs in the US and the pharmaceutical industry: too big to fail. Neurology. 2015;84(21):2185-2192.
49. Cohen BA, Coyle PK, Leist T, Oleen-Burkey MA, Schwartz M, Zwibel H. Therapy Optimization in Multiple Sclerosis: a cohort study of therapy adherence and risk of relapse. Mult Scler Relat Disord. 2015;4(1):75-82.
50. Cohen B, Leist T, Coyle P, Zwibel H, Markowitz C, Tullman M. MS therapy adherence and relapse risk. Neurology. 2013;80(7) (suppl):P01.193.
51. Richert ND, Zierak MC, Bash CN, Lewis BK, McFarland HF, Frank JA. MRI and clinical activity in MS patients after terminating treatment with interferon beta-1b. Mult Scler. 2000;6(2):86-90.
52. Siger M, Durko A, Nicpan A, Konarska M, Grudziecka M, Selmaj K. Discontinuation of interferon beta therapy in multiple sclerosis patients with high pre-treatment disease activity leads to prompt return to previous disease activity. J Neurol Sci. 2011;303(1-2):50-52.
53. Wu X, Dastidar P, Kuusisto H, Ukkonen M, Huhtala H, Elovaara I. Increased disability and MRI lesions after discontinuation of IFN-beta-1a in secondary progressive MS. Acta Neurol Scand. 2005;112(4):242-247.
54. Scalfari A, Neuhaus A, Degenhardt A, et al. The natural history of multiple sclerosis: a geographically based study 10: relapses and long-term disability. Brain. 2010;133(pt 7):1914-1929.
55. Bates D. Treatment effects of immunomodulatory therapies at different stages of multiple sclerosis in short-term trials. Neurology. 2011;76(1)(suppl 1):S14-S25.
56. Fisniku LK, Brex PA, Altmann DR, et al. Disability and T2 MRI lesions: a 20-year follow-up of patients with relapse onset of multiple sclerosis. Brain. 2008;131(pt 3):808-817.
57. Cross AH, Naismith RT. Established and novel disease-modifying treatments in multiple sclerosis. J Intern Med. 2014;275(4):350-363.
58. Lublin FD, Baier M, Cutter G. Effect of relapses on development of residual deficit in multiple sclerosis. Neurology. 2003;61(11):1528-1532.
59. Kalb R. The emotional and psychological impact of multiple sclerosis relapses. J Neurol Sci. 2007;256(suppl 1):S29-S33.
A Physician With Thigh Pain
Necrotizing soft-tissue infection (NSTI) often is difficult to distinguish from a superficial soft-tissue infection like cellulitis. Both conditions present with pain, edema, and erythema and can be accompanied by fever and malaise. The diagnosis of NSTI must be made quickly because successful treatment requires early surgical debridement and broad-spectrum antibiotics. The following case demonstrates the challenge of diagnosing NSTI.
Case Presentation
A 50-year-old physician developed a sore throat with subjective fevers, night sweats, and chills. After 2 days, his symptoms resolved. The next day he developed right thigh pain while playing tennis and limped off the court. That night he had fevers, chills, and sweats. For the next 3 days, his right thigh pain persisted with waxing and waning fevers.
The patient’s medical history included gastroesophageal reflux disease, vitamin D deficiency, and a positive purified protein derivative test for which he had completed 1 year of isoniazid therapy. The patient was married and in a monogamous relationship with his wife. He had traveled to the Sierra National Forest and Yosemite Park during the preceding winter. He did not swim in a lake or recall a tick bite. He had not consumed raw food, imported meats, or dairy products. He recently started oral fluconazole for tinea corporis.
The patient’s temperature was 39.5°C, heart rate was 115 beats per minute, blood pressure (BP) was 142/88 mm Hg, and respiratory rate was 18 breaths per minute with an oxygen saturation of 95% while breathing ambient air. He was drenched in sweat yet remained comfortable throughout the interview. The oropharyngeal mucosa was moist without lesions or erythema. There was no rash or lymphadenopathy. The lungs were clear to auscultation. The cardiac exam revealed tachycardia. There was point tenderness to deep palpation of the mid-anterior right thigh without crepitus, erythema, or edema.
The patient’s sodium level was 129 mmol/L (normal range 135-145 mmol/L), bicarbonate was 20 mmol/L (normal range 22-32 mmol/L), creatinine was 1.1 mg/dL (normal range 0.7-1.2 mg/dL), and glucose was 194 mg/dL. The white blood cell count (WBC) was 12,900 cells/mm3 (normal range 3,400-10,000 cells/mm3) with 96% neutrophils. The hematocrit was 41% (normal range 41-53%), and the platelet count was 347,000 cells/mm3 (normal range 140,000-450,000 cells/mm3). The lactate level was 2.2 mmol/L (normal range 0-2 mmol/L). The creatine kinase level was 347 U/L (normal range 50-388 U/L), and the lactate dehydrogenase level was 254 U/L (normal range 102-199 U/L). A rapid group A streptococcal (GAS) antigen test was negative. A radiograph of the right femur revealed mildly edematous soft tissue. On ultrasound the right quadriceps appeared mildly edematous, but there was no evidence of abscess or discrete fluid collection (eFigure 1).
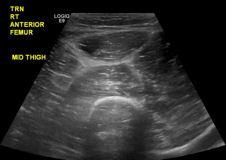
eFigure 1. Ultrasound of the Right Anterior Thigh Ultrasound revealed heterogeneous, mildly edematous quadriceps muscle. There was no abscess or discrete fluid collection. There was trace fluid along the fascia of the quadriceps muscle.
Four liters of normal saline, acetaminophen, ceftriaxone, and doxycycline were administered to the patient. Overnight he was afebrile, tachycardic, and normotensive. The following morning his BP decreased to 81/53 mm Hg. His WBC count was 33,000 cells/mm3 with 96% neutrophils. A peripheral blood smear showed immature granulocytes. The sodium and creatinine increased to 135 mmol/L and 1.3 mg/dL, respectively. The erythrocyte sedimentation rate was 20 mm/h (normal range 0-10 mm/h), and the C-reactive protein level was 174 mg/L (normal range < 6.3 mg/L).The right thigh became erythematous and edematous.
Given concern for necrotizing fasciitis, antibiotics were changed to vancomycin, piperacillin-tazobactam, and clindamycin. The patient was taken to the operating room (OR). The right quadriceps muscle was markedly edematous with overlying necrotic fibrofatty tissue with easy separation of the fascia from the anterolateral rectus femoris and rectus lateralis muscles. Necrotizing fasciitis was diagnosed.
The tissue was debrided, and surgical pathology revealed fibroadipose tissue with extensive necrosis and dense acute inflammation (eFigure 2). After the anterolateral space between the fascia and underlying thigh muscle was drained, a Penrose drain was placed, and the wound was left open with plans for a second-look operation within 24 hours.
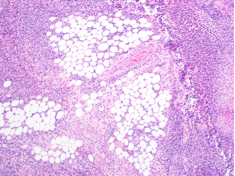
eFigure 2. Surgical Pathology of Debrided Right Thigh
Pathology revealed fibroadipose tissue with extensive necrosis and dense acute inflammation.
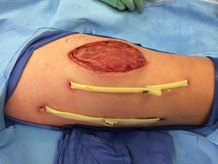
eFigure 3. Right Anterior Thigh
Two Penrose drains inserted after second operation.
In the ensuing hours erythema extended proximal to the operative site. The patient was emergently taken to the OR. The focus of necrotizing fasciitis along the anterolateral aspect of the thigh had extended posteriorly and superiorly. This area was irrigated, all loculations were disrupted, and a second Penrose drain was placed.
The wound was left open for 6 more days. On hospital day 9, operative exploration revealed no necrotizing fasciitis. The fascia and skin wound were then closed (eFigure 3).
Cultures from the fascia grew the GAS bacteria Streptococcus pyogenes (S pyogenes), which was sensitive to penicillin. The blood cultures from admission were sterile. A test for Epstein-Barr virus immunoglobulin M antibody was negative. The patient was discharged after 10 days in the hospital to complete a 2-week course of IV penicillin. Two months later he resumed playing tennis and returned to his clinical duties.
Discussion
In the U.S., there are approximately 3.5 cases of invasive GAS infection per 100,000 persons.1 Type I NSTI is polymicrobial (aerobic and anaerobic organisms). Risk factors include recent surgery, immunocompromised states, drug use, diabetes mellitus, and traumatic wounds.2 Type II NSTI is caused by GAS or other β-hemolytic streptococci either alone or in association with another organism, most commonly Staphylococcus aureus. Type II NSTI is classically found on the extremities and occurs in young, healthy, immunocompetent patients—such as this patient.3
The portal of entry in nearly half of type II NSTI is unknown; minor local trauma is often suspected.4 However, cases have been reported in which the only identifiable source was a preceding sore throat.4 The origin of this patient’s GAS remains unknown, but perhaps his pharyngitis led to transient bacteremia, which then seeded his injured thigh muscle. An in vitro model demonstrated that injured muscles increase surface expression of the cytoskeletal protein vimentin, which binds GAS.5 Exotoxins and endotoxins produced by S pyogenes may lead to microvascular thrombosis, tissue ischemia, liquefactive necrosis, and systemic release of cytokines followed by systemic illness, multiorgan dysfunction, and death.6
The Laboratory Risk Indicator for Necrotizing Fasciitis (LRINEC) score was developed to aid in early diagnosis of NSTI.7 It was derived from a series of 2,555 patients admitted with cellulitis or abscesses at a single institution. Scores > 8 have a positive predictive value of 93% for NSTI. This patient had a LRINEC score of 9. Radiographs or computed tomography scans may demonstrate soft-tissue air collections but lack sensitivity and are often nondiagnostic.8,9 T1-weighted magnetic resonance imaging can delineate the anatomic extent of soft-tissue infections but is time consuming and may delay treatment.10 When the pretest probability is high, proceeding directly to the OR for direct visualization and possible debridement is advisable. Histologic features of necrotizing fasciitis include inflammation with polymorphonuclear cells and necrosis of the subcutaneous fat and fascia with relative sparing of the muscle.11Necrotizing soft-tissue infection requires early surgical debridement and broad-spectrum antibiotic coverage. Without surgical debridement, the mortality rate approaches 100%.2 Antibiotics should include activity against Gram-positive, Gram-negative, and anaerobic organisms. The duration of antibiotic therapy has not been defined and is dependent on the patient’s clinical status. Adjunctive treatment options may include IV immunoglobulin and hyperbaric oxygen therapy, although the data supporting their utility are limited.12,13
Conclusion
Despite the LRINEC scoring systems and advanced imaging, necrotizing fasciitis remains challenging to diagnose in a timely manner. In this case, close monitoring of the patient facilitated timely evaluation and treatment of a fatal disease.
1. O'Loughlin RE, Roberson A, Cieslak PR, et al; Active Bacterial Core Surveillance Team. The epidemiology of invasive group A streptococcal infection and potential vaccine implications: United States, 2000-2004. Clin Infect Dis. 2007;45(7):853-857.
2. Anaya DA, Dellinger EP. Necrotizing soft-tissue infection: diagnosis and management. Clin Infect Dis. 2007;44(5):705-710.
3. Naqvi GA, Malik SA, Jan W. Necrotizing fasciitis of the lower extremity: a case report and current concept of diagnosis and management. Scand J Trauma Resusc Emerg Med. 2009;17:28.
4. Stevens DL. Streptococcal toxic-shock syndrome: spectrum of disease, pathogenesis, and new concepts in treatment. Emerg Infect Dis. 1195;1(3):69-78.
5. Bryant AE, Bayer CR, Huntington JD, Stevens DL. Group A streptococcal myonecrosis: increased vimentin expression after skeletal-muscle injury mediates the binding of Streptococcus pyogenes. J Infect Dis. 2006;193(12):1685-1692.
6. Cainzos M, Gonzalez-Rodriguez FJ. Necrotizing soft tissue infections. Curr Opin Crit Care. 2007;13(4):433-439.
7. Wong CH, Khin LW, Heng KS, Tan KC, Low CO. The LRINEC (Laboratory Risk Indicator for Necrotizing Fasciitis) score: a tool for distinguishing necrotizing fasciitis from other soft tissue infections. Crit Care Med. 2004;32(7):1535-1541.
8. Goh T, Goh LG, Ang CH, Wong CH. Early diagnosis of necrotizing fasciitis. Br J Surg. 2014;101(1):119-125.
9. Lancerotto L, Tocco I, Salmaso R, Vindigni V, Basetto F. Necrotizing fasciitis: classification, diagnosis and management. J Trauma Acute Care Surg. 2012;72(3):560-566.
10. Brothers TE, Tagge DU, Stutley JE, Conway WF, Del Schutte H Jr, Byrne TK. Magnetic resonance imaging differentiates between necrotizing and non-necrotizing fasciitis of the lower extremity. J Am Coll Surg. 1998;187(4):416-421.
11. Bakleh M, Wold LE, Mandrekar JN, Harmsen WS, Dimashkieh HH, Baddour LM. Correlation of histopathologic findings with clinical outcome in necrotizing fasciitis. Clin Infect Dis. 2005;40(3):410-414.
12. Barry W, Hudgins L, Donta ST, Pesanti EL. Intravenous immunoglobulin therapy for toxic shock syndrome. JAMA. 1992;267(24):3315-3316.
13. Wilkinson D, Doolette D. Hyperbaric oxygen treatment and survival from necrotizing soft tissue infection. Arch Surg. 2004;139(12):1339-1345.
Necrotizing soft-tissue infection (NSTI) often is difficult to distinguish from a superficial soft-tissue infection like cellulitis. Both conditions present with pain, edema, and erythema and can be accompanied by fever and malaise. The diagnosis of NSTI must be made quickly because successful treatment requires early surgical debridement and broad-spectrum antibiotics. The following case demonstrates the challenge of diagnosing NSTI.
Case Presentation
A 50-year-old physician developed a sore throat with subjective fevers, night sweats, and chills. After 2 days, his symptoms resolved. The next day he developed right thigh pain while playing tennis and limped off the court. That night he had fevers, chills, and sweats. For the next 3 days, his right thigh pain persisted with waxing and waning fevers.
The patient’s medical history included gastroesophageal reflux disease, vitamin D deficiency, and a positive purified protein derivative test for which he had completed 1 year of isoniazid therapy. The patient was married and in a monogamous relationship with his wife. He had traveled to the Sierra National Forest and Yosemite Park during the preceding winter. He did not swim in a lake or recall a tick bite. He had not consumed raw food, imported meats, or dairy products. He recently started oral fluconazole for tinea corporis.
The patient’s temperature was 39.5°C, heart rate was 115 beats per minute, blood pressure (BP) was 142/88 mm Hg, and respiratory rate was 18 breaths per minute with an oxygen saturation of 95% while breathing ambient air. He was drenched in sweat yet remained comfortable throughout the interview. The oropharyngeal mucosa was moist without lesions or erythema. There was no rash or lymphadenopathy. The lungs were clear to auscultation. The cardiac exam revealed tachycardia. There was point tenderness to deep palpation of the mid-anterior right thigh without crepitus, erythema, or edema.
The patient’s sodium level was 129 mmol/L (normal range 135-145 mmol/L), bicarbonate was 20 mmol/L (normal range 22-32 mmol/L), creatinine was 1.1 mg/dL (normal range 0.7-1.2 mg/dL), and glucose was 194 mg/dL. The white blood cell count (WBC) was 12,900 cells/mm3 (normal range 3,400-10,000 cells/mm3) with 96% neutrophils. The hematocrit was 41% (normal range 41-53%), and the platelet count was 347,000 cells/mm3 (normal range 140,000-450,000 cells/mm3). The lactate level was 2.2 mmol/L (normal range 0-2 mmol/L). The creatine kinase level was 347 U/L (normal range 50-388 U/L), and the lactate dehydrogenase level was 254 U/L (normal range 102-199 U/L). A rapid group A streptococcal (GAS) antigen test was negative. A radiograph of the right femur revealed mildly edematous soft tissue. On ultrasound the right quadriceps appeared mildly edematous, but there was no evidence of abscess or discrete fluid collection (eFigure 1).
eFigure 1. Ultrasound of the Right Anterior Thigh Ultrasound revealed heterogeneous, mildly edematous quadriceps muscle. There was no abscess or discrete fluid collection. There was trace fluid along the fascia of the quadriceps muscle.
Four liters of normal saline, acetaminophen, ceftriaxone, and doxycycline were administered to the patient. Overnight he was afebrile, tachycardic, and normotensive. The following morning his BP decreased to 81/53 mm Hg. His WBC count was 33,000 cells/mm3 with 96% neutrophils. A peripheral blood smear showed immature granulocytes. The sodium and creatinine increased to 135 mmol/L and 1.3 mg/dL, respectively. The erythrocyte sedimentation rate was 20 mm/h (normal range 0-10 mm/h), and the C-reactive protein level was 174 mg/L (normal range < 6.3 mg/L).The right thigh became erythematous and edematous.
Given concern for necrotizing fasciitis, antibiotics were changed to vancomycin, piperacillin-tazobactam, and clindamycin. The patient was taken to the operating room (OR). The right quadriceps muscle was markedly edematous with overlying necrotic fibrofatty tissue with easy separation of the fascia from the anterolateral rectus femoris and rectus lateralis muscles. Necrotizing fasciitis was diagnosed.
The tissue was debrided, and surgical pathology revealed fibroadipose tissue with extensive necrosis and dense acute inflammation (eFigure 2). After the anterolateral space between the fascia and underlying thigh muscle was drained, a Penrose drain was placed, and the wound was left open with plans for a second-look operation within 24 hours.
eFigure 2. Surgical Pathology of Debrided Right Thigh
Pathology revealed fibroadipose tissue with extensive necrosis and dense acute inflammation.
eFigure 3. Right Anterior Thigh
Two Penrose drains inserted after second operation.
In the ensuing hours erythema extended proximal to the operative site. The patient was emergently taken to the OR. The focus of necrotizing fasciitis along the anterolateral aspect of the thigh had extended posteriorly and superiorly. This area was irrigated, all loculations were disrupted, and a second Penrose drain was placed.
The wound was left open for 6 more days. On hospital day 9, operative exploration revealed no necrotizing fasciitis. The fascia and skin wound were then closed (eFigure 3).
Cultures from the fascia grew the GAS bacteria Streptococcus pyogenes (S pyogenes), which was sensitive to penicillin. The blood cultures from admission were sterile. A test for Epstein-Barr virus immunoglobulin M antibody was negative. The patient was discharged after 10 days in the hospital to complete a 2-week course of IV penicillin. Two months later he resumed playing tennis and returned to his clinical duties.
Discussion
In the U.S., there are approximately 3.5 cases of invasive GAS infection per 100,000 persons.1 Type I NSTI is polymicrobial (aerobic and anaerobic organisms). Risk factors include recent surgery, immunocompromised states, drug use, diabetes mellitus, and traumatic wounds.2 Type II NSTI is caused by GAS or other β-hemolytic streptococci either alone or in association with another organism, most commonly Staphylococcus aureus. Type II NSTI is classically found on the extremities and occurs in young, healthy, immunocompetent patients—such as this patient.3
The portal of entry in nearly half of type II NSTI is unknown; minor local trauma is often suspected.4 However, cases have been reported in which the only identifiable source was a preceding sore throat.4 The origin of this patient’s GAS remains unknown, but perhaps his pharyngitis led to transient bacteremia, which then seeded his injured thigh muscle. An in vitro model demonstrated that injured muscles increase surface expression of the cytoskeletal protein vimentin, which binds GAS.5 Exotoxins and endotoxins produced by S pyogenes may lead to microvascular thrombosis, tissue ischemia, liquefactive necrosis, and systemic release of cytokines followed by systemic illness, multiorgan dysfunction, and death.6
The Laboratory Risk Indicator for Necrotizing Fasciitis (LRINEC) score was developed to aid in early diagnosis of NSTI.7 It was derived from a series of 2,555 patients admitted with cellulitis or abscesses at a single institution. Scores > 8 have a positive predictive value of 93% for NSTI. This patient had a LRINEC score of 9. Radiographs or computed tomography scans may demonstrate soft-tissue air collections but lack sensitivity and are often nondiagnostic.8,9 T1-weighted magnetic resonance imaging can delineate the anatomic extent of soft-tissue infections but is time consuming and may delay treatment.10 When the pretest probability is high, proceeding directly to the OR for direct visualization and possible debridement is advisable. Histologic features of necrotizing fasciitis include inflammation with polymorphonuclear cells and necrosis of the subcutaneous fat and fascia with relative sparing of the muscle.11Necrotizing soft-tissue infection requires early surgical debridement and broad-spectrum antibiotic coverage. Without surgical debridement, the mortality rate approaches 100%.2 Antibiotics should include activity against Gram-positive, Gram-negative, and anaerobic organisms. The duration of antibiotic therapy has not been defined and is dependent on the patient’s clinical status. Adjunctive treatment options may include IV immunoglobulin and hyperbaric oxygen therapy, although the data supporting their utility are limited.12,13
Conclusion
Despite the LRINEC scoring systems and advanced imaging, necrotizing fasciitis remains challenging to diagnose in a timely manner. In this case, close monitoring of the patient facilitated timely evaluation and treatment of a fatal disease.
1. O'Loughlin RE, Roberson A, Cieslak PR, et al; Active Bacterial Core Surveillance Team. The epidemiology of invasive group A streptococcal infection and potential vaccine implications: United States, 2000-2004. Clin Infect Dis. 2007;45(7):853-857.
2. Anaya DA, Dellinger EP. Necrotizing soft-tissue infection: diagnosis and management. Clin Infect Dis. 2007;44(5):705-710.
3. Naqvi GA, Malik SA, Jan W. Necrotizing fasciitis of the lower extremity: a case report and current concept of diagnosis and management. Scand J Trauma Resusc Emerg Med. 2009;17:28.
4. Stevens DL. Streptococcal toxic-shock syndrome: spectrum of disease, pathogenesis, and new concepts in treatment. Emerg Infect Dis. 1195;1(3):69-78.
5. Bryant AE, Bayer CR, Huntington JD, Stevens DL. Group A streptococcal myonecrosis: increased vimentin expression after skeletal-muscle injury mediates the binding of Streptococcus pyogenes. J Infect Dis. 2006;193(12):1685-1692.
6. Cainzos M, Gonzalez-Rodriguez FJ. Necrotizing soft tissue infections. Curr Opin Crit Care. 2007;13(4):433-439.
7. Wong CH, Khin LW, Heng KS, Tan KC, Low CO. The LRINEC (Laboratory Risk Indicator for Necrotizing Fasciitis) score: a tool for distinguishing necrotizing fasciitis from other soft tissue infections. Crit Care Med. 2004;32(7):1535-1541.
8. Goh T, Goh LG, Ang CH, Wong CH. Early diagnosis of necrotizing fasciitis. Br J Surg. 2014;101(1):119-125.
9. Lancerotto L, Tocco I, Salmaso R, Vindigni V, Basetto F. Necrotizing fasciitis: classification, diagnosis and management. J Trauma Acute Care Surg. 2012;72(3):560-566.
10. Brothers TE, Tagge DU, Stutley JE, Conway WF, Del Schutte H Jr, Byrne TK. Magnetic resonance imaging differentiates between necrotizing and non-necrotizing fasciitis of the lower extremity. J Am Coll Surg. 1998;187(4):416-421.
11. Bakleh M, Wold LE, Mandrekar JN, Harmsen WS, Dimashkieh HH, Baddour LM. Correlation of histopathologic findings with clinical outcome in necrotizing fasciitis. Clin Infect Dis. 2005;40(3):410-414.
12. Barry W, Hudgins L, Donta ST, Pesanti EL. Intravenous immunoglobulin therapy for toxic shock syndrome. JAMA. 1992;267(24):3315-3316.
13. Wilkinson D, Doolette D. Hyperbaric oxygen treatment and survival from necrotizing soft tissue infection. Arch Surg. 2004;139(12):1339-1345.