User login
Use of RUS in the Evaluation of AKI
According to the American College of Radiology Appropriateness Criteria, renal ultrasound (RUS) is the most appropriate imaging examination for evaluating patients with acute kidney injury (AKI), with a rating score of 9, representing the strongest level of recommendation.[1, 2] However, recent studies suggest that RUS may be performed in patients with certain risk factors for ureteral obstruction,[1] which would lead to important reductions in the use of medical imaging. Licurse developed a risk stratification framework to help clinicians identify patients in whom RUS was most likely to be beneficial.[2] The model was built based on clinical predictors that included race, recent exposure to inpatient nephrotoxic medications, history of hydronephrosis, recurrent urinary tract infections, benign prostatic hyperplasia, abdominal or pelvic cancer, neurogenic bladder, single functional kidney, previous pelvic surgery, congestive heart failure, and prerenal AKI. It was found, using a cross‐sectional study design that included derivation and validation samples, that a low‐risk population could be identified based on demographic and clinical risk factors; in this population, the prevalence of hydronephrosis, as well as the rate of hydronephrosis requiring an intervention, was only <1%.
However, due to several study limitations, including that it was performed at a single center,[3] the stratification prediction rule has yet to be adopted broadly. Although at least 1 other study has similarly found that RUS may not be efficacious in patients with no suggestive history and with other more likely causes for renal failure,[1] to the best of our knowledge, no large, external, prospective trial to validate the selective use of RUS in patients with AKI has been reported. Therefore, the aim of this study was to evaluate the accuracy and usefulness of the Licurse renal ultrasonography risk stratification model for hospitalized patients with AKI.
METHODS
Study Setting
The study site was a 793‐bed academic, quaternary care, adult hospital with an affiliated cancer center. The requirement to obtain informed consent was waived by the institutional review board for this Health Insurance Portability and Accountability Actcompliant, prospective cohort study.
Study Population
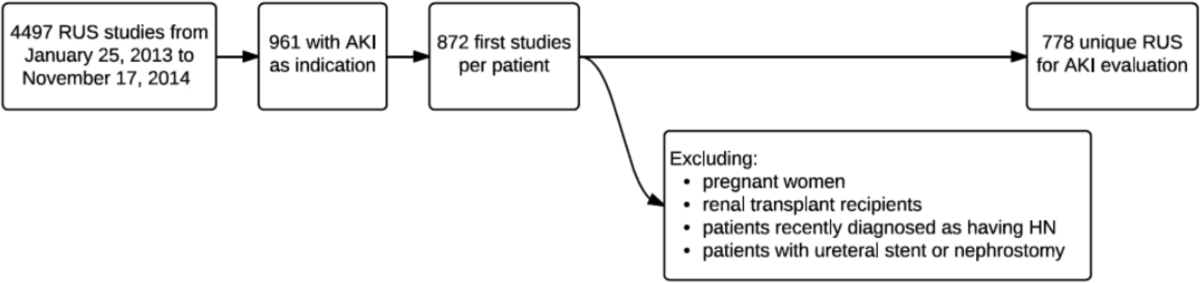
The study cohort included all adult hospitalized patients who underwent an RUS for the indication of AKI over a 23‐month study period, from January 2013 to November 2014. AKI was defined as having a peak rise in serum creatinine level of at least 0.3 mg/dL from baseline, based on data within the electronic health record (EHR). To ensure that the imaging study was not ordered for the purpose of follow‐up or other reasons, patients who were renal transplant recipients, those who had ureteral stent or nephrostomy in place, patients who were recently diagnosed with hydronephrosis on prior imaging, and women who were pregnant were excluded based on retrospective chart review. In patients with multiple renal ultrasounds during the study period, only the first examination was considered.
Data Collection
We collected patient demographics in the study cohort from the EHR. Imaging data were identified using the radiology information system and computerized physician order entry (CPOE) system. For each eligible patient, we collected relevant clinical attributes including: (1) race, (2) history of hydronephrosis, (3) history of recurrent urinary tract infections, (4) history of benign prostatic hyperplasia, (5) history of abdominal or pelvic cancer, (6) history of neurogenic bladder, (7) history of single functional kidney, (8) history of previous pelvic surgery, (9) recent exposure to inpatient nephrotoxic medications, (10) history of congestive heart failure, and (11) history of prerenal AKI. Information was collected from ordering clinicians at the time of imaging order entry using a computerized data capture tool integrated with the CPOE system. The data capture screen is shown in Supporting Figure 1 in the online version of this article. To validate the accuracy and completeness of this data entry, we manually reviewed objective clinical data from a random sample of 80 medical records for 480 clinical attributes. This number was selected based on a calculation of 80% power, 0.05 , and a 0.1 proportion difference.
Patients received +1 point for the presence/absence of each clinical attribute. The sum of points was used to classify the patient's pretest probability of AKI as low (<2), medium (3), or high (>3). Both ordering and interpreting clinicians were blinded to the patient's prediction score.
Each RUS report was manually classified (by an internal medicine attending physician and a radiology trainee) as positive or negative for hydronephrosis, defined as any dilatation of the renal pelvis or the calyces. Subsequent use of urologic intervention was determined by full chart review of the sonographic positive cases. We defined these urologic interventions to include stent placement and nephrostomy tube placement. Only interventions performed during the same hospitalization as the index ultrasound were counted.
Outcomes
Our primary outcome was hydronephrosis (HN) diagnosed on ultrasound. Secondary outcome was hydronephrosis resulting in intervention (HNRI), defined as the need for urologic interventions of stent placement or nephrostomy tube placement.
Statistical Analysis
Analyses were performed using Microsoft Excel 2003 (Microsoft Corp., Redmond, WA) and JMP 10 (SAS Institute, Cary, NC). We used 2 to assess for differences in the rates of HN and HNRI across the 3 pretest probability risk groups. Sensitivity, specificity, negative predictive value, efficiency, and the number needed to screen to find 1 case of HN or HNRI for each risk group were calculated. The high and medium risk groups were merged for the purpose of calculating sensitivity and specificity. Efficiency was defined as the percentage of ultrasounds that could have been avoided based on applying the risk stratification model. We additionally performed a sensitivity analysis to evaluate how different cutoff thresholds for classifying low risk patients would affect the accuracy of the Licurse model. A 2‐tailed P value of <0.05 was defined as statistically significant.
RESULTS
During the 23‐month study period, a total of 961 RUS studies were completed for inpatients with AKI; 778 unique studies met our inclusion criteria (Figure 1).

Based on the manual review of objective clinical data from the random sample of 80 medical records for 480 clinical attributes, overall, there was 90.2% (433/480) concordance rate between the structured data entry and that captured in free text in the clinical notes. There were some variations in the concordance rates for each clinical attribute, ranging from 78.8% (63/80) for exposure to nephrotoxic drugs to 95% for history of congestive heart failure.
On univariate analysis, patients with past medical history of hydronephrosis had a 5‐fold higher likelihood of developing a recurrence of hydronephrosis (45.9% [50/109] vs 8.4% [56/669], P < 0.001). Similarly, they also had a 9.5‐fold higher likelihood of requiring urologic interventions related to the hydronephrosis (12.8% [14/109] vs 1.4% [9/669], P < 0.001). Having diagnoses predisposing the patient for urinary obstruction (benign prostate hyperplasia, abdominal/pelvic cancer, neurogenic bladder, single functional kidney, and history of pelvic surgery) was correlated with the likelihood of both hydronephrosis and the need for urologic intervention. Of the patients with a diagnosis predisposing the patient for urinary obstructions, 22.1% (59/267) had hydronephrosis on imaging, whereas 9.2% (47/511) of patients without such a diagnosis had hydronephrosis (P < 0.001).
Conversely, having a recent exposure to nephrotoxic medications was negatively correlated with the likelihood of both hydronephrosis and the need for urologic intervention. Of the patients with recent exposure to nephrotoxic medications, 7.1% (20/280) had hydronephrosis on imaging, whereas the prevalence of hydronephrosis was 17.3% (86/498) in patients without such an exposure (P < 0.001) (Table 1).
| Patient Characteristic | With HN, n = 106 | Without HN, n = 672 | P Value |
|---|---|---|---|
| |||
| Demographics | |||
| Age, y, mean SD | 60.5 17.1 | 64.1 16.0 | 0.035* |
| Nonblack | 97 (91.5) | 573 (85.3) | 0.084 |
| Male | 59 (55.7) | 368 (54.8) | 0.863 |
| Past medical history | |||
| Hydronephrosis | 50 (47.2) | 59 (8.8) | <0.001* |
| Recurrent urinary tract infections | 22 (20.75) | 101 (15.0) | 0.133 |
| Congestive heart failure | 9 (5.5) | 155 (23.1) | <0.001* |
| Prerenal status | 36 (34.0) | 272 (40.5) | 0.203 |
| Exposure to nephrotoxic medication | 20 (18.9) | 260 (38.7) | <0.001* |
| Diagnosis consistent with obstruction | 59 (22.1) | 208 (31.0) | <0.001* |
| Benign prostate hyperplasia | 9 (8.5) | 63 (9.4) | 0.770 |
| Abdominal or pelvic cancer | 42 (39.6) | 97 (14.4) | <0.001* |
| Neurogenic bladder | 5 (4.7) | 12 (1.8) | 0.055 |
| Single functional kidney | 6 (18.8) | 26 (81.3) | 0.388 |
| Pelvic surgery | 14 (13.2) | 61 (9.1) | 0.181 |
Adjusted for other covariates, the multiple variable model showed that a diagnosis predisposing patients for obstruction (odds ratio [OR]: 2.0, P = 0.004), history of hydronephrosis (OR: 7.4, P < 0.001), absence of a history of congestive heart failure (OR: 2.7, P = 0.009), and lack of exposure to nephrotoxic medications (OR: 1.9, P = 0.022) were statistically significant predictors for hydronephrosis (Table 2).
| Patient Characteristic | Adjusted Odds Ratio (95% Confidence Interval) | P Value |
|---|---|---|
| ||
| Race | ||
| Nonblack (reference = black) | 1.4 (0.73.1) | 0.414 |
| History of recurrent urinary tract infections | ||
| Yes (reference = no) | 0.75 (0.41.3) | 0.346 |
| Diagnosis consistent with possible obstruction* | ||
| Yes (reference = no) | 2.0 (1.23.1) | 0.004 |
| History of HN | ||
| Yes (reference = no) | 7.4 (4.512.3) | <0.001 |
| History of CHF | ||
| No (reference = yes) | 2.7 (1.36.1) | 0.009 |
| History of prerenal AKI, use of pressors, or sepsis | ||
| No (reference = 1) | 1.0 (0.61.7) | 0.846 |
| Exposure to nephrotoxic medications prior to AKI | ||
| No (reference = yes) | 1.9 (1.13.3) | 0.022 |
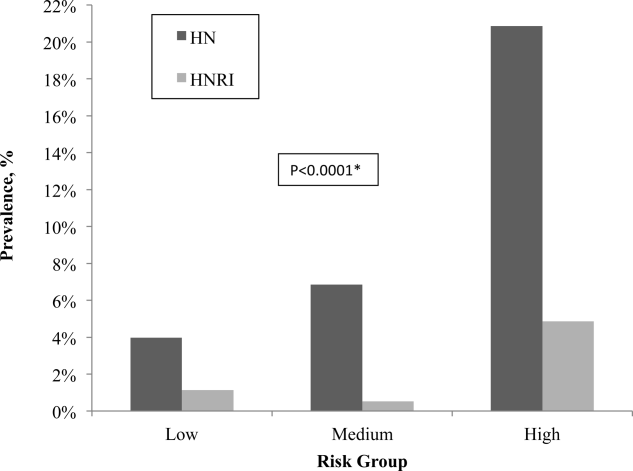
After applying the Licurse renal ultrasonography risk stratification model, 176 (22.6%), 190 (24.4%), and 412 (53.0%) patients were classified as low risk, medium risk, and high risk for hydronephrosis, respectively. The incidence rates for hydronephrosis in the pretest probability risk groups were 4.0%, 6.8%, and 20.9% for low‐, medium‐, and high‐risk patients, respectively (P < 0.0001). The rates for urologic interventions were 1.1%, 0.5%, and 4.9% in the risk groups from low to high (P < 0.0001) (Figure 2).
Overall, the Licurse model, using a cutoff between low‐risk and medium/high‐risk patients, had sensitivity of 91.3% (95% confidence interval [CI]: 73.2%‐97.6%) for HNRI and 93.4% (95% CI: 87.0%‐96.8%) for presence of HN. Specificity was low for both HNRI (23.0% [95% CI: 20.2%‐26.2%]) and HN (25.1% [95% CI: 22.0%‐28.6%]). The estimated potential reduction in renal ultrasound for hospitalized patients with AKI, defined as the rate of imaging performed in the low‐risk group, was 22.6%. In the low‐risk group, the number needed to screen to find 1 case of HN was 25, and to find 1 case of HNRI it was 88. The negative predictive value for hydronephrosis was 96.0% (95% CI: 92.0%‐98.1%) and 98.9% for HNRI (95% CI: 96.0%‐99.7%) (Table 3).
| Our External Validation Set | Licurse Internal Validation Set | |||
|---|---|---|---|---|
| HN an Outcome | With HN | Without HN | With HN | Without HN |
| ||||
| Low risk, no. of patients* | 7 | 169 | 7 | 216 |
| Medium/high risk, no. of patients | 99 | 503 | 78 | 496 |
| Test performance, % (95% CI) | ||||
| Sensitivity | 93.4 (87.096.8) | 91.8 (89.993.7) | ||
| Specificity | 25.1 (22.028.6) | 30.3 (27.233.5) | ||
| Negative predictive value | 96.0 (92.098.1) | 96.9 (95.798.1) | ||
| HNRI an outcome | ||||
| Low risk, no. of patients | 2 | 174 | 1 | 222 |
| Medium/high risk, no. of patients | 21 | 581 | 26 | 548 |
| Test performance, % (95% CI) | ||||
| Sensitivity | 91.3 (73.297.6) | 96.3 (94.997.6) | ||
| Specificity | 23.0 (20.226.2) | 28.8 (25.732.0) | ||
| Negative predictive value | 98.9 (96.099.7) | 99.6 (99.1100.0) | ||
Supporting Table 1, in the online version of this article, shows a sensitivity analysis using different cutoff thresholds in the Licurse model for classifying low‐risk patients. A lower threshold cutoff (ie, a cutoff of <1) significantly increases the sensitivity (98.1% [95% CI: 93.4%‐99.5%] for HN; 100% [95% CI: 85.7%‐100%]) for HNRI, but at the cost of a lower specificity (7.6% [95% CI: 5.8%‐9.8%] for HN and 7.0% [95% CI: 5.4%‐9.1%] for HNRI). The estimated potential reduction in renal ultrasound for hospitalized patients with AKI would be 6.0%, the number needed to screen to find 1 case of HN would be 26, and 1 case of HNRI would be infinity.
DISCUSSION
In this prospective observational study, we found that the Licurse risk stratification model, using a cutoff between low‐ risk and medium/high‐risk patients, had 91.3% (95% CI: 73.2%‐97.6%) sensitivity for predicting patients who would require urologic intervention and 93.4% (95% CI: 87.0%‐96.8%) sensitivity for identifying patients with hydronephrosis. These findings were comparable to those found in the original validation cohort of the model, which showed sensitivity rates of 96.3% and 91.8%, respectively.[2] The negative predictive value for hydronephrosis and HNRI were sufficiently high, at 96.0% (95% CI: 92.0‐98.1) and 98.9% (95% CI: 96.0‐99.7), respectively.
Our results suggest that the Licurse model may be sufficient to rule out HN in the inpatient setting at our institution. The slight differences between the findings of our and the original studies may be due to differences in data extraction methodologies. In the original study, all data were retrospectively abstracted from medical records (discharge summaries and clinical notes) by 4 trained reviewers. However, such methodology is dependent on the quality of unstructured EHR data, which as noted in previous research, can be highly variable. Hogan and Wagner found that the correctness of EHR data can range from 44% to 100% and completeness from 1.1% to 100%, depending on the clinical concepts being studied.[4] Similarly, Thiru et al. found that the sensitivity of different types of EHR data ranged from 0.25 to 1.0.[5] Medical chart review can be labor intensive and time consuming. The lack of standardized methods for structured data capture has been a major limitation in decreasing research costs and speeding the rate of new medical discoveries through the secondary use of EHR data. By modifying our institutional clinical decision support (CDS) system to enable the necessary granular clinical data collection, we were able to obviate the need for resource intensive retrospective chart reviews. To our knowledge, this is the second example of a CDS tool specifically designed for capture of discrete data to validate a decision rule.[6] A similar process may also be useful to accelerate generation of new decision rules. With secondary use of EHR data becoming an increasingly important topic,[7] CDS may serve as an alternative method in the context of data reuse for clinical research. Based on a randomly selected chart review, it was noted that clinicians, overall, do try to communicate to the interpreting radiologists the clinical picture as accurately as they can, and rarely do providers drop their orders due to data entry.
Despite our data confirming Licurse's initial findings, it is important to note that as with any clinical prediction rules, there is a trade‐off between cost savings and potential missed diagnoses. Even the most accepted clinical decision rules, such as the Well's criteria for pulmonary embolism and deep vein thrombosis, has their inherent acceptable rates of false negative. What is considered to be acceptable may differ among providers and patients. Thus, a shared decision‐making model, in which the patient and provider actively engage in sharing of information regarding risks and benefits of both performing and bypassing the diagnostic testing, is preferred. For providers/patients who are more risk‐adverse, one could consider using a more sensitive cutoff (for example, using the <1 threshold), essentially increasing the sensitivity from 91.3% to 100% for HNRI and from 93.4% to 98.1% for HN.
Although one would not want to miss a hydronephrosis in a patient, a too aggressive imaging strategy is not without economic and downstream risks. At an estimated cost of $200 per renal ultrasonography,[2] a 22.6% reduction would result in an annual savings of nearly $20,000 at our institution. The financial costs of forgoing ultrasound studies at the risk of missing 1 case of HN or 1 case of HNRI would be $5000 and $17,600, respectively.
Data‐driven decision rules are becoming more commonly used in the current environment of increased emphasis on evidence‐based medicine.[8, 9, 10, 11, 12, 13] When applied appropriately, such prediction models can result in more efficient use of medical imaging while increasing value of care.[14, 15] However, prior to implementation in clinical practice, these models need to be externally validated across multiple institutions and in various practice settings. This is the largest study of which we are aware to validate the utility of a prediction model for AKI in the inpatient setting. Although we did find slightly smaller differences in hydronephrosis in inpatients across the low, moderate, and high pretest probability groups, this may be explained by the differences in methodology.
Our study has several limitations. First, it was performed at a single academic medical center, a similar setting as that of the original work. Thus, the generalizability of our findings in other settings is unclear. Second, it is possible that our ordering providers did not thoroughly and accurately enter data into the structured CPOE form. However, we randomly selected a sample for chart review and found 90% concordance between data captured and those in the EHR. Due to selection of our cohort that included only patients with AKI who underwent RUS, it is possible that some patients who were not imaged or imaged with other cross‐sectional modalities were excluded, resulting in differential test ordering bias. Finally, we did not include the potential benefits of RUS in affecting nonsurgical interventions of hydronephrosis (eg, Foley catheter insertion).
CONCLUSION
We found that the Licurse renal ultrasonography risk stratification model was sufficiently accurate in classifying patients at risk for ureteral obstruction among hospitalized patients with AKI.
Acknowledgements
The authors thank Laura E. Peterson, BSN, SM, for her assistance in editing this manuscript.
- , , , , . Renal sonography: can it be used more selectively in the setting of an elevated serum creatinine level? Am J Kidney Dis. 1997;29(3):362–367.
- . Renal ultrasonography in the evaluation of acute kidney injury: developing a Risk stratification framework. Arch Intern Med. 2010;170(21):1900.
- , . Curbing the use of ultrasonography in the diagnosis of acute kidney injury: Penny wise or pound foolish?: comment on “Renal ultrasonography in the evaluation of acute kidney injury.” Arch Intern Med. 2010;170(21):1907–1908.
- , . Accuracy of data in computer‐based patient records. J Am Med Inform Assoc 1997;4(5):342–355.
- , , . Systematic review of scope and quality of electronic patient record data in primary care. BMJ. 2003;326(7398):1070.
- , , , , , . Performance of Wells score for deep vein thrombosis in the inpatient setting. JAMA Intern Med. 2015;175(7):1112–1117.
- , , , , . Public preferences about secondary uses of electronic health information. JAMA Intern Med. 2013;173(19):1798–1806.
- , , , et al. The Canadian CT Head Rule for patients with minor head injury. Lancet. 2001;357(9266):1391–1396.
- , , , et al. Value of assessment of pretest probability of deep‐vein thrombosis in clinical management. Lancet. 1997;350(9094):1795–1798.
- , , , , , . Derivation of the children's head injury algorithm for the prediction of important clinical events decision rule for head injury in children. Arch Dis Child. 2006;91(11):885–891.
- , , , et al. Clinical decision rules to rule out subarachnoid hemorrhage for acute headache. JAMA. 2013;310(12):1248–1255.
- , , , et al. Excluding pulmonary embolism at the bedside without diagnostic imaging: management of patients with suspected pulmonary embolism presenting to the emergency department by using a simple clinical model and d‐dimer. Ann Intern Med. 2001;135(2):98–107.
- , , , et al. Implementation of the Ottawa knee rule for the use of radiography in acute knee injuries. JAMA. 1997;278(23):2075–2079.
- , , , et al. Impact of provider‐led, technology‐enabled radiology management program on imaging. Am J Med. 2013;126(8):687–692.
- , , , et al. Effect of computerized clinical decision support on the use and yield of CT pulmonary angiography in the emergency department. Radiology. 2012;262(2):468–474.
According to the American College of Radiology Appropriateness Criteria, renal ultrasound (RUS) is the most appropriate imaging examination for evaluating patients with acute kidney injury (AKI), with a rating score of 9, representing the strongest level of recommendation.[1, 2] However, recent studies suggest that RUS may be performed in patients with certain risk factors for ureteral obstruction,[1] which would lead to important reductions in the use of medical imaging. Licurse developed a risk stratification framework to help clinicians identify patients in whom RUS was most likely to be beneficial.[2] The model was built based on clinical predictors that included race, recent exposure to inpatient nephrotoxic medications, history of hydronephrosis, recurrent urinary tract infections, benign prostatic hyperplasia, abdominal or pelvic cancer, neurogenic bladder, single functional kidney, previous pelvic surgery, congestive heart failure, and prerenal AKI. It was found, using a cross‐sectional study design that included derivation and validation samples, that a low‐risk population could be identified based on demographic and clinical risk factors; in this population, the prevalence of hydronephrosis, as well as the rate of hydronephrosis requiring an intervention, was only <1%.
However, due to several study limitations, including that it was performed at a single center,[3] the stratification prediction rule has yet to be adopted broadly. Although at least 1 other study has similarly found that RUS may not be efficacious in patients with no suggestive history and with other more likely causes for renal failure,[1] to the best of our knowledge, no large, external, prospective trial to validate the selective use of RUS in patients with AKI has been reported. Therefore, the aim of this study was to evaluate the accuracy and usefulness of the Licurse renal ultrasonography risk stratification model for hospitalized patients with AKI.
METHODS
Study Setting
The study site was a 793‐bed academic, quaternary care, adult hospital with an affiliated cancer center. The requirement to obtain informed consent was waived by the institutional review board for this Health Insurance Portability and Accountability Actcompliant, prospective cohort study.
Study Population
The study cohort included all adult hospitalized patients who underwent an RUS for the indication of AKI over a 23‐month study period, from January 2013 to November 2014. AKI was defined as having a peak rise in serum creatinine level of at least 0.3 mg/dL from baseline, based on data within the electronic health record (EHR). To ensure that the imaging study was not ordered for the purpose of follow‐up or other reasons, patients who were renal transplant recipients, those who had ureteral stent or nephrostomy in place, patients who were recently diagnosed with hydronephrosis on prior imaging, and women who were pregnant were excluded based on retrospective chart review. In patients with multiple renal ultrasounds during the study period, only the first examination was considered.
Data Collection
We collected patient demographics in the study cohort from the EHR. Imaging data were identified using the radiology information system and computerized physician order entry (CPOE) system. For each eligible patient, we collected relevant clinical attributes including: (1) race, (2) history of hydronephrosis, (3) history of recurrent urinary tract infections, (4) history of benign prostatic hyperplasia, (5) history of abdominal or pelvic cancer, (6) history of neurogenic bladder, (7) history of single functional kidney, (8) history of previous pelvic surgery, (9) recent exposure to inpatient nephrotoxic medications, (10) history of congestive heart failure, and (11) history of prerenal AKI. Information was collected from ordering clinicians at the time of imaging order entry using a computerized data capture tool integrated with the CPOE system. The data capture screen is shown in Supporting Figure 1 in the online version of this article. To validate the accuracy and completeness of this data entry, we manually reviewed objective clinical data from a random sample of 80 medical records for 480 clinical attributes. This number was selected based on a calculation of 80% power, 0.05 , and a 0.1 proportion difference.
Patients received +1 point for the presence/absence of each clinical attribute. The sum of points was used to classify the patient's pretest probability of AKI as low (<2), medium (3), or high (>3). Both ordering and interpreting clinicians were blinded to the patient's prediction score.
Each RUS report was manually classified (by an internal medicine attending physician and a radiology trainee) as positive or negative for hydronephrosis, defined as any dilatation of the renal pelvis or the calyces. Subsequent use of urologic intervention was determined by full chart review of the sonographic positive cases. We defined these urologic interventions to include stent placement and nephrostomy tube placement. Only interventions performed during the same hospitalization as the index ultrasound were counted.
Outcomes
Our primary outcome was hydronephrosis (HN) diagnosed on ultrasound. Secondary outcome was hydronephrosis resulting in intervention (HNRI), defined as the need for urologic interventions of stent placement or nephrostomy tube placement.
Statistical Analysis
Analyses were performed using Microsoft Excel 2003 (Microsoft Corp., Redmond, WA) and JMP 10 (SAS Institute, Cary, NC). We used 2 to assess for differences in the rates of HN and HNRI across the 3 pretest probability risk groups. Sensitivity, specificity, negative predictive value, efficiency, and the number needed to screen to find 1 case of HN or HNRI for each risk group were calculated. The high and medium risk groups were merged for the purpose of calculating sensitivity and specificity. Efficiency was defined as the percentage of ultrasounds that could have been avoided based on applying the risk stratification model. We additionally performed a sensitivity analysis to evaluate how different cutoff thresholds for classifying low risk patients would affect the accuracy of the Licurse model. A 2‐tailed P value of <0.05 was defined as statistically significant.
RESULTS
During the 23‐month study period, a total of 961 RUS studies were completed for inpatients with AKI; 778 unique studies met our inclusion criteria (Figure 1).
Based on the manual review of objective clinical data from the random sample of 80 medical records for 480 clinical attributes, overall, there was 90.2% (433/480) concordance rate between the structured data entry and that captured in free text in the clinical notes. There were some variations in the concordance rates for each clinical attribute, ranging from 78.8% (63/80) for exposure to nephrotoxic drugs to 95% for history of congestive heart failure.
On univariate analysis, patients with past medical history of hydronephrosis had a 5‐fold higher likelihood of developing a recurrence of hydronephrosis (45.9% [50/109] vs 8.4% [56/669], P < 0.001). Similarly, they also had a 9.5‐fold higher likelihood of requiring urologic interventions related to the hydronephrosis (12.8% [14/109] vs 1.4% [9/669], P < 0.001). Having diagnoses predisposing the patient for urinary obstruction (benign prostate hyperplasia, abdominal/pelvic cancer, neurogenic bladder, single functional kidney, and history of pelvic surgery) was correlated with the likelihood of both hydronephrosis and the need for urologic intervention. Of the patients with a diagnosis predisposing the patient for urinary obstructions, 22.1% (59/267) had hydronephrosis on imaging, whereas 9.2% (47/511) of patients without such a diagnosis had hydronephrosis (P < 0.001).
Conversely, having a recent exposure to nephrotoxic medications was negatively correlated with the likelihood of both hydronephrosis and the need for urologic intervention. Of the patients with recent exposure to nephrotoxic medications, 7.1% (20/280) had hydronephrosis on imaging, whereas the prevalence of hydronephrosis was 17.3% (86/498) in patients without such an exposure (P < 0.001) (Table 1).
| Patient Characteristic | With HN, n = 106 | Without HN, n = 672 | P Value |
|---|---|---|---|
| |||
| Demographics | |||
| Age, y, mean SD | 60.5 17.1 | 64.1 16.0 | 0.035* |
| Nonblack | 97 (91.5) | 573 (85.3) | 0.084 |
| Male | 59 (55.7) | 368 (54.8) | 0.863 |
| Past medical history | |||
| Hydronephrosis | 50 (47.2) | 59 (8.8) | <0.001* |
| Recurrent urinary tract infections | 22 (20.75) | 101 (15.0) | 0.133 |
| Congestive heart failure | 9 (5.5) | 155 (23.1) | <0.001* |
| Prerenal status | 36 (34.0) | 272 (40.5) | 0.203 |
| Exposure to nephrotoxic medication | 20 (18.9) | 260 (38.7) | <0.001* |
| Diagnosis consistent with obstruction | 59 (22.1) | 208 (31.0) | <0.001* |
| Benign prostate hyperplasia | 9 (8.5) | 63 (9.4) | 0.770 |
| Abdominal or pelvic cancer | 42 (39.6) | 97 (14.4) | <0.001* |
| Neurogenic bladder | 5 (4.7) | 12 (1.8) | 0.055 |
| Single functional kidney | 6 (18.8) | 26 (81.3) | 0.388 |
| Pelvic surgery | 14 (13.2) | 61 (9.1) | 0.181 |
Adjusted for other covariates, the multiple variable model showed that a diagnosis predisposing patients for obstruction (odds ratio [OR]: 2.0, P = 0.004), history of hydronephrosis (OR: 7.4, P < 0.001), absence of a history of congestive heart failure (OR: 2.7, P = 0.009), and lack of exposure to nephrotoxic medications (OR: 1.9, P = 0.022) were statistically significant predictors for hydronephrosis (Table 2).
| Patient Characteristic | Adjusted Odds Ratio (95% Confidence Interval) | P Value |
|---|---|---|
| ||
| Race | ||
| Nonblack (reference = black) | 1.4 (0.73.1) | 0.414 |
| History of recurrent urinary tract infections | ||
| Yes (reference = no) | 0.75 (0.41.3) | 0.346 |
| Diagnosis consistent with possible obstruction* | ||
| Yes (reference = no) | 2.0 (1.23.1) | 0.004 |
| History of HN | ||
| Yes (reference = no) | 7.4 (4.512.3) | <0.001 |
| History of CHF | ||
| No (reference = yes) | 2.7 (1.36.1) | 0.009 |
| History of prerenal AKI, use of pressors, or sepsis | ||
| No (reference = 1) | 1.0 (0.61.7) | 0.846 |
| Exposure to nephrotoxic medications prior to AKI | ||
| No (reference = yes) | 1.9 (1.13.3) | 0.022 |
After applying the Licurse renal ultrasonography risk stratification model, 176 (22.6%), 190 (24.4%), and 412 (53.0%) patients were classified as low risk, medium risk, and high risk for hydronephrosis, respectively. The incidence rates for hydronephrosis in the pretest probability risk groups were 4.0%, 6.8%, and 20.9% for low‐, medium‐, and high‐risk patients, respectively (P < 0.0001). The rates for urologic interventions were 1.1%, 0.5%, and 4.9% in the risk groups from low to high (P < 0.0001) (Figure 2).
Overall, the Licurse model, using a cutoff between low‐risk and medium/high‐risk patients, had sensitivity of 91.3% (95% confidence interval [CI]: 73.2%‐97.6%) for HNRI and 93.4% (95% CI: 87.0%‐96.8%) for presence of HN. Specificity was low for both HNRI (23.0% [95% CI: 20.2%‐26.2%]) and HN (25.1% [95% CI: 22.0%‐28.6%]). The estimated potential reduction in renal ultrasound for hospitalized patients with AKI, defined as the rate of imaging performed in the low‐risk group, was 22.6%. In the low‐risk group, the number needed to screen to find 1 case of HN was 25, and to find 1 case of HNRI it was 88. The negative predictive value for hydronephrosis was 96.0% (95% CI: 92.0%‐98.1%) and 98.9% for HNRI (95% CI: 96.0%‐99.7%) (Table 3).
| Our External Validation Set | Licurse Internal Validation Set | |||
|---|---|---|---|---|
| HN an Outcome | With HN | Without HN | With HN | Without HN |
| ||||
| Low risk, no. of patients* | 7 | 169 | 7 | 216 |
| Medium/high risk, no. of patients | 99 | 503 | 78 | 496 |
| Test performance, % (95% CI) | ||||
| Sensitivity | 93.4 (87.096.8) | 91.8 (89.993.7) | ||
| Specificity | 25.1 (22.028.6) | 30.3 (27.233.5) | ||
| Negative predictive value | 96.0 (92.098.1) | 96.9 (95.798.1) | ||
| HNRI an outcome | ||||
| Low risk, no. of patients | 2 | 174 | 1 | 222 |
| Medium/high risk, no. of patients | 21 | 581 | 26 | 548 |
| Test performance, % (95% CI) | ||||
| Sensitivity | 91.3 (73.297.6) | 96.3 (94.997.6) | ||
| Specificity | 23.0 (20.226.2) | 28.8 (25.732.0) | ||
| Negative predictive value | 98.9 (96.099.7) | 99.6 (99.1100.0) | ||
Supporting Table 1, in the online version of this article, shows a sensitivity analysis using different cutoff thresholds in the Licurse model for classifying low‐risk patients. A lower threshold cutoff (ie, a cutoff of <1) significantly increases the sensitivity (98.1% [95% CI: 93.4%‐99.5%] for HN; 100% [95% CI: 85.7%‐100%]) for HNRI, but at the cost of a lower specificity (7.6% [95% CI: 5.8%‐9.8%] for HN and 7.0% [95% CI: 5.4%‐9.1%] for HNRI). The estimated potential reduction in renal ultrasound for hospitalized patients with AKI would be 6.0%, the number needed to screen to find 1 case of HN would be 26, and 1 case of HNRI would be infinity.
DISCUSSION
In this prospective observational study, we found that the Licurse risk stratification model, using a cutoff between low‐ risk and medium/high‐risk patients, had 91.3% (95% CI: 73.2%‐97.6%) sensitivity for predicting patients who would require urologic intervention and 93.4% (95% CI: 87.0%‐96.8%) sensitivity for identifying patients with hydronephrosis. These findings were comparable to those found in the original validation cohort of the model, which showed sensitivity rates of 96.3% and 91.8%, respectively.[2] The negative predictive value for hydronephrosis and HNRI were sufficiently high, at 96.0% (95% CI: 92.0‐98.1) and 98.9% (95% CI: 96.0‐99.7), respectively.
Our results suggest that the Licurse model may be sufficient to rule out HN in the inpatient setting at our institution. The slight differences between the findings of our and the original studies may be due to differences in data extraction methodologies. In the original study, all data were retrospectively abstracted from medical records (discharge summaries and clinical notes) by 4 trained reviewers. However, such methodology is dependent on the quality of unstructured EHR data, which as noted in previous research, can be highly variable. Hogan and Wagner found that the correctness of EHR data can range from 44% to 100% and completeness from 1.1% to 100%, depending on the clinical concepts being studied.[4] Similarly, Thiru et al. found that the sensitivity of different types of EHR data ranged from 0.25 to 1.0.[5] Medical chart review can be labor intensive and time consuming. The lack of standardized methods for structured data capture has been a major limitation in decreasing research costs and speeding the rate of new medical discoveries through the secondary use of EHR data. By modifying our institutional clinical decision support (CDS) system to enable the necessary granular clinical data collection, we were able to obviate the need for resource intensive retrospective chart reviews. To our knowledge, this is the second example of a CDS tool specifically designed for capture of discrete data to validate a decision rule.[6] A similar process may also be useful to accelerate generation of new decision rules. With secondary use of EHR data becoming an increasingly important topic,[7] CDS may serve as an alternative method in the context of data reuse for clinical research. Based on a randomly selected chart review, it was noted that clinicians, overall, do try to communicate to the interpreting radiologists the clinical picture as accurately as they can, and rarely do providers drop their orders due to data entry.
Despite our data confirming Licurse's initial findings, it is important to note that as with any clinical prediction rules, there is a trade‐off between cost savings and potential missed diagnoses. Even the most accepted clinical decision rules, such as the Well's criteria for pulmonary embolism and deep vein thrombosis, has their inherent acceptable rates of false negative. What is considered to be acceptable may differ among providers and patients. Thus, a shared decision‐making model, in which the patient and provider actively engage in sharing of information regarding risks and benefits of both performing and bypassing the diagnostic testing, is preferred. For providers/patients who are more risk‐adverse, one could consider using a more sensitive cutoff (for example, using the <1 threshold), essentially increasing the sensitivity from 91.3% to 100% for HNRI and from 93.4% to 98.1% for HN.
Although one would not want to miss a hydronephrosis in a patient, a too aggressive imaging strategy is not without economic and downstream risks. At an estimated cost of $200 per renal ultrasonography,[2] a 22.6% reduction would result in an annual savings of nearly $20,000 at our institution. The financial costs of forgoing ultrasound studies at the risk of missing 1 case of HN or 1 case of HNRI would be $5000 and $17,600, respectively.
Data‐driven decision rules are becoming more commonly used in the current environment of increased emphasis on evidence‐based medicine.[8, 9, 10, 11, 12, 13] When applied appropriately, such prediction models can result in more efficient use of medical imaging while increasing value of care.[14, 15] However, prior to implementation in clinical practice, these models need to be externally validated across multiple institutions and in various practice settings. This is the largest study of which we are aware to validate the utility of a prediction model for AKI in the inpatient setting. Although we did find slightly smaller differences in hydronephrosis in inpatients across the low, moderate, and high pretest probability groups, this may be explained by the differences in methodology.
Our study has several limitations. First, it was performed at a single academic medical center, a similar setting as that of the original work. Thus, the generalizability of our findings in other settings is unclear. Second, it is possible that our ordering providers did not thoroughly and accurately enter data into the structured CPOE form. However, we randomly selected a sample for chart review and found 90% concordance between data captured and those in the EHR. Due to selection of our cohort that included only patients with AKI who underwent RUS, it is possible that some patients who were not imaged or imaged with other cross‐sectional modalities were excluded, resulting in differential test ordering bias. Finally, we did not include the potential benefits of RUS in affecting nonsurgical interventions of hydronephrosis (eg, Foley catheter insertion).
CONCLUSION
We found that the Licurse renal ultrasonography risk stratification model was sufficiently accurate in classifying patients at risk for ureteral obstruction among hospitalized patients with AKI.
Acknowledgements
The authors thank Laura E. Peterson, BSN, SM, for her assistance in editing this manuscript.
- , , , , . Renal sonography: can it be used more selectively in the setting of an elevated serum creatinine level? Am J Kidney Dis. 1997;29(3):362–367.
- . Renal ultrasonography in the evaluation of acute kidney injury: developing a Risk stratification framework. Arch Intern Med. 2010;170(21):1900.
- , . Curbing the use of ultrasonography in the diagnosis of acute kidney injury: Penny wise or pound foolish?: comment on “Renal ultrasonography in the evaluation of acute kidney injury.” Arch Intern Med. 2010;170(21):1907–1908.
- , . Accuracy of data in computer‐based patient records. J Am Med Inform Assoc 1997;4(5):342–355.
- , , . Systematic review of scope and quality of electronic patient record data in primary care. BMJ. 2003;326(7398):1070.
- , , , , , . Performance of Wells score for deep vein thrombosis in the inpatient setting. JAMA Intern Med. 2015;175(7):1112–1117.
- , , , , . Public preferences about secondary uses of electronic health information. JAMA Intern Med. 2013;173(19):1798–1806.
- , , , et al. The Canadian CT Head Rule for patients with minor head injury. Lancet. 2001;357(9266):1391–1396.
- , , , et al. Value of assessment of pretest probability of deep‐vein thrombosis in clinical management. Lancet. 1997;350(9094):1795–1798.
- , , , , , . Derivation of the children's head injury algorithm for the prediction of important clinical events decision rule for head injury in children. Arch Dis Child. 2006;91(11):885–891.
- , , , et al. Clinical decision rules to rule out subarachnoid hemorrhage for acute headache. JAMA. 2013;310(12):1248–1255.
- , , , et al. Excluding pulmonary embolism at the bedside without diagnostic imaging: management of patients with suspected pulmonary embolism presenting to the emergency department by using a simple clinical model and d‐dimer. Ann Intern Med. 2001;135(2):98–107.
- , , , et al. Implementation of the Ottawa knee rule for the use of radiography in acute knee injuries. JAMA. 1997;278(23):2075–2079.
- , , , et al. Impact of provider‐led, technology‐enabled radiology management program on imaging. Am J Med. 2013;126(8):687–692.
- , , , et al. Effect of computerized clinical decision support on the use and yield of CT pulmonary angiography in the emergency department. Radiology. 2012;262(2):468–474.
Frailty Evaluation in the Hospital
Frailty is a state of vulnerability that encompasses a heterogeneous group of people.[1] Because it lacks a precise definition, multiple tools have been developed to identify frailty in both clinical and research settings.[2, 3, 4] Prevalence of frailty depends on the frailty assessment tool used and the population studied, ranging from 4% to 17% when the Fried score[5, 6, 7] is used and from 5% to 44%[5, 7, 8] when cumulative deficit models like the Frailty Index are utilized, with the lower prevalences being in younger community‐dwelling elderly populations and the higher proportions being in older institutionalized populations.
The Frailty Index, also called the Burden or Cumulative Deficit Model, comprises 70 domains that include mobility, mood, function, cognitive impairment, and disease states. It is multidimensional and allows for patients to be categorized on a continuum of frailty, but it is extremely difficult to apply in clinical practice. Recognizing this, Rockwood et al.[9] developed and validated the Clinical Frailty Scale (CFS) in the Canadian Study of Health and Aging. The CFS classifies patients into 1 of 9 categories: very fit, well, managing well, vulnerable, mildly frail (needs help with at least 1 instrumental activity of daily living such as shopping, finances, meal preparation, or housework), moderately frail (needs help with 1 or 2 activities of daily living such as bathing and dressing), severely frail (dependent for personal care), very severely frail (bedbound), and terminally ill. Although this tool is easy to use in clinical practice, it reflects a gestalt impression and requires some clinical judgement.
The Fried score[6] is a prototypical phenotype tool based on 5 criteria that include weight loss, self‐reported exhaustion, low energy expenditure, slowness of gait, and weakness. Recent evidence has suggested that slow gait (or dysmobility) alone may also be a potential screening test for frailty.[10] A recent systematic review[11] demonstrated an association between slow gait (dysmobility) and increased mortality. Dysmobility negatively impacts quality of life and has a strong association with disability resulting in the need for an increased level of care.[12] The Timed Up and Go Test (TUGT) is one method of assessing mobility which is relatively easy to perform, does not require special equipment, and is feasible to use in clinical settings.[13] However, whether impaired mobility predicts outcomes within the first 30 days after hospital discharge (a timeframe highlighted in the Affordable Care Act and used by the Centers for Medicare and Medicaid Services as an important hospital quality indicator) is still uncertain.
The aim of this study was to compare frailty assessments using the CFS and 2 of the most commonly used phenotypic tools (a modified Fried score and the TUGT as a proxy for mobility assessment) to determine which tools best predict postdischarge outcomes.
METHODS
Study Design and Population
As described in detail elsewhere,[14] this was a prospective cohort study that enrolled adult patients (any age older than 18 years) at the time of discharge back to the community from 7 general internal medicine wards in 2 teaching hospitals in Edmonton, Alberta between October 2013 and November 2014. We excluded patients admitted from, or being discharged back to, long‐term care facilities or other acute care hospitals, or from out of the province; patients who were unable to communicate in English; patients with moderate or severe cognitive impairment (scoring 5 or more on the Short Portable Mental Status Questionnaire); or patients with projected life expectancy of less than 3 months. All patients provided written consent, and the study was approved by the Health Research Ethics board of the University of Alberta (project ID Pro00036880).
We assessed the degree of frailty within 24 hours of discharge in 3 ways. First, we used the CFS[9, 15] with patients being asked to rate their best functional status in the week prior to admission. As per the CFS validations studies, scores 5 were defined as frail.[9, 15] Second, we used the TUGT as a proxy for slow gait speed/dysmobility (with >20 seconds defined as abnormal).[13] The TUGT was recorded as the shortest recorded time of the 2 timed trials to get up from a seated position, walk 10 feet and back, and then sit in the chair again. Third, we also determined their Fried score[6] (using the modifications outlined below) and categorized the patients as frail if they scored 3 or more. Of the 5 Fried categories, we assessed weakness by grip strength in their dominant hand using a Jamar handheld dynamometer and weight loss of 10 lb or more in the past year based on patient self‐report; these are identical to the original Fried scale description. Grip strength in the lowest quintile for sex and body mass index was defined as weak grip strength as per convention in the literature, which corresponded to less than 28.5 kg for men and less than 18.5 kg for women.[16, 17] We assessed the other 3 Fried categories in modified fashion as follows. For slow gait, rather than assessing time to walk 15 feet as in the original study and assigning a point to those testing in the lowest quintile for their age/sex, we used the TUGT, because our research personnel were already trained in this test, and we were doing it already as part of the discharge package for all patients.[13] For the Fried category of low activity, we based this on patient self‐report using the relevant questions in the EuroQoL Questionnaire (EQ‐5D); the Fried score used self‐report with a different questionnaire. Finally, for self‐reported exhaustion we used the questions in the Patient Health Questionnaire 9 (PHQ‐9)[18] analogous to those used from the Center for Epidemiological Studies depression scale in the original Fried description. We did this as we were evaluating the PHQ‐9 in our cohort already, and did not want to increase responder burden by presenting them with 2 depression questionnaires.
We followed all patients until 30 days after discharge, and outcome data (all‐cause mortality or all‐cause readmission) were collected by research personnel blinded to the patient's frailty status at discharge using patient/caregiver self‐report and analysis of the provincial electronic health record. We included deaths in or out of the hospital, and all readmissions were unplanned.
We examined the correlation between the CFS score (5 vs <5) and (1) the modified Fried score (3 vs <3) and (2) TUGT (20 seconds vs >20 seconds) using chance corrected kappa coefficients. In our previous article[14] we reported the association between the CFS and readmissions/hospitalizations within 30 days of discharge. In this article we examine whether either the Fried score or TUGT accurately and independently predict postdischarge readmissions/deaths, and whether they add additional prognostic information to the CFS assessment by comparing models with/without each definition using the C statistic and the Integrated Discrimination Improvement index. All analyses were performed using SAS version 9.4 (SAS Institute, Cary, NC), with P values of <0.05 considered statistically significant. Subgroup analysis was done in patients older than 65 years.
RESULTS
Of 1124 potentially eligible patients, 626 were excluded because of patient refusal (n = 227); transfer to/from another hospital, long‐term care facility, or out of province (n = 189); moderate to severe cognitive impairment (n = 88); language barriers (n = 71); or foreshortened life expectancy (n = 51). Another 3 patients withdrew consent prior to outcome assessment. The 495 patients we recruited and had outcome data for had a mean age of 64 years, 19.6% were older than 80 years, 50% were women, and the patients had a mean of 4.2 comorbidities and mean Charlson score of 2.4. The 4 most common reasons for hospital admission were heart failure, pneumonia, chronic obstructive pulmonary disease, and urinary tract infection, and the median length of stay was 5 days (interquartile range: 49 days).
Prevalence of Frailty According to Different Definitions
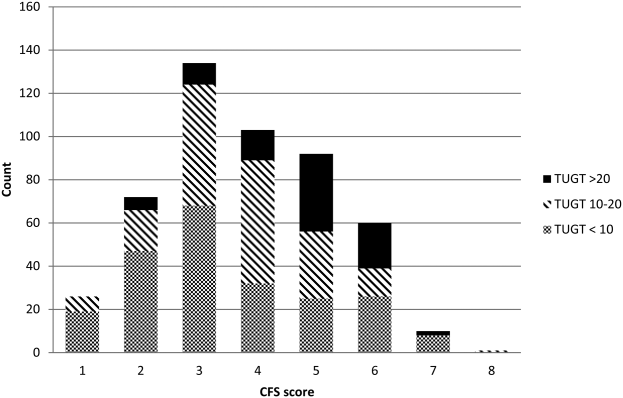
Although the CFS assessment resulted in 162 (33%) patients being deemed frail, only 82 (51%) of those patients also met the phenotype frailty definition using either the Fried model or the TUGT, and 49 (10%) patients who were not classified as frail on the CFS met either of the phenotypic definitions of frailty (Figure 1). Overall, 211 (43%) patients were frail according to at least 1 assessment, and 46 (9%) met all 3 frailty definitions. In the subgroup of 245 patients older than 65 years, 137 (56%) were frail according to at least 1 assessment, 38 (16%) met all 3 frailty definitions, and 27 (11%) of those patients classified as not frail on the CFS met either phenotypic definition of frailty. Agreement between TUGT and CFS or CFS and Fried was relatively poor with kappas of 0.31 (95% confidence interval [CI]: 0.23‐0.40) and 0.33 (95% CI: 0.25‐0.42), respectively. It is noteworthy that some patients deemed nonfrail on the CFS had slow gait speeds, and most CFS‐frail patients had gait speeds in the nonfrail range (Figure 2).

Characteristics According to Frailty Status
Although frail patients were generally similar across definitions (Table 1) in that they were older, had more comorbidities, more hospitalizations in the prior year, and longer index hospitalization lengths of stay than nonfrail patients, patients meeting phenotypic definitions of frailty but not classified as frail on the CFS were younger, had lower Charlson scores, higher EQ‐5D scores, and were discharged with less medications (Table 1).
| Not Frail on Any of the 3 Models, n = 284 | Frail on the CFS Only, n = 80 | Frail on the Fried and/or TUGT but Not the CFS, n = 49 | Frail on CFS and Either Phenotype Model, n = 82 | P Value Comparing the 3 Frailty Columns | |
|---|---|---|---|---|---|
| |||||
| Age, y, mean (95% CI) | 57.3 (55.259.5) | 69.1 (65.872.3) | 63.1 (57.968.3) | 75.8 (72.679.0) | <0.001 |
| Sex, female, no (%) | 118 (41.6) | 49 (61.3) | 27 (55.1) | 56 (68.3) | 0.3 |
| No. of comorbidities, mean (95% CI) | 4.2 (3.84.5) | 6.0 (5.56.6) | 4.0 (3.14.9) | 6.5 (5.87.2) | <0.001 |
| Charlson comorbidity score, mean (95% CI) | 2.4 (2.12.6) | 3.4 (3.03.9) | 2.6 (2.03.2) | 3.8 (3.34.2) | 0.01 |
| No. of patients hospitalized in prior 12 months, no (%) | 93 (32.8) | 44 (55.0) | 27 (55.1) | 54 (65.9) | 0.3 |
| Preadmission living situation, no (%) | 0.01 | ||||
| Living at home independently | 221 (77.8) | 26 (32.5) | 25 (51.0) | 17 (20.7) | |
| Living at home with help | 59 (20.8) | 43 (53.8) | 19 (38.8) | 48 (58.5) | |
| Assisted living or lodge | 4 (1.4) | 11 (13.8) | 5 (10.2) | 17 (20.7) | |
| EQ‐5D overall score, /100, mean (95% CI) | 66.9 (65.068.9) | 62.0 (57.666.4) | 56.6 (51.361.8) | 58.3 (53.962.7) | 0.28 |
| Goals of care in the hospital, no (%) | <0.0001 | ||||
| Resuscitation/ICU | 228 (83.5) | 41 (54.7) | 39 (84.8) | 29 (39.7) | |
| ICU but no resuscitation | 21(7.7) | 17 (22.7) | 1 (2.2) | 16 (21.9) | |
| No ICU, no resuscitation | 23 (8.4) | 17(22.7) | 6 (13.0) | 28 (37.8) | |
| Comfort care | 1 (0.4) | 0 | 0 | 0 | |
| Timed Up and Go Test, s, mean (95% CI) | 10.9 (10.411.3) | 13.9 (12.914.9) | 26.3 (19.033.6) | 30.3 (26.833.7) | <0.0001 |
| Grip strength, kg, mean (95% CI) | 32.1 (30.733.5) | 24.3 (22.3‐ 26.3) | 22.1 (19.924.2) | 17.7 (16.219.1) | <0.0001 |
| Serum albumin, g/L, mean (95% CI) | 34.2 (32.835.5) | 35.0 (33.037.0) | 31.1 (27.934.4) | 33.1 (31.434.9) | 0.07 |
| No. of prescription medications at discharge, mean (95% CI) | 5.2 (4.85.6) | 8.8 (7.99.6) | 6.1 (5.17.1) | 8.2 (7.58.9) | <0.0001 |
| Length of stay, d, median, [IQR] | 5 [37] | 6 [411] | 7 [3.512] | 7 [59] | 0.02 |
Outcomes According to Frailty Status
The overall rate of 30‐day death or hospital readmission was 17.1% (85 patients), primarily as a result of hospital readmissions (81, 16.4%) (Table 2). Although patients classified as frail on the CFS exhibited significantly higher 30‐day readmission/death rates (24.1% vs 13.8% for not frail, P = 0.005) even after adjusting for age and sex (adjusted odds ratio [aOR]: 2.02, 95% CI: 1.19‐3.41) (Table 3), patients meeting either of the phenotypic definitions for frailty but not the CFS definition were not at higher risk for 30‐day readmission/death (aOR: 0.87, 95% CI: 0.34‐2.19) (Table 3). The group at highest risk for 30‐day readmissions/death were those meeting both the CFS and either phenotypic definition of frailty (25.6% vs 13.8% for those not frail, aOR: 2.15, 95% CI: 1.10‐4.19) (Tables 2 and 3). None of the Integrated Discrimination Improvement indices (for modified Fried added to CFS or TUGT added to CFS) were statistically significant, suggesting no net new information was added to predictive models, and there were no appreciable changes in C statistics (Table 3). Neither the modified Fried score nor the TUGT on their own added independent prognostic information to age/sex alone as predictors of postdischarge outcomes. It is noteworthy that the areas under the curve for models using any combination of the frailty definitions plus age and sex were not high (all ranged between 0.55 and 0.60 for the overall cohort and from 0.52 and 0.65 in the elderly). If the frailty definitions were examined as continuous variables rather than dichotomized into frail/not frail, the C statistics were not appreciably better: 0.65 for CFS, 0.58 for TUGT, and 0.60 for modified Fried. Of note, the CFS score with the published cutoff of 5 demonstrated the highest kappa, sensitivity, specificity, and positive predictive value in relation to outcomes.
| Outcomes (Not Mutually Exclusive) | Not Frail on Any of the 3 Models | Frail on the CFS Only | Frail on the Fried and/or TUGT | Frail on CFS and Either Phenotype Model | P Value Comparing the 3 Frailty Columns |
|---|---|---|---|---|---|
| |||||
| Entire cohort | n = 284 | n = 80 | n = 49 | n = 82 | |
| Discharge disposition | <0.002 | ||||
| Live at home independently | 203 (71.5) | 16 (20.0) | 19 (38.8) | 10 (12.2) | |
| Live at home with help | 77 (27.1) | 52 (65.0) | 25 (51.0) | 50 (61.0) | |
| Assisted living or lodge | 4 (9.3) | 12 (15.0) | 5 (10.2) | 22 (26.8) | |
| 30‐day readmission or death | 40 (14.1) | 18 (22.5) | 6 (12.2) | 21 (25.6) | 0.2 |
| 30‐day hospital readmission | 39 (13.8) | 18 (22.5) | 6 (12.2) | 18 (22.0) | 0.31 |
| Death | 5 (1.8) | 3 (3.8) | 1 (2.0) | 4 (4.9) | 0.9 |
| 30‐day ER visit | 66 (23.2) | 30 (37.5) | 12 (24.5) | 23 (17.6) | 0.25 |
| Patients aged 65 years or older | n = 108 | n = 47 | n = 27 | n = 63 | |
| Discharge disposition | 0.03 | ||||
| Live at home independently | 69 (63.9) | 9 (19.2) | 10 (37.0) | 6 (9.5) | |
| Live at home with help | 36 (33.3) | 30 (63.8) | 13 (48.2) | 39(61.9) | |
| Assisted living or lodge | 3 (3.8) | 8 (17.0) | 4 (14.8) | 18 (28.6) | |
| 30‐day readmission or death | 13 (12.0) | 13 (27.7) | 3 (11.1) | 17 (27.0) | 0.22 |
| 30‐day hospital readmission | 12 (11.1) | 13 (27.7) | 3 (11.1) | 14 (22.2) | 0.26 |
| Death | 2 (1.9) | 3 (6.4) | 1 (3.7) | 3 (4.8) | 0.87 |
| 30‐day ER visit | 20 (18.5) | 17 (36.2) | 6 (22.2) | 18 (28.6) | 0.45 |
| Frailty Definition | Adjusted Odds Ratio for 30‐Day Readmission/Death | 95% CI | C Statistic for Model Predicting 30‐Day Readmission/Death Including Age, Sex, and Frailty Definition (95% CI) |
|---|---|---|---|
| |||
| Entire cohort | |||
| CFS (overall) | 2.02 | 1.193.41 | 0.60 (0.530.65) |
| CFS (plus either phenotype model) | 2.15 | 1.104.19 | 0.60 (0.520.64) |
| CFS (but neither phenotype model) | 1.81 | 0.943.48 | 0.60 (0.520.64) |
| Fried | 1.32 | 0.752.30 | 0.55 (0.560.58) |
| TUGT | 1.34 | 0.732.44 | 0.55 (0.460.58) |
| Fried and/or TUGT | 0.87 | 0.342.19 | 0.55 (0.470.58) |
| Patients aged 65 years or older | |||
| CFS (overall) | 3.20 | 1.556.60 | 0.65 (0.560.73) |
| CFS (plus either phenotype model) | 3.20 | 1.337.68 | 0.65 (0.550.72) |
| CFS (but neither phenotype model) | 3.08 | 1.267.47 | 0.65 (0.550.72) |
| Fried | 1.28 | 0.642.56 | 0.52 (0.390.53) |
| TUGT | 1.44 | 0.702.97 | 0.52 (0.390.53) |
| Fried and/or TUGT | 1.41 | 0.722.78 | 0.54 (0.420.56) |
Outcomes According to Frailty Status in the Elderly Subgroup
Although absolute risks of readmission or death were higher in elderly patients than younger patients, the excess risk was largely seen in those elderly patients classified as frail on the CFS. In fact, all of the associations reported above for the entire cohort were in the same direction in the elderly subgroup (Tables 2 and 3).
DISCUSSION
In summary, we found that of patients being discharged from general medical wards who were frail according to at least 1 of the 3 tools we used, only 22% met all 3 frailty case definitions (including only 28% of elderly patients deemed frail by at least 1 definition). There was surprisingly poor correlation between phenotypic markers of frailty such as poor mobility (slow TUGT) or the modified Fried Index and the CFS, even amongt elderly patients. The most clinically useful of the frailty assessment tools (both overall and in those patients who are elderly) appears to be the CFS, because it more accurately identifies those at higher risk of adverse outcomes after discharge, does not require special equipment to conduct, and is faster to do than the phenotypic assessment models we tested. We have also previously demonstrated that the CFS, after a brief training period identical to that used in this study, is reproducible between observers[19] and remains an independent predictor of adverse 30‐day outcomes even after adjusting for age, sex, comorbidities, and the LACE (length of stay, acuity of the admission, comorbidity, emergency room visits during the previous 6 months) score.[14]
Although some[10] have advocated for the use of mobility assessments (such as gait speed) as a frailty marker due to its ease of measurement and objectivity, we found that slow TUGT (which is a marker for mobility and not just slow gait speed) was not an independent prognostic marker for postdischarge outcomes. We hypothesize that the phenotypic models of frailty performed less well than the CFS as they focus on the measurement of particular physical attributes and do not take into account cognitive or psychosocial characteristics or comorbidity burden that also influence postdischarge outcomes. As well, the CFS captures the patients' baseline status prior to acute illness, whereas the phenotypic measures were assessed just prior to discharge and thus may provide less information about eventual recovery potential. Some have suggested that repeating phenotype measures postdischarge might be more informative,[20] but this would reduce clinical applicability a great deal. Certainly, an analysis[21] of the Cardiovascular Health Study cohort demonstrated that cumulative deficit models of frailty (for which the CFS is an accurate proxy[9, 15]) better predicted risk of death than phenotypic models.
Although a number of published studies have shown similar results to ours in that frail patients are at greater risk for death and/or hospitalization,[22, 23, 24] there is surprisingly little literature on the comparative predictive performance of the different frailty instruments and the extent to which they overlap. Cigolle et al.[25] compared 3 frailty scales (the Functional Domain Model, the Burden Model, and the Fried score) in the Health and Retirement Study and, similarly to us, found that although 30.2% were frail on at least 1 of these scales, only 3.1% were deemed frail by all 3. The Conselice Study of Brain Aging[5] also reported that a deficit accumulation model defined a much higher prevalence of frailty (37.6%) than the 11.6% identified using the phenotypic Study of Osteoporotic Fractures (SOF) index based on weight loss, mobility, and level of energy. Another study[26] reported that risk models incorporating either the SOF index or the Fried score exhibited C statistics of only 0.61 for predicting falls in elderly females. A cohort study[27] from 2 English general medical units also found that none of the 5 frailty models was particularly accurate at predicting risk of readmission at 3 months, with C statistics ranging between 0.52 and 0.57. Although frailty assessment at time of hospital admission predicted in‐hospital mortality and length of stay in another English study, it was not independently associated with 30‐day outcomes after adjusting for age, sex, and comorbidities including dementia.[27] To our knowledge, these latter 2 are the only other studies reported to date performed in hospitalized patients to assess whether frailty assessment helps predict postdischarge outcomes. Thus, the poor C statistics we found for all of our frailty tools confirms prior literature that frailty assessment alone is inadequate to accurately identify those patients at highest risk for poor outcomes in the first 30 days after discharge. However, frailty assessment together with consideration of each individual's comorbidities, cognitive status, psychosocial circumstances, and environment can be useful to flag those individuals who may need extra attention postdischarge to optimize outcomes.
Strengths and Limitations
Although this was a prospective cohort study with blinded ascertainment of endpoints (30‐day outcome data were collected by observers who were unaware of the patients' CFS or phenotypic model scores), it is not without limitations. First, the only postdischarge outcomes we assessed were readmission and death, and it would be interesting to evaluate which frailty tools best predict those who are most likely to benefit from home‐care services in the community. Second, as we were interested in 30‐day readmission rates, we excluded long‐term care residents from our study and patients who had foreshortened life expectancy, in essence, the frailest of the frail. Although this reduced the size of any association between frailty and adverse outcomes, we focused this study on the situations where there is clinical equipoise and there is rarely a diagnostic dilemma around the identification of frailty and need for increased services in palliative or long‐term care patients. Third, we did not use exactly the same questionnaires or gait speed assessments as used in the original Fried score description, but as outlined in the Methods section, we used analogous questions on closely related questionnaires to extract the same information. Fourth, some might consider our comparisons biased toward the CFS, as it reflects gestalt clinical impressions (informed by patients and proxies) of frailty status before hospital admission while the Fried score and TUGT were based on patient status just prior to discharge, it may be that the former is a better measure of eventual recovery (and ongoing risk) than the latter measures. If this is the case, for the purposes of targeting interventions to prevent postdischarge complications, it would suggest to us that the CFS is better suited, whereas phenotype tools can be reserved for the postdischarge phase of recovery. By the same token, perhaps serial measures of the CFS and phenotypic tools are more important, as the trajectory of recovery may be most informative for risk prediction.[7] Certainly, if one were interested in changes in functional status during hospitalization,[29] then objective phenotypic measures such as grip strength or TUGT times would seem more appropriate choices. Fifth, some may perceive it as a weakness that we did not restrict our cohort to elderly patients; however, we actually view this as a strength, because frailty is not exclusive to older patients. Sixth, although we restricted this study to patients being discharged from general internal medicine wards, it is worth mentioning that previous studies have shown similar associations between frailty and outcomes in nonmedical hospitalized patients.[19, 22, 23, 24]
In conclusion, we looked at 3 different ways of screening for frailty, 1 being a subjective but well‐validated tool (the CFS) and the other 2 being objective assessments that look at specific phenotypic characteristics. There is a compelling need to find a standardized assessment to determine frailty in both research and clinical settings, and our study provides support for use of the CFS over the Fried or TUGT as screening tools. Standardized frailty assessments should be part of the discharge planning for all medical patients so that extra resources can be properly targeted at those patients at greatest risk for suboptimal transition back to community living.
Acknowledgements
The authors acknowledge Miriam Fradette and Debbie Boyko for their important contributions in data acquisition, as well as all the physicians rotating through the general internal medicine wards for their help in identifying the patients.
Disclosures: Author contributions are as follows: study concept and design: Finlay A. McAlister, Sumit R. Majumdar, and Raj Padwal; acquisition of patients and data: Sara Belga, Darren Lau, Jenelle Pederson, and Sharry Kahlon; analysis of data: Jeff Bakal, Sara Belga, Finlay A. McAlister; first draft of manuscript: Sara Belga and Finlay A. McAlister; critical revision of manuscript: all authors. Funding for this study was provided by an operating grant from Alberta InnovatesHealth Solutions. Alberta InnovatesHealth Solutions had no role in role in the design, methods, subject recruitment, data collections, analysis, or preparation of the article. Finlay A. McAlister and Sumit R. Majumdar hold career salary support from Alberta InnovatesHealth Solutions. Finlay A. McAlister holds the Chair in Cardiovascular Outcomes Research at the Mazankowski Heart Institute, University of Alberta. Sumit R. Majumdar holds the Endowed Chair in Patient Health Management from the Faculty of Medicine and Dentistry, and the Faculty of Pharmacy and Pharmaceutical Sciences, University of Alberta. The authors have no affiliations or financial interests with any organization or entity with a financial interest in the contents of this article. All authors had access to the data and played a role in writing and revising this article. The authors declare no conflicts of interest.
- , , , , . Untangling the concepts of disability, frailty, and comorbidity: implications for improved targeting and care. J Gerontol A Biol Sci Med Sci. 2004;59:255–263.
- , , , , . The identification of frailty: a systematic literature review. J Am Geriatr Soc. 2011;59:2129–2138.
- , , , , . Frailty in elderly people. Lancet. 2013;381:752–762.
- , , , , , . Outcome instruments to measure frailty: a systematic review. Ageing Res Rev. 2011;10:104–114.
- , , , , , . A comparison of frailty indexes for prediction of adverse health outcomes in a elderly cohort. Arch Gerontol Geriatr. 2012;54:16–20.
- , , , et al. Frailty in older adults: evidence for a phenotype. J Gerontol A Biol Sci Med Sci. 2001;56:M146–M156.
- , , , . Prevalence of frailty in community‐dwelling older persons: a systematic review. J Am Geriatr Soc. 2012;60:1487–1492.
- , , . Sex differences in the risk of frailty for mortality independent of disability of chronic diseases. J Am Geriatr Soc. 2005;53:40–47.
- , , . A comparison of two approaches to measuring frailty in elderly people. J Gerontol. 2007;62:738–743.
- , , . A diagnosis of dismobility—giving mobility clinical visibility: a mobility working group recommendation. JAMA. 2014;311:2061–2062.
- , , , et al. Gait speed and survival in older adults. JAMA. 2011;301:50–58.
- , , , et al. Frailty assessment in the cardiovascular care of older adults. J Am Coll Cardiol. 2014;63:747–762.
- , . The timed “Up and Go” test: a test of basic functional mobility for frail elderly persons. J Am Geriatr Soc. 1991;39:142–148.
- , , , et al. Association between frailty and 30‐day outcomes after discharge from hospital. CMAJ. 2015;187:799–804.
- , , , et al. A global clinical measure of fitness and frailty in elderly people. CMAJ. 2005;173:489–495.
- , , , et al. Do muscle mass, muscle density, strength, and physical function similarly influence risk of hospitalization in older adults? J Am Geriatr Soc. 2009;57:1411–1419.
- , . Grip strength in older adults: test‐retest reliability and cutoff for subjective weakness of using the hands in heavy tasks. Arch Phys Med Rehabil. 2010;91:1747–1751.
- , . The PHQ‐9: a new depression measure. Psychiatr Ann. 2002;32:509–515.
- , , , et al. Association between frailty and short‐ and long‐term outcomes among critically ill patients: a multicenter prospective cohort study. CMAJ. 2013;186:e95–e102.
- , . Risk after hospitalization: we have a lot to learn. J Hosp Med. 2015;10:135–136.
- , , , , , . Cumulative deficits better characterize susceptibility to death in elderly people than phenotypic frailty: lessons from the Cardiovascular Health Study. J Am Geriatr Soc. 2008;56:898–903.
- , , . Unplanned hospital readmission and its predictors in patients with chronic conditions. J Formos Med Assoc. 2002;101:779–785.
- , , , et al. Frailty and early hospital readmission after kidney transplant. Am J Transplant. 2013;13:2091–2095.
- , , , , , . Simple frailty score predicts postoperative complications across surgical specialities. Am J Surg. 2013;206:544–550.
- , , , . Comparing models of frailty: the Health and Retirement Study. J Am Geriatr Soc. 2009;57:830–839.
- , , , et al. Comparison of 2 frailty indexes for prediction of falls, disability, fractures, and death in older women. Arch Int Med. 2008;168:382–389.
- , , , , , . The predictive properties of frailty‐rating scales in the acute medical unit. Age Ageing. 2013;42:776–781.
- , , , . Association of the clinical frailty scale with hospital outcomes. QJM. 2015;108:943–949.
- , , . Hospitalization‐associated disability: she was probably able to ambulate, but I'm not sure. JAMA. 2011;306:1782–1793.
Frailty is a state of vulnerability that encompasses a heterogeneous group of people.[1] Because it lacks a precise definition, multiple tools have been developed to identify frailty in both clinical and research settings.[2, 3, 4] Prevalence of frailty depends on the frailty assessment tool used and the population studied, ranging from 4% to 17% when the Fried score[5, 6, 7] is used and from 5% to 44%[5, 7, 8] when cumulative deficit models like the Frailty Index are utilized, with the lower prevalences being in younger community‐dwelling elderly populations and the higher proportions being in older institutionalized populations.
The Frailty Index, also called the Burden or Cumulative Deficit Model, comprises 70 domains that include mobility, mood, function, cognitive impairment, and disease states. It is multidimensional and allows for patients to be categorized on a continuum of frailty, but it is extremely difficult to apply in clinical practice. Recognizing this, Rockwood et al.[9] developed and validated the Clinical Frailty Scale (CFS) in the Canadian Study of Health and Aging. The CFS classifies patients into 1 of 9 categories: very fit, well, managing well, vulnerable, mildly frail (needs help with at least 1 instrumental activity of daily living such as shopping, finances, meal preparation, or housework), moderately frail (needs help with 1 or 2 activities of daily living such as bathing and dressing), severely frail (dependent for personal care), very severely frail (bedbound), and terminally ill. Although this tool is easy to use in clinical practice, it reflects a gestalt impression and requires some clinical judgement.
The Fried score[6] is a prototypical phenotype tool based on 5 criteria that include weight loss, self‐reported exhaustion, low energy expenditure, slowness of gait, and weakness. Recent evidence has suggested that slow gait (or dysmobility) alone may also be a potential screening test for frailty.[10] A recent systematic review[11] demonstrated an association between slow gait (dysmobility) and increased mortality. Dysmobility negatively impacts quality of life and has a strong association with disability resulting in the need for an increased level of care.[12] The Timed Up and Go Test (TUGT) is one method of assessing mobility which is relatively easy to perform, does not require special equipment, and is feasible to use in clinical settings.[13] However, whether impaired mobility predicts outcomes within the first 30 days after hospital discharge (a timeframe highlighted in the Affordable Care Act and used by the Centers for Medicare and Medicaid Services as an important hospital quality indicator) is still uncertain.
The aim of this study was to compare frailty assessments using the CFS and 2 of the most commonly used phenotypic tools (a modified Fried score and the TUGT as a proxy for mobility assessment) to determine which tools best predict postdischarge outcomes.
METHODS
Study Design and Population
As described in detail elsewhere,[14] this was a prospective cohort study that enrolled adult patients (any age older than 18 years) at the time of discharge back to the community from 7 general internal medicine wards in 2 teaching hospitals in Edmonton, Alberta between October 2013 and November 2014. We excluded patients admitted from, or being discharged back to, long‐term care facilities or other acute care hospitals, or from out of the province; patients who were unable to communicate in English; patients with moderate or severe cognitive impairment (scoring 5 or more on the Short Portable Mental Status Questionnaire); or patients with projected life expectancy of less than 3 months. All patients provided written consent, and the study was approved by the Health Research Ethics board of the University of Alberta (project ID Pro00036880).
We assessed the degree of frailty within 24 hours of discharge in 3 ways. First, we used the CFS[9, 15] with patients being asked to rate their best functional status in the week prior to admission. As per the CFS validations studies, scores 5 were defined as frail.[9, 15] Second, we used the TUGT as a proxy for slow gait speed/dysmobility (with >20 seconds defined as abnormal).[13] The TUGT was recorded as the shortest recorded time of the 2 timed trials to get up from a seated position, walk 10 feet and back, and then sit in the chair again. Third, we also determined their Fried score[6] (using the modifications outlined below) and categorized the patients as frail if they scored 3 or more. Of the 5 Fried categories, we assessed weakness by grip strength in their dominant hand using a Jamar handheld dynamometer and weight loss of 10 lb or more in the past year based on patient self‐report; these are identical to the original Fried scale description. Grip strength in the lowest quintile for sex and body mass index was defined as weak grip strength as per convention in the literature, which corresponded to less than 28.5 kg for men and less than 18.5 kg for women.[16, 17] We assessed the other 3 Fried categories in modified fashion as follows. For slow gait, rather than assessing time to walk 15 feet as in the original study and assigning a point to those testing in the lowest quintile for their age/sex, we used the TUGT, because our research personnel were already trained in this test, and we were doing it already as part of the discharge package for all patients.[13] For the Fried category of low activity, we based this on patient self‐report using the relevant questions in the EuroQoL Questionnaire (EQ‐5D); the Fried score used self‐report with a different questionnaire. Finally, for self‐reported exhaustion we used the questions in the Patient Health Questionnaire 9 (PHQ‐9)[18] analogous to those used from the Center for Epidemiological Studies depression scale in the original Fried description. We did this as we were evaluating the PHQ‐9 in our cohort already, and did not want to increase responder burden by presenting them with 2 depression questionnaires.
We followed all patients until 30 days after discharge, and outcome data (all‐cause mortality or all‐cause readmission) were collected by research personnel blinded to the patient's frailty status at discharge using patient/caregiver self‐report and analysis of the provincial electronic health record. We included deaths in or out of the hospital, and all readmissions were unplanned.
We examined the correlation between the CFS score (5 vs <5) and (1) the modified Fried score (3 vs <3) and (2) TUGT (20 seconds vs >20 seconds) using chance corrected kappa coefficients. In our previous article[14] we reported the association between the CFS and readmissions/hospitalizations within 30 days of discharge. In this article we examine whether either the Fried score or TUGT accurately and independently predict postdischarge readmissions/deaths, and whether they add additional prognostic information to the CFS assessment by comparing models with/without each definition using the C statistic and the Integrated Discrimination Improvement index. All analyses were performed using SAS version 9.4 (SAS Institute, Cary, NC), with P values of <0.05 considered statistically significant. Subgroup analysis was done in patients older than 65 years.
RESULTS
Of 1124 potentially eligible patients, 626 were excluded because of patient refusal (n = 227); transfer to/from another hospital, long‐term care facility, or out of province (n = 189); moderate to severe cognitive impairment (n = 88); language barriers (n = 71); or foreshortened life expectancy (n = 51). Another 3 patients withdrew consent prior to outcome assessment. The 495 patients we recruited and had outcome data for had a mean age of 64 years, 19.6% were older than 80 years, 50% were women, and the patients had a mean of 4.2 comorbidities and mean Charlson score of 2.4. The 4 most common reasons for hospital admission were heart failure, pneumonia, chronic obstructive pulmonary disease, and urinary tract infection, and the median length of stay was 5 days (interquartile range: 49 days).
Prevalence of Frailty According to Different Definitions
Although the CFS assessment resulted in 162 (33%) patients being deemed frail, only 82 (51%) of those patients also met the phenotype frailty definition using either the Fried model or the TUGT, and 49 (10%) patients who were not classified as frail on the CFS met either of the phenotypic definitions of frailty (Figure 1). Overall, 211 (43%) patients were frail according to at least 1 assessment, and 46 (9%) met all 3 frailty definitions. In the subgroup of 245 patients older than 65 years, 137 (56%) were frail according to at least 1 assessment, 38 (16%) met all 3 frailty definitions, and 27 (11%) of those patients classified as not frail on the CFS met either phenotypic definition of frailty. Agreement between TUGT and CFS or CFS and Fried was relatively poor with kappas of 0.31 (95% confidence interval [CI]: 0.23‐0.40) and 0.33 (95% CI: 0.25‐0.42), respectively. It is noteworthy that some patients deemed nonfrail on the CFS had slow gait speeds, and most CFS‐frail patients had gait speeds in the nonfrail range (Figure 2).
Characteristics According to Frailty Status
Although frail patients were generally similar across definitions (Table 1) in that they were older, had more comorbidities, more hospitalizations in the prior year, and longer index hospitalization lengths of stay than nonfrail patients, patients meeting phenotypic definitions of frailty but not classified as frail on the CFS were younger, had lower Charlson scores, higher EQ‐5D scores, and were discharged with less medications (Table 1).
| Not Frail on Any of the 3 Models, n = 284 | Frail on the CFS Only, n = 80 | Frail on the Fried and/or TUGT but Not the CFS, n = 49 | Frail on CFS and Either Phenotype Model, n = 82 | P Value Comparing the 3 Frailty Columns | |
|---|---|---|---|---|---|
| |||||
| Age, y, mean (95% CI) | 57.3 (55.259.5) | 69.1 (65.872.3) | 63.1 (57.968.3) | 75.8 (72.679.0) | <0.001 |
| Sex, female, no (%) | 118 (41.6) | 49 (61.3) | 27 (55.1) | 56 (68.3) | 0.3 |
| No. of comorbidities, mean (95% CI) | 4.2 (3.84.5) | 6.0 (5.56.6) | 4.0 (3.14.9) | 6.5 (5.87.2) | <0.001 |
| Charlson comorbidity score, mean (95% CI) | 2.4 (2.12.6) | 3.4 (3.03.9) | 2.6 (2.03.2) | 3.8 (3.34.2) | 0.01 |
| No. of patients hospitalized in prior 12 months, no (%) | 93 (32.8) | 44 (55.0) | 27 (55.1) | 54 (65.9) | 0.3 |
| Preadmission living situation, no (%) | 0.01 | ||||
| Living at home independently | 221 (77.8) | 26 (32.5) | 25 (51.0) | 17 (20.7) | |
| Living at home with help | 59 (20.8) | 43 (53.8) | 19 (38.8) | 48 (58.5) | |
| Assisted living or lodge | 4 (1.4) | 11 (13.8) | 5 (10.2) | 17 (20.7) | |
| EQ‐5D overall score, /100, mean (95% CI) | 66.9 (65.068.9) | 62.0 (57.666.4) | 56.6 (51.361.8) | 58.3 (53.962.7) | 0.28 |
| Goals of care in the hospital, no (%) | <0.0001 | ||||
| Resuscitation/ICU | 228 (83.5) | 41 (54.7) | 39 (84.8) | 29 (39.7) | |
| ICU but no resuscitation | 21(7.7) | 17 (22.7) | 1 (2.2) | 16 (21.9) | |
| No ICU, no resuscitation | 23 (8.4) | 17(22.7) | 6 (13.0) | 28 (37.8) | |
| Comfort care | 1 (0.4) | 0 | 0 | 0 | |
| Timed Up and Go Test, s, mean (95% CI) | 10.9 (10.411.3) | 13.9 (12.914.9) | 26.3 (19.033.6) | 30.3 (26.833.7) | <0.0001 |
| Grip strength, kg, mean (95% CI) | 32.1 (30.733.5) | 24.3 (22.3‐ 26.3) | 22.1 (19.924.2) | 17.7 (16.219.1) | <0.0001 |
| Serum albumin, g/L, mean (95% CI) | 34.2 (32.835.5) | 35.0 (33.037.0) | 31.1 (27.934.4) | 33.1 (31.434.9) | 0.07 |
| No. of prescription medications at discharge, mean (95% CI) | 5.2 (4.85.6) | 8.8 (7.99.6) | 6.1 (5.17.1) | 8.2 (7.58.9) | <0.0001 |
| Length of stay, d, median, [IQR] | 5 [37] | 6 [411] | 7 [3.512] | 7 [59] | 0.02 |
Outcomes According to Frailty Status
The overall rate of 30‐day death or hospital readmission was 17.1% (85 patients), primarily as a result of hospital readmissions (81, 16.4%) (Table 2). Although patients classified as frail on the CFS exhibited significantly higher 30‐day readmission/death rates (24.1% vs 13.8% for not frail, P = 0.005) even after adjusting for age and sex (adjusted odds ratio [aOR]: 2.02, 95% CI: 1.19‐3.41) (Table 3), patients meeting either of the phenotypic definitions for frailty but not the CFS definition were not at higher risk for 30‐day readmission/death (aOR: 0.87, 95% CI: 0.34‐2.19) (Table 3). The group at highest risk for 30‐day readmissions/death were those meeting both the CFS and either phenotypic definition of frailty (25.6% vs 13.8% for those not frail, aOR: 2.15, 95% CI: 1.10‐4.19) (Tables 2 and 3). None of the Integrated Discrimination Improvement indices (for modified Fried added to CFS or TUGT added to CFS) were statistically significant, suggesting no net new information was added to predictive models, and there were no appreciable changes in C statistics (Table 3). Neither the modified Fried score nor the TUGT on their own added independent prognostic information to age/sex alone as predictors of postdischarge outcomes. It is noteworthy that the areas under the curve for models using any combination of the frailty definitions plus age and sex were not high (all ranged between 0.55 and 0.60 for the overall cohort and from 0.52 and 0.65 in the elderly). If the frailty definitions were examined as continuous variables rather than dichotomized into frail/not frail, the C statistics were not appreciably better: 0.65 for CFS, 0.58 for TUGT, and 0.60 for modified Fried. Of note, the CFS score with the published cutoff of 5 demonstrated the highest kappa, sensitivity, specificity, and positive predictive value in relation to outcomes.
| Outcomes (Not Mutually Exclusive) | Not Frail on Any of the 3 Models | Frail on the CFS Only | Frail on the Fried and/or TUGT | Frail on CFS and Either Phenotype Model | P Value Comparing the 3 Frailty Columns |
|---|---|---|---|---|---|
| |||||
| Entire cohort | n = 284 | n = 80 | n = 49 | n = 82 | |
| Discharge disposition | <0.002 | ||||
| Live at home independently | 203 (71.5) | 16 (20.0) | 19 (38.8) | 10 (12.2) | |
| Live at home with help | 77 (27.1) | 52 (65.0) | 25 (51.0) | 50 (61.0) | |
| Assisted living or lodge | 4 (9.3) | 12 (15.0) | 5 (10.2) | 22 (26.8) | |
| 30‐day readmission or death | 40 (14.1) | 18 (22.5) | 6 (12.2) | 21 (25.6) | 0.2 |
| 30‐day hospital readmission | 39 (13.8) | 18 (22.5) | 6 (12.2) | 18 (22.0) | 0.31 |
| Death | 5 (1.8) | 3 (3.8) | 1 (2.0) | 4 (4.9) | 0.9 |
| 30‐day ER visit | 66 (23.2) | 30 (37.5) | 12 (24.5) | 23 (17.6) | 0.25 |
| Patients aged 65 years or older | n = 108 | n = 47 | n = 27 | n = 63 | |
| Discharge disposition | 0.03 | ||||
| Live at home independently | 69 (63.9) | 9 (19.2) | 10 (37.0) | 6 (9.5) | |
| Live at home with help | 36 (33.3) | 30 (63.8) | 13 (48.2) | 39(61.9) | |
| Assisted living or lodge | 3 (3.8) | 8 (17.0) | 4 (14.8) | 18 (28.6) | |
| 30‐day readmission or death | 13 (12.0) | 13 (27.7) | 3 (11.1) | 17 (27.0) | 0.22 |
| 30‐day hospital readmission | 12 (11.1) | 13 (27.7) | 3 (11.1) | 14 (22.2) | 0.26 |
| Death | 2 (1.9) | 3 (6.4) | 1 (3.7) | 3 (4.8) | 0.87 |
| 30‐day ER visit | 20 (18.5) | 17 (36.2) | 6 (22.2) | 18 (28.6) | 0.45 |
| Frailty Definition | Adjusted Odds Ratio for 30‐Day Readmission/Death | 95% CI | C Statistic for Model Predicting 30‐Day Readmission/Death Including Age, Sex, and Frailty Definition (95% CI) |
|---|---|---|---|
| |||
| Entire cohort | |||
| CFS (overall) | 2.02 | 1.193.41 | 0.60 (0.530.65) |
| CFS (plus either phenotype model) | 2.15 | 1.104.19 | 0.60 (0.520.64) |
| CFS (but neither phenotype model) | 1.81 | 0.943.48 | 0.60 (0.520.64) |
| Fried | 1.32 | 0.752.30 | 0.55 (0.560.58) |
| TUGT | 1.34 | 0.732.44 | 0.55 (0.460.58) |
| Fried and/or TUGT | 0.87 | 0.342.19 | 0.55 (0.470.58) |
| Patients aged 65 years or older | |||
| CFS (overall) | 3.20 | 1.556.60 | 0.65 (0.560.73) |
| CFS (plus either phenotype model) | 3.20 | 1.337.68 | 0.65 (0.550.72) |
| CFS (but neither phenotype model) | 3.08 | 1.267.47 | 0.65 (0.550.72) |
| Fried | 1.28 | 0.642.56 | 0.52 (0.390.53) |
| TUGT | 1.44 | 0.702.97 | 0.52 (0.390.53) |
| Fried and/or TUGT | 1.41 | 0.722.78 | 0.54 (0.420.56) |
Outcomes According to Frailty Status in the Elderly Subgroup
Although absolute risks of readmission or death were higher in elderly patients than younger patients, the excess risk was largely seen in those elderly patients classified as frail on the CFS. In fact, all of the associations reported above for the entire cohort were in the same direction in the elderly subgroup (Tables 2 and 3).
DISCUSSION
In summary, we found that of patients being discharged from general medical wards who were frail according to at least 1 of the 3 tools we used, only 22% met all 3 frailty case definitions (including only 28% of elderly patients deemed frail by at least 1 definition). There was surprisingly poor correlation between phenotypic markers of frailty such as poor mobility (slow TUGT) or the modified Fried Index and the CFS, even amongt elderly patients. The most clinically useful of the frailty assessment tools (both overall and in those patients who are elderly) appears to be the CFS, because it more accurately identifies those at higher risk of adverse outcomes after discharge, does not require special equipment to conduct, and is faster to do than the phenotypic assessment models we tested. We have also previously demonstrated that the CFS, after a brief training period identical to that used in this study, is reproducible between observers[19] and remains an independent predictor of adverse 30‐day outcomes even after adjusting for age, sex, comorbidities, and the LACE (length of stay, acuity of the admission, comorbidity, emergency room visits during the previous 6 months) score.[14]
Although some[10] have advocated for the use of mobility assessments (such as gait speed) as a frailty marker due to its ease of measurement and objectivity, we found that slow TUGT (which is a marker for mobility and not just slow gait speed) was not an independent prognostic marker for postdischarge outcomes. We hypothesize that the phenotypic models of frailty performed less well than the CFS as they focus on the measurement of particular physical attributes and do not take into account cognitive or psychosocial characteristics or comorbidity burden that also influence postdischarge outcomes. As well, the CFS captures the patients' baseline status prior to acute illness, whereas the phenotypic measures were assessed just prior to discharge and thus may provide less information about eventual recovery potential. Some have suggested that repeating phenotype measures postdischarge might be more informative,[20] but this would reduce clinical applicability a great deal. Certainly, an analysis[21] of the Cardiovascular Health Study cohort demonstrated that cumulative deficit models of frailty (for which the CFS is an accurate proxy[9, 15]) better predicted risk of death than phenotypic models.
Although a number of published studies have shown similar results to ours in that frail patients are at greater risk for death and/or hospitalization,[22, 23, 24] there is surprisingly little literature on the comparative predictive performance of the different frailty instruments and the extent to which they overlap. Cigolle et al.[25] compared 3 frailty scales (the Functional Domain Model, the Burden Model, and the Fried score) in the Health and Retirement Study and, similarly to us, found that although 30.2% were frail on at least 1 of these scales, only 3.1% were deemed frail by all 3. The Conselice Study of Brain Aging[5] also reported that a deficit accumulation model defined a much higher prevalence of frailty (37.6%) than the 11.6% identified using the phenotypic Study of Osteoporotic Fractures (SOF) index based on weight loss, mobility, and level of energy. Another study[26] reported that risk models incorporating either the SOF index or the Fried score exhibited C statistics of only 0.61 for predicting falls in elderly females. A cohort study[27] from 2 English general medical units also found that none of the 5 frailty models was particularly accurate at predicting risk of readmission at 3 months, with C statistics ranging between 0.52 and 0.57. Although frailty assessment at time of hospital admission predicted in‐hospital mortality and length of stay in another English study, it was not independently associated with 30‐day outcomes after adjusting for age, sex, and comorbidities including dementia.[27] To our knowledge, these latter 2 are the only other studies reported to date performed in hospitalized patients to assess whether frailty assessment helps predict postdischarge outcomes. Thus, the poor C statistics we found for all of our frailty tools confirms prior literature that frailty assessment alone is inadequate to accurately identify those patients at highest risk for poor outcomes in the first 30 days after discharge. However, frailty assessment together with consideration of each individual's comorbidities, cognitive status, psychosocial circumstances, and environment can be useful to flag those individuals who may need extra attention postdischarge to optimize outcomes.
Strengths and Limitations
Although this was a prospective cohort study with blinded ascertainment of endpoints (30‐day outcome data were collected by observers who were unaware of the patients' CFS or phenotypic model scores), it is not without limitations. First, the only postdischarge outcomes we assessed were readmission and death, and it would be interesting to evaluate which frailty tools best predict those who are most likely to benefit from home‐care services in the community. Second, as we were interested in 30‐day readmission rates, we excluded long‐term care residents from our study and patients who had foreshortened life expectancy, in essence, the frailest of the frail. Although this reduced the size of any association between frailty and adverse outcomes, we focused this study on the situations where there is clinical equipoise and there is rarely a diagnostic dilemma around the identification of frailty and need for increased services in palliative or long‐term care patients. Third, we did not use exactly the same questionnaires or gait speed assessments as used in the original Fried score description, but as outlined in the Methods section, we used analogous questions on closely related questionnaires to extract the same information. Fourth, some might consider our comparisons biased toward the CFS, as it reflects gestalt clinical impressions (informed by patients and proxies) of frailty status before hospital admission while the Fried score and TUGT were based on patient status just prior to discharge, it may be that the former is a better measure of eventual recovery (and ongoing risk) than the latter measures. If this is the case, for the purposes of targeting interventions to prevent postdischarge complications, it would suggest to us that the CFS is better suited, whereas phenotype tools can be reserved for the postdischarge phase of recovery. By the same token, perhaps serial measures of the CFS and phenotypic tools are more important, as the trajectory of recovery may be most informative for risk prediction.[7] Certainly, if one were interested in changes in functional status during hospitalization,[29] then objective phenotypic measures such as grip strength or TUGT times would seem more appropriate choices. Fifth, some may perceive it as a weakness that we did not restrict our cohort to elderly patients; however, we actually view this as a strength, because frailty is not exclusive to older patients. Sixth, although we restricted this study to patients being discharged from general internal medicine wards, it is worth mentioning that previous studies have shown similar associations between frailty and outcomes in nonmedical hospitalized patients.[19, 22, 23, 24]
In conclusion, we looked at 3 different ways of screening for frailty, 1 being a subjective but well‐validated tool (the CFS) and the other 2 being objective assessments that look at specific phenotypic characteristics. There is a compelling need to find a standardized assessment to determine frailty in both research and clinical settings, and our study provides support for use of the CFS over the Fried or TUGT as screening tools. Standardized frailty assessments should be part of the discharge planning for all medical patients so that extra resources can be properly targeted at those patients at greatest risk for suboptimal transition back to community living.
Acknowledgements
The authors acknowledge Miriam Fradette and Debbie Boyko for their important contributions in data acquisition, as well as all the physicians rotating through the general internal medicine wards for their help in identifying the patients.
Disclosures: Author contributions are as follows: study concept and design: Finlay A. McAlister, Sumit R. Majumdar, and Raj Padwal; acquisition of patients and data: Sara Belga, Darren Lau, Jenelle Pederson, and Sharry Kahlon; analysis of data: Jeff Bakal, Sara Belga, Finlay A. McAlister; first draft of manuscript: Sara Belga and Finlay A. McAlister; critical revision of manuscript: all authors. Funding for this study was provided by an operating grant from Alberta InnovatesHealth Solutions. Alberta InnovatesHealth Solutions had no role in role in the design, methods, subject recruitment, data collections, analysis, or preparation of the article. Finlay A. McAlister and Sumit R. Majumdar hold career salary support from Alberta InnovatesHealth Solutions. Finlay A. McAlister holds the Chair in Cardiovascular Outcomes Research at the Mazankowski Heart Institute, University of Alberta. Sumit R. Majumdar holds the Endowed Chair in Patient Health Management from the Faculty of Medicine and Dentistry, and the Faculty of Pharmacy and Pharmaceutical Sciences, University of Alberta. The authors have no affiliations or financial interests with any organization or entity with a financial interest in the contents of this article. All authors had access to the data and played a role in writing and revising this article. The authors declare no conflicts of interest.
- , , , , . Untangling the concepts of disability, frailty, and comorbidity: implications for improved targeting and care. J Gerontol A Biol Sci Med Sci. 2004;59:255–263.
- , , , , . The identification of frailty: a systematic literature review. J Am Geriatr Soc. 2011;59:2129–2138.
- , , , , . Frailty in elderly people. Lancet. 2013;381:752–762.
- , , , , , . Outcome instruments to measure frailty: a systematic review. Ageing Res Rev. 2011;10:104–114.
- , , , , , . A comparison of frailty indexes for prediction of adverse health outcomes in a elderly cohort. Arch Gerontol Geriatr. 2012;54:16–20.
- , , , et al. Frailty in older adults: evidence for a phenotype. J Gerontol A Biol Sci Med Sci. 2001;56:M146–M156.
- , , , . Prevalence of frailty in community‐dwelling older persons: a systematic review. J Am Geriatr Soc. 2012;60:1487–1492.
- , , . Sex differences in the risk of frailty for mortality independent of disability of chronic diseases. J Am Geriatr Soc. 2005;53:40–47.
- , , . A comparison of two approaches to measuring frailty in elderly people. J Gerontol. 2007;62:738–743.
- , , . A diagnosis of dismobility—giving mobility clinical visibility: a mobility working group recommendation. JAMA. 2014;311:2061–2062.
- , , , et al. Gait speed and survival in older adults. JAMA. 2011;301:50–58.
- , , , et al. Frailty assessment in the cardiovascular care of older adults. J Am Coll Cardiol. 2014;63:747–762.
- , . The timed “Up and Go” test: a test of basic functional mobility for frail elderly persons. J Am Geriatr Soc. 1991;39:142–148.
- , , , et al. Association between frailty and 30‐day outcomes after discharge from hospital. CMAJ. 2015;187:799–804.
- , , , et al. A global clinical measure of fitness and frailty in elderly people. CMAJ. 2005;173:489–495.
- , , , et al. Do muscle mass, muscle density, strength, and physical function similarly influence risk of hospitalization in older adults? J Am Geriatr Soc. 2009;57:1411–1419.
- , . Grip strength in older adults: test‐retest reliability and cutoff for subjective weakness of using the hands in heavy tasks. Arch Phys Med Rehabil. 2010;91:1747–1751.
- , . The PHQ‐9: a new depression measure. Psychiatr Ann. 2002;32:509–515.
- , , , et al. Association between frailty and short‐ and long‐term outcomes among critically ill patients: a multicenter prospective cohort study. CMAJ. 2013;186:e95–e102.
- , . Risk after hospitalization: we have a lot to learn. J Hosp Med. 2015;10:135–136.
- , , , , , . Cumulative deficits better characterize susceptibility to death in elderly people than phenotypic frailty: lessons from the Cardiovascular Health Study. J Am Geriatr Soc. 2008;56:898–903.
- , , . Unplanned hospital readmission and its predictors in patients with chronic conditions. J Formos Med Assoc. 2002;101:779–785.
- , , , et al. Frailty and early hospital readmission after kidney transplant. Am J Transplant. 2013;13:2091–2095.
- , , , , , . Simple frailty score predicts postoperative complications across surgical specialities. Am J Surg. 2013;206:544–550.
- , , , . Comparing models of frailty: the Health and Retirement Study. J Am Geriatr Soc. 2009;57:830–839.
- , , , et al. Comparison of 2 frailty indexes for prediction of falls, disability, fractures, and death in older women. Arch Int Med. 2008;168:382–389.
- , , , , , . The predictive properties of frailty‐rating scales in the acute medical unit. Age Ageing. 2013;42:776–781.
- , , , . Association of the clinical frailty scale with hospital outcomes. QJM. 2015;108:943–949.
- , , . Hospitalization‐associated disability: she was probably able to ambulate, but I'm not sure. JAMA. 2011;306:1782–1793.
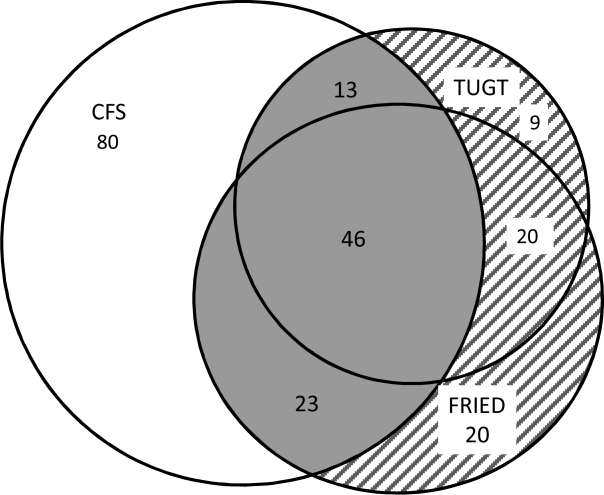
Hospital‐Wide Readmission Rates
The hospital‐wide all‐cause 30‐day readmission rate is a key quality measure associated with patient outcomes, cost of care, and wasted hospital resources.[1] The estimated 20% readmission rate of Medicare patients and the associated $17 billion annual cost of readmissions led the Centers for Medicare and Medicaid Services (CMS) to implement policies that limit reimbursement for 30‐day unplanned readmissions and thus place hospitals with high readmission rates at financial risk.[1, 2]
The variation in readmission rates between hospitals is well documented in the literature.[3, 4] Singh et al. found that 9.3% of the variation in readmissions can be explained by hospital characteristics.[4] Hospital factors associated with lower readmission rates include not‐for‐profit ownership, hospital size, and nursing staffing levels.[5, 6, 7] Other studies found an association between environmental factors such as the percent of patients living under the poverty line and higher readmission rates.[7] The recent publicly available CMS data on readmission rates allows us to further our understanding of hospital characteristics that explain the variation in readmission rates. In this article, we are specifically interested in hospitalist staffing levels and hospital‐physician arrangements such as physician integration level and physician ownership. Moreover, we are interested in novel organizational variables, specifically, the adoption of a medical home model, which has been ignored by previous research. Medical homes are associated with better quality[8]; hospitals that already adopted the medical home model might be better equipped to coordinate care after the patients are discharged.
In recent years, the number of hospitals relying on hospitalists to provide inpatient care has been on the rise. As more hospitals employ hospitalists, it is important to understand how hospitalist staffing levels are associated with quality. Previous studies have linked hospitalists with lower hospital mortality rates,[7] lower cost of care,[9, 10] and lower readmission rates.[10, 11] Goodrich et al., on the other hand, did not find a significant relationship between the presence of hospitalists and mortality or readmission rates.[12] In a recent study, hospitalists indicated that heavy workloads limited the time they had available to communicate with patients, which negatively influenced quality and patient satisfaction, and resulted in delayed admissions and discharges.[13]
The main objective of this article was therefore to study the association between hospitalist staffing levels and hospital‐wide all‐cause readmission rates. Most empirical studies examining the relationship between hospitalist staffing and quality of inpatient care have predominantly focused on whether the presence of hospitalists who provided care at a hospital influenced mortality or readmissions.[11, 12] In this article, we contribute to the literature by examining how staffing levels measured by the ratio of hospitalists to general medical and surgical beds is associated with 30‐day readmission rates. We predict that there is a positive association between readmission rates and hospitalists per bed.
Hospitals have a broad range of contractual arrangements or integration levels with physicians, with employment being the highest level. A hospital can rely on physicians who have admitting privileges but are not salaried employees of the hospital to treat a large portion of its inpatient population. In the past few years, with the passage of the Patient Protection and Affordable Care Act (2010) and the shift in reimbursement towards Value Based Purchasing (VBP), more hospitals are choosing to ensure that physicians are strongly integrated within the hospital by adopting an employment‐based model. Moreover, hospitals view physician employment as a strategic move that will help ensure or expand their market share.[14] For instance, the number of surgeons who identified as self‐employed dropped from 48% in 2001 to 28% in 2011, and this reduction is attributed to the shift toward hospital employment of physicians.[15] Despite the evolving models of hospital‐physician arrangements, little is understood on how the adoption of the integrated salary model, in addition to the equity and foundation models, which are classified by Baker et al. as the highest level of integration, influence quality.[16] Therefore, another objective of this article was to examine the association between hospital‐physician arrangements and all‐cause unplanned readmission rates.
METHODS
Data Source and Sample
Data from the American Hospital Association (AHA) Annual Survey (2013), CMS Hospital Compare (October 2013), and Area Health Resource File (2013) were merged to analyze the association between readmission rates with hospital characteristics and environmental factors. We limited the analysis to private (nonpublic) hospitals with no missing data. Our final sample consisted of 1756 hospitals. Of the hospitals in our sample, 14% were for profit, 70% were nonteaching, 23% were minor teaching, 7% were major teaching hospitals, 73% belonged to a system, and 31% were classified as small hospitals. Table 1 provides descriptive statistics for all the variables included in the analysis.
| Variable | Value | Data Source |
|---|---|---|
| ||
| 30‐day all‐cause readmissions, median (IQR) | 15.8% (15.2%16.5%) | Centers for Medicare and Medicaid Services |
| Hospitalists per general medicine and surgical beds, median (IQR) | 0.09 (0.060.15) | American Hospital Association |
| RNs per 100 inpatient days, median (IQR) | 0.84 (0.6610.10) | American Hospital Association |
| Medicare admissions, median (IQR) | 48.45% (40.84%55.14%) | American Hospital Association |
| Medicaid admissions, median (IQR) | 16.45% (11.06%22.76%) | American Hospital Association |
| Competition, median (IQR) | 0.56 (0.230.83) | American Hospital Association |
| Unemployment, median (IQR) | 2.9% (2.54%3.37%) | Area Resource File |
| Fully integrated | American Hospital Association | |
| Yes | 51% | |
| No | 49% | |
| Physician ownership | American Hospital Association | |
| Physician partial or complete ownership | 5% | |
| No physician ownership | 95% | |
| Established medical home program | American Hospital Association | |
| Yes | 29% | |
| No | 71% | |
| High technology | American Hospital Association | |
| Yes | 40% | |
| No | 60% | |
| Teaching level | American Hospital Association | |
| Nonteaching | 70% | |
| Minor teaching | 23% | |
| Major teaching | 7% | |
| Size | American Hospital Association | |
| Small | 31% | |
| Medium | 34% | |
| Large | 35% | |
| Ownership | American Hospital Association | |
| For profit | 14% | |
| Not for profit | 86% | |
| Critical access hospital | American Hospital Association | |
| Yes | 11% | |
| No | 89% | |
| System membership | American Hospital Association | |
| Yes | 73% | |
| No | 27% | |
Variables
Dependent Variable
Risk standardized 30‐day hospital‐wide all‐cause readmission rates (HWR) were obtained from CMS. This measure was publicly reported in October 2013. The HWR is estimated using standardized risk ratios at the hospital level for the following 5 discharge diagnosis groups: surgery/gynecology, neurology, cardiorespiratory, cardiovascular, and general medicine.[17] The measure adjusts, in addition to a hospital's case mix, for patients' ages, principal discharge diagnoses, and comorbidities.[17] HWR is calculated as a predicted‐to‐expected readmissions ratio. Predicted and expected readmissions were calculated for each of the 5 groups for each hospital using each hospital's patient mix and a hospital random effects estimate. A standardized readmission ratio was then derived by dividing predicted readmissions by expected readmissions for each group for each hospital. A single hospital score was obtained by multiplying the volume‐weighted logarithmic average of the 5 diagnostic groups by the average national readmission rate.[18]
Independent Variables
The primary independent variable of interest to this study is hospitalist staffing levels. We calculate the staffing levels of hospitalists by dividing the full‐time equivalent (FTE) of hospitalists by the number of general medical and surgical beds. FTE hospitalists are calculated by the AHA Annual Survey database (2013) as the sum of full‐time hospitalists and 0.5*number of part‐time hospitalists. In addition to hospitalist staffing levels, a main predictors is whether the hospital fully integrates physicians or not. We follow Baker et al. in our classification of full integration. Baker et al. define fully integrated hospitals as those that adopted 1 of the following models with their physicians: integrated salary, foundation or equity model.[16] We predict that fully integrated hospitals are more likely to have better readmission rates. Another key physician variable that is likely to influence outcomes is physician partial or full ownership of the hospital. Ownership aligns physicians' incentives with hospital performance[19] and is therefore likely to be associated with better readmission rates. We also include a dichotomous variable that indicates whether a hospital has an established medical home program or not. Medical homes indicate an organizational culture that is patient centered and committed to continuity and coordination of care; all of which are important for better quality. We predict that the presence of a medical home model will be associated with better readmission rates.
Control Variables
We control for registered nurses per 100 inpatient days ratio, critical access designation, Medicare share of hospital admissions, Medicaid share of hospital admissions, teaching status, size, and technology level. Previous research indicates that these variables are associated with patient outcomes.[20, 21] We follow the Aiken et al. characterization of teaching status: hospitals with no residency programs (nonteaching), hospitals with a resident‐to‐bed ratio of 1 to 4 or less (minor teaching), and hospitals with a resident‐to‐bed ratio of more than 1 to 4 (major teaching).[20] We also classify hospitals as small if they have less than 100 beds, medium if they have 101 to 250 beds, and large if they have more than 250 beds. We modify the Aiken et al. classification of technology level and control for the level of technology adopted at a hospital by classifying hospitals as high technology if they offer any of the following services: any major organ transplant, computer‐assisted orthopedic surgery, or electron beam computed tomography.[21] We also control for 2 market level variables: (1) competition estimated by the county level Herfindahl‐Hirschman Index (HHI) and (2) the percentage of individuals in the county who are unemployed. Unemployment rates are derived from the Area Health Resource File (2013). HHI is calculated by summing the squares of market shares of admissions. For ease of interpretation, competition is coded as 1‐HHI.
Statistical Analysis
We ran a multivariate ordinary least squares (OLS) regression on Stata 12 (StataCorp, College Station, TX) to assess the relationship between 30‐day all‐cause readmissions and hospitalist staffing levels, physician integration, physician ownership, and other organizational characteristics. We checked for multicollinearity by using a variance inflation factor (VIF). The VIF of all independent variables was less than 10, and therefore multicollinearity was not of concern to this analysis.
RESULTS
Among our sample of 1756 hospitals, the median 30‐day all‐cause readmission rate was 16%, with the middle 50% of hospitals with readmission rates between 15.2% and 16.5%. All of the hospitals in this study reported that hospitalists provide care at the hospitals. The median Medicare share of hospital admissions was 48.46%, and the median Medicaid share of hospital admissions was 16.4%. Fifty‐one percent of the hospitals in our sample were fully integrated. Fifty percent of hospitals had 9 or fewer hospitalists per 100 general medical and surgical beds. Only 5% of the hospitals had partial or full physician ownership. Twenty‐nine percent of hospitals had an established medical home program. Table 1 provides summary statistics and the data sources of all the variables included in the study.
To compare readmission rates, we created a dummy variable that divided the sample into 2 categories: hospitals with low hospitalist staffing levels (hospitalists per general medical and surgical beds is less than the median) and high hospitalist staffing (hospitalists per general medical and surgical bed ratio is more than the median). We then used t tests to compare all‐cause readmission rates between hospitals with low and high hospitalist staffing levels, physician owned versus nonphysician owned, and fully integrated versus not fully integrated. We also used single‐factor analysis of variance (ANOVA) to compare readmission rates between nonteaching, minor teaching, and major teaching hospitals. Results are displayed in Table 2. There was a significant difference in the mean readmission rates between hospitals with low hospitalist staffing levels (mean readmission rate = 16.06%) versus high staffing levels (mean readmission rate = 15.72%). The mean readmission rate for physician‐owned hospitals was significantly lower than for nonphysician‐owned hospitals (15.46% vs 15.9%). Also, fully integrated hospitals had a lower readmission rate than hospitals where physicians were not fully integrated (15.93% vs 15.86%). Based on the ANOVA results, there was a significant difference between teaching levels. According to a Tukey honest significant difference post hoc test, there was no significant difference between nonteaching and minor teaching hospitals, but the readmission rate was significantly higher in major teaching hospitals (nonteaching = 15.83%, minor teaching = 15.76%, major teaching = 16.9%).
| Variable | Readmission Rates | P Value |
|---|---|---|
| Hospitalist staffing levels | ||
| Low | 16.06% | 0.00 |
| High | 15.72% | |
| Physician ownership | ||
| Fully or partially physician‐owned hospitals | 15.46% | 0.00 |
| Nonphysician‐owned hospitals | 15.9 % | |
| Physician integration | ||
| Fully integrated hospitals | 15.86% | 0.00 |
| Nonintegrated hospitals | 15.93% | |
| Teaching status | ||
| Nonteaching hospitals | 15.83% | 0.00 |
| Minor teaching hospitals | 15.76% | |
| Major teaching hospitals | 16.9% |
The OLS regression model was significant and explained 16% of the variability in readmission rates (Table 3). Higher hospitalists staffing levels were associated with lower 30‐day all cause readmission rates (P = 0.00). The addition of 1 hospitalist per general and surgical bed was associated with a 0.77 percentage points decrease in adjusted readmission rates. In terms of hospital‐physician arrangements, fully integrated hospitals had adjusted 30‐day all‐cause readmission rates 0.09 percentage points lower than nonfully integrated hospitals (P = 0.08). Physician partial or full ownership was significantly associated with lower readmission rates (P = 0.00); hospitals partially or fully owned by physicians had adjusted readmission rates 0.36 percentage points lower than nonphysician‐owned hospitals.
| Variable | Coefficient | Standard Error | P Value |
|---|---|---|---|
| |||
| Hospitalists per general and surgical beds | 0.77 | 0.172 | 0.00 |
| Full integration | 0.086 | 0.049 | 0.08 |
| Physician ownership | 0.355 | 0.119 | 0.00 |
| RNs per 100 inpatient days | 0.174 | 0.050 | 0.00 |
| Established medical home program | 0.132 | 0.057 | 0.02 |
| Medicare admissions | 0.063 | 0.002 | 0.21 |
| Medicaid admissions | 0.015 | 0.003 | 0.00 |
| Competition | 0.115 | 0.08 | 0.17 |
| Unemployment | 0.244 | 0.037 | 0.00 |
| System membership | 0.041 | 0.055 | 0.45 |
| Teaching level | |||
| Minor teaching | 0.007 | 0.066 | 0.92 |
| Major teaching | 1.032 | 0.106 | 0.00 |
| Size | |||
| Medium | 0.032 | 0.071 | 0.66 |
| Large | 0.066 | 0.085 | 0.44 |
| For‐profit ownership | 0.206 | 0.078 | 0.01 |
| High technology | 0.077 | 0.055 | 0.17 |
| Critical access hospital | 0.202 | 0.092 | 0.03 |
Based on the regression analysis, major teaching hospitals on average had adjusted readmission rates 1.03 percentage point higher than nonteaching hospitals (P = 0.000), whereas there was no significant difference between minor and nonteaching hospitals (P > 0.1). As the number of registered nurses (RNs) per 100 inpatient days increased by 1, readmission rates dropped by 0.17 (P = 0.00). Hospitals with higher Medicaid shares of admission had significantly higher readmission rates (P < 0.05). Hospitals located in counties with higher unemployment rates also had higher readmission rates (P = 0.000), whereas market competition had no significant association with readmissions. For‐profit hospitals had adjusted readmission rates 0.21 percentage points higher than not‐for‐profit hospitals (P = 0.01). Finally, hospitals that have adopted a medical home model had significantly lower readmission rates (P = 0.02); hospitals with an established medical home model had adjusted readmission rates 0.17 percentage points lower than their counterparts.
DISCUSSION
In the era of VBP and mounting pressures on hospitals to improve quality and lower cost, it is important to understand the association between modifiable hospital characteristics, such as hospitalist staffing levels, and unmodifiable characteristics, such as teaching status and size, with quality of care. There are many factors that can contribute to higher readmission rates. Some of these factors are hospital related and others are patient related, such as the environment in which a patient resides. Benbassat and Taragin argue that 9% to 48% of hospital readmissions are avoidable and are related to factors such as inadequate resolution of the problem the patient was admitted for and poor discharge care.[22] In this article, we have focused on hospital and market factors. Our main variables of interest were hospitalist staffing level, physician full integration, physician ownership, and the adoption of the medical home model at the hospital. Moreover, we examined the association between the hospital environment, specifically, market competition, and the patient environment, specifically, unemployment rates, with readmission rates.
Hospitalists' provision of inpatient care has been on the rise. From 1997 to 2006, the likelihood of receiving inpatient care from a hospitalist grew by 29.2% per year.[23] Based on AHA (2013) data, 65% of hospitals reported that hospitalists provided care at the hospital. The main driver behind the adoption of the hospitalists' model is the positive role hospitalists play in improving hospital efficiency and their familiarity and specialization in hospital care.[24] However, concerns exist that hospitalists might negatively influence patient outcomes given the discontinuity of care that occurs once the patient is discharged from the hospital and back to the care of their primary care physician.[25] Based on our analysis though, higher hospitalist staffing levels were associated with lower readmission rates. Therefore, to better understand the relationship between hospitalists and quality, it is important to account for staffing levels, not merely whether hospitalists provide care at the hospital or not. Higher patient load per hospitalist might still improve hospital efficiency by lowering costs, but is it likely to impede the quality of care provided by hospitalists. This is not surprising given similar findings, including in this article, which document a similar positive relationship between nursing staffing levels and quality.
Hospitals utilize various arrangements with physicians that range from employment to more relaxed arrangements such as physicians with privileges who are neither employed by the hospital nor under individual or group contracts. Historically, the main incentive for hospitals to integrate physicians was referrals to hospital services and specialties.[16, 26] The Affordable Care Act, however, provided further incentives, such as ease of care coordination, physicians' involvement, and commitment to quality improvement and cost‐containment efforts. Based on this study, hospitals that were classified as fully integrated had lower readmission rates. Also, hospitals partially or fully owned by physicians had better readmission rates. These findings indicate that hospital‐physician arrangements play a significant role not only in influencing efficiency and market share but also patient outcomes. Physician integration and physician ownership align physicians' financial incentives with those of the hospital. For instance, given the recent changes in reimbursement and the shift toward VBP, physician income in physician‐owned hospitals is at risk if the hospital has poor patient outcomes.
Other significant predictors of readmission rates included the adoption of the medical home model and RN staffing levels. Hospitals that adopted a medical home model and had a higher registered nurse‐to‐inpatient days ratio had significantly better readmission rates. The finding on the adoption of the medical home model is especially important. Previous research indicates that patient‐centered medical homes are associated with lower emergency room visits but not necessarily lower admissions.[27] Our findings indicate that medical homes might play a role in lowering readmission rates, and therefore this outcome needs to be included in studies examining the performance of medical homes. Critical access hospitals and those with higher admissions share of Medicaid patients had worst readmission rates. Finally, hospitals located in counties with higher unemployment rates also had the worst readmission rates. This finding is not surprising and is consistent with previous research, which indicates that the patients' environment and social risk factors play a significant role.
This article contributes to our understanding of readmission rates despite its several limitations, which include the measurement of hospitalist staffing levels based on general medical and surgical beds rather than general medicine admissions. Moreover, some hospitals had missing data on key variables, which warranted their exclusion from this study. In conclusion, many structural, operational and market‐level factors influence all‐cause readmission rates. However, some of these variables are modifiable and can thus be adjusted by a hospital to improve readmission rates. These variables include hospitalists and registered nurse staffing levels; physician integration through the salaried, equity, or foundation model; and the adoption of a medical home model.
Disclosure
Nothing to report.
- , , . Medicare's readmissions‐reduction program—a positive alternative. N Engl J Med. 2012;366:1364–1366.
- , , , et al. Impact of hospital population case‐mix, including poverty, on hospital all‐cause and infection‐related 30‐day readmission rates. Clin Infect Dis. 2015;31(2):1235–1243.
- , , , et al. Patterns of hospital performance in acute myocardial infarction and heart failure 30‐day mortality and readmission. Circ Cardiovasc Qual Outcomes. 2009;2:407–413.
- , , , , . Variation in the risk of readmission among hospitals: the relative contribution of patient, hospital and inpatient provider characteristics. J Gen Intern Med. 2014;29:572–578.
- , . A path forward on Medicare readmissions. N Engl J Med. 2013;368:1175–1177.
- , , . Hospitals with higher nurse staffing had lower odds of readmissions penalties than hospitals with lower staffing. Health Aff (Millwood). 2013;32:1740–1747.
- , , , , . Variation in surgical‐readmission rates and quality of hospital care. N Engl J Med. 2013;369:1134–1142.
- , , , et al. Value and the medical home: effects of transformed primary care. Am J Manag Care. 2010;16.8:607–614.
- , , , , , . Effects of hospitalists on cost, outcomes, and patient satisfaction in a rural health system. Am J Med. 2000;108:621–626.
- , , , , . Effect of hospitalist workload on the quality and efficiency of care. JAMA Intern Med. 2014;174:786–793.
- , , . Association of hospitalist presence and hospital‐level outcome measures among Medicare patients. J Hosp Med. 2014;9:1–6.
- , , , , . Hospitalist utilization and hospital performance on 6 publicly reported patient outcomes. J Hosp Med. 2012;7:482–488.
- , , , . Impact of attending physician workload on patient care: a survey of hospitalists. JAMA Intern Med. 2013;173:375–377.
- , , . Rising hospital employment of physicians: better quality, higher costs. Issue Brief Cent Stud Health Syst Change. 2011;136:1–4.
- , , , et al. The employed surgeon: a changing professional paradigm. JAMA Surg. 2013;148:323–328.
- , , . Vertical integration: hospital ownership of physician practices is associated with higher prices and spending. Health Aff (Millwood). 2014;33:756–763.
- , , , et al. Hospital‐wide (all‐condition) 30‐day risk‐standardized readmission measure: Yale New Haven Health Services Corporation. Center for Outcomes Research 161(10 suppl):S66–S75.
- , . Hospital‐physician collaboration: landscape of economic integration and impact on clinical integration. Milbank Q. 2008;86(3):375–434.
- , , , , . Effects of hospital care environment on patient mortality and nurse outcomes. J Nurs Adm. 2008;38:223–229.
- , , , , , . The effects of nurse staffing and nurse education on patient deaths in hospitals with different nurse work environments. Med Care. 2011;49(12):1047–1053.
- , . Hospital readmissions as a measure of quality of health care: advantages and limitations. Arch Intern Med. 2000;160:1074–1081.
- , , , . Growth in the care of older patients by hospitalists in the United States. N Engl J Med. 2009;360:1102–1112.
- . Reflections: the hospitalist movement a decade later. J Hosp Med. 2006;1:248–252.
- , , , . Variation in length of stay and outcomes among hospitalized patients attributable to hospitals and hospitalists. J Gen Intern Med. 2013;28:370–376.
- , , , . Regulatory neutrality is essential to establishing a level playing field for accountable care organizations. Health Aff (Millwood). 2013;32:1426–1432.
- , . The patient‐centered medical home: will it stand the test of health reform? JAMA. 2009;301:2038–2040.
- , . Who has higher readmission rates for heart failure, and why?: implications for efforts to improve care using financial incentives. Circ Cardiovasc Qual Outcomes. 2011;4:53–59.
The hospital‐wide all‐cause 30‐day readmission rate is a key quality measure associated with patient outcomes, cost of care, and wasted hospital resources.[1] The estimated 20% readmission rate of Medicare patients and the associated $17 billion annual cost of readmissions led the Centers for Medicare and Medicaid Services (CMS) to implement policies that limit reimbursement for 30‐day unplanned readmissions and thus place hospitals with high readmission rates at financial risk.[1, 2]
The variation in readmission rates between hospitals is well documented in the literature.[3, 4] Singh et al. found that 9.3% of the variation in readmissions can be explained by hospital characteristics.[4] Hospital factors associated with lower readmission rates include not‐for‐profit ownership, hospital size, and nursing staffing levels.[5, 6, 7] Other studies found an association between environmental factors such as the percent of patients living under the poverty line and higher readmission rates.[7] The recent publicly available CMS data on readmission rates allows us to further our understanding of hospital characteristics that explain the variation in readmission rates. In this article, we are specifically interested in hospitalist staffing levels and hospital‐physician arrangements such as physician integration level and physician ownership. Moreover, we are interested in novel organizational variables, specifically, the adoption of a medical home model, which has been ignored by previous research. Medical homes are associated with better quality[8]; hospitals that already adopted the medical home model might be better equipped to coordinate care after the patients are discharged.
In recent years, the number of hospitals relying on hospitalists to provide inpatient care has been on the rise. As more hospitals employ hospitalists, it is important to understand how hospitalist staffing levels are associated with quality. Previous studies have linked hospitalists with lower hospital mortality rates,[7] lower cost of care,[9, 10] and lower readmission rates.[10, 11] Goodrich et al., on the other hand, did not find a significant relationship between the presence of hospitalists and mortality or readmission rates.[12] In a recent study, hospitalists indicated that heavy workloads limited the time they had available to communicate with patients, which negatively influenced quality and patient satisfaction, and resulted in delayed admissions and discharges.[13]
The main objective of this article was therefore to study the association between hospitalist staffing levels and hospital‐wide all‐cause readmission rates. Most empirical studies examining the relationship between hospitalist staffing and quality of inpatient care have predominantly focused on whether the presence of hospitalists who provided care at a hospital influenced mortality or readmissions.[11, 12] In this article, we contribute to the literature by examining how staffing levels measured by the ratio of hospitalists to general medical and surgical beds is associated with 30‐day readmission rates. We predict that there is a positive association between readmission rates and hospitalists per bed.
Hospitals have a broad range of contractual arrangements or integration levels with physicians, with employment being the highest level. A hospital can rely on physicians who have admitting privileges but are not salaried employees of the hospital to treat a large portion of its inpatient population. In the past few years, with the passage of the Patient Protection and Affordable Care Act (2010) and the shift in reimbursement towards Value Based Purchasing (VBP), more hospitals are choosing to ensure that physicians are strongly integrated within the hospital by adopting an employment‐based model. Moreover, hospitals view physician employment as a strategic move that will help ensure or expand their market share.[14] For instance, the number of surgeons who identified as self‐employed dropped from 48% in 2001 to 28% in 2011, and this reduction is attributed to the shift toward hospital employment of physicians.[15] Despite the evolving models of hospital‐physician arrangements, little is understood on how the adoption of the integrated salary model, in addition to the equity and foundation models, which are classified by Baker et al. as the highest level of integration, influence quality.[16] Therefore, another objective of this article was to examine the association between hospital‐physician arrangements and all‐cause unplanned readmission rates.
METHODS
Data Source and Sample
Data from the American Hospital Association (AHA) Annual Survey (2013), CMS Hospital Compare (October 2013), and Area Health Resource File (2013) were merged to analyze the association between readmission rates with hospital characteristics and environmental factors. We limited the analysis to private (nonpublic) hospitals with no missing data. Our final sample consisted of 1756 hospitals. Of the hospitals in our sample, 14% were for profit, 70% were nonteaching, 23% were minor teaching, 7% were major teaching hospitals, 73% belonged to a system, and 31% were classified as small hospitals. Table 1 provides descriptive statistics for all the variables included in the analysis.
| Variable | Value | Data Source |
|---|---|---|
| ||
| 30‐day all‐cause readmissions, median (IQR) | 15.8% (15.2%16.5%) | Centers for Medicare and Medicaid Services |
| Hospitalists per general medicine and surgical beds, median (IQR) | 0.09 (0.060.15) | American Hospital Association |
| RNs per 100 inpatient days, median (IQR) | 0.84 (0.6610.10) | American Hospital Association |
| Medicare admissions, median (IQR) | 48.45% (40.84%55.14%) | American Hospital Association |
| Medicaid admissions, median (IQR) | 16.45% (11.06%22.76%) | American Hospital Association |
| Competition, median (IQR) | 0.56 (0.230.83) | American Hospital Association |
| Unemployment, median (IQR) | 2.9% (2.54%3.37%) | Area Resource File |
| Fully integrated | American Hospital Association | |
| Yes | 51% | |
| No | 49% | |
| Physician ownership | American Hospital Association | |
| Physician partial or complete ownership | 5% | |
| No physician ownership | 95% | |
| Established medical home program | American Hospital Association | |
| Yes | 29% | |
| No | 71% | |
| High technology | American Hospital Association | |
| Yes | 40% | |
| No | 60% | |
| Teaching level | American Hospital Association | |
| Nonteaching | 70% | |
| Minor teaching | 23% | |
| Major teaching | 7% | |
| Size | American Hospital Association | |
| Small | 31% | |
| Medium | 34% | |
| Large | 35% | |
| Ownership | American Hospital Association | |
| For profit | 14% | |
| Not for profit | 86% | |
| Critical access hospital | American Hospital Association | |
| Yes | 11% | |
| No | 89% | |
| System membership | American Hospital Association | |
| Yes | 73% | |
| No | 27% | |
Variables
Dependent Variable
Risk standardized 30‐day hospital‐wide all‐cause readmission rates (HWR) were obtained from CMS. This measure was publicly reported in October 2013. The HWR is estimated using standardized risk ratios at the hospital level for the following 5 discharge diagnosis groups: surgery/gynecology, neurology, cardiorespiratory, cardiovascular, and general medicine.[17] The measure adjusts, in addition to a hospital's case mix, for patients' ages, principal discharge diagnoses, and comorbidities.[17] HWR is calculated as a predicted‐to‐expected readmissions ratio. Predicted and expected readmissions were calculated for each of the 5 groups for each hospital using each hospital's patient mix and a hospital random effects estimate. A standardized readmission ratio was then derived by dividing predicted readmissions by expected readmissions for each group for each hospital. A single hospital score was obtained by multiplying the volume‐weighted logarithmic average of the 5 diagnostic groups by the average national readmission rate.[18]
Independent Variables
The primary independent variable of interest to this study is hospitalist staffing levels. We calculate the staffing levels of hospitalists by dividing the full‐time equivalent (FTE) of hospitalists by the number of general medical and surgical beds. FTE hospitalists are calculated by the AHA Annual Survey database (2013) as the sum of full‐time hospitalists and 0.5*number of part‐time hospitalists. In addition to hospitalist staffing levels, a main predictors is whether the hospital fully integrates physicians or not. We follow Baker et al. in our classification of full integration. Baker et al. define fully integrated hospitals as those that adopted 1 of the following models with their physicians: integrated salary, foundation or equity model.[16] We predict that fully integrated hospitals are more likely to have better readmission rates. Another key physician variable that is likely to influence outcomes is physician partial or full ownership of the hospital. Ownership aligns physicians' incentives with hospital performance[19] and is therefore likely to be associated with better readmission rates. We also include a dichotomous variable that indicates whether a hospital has an established medical home program or not. Medical homes indicate an organizational culture that is patient centered and committed to continuity and coordination of care; all of which are important for better quality. We predict that the presence of a medical home model will be associated with better readmission rates.
Control Variables
We control for registered nurses per 100 inpatient days ratio, critical access designation, Medicare share of hospital admissions, Medicaid share of hospital admissions, teaching status, size, and technology level. Previous research indicates that these variables are associated with patient outcomes.[20, 21] We follow the Aiken et al. characterization of teaching status: hospitals with no residency programs (nonteaching), hospitals with a resident‐to‐bed ratio of 1 to 4 or less (minor teaching), and hospitals with a resident‐to‐bed ratio of more than 1 to 4 (major teaching).[20] We also classify hospitals as small if they have less than 100 beds, medium if they have 101 to 250 beds, and large if they have more than 250 beds. We modify the Aiken et al. classification of technology level and control for the level of technology adopted at a hospital by classifying hospitals as high technology if they offer any of the following services: any major organ transplant, computer‐assisted orthopedic surgery, or electron beam computed tomography.[21] We also control for 2 market level variables: (1) competition estimated by the county level Herfindahl‐Hirschman Index (HHI) and (2) the percentage of individuals in the county who are unemployed. Unemployment rates are derived from the Area Health Resource File (2013). HHI is calculated by summing the squares of market shares of admissions. For ease of interpretation, competition is coded as 1‐HHI.
Statistical Analysis
We ran a multivariate ordinary least squares (OLS) regression on Stata 12 (StataCorp, College Station, TX) to assess the relationship between 30‐day all‐cause readmissions and hospitalist staffing levels, physician integration, physician ownership, and other organizational characteristics. We checked for multicollinearity by using a variance inflation factor (VIF). The VIF of all independent variables was less than 10, and therefore multicollinearity was not of concern to this analysis.
RESULTS
Among our sample of 1756 hospitals, the median 30‐day all‐cause readmission rate was 16%, with the middle 50% of hospitals with readmission rates between 15.2% and 16.5%. All of the hospitals in this study reported that hospitalists provide care at the hospitals. The median Medicare share of hospital admissions was 48.46%, and the median Medicaid share of hospital admissions was 16.4%. Fifty‐one percent of the hospitals in our sample were fully integrated. Fifty percent of hospitals had 9 or fewer hospitalists per 100 general medical and surgical beds. Only 5% of the hospitals had partial or full physician ownership. Twenty‐nine percent of hospitals had an established medical home program. Table 1 provides summary statistics and the data sources of all the variables included in the study.
To compare readmission rates, we created a dummy variable that divided the sample into 2 categories: hospitals with low hospitalist staffing levels (hospitalists per general medical and surgical beds is less than the median) and high hospitalist staffing (hospitalists per general medical and surgical bed ratio is more than the median). We then used t tests to compare all‐cause readmission rates between hospitals with low and high hospitalist staffing levels, physician owned versus nonphysician owned, and fully integrated versus not fully integrated. We also used single‐factor analysis of variance (ANOVA) to compare readmission rates between nonteaching, minor teaching, and major teaching hospitals. Results are displayed in Table 2. There was a significant difference in the mean readmission rates between hospitals with low hospitalist staffing levels (mean readmission rate = 16.06%) versus high staffing levels (mean readmission rate = 15.72%). The mean readmission rate for physician‐owned hospitals was significantly lower than for nonphysician‐owned hospitals (15.46% vs 15.9%). Also, fully integrated hospitals had a lower readmission rate than hospitals where physicians were not fully integrated (15.93% vs 15.86%). Based on the ANOVA results, there was a significant difference between teaching levels. According to a Tukey honest significant difference post hoc test, there was no significant difference between nonteaching and minor teaching hospitals, but the readmission rate was significantly higher in major teaching hospitals (nonteaching = 15.83%, minor teaching = 15.76%, major teaching = 16.9%).
| Variable | Readmission Rates | P Value |
|---|---|---|
| Hospitalist staffing levels | ||
| Low | 16.06% | 0.00 |
| High | 15.72% | |
| Physician ownership | ||
| Fully or partially physician‐owned hospitals | 15.46% | 0.00 |
| Nonphysician‐owned hospitals | 15.9 % | |
| Physician integration | ||
| Fully integrated hospitals | 15.86% | 0.00 |
| Nonintegrated hospitals | 15.93% | |
| Teaching status | ||
| Nonteaching hospitals | 15.83% | 0.00 |
| Minor teaching hospitals | 15.76% | |
| Major teaching hospitals | 16.9% |
The OLS regression model was significant and explained 16% of the variability in readmission rates (Table 3). Higher hospitalists staffing levels were associated with lower 30‐day all cause readmission rates (P = 0.00). The addition of 1 hospitalist per general and surgical bed was associated with a 0.77 percentage points decrease in adjusted readmission rates. In terms of hospital‐physician arrangements, fully integrated hospitals had adjusted 30‐day all‐cause readmission rates 0.09 percentage points lower than nonfully integrated hospitals (P = 0.08). Physician partial or full ownership was significantly associated with lower readmission rates (P = 0.00); hospitals partially or fully owned by physicians had adjusted readmission rates 0.36 percentage points lower than nonphysician‐owned hospitals.
| Variable | Coefficient | Standard Error | P Value |
|---|---|---|---|
| |||
| Hospitalists per general and surgical beds | 0.77 | 0.172 | 0.00 |
| Full integration | 0.086 | 0.049 | 0.08 |
| Physician ownership | 0.355 | 0.119 | 0.00 |
| RNs per 100 inpatient days | 0.174 | 0.050 | 0.00 |
| Established medical home program | 0.132 | 0.057 | 0.02 |
| Medicare admissions | 0.063 | 0.002 | 0.21 |
| Medicaid admissions | 0.015 | 0.003 | 0.00 |
| Competition | 0.115 | 0.08 | 0.17 |
| Unemployment | 0.244 | 0.037 | 0.00 |
| System membership | 0.041 | 0.055 | 0.45 |
| Teaching level | |||
| Minor teaching | 0.007 | 0.066 | 0.92 |
| Major teaching | 1.032 | 0.106 | 0.00 |
| Size | |||
| Medium | 0.032 | 0.071 | 0.66 |
| Large | 0.066 | 0.085 | 0.44 |
| For‐profit ownership | 0.206 | 0.078 | 0.01 |
| High technology | 0.077 | 0.055 | 0.17 |
| Critical access hospital | 0.202 | 0.092 | 0.03 |
Based on the regression analysis, major teaching hospitals on average had adjusted readmission rates 1.03 percentage point higher than nonteaching hospitals (P = 0.000), whereas there was no significant difference between minor and nonteaching hospitals (P > 0.1). As the number of registered nurses (RNs) per 100 inpatient days increased by 1, readmission rates dropped by 0.17 (P = 0.00). Hospitals with higher Medicaid shares of admission had significantly higher readmission rates (P < 0.05). Hospitals located in counties with higher unemployment rates also had higher readmission rates (P = 0.000), whereas market competition had no significant association with readmissions. For‐profit hospitals had adjusted readmission rates 0.21 percentage points higher than not‐for‐profit hospitals (P = 0.01). Finally, hospitals that have adopted a medical home model had significantly lower readmission rates (P = 0.02); hospitals with an established medical home model had adjusted readmission rates 0.17 percentage points lower than their counterparts.
DISCUSSION
In the era of VBP and mounting pressures on hospitals to improve quality and lower cost, it is important to understand the association between modifiable hospital characteristics, such as hospitalist staffing levels, and unmodifiable characteristics, such as teaching status and size, with quality of care. There are many factors that can contribute to higher readmission rates. Some of these factors are hospital related and others are patient related, such as the environment in which a patient resides. Benbassat and Taragin argue that 9% to 48% of hospital readmissions are avoidable and are related to factors such as inadequate resolution of the problem the patient was admitted for and poor discharge care.[22] In this article, we have focused on hospital and market factors. Our main variables of interest were hospitalist staffing level, physician full integration, physician ownership, and the adoption of the medical home model at the hospital. Moreover, we examined the association between the hospital environment, specifically, market competition, and the patient environment, specifically, unemployment rates, with readmission rates.
Hospitalists' provision of inpatient care has been on the rise. From 1997 to 2006, the likelihood of receiving inpatient care from a hospitalist grew by 29.2% per year.[23] Based on AHA (2013) data, 65% of hospitals reported that hospitalists provided care at the hospital. The main driver behind the adoption of the hospitalists' model is the positive role hospitalists play in improving hospital efficiency and their familiarity and specialization in hospital care.[24] However, concerns exist that hospitalists might negatively influence patient outcomes given the discontinuity of care that occurs once the patient is discharged from the hospital and back to the care of their primary care physician.[25] Based on our analysis though, higher hospitalist staffing levels were associated with lower readmission rates. Therefore, to better understand the relationship between hospitalists and quality, it is important to account for staffing levels, not merely whether hospitalists provide care at the hospital or not. Higher patient load per hospitalist might still improve hospital efficiency by lowering costs, but is it likely to impede the quality of care provided by hospitalists. This is not surprising given similar findings, including in this article, which document a similar positive relationship between nursing staffing levels and quality.
Hospitals utilize various arrangements with physicians that range from employment to more relaxed arrangements such as physicians with privileges who are neither employed by the hospital nor under individual or group contracts. Historically, the main incentive for hospitals to integrate physicians was referrals to hospital services and specialties.[16, 26] The Affordable Care Act, however, provided further incentives, such as ease of care coordination, physicians' involvement, and commitment to quality improvement and cost‐containment efforts. Based on this study, hospitals that were classified as fully integrated had lower readmission rates. Also, hospitals partially or fully owned by physicians had better readmission rates. These findings indicate that hospital‐physician arrangements play a significant role not only in influencing efficiency and market share but also patient outcomes. Physician integration and physician ownership align physicians' financial incentives with those of the hospital. For instance, given the recent changes in reimbursement and the shift toward VBP, physician income in physician‐owned hospitals is at risk if the hospital has poor patient outcomes.
Other significant predictors of readmission rates included the adoption of the medical home model and RN staffing levels. Hospitals that adopted a medical home model and had a higher registered nurse‐to‐inpatient days ratio had significantly better readmission rates. The finding on the adoption of the medical home model is especially important. Previous research indicates that patient‐centered medical homes are associated with lower emergency room visits but not necessarily lower admissions.[27] Our findings indicate that medical homes might play a role in lowering readmission rates, and therefore this outcome needs to be included in studies examining the performance of medical homes. Critical access hospitals and those with higher admissions share of Medicaid patients had worst readmission rates. Finally, hospitals located in counties with higher unemployment rates also had the worst readmission rates. This finding is not surprising and is consistent with previous research, which indicates that the patients' environment and social risk factors play a significant role.
This article contributes to our understanding of readmission rates despite its several limitations, which include the measurement of hospitalist staffing levels based on general medical and surgical beds rather than general medicine admissions. Moreover, some hospitals had missing data on key variables, which warranted their exclusion from this study. In conclusion, many structural, operational and market‐level factors influence all‐cause readmission rates. However, some of these variables are modifiable and can thus be adjusted by a hospital to improve readmission rates. These variables include hospitalists and registered nurse staffing levels; physician integration through the salaried, equity, or foundation model; and the adoption of a medical home model.
Disclosure
Nothing to report.
- , , . Medicare's readmissions‐reduction program—a positive alternative. N Engl J Med. 2012;366:1364–1366.
- , , , et al. Impact of hospital population case‐mix, including poverty, on hospital all‐cause and infection‐related 30‐day readmission rates. Clin Infect Dis. 2015;31(2):1235–1243.
- , , , et al. Patterns of hospital performance in acute myocardial infarction and heart failure 30‐day mortality and readmission. Circ Cardiovasc Qual Outcomes. 2009;2:407–413.
- , , , , . Variation in the risk of readmission among hospitals: the relative contribution of patient, hospital and inpatient provider characteristics. J Gen Intern Med. 2014;29:572–578.
- , . A path forward on Medicare readmissions. N Engl J Med. 2013;368:1175–1177.
- , , . Hospitals with higher nurse staffing had lower odds of readmissions penalties than hospitals with lower staffing. Health Aff (Millwood). 2013;32:1740–1747.
- , , , , . Variation in surgical‐readmission rates and quality of hospital care. N Engl J Med. 2013;369:1134–1142.
- , , , et al. Value and the medical home: effects of transformed primary care. Am J Manag Care. 2010;16.8:607–614.
- , , , , , . Effects of hospitalists on cost, outcomes, and patient satisfaction in a rural health system. Am J Med. 2000;108:621–626.
- , , , , . Effect of hospitalist workload on the quality and efficiency of care. JAMA Intern Med. 2014;174:786–793.
- , , . Association of hospitalist presence and hospital‐level outcome measures among Medicare patients. J Hosp Med. 2014;9:1–6.
- , , , , . Hospitalist utilization and hospital performance on 6 publicly reported patient outcomes. J Hosp Med. 2012;7:482–488.
- , , , . Impact of attending physician workload on patient care: a survey of hospitalists. JAMA Intern Med. 2013;173:375–377.
- , , . Rising hospital employment of physicians: better quality, higher costs. Issue Brief Cent Stud Health Syst Change. 2011;136:1–4.
- , , , et al. The employed surgeon: a changing professional paradigm. JAMA Surg. 2013;148:323–328.
- , , . Vertical integration: hospital ownership of physician practices is associated with higher prices and spending. Health Aff (Millwood). 2014;33:756–763.
- , , , et al. Hospital‐wide (all‐condition) 30‐day risk‐standardized readmission measure: Yale New Haven Health Services Corporation. Center for Outcomes Research 161(10 suppl):S66–S75.
- , . Hospital‐physician collaboration: landscape of economic integration and impact on clinical integration. Milbank Q. 2008;86(3):375–434.
- , , , , . Effects of hospital care environment on patient mortality and nurse outcomes. J Nurs Adm. 2008;38:223–229.
- , , , , , . The effects of nurse staffing and nurse education on patient deaths in hospitals with different nurse work environments. Med Care. 2011;49(12):1047–1053.
- , . Hospital readmissions as a measure of quality of health care: advantages and limitations. Arch Intern Med. 2000;160:1074–1081.
- , , , . Growth in the care of older patients by hospitalists in the United States. N Engl J Med. 2009;360:1102–1112.
- . Reflections: the hospitalist movement a decade later. J Hosp Med. 2006;1:248–252.
- , , , . Variation in length of stay and outcomes among hospitalized patients attributable to hospitals and hospitalists. J Gen Intern Med. 2013;28:370–376.
- , , , . Regulatory neutrality is essential to establishing a level playing field for accountable care organizations. Health Aff (Millwood). 2013;32:1426–1432.
- , . The patient‐centered medical home: will it stand the test of health reform? JAMA. 2009;301:2038–2040.
- , . Who has higher readmission rates for heart failure, and why?: implications for efforts to improve care using financial incentives. Circ Cardiovasc Qual Outcomes. 2011;4:53–59.
Anterior Cervical Interbody Fusion Using a Polyetheretherketone (PEEK) Cage Device and Local Autograft Bone
Anterior cervical discectomy and fusion (ACDF) has been performed with various techniques and devices for many years. Autologous iliac crest grafts were initially used for the Cloward1,2 and Robinson and Smith3 techniques, but because of iliac crest graft site complications (eg, pain, infection, fracture, dystrophic scarring4,5), the procedure was generally superseded by allograft implants. These implants were then supplemented with anterior locking plate devices. More recently, unitary devices combining a polyetheretherketone (PEEK) spacer with screw or blade fixation have been developed, such as the Zero P (Synthes, Inc.) and the ROI-C cervical cage (LDR). Bone graft is required to fill the cavity of these devices and to promote osseous union. Demineralized bone matrix,6 tricalcium phosphate,7,8 and bone morphogenetic protein (BMP) have been used for these purposes, but they add expense to the procedure and have been associated with several complications (eg, neck swelling, dysphagia associated with BMP).9
Although multiple studies have demonstrated effective fusion rates and good outcomes for both iliac crest autograft and grafting/spacer constructs, the debate over cost and “added value” remains unresolved. One institution, which has published articles reviewing the spine literature and its own data, concluded that iliac crest autograft was the most cost-effective and consistently successful ACDF procedure.5,10
The VA Portland Health Care System (VAPORHCS) has analyzed the use of local autograft sources at the surgical site to circumvent the need to make a second incision at the iliac crest and, theoretically, to decrease risks and expenses associated with iliac crest autograft, allograft bone, and artificial constructs. Given the paucity of data on this method, the case series presented here represents one of a few studies that analyze local autograft for promotion of arthrodesis in a PEEK spacer device.
This article will report on the prospectively collected results of consecutive cases performed by Dr. Ross using a ROI-C cervical cage for 1-level anterior cervical discectomy between August 2011 and November 2014. This study received institutional review board approval.
Methods
Neck disability index (NDI) forms were used to assess the impact of neck pain on patients’ ability to manage in everyday life. The NDI form was completed before surgery and 3 and 9 months after surgery.
Dr. Ross preferred to perform minimally invasive posterior cervical foraminotomy for unilateral radiculopathy. Therefore, all patients with radiculopathy had bilateral symptoms or a symptomatic midline disc protrusion not accessible from a posterior approach. Standard techniques were used to make a left-side approach to the anterior cervical spine except in cases in which a previous right-side approach could be reused. Under the microscope, the anterior longitudinal ligament and annulus were incised, and the anterior contents of the disc space were removed with curettes and pituitary rongeurs. Care was taken to remove all cartilage from beneath the anterior inferior lip of the rostral vertebral body and to remove a few millimeters of the anterior longitudinal ligament from the rostral vertebral body without use of monopolar cautery (Figure 1). A 2 mm Kerrison punch then was used to remove the anterior inferior lip of the rostral vertebral body, and this bone was saved for grafting. No bone wax was used within the disc space.
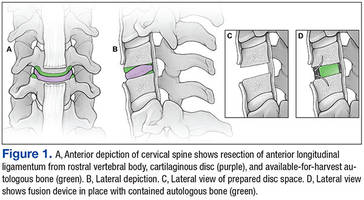
After all disc space cartilage was removed from the endplates, additional bone was obtained from the uncovertebral joints and posterior vertebral bodies as the decompression proceeded posteriorly. Occasionally, distraction posts were used if the disc space was too narrow for optimal visualization posteriorly. After decompression was achieved, a lordotic ROI-C cervical cage was packed in its lumen with the bone chips and impacted into the disc space under fluoroscopic guidance. The blades were impacted under fluoroscopic guidance as well. The wound was closed with absorbable suture.
Antibiotics were given for no more than 24 hours after surgery. Ketorolac was used for analgesia the night of the surgery, and patients were asked to not use nonsteroidal anti-inflammatory drugs for 3 months after surgery. Lateral radiographs were obtained 3 and 9 months after surgery and every 6 months thereafter until arthrodesis was detected.
Results
Seventy-seven consecutive patients underwent 1-level anterior cervical discectomy (Table 1). Twenty-four procedures were performed for radiculopathy, 52 for myelopathy, and 1 for central cord injury sustained in a fall by a patient with preexisting spinal stenosis. Surgery was performed at C3-C4 (25 cases), C4-C5 (11 cases), C5-C6 (15 cases), and C6-C7 (1 case) for patients with myelopathy. Surgery was performed at C3-C4 (2 cases), C4-C5 (3 cases), C5-C6 (9 cases), and C6-C7 (10 cases) for patients with radiculopathy.
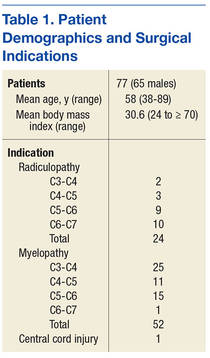
Twenty-eight patients reported presurgery tobacco use. Although all tobacco-using patients agreed to cease use in the perioperative period, at least 9 admitted to resuming tobacco use immediately after surgery. Eighteen patients had diabetes mellitus. In 2 patients, a diagnosis of osteoporosis was made with dual-energy X-ray absorptiometry. One patient was a chronic user of steroids before and after surgery. Mean body mass index (BMI) was 30.6, and 13 patients were morbidly obese (BMI > 34).
In 2 cases, only a single blade was placed. The second blade could not be placed because of broken adjacent screws (1 case) or undetermined reason (1 case).
The mean time for follow-up was 17 months (range 3-34). Four patients were lost to follow-up: 3 after the 1-month postoperative visit and 1 with severe psychiatric problems after hospital discharge.
There were no new neurologic deficits, no wound infections, and no recurrent laryngeal nerve palsies in the 77 patients. Eight months after surgery, 1 patient with radiculopathy underwent foraminotomy at the index level for persisting foraminal stenosis. Two patients whose myelopathic symptoms persisted after surgery returned for minimally invasive posterior laminotomy to remove infolded ligamentum flavum. The presurgery and 3- and 9-month postsurgery NDI scores were available for 52 patients (Table 2). Before surgery the mean NDI score was 24 (range 8-40). Three months postsurgery the mean NDI score was 15 (range 2-27) for patients with myelopathy and 13 (range 2-28) for patients with radiculopathy. The patient with the highest NDI score (28) stated that though all his symptoms were relieved, he had gauged his responses to protect his disability claim. Nine months after surgery, the mean NDI scores were 9.5 (range 5-17) for patients with myelopathy and 6 (range 2-13) for patients with radiculopathy. No NDI score was higher postsurgery than presurgery.

Arthrodesis was defined as bony bridging between the adjacent vertebral bodies and the bone graft within the lumen of the device, anterior to the device, or posterior to the device. In Dr. Ross’ protocol, computed tomography (CT) scans or flexion-extension radiographs were obtained only if pseudarthrosis was suspected to avoid unnecessary radiation exposure. Sixty-six patients had at least the 3-month radiography follow-up available. All 52 patients with 9-month follow-up data achieved complete arthrodesis, as determined by plain film radiography. Bridging ossification was found anterior to the device in all but 9 patients. Trabeculated bone was growing through the lumen of the device in all cases (Figure 2). A broken blade without clinical correlation was noted on imaging for 1 patient.

The total cost of the ROI-C cervical cage (LDR) for VAPORHCS was $3,498, or $1,749 for the PEEK spacer plus $1,749 for 2 metal blades. In comparison, the total cost of a typical anterior locking plate would have been $6,700, or $3,200 for the plate plus $2,000 for 4 screws and $1,500 for an allograft fibular spacer. Demineralized bone matrix (1 mL) as used in cervical arthrodesis by other surgeons at VAPORHCS cost $279, or about $500 including shipping.
DISCUSSION
Anterior cervical discectomy with fusion is a very common and successful surgical procedure for cervical myelopathy, radiculopathy, and degenerative disease that has failed to be corrected with conservative therapy.10 Medicare data documented a 206% increase in 1-level fusion procedures for degenerative spine pathology performed between 1992 and 2005.11 When a procedure is performed so often, it is appropriate to review methods and analyze efficacy, cost, and cost-effectiveness.
According to a 2007 meta-analysis, the fusion rates of 1-level ACDF arthrodesis at 1-year follow-up are 97.1% in patients treated with anterior plates and 92.1% in patients treated with noninstrumented fusion.12 The rate disparity was larger for multiple-level fusion: 50% to 82.5% for instrumented cases12,13 vs 3% to 42% for noninstrumented cases.14-16 Given the higher fusion rates achieved with instrumentation, surgeons have favored its use in ACDF.
Computed Tomography Use
Computed tomography has long been considered the gold standard for assessing arthrodesis outcomes (eg, Siambanes and Mather).17 However, recent data on potential harm caused by CT-related ionizing radiation suggest a need for caution with routine CT use.18,19 For cervical spine CT, Schonfeld and colleagues found that the risk for excess thyroid cancers ranged from 1 to 33 cases per 10,000 CT scans.20 According to another report, “limiting neck CT scanning to a higher risk group would increase the gap between benefit and harm, whereas performing CT routinely on low-risk cases approaches a point where its harm equals or exceeds its benefit.”19 As some have questioned even routinepostoperative use of radiation in patients with unremarkable clinical courses—patients should be spared unnecessary exposure—CT scans or flexion-extensionradiographs were obtained at VAPORHCS only if clinical symptoms or radiographs were suggestive of pseudarthrosis.21 As none of the VAPORHCS patients had those symptoms, none underwent postoperative CT.
For anterior cervical arthrodesis, surgeon preference determines which of many different bone substrates can be used with instrumentation, which impacts the costs. Fusion substrates include structural autografts, structural allografts, morselized autografts, morselized allografts, demineralized allografts, porous ceramics and metals, and BMP. Given these many options, studies comparing the constructs are lacking, especially with regard to the cost of alternative fusion constructs that produce similar outcomes. The Centers for Disease Control and Prevention defines cost-benefit analysis as a “type of economic evaluation that measures both costs and benefits (ie, negative and positive consequences) associated with an intervention in dollar terms.”22 It has been reported that using iliac crest autografts with anterior plate instrumentation is the most cost-effective method, yet alternatives remain in use.5,10
For ACDF, iliac crest bone is an ideal and widely used construct substrate. Structural grafts harvested from the crest provide significant stability due to their bicortical or tricortical configuration with interposed osteoinductive and osteogenic cancellous bone. Few graft complications (eg, graft resorption) and no immunogenic or infectious complications have been reported for iliac crest bone. However, autologous iliac crest increases operative time, and donor-site morbidity has been reported.23,24 A retrospective questionnaire-based investigation by Silber and colleagues, who evaluated iliac crest bone graft site morbidity in 1-level ACDF, found that 26.1% of patients had pain at the iliac crest harvest site, and 15.7% had numbness.24 Other complications, which occurred at lower rates, were bruising, hematoma, pelvic fracture, and poor cosmesis.23,25 In addition, osteoporosis and comorbid conditions have made it a challenge to acquire iliac crest autograft, contributing to the popularity of alternative substrates.25
Allografts
An alternative to autografts, allografts have the advantages of reduced operative time and reduced donor-site morbidity.26 Major historical concerns with allografts have included risk for disease transmission, costs associated with sterilization and serologic screening of grafts, and lack of oversight, leading to human allografts being acquired from dubious sources and ending up in the operating room.27,28 Two major types of allografts are available: mineralized and demineralized.
Arthrodesis rates are inferior for mineralized (structural) allografts with instrumentation than for autografts with instrumentation.29 In addition, smoking and other comorbidities have influenced fusion rates more in allograft than autograft fusions.30-33 However, allografts are being widely used because they avoid the donor-site morbidity associated with autografts and because they are load bearing, can provide structural stability and an osteoconductive matrix, and can be used off the shelf without adding much time to surgery.
Demineralized matrix substrates are commercial osteoconductive and osteoinductive biomaterials approved for filling bone gaps and extending graft when combined with autograft.7,8 Despite their osteoinductive properties, these substrates have had a high degree of product inconsistency, in some cases leading to poor outcomes.34 The lack of randomized studies with these constructs has made the determination of clear indications a challenge.
The initial enthusiasm over use of BMP, another bone-graft substitute for cervical fusion, was curtailed by reports of adverse events (AEs). Effective in anterior lumbar spine fusions, BMP was adapted to off-label use in the cervical spine a few years ago.35 Initial studies by Baskin and colleagues and Bishop and colleagues showed its fusion rates superior to those of allograft.31,32 Both studies reported no significant AEs. However, studies by Dickerman and colleagues and Smucker and colleagues demonstrated increased soft-tissue swelling leading to dysphagia and prolonged hospitalization, which were attributed to higher dosage (no study has identified a precise dose for individual patients).36,37 In addition, the cost of BMP is higher than that of any other bone-graft option for ACDF.3 Osteolysis has also been reported with BMP use.38-40 Carragee and colleagues highlighted the potential carcinogenicity of BMP, but this finding was not corroborated by Lad and colleagues.41,42
Cost Considerations
In addition to surgical effectiveness, spine surgical device costs have come under increased scrutiny.43-45 In 2012, plates were reported to cost (without overhead or profit margin to hospitals) between $1,015 and $3,601, and allograft spacers were estimated to cost between $1,220 and $3,640, cage costs ranged from $1,942 to $4,347, and PEEK spacers cost from $4,930 to $5,246.5 Individual surgeon instrumentation costs varied 10-fold based on the fusion constructs used.5
In a cost-effectiveness review of anterior cervical techniques, cage alone was the least expensive technique, disc arthroplasty or cage/plate/bone substitute groups were the next most expensive, and autograft alone was the most expensive option due to hip graft site morbidity.43 In another study, operative time associated with harvesting an iliac crest graft was equivalent in cost to that of an interbody cage.44 Other studies have compared the costs of various anterior cervical fusion constructs.9,10,45,46 A limitation of these studies is that autologous bone often refers to iliac crest grafts rather than local autograft. Epstein reviewed data from these studies and concluded, “ACDF using dynamic plates and autografts are the most cost effective treatment for anterior cervical discectomy,” citing a cost of $1,015 for this construct.5 Although Epstein demonstrated the cost-effectiveness of autograft in an individual surgeon’s hands, the results also are significant in that the studies identified areas in which improvements can be made at other institutions. The ROI-C cervical cage and local autograft bone cost that the authors report is at the lower end of the range reported by Epstein.5
Device explant rates also can be a concern. Operative waste was well described in a retrospective analysis of 87 ACDF procedures.47 The study found that the cost of explanting devices implanted during the same intraoperative period was equivalent to 9.2% of the cost of permanently implanted constructs. Epstein addressed operative waste by using educational modules to evaluate spine surgeons’ decision making before and after education. After the intervention, the institution noted a marked decline in costs related to explanted devices—from 20% in 2010 (before education) to 5.8% of the total cost of implanted devices in 2010 (after education).5
In the present study, the authors demonstrated that use of local morselized autograft with a PEEK spacer for 1-level ACDF had excellent arthrodesis rates and minimal complications. Of the 52 patients with 9 month postoperative data, all achieved arthrodesis regardless of tobacco use. This method compares favorably with other fusion options in terms of radiographic arthrodesis rates. In addition, it avoids the donor-site morbidity associated with autografts from an iliac site but maintains the benefits of the osteogenic, osteoconductive, and osteoinductive properties of autograft bone. Use of local autograft avoids the costs associated with iliac crest autograft, including increased operating and anesthesia time, additional operating room supplies (drapes, sutures, etc) needed for operating at a second site, and prolonged hospital stay due to pain at the donor site. Use of local autograft also obviates complications at a second surgical site; purchase, storage, and sterilization of allograft; and the neck swelling, possible carcinogenicity, and cost of purchase of BMP. Other than the occasional reuse of distraction posts, this method involves no other expensive explant supplies.
Autografts have osteogenic, osteoconductive, and osteoinductive properties, and autograft fusion rates are generally superior to allograft fusion rates. Bone morphogenetic protein fusion rates may be comparable to autograft fusion rates.9,26,32 Shortcomings of iliac crest autografts include increased operative time, blood loss, and donor-site morbidity. Allografts are osteoconductive and osteoinductive, but their fusion rates are inferior to those of iliac crest autografts. Other shortcomings are infection transmission and immunogenicity risks, higher graft resorption and collapse rates, cost, and previous issues relating to provenance. Bone morphogenetic protein is the most osteoinductive material with fusion rates similar to those of autograft, but its use is associated with neck swelling, dysphagia, osteolysis, potential carcinogenicity, and high cost.9
Conclusion
Overall, use of local autograft with a PEEK spacer has all the advantages of iliac crest autograft along with the benefit of working within the same operative window as the ACDF, thus reducing the infection, bleeding, and pain risks that may be encountered with a second incision. This procedure is effective, inexpensive, and cost-effective compared with alternatives and may be preferable for 1-level ACDF. In a population of patients with high rates of tobacco use, diabetes mellitus, obesity, and other factors that negatively affect fusion rates, local autograft may be a good choice for efficacy and cost savings.
Acknowledgments
The authors thank Shirley McCartney, PhD, for editorial assistance and Andy Rekito, MS, for illustrative assistance.
1. Cloward RB. The anterior approach for removal of ruptured cervical disks. 1958. J Neurosurg Spine. 2007;6(5):496-511.
2. Cloward RB. The anterior approach for removal of ruptured cervical disks. J Neurosurg. 1958;15(6):602-617.
3. Robinson RA, Smith GW. Anterolateral cervical disc removal and interbody fusion for cervical disc syndrome. SAS J. 2010;4(1):34-35.
4. Dimitriou R, Mataliotakis GI, Angoules AG, Kanakaris NK, Giannoudis PV. Complications following autologous bone graft harvesting from the iliac crest and using the RIA: a systematic review. Injury. 2011;42(suppl 2):S3-S15.
5. Epstein NE. Iliac crest autograft versus alternative constructs for anterior cervical spine surgery: pros, cons, and costs. Surg Neurol Int. 2012;3(suppl 3):S143-S156.
6. Gruskin E, Doll BA, Futrell FW, Schmitz JP, Hollinger JO. Demineralized bone matrix in bone repair: history and use. Adv Drug Deliv Rev. 2012;64(12):1063-1077.
7. Becker S, Maissen O, Ponomarev I, Stoll T, Rahn B, Wilke I. Osteopromotion by a beta-tricalcium phosphate/bone marrow hybrid implant for use in spine surgery. Spine (Phila Pa 1976). 2006;31(1):11-17.
8. Muschik M, Ludwig R, Halbhübner S, Bursche K, Stoll T. Beta-tricalcium phosphate as a bone substitute for dorsal spinal fusion in adolescent idiopathic scoliosis: preliminary results of a prospective clinical study. Eur Spine J. 2001;10(suppl 2):S178-S184.
9. Buttermann GR. Prospective nonrandomized comparison of an allograft with bone morphogenic protein versus an iliac-crest autograft in anterior cervical discectomy and fusion. Spine J. 2008;8(3):426-435.
10. Epstein NE. Efficacy and outcomes of dynamic-plated single-level anterior diskectomy/fusion with additional analysis of comparative costs. Surg Neurol Int. 2011;2:9.
11. Wang MC, Kreuter W, Wolfla CE, Maiman DJ, Deyo RA. Trends and variations in cervical spine surgery in the United States: Medicare beneficiaries, 1992 to 2005. Spine (Phila Pa 1976). 2009;34(9):955-961.
12. Fraser JF, Härtl R. Anterior approaches to fusion of the cervical spine: a metaanalysis of fusion rates. J Neurosurg Spine. 2007;6(4):298-303.
13. Nirala AP, Husain M, Vatsal DK. A retrospective study of multiple interbody grafting and long segment strut grafting following multilevel anterior cervical decompression. Br J Neurosurg. 2004;18(3):227-232.
14. Bohlman HH, Emery SE, Goodfellow DB, Jones PK. Robinson anterior cervical discectomy and arthrodesis for cervical radiculopathy. Long-term follow-up of one hundred and twenty-two patients. J Bone Joint Surg Am. 1993;75(9):1298-1307.
15. Cauthen JC, Kinard RE, Vogler JB, et al. Outcome analysis of noninstrumented anterior cervical discectomy and interbody fusion in 348 patients. Spine (Phila Pa 1976). 1998;23(2):188-192.
16. Emery SE, Fisher JR, Bohlman HH. Three-level anterior cervical discectomy and fusion: radiographic and clinical results. Spine (Phila Pa 1976). 1997;22(22):2622-2624.
17. Siambanes D, Mather S. Comparison of plain radiographs and CT scans in instrumented posterior lumbar interbody fusion. Orthopedics. 1998;21(2):165-167.
18. Berrington de González A, Mahesh M, Kim KP, et al. Projected cancer risks from computed tomographic scans performed in the United States in 2007. Arch Intern Med. 2009;169(22):2071-2077.
19. Hikino K, Yamamoto LG. The benefit of neck computed tomography compared with its harm (risk of cancer). J Trauma Acute Care Surg. 2015;78(1):126-131.
20. Schonfeld SJ, Lee C, Berrington de González A. Medical exposure to radiation and thyroid cancer. Clin Oncol (R Coll Radiol). 2011;23(4):244-250.
21. Bartels RH, Beems T, Schutte PJ, Verbeek AL. The rationale of postoperative radiographs after cervical anterior discectomy with stand-alone cage for radicular pain. J Neurosurg Spine. 2010;12(3):275-279.
22. Centers for Disease Control and Prevention. The different types of health assessments. Centers for Disease Control and Prevention website. http://www.cdc.gov/healthyplaces/types_health_assessments.htm. Updated July 25, 2012. Accessed April 8, 2016.
23. Schnee CL, Freese A, Weil RJ, Marcotte PJ. Analysis of harvest morbidity and radiographic outcome using autograft for anterior cervical fusion. Spine (Phila Pa 1976). 1997;22(19):2222-2227.
24. Silber JS, Anderson DG, Daffner SD, et al. Donor site morbidity after anterior iliac crest bone harvest for single-level anterior cervical discectomy and fusion. Spine (Phila Pa 1976). 2003;28(2):134-139.
25. Seiler JG 3rd, Johnson J. Iliac crest autogenous bone grafting: donor site complications. J South Orthop Assoc. 2000;9(2):91-97.
26. Floyd T, Ohnmeiss D. A meta-analysis of autograft versus allograft in anterior cervical fusion. Eur Spine J. 2000;9(5):398-403.
27. Delloye C, Cornu O, Druez V, Barbier O. Bone allografts: what they can offer and what they cannot. J Bone Joint Surg Br. 2007;89(5):574-579.
28. Armour S. Illegal trade in bodies shakes loved ones. USA Today. http://usatoday30.usatoday.com/money/2006-04-26-body-parts-cover-usat_x.htm. Updated April 28, 2006. Accessed April 6, 2016.
29. Wigfield CC, Nelson RJ. Nonautologous interbody fusion materials in cervical spine surgery: how strong is the evidence to justify their use? Spine (Phila Pa 1976). 2001;26(6):687-694.
30. Bärlocher CB, Barth A, Krauss JK, Binggeli R, Seiler RW. Comparative evaluation of microdiscectomy only, autograft fusion, polymethylmethacrylate interposition, and threaded titanium cage fusion for treatment of single-level cervical disc disease: a prospective randomized study in 125 patients. Neurosurg Focus. 2002;12(1):E4.
31. Baskin DS, Ryan P, Sonntag V, Westmark R, Widmayer MA. A prospective, randomized, controlled cervical fusion study using recombinant human bone morphogenetic protein-2 with the CORNERSTONE-SR allograft ring and the ATLANTIS anterior cervical plate. Spine (Phila Pa 1976). 2003;28(12):1219-1224.
32. Bishop RC, Moore KA, Hadley MN. Anterior cervical interbody fusion using autogeneic and allogeneic bone graft substrate: a prospective comparative analysis. J Neurosurg. 1996;85(2):206-210.
33. Martin GJ Jr, Haid RW Jr, MacMillan M, Rodts GE Jr, Berkman R. Anterior cervical discectomy with freeze-dried fibula allograft. Overview of 317 cases and literature review. Spine (Phila Pa 1976). 1999;24(9):852-858.
34. Bae HW, Zhao L, Kanim LE, Wong P, Delamarter RB, Dawson EG. Intervariability and intravariability of bone morphogenetic proteins in commercially available demineralized bone matrix products. Spine (Phila Pa 1976). 2006;31(12):1299-1306.
35. Burkus JK, Gornet MF, Dickman CA, Zdeblick TA. Anterior lumbar interbody fusion using rhBMP-2 with tapered interbody cages. J Spinal Disord Tech. 2002;15(5):337-349.
36. Dickerman RD, Reynolds AS, Morgan BC, Tompkins J, Cattorini J, Bennett M. rh-BMP-2 can be used safely in the cervical spine: dose and containment are the keys! Spine J. 2007;7(4):508-509.
37. Smucker JD, Rhee JM, Singh K, Yoon ST, Heller JG. Increased swelling complications associated with off-label usage of rhBMP-2 in the anterior cervical spine. Spine (Phila Pa 1976). 2006;31(24):2813-2819.
38. Vaidya R, Carp J, Sethi A, Bartol S, Craig J, Les CM. Complications of anterior cervical discectomy and fusion using recombinant human bone morphogenetic protein-2. Eur Spine J. 2007;16(8):1257-1265.
39. Vaidya R, Sethi A, Bartol S, Jacobson M, Coe C, Craig JG. Complications in the use of rhBMP-2 in PEEK cages for interbody spinal fusions. J Spinal Disord Tech. 2008;21(8):557-562.
40. Knox JB, Dai JM 3rd, Orchowski J. Osteolysis in transforaminal lumbar interbody fusion with bone morphogenetic protein-2. Spine (Phila Pa 1976). 2011;36(8):672-676.
41. Carragee EJ, Chu G, Rohatgi R, et al. Cancer risk after use of recombinant bone morphogenetic protein-2 for spinal arthrodesis. J Bone Joint Surg Am. 2013;95(17):1537-1545.
42. Lad SP, Bagley JH, Karikari IO, et al. Cancer after spinal fusion: the role of bone morphogenetic protein. Neurosurgery. 2013;73(3):440-449.
43. Bhadra AK, Raman AS, Casey AT, Crawford RJ. Single-level cervical radiculopathy: clinical outcome and cost-effectiveness of four techniques of anterior cervical discectomy and fusion and disc arthroplasty. Eur Spine J. 2009;18(2):232-237.
44. Castro FP Jr, Holt RT, Majd M, Whitecloud TS 3rd. A cost analysis of two anterior cervical fusion procedures. J Spinal Disord. 2000;13(6):511-514.
45. Kandziora F, Pflugmacher R, Scholz M, et al. Treatment of traumatic cervical spine instability with interbody fusion cages: a prospective controlled study with a 2-year follow-up. Injury. 2005;36(suppl 2):B27-B35.
46. Vaidya R, Weir R, Sethi A, Meisterling S, Hakeos W, Wybo CD. Interbody fusion with allograft and rhBMP-2 leads to consistent fusion but early subsidence. J Bone Joint Surg Br. 2007;89(3):342-345.
47. Epstein NE, Schwall GS, Hood DC. The incidence and cost of devices explanted during single-level anterior diskectomy/fusions. Surg Neurol Int. 2011;2:23.
Anterior cervical discectomy and fusion (ACDF) has been performed with various techniques and devices for many years. Autologous iliac crest grafts were initially used for the Cloward1,2 and Robinson and Smith3 techniques, but because of iliac crest graft site complications (eg, pain, infection, fracture, dystrophic scarring4,5), the procedure was generally superseded by allograft implants. These implants were then supplemented with anterior locking plate devices. More recently, unitary devices combining a polyetheretherketone (PEEK) spacer with screw or blade fixation have been developed, such as the Zero P (Synthes, Inc.) and the ROI-C cervical cage (LDR). Bone graft is required to fill the cavity of these devices and to promote osseous union. Demineralized bone matrix,6 tricalcium phosphate,7,8 and bone morphogenetic protein (BMP) have been used for these purposes, but they add expense to the procedure and have been associated with several complications (eg, neck swelling, dysphagia associated with BMP).9
Although multiple studies have demonstrated effective fusion rates and good outcomes for both iliac crest autograft and grafting/spacer constructs, the debate over cost and “added value” remains unresolved. One institution, which has published articles reviewing the spine literature and its own data, concluded that iliac crest autograft was the most cost-effective and consistently successful ACDF procedure.5,10
The VA Portland Health Care System (VAPORHCS) has analyzed the use of local autograft sources at the surgical site to circumvent the need to make a second incision at the iliac crest and, theoretically, to decrease risks and expenses associated with iliac crest autograft, allograft bone, and artificial constructs. Given the paucity of data on this method, the case series presented here represents one of a few studies that analyze local autograft for promotion of arthrodesis in a PEEK spacer device.
This article will report on the prospectively collected results of consecutive cases performed by Dr. Ross using a ROI-C cervical cage for 1-level anterior cervical discectomy between August 2011 and November 2014. This study received institutional review board approval.
Methods
Neck disability index (NDI) forms were used to assess the impact of neck pain on patients’ ability to manage in everyday life. The NDI form was completed before surgery and 3 and 9 months after surgery.
Dr. Ross preferred to perform minimally invasive posterior cervical foraminotomy for unilateral radiculopathy. Therefore, all patients with radiculopathy had bilateral symptoms or a symptomatic midline disc protrusion not accessible from a posterior approach. Standard techniques were used to make a left-side approach to the anterior cervical spine except in cases in which a previous right-side approach could be reused. Under the microscope, the anterior longitudinal ligament and annulus were incised, and the anterior contents of the disc space were removed with curettes and pituitary rongeurs. Care was taken to remove all cartilage from beneath the anterior inferior lip of the rostral vertebral body and to remove a few millimeters of the anterior longitudinal ligament from the rostral vertebral body without use of monopolar cautery (Figure 1). A 2 mm Kerrison punch then was used to remove the anterior inferior lip of the rostral vertebral body, and this bone was saved for grafting. No bone wax was used within the disc space.
After all disc space cartilage was removed from the endplates, additional bone was obtained from the uncovertebral joints and posterior vertebral bodies as the decompression proceeded posteriorly. Occasionally, distraction posts were used if the disc space was too narrow for optimal visualization posteriorly. After decompression was achieved, a lordotic ROI-C cervical cage was packed in its lumen with the bone chips and impacted into the disc space under fluoroscopic guidance. The blades were impacted under fluoroscopic guidance as well. The wound was closed with absorbable suture.
Antibiotics were given for no more than 24 hours after surgery. Ketorolac was used for analgesia the night of the surgery, and patients were asked to not use nonsteroidal anti-inflammatory drugs for 3 months after surgery. Lateral radiographs were obtained 3 and 9 months after surgery and every 6 months thereafter until arthrodesis was detected.
Results
Seventy-seven consecutive patients underwent 1-level anterior cervical discectomy (Table 1). Twenty-four procedures were performed for radiculopathy, 52 for myelopathy, and 1 for central cord injury sustained in a fall by a patient with preexisting spinal stenosis. Surgery was performed at C3-C4 (25 cases), C4-C5 (11 cases), C5-C6 (15 cases), and C6-C7 (1 case) for patients with myelopathy. Surgery was performed at C3-C4 (2 cases), C4-C5 (3 cases), C5-C6 (9 cases), and C6-C7 (10 cases) for patients with radiculopathy.
Twenty-eight patients reported presurgery tobacco use. Although all tobacco-using patients agreed to cease use in the perioperative period, at least 9 admitted to resuming tobacco use immediately after surgery. Eighteen patients had diabetes mellitus. In 2 patients, a diagnosis of osteoporosis was made with dual-energy X-ray absorptiometry. One patient was a chronic user of steroids before and after surgery. Mean body mass index (BMI) was 30.6, and 13 patients were morbidly obese (BMI > 34).
In 2 cases, only a single blade was placed. The second blade could not be placed because of broken adjacent screws (1 case) or undetermined reason (1 case).
The mean time for follow-up was 17 months (range 3-34). Four patients were lost to follow-up: 3 after the 1-month postoperative visit and 1 with severe psychiatric problems after hospital discharge.
There were no new neurologic deficits, no wound infections, and no recurrent laryngeal nerve palsies in the 77 patients. Eight months after surgery, 1 patient with radiculopathy underwent foraminotomy at the index level for persisting foraminal stenosis. Two patients whose myelopathic symptoms persisted after surgery returned for minimally invasive posterior laminotomy to remove infolded ligamentum flavum. The presurgery and 3- and 9-month postsurgery NDI scores were available for 52 patients (Table 2). Before surgery the mean NDI score was 24 (range 8-40). Three months postsurgery the mean NDI score was 15 (range 2-27) for patients with myelopathy and 13 (range 2-28) for patients with radiculopathy. The patient with the highest NDI score (28) stated that though all his symptoms were relieved, he had gauged his responses to protect his disability claim. Nine months after surgery, the mean NDI scores were 9.5 (range 5-17) for patients with myelopathy and 6 (range 2-13) for patients with radiculopathy. No NDI score was higher postsurgery than presurgery.
Arthrodesis was defined as bony bridging between the adjacent vertebral bodies and the bone graft within the lumen of the device, anterior to the device, or posterior to the device. In Dr. Ross’ protocol, computed tomography (CT) scans or flexion-extension radiographs were obtained only if pseudarthrosis was suspected to avoid unnecessary radiation exposure. Sixty-six patients had at least the 3-month radiography follow-up available. All 52 patients with 9-month follow-up data achieved complete arthrodesis, as determined by plain film radiography. Bridging ossification was found anterior to the device in all but 9 patients. Trabeculated bone was growing through the lumen of the device in all cases (Figure 2). A broken blade without clinical correlation was noted on imaging for 1 patient.
The total cost of the ROI-C cervical cage (LDR) for VAPORHCS was $3,498, or $1,749 for the PEEK spacer plus $1,749 for 2 metal blades. In comparison, the total cost of a typical anterior locking plate would have been $6,700, or $3,200 for the plate plus $2,000 for 4 screws and $1,500 for an allograft fibular spacer. Demineralized bone matrix (1 mL) as used in cervical arthrodesis by other surgeons at VAPORHCS cost $279, or about $500 including shipping.
DISCUSSION
Anterior cervical discectomy with fusion is a very common and successful surgical procedure for cervical myelopathy, radiculopathy, and degenerative disease that has failed to be corrected with conservative therapy.10 Medicare data documented a 206% increase in 1-level fusion procedures for degenerative spine pathology performed between 1992 and 2005.11 When a procedure is performed so often, it is appropriate to review methods and analyze efficacy, cost, and cost-effectiveness.
According to a 2007 meta-analysis, the fusion rates of 1-level ACDF arthrodesis at 1-year follow-up are 97.1% in patients treated with anterior plates and 92.1% in patients treated with noninstrumented fusion.12 The rate disparity was larger for multiple-level fusion: 50% to 82.5% for instrumented cases12,13 vs 3% to 42% for noninstrumented cases.14-16 Given the higher fusion rates achieved with instrumentation, surgeons have favored its use in ACDF.
Computed Tomography Use
Computed tomography has long been considered the gold standard for assessing arthrodesis outcomes (eg, Siambanes and Mather).17 However, recent data on potential harm caused by CT-related ionizing radiation suggest a need for caution with routine CT use.18,19 For cervical spine CT, Schonfeld and colleagues found that the risk for excess thyroid cancers ranged from 1 to 33 cases per 10,000 CT scans.20 According to another report, “limiting neck CT scanning to a higher risk group would increase the gap between benefit and harm, whereas performing CT routinely on low-risk cases approaches a point where its harm equals or exceeds its benefit.”19 As some have questioned even routinepostoperative use of radiation in patients with unremarkable clinical courses—patients should be spared unnecessary exposure—CT scans or flexion-extensionradiographs were obtained at VAPORHCS only if clinical symptoms or radiographs were suggestive of pseudarthrosis.21 As none of the VAPORHCS patients had those symptoms, none underwent postoperative CT.
For anterior cervical arthrodesis, surgeon preference determines which of many different bone substrates can be used with instrumentation, which impacts the costs. Fusion substrates include structural autografts, structural allografts, morselized autografts, morselized allografts, demineralized allografts, porous ceramics and metals, and BMP. Given these many options, studies comparing the constructs are lacking, especially with regard to the cost of alternative fusion constructs that produce similar outcomes. The Centers for Disease Control and Prevention defines cost-benefit analysis as a “type of economic evaluation that measures both costs and benefits (ie, negative and positive consequences) associated with an intervention in dollar terms.”22 It has been reported that using iliac crest autografts with anterior plate instrumentation is the most cost-effective method, yet alternatives remain in use.5,10
For ACDF, iliac crest bone is an ideal and widely used construct substrate. Structural grafts harvested from the crest provide significant stability due to their bicortical or tricortical configuration with interposed osteoinductive and osteogenic cancellous bone. Few graft complications (eg, graft resorption) and no immunogenic or infectious complications have been reported for iliac crest bone. However, autologous iliac crest increases operative time, and donor-site morbidity has been reported.23,24 A retrospective questionnaire-based investigation by Silber and colleagues, who evaluated iliac crest bone graft site morbidity in 1-level ACDF, found that 26.1% of patients had pain at the iliac crest harvest site, and 15.7% had numbness.24 Other complications, which occurred at lower rates, were bruising, hematoma, pelvic fracture, and poor cosmesis.23,25 In addition, osteoporosis and comorbid conditions have made it a challenge to acquire iliac crest autograft, contributing to the popularity of alternative substrates.25
Allografts
An alternative to autografts, allografts have the advantages of reduced operative time and reduced donor-site morbidity.26 Major historical concerns with allografts have included risk for disease transmission, costs associated with sterilization and serologic screening of grafts, and lack of oversight, leading to human allografts being acquired from dubious sources and ending up in the operating room.27,28 Two major types of allografts are available: mineralized and demineralized.
Arthrodesis rates are inferior for mineralized (structural) allografts with instrumentation than for autografts with instrumentation.29 In addition, smoking and other comorbidities have influenced fusion rates more in allograft than autograft fusions.30-33 However, allografts are being widely used because they avoid the donor-site morbidity associated with autografts and because they are load bearing, can provide structural stability and an osteoconductive matrix, and can be used off the shelf without adding much time to surgery.
Demineralized matrix substrates are commercial osteoconductive and osteoinductive biomaterials approved for filling bone gaps and extending graft when combined with autograft.7,8 Despite their osteoinductive properties, these substrates have had a high degree of product inconsistency, in some cases leading to poor outcomes.34 The lack of randomized studies with these constructs has made the determination of clear indications a challenge.
The initial enthusiasm over use of BMP, another bone-graft substitute for cervical fusion, was curtailed by reports of adverse events (AEs). Effective in anterior lumbar spine fusions, BMP was adapted to off-label use in the cervical spine a few years ago.35 Initial studies by Baskin and colleagues and Bishop and colleagues showed its fusion rates superior to those of allograft.31,32 Both studies reported no significant AEs. However, studies by Dickerman and colleagues and Smucker and colleagues demonstrated increased soft-tissue swelling leading to dysphagia and prolonged hospitalization, which were attributed to higher dosage (no study has identified a precise dose for individual patients).36,37 In addition, the cost of BMP is higher than that of any other bone-graft option for ACDF.3 Osteolysis has also been reported with BMP use.38-40 Carragee and colleagues highlighted the potential carcinogenicity of BMP, but this finding was not corroborated by Lad and colleagues.41,42
Cost Considerations
In addition to surgical effectiveness, spine surgical device costs have come under increased scrutiny.43-45 In 2012, plates were reported to cost (without overhead or profit margin to hospitals) between $1,015 and $3,601, and allograft spacers were estimated to cost between $1,220 and $3,640, cage costs ranged from $1,942 to $4,347, and PEEK spacers cost from $4,930 to $5,246.5 Individual surgeon instrumentation costs varied 10-fold based on the fusion constructs used.5
In a cost-effectiveness review of anterior cervical techniques, cage alone was the least expensive technique, disc arthroplasty or cage/plate/bone substitute groups were the next most expensive, and autograft alone was the most expensive option due to hip graft site morbidity.43 In another study, operative time associated with harvesting an iliac crest graft was equivalent in cost to that of an interbody cage.44 Other studies have compared the costs of various anterior cervical fusion constructs.9,10,45,46 A limitation of these studies is that autologous bone often refers to iliac crest grafts rather than local autograft. Epstein reviewed data from these studies and concluded, “ACDF using dynamic plates and autografts are the most cost effective treatment for anterior cervical discectomy,” citing a cost of $1,015 for this construct.5 Although Epstein demonstrated the cost-effectiveness of autograft in an individual surgeon’s hands, the results also are significant in that the studies identified areas in which improvements can be made at other institutions. The ROI-C cervical cage and local autograft bone cost that the authors report is at the lower end of the range reported by Epstein.5
Device explant rates also can be a concern. Operative waste was well described in a retrospective analysis of 87 ACDF procedures.47 The study found that the cost of explanting devices implanted during the same intraoperative period was equivalent to 9.2% of the cost of permanently implanted constructs. Epstein addressed operative waste by using educational modules to evaluate spine surgeons’ decision making before and after education. After the intervention, the institution noted a marked decline in costs related to explanted devices—from 20% in 2010 (before education) to 5.8% of the total cost of implanted devices in 2010 (after education).5
In the present study, the authors demonstrated that use of local morselized autograft with a PEEK spacer for 1-level ACDF had excellent arthrodesis rates and minimal complications. Of the 52 patients with 9 month postoperative data, all achieved arthrodesis regardless of tobacco use. This method compares favorably with other fusion options in terms of radiographic arthrodesis rates. In addition, it avoids the donor-site morbidity associated with autografts from an iliac site but maintains the benefits of the osteogenic, osteoconductive, and osteoinductive properties of autograft bone. Use of local autograft avoids the costs associated with iliac crest autograft, including increased operating and anesthesia time, additional operating room supplies (drapes, sutures, etc) needed for operating at a second site, and prolonged hospital stay due to pain at the donor site. Use of local autograft also obviates complications at a second surgical site; purchase, storage, and sterilization of allograft; and the neck swelling, possible carcinogenicity, and cost of purchase of BMP. Other than the occasional reuse of distraction posts, this method involves no other expensive explant supplies.
Autografts have osteogenic, osteoconductive, and osteoinductive properties, and autograft fusion rates are generally superior to allograft fusion rates. Bone morphogenetic protein fusion rates may be comparable to autograft fusion rates.9,26,32 Shortcomings of iliac crest autografts include increased operative time, blood loss, and donor-site morbidity. Allografts are osteoconductive and osteoinductive, but their fusion rates are inferior to those of iliac crest autografts. Other shortcomings are infection transmission and immunogenicity risks, higher graft resorption and collapse rates, cost, and previous issues relating to provenance. Bone morphogenetic protein is the most osteoinductive material with fusion rates similar to those of autograft, but its use is associated with neck swelling, dysphagia, osteolysis, potential carcinogenicity, and high cost.9
Conclusion
Overall, use of local autograft with a PEEK spacer has all the advantages of iliac crest autograft along with the benefit of working within the same operative window as the ACDF, thus reducing the infection, bleeding, and pain risks that may be encountered with a second incision. This procedure is effective, inexpensive, and cost-effective compared with alternatives and may be preferable for 1-level ACDF. In a population of patients with high rates of tobacco use, diabetes mellitus, obesity, and other factors that negatively affect fusion rates, local autograft may be a good choice for efficacy and cost savings.
Acknowledgments
The authors thank Shirley McCartney, PhD, for editorial assistance and Andy Rekito, MS, for illustrative assistance.
1. Cloward RB. The anterior approach for removal of ruptured cervical disks. 1958. J Neurosurg Spine. 2007;6(5):496-511.
2. Cloward RB. The anterior approach for removal of ruptured cervical disks. J Neurosurg. 1958;15(6):602-617.
3. Robinson RA, Smith GW. Anterolateral cervical disc removal and interbody fusion for cervical disc syndrome. SAS J. 2010;4(1):34-35.
4. Dimitriou R, Mataliotakis GI, Angoules AG, Kanakaris NK, Giannoudis PV. Complications following autologous bone graft harvesting from the iliac crest and using the RIA: a systematic review. Injury. 2011;42(suppl 2):S3-S15.
5. Epstein NE. Iliac crest autograft versus alternative constructs for anterior cervical spine surgery: pros, cons, and costs. Surg Neurol Int. 2012;3(suppl 3):S143-S156.
6. Gruskin E, Doll BA, Futrell FW, Schmitz JP, Hollinger JO. Demineralized bone matrix in bone repair: history and use. Adv Drug Deliv Rev. 2012;64(12):1063-1077.
7. Becker S, Maissen O, Ponomarev I, Stoll T, Rahn B, Wilke I. Osteopromotion by a beta-tricalcium phosphate/bone marrow hybrid implant for use in spine surgery. Spine (Phila Pa 1976). 2006;31(1):11-17.
8. Muschik M, Ludwig R, Halbhübner S, Bursche K, Stoll T. Beta-tricalcium phosphate as a bone substitute for dorsal spinal fusion in adolescent idiopathic scoliosis: preliminary results of a prospective clinical study. Eur Spine J. 2001;10(suppl 2):S178-S184.
9. Buttermann GR. Prospective nonrandomized comparison of an allograft with bone morphogenic protein versus an iliac-crest autograft in anterior cervical discectomy and fusion. Spine J. 2008;8(3):426-435.
10. Epstein NE. Efficacy and outcomes of dynamic-plated single-level anterior diskectomy/fusion with additional analysis of comparative costs. Surg Neurol Int. 2011;2:9.
11. Wang MC, Kreuter W, Wolfla CE, Maiman DJ, Deyo RA. Trends and variations in cervical spine surgery in the United States: Medicare beneficiaries, 1992 to 2005. Spine (Phila Pa 1976). 2009;34(9):955-961.
12. Fraser JF, Härtl R. Anterior approaches to fusion of the cervical spine: a metaanalysis of fusion rates. J Neurosurg Spine. 2007;6(4):298-303.
13. Nirala AP, Husain M, Vatsal DK. A retrospective study of multiple interbody grafting and long segment strut grafting following multilevel anterior cervical decompression. Br J Neurosurg. 2004;18(3):227-232.
14. Bohlman HH, Emery SE, Goodfellow DB, Jones PK. Robinson anterior cervical discectomy and arthrodesis for cervical radiculopathy. Long-term follow-up of one hundred and twenty-two patients. J Bone Joint Surg Am. 1993;75(9):1298-1307.
15. Cauthen JC, Kinard RE, Vogler JB, et al. Outcome analysis of noninstrumented anterior cervical discectomy and interbody fusion in 348 patients. Spine (Phila Pa 1976). 1998;23(2):188-192.
16. Emery SE, Fisher JR, Bohlman HH. Three-level anterior cervical discectomy and fusion: radiographic and clinical results. Spine (Phila Pa 1976). 1997;22(22):2622-2624.
17. Siambanes D, Mather S. Comparison of plain radiographs and CT scans in instrumented posterior lumbar interbody fusion. Orthopedics. 1998;21(2):165-167.
18. Berrington de González A, Mahesh M, Kim KP, et al. Projected cancer risks from computed tomographic scans performed in the United States in 2007. Arch Intern Med. 2009;169(22):2071-2077.
19. Hikino K, Yamamoto LG. The benefit of neck computed tomography compared with its harm (risk of cancer). J Trauma Acute Care Surg. 2015;78(1):126-131.
20. Schonfeld SJ, Lee C, Berrington de González A. Medical exposure to radiation and thyroid cancer. Clin Oncol (R Coll Radiol). 2011;23(4):244-250.
21. Bartels RH, Beems T, Schutte PJ, Verbeek AL. The rationale of postoperative radiographs after cervical anterior discectomy with stand-alone cage for radicular pain. J Neurosurg Spine. 2010;12(3):275-279.
22. Centers for Disease Control and Prevention. The different types of health assessments. Centers for Disease Control and Prevention website. http://www.cdc.gov/healthyplaces/types_health_assessments.htm. Updated July 25, 2012. Accessed April 8, 2016.
23. Schnee CL, Freese A, Weil RJ, Marcotte PJ. Analysis of harvest morbidity and radiographic outcome using autograft for anterior cervical fusion. Spine (Phila Pa 1976). 1997;22(19):2222-2227.
24. Silber JS, Anderson DG, Daffner SD, et al. Donor site morbidity after anterior iliac crest bone harvest for single-level anterior cervical discectomy and fusion. Spine (Phila Pa 1976). 2003;28(2):134-139.
25. Seiler JG 3rd, Johnson J. Iliac crest autogenous bone grafting: donor site complications. J South Orthop Assoc. 2000;9(2):91-97.
26. Floyd T, Ohnmeiss D. A meta-analysis of autograft versus allograft in anterior cervical fusion. Eur Spine J. 2000;9(5):398-403.
27. Delloye C, Cornu O, Druez V, Barbier O. Bone allografts: what they can offer and what they cannot. J Bone Joint Surg Br. 2007;89(5):574-579.
28. Armour S. Illegal trade in bodies shakes loved ones. USA Today. http://usatoday30.usatoday.com/money/2006-04-26-body-parts-cover-usat_x.htm. Updated April 28, 2006. Accessed April 6, 2016.
29. Wigfield CC, Nelson RJ. Nonautologous interbody fusion materials in cervical spine surgery: how strong is the evidence to justify their use? Spine (Phila Pa 1976). 2001;26(6):687-694.
30. Bärlocher CB, Barth A, Krauss JK, Binggeli R, Seiler RW. Comparative evaluation of microdiscectomy only, autograft fusion, polymethylmethacrylate interposition, and threaded titanium cage fusion for treatment of single-level cervical disc disease: a prospective randomized study in 125 patients. Neurosurg Focus. 2002;12(1):E4.
31. Baskin DS, Ryan P, Sonntag V, Westmark R, Widmayer MA. A prospective, randomized, controlled cervical fusion study using recombinant human bone morphogenetic protein-2 with the CORNERSTONE-SR allograft ring and the ATLANTIS anterior cervical plate. Spine (Phila Pa 1976). 2003;28(12):1219-1224.
32. Bishop RC, Moore KA, Hadley MN. Anterior cervical interbody fusion using autogeneic and allogeneic bone graft substrate: a prospective comparative analysis. J Neurosurg. 1996;85(2):206-210.
33. Martin GJ Jr, Haid RW Jr, MacMillan M, Rodts GE Jr, Berkman R. Anterior cervical discectomy with freeze-dried fibula allograft. Overview of 317 cases and literature review. Spine (Phila Pa 1976). 1999;24(9):852-858.
34. Bae HW, Zhao L, Kanim LE, Wong P, Delamarter RB, Dawson EG. Intervariability and intravariability of bone morphogenetic proteins in commercially available demineralized bone matrix products. Spine (Phila Pa 1976). 2006;31(12):1299-1306.
35. Burkus JK, Gornet MF, Dickman CA, Zdeblick TA. Anterior lumbar interbody fusion using rhBMP-2 with tapered interbody cages. J Spinal Disord Tech. 2002;15(5):337-349.
36. Dickerman RD, Reynolds AS, Morgan BC, Tompkins J, Cattorini J, Bennett M. rh-BMP-2 can be used safely in the cervical spine: dose and containment are the keys! Spine J. 2007;7(4):508-509.
37. Smucker JD, Rhee JM, Singh K, Yoon ST, Heller JG. Increased swelling complications associated with off-label usage of rhBMP-2 in the anterior cervical spine. Spine (Phila Pa 1976). 2006;31(24):2813-2819.
38. Vaidya R, Carp J, Sethi A, Bartol S, Craig J, Les CM. Complications of anterior cervical discectomy and fusion using recombinant human bone morphogenetic protein-2. Eur Spine J. 2007;16(8):1257-1265.
39. Vaidya R, Sethi A, Bartol S, Jacobson M, Coe C, Craig JG. Complications in the use of rhBMP-2 in PEEK cages for interbody spinal fusions. J Spinal Disord Tech. 2008;21(8):557-562.
40. Knox JB, Dai JM 3rd, Orchowski J. Osteolysis in transforaminal lumbar interbody fusion with bone morphogenetic protein-2. Spine (Phila Pa 1976). 2011;36(8):672-676.
41. Carragee EJ, Chu G, Rohatgi R, et al. Cancer risk after use of recombinant bone morphogenetic protein-2 for spinal arthrodesis. J Bone Joint Surg Am. 2013;95(17):1537-1545.
42. Lad SP, Bagley JH, Karikari IO, et al. Cancer after spinal fusion: the role of bone morphogenetic protein. Neurosurgery. 2013;73(3):440-449.
43. Bhadra AK, Raman AS, Casey AT, Crawford RJ. Single-level cervical radiculopathy: clinical outcome and cost-effectiveness of four techniques of anterior cervical discectomy and fusion and disc arthroplasty. Eur Spine J. 2009;18(2):232-237.
44. Castro FP Jr, Holt RT, Majd M, Whitecloud TS 3rd. A cost analysis of two anterior cervical fusion procedures. J Spinal Disord. 2000;13(6):511-514.
45. Kandziora F, Pflugmacher R, Scholz M, et al. Treatment of traumatic cervical spine instability with interbody fusion cages: a prospective controlled study with a 2-year follow-up. Injury. 2005;36(suppl 2):B27-B35.
46. Vaidya R, Weir R, Sethi A, Meisterling S, Hakeos W, Wybo CD. Interbody fusion with allograft and rhBMP-2 leads to consistent fusion but early subsidence. J Bone Joint Surg Br. 2007;89(3):342-345.
47. Epstein NE, Schwall GS, Hood DC. The incidence and cost of devices explanted during single-level anterior diskectomy/fusions. Surg Neurol Int. 2011;2:23.

Academic Reasonable Accommodations for Post-9/11 Veterans With Psychiatric Diagnoses, Part 2
Among the ever increasing number of post-9/11 veterans pursuing higher education are many who carry psychological injuries, which include depression, anxiety, and posttraumatic stress disorder (PTSD). The effects of these mental health issues can create acquired learning disabilities involving impairments in memory, attention, concentration, and abstract thinking.1-4 Such learning disabilities can prevent a soldier from successfully transitioning to student-veteran.
Academic reasonable accommodations for veterans with psychiatric diagnoses can strategically enhance student-veteran role integration. Similar to reasonable accommodations for physical diagnoses, academic accommodations for psychiatric conditions enhance qualifying student-veterans’ abilities to successfully pursue higher education by enabling them to compensate for deficits in memory, recall, concentration, and abstract thinking. Such assistance for veterans with disabilities has been advocated in order to promote academic progression and student empowerment.5,6 Although academic accommodations enable veterans to compensate for learning disabilities, such interventions are not routinely requested for a variety of reasons. There are several key factors influencing veterans’ decisions to request such accommodations.
To promote a healthy transition to the student-veteran role, health care providers (HCPs) should initiate conversations about potential acquired learning disabilities with post-9/11 veterans with psychiatric diagnoses who are or will become students. Unfortunately, the medical literature includes little information on this topic or on how to have these conversations. To date, there is no suggested theoretical framework for guiding such discussions.
As a foundation for such discussion, Part 1 of this article explained the implications of psychiatric diagnoses and other common factors that can significantly impede adult learning among post-9/11 veterans who are separated from service.7 Part 1 also addressed the fundamentals of academic reasonable accommodations, which are outlined in Table 1.
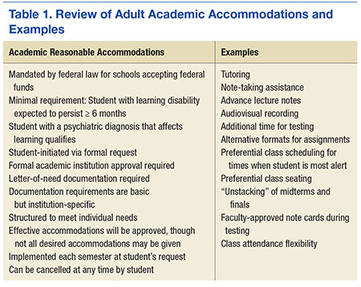
Through use of a theoretical model, part 2 of this study defines key factors influencing post-9/11 veterans’ decision to request academic reasonable accommodations for psychiatric diagnoses. It also provides practical advice for facilitating clinical conversations at each stage of the model to promote the acceptance of academic reasonable accommodations among eligible post-9/11 veterans.
Health Belief Model
The health belief model (HBM) can be adopted to understand the steps of veterans’ decision-making processes involving reasonable accommodations. The model outlines determinants of human behavior that influence the potential health care decision to deliberately mitigate harm from a perceived health threat.8,9 The 6 primary components are perceived susceptibility, perceived severity, perceived benefits, perceived barriers, cues to action, and self-efficacy.8,9 The HBM previously has been applied to a diverse range of health behaviors involving prevention, medical regimen adherence, and utilization of health care services.10 Its application to learning impairment and academic reasonable accommodations is outlined in Table 2.
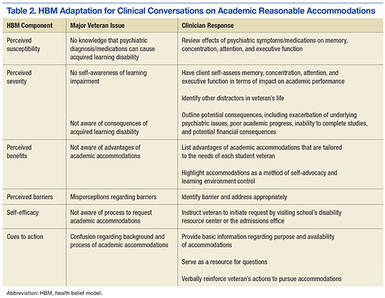
When the HBM framework is applied to academic accommodations, the perceived health threat is acquired learning disability. The desired health care decision is the act of requesting academic reasonable accommodations. The targeted population at risk is the post-9/11 veteran cohort with symptomatic psychiatric diagnoses who are enrolled in, or who are considering, postsecondary education.
The initial perceived susceptibility step determines the degree to which these veterans judge themselves as being at risk for learning impairment because of psychiatric diagnoses. During this step, it is imperative that HCPs educate veterans on how mental health conditions can alter adult learning styles. Clinicians should describe the negative effects of psychiatric symptoms on memory, concentration, focus, attention, and abstract thinking. Insight is developed in this step as veterans recognize that their academic endeavors potentially could be affected by underlying mental health symptoms.
Perceived Severity
Recognition of the perceived severity of impaired learning is the next step in HBM. Veterans will need to self-evaluate their actual or potential academic performance based on their current state of memory, concentration, focus, and attention. Although many veterans might determine that the impact is transient or minimal, a significant number of veterans will observe that their learning abilities are greatly affected. If veterans identify with loss of those skills since the onset of serious mental health issues, there should be further discussion regarding the existence of academic accommodations that address any learning impairment expected to last longer than 6 months.
As discussed in part 1, mental health diagnoses involving mood, though possessing individually distinct diagnostic criteria, create potentially similar global learning impairments in terms of decreased memory, poor concentration, and slowed executive functioning.1-4 Insight into the impact of any acquired learning disability from these mental health conditions and/or associated pharmacologic treatment can be encouraged if the clinician and client jointly review the client’s self-described premorbid learning style and compare it with the client’s current functioning in day-to-day activities requiring memory, concentration, and decision making. A clinician can use a gentle emphasis on the incongruities between premorbid learning ability and present-day impairments as a springboard for discussion about ways to compensate for learning impairments.
Additional insight can be elicited by providing practical examples of how other factors can accentuate the learning difficulties caused by serious or persistent psychiatric symptoms. By discussing these issues, clinicians can provide veterans with a more realistic understanding of potential obstacles in the postsecondary setting and the need for a strategic plan to address such challenges. For example, if a veteran takes prescription medications to manage underlying psychiatric conditions, a discussion regarding pertinent pharmacologic adverse effects (AEs) can highlight how academic performance might be affected. As outlined in part 1, fatigue, drowsiness, restlessness, mental grogginess, and insomnia are just a few medication AEs that may impair academic performance by negatively affecting memory, concentration, and executive functioning.
There are multiple circumstances that can increase the degree to which psychiatric symptoms impede recall, memory, insight, judgment, concentration, attention, organization, and abstract thinking. Impaired memory, poor concentration, irritability, and decreased attention can occur in the normal postmilitary transition period or as residual effects from mild-to-moderate traumatic brain injury. Multiple role responsibilities, such as being a spouse and parent, also can present significant mental distractions from academic endeavors. A physical impairment, such as tinnitus, hearing loss, or chronic pain, can impede classroom participation.
At this juncture, HCPs also should identify the academic consequences of impaired learning. Knowing these consequences will help veterans decide whether a course of action is needed to compensate for any learning disability that may be present. Inability to finish timed tests, difficulty taking notes, and inefficient studying are some of the more serious potential sequelae. Feared long-term consequences include a lack of progress through the required course load and, ultimately, failing courses.
A basic explanation of the potential financial effects of poor academic achievement provides another practical method for clinicians to outline negative consequences of an acquired learning disability. The student’s sole income for basic necessities is often the post-9/11 GI Bill, which pays for up to 36 months of education benefits and includes a living allowance and book stipend.
Unfortunately, given their financial dependence on the GI Bill, many veterans who withdraw from classes due to academic difficulties face economic uncertainty. If their withdrawal is not approved by the GI Bill program, these veterans must pay back all the money granted during the semester. Veterans who remain in school despite receiving failing marks cannot recover money spent on failed courses. This potentially results in veterans exceeding their entire GI Bill allotment before completing course requirements for their desired certificate or degree. Many veterans logically conclude that the potential financial devastation is a sufficiently severe consequence of impaired learning ability, and those who believe they have significantly impaired learning ability may become more motivated to reduce any risk of academic failure by pursuing academic accommodations.
In tandem with reviewing the potential severity of the problem, clinicians always should emphasize the availability of academic accommodations to circumvent the negative consequences of an acquired learning disability. Veterans who experience academic difficulties but are unaware of academic interventions may decide to forgo postsecondary education. By understanding basic details about accommodations, veterans can make the informed decision to pursue these interventions as part of a plan for academic success.
Perceived Benefits
Although identifying perceived susceptibility and perceived severity are necessary for veterans to consider academic reasonable accommodation use, eligible veterans still may not understand how these accommodations can apply to their situation. In the next step of HBM, veterans must view formal academic accommodations as a desirable solution to mitigate the effects of impaired learning ability. Veterans must appreciate the perceived benefits of such requests before they elect to pursue them.
At this point, HCPs should provide examples of academic accommodations to illustrate the simplicity and ease of such interventions. Tutoring, note-taking assistance, and providing additional time for testing are examples of a few types of accommodations featuring advantages that should be readily apparent to veterans returning to school. These measures not only lessen the likelihood of struggling academically, but also afford an opportunity to excel. By painting accommodations as a powerful method of self-advocacy, HCPs can inform veterans that accommodations enable a measure of control within the academic setting and assist with planning.
Perceived Barriers
Although identifying perceived benefits may be persuasive, discerning perceived barriers is an important HBM step that influences whether veterans will seek academic accommodations. Fortunately, many of the common barriers to accommodation requests are simply misconceptions that clinicians can address easily. For example, some veterans misconstrue reasonable accommodations as giving them an unfair advantage, which they find offensive to their personal integrity and pride. Clinicians should point out to these veterans that accommodations address deficits in learning abilities and merely level the academic playing field so the student-veteran is on par with those students without such impairments. The core work needed to pass the class remains unchanged by such accommodations.
Often a barrier is erected when veterans subscribe to the traditional military definition of disability, which is equated with having overwhelming physical injuries or paralyzing psychological states. These veterans are reluctant to request any formal accommodations, because they do not see themselves as having a disability under this restrictive definition. For these veterans, HCPs need to explain that the broad federal definition of disability does not imply veterans must be disabled in any other aspect of his or her life except for learning.
Some veterans do not want to draw attention to themselves either as a veteran or as a student with learning difficulties.11,12 Aware of civilian stereotyping of veterans, they prefer to remain anonymous. In this instance, clinicians should emphasize that psychiatric diagnoses are confidential and that only the reasonable accommodations are shared with the professor—not the underlying medical problem. The clinician also should emphasize that the accommodations are open to all eligible adult students, not just student-veterans. Therefore, use of such accommodations is not a disclosure of veteran status.
In conjunction with addressing client fears about stereotyping of both veterans and students with learning disabilities, HCPs should be mindful that mental health stigma is a significant barrier to seeking mental health services among military personnel, post-9/11 veterans, and college students.13,14 Therefore, clinicians should emphasize that academic accommodations for psychiatric diagnoses are not self-disclosing of psychiatric concerns and are usually the same accommodations used to address learning disabilities caused by other factors.
Veterans may believe that documentation obtained in support of reasonable accommodations is too intimidating or too personal to reveal. Not realizing that federal law prevents institutions from requesting in-depth documentation, veterans mistakenly believe that they must provide all medical documents in order to qualify for academic accommodations. To assuage these fears, clinicians should inform veterans that schools generally require only a documentation letter from a qualified provider and usually do not require other medical records.
To further alleviate veteran fears and promote a measure of client control, providers may find it beneficial to review the proposed medical documentation letter with the veteran and have the veteran approve the content. Figures 1 and 2 illustrate a basic medical documentation letter with optional institution-specific criteria. To ensure compliance with any applicable federal privacy regulations or local facility policy, clinicians should obtain an information release form from the veteran. The medical documentation letter can then be released to the veteran for hand delivery to the academic institution.
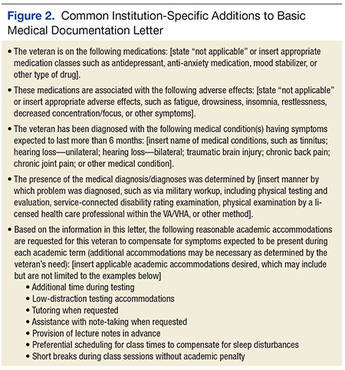
Veterans might be concerned about the potential lack of confidentiality regarding the diagnosis contributing to their learning disability. They also may worry that accommodations will prevent them from entering the field of their choice when they graduate, especially for law enforcement careers. These veterans can be reassured by informing them that use of academic accommodations is completely confidential during their school years and will not appear on their school graduation records. Recommending that veterans confirm the established confidentiality process with their schools may help allay fears about inadvertent release of private information by the institution.
Self-Efficacy and Cues to Action
Even after perceived benefits and barriers are identified, veterans still may not act unless they believe that they can intervene appropriately to address the problem. The HBM refers to this step as self-efficacy. Student-veterans must feel empowered to effectively make reasonable accommodation requests and negotiate any potential setbacks to the implementation of those accommodations. Health care providers should inform veterans about the availability of a disability resource center or other counseling service at each school that can help the student-veteran through the process of accommodation approval. Ideally, student-veterans also should receive guidance on how to approach professors regarding both the request for and the implementation of the approved reasonable accommodations.15 Counselors at the institution should offer this guidance and help veterans select the appropriate accommodations.
In the HBM, cues to action occur at every step. These cues consist of the influential factors promoting the desired behavior. Providing answers to common veteran questions about academic accommodations is one cue to action. Another is providing a written step-by-step guide explaining academic accommodations to veterans. (The author has created a veteran-centric guide to academic accommodations. The guide, which explains basic concepts and addresses common barriers to requesting such accommodations, is available upon request from Katherine.Mitchell1@va.gov).
At all times, positive feedback from clinicians is important in motivating veterans to complete the entire process. Discussion may be stalled at any point if veterans overestimate current academic abilities or underestimate their level of impaired learning ability. Motivational interviewing techniques may help resolve this impasse. However, even if eligible veterans are not interested in pursuing academic accommodations, HCPs should leave the option open for consideration. Although interventions are most beneficial when instituted early in the student’s coursework, veterans can formally request academic accommodations at any stage of their academic career.
Conclusion
Formal academic accommodations are viable tools for cultivating academic success among student-veterans with significant psychiatric conditions. The adoption of such interventions requires understanding post-9/11 veterans’ motivation and concerns about formal academic accommodation requests. Application of the HBM can guide clinicians in their discussions with post-9/11 veterans. By understanding the veterans’ perspectives on the subject, HCPs can directly address the factors influencing the decision to seek academic accommodations.
Ensuring successful transition to the student-veteran role is of prime importance for veterans who bear emotional scars from military service. To this author’s knowledge, no structured educational programs currently exist that inform either post-9/11 veterans or their HCPs about pertinent aspects of academic accommodations for student-veterans with symptomatic psychiatric diagnoses that impede learning. Future endeavors need to include development of programs to inform veterans and providers about this important topic. Such programs should not only promote the dissemination of general information, but also explore specific ways to tailor accommodations to the cognitive needs of each veteran.
1. Burriss L, Ayers E, Ginsberg J, Powell DA. Learning and memory impairment in PTSD: relationship to depression. Depress Anxiety. 2008;25(2):149-157.
2. Sweeney JA, Kmiec JA, Kupfer DJ. Neuropsychologic impairments in bipolar and unipolar mood disorders on the CANTAB neurocognitive battery. Biol Psychiatry. 2000;48(7):674-684.
3. Chamberlain SR, Sahakian BJ. The neuropsychology of mood disorders. Curr Psychiatry Rep. 2006;8(6):458-463.
4. Jaeger J, Berns S, Uzelac S, Davis-Conway S. Neurocognitive deficits and disability in major depressive disorder. Psychiatry Res. 2006;145(1):39-48.
5. Branker C. Deserving design: the new generation of student veterans. J Postsecond Educ Disabil. 2009;22(1):59-66.
6. Burnett SE, Segoria J. Collaboration for military transition students from combat to college: it takes a community. J Postsecond Educ and Disabil. 2009;22(1):53-58.
7. Mitchell K. Understanding academic reasonable accommodations for post-9/11 veterans with psychiatric diagnoses—part 1, the foundation. Fed Pract. 2016;33(4):33-39.
8. Rosenstock IM, Strecher VJ, Becker MH. Social learning theory and the health belief model. Health Educ Q. 1988;15(2):175-183.
9. Glanz K, Rimer BK. Theory at a Glance: A Guide for Health Promotion Practice. 2nd ed. Bethesda, MD: U.S. Deptartment of Health and Human Services, National Institutes of Health, National Cancer Institute; 2005.
10. Janz NK, Becker MH. The health belief model: a decade later. Health Educ Q. 1984;11(1):1-47.
11. Salzer MS, Wick LC, Rogers JA. Familiarity with and use of accommodations and supports among postsecondary students with mental illnesses. Psychiatr Serv. 2008;59(4):370-375.
12. Shackelford AL. Documenting the needs of student veterans with disabilities: intersection roadblocks, solutions, and legal realities. J Postsecond Educ Disabil. 2009;22(1):36-42.
13. Eisenberg D, Downs MF, Golberstein E, Zivin K. Stigma and help seeking for mental health among college students. Med Care Res Rev. 2009;66(5):522-541.
14. Vogt D. Mental health related beliefs as a barrier to service use for military personnel and veterans: a review. Psychiatr Serv. 2011;62(2):135-142.
15. Palmer C, Roessler RT. Requesting classroom accommodations: self-advocacy and conflict resolution training for college students with disabilities. J Rehabil. 2000;66(3):38-43.
Among the ever increasing number of post-9/11 veterans pursuing higher education are many who carry psychological injuries, which include depression, anxiety, and posttraumatic stress disorder (PTSD). The effects of these mental health issues can create acquired learning disabilities involving impairments in memory, attention, concentration, and abstract thinking.1-4 Such learning disabilities can prevent a soldier from successfully transitioning to student-veteran.
Academic reasonable accommodations for veterans with psychiatric diagnoses can strategically enhance student-veteran role integration. Similar to reasonable accommodations for physical diagnoses, academic accommodations for psychiatric conditions enhance qualifying student-veterans’ abilities to successfully pursue higher education by enabling them to compensate for deficits in memory, recall, concentration, and abstract thinking. Such assistance for veterans with disabilities has been advocated in order to promote academic progression and student empowerment.5,6 Although academic accommodations enable veterans to compensate for learning disabilities, such interventions are not routinely requested for a variety of reasons. There are several key factors influencing veterans’ decisions to request such accommodations.
To promote a healthy transition to the student-veteran role, health care providers (HCPs) should initiate conversations about potential acquired learning disabilities with post-9/11 veterans with psychiatric diagnoses who are or will become students. Unfortunately, the medical literature includes little information on this topic or on how to have these conversations. To date, there is no suggested theoretical framework for guiding such discussions.
As a foundation for such discussion, Part 1 of this article explained the implications of psychiatric diagnoses and other common factors that can significantly impede adult learning among post-9/11 veterans who are separated from service.7 Part 1 also addressed the fundamentals of academic reasonable accommodations, which are outlined in Table 1.
Through use of a theoretical model, part 2 of this study defines key factors influencing post-9/11 veterans’ decision to request academic reasonable accommodations for psychiatric diagnoses. It also provides practical advice for facilitating clinical conversations at each stage of the model to promote the acceptance of academic reasonable accommodations among eligible post-9/11 veterans.
Health Belief Model
The health belief model (HBM) can be adopted to understand the steps of veterans’ decision-making processes involving reasonable accommodations. The model outlines determinants of human behavior that influence the potential health care decision to deliberately mitigate harm from a perceived health threat.8,9 The 6 primary components are perceived susceptibility, perceived severity, perceived benefits, perceived barriers, cues to action, and self-efficacy.8,9 The HBM previously has been applied to a diverse range of health behaviors involving prevention, medical regimen adherence, and utilization of health care services.10 Its application to learning impairment and academic reasonable accommodations is outlined in Table 2.
When the HBM framework is applied to academic accommodations, the perceived health threat is acquired learning disability. The desired health care decision is the act of requesting academic reasonable accommodations. The targeted population at risk is the post-9/11 veteran cohort with symptomatic psychiatric diagnoses who are enrolled in, or who are considering, postsecondary education.
The initial perceived susceptibility step determines the degree to which these veterans judge themselves as being at risk for learning impairment because of psychiatric diagnoses. During this step, it is imperative that HCPs educate veterans on how mental health conditions can alter adult learning styles. Clinicians should describe the negative effects of psychiatric symptoms on memory, concentration, focus, attention, and abstract thinking. Insight is developed in this step as veterans recognize that their academic endeavors potentially could be affected by underlying mental health symptoms.
Perceived Severity
Recognition of the perceived severity of impaired learning is the next step in HBM. Veterans will need to self-evaluate their actual or potential academic performance based on their current state of memory, concentration, focus, and attention. Although many veterans might determine that the impact is transient or minimal, a significant number of veterans will observe that their learning abilities are greatly affected. If veterans identify with loss of those skills since the onset of serious mental health issues, there should be further discussion regarding the existence of academic accommodations that address any learning impairment expected to last longer than 6 months.
As discussed in part 1, mental health diagnoses involving mood, though possessing individually distinct diagnostic criteria, create potentially similar global learning impairments in terms of decreased memory, poor concentration, and slowed executive functioning.1-4 Insight into the impact of any acquired learning disability from these mental health conditions and/or associated pharmacologic treatment can be encouraged if the clinician and client jointly review the client’s self-described premorbid learning style and compare it with the client’s current functioning in day-to-day activities requiring memory, concentration, and decision making. A clinician can use a gentle emphasis on the incongruities between premorbid learning ability and present-day impairments as a springboard for discussion about ways to compensate for learning impairments.
Additional insight can be elicited by providing practical examples of how other factors can accentuate the learning difficulties caused by serious or persistent psychiatric symptoms. By discussing these issues, clinicians can provide veterans with a more realistic understanding of potential obstacles in the postsecondary setting and the need for a strategic plan to address such challenges. For example, if a veteran takes prescription medications to manage underlying psychiatric conditions, a discussion regarding pertinent pharmacologic adverse effects (AEs) can highlight how academic performance might be affected. As outlined in part 1, fatigue, drowsiness, restlessness, mental grogginess, and insomnia are just a few medication AEs that may impair academic performance by negatively affecting memory, concentration, and executive functioning.
There are multiple circumstances that can increase the degree to which psychiatric symptoms impede recall, memory, insight, judgment, concentration, attention, organization, and abstract thinking. Impaired memory, poor concentration, irritability, and decreased attention can occur in the normal postmilitary transition period or as residual effects from mild-to-moderate traumatic brain injury. Multiple role responsibilities, such as being a spouse and parent, also can present significant mental distractions from academic endeavors. A physical impairment, such as tinnitus, hearing loss, or chronic pain, can impede classroom participation.
At this juncture, HCPs also should identify the academic consequences of impaired learning. Knowing these consequences will help veterans decide whether a course of action is needed to compensate for any learning disability that may be present. Inability to finish timed tests, difficulty taking notes, and inefficient studying are some of the more serious potential sequelae. Feared long-term consequences include a lack of progress through the required course load and, ultimately, failing courses.
A basic explanation of the potential financial effects of poor academic achievement provides another practical method for clinicians to outline negative consequences of an acquired learning disability. The student’s sole income for basic necessities is often the post-9/11 GI Bill, which pays for up to 36 months of education benefits and includes a living allowance and book stipend.
Unfortunately, given their financial dependence on the GI Bill, many veterans who withdraw from classes due to academic difficulties face economic uncertainty. If their withdrawal is not approved by the GI Bill program, these veterans must pay back all the money granted during the semester. Veterans who remain in school despite receiving failing marks cannot recover money spent on failed courses. This potentially results in veterans exceeding their entire GI Bill allotment before completing course requirements for their desired certificate or degree. Many veterans logically conclude that the potential financial devastation is a sufficiently severe consequence of impaired learning ability, and those who believe they have significantly impaired learning ability may become more motivated to reduce any risk of academic failure by pursuing academic accommodations.
In tandem with reviewing the potential severity of the problem, clinicians always should emphasize the availability of academic accommodations to circumvent the negative consequences of an acquired learning disability. Veterans who experience academic difficulties but are unaware of academic interventions may decide to forgo postsecondary education. By understanding basic details about accommodations, veterans can make the informed decision to pursue these interventions as part of a plan for academic success.
Perceived Benefits
Although identifying perceived susceptibility and perceived severity are necessary for veterans to consider academic reasonable accommodation use, eligible veterans still may not understand how these accommodations can apply to their situation. In the next step of HBM, veterans must view formal academic accommodations as a desirable solution to mitigate the effects of impaired learning ability. Veterans must appreciate the perceived benefits of such requests before they elect to pursue them.
At this point, HCPs should provide examples of academic accommodations to illustrate the simplicity and ease of such interventions. Tutoring, note-taking assistance, and providing additional time for testing are examples of a few types of accommodations featuring advantages that should be readily apparent to veterans returning to school. These measures not only lessen the likelihood of struggling academically, but also afford an opportunity to excel. By painting accommodations as a powerful method of self-advocacy, HCPs can inform veterans that accommodations enable a measure of control within the academic setting and assist with planning.
Perceived Barriers
Although identifying perceived benefits may be persuasive, discerning perceived barriers is an important HBM step that influences whether veterans will seek academic accommodations. Fortunately, many of the common barriers to accommodation requests are simply misconceptions that clinicians can address easily. For example, some veterans misconstrue reasonable accommodations as giving them an unfair advantage, which they find offensive to their personal integrity and pride. Clinicians should point out to these veterans that accommodations address deficits in learning abilities and merely level the academic playing field so the student-veteran is on par with those students without such impairments. The core work needed to pass the class remains unchanged by such accommodations.
Often a barrier is erected when veterans subscribe to the traditional military definition of disability, which is equated with having overwhelming physical injuries or paralyzing psychological states. These veterans are reluctant to request any formal accommodations, because they do not see themselves as having a disability under this restrictive definition. For these veterans, HCPs need to explain that the broad federal definition of disability does not imply veterans must be disabled in any other aspect of his or her life except for learning.
Some veterans do not want to draw attention to themselves either as a veteran or as a student with learning difficulties.11,12 Aware of civilian stereotyping of veterans, they prefer to remain anonymous. In this instance, clinicians should emphasize that psychiatric diagnoses are confidential and that only the reasonable accommodations are shared with the professor—not the underlying medical problem. The clinician also should emphasize that the accommodations are open to all eligible adult students, not just student-veterans. Therefore, use of such accommodations is not a disclosure of veteran status.
In conjunction with addressing client fears about stereotyping of both veterans and students with learning disabilities, HCPs should be mindful that mental health stigma is a significant barrier to seeking mental health services among military personnel, post-9/11 veterans, and college students.13,14 Therefore, clinicians should emphasize that academic accommodations for psychiatric diagnoses are not self-disclosing of psychiatric concerns and are usually the same accommodations used to address learning disabilities caused by other factors.
Veterans may believe that documentation obtained in support of reasonable accommodations is too intimidating or too personal to reveal. Not realizing that federal law prevents institutions from requesting in-depth documentation, veterans mistakenly believe that they must provide all medical documents in order to qualify for academic accommodations. To assuage these fears, clinicians should inform veterans that schools generally require only a documentation letter from a qualified provider and usually do not require other medical records.
To further alleviate veteran fears and promote a measure of client control, providers may find it beneficial to review the proposed medical documentation letter with the veteran and have the veteran approve the content. Figures 1 and 2 illustrate a basic medical documentation letter with optional institution-specific criteria. To ensure compliance with any applicable federal privacy regulations or local facility policy, clinicians should obtain an information release form from the veteran. The medical documentation letter can then be released to the veteran for hand delivery to the academic institution.
Veterans might be concerned about the potential lack of confidentiality regarding the diagnosis contributing to their learning disability. They also may worry that accommodations will prevent them from entering the field of their choice when they graduate, especially for law enforcement careers. These veterans can be reassured by informing them that use of academic accommodations is completely confidential during their school years and will not appear on their school graduation records. Recommending that veterans confirm the established confidentiality process with their schools may help allay fears about inadvertent release of private information by the institution.
Self-Efficacy and Cues to Action
Even after perceived benefits and barriers are identified, veterans still may not act unless they believe that they can intervene appropriately to address the problem. The HBM refers to this step as self-efficacy. Student-veterans must feel empowered to effectively make reasonable accommodation requests and negotiate any potential setbacks to the implementation of those accommodations. Health care providers should inform veterans about the availability of a disability resource center or other counseling service at each school that can help the student-veteran through the process of accommodation approval. Ideally, student-veterans also should receive guidance on how to approach professors regarding both the request for and the implementation of the approved reasonable accommodations.15 Counselors at the institution should offer this guidance and help veterans select the appropriate accommodations.
In the HBM, cues to action occur at every step. These cues consist of the influential factors promoting the desired behavior. Providing answers to common veteran questions about academic accommodations is one cue to action. Another is providing a written step-by-step guide explaining academic accommodations to veterans. (The author has created a veteran-centric guide to academic accommodations. The guide, which explains basic concepts and addresses common barriers to requesting such accommodations, is available upon request from Katherine.Mitchell1@va.gov).
At all times, positive feedback from clinicians is important in motivating veterans to complete the entire process. Discussion may be stalled at any point if veterans overestimate current academic abilities or underestimate their level of impaired learning ability. Motivational interviewing techniques may help resolve this impasse. However, even if eligible veterans are not interested in pursuing academic accommodations, HCPs should leave the option open for consideration. Although interventions are most beneficial when instituted early in the student’s coursework, veterans can formally request academic accommodations at any stage of their academic career.
Conclusion
Formal academic accommodations are viable tools for cultivating academic success among student-veterans with significant psychiatric conditions. The adoption of such interventions requires understanding post-9/11 veterans’ motivation and concerns about formal academic accommodation requests. Application of the HBM can guide clinicians in their discussions with post-9/11 veterans. By understanding the veterans’ perspectives on the subject, HCPs can directly address the factors influencing the decision to seek academic accommodations.
Ensuring successful transition to the student-veteran role is of prime importance for veterans who bear emotional scars from military service. To this author’s knowledge, no structured educational programs currently exist that inform either post-9/11 veterans or their HCPs about pertinent aspects of academic accommodations for student-veterans with symptomatic psychiatric diagnoses that impede learning. Future endeavors need to include development of programs to inform veterans and providers about this important topic. Such programs should not only promote the dissemination of general information, but also explore specific ways to tailor accommodations to the cognitive needs of each veteran.
1. Burriss L, Ayers E, Ginsberg J, Powell DA. Learning and memory impairment in PTSD: relationship to depression. Depress Anxiety. 2008;25(2):149-157.
2. Sweeney JA, Kmiec JA, Kupfer DJ. Neuropsychologic impairments in bipolar and unipolar mood disorders on the CANTAB neurocognitive battery. Biol Psychiatry. 2000;48(7):674-684.
3. Chamberlain SR, Sahakian BJ. The neuropsychology of mood disorders. Curr Psychiatry Rep. 2006;8(6):458-463.
4. Jaeger J, Berns S, Uzelac S, Davis-Conway S. Neurocognitive deficits and disability in major depressive disorder. Psychiatry Res. 2006;145(1):39-48.
5. Branker C. Deserving design: the new generation of student veterans. J Postsecond Educ Disabil. 2009;22(1):59-66.
6. Burnett SE, Segoria J. Collaboration for military transition students from combat to college: it takes a community. J Postsecond Educ and Disabil. 2009;22(1):53-58.
7. Mitchell K. Understanding academic reasonable accommodations for post-9/11 veterans with psychiatric diagnoses—part 1, the foundation. Fed Pract. 2016;33(4):33-39.
8. Rosenstock IM, Strecher VJ, Becker MH. Social learning theory and the health belief model. Health Educ Q. 1988;15(2):175-183.
9. Glanz K, Rimer BK. Theory at a Glance: A Guide for Health Promotion Practice. 2nd ed. Bethesda, MD: U.S. Deptartment of Health and Human Services, National Institutes of Health, National Cancer Institute; 2005.
10. Janz NK, Becker MH. The health belief model: a decade later. Health Educ Q. 1984;11(1):1-47.
11. Salzer MS, Wick LC, Rogers JA. Familiarity with and use of accommodations and supports among postsecondary students with mental illnesses. Psychiatr Serv. 2008;59(4):370-375.
12. Shackelford AL. Documenting the needs of student veterans with disabilities: intersection roadblocks, solutions, and legal realities. J Postsecond Educ Disabil. 2009;22(1):36-42.
13. Eisenberg D, Downs MF, Golberstein E, Zivin K. Stigma and help seeking for mental health among college students. Med Care Res Rev. 2009;66(5):522-541.
14. Vogt D. Mental health related beliefs as a barrier to service use for military personnel and veterans: a review. Psychiatr Serv. 2011;62(2):135-142.
15. Palmer C, Roessler RT. Requesting classroom accommodations: self-advocacy and conflict resolution training for college students with disabilities. J Rehabil. 2000;66(3):38-43.
A Real Welcome Home: Permanent Housing for Homeless Veterans
Mr. G is a 67-year-old veteran. During the Vietnam War, he had the “most dangerous job”: helicopter door gunner and mechanic. He served in multiple combat missions and was under constant threat of attack. On returning to the U.S., he experienced anger outbursts, nightmares, hypervigilance, and urges to engage in dangerous behavior, such as driving a motorcycle more than 100 mph. Then he began abusing alcohol and drugs. Mr. G’s behavior and substance abuse eventually led to strained family relationships, termination from a high-paying job, and homelessness.
In 2001, the Washington DC VAMC homeless and substance abuse staff provided outreach and services that helped him secure permanent subsidized housing, achieve and maintain sobriety, get treatment for posttraumatic stress disorder (PTSD), and get full-time employment. Mr. G has maintained permanent supported housing status for 9 years, regained a sense of purpose, remained drug- and alcohol-free since 2001, attended a Vietnam combat PTSD support group weekly, and been an exemplary employee for 8 years.
In 2009, on any given night in the U.S., more than 75,000 veterans were without a permanent home and living on the streets, as Mr. G had been.1 Nearly 150,000 other veterans were spending the night in an emergency shelter or transitional housing. In early 2010, the U.S. Interagency Council on Homelessness (USICH) developed a strategic plan to align federal resources toward 4 key objectives, which included preventing and ending homelessness among veterans. Since then, the most dramatic reductions in homelessness have occurred among veterans, with an overall 33% decline in chronic homelessness nationwide.
According to the U.S. Department of Housing and Urban Development (HUD), permanent housing is defined as community-based housing without a designated length of stay in which formerly homeless individuals live as independently as possible.2 Under permanent housing, a program participant must be the tenant on a lease for at least 1 year, and the lease is renewable and terminable only for cause. The federal definition of the chronically homeless is a person who is homeless and lives in a place not meant for human habitation, in a safe haven, or in an emergency shelter continuously for at least 1 year; or on at least 4 separate occasions within the past 3 years; and who can be diagnosed with ≥ 1 of the following conditions: substance use disorder, serious mental illness, developmental disability as defined in section 102 of the Developmental Disabilities Assistance Bill of Rights Act of 2000 (42 U.S.C. 15002), PTSD, cognitive impairments caused by brain injury, and chronic physical illness or disability.3
Ending homelessness makes sense from a variety of perspectives. From a moral perspective, no one should experience homelessness, but this is especially true for the men and women who have served in the U.S. military. From a health care and resources perspective, homelessness is associated with poorer medical outcomes; higher medical costs for emergency department visits and hospital admissions; longer stays (often for conditions that could be treated in ambulatory settings); and increased mortality.4-7 From a societal perspective, homelessness is associated with costs for shelters and other forms of temporary housing and with higher justice system costs stemming from police, court, and jail involvement.8 The higher justice system costs are in part attributable to significantly longer incarcerations for homeless persons than for demographically similar inmates who have been similarly charged but have housing.9 According to recent studies, significant cost reductions have been achieved by addressing homelessness and providing permanent housing, particularly for the chronically homeless with mental illness.10-14
This article describes the efforts that have been made, through collaborations and coalitions of government and community partners, to identify and address risk factors for homelessness in Washington, DC—and ultimately to end veteran homelessness in the nation’s capitol.
Historic Perspective on Veteran Homelessness
Although the problem was first described after the Revolutionary War and again after the Civil War, homelessness among U.S. veterans has only recently been academically studied. During the colonial period, men often were promised pensions or land grants in exchange for military service. Several states failed to deliver on these promises, throwing veterans into dire financial circumstances and leaving them homeless. By the end of the Civil War, the size of the veteran population (almost 2 million, counting only those who fought for the Union), combined with an unemployment rate of 40% and economic downturns, led to thousands of veterans becoming homeless.15,16
Homelessness among veterans continued after World War I. In 1932, more than 15,000 homeless and disabled “Bonus Army,” World War I veterans, marched on Washington to demand payment of the financial benefits promised for their military service.
Although World War II and Korean War veterans did not experience homelessness as previous veterans had, the problem resurfaced after Vietnam—the combat veterans of that war were overrepresented among the homeless.17,18 Those at highest risk ranged from age 35 to 44 years in the early years of the all-volunteer military. It has been suggested that their increased risk may reflect social selection—volunteers for military service came from poor economic backgrounds with fewer social supports.19 A more recent study found that 3.8% of more than 300,000 Iraq and Afghanistan veterans who were followed for 5 years after military discharge experienced a homeless episode.20 Female veterans similarly are overrepresented among the homeless.21 Female veterans represent only 1% of the overall female population, yet 3% to 4% are homeless.
Homelessness has always been a social problem, but only during the 1970s and 1980s did homelessness increase in importance—the number of visibly homeless people rose during that period—and investigators began to study and address the issue. Experts have described several factors that contributed to the increase in homelessness during that time.22,23 First, as part of the deinstitutionalization initiative, thousands of mentally ill persons were released from state mental hospitals without a plan in place for affordable or supervised housing. Second, single-room-occupancy dwellings in poor areas, where transient single men lived, were demolished, and affordable housing options decreased. Third, economic and social changes were factors, such as a decreased need for seasonal and unskilled labor; reduced likelihood that relatives will take in homeless family members; and decriminalized public intoxication, loitering, and vagrancy. Out of these conditions came an interest in studying the causes of and risk factors for veteran homelessness and in developing a multipronged approach to end veteran homelessness.
Demographics
Nationally, veterans account for 9% of the homeless population.24 Predominantly, they are single men living in urban areas—only about 9% are women—and 43% served during the Vietnam era.24 Among homeless veterans, minorities are overrepresented—45% are African American or Hispanic, as contrasted with 10% and 3%, respectively, of the general population. More than two-thirds served in the military for more than 3 years, and 76% have a history of mental illness or substance abuse. Compared with the general homeless population, homeless veterans are older, better educated, more likely to have been married, and more likely to have health insurance, primarily through the VA.24,25
The Washington, DC, metropolitan area encompasses the District of Columbia, northern Virginia, the tricounty area of southern Maryland, and Montgomery and Prince George’s counties in Maryland. Demographics for veterans in this area vary somewhat from national figures. According to the 2015 Point-in-Time survey of the homeless, veterans accounted for 5% of the homeless population (less than the national percentage). Most homeless veterans were single men (11.6% were women) and African American (65% of single adults, 85% of adults in families). Forty-five percent reported being employed and 40% had a substance use disorder or a serious mental illness. A large proportion also had at least 1 physical disability, such as hypertension, hepatitis, arthritis, diabetes mellitus, or heart disease.26
Risk Factors
Multiple studies and multivariate analyses have determined that veteran status is associated with an increased risk for homelessness for both male and female veterans.27 Female veterans were 3 times and male veterans 2 times more likely than nonveterans to become homeless, even when poverty, age, race, and geographic variation were controlled. A recent systematic review of U.S. veterans found that the strongest and most consistent risk factors for homelessness were substance use disorders and mental illness, particularly psychotic disorders. Posttraumatic stress disorder was not more significant than other mental conditions but it was a risk factor. Low income, unemployment, and poor money management were also factors.
Social risk factors include lack of support from family and friends. Military service with multiple deployments, transfers, and on-base housing may contribute to interruption of social support and lead to social isolation, thus increasing veterans’ risk for homelessness. Some studies have found that veterans are more likely to report physical injury or medical problems as contributing to homelessness and more likely to have 2 or more chronic medical conditions. Last, history of incarceration and adverse childhood experiences (eg, behavioral problems, family instability, foster care, childhood abuse) also have been found to be risk factors for homelessness among veterans and nonveterans alike.
Understanding these risk factors is an important step in addressing homelessness. Homelessness prevention efforts can screen for these risk factors and then intervene as quickly as possible. Access to mental health and substance abuse services, employment assistance, disability benefits and other income supports, and social services may prevent initial and subsequent episodes of homelessness. The VA, as the largest integrated health system in the U.S., is a critical safety net for low-income and disabled veterans with complex psychosocial needs. One study found access to VA service-connected pensions was protective against homelessness.28
Addressing Homelessness
There are 10 USICH-recommended strategies for ending veteran homelessness (Table 1). These strategies cannot be achieved by any single federal agency or exclusively by government agencies—they require multipronged approaches and private and public partnerships. In early 2011, the staff of the Washington DC VAMC homeless program identified a single point of contact who would regularly meet with each Continuum of Care local planning body and each Public Housing Authority (PHA). This contact could identify homeless veterans regardless of the agency from which they were requesting assistance. The contact also facilitated identification of specific bottleneck issues contributing to delays in housing veterans. One such issue was that veterans were filling out application forms by themselves, and in some cases, their information was incomplete, or supporting documents (eg, government-issued IDs) were missing. The VA team adjusted the procedures to better meet veterans’ needs. Now veterans identified as meeting requirements for housing assistance are enrolled in classes in which a caseworker reviews their completed applications to ensure they are complete and supporting documents included. If an ID is needed, the caseworker facilitates the process and then submits the veteran’s application to the local PHA for processing. The result has been no returned applications.
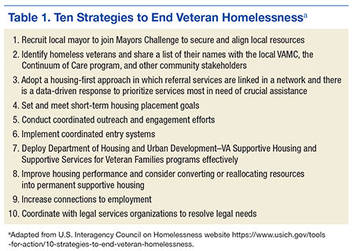
Another issue was that in some cases a veteran spoke with the PHA and indicated interest in an apartment and only later found out that the apartment failed inspection. There would then be back-and-forth communications between PHA and landlord to have repairs made so the unit could pass inspection, which often resulted in long delays. The solution was to have a stock of preinspected housing options. The Washington DC VAMC homeless program now has a housing specialist who identifies preinspected units and can expedite the lease to a veteran. In addition, the homeless program in partnership with the PHA now sets up regular meet-and-greet events for landlords and veterans so veterans can preview available rentals.
Housing-First Model
The homeless program readily adopted the housing-first model. This model focuses on helping individuals and families access housing as quickly as possible and remain permanently housed; this assistance is not time-limited but ongoing. After housing placement, the client can choose from an array of both time-limited and long-term services, which are individualized to promote housing stability and individual well-being. Most important, housing is not contingent on compliance with services. Instead, participants must comply with a standard lease agreement and are provided the services and support that can help them do so successfully. Services are determined by completing needs assessments. In addition, as a veteran is applying for housing, a caseworker actively uses motivational interviewing techniques to enhance the likelihood that the veteran will accept services.
Providing Core Service to Veterans
In 2012, the Washington DC VAMC opened the Community Resource and Referral Center (CRRC) as a one-stop shop for homeless and at-risk veterans in need of basic, core, wraparound services through the VA. Basic services include showers, laundry facilities, and a chapel. The CRRC has onsite psychiatric services that can engage veterans in mental health and substance abuse treatment. There is also an onsite primary care team who specialize in working with the homeless and can address any acute or chronic medical problems. For veterans who want to return to employment, there is an onsite Compensated Work Therapy program, which has uniquely partnered with the VAMC as well as community partners (eg, National Archives, Smithsonian Institution, Quantico National Cemetery, Arlington National Cemetery) to offer therapeutic job experiences that often lead to gainful full-time employment.
Veterans can use an onsite computer lab to complete resumes and apply for employment online, with the assistance of veteran peer specialists and vocational rehabilitation specialists. For veterans who are unable to work, the homeless program team assists with disability applications. Social Security, Veterans Benefits Administration representatives, and Legal Aid have office hours at the CRRC to provide one-stop shopping for veterans. Additional community partnerships have led to classes to help veterans manage income effectively, and veterans are assisted with completing tax returns.
Representatives from the Veterans Justice Outreach (VJO) and Health Care for Re-entry Veterans (HCRV) programs are also onsite. The VJO program provides outreach, assessment, and case management for justice-involved veterans to prevent unnecessary criminalization of mental illness and extended incarceration. A VJO program specialist works with courts, legal representatives, and jails and acts as a liaison to engage veterans in treatment and prevent incarcerations through jail diversion strategies. The HCRV program assists incarcerated veterans with reentry into the community through outreach and prerelease assessments, and referrals and links to medical, psychiatric, and social services, including employment services on release. This program also can provide short-term case management assistance on release.
In 2013, to further the implementation of the USICH strategies in the Washington, DC, metropolitan area, 12 local government and nonprofit agencies entered into the Veterans NOW coalition (Table 2). This collaboration enabled development of a coordinated effort to identify all area veterans experiencing homelessness, regardless of which agency the veterans contacted. Further, this team set up processes to assess veterans’ housing and service needs and to match each veteran to the most appropriate housing resource. There was consensus regarding use of the Service Prioritization Decision Assistance Tool (SPDAT) as the evidence-informed approach for prioritizing client needs and identifying areas in which support is most likely needed to prevent housing instability.29 More than 50 staff members at 20 different agencies in the District of Columbia have now been trained and are using this tool.

Outcomes
In 2010, the Point-in-Time count identified 718 homeless veterans in the Washington, DC, metropolitan area. By 2016, that number had dropped to 326 (55% reduction). During this same period, the number of veterans served by the Washington DC VAMC homeless program more than tripled, from 2,100 individuals in 2010 to nearly 6,400 in 2015. The coalition has housed or prevented homelessness for nearly 1,300 veterans during the past 2 years alone. Veterans were housed through multiple programs and efforts, including VA Supportive Housing (VASH), Supportive Services for Veteran Families, and Washington, DC Department of Human Services Permanent Supportive Housing. During the past year, > 60% of veterans were successfully placed in VASH housing within 90 days of application submission. Table 3 lists the national targets for assessing performance measurement and success. Not only were the various performance measure benchmarks exceeded, but more important, > 90% of veterans in VASH and Health Care for Homeless Veterans were able to keep their housing stabilized. Using SPDAT, the most chronically homeless and vulnerable were housed first, which accounts for the lower numbers of homeless Washington, DC, area veterans with substance abuse and mental health problems identified in the Point-in-Time survey.
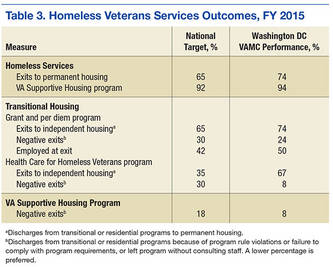
Discussion
At the Washington DC VAMC, HCHV program staff members used evidence-based and evidence-informed tools, collaborated with community partners, and implemented recommended best practices to end veteran homelessness by 2015. Permanent supportive housing through VASH is crucial for helping veterans overcome their lack of income and in providing mechanisms for engaging in mental health and substance abuse services as well as primary care and therapeutic employment opportunities.
When former VA Secretary Eric K. Shinseki first announced the goal of ending veteran homelessness by 2015, many people questioned this goal’s attainability and feasibility. However, through the adoption of the strategies recommended by USICH, the establishment of government and community partnerships (including faith-based groups) and the implementation of programs addressing substance abuse issues, mental and physical health, income limitations, and employment, this goal now seems possible. Overall veteran homelessness decreased by 36% since 2010, and unsheltered homelessness decreased by nearly 50%.30 By the end of 2015, nearly 65,000 veterans are in permanent housing nationwide, and another 8,100 are in the process of obtaining permanent supportive housing. Also, 87% of unsheltered veterans were able to move to safe housing within 30 days of engagement. Last, Supportive Services for Veteran Families was able to assist more than 156,800 individuals (single veterans as well as their children and families).
Sustainability from a national perspective also depends on continued federal funding. Mr. G, described at the beginning of this article, served his country honorably but then experienced the factors that put him at risk for homelessness. Through a veteran-centric team approach, he was able to successfully address each of these factors. As there are another 500 homeless veterans in Washington, DC, much work still needs to be done. With important collaborations and partnerships now in place, the goal of ending veteran homelessness in the District of Columbia is within sight. When homelessness is a thing of the past, we will truly be able to Welcome Home each veteran.
1. U.S. Department of Housing and Urban Development, Office of Community Planning and Development; U.S. Department of Veterans Affairs, National Center on Homelessness Among Veterans Veteran Homelessness: A Supplemental Report to the 2009 Annual Homeless Assessment Report to Congress.https://www.hudexchange.info/resources/documents/2009AHARveterans Report.pdf. Accessed April 19, 2016.
2. HUD Exchange. Homeless emergency assistance and rapid transition to housing (HEARTH): defining “homeless” final rule. HUD Exchange website. https://www.hudexchange.info/resource/1928 /hearth-defining-homeless-final-rule. Published November 2011. Accessed April 5, 2016.
3. U.S. Department of Health and Human Services, Administration for Community Living (ACL), Administration on Intellectual and Developmental Disabilities. The Developmental Disabilities Assistance and Bill of Rights Act of 2000. http://www.acl.gov/Programs/AIDD/DDA_BOR _ACT_2000/docs/dd_act.pdf. Accessed April 5, 2016. 4. Hwang SW. Mortality among men using homeless shelters in Toronto, Ontario. JAMA. 2000;283(16):2152-2157.
5. O’Connell JJ. Premature Mortality in Homeless Populations: A Review of the Literature. Nashville, TN: National Health Care for the Homeless Council; 2005.
6. Salit SA, Kuhn EM, Hartz AJ, Vu JM, Mosso AL. Hopitalization costs associated with homelessness in New York City. N Engl J Med. 1998;338(24):1734-1740.
7. Kushel MB, Perry S, Bangsberg D, Clark R, Moss AR. Emergency department use among the homeless and marginally housed: results from a community-based study. Am J Public Health. 2002;92(5):778-784.
8. Larimer ME, Malone DK, Garner MD, et al. Healthcare and public service use and costs before and after provision of housing for chronically homeless persons with severe alcohol problems. JAMA. 2009;301(13):1349-1357.
9. McNeil DE, Binder RL, Robinson JC. Incarceration associated with homelessness, mental disorder, and co-occurring substance abuse. Psychiatr Serv. 2005;56(7):840-846.
10. Rosenheck R. Cost-effectiveness of services for mentally ill homeless people: the application of research to policy and practice. Am J Psychiatry. 2000;157(10):1563-1570.
11. Culhane DP, Metraux S, Hadley T. Public service reductions associated with placement of homeless people with severe mental illness in supportive housing. Housing Policy Debate. 2002;13(1):107-163.
12. Martinez TE, Burt MR. Impact of permanent supportive housing on the use of acute care health services by homeless adults. Psychiatr Serv. 2006;57(7):992-999.
13. Culhane DP, Parker WD, Poppe B, et al. Accountability, cost-effectiveness, and program performance: progress since 1998. In: Dennis D, Locke G, Khadduri J, eds. Toward Understanding Homelessness: The 2007 National Symposium on Homelessness Research. Washington, DC: Substance Abuse and Mental Health Services Administration, U.S. Dept of Health and Human Services; Office of Policy Development and Research, U.S. Dept of Housing and Urban Development; 2007.
14. Poulin SR, Maguire M, Metraux S, Culhane DP. Service use and costs for persons experiencing chronic homelessness in Philadelphia: a population-based study. Psychiatr Serv. 2010;61(11):1093-1098.
15. U.S. Department of Veterans Affairs. VA History in Brief. http://www.va.gov/opa/publications/archives /docs/history_in_brief.pdf. U.S. Department of Veteran Affairs website. Published December 27, 2013. Accessed April 19, 2016.
16. Kusmer KL. Down and Out, on the Road: The Homeless in American History. New York, NY: Oxford University Press; 2002.
17. Baumohl J, ed. Homelessness in America. Westport, CT: Oryx Press; 1996.
18. Fargo J, Metraux S, Byrne T, et al. Prevalence and risk of homelessness among U.S. veterans: a multisite investigation. http://www.va.gov/HOMELESS/docs/Center/Prevalence_Final.pdf. Published August 2011. Accessed April 19, 2016.
19. Tsai J, Mares AS, Rosenheck R, Gamache D. Do homeless veterans have the same needs and outcomes as non-veterans? Mil Med. 2012;177(1):27-31.
20. Metraux S, Clegg L, Daigh JD, Culhane DP, Kane V. Risk factors for becoming homeless among a cohort of veterans who served in the era of the Iraq and Afghanistan conflicts. Am J Public Health. 2013;103(suppl 2):S255-S261.
21. Perl L. Veterans and homelessness. Congressional research Service Report RL34024. https://www.fas .org/sgp/crs/misc/RL34024.pdf.Published November 6, 2015. Accessed April 7, 2016.
22. Rossi PH. Down and Out in America: The Origins of Homelessness. Chicago, IL: University of Chicago Press; 1989.
23. Burt M. Over the Edge: The Growth of Homelessness in the 1980s. New York, NY: Russell Sage Foundation; 1992.
24. National Coalition for the Homeless. Homeless Veterans [fact sheet]. http://www .nationalhomeless.org/factsheets/veterans.html. September 2009. Accessed April 19, 2016.
25. Tessler R, Rosenheck R, Gamache F. Comparison of homeless veterans with other homeless men in a large clinical outreach program. Psychiatr Q. 2002;73(2):109-119.
26. Chapman H. Homelessness in Metropolitan Washington: Results and Analysis From the 2015 Point-in-Time Count of Persons Experiencing Homelessness in the Metropolitan Washington Region. Metropolitan Washington Council of Governments website. https://www .mwcog.org/uploads/pub-documents/v15Wlk20150514094353.pdf. Published May 13, 2015. Accessed April 6, 2016.
27. Tsai J, Rosenheck R. Risk factors for homelessness among US veterans. Epidemiol Rev. 2015;37:177-195.
28. Edens EL, Kasprow W, Tsai J, Rosenheck R. Association of substance use and VA service-connected disability benefits with risk of homelessness among veterans. Am J Addict. 2011;20(5):412-419.
29. OrgCode Consulting. Service Prioritization Decision Assistance Tool (SPDAT). http://www.orgcode .com/product/spdat/. Accessed April 19, 2016.
30. Performance.gov. End veteran homelessness: progress update. Performance.gov website. https://www.performance.gov/content/end-veteran-homelessness#progressUpdate. Accessed April 6, 2016.
Mr. G is a 67-year-old veteran. During the Vietnam War, he had the “most dangerous job”: helicopter door gunner and mechanic. He served in multiple combat missions and was under constant threat of attack. On returning to the U.S., he experienced anger outbursts, nightmares, hypervigilance, and urges to engage in dangerous behavior, such as driving a motorcycle more than 100 mph. Then he began abusing alcohol and drugs. Mr. G’s behavior and substance abuse eventually led to strained family relationships, termination from a high-paying job, and homelessness.
In 2001, the Washington DC VAMC homeless and substance abuse staff provided outreach and services that helped him secure permanent subsidized housing, achieve and maintain sobriety, get treatment for posttraumatic stress disorder (PTSD), and get full-time employment. Mr. G has maintained permanent supported housing status for 9 years, regained a sense of purpose, remained drug- and alcohol-free since 2001, attended a Vietnam combat PTSD support group weekly, and been an exemplary employee for 8 years.
In 2009, on any given night in the U.S., more than 75,000 veterans were without a permanent home and living on the streets, as Mr. G had been.1 Nearly 150,000 other veterans were spending the night in an emergency shelter or transitional housing. In early 2010, the U.S. Interagency Council on Homelessness (USICH) developed a strategic plan to align federal resources toward 4 key objectives, which included preventing and ending homelessness among veterans. Since then, the most dramatic reductions in homelessness have occurred among veterans, with an overall 33% decline in chronic homelessness nationwide.
According to the U.S. Department of Housing and Urban Development (HUD), permanent housing is defined as community-based housing without a designated length of stay in which formerly homeless individuals live as independently as possible.2 Under permanent housing, a program participant must be the tenant on a lease for at least 1 year, and the lease is renewable and terminable only for cause. The federal definition of the chronically homeless is a person who is homeless and lives in a place not meant for human habitation, in a safe haven, or in an emergency shelter continuously for at least 1 year; or on at least 4 separate occasions within the past 3 years; and who can be diagnosed with ≥ 1 of the following conditions: substance use disorder, serious mental illness, developmental disability as defined in section 102 of the Developmental Disabilities Assistance Bill of Rights Act of 2000 (42 U.S.C. 15002), PTSD, cognitive impairments caused by brain injury, and chronic physical illness or disability.3
Ending homelessness makes sense from a variety of perspectives. From a moral perspective, no one should experience homelessness, but this is especially true for the men and women who have served in the U.S. military. From a health care and resources perspective, homelessness is associated with poorer medical outcomes; higher medical costs for emergency department visits and hospital admissions; longer stays (often for conditions that could be treated in ambulatory settings); and increased mortality.4-7 From a societal perspective, homelessness is associated with costs for shelters and other forms of temporary housing and with higher justice system costs stemming from police, court, and jail involvement.8 The higher justice system costs are in part attributable to significantly longer incarcerations for homeless persons than for demographically similar inmates who have been similarly charged but have housing.9 According to recent studies, significant cost reductions have been achieved by addressing homelessness and providing permanent housing, particularly for the chronically homeless with mental illness.10-14
This article describes the efforts that have been made, through collaborations and coalitions of government and community partners, to identify and address risk factors for homelessness in Washington, DC—and ultimately to end veteran homelessness in the nation’s capitol.
Historic Perspective on Veteran Homelessness
Although the problem was first described after the Revolutionary War and again after the Civil War, homelessness among U.S. veterans has only recently been academically studied. During the colonial period, men often were promised pensions or land grants in exchange for military service. Several states failed to deliver on these promises, throwing veterans into dire financial circumstances and leaving them homeless. By the end of the Civil War, the size of the veteran population (almost 2 million, counting only those who fought for the Union), combined with an unemployment rate of 40% and economic downturns, led to thousands of veterans becoming homeless.15,16
Homelessness among veterans continued after World War I. In 1932, more than 15,000 homeless and disabled “Bonus Army,” World War I veterans, marched on Washington to demand payment of the financial benefits promised for their military service.
Although World War II and Korean War veterans did not experience homelessness as previous veterans had, the problem resurfaced after Vietnam—the combat veterans of that war were overrepresented among the homeless.17,18 Those at highest risk ranged from age 35 to 44 years in the early years of the all-volunteer military. It has been suggested that their increased risk may reflect social selection—volunteers for military service came from poor economic backgrounds with fewer social supports.19 A more recent study found that 3.8% of more than 300,000 Iraq and Afghanistan veterans who were followed for 5 years after military discharge experienced a homeless episode.20 Female veterans similarly are overrepresented among the homeless.21 Female veterans represent only 1% of the overall female population, yet 3% to 4% are homeless.
Homelessness has always been a social problem, but only during the 1970s and 1980s did homelessness increase in importance—the number of visibly homeless people rose during that period—and investigators began to study and address the issue. Experts have described several factors that contributed to the increase in homelessness during that time.22,23 First, as part of the deinstitutionalization initiative, thousands of mentally ill persons were released from state mental hospitals without a plan in place for affordable or supervised housing. Second, single-room-occupancy dwellings in poor areas, where transient single men lived, were demolished, and affordable housing options decreased. Third, economic and social changes were factors, such as a decreased need for seasonal and unskilled labor; reduced likelihood that relatives will take in homeless family members; and decriminalized public intoxication, loitering, and vagrancy. Out of these conditions came an interest in studying the causes of and risk factors for veteran homelessness and in developing a multipronged approach to end veteran homelessness.
Demographics
Nationally, veterans account for 9% of the homeless population.24 Predominantly, they are single men living in urban areas—only about 9% are women—and 43% served during the Vietnam era.24 Among homeless veterans, minorities are overrepresented—45% are African American or Hispanic, as contrasted with 10% and 3%, respectively, of the general population. More than two-thirds served in the military for more than 3 years, and 76% have a history of mental illness or substance abuse. Compared with the general homeless population, homeless veterans are older, better educated, more likely to have been married, and more likely to have health insurance, primarily through the VA.24,25
The Washington, DC, metropolitan area encompasses the District of Columbia, northern Virginia, the tricounty area of southern Maryland, and Montgomery and Prince George’s counties in Maryland. Demographics for veterans in this area vary somewhat from national figures. According to the 2015 Point-in-Time survey of the homeless, veterans accounted for 5% of the homeless population (less than the national percentage). Most homeless veterans were single men (11.6% were women) and African American (65% of single adults, 85% of adults in families). Forty-five percent reported being employed and 40% had a substance use disorder or a serious mental illness. A large proportion also had at least 1 physical disability, such as hypertension, hepatitis, arthritis, diabetes mellitus, or heart disease.26
Risk Factors
Multiple studies and multivariate analyses have determined that veteran status is associated with an increased risk for homelessness for both male and female veterans.27 Female veterans were 3 times and male veterans 2 times more likely than nonveterans to become homeless, even when poverty, age, race, and geographic variation were controlled. A recent systematic review of U.S. veterans found that the strongest and most consistent risk factors for homelessness were substance use disorders and mental illness, particularly psychotic disorders. Posttraumatic stress disorder was not more significant than other mental conditions but it was a risk factor. Low income, unemployment, and poor money management were also factors.
Social risk factors include lack of support from family and friends. Military service with multiple deployments, transfers, and on-base housing may contribute to interruption of social support and lead to social isolation, thus increasing veterans’ risk for homelessness. Some studies have found that veterans are more likely to report physical injury or medical problems as contributing to homelessness and more likely to have 2 or more chronic medical conditions. Last, history of incarceration and adverse childhood experiences (eg, behavioral problems, family instability, foster care, childhood abuse) also have been found to be risk factors for homelessness among veterans and nonveterans alike.
Understanding these risk factors is an important step in addressing homelessness. Homelessness prevention efforts can screen for these risk factors and then intervene as quickly as possible. Access to mental health and substance abuse services, employment assistance, disability benefits and other income supports, and social services may prevent initial and subsequent episodes of homelessness. The VA, as the largest integrated health system in the U.S., is a critical safety net for low-income and disabled veterans with complex psychosocial needs. One study found access to VA service-connected pensions was protective against homelessness.28
Addressing Homelessness
There are 10 USICH-recommended strategies for ending veteran homelessness (Table 1). These strategies cannot be achieved by any single federal agency or exclusively by government agencies—they require multipronged approaches and private and public partnerships. In early 2011, the staff of the Washington DC VAMC homeless program identified a single point of contact who would regularly meet with each Continuum of Care local planning body and each Public Housing Authority (PHA). This contact could identify homeless veterans regardless of the agency from which they were requesting assistance. The contact also facilitated identification of specific bottleneck issues contributing to delays in housing veterans. One such issue was that veterans were filling out application forms by themselves, and in some cases, their information was incomplete, or supporting documents (eg, government-issued IDs) were missing. The VA team adjusted the procedures to better meet veterans’ needs. Now veterans identified as meeting requirements for housing assistance are enrolled in classes in which a caseworker reviews their completed applications to ensure they are complete and supporting documents included. If an ID is needed, the caseworker facilitates the process and then submits the veteran’s application to the local PHA for processing. The result has been no returned applications.
Another issue was that in some cases a veteran spoke with the PHA and indicated interest in an apartment and only later found out that the apartment failed inspection. There would then be back-and-forth communications between PHA and landlord to have repairs made so the unit could pass inspection, which often resulted in long delays. The solution was to have a stock of preinspected housing options. The Washington DC VAMC homeless program now has a housing specialist who identifies preinspected units and can expedite the lease to a veteran. In addition, the homeless program in partnership with the PHA now sets up regular meet-and-greet events for landlords and veterans so veterans can preview available rentals.
Housing-First Model
The homeless program readily adopted the housing-first model. This model focuses on helping individuals and families access housing as quickly as possible and remain permanently housed; this assistance is not time-limited but ongoing. After housing placement, the client can choose from an array of both time-limited and long-term services, which are individualized to promote housing stability and individual well-being. Most important, housing is not contingent on compliance with services. Instead, participants must comply with a standard lease agreement and are provided the services and support that can help them do so successfully. Services are determined by completing needs assessments. In addition, as a veteran is applying for housing, a caseworker actively uses motivational interviewing techniques to enhance the likelihood that the veteran will accept services.
Providing Core Service to Veterans
In 2012, the Washington DC VAMC opened the Community Resource and Referral Center (CRRC) as a one-stop shop for homeless and at-risk veterans in need of basic, core, wraparound services through the VA. Basic services include showers, laundry facilities, and a chapel. The CRRC has onsite psychiatric services that can engage veterans in mental health and substance abuse treatment. There is also an onsite primary care team who specialize in working with the homeless and can address any acute or chronic medical problems. For veterans who want to return to employment, there is an onsite Compensated Work Therapy program, which has uniquely partnered with the VAMC as well as community partners (eg, National Archives, Smithsonian Institution, Quantico National Cemetery, Arlington National Cemetery) to offer therapeutic job experiences that often lead to gainful full-time employment.
Veterans can use an onsite computer lab to complete resumes and apply for employment online, with the assistance of veteran peer specialists and vocational rehabilitation specialists. For veterans who are unable to work, the homeless program team assists with disability applications. Social Security, Veterans Benefits Administration representatives, and Legal Aid have office hours at the CRRC to provide one-stop shopping for veterans. Additional community partnerships have led to classes to help veterans manage income effectively, and veterans are assisted with completing tax returns.
Representatives from the Veterans Justice Outreach (VJO) and Health Care for Re-entry Veterans (HCRV) programs are also onsite. The VJO program provides outreach, assessment, and case management for justice-involved veterans to prevent unnecessary criminalization of mental illness and extended incarceration. A VJO program specialist works with courts, legal representatives, and jails and acts as a liaison to engage veterans in treatment and prevent incarcerations through jail diversion strategies. The HCRV program assists incarcerated veterans with reentry into the community through outreach and prerelease assessments, and referrals and links to medical, psychiatric, and social services, including employment services on release. This program also can provide short-term case management assistance on release.
In 2013, to further the implementation of the USICH strategies in the Washington, DC, metropolitan area, 12 local government and nonprofit agencies entered into the Veterans NOW coalition (Table 2). This collaboration enabled development of a coordinated effort to identify all area veterans experiencing homelessness, regardless of which agency the veterans contacted. Further, this team set up processes to assess veterans’ housing and service needs and to match each veteran to the most appropriate housing resource. There was consensus regarding use of the Service Prioritization Decision Assistance Tool (SPDAT) as the evidence-informed approach for prioritizing client needs and identifying areas in which support is most likely needed to prevent housing instability.29 More than 50 staff members at 20 different agencies in the District of Columbia have now been trained and are using this tool.
Outcomes
In 2010, the Point-in-Time count identified 718 homeless veterans in the Washington, DC, metropolitan area. By 2016, that number had dropped to 326 (55% reduction). During this same period, the number of veterans served by the Washington DC VAMC homeless program more than tripled, from 2,100 individuals in 2010 to nearly 6,400 in 2015. The coalition has housed or prevented homelessness for nearly 1,300 veterans during the past 2 years alone. Veterans were housed through multiple programs and efforts, including VA Supportive Housing (VASH), Supportive Services for Veteran Families, and Washington, DC Department of Human Services Permanent Supportive Housing. During the past year, > 60% of veterans were successfully placed in VASH housing within 90 days of application submission. Table 3 lists the national targets for assessing performance measurement and success. Not only were the various performance measure benchmarks exceeded, but more important, > 90% of veterans in VASH and Health Care for Homeless Veterans were able to keep their housing stabilized. Using SPDAT, the most chronically homeless and vulnerable were housed first, which accounts for the lower numbers of homeless Washington, DC, area veterans with substance abuse and mental health problems identified in the Point-in-Time survey.
Discussion
At the Washington DC VAMC, HCHV program staff members used evidence-based and evidence-informed tools, collaborated with community partners, and implemented recommended best practices to end veteran homelessness by 2015. Permanent supportive housing through VASH is crucial for helping veterans overcome their lack of income and in providing mechanisms for engaging in mental health and substance abuse services as well as primary care and therapeutic employment opportunities.
When former VA Secretary Eric K. Shinseki first announced the goal of ending veteran homelessness by 2015, many people questioned this goal’s attainability and feasibility. However, through the adoption of the strategies recommended by USICH, the establishment of government and community partnerships (including faith-based groups) and the implementation of programs addressing substance abuse issues, mental and physical health, income limitations, and employment, this goal now seems possible. Overall veteran homelessness decreased by 36% since 2010, and unsheltered homelessness decreased by nearly 50%.30 By the end of 2015, nearly 65,000 veterans are in permanent housing nationwide, and another 8,100 are in the process of obtaining permanent supportive housing. Also, 87% of unsheltered veterans were able to move to safe housing within 30 days of engagement. Last, Supportive Services for Veteran Families was able to assist more than 156,800 individuals (single veterans as well as their children and families).
Sustainability from a national perspective also depends on continued federal funding. Mr. G, described at the beginning of this article, served his country honorably but then experienced the factors that put him at risk for homelessness. Through a veteran-centric team approach, he was able to successfully address each of these factors. As there are another 500 homeless veterans in Washington, DC, much work still needs to be done. With important collaborations and partnerships now in place, the goal of ending veteran homelessness in the District of Columbia is within sight. When homelessness is a thing of the past, we will truly be able to Welcome Home each veteran.
1. U.S. Department of Housing and Urban Development, Office of Community Planning and Development; U.S. Department of Veterans Affairs, National Center on Homelessness Among Veterans Veteran Homelessness: A Supplemental Report to the 2009 Annual Homeless Assessment Report to Congress.https://www.hudexchange.info/resources/documents/2009AHARveterans Report.pdf. Accessed April 19, 2016.
2. HUD Exchange. Homeless emergency assistance and rapid transition to housing (HEARTH): defining “homeless” final rule. HUD Exchange website. https://www.hudexchange.info/resource/1928 /hearth-defining-homeless-final-rule. Published November 2011. Accessed April 5, 2016.
3. U.S. Department of Health and Human Services, Administration for Community Living (ACL), Administration on Intellectual and Developmental Disabilities. The Developmental Disabilities Assistance and Bill of Rights Act of 2000. http://www.acl.gov/Programs/AIDD/DDA_BOR _ACT_2000/docs/dd_act.pdf. Accessed April 5, 2016. 4. Hwang SW. Mortality among men using homeless shelters in Toronto, Ontario. JAMA. 2000;283(16):2152-2157.
5. O’Connell JJ. Premature Mortality in Homeless Populations: A Review of the Literature. Nashville, TN: National Health Care for the Homeless Council; 2005.
6. Salit SA, Kuhn EM, Hartz AJ, Vu JM, Mosso AL. Hopitalization costs associated with homelessness in New York City. N Engl J Med. 1998;338(24):1734-1740.
7. Kushel MB, Perry S, Bangsberg D, Clark R, Moss AR. Emergency department use among the homeless and marginally housed: results from a community-based study. Am J Public Health. 2002;92(5):778-784.
8. Larimer ME, Malone DK, Garner MD, et al. Healthcare and public service use and costs before and after provision of housing for chronically homeless persons with severe alcohol problems. JAMA. 2009;301(13):1349-1357.
9. McNeil DE, Binder RL, Robinson JC. Incarceration associated with homelessness, mental disorder, and co-occurring substance abuse. Psychiatr Serv. 2005;56(7):840-846.
10. Rosenheck R. Cost-effectiveness of services for mentally ill homeless people: the application of research to policy and practice. Am J Psychiatry. 2000;157(10):1563-1570.
11. Culhane DP, Metraux S, Hadley T. Public service reductions associated with placement of homeless people with severe mental illness in supportive housing. Housing Policy Debate. 2002;13(1):107-163.
12. Martinez TE, Burt MR. Impact of permanent supportive housing on the use of acute care health services by homeless adults. Psychiatr Serv. 2006;57(7):992-999.
13. Culhane DP, Parker WD, Poppe B, et al. Accountability, cost-effectiveness, and program performance: progress since 1998. In: Dennis D, Locke G, Khadduri J, eds. Toward Understanding Homelessness: The 2007 National Symposium on Homelessness Research. Washington, DC: Substance Abuse and Mental Health Services Administration, U.S. Dept of Health and Human Services; Office of Policy Development and Research, U.S. Dept of Housing and Urban Development; 2007.
14. Poulin SR, Maguire M, Metraux S, Culhane DP. Service use and costs for persons experiencing chronic homelessness in Philadelphia: a population-based study. Psychiatr Serv. 2010;61(11):1093-1098.
15. U.S. Department of Veterans Affairs. VA History in Brief. http://www.va.gov/opa/publications/archives /docs/history_in_brief.pdf. U.S. Department of Veteran Affairs website. Published December 27, 2013. Accessed April 19, 2016.
16. Kusmer KL. Down and Out, on the Road: The Homeless in American History. New York, NY: Oxford University Press; 2002.
17. Baumohl J, ed. Homelessness in America. Westport, CT: Oryx Press; 1996.
18. Fargo J, Metraux S, Byrne T, et al. Prevalence and risk of homelessness among U.S. veterans: a multisite investigation. http://www.va.gov/HOMELESS/docs/Center/Prevalence_Final.pdf. Published August 2011. Accessed April 19, 2016.
19. Tsai J, Mares AS, Rosenheck R, Gamache D. Do homeless veterans have the same needs and outcomes as non-veterans? Mil Med. 2012;177(1):27-31.
20. Metraux S, Clegg L, Daigh JD, Culhane DP, Kane V. Risk factors for becoming homeless among a cohort of veterans who served in the era of the Iraq and Afghanistan conflicts. Am J Public Health. 2013;103(suppl 2):S255-S261.
21. Perl L. Veterans and homelessness. Congressional research Service Report RL34024. https://www.fas .org/sgp/crs/misc/RL34024.pdf.Published November 6, 2015. Accessed April 7, 2016.
22. Rossi PH. Down and Out in America: The Origins of Homelessness. Chicago, IL: University of Chicago Press; 1989.
23. Burt M. Over the Edge: The Growth of Homelessness in the 1980s. New York, NY: Russell Sage Foundation; 1992.
24. National Coalition for the Homeless. Homeless Veterans [fact sheet]. http://www .nationalhomeless.org/factsheets/veterans.html. September 2009. Accessed April 19, 2016.
25. Tessler R, Rosenheck R, Gamache F. Comparison of homeless veterans with other homeless men in a large clinical outreach program. Psychiatr Q. 2002;73(2):109-119.
26. Chapman H. Homelessness in Metropolitan Washington: Results and Analysis From the 2015 Point-in-Time Count of Persons Experiencing Homelessness in the Metropolitan Washington Region. Metropolitan Washington Council of Governments website. https://www .mwcog.org/uploads/pub-documents/v15Wlk20150514094353.pdf. Published May 13, 2015. Accessed April 6, 2016.
27. Tsai J, Rosenheck R. Risk factors for homelessness among US veterans. Epidemiol Rev. 2015;37:177-195.
28. Edens EL, Kasprow W, Tsai J, Rosenheck R. Association of substance use and VA service-connected disability benefits with risk of homelessness among veterans. Am J Addict. 2011;20(5):412-419.
29. OrgCode Consulting. Service Prioritization Decision Assistance Tool (SPDAT). http://www.orgcode .com/product/spdat/. Accessed April 19, 2016.
30. Performance.gov. End veteran homelessness: progress update. Performance.gov website. https://www.performance.gov/content/end-veteran-homelessness#progressUpdate. Accessed April 6, 2016.
Veterans’ Satisfaction With Erectile Dysfunction Treatment
A majority of men (70%) aged ≥ 70 years report erectile dysfunction (ED) in primary care settings.1 Further, the cost of ED medication is increasing: nationally, the VA spent $71.7 million on ED medications in 2013, triple the amount from 2006,2 despite a 2011 VA mandate limiting ED medication prescriptions to 4 doses per month per veteran.3 Unfortunately, although ED is common and costly, only about 12% of men in the community report being asked about their sexual health by their primary care provider (PCP) in the past 3 years.4 Further, little emphasis seems to be placed on preventive care. For example, men with ED in primary care clinics are unaware of ED risk factors such as hypertension, smoking, and obesity; indeed, only 17% of a large community sample could name 1 risk factor for ED.5 This is problematic because diet and exercise improve erectile functioning,yet men may not realize they can reduce ED through behavioral and lifestyle change.6
In addition, there is little research that investigates veterans’ satisfaction with ED treatment and its effectiveness. The taboo nature of talking about erections and sexual health may partially relate to the lack of research. When surveyed, PCPs noted that they do not talk about ED routinely with patients for reasons that include time constraints, lack of experience managing sexual problems, viewing ED medication as a lifestyle drug, perceiving ED as a nonserious concern, discomfort discussing the topic for both male and female PCPs, and viewing ED discussions as the responsibility of providers of the opposite gender.7-9
Given the dearth of ED research within the veteran population, the purpose of the current study was to (1) explore the level of treatment satisfaction of veterans prescribed an ED medication, phosphodiesterase type 5 inhibitor (PDE5); (2) assess patients’ perception of discussions with their PCPs about sexual health concerns; and (3) provide preliminary data on veterans’ knowledge of ED risk factors and identify possible areas for preventive education. This study was intended to highlight areas for further investigation to improve ED treatment satisfaction among veterans.
Methods
The authors conducted an anonymous survey with veterans who were prescribed an ED medication within the previous 12 months. In 2012, researchers obtained 8,000 names of veterans prescribed a PDE5 medication at the Clement J. Zablocki VA Medical Center (CJZVAMC) in Milwaukee, Wisconsin, and randomly selected 1,000 persons to mail a research survey to be returned anonymously. Three hundred ten surveys were returned, a 31% response rate, which was similar (32%) to a comparable large ED survey study, in which the participants were randomly selected to participate and also were not recruited by their PCP.10 Because 13 participants were excluded due to incomplete surveys or obtaining primary medical care services outside the VA, the current sample consisted of 297 participants. The CJZVAMC institutional review board approved the study in March 2013, and de-identified data were collected from March 2013 to March 2014.
The authors assessed demographics and treatment information, including whether veterans had talked with their PCP about sexual concerns.
Of the 297 participants, 55% were aged > 65 years. Racial/ethnic groups reflected the veteran population at CJZVAMC, with 78% identifying as European American, 17% as African American, 2% as Hispanic American, 2% as biracial, and 1% as Asian American or American Indian. Eighty-one percent were identified as Christian, and 10% reported no religious preference. Sixty-seven percent reported having a current sexual partner.
Measures
The International Index of Erectile Function (IIEF-5), an abridged version of a longer, 15-item instrument, was administered to assess participants’ erectile function.11,12 The IIEF-5 consists of 5 items that ask about participants’ erectile functioning over the past 6 months. Participants responded to items on a 1 to 5 scale ranging from “almost never/never” to “almost always/always”. Items were summed to create a total score that could range from 5 to 25. Total scores reflect erectile functioning and satisfaction, with low scores indicating greater dysfunction. This measure has shown high sensitivity (.98) and specificity (.88).11 Cut scores for the current study were consistent with the literature: mild ED = 17-21; mild-to-moderate ED = 12-16; moderate ED = 8-11; and severe ED = 5-7.13 Reliability in this sample was α = .93.
The authors were unable to find a validated measure assessing men’s knowledge of ED risk factors in the literature. Therefore, participants’ knowledge of ED risk factors was assessed using an online nonvalidated questionnaire entitled “Impotence [Erectile Dysfunction] Quiz: Test Your Medical IQ of ED” from www.emedicinehelp.com.13 Questions assess knowledge of specific risk factors (eg, age, obesity, depression, prostate cancer), symptoms, incidence rate, treatments, normal erectile functioning, and implications of ED. The questionnaire contains 16 items (3 true/false and 13 multiple choice items), and the total score corresponds to the percentage correct. According to the online version, the average score is 11 items correct (69%).13
A single item asked participants to identify behavioral changes they had tried to improve their erectile functioning. Options included taking medications at a different time, and/or decreasing tobacco, caffeine, or alcohol consumption. The Erectile Dysfunction Inventory of Treatment Satisfaction – Patient Version (EDITS) is an 11-item questionnaire administered to assess participants’ satisfaction with their medical treatment of ED.14 Items assess treatment satisfaction, ease of use, confidence in ability to perform, partner satisfaction, and naturalness of erections achieved during treatment. These items are rated on a scale ranging from 0 (dissatisfaction) to 4 (high satisfaction) and then summed, with total scores ranging from 0 (extremely dissatisfied) to 100 (extremely satisfied). The measure displayed high internal consistency (α = .90) and high test-retest reliability (r = .98).14 Several studies have used cutoff scores of 0 = very dissatisfied; 25 = dissatisfied; 50 = neither satisfied nor dissatisfied; 75 = satisfied; and 100 = very satisfied.15,16 These cut scores and classifiers were used in the current study; reliability was α = .92.
The authors further explored reasons for veteran dissatisfaction with ED treatment by asking participants to respond to a single item: “Why are you dissatisfied with your erectile dysfunction treatment?” They could indicate that they were satisfied or circle all options for dissatisfaction that applied (“I would like to receive more pills per month,” “The treatment does not work well,” or “I want more information about erectile dysfunction and treatment”), or write in a response. The authors inquired about the number of pills prescribed to ascertain whether dissatisfaction was due to VA-specific policies vs veterans’ understanding of ED and effectiveness of treatment, which providers have more ability to improve.
In addition to the quantitative data obtained from the completed surveys, unsolicited responses from participants to the principal investigator via phone calls, and letters regarding treatment satisfaction were gathered. The second author conducted a basic exploratory content analysis of these unsolicited responses to group them into themes related to this study, such as satisfaction or dissatisfaction with ED treatment.
Results
The authors first assessed levels of ED and satisfaction with treatment in the sample. On average, participants reported mild-to-moderate erectile dysfunction (M = 13.1; SD = 5.7), which is higher than that of the general population and consistent with samples of men referred for ED treatment.17,18 Satisfaction levels were slightly above neutral on the EDITS questionnaire (M = 58.3%; SD = 24.5). In response to a separate single-item question regarding reasons for dissatisfaction, only 6.4% of veterans reported being satisfied with their ED treatment.
According to respondents, the primary reasons for dissatisfaction were wanting more medication (46%), finding the treatment ineffective (26.7%), and desiring more information (24%). Further, ED severity was negatively correlated with satisfaction with ED treatment (r = .72, P < .01; note that higher scores correspond to less severe ED on this measure). However, despite moderate-to-low levels of satisfaction, 79.2% of patients planned to continue with their ED treatment (59.3% very likely and 19.9% moderately likely).
The authors also assessed participants’ communication with PCPs about their sexual functioning. Twenty-five percent reported not talking with their PCP about sexual concerns (despite all having been prescribed an ED medication in the past year). In this sample, talking with one’s PCP was not related to increased knowledge of ED risk factors (t [294] = .32, ns). Those who talked to their PCP tended to be less satisfied with treatment (M = 56.2; SD = 24.5) than those who did not talk to their PCP (M = 64.7; SD = 23.3; t (213) = -2.2; P = .03), likely because those who felt their treatment was working for them felt less need to talk to their provider. Indeed, those who talked to their PCP trended to have more severe levels of ED (M = 12.7; SD = 5.8) than those who did not (M = 14.2; SD = 5.3; t [285] = -1.91; P = .057; note that higher scores correspond to less severe ED on this measure). Finally, adults aged > 65 years were less likely to talk to their PCP than were younger adults (69% vs 81%); χ2 (1, N = 291) = 5.57; P = .018.
Generally, the level of knowledge of ED risk factors was lower than the average of respondents to the original online survey (62% vs 69%).13 Younger adults were slightly more knowledgeable (M = 64%; SD = 13) than were older adults (M = 60%; SD = 15), t (288.08) = 2.01; P = .046).
Finally, most veterans reported few attempted behavioral changes to address ED, such as taking medications at a different time or decreasing use of tobacco, caffeine, or alcohol (M = 1.3; SD = 1.1). Thirty percent had not tried any behavioral changes; 34.1% tried 1 change; and 35.9% had tried more than 1 behavioral change. In contrast, 89% of participants reported using a PDE5 medication. Eight-two percent of participants reported currently receiving ED treatment of some kind; within this group, 97.4% reported currently taking a PDE5 medication. Only 2.5% of veterans reported using other kinds of treatment, such as vacuum pump, suppository, over-the-counter medication, injections, and not using a PDE5 medication, whereas 6.7% were using other kinds of treatment as well as a PDE5 medication.
In addition to the quantitative responses, 48 participants wrote unsolicited comments about their experiences with ED treatment on their returned questionnaires. The principal investigator also received 9 telephone calls from intended study participants, who provided verbal feedback regarding their experience with ED treatment. Comments unrelated to the study were eliminated, and the remaining written and verbal responses were grouped into categories to identify themes. Mirroring the quantitative results, participants providing qualitative feedback were dissatisfied with their ED treatment. Specifically, 43% of the comments consisted of complaints regarding the ineffectiveness and/or undesirable adverse effects (AEs) of ED medications and other ED treatments, including physical AEs (eg, headaches), sentiments that treatment does not feel “natural,” and dissatisfaction with the quality and length of sexual encounters despite treatment. Yet 24% of the comments entailed requests for more and/or different ED medications. Less frequent, although significant, comments related to decreased sexual interest and performance because of other medical conditions, such as pain, prostate surgery, and hypertension (15%); desire for additional information about ED treatments from health care providers (9%); use of nonpharmacologic ED interventions (eg, vacuum pump, 7%); and concerns about their partners’ level of sexual dissatisfaction as a result of their ED (7%).
Discussion
The present study examined knowledge of ED risk factors and level of satisfaction with ED treatment in a veteran population. Pharmacologic interventions comprised the most prevalent form of ED treatment. Both quantitative and qualitative results indicated areas for improvement in veteran satisfaction with ED treatment. Overall, veterans reported being neither satisfied nor dissatisfied with their current ED treatment, although very few reported being satisfied in response to a single item. The discrepancy may be related to the negative wording of the latter question (“Why are you dissatisfied with your erectile dysfunction treatment?”), which potentially biased participants’ responses. Several veterans also provided many unsolicited comments regarding areas for improvement. Despite feeling neutral to dissatisfied with treatment, 80% planned to continue with treatment. Sources of dissatisfaction included restricted access to ED medication (eg, limiting pills to 4 per month), ineffectiveness of treatment (eg, poor quality of erection, lack of climax), physical AEs, a desire for more information about ED, and psychological and relational concerns (eg, partner sexual dissatisfaction). As one veteran in his 80s lamented in describing the apparent end to his sexual life despite current ED treatment, “Is that all there is? It is the end of the road.”
The authors identified several barriers to implementing potentially beneficial interventions other than ED medications. Specifically, despite receiving long-term treatment for ED, veteran participants showed average knowledge of information related to ED risk factors. Of concern, discussing sexual health concerns with a PCP was not associated with increased knowledge of ED risk factors. This may explain the finding that veterans plan to continue with medication treatment despite feeling only neutral to dissatisfied about their current ED treatment.
Veterans who talked to their PCP about ED were less satisfied with treatment than were those who did not talk to their PCP, likely because those who felt their treatment was working for them felt less need to talk to their provider. Indeed, those who talked to their PCP tended to have more severe ED than those who did not. It may be that veterans avoid discussing ED with their PCP until they reach advanced ED when it is too late for treatment to make a difference. The principal investigator’s receipt of unsolicited telephone calls from intended study participants desiring to discuss ED—something that has not occurred during the researchers’ involvement in dozens of prior health-related studies—illustrates the importance veterans place on sexual concerns and the need to encourage discussion about the topic in the context of health care appointments. Specifically, older adults would benefit from more conversations with PCPs as they reported less knowledge of ED risk factors and fewer conversations with PCPs about sexual concerns than did younger men.
Adverse Events
Given the AEs reported by veterans and the significant cost of ED medications within the VA system,2 increased use of alternative nonpharmacologic and preventive behavioral approaches would be clinically and economically beneficial. For example, in one study, men with ED who engaged in a lifestyle program that focused on weight loss, diet, and exercise were found more likely to experience improvements in erectile functioning compared with men who did not participate.6 Yet in the current study, 30% of participants had not attempted behavioral changes to address ED.
The VA’s Health Promotion and Disease Prevention (HPDP) Program focuses on preventive services and behavioral interventions to reduce health risks within primary care settings.19 This program may provide a framework for efforts to prevent and ameliorate ED. Specifically, coaching and education by HPDP experts could reduce PCPs’ discomfort with sexual health discussions and normalize the value of such conversations for both providers and patients. Existing HPDP behavioral interventions targeting areas such as weight loss and smoking cessation also could emphasize the potential secondary benefit of improved sexual functioning. To that end, preventive health campaigns could include sexual health and ED prevention as topics on patient education materials. Including sexual functioning on telephone or in-person prescreening questionnaires prior to routine appointments with PCPs also may facilitate destigmatization of sex as an important health topic.
Limitations
Limitations of the current study include its correlational design, which precludes conclusions regarding casual relationships among the variables in question. The authors cannot speculate about how well their sample represents the general veteran population given its low response rate (although comparable to a similar study).10 In addition, the lack of a validated measure of ED risk-factor knowledge meant reliance on an online questionnaire with unknown psychometric properties. To identify alternatives to pharmacologic treatment for ED, it would be beneficial for future research to examine the reasons for dissatisfaction among veterans, assessing satisfaction changes after implementation of behavioral and/or preventive interventions.
Conclusion
This study deepens the understanding of ED treatment efficacy among veterans in light of the paucity of available information. Overall, veterans are neutral to dissatisfied with their ED treatment, yet plan to continue it in the context of limited alternatives and possible lack of knowledge of behavioral methods shown to improve erectile functioning. Future studies that examine the reasons for continuing medication despite neutral satisfaction would help explore this finding. Based on these results, the authors recommend increased attention and discussion of sexual health during PCP visits and enhanced efforts toward using behavioral strategies to prevent and reduce ED. Encouragement from PCPs to address sexual health concerns earlier in a veteran’s treatment course—and in the context of behavioral and lifestyle change—may assist in preventing veterans’ sexual lives from prematurely reaching “the end of the road.”
Acknowledgments
This material is the result of work supported with resources and the use of facilities at the Clement J. Zablocki VA Medical Center in Milwaukee, Wisconsin.
1. Grover SA, Lowensteyn I, Kaouache M, et al. The prevalence of erectile dysfunction in the primary care setting: importance of risk factors for diabetes and vascular disease. Arch Intern Med. 2006;166(2):213-219.
2. Miller K. In the war on impotence, the VA deploys Viagra and Cialis. Bloomberg Business Week. January 17, 2013. http://www.businessweek.com/articles/2013-01-17/in-the-war-on-impotence-the-va-deploys-viagra-and-cialis. Accessed April 7, 2016.
3. Phosphodiesterase Type 5 Inhibitors for the Treatment of BPH/LUTS and Penile Rehabilitation: Evidence Summary and Recommendations - December 2014. U.S. Department of Veterans Affairs website. http://www.pbm.va.gov/clinicalguidance/clinicalrecommendations/PDE5I_BPH_LUTS_Evidence_Summary_and_Recommendations.pdf. Accessed April 29, 2016.
4. Laumann EO, Glasser DB, Neves RC, Moreira ED Jr; GSSAB Investigators’ Group. A population-based survey of sexual activity, sexual problems and associated help-seeking behavior patterns in mature adults in the United States of America. Int J Impot Res. 2009;21(3):171-178.
5. Baumgartner MK, Hermanns T, Cohen A, et al. Patients’ knowledge about risk factors for erectile dysfunction is poor. J Sex Med. 2008;5(10):2399-2404.
6. Esposito K, Ciotola M, Giugliano F, et al. Effects of intensive lifestyle changes on erectile dysfunction in men. J Sex Med. 2009;6(1):243-250.
7. Macdowall W, Parker R, Nanchahal K, et al. ‘Talking of Sex’: developing and piloting a sexual health communication tool for use in primary care. Patient Educ Couns. 2010;81(3):332-337.
8. Ng CJ, Low WY, Tan NC, Choo WY. The role of general practitioners in the management of erectile dysfunction-a qualitative study. Int J Impot Res. 2004;16(1):60-63.
9. Tsimtsiou Z, Hatzimouratidis K, Nakopoulou E, Kyrana E, Salpigidis G, Hatzichristou D. Predictors of physicians’ involvement in addressing sexual health issues. J Sex Med. 2006;3(4):583-588.
10. Moreira ED Jr., Kim SC, Glasser D, Gingell C. Sexual activity, prevalence of sexual problems, and associated help-seeking patterns in men and women aged 40-80 years in Korea: data from the Global Study of Sexual Attitudes and Behaviors (GSSAB). J Sex Med. 2006;3(2):201-211.
11. Rosen RC, Cappelleri JC, Smith MD, Lipsky J, Peña BM. Development and evaluation of an abridged, 5-item version of the International Index of Erectile Function (IIEF-5) as a diagnostic tool for erectile dysfunction. Int J Impot Res. 1999;11(6):319-326.
12. Rosen RC, Riley A, Wagner G, Osterloh IH, Kirkpatrick J, Mishra A. The international index of erectile function (IIEF): a multidimensional scale for assessment of erectile dysfunction. Urology. 1997;49(6):822-830.
13. Impotence [Erectile Dysfunction] Quiz: Test Your Medical IQ of ED. MedicineNet website. http://www.medicinenet.com/impotence_erectile_dysfunction_quiz/quiz.htm. Accessed April 20, 2016.
14. Ponholzer A, Temml C, Mock K, Marszalek M, Obermayr R, Madersbacher S. Prevalence and risk factors for erectile dysfunction in 2869 men using a validated questionnaire. Eur Urol. 2005;47(1):80-86.
15. Althof SE, Corty EW, Levine SB, et al. EDITS: development of questionnaires for evaluating satisfaction with treatments for erectile dysfunction. Urology. 1999;53(4):793-799.
16. Lewis R, Bennett CJ, Borkon WD, et al. Patient and partner satisfaction with Viagra (sildenafil citrate) treatment as determined by the Erectile Dysfunction Inventory of Treatment Satisfaction Questionnaire. Urology. 2001;57(5):960-965.
17. Raina R, Lakin MM, Agarwal A, et al. Long-term effect of sildenafil citrate on erectile dysfunction after radical prostatectomy: 3-year follow-up. Urology. 2003;62(1):110-115.
18. Safarinejad MR, Kolahi AA, Ghaedi G. Safety and efficacy of sildenafil citrate in treating erectile dysfunction in patients with combat-related post-traumatic stress disorder: a double-blind, randomized and placebo-controlled study. BJU Int. 2009; 104(3):376-383.
19. U.S. Department of Veterans Affairs, Veterans Health Administration. VHA Handbook 1120.02: Health promotion and disease prevention core program requirements. U.S. Department of Veterans Affairs website. http://www.va.gov/vhapublications/ViewPublication.asp?pub_ID=2763. Published July 5, 2012. Accessed April 7, 2016.
A majority of men (70%) aged ≥ 70 years report erectile dysfunction (ED) in primary care settings.1 Further, the cost of ED medication is increasing: nationally, the VA spent $71.7 million on ED medications in 2013, triple the amount from 2006,2 despite a 2011 VA mandate limiting ED medication prescriptions to 4 doses per month per veteran.3 Unfortunately, although ED is common and costly, only about 12% of men in the community report being asked about their sexual health by their primary care provider (PCP) in the past 3 years.4 Further, little emphasis seems to be placed on preventive care. For example, men with ED in primary care clinics are unaware of ED risk factors such as hypertension, smoking, and obesity; indeed, only 17% of a large community sample could name 1 risk factor for ED.5 This is problematic because diet and exercise improve erectile functioning,yet men may not realize they can reduce ED through behavioral and lifestyle change.6
In addition, there is little research that investigates veterans’ satisfaction with ED treatment and its effectiveness. The taboo nature of talking about erections and sexual health may partially relate to the lack of research. When surveyed, PCPs noted that they do not talk about ED routinely with patients for reasons that include time constraints, lack of experience managing sexual problems, viewing ED medication as a lifestyle drug, perceiving ED as a nonserious concern, discomfort discussing the topic for both male and female PCPs, and viewing ED discussions as the responsibility of providers of the opposite gender.7-9
Given the dearth of ED research within the veteran population, the purpose of the current study was to (1) explore the level of treatment satisfaction of veterans prescribed an ED medication, phosphodiesterase type 5 inhibitor (PDE5); (2) assess patients’ perception of discussions with their PCPs about sexual health concerns; and (3) provide preliminary data on veterans’ knowledge of ED risk factors and identify possible areas for preventive education. This study was intended to highlight areas for further investigation to improve ED treatment satisfaction among veterans.
Methods
The authors conducted an anonymous survey with veterans who were prescribed an ED medication within the previous 12 months. In 2012, researchers obtained 8,000 names of veterans prescribed a PDE5 medication at the Clement J. Zablocki VA Medical Center (CJZVAMC) in Milwaukee, Wisconsin, and randomly selected 1,000 persons to mail a research survey to be returned anonymously. Three hundred ten surveys were returned, a 31% response rate, which was similar (32%) to a comparable large ED survey study, in which the participants were randomly selected to participate and also were not recruited by their PCP.10 Because 13 participants were excluded due to incomplete surveys or obtaining primary medical care services outside the VA, the current sample consisted of 297 participants. The CJZVAMC institutional review board approved the study in March 2013, and de-identified data were collected from March 2013 to March 2014.
The authors assessed demographics and treatment information, including whether veterans had talked with their PCP about sexual concerns.
Of the 297 participants, 55% were aged > 65 years. Racial/ethnic groups reflected the veteran population at CJZVAMC, with 78% identifying as European American, 17% as African American, 2% as Hispanic American, 2% as biracial, and 1% as Asian American or American Indian. Eighty-one percent were identified as Christian, and 10% reported no religious preference. Sixty-seven percent reported having a current sexual partner.
Measures
The International Index of Erectile Function (IIEF-5), an abridged version of a longer, 15-item instrument, was administered to assess participants’ erectile function.11,12 The IIEF-5 consists of 5 items that ask about participants’ erectile functioning over the past 6 months. Participants responded to items on a 1 to 5 scale ranging from “almost never/never” to “almost always/always”. Items were summed to create a total score that could range from 5 to 25. Total scores reflect erectile functioning and satisfaction, with low scores indicating greater dysfunction. This measure has shown high sensitivity (.98) and specificity (.88).11 Cut scores for the current study were consistent with the literature: mild ED = 17-21; mild-to-moderate ED = 12-16; moderate ED = 8-11; and severe ED = 5-7.13 Reliability in this sample was α = .93.
The authors were unable to find a validated measure assessing men’s knowledge of ED risk factors in the literature. Therefore, participants’ knowledge of ED risk factors was assessed using an online nonvalidated questionnaire entitled “Impotence [Erectile Dysfunction] Quiz: Test Your Medical IQ of ED” from www.emedicinehelp.com.13 Questions assess knowledge of specific risk factors (eg, age, obesity, depression, prostate cancer), symptoms, incidence rate, treatments, normal erectile functioning, and implications of ED. The questionnaire contains 16 items (3 true/false and 13 multiple choice items), and the total score corresponds to the percentage correct. According to the online version, the average score is 11 items correct (69%).13
A single item asked participants to identify behavioral changes they had tried to improve their erectile functioning. Options included taking medications at a different time, and/or decreasing tobacco, caffeine, or alcohol consumption. The Erectile Dysfunction Inventory of Treatment Satisfaction – Patient Version (EDITS) is an 11-item questionnaire administered to assess participants’ satisfaction with their medical treatment of ED.14 Items assess treatment satisfaction, ease of use, confidence in ability to perform, partner satisfaction, and naturalness of erections achieved during treatment. These items are rated on a scale ranging from 0 (dissatisfaction) to 4 (high satisfaction) and then summed, with total scores ranging from 0 (extremely dissatisfied) to 100 (extremely satisfied). The measure displayed high internal consistency (α = .90) and high test-retest reliability (r = .98).14 Several studies have used cutoff scores of 0 = very dissatisfied; 25 = dissatisfied; 50 = neither satisfied nor dissatisfied; 75 = satisfied; and 100 = very satisfied.15,16 These cut scores and classifiers were used in the current study; reliability was α = .92.
The authors further explored reasons for veteran dissatisfaction with ED treatment by asking participants to respond to a single item: “Why are you dissatisfied with your erectile dysfunction treatment?” They could indicate that they were satisfied or circle all options for dissatisfaction that applied (“I would like to receive more pills per month,” “The treatment does not work well,” or “I want more information about erectile dysfunction and treatment”), or write in a response. The authors inquired about the number of pills prescribed to ascertain whether dissatisfaction was due to VA-specific policies vs veterans’ understanding of ED and effectiveness of treatment, which providers have more ability to improve.
In addition to the quantitative data obtained from the completed surveys, unsolicited responses from participants to the principal investigator via phone calls, and letters regarding treatment satisfaction were gathered. The second author conducted a basic exploratory content analysis of these unsolicited responses to group them into themes related to this study, such as satisfaction or dissatisfaction with ED treatment.
Results
The authors first assessed levels of ED and satisfaction with treatment in the sample. On average, participants reported mild-to-moderate erectile dysfunction (M = 13.1; SD = 5.7), which is higher than that of the general population and consistent with samples of men referred for ED treatment.17,18 Satisfaction levels were slightly above neutral on the EDITS questionnaire (M = 58.3%; SD = 24.5). In response to a separate single-item question regarding reasons for dissatisfaction, only 6.4% of veterans reported being satisfied with their ED treatment.
According to respondents, the primary reasons for dissatisfaction were wanting more medication (46%), finding the treatment ineffective (26.7%), and desiring more information (24%). Further, ED severity was negatively correlated with satisfaction with ED treatment (r = .72, P < .01; note that higher scores correspond to less severe ED on this measure). However, despite moderate-to-low levels of satisfaction, 79.2% of patients planned to continue with their ED treatment (59.3% very likely and 19.9% moderately likely).
The authors also assessed participants’ communication with PCPs about their sexual functioning. Twenty-five percent reported not talking with their PCP about sexual concerns (despite all having been prescribed an ED medication in the past year). In this sample, talking with one’s PCP was not related to increased knowledge of ED risk factors (t [294] = .32, ns). Those who talked to their PCP tended to be less satisfied with treatment (M = 56.2; SD = 24.5) than those who did not talk to their PCP (M = 64.7; SD = 23.3; t (213) = -2.2; P = .03), likely because those who felt their treatment was working for them felt less need to talk to their provider. Indeed, those who talked to their PCP trended to have more severe levels of ED (M = 12.7; SD = 5.8) than those who did not (M = 14.2; SD = 5.3; t [285] = -1.91; P = .057; note that higher scores correspond to less severe ED on this measure). Finally, adults aged > 65 years were less likely to talk to their PCP than were younger adults (69% vs 81%); χ2 (1, N = 291) = 5.57; P = .018.
Generally, the level of knowledge of ED risk factors was lower than the average of respondents to the original online survey (62% vs 69%).13 Younger adults were slightly more knowledgeable (M = 64%; SD = 13) than were older adults (M = 60%; SD = 15), t (288.08) = 2.01; P = .046).
Finally, most veterans reported few attempted behavioral changes to address ED, such as taking medications at a different time or decreasing use of tobacco, caffeine, or alcohol (M = 1.3; SD = 1.1). Thirty percent had not tried any behavioral changes; 34.1% tried 1 change; and 35.9% had tried more than 1 behavioral change. In contrast, 89% of participants reported using a PDE5 medication. Eight-two percent of participants reported currently receiving ED treatment of some kind; within this group, 97.4% reported currently taking a PDE5 medication. Only 2.5% of veterans reported using other kinds of treatment, such as vacuum pump, suppository, over-the-counter medication, injections, and not using a PDE5 medication, whereas 6.7% were using other kinds of treatment as well as a PDE5 medication.
In addition to the quantitative responses, 48 participants wrote unsolicited comments about their experiences with ED treatment on their returned questionnaires. The principal investigator also received 9 telephone calls from intended study participants, who provided verbal feedback regarding their experience with ED treatment. Comments unrelated to the study were eliminated, and the remaining written and verbal responses were grouped into categories to identify themes. Mirroring the quantitative results, participants providing qualitative feedback were dissatisfied with their ED treatment. Specifically, 43% of the comments consisted of complaints regarding the ineffectiveness and/or undesirable adverse effects (AEs) of ED medications and other ED treatments, including physical AEs (eg, headaches), sentiments that treatment does not feel “natural,” and dissatisfaction with the quality and length of sexual encounters despite treatment. Yet 24% of the comments entailed requests for more and/or different ED medications. Less frequent, although significant, comments related to decreased sexual interest and performance because of other medical conditions, such as pain, prostate surgery, and hypertension (15%); desire for additional information about ED treatments from health care providers (9%); use of nonpharmacologic ED interventions (eg, vacuum pump, 7%); and concerns about their partners’ level of sexual dissatisfaction as a result of their ED (7%).
Discussion
The present study examined knowledge of ED risk factors and level of satisfaction with ED treatment in a veteran population. Pharmacologic interventions comprised the most prevalent form of ED treatment. Both quantitative and qualitative results indicated areas for improvement in veteran satisfaction with ED treatment. Overall, veterans reported being neither satisfied nor dissatisfied with their current ED treatment, although very few reported being satisfied in response to a single item. The discrepancy may be related to the negative wording of the latter question (“Why are you dissatisfied with your erectile dysfunction treatment?”), which potentially biased participants’ responses. Several veterans also provided many unsolicited comments regarding areas for improvement. Despite feeling neutral to dissatisfied with treatment, 80% planned to continue with treatment. Sources of dissatisfaction included restricted access to ED medication (eg, limiting pills to 4 per month), ineffectiveness of treatment (eg, poor quality of erection, lack of climax), physical AEs, a desire for more information about ED, and psychological and relational concerns (eg, partner sexual dissatisfaction). As one veteran in his 80s lamented in describing the apparent end to his sexual life despite current ED treatment, “Is that all there is? It is the end of the road.”
The authors identified several barriers to implementing potentially beneficial interventions other than ED medications. Specifically, despite receiving long-term treatment for ED, veteran participants showed average knowledge of information related to ED risk factors. Of concern, discussing sexual health concerns with a PCP was not associated with increased knowledge of ED risk factors. This may explain the finding that veterans plan to continue with medication treatment despite feeling only neutral to dissatisfied about their current ED treatment.
Veterans who talked to their PCP about ED were less satisfied with treatment than were those who did not talk to their PCP, likely because those who felt their treatment was working for them felt less need to talk to their provider. Indeed, those who talked to their PCP tended to have more severe ED than those who did not. It may be that veterans avoid discussing ED with their PCP until they reach advanced ED when it is too late for treatment to make a difference. The principal investigator’s receipt of unsolicited telephone calls from intended study participants desiring to discuss ED—something that has not occurred during the researchers’ involvement in dozens of prior health-related studies—illustrates the importance veterans place on sexual concerns and the need to encourage discussion about the topic in the context of health care appointments. Specifically, older adults would benefit from more conversations with PCPs as they reported less knowledge of ED risk factors and fewer conversations with PCPs about sexual concerns than did younger men.
Adverse Events
Given the AEs reported by veterans and the significant cost of ED medications within the VA system,2 increased use of alternative nonpharmacologic and preventive behavioral approaches would be clinically and economically beneficial. For example, in one study, men with ED who engaged in a lifestyle program that focused on weight loss, diet, and exercise were found more likely to experience improvements in erectile functioning compared with men who did not participate.6 Yet in the current study, 30% of participants had not attempted behavioral changes to address ED.
The VA’s Health Promotion and Disease Prevention (HPDP) Program focuses on preventive services and behavioral interventions to reduce health risks within primary care settings.19 This program may provide a framework for efforts to prevent and ameliorate ED. Specifically, coaching and education by HPDP experts could reduce PCPs’ discomfort with sexual health discussions and normalize the value of such conversations for both providers and patients. Existing HPDP behavioral interventions targeting areas such as weight loss and smoking cessation also could emphasize the potential secondary benefit of improved sexual functioning. To that end, preventive health campaigns could include sexual health and ED prevention as topics on patient education materials. Including sexual functioning on telephone or in-person prescreening questionnaires prior to routine appointments with PCPs also may facilitate destigmatization of sex as an important health topic.
Limitations
Limitations of the current study include its correlational design, which precludes conclusions regarding casual relationships among the variables in question. The authors cannot speculate about how well their sample represents the general veteran population given its low response rate (although comparable to a similar study).10 In addition, the lack of a validated measure of ED risk-factor knowledge meant reliance on an online questionnaire with unknown psychometric properties. To identify alternatives to pharmacologic treatment for ED, it would be beneficial for future research to examine the reasons for dissatisfaction among veterans, assessing satisfaction changes after implementation of behavioral and/or preventive interventions.
Conclusion
This study deepens the understanding of ED treatment efficacy among veterans in light of the paucity of available information. Overall, veterans are neutral to dissatisfied with their ED treatment, yet plan to continue it in the context of limited alternatives and possible lack of knowledge of behavioral methods shown to improve erectile functioning. Future studies that examine the reasons for continuing medication despite neutral satisfaction would help explore this finding. Based on these results, the authors recommend increased attention and discussion of sexual health during PCP visits and enhanced efforts toward using behavioral strategies to prevent and reduce ED. Encouragement from PCPs to address sexual health concerns earlier in a veteran’s treatment course—and in the context of behavioral and lifestyle change—may assist in preventing veterans’ sexual lives from prematurely reaching “the end of the road.”
Acknowledgments
This material is the result of work supported with resources and the use of facilities at the Clement J. Zablocki VA Medical Center in Milwaukee, Wisconsin.
1. Grover SA, Lowensteyn I, Kaouache M, et al. The prevalence of erectile dysfunction in the primary care setting: importance of risk factors for diabetes and vascular disease. Arch Intern Med. 2006;166(2):213-219.
2. Miller K. In the war on impotence, the VA deploys Viagra and Cialis. Bloomberg Business Week. January 17, 2013. http://www.businessweek.com/articles/2013-01-17/in-the-war-on-impotence-the-va-deploys-viagra-and-cialis. Accessed April 7, 2016.
3. Phosphodiesterase Type 5 Inhibitors for the Treatment of BPH/LUTS and Penile Rehabilitation: Evidence Summary and Recommendations - December 2014. U.S. Department of Veterans Affairs website. http://www.pbm.va.gov/clinicalguidance/clinicalrecommendations/PDE5I_BPH_LUTS_Evidence_Summary_and_Recommendations.pdf. Accessed April 29, 2016.
4. Laumann EO, Glasser DB, Neves RC, Moreira ED Jr; GSSAB Investigators’ Group. A population-based survey of sexual activity, sexual problems and associated help-seeking behavior patterns in mature adults in the United States of America. Int J Impot Res. 2009;21(3):171-178.
5. Baumgartner MK, Hermanns T, Cohen A, et al. Patients’ knowledge about risk factors for erectile dysfunction is poor. J Sex Med. 2008;5(10):2399-2404.
6. Esposito K, Ciotola M, Giugliano F, et al. Effects of intensive lifestyle changes on erectile dysfunction in men. J Sex Med. 2009;6(1):243-250.
7. Macdowall W, Parker R, Nanchahal K, et al. ‘Talking of Sex’: developing and piloting a sexual health communication tool for use in primary care. Patient Educ Couns. 2010;81(3):332-337.
8. Ng CJ, Low WY, Tan NC, Choo WY. The role of general practitioners in the management of erectile dysfunction-a qualitative study. Int J Impot Res. 2004;16(1):60-63.
9. Tsimtsiou Z, Hatzimouratidis K, Nakopoulou E, Kyrana E, Salpigidis G, Hatzichristou D. Predictors of physicians’ involvement in addressing sexual health issues. J Sex Med. 2006;3(4):583-588.
10. Moreira ED Jr., Kim SC, Glasser D, Gingell C. Sexual activity, prevalence of sexual problems, and associated help-seeking patterns in men and women aged 40-80 years in Korea: data from the Global Study of Sexual Attitudes and Behaviors (GSSAB). J Sex Med. 2006;3(2):201-211.
11. Rosen RC, Cappelleri JC, Smith MD, Lipsky J, Peña BM. Development and evaluation of an abridged, 5-item version of the International Index of Erectile Function (IIEF-5) as a diagnostic tool for erectile dysfunction. Int J Impot Res. 1999;11(6):319-326.
12. Rosen RC, Riley A, Wagner G, Osterloh IH, Kirkpatrick J, Mishra A. The international index of erectile function (IIEF): a multidimensional scale for assessment of erectile dysfunction. Urology. 1997;49(6):822-830.
13. Impotence [Erectile Dysfunction] Quiz: Test Your Medical IQ of ED. MedicineNet website. http://www.medicinenet.com/impotence_erectile_dysfunction_quiz/quiz.htm. Accessed April 20, 2016.
14. Ponholzer A, Temml C, Mock K, Marszalek M, Obermayr R, Madersbacher S. Prevalence and risk factors for erectile dysfunction in 2869 men using a validated questionnaire. Eur Urol. 2005;47(1):80-86.
15. Althof SE, Corty EW, Levine SB, et al. EDITS: development of questionnaires for evaluating satisfaction with treatments for erectile dysfunction. Urology. 1999;53(4):793-799.
16. Lewis R, Bennett CJ, Borkon WD, et al. Patient and partner satisfaction with Viagra (sildenafil citrate) treatment as determined by the Erectile Dysfunction Inventory of Treatment Satisfaction Questionnaire. Urology. 2001;57(5):960-965.
17. Raina R, Lakin MM, Agarwal A, et al. Long-term effect of sildenafil citrate on erectile dysfunction after radical prostatectomy: 3-year follow-up. Urology. 2003;62(1):110-115.
18. Safarinejad MR, Kolahi AA, Ghaedi G. Safety and efficacy of sildenafil citrate in treating erectile dysfunction in patients with combat-related post-traumatic stress disorder: a double-blind, randomized and placebo-controlled study. BJU Int. 2009; 104(3):376-383.
19. U.S. Department of Veterans Affairs, Veterans Health Administration. VHA Handbook 1120.02: Health promotion and disease prevention core program requirements. U.S. Department of Veterans Affairs website. http://www.va.gov/vhapublications/ViewPublication.asp?pub_ID=2763. Published July 5, 2012. Accessed April 7, 2016.
Adherence to Disease-Modifying Therapies in Patients With MS: A Retrospective Cohort Study
Multiple sclerosis (MS) is an autoimmune disorder in which the myelin of the brain and spinal cord is selectively targeted by immune-system cells. As a result, nerve transmission is disrupted, leading to a variety of unpredictable symptoms from weakness and a lack of balance to blindness and paralysis of the body. Clinically, MS can take 4 courses, including relapsing-remitting (RRMS), primary-progressive (PPMS), secondary-progressive, and progressive-relapsing.1 At onset, 85% of diagnosed patients have RRMS, and 10% to 15% have PPMS.2 If untreated, patients with RRMS become secondary-progressive, with progressive disability and indiscrete relapses.3 Hence, disease-modifying therapies are targeted toward decreasing the relapse rate as well as slowing the progression of the disease.4
Annually, about 16,000 veterans with MS receive health care services from the VHA.5 The C.W. Bill Young Bay Pines VA Healthcare System (BPVAHCS) is a level 1 facility that annually serves more than 105,000 veterans. The BPVAMC sees veterans with a wide variety of neurologic illnesses and has 5 full-time neurologists with subspecialty training. The BPVAHCS facility has outpatient clinics and a 200 inpatient bed facility. The Neurology Department sees 125 outpatients per week and consults on about 30 inpatients per week.
Methods
A retrospective review of BPVAHCS patients diagnosed with MS from January 2009 to July 2014 was performed with institutional review board approval. Patient data were collected from ICD-9-CM codes and kept confidential. A list of patients was collected from Neurology Clinic patient visits with “Multiple Sclerosis” on the problem list.
Patient medical records were reviewed to collect the following information: presence of rigorous diagnosis of MS, clinical course of MS in patient, presence or absence of disease-modifying therapy, and disease-modifying agents (DMAs) used.
Determining factors for DMA treatment included increasing tiredness, weakness, visual symptoms, and radiologic evidence (magnetic resonance imaging) of recurrent, active lesions. Each patient was examined on a case-by-case basis to assess whether or not the patient actually had MS and if so, whether they were being treated with DMAs. Only patients with RRMS were included. Patients were excluded from the study if they were deceased, not currently under BPVACHS care, or had symptoms of optic neuritis but were not fully indicative of MS. Patients with clinically isolated syndrome, probable diagnosis of MS, or PPMS also were excluded from the study.
Exclusion from this study was based on 2 additional premises. Patients were excluded if they discontinued an initial ABC (interferon beta-1a, interferon beta-1b, glatiramer acetate) due to DMA treatment relapse or adverse effects (AEs), such as injection site reactions, flulike symptoms, or depression. Additionally, patients who were not willing to take more DMA medications were excluded if they felt they were relatively stable (had infrequent relapses) and believed that additional medication was not worth the risk of potential AEs.
The study patients were seen and followed up by the neurologists. All the data for this study were based on interactions with the neurologists and not primary care providers (PCPs). Because MS treatment is complex, PCPs have little involvement in its management. The percentage of patients not on any DMAs was calculated from the list of BPVAHCS patients with RRMS.
The results were compared with a similar retrospective cohort study conducted using the Commercial Claims database and Medicare Supplemental and Coordination of Benefits database to identify individuals newly diagnosed with MS.6 This study was chosen because it was similar in methodology but investigated a comparable non-VA group. A 2-tailed difference between proportions test was then performed to determine whether the BPVAHCS patients with MS who were not treated with DMAs were significantly different from those from this non-VA population. Additionally, data from VA patients who were receiving DMAs were further examined and presented.
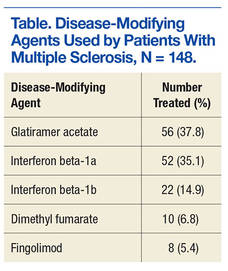
Results
At the BPVAHCS, 262 patients were diagnosed with MS and 43% were not treated with DMAs. Margolis and colleagues found that about 60% of its 11,061 newly diagnosed non-VA patients with MS remained untreated.6 Although the latter proportion is higher, a 2-tailed difference between proportions test indicates that the proportion of patients with MS being treated at the VA was significantly lower (P < .01).
Among the 148 patients who were diagnosed with MS and treated with DMA at BPVAHCS, 5 different DMAs were identified (Table). The most commonly prescribed regimen was glatiramer acetate, which was used by 56 of 148 patients (37.8%). Fifty-two patients (35.1%) used interferon beta-1a. Of the 2 interferon DMAs, beta-1a was twice as popular as beta-1b, which was prescribed to 22 (14.9%) of patients. Dimethyl fumarate (6.8%) and fingolimod (5.4%) were used sparingly, because they were new to the market (cost and availability also were factors). With time, increased efficacy and objective assessment of benefit in the reduction of the T2 lesion load may result in a greater use of these oral DMAs.7–9
Based on this evaluation, 43% of patients who were diagnosed with MS were untreated at BPVAHCS. Concern over treatment AEs, the inconvenience of injectable dosing, and patients who were not 100% service-connected and lost to follow-up because of the cost may have contributed to the poor rate of treatment.
Discussion
Injected-based DMAs, such as interferon beta-1a, interferon beta-1b, and glatiramer acetate, were first introduced in the 1990s, but these proved to be inconvenient and triggered AEs, including injection site reactions. Overall, their efficacy was about 30%, with interferon beta-1a showing a 27% reduction in relapses.10 In 2010, oral DMAs, such as fingolimod, were FDA approved. These oral DMAs were a significant improvement over injectable DMAs but still had AEs. Hence, their use was restricted to neurologists by the BPVAHCS, and rightfully so.
Still, newer and more effective oral DMAs are showing promise, such as dimethyl fumarate, teriflunomide, and alemtuzumab. These new DMAs have significantly impacted the treatment of MS as they are not only easier for patients to adhere to and for neurologists to prescribe, but most significantly, have had a 50% decrease in the rate of relapse.10 Yet, the newer oral DMAs were less commonly prescribed than the older treatments at BPVAHCS.
Since this study did not demonstrate increased use of oral DMAs at the BPVAHCS, more PCP and neurologist-focused educational programs on the use of DMAs may be beneficial. Educational programs should lead to a reevaluation of patients with MS to consider oral DMAs, which offer better efficacy and fewer AEs. The newer oral DMAs have shown a higher reduction of T2 lesions, and the significantly decreased incidence of relapses in many other medical facilities is quite promising for the BPVAHCS.7-9
The data collected at BPVAHCS were part of a quality improvement (QI) study that will be used by the Neurology Department to follow up on the patients with MS in order to implement DMA therapies. A questionnaire was developed for following up with BPVAHCS patients with MS. The primary purpose of the questionnaire is to help neurologists identify the reasons patients avoid DMA therapies and to reduce the number of BPVAHCS patients not on the most efficacious MS DMA treatment.
Conclusion
Multiple sclerosis is a disease without a cure. Current treatment strategies focus on modifying the course of the disease and managing its symptoms. However, even as promising new treatments emerge, the current literature suggests that a significant number of patients diagnosed with MS are not receiving DMAs and may not be receiving optimal treatment.11
Findings from this study indicate that although DMAs are optimal for patients with MS, they may not be prescribed as frequently at BPVAHCS as they are at a non-VA care facility. It is unclear whether this finding is explained by an educational gap, clinical differences between non-VA and VA patients, organizational factors, or a combination of these variables. Further study is warranted to examine the use of DMAs among veterans with MS and factors that facilitate or impede optimal practice. The BPVAHCS will use data from this retrospective cohort study in a QI initiative for patients with MS. Findings from the QI initiative will be reported using the Standards for Quality Improvement Reporting Excellence.12,13
Acknowledgments
This material is the result of work supported with resources and the use of facilities at the Bay Pines VA Healthcare System.
1. National Multiple Sclerosis Society. Types of MS. National Multiple Sclerosis Society website. http://www.nationalmssociety.org/What-is-MS/Types-of-MS. Accessed April 7, 2016.
2. McKay KA, Kwan V, Duggan T, Tremlett H. Risk factors associated with the onset of relapsing-remitting and primary progressive multiple sclerosis: a systematic review. Biomed Res Int. 2015;2015:817238.
3. Gold R, Wolinsky JS, Amato MP, Comi G. Evolving expectations around early management of multiple sclerosis. Ther Adv Neurol Disord. 2010;3(6):351-367.
4. Ben-Zacharia A, Lublin FD. Talking About Initiating and Adhering to Treatment With Injectable Disease Modifying Agents. Washington, DC: National Multiple Sclerosis Society; 2009.
5. Cameron MH, Poel AJ, Haselkorn JK, Linke A, Bourdette D. Falls requiring medical attention among veterans with multiple sclerosis: a cohort study. J Rehabil Res Dev. 2011;48(1):13-20.
6. Margolis JM, Fowler R, Johnson BH, Kassed CA, Kahler K. Disease-modifying drug initiation patterns in commercially insured multiple sclerosis patients: a retrospective cohort study. BMC Neurol. 2011;11:122.
7. Johnson KP, Brooks BR, Ford CC, et al. Sustained clinical benefits of glatiramer acetate in relapsing multiple sclerosis patients observed for 6 years. Copolymer 1 Multiple Scleroisis Study Group. Mult Scler. 2000;6(4):255-266.
8. Steinberg SC, Faris RJ, Chang CF, Chan A, Tankersley MA. Impact of adherence to interferons in the treatment of multiple sclerosis: a non-experimental, retrospective, cohort study. Clin Drug Investig. 2010;30(2):89-100.
9. Agashivala N, Wu N, Abouzaid S, et al. Compliance to fingolimod and other disease modifying treatments in multiple sclerosis patients, a retrospective cohort study. BMC Neurol. 2013;13:138.
10. Williams UE, Oparah SK, Philip-Ephraim EE. Disease modifying therapy in multiple sclerosis. Int Sch Res Notices. 2014;2014:307064.
11. Lus G, Signoriello E, Maniscalco GT, Bonavita S, Signoriello S, Gallo C. Treatment withdrawal in relapsing-remitting multiple sclerosis: a retrospective cohort study. Eur J Neurol. 2016;23(3):489-493.
12. Davidoff F, Batalden P, Stevens D, Ogrinc G, Mooney S; SQUIRE development group. Publication guidelines for quality improvement studies in health care: evolution of the SQUIRE project. Qual Saf Health Care. 2008;17(suppl 1):i3–i9.
13. Ogrinc G, Mooney SE, Estrada C, et al. The SQUIRE (Standards for QUality Improvement Reporting Excellence) guidelines for quality improvement reporting: explanation and elaboration. Qual Saf Health Care. 2008;17(suppl 1):i13-i32.
Multiple sclerosis (MS) is an autoimmune disorder in which the myelin of the brain and spinal cord is selectively targeted by immune-system cells. As a result, nerve transmission is disrupted, leading to a variety of unpredictable symptoms from weakness and a lack of balance to blindness and paralysis of the body. Clinically, MS can take 4 courses, including relapsing-remitting (RRMS), primary-progressive (PPMS), secondary-progressive, and progressive-relapsing.1 At onset, 85% of diagnosed patients have RRMS, and 10% to 15% have PPMS.2 If untreated, patients with RRMS become secondary-progressive, with progressive disability and indiscrete relapses.3 Hence, disease-modifying therapies are targeted toward decreasing the relapse rate as well as slowing the progression of the disease.4
Annually, about 16,000 veterans with MS receive health care services from the VHA.5 The C.W. Bill Young Bay Pines VA Healthcare System (BPVAHCS) is a level 1 facility that annually serves more than 105,000 veterans. The BPVAMC sees veterans with a wide variety of neurologic illnesses and has 5 full-time neurologists with subspecialty training. The BPVAHCS facility has outpatient clinics and a 200 inpatient bed facility. The Neurology Department sees 125 outpatients per week and consults on about 30 inpatients per week.
Methods
A retrospective review of BPVAHCS patients diagnosed with MS from January 2009 to July 2014 was performed with institutional review board approval. Patient data were collected from ICD-9-CM codes and kept confidential. A list of patients was collected from Neurology Clinic patient visits with “Multiple Sclerosis” on the problem list.
Patient medical records were reviewed to collect the following information: presence of rigorous diagnosis of MS, clinical course of MS in patient, presence or absence of disease-modifying therapy, and disease-modifying agents (DMAs) used.
Determining factors for DMA treatment included increasing tiredness, weakness, visual symptoms, and radiologic evidence (magnetic resonance imaging) of recurrent, active lesions. Each patient was examined on a case-by-case basis to assess whether or not the patient actually had MS and if so, whether they were being treated with DMAs. Only patients with RRMS were included. Patients were excluded from the study if they were deceased, not currently under BPVACHS care, or had symptoms of optic neuritis but were not fully indicative of MS. Patients with clinically isolated syndrome, probable diagnosis of MS, or PPMS also were excluded from the study.
Exclusion from this study was based on 2 additional premises. Patients were excluded if they discontinued an initial ABC (interferon beta-1a, interferon beta-1b, glatiramer acetate) due to DMA treatment relapse or adverse effects (AEs), such as injection site reactions, flulike symptoms, or depression. Additionally, patients who were not willing to take more DMA medications were excluded if they felt they were relatively stable (had infrequent relapses) and believed that additional medication was not worth the risk of potential AEs.
The study patients were seen and followed up by the neurologists. All the data for this study were based on interactions with the neurologists and not primary care providers (PCPs). Because MS treatment is complex, PCPs have little involvement in its management. The percentage of patients not on any DMAs was calculated from the list of BPVAHCS patients with RRMS.
The results were compared with a similar retrospective cohort study conducted using the Commercial Claims database and Medicare Supplemental and Coordination of Benefits database to identify individuals newly diagnosed with MS.6 This study was chosen because it was similar in methodology but investigated a comparable non-VA group. A 2-tailed difference between proportions test was then performed to determine whether the BPVAHCS patients with MS who were not treated with DMAs were significantly different from those from this non-VA population. Additionally, data from VA patients who were receiving DMAs were further examined and presented.
Results
At the BPVAHCS, 262 patients were diagnosed with MS and 43% were not treated with DMAs. Margolis and colleagues found that about 60% of its 11,061 newly diagnosed non-VA patients with MS remained untreated.6 Although the latter proportion is higher, a 2-tailed difference between proportions test indicates that the proportion of patients with MS being treated at the VA was significantly lower (P < .01).
Among the 148 patients who were diagnosed with MS and treated with DMA at BPVAHCS, 5 different DMAs were identified (Table). The most commonly prescribed regimen was glatiramer acetate, which was used by 56 of 148 patients (37.8%). Fifty-two patients (35.1%) used interferon beta-1a. Of the 2 interferon DMAs, beta-1a was twice as popular as beta-1b, which was prescribed to 22 (14.9%) of patients. Dimethyl fumarate (6.8%) and fingolimod (5.4%) were used sparingly, because they were new to the market (cost and availability also were factors). With time, increased efficacy and objective assessment of benefit in the reduction of the T2 lesion load may result in a greater use of these oral DMAs.7–9
Based on this evaluation, 43% of patients who were diagnosed with MS were untreated at BPVAHCS. Concern over treatment AEs, the inconvenience of injectable dosing, and patients who were not 100% service-connected and lost to follow-up because of the cost may have contributed to the poor rate of treatment.
Discussion
Injected-based DMAs, such as interferon beta-1a, interferon beta-1b, and glatiramer acetate, were first introduced in the 1990s, but these proved to be inconvenient and triggered AEs, including injection site reactions. Overall, their efficacy was about 30%, with interferon beta-1a showing a 27% reduction in relapses.10 In 2010, oral DMAs, such as fingolimod, were FDA approved. These oral DMAs were a significant improvement over injectable DMAs but still had AEs. Hence, their use was restricted to neurologists by the BPVAHCS, and rightfully so.
Still, newer and more effective oral DMAs are showing promise, such as dimethyl fumarate, teriflunomide, and alemtuzumab. These new DMAs have significantly impacted the treatment of MS as they are not only easier for patients to adhere to and for neurologists to prescribe, but most significantly, have had a 50% decrease in the rate of relapse.10 Yet, the newer oral DMAs were less commonly prescribed than the older treatments at BPVAHCS.
Since this study did not demonstrate increased use of oral DMAs at the BPVAHCS, more PCP and neurologist-focused educational programs on the use of DMAs may be beneficial. Educational programs should lead to a reevaluation of patients with MS to consider oral DMAs, which offer better efficacy and fewer AEs. The newer oral DMAs have shown a higher reduction of T2 lesions, and the significantly decreased incidence of relapses in many other medical facilities is quite promising for the BPVAHCS.7-9
The data collected at BPVAHCS were part of a quality improvement (QI) study that will be used by the Neurology Department to follow up on the patients with MS in order to implement DMA therapies. A questionnaire was developed for following up with BPVAHCS patients with MS. The primary purpose of the questionnaire is to help neurologists identify the reasons patients avoid DMA therapies and to reduce the number of BPVAHCS patients not on the most efficacious MS DMA treatment.
Conclusion
Multiple sclerosis is a disease without a cure. Current treatment strategies focus on modifying the course of the disease and managing its symptoms. However, even as promising new treatments emerge, the current literature suggests that a significant number of patients diagnosed with MS are not receiving DMAs and may not be receiving optimal treatment.11
Findings from this study indicate that although DMAs are optimal for patients with MS, they may not be prescribed as frequently at BPVAHCS as they are at a non-VA care facility. It is unclear whether this finding is explained by an educational gap, clinical differences between non-VA and VA patients, organizational factors, or a combination of these variables. Further study is warranted to examine the use of DMAs among veterans with MS and factors that facilitate or impede optimal practice. The BPVAHCS will use data from this retrospective cohort study in a QI initiative for patients with MS. Findings from the QI initiative will be reported using the Standards for Quality Improvement Reporting Excellence.12,13
Acknowledgments
This material is the result of work supported with resources and the use of facilities at the Bay Pines VA Healthcare System.
1. National Multiple Sclerosis Society. Types of MS. National Multiple Sclerosis Society website. http://www.nationalmssociety.org/What-is-MS/Types-of-MS. Accessed April 7, 2016.
2. McKay KA, Kwan V, Duggan T, Tremlett H. Risk factors associated with the onset of relapsing-remitting and primary progressive multiple sclerosis: a systematic review. Biomed Res Int. 2015;2015:817238.
3. Gold R, Wolinsky JS, Amato MP, Comi G. Evolving expectations around early management of multiple sclerosis. Ther Adv Neurol Disord. 2010;3(6):351-367.
4. Ben-Zacharia A, Lublin FD. Talking About Initiating and Adhering to Treatment With Injectable Disease Modifying Agents. Washington, DC: National Multiple Sclerosis Society; 2009.
5. Cameron MH, Poel AJ, Haselkorn JK, Linke A, Bourdette D. Falls requiring medical attention among veterans with multiple sclerosis: a cohort study. J Rehabil Res Dev. 2011;48(1):13-20.
6. Margolis JM, Fowler R, Johnson BH, Kassed CA, Kahler K. Disease-modifying drug initiation patterns in commercially insured multiple sclerosis patients: a retrospective cohort study. BMC Neurol. 2011;11:122.
7. Johnson KP, Brooks BR, Ford CC, et al. Sustained clinical benefits of glatiramer acetate in relapsing multiple sclerosis patients observed for 6 years. Copolymer 1 Multiple Scleroisis Study Group. Mult Scler. 2000;6(4):255-266.
8. Steinberg SC, Faris RJ, Chang CF, Chan A, Tankersley MA. Impact of adherence to interferons in the treatment of multiple sclerosis: a non-experimental, retrospective, cohort study. Clin Drug Investig. 2010;30(2):89-100.
9. Agashivala N, Wu N, Abouzaid S, et al. Compliance to fingolimod and other disease modifying treatments in multiple sclerosis patients, a retrospective cohort study. BMC Neurol. 2013;13:138.
10. Williams UE, Oparah SK, Philip-Ephraim EE. Disease modifying therapy in multiple sclerosis. Int Sch Res Notices. 2014;2014:307064.
11. Lus G, Signoriello E, Maniscalco GT, Bonavita S, Signoriello S, Gallo C. Treatment withdrawal in relapsing-remitting multiple sclerosis: a retrospective cohort study. Eur J Neurol. 2016;23(3):489-493.
12. Davidoff F, Batalden P, Stevens D, Ogrinc G, Mooney S; SQUIRE development group. Publication guidelines for quality improvement studies in health care: evolution of the SQUIRE project. Qual Saf Health Care. 2008;17(suppl 1):i3–i9.
13. Ogrinc G, Mooney SE, Estrada C, et al. The SQUIRE (Standards for QUality Improvement Reporting Excellence) guidelines for quality improvement reporting: explanation and elaboration. Qual Saf Health Care. 2008;17(suppl 1):i13-i32.
Analysis of Hospitalist Discontinuity
Studies examining the importance of continuity of care have shown that patients who maintain a continuous relationship with a single physician have improved outcomes.[1, 2] However, most of these studies were performed in the outpatient, rather than the inpatient setting. With over 35 million patients admitted to hospitals in 2013, along with the significant increase in hospital discontinuity over recent years, the impact of inpatient continuity of care on quality outcomes and patient satisfaction is becoming increasingly relevant.[3, 4]
Service handoffs, when a physician hands over treatment responsibility for a panel of patients and is not expected to return, are a type of handoff that contributes to inpatient discontinuity. In particular, service handoffs between hospitalists are an especially common and inherently risky type of transition, as there is a severing of an established relationship during a patient's hospitalization. Unfortunately, due to the lack of evidence on the effects of service handoffs, current guidelines are limited in their recommendations.[5] Whereas several recent studies have begun to explore the effects of these handoffs, no prior study has examined this issue from a patient's perspective.[6, 7, 8]
Patients are uniquely positioned to inform us about their experiences in care transitions. Furthermore, with patient satisfaction now affecting Medicare reimbursement rates, patient experiences while in the hospital are becoming even more significant.[9] Despite this emphasis toward more patient‐centered care, no study has explored the hospitalized patient's experience with hospitalist service handoffs. Our goal was to qualitatively assess the hospitalized patients' experiences with transitions between hospitalists to develop a conceptual model to inform future work on improving inpatient transitions of care.
METHODS
Sampling and Recruitment
We conducted bedside interviews of hospitalized patients at an urban academic medical center from October 2014 through December 2014. The hospitalist service consists of a physician and an advanced nurse practitioner (ANP) who divide a panel of patients that consist of general medicine and subspecialty patients who are often comanaged with hepatology, oncology, and nephrology subspecialists. We performed a purposive selection of patients who could potentially comment on their experience with a hospitalist service transition using the following method: 48 hours after a service handoff (ie, an outgoing physician completing 1 week on service, then transfers the care of the patient to a new oncoming hospitalist), oncoming hospitalists were approached and asked if any patient on their service had experienced a service handoff and still remained in the hospital. A 48‐hour time period was chosen to give the patients time to familiarize themselves with their new hospitalist, allowing them to properly comment on the handoff. Patients who were managed by the ANP, who were non‐English speaking, or who were deemed to have an altered mental status based on clinical suspicion by the interviewing physician (C.M.W.) were excluded from participation. Following each weekly service transition, a list of patients who met the above criteria was collected from 4 nonteaching hospitalist services, and were approached by the primary investigator (C.M.W.) and asked if they would be willing to participate. All patients were general medicine patients and no exclusions were made based on physical location within the hospital. Those who agreed provided signed written consent prior to participation to allow access to the electronic health records (EHRs) by study personnel.
Data Collection
Patients were administered a 9‐question, semistructured interview that was informed by expert opinion and existing literature, which was developed to elicit their perspective regarding their transition between hospitalists.[10, 11] No formal changes were made to the interview guide during the study period, and all patients were asked the same questions. Outcomes from interim analysis guided further questioning in subsequent interviews so as to increase the depth of patient responses (ie, Can you explain your response in greater depth?). Prior to the interview, patients were read a description of a hospitalist, and were reminded which hospitalists had cared for them during their stay (see Supporting Information, Appendix 1, in the online version of this article). If family members or a caregiver were present at the time of interview, they were asked not to comment. No repeat interviews were carried out.
All interviews were performed privately in single‐occupancy rooms, digitally recorded using an iPad (Apple, Cupertino, CA) and professionally transcribed verbatim (Rev, San Francisco, CA). All analysis was performed using MAXQDA Software (VERBI Software GmbH, Berlin, Germany). We obtained demographic information about each patient through chart review
Data Analysis
Grounded theory was utilized, with an inductive approach with no a priori hypothesis.[12] The constant comparative method was used to generate emerging and reoccurring themes.[13] Units of analysis were sentences and phrases. Our research team consisted of 4 academic hospitalists, 2 with backgrounds in clinical medicine, medical education, and qualitative analysis (J.M.F., V.M.A.), 1 as a clinician (C.M.W.), and 1 in health economics (D.O.M.). Interim analysis was performed on a weekly basis (C.M.W.), during which time a coding template was created and refined through an iterative process (C.M.W., J.M.F.). All disagreements in coded themes were resolved through group discussion until full consensus was reached. Each week, responses were assessed for thematic saturation.[14] Interviews were continued if new themes arose during this analysis. Data collection was ended once we ceased to extract new topics from participants. A summary of all themes was then presented to a group of 10 patients who met the same inclusion criteria for respondent validation and member checking. All reporting was performed within the Standards for Reporting Qualitative Research, with additional guidance derived from the Consolidated Criteria for Reporting Qualitative Research.[15, 16] The University of Chicago Institutional Review Board approved this protocol.
RESULTS
In total, 43 eligible patients were recruited, and 40 (93%) agreed to participate. Interviewed patients were between 51 and 65 (39%) years old, had a mean age of 54.5 (15) years, were predominantly female (65%), African American (58%), had a median length of stay at the time of interview of 6.5 days (interquartile range [IQR]: 48), and had an average of 2.0 (IQR: 13) hospitalists oversee their care at the time of interview (Table 1). Interview times ranged from 10:25 to 25:48 minutes, with an average of 15:32 minutes.
| Value | |
|---|---|
| |
| Response rate, n (%) | 40/43 (93) |
| Age, mean SD | 54.5 15 |
| Sex, n (%) | |
| Female | 26 (65) |
| Male | 14 (35) |
| Race, n (%) | |
| African American | 23 (58) |
| White | 16 (40) |
| Hispanic | 1 (2) |
| Median LOS at time of interview, d (IQR) | 6.5 (48) |
| Median no. of hospitalists at time of interview, n (IQR) | 2.0 (13) |
We identified 6 major themes on patient perceptions of hospitalist service handoffs including (1) physician‐patient communication, (2) transparency in the hospitalist transition process, (3) indifference toward the hospitalist transition, (4) hospitalist‐subspecialist communication, (5) recognition of new opportunities due to a transition, and (6) hospitalists' bedside manner (Table 2).
| Themes | Subthemes | Representative Quotes |
|---|---|---|
| Physician‐patient communication | Patients dislike redundant communication with oncoming hospitalist. | I mean it's just you always have to explain your situation over and over and over again. (patient 14) |
| When I said it once already, then you're repeating it to another doctor. I feel as if that hospitalist didn't talk to the other hospitalist. (patient 7) | ||
| Poor communication can negatively affect the doctor‐patient relationship. | They don't really want to explain things. They don't think I'll understand. I think & yeah, I'm okay. You don't even have to put it in layman's terms. I know medical. I'm in nursing school. I have a year left. But even if you didn't know that, I would still hope you would try to tell me what was going on instead of just doing it in your head, and treating it. (patient 2) | |
| I mean it's just you always have to explain your situation over and over and over again. After a while you just stop trusting them. (patient 20) | ||
| Good communication can positively affect the doctor‐patient relationship. | Just continue with the communication, the open communication, and always stress to me that I have a voice and just going out of their way to do whatever they can to help me through whatever I'm going through. (patient 1) | |
| Transparency in transition | Patients want to be informed prior to a service changeover. | I think they should be told immediately, even maybe given prior notice, like this may happen, just so you're not surprised when it happens. (patient 15) |
| When the doctor approached me, he let me know that he wasn't going to be here the next day and there was going to be another doctor coming in. That made me feel comfortable. (patient 9) | ||
| Patients desire a more formalized process in the service changeover. | People want things to be consistent. People don't like change. They like routine. So, if he's leaving, you're coming on, I'd like for him to bring you in, introduce you to me, and for you just assure me that I'll take care of you. (patient 4) | |
| Just like when you get a new medication, you're given all this information on it. So when you get a new hospitalist, shouldn't I get all the information on them? Like where they went to school, what they look like. (patient 23) | ||
| Patients want clearer definition of the roles the physicians will play in their care. | The first time I was hospitalized for the first time I had all these different doctors coming in, and I had the residency, and the specialists, and the department, and I don't know who's who. What I asked them to do is when they come in the room, which they did, but introduce it a little more for me. Write it down like these are the special team and these are the doctors because even though they come in and give me their name, I have no idea what they're doing. (patient 5) | |
| Someone should explain the setup and who people are. Someone would say, Okay when you're in a hospital this is your [doctor's] role. Like they should have booklets and everything. (patient 19) | ||
| Indifference toward transition | Many patients have trust in service changeovers. | [S]o as long as everybody's on board and communicates well and efficiently, I don't have a problem with it. (patient 6) |
| To me, it really wasn't no preference, as long as I was getting the care that I needed. (patient 21) | ||
| It's not a concern as long as they're on the same page. (patient 17) | ||
| Hospitalist‐specialist communication | Patients are concerned about communication between their hospitalist and their subspecialists. | The more cooks you get in the kitchen, the more things get to get lost, so I'm always concerned that they're not sharing the same information, especially when you're getting asked the same questions that you might have just answered the last hour ago. (patient 9) |
| I don't know if the hospitalist are talking to them [subspecialist]. They haven't got time. (patient 35) | ||
| Patients place trust in the communication between hospitalist and subspecialist. | I think among the teams themselveswhich is my pain doctor, Dr. K's group, the oncology group itself, they switch off and trade with each other and they all speak the same language so that works out good. (patient 3) | |
| Lack of interprofessional communication can lead to patient concern. | I was afraid that one was going to drop the ball on something and not pass something on, or you know. (patient 11) | |
| I had numerous doctors who all seemed to not communicate with each other at all or did so by email or whatever. They didn't just sit down together and say we feel this way and we feel that way. I didn't like that at all. (patient 10) | ||
| New opportunities due to transition | Patients see new doctor as opportunity for medical reevaluation. | I see it as two heads are better than one, three heads are better than one, four heads are better than one. When people put their heads together to work towards a common goal, especially when they're, you know, people working their craft, it can't be bad. (patient 9) |
| I finally got my ears looked atbecause I've asked to have my ears looked at since Mondayand the new doc is trying to make an effort to look at them. (patient 39) | ||
| Patients see service changeover as an opportunity to form a better personal relationship. | Having a new hospitalist it gives you opportunity for a new beginning. (patient 11) | |
| Bedside manner | Good bedside manner can assist in a service changeover. | Some of them are all business‐like but some of them are, Well how do you feel today? Hi, how are you? So this made a little difference. You feel more comfortable. You're going to be more comfortable with them. Their bedside manner helps. (patient 16) |
| It's just like when a doctor sits down and talks to you, they just seem more relaxed and more .... I know they're very busy and they have lots of things to do and other patients to see, but while they're in there with you, you know, you don't get too much time with them. So bedside manner is just so important. (patient 24) | ||
| Poor bedside manner can be detrimental in transition. | [B]ecause they be so busy they claim they don't have time just to sit and talk to a patient, and make sure they all right. (patient 17) |
Physician‐Patient Communication
Communication between the physician and the patient was an important element in patients' assessment of their experience. Patient's tended to divide physician‐patient communication into 2 categories: good communication, which consisted of open communication (patient 1) and patient engagement, and bad communication, which was described as physicians not sharing information or taking the time to explain the course of care in words that I'll understand (patient 2). Patients also described dissatisfaction with redundant communication between multiple hospitalists and the frustration of often having to describe their clinical course to multiple providers.
Transparency in Communication
The desire to have greater transparency in the handoff process was another common theme. This was likely due to the fact that 34/40 (85%) of surveyed patients were unaware that a service changeover had ever taken place. This lack of transparency was viewed to have further downstream consequences as patients stated that there should be a level of transparency, and when it's not, then there is always trust issues (patient 1). Upon further questioning as to how to make the process more transparent, many patients recommended a formalized, face‐to‐face introduction involving the patient and both hospitalists, in which the outgoing hospitalist would, bring you [oncoming hospitalist] in, and introduce you to me (patient 4).
Patients often stated that given the large spectrum of physicians they might encounter during their stay (ie, medical student, resident, hospitalist attending, subspecialty fellow, subspecialist attending), clearer definitions of physicians' roles are needed.
Hospitalist‐Specialist Communication
Concern about the communication between their hospitalist and subspecialist was another predominant theme. Conflicting and unclear directions from multiple services were especially frustrating, as a patient stated, One guy took me off this pill, the other guy wants me on that pill, I'm like okay, I can't do both (patient 8). Furthermore, a subset of patients referenced their subspecialist as their primary care provider and preferred their subspecialist for guidance in their hospital course, rather than their hospitalist. This often appeared in cases where the patient had an established relationship with the subspecialist prior to their hospitalization.
New Opportunities Due to Transition
Patients expressed positive feelings toward service handoffs by viewing the transition as an opportunity for medical reevaluation by a new physician. Patients told of instances in which a specific complaint was not being addressed by the first physician, but would be addressed by the second (oncoming) physician. A commonly expressed idea was that the oncoming physician might know something that he [Dr. B] didn't know, and since Dr. B was only here for a week, why not give him [oncoming hospitalist] a chance (patient 10). Patients would also describe the transition as an opportunity to form, and possibly improve, therapeutic alliances with a new hospitalist.
Bedside Manner
Bedside manner was another commonly mentioned thematic element. Patients were often quick to forget prior problems or issues that they may have suffered because of the transition if the oncoming physician was perceived to have a good bedside manner, often described as someone who formally introduced themselves, was considered relaxed, and would take the time to sit and talk with the patient. As a patient put it, [S]he sat down and got to know meand asked me what I wanted to do (patient 12). Conversely, patients described instances in which a perceived bad bedside manner led to a poor relationship between the physician and the patient, in which trust and comfort (patient 11) were sacrificed.
Indifference Toward Transition
In contrast to some of the previous findings, which called for improved interactions between physicians and patients, we also discovered a theme of indifference toward the transition. Several patients stated feelings of trust with the medical system, and were content with the service changeover as long as they felt that their medical needs were being met. Patients also tended to express a level of acceptance with the transition, and tended to believe that this was the price we pay for being here [in the hospital] (patient 7).
Conceptual Model
Following the collection and analysis of all patient responses, all themes were utilized to construct the ideal patient‐centered service handoff. The ideal transition describes open lines of communication between all involved parties, is facilitated by multiple modalities, such as the EHRs and nursing staff, and recognizes the patient as the primary stakeholder (Figure 1).
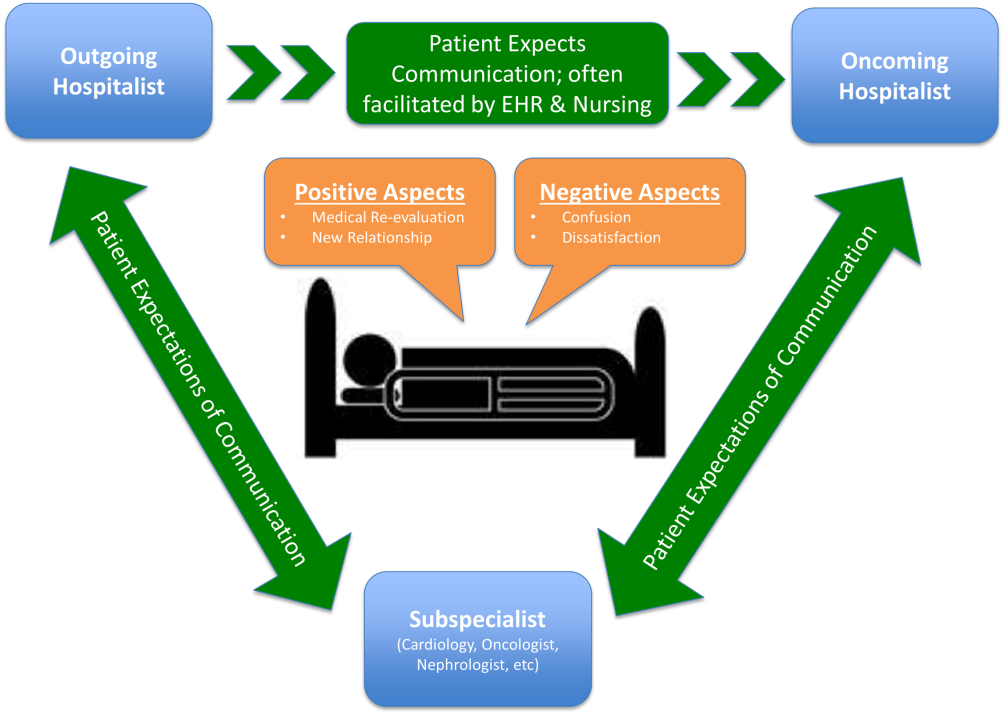
DISCUSSION
To our knowledge, this is the first qualitative investigation of the hospitalized patient's experience with service handoffs between hospitalists. The patient perspective adds a personal and first‐hand description of how fragmented care may impact the hospitalized patient experience.
Of the 6 themes, communication was found to be the most pertinent to our respondents. Because much of patient care is an inherently communicative activity, it is not surprising that patients, as well as patient safety experts, have focused on communication as an area in need of improvement in transition processes.[17, 18] Moreover, multiple medical societies have directly called for improvements within this area, and have specifically recommended clear and direct communication of treatment plans between the patient and physician, timely exchange of information, and knowledge of who is primarily in charge of the patients care.[11] Not surprisingly, each of these recommendations appears to be echoed by our participants. This theme is especially important given that good physician‐patient communication has been noted to be a major goal in achieving patient‐centered care, and has been positively correlated to medication adherence, patient satisfaction, and physical health outcomes.[19, 20, 21, 22, 23]
Although not a substitute for face‐to‐face interactions, other communication interventions between physicians and patients should be considered. For example, get to know me posters placed in patient rooms have been shown to encourage communication between patients and physicians.[24] Additionally, physician face cards have been used to improve patients' abilities to identify and clarify physicians' roles in patient care.[25] As a patient put it, If they got a new one [hospitalist], just as if I got a new medicationprint out information on themlike where they went to med school, and stuff(patient 13). These modalities may represent highly implementable, cost‐effective adjuncts to current handoff methods that may improve lines of communication between physicians and patients.
In addition to the importance placed on physician‐patient communication, interprofessional communication between hospitalists and subspecialists was also highly regarded. Studies have shown that practice‐based interprofessional communication, such as daily interdisciplinary rounds and the use of external facilitators, can improve healthcare processes and outcomes.[26] However, these interventions must be weighed with the many conflicting factors that both hospitalists and subspecialists face on daily basis, including high patient volumes, time limitations, patient availability, and scheduling conflicts.[27] None the less, the strong emphasis patients placed on this line of communication highlights this domain as an area in which hospitalist and subspecialist can work together for systematic improvement.
Patients also recognized the complexity of the transfer process between hospitalists and called for improved transparency. For example, patients repeatedly requested to be informed prior to any changes in their hospitalists, a request that remains consistent with current guidelines.[11] There also existed a strong desire for a more formalized process of transitioning between hospitalists, which often described a handoff procedure that would occur at the patient's bedside. This desire seems to be mirrored in the data that show that patients prefer to interact with their care team at the bedside and report higher satisfaction when they are involved with their care.[28, 29] Unfortunately, this desire for more direct interaction with physicians runs counter to the current paradigm of patient care, where most activities on rounds do not take place at the bedside.[30]
In contrast to patient's calls for improved transparency, an equally large portion of patients expressed relative indifference to the transition. Whereas on the surface this may seem salutary, some studies suggest that a lack of patient activation and engagement may have adverse effects toward patients' overall care.[31] Furthermore, others have shown evidence of better healthcare experiences, improved health outcomes, and lower costs in patients who are more active in their care.[30, 31] Altogether, this suggests that despite some patients' indifference, physicians should continue to engage patients in their hospital care.[32]
Although prevailing sentiments among patient safety advocates are that patient handoffs are inherently dangerous and place patients at increased risk of adverse events, patients did not always share this concern. A frequently occurring theme was that the transition is an opportunity for medical reevaluation or the establishment of a new, possibly improved therapeutic alliance. Recognizing this viewpoint offers oncoming hospitalists the opportunity to focus on issues that the patient may have felt were not being properly addressed with their prior physician.
Finally, although our conceptual model is not a strict guideline, we believe that any future studies should consider this framework when constructing interventions to improve service‐level handoffs. Several interventions already exist. For instance, educational interventions, such as patient‐centered interviewing, have been shown to improve patient satisfaction, compliance with medications, lead to fewer lawsuits, and improve health outcomes.[33, 34, 35] Additional methods of keeping the patient more informed include physician face sheets and performance of the handoff at the patient's bedside. Although well known in nursing literature, the idea of physicians performing handoffs at the patient's bedside is a particularly patient‐centric process.[36] This type of intervention may have the ability to transform the handoff from the current state of a 2‐way street, in which information is passed between 2 hospitalists, to a 3‐way stop, in which both hospitalists and the patient are able to communicate at this critical junction of care.
Although our study does offer new insight into the effects of discontinuous care, its exploratory nature does have limitations. First, being performed at a single academic center limits our ability to generalize our findings. Second, perspectives of those who did not wish to participate, patients' family members or caregivers, and those who were not queried, could highly differ from those we interviewed. Additionally, we did not collect data on patients' diagnoses or reason for admission, thus limiting our ability to assess if certain diagnosis or subpopulations predispose patients to experiencing a service handoff. Third, although our study was restricted to English‐speaking patients only, we must consider that non‐English speakers would likely suffer from even greater communication barriers than those who took part in our study. Finally, our interviews and data analysis were conducted by hospitalists, which could have subconsciously influenced the interview process, and the interpretation of patient responses. However, we tried to mitigate these issues by having the same individual interview all participants, by using an interview guide to ensure cross‐cohort consistency, by using open‐ended questions, and by attempting to give patients every opportunity to express themselves.
CONCLUSIONS
From a patients' perspective, inpatient service handoffs are often opaque experiences that are highlighted by poor communication between physicians and patients. Although deficits in communication and transparency acted as barriers to a patient‐centered handoff, physicians should recognize that service handoffs may also represent opportunities for improvement, and should focus on these domains when they start on a new service.
Disclosures
All funding for this project was provided by the Section of Hospital Medicine at The University of Chicago Medical Center. The data from this article were presented at the Society of Hospital Medicine Annual Conference, National Harbor, March 31, 2015, and at the Society of General Internal Medicine National Meeting in Toronto, Canada, April 23, 2015. The authors report that no conflicts of interest, financial or otherwise, exist.
- , , , , , . Continuity of outpatient and inpatient care by primary care physicians for hospitalized older adults. JAMA. 2009;301(16):1671–1680.
- , , , et al. Continuity of care and the risk of preventable hospitalization in older adults. JAMA Intern Med. 2013;173(20):1879–1885.
- Agency for Healthcare Research and Quality. HCUPnet: a tool for identifying, tracking, and analyzing national hospital statistics. Available at: http://hcupnet.ahrq.gov/HCUPnet.jsp?Id=82B37DA366A36BAD6(8):438–444.
- , , , , , . Hospitalist handoffs: a systematic review and task force recommendations. J Hosp Med. 2009;4(7):433–440.
- , , , , . The impact of fragmentation of hospitalist care on length of stay. J Hosp Med. 2010;5(6):335–338.
- , , , et al. The impact of hospitalist discontinuity on hospital cost, readmissions, and patient satisfaction. J Gen Intern Med. 2014;29(7):1004–1008.
- , , , et al. The effect of hospitalist discontinuity on adverse events. J Hosp Med. 2015;10(3):147–151.
- Agency for Healthcare Research and Quality. HCAHPS Fact Sheet. CAHPS Hospital Survey August 2013. Available at: http://www.hcahpsonline.org/files/August_2013_HCAHPS_Fact_Sheet3.pdf. Accessed February 2, 2015.
- , , , et al. A conceptual framework for studying the safety of transitions in emergency care. In: Henriksen K, Battles JB, Marks ES, eds. Advances in Patient Safety: From Research to Implementation. Rockville, MD: Agency for Healthcare Research and Quality; 2005:309–321. Concepts and Methodology; vol 2. Available at: http://www.ncbi.nlm.nih.gov/books/NBK20522. Accessed January 15, 2015.
- , , , et al. Transitions of care consensus policy statement American College of Physicians‐Society of General Internal Medicine‐Society of Hospital Medicine‐American Geriatrics Society‐American College of Emergency Physicians‐Society of Academic Emergency Medicine. J Gen Intern Med. 2009;24(8):971–976.
- , . Grounded theory in medical education research: AMEE guide no. 70. Med Teach. 2012;34(10):850–861.
- . A purposeful approach to the constant comparative method in the analysis of qualitative interviews. Qual Quant. 2002;36(4):391–409.
- . The significance of saturation. Qual Health Res. 1995;5(2):147–149.
- , , , , . Standards for reporting qualitative research: a synthesis of recommendations. Acad Med. 2014;89(9):1245–1251.
- , , . Consolidated criteria for reporting qualitative research (COREQ): a 32‐item checklist for interviews and focus groups. Int J Qual Health Care. 2007;19(6):349–357.
- , , , . Promoting effective transitions of care at hospital discharge: a review of key issues for hospitalists. J Hosp Med. 2007;2(5):314–323.
- The Joint Commission. Hot Topics in Healthcare, Issue 2. Transitions of care: the need for collaboration across entire care continuum. Available at: http://www.jointcommission.org/assets/1/6/TOC_Hot_Topics.pdf. Accessed April 9, 2015.
- , . Physician communication and patient adherence to treatment: a meta‐analysis. Med Care. 2009;47(8):826–834.
- , . Impediments to adherence to post myocardial infarction medications. Curr Cardiol Rep. 2013;15(1):322.
- , , , , . Medical specialists' patient‐centered communication and patient‐reported outcomes. Med Care. 2007;45(4):330–339.
- , , , . Does doctor‐patient communication affect patient satisfaction with hospital care? Results of an analysis with a novel instrumental variable. Health Serv Res. 2008;43(5 pt 1):1505–1519.
- , , . Patient‐centredness in chronic illness: what is it and does it matter? Patient Educ Couns. 2003;51(3):197–206.
- , , , et al. Merging cultures: palliative care specialists in the medical intensive care unit. Crit Care Med. 2006;34(11 suppl):S388–S393.
- , , , et al. Improving inpatients' identification of their doctors: use of FACE cards. Jt Comm J Qual Patient Saf. 2009;35(12):613–619.
- , , . Interprofessional collaboration: effects of practice‐based interventions on professional practice and healthcare outcomes. Cochrane Database Syst Rev. 2009;(3):CD000072.
- , , , et al. Identifying and overcoming the barriers to bedside rounds: a multicenter qualitative study. Acad Med. 2014;89(2):326–334.
- , , , , . The effect of bedside case presentations on patients' perceptions of their medical care. N Engl J Med. 1997;336(16):1150–1155.
- , , , . Patient‐centered interprofessional collaborative care: factors associated with bedside interprofessional rounds. J Gen Intern Med. 2014;29(7):1040–1047.
- , , , et al. Attending rounds in the current era: what is and is not happening. JAMA Intern Med. 2013;173(12):1084–1089.
- , . What the evidence shows about patient activation: better health outcomes and care experiences; fewer data on costs. Health Aff (Millwood). 2013;32(2):207–214.
- , , , , . When patient activation levels change, health outcomes and costs change, too. Health Aff Proj Hope. 2015;34(3):431–437.
- , , , et al. Evidence‐based guidelines for teaching patient‐centered interviewing. Patient Educ Couns. 2000;39(1):27–36.
- , , . Meta‐analysis of correlates of provider behavior in medical encounters. Med Care. 1988;26(7):657–675.
- , . Characteristics of potential plaintiffs in malpractice litigation. Ann Intern Med. 1994;120(9):792–798.
- , , , , . Bedside shift reports: what does the evidence say? J Nurs Adm. 2014;44(10):541–545.
Studies examining the importance of continuity of care have shown that patients who maintain a continuous relationship with a single physician have improved outcomes.[1, 2] However, most of these studies were performed in the outpatient, rather than the inpatient setting. With over 35 million patients admitted to hospitals in 2013, along with the significant increase in hospital discontinuity over recent years, the impact of inpatient continuity of care on quality outcomes and patient satisfaction is becoming increasingly relevant.[3, 4]
Service handoffs, when a physician hands over treatment responsibility for a panel of patients and is not expected to return, are a type of handoff that contributes to inpatient discontinuity. In particular, service handoffs between hospitalists are an especially common and inherently risky type of transition, as there is a severing of an established relationship during a patient's hospitalization. Unfortunately, due to the lack of evidence on the effects of service handoffs, current guidelines are limited in their recommendations.[5] Whereas several recent studies have begun to explore the effects of these handoffs, no prior study has examined this issue from a patient's perspective.[6, 7, 8]
Patients are uniquely positioned to inform us about their experiences in care transitions. Furthermore, with patient satisfaction now affecting Medicare reimbursement rates, patient experiences while in the hospital are becoming even more significant.[9] Despite this emphasis toward more patient‐centered care, no study has explored the hospitalized patient's experience with hospitalist service handoffs. Our goal was to qualitatively assess the hospitalized patients' experiences with transitions between hospitalists to develop a conceptual model to inform future work on improving inpatient transitions of care.
METHODS
Sampling and Recruitment
We conducted bedside interviews of hospitalized patients at an urban academic medical center from October 2014 through December 2014. The hospitalist service consists of a physician and an advanced nurse practitioner (ANP) who divide a panel of patients that consist of general medicine and subspecialty patients who are often comanaged with hepatology, oncology, and nephrology subspecialists. We performed a purposive selection of patients who could potentially comment on their experience with a hospitalist service transition using the following method: 48 hours after a service handoff (ie, an outgoing physician completing 1 week on service, then transfers the care of the patient to a new oncoming hospitalist), oncoming hospitalists were approached and asked if any patient on their service had experienced a service handoff and still remained in the hospital. A 48‐hour time period was chosen to give the patients time to familiarize themselves with their new hospitalist, allowing them to properly comment on the handoff. Patients who were managed by the ANP, who were non‐English speaking, or who were deemed to have an altered mental status based on clinical suspicion by the interviewing physician (C.M.W.) were excluded from participation. Following each weekly service transition, a list of patients who met the above criteria was collected from 4 nonteaching hospitalist services, and were approached by the primary investigator (C.M.W.) and asked if they would be willing to participate. All patients were general medicine patients and no exclusions were made based on physical location within the hospital. Those who agreed provided signed written consent prior to participation to allow access to the electronic health records (EHRs) by study personnel.
Data Collection
Patients were administered a 9‐question, semistructured interview that was informed by expert opinion and existing literature, which was developed to elicit their perspective regarding their transition between hospitalists.[10, 11] No formal changes were made to the interview guide during the study period, and all patients were asked the same questions. Outcomes from interim analysis guided further questioning in subsequent interviews so as to increase the depth of patient responses (ie, Can you explain your response in greater depth?). Prior to the interview, patients were read a description of a hospitalist, and were reminded which hospitalists had cared for them during their stay (see Supporting Information, Appendix 1, in the online version of this article). If family members or a caregiver were present at the time of interview, they were asked not to comment. No repeat interviews were carried out.
All interviews were performed privately in single‐occupancy rooms, digitally recorded using an iPad (Apple, Cupertino, CA) and professionally transcribed verbatim (Rev, San Francisco, CA). All analysis was performed using MAXQDA Software (VERBI Software GmbH, Berlin, Germany). We obtained demographic information about each patient through chart review
Data Analysis
Grounded theory was utilized, with an inductive approach with no a priori hypothesis.[12] The constant comparative method was used to generate emerging and reoccurring themes.[13] Units of analysis were sentences and phrases. Our research team consisted of 4 academic hospitalists, 2 with backgrounds in clinical medicine, medical education, and qualitative analysis (J.M.F., V.M.A.), 1 as a clinician (C.M.W.), and 1 in health economics (D.O.M.). Interim analysis was performed on a weekly basis (C.M.W.), during which time a coding template was created and refined through an iterative process (C.M.W., J.M.F.). All disagreements in coded themes were resolved through group discussion until full consensus was reached. Each week, responses were assessed for thematic saturation.[14] Interviews were continued if new themes arose during this analysis. Data collection was ended once we ceased to extract new topics from participants. A summary of all themes was then presented to a group of 10 patients who met the same inclusion criteria for respondent validation and member checking. All reporting was performed within the Standards for Reporting Qualitative Research, with additional guidance derived from the Consolidated Criteria for Reporting Qualitative Research.[15, 16] The University of Chicago Institutional Review Board approved this protocol.
RESULTS
In total, 43 eligible patients were recruited, and 40 (93%) agreed to participate. Interviewed patients were between 51 and 65 (39%) years old, had a mean age of 54.5 (15) years, were predominantly female (65%), African American (58%), had a median length of stay at the time of interview of 6.5 days (interquartile range [IQR]: 48), and had an average of 2.0 (IQR: 13) hospitalists oversee their care at the time of interview (Table 1). Interview times ranged from 10:25 to 25:48 minutes, with an average of 15:32 minutes.
| Value | |
|---|---|
| |
| Response rate, n (%) | 40/43 (93) |
| Age, mean SD | 54.5 15 |
| Sex, n (%) | |
| Female | 26 (65) |
| Male | 14 (35) |
| Race, n (%) | |
| African American | 23 (58) |
| White | 16 (40) |
| Hispanic | 1 (2) |
| Median LOS at time of interview, d (IQR) | 6.5 (48) |
| Median no. of hospitalists at time of interview, n (IQR) | 2.0 (13) |
We identified 6 major themes on patient perceptions of hospitalist service handoffs including (1) physician‐patient communication, (2) transparency in the hospitalist transition process, (3) indifference toward the hospitalist transition, (4) hospitalist‐subspecialist communication, (5) recognition of new opportunities due to a transition, and (6) hospitalists' bedside manner (Table 2).
| Themes | Subthemes | Representative Quotes |
|---|---|---|
| Physician‐patient communication | Patients dislike redundant communication with oncoming hospitalist. | I mean it's just you always have to explain your situation over and over and over again. (patient 14) |
| When I said it once already, then you're repeating it to another doctor. I feel as if that hospitalist didn't talk to the other hospitalist. (patient 7) | ||
| Poor communication can negatively affect the doctor‐patient relationship. | They don't really want to explain things. They don't think I'll understand. I think & yeah, I'm okay. You don't even have to put it in layman's terms. I know medical. I'm in nursing school. I have a year left. But even if you didn't know that, I would still hope you would try to tell me what was going on instead of just doing it in your head, and treating it. (patient 2) | |
| I mean it's just you always have to explain your situation over and over and over again. After a while you just stop trusting them. (patient 20) | ||
| Good communication can positively affect the doctor‐patient relationship. | Just continue with the communication, the open communication, and always stress to me that I have a voice and just going out of their way to do whatever they can to help me through whatever I'm going through. (patient 1) | |
| Transparency in transition | Patients want to be informed prior to a service changeover. | I think they should be told immediately, even maybe given prior notice, like this may happen, just so you're not surprised when it happens. (patient 15) |
| When the doctor approached me, he let me know that he wasn't going to be here the next day and there was going to be another doctor coming in. That made me feel comfortable. (patient 9) | ||
| Patients desire a more formalized process in the service changeover. | People want things to be consistent. People don't like change. They like routine. So, if he's leaving, you're coming on, I'd like for him to bring you in, introduce you to me, and for you just assure me that I'll take care of you. (patient 4) | |
| Just like when you get a new medication, you're given all this information on it. So when you get a new hospitalist, shouldn't I get all the information on them? Like where they went to school, what they look like. (patient 23) | ||
| Patients want clearer definition of the roles the physicians will play in their care. | The first time I was hospitalized for the first time I had all these different doctors coming in, and I had the residency, and the specialists, and the department, and I don't know who's who. What I asked them to do is when they come in the room, which they did, but introduce it a little more for me. Write it down like these are the special team and these are the doctors because even though they come in and give me their name, I have no idea what they're doing. (patient 5) | |
| Someone should explain the setup and who people are. Someone would say, Okay when you're in a hospital this is your [doctor's] role. Like they should have booklets and everything. (patient 19) | ||
| Indifference toward transition | Many patients have trust in service changeovers. | [S]o as long as everybody's on board and communicates well and efficiently, I don't have a problem with it. (patient 6) |
| To me, it really wasn't no preference, as long as I was getting the care that I needed. (patient 21) | ||
| It's not a concern as long as they're on the same page. (patient 17) | ||
| Hospitalist‐specialist communication | Patients are concerned about communication between their hospitalist and their subspecialists. | The more cooks you get in the kitchen, the more things get to get lost, so I'm always concerned that they're not sharing the same information, especially when you're getting asked the same questions that you might have just answered the last hour ago. (patient 9) |
| I don't know if the hospitalist are talking to them [subspecialist]. They haven't got time. (patient 35) | ||
| Patients place trust in the communication between hospitalist and subspecialist. | I think among the teams themselveswhich is my pain doctor, Dr. K's group, the oncology group itself, they switch off and trade with each other and they all speak the same language so that works out good. (patient 3) | |
| Lack of interprofessional communication can lead to patient concern. | I was afraid that one was going to drop the ball on something and not pass something on, or you know. (patient 11) | |
| I had numerous doctors who all seemed to not communicate with each other at all or did so by email or whatever. They didn't just sit down together and say we feel this way and we feel that way. I didn't like that at all. (patient 10) | ||
| New opportunities due to transition | Patients see new doctor as opportunity for medical reevaluation. | I see it as two heads are better than one, three heads are better than one, four heads are better than one. When people put their heads together to work towards a common goal, especially when they're, you know, people working their craft, it can't be bad. (patient 9) |
| I finally got my ears looked atbecause I've asked to have my ears looked at since Mondayand the new doc is trying to make an effort to look at them. (patient 39) | ||
| Patients see service changeover as an opportunity to form a better personal relationship. | Having a new hospitalist it gives you opportunity for a new beginning. (patient 11) | |
| Bedside manner | Good bedside manner can assist in a service changeover. | Some of them are all business‐like but some of them are, Well how do you feel today? Hi, how are you? So this made a little difference. You feel more comfortable. You're going to be more comfortable with them. Their bedside manner helps. (patient 16) |
| It's just like when a doctor sits down and talks to you, they just seem more relaxed and more .... I know they're very busy and they have lots of things to do and other patients to see, but while they're in there with you, you know, you don't get too much time with them. So bedside manner is just so important. (patient 24) | ||
| Poor bedside manner can be detrimental in transition. | [B]ecause they be so busy they claim they don't have time just to sit and talk to a patient, and make sure they all right. (patient 17) |
Physician‐Patient Communication
Communication between the physician and the patient was an important element in patients' assessment of their experience. Patient's tended to divide physician‐patient communication into 2 categories: good communication, which consisted of open communication (patient 1) and patient engagement, and bad communication, which was described as physicians not sharing information or taking the time to explain the course of care in words that I'll understand (patient 2). Patients also described dissatisfaction with redundant communication between multiple hospitalists and the frustration of often having to describe their clinical course to multiple providers.
Transparency in Communication
The desire to have greater transparency in the handoff process was another common theme. This was likely due to the fact that 34/40 (85%) of surveyed patients were unaware that a service changeover had ever taken place. This lack of transparency was viewed to have further downstream consequences as patients stated that there should be a level of transparency, and when it's not, then there is always trust issues (patient 1). Upon further questioning as to how to make the process more transparent, many patients recommended a formalized, face‐to‐face introduction involving the patient and both hospitalists, in which the outgoing hospitalist would, bring you [oncoming hospitalist] in, and introduce you to me (patient 4).
Patients often stated that given the large spectrum of physicians they might encounter during their stay (ie, medical student, resident, hospitalist attending, subspecialty fellow, subspecialist attending), clearer definitions of physicians' roles are needed.
Hospitalist‐Specialist Communication
Concern about the communication between their hospitalist and subspecialist was another predominant theme. Conflicting and unclear directions from multiple services were especially frustrating, as a patient stated, One guy took me off this pill, the other guy wants me on that pill, I'm like okay, I can't do both (patient 8). Furthermore, a subset of patients referenced their subspecialist as their primary care provider and preferred their subspecialist for guidance in their hospital course, rather than their hospitalist. This often appeared in cases where the patient had an established relationship with the subspecialist prior to their hospitalization.
New Opportunities Due to Transition
Patients expressed positive feelings toward service handoffs by viewing the transition as an opportunity for medical reevaluation by a new physician. Patients told of instances in which a specific complaint was not being addressed by the first physician, but would be addressed by the second (oncoming) physician. A commonly expressed idea was that the oncoming physician might know something that he [Dr. B] didn't know, and since Dr. B was only here for a week, why not give him [oncoming hospitalist] a chance (patient 10). Patients would also describe the transition as an opportunity to form, and possibly improve, therapeutic alliances with a new hospitalist.
Bedside Manner
Bedside manner was another commonly mentioned thematic element. Patients were often quick to forget prior problems or issues that they may have suffered because of the transition if the oncoming physician was perceived to have a good bedside manner, often described as someone who formally introduced themselves, was considered relaxed, and would take the time to sit and talk with the patient. As a patient put it, [S]he sat down and got to know meand asked me what I wanted to do (patient 12). Conversely, patients described instances in which a perceived bad bedside manner led to a poor relationship between the physician and the patient, in which trust and comfort (patient 11) were sacrificed.
Indifference Toward Transition
In contrast to some of the previous findings, which called for improved interactions between physicians and patients, we also discovered a theme of indifference toward the transition. Several patients stated feelings of trust with the medical system, and were content with the service changeover as long as they felt that their medical needs were being met. Patients also tended to express a level of acceptance with the transition, and tended to believe that this was the price we pay for being here [in the hospital] (patient 7).
Conceptual Model
Following the collection and analysis of all patient responses, all themes were utilized to construct the ideal patient‐centered service handoff. The ideal transition describes open lines of communication between all involved parties, is facilitated by multiple modalities, such as the EHRs and nursing staff, and recognizes the patient as the primary stakeholder (Figure 1).
DISCUSSION
To our knowledge, this is the first qualitative investigation of the hospitalized patient's experience with service handoffs between hospitalists. The patient perspective adds a personal and first‐hand description of how fragmented care may impact the hospitalized patient experience.
Of the 6 themes, communication was found to be the most pertinent to our respondents. Because much of patient care is an inherently communicative activity, it is not surprising that patients, as well as patient safety experts, have focused on communication as an area in need of improvement in transition processes.[17, 18] Moreover, multiple medical societies have directly called for improvements within this area, and have specifically recommended clear and direct communication of treatment plans between the patient and physician, timely exchange of information, and knowledge of who is primarily in charge of the patients care.[11] Not surprisingly, each of these recommendations appears to be echoed by our participants. This theme is especially important given that good physician‐patient communication has been noted to be a major goal in achieving patient‐centered care, and has been positively correlated to medication adherence, patient satisfaction, and physical health outcomes.[19, 20, 21, 22, 23]
Although not a substitute for face‐to‐face interactions, other communication interventions between physicians and patients should be considered. For example, get to know me posters placed in patient rooms have been shown to encourage communication between patients and physicians.[24] Additionally, physician face cards have been used to improve patients' abilities to identify and clarify physicians' roles in patient care.[25] As a patient put it, If they got a new one [hospitalist], just as if I got a new medicationprint out information on themlike where they went to med school, and stuff(patient 13). These modalities may represent highly implementable, cost‐effective adjuncts to current handoff methods that may improve lines of communication between physicians and patients.
In addition to the importance placed on physician‐patient communication, interprofessional communication between hospitalists and subspecialists was also highly regarded. Studies have shown that practice‐based interprofessional communication, such as daily interdisciplinary rounds and the use of external facilitators, can improve healthcare processes and outcomes.[26] However, these interventions must be weighed with the many conflicting factors that both hospitalists and subspecialists face on daily basis, including high patient volumes, time limitations, patient availability, and scheduling conflicts.[27] None the less, the strong emphasis patients placed on this line of communication highlights this domain as an area in which hospitalist and subspecialist can work together for systematic improvement.
Patients also recognized the complexity of the transfer process between hospitalists and called for improved transparency. For example, patients repeatedly requested to be informed prior to any changes in their hospitalists, a request that remains consistent with current guidelines.[11] There also existed a strong desire for a more formalized process of transitioning between hospitalists, which often described a handoff procedure that would occur at the patient's bedside. This desire seems to be mirrored in the data that show that patients prefer to interact with their care team at the bedside and report higher satisfaction when they are involved with their care.[28, 29] Unfortunately, this desire for more direct interaction with physicians runs counter to the current paradigm of patient care, where most activities on rounds do not take place at the bedside.[30]
In contrast to patient's calls for improved transparency, an equally large portion of patients expressed relative indifference to the transition. Whereas on the surface this may seem salutary, some studies suggest that a lack of patient activation and engagement may have adverse effects toward patients' overall care.[31] Furthermore, others have shown evidence of better healthcare experiences, improved health outcomes, and lower costs in patients who are more active in their care.[30, 31] Altogether, this suggests that despite some patients' indifference, physicians should continue to engage patients in their hospital care.[32]
Although prevailing sentiments among patient safety advocates are that patient handoffs are inherently dangerous and place patients at increased risk of adverse events, patients did not always share this concern. A frequently occurring theme was that the transition is an opportunity for medical reevaluation or the establishment of a new, possibly improved therapeutic alliance. Recognizing this viewpoint offers oncoming hospitalists the opportunity to focus on issues that the patient may have felt were not being properly addressed with their prior physician.
Finally, although our conceptual model is not a strict guideline, we believe that any future studies should consider this framework when constructing interventions to improve service‐level handoffs. Several interventions already exist. For instance, educational interventions, such as patient‐centered interviewing, have been shown to improve patient satisfaction, compliance with medications, lead to fewer lawsuits, and improve health outcomes.[33, 34, 35] Additional methods of keeping the patient more informed include physician face sheets and performance of the handoff at the patient's bedside. Although well known in nursing literature, the idea of physicians performing handoffs at the patient's bedside is a particularly patient‐centric process.[36] This type of intervention may have the ability to transform the handoff from the current state of a 2‐way street, in which information is passed between 2 hospitalists, to a 3‐way stop, in which both hospitalists and the patient are able to communicate at this critical junction of care.
Although our study does offer new insight into the effects of discontinuous care, its exploratory nature does have limitations. First, being performed at a single academic center limits our ability to generalize our findings. Second, perspectives of those who did not wish to participate, patients' family members or caregivers, and those who were not queried, could highly differ from those we interviewed. Additionally, we did not collect data on patients' diagnoses or reason for admission, thus limiting our ability to assess if certain diagnosis or subpopulations predispose patients to experiencing a service handoff. Third, although our study was restricted to English‐speaking patients only, we must consider that non‐English speakers would likely suffer from even greater communication barriers than those who took part in our study. Finally, our interviews and data analysis were conducted by hospitalists, which could have subconsciously influenced the interview process, and the interpretation of patient responses. However, we tried to mitigate these issues by having the same individual interview all participants, by using an interview guide to ensure cross‐cohort consistency, by using open‐ended questions, and by attempting to give patients every opportunity to express themselves.
CONCLUSIONS
From a patients' perspective, inpatient service handoffs are often opaque experiences that are highlighted by poor communication between physicians and patients. Although deficits in communication and transparency acted as barriers to a patient‐centered handoff, physicians should recognize that service handoffs may also represent opportunities for improvement, and should focus on these domains when they start on a new service.
Disclosures
All funding for this project was provided by the Section of Hospital Medicine at The University of Chicago Medical Center. The data from this article were presented at the Society of Hospital Medicine Annual Conference, National Harbor, March 31, 2015, and at the Society of General Internal Medicine National Meeting in Toronto, Canada, April 23, 2015. The authors report that no conflicts of interest, financial or otherwise, exist.
- , , , , , . Continuity of outpatient and inpatient care by primary care physicians for hospitalized older adults. JAMA. 2009;301(16):1671–1680.
- , , , et al. Continuity of care and the risk of preventable hospitalization in older adults. JAMA Intern Med. 2013;173(20):1879–1885.
- Agency for Healthcare Research and Quality. HCUPnet: a tool for identifying, tracking, and analyzing national hospital statistics. Available at: http://hcupnet.ahrq.gov/HCUPnet.jsp?Id=82B37DA366A36BAD6(8):438–444.
- , , , , , . Hospitalist handoffs: a systematic review and task force recommendations. J Hosp Med. 2009;4(7):433–440.
- , , , , . The impact of fragmentation of hospitalist care on length of stay. J Hosp Med. 2010;5(6):335–338.
- , , , et al. The impact of hospitalist discontinuity on hospital cost, readmissions, and patient satisfaction. J Gen Intern Med. 2014;29(7):1004–1008.
- , , , et al. The effect of hospitalist discontinuity on adverse events. J Hosp Med. 2015;10(3):147–151.
- Agency for Healthcare Research and Quality. HCAHPS Fact Sheet. CAHPS Hospital Survey August 2013. Available at: http://www.hcahpsonline.org/files/August_2013_HCAHPS_Fact_Sheet3.pdf. Accessed February 2, 2015.
- , , , et al. A conceptual framework for studying the safety of transitions in emergency care. In: Henriksen K, Battles JB, Marks ES, eds. Advances in Patient Safety: From Research to Implementation. Rockville, MD: Agency for Healthcare Research and Quality; 2005:309–321. Concepts and Methodology; vol 2. Available at: http://www.ncbi.nlm.nih.gov/books/NBK20522. Accessed January 15, 2015.
- , , , et al. Transitions of care consensus policy statement American College of Physicians‐Society of General Internal Medicine‐Society of Hospital Medicine‐American Geriatrics Society‐American College of Emergency Physicians‐Society of Academic Emergency Medicine. J Gen Intern Med. 2009;24(8):971–976.
- , . Grounded theory in medical education research: AMEE guide no. 70. Med Teach. 2012;34(10):850–861.
- . A purposeful approach to the constant comparative method in the analysis of qualitative interviews. Qual Quant. 2002;36(4):391–409.
- . The significance of saturation. Qual Health Res. 1995;5(2):147–149.
- , , , , . Standards for reporting qualitative research: a synthesis of recommendations. Acad Med. 2014;89(9):1245–1251.
- , , . Consolidated criteria for reporting qualitative research (COREQ): a 32‐item checklist for interviews and focus groups. Int J Qual Health Care. 2007;19(6):349–357.
- , , , . Promoting effective transitions of care at hospital discharge: a review of key issues for hospitalists. J Hosp Med. 2007;2(5):314–323.
- The Joint Commission. Hot Topics in Healthcare, Issue 2. Transitions of care: the need for collaboration across entire care continuum. Available at: http://www.jointcommission.org/assets/1/6/TOC_Hot_Topics.pdf. Accessed April 9, 2015.
- , . Physician communication and patient adherence to treatment: a meta‐analysis. Med Care. 2009;47(8):826–834.
- , . Impediments to adherence to post myocardial infarction medications. Curr Cardiol Rep. 2013;15(1):322.
- , , , , . Medical specialists' patient‐centered communication and patient‐reported outcomes. Med Care. 2007;45(4):330–339.
- , , , . Does doctor‐patient communication affect patient satisfaction with hospital care? Results of an analysis with a novel instrumental variable. Health Serv Res. 2008;43(5 pt 1):1505–1519.
- , , . Patient‐centredness in chronic illness: what is it and does it matter? Patient Educ Couns. 2003;51(3):197–206.
- , , , et al. Merging cultures: palliative care specialists in the medical intensive care unit. Crit Care Med. 2006;34(11 suppl):S388–S393.
- , , , et al. Improving inpatients' identification of their doctors: use of FACE cards. Jt Comm J Qual Patient Saf. 2009;35(12):613–619.
- , , . Interprofessional collaboration: effects of practice‐based interventions on professional practice and healthcare outcomes. Cochrane Database Syst Rev. 2009;(3):CD000072.
- , , , et al. Identifying and overcoming the barriers to bedside rounds: a multicenter qualitative study. Acad Med. 2014;89(2):326–334.
- , , , , . The effect of bedside case presentations on patients' perceptions of their medical care. N Engl J Med. 1997;336(16):1150–1155.
- , , , . Patient‐centered interprofessional collaborative care: factors associated with bedside interprofessional rounds. J Gen Intern Med. 2014;29(7):1040–1047.
- , , , et al. Attending rounds in the current era: what is and is not happening. JAMA Intern Med. 2013;173(12):1084–1089.
- , . What the evidence shows about patient activation: better health outcomes and care experiences; fewer data on costs. Health Aff (Millwood). 2013;32(2):207–214.
- , , , , . When patient activation levels change, health outcomes and costs change, too. Health Aff Proj Hope. 2015;34(3):431–437.
- , , , et al. Evidence‐based guidelines for teaching patient‐centered interviewing. Patient Educ Couns. 2000;39(1):27–36.
- , , . Meta‐analysis of correlates of provider behavior in medical encounters. Med Care. 1988;26(7):657–675.
- , . Characteristics of potential plaintiffs in malpractice litigation. Ann Intern Med. 1994;120(9):792–798.
- , , , , . Bedside shift reports: what does the evidence say? J Nurs Adm. 2014;44(10):541–545.

A Retrospective Analysis of Hemostatic Techniques in Primary Total Knee Arthroplasty: Traditional Electrocautery, Bipolar Sealer, and Argon Beam Coagulation
Total knee arthroplasty (TKA) is a reliable and successful treatment for end-stage degenerative joint disease of the knee. Given the reproducibility of its generally excellent outcomes, TKA is increasingly being performed.1 However, the potential complications of this procedure can be devastating.2-4 The arthroplasty literature has shed light on the detrimental effects of postoperative blood loss and anemia.5,6 In addition, the increase in transfusion burden among patients is not without risk.7 Given these concerns, surgeons have been tasked with determining the ideal methods for minimizing blood transfusions and postoperative hematomas and anemia. Several strategies have been described.8-11 Hemostasis can be achieved with use of intravenous medications, intra-articular agents, or electrocautery devices. Electrocautery technologies include traditional electrocautery (TE), saline-coupled bipolar sealer (BS), and argon beam coagulation (ABC). There is controversy as to whether outcomes are better with one hemostasis method over another and whether these methods are worth the additional cost.
In traditional (Bovie) electrocautery, a unipolar device delivers an electrical current to tissues through a pencil-like instrument. Intraoperative tissue temperatures can exceed 400°C.12 In BS, radiofrequency energy is delivered through a saline medium, which increases the contact area, acts as an electrode, and maintains a cooler environment during electrocautery. Proposed advantages are reduced tissue destruction and absence of smoke.12 There is evidence both for10,12-16 and against17-20 use of BS in total joint arthroplasty. ABC, a novel hemostasis method, has been studied in the context of orthopedics21,22 but not TKA specifically. ABC establishes a monopolar electric circuit between a handheld device and the target tissues by channeling electrons through ionized argon gas. Hemostasis is achieved through thermal coagulation. Tissue penetration can be adjusted by changing power, probe-to-target distance, and duration of use.23 We conducted a study to assess the efficacy of all 3 electrocautery methods during TKA. We hypothesized the 3 methods would be clinically equivalent with respect to estimated blood loss (EBL), 48-hour wound drainage, operative time, and change from preoperative hemoglobin (Hb) level.
Methods
We conducted a retrospective cohort study of consecutive primary TKAs performed by Dr. Levine between October 2010 and November 2011. Patients were identified by querying an internal database. Exclusion criteria were prior ipsilateral open knee procedure, prior fracture, nonuse of our standard hemostatic protocol, and either tourniquet time under 40 minutes or intraoperative documentation of tourniquet failure. As only 9 patients were initially identified for the TE cohort, the same database was used to add 32 patients treated between April 2009 and October 2009 (before our institution began using BS and ABC).
Clinical charts were reviewed, and baseline demographics (age, body mass index [BMI], preoperative Hb level) were abstracted, as were outcome metrics (EBL, 48-hour wound drainage, operative time, postoperative transfusions, adverse events (AEs) before discharge, and change in Hb level from before surgery to after surgery, in recovery room and on discharge). Statistical analyses were performed with JMP Version 10.0.0 (SAS Institute). Given the hypothesis that the 3 hemostasis methods would be clinically equivalent, 2 one-sided tests (TOSTs) of equivalence were performed with an α of 0.05. With TOST, the traditional null and alternative hypotheses are reversed; thus, P < .05 identifies statistical equivalence. The advantage of this study design is that equivalence can be identified, whereas traditional study designs can identify only a lack of statistical difference.24 We used our consensus opinions to set clinical insignificance thresholds for EBL (150 mL), wound drainage (150 mL), decrease from postoperative Hb level (1 g/dL), and operative time (10 minutes). Patients who received a blood transfusion were subsequently excluded from analysis in order to avoid skewing Hb-level depreciation calculations. Analysis of variance (ANOVA) and χ2 tests were used to compare preoperative variables, transfusion requirements, hospital length of stay, and AE rates by hemostasis type.
Cautery Technique
In all cases, TE was used for surgical dissection, which followed a standard midvastus approach. Then, for meniscal excision, the capsule and meniscal attachment sites were treated with TE, BS, or ABC. During cement hardening, an available supplemental cautery option was used to achieve hemostasis of the suprapatellar fat pad and visible meniscal attachment sites. All other aspects of the procedure and the postoperative protocols—including the anticoagulation and rapid rehabilitation (early ambulation and therapy) protocols—were similar for all patients. The standard anticoagulation protocol was to use low-molecular-weight heparin, unless contraindicated. Tranexamic acid was not used at our institution during the study period.
Results
For the study period, 280 cases (41 TE, 203 BS, 36 ABC) met the inclusion criteria. Of the 280 TKAs, 261 (93.21%) were performed for degenerative arthritis. There was no statistically significant difference among cohorts in indication (χ2 = 1.841, P = .398) or sex (χ2 = 1.176, P= .555).
Table 1 lists the cohorts’ baseline demographics (mean age, BMI, preoperative Hb level) and comparative ANOVA results. TOSTs of equivalence were performed to compare operative time, EBL, 48-hour wound drainage, and postoperative Hb-level depreciation among hemostasis types. Changes in Hb level were calculated for the immediate postoperative period and time of discharge (Table 2). ANOVA of hospital length of stay demonstrated no significant difference in means among groups (P = .09).
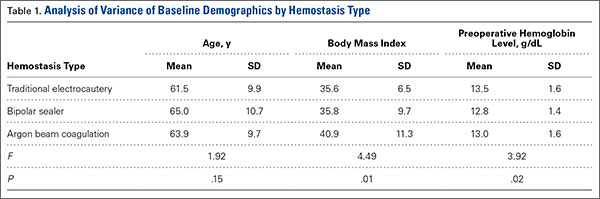
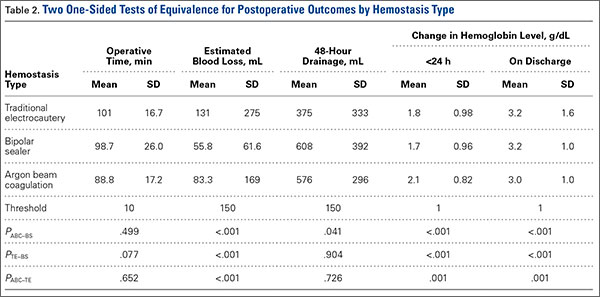
The cohorts were compared with respect to use of postoperative transfusions and incidence of postoperative AEs (Table 3). The TE cohort did not have any AEs. Of the 203 BS patients, 14 (7%) had 1 or more AEs, which included acute kidney injury (3 cases), electrolyte disturbance (3), urinary tract infection (2), oxygen desaturation (2), altered mental status (1), pneumonia (1), arrhythmia (1), congestive heart failure exacerbation (1), dehiscence (1), pulmonary embolism (2), and hypotension (1). Of the 36 ABC patients, 1 (3%) had arrhythmia, pneumonia, sepsis, and altered mental status.
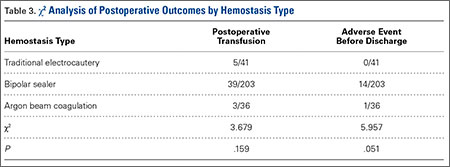
Discussion
With the population aging, the demand for TKA is greater than ever.1 As surgical volume increases, the ability to minimize the rates of intraoperative bleeding, postoperative anemia, and transfusion is becoming increasingly important to patients and the healthcare system. There is no consensus as to which cautery method is ideal. Other investigators have identified differences in clinical outcomes between cautery systems, but reported results are largely conflicting.10,12-20 In addition, no one has studied the utility of ABC in TKA. In the present retrospective cohort analysis, we hypothesized that TE, BS, and ABC would be clinically equivalent in primary TKA with respect to EBL, 48-hour wound drainage, operative time, and change from preoperative Hb level.
The data on hemostatic technology in primary TKA are inconclusive. In an age- and sex-matched study comparing TE and BS in primary TKA, BS used with shed blood autotransfusion reduced homologous blood transfusions by a factor of 5.16 In addition, BS patients lost significantly less total visible blood (intraoperative EBL, postoperative drain output), and their magnitude of postoperative Hb-level depreciations at time of discharge was significantly lower. In a multicenter, prospective randomized trial comparing TE with BS, adjusted blood loss and need for autologous blood transfusions were lower in BS patients,10 though there was no significant difference in Knee Society Scale scores between the 2 treatment arms. However, analysis was potentially biased in that multiple authors had financial ties to Salient Surgical Technologies, the manufacturer of the BS device used in the study. Other prospective randomized trials of patients who had primary TKA with either TE or BS did not find any significant difference in postoperative Hb level, postoperative drainage, or transfusion requirements.19 ABC has been studied in the context of orthopedics but not joint arthroplasty specifically. This technology was anecdotally identified as a means of attaining hemostasis in foot and ankle surgery after failure of TE and other conventional means.22 ABC has also been identified as a successful adjuvant to curettage in the treatment of aneurysmal bone cysts.21 However, ABC has not been compared with TE or BS in the orthopedic literature.
In the present study, analysis of preoperative variables revealed a statistically but not clinically significant difference in BMI among cohorts. Mean (SD) BMI was 35.6 (6.5) for TE patients, 35.8 (9.7) for BS patients, and 40.9 (11.3) for ABC patients. (Previously, BMI did not correlate with intraoperative blood loss in TKA.25) Analysis also revealed a statistically significant but clinically insignificant and inconsequential difference in Hb level among cohorts. Mean (SD) preoperative Hb level was 13.5 (1.6) g/dL for TE patients, 12.8 (1.4) g/dL for BS patients, and 13.0 (1.6) g/dL for ABC patients. As decreases from preoperative baseline Hb levels were the intended focus of analysis—not absolute Hb levels—this finding does not refute postoperative analyses.
Our results suggest that, though TE may have relatively longer operative times in primary TKA, it is clinically equivalent to BS and ABC with respect to EBL and postoperative change in Hb levels. In addition, postoperative drainage was lower in TE than in BS and ABC, which were equivalent. No significant differences were found among hemostasis types with respect to postoperative transfusion requirements.
The prevalence distribution of predischarge AEs trended toward significance (χ2 = 5.957, P = .051), despite not meeting the predetermined α level. Rates of predischarge AEs were 0% (0/41) for TE patients, 7% (14/203) for BS patients, and 3% (1/36) for ABC patients. AEs included acute kidney injuries, electrolyte disturbances, urinary tract infections, oxygen desaturation, altered mental status, sepsis/infections, arrhythmias, congestive heart failure exacerbation, dehiscence, pulmonary embolism, and hypotension. Clearly, many of these AEs are not attributable to the hemostasis system used.
Limitations of this study include its retrospective design, documentation inadequate to account for drainage amount reinfused, and limited data on which clinical insignificance thresholds were based. In addition, reliance on historical data may have introduced bias into the analysis. The historical data used to increase the size of the TE cohort may reflect a period of relative inexperience and may have contributed to the longer operative times relative to those of the ABC cohort (Dr. Levine used ABC later in his career).
Traditional electrocautery remains a viable option in primary TKA. With its low cost and hemostasis equivalent to that of BS and ABC, TE deserves consideration equal to that given to these more modern hemostasis technologies. Cost per case is about $10 for TE versus $500 for BS and $110 for ABC.17 Soaring healthcare expenditures may warrant returning to TE or combining cautery techniques and other agents in primary TKA in order to reduce the number of transfusions and associated surgical costs.
1. Cram P, Lu X, Kates SL, Singh JA, Li Y, Wolf BR. Total knee arthroplasty volume, utilization, and outcomes among Medicare beneficiaries, 1991-2010. JAMA. 2012;308(12):1227-1236.
2. Leijtens B, Kremers van de Hei K, Jansen J, Koëter S. High complication rate after total knee and hip replacement due to perioperative bridging of anticoagulant therapy based on the 2012 ACCP guideline. Arch Orthop Trauma Surg. 2014;134(9):1335-1341.
3. Park CH, Lee SH, Kang DG, Cho KY, Lee SH, Kim KI. Compartment syndrome following total knee arthroplasty: clinical results of late fasciotomy. Knee Surg Relat Res. 2014;26(3):177-181.
4. Pedersen AB, Mehnert F, Sorensen HT, Emmeluth C, Overgaard S, Johnsen SP. The risk of venous thromboembolism, myocardial infarction, stroke, major bleeding and death in patients undergoing total hip and knee replacement: a 15-year retrospective cohort study of routine clinical practice. Bone Joint J. 2014;96-B(4):479-485.
5. Carson JL, Poses RM, Spence RK, Bonavita G. Severity of anaemia and operative mortality and morbidity. Lancet. 1988;1(8588):727-729.
6. Carson JL, Duff A, Poses RM, et al. Effect of anaemia and cardiovascular disease on surgical mortality and morbidity. Lancet. 1996;348(9034):1055-1060.
7. Dodd RY. Current risk for transfusion transmitted infections. Curr Opin Hematol. 2007;14(6):671-676.
8. Kang DG, Khurana S, Baek JH, Park YS, Lee SH, Kim KI. Efficacy and safety using autotransfusion system with postoperative shed blood following total knee arthroplasty in haemophilia. Haemophilia. 2014;20(1):129-132.
9. Aguilera X, Martinez-Zapata MJ, Bosch A, et al. Efficacy and safety of fibrin glue and tranexamic acid to prevent postoperative blood loss in total knee arthroplasty: a randomized controlled clinical trial. J Bone Joint Surg Am. 2013;95(22):2001-2007.
10. Marulanda GA, Krebs VE, Bierbaum BE, et al. Hemostasis using a bipolar sealer in primary unilateral total knee arthroplasty. Am J Orthop. 2009;38(12):E179-E183.
11. Katkhouda N, Friedlander M, Darehzereshki A, et al. Argon beam coagulation versus fibrin sealant for hemostasis following liver resection: a randomized study in a porcine model. Hepatogastroenterology. 2013;60(125):1110-1116.
12. Marulanda GA, Ulrich SD, Seyler TM, Delanois RE, Mont MA. Reductions in blood loss with a bipolar sealer in total hip arthroplasty. Expert Rev Med Devices. 2008;5(2):125-131.
13. Morris MJ, Berend KR, Lombardi AV Jr. Hemostasis in anterior supine intermuscular total hip arthroplasty: pilot study comparing standard electrocautery and a bipolar sealer. Surg Technol Int. 2010;20:352-356.
14. Clement RC, Kamath AF, Derman PB, Garino JP, Lee GC. Bipolar sealing in revision total hip arthroplasty for infection: efficacy and cost analysis. J Arthroplasty. 2012;27(7):1376-1381.
15. Rosenberg AG. Reducing blood loss in total joint surgery with a saline-coupled bipolar sealing technology. J Arthroplasty. 2007;22(4 suppl 1):82-85.
16. Pfeiffer M, Bräutigam H, Draws D, Sigg A. A new bipolar blood sealing system embedded in perioperative strategies vs. a conventional regimen for total knee arthroplasty: results of a matched-pair study. Ger Med Sci. 2005;3:Doc10.
17. Morris MJ, Barrett M, Lombardi AV Jr, Tucker TL, Berend KR. Randomized blinded study comparing a bipolar sealer and standard electrocautery in reducing transfusion requirements in anterior supine intermuscular total hip arthroplasty. J Arthroplasty. 2013;28(9):1614-1617.
18. Barsoum WK, Klika AK, Murray TG, Higuera C, Lee HH, Krebs VE. Prospective randomized evaluation of the need for blood transfusion during primary total hip arthroplasty with use of a bipolar sealer. J Bone Joint Surg Am. 2011;93(6):513-518.
19. Plymale MF, Capogna BM, Lovy AJ, Adler ML, Hirsh DM, Kim SJ. Unipolar vs bipolar hemostasis in total knee arthroplasty: a prospective randomized trial. J Arthroplasty. 2012;27(6):1133-1137.e1.
20. Zeh A, Messer J, Davis J, Vasarhelyi A, Wohlrab D. The Aquamantys system—an alternative to reduce blood loss in primary total hip arthroplasty? J Arthroplasty. 2010;25(7):1072-1077.
21. Cummings JE, Smith RA, Heck RK Jr. Argon beam coagulation as adjuvant treatment after curettage of aneurysmal bone cysts: a preliminary study. Clin Orthop Relat Res. 2010;468(1):231-237.
22. Adams ML, Steinberg JS. Argon beam coagulation in foot and ankle surgery. J Foot Ankle Surg. 2011;50(6):780-782.
23. Neumayer L, Vargo D. Principles of preoperative and operative surgery. In: Townsend CM Jr, Beauchamp RD, Evers BM, Mattox KL, eds. Sabiston Textbook of Surgery. 19th ed. Philadelphia, PA: Elsevier Saunders; 2012:211-239.
24. Walker E, Nowacki AS. Understanding equivalence and noninferiority testing. J Gen Intern Med. 2011;26(2):192-196.
25. Hrnack SA, Skeen N, Xu T, Rosenstein AD. Correlation of body mass index and blood loss during total knee and total hip arthroplasty. Am J Orthop. 2012;41(10):467-471.
Total knee arthroplasty (TKA) is a reliable and successful treatment for end-stage degenerative joint disease of the knee. Given the reproducibility of its generally excellent outcomes, TKA is increasingly being performed.1 However, the potential complications of this procedure can be devastating.2-4 The arthroplasty literature has shed light on the detrimental effects of postoperative blood loss and anemia.5,6 In addition, the increase in transfusion burden among patients is not without risk.7 Given these concerns, surgeons have been tasked with determining the ideal methods for minimizing blood transfusions and postoperative hematomas and anemia. Several strategies have been described.8-11 Hemostasis can be achieved with use of intravenous medications, intra-articular agents, or electrocautery devices. Electrocautery technologies include traditional electrocautery (TE), saline-coupled bipolar sealer (BS), and argon beam coagulation (ABC). There is controversy as to whether outcomes are better with one hemostasis method over another and whether these methods are worth the additional cost.
In traditional (Bovie) electrocautery, a unipolar device delivers an electrical current to tissues through a pencil-like instrument. Intraoperative tissue temperatures can exceed 400°C.12 In BS, radiofrequency energy is delivered through a saline medium, which increases the contact area, acts as an electrode, and maintains a cooler environment during electrocautery. Proposed advantages are reduced tissue destruction and absence of smoke.12 There is evidence both for10,12-16 and against17-20 use of BS in total joint arthroplasty. ABC, a novel hemostasis method, has been studied in the context of orthopedics21,22 but not TKA specifically. ABC establishes a monopolar electric circuit between a handheld device and the target tissues by channeling electrons through ionized argon gas. Hemostasis is achieved through thermal coagulation. Tissue penetration can be adjusted by changing power, probe-to-target distance, and duration of use.23 We conducted a study to assess the efficacy of all 3 electrocautery methods during TKA. We hypothesized the 3 methods would be clinically equivalent with respect to estimated blood loss (EBL), 48-hour wound drainage, operative time, and change from preoperative hemoglobin (Hb) level.
Methods
We conducted a retrospective cohort study of consecutive primary TKAs performed by Dr. Levine between October 2010 and November 2011. Patients were identified by querying an internal database. Exclusion criteria were prior ipsilateral open knee procedure, prior fracture, nonuse of our standard hemostatic protocol, and either tourniquet time under 40 minutes or intraoperative documentation of tourniquet failure. As only 9 patients were initially identified for the TE cohort, the same database was used to add 32 patients treated between April 2009 and October 2009 (before our institution began using BS and ABC).
Clinical charts were reviewed, and baseline demographics (age, body mass index [BMI], preoperative Hb level) were abstracted, as were outcome metrics (EBL, 48-hour wound drainage, operative time, postoperative transfusions, adverse events (AEs) before discharge, and change in Hb level from before surgery to after surgery, in recovery room and on discharge). Statistical analyses were performed with JMP Version 10.0.0 (SAS Institute). Given the hypothesis that the 3 hemostasis methods would be clinically equivalent, 2 one-sided tests (TOSTs) of equivalence were performed with an α of 0.05. With TOST, the traditional null and alternative hypotheses are reversed; thus, P < .05 identifies statistical equivalence. The advantage of this study design is that equivalence can be identified, whereas traditional study designs can identify only a lack of statistical difference.24 We used our consensus opinions to set clinical insignificance thresholds for EBL (150 mL), wound drainage (150 mL), decrease from postoperative Hb level (1 g/dL), and operative time (10 minutes). Patients who received a blood transfusion were subsequently excluded from analysis in order to avoid skewing Hb-level depreciation calculations. Analysis of variance (ANOVA) and χ2 tests were used to compare preoperative variables, transfusion requirements, hospital length of stay, and AE rates by hemostasis type.
Cautery Technique
In all cases, TE was used for surgical dissection, which followed a standard midvastus approach. Then, for meniscal excision, the capsule and meniscal attachment sites were treated with TE, BS, or ABC. During cement hardening, an available supplemental cautery option was used to achieve hemostasis of the suprapatellar fat pad and visible meniscal attachment sites. All other aspects of the procedure and the postoperative protocols—including the anticoagulation and rapid rehabilitation (early ambulation and therapy) protocols—were similar for all patients. The standard anticoagulation protocol was to use low-molecular-weight heparin, unless contraindicated. Tranexamic acid was not used at our institution during the study period.
Results
For the study period, 280 cases (41 TE, 203 BS, 36 ABC) met the inclusion criteria. Of the 280 TKAs, 261 (93.21%) were performed for degenerative arthritis. There was no statistically significant difference among cohorts in indication (χ2 = 1.841, P = .398) or sex (χ2 = 1.176, P= .555).
Table 1 lists the cohorts’ baseline demographics (mean age, BMI, preoperative Hb level) and comparative ANOVA results. TOSTs of equivalence were performed to compare operative time, EBL, 48-hour wound drainage, and postoperative Hb-level depreciation among hemostasis types. Changes in Hb level were calculated for the immediate postoperative period and time of discharge (Table 2). ANOVA of hospital length of stay demonstrated no significant difference in means among groups (P = .09).
The cohorts were compared with respect to use of postoperative transfusions and incidence of postoperative AEs (Table 3). The TE cohort did not have any AEs. Of the 203 BS patients, 14 (7%) had 1 or more AEs, which included acute kidney injury (3 cases), electrolyte disturbance (3), urinary tract infection (2), oxygen desaturation (2), altered mental status (1), pneumonia (1), arrhythmia (1), congestive heart failure exacerbation (1), dehiscence (1), pulmonary embolism (2), and hypotension (1). Of the 36 ABC patients, 1 (3%) had arrhythmia, pneumonia, sepsis, and altered mental status.
Discussion
With the population aging, the demand for TKA is greater than ever.1 As surgical volume increases, the ability to minimize the rates of intraoperative bleeding, postoperative anemia, and transfusion is becoming increasingly important to patients and the healthcare system. There is no consensus as to which cautery method is ideal. Other investigators have identified differences in clinical outcomes between cautery systems, but reported results are largely conflicting.10,12-20 In addition, no one has studied the utility of ABC in TKA. In the present retrospective cohort analysis, we hypothesized that TE, BS, and ABC would be clinically equivalent in primary TKA with respect to EBL, 48-hour wound drainage, operative time, and change from preoperative Hb level.
The data on hemostatic technology in primary TKA are inconclusive. In an age- and sex-matched study comparing TE and BS in primary TKA, BS used with shed blood autotransfusion reduced homologous blood transfusions by a factor of 5.16 In addition, BS patients lost significantly less total visible blood (intraoperative EBL, postoperative drain output), and their magnitude of postoperative Hb-level depreciations at time of discharge was significantly lower. In a multicenter, prospective randomized trial comparing TE with BS, adjusted blood loss and need for autologous blood transfusions were lower in BS patients,10 though there was no significant difference in Knee Society Scale scores between the 2 treatment arms. However, analysis was potentially biased in that multiple authors had financial ties to Salient Surgical Technologies, the manufacturer of the BS device used in the study. Other prospective randomized trials of patients who had primary TKA with either TE or BS did not find any significant difference in postoperative Hb level, postoperative drainage, or transfusion requirements.19 ABC has been studied in the context of orthopedics but not joint arthroplasty specifically. This technology was anecdotally identified as a means of attaining hemostasis in foot and ankle surgery after failure of TE and other conventional means.22 ABC has also been identified as a successful adjuvant to curettage in the treatment of aneurysmal bone cysts.21 However, ABC has not been compared with TE or BS in the orthopedic literature.
In the present study, analysis of preoperative variables revealed a statistically but not clinically significant difference in BMI among cohorts. Mean (SD) BMI was 35.6 (6.5) for TE patients, 35.8 (9.7) for BS patients, and 40.9 (11.3) for ABC patients. (Previously, BMI did not correlate with intraoperative blood loss in TKA.25) Analysis also revealed a statistically significant but clinically insignificant and inconsequential difference in Hb level among cohorts. Mean (SD) preoperative Hb level was 13.5 (1.6) g/dL for TE patients, 12.8 (1.4) g/dL for BS patients, and 13.0 (1.6) g/dL for ABC patients. As decreases from preoperative baseline Hb levels were the intended focus of analysis—not absolute Hb levels—this finding does not refute postoperative analyses.
Our results suggest that, though TE may have relatively longer operative times in primary TKA, it is clinically equivalent to BS and ABC with respect to EBL and postoperative change in Hb levels. In addition, postoperative drainage was lower in TE than in BS and ABC, which were equivalent. No significant differences were found among hemostasis types with respect to postoperative transfusion requirements.
The prevalence distribution of predischarge AEs trended toward significance (χ2 = 5.957, P = .051), despite not meeting the predetermined α level. Rates of predischarge AEs were 0% (0/41) for TE patients, 7% (14/203) for BS patients, and 3% (1/36) for ABC patients. AEs included acute kidney injuries, electrolyte disturbances, urinary tract infections, oxygen desaturation, altered mental status, sepsis/infections, arrhythmias, congestive heart failure exacerbation, dehiscence, pulmonary embolism, and hypotension. Clearly, many of these AEs are not attributable to the hemostasis system used.
Limitations of this study include its retrospective design, documentation inadequate to account for drainage amount reinfused, and limited data on which clinical insignificance thresholds were based. In addition, reliance on historical data may have introduced bias into the analysis. The historical data used to increase the size of the TE cohort may reflect a period of relative inexperience and may have contributed to the longer operative times relative to those of the ABC cohort (Dr. Levine used ABC later in his career).
Traditional electrocautery remains a viable option in primary TKA. With its low cost and hemostasis equivalent to that of BS and ABC, TE deserves consideration equal to that given to these more modern hemostasis technologies. Cost per case is about $10 for TE versus $500 for BS and $110 for ABC.17 Soaring healthcare expenditures may warrant returning to TE or combining cautery techniques and other agents in primary TKA in order to reduce the number of transfusions and associated surgical costs.
1. Cram P, Lu X, Kates SL, Singh JA, Li Y, Wolf BR. Total knee arthroplasty volume, utilization, and outcomes among Medicare beneficiaries, 1991-2010. JAMA. 2012;308(12):1227-1236.
2. Leijtens B, Kremers van de Hei K, Jansen J, Koëter S. High complication rate after total knee and hip replacement due to perioperative bridging of anticoagulant therapy based on the 2012 ACCP guideline. Arch Orthop Trauma Surg. 2014;134(9):1335-1341.
3. Park CH, Lee SH, Kang DG, Cho KY, Lee SH, Kim KI. Compartment syndrome following total knee arthroplasty: clinical results of late fasciotomy. Knee Surg Relat Res. 2014;26(3):177-181.
4. Pedersen AB, Mehnert F, Sorensen HT, Emmeluth C, Overgaard S, Johnsen SP. The risk of venous thromboembolism, myocardial infarction, stroke, major bleeding and death in patients undergoing total hip and knee replacement: a 15-year retrospective cohort study of routine clinical practice. Bone Joint J. 2014;96-B(4):479-485.
5. Carson JL, Poses RM, Spence RK, Bonavita G. Severity of anaemia and operative mortality and morbidity. Lancet. 1988;1(8588):727-729.
6. Carson JL, Duff A, Poses RM, et al. Effect of anaemia and cardiovascular disease on surgical mortality and morbidity. Lancet. 1996;348(9034):1055-1060.
7. Dodd RY. Current risk for transfusion transmitted infections. Curr Opin Hematol. 2007;14(6):671-676.
8. Kang DG, Khurana S, Baek JH, Park YS, Lee SH, Kim KI. Efficacy and safety using autotransfusion system with postoperative shed blood following total knee arthroplasty in haemophilia. Haemophilia. 2014;20(1):129-132.
9. Aguilera X, Martinez-Zapata MJ, Bosch A, et al. Efficacy and safety of fibrin glue and tranexamic acid to prevent postoperative blood loss in total knee arthroplasty: a randomized controlled clinical trial. J Bone Joint Surg Am. 2013;95(22):2001-2007.
10. Marulanda GA, Krebs VE, Bierbaum BE, et al. Hemostasis using a bipolar sealer in primary unilateral total knee arthroplasty. Am J Orthop. 2009;38(12):E179-E183.
11. Katkhouda N, Friedlander M, Darehzereshki A, et al. Argon beam coagulation versus fibrin sealant for hemostasis following liver resection: a randomized study in a porcine model. Hepatogastroenterology. 2013;60(125):1110-1116.
12. Marulanda GA, Ulrich SD, Seyler TM, Delanois RE, Mont MA. Reductions in blood loss with a bipolar sealer in total hip arthroplasty. Expert Rev Med Devices. 2008;5(2):125-131.
13. Morris MJ, Berend KR, Lombardi AV Jr. Hemostasis in anterior supine intermuscular total hip arthroplasty: pilot study comparing standard electrocautery and a bipolar sealer. Surg Technol Int. 2010;20:352-356.
14. Clement RC, Kamath AF, Derman PB, Garino JP, Lee GC. Bipolar sealing in revision total hip arthroplasty for infection: efficacy and cost analysis. J Arthroplasty. 2012;27(7):1376-1381.
15. Rosenberg AG. Reducing blood loss in total joint surgery with a saline-coupled bipolar sealing technology. J Arthroplasty. 2007;22(4 suppl 1):82-85.
16. Pfeiffer M, Bräutigam H, Draws D, Sigg A. A new bipolar blood sealing system embedded in perioperative strategies vs. a conventional regimen for total knee arthroplasty: results of a matched-pair study. Ger Med Sci. 2005;3:Doc10.
17. Morris MJ, Barrett M, Lombardi AV Jr, Tucker TL, Berend KR. Randomized blinded study comparing a bipolar sealer and standard electrocautery in reducing transfusion requirements in anterior supine intermuscular total hip arthroplasty. J Arthroplasty. 2013;28(9):1614-1617.
18. Barsoum WK, Klika AK, Murray TG, Higuera C, Lee HH, Krebs VE. Prospective randomized evaluation of the need for blood transfusion during primary total hip arthroplasty with use of a bipolar sealer. J Bone Joint Surg Am. 2011;93(6):513-518.
19. Plymale MF, Capogna BM, Lovy AJ, Adler ML, Hirsh DM, Kim SJ. Unipolar vs bipolar hemostasis in total knee arthroplasty: a prospective randomized trial. J Arthroplasty. 2012;27(6):1133-1137.e1.
20. Zeh A, Messer J, Davis J, Vasarhelyi A, Wohlrab D. The Aquamantys system—an alternative to reduce blood loss in primary total hip arthroplasty? J Arthroplasty. 2010;25(7):1072-1077.
21. Cummings JE, Smith RA, Heck RK Jr. Argon beam coagulation as adjuvant treatment after curettage of aneurysmal bone cysts: a preliminary study. Clin Orthop Relat Res. 2010;468(1):231-237.
22. Adams ML, Steinberg JS. Argon beam coagulation in foot and ankle surgery. J Foot Ankle Surg. 2011;50(6):780-782.
23. Neumayer L, Vargo D. Principles of preoperative and operative surgery. In: Townsend CM Jr, Beauchamp RD, Evers BM, Mattox KL, eds. Sabiston Textbook of Surgery. 19th ed. Philadelphia, PA: Elsevier Saunders; 2012:211-239.
24. Walker E, Nowacki AS. Understanding equivalence and noninferiority testing. J Gen Intern Med. 2011;26(2):192-196.
25. Hrnack SA, Skeen N, Xu T, Rosenstein AD. Correlation of body mass index and blood loss during total knee and total hip arthroplasty. Am J Orthop. 2012;41(10):467-471.